UNITED STATES
SECURITIES AND EXCHANGE COMMISSION
Washington, D.C. 20549
FORM N-CSR
CERTIFIED SHAREHOLDER REPORT OF REGISTERED
MANAGEMENT INVESTMENT COMPANIES
Investment Company Act file number 811-05010
Mutual Fund and Variable Insurance Trust
(Exact name of registrant as specified in charter)
36 North New York Avenue
Huntington, NY 11743
(Address of principal executive offices) (Zip code)
The Corporation Trust Company
Corporate Trust Center
1209 Orange Street
Wilmington, DE 19801
(Name and address of agent for service)
Registrant’s telephone number, including area code: 1-631-629-4237
Date of fiscal year end: December 31
Date of reporting period: December 31, 2023
| Item 1. | Reports to Shareholders. |

Annual Shareholder Report
December 31, 2023
INSTITUTIONAL SHARES
CLASS A SHARES
CLASS C SHARES

December 31, 2023
Rational Equity Armor Fund (HDCAX, HDCEX, HDCTX) (unaudited)
Dear Shareholders,
Rational Equity Armor Fund (the “Fund”) seeks total return with dividend income through two strategies: long equity (S&P 500) and a volatility hedge overlay. Recently recategorized by Morningstar as Options Trading, the Fund aims to offer active management with built-in risk mitigation via the utilization of options and volatility.
While bond investing has become challenging, volatility presents new opportunities. A paradigm shift has occurred causing investors to seek active management returns that avoid the high levels of risk in equity investing. Thus, we contrast long only, passive management by being long stocks but also using volatility in three ways:
| ● | Buying stocks low, selling high: Capitalizing on market fluctuations. |
| ● | Hedging: Offsetting potential losses in the equity portfolio. |
| ● | Potential income generation: Utilizing options and volatility futures. |
The current market environment, characterized by one of the fastest declining money supplies on record month-over-month, and fluctuating interest rates, allows us to seamlessly combine these strategies, creating a valuable core holding for long-term investors.
With a 90% allocation to S&P 500 stocks, the Fund can serve as an alternative to high-dividend equities and traditional liquid alternative strategies. In 2023, the Fund’s Institutional shares delivered a 2.95% return, matching dividend peers, and has recently gained momentum from the renewed negative correlation between stocks and volatility.
As volatility is expected to normalize and option premiums remain low, heading into an election year, we believe the Fund is well-positioned to deliver strong results. We believe that this fund could be a core holding to go with other long/short strategies, option strategies, and provides a complement to a low-risk equity portfolio.
Sincerely,
The Rational Equity Armor Fund Management Team
Performance (%): Ending December 31, 20231
Annualized if greater than a year
| Share Class/Benchmark | YTD | 1 Year | 3 Years | Since
12/12/191 | 5 Years | 10 Years | Since
Inception* |
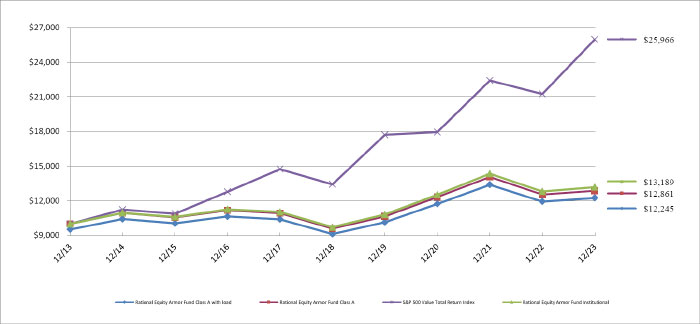
| Institutional Shares | 2.95 | 2.95 | 1.74 | 5.12 | 6.31 | 2.81 | 5.08 |
| S&P 500 Value Index | 22.23 | 22.23 | 13.11 | 10.33 | 14.11 | 10.01 | 7.16 |
| Class A | 2.62 | 2.62 | 1.44 | 4.86 | 6.05 | 2.55 | 4.82 |
| Class C | 1.90 | 1.90 | 0.74 | 4.12 | 5.24 | 1.96 | 3.98 |
| Class A w/ Sales Charge | -2.29 | -2.29 | -0.21 | 3.60 | 5.01 | 2.05 | 4.60 |
Class C Shares commenced operations on January 3, 2014. Returns prior to that date are of the Institutional Shares, adjusted for expenses of Class C Shares. Institutional Shares would have had substantially similar annual returns because the shares are invested in the same portfolio.

The Fund’s maximum sales charge for Class A shares is 4.75%. Investments in mutual funds involve risks. Performance is historic and does not guarantee future results. Investment return and principal value will fluctuate with changing market conditions so that when redeemed, shares may be worth more or less than their original cost. Current performance may be lower or higher than the performance data quoted. To obtain the most recent month- end performance information or the Fund’s prospectus please call the Fund, toll free at 1-800-253-0412. You can also obtain a prospectus at www.RationalMF.com.
This report is intended for the Fund’s shareholders. It may not be distributed to prospective investors unless it is preceded or accompanied by the current Fund prospectus. To obtain a prospectus or other information about the Fund, please visit www.RationalMF.com or call 1-800-253-0412. Please read the prospectus carefully before investing.
| (1) | The S&P 500 Value Total Return Index® (“S&P 500 Value TR”) is an unmanaged market-capitalization weighted index consisting of those stocks within the S&P 500 that exhibit strong value characteristics. It uses a numerical ranking system based on four value factors and three growth factors to determine the constituents and their weightings. |
| (2) | The S&P 500 Total Return Index® (“S&P 500 TR”) is an unmanaged index generally representing the performance of the broad domestic economy through changes in the aggregate market value of 500 stocks representing all major industries. Indices are unmanaged and, unlike the Fund, are not affected by cash flows. It is not possible to invest directly in an Index. |
5138-NLD-2/1/2024
Rational Equity Armor Fund
PORTFOLIO REVIEW (Unaudited)
December 31, 2023
The Fund’s performance figures* for each of the periods ended December 31, 2023, compared to its benchmark:
| | | Annualized | Annualized | Annualized | Annualized |
| | 1 Year Return | 5 Year Return | 10 Year Return | Since Inception(a) | Since Inception(b) |
| Institutional | 2.95% | 6.31% | 2.81% | 5.08% | N/A |
| Class A | 2.62% | 6.05% | 2.55% | 4.82% | N/A |
| Class A with load | (2.29)% | 5.01% | 2.05% | 4.60% | N/A |
| Class C | 1.90% | 5.24% | N/A | N/A | 1.96% |
| S&P 500 Value Total Return Index (c) | 22.23% | 14.11% | 10.01% | 7.68% | 10.10% |
| * | The performance data quoted here represents past performance. Current performance may be lower or higher than the performance data quoted above. Investment return and principal value will fluctuate, so that shares, when redeemed, may be worth more or less than their original cost. The returns shown do not reflect the deduction of taxes that a shareholder would pay on Fund distributions or on the redemptions of Fund shares. Past performance is no guarantee of future results. Performance figures for periods greater than 1 year are annualized. Per the fee table in the Fund’s May 1, 2023 prospectus, as supplemented to date, the total annual operating expense are 1.22% for Institutional shares, 1.48% for A shares and 2.17% for C shares. See the financial highlights for current expense ratios. For performance information current to the most recent month-end, please call toll-free 1-800-253-0412. Class A shares are subject to a maximum load of 4.75%. |
Performance information for the period prior to December 13, 2019 does not reflect the Fund’s current strategy and the Fund’s portfolio was not managed by the Fund’s current Sub-Advisor.
| (a) | Inception date is March 1, 2001 for Class A, Institutional and the benchmark. |
| (b) | Inception date is January 3, 2014 for Class C and the benchmark. |
| (c) | The S&P 500 Value Total Return Index uses a numerical ranking system based on four value factors and three growth factors to determine the constituents and their weightings. Investors cannot invest directly in an Index. |
Comparison of the Change in Value of a $10,000 Investment
| Top 10 Holdings by Industry ^ | | % of Net Assets | |
| Equity | | | 36.4 | % |
| Insurance | | | 9.7 | % |
| Semiconductors | | | 9.7 | % |
| Internet Media & Services | | | 9.3 | % |
| Technology Hardware | | | 7.3 | % |
| Software | | | 6.4 | % |
| E-Commerce Discretionary | | | 4.9 | % |
| Biotech & Pharma | | | 3.2 | % |
| Banking | | | 2.2 | % |
| Technology Services | | | 2.0 | % |
| Other/Short-Term Investments | | | 8.9 | % |
| | | | 100.0 | % |
^ Does not include derivatives in which the Fund invests.
Please refer to the Schedule of Investments for a more detailed breakdown of the Fund’s assets.
December 31, 2023
Rational Tactical Return Fund (HRSAX, HRSFX, HRSTX) (unaudited)
Dear Shareholders,
The Rational Tactical Return Fund (the “Fund”) seeks total return consisting of long-term capital appreciation and income by making investments in long and short call and put options on futures contracts on the S&P 500 Index, as well as cash and cash equivalents. For the year ended December 31, 2023, the Fund posted a +5.06% (Institutional shares) return versus +26.29% for the S&P 500 TR Index (the “S&P 500 Index”).
Investment Strategy
Warrington Asset Management, LLC’s (the “Sub-Advisor”) strategy seeks to achieve the Fund’s investment objective in three ways: (1) Premium Collection – the Fund collects premiums on options it sells; (2) Volatility Trading – the Fund may enter into positions designed to hedge or profit from either an increase or a decrease in S&P 500 Index volatility; and (3) Trend Following – the Fund may increase or decrease the balance of puts and calls based on trending market direction. The Fund is designed to produce returns that are not correlated with equity market returns. The Fund employs strict risk management procedures, supported by both technical and fundamental analysis, that are intended to provide consistency of returns and to mitigate the extent of losses.
Fund Performance
While the Fund trades options on the S&P 500 Index, the Sub-Advisor’s goal is to have low correlation to that benchmark. In this regard, the Sub-Advisor’s objective is to provide positive, risk adjusted absolute returns to our investors. When those returns are additionally weighed against the volatility endured to produce such returns, with low standard deviation on a daily, monthly, and yearly timeframes, we believe the Fund has performed well and has achieved its objective.
Equity markets performed well in 2023, while fixed income (using the Bloomberg US Agg Index) ended positive after some volatile swings. Fixed income does not seem to be the portfolio buffer that it once was, highlighting the need for uncorrelated assets. While volatility, as measured by the VIX Index, was low throughout the year, geopolitical issues remained worrisome. We believe we were able to navigate these difficult markets and capture trading gains, while seeking to protect capital when opportunity sets were limited. In looking at the Morningstar ranking and return data for the category in which the Fund’s strategy is placed (Options Trading), we believe the category is extremely broad. The group contains a wide variety of options traders, many of whom, in our view, take extreme risks collecting premiums during periods of positive index performance and may at times outperform, but underperform in periods of rising volatility. According to Morningstar, in 2023, the Fund finished near the bottom of the 284 other funds, but in 2022 when our absolute performance was worse than 2023, the Fund finished in the top 4% of the rankings. Additionally, our trading approach is significantly different than the rest of our category, which we believe is reflective in the Fund’s performance and minimal standard deviation (the five-year standard deviation for the Fund is 1.40% vs 9.99% for the Morningstar category). This wide disparity leads to a Sharpe ratio of 1.30 for the Fund vs. 0.54 for the Morningstar category, underscoring how we have sought to add significant shareholder value using our approach. The flexibility in the tactical trading methodology utilized for the Fund, coupled with stringent risk parameters, is designed to provide the ability to react quickly to an ever-changing market environment in search of profits while also remaining focused on avoiding potentially treacherous market conditions.
Summary
In another year as the Fund’s Sub Advisor, Warrington has continued to provide strong absolute and relative returns, while consistently managing market risks. We seek to continue asset growth as variable equity markets have highlighted the need for non-correlated assets. In volatile markets, Warrington ensures that risk management is paramount, while concurrently evaluating the risk/reward relationship of the opportunities presented by those volatile markets.
Sincerely,
Scott Kimple and Mark Adams, Portfolio Managers
Performance (%): Ending December 31, 20231
Annualized if greater than a year
| Share Class/Benchmark | YTD | 1 Year | 3 Years | 5 Years | Since
12/5/171 | 10 Years | Since
Inception* |
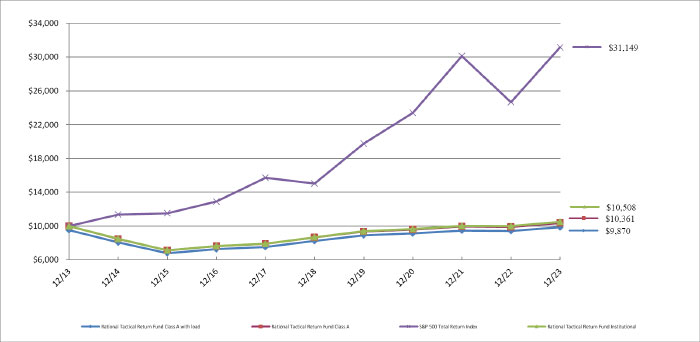
| Institutional Shares | 5.06 | 5.06 | 2.87 | 3.90 | 4.94 | 0.50 | -0.49 |
| Class A | 4.77 | 4.77 | 2.64 | 3.67 | 4.70 | 0.35 | -0.68 |
| Class A w/ Sales Charge | -0.21 | -0.21 | 0.98 | 2.66 | 3.86 | -0.13 | -0.97 |
| Class C | 3.97 | 3.97 | 1.83 | 2.84 | 3.95 | n/a | 4.12 |
| S&P 500 TR Index | 26.29 | 26.29 | 10.00 | 15.69 | 12.25 | n/a** | n/a** |
| * | Inception: 05/01/2007 (Class A & Inst.), 05/31/2016 (Class C) |
| ** | S&P 500 TR Index not relevant to strategy prior to 12/5/2017 strategy change. |
| 1 | Prior to 12/5/2017, the Rational Tactical Return Fund was named the Rational Real Strategies Fund, which was managed by a different sub-advisor and implemented a different investment strategy. |
The Fund’s maximum sales charge for Class A shares is 4.75%. Investments in mutual funds involve risks. Performance is historic and does not guarantee future results. Investment return and principal value will fluctuate with changing market conditions so that when redeemed, shares may be worth more or less than their original cost. Current performance may be lower or higher than the performance data quoted. To obtain the most recent month- end performance information or the Fund’s prospectus please call the Fund, toll free at 1-800-253-0412. You can also obtain a prospectus at www.RationalMF.com.
This report is intended for the Fund’s shareholders. It may not be distributed to prospective investors unless it is preceded or accompanied by the current Fund prospectus. To obtain a prospectus or other information about the Fund, please visit www.RationalMF.com or call 1-800-253-0412. Please read the prospectus carefully before investing.
| 1 | The S&P 500 Total Return Index by Standard & Poor’s Corp. is a capitalization-weighted index comprising 500 issues listed on various exchanges, representing the performance of the stock market generally. Please note that indices do not take into account any fees and expenses of investing in the individual securities that they track, and individuals cannot invest directly in any index, although individuals may invest in exchange traded funds or other investment vehicles that attempt to track the performance of an index. The Rational Tactical Return Fund may or may not purchase the types of securities represented by the S&P 500 Total Return Index. |
3137-NLD-02/05/2024
Rational Tactical Return Fund
PORTFOLIO REVIEW (Unaudited)
December 31, 2023
The Fund’s performance figures* for each of the periods ended December 31, 2023, compared to its benchmark:
| | | Annualized | Annualized | Annualized | Annualized |
| | 1 Year Return | 5 Year Return | 10 Year Return | Since Inception(a) | Since Inception(b) |
| Institutional | 5.06% | 3.90% | 0.50% | (0.49)% | N/A |
| Class A | 4.77% | 3.67% | 0.35% | (0.68)% | N/A |
| Class A with load | (0.21)% | 2.66% | (0.13)% | (0.97)% | N/A |
| Class C | 3.97% | 2.84% | N/A | N/A | 4.12% |
| S&P 500 Total Return Index (c) | 26.29% | 15.69% | 12.03% | 9.42% | 13.48% |
| * | The performance data quoted here represents past performance. Current performance may be lower or higher than the performance data quoted above. Investment return and principal value will fluctuate, so that shares, when redeemed, may be worth more or less than their original cost. The returns shown do not reflect the deduction of taxes that a shareholder would pay on Fund distributions or on the redemptions of Fund shares. Past performance is no guarantee of future results. Performance figures for periods greater than 1 year are annualized. Per the fee table in the Fund’s May 1, 2023 prospectus, as supplemented to date, the total annual operating expense are 2.09% for Institutional Class shares, 2.36% for Class A shares and 3.06% for Class C shares before fee waivers and/or expense reimbursements, if any. See the financial highlights for current expense ratios. For performance information current to the most recent month-end, please call toll-free 1-800-253-0412. Class A shares are subject to a maximum load of 4.75%. |
Performance information for the period prior to December 5, 2017 does not reflect the Fund’s current strategy and the Fund’s portfolio was not managed by the Fund’s current Sub-Advisor.
| (a) | Inception date is May 1, 2007 for Class A, Institutional and the benchmark. |
| (b) | Inception date is May 31, 2016 for Class C and the benchmark. |
| (c) | The S&P 500 Total Return Index, a registered trademark of S&P Global, Inc., is a market capitalization-weighted index of 500 widely held common stocks. Investors cannot invest directly in an Index. |
Comparison of the Change in Value of a $10,000 Investment
| Top Holdings by Asset Type ^ | | % of Net Assets | |
| U.S. Treasury Bills | | | 52.6 | % |
| Other/Cash & Equivalents | | | 47.4 | % |
| | | | 100.0 | % |
^ Does not include derivatives in which the Fund invests.
Please refer to the Schedule of Investments for a more detailed breakdown of the Fund’s assets.
December 31, 2023
Rational Dynamic Brands Fund (HSUAX | HSUCX | HSUTX) (unaudited)
2023: Business Fundamentals Mattered Again. Brands Mattered Again
Current Portfolio Holdings, Analytics, Historical Data: Global Brands Portfolio Page
Dear Shareholders,
Happy New Year! 2023 was a much more pleasant year and one our team expected. We cannot predict, no one can, but our experience navigating markets for 30 years taught us to expect better outcomes when willing to buy at highly attractive prices. 2022 was not a pleasant year for investors, but we could not buy enough of our favorite global brands when the market put them on mega sale. That’s what you pay us for, to make the difficult decisions in very important periods of time.
The Rational Dynamic Brands Fund (the “Fund”) Institutional shares’ return for 2023 was +42.50%, versus the S&P 500 return of +26.29%.
The strong gains in absolute and relative terms were generated primarily due to these three factors: 1) the willingness to obtain attractive purchase prices in 2022, 2) dedication to the quality style factor across primarily Consumer Discretionary; Technology; and Communication Services sectors; and 3) our willingness to embrace volatility when it arrives and trade around our core positions or to take decisive action when we see a short-term tactical trading opportunity. In a market driven by CTA’s (commodity trading advisors), algorithms, and one-day-to-expiration (ODTE) options trading, investors must get comfortable with periodic bouts of volatility. Volatility is the friend of the long-term investor; these short-term periods often offer attractive opportunities to generate strong returns.
What worked in 2023?
| 1) | Mega-cap brands. Core holdings like Microsoft gained +58%, Amazon +80%, Meta +194%, Google +58%, Apple +49%, Lilly +60%, Lululemon +59%, and Costco +49%. These numbers sound incredible, and they are, but when one widens the lens a bit and looks at the 2 & 3 year returns of many of these great brands and the market overall, you’ll realize how much opportunity there still is across markets as we enter 2024. We believe that mean reversion is a wonderful concept every investor should embrace. Thesis: If stocks tend to compound at an 8-10% per year rate over long periods of time, it’s logical to assume the best companies across the most important industries should compound higher than the market and closer to 13%+ per year over time. Where the most relevant and leading brands are concerned, we have a significant amount of data to back up this thesis. |
While markets were generally strong in 2023, the two-year return for the S&P 500 is a sub-par +3.26% or +1.62% annualized. Amazon, our largest and favorite holding has annualized at -4.55% for 2 years, and -2.3% over 3 years. For perspective, from the IPO in mid-1997 to 12/31/2019 just before the pandemic began, Amazon stock returned +31% annualized. We can say with a high degree of confidence, Amazon has more growth levers to pull than ever before and the return to strong free cash flow and high levels of net income has just begun. Amazon pulled forward many years of CAPEX (capital expenditure) spending to keep up with demand over the last few years, and now they will begin to reap the rewards.
There are many other examples like Amazon in our portfolio today. So many great brands are better positioned, cheaper, and more efficient than they have ever been and their stock prices have yet to fully reflect this new reality. We are excited for the future of leading brands as consumers & businesses get back to normal.
| 2) | Brands that crossed into profitability for the first time. Leading sports betting brand Draftkings had a phenomenal year at +209%. The leader in ride sharing, Uber, saw a +149% return as free cash flow sustainability was reached, and the stock was added to the S&P 500 Index. Latam e-commerce and fintech leader Mercado Libre turned in a great year at +85%. |
| 3) | Our Alternative Asset Manager (private markets) basket also returned to its winning ways. Blackstone (BX) was +82%, KKR +80%, and Apollo Global +49%. There is significant demand from high net worth investors across private market assets. These brands stand to benefit. Importantly, if your clients opt for giving up a little liquidity to gain access to areas like Private Equity, Private Credit, Infrastructure, Differentiated Real Estate, etc., these brands win. If clients do not feel comfortable carving out some liquidity for private markets, they can benefit from the secular growth theme by owning the stocks as we do in the Fund. |
Fun fact: Most top-tier alternative asset managers have generated exceptional returns for clients over time. Giving up some liquidity has historically paid handsomely. Logic would tell us; the stocks of these great brands should also be strong performers if their business was strong. Case in point: Since the initial public offering (IPO) in July 2007, Blackstone (BX) stock has annualized at +14.5%, very similar to its Private Equity returns. And this included the dreadful 2008-2009 period as well as the poor returns of 2022. KKR stock has annualized at 21% since its public debut in July 2010. Apollo Global has annualized at +22% since the IPO in April 2011. The stocks can be volatile at times, but these brands are dominating the industry. They also have a meaningful step-up in earnings coming as they deploy over $300 billion in dry powder over the next few years and increase realizations. KKR & APO are still quite cheap, have a decent shot at being added to the S&P 500 in 2024 (strong stock catalyst), and both are on their way to meet Blackstone at >$1 trillion in assets. The large and recurring fees at this level of scale are worthy of a higher multiple. We fully expect the stocks to reflect this reality over time.
Current Views on 2024:
| ● | We expect interest rates and inflation data to be rangebound and volatile. The easy part of containing inflation is now behind us; we suspect the data and the responses to the data to be more volatile throughout 2024. That means you can expect us to trade around core positions when short-term volatility arrives. |
| ● | 2–3-year laggards return to their former glory as the normalization process continues. Currently, about 55% of the portfolio could be classified in this category. |
| ● | We expect rolling corrections across sectors and industries to continue. This should also continue to offer opportunities for more active investors like us. The Fund has a very high tracking error (looks different than the S&P 500) by design. This makes it a great complement to passive investments. |
| ● | Geopolitics & U.S. political antics could continue to spark short periods of volatility. |
| ● | The quality style factor that includes strong free cash flow, stable & predictable earnings, and solid balance sheets should continue to perform and be an overweight in the portfolio. |
| ● | A broadening of the returns should happen as more stocks participate, particularly in 2H 2024. |
| ● | The economy could slow further into Q2 2024 as the effects of Fed tightening continue to affect secondary businesses and those in need of refinancing. This would allow us to get more exposure to industries & leading brands we admire. |
| ● | The consumer will likely stay stingy about spending. Trade down activity should continue for 2/3 of the consumer base. Wealthier consumers will continue to be disciplined about spending. Brand relevance, brand love, and high brand loyalty is where we see the best opportunities. |
| ● | Consumer sentiment should improve as the wealth effect and job security keep them engaged in their favored spending categories. Wage gains are strong, which feeds into better discretionary income, which feeds into solid consumer spending, which drives 70% of total GDP. Experiences, travel, e-commerce, discount shopping, and wellness are key areas of focus for the team. |
Non-Consensus View Using Data Over Opinions:
We have sufficient data that FOMO (fear of missing out) was in-play late in 2023 which helped drive the market up after a slight pullback into late October. We would consider these FOMO flows to be transitory and likely non-committed capital. Money market investments in the U.S. now have a record $6 trillion and are earning less than they used to. Globally, there’s now over $8 trillion in money markets. Some of this money will eventually de-anchor from fear allocations and shift into more risky assets like bonds and stocks. Portfolios that have been positioned overly defensively will also need to be right sized. In the end, there’s plenty of fuel that could come back to equities, particularly given the likelihood that the economy will continue to stay out of recession and recover from Fed manipulation.
There’s a significant number of opinions and predictions based on the direction of Fed Funds and inflation over the next year or two. We try not to be in the predicting game and focus on business fundamentals and consumer spending trends where we feel like we have a big edge over peers. We did, however, have some fun late in the year doing a research project to identify how the S&P 500 tended to perform in periods like the most likely Fed Funds and inflation set up today. Our base case for 2024 and possibly 2025 is Fed Funds to anchor around 4-5% with inflation in the 2-4% range, slightly higher than the Fed’s 2% stated goal. As it turns out, looking back, the S&P 500 has been in these ranges 11 of the last 53 years: 2023, 2007, 2006, 1999, 1997, 1996, 1995, 1994, 1991, 1972, and 1971. Averaging these years shows an S&P 500 return of +20.6% with no down calendar years. Most sectors performed well in these years but Technology, Consumer Discretionary, and Healthcare were the top performers. While we certainly won’t anchor to the 20% return historical lookback, the most likely outcome for the cost of capital and inflation seems to be much more positive than conventional wisdom expects. Remember, the Fed has been manipulating the economy down and it cannot or will not do that forever. At some point, the
economy will fully recover, consumer sentiment will recover, and stocks tend to perform well in this type of environment. The equity market returns also tend to be much more broad-based in these scenarios.
The Brands Portfolio
In aggregate, we believe the Fund continues to offer a very high-quality portfolio of stocks with attractive sales and earnings growth projections and one that is filled with free cash flow generators that have strong histories of compounding those investments at an attractive rate. The portfolio of brands has strong pricing power, high brand love, and generates strong free cash flows, which can be used for buybacks, dividend payments, and future growth initiatives. As owners of this portfolio ourselves, we sleep very well at night no matter what the macro market brings.
Should we see early weakness in 2024 given the current overbought readings we see, you can assume we will take advantage of weakness to build bigger positions in our favorite brands. We know with certainty, “purchase price matters,” and the best prices happen when markets go on sale. Let us all embrace the volatility that comes so our long-term retirements get more secure.
We thank you for your loyalty to the Rational Dynamic Brands Fund and for appreciating the value of investing in the $50+ trillion global consumption theme and through the brands that make a difference in all our lives. Investing in the brands that build innovative and necessity-based products and services is a timeless approach to long-term investing.
Reminder: The holdings and allocation weights will change over time according to the opportunities we see in the marketplace. Fund holdings are subject to change and should not be considered investment advice.
Sincerely,
The Accuvest Dynamic Brands Team
Eric Clark, Dave Garff, James Calhoun
Performance (%): Ending December 31, 2023
Annualized if greater than a year
| Share Class/Benchmark | YTD | 1 Year | 3 Years | 5 Years | Since
10/16/171 | 10 Years | Since
Inception* |
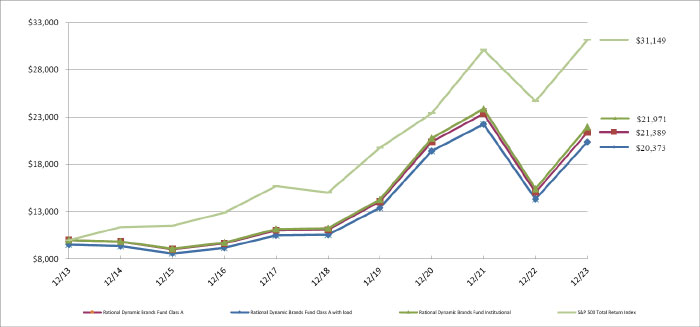
| Institutional Shares | 42.50 | 42.50 | 1.90 | 14.32 | 12.47 | 8.19 | 10.77 |
| S&P 500 TR Index | 26.29 | 26.29 | 10.00 | 15.69 | 12.53 | 12.03 | 10.74 |
| Class A | 42.10 | 42.10 | 1.61 | 14.01 | 12.17 | 7.90 | 10.48 |
| Class A w/ Sales Charge | 35.32 | 35.32 | -0.02 | 12.90 | 11.29 | 7.38 | 10.23 |
* Inception: 09/27/2002
| 1 | Prior to 10/17/2017, Rational Dynamic Brands Fund was named the Rational Defensive Growth Fund, which implemented a different investment strategy. |
The maximum sales charge for Class A Shares is 4.75%. In the case of investments of $1 million or more (where you do not pay an initial sales charge), a 1.00% contingent deferred sales charge (CDSC) may be assessed on shares redeemed within two years of purchase. The gross expense ratios were 1.47%, 2.18%, and 1.20% for the Class A, Class C, and Institutional shares, respectively. Performance is historic and does not guarantee future results. Investment return and principal value will fluctuate with changing market conditions so that when redeemed, shares may be worth more or less than their original cost. Current performance may be lower or higher than the performance data quoted. To obtain the most recent month end performance information or the Fund’s prospectus please call 800-253-0412 or visit www.RationalMF.com.
There is no assurance that the Fund will achieve its investment objective.
As of December 31, 2023, the Fund’s top 10 holdings were:
| Amazon | 14.62% |
| Live Nation | 6.27% |
| Lululemon | 4.70% |
| Costco | 4.59% |
| KKR & Co | 4.59% |
| Microsoft | 4.55% |
| Apollo Global | 4.38% |
| Visa | 4.34% |
| MercadoLibre | 4.20% |
| L’Oreal SA | 4.17% |
Important Risk Considerations:
Investing in the Fund carries certain risks. The value of the Fund may decrease in response to the activities and financial prospects of an individual security in the Fund’s portfolio. These factors may affect the value of your investment. Investments in international markets present special risks including currency fluctuation, the potential for diplomatic and political instability, regulatory and liquidity risks, foreign taxations and differences in auditing and other financial standards. Risks of foreign investing are generally intensified for investment in emerging markets. Emerging market securities tend to be more volatile and less liquid than securities traded in developed countries.
Investors should carefully consider the investment objectives, risks, charges and expenses of the Rational Funds. This and other important information about the Fund is contained in the prospectus, which can be obtained by calling (800) 253-0412 or at www.RationalMF.com. The prospectus should be read carefully before investing. The Rational Funds are distributed by Northern Lights Distributors, LLC member FINRA/SIPC. Rational Advisors, Inc. is not affiliated with Northern Lights Distributors, LLC.
5136-NLD-2/1/2024
Rational Dynamic Brands Fund
PORTFOLIO REVIEW (Unaudited)
December 31, 2023
The Fund’s performance figures* for each of the periods ended December 31, 2023, compared to its benchmark:
| | | Annualized | Annualized | Annualized | Annualized |
| | 1 Year Return | 5 Year Return | 10 Year Return | Since Inception(a) | Since Inception(b) |
| Institutional | 42.50% | 14.32% | 8.19% | 10.77% | N/A |
| Class A | 42.10% | 14.01% | 7.90% | 10.48% | N/A |
| Class A with load | 35.32% | 12.90% | 7.38% | 10.23% | N/A |
| Class C | 41.07% | 13.16% | N/A | N/A | 7.36% |
| S&P 500 Total Return Index (c) | 26.29% | 15.69% | 12.03% | 10.74% | 12.14% |
| * | The performance data quoted here represents past performance. Current performance may be lower or higher than the performance data quoted above. Investment return and principal value will fluctuate, so that shares, when redeemed, may be worth more or less than their original cost. The returns shown do not reflect the deduction of taxes that a shareholder would pay on Fund distributions or on the redemptions of Fund shares. Past performance is no guarantee of future results. Performance figures for periods greater than 1 year are annualized. Per the fee table in the Fund’s May 1, 2023 prospectus, as supplemented to date, the total annual operating expense are 1.20% for Institutional shares, 1.47% for Class A shares and 2.18% for Class C shares before fee waivers and/or expense reimbursements, if any. See the financial highlights for current expense ratios. For performance information current to the most recent month-end, please call toll-free 1-800-253-0412. Class A shares are subject to a maximum load of 4.75%. |
Performance information for the period prior to October 17, 2017 does not reflect the Fund’s current strategy and the Fund’s portfolio was not managed by the Fund’s current Sub-Advisor.
| (a) | Inception date is September 27, 2002, for Class A, Institutional and the benchmark. |
| (b) | Inception date is January 2, 2014 for Class C and the benchmark. |
| (c) | The S&P 500 Total Return Index, a registered trademark of S&P Global, Inc., is a market capitalization-weighted index of 500 widely held common stocks. Investors cannot invest directly in an Index. |
Comparison of the Change in Value of a $10,000 Investment
| Top 10 Holdings by Industry | | % of Net Assets | |
| E-Commerce Discretionary | | | 18.9 | % |
| Asset Management | | | 12.6 | % |
| Leisure Facilities & Services | | | 12.1 | % |
| Internet Media & Services | | | 10.5 | % |
| Apparel & Textile Products | | | 8.1 | % |
| Retail - Discretionary | | | 7.0 | % |
| Biotech & Pharma | | | 5.6 | % |
| Retail - Consumer Staples | | | 4.6 | % |
| Software | | | 4.5 | % |
| Technology Services | | | 4.4 | % |
| Other/Short-Term Investments | | | 11.7 | % |
| | | | 100.0 | % |
Please refer to the Schedule of Investments for a more detailed breakdown of the Fund’s assets.
December 31, 2023
Rational Strategic Allocation Fund (RHSAX | RHSCX | RHSIX) (unaudited)
Dear Shareholders,
The Rational Strategic Allocation Fund (the “Fund”) seeks current income and moderate appreciation of capital by implementing a distinct “index plus” strategy that provides investors exposure to a non-traditional fixed income portfolio with an S&P 500 Index equity overlay. During 2023, the Fund underperformed the S&P 500 Total Return Index (1) with a 23.75% (Class A) return versus 26.29% for the S&P 500 Total Return Index. The Fund lagged because of its allocations to futures contracts on the S&P 500 Index and fixed-income funds.
Investment Strategy
The Fund invests in a portfolio of futures contracts on the S&P 500 Index and income-oriented mutual funds typically representing non-traditional fixed-income asset classes. We select underlying funds using a fundamental research process, including a top-down analysis of market conditions and investment category historical performance during various market conditions. We also perform a bottom-up analysis of each potential fund for investment, including investment allocations, investment valuations and characteristics, positioning, historical performance during various market conditions, and each fund’s portfolio manager’s outlook. The Fund typically maintains 70% to 100% notional exposure to the S&P 500 Index and 70% to 100% notional exposure to the fixed income portfolio.
Fund Performance
The Fund performed in-line with our expectations. Our exposure to S&P 500 Index futures contracts allowed us to participate in the upswings of the equity markets, while our non-traditional fixed-income portfolio served to provide current income and support the goal of moderate capital appreciation by buffering the impact of downside equity market volatility. Throughout 2023, we were able to maintain our targeted notional exposure of 70% to 100% to the S&P 500 Index.
The majority of the holdings performed to our expectations. The top performing funds held in the portfolio during 2023 were the Catalyst/CIFC Floating Rate Income Fund (CFRIX +13.27%) and the Catalyst Insider Income Fund (IIXIX +9.22%). The weakest performing fund held in the portfolio during 2023 was the AlphaCentric Income Opportunities Fund (IOFIX -5.52%).
The Fund’s total annualized returns through December 31, 2023 as compared to the S&P 500 Total Return Index were as follows:
Performance (%): Ending December 31, 20231
Annualized if greater than a year
| Share Class/Benchmark | YTD | 1 Yr | 3 Yr | Since
12/05/19 | 5 Yr | 10 Yr | Since Inception* |
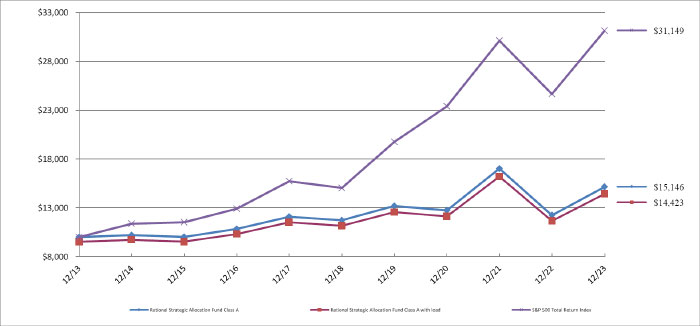
| Class A | 23.75 | 23.75 | 5.95 | 3.67 | 5.26 | 4.24 | 5.53 |
| S&P 500 TR Index | 26.29 | 26.29 | 10.00 | 12.39 | 15.69 | 12.03 | 13.75 |
| Class A w/ Sales Charge | 17.93 | 17.93 | 4.24 | 2.44 | 4.23 | 3.73 | 5.18 |
| Institutional Shares | 24.05 | 24.05 | 6.22 | 3.89 | 5.50 | n/a | 5.44 |
| Class C | 22.94 | 22.94 | 5.22 | 2.93 | 4.50 | n/a | 4.42 |
| S&P 500 TR Index | 26.29 | 26.29 | 10.00 | 12.39 | 15.69 | n/a | 13.48 |
* Inception: Class A: 07/30/2009, Institutional & Class C: 05/31/2016
The Fund’s maximum sales charge for Class A shares is 4.75%. Investments in mutual funds involve risks. Performance is historic and does not guarantee future results. Investment return and principal value will fluctuate with changing market conditions so that when redeemed, shares may be worth more or less than their original cost. Current performance may be lower or higher than the performance data quoted. To obtain the most recent month- end performance information or the Fund’s prospectus please call the Fund, toll free at 1-800-253-0412. You can also obtain a prospectus at www.RationalMF.com.
The views expressed in this letter were those as of December 31, 2023 and may not necessarily reflect views on the date this letter is first published or anytime thereafter. These views are intended to help shareholders in understanding the Fund’s present investment methodology and do not constitute investment advice.
Sincerely,
David Miller
Portfolio Manager
This report is intended for the Fund’s shareholders. It may not be distributed to prospective investors unless it is preceded or accompanied by the current Fund prospectus. To obtain a prospectus or other information about the Fund, please visit www.RationalMF.com or call 1-800-253-0412. Please read the prospectus carefully before investing.
| (1) | The S&P 500 Total Return Index by Standard & Poor’s Corp. is a capitalization-weighted index comprising 500 issues listed on various exchanges, representing the performance of the stock market generally. Please note that indices do not take into account any fees and expenses of investing in the individual securities that they track, and individuals cannot invest directly in any index, although individuals may invest in exchange traded funds or other investment vehicles that attempt to track the performance of an index. The Rational Strategic Allocation Fund may or may not purchase the types of securities represented by the S&P 500 Total Return Index. |
5173-NLD-2/15/2024
Rational Strategic Allocation Fund
PORTFOLIO REVIEW (Unaudited)
December 31, 2023
The Fund’s performance figures* for each of the periods ended December 31, 2023, compared to its benchmark:
| | | Annualized | Annualized | Annualized | Annualized |
| | 1 Year Return | 5 Year Return | 10 Year Return | Since Inception(a) | Since Inception(b) |
| Institutional | 24.05% | 5.50% | N/A | N/A | 5.44% |
| Class A | 23.75% | 5.26% | 4.24% | 5.53% | N/A |
| Class A with load | 17.93% | 4.23% | 3.73% | 5.18% | N/A |
| Class C | 22.94% | 4.50% | N/A | N/A | 4.42% |
| S&P 500 Total Return Index (c) | 26.29% | 15.69% | 12.03% | 13.75% | 13.48% |
| * | The performance data quoted here represents past performance. Current performance may be lower or higher than the performance data quoted above. Investment return and principal value will fluctuate, so that shares, when redeemed, may be worth more or less than their original cost. The returns shown do not reflect the deduction of taxes that a shareholder would pay on Fund distributions or on the redemptions of Fund shares. Past performance is no guarantee of future results. Performance figures for periods greater than 1 year are annualized. Per the fee table in the Fund’s May 1, 2023 prospectus, as supplemented to date, the total annual operating expense are 2.46% for Institutional shares, 2.79% for Class A shares and 3.44% for Class C shares before fee waivers and/or expense reimbursements, if any. See the financial highlights for current expense ratios. For performance information current to the most recent month-end, please call toll-free 1-800-253-0412. Class A shares are subject to a maximum load of 4.75%. |
Performance information for the period prior to December 13, 2019 does not reflect the Fund’s current strategy and the Fund’s portfolio was not managed by the Fund’s current Sub-Advisor.
| (a) | Inception date is July 30, 2009 for Class A and the benchmark. |
| (b) | Inception date is May 31, 2016 for Class C, Institutional and the benchmark. |
| (c) | The S&P 500 Total Return Index, a registered trademark of S&P Global, Inc., is a market capitalization-weighted index of 500 widely held common stocks. Investors cannot invest directly in an Index. |
Comparison of the Change in Value of a $10,000 Investment
| Top Holdings by Asset Type ^ | | % of Net Assets | |
| Alternative | | | 63.2 | % |
| Fixed Income | | | 23.4 | % |
| Other/Short-Term Investments | | | 13.4 | % |
| | | | 100.0 | % |
^ Does not include derivatives in which the Fund invests.
Please refer to the Schedule of Investments for a more detailed breakdown of the Fund’s total investments.
December 31, 2023
Rational/ReSolve Adaptive Asset Allocation Fund (RDMAX | RDMCX | RDMIX) (unaudited)
Dear Shareholders,
The ReSolve Adaptive Asset Allocation1 methodology utilized for the Rational/ReSolve Adaptive Asset Allocation Fund (the “Fund”) uses proprietary quantitative models that are designed to emphasize characteristics such as, but not limited to, total return momentum, trends, seasonal patterns, carry measures, mean reversion and others, while simultaneously seeking to maximizie diversification based on changing estimates of volatility and correlations across a global universe of futures markets referencing stock and bond indices, commodities, and currencies.
Portfolio Review
The strategy suffered losses in the first half of the year driven by the alpha portion of the strategy, partially countered by positive returns delivered by the beta component. In the second semester, the beta component was flat while the alpha portion produced positive results, concentrated in the third quarter.
Figure 1. 2023 Return Attributions
| Sector | 1st Semester | 2nd Semester | 2023 |
| Bonds | -1.9% | -0.8% | -2.8% |
| Currencies | 2.3% | -2.2% | 0.2% |
| Energies | -4.2% | 2.1% | -1.9% |
| Grains | -3.6% | -0.8% | -4.4% |
| Indices | 7.2% | 3.5% | 10.4% |
| Volatility | -0.2% | 0.1% | -0.1% |
| Metals | -1.5% | -1.1% | -2.6% |
| Softs | -0.1% | 0.7% | 0.7% |
| | | | |
| Total | -1.9% | 1.5% | -0.5% |
Past performance is not indicative of future results.
Note: Results may differ due to rounding. Performance is expressed in USD. Strategy attribution is a best-efforts approximation, net of all applicable borrowing costs, fees and fund accruals for the period. Indicated returns of one year or more are annualized.
Equities were by far the best performers, led by long Italian MIB, Spanish IBEX, Aussie200, Japanese Topix and Nikkei, as well as short UK FTSE and active trading in the S&P 500 and French CAC40.
Softs also delivered positive returns, driven largely by long cocoa and sugar.
Currencies provided incremental profits, as gains from short Japanese Yen, Aussie, and Kiwi Dollars, and long British Pound in the second and third quarter were partially offset by losses in the fourth quarter from short Canadian Dollar and Swiss Franc.
Grains were the largest detractors, primarily due to longs in bean oil, soy meal, milling wheat and Kansas City wheat.
| 1 | For our longest-running track record, please visit: https://investresolve.com/strategies/resolve-adaptive-asset-allocation-cad-8-volatility/ |
Bonds also suffered, primarily from longs in 5- and 10-year US Treasuries, and shorts in German 5-year Bobl and 30-year Buxl. Long UK Gilts and active positioning in German 10-year Bunds provided important offsetting gains.
Metals sustained losses from short gold, and active trading in silver and copper.
Energies detracted in the first semester from active positioning in crude oil, with a partial recovery in the second half led by longs in gasoil and heating oil.
Performance (%): Ending December 31, 20231
Annualized if greater than a year
| Share Class/Benchmark | YTD | 1 Year | 3 Years | 5 Years | Since
02/27/181 | 10 Years | Since
Inception* |
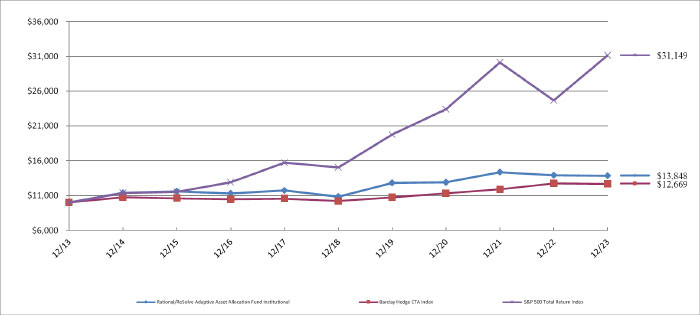
| Institutional Shares | -0.46 | -0.46 | 2.40 | 5.04 | 2.43 | 3.31 | 5.60 |
| BarclayHedge CTA Index | -0.30 | -0.30 | 3.87 | 4.46 | 3.44 | 2.42 | 4.22 |
| S&P 500 TR Index | 26.29 | 26.29 | 10.00 | 15.69 | 11.61 | 12.03 | 10.19 |
| Class A | -0.71 | -0.71 | 2.14 | 4.77 | 2.18 | 3.05 | 5.34 |
| Class C | -1.43 | -1.43 | 1.40 | 4.01 | 1.43 | 2.30 | 4.57 |
| Class A w/ Sales Charge | -6.40 | -6.40 | 0.15 | 3.54 | 1.15 | 3.05 | 5.34 |
| * | Inception: 02/01/1994. The performance shown prior to September 30, 2016 is that of the Predecessor Fund, which reflects all of the Predecessor Fund’s actual fees and expenses adjusted to include any fees of each share class. |
The Fund’s maximum sales charge for Class A shares is 5.75%. Investments in mutual funds involve risks. Performance is historic and does not guarantee future results. Investment return and principal value will fluctuate with changing market conditions so that when redeemed, shares may be worth more or less than their original cost. Current performance may be lower or higher than the performance data quoted. To obtain the most recent month- end performance information please call the Fund, toll free at 1-800-253-0412.
The Fund acquired all of the assets and liabilities of Chesapeake Fund, LLC (the “Predecessor Fund”) in a tax free reorganization on September 30, 2016. In connection with this acquisition, shares of the Predecessor Fund were exchanged for Institutional shares of the Fund. At the time of the reorganization, the Predecessor Fund had an investment objective and strategies that were, in all material respects, the same as those of the Fund, and was managed in a manner that, in all material respects, complied with the investment guidelines and restrictions of the Fund. Effective February 27, 2018, the Fund’s investment strategy changed, and the current Sub Advisor replaced the prior sub-advisor. Consequently, prior performance may not reflect the Fund’s current operations.
General Market Review
The year began with a rally across global equities and bonds, as decelerating inflation in the US and Europe rekindled hopes that a potential pause in monetary tightening was in sight, even though central banks continued to emphasize a tightening bias. The seesaw of cyclical and structural forces pulled in opposite directions, generating increased complexity to the future path of US interest rates and, by extension, risk appetite for global assets.
During the second week of March, large (albeit unrealized) losses from Treasury holdings, that had been accumulating across the US banking system since the Fed began raising rates, precipitated the first bank run of the digital age. A large number of depositor capital rapidly fled from smaller regional banks, and financial institutions otherwise perceived as “non-systematically important”, and into the (relative) less risky and yield offered by Treasuries and other sovereign debt.
After 10 consecutive hikes, the Fed paused in June as inflation moderated, then raised rates one last time in 2023 at the following FOMC meeting. The European Central Bank raised interest rates to an all-time high while signaling an end to the current hiking cycle, as Eurozone inflation fell to its lowest in almost two years. Chinese indicators continue pointing to a faltering recovery as growth remains sluggish, amidst rising youth unemployment and deflationary pressures. Despite loosening its yield curve control (YCC) policy in July, moving one step closer to normalization, the Bank of Japan was forced to intervene and protect the 1 percent yield cap on 10-year government bonds in the wake of the biggest selloff in 25 years.
US GDP accelerated in the third quarter, displaying resilience in the face of tighter monetary conditions. As inflation continued to slow, the final FOMC meeting of the year indicated that officials expect 75 basis points of rate cuts in the new year. Combined with subsequent dovish remarks by Fed chairman Jerome Powell, investors were granted the long-awaited policy pivot and unleashed animal spirits, leading to a strong rally in risk assets.
Outlook
A narrowly averted government shutdown, an expected doubling of the federal budget deficit and a national debt milestone of 33 trillion dollars further contributed to the souring mood, bringing the precarious US fiscal position into focus. While the Fed is no longer the dominant buyer of Treasuries under Quantitative Tightening (QT), US banks have pulled back from the market in the wake of the banking crisis earlier this year, and appetite from foreign sovereign buyers also appears to be waning at the margin. Combined with surging debt and ballooning deficits, market forces have pushed US Treasuries to clear at a lower price, resulting in higher yields. As Ray Dalio, Chief investment officer of investment management firm Bridgewater Associates, recently put it: “We’re going to have a debt crisis in this country. How fast it transpires, I think, is going to be a function of that supply-demand issue, so I’m watching that very closely.”2
The war in Ukraine seems to have ground to a stalemate, with no end in sight. Conflict in the Middle East has affected global shipping and could escalate at any moment. US-Sino relations remain strained, despite recent diplomatic efforts for rapprochement, and might be further complicated by the upcoming elections in Taiwan. A growing number of countries, led by the Association of Brazil, Russia, India, China and South Africa (BRICS), have been moving away from the US dollar and conducting bilateral trade in their own currencies. It has been many decades since the world saw this much geopolitical tension. As the paradigm continues to shift, we believe that investors should continue to focus on diversification, rebalancing portfolios and managing risk as opportunities arise.
Sincerely,
ReSolve Asset Management Inc.
Strategy Sub-Advisors
and
ReSolve Asset Management SEZC (Cayman), Futures Trading Advisor
This report is intended for the Fund’s shareholders. It may not be distributed to prospective investors unless it is preceded or accompanied by the current Fund prospectus. To obtain a prospectus or other information about the Fund, please visit www.RationalMF.com or call 1-800-253-0412. Please read the prospectus carefully before investing.
5139-NLD-2/1/2024
| 2 | https://www.cnbc.com/2023/09/28/ray-dalio-says-the-us-is-going-to-have-a-debt-crisis.html |
Rational/ReSolve Adaptive Asset Allocation Fund
PORTFOLIO REVIEW (Unaudited)
December 31, 2023
The Fund’s performance figures* for each of the periods ended December 31, 2023, compared to its benchmarks:
| | | Annualized | Annualized | Annualized | Annualized |
| | 1 Year Return | 5 Year Return | 10 Year Return | Since Inception(a) | Since Inception(b) |
| Institutional (c) | (0.46)% | 5.04% | 3.31% | N/A | 5.60% |
| Class A | (0.71)% | 4.77% | N/A | 2.21% | N/A |
| Class A with load | (6.40)% | 3.54% | N/A | 1.37% | N/A |
| Class C | (1.43)% | 4.01% | N/A | 1.48% | N/A |
| S&P 500 Total Return Index (d) | 26.29% | 15.69% | 12.03% | 13.51% | 10.19% |
| Barclay Hedge CTA Index (e) | (0.30)% | 4.46% | 2.42% | 2.53% | 4.22% |
| * | The performance data quoted here represents past performance. Current performance may be lower or higher than the performance data quoted above. Investment return and principal value will fluctuate, so that shares, when redeemed, may be worth more or less than their original cost. The returns shown do not reflect the deduction of taxes that a shareholder would pay on Fund distributions or on the redemptions of Fund shares. Past performance is no guarantee of future results. Performance figures for periods greater than 1 year are annualized. Per the fee table in the Fund’s May 1, 2023 prospectus, as supplemented to date, the total annual operating expense are 2.20% for Institutional shares, 2.48% for Class A shares and 3.15% for Class C shares before fee waivers and/or expense reimbursements, if any. See the financial highlights for current expense ratios. For performance information current to the most recent month-end, please call toll-free 1-800-253-0412. Class A shares are subject to a maximum load of 5.75%. |
Performance information for the period prior to February 27, 2018 does not reflect the Fund’s current strategy and the Fund’s portfolio was not managed by the Fund’s current Sub-Advisor.
| (a) | Inception date is September 30, 2016 for Class A, Class C and the benchmarks. |
| (b) | Inception date is February 28, 1994 for Institutional and the benchmarks. |
| (c) | The Fund acquired all of the assets and liabilities of Chesapeake Fund LLC (the “Predecessor Fund”) in a tax-free reorganization on September 30, 2016. In connection with this acquisition, shares of the Predecessor Fund were exchanged for Institutional shares of the Fund. At the time of the reorganization, the Fund’s investment objective, policies and guidelines were, in all material respects, equivalent to the Predecessor Fund’s investment objectives, policies and guidelines. The Predecessor Fund commenced operations on February 28,1994. Updated performance information is available at no cost by calling 1-800-253-0412 or visiting the Fund’s website at www.RationalMF.com. |
| (d) | The S&P 500 Total Return Index, a registered trademark of S&P Global, Inc., is a market capitalization-weighted index of 500 widely held common stocks. Investors cannot invest directly in an Index. |
| (e) | The Barclay Hedge CTA Index is a leading industry benchmark of representative performance of commodity trading advisors. |
Comparison of the Change in Value of a $10,000 Investment
| Holdings by Asset Type ^ | | % of Net Assets | |
| U.S. Treasury Bills | | | 63.1 | % |
| Other/Cash & Equivalents | | | 36.9 | % |
| | | | 100.0 | % |
^ Does not include derivatives in which the Fund invests.
Please refer to the Consolidated Schedule of Investments for a more detailed breakdown of the Fund’s assets.
December 31, 2023
Rational/Pier 88 Convertible Securities Fund (PBXAX, PBXCX, PBXIX) (unaudited)
Dear Shareholders,
The Rational/Pier 88 Convertible Securities Fund (the “Fund”) seeks total return consisting of capital appreciation and income, by investing primarily in convertible securities, which offer equity participation with the added benefit of a bond floor component. The Fund maintains an average investment grade rating with the goal of providing additional downside risk management. The Pier 88 approach to managing the convertible bond asset class can be characterized by the word “balance.” We endeavor to take a balanced view of risk versus reward. The team is cognizant that all investments present a plethora of risk including macroeconomic, market and idiosyncratic. Our portfolio seeks to remain diversified from a market sector, market capitalization and style perspective.
Investment Strategy
The Fund seeks to achieve its objective by investing in convertible securities, which are “hybrid” securities that possess both fixed income and equity characteristics. The convertible securities asset class is often overlooked because of its unique profile and often trades at a discount to its pari-passu fixed income counterparts. As equity sensitivity has been the primary driver of returns of the asset class, our investment team employs an equity analysis perspective for investment decisions.
Fund Performance
During 2023, the Fund’s Institutional shares returned 3.29% versus 6.74% for the ICE BofAML Investment Grade US Convertible 5% Constrained Index (“VX5C.”) In 2022, the Fund generated top decile performance in its Morningstar Convertibles category, as it was defensively positioned in sectors like healthcare and protected investors much better than peers. For 2023, healthcare underperformed as a sector, as investors rotated into mega cap technology names. PBXIX was overweight healthcare which negatively impacted performance, while the underweight in utilities positively impacted performance relative to the VX5C. As the technology convertibles in the Fund were below par and had lower deltas, they weighed on performance in a rising market. Our underweight to the security BKNG (the index had a 5% position), which appreciated significantly, negatively impacted performance from a stock specific basis. For risk purposes, the Fund tends to not hold 5% positions in high priced, high delta positions. Moreover, two specific healthcare names, PODD and DXCM, were negatively impacted this year as the market rewarded weight loss drug companies that offer GLP drugs and punished companies that offered devices for diabetes. We believe the market has unduly punished these names based on current and expected future fundamentals.
Outlook
The Pier 88 Investment Team is constructive on the convertible bond asset class given a historically high Sharpe ratio (risk-adjusted return), competitive yield, positive correlation with rising interest rates, risk-reward profile, and a plethora of convertibles of high growth companies trading significantly below par allowing for a diversified portfolio to express thematic views.
Within the asset class, we see investment grade convertible securities as a particularly compelling investment opportunity in the current market environment as they provide the potential for equity participation with the added downside protection of better credit profiles. Further, the investment grade convertible securities universe is well diversified across industry sectors and market caps. It also offers a current yield that is competitive to broader equity markets. As interest rates remain “higher for longer,” weaker positioned companies and those with excessive debt are at increasing risks of default. This risk increases if the economy slows. Unlike the high yield market, the convertible market tends to be comprised of growth companies levered to secular trends where the convertible bond is likely the only debt instrument in the capital structure. Further, convertibles tend to be issued at lower interest rates than high yield. Finally, convertibles have been a more comprehensive asset class to high yield and other segments of the fixed income markets.
Pier 88’s decade of experience with the asset class leads us to conclude that being levered to great growth companies with appreciating stocks has enabled the asset class to experience strong appreciation. This asset class has historically attracted high growth innovation companies, which may not have found the high yield debt market welcoming.
As the asset class has a historically high Sharpe ratio, Pier 88 believes a fundamental “equity lens” approach provides a method to uncover compelling investment opportunities in the current macroeconomic environment. By focusing on the underlying equity element of this hybrid security and concentrating on “delta”, a main driver of returns, Pier 88 posits that an investment grade convertible allocation can be a compelling way for investors to achieve more performance from their traditional fixed income portfolios. We believe the offensive/defensive traits of convertible bond provide for an attractive risk-adjusted way to gain exposure to many of these exciting growth companies in the current market regime.
Sincerely,
Frank Timons
Portfolio Manager
The Fund’s total annualized returns through 12/31/23 as compared to its benchmark were as follows:
Performance (%): Ending December 31, 2023
Annualized if greater than a year
| Share Class/Benchmark | QTD | YTD | 1 Year | 3 Years | 5 Years | Since Inception* |
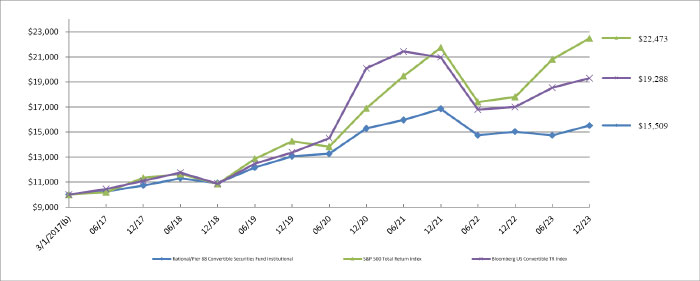
| Institutional Shares | 6.42 | 3.29 | 3.29 | 0.50 | 7.29 | 6.63 |
| Bloomberg US Aggregate TR Index | 6.82 | 5.53 | 5.53 | -3.31 | 1.10 | 1.28 |
| S&P 500 TR Index | 11.69 | 26.29 | 26.29 | 10.00 | 15.69 | 12.80 |
| ICE BofAML Investment Grade US Convertible 5% Constrained Index | 5.83 | 6.74 | 6.74 | 4.02 | 8.00 | 8.17 |
| Class A | 5.94 | 2.73 | 2.73 | 0.17 | 6.99 | 6.35 |
| Class C | 5.80 | 1.92 | 1.92 | -0.58 | 6.24 | 5.58 |
| Class A w/ Sales Charge | 0.90 | -2.15 | -2.15 | -1.44 | 5.94 | 5.60 |
| * | Inception: 03/01/2017. The performance shown prior to December 6, 2019 is that of the Predecessor Fund, which reflects all of the Predecessor Fund’s actual fees and expenses adjusted to include any fees of each share class. |
Maximum sales charge for Class A is 4.75%. Maximum Deferred Sales Charge of 1.00% on Class C shares applies to shares sold within 12 months of purchase. The performance data quoted here represents past performance. Current performance may be lower or higher than the performance data quoted above. Investment return and principal value will fluctuate, so that shares, when redeemed, may be worth more or less than their original cost. Past performance is no guarantee of future results. Results shown reflect the waiver, without which the results could have been lower. A fund’s performance, especially for very short periods of time, should not be the sole factor in making your investment decisions. To obtain the most recent month end performance information or the Fund’s prospectus please call 800-253-0412 or visit www.RationalMF.com.
| 1 | Bloomberg US Convertibles TR Index: An index used to represent the U.S. convertible bond asset class. |
5140-NLD-2/1/2024
Rational/Pier 88 Convertible Securities Fund
PORTFOLIO REVIEW (Unaudited)
December 31, 2023
The Fund’s performance figures* for each of the periods ended December 31, 2023, compared to its benchmarks:
| | | Annualized | Annualized | Annualized |
| | 1 Year Return | 5 Year Return | Since Inception(a) | Since Inception(b) |
| Institutional (c) | 3.29% | 7.29% | N/A | 6.63% |
| Class A | 2.73% | 6.99% | 4.49% | N/A |
| Class A with load | (2.15)% | 5.94% | 3.24% | N/A |
| Class C | 1.92% | 6.24% | 3.77% | N/A |
| S&P 500 Total Return Index (d) | 26.29% | 15.69% | 12.59% | 12.58% |
| Bloomberg US Convertible TR Index (e) | 13.49% | 12.15% | 10.10% | 10.08% |
| ICE BofA Investment Grade U.S. Convertible 5% Constrained Index (f) | 6.74% | 8.00% | 5.24% | 8.16% |
| * | The performance data quoted here represents past performance. Current performance may be lower or higher than the performance data quoted above. Investment return and principal value will fluctuate, so that shares, when redeemed, may be worth more or less than their original cost. The returns shown do not reflect the deduction of taxes that a shareholder would pay on Fund distributions or on the redemptions of Fund shares. Past performance is no guarantee of future results. Performance figures for periods greater than 1 year are annualized. Per the fee table in the Fund’s May 1, 2023 prospectus, as supplemented to date, the total annual operating expense are 1.17% for Institutional shares, 1.42% for Class A shares and 2.12% for Class C shares before fee waivers and/or expense reimbursements, if any. See the financial highlights for current expense ratios. For performance information current to the most recent month-end, please call toll-free 1-800-253- 0412. Class A shares are subject to a maximum load of 4.75%. |
| (a) | Inception date is December 6, 2019 for Class A, Class C and the benchmarks. |
| (b) | Inception date is March 1, 2017 for Institutional and the benchmarks. |
| (c) | The Fund acquired all of the assets and liabilities of Lake Como Convertible Bond Fund L.P. (the “Predecessor Fund”) in a tax-free reorganization on December 6, 2019. In connection with this acquisition, shares of the Predecessor Fund were exchanged for Institutional shares of the Fund. The Fund’s investment objective, policies and guidelines are, in all material respects, equivalent to the Predecessor Fund’s investment objectives, policies and guidelines. The Predecessor Fund commenced operations on March 1, 2017. Updated performance information will be available at no cost by calling 1-800-253-0412 or visiting the Fund’s website at www.rationalmf.com. |
| (d) | The S&P 500 Total Return Index, a registered trademark of S&P Global, Inc., is a market capitalization-weighted index of 500 widely held common stocks. Investors cannot invest directly in an Index. |
| (e) | The Bloomberg US Convertible TR Index: An index used to represent the US convertible bond asset class |
| (f) | The ICE BofA Investment Grade U.S. Convertible 5% Constrained Index (VX5C) is a market-capitalization-weighted index of domestic corporate convertible securities. Bonds and preferred stocks must be convertible only to common stock, ADRs or cash equivalent and have a market value of at least $50 million. It includes Coupon, OID, or zero coupon convertible bonds rated by Moody’s and/or S&P with an average rating of Baa3/BBB- or higher. All positions are capped at 5% of market value. |
Comparison of the Change in Value of a $10,000 Investment
| Top 10 Holdings by Industry | | % of Net Assets | |
| Software | | | 26.4 | % |
| Electric Utilities | | | 11.9 | % |
| Banking | | | 8.8 | % |
| Real Estate Investment Trusts | | | 8.0 | % |
| Internet Media & Services | | | 7.3 | % |
| E-Commerce Discretionary | | | 5.8 | % |
| Asset Management | | | 5.1 | % |
| Medical Equipment & Devices | | | 4.2 | % |
| Technology Services | | | 3.7 | % |
| Oil & Gas Producers | | | 2.5 | % |
| Other/Short-Term Investments | | | 16.3 | % |
| | | | 100.0 | % |
Please refer to the Schedule of Investments for a more detailed breakdown of the Fund’s assets.
December 31, 2023
Rational Special Situations Income Fund (RFXAX | RFXCX | RFXIX) (unaudited)
Dear Shareholders,
The Rational Special Situations Income Fund’s (the “Fund”) Institutional class shares returned +4.08% in 2023. After a volatile year, the Bloomberg U.S. Aggregate Bond Index (the “Agg”) was buoyed by the December 2023 rally in rates (10-year Treasury yields fell by 45 bps in December) and returned +5.53% in 2023. Similarly, the Bloomberg Barclays U.S. Mortgage Backed Securities Index returned +5.05% on the year.
While the Agg was buffeted by interest rates, the Fund had a muted response. For 2023, the Fund’s beta (expected to move relative to reference data point) to the Agg, based on daily returns, was only 0.10. It is generally the case that when markets become more volatile (as was the case with fixed income throughout 2023), correlations become much tighter. We believe that the realized beta of the Fund to the Agg further solidifies the Fund as a diversifying addition to the fixed income component of an investment portfolio.
While the Fund benefited this year from the high yield on pre-2008 non-agency residential mortgage-backed securities (“NARMBS”) and many of our special situation trades in both the residential mortgage-backed securities (“RMBS”) and commercial mortgage-backed securities (“CMBS”) spaces, performance was hurt by a general decline in CMBS prices - as well as a steep (and we believe temporary) decline in the price of our largest special situation position.
Pre-2008, NARMBS began the year with a loss-adjusted yield of approximately 8% and finished the year at about 7.5%. In other words, the relatively modest rally in nominal long-adjusted yields was not the largest driver of our performance. Credit risk continued to be a small risk to those holdings, and we were able to collect principal and interest payment as expected. With the recent drop in risk-free rates, we believe that NARMBS yields are substantially more attractive now than they were a year ago, simply because the spread between their yields and Treasury yields has widened.
In our opinion, we also benefited from the ripening of a handful of special situation trades in RMBS. For instance, the Fund made about 40 bps in June 2023 on an “indirect litigation trade,” i.e. a trade involving bonds that were the subject of litigation, but for which we had no involvement in the proceedings. Our expertise in, and focus on, RMBS litigation afforded us an opportunity to better understand and respond more swiftly to the announcement of a settlement in the case than most market participants. As a result, we were able to acquire bonds at an approximately 40% discount to their post-settlement, fundamental value. We believe other market participants either misinterpreted the consequences of the settlement on future cash flows or simply assigned too large a discount for uncertainty, even after most of the uncertainty had been resolved by the courts.
On the direct litigation side, we presented arguments in court for another special situation trade at the end of January 2023. Disappointingly, the judge has not yet ruled, but we are hopeful that the delay is a sign that the judge is diligently wrestling with the complexities in the case. The largest obstacle we often face is complexity because, we believe, maintaining the status quo is the path of least resistance for a judge, which usually works to the detriment of the plaintiff.
The CMBS market underperformed our expectations this year, but not because of unsuccessful special situation plays or disappointing realized yields. In fact, we made money from both special situation trades and yields in this sector, but CMBS generally fell out of favor with investors and prices declined across the board. We believe most of the CMBS we focus on are more attractive now than they were a year ago.
We continue to look for (and find) credit-remote CMBS plays that involve healthy yields (low double digit yields are typical) in baseline scenarios and which actually do better in both very positive and very negative economic scenarios. If commercial property values were to rally significantly this year, we would likely see spread tightening and therefore higher prices on our target bonds. Alternatively, if property values were to decline precipitously, we would likely see rising defaults and liquidations of underlying properties, leading to accelerated repayments on the most senior bonds. Note that when we purchase a bond at a discount to par, earlier than expected repayment of principal increases the bond’s IRR (internal rate of return).
Ambac surplus notes continue to be our largest position. Much to our surprise, it was a drag on our performance last year. We feel that the prospects are brighter than they have ever been for a successful resolution of litigation related to these notes on a relatively short time frame. The price was driven down late in the year by a few aggressive sellers.
We are very optimistic for 2024. Non-agency RMBS continue to offer comprehensive loss-adjusted yields, special situations abound in both RMBS and CMBS, and we are very excited about the special situations we already hold, especially the Ambac trade.
We will continue to focus on senior tranches and to minimize interest rate risk. We find it likely that, this will continue to result in lower volatility of our daily performance relative to other fixed income funds.
We thank you for your continued support.
Sincerely,
Dr. Eric S. Meyer and William Van de Water
Portfolio Managers
Performance (%): Ending December 31, 2023
Annualized if greater than a year
| Share Class/Benchmark | 1 Year | 3 Years | 5 Years | 10 Years | Since Inception* |
| Institutional Shares | 4.08 | 2.81 | 3.85 | 6.39 | 12.30 |
| Bloomberg US Agg TR Index | 5.53 | -3.31 | 1.10 | 1.81 | 2.76 |
| Bloomberg MBS TR Index | 5.05 | -2.86 | 0.25 | 1.38 | 2.15 |
| Class A | 3.88 | 2.56 | 3.59 | 6.12 | 12.03 |
| Class C | 3.06 | 1.80 | 2.82 | 5.33 | 11.19 |
| Class A w/ Load | -1.08 | 0.91 | 2.59 | 5.61 | 11.66 |
| * | Inception: 02/01/2009. The performance shown prior to July 17, 2019 is that of the Predecessor Fund, which reflects all of the Predecessor Fund’s actual fees and expenses adjusted to include any fees of each share class. |
Investment return and principal value will fluctuate, so that shares, when redeemed, may be worth more or less than their original cost. Past performance is no guarantee of future results. Results shown reflect the expense waiver, without which the results could have been lower. A fund’s performance, especially for very short periods of time, should not be the sole factor in making your investment decisions. To obtain the most recent month end performance information please call 800-253-0412 or visit www.RationalMF.com.
Maximum sales charge for Class A is 4.75%. Maximum Deferred Sales Charge of 1.00% on Class C shares applies to shares sold within 12 months of purchase. The performance data quoted here represents past performance. Current performance may be lower or higher than the performance data quoted above.
Investors should carefully consider the investment objectives, risks, charges and expenses of the Rational Funds. This and other important information about the Fund are contained in the prospectus, which can be obtained by calling (800) 253-0412 or at www.rationalmf.com. The prospectus should be read carefully before investing. The Rational Funds are distributed by Northern Lights Distributors, LLC member FINRA/SIPC. Rational Advisors, Inc. is not affiliated with Northern Lights Distributors, LLC.
Important Risk Information
Investing in the Fund carries certain risks. The value of the Fund may decrease in response to the activities and financial prospects of an individual security in the Fund’s portfolio. The Fund is non-diversified and may invest a greater percentage of its assets in a particular issue and may own fewer securities than other mutual funds; the Fund is subject to concentration risk. When the Fund invests in asset-backed securities and mortgage-backed securities, the Fund is subject to the risk that, if the underlying borrowers fail to pay interest or repay principal, the assets backing these securities may not be sufficient to support payments on the securities. Interest rate risk is the risk that bond prices overall, including the prices of securities held by the Fund, will decline over short or even long periods of time due to rising interest rates. Bonds with longer maturities tend to be more sensitive to interest rates than bonds with shorter maturities. Lower-quality bonds, known as “high yield” or
“junk” bonds, present greater risk than bonds of higher quality, including an increased risk of default. Credit risk is the risk that the issuer of a security will not be able to make principal and interest payments when due. These factors may affect the value of your investment.
The Fund commenced operations by acquiring all of the assets and liabilities of ESM Fund I, L.P. (the “Predecessor Fund”) in a tax-free reorganization on July 17, 2019 (the “Reorganization”). In connection with the Reorganization, investors in the Predecessor Fund received Institutional shares of the Fund. The Fund’s investment objectives, policies, guidelines and restrictions are, in all material respects, equivalent to those of the Predecessor Fund. However, the Predecessor Fund was not registered under the Investment Company Act of 1940, as amended (the “1940 Act), and, therefore, was not subject to certain investment restrictions, limitations and diversification requirements that are imposed by the 1940 Act or Subchapter M of the Internal Revenue Code, which, if they had been applicable, might have adversely affected the Predecessor Fund’s performance. The Fund’s Sub-Advisor was the investment adviser to the Predecessor Fund. The Fund’s fees and expenses are expected to be higher than those of the Predecessor Fund, so if the Fund’s expenses were applied to the Predecessor Fund’s performance, the performance would have been lower.
5137-NLD-2/1/2024
Rational Special Situations Income Fund
PORTFOLIO REVIEW (Unaudited)
December 31, 2023
The Fund’s performance figures* for each of the periods ended December 31, 2023, compared to its benchmarks:
| | | Annualized | Annualized | Annualized | Annualized |
| | 1 Year Return | 5 Year Return | 10 Year Return | Since Inception(a) | Since Inception(b) |
| Institutional (c) | 4.08% | 3.85% | 6.39% | N/A | 12.30% |
| Class A | 3.88% | N/A | N/A | 2.70% | N/A |
| Class A with load | (1.08)% | N/A | N/A | 1.58% | N/A |
| Class C | 3.06% | N/A | N/A | 1.94% | N/A |
| Bloomberg U.S. Aggregate Bond Index (d) | 5.53% | 1.10% | 1.81% | (0.08)% | 2.76% |
| Bloomberg U.S. Mortgage Backed Securities Index (e) | 5.05% | 0.25% | 1.38% | (0.68)% | 2.15% |
| * | The performance data quoted here represents past performance. Current performance may be lower or higher than the performance data quoted above. Investment return and principal value will fluctuate, so that shares, when redeemed, may be worth more or less than their original cost. The returns shown do not reflect the deduction of taxes that a shareholder would pay on Fund distributions or on the redemptions of Fund shares. Past performance is no guarantee of future results. Performance figures for periods greater than 1 year are annualized. Per the fee table in the Fund’s May 1, 2023 prospectus, as supplemented to date, the total annual operating expense are 1.80% for Institutional shares, 2.06% for Class A shares and 2.77% for Class C shares before fee waivers and/or expense reimbursements, if any. See the financial highlights for current expense ratios. For performance information current to the most recent month-end, please call toll-free 1-800-253-0412. Class A shares are subject to a maximum load of 4.75%. |
| (a) | Inception date is July 17, 2019 for Class A, Class C and the benchmarks. |
| (b) | Inception date is February 1, 2009 for Institutional and the benchmarks. |
| (c) | The Fund acquired all of the assets and liabilities of ESM Fund I, L.P. (the “Predecessor Fund”) in a tax-free reorganization on July 17, 2019. In connection with this acquisition, shares of the Predecessor Fund were exchanged for Institutional shares of the Fund, so the Predecessor Fund became the Institutional shares of the Fund. The Fund’s investment objective, policies and guidelines are, in all material respects, equivalent to the Predecessor Fund’s investment objectives, policies and guidelines. The Predecessor Fund commenced operations in February 2009. Updated performance information will be available at no cost by calling 1-800-253-0412 or visiting the Fund’s website at www.RationalMF.com. |
| (d) | The Bloomberg U.S. Aggregate Bond Index is a market capitalization-weighted index that is designed to measure the performance of the U.S. investment grade bond market with maturities of more than one year. Investors cannot invest directly in an Index. |
| (e) | The Bloomberg U.S. Mortgage Backed Securities Index tracks agency mortgage pass-through securities. Investors cannot invest directly in an Index. |
Comparison of the Change in Value of a $10,000 Investment
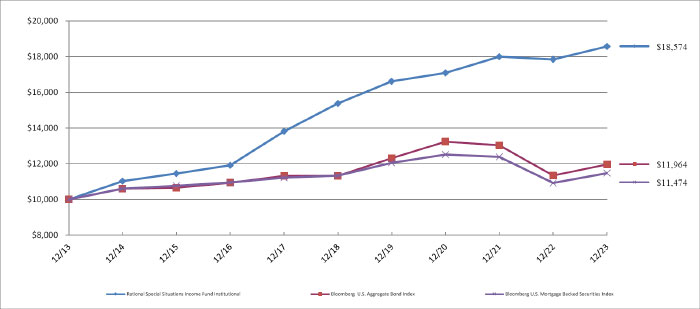
| Top 10 Holdings by Industry | | % of Net Assets | |
| Non Agency Collateralized Mortgage Backed Securities | | | 26.4 | % |
| Collateralized Mortgage Obligations | | | 25.6 | % |
| Insurance | | | 14.3 | % |
| Home Equity | | | 11.2 | % |
| Residential Mortgage | | | 10.9 | % |
| Manufactured Housing | | | 4.2 | % |
| Synthetic Fibers and Chemicals | | | 1.9 | % |
| Specialty Finance | | | 1.2 | % |
| Auto Loan | | | 0.6 | % |
| Banking | | | 0.4 | % |
| Other/Short-Term Investments | | | 3.3 | % |
| | | | 100.0 | % |
Please refer to the Schedule of Investments for a more detailed breakdown of the Fund’s assets.
December 31, 2023
Rational Real Assets Fund (IGOAX, IGOCX, IGOIX) (unaudited)
Formerly, the Rational Inflation Growth Fund
Dear Shareholders,
The Rational Real Assets Fund (the “Fund”) seeks to achieve long-term capital appreciation by investing in exchange-traded equity securities of “real assets” companies. The Fund defines “real assets” companies as those in energy, materials, industrials, real estate, and utility sectors.
The Fund primarily invests in the common stock of domestic and foreign companies, including American Depositary Receipts (“ADRs”) and real estate investment trusts (“REITs”), with any market capitalization within sectors and/or asset classes that SL Advisors, LLC (the “Sub-Advisor”), believes to own “real assets” including those in the real estate, infrastructure, energy, basic materials, utilities, and industrials sectors.
Fund Performance
The Fund lagged its official benchmark which is a composite of 60% S&P500 Total Return Index and 40% the Bloomberg US Aggregate Total Return Bond Index which returned 17.67%. This was led by the strong performance of the S&P500 of 26.3% as well as solid performance from the Bloomberg US Aggregate Bond Index of 5.5% bond investors priced in the end of rate hikes in late 2023. The Fund performed in line vs its benchmark index, the S&P Real Asset Equity Total Return Index (Index Ticker: SPRAET) during 2023. During this period, the Fund returned +7.43% versus the SPRAET returning +8.43%. Both underperformed the broader S&P500 TR Index, which delivered a strong return of +26.29%. Federal Reserve policy remained hawkish for most of the year leading to lower inflation and lower inflation expectations but also raising concerns for economically sensitive sectors. On a price return basis, as represented by FactSet, Real Asset equity sectors significantly underperformed. The Fund lacks exposure to the Technology, Communication Services, and Consumer Discretionary sectors which were the best performers returning respectively 56%, 53%, and 40%. On the other hand, the Real Asset heavy sectors of Energy and Utilities were down on the year by -1% and -7%. Furthermore, the S&P 500 is heavily weighted towards the Technology, Consumer Discretionary, and Communication Services sectors which comprise approximately half of the S&P 500 Index.
Performance (%): Ending December 31, 2023
Annualized if greater than a year
| Share Class/Benchmark | QTD | YTD | 1 Year | 3 Years | Since Inception* |
| Institutional Shares | 9.03 | 7.43 | 7.43 | n/a | 2.05 |
| 60% S&P 500 TR Index / 40% Bloomberg US Agg TR Index | 9.74 | 17.67 | 17.67 | n/a | 1.69 |
| S&P Real Assets Equity TR Index | 11.64 | 8.43 | 8.43 | n/a | 1.43 |
| Class A | 9.04 | 7.20 | 7.20 | n/a | 1.81 |
| Class C | 8.81 | 6.25 | 6.25 | n/a | 0.99 |
| Class A w/ Sales Charge | 2.81 | 1.02 | 1.02 | n/a | -0.70 |
* Inception: 08/18/2021.
Maximum sales charge for Class A is 5.75%. Maximum Deferred Sales Charge of 1.00% on Class C shares applies to shares sold within 12 months of purchase. Total Annual Fund Operating Expense 1.32%. 1.57%, and 2.32% for Institutional, Class A, and Class C shares, respectively. The performance data quoted here represents past performance. Current performance may be lower or higher than the performance data quoted above. Investment return and principal value will fluctuate, so that shares, when redeemed, may be worth more or less than their original cost. Past performance
is no guarantee of future results. To obtain the most recent month end performance information or the Fund’s prospectus please call 800-253-0412 or visit www.RationalMF.com.
Results shown reflect the fee waiver and/or expense reimbursements, without which the results could have been higher. A fund’s performance, especially for very short periods of time, should not be the sole factor in making your investment decisions.
Summary
The Sub-Advisor believes the Fund’s investments are well positioned to deliver positive returns, as real assets have embedded inflation protection and the fund seeks investments in profitable companies generating positive cash flows.
| Simon Lack | Henry Hoffman |
| Portfolio Manager | Portfolio Manager |
This report is intended for the Fund’s shareholders. It may not be distributed to prospective investors unless it is preceded or accompanied by the current Fund prospectus. To obtain a prospectus or other information about the Fund, please visit www.RationalMF.com or call 1-800-253-0412. Please read the prospectus carefully before investing.
| 1 | The 60% S&P 500 TR Index/40% LBUSTRUU Index represents a blended index consisting of 60% of returns generated from the S&P 500 TR Index and 40% of returns generated from the Bloomberg U.S. Aggregate Bond Index. |
Important Risk Information:
As with any mutual fund, there is no guarantee that the Fund will achieve its objective. Investment markets are unpredictable and there will be certain market conditions where the Fund will not meet its investment objective and will lose money. The Fund has a limited history of operations for investors to evaluate. If the Fund is unable to achieve an economic size, expenses will be higher than expected and the Fund might close, which could produce adverse tax consequences for shareholders.
There is no guarantee that the value of the Fund’s investments will increase with inflation or with the expectation of higher inflation in the future. It is possible that the Fund’s investments may be negatively correlated with inflation trends or show no such correlation at all, either because the estimate of correlation by the Sub-Advisor or its proprietary model was wrong or because the correlation in the market changed. Historic correlation is no guarantee of future correlation.
ADRs are subject to the same risks as direct investment in foreign companies discussed below and involve risks that are not found in investments in U.S. companies. ADRs may not track the price of the underlying foreign securities on which they are based, and their value may change materially at times when U.S. markets are not open for trading.
Like a mutual fund, the value of an ETF can fluctuate based on the prices of the securities owned by the ETF. Because the Fund may invest its assets in ETFs that have their own fees and expenses in addition to those charged directly by the Fund, the Fund may bear higher expenses than a fund that invests directly in individual securities.
The Fund’s investments in REITs are subject to the same risks as direct investments in real estate, including sensitivity to general economic downturns and the volatility of local real estate markets.
The Fund is distributed by Northern Lights Distributors, LLC. (Member FINRA) Rational Funds, the Sub-Advisor and Northern Lights Distributors, LLC are separate and unaffiliated.
The views expressed in this letter were those as of December 31, 2023 and may not necessarily reflect views on the date this letter is first published or anytime thereafter. These views are intended to help shareholders in understanding the Fund’s present investment methodology and do not constitute investment advice.
5135-NLD-1/31/2024
Rational Real Assets Fund
(Formerly, Rational Inflation Growth Fund)
PORTFOLIO REVIEW (Unaudited)
December 31, 2023
The Fund’s performance figures* for each of the periods ended December 31, 2023, compared to its benchmarks:
| | | Annualized |
| | 1 Year Return | Since Inception(a) |
| Institutional | 7.43% | 2.05% |
| Class A | 7.20% | 1.81% |
| Class A with load | 1.02% | (0.70)% |
| Class C | 6.25% | 0.99% |
| 60% S&P 500 Total Return Index/40% Bloomberg U.S. Aggregate Bond Index (b) | 17.67% | 1.69% |
| S&P 500 Total Return Index (c) | 26.29% | 5.13% |
| Bloomberg U.S. Aggregate Bond Index (d) | 5.53% | (3.87)% |
| * | The performance data quoted here represents past performance. Current performance may be lower or higher than the performance data quoted above. Investment return and principal value will fluctuate, so that shares, when redeemed, may be worth more or less than their original cost. The returns shown do not reflect the deduction of taxes that a shareholder would pay on Fund distributions or on the redemptions of Fund shares. Past performance is no guarantee of future results. Performance figures for periods greater than 1 year are annualized. Per the fee table in the Fund’s May 1, 2023 prospectus, as supplemented to date, the total annual operating expense are 4.69% for Institutional shares, 5.04% for Class A shares and 6.02% for Class C shares before fee waivers and/or expense reimbursements, if any. Effective January 18, 2024 the total annual operating expense are 4.39% for Institutional shares, 4.74% for Class A shares and 5.72% for Class C shares before fee waivers and/or expense reimbursements, if any. See the financial highlights for current expense ratios. For performance information current to the most recent month-end, please call toll-free 1-800-253-0412. Class A shares are subject to a maximum load of 5.75%. |
| (a) | Inception date is August 18, 2021 for Class A, Class C, Institutional and the benchmarks. |
| (b) | The 60% S&P 500/40% Bloomberg U.S. Aggregate Index is a hypothetical combination of unmanaged indices comprised of 60% S&P 500 Index and 40% Bloomberg U.S. Aggregate Bond Index. |
| (c) | The S&P 500 Total Return Index, a registered trademark of S&P Global, Inc., is a market capitalization-weighted index of 500 widely held common stocks. Investors cannot invest directly in an Index. |
| (d) | The Bloomberg U.S. Aggregate Bond Index is a market capitalization-weighted index that is designed to measure the performance of the U.S. investment grade bond market with maturities of more than one year. Investors cannot invest directly in an Index. |
Comparison of the Change in Value of a $10,000 Investment
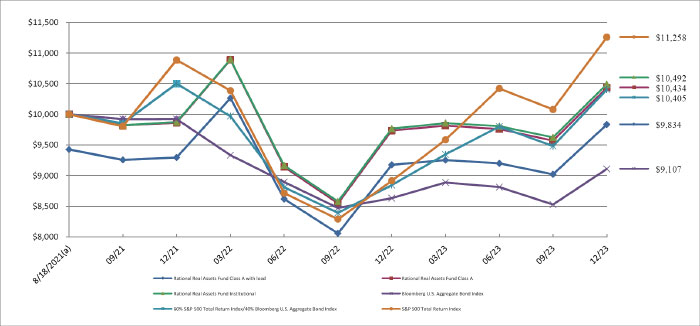
| Top 10 Holdings by Industry | | % of Net Assets | |
| Oil & Gas Producers | | | 27.5 | % |
| Chemicals | | | 9.6 | % |
| Electric Utilities | | | 9.4 | % |
| Steel | | | 8.2 | % |
| Transportation & Logistics | | | 8.2 | % |
| Aerospace & Defense | | | 6.1 | % |
| Commercial Support Services | | | 4.4 | % |
| Diversified Industrials | | | 4.2 | % |
| Data Center REIT | | | 3.0 | % |
| Industrial REIT | | | 2.8 | % |
| Other/Short-Term Investments | | | 16.6 | % |
| | | | 100.0 | % |
Please refer to the Schedule of Investments for a more detailed breakdown of the Fund’s assets.
| RATIONAL EQUITY ARMOR FUND |
| SCHEDULE OF INVESTMENTS |
| December 31, 2023 |
| Shares | | | | | Fair Value | |
| | | | | COMMON STOCKS — 69.3% | | | | |
| | | | | AEROSPACE & DEFENSE - 0.6% | | | | |
| | 447 | | | Boeing Company (The)(a) | | $ | 116,516 | |
| | 1,182 | | | Raytheon Technologies Corporation | | | 99,453 | |
| | | | | | | | 215,969 | |
| | | | | APPAREL & TEXTILE PRODUCTS - 0.3% | | | | |
| | 964 | | | NIKE, Inc., Class B | | | 104,661 | |
| | | | | | | | | |
| | | | | ASSET MANAGEMENT - 0.2% | | | | |
| | 107 | | | BlackRock, Inc. | | | 86,863 | |
| | | | | | | | | |
| | | | | AUTOMOTIVE - 1.4% | | | | |
| | 1,978 | | | Tesla, Inc.(a) | | | 491,493 | |
| | | | | | | | | |
| | | | | BANKING - 2.2% | | | | |
| | 5,239 | | | Bank of America Corporation | | | 176,397 | |
| | 1,481 | | | Citigroup, Inc. | | | 76,183 | |
| | 2,284 | | | JPMorgan Chase & Company | | | 388,509 | |
| | 2,834 | | | Wells Fargo & Company | | | 139,489 | |
| | | | | | | | 780,578 | |
| | | | | BEVERAGES - 0.2% | | | | |
| | 1,088 | | | Coca-Cola Company (The) | | | 64,116 | |
| | | | | | | | | |
| | | | | BIOTECH & PHARMA - 3.2% | | | | |
| | 1,973 | | | Amgen, Inc. | | | 568,264 | |
| | 6,332 | | | Gilead Sciences, Inc. | | | 512,956 | |
| | 360 | | | Zoetis, Inc. | | | 71,053 | |
| | | | | | | | 1,152,273 | |
| | | | | CABLE & SATELLITE - 0.4% | | | | |
| | 3,268 | | | Comcast Corporation, Class A | | | 143,302 | |
| | | | | | | | | |
| | | | | CHEMICALS - 0.2% | | | | |
| | 151 | | | Linde plc | | | 62,017 | |
| | | | | | | | | |
| | | | | DIVERSIFIED INDUSTRIALS - 0.8% | | | | |
| | 312 | | | Eaton Corporation PLC | | | 75,136 | |
See accompanying notes which are an integral part of these financial statements.
| RATIONAL EQUITY ARMOR FUND |
| SCHEDULE OF INVESTMENTS (Continued) |
| December 31, 2023 |
| Shares | | | | | Fair Value | |
| | | | | COMMON STOCKS — 69.3% (Continued) | | | | |
| | | | | DIVERSIFIED INDUSTRIALS - 0.8% (Continued) | | | | |
| | 857 | | | General Electric Company | | $ | 109,379 | |
| | 521 | | | Honeywell International, Inc. | | | 109,259 | |
| | | | | | | | 293,774 | |
| | | | | E-COMMERCE DISCRETIONARY - 4.9% | | | | |
| | 8,946 | | | Amazon.com, Inc.(a) | | | 1,359,256 | |
| | 8,661 | | | eBay, Inc. | | | 377,793 | |
| | | | | | | | 1,737,049 | |
| | | | | ELECTRIC UTILITIES - 0.7% | | | | |
| | 1,376 | | | Constellation Energy Corporation | | | 160,840 | |
| | 1,532 | | | NextEra Energy, Inc. | | | 93,054 | |
| | | | | | | | 253,894 | |
| | | | | ENTERTAINMENT CONTENT - 0.4% | | | | |
| | 1,437 | | | Walt Disney Company (The) | | | 129,747 | |
| | | | | | | | | |
| | | | | HEALTH CARE FACILITIES & SERVICES - 0.2% | | | | |
| | 1,017 | | | CVS Health Corporation | | | 80,302 | |
| | | | | | | | | |
| | | | | HOUSEHOLD PRODUCTS - 0.4% | | | | |
| | 850 | | | Procter & Gamble Company (The) | | | 124,559 | |
| | | | | | | | | |
| | | | | INSTITUTIONAL FINANCIAL SERVICES - 0.7% | | | | |
| | 296 | | | CME Group, Inc. | | | 62,338 | |
| | 254 | | | Goldman Sachs Group, Inc. (The) | | | 97,985 | |
| | 978 | | | Morgan Stanley | | | 91,199 | |
| | | | | | | | 251,522 | |
| | | | | INSURANCE - 9.7% | | | | |
| | 3 | | | Berkshire Hathaway, Inc., Class A(a) | | | 1,627,875 | |
| | 5,088 | | | Berkshire Hathaway, Inc., Class B(a) | | | 1,814,685 | |
| | | | | | | | 3,442,560 | |
| | | | | INTERNET MEDIA & SERVICES - 9.3% | | | | |
| | 5,538 | | | Alphabet, Inc., Class A(a) | | | 773,603 | |
| | 5,453 | | | Alphabet, Inc., Class C(a) | | | 768,491 | |
| | 28 | | | Booking Holdings, Inc.(a) | | | 99,322 | |
| | 4,194 | | | Meta Platforms, Inc., Class A(a) | | | 1,484,508 | |
See accompanying notes which are an integral part of these financial statements.
| RATIONAL EQUITY ARMOR FUND |
| SCHEDULE OF INVESTMENTS (Continued) |
| December 31, 2023 |
| Shares | | | | | Fair Value | |
| | | | | COMMON STOCKS — 69.3% (Continued) | | | | |
| | | | | INTERNET MEDIA & SERVICES - 9.3% (Continued) | | | | |
| | 352 | | | Netflix, Inc.(a) | | $ | 171,382 | |
| | | | | | | | 3,297,306 | |
| | | | | LEISURE FACILITIES & SERVICES - 1.4% | | | | |
| | 1,716 | | | McDonald’s Corporation | | | 508,811 | |
| | | | | | | | | |
| | | | | MEDICAL EQUIPMENT & DEVICES - 0.7% | | | | |
| | 658 | | | Abbott Laboratories | | | 72,426 | |
| | 1,057 | | | Medtronic PLC | | | 87,075 | |
| | 269 | | | Stryker Corporation | | | 80,555 | |
| | | | | | | | 240,056 | |
| | | | | REAL ESTATE INVESTMENT TRUSTS - 0.3% | | | | |
| | 695 | | | Prologis, Inc. | | | 92,644 | |
| | | | | | | | | |
| | | | | RETAIL - CONSUMER STAPLES - 0.7% | | | | |
| | 118 | | | Costco Wholesale Corporation | | | 77,889 | |
| | 1,142 | | | Walmart, Inc. | | | 180,037 | |
| | | | | | | | 257,926 | |
| | | | | RETAIL - DISCRETIONARY - 1.3% | | | | |
| | 359 | | | Home Depot, Inc. (The) | | | 124,411 | |
| | 1,588 | | | Lowe’s Companies, Inc. | | | 353,410 | |
| | | | | | | | 477,821 | |
| | | | | SEMICONDUCTORS - 9.7% | | | | |
| | 579 | | | Advanced Micro Devices, Inc.(a) | | | 85,350 | |
| | 3,303 | | | Applied Materials, Inc. | | | 535,317 | |
| | 941 | | | Broadcom, Inc. | | | 1,050,391 | |
| | 3,254 | | | Intel Corporation | | | 163,514 | |
| | 676 | | | Lam Research Corporation | | | 529,484 | |
| | 851 | | | Micron Technology, Inc. | | | 72,624 | |
| | 1,996 | | | NVIDIA Corporation | | | 988,459 | |
| | | | | | | | 3,425,139 | |
| | | | | SOFTWARE - 6.4% | | | | |
| | 189 | | | Adobe, Inc.(a) | | | 112,757 | |
| | 5,251 | | | Microsoft Corporation | | | 1,974,587 | |
See accompanying notes which are an integral part of these financial statements.
| RATIONAL EQUITY ARMOR FUND |
| SCHEDULE OF INVESTMENTS (Continued) |
| December 31, 2023 |
| Shares | | | | | Fair Value | |
| | | | | COMMON STOCKS — 69.3% (Continued) | | | | |
| | | | | SOFTWARE - 6.4% (Continued) | | | | |
| | 759 | | | Salesforce, Inc.(a) | | $ | 199,723 | |
| | | | | | | | 2,287,067 | |
| | | | | TECHNOLOGY HARDWARE - 7.3% | | | | |
| | 9,562 | | | Apple, Inc. | | | 1,840,971 | |
| | 15,207 | | | Cisco Systems, Inc. | | | 768,258 | |
| | | | | | | | 2,609,229 | |
| | | | | TECHNOLOGY SERVICES - 2.0% | | | | |
| | 253 | | | Accenture plc, Class A | | | 88,780 | |
| | 3,193 | | | International Business Machines Corporation | | | 522,215 | |
| | 254 | | | S&P Global, Inc. | | | 111,892 | |
| | | | | | | | 722,887 | |
| | | | | TELECOMMUNICATIONS - 0.6% | | | | |
| | 5,712 | | | AT&T, Inc. | | | 95,847 | |
| | 3,362 | | | Verizon Communications, Inc. | | | 126,748 | |
| | | | | | | | 222,595 | |
| | | | | TOBACCO & CANNABIS - 1.7% | | | | |
| | 15,669 | | | Altria Group, Inc. | | | 632,087 | |
| | | | | | | | | |
| | | | | TRANSPORTATION & LOGISTICS - 0.7% | | | | |
| | 3,764 | | | Delta Air Lines, Inc. | | | 151,425 | |
| | 559 | | | United Parcel Service, Inc., B | | | 87,892 | |
| | | | | | | | 239,317 | |
| | | | | TRANSPORTATION EQUIPMENT - 0.7% | | | | |
| | 2,691 | | | PACCAR, Inc. | | | 262,776 | |
| | | | | | | | | |
| | | | | TOTAL COMMON STOCKS (Cost $21,109,167) | | | 24,690,340 | |
| | | | | | | | | |
| | | | | EXCHANGE-TRADED FUNDS — 36.9% | | | | |
| | | | | EQUITY - 36.4% | | | | |
| | 6,673 | | | Fidelity MSCI Information Technology Index ETF | | | 958,510 | |
| | 29,726 | | | Fidelity Value Factor ETF | | | 1,575,416 | |
| | 6,535 | | | iShares Core S&P U.S. Value ETF | | | 551,097 | |
See accompanying notes which are an integral part of these financial statements.
| RATIONAL EQUITY ARMOR FUND |
| SCHEDULE OF INVESTMENTS (Continued) |
| December 31, 2023 |
| Shares | | | | | Fair Value | |
| | | | | EXCHANGE-TRADED FUNDS — 36.9% (Continued) | | | | |
| | | | | EQUITY - 36.4% (Continued) | | | | |
| | 3,480 | | | iShares S&P 100 ETF | | $ | 777,397 | |
| | 11,156 | | | iShares S&P 500 Value ETF | | | 1,939,916 | |
| | 7,809 | | | iShares US Technology ETF | | | 958,555 | |
| | 41,568 | | | SPDR Portfolio S&P 500 Value ETF | | | 1,938,316 | |
| | 4,948 | | | Technology Select Sector SPDR Fund | | | 952,391 | |
| | 2,146 | | | VanEck Semiconductor ETF | | | 375,271 | |
| | 1,984 | | | Vanguard Information Technology ETF | | | 960,256 | |
| | 11,538 | | | Vanguard S&P 500 Value ETF | | | 1,937,922 | |
| | | | | | | | 12,925,047 | |
| | | | | FIXED INCOME - 0.5% | | | | |
| | 1,762 | | | iShares Short Treasury Bond ETF | | | 194,049 | |
| | | | | | | | | |
| | | | | TOTAL EXCHANGE-TRADED FUNDS (Cost $11,817,102) | | | 13,119,096 | |
| | | | | | | | | |
| | | | | SHORT-TERM INVESTMENTS — 0.5% | | | | |
| | | | | MONEY MARKET FUNDS - 0.5% | | | | |
| | 168,457 | | | First American Treasury Obligations Fund, Class X, 5.28% (Cost $168,457)(b) | | | 168,457 | |
| | | | | | | | | |
| | | | | TOTAL SHORT-TERM INVESTMENTS (Cost $168,457) | | | 168,457 | |
| Contracts(c) | | | | | Broker/
Counterparty | | Expiration Date | | Exercise Price | | | Notional Value | | | Fair Value | |
| | | | | FUTURE OPTIONS PURCHASED - 0.5% | | | | | | | | | | | | | | | | |
| | | | | PUT OPTIONS PURCHASED - 0.5% | | | | | | | | | | | | | | | | |
| | 162 | | | S&P Emini Future, Maturing March 2024 | | WED | | 01/19/2024 | | $ | 4,740 | | | $ | 38,394,000 | | | $ | 162,001 | |
| | | | | TOTAL PUT OPTIONS PURCHASED (Cost - $388,800) | | | | | | |
| | | | | | | | | | | | | | | | | | | | | |
| | | | | TOTAL FUTURE OPTIONS PURCHASED (Cost - $388,800) | | | | | 162,001 | |
| | | | | | | | | | | | | | | | | | | | | |
| | | | | TOTAL INVESTMENTS - 107.2% (Cost $33,483,526) | | | | $ | 38,139,894 | |
| | | | | CALL OPTIONS WRITTEN - (0.1)% (Proceeds - $11,093) | | | | | (19,575 | ) |
| | | | | PUT OPTIONS WRITTEN - 0.0%(d) (Proceeds - $55,462) | | | | | (11,092 | ) |
| | | | | LIABILITIES IN EXCESS OF OTHER ASSETS - (7.1)% | | | | | (2,541,690 | ) |
| | | | | NET ASSETS - 100.0% | | | | $ | 35,567,537 | |
See accompanying notes which are an integral part of these financial statements.
| RATIONAL EQUITY ARMOR FUND |
| SCHEDULE OF INVESTMENTS (Continued) |
| December 31, 2023 |
| Contracts(c) | | | | | Counterparty | | Expiration Date | | Exercise Price | | | Notional Value | | | Fair Value | |
| | | | | FUTURE OPTIONS WRITTEN - (0.1)% | | | | | | | | | | | | | | | | |
| | | | | CALL OPTIONS WRITTEN- (0.1)% | | | | | | | | | | | | | | | | |
| | 87 | | | S&P Emini Future, Maturing March 2024 | | WED | | 01/19/2024 | | $ | 4,970 | | | $ | 21,619,500 | | | $ | 19,575 | |
| | | | | TOTAL CALL OPTIONS WRITTEN (Proceeds - $11,093) | | | | | |
| | | | | | | | | | | | | | | | | | | | | |
| | | | | PUT OPTIONS WRITTEN - 0.0%(d) | | | | | | |
| | 87 | | | S&P Emini Future, Maturing March 2024 | | WED | | 01/19/2024 | | $ | 4,470 | | | $ | 19,444,500 | | | $ | 11,092 | |
| | | | | TOTAL PUT OPTIONS WRITTEN (Proceeds - $55,462) | | | | | | |
| | | | | | | | | | | | | | | | | | | | | |
| | | | | TOTAL FUTURE OPTIONS WRITTEN (Proceeds - $66,555) | | | | $ | 30,667 | |
OPEN FUTURES CONTRACTS
Number of
Contracts | | | Open Long Futures Contracts | | Expiration | | Notional Amount(e) | | | Value and Unrealized
Depreciation | |
| | 302 | | | CBOE Volatility Index Future | | 03/20/2024 | | $ | 4,912,603 | | | $ | (190,687 | ) |
| | 18 | | | CBOE Volatility Index Future | | 04/17/2024 | | | 305,120 | | | | (19,780 | ) |
| | | | | TOTAL OPEN LONG FUTURES CONTRACTS | | | | | | | | $ | (210,467 | ) |
OPEN FUTURES CONTRACTS
Number of
Contracts | | | Open Short Futures Contracts | | Expiration | | Notional Amount(e) | | | Value and Unrealized
Appreciation | |
| | 251 | | | CBOE Volatility Index Future | | 01/17/2024 | | $ | 3,526,851 | | | $ | 168,345 | |
| | | | | TOTAL OPEN SHORT FUTURES CONTRACTS | | | | | | | | | | |
| ETF | - Exchange-Traded Fund |
| | |
| MSCI | - Morgan Stanley Capital International |
| | |
| PLC | - Public Limited Company |
| | |
| SPDR | - Standard & Poor’s Depositary Receipt |
| | |
| WED | - Wedbush Securities |
| (a) | Non-income producing security. |
| (b) | Rate disclosed is the seven day effective yield as of December 31, 2023. |
| (c) | Each contract is equivalent to one futures contract. |
| (d) | Percentage rounds to less than 0.1%. |
| (e) | The amounts shown are the underlying reference notional amounts to stock exchange indices and equities upon which the fair value of the futures contracts held by the Fund are based. Notional values do not represent the current fair value of, and are not necessarily indicative of the future cash flows of the Fund’s futures contracts. Further, the underlying price changes in relation to the variables specified by the notional values affects the fair value of these derivative financial instruments. The notional values as set forth within this schedule do not purport to represent economic value at risk to the Fund. |
See accompanying notes which are an integral part of these financial statements.
| RATIONAL TACTICAL RETURN FUND |
| SCHEDULE OF INVESTMENTS |
| December 31, 2023 |
| Principal | | | | | Discount Rate | | | | | |
| Amount ($) | | | | | (%) | | Maturity | | Fair Value | |
| | | | | SHORT-TERM INVESTMENTS — 92.6% | | | | | | | | |
| | | | | U.S. TREASURY BILLS — 52.6% | | | | | | | | |
| | 15,000,000 | | | United States Treasury Bill(a)(f) | | 4.8509 | | 01/25/24 | | $ | 14,949,470 | |
| | 15,000,000 | | | United States Treasury Bill(a)(f) | | 5.0131 | | 02/15/24 | | | 14,903,915 | |
| | 20,000,000 | | | United States Treasury Bill(a) | | 5.0789 | | 03/28/24 | | | 19,751,710 | |
| | 20,000,000 | | | United States Treasury Bill(a)(f) | | 5.0843 | | 04/11/24 | | | 19,711,889 | |
| | | | | | | | | | | | 69,316,984 | |
| Shares | | | | | | |
| | | | | MONEY MARKET FUNDS - 40.0% | | | | |
| | 52,763,568 | | | First American Treasury Obligations Fund, Class X, 5.28%(b) | | | 52,763,568 | |
| | | | | TOTAL SHORT-TERM INVESTMENTS (Cost $122,059,691) | | | 122,080,552 | |
| Contracts(c) | | | | | Broker/
Counterparty | | Expiration Date | | Exercise Price | | | Notional Value | | | Fair Value | |
| | | | | FUTURE OPTIONS PURCHASED - 0.0% (d) | | | | | | | | | | | | | | | | |
| | | | | PUT OPTIONS PURCHASED - 0.0%(d) | | | | | | | | | | | | | | | | |
| | 300 | | | S&P Emini Future, Maturing March 2024 | | ADM | | 01/05/2024 | | $ | 3,450 | | | $ | 51,750,000 | | | $ | 750 | |
| | 100 | | | S&P Emini Future, Maturing March 2024 | | FCS | | 01/05/2024 | | | 3,450 | | | | 17,250,000 | | | | 250 | |
| | 1,026 | | | S&P Emini Future, Maturing March 2024 | | ADM | | 01/05/2024 | | | 4,350 | | | | 223,155,000 | | | | 15,390 | |
| | 162 | | | S&P Emini Future, Maturing March 2024 | | RCG | | 01/05/2024 | | | 4,350 | | | | 35,235,000 | | | | 2,430 | |
| | 408 | | | S&P Emini Future, Maturing March 2024 | | FCS | | 01/05/2024 | | | 4,350 | | | | 88,740,000 | | | | 6,120 | |
| | | | | TOTAL PUT OPTIONS PURCHASED (Cost - $64,840) | | | | | 24,940 | |
| | | | | | | | | | | | | | | | | | | | | |
| | | | | TOTAL FUTURE OPTIONS PURCHASED (Cost - $64,840) | | | | | 24,940 | |
| | | | | | | | | | | | | | | | | | | | | |
| | | | | TOTAL INVESTMENTS - 92.6% (Cost $122,124,531) | | | | $ | 122,105,492 | |
| | | | | PUT OPTIONS WRITTEN - 0.0%(e) (Proceeds - $103,740) | | | | | (39,900 | ) |
| | | | | OTHER ASSETS IN EXCESS OF LIABILITIES- 7.4% | | | | | 9,716,753 | |
| | | | | NET ASSETS - 100.0% | | | | $ | 131,782,345 | |
| | | | | | | | | | | |
| Contracts(c) | | | | | Counterparty | | Expiration Date | | Exercise Price | | | Notional Value | | | Fair Value | |
| | | | | FUTURE OPTIONS WRITTEN - 0.0% (e) | | | | | | | | | | | | | | | | |
| | | | | PUT OPTIONS WRITTEN - 0.0%(e) | | | | | | | | | | | | | | | | |
| | 2,052 | | | S&P Emini Future, Maturing March 2024 | | ADM | | 01/05/2024 | | $ | 4,290 | | | $ | 440,154,000 | | | $ | 25,650 | |
| | 324 | | | S&P Emini Future, Maturing March 2024 | | RCG | | 01/05/2024 | | | 4,290 | | | | 69,498,000 | | | | 4,050 | |
| | 816 | | | S&P Emini Future, Maturing March 2024 | | FCS | | 01/05/2024 | | | 4,290 | | | | 175,032,000 | | | | 10,200 | |
| | | | | TOTAL PUT OPTIONS WRITTEN (Proceeds - $103,740) | | | | | 39,900 | |
| | | | | TOTAL FUTURE OPTIONS WRITTEN (Proceeds - $103,740) | | | | $ | 39,900 | |
| ADM | ADM Investor Services, Inc. |
| | |
| FCS | StoneX Group, Inc. |
| | |
| RCG | Marex Capitals Markets, Inc. |
| (b) | Rate disclosed is the seven day effective yield as of December 31, 2023. |
| (c) | Each contract is equivalent to one futures contract. |
| (d) | Percentage rounds to less than 0.1%. |
| (e) | Percentage rounds to greater than (0.1%). |
| (f) | As of December 31, 2023 a portion is held as collateral for options with a market value of $12,907,911. |
See accompanying notes which are an integral part of these financial statements.
| RATIONAL DYNAMIC BRANDS FUND |
| SCHEDULE OF INVESTMENTS |
| December 31, 2023 |
| Shares | | | | | Fair Value | |
| | | | | COMMON STOCKS — 99.9% | | | | |
| | | | | APPAREL & TEXTILE PRODUCTS - 8.1% | | | | |
| | 15,900 | | | LVMH Moet Hennessy Louis Vuitton S.E. - ADR | | $ | 2,582,955 | |
| | 22,939 | | | NIKE, Inc., Class B | | | 2,490,487 | |
| | | | | | | | 5,073,442 | |
| | | | | ASSET MANAGEMENT - 12.6% | | | | |
| | 29,700 | | | Apollo Global Management, Inc. | | | 2,767,743 | |
| | 17,000 | | | Blackstone, Inc. | | | 2,225,640 | |
| | 35,000 | | | KKR & Company, Inc. | | | 2,899,750 | |
| | | | | | | | 7,893,133 | |
| | | | | AUTOMOTIVE - 0.7% | | | | |
| | 50,000 | | | Dr Ing hc F Porsche A.G. - ADR | | | 437,000 | |
| | | | | | | | | |
| | | | | BIOTECH & PHARMA - 5.6% | | | | |
| | 3,900 | | | Eli Lilly and Company | | | 2,273,388 | |
| | 11,500 | | | Merck & Company, Inc. | | | 1,253,730 | |
| | | | | | | | 3,527,118 | |
| | | | | E-COMMERCE DISCRETIONARY - 18.9% | | | | |
| | 60,795 | | | Amazon.com, Inc.(a) | | | 9,237,192 | |
| | 1,690 | | | MercadoLibre, Inc.(a) | | | 2,655,903 | |
| | | | | | | | 11,893,095 | |
| | | | | HOUSEHOLD PRODUCTS - 4.2% | | | | |
| | 26,500 | | | L’Oreal S.A. - ADR | | | 2,634,365 | |
| | | | | | | | | |
| | | | | INTERNET MEDIA & SERVICES - 10.5% | | | | |
| | 12,650 | | | Alphabet, Inc., Class A(a) | | | 1,767,079 | |
| | 6,525 | | | Meta Platforms, Inc., Class A(a) | | | 2,309,589 | |
| | 40,700 | | | Uber Technologies, Inc.(a) | | | 2,505,899 | |
| | | | | | | | 6,582,567 | |
| | | | | LEISURE FACILITIES & SERVICES - 12.1% | | | | |
| | 1,000 | | | Domino’s Pizza, Inc. | | | 412,230 | |
| | 72,000 | | | DraftKings, Inc., Class A(a) | | | 2,538,000 | |
| | 42,350 | | | Live Nation Entertainment, Inc.(a) | | | 3,963,960 | |
| | 34,500 | | | Manchester United plc, Class A(a) | | | 703,110 | |
| | | | | | | | 7,617,300 | |
See accompanying notes which are an integral part of these financial statements.
| RATIONAL DYNAMIC BRANDS FUND |
| SCHEDULE OF INVESTMENTS (Continued) |
| December 31, 2023 |
| Shares | | | | | Fair Value | |
| | | | | COMMON STOCKS — 99.9% (Continued) | | | | |
| | | | | RETAIL - CONSUMER STAPLES - 4.6% | | | | |
| | 4,394 | | | Costco Wholesale Corporation | | $ | 2,900,392 | |
| | | | | | | | | |
| | | | | RETAIL - DISCRETIONARY - 7.0% | | | | |
| | 285 | | | AutoZone, Inc.(a) | | | 736,899 | |
| | 5,810 | | | Lululemon Athletica, Inc.(a) | | | 2,970,595 | |
| | 710 | | | O’Reilly Automotive, Inc.(a) | | | 674,557 | |
| | | | | | | | 4,382,051 | |
| | | | | SOFTWARE - 4.5% | | | | |
| | 7,647 | | | Microsoft Corporation | | | 2,875,578 | |
| | | | | | | | | |
| | | | | TECHNOLOGY HARDWARE - 3.4% | | | | |
| | 11,051 | | | Apple, Inc. | | | 2,127,649 | |
| | | | | | | | | |
| | | | | TECHNOLOGY SERVICES - 4.4% | | | | |
| | 10,538 | | | Visa, Inc., Class A | | | 2,743,568 | |
| | | | | | | | | |
| | | | | TELECOMMUNICATIONS - 3.3% | | | | |
| | 13,000 | | | T-Mobile US, Inc. | | | 2,084,290 | |
| | | | | | | | | |
| | | | | TOTAL COMMON STOCKS (Cost $46,162,586) | | | 62,771,548 | |
| | | | | | | | | |
| | | | | SHORT-TERM INVESTMENTS — 0.7% | | | | |
| | | | | MONEY MARKET FUNDS - 0.7% | | | | |
| | 425,543 | | | First American Treasury Obligations Fund, Class X, 5.28% (Cost $425,543)(b) | | | 425,543 | |
| | | | | | | | | |
| | | | | TOTAL INVESTMENTS - 100.6% (Cost $46,588,129) | | $ | 63,197,091 | |
| | | | | LIABILITIES IN EXCESS OF OTHER ASSETS - (0.6)% | | | (353,881 | ) |
| | | | | NET ASSETS - 100.0% | | $ | 62,843,210 | |
| ADR | - American Depositary Receipt |
| | |
| PLC | - Public Limited Company |
| (a) | Non-income producing security. |
| (b) | Rate disclosed is the seven day effective yield as of December 31, 2023. |
See accompanying notes which are an integral part of these financial statements.
| RATIONAL STRATEGIC ALLOCATION FUND |
| SCHEDULE OF INVESTMENTS |
| December 31, 2023 |
| Shares | | | | | Fair Value | |
| | | | | OPEN END FUNDS — 86.6% | | | | |
| | | | | ALTERNATIVE - 63.2% | | | | |
| | 512,398 | | | Catalyst Systematic Alpha Fund(a) | | $ | 6,314,234 | |
| | | | | | | | | |
| | | | | FIXED INCOME - 23.4% | | | | |
| | 157,819 | | | Catalyst/CIFC Floating Rate Income Fund, Class I(a) | | | 1,459,825 | |
| | 83,315 | | | Rational/Pier 88 Convertible Securities Fund, Institutional Class(a) | | | 877,302 | |
| | | | | | | | 2,337,127 | |
| | | | | | | | | |
| | | | | TOTAL OPEN END FUNDS (Cost $8,517,289) | | | 8,651,361 | |
| Principal | | | | | Discount Rate | | | | | |
| Amount ($) | | | | | (%) | | Maturity | | | |
| | | | | SHORT-TERM INVESTMENTS — 5.7% | | | | | | | | |
| | | | | U.S. TREASURY BILLS — 4.9% | | | | | | | | |
| | 500,000 | | | United States Treasury Bill(b) | | 5.0384 | | 05/16/24 | | | 490,412 | |
| Shares | | | | | | |
| | | | | MONEY MARKET FUNDS - 0.8% | | | | |
| | 81,467 | | | First American Treasury Obligations Fund, Class X, 5.28%(c) | | | 81,467 | |
| | | | | TOTAL SHORT-TERM INVESTMENTS (Cost $572,305) | | | 571,879 | |
| | | | | | | | | |
| | | | | TOTAL INVESTMENTS - 92.3% (Cost $9,089,594) | | $ | 9,223,240 | |
| | | | | OTHER ASSETS IN EXCESS OF LIABILITIES- 7.7% | | | 767,806 | |
| | | | | NET ASSETS - 100.0% | | $ | 9,991,046 | |
OPEN FUTURES CONTRACTS
Number of
Contracts | | | Open Long Futures Contracts | | Expiration | | Notional Amount(d) | | | Value and Unrealized
Appreciation | |
| | 42 | | | CME E-Mini Standard & Poor’s 500 Index Future | | 03/15/2024 | | $ | 10,122,000 | | | $ | 71,400 | |
| | | | | | | | | | | | | | | |
| | | | | TOTAL OPEN LONG FUTURES CONTRACTS | | | | | | | | | | |
| (c) | Rate disclosed is the seven day effective yield as of December 31, 2023. |
| (d) | The amounts shown are the underlying reference notional amounts to stock exchange indices and equities upon which the fair value of the futures contracts held by the Fund are based. Notional values do not represent the current fair value of, and are not necessarily indicative of the future cash flows of the Fund’s futures contracts. Further, the underlying price changes in relation to the variables specified by the notional values affects the fair value of these derivative financial instruments. The notional values as set forth within this schedule do not purport to represent economic value at risk to the Fund. |
See accompanying notes which are an integral part of these financial statements.
| RATIONAL/RESOLVE ADAPTIVE ASSET ALLOCATION FUND |
| CONSOLIDATED SCHEDULE OF INVESTMENTS |
| December 31, 2023 |
Principal
Amount ($) | | | | | Discount Rate
(%) | | Maturity | | Fair Value | |
| | | | | SHORT-TERM INVESTMENTS — 86.8% | | | | | | | | |
| | | | | U.S. TREASURY BILLS — 63.1% | | | | | | | | |
| | 27,300,000 | | | United States Treasury Bill(a) | | 2.6154 | | 01/04/24 | | $ | 27,292,066 | |
| | 21,300,000 | | | United States Treasury Bill(a) | | 4.9437 | | 02/01/24 | | | 21,206,400 | |
| | 11,400,000 | | | United States Treasury Bill(a) | | 5.0483 | | 03/14/24 | | | 11,281,702 | |
| | | | | TOTAL U.S. TREASURY BILLS (Cost $59,774,322) | | | | | | | 59,780,168 | |
| Shares | | | | | | |
| | | | | MONEY MARKET FUNDS - 23.7% | | | | |
| | 22,392,315 | | | First American US Treasury Money Market Fund, Class Z, 5.20% (Cost $22,392,315)(b)(d) | | | 22,392,315 | |
| | | | | | | | | |
| | | | | TOTAL SHORT-TERM INVESTMENTS (Cost $82,166,637) | | | 22,392,315 | |
| | | | | | | | | |
| | | | | TOTAL INVESTMENTS - 86.8% (Cost $82,166,637) | | $ | 82,172,483 | |
| | | | | OTHER ASSETS IN EXCESS OF LIABILITIES- 13.2% | | | 12,526,738 | |
| | | | | NET ASSETS - 100.0% | | $ | 94,699,221 | |
OPEN FUTURES CONTRACTS
Number of
Contracts | | | Open Long Futures Contracts | | Expiration | | Notional Amount(c) | | | Value and Unrealized
Appreciation (Depreciation) | |
| | 185 | | | CBOT 5 Year US Treasury Note | | 03/28/2024 | | $ | 20,123,086 | | | $ | 15,992 | |
| | 7 | | | CBOT Soybean Future(d) | | 03/14/2024 | | | 454,300 | | | | (7,163 | ) |
| | 1 | | | CBOT Soybean Future(d) | | 05/14/2024 | | | 65,363 | | | | (1,350 | ) |
| | 87 | | | CBOT Wheat Future(d) | | 03/14/2024 | | | 2,731,800 | | | | 47,037 | |
| | 21 | | | CBOT Wheat Future(d) | | 05/14/2024 | | | 671,475 | | | | 12,287 | |
| | 25 | | | CME British Pound Currency Future | | 03/18/2024 | | | 1,992,344 | | | | 8,306 | |
| | 213 | | | CME Canadian Dollar Currency Future | | 03/19/2024 | | | 16,108,125 | | | | (12,960 | ) |
| | 1 | | | CME E-mini Russell 2000 Index Futures | | 03/15/2024 | | | 102,385 | | | | (1,525 | ) |
| | 4 | | | CME E-Mini Standard & Poor’s 500 Index Future | | 03/15/2024 | | | 964,000 | | | | (1,700 | ) |
| | 138 | | | CME Euro Foreign Exchange Currency Future | | 03/18/2024 | | | 19,104,375 | | | | 15,538 | |
| | 248 | | | CME New Zealand Dollar Currency Future | | 03/18/2024 | | | 15,679,800 | | | | 357,025 | |
| | 48 | | | COMEX Gold 100 Troy Ounces Future(d) | | 02/27/2024 | | | 9,944,640 | | | | 92,470 | |
| | 25 | | | Eurex EURO STOXX 50 Future | | 03/15/2024 | | | 1,253,864 | | | | (5,687 | ) |
| | 9 | | | Euro-BTP Italian Bond Futures | | 03/07/2024 | | | 1,183,871 | | | | 29,505 | |
| | 53 | | | Euronext CAC 40 Index Future | | 01/19/2024 | | | 4,420,567 | | | | (32,114 | ) |
| | 11 | | | French Government Bond Futures | | 03/07/2024 | | | 1,597,052 | | | | 38,292 | |
| | 106 | | | FTSE/MIB Index Future | | 03/15/2024 | | | 17,858,390 | | | | (38,955 | ) |
See accompanying notes which are an integral part of these consolidated financial statements.
| RATIONAL/RESOLVE ADAPTIVE ASSET ALLOCATION FUND |
| CONSOLIDATED SCHEDULE OF INVESTMENTS (Continued) |
| December 31, 2023 |
OPEN FUTURES CONTRACTS (Continued)
Number of
Contracts | | | Open Long Futures Contracts | | Expiration | | Notional Amount(c) | | | Value and Unrealized
Appreciation (Depreciation) | |
| | 5 | | | HKG Hang Seng Index Future | | 01/30/2024 | | $ | 548,502 | | | $ | 10,700 | |
| | 52 | | | ICE Brent Crude Oil Future(d) | | 01/31/2024 | | | 4,006,080 | | | | (193,070 | ) |
| | 9 | | | ICE Gas Oil Future(d) | | 02/12/2024 | | | 668,025 | | | | (35,400 | ) |
| | 10 | | | KCBT Hard Red Winter Wheat Future(d) | | 03/14/2024 | | | 321,000 | | | | (1,825 | ) |
| | 2 | | | KCBT Hard Red Winter Wheat Future(d) | | 05/14/2024 | | | 64,400 | | | | (250 | ) |
| | 35 | | | Long Gilt Future | | 03/26/2024 | | | 4,580,077 | | | | 194,158 | |
| | 105 | | | MEFF Madrid IBEX 35 Index Future | | 01/19/2024 | | | 11,691,886 | | | | (18,507 | ) |
| | 26 | | | Montreal Exchange 10 Year Canadian Bond Future | | 03/19/2024 | | | 2,436,795 | | | | (1,960 | ) |
| | 75 | | | NYBOT CSC C Coffee Future(d) | | 03/18/2024 | | | 5,295,938 | | | | 54,413 | |
| | 19 | | | NYBOT CSC C Coffee Future(d) | | 05/20/2024 | | | 1,326,675 | | | | 23,025 | |
| | 55 | | | NYBOT CTN Number 2 Cotton Future(d) | | 03/06/2024 | | | 2,227,500 | | | | (18,145 | ) |
| | 13 | | | NYBOT CTN Number 2 Cotton Future(d) | | 05/08/2024 | | | 533,975 | | | | (2,565 | ) |
| | 9 | | | NYMEX Light Sweet Crude Oil Future(d) | | 01/22/2024 | | | 644,850 | | | | (33,470 | ) |
| | 9 | | | NYMEX Platinum Future(d) | | 04/26/2024 | | | 454,140 | | | | (1,815 | ) |
| | 64 | | | NYMEX Reformulated Gasoline Blendstock for Oxygen(d) | | 01/31/2024 | | | 5,661,734 | | | | (256,124 | ) |
| | 50 | | | SFE S&P ASX Share Price Index 200 Future | | 03/21/2024 | | | 6,462,139 | | | | 140,623 | |
| | 105 | | | SGX FTSE China A50 Futures Contract | | 01/30/2024 | | | 1,206,975 | | | | 32,108 | |
| | 5 | | | SGX Nikkei 225 Stock Index Future | | 03/07/2024 | | | 592,528 | | | | 9,560 | |
| | 96 | | | TSE TOPIX (Tokyo Price Index) Future | | 03/07/2024 | | | 16,110,650 | | | | 116,823 | |
| | | | | TOTAL OPEN LONG FUTURES CONTRACTS | | | | | | | | $ | 533,277 | |
OPEN FUTURES CONTRACTS
Number of
Contracts | | | Open Short Futures Contracts | | Expiration | | Notional Amount(c) | | | Value and Unrealized
Appreciation (Depreciation) | |
| | 39 | | | Carbon Emissions Future(d) | | 12/16/2024 | | $ | 3,460,400 | | | $ | (314,526 | ) |
| | 43 | | | CBOT Corn Future(d) | | 03/14/2024 | | | 1,013,188 | | | | 17,137 | |
| | 10 | | | CBOT Corn Future(d) | | 05/14/2024 | | | 242,000 | | | | 4,463 | |
| | 123 | | | CBOT Soybean Meal Future(d) | | 03/14/2024 | | | 4,747,801 | | | | 54,250 | |
| | 30 | | | CBOT Soybean Meal Future(d) | | 05/14/2024 | | | 1,154,400 | | | | 7,100 | |
| | 93 | | | CBOT Soybean Oil Future(d) | | 03/14/2024 | | | 2,688,444 | | | | 50,730 | |
| | 23 | | | CBOT Soybean Oil Future(d) | | 05/14/2024 | | | 670,266 | | | | 11,808 | |
| | 9 | | | CBOT US Treasure Bond Futures | | 03/19/2024 | | | 1,124,438 | | | | (25,844 | ) |
| | 42 | | | CME Australian Dollar Currency Future | | 03/18/2024 | | | 2,868,810 | | | | (39,385 | ) |
| | 9 | | | CME E-Mini NASDAQ 100 Index Future | | 03/15/2024 | | | 3,064,230 | | | | 7,105 | |
| | 191 | | | CME Japanese Yen Currency Future | | 03/18/2024 | | | 17,132,700 | | | | (337,889 | ) |
| | 8 | | | CME Nikkei 225 Index Future | | 03/07/2024 | | | 1,332,400 | | | | 6,525 | |
| | 24 | | | CME Swiss Franc Currency Future | | 03/18/2024 | | | 3,594,000 | | | | (19,231 | ) |
| | 2 | | | COMEX Copper Future(d) | | 05/29/2024 | | | 195,425 | | | | 713 | |
| | 11 | | | COMEX Copper Future(d) | | 03/26/2024 | | | 1,069,888 | | | | 7,012 | |
| | 8 | | | COMEX Silver Future(d) | | 03/26/2024 | | | 963,440 | | | | 19,810 | |
| | 34 | | | Eurex 10 Year Euro BUND Future | | 03/07/2024 | | | 5,150,673 | | | | 813 | |
| | 32 | | | Eurex 30 Year Euro BUXL Future | | 03/07/2024 | | | 5,006,668 | | | | (216,563 | ) |
| | 123 | | | Eurex 5 Year Euro BOBL Future | | 03/07/2024 | | | 16,197,218 | | | | (176,382 | ) |
| | 4 | | | Eurex DAX Index Future | | 03/15/2024 | | | 1,867,189 | | | | 5,781 | |
| | 353 | | | Euronext Milling Wheat Future(d) | | 03/11/2024 | | | 4,335,532 | | | | 38,601 | |
| | 9 | | | FTSE 100 Index Future | | 03/15/2024 | | | 889,926 | | | | (4,465 | ) |
See accompanying notes which are an integral part of these consolidated financial statements.
| RATIONAL/RESOLVE ADAPTIVE ASSET ALLOCATION FUND |
| CONSOLIDATED SCHEDULE OF INVESTMENTS (Continued) |
| December 31, 2023 |
OPEN FUTURES CONTRACTS (Continued)
Number of
Contracts | | | Open Short Futures Contracts | | Expiration | | Notional Amount(c) | | | Value and Unrealized
Appreciation (Depreciation) | |
| | 35 | | | Montreal Exchange S&P/TSX 60 Index Future | | 03/14/2024 | | $ | 6,711,699 | | | $ | (70,754 | ) |
| | 44 | | | NYBOT CSC Cocoa Future(d) | | 03/13/2024 | | | 1,846,240 | | | | 22,850 | |
| | 5 | | | NYBOT CSC Cocoa Future(d) | | 05/15/2024 | | | 208,100 | | | | 2,440 | |
| | 80 | | | NYBOT CSC Number 11 World Sugar Future(d) | | 02/29/2024 | | | 1,843,968 | | | | (12,712 | ) |
| | 81 | | | NYMEX Henry Hub Natural Gas Futures(d) | | 01/29/2024 | | | 2,036,340 | | | | (9,220 | ) |
| | 9 | | | NYMEX NY Harbor ULSD Futures(d) | | 01/31/2024 | | | 955,924 | | | | 12,302 | |
| | | | | TOTAL OPEN SHORT FUTURES CONTRACTS | | | | | | | | $ | (957,531 | ) |
| (b) | Rate disclosed is the seven day effective yield as of December 31, 2023. |
| (c) | The amounts shown are the underlying reference notional amounts to stock exchange indices and equities upon which the fair value of the futures contracts held by the Fund are based. Notional values do not represent the current fair value of, and are not necessarily indicative of the future cash flows of the Fund’s futures contracts. Further, the underlying price changes in relation to the variables specified by the notional values affects the fair value of these derivative financial instruments. The notional values as set forth within this schedule do not purport to represent economic value at risk to the Fund. |
| (d) | All or a portion of this investment is a holding of the RDMF Fund Ltd. |
See accompanying notes which are an integral part of these consolidated financial statements.
| RATIONAL/PIER 88 CONVERTIBLE SECURITIES FUND |
| SCHEDULE OF INVESTMENTS |
| December 31, 2023 |
| Shares | | | | | Fair Value | |
| | | | | COMMON STOCKS — 14.8% | | | | |
| | | | | AEROSPACE & DEFENSE - 1.6% | | | | |
| | 2,100 | | | TransDigm Group, Inc. | | $ | 2,124,360 | |
| | | | | | | | | |
| | | | | E-COMMERCE DISCRETIONARY - 2.3% | | | | |
| | 2,000 | | | MercadoLibre, Inc.(a) | | | 3,143,080 | |
| | | | | | | | | |
| | | | | ENGINEERING & CONSTRUCTION - 1.5% | | | | |
| | 36,300 | | | KBR, Inc. | | | 2,011,383 | |
| | | | | | | | | |
| | | | | INTERNET MEDIA & SERVICES - 3.1% | | | | |
| | 1,200 | | | Booking Holdings, Inc.(a) | | | 4,256,664 | |
| | | | | | | | | |
| | | | | OIL & GAS PRODUCERS - 2.5% | | | | |
| | 49,000 | | | EQT Corporation | | | 1,894,340 | |
| | 7,100 | | | Pioneer Natural Resources Company | | | 1,596,648 | |
| | | | | | | | 3,490,988 | |
| | | | | SOFTWARE - 2.7% | | | | |
| | 23,500 | | | Cloudflare, Inc., Class A(a) | | | 1,956,610 | |
| | 8,800 | | | Datadog, Inc., Class A(a) | | | 1,068,144 | |
| | 15,400 | | | Nutanix, Inc., Class A(a) | | | 734,426 | |
| | | | | | | | 3,759,180 | |
| | | | | STEEL - 1.1% | | | | |
| | 33,300 | | | ATI, Inc.(a) | | | 1,514,151 | |
| | | | | | | | | |
| | | | | TOTAL COMMON STOCKS (Cost $18,744,386) | | | 20,299,806 | |
| | | | | | Coupon Rate | | | | | |
| | | | | | (%) | | Maturity | | | |
| | | | | PREFERRED STOCKS — 18.4% | | | | | | | | |
| | | | | ASSET MANAGEMENT — 5.1% | | | | | | | | |
| | 17,000 | | | AMG Capital Trust II | | 5.1500 | | 10/15/37 | | | 853,713 | |
| | 109,800 | | | APOLLO GLOBAL MANAGEMENT, INC. | | 6.7500 | | 07/31/26 | | | 6,191,622 | |
| | | | | | | | | | | | 7,045,335 | |
See accompanying notes which are an integral part of these financial statements.
| RATIONAL/PIER 88 CONVERTIBLE SECURITIES FUND |
| SCHEDULE OF INVESTMENTS (Continued) |
| December 31, 2023 |
| | | | | | Coupon Rate | | | | | |
| Shares | | | | | (%) | | Maturity | | Fair Value | |
| | | | | PREFERRED STOCKS – 18.4% (Continued) | | | | | | | | |
| | | | | BANKING — 8.8% | | | | | | | | |
| | 4,948 | | | Bank of America Corporation | | 7.2500 | | Perpetual | | $ | 5,963,725 | |
| | 5,100 | | | Wells Fargo & Company - Series L | | 7.5000 | | Perpetual | | | 6,097,662 | |
| | | | | | | | | | | | 12,061,387 | |
| | | | | ELECTRIC UTILITIES — 4.5% | | | | | | | | |
| | 160,800 | | | NextEra Energy, Inc. | | 6.9260 | | 09/01/25 | | | 6,129,696 | |
| | | | | | | | | | | | | |
| | | | | TOTAL PREFERRED STOCKS (Cost $24,547,047) | | | | | | | 25,236,418 | |
| Principal | | | | | | | | | | |
| Amount ($) | | | | | | | | | | |
| | | | | CONVERTIBLE BONDS — 63.2% | | | | | | | | |
| | | | | AUTOMOTIVE — 2.0% | | | | | | | | |
| | 2,800,000 | | | Ford Motor Company(b) | | 0.0000 | | 03/15/26 | | | 2,786,000 | |
| | | | | | | | | | | | | |
| | | | | BIOTECH & PHARMA — 1.9% | | | | | | | | |
| | 2,493,000 | | | BioMarin Pharmaceutical, Inc. | | 1.2500 | | 05/15/27 | | | 2,560,062 | |
| | | | | | | | | | | | | |
| | | | | CONSUMER SERVICES — 1.2% | | | | | | | | |
| | 2,057,000 | | | Chegg, Inc.(b) | | 0.0000 | | 09/01/26 | | | 1,707,310 | |
| | | | | | | | | | | | | |
| | | | | E-COMMERCE DISCRETIONARY — 3.5% | | | | | | | | |
| | 6,090,000 | | | Etsy, Inc. | | 0.2500 | | 06/15/28 | | | 4,875,654 | |
| | | | | | | | | | | | | |
| | | | | ELECTRIC UTILITIES — 7.4% | | | | | | | | |
| | 4,250,000 | | | Alliant Energy Corporation(c) | | 3.8750 | | 03/15/26 | | | 4,218,125 | |
| | 6,120,000 | | | PPL Capital Funding, Inc.(c) | | 2.8750 | | 03/15/28 | | | 5,927,220 | |
| | | | | | | | | | | | 10,145,345 | |
| | | | | HEALTH CARE FACILITIES & SERVICES — 0.5% | | | | | | | | |
| | 635,000 | | | PetIQ, Inc. | | 4.0000 | | 06/01/26 | | | 640,588 | |
| | | | | | | | | | | | | |
| | | | | INTERNET MEDIA & SERVICES — 4.2% | | | | | | | | |
| | 6,125,000 | | | Expedia Group, Inc.(b) | | 0.0000 | | 02/15/26 | | | 5,791,188 | |
See accompanying notes which are an integral part of these financial statements.
| RATIONAL/PIER 88 CONVERTIBLE SECURITIES FUND |
| SCHEDULE OF INVESTMENTS (Continued) |
| December 31, 2023 |
| Principal | | | | | Coupon Rate | | | | | |
| Amount ($) | | | | | (%) | | Maturity | | Fair Value | |
| | | | | CONVERTIBLE BONDS — 63.2% (Continued) | | | | | | | | |
| | | | | LEISURE FACILITIES & SERVICES — 1.8% | | | | | | | | |
| | 3,020,000 | | | DraftKings, Inc.(b) | | 0.0000 | | 03/15/28 | | $ | 2,420,530 | |
| | | | | | | | | | | | | |
| | | | | MEDICAL EQUIPMENT & DEVICES — 4.2% | | | | | | | | |
| | 5,530,000 | | | Dexcom, Inc. | | 0.2500 | | 11/15/25 | | | 5,773,320 | |
| | | | | | | | | | | | | |
| | | | | REAL ESTATE INVESTMENT TRUSTS — 8.0% | | | | | | | | |
| | 3,070,000 | | | Kite Realty Group, L.P.(c) | | 0.7500 | | 04/01/27 | | | 3,054,650 | |
| | 1,350,000 | | | Ventas Realty, L.P.(c) | | 3.7500 | | 06/01/26 | | | 1,424,250 | |
| | 5,860,000 | | | Welltower OP, LLC(c) | | 2.7500 | | 05/15/28 | | | 6,478,816 | |
| | | | | | | | | | | | 10,957,716 | |
| | | | | SOFTWARE — 23.7% | | | | | | | | |
| | 4,260,000 | | | Alteryx, Inc. | | 1.0000 | | 08/01/26 | | | 4,137,525 | |
| | 2,185,000 | | | CyberArk Software Ltd.(b) | | 0.0000 | | 11/15/24 | | | 3,093,960 | |
| | 4,649,000 | | | Okta, Inc. | | 0.3750 | | 06/15/26 | | | 4,109,716 | |
| | 2,211,000 | | | PROS Holdings, Inc. | | 2.2500 | | 09/15/27 | | | 2,480,742 | |
| | 5,332,000 | | | Shopify, Inc. | | 0.1250 | | 11/01/25 | | | 5,028,076 | |
| | 5,820,000 | | | Splunk, Inc. | | 1.1250 | | 06/15/27 | | | 5,636,670 | |
| | 5,620,000 | | | Tyler Technologies, Inc. | | 0.2500 | | 03/15/26 | | | 5,667,770 | |
| | 2,540,000 | | | Wix.com Ltd.(b) | | 0.0000 | | 08/15/25 | | | 2,297,430 | |
| | | | | | | | | | | | 32,451,889 | |
| | | | | TECHNOLOGY HARDWARE — 0.0%(d) | | | | | | | | |
| | 80 | | | Western Digital Corporation B | | 1.5000 | | 02/01/24 | | | 80 | |
| | | | | | | | | | | | | |
| | | | | TECHNOLOGY SERVICES — 3.7% | | | | | | | | |
| | 5,380,928 | | | Euronet Worldwide, Inc. | | 0.7500 | | 03/15/49 | | | 5,031,167 | |
| | | | | | | | | | | | | |
| | | | | TRANSPORTATION & LOGISTICS — 1.1% | | | | | | | | |
| | 1,560,000 | | | Southwest Airlines Company | | 1.2500 | | 05/01/25 | | | 1,576,380 | |
| | | | | | | | | | | | | |
| | | | | TOTAL CONVERTIBLE BONDS (Cost $84,804,739) | | | | | | | 86,717,229 | |
See accompanying notes which are an integral part of these financial statements.
| RATIONAL/PIER 88 CONVERTIBLE SECURITIES FUND |
| SCHEDULE OF INVESTMENTS (Continued) |
| December 31, 2023 |
| Shares | | | | | Fair Value | |
| | | | | SHORT-TERM INVESTMENTS — 3.4% | | | | |
| | | | | MONEY MARKET FUNDS - 3.4% | | | | |
| | 4,689,343 | | | First American Treasury Obligations Fund, Class X, 5.28% (Cost $4,689,343)(e) | | $ | 4,689,343 | |
| | | | | | | | | |
| | | | | TOTAL INVESTMENTS - 99.8% (Cost $132,785,515) | | $ | 136,942,796 | |
| | | | | OTHER ASSETS IN EXCESS OF LIABILITIES- 0.2% | | | 232,363 | |
| | | | | NET ASSETS - 100.0% | | $ | 137,175,159 | |
| LLC | - Limited Liability Company |
| | |
| LP | - Limited Partnership |
| | |
| LTD | - Limited Company |
| (a) | Non-income producing security. |
| (c) | Security exempt from registration under Rule 144A or Section 4(2) of the Securities Act of 1933. The security may be resold in transactions exempt from registration, normally to qualified institutional buyers. As of December 31, 2023, the total market value of 144A securities is $21,103,061 or 15.4% of net assets. |
| (d) | Percentage rounds to less than 0.1%. |
| (e) | Rate disclosed is the seven day effective yield as of December 31, 2023. |
See accompanying notes which are an integral part of these financial statements.
| RATIONAL SPECIAL SITUATIONS INCOME FUND |
| SCHEDULE OF INVESTMENTS |
| December 31, 2023 |
| | | | | | Coupon Rate | | | | | |
| Shares | | | | | (%) | | Maturity | | Fair Value | |
| | | | | PREFERRED STOCKS — 0.5% | | | | | | | | |
| | | | | ASSET MANAGEMENT — 0.3% | | | | | | | | |
| | 16 | | | Eaton Vance Senior Floating-Rate Trust Cl A (j) | | 8.5820 | | Perpetual | | $ | 368,000 | |
| | 103 | | | Eaton Vance Senior Floating-Rate Trust CL C | | 8.5500 | | Perpetual | | | 2,369,001 | |
| | | | | | | | | | | | 2,737,001 | |
| | | | | BANKING — 0.2% | | | | | | | | |
| | 2,297 | | | CIB Marine Class A(a) | | 0.0000 | | 06/01/35 | | | 1,171,329 | |
| | 253 | | | CIB Marine Class B(a) | | 0.0000 | | 06/01/35 | | | 128,881 | |
| | | | | | | | | | | | 1,300,210 | |
| | | | | SPECIALTY FINANCE — 0.0%(b) | | | | | | | | |
| | 500,000 | | | SOLOSO CDO Ltd. 144A(a),(c) | | 0.0000 | | 10/07/37 | | | 0 | |
| | 158,000 | | | Tropic CDO V Ltd.(a) | | 0.0000 | | 07/15/36 | | | 0 | |
| | | | | | | | | | | | 0 | |
| | | | | TOTAL PREFERRED STOCKS (Cost $4,123,224) | | | | | | | 4,037,211 | |
| Principal | | | | | | | | | | | | |
| Amount ($) | | | | | Spread | | | | | | | |
| | | | | ASSET BACKED SECURITIES — 79.8% | | | | | | | | | | |
| | | | | AGENCY CMBS — 0.3% | | | | | | | | | | |
| | 29,817,998 | | | Ginnie Mae Strip Series 3 23(d) | | | | 1.4000 | | 09/16/45 | | | 2,229,104 | |
| | 1,337,132 | | | Government National Mortgage Association Series 2013-43 IO(d),(e) | | | | 0.0240 | | 08/16/48 | | | 353 | |
| | | | | | | | | | | | | | 2,229,457 | |
| | | | | AUTO LOAN — 0.6% | | | | | | | | | | |
| | 5,000,000 | | | CAL Receivables, LLC Series 2022-1 B(c),(f) | | SOFR30A + 4.350% | | 9.6880 | | 10/15/26 | | | 4,979,137 | |
| | | | | | | | | | | | | | | |
| | | | | CDO — 0.4% | | | | | | | | | | |
| | 4,201 | | | Ansonia CDO Ltd. Series 2006-1A AFL(c),(f) | | TSFR1M + 0.414% | | 0.4090 | | 07/28/46 | | | 4,196 | |
| | 2,138 | | | Ansonia CDO Ltd. Series 2006-1A AFX(c) | | | | 5.7020 | | 07/28/46 | | | 2,126 | |
| | 234,329 | | | Aspen Funding I Ltd. Series 2002-1A B1(c),(j) | | | | 9.0600 | | 07/10/37 | | | 233,896 | |
| | 10,000,000 | | | Bleecker Structured Asset Funding Ltd.(j) | | | | 6.4300 | | 04/01/35 | | | 300,420 | |
| | 3,064,844 | | | Nomura CRE CDO Ltd. Series 2007-2A D(c),(f) | | TSFR3M + 0.712% | | 6.0900 | | 05/21/42 | | | 337,133 | |
| | 2,000,000 | | | Taberna Preferred Funding II Ltd. Series 2005-2A A2(c),(f),(j) | | TSFR3M + 0.912% | | 6.3040 | | 11/05/35 | | | 1,310,452 | |
| | 374,034 | | | Wachovia Repackaged Asset Participating Securities Series 2003-1A A(c),(f) | | PRIME + 0.550% | | 6.1800 | | 02/08/35 | | | 299,227 | |
| | 571,918 | | | Wachovia Repackaged Asset Participating Securities Series 2003-1A B(c),(f) | | PRIME + 0.550% | | 6.1800 | | 02/08/35 | | | 394,623 | |
| | | | | | | | | | | | | | 2,882,073 | |
See accompanying notes which are an integral part of these financial statements.
| RATIONAL SPECIAL SITUATIONS INCOME FUND |
| SCHEDULE OF INVESTMENTS (Continued) |
| December 31, 2023 |
| Principal | | | | | | | Coupon Rate | | | | | |
| Amount ($) | | | | | Spread | | (%) | | Maturity | | Fair Value | |
| | | | | ASSET BACKED SECURITIES — 79.8% (Continued) | | | | | | | | | | |
| | | | | COLLATERALIZED MORTGAGE OBLIGATIONS — 25.6% | | | | | | | | | | |
| | 114,409 | | | ABN Amro Mortgage Corporation Series 2002-9 M | | | | 5.7500 | | 12/25/32 | | $ | 110,097 | |
| | 46,870 | | | ABN Amro Mortgage Corporation Series 2003-3 A4 | | | | 5.7500 | | 02/25/33 | | | 44,821 | |
| | 37,232 | | | Adjustable Rate Mortgage Trust Series 2004-5 2A1(e) | | | | 4.8760 | | 04/25/35 | | | 36,049 | |
| | 124,791 | | | Adjustable Rate Mortgage Trust Series 2005-2 3A1(e) | | | | 5.4740 | | 06/25/35 | | | 119,076 | |
| | 73,700 | | | Adjustable Rate Mortgage Trust Series 2005-4 1A1(e) | | | | 3.0470 | | 08/25/35 | | | 58,912 | |
| | 666,602 | | | Adjustable Rate Mortgage Trust Series 2005-5 2A1(e) | | | | 4.8220 | | 09/25/35 | | | 574,330 | |
| | 213,392 | | | Adjustable Rate Mortgage Trust Series 2005-6A 1A21(f) | | TSFR1M + 0.634% | | 5.9900 | | 11/25/35 | | | 176,892 | |
| | 244,832 | | | Adjustable Rate Mortgage Trust Series 2005-6A 1A1(f) | | TSFR1M + 0.654% | | 6.0100 | | 11/25/35 | | | 201,753 | |
| | 148,124 | | | Adjustable Rate Mortgage Trust Series 2005-10 3A31(e) | | | | 3.8760 | | 01/25/36 | | | 136,201 | |
| | 380,189 | | | Adjustable Rate Mortgage Trust Series 2005-10 3A11(e) | | | | 3.8760 | | 01/25/36 | | | 350,431 | |
| | 90,164 | | | Adjustable Rate Mortgage Trust Series 2005-10 1A1(e) | | | | 5.5580 | | 01/25/36 | | | 82,798 | |
| | 116,932 | | | Adjustable Rate Mortgage Trust Series 2005-10 6A1(f) | | TSFR1M + 0.654% | | 6.0100 | | 01/25/36 | | | 105,854 | |
| | 10,606 | | | Alternative Loan Trust Series 2003-4CB 1A1 | | | | 5.7500 | | 04/25/33 | | | 10,385 | |
| | 62,033 | | | Alternative Loan Trust Series 2003-J3 1A2 | | | | 5.2500 | | 11/25/33 | | | 54,665 | |
| | 65,960 | | | Alternative Loan Trust Series 2005-17 1A2(f) | | TSFR1M + 0.674% | | 6.0300 | | 07/25/35 | | | 42,763 | |
| | 414,401 | | | Alternative Loan Trust Series 2005-43 5A1(e) | | | | 5.0570 | | 09/25/35 | | | 344,632 | |
| | 58,546 | | | Alternative Loan Trust Series 2005-51 2A1(f) | | TSFR1M + 0.714% | | 6.0720 | | 11/20/35 | | | 52,997 | |
| | 29,390 | | | Alternative Loan Trust Series 2005-63 5A1(e) | | | | 4.1210 | | 12/25/35 | | | 26,563 | |
| | 1,537,163 | | | Alternative Loan Trust Series 2006-J6 A2(d),(f),(j) | | -(TSFR1M + 0.114%) + 5.500% | | 0.0300 | | 09/25/36 | | | 145,159 | |
| | 1,259,969 | | | Alternative Loan Trust Series 2006-J6 A1(f) | | TSFR1M + 0.614% | | 5.9600 | | 09/25/36 | | | 529,271 | |
| | 666,427 | | | Alternative Loan Trust Series 2006-32CB A2(d),(f),(j) | | -(TSFR1M + 0.114%) + 5.216% | | 0.0000 | | 11/25/36 | | | 56,650 | |
| | 401,462 | | | Alternative Loan Trust Series 2006-32CB A1(f) | | TSFR1M + 0.784% | | 6.0000 | | 11/25/36 | | | 202,104 | |
| | 300,000 | | | Alternative Loan Trust Series 2007-5CB 1A24(g) | | | | 0.0000 | | 04/25/37 | | | 18,577 | |
| | 369,770 | | | Alternative Loan Trust Series 2007-5CB 1A18(d),(f) | | -(TSFR1M + 0.114%) + 5.650% | | 0.1800 | | 04/25/37 | | | 43,244 | |
| | 373,491 | | | Alternative Loan Trust Series 2004-2CB 4A1 | | | | 5.0000 | | 08/25/54 | | | 364,767 | |
| | 355,410 | | | American Home Mortgage Assets Trust Series 2006-1 2A1(f) | | TSFR1M + 0.304% | | 5.6600 | | 05/25/46 | | | 291,905 | |
| | 10,477 | | | American Home Mortgage Investment Trust Series 2004-3 4A(f) | | TSFR6M + 1.928% | | 4.5290 | | 10/25/34 | | | 10,383 | |
| | 4,361,543 | | | American Home Mortgage Investment Trust Series 2005-2 5A4D(h) | | | | 5.8280 | | 09/25/35 | | | 3,330,870 | |
| | 428,833 | | | American Home Mortgage Investment Trust Series 2006-2 3A1(f) | | TSFR1M + 0.334% | | 5.6800 | | 06/25/36 | | | 58,775 | |
| | 5,823 | | | American Home Mortgage Investment Trust Series 2004-1 1M1(f) | | TSFR1M + 1.014% | | 6.3700 | | 04/25/44 | | | 5,773 | |
| | 18,230 | | | American Home Mortgage Investment Trust Series 2004-4 6A1(h) | | | | 6.0000 | | 02/25/45 | | | 17,735 | |
See accompanying notes which are an integral part of these financial statements.
| RATIONAL SPECIAL SITUATIONS INCOME FUND |
| SCHEDULE OF INVESTMENTS (Continued) |
| December 31, 2023 |
| Principal | | | | | | | Coupon Rate | | | | | |
| Amount ($) | | | | | Spread | | (%) | | Maturity | | Fair Value | |
| | | | | ASSET BACKED SECURITIES — 79.8% (Continued) | | | | | | | | | | |
| | | | | COLLATERALIZED MORTGAGE OBLIGATIONS — 25.6% (Continued) | | | | | | | | | | |
| | 15,699 | | | American Home Mortgage Investment Trust Series 2005-1 6A(f) | | TSFR6M + 2.428% | | 7.8670 | | 06/25/45 | | $ | 15,553 | |
| | 840,233 | | | American Home Mortgage Investment Trust Series 2005-4 5A(f) | | TSFR6M + 2.178% | | 7.5600 | | 11/25/45 | | | 339,059 | |
| | 364,408 | | | American Home Mortgage Investment Trust Series 2006-3 12A1(f) | | TSFR1M + 0.494% | | 5.8500 | | 12/25/46 | | | 342,952 | |
| | 593,031 | | | Banc of America Alternative Loan Trust Series 2006-4 1A2(d),(f),(j) | | -(TSFR1M + .114) + 5.150% | | 0.0000 | | 05/25/46 | | | 29,733 | |
| | 300,787 | | | Banc of America Alternative Loan Trust Series 2006-4 1A5 | | | | 6.0000 | | 05/25/46 | | | 252,075 | |
| | 259,899 | | | Banc of America Alternative Loan Trust Series 2006-4 1A4 | | | | 6.0000 | | 05/25/46 | | | 217,805 | |
| | 587,649 | | | Banc of America Alternative Loan Trust Series 2006-4 1A1(f) | | TSFR1M + 0.964% | | 6.0000 | | 05/25/46 | | | 473,204 | |
| | 322,053 | | | Banc of America Alternative Loan Trust Series 2006-4 1A3 | | | | 6.0000 | | 05/25/46 | | | 269,897 | |
| | 2,128,603 | | | Banc of America Funding 2015-R8 Trust Series R8 3A2(c),(e) | | | | 4.3930 | | 08/26/35 | | | 1,527,916 | |
| | 1,265,660 | | | Banc of America Funding Corporation Series 2008-1 A2(e) | | | | 4.3760 | | 09/25/48 | | | 1,226,842 | |
| | 661,368 | | | Banc of America Funding Trust Series 2016-R2 1A1(c),(e) | | | | 4.7000 | | 05/01/33 | | | 650,855 | |
| | 94,782 | | | Banc of America Funding Trust Series 2003-1 B2 | | | | 6.0000 | | 05/20/33 | | | 47,653 | |
| | 49,383 | | | Banc of America Funding Trust Series 2007-4 5A1 | | | | 5.5000 | | 11/25/34 | | | 41,686 | |
| | 409,941 | | | Banc of America Funding Trust Series 2004-B 6A1(e) | | | | 2.8720 | | 12/20/34 | | | 326,747 | |
| | 149,541 | | | Banc of America Funding Trust Series 2005-B 1A1(e) | | | | 4.6970 | | 04/20/35 | | | 132,659 | |
| | 1,586,798 | | | Banc of America Funding Trust Series 2005-E 2A1(e) | | | | 3.8080 | | 05/20/35 | | | 1,374,867 | |
| | 119,681 | | | Banc of America Funding Trust Series 2005-E 8A1(f) | | 12MTA + 1.430% | | 6.4420 | | 06/20/35 | | | 86,031 | |
| | 53,867 | | | Banc of America Funding Trust Series 2005-8 30PO(g) | | | | 0.0000 | | 01/25/36 | | | 35,220 | |
| | 1,297,495 | | | Banc of America Funding Trust Series 2006-A 5A1(e) | | | | 3.8060 | | 02/20/36 | | | 1,123,876 | |
| | 993,780 | | | Banc of America Funding Trust Series 2006-A 4A1(e) | | | | 4.5890 | | 02/20/36 | | | 803,187 | |
| | 391,074 | | | Banc of America Funding Trust Series 2006-B 7A1(e) | | | | 3.5020 | | 03/20/36 | | | 325,676 | |
| | 168,101 | | | Banc of America Funding Trust Series 2006-B 1A1(e) | | | | 4.3710 | | 03/20/36 | | | 155,052 | |
| | 135,190 | | | Banc of America Funding Trust Series 2006-C 4A1(e) | | | | 4.3150 | | 04/20/36 | | | 113,205 | |
| | 548,963 | | | Banc of America Funding Trust Series 2006-D 2A1(e) | | | | 3.4990 | | 05/20/36 | | | 476,884 | |
| | 303,010 | | | Banc of America Funding Trust Series 2006-F 1A2(e) | | | | 4.8090 | | 07/20/36 | | | 261,876 | |
| | 15,091 | | | Banc of America Funding Trust Series 2006-G 3A3(f) | | TSFR12M + 2.465% | | 7.6780 | | 07/20/36 | | | 14,805 | |
| | 71,282 | | | Banc of America Funding Trust Series 2007-7 30PO(g) | | | | 0.0000 | | 09/25/37 | | | 32,863 | |
| | 95,854 | | | Banc of America Funding Trust Series 2006-I 5A1(e) | | | | 3.1110 | | 10/20/46 | | | 78,953 | |
| | 45,987 | | | Banc of America Funding Trust Series 2007-C 6A2(f) | | TSFR1M + 0.654% | | 6.0120 | | 05/20/47 | | | 44,920 | |
| | 338,496 | | | Banc of America Funding Trust Series 2007-8 3A1 | | | | 6.0000 | | 08/25/53 | | | 176,483 | |
| | 4,859,455 | | | Banc of America Mortgage Trust Series 2004-G 3A1(e) | | | | 5.2080 | | 08/25/34 | | | 3,156,785 | |
| | 36,883 | | | Banc of America Mortgage Trust Series 2005-A 2A2(e) | | | | 3.8160 | | 02/25/35 | | | 35,299 | |
| | 394,855 | | | Banc of America Mortgage Trust Series 2005-G 4A3(e) | | | | 4.3140 | | 08/25/35 | | | 349,430 | |
| | 949,261 | | | Banc of America Mortgage Trust Series 2005-I 4A1(e) | | | | 6.2150 | | 10/25/35 | | | 922,195 | |
See accompanying notes which are an integral part of these financial statements.
| RATIONAL SPECIAL SITUATIONS INCOME FUND |
| SCHEDULE OF INVESTMENTS (Continued) |
| December 31, 2023 |
| Principal | | | | | | | Coupon Rate | | | | | |
| Amount ($) | | | | | Spread | | (%) | | Maturity | | Fair Value | |
| | | | | ASSET BACKED SECURITIES — 79.8% (Continued) | | | | | | | | | | |
| | | | | COLLATERALIZED MORTGAGE OBLIGATIONS — 25.6% (Continued) | | | | | | | | | | |
| | 89,286 | | | Banc of America Mortgage Trust Series 2006-A 1A1(e) | | | | 3.8790 | | 02/25/36 | | $ | 74,106 | |
| | 73,262 | | | Banc of America Mortgage Trust Series 2006-B 2A1(e) | | | | 4.9860 | | 11/20/46 | | | 64,715 | |
| | 150,926 | | | Bayview Commercial Asset Trust Series 2005-3A M5(c),(f) | | TSFR1M + 1.074% | | 6.4300 | | 11/25/35 | | | 143,157 | |
| | 4,203,428 | | | BCAP, LLC Trust Series 2013-RR7 4A4(c),(e) | | | | 4.8840 | | 12/27/34 | | | 3,840,341 | |
| | 2,016,849 | | | BCAP, LLC Trust Series 2009-RR10 1A2(c),(e) | | | | 5.9960 | | 02/26/36 | | | 1,918,846 | |
| | 1,823,326 | | | BCAP, LLC Trust Series 2010-RR11 3A3(c),(e) | | | | 3.9110 | | 06/27/36 | | | 1,692,512 | |
| | 2,441,948 | | | BCAP, LLC Trust Series 2011-RR4 7A1(c) | | | | 5.2500 | | 04/26/37 | | | 1,373,644 | |
| | 7,679 | | | Bear Stearns ALT-A Trust Series 2004-9 6A1(e) | | | | 5.7680 | | 09/25/34 | | | 7,321 | |
| | 149,101 | | | Bear Stearns ALT-A Trust Series 2004-12 2A4(e) | | | | 4.2940 | | 01/25/35 | | | 134,402 | |
| | 46,362 | | | Bear Stearns ALT-A Trust Series 2005-4 25A1(e) | | | | 4.3060 | | 05/25/35 | | | 43,099 | |
| | 67,474 | | | Bear Stearns ALT-A Trust Series 2005-10 23A1(e) | | | | 4.5800 | | 01/25/36 | | | 60,470 | |
| | 2,029,965 | | | Bear Stearns ALT-A Trust Series 2006-1 11A1(f) | | TSFR1M + 0.594% | | 5.9500 | | 02/25/36 | | | 1,786,655 | |
| | 1,631,226 | | | Bear Stearns ALT-A Trust Series 2006-2 11A1(f) | | TSFR1M + 0.554% | | 5.9100 | | 04/25/36 | | | 1,431,702 | |
| | 366,798 | | | Bear Stearns ALT-A Trust Series 2006-3 35A1(e) | | | | 2.5510 | | 05/25/36 | | | 177,408 | |
| | 59,390 | | | Bear Stearns ALT-A Trust Series 2006-3 33A1(e) | | | | 4.2680 | | 05/25/36 | | | 38,477 | |
| | 172,595 | | | Bear Stearns ALT-A Trust Series 2006-3 1A1(f) | | TSFR1M + 0.494% | | 5.8500 | | 05/25/36 | | | 138,280 | |
| | 38,625 | | | Bear Stearns ALT-A Trust II Series 2007-1 1A1(e) | | | | 2.4380 | | 09/25/47 | | | 18,263 | |
| | 40,924 | | | Bear Stearns ARM Trust Series 2003-8 1A1(e) | | | | 4.3190 | | 01/25/34 | | | 37,975 | |
| | 9,742 | | | Bear Stearns ARM Trust Series 2004-1 21A1(e) | | | | 5.1500 | | 04/25/34 | | | 9,411 | |
| | 364,548 | | | Bear Stearns ARM Trust Series 2004-9 23A1(e) | | | | 5.8210 | | 11/25/34 | | | 338,384 | |
| | 58,442 | | | Bear Stearns ARM Trust Series 2004-10 21A1(e) | | | | 5.0320 | | 01/25/35 | | | 52,803 | |
| | 147,524 | | | Bear Stearns ARM Trust Series 2005-3 2A1(e) | | | | 4.8760 | | 06/25/35 | | | 137,136 | |
| | 940,832 | | | Bear Stearns ARM Trust Series 2005-6 3A1(e) | | | | 5.6610 | | 08/25/35 | | | 853,427 | |
| | 341,213 | | | Bear Stearns ARM Trust Series 2006-4 1A1(e) | | | | 5.7950 | | 10/25/36 | | | 319,757 | |
| | 49,778 | | | Bear Stearns ARM Trust Series 2007-5 3A1(e) | | | | 4.3220 | | 08/25/47 | | | 41,991 | |
| | 3,294,102 | | | Bear Stearns ARM Trust Series 2007-5 2A1(e) | | | | 4.8580 | | 08/25/47 | | | 2,965,688 | |
| | 139,144 | | | Bear Stearns Asset Backed Securities I Trust Series 2005-AC5 1A1(f) | | TSFR1M + 1.114% | | 5.5000 | | 08/25/35 | | | 85,897 | |
| | 8,261 | | | Bear Stearns Asset Backed Securities Trust Series 2003-AC5 A5(h) | | | | 5.2500 | | 10/25/33 | | | 8,109 | |
| | 21,736 | | | Bear Stearns Asset Backed Securities Trust Series 2003-AC5 A1(h) | | | | 5.7500 | | 10/25/33 | | | 22,695 | |
| | 699,614 | | | Bear Stearns Mortgage Funding Trust Series 2006-SL5 1A(f) | | TSFR1M + 0.414% | | 5.7700 | | 12/25/36 | | | 858,532 | |
| | 13,463 | | | Bear Stearns Mortgage Securities, Inc. Series 1997-6 1A(e) | | | | 7.2390 | | 03/25/31 | | | 13,355 | |
| | 1,694 | | | Bear Stearns Mortgage Securities, Inc. Series 1997-6 B2(e) | | | | 7.2390 | | 03/25/31 | | | 1,230 | |
| | 36,950,486 | | | CBASS Trust Series 2011-1A KAB1(c),(f) | | TSFR1M + 0.574% | | 1.9200 | | 02/25/37 | | | 651,153 | |
| | 160,673 | | | Chase Mortgage Finance Trust Series 2005-S1 2A1 | | | | 5.0000 | | 05/25/35 | | | 156,398 | |
See accompanying notes which are an integral part of these financial statements.
| RATIONAL SPECIAL SITUATIONS INCOME FUND |
| SCHEDULE OF INVESTMENTS (Continued) |
| December 31, 2023 |
| Principal | | | | | | | Coupon Rate | | | | | |
| Amount ($) | | | | | Spread | | (%) | | Maturity | | Fair Value | |
| | | | | ASSET BACKED SECURITIES — 79.8% (Continued) | | | | | | | | | | |
| | | | | COLLATERALIZED MORTGAGE OBLIGATIONS — 25.6% (Continued) | | | | | | | | | | |
| | 934,247 | | | ChaseFlex Trust Series 2005-2 3A4 | | | | 7.5000 | | 06/25/35 | | $ | 594,470 | |
| | 37,611 | | | CHL Mortgage Pass-Through Trust Series 2003-56 3A7A(e) | | | | 5.6760 | | 12/25/33 | | | 34,503 | |
| | 199,921 | | | CHL Mortgage Pass-Through Trust Series 2004-2 2A1(e) | | | | 3.7360 | | 02/25/34 | | | 165,069 | |
| | 1,328,753 | | | CHL Mortgage Pass-Through Trust Series 2004-7 6A1(e) | | | | 1.0270 | | 05/25/34 | | | 265,021 | |
| | 222,198 | | | CHL Mortgage Pass-Through Trust Series 2004-5 2A7 | | | | 5.0000 | | 05/25/34 | | | 219,359 | |
| | 86,397 | | | CHL Mortgage Pass-Through Trust Series 2004-7 2A1(e) | | | | 11.1400 | | 06/25/34 | | | 80,966 | |
| | 40,542 | | | CHL Mortgage Pass-Through Trust Series 2004-8 1A6(g) | | | | 0.0000 | | 07/25/34 | | | 27,037 | |
| | 325,071 | | | CHL Mortgage Pass-Through Trust Series 2004-14 4A1(e) | | | | 5.3650 | | 08/25/34 | | | 290,730 | |
| | 1,587 | | | CHL Mortgage Pass-Through Trust Series 2005-7 2A2(f) | | TSFR1M + 0.834% | | 5.3000 | | 03/25/35 | | | 500 | |
| | 1,844 | | | CHL Mortgage Pass-Through Trust Series 2005-11 4A2(f) | | TSFR1M + 0.434% | | 5.7900 | | 04/25/35 | | | 1,020 | |
| | 241,196 | | | CHL Mortgage Pass-Through Trust Series 2005-J2 3A12 | | | | 5.0000 | | 08/25/35 | | | 145,526 | |
| | 151,899 | | | CHL Mortgage Pass-Through Trust Series 2005-15 A4 | | | | 5.1000 | | 08/25/35 | | | 129,954 | |
| | 114,373 | | | CHL Mortgage Pass-Through Trust Series 2005-HYB6 5A1(e) | | | | 3.7010 | | 10/20/35 | | | 107,798 | |
| | 90,418 | | | Citicorp Mortgage Securities Trust Series 2006-1 1A4 | | | | 6.0000 | | 02/25/36 | | | 78,738 | |
| | 218,307 | | | Citicorp Mortgage Securities, Inc. Series 2005-2 1A3 | | | | 5.5000 | | 03/25/35 | | | 196,711 | |
| | 106,010 | | | Citigroup Mortgage Loan Trust Series 2004-HYB2 3A(e) | | | | 4.6410 | | 03/25/34 | | | 90,222 | |
| | 28,236 | | | Citigroup Mortgage Loan Trust Series 2013-8 1A2(c),(e) | | | | 5.1700 | | 05/25/35 | | | 24,684 | |
| | 263,105 | | | Citigroup Mortgage Loan Trust Series 2009-4 7A5(c),(e) | | | | 5.4830 | | 05/25/35 | | | 243,565 | |
| | 29,047 | | | Citigroup Mortgage Loan Trust Series 2005-11 A3(f) | | H15T1Y + 2.400% | | 7.8600 | | 11/25/35 | | | 28,510 | |
| | 370,183 | | | Citigroup Mortgage Loan Trust Series 2006-AR2 1A2(e) | | | | 4.4130 | | 03/25/36 | | | 347,510 | |
| | 85,922 | | | Citigroup Mortgage Loan Trust Series 2006-AR5 2A4A(e) | | | | 4.4590 | | 07/25/36 | | | 95,187 | |
| | 302,000 | | | Citigroup Mortgage Loan Trust Series 2013-8 2A2(c),(e) | | | | 5.9570 | | 11/25/36 | | | 212,466 | |
| | 1,514,553 | | | Citigroup Mortgage Loan Trust Series 2008-RR1 A1A1(c),(f) | | TSFR1M + 0.184% | | 5.5400 | | 01/25/37 | | | 1,297,066 | |
| | 687,328 | | | Citigroup Mortgage Loan Trust, Inc. Series 2004-RR1 2A1(c),(f) | | TSFR1M + 0.514% | | 5.8700 | | 01/25/29 | | | 633,627 | |
| | 56,658 | | | Citigroup Mortgage Loan Trust, Inc. Series 2004-NCM2 2CB3 | | | | 8.0000 | | 08/25/34 | | | 56,603 | |
| | 919,432 | | | Citigroup Mortgage Loan Trust, Inc. Series 2005-9 2A3 | | | | 5.7500 | | 11/25/35 | | | 692,244 | |
| | 160,086 | | | CitiMortgage Alternative Loan Trust Series 2007-A1 1A9(d),(f) | | -(TSFR1M + 0.114%) + 5.400% | | 0.0000 | | 01/25/37 | | | 7,487 | |
| | 83,182 | | | CitiMortgage Alternative Loan Trust Series 2007-A1 1APO(g) | | | | 0.0000 | | 01/25/37 | | | 48,256 | |
| | 16,754 | | | CitiMortgage Alternative Loan Trust Series 2007-A1 1A1 | | | | 6.0000 | | 01/25/37 | | | 14,712 | |
| | 31,827,712 | | | COMM Mortgage Trust Series 2007-C9 XS(c),(d),(e) | | | | 0.4330 | | 12/10/49 | | | 654,400 | |
| | 348,924 | | | Credit Suisse First Boston Mortgage Securities Series 2005-8 6A1 | | | | 5.5000 | | 08/25/25 | | | 270,177 | |
| | 545,807 | | | Credit Suisse First Boston Mortgage Securities Series MH29 B1(e) | | | | 8.1000 | | 09/25/31 | | | 544,419 | |
| | 273,609 | | | Credit Suisse First Boston Mortgage Securities Series 2002-P1A A(c),(e) | | | | 6.0580 | | 03/25/32 | | | 253,327 | |
| | 110,777 | | | Credit Suisse First Boston Mortgage Securities Series 2002-18 1M2(e) | | | | 7.0000 | | 06/25/32 | | | 104,841 | |
See accompanying notes which are an integral part of these financial statements.
| RATIONAL SPECIAL SITUATIONS INCOME FUND |
| SCHEDULE OF INVESTMENTS (Continued) |
| December 31, 2023 |
| Principal | | | | | | | Coupon Rate | | | | | |
| Amount ($) | | | | | Spread | | (%) | | Maturity | | Fair Value | |
| | | | | ASSET BACKED SECURITIES — 79.8% (Continued) | | | | | | | | | | |
| | | | | COLLATERALIZED MORTGAGE OBLIGATIONS — 25.6% (Continued) | | | | | | | | | | |
| | 20,654 | | | Credit Suisse First Boston Mortgage Securities Series 2002-AR31 CB2(e) | | | | 5.8340 | | 11/25/32 | | $ | 15,547 | |
| | 80,992 | | | Credit Suisse First Boston Mortgage Securities Series 2002-AR31 CB1(e) | | | | 5.8340 | | 11/25/32 | | | 76,760 | |
| | 410,112 | | | Credit Suisse First Boston Mortgage Securities Series 2002-30 DB1(e) | | | | 7.3350 | | 11/25/32 | | | 412,606 | |
| | 21,983 | | | Credit Suisse First Boston Mortgage Securities Series 2002-34 DB1(e) | | | | 6.9160 | | 12/25/32 | | | 20,902 | |
| | 60,079 | | | Credit Suisse First Boston Mortgage Securities Series 2003-8 CB2(e) | | | | 5.6550 | | 04/25/33 | | | 44,025 | |
| | 110,945 | | | Credit Suisse First Boston Mortgage Securities Series 2003-8 5A1 | | | | 6.5000 | | 04/25/33 | | | 110,108 | |
| | 25,121 | | | Credit Suisse First Boston Mortgage Securities Series 2003-23 6A1 | | | | 6.5000 | | 09/25/33 | | | 25,172 | |
| | 193,577 | | | Credit Suisse First Boston Mortgage Securities Series AR26 9M3(f) | | TSFR1M + 2.864% | | 8.2200 | | 11/25/33 | | | 182,578 | |
| | 87,328 | | | Credit Suisse First Boston Mortgage Securities Series 2003-AR28 6M3(f) | | TSFR1M + 2.864% | | 8.2200 | | 12/25/33 | | | 94,168 | |
| | 772,785 | | | Credit Suisse First Boston Mortgage Securities Series 2004-AR1 6M2(f) | | TSFR1M + 2.214% | | 7.5700 | | 02/25/34 | | | 816,279 | |
| | 51,659 | | | Credit Suisse First Boston Mortgage Securities Series 2004-5 5A1 | | | | 5.0000 | | 09/25/34 | | | 46,109 | |
| | 785,992 | | | Credit Suisse First Boston Mortgage Securities Series 2005-12 5A1 | | | | 5.2500 | | 01/25/36 | | | 677,681 | |
| | 2,098 | | | CSFB Mortgage-Backed Pass-Through Certificates Series 2003-29 6A1 | | | | 5.0000 | | 11/25/28 | | | 1,971 | |
| | 563,201 | | | CSFB Mortgage-Backed Pass-Through Certificates Series 2002-29 2B1 | | | | 7.0000 | | 10/25/32 | | | 551,248 | |
| | 85,973 | | | CSFB Mortgage-Backed Pass-Through Certificates Series 2003-AR18 4M3(f) | | TSFR1M + 3.014% | | 8.3700 | | 07/25/33 | | | 83,120 | |
| | 36,572 | | | CSFB Mortgage-Backed Pass-Through Certificates Series 2003-27 7A1 | | | | 5.5000 | | 11/25/33 | | | 36,515 | |
| | 206,636 | | | CSFB Mortgage-Backed Pass-Through Certificates Series 2003-27 8A1 | | | | 6.0000 | | 11/25/33 | | | 206,794 | |
| | 118,556 | | | CSFB Mortgage-Backed Pass-Through Certificates Series 2003-29 7A1 | | | | 6.5000 | | 12/25/33 | | | 119,209 | |
| | 9,362 | | | CSFB Mortgage-Backed Pass-Through Certificates Series 2003-AR30 5A1(e) | | | | 5.0320 | | 01/25/34 | | | 9,105 | |
| | 567,583 | | | CSFB Mortgage-Backed Pass-Through Certificates Series 2005-9 4A2(f) | | TSFR1M + 0.464% | | 5.8200 | | 10/25/35 | | | 473,170 | |
| | 31,960 | | | CSFB Mortgage-Backed Trust Series 2004-AR6 7A1(e) | | | | 5.9920 | | 10/25/34 | | | 31,857 | |
| | 115,760 | | | CSMC Series 2014-4R 16A3(c),(f) | | TSFR1M + 0.314% | | 3.8290 | | 02/27/36 | | | 108,081 | |
| | 95,745 | | | CSMC Series 2011-6R 4A2(c),(e) | | | | 3.9140 | | 04/28/37 | | | 88,184 | |
| | 28,438 | | | CSMC Mortgage-Backed Trust Series 2007-5 10A2 | | | | 6.0000 | | 04/25/29 | | | 27,041 | |
| | 1,964,359 | | | CSMC Mortgage-Backed Trust Series 2006-9 4A13 | | | | 6.5000 | | 11/25/36 | | | 1,213,458 | |
| | 520,877 | | | CSMC Mortgage-Backed Trust Series 2007-1 5A13 | | | | 6.0000 | | 02/25/37 | | | 291,218 | |
| | 183,232 | | | CSMC Mortgage-Backed Trust Series 2007-3 3A4 | | | | 5.0000 | | 04/25/37 | | | 151,278 | |
| | 138,958 | | | CSMC Mortgage-Backed Trust Series 2007-3 4A6(f) | | TSFR1M + 0.364% | | 5.7200 | | 04/25/37 | | | 107,393 | |
| | 190,188 | | | CSMC Mortgage-Backed Trust Series 2007-4 1A1(f) | | TSFR1M + 0.514% | | 5.8700 | | 06/25/37 | | | 113,921 | |
| | 2,302,440 | | | CSMC Mortgage-Backed Trust Series 2007-4 5A1 | | | | 6.0000 | | 06/25/37 | | | 360,538 | |
| | 161,186 | | | Deutsche Alt-B Securities Inc Mortgage Loan Trust Series 2006-AB2 A3(e) | | | | 4.7980 | | 06/25/36 | | | 140,140 | |
| | 114,783 | | | Deutsche Alt-B Securities Mortgage Loan Trust Series 2006-AB1 A3(h) | | | | 6.3650 | | 02/25/36 | | | 102,866 | |
See accompanying notes which are an integral part of these financial statements.
| RATIONAL SPECIAL SITUATIONS INCOME FUND |
| SCHEDULE OF INVESTMENTS (Continued) |
| December 31, 2023 |
| Principal | | | | | | | Coupon Rate | | | | | |
| Amount ($) | | | | | Spread | | (%) | | Maturity | | Fair Value | |
| | | | | ASSETBACKED SECURITIES —79.8% (Continued) | | | | | | | | | | |
| | | | | COLLATERALIZED MORTGAGEOBLIGATIONS — 25.6%(Continued) | | | | | | | | | | |
| | 31,150 | | | Deutsche Mortgage Sec Inc Mort Loan Trust Series 2004-1 B2(e) | | | | 5.5000 | | 09/25/33 | | $ | 29,151 | |
| | 33,681 | | | Deutsche Mortgage Securities Inc Mortgage Loan Series 2006 - PR1 4AF1(c),(f) | | TSFR1M + 0.404% | | 5.7660 | | 04/15/36 | | | 28,943 | |
| | 164,010 | | | DSLA Mortgage Loan Trust Series 2004-AR1 A2B (f) | | TSFR1M + 0.954% | | 6.3100 | | 09/19/44 | | | 142,726 | |
| | 236,158 | | | DSLA Mortgage Loan Trust Series 2004-AR2 A2B (f) | | TSFR1M + 0.914% | | 6.2700 | | 11/19/44 | | | 220,498 | |
| | 1,038,736 | | | DSLA Mortgage Loan Trust Series 2004-AR2 A1B (f) | | TSFR1M + 0.914% | | 6.2700 | | 11/19/44 | | | 881,908 | |
| | 2,308,251 | | | DSLA Mortgage Loan Trust Series 2007-AR1 1A1B (f) | | TSFR1M + 0.254% | | 5.6100 | | 04/19/47 | | | 1,904,436 | |
| | 152,753 | | | Fannie Mae Interest Strip Series 409 19(d),(e) | | | | 3.5000 | | 04/25/27 | | | 3,761 | |
| | 138,754 | | | Fannie Mae Interest Strip Series 356 17(d) | | | | 6.0000 | | 01/25/35 | | | 23,425 | |
| | 295,370 | | | Fannie Mae Interest Strip Series 362 2(d) | | | | 4.5000 | | 08/25/35 | | | 41,344 | |
| | 192,648 | | | Fannie Mae Interest Strip Series 387 5(d),(e) | | | | 5.0000 | | 03/25/38 | | | 28,330 | |
| | 427,176 | | | Fannie Mae Interest Strip Series 407 16(d) | | | | 5.0000 | | 01/25/40 | | | 78,136 | |
| | 296,419 | | | Fannie Mae REMICS Series 2010 -55 SH(d),(f) | | -(SOFR30A + 0.114%)+ 6.500% | | 0.0900 | | 05/25/40 | | | 7,070 | |
| | 314,775 | | | Fannie Mae REMICS Series 2018 -95 SA(d),(f) | | -(SOFR30A + 0.114%)+ 6.150% | | 11.9400 | | 01/25/49 | | | 33,876 | |
| | 1,095,230 | | | Fannie Mae Trust Series 2003-W65S (d),(f) | | -(SOFR30A + 0.114%)+ 7.600% | | 2.1480 | | 09/25/42 | | | 143,145 | |
| | 157,934 | | | First Horizon Alternative Mortgage Securities Series 2004-AA5 2A1(e) | | | | 5.9000 | | 12/25/34 | | | 147,211 | |
| | 365,363 | | | First Horizon Alternative Mortgage Securities Series 2004-AA7 1A1(e) | | | | 5.1270 | | 02/25/35 | | | 335,550 | |
| | 25,858 | | | First Horizon Alternative Mortgage Securities Series 2005-AA1 1A1(e) | | | | 5.2080 | | 03/25/35 | | | 15,382 | |
| | 865,457 | | | First Horizon Alternative Mortgage Securities Series 2005-AA3 2A1(e) | | | | 7.1990 | | 05/25/35 | | | 441,184 | |
| | 216,188 | | | First Horizon Alternative Mortgage Securities Series 2005-AA5 1A1(e) | | | | 6.4990 | | 07/25/35 | | | 134,717 | |
| | 1,112 | | | First Horizon Alternative Mortgage Securities Series 2006-AA4 1A1(e) | | | | 4.5100 | | 07/25/36 | | | — | |
| | 20,861 | | | First Horizon Mortgage Pass - Through Trust Series 2000-H3B1 (e) | | | | 4.6790 | | 05/25/30 | | | 20,297 | |
| | 18,109 | | | First Horizon Mortgage Pass - Through Trust Series 2000-H4B2 (e) | | | | 5.2490 | | 05/25/30 | | | 17,372 | |
| | 160,558 | | | First Horizon Mortgage Pass - Through Trust Series 2004-FL11A1 (f) | | TSFR1M + 0.384% | | 5.7400 | | 02/25/35 | | | 137,098 | |
| | 185,860 | | | First Horizon Mortgage Pass - Through Trust Series 2005-AR4 2A1(e) | | | | 4.9460 | | 10/25/35 | | | 172,591 | |
| | 627,169 | | | First Horizon Mortgage Pass - Through Trust Series 2005-AR6 3A1(e) | | | | 6.6250 | | 01/25/36 | | | 465,615 | |
| | 473,880 | | | First Horizon Mortgage Pass - Through Trust Series 2006-AR3 3A1(e) | | | | 3.5140 | | 10/25/36 | | | 352,159 | |
| | 55,194 | | | First Horizon Mortgage Pass - Through Trust Series 2007-AR2 2A1(e) | | | | 4.5090 | | 07/25/37 | | | 35,732 | |
| | 301,273 | | | Freddie Mac REMICS Series 3753 SB(d),(f) | | -(SOFR30A + 0.114%)+ 6.000% | | 8.0400 | | 11/15/40 | | | 32,190 | |
| | 260,558 | | | Freddie Mac Strips Series 324 C21(d) | | | | 6.0000 | | 06/15/39 | | | 53,017 | |
| | 284,389 | | | Freddie Mac Strips Series 365 257(d),(e) | | | | 4.5000 | | 05/15/49 | | | 56,515 | |
| | 2,863,432 | | | Freddie Mac Structured Pass -Through Certificates Series 56 AIO (d),(e) | | | | 0.5240 | | 05/25/43 | | | 72,357 | |
| | 411,552 | | | Global Mortgage Securitization Ltd. Series 2004-A A2(c),(f) | | TSFR1M + 0.434% | | 5.7900 | | 11/25/32 | | | 398,428 | |
See accompanying notes which are an integral part of these financial statements.
| RATIONAL SPECIAL SITUATIONS INCOME FUND |
| SCHEDULE OF INVESTMENTS (Continued) |
| December 31, 2023 |
| Principal | | | | | | | Coupon Rate | | | | | |
| Amount ($) | | | | | Spread | | (%) | | Maturity | | Fair Value | |
| | | | | ASSET BACKED SECURITIES — 79.8% (Continued) | | | | | | | | | | |
| | | | | COLLATERALIZED MORTGAGE OBLIGATIONS — 25.6% (Continued) | | | | | | | | | | |
| | 148,829 | | | GMACM Mortgage Loan Trust Series 2004-J2 A9(g) | | | | 0.0000 | | 06/25/34 | | $ | 123,419 | |
| | 1,803,346 | | | GMACM Mortgage Loan Trust Series 2005-AR4 3A1(e) | | | | 3.7050 | | 07/19/35 | | | 1,447,524 | |
| | 446,478 | | | GMACM Mortgage Loan Trust Series 2005-AR6 3A1(e) | | | | 4.2640 | | 11/19/35 | | | 380,781 | |
| | 158,037 | | | Government National Mortgage Association Series 2012-104 DI(d),(h),(j) | | | | 4.0000 | | 09/16/25 | | | 47 | |
| | 153,888 | | | Government National Mortgage Association Series 2003-12 S(d),(f) | | -(TSFR1M + 0.114%) + 7.550% | | 5.7800 | | 02/20/33 | | | 1,853 | |
| | 152,156 | | | Government National Mortgage Association Series 2021-78 QI(d) | | | | 5.0000 | | 05/20/34 | | | 18,895 | |
| | 160,771 | | | Government National Mortgage Association Series 2015-79 GI(d) | | | | 5.0000 | | 10/20/39 | | | 31,567 | |
| | 127,682 | | | Government National Mortgage Association Series 2011-71 SG(d),(f) | | -(TSFR1M + 0.114%) + 5.400% | | 4.2000 | | 05/20/41 | | | 9,294 | |
| | 149,627 | | | Government National Mortgage Association Series 2011-89 SA(d),(f) | | -(TSFR1M + 0.114%) + 5.450% | | 6.8600 | | 06/20/41 | | | 11,115 | |
| | 685,225 | | | GreenPoint Mortgage Funding Trust Series 2006-AR2 4A1(f) | | 12MTA + 2.000% | | 6.9290 | | 03/25/36 | | | 600,861 | |
| | 67,593 | | | GreenPoint Mortgage Funding Trust Series 2006-AR3 4A1(f) | | TSFR1M + 0.534% | | 5.8900 | | 04/25/36 | | | 57,253 | |
| | 420,756 | | | GreenPoint Mortgage Funding Trust Series 2005-AR4 1A1(f) | | TSFR1M + 0.634% | | 5.9900 | | 10/25/45 | | | 411,072 | |
| | 205,413 | | | GreenPoint Mortgage Funding Trust Series 2005-AR5 3A1(f) | | TSFR1M + 0.674% | | 6.0300 | | 11/25/45 | | | 143,648 | |
| | 554,525 | | | GreenPoint Mortgage Loan Trust Series 2004-1 A(f) | | TSFR1M + 1.264% | | 6.6200 | | 10/25/34 | | | 434,602 | |
| | 329,224 | | | GreenPoint MTA Trust Series 2005-AR3 1A1(f) | | TSFR1M + 0.594% | | 5.9500 | | 08/25/45 | | | 260,194 | |
| | 140,046 | | | GSMPS Mortgage Loan Trust Series 1998-2 A(c),(e) | | | | 7.7500 | | 05/19/27 | | | 141,232 | |
| | 58,416 | | | GSMPS Mortgage Loan Trust Series 1998-3 A(c),(e) | | | | 4.8090 | | 09/19/27 | | | 57,619 | |
| | 145,285 | | | GSMPS Mortgage Loan Trust Series 1999-2 A(c),(e) | | | | 8.0000 | | 09/19/27 | | | 142,417 | |
| | 48,468 | | | GSMPS Mortgage Loan Trust Series 1998-1 A(c),(e) | | | | 8.0000 | | 09/19/27 | | | 45,753 | |
| | 412,972 | | | GSMPS Mortgage Loan Trust Series 2001-2 A(c),(e) | | | | 7.5000 | | 06/19/32 | | | 383,281 | |
| | 118,265 | | | GSR Mortgage Loan Trust Series 2003-1 B1(e) | | | | 4.5870 | | 03/25/33 | | | 109,192 | |
| | 9,412 | | | GSR Mortgage Loan Trust Series 2003-1 A2(f) | | H15T1Y + 1.750% | | 5.9300 | | 03/25/33 | | | 9,222 | |
| | 90,351 | | | GSR Mortgage Loan Trust Series 2003-3F B3(e) | | | | 5.9590 | | 04/25/33 | | | 86,101 | |
| | 106,684 | | | GSR Mortgage Loan Trust Series 2003-3F 1A6 | | | | 6.0000 | | 04/25/33 | | | 104,527 | |
| | 165,827 | | | GSR Mortgage Loan Trust Series 2003-4F B3(e) | | | | 5.9100 | | 05/25/33 | | | 167,200 | |
| | 375,670 | | | GSR Mortgage Loan Trust Series 2003-9 A2(f) | | TSFR12M + 2.465% | | 5.9500 | | 08/25/33 | | | 350,344 | |
| | 12,151 | | | GSR Mortgage Loan Trust Series 2004-8F 2A3 | | | | 6.0000 | | 09/25/34 | | | 12,112 | |
| | 14,223 | | | GSR Mortgage Loan Trust Series 2004-13F 3A3 | | | | 6.0000 | | 11/25/34 | | | 13,796 | |
| | 95,590 | | | GSR Mortgage Loan Trust Series 2004-15F 3A1(f) | | TSFR1M + 0.414% | | 5.7700 | | 12/25/34 | | | 88,208 | |
| | 17,762 | | | GSR Mortgage Loan Trust Series 2005-5F 8A7 | | | | 5.5000 | | 06/25/35 | | | 17,682 | |
| | 14,672 | | | GSR Mortgage Loan Trust Series 2005-AR6 2A2(e) | | | | 4.6630 | | 09/25/35 | | | 13,706 | |
| | 6,661 | | | GSR Mortgage Loan Trust Series 2005-AR6 1A1(e) | | | | 5.3100 | | 09/25/35 | | | 6,571 | |
| | 58,178 | | | GSR Mortgage Loan Trust Series 2005-7F 2A6 | | | | 5.5000 | | 09/25/35 | | | 55,692 | |
See accompanying notes which are an integral part of these financial statements.
| RATIONAL SPECIAL SITUATIONS INCOME FUND |
| SCHEDULE OF INVESTMENTS (Continued) |
| December 31, 2023 |
| Principal | | | | | | | Coupon Rate | | | | | |
| Amount ($) | | | | | Spread | | (%) | | Maturity | | Fair Value | |
| | | | | ASSET BACKED SECURITIES — 79.8% (Continued) | | | | | | | | | | |
| | | | | COLLATERALIZED MORTGAGE OBLIGATIONS — 25.6% (Continued) | | | | | | | | | | |
| | 191,829 | | | GSR Mortgage Loan Trust Series 2005-AR5 1A1(e) | | | | 5.3500 | | 10/25/35 | | $ | 178,956 | |
| | 281,003 | | | GSR Mortgage Loan Trust Series 2005-AR7 5A1(e) | | | | 4.5820 | | 11/25/35 | | | 233,628 | |
| | 374,405 | | | GSR Mortgage Loan Trust Series 2005-8F 2A1 | | | | 5.5000 | | 11/25/35 | | | 344,544 | |
| | 499,664 | | | GSR Mortgage Loan Trust Series 2005-8F 2A4 | | | | 5.5000 | | 11/25/35 | | | 459,812 | |
| | 1,153,337 | | | GSR Mortgage Loan Trust Series 2005-8F 2A6 | | | | 5.5000 | | 11/25/35 | | | 1,065,139 | |
| | 8,903 | | | GSR Mortgage Loan Trust Series 2005-AR7 3A1(e) | | | | 6.1060 | | 11/25/35 | | | 8,233 | |
| | 37,032 | | | GSR Mortgage Loan Trust Series 2006-1F 1A3 | | | | 5.5000 | | 02/25/36 | | | 66,896 | |
| | 823,923 | | | GSR Mortgage Loan Trust Series 2006-1F 4A1 | | | | 5.5000 | | 02/25/36 | | | 613,069 | |
| | 24,203 | | | GSR Mortgage Loan Trust Series 2006-1F 1A9 | | | | 5.5000 | | 02/25/36 | | | 35,069 | |
| | 1,428,018 | | | GSR Mortgage Loan Trust Series 2006-2F 2A13 | | | | 5.7500 | | 02/25/36 | | | 1,271,276 | |
| | 1,687,346 | | | GSR Mortgage Loan Trust Series 2006-2F 2A17 | | | | 5.7500 | | 02/25/36 | | | 1,502,139 | |
| | 827,541 | | | GSR Mortgage Loan Trust Series 2006-1F 1A6(f) | | TSFR1M + 1.064% | | 6.4200 | | 02/25/36 | | | 1,637,803 | |
| | 2,522,878 | | | GSR Mortgage Loan Trust Series 2006-4F 5A11 | | | | 5.5000 | | 05/25/36 | | | 837,500 | |
| | 875,000 | | | GSR Mortgage Loan Trust Series 2006-4F 2A11 | | | | 5.5000 | | 05/25/36 | | | 500,000 | |
| | 64,608,613 | | | GSR Mortgage Loan Trust Series 2006-4F 2A2 | | | | 5.5000 | | 05/25/36 | | | 1,143,000 | |
| | 81,195 | | | GSR Mortgage Loan Trust Series 2006-5F 2A4 | | | | 6.0000 | | 06/25/36 | | | 123,434 | |
| | 432,190 | | | GSR Mortgage Loan Trust Series 2006-5F 2A2 | | | | 6.0000 | | 06/25/36 | | | 657,018 | |
| | 219,342 | | | GSR Mortgage Loan Trust Series 2006-5F 2A1 | | | | 6.0000 | | 06/25/36 | | | 333,446 | |
| | 10,991 | | | GSR Mortgage Loan Trust Series 2006-7F 2A1 | | | | 6.0000 | | 08/25/36 | | | 1,825,000 | |
| | 765,176 | | | GSR Mortgage Loan Trust Series 2006-10F 2A1 | | | | 5.7500 | | 12/25/36 | | | 1,702,087 | |
| | 223,705 | | | GSR Mortgage Loan Trust Series 2007-1F 2A4 | | | | 5.5000 | | 01/25/37 | | | 296,969 | |
| | 400,668 | | | GSR Mortgage Loan Trust Series 2007-1F 2A2 | | | | 5.5000 | | 01/25/37 | | | 921,037 | |
| | 788,230 | | | GSR Mortgage Loan Trust Series 2007-1F 3A1 | | | | 6.0000 | | 01/25/37 | | | 481,578 | |
| | 620,856 | | | GSR Mortgage Loan Trust Series 2007-AR1 1A1(e) | | | | 3.6740 | | 03/25/37 | | | 339,391 | |
| | 518,710 | | | GSR Mortgage Loan Trust Series 2007-AR1 3A1(e) | | | | 3.8850 | | 03/25/37 | | | 451,166 | |
| | 120,732 | | | GSR Mortgage Loan Trust Series 2007-AR2 5A1A(e) | | | | 5.4160 | | 05/25/37 | | | 104,412 | |
| | 753,830 | | | GSR Mortgage Loan Trust Series 2007-3F 2A1 | | | | 5.7500 | | 05/25/37 | | | 1,980,120 | |
| | 52,503 | | | GSR Mortgage Loan Trust Series 2007-4F 1A1 | | | | 5.0000 | | 07/25/37 | | | 79,877 | |
| | 2,384,636 | | | GSR Mortgage Loan Trust Series 2007-4F 2A1 | | | | 5.7500 | | 07/25/37 | | | 3,799,510 | |
| | 73,529 | | | HarborView Mortgage Loan Trust Series 2003-1 B1(e) | | | | 5.2850 | | 05/19/33 | | | 57,229 | |
| | 257,749 | | | HarborView Mortgage Loan Trust Series 2004-1 B1(e) | | | | 5.5760 | | 04/19/34 | | | 197,073 | |
| | 982,432 | | | HarborView Mortgage Loan Trust Series 2004-8 3A2(f) | | TSFR1M + 0.914% | | 6.2700 | | 11/19/34 | | | 732,963 | |
| | 74,755 | | | HarborView Mortgage Loan Trust Series 2004-9 4A2(f) | | TSFR1M + 0.894% | | 6.2500 | | 12/19/34 | | | 65,055 | |
| | 3,117,476 | | | HarborView Mortgage Loan Trust Series 2005-2 1A(f) | | TSFR1M + 0.634% | | 5.1900 | | 05/19/35 | | | 981,033 | |
See accompanying notes which are an integral part of these financial statements.
| RATIONAL SPECIAL SITUATIONS INCOME FUND |
| SCHEDULE OF INVESTMENTS (Continued) |
| December 31, 2023 |
| Principal | | | | | | | Coupon Rate | | | | | |
| Amount ($) | | | | | Spread | | (%) | | Maturity | | Fair Value | |
| | | | | ASSET BACKED SECURITIES — 79.8% (Continued) | | | | | | | | | | |
| | | | | COLLATERALIZED MORTGAGE OBLIGATIONS — 25.6% (Continued) | | | | | | | | | | |
| | 47,044 | | | HarborView Mortgage Loan Trust Series 2005-4 4A(e) | | | | 4.9520 | | 07/19/35 | | $ | 41,506 | |
| | 199,163 | | | HarborView Mortgage Loan Trust Series 2005-8 1A2A(f) | | TSFR1M + 0.774% | | 5.8000 | | 09/19/35 | | | 131,365 | |
| | 20,973 | | | HarborView Mortgage Loan Trust Series 2005-14 2A1A(e) | | | | 5.8410 | | 12/19/35 | | | 14,749 | |
| | 166,349 | | | HarborView Mortgage Loan Trust Series 2005-14 3A1A(e) | | | | 5.9270 | | 12/19/35 | | | 157,053 | |
| | 1,956,887 | | | HarborView Mortgage Loan Trust Series 2005-16 4A1B(f) | | 12MTA + 2.000% | | 7.0120 | | 01/19/37 | | | 1,412,464 | |
| | 926 | | | Impac CMB Trust Series 2003-8 2M2(f) | | TSFR1M + 2.739% | | 8.0950 | | 10/25/33 | | | 916 | |
| | 1,686 | | | Impac CMB Trust Series 2003-8 2B1(f) | | TSFR1M + 4.614% | | 9.9700 | | 10/25/33 | | | 1,652 | |
| | 82,686 | | | Impac CMB Trust Series 2004-10 3A2(f) | | TSFR1M + 0.914% | | 6.2700 | | 03/25/35 | | | 77,330 | |
| | 863,693 | | | Impac CMB Trust Series 2005-4 2B1(f) | | TSFR1M + 1.764% | | 4.6700 | | 05/25/35 | | | 828,202 | |
| | 190,351 | | | Impac CMB Trust Series 2005-4 2A2(f) | | TSFR1M + 0.494% | | 6.2300 | | 05/25/35 | | | 177,999 | |
| | 199,339 | | | Impac Secured Assets CMN Owner Trust Series 2003-3 M1(e) | | | | 5.2890 | | 08/25/33 | | | 188,995 | |
| | 130,340 | | | Impac Secured Assets CMN Owner Trust Series 2005-1 4A(e) | | | | 4.8080 | | 07/25/35 | | | 115,271 | |
| | 2,724 | | | Impac Secured Assets Trust Series 2006-2 2M3(f) | | TSFR1M + 1.764% | | 7.1200 | | 08/25/36 | | | 2,723 | |
| | 125,349 | | | IndyMac ARM Trust Series 2001-H1 1A(e) | | | | 5.2000 | | 08/25/31 | | | 67,576 | |
| | 78,127 | | | IndyMac IMSC Mortgage Loan Trust Series 2007-F3 PO(g) | | | | 0.0000 | | 09/25/37 | | | 44,782 | |
| | 81,792 | | | IndyMac INDA Mortgage Loan Trust Series 2005-AR1 2A1(e) | | | | 4.8050 | | 11/25/35 | | | 82,113 | |
| | 17,440 | | | IndyMac INDA Mortgage Loan Trust Series 2005-AR2 2A1(e) | | | | 4.7500 | | 01/25/36 | | | 16,204 | |
| | 69,881 | | | IndyMac INDA Mortgage Loan Trust Series 2007-AR4 3A1(e) | | | | 4.5480 | | 08/25/37 | | | 67,308 | |
| | 28,042 | | | IndyMac INDX Mortgage Loan Trust Series 2004-AR10 2A2B(f) | | TSFR1M + 1.034% | | 6.3900 | | 05/25/34 | | | 24,535 | |
| | 155,994 | | | IndyMac INDX Mortgage Loan Trust Series 2004-AR5 2A1A(f) | | TSFR1M + 0.974% | | 6.3300 | | 08/25/34 | | | 131,504 | |
| | 1,953,120 | | | IndyMac INDX Mortgage Loan Trust Series 2005-AR9 2A1(e) | | | | 4.5650 | | 07/25/35 | | | 1,806,914 | |
| | 151,116 | | | IndyMac INDX Mortgage Loan Trust Series 2006-AR2 2A1(f) | | TSFR1M + 0.534% | | 5.8900 | | 02/25/46 | | | 106,444 | |
| | 1,026,321 | | | Jefferies Resecuritization Trust Series 2009-R6 7A5(c),(e) | | | | 4.8710 | | 08/26/35 | | | 938,129 | |
| | 477,380 | | | Jefferies Resecuritization Trust Series 2009-R7 6A2(c),(e) | | | | 4.5970 | | 10/21/35 | | | 465,855 | |
| | 260,690 | | | JP Morgan Alternative Loan Trust Series 2005-S1 2A1 | | | | 5.0000 | | 12/25/35 | | | 174,849 | |
| | 28,230 | | | JP Morgan Alternative Loan Trust Series 2006-S2 A4(h) | | | | 6.6900 | | 05/25/36 | | | 28,134 | |
| | 589 | | | JP Morgan Mortgage Trust Series 2004-S2 3A1 | | | | 5.5000 | | 11/25/24 | | | 585 | |
| | 444,971 | | | JP Morgan Mortgage Trust Series 2004-S2 2A13(f) | | TSFR1M + 0.514% | | 5.8700 | | 11/25/34 | | | 404,408 | |
| | 201,954 | | | JP Morgan Mortgage Trust Series 2004-S2 4A5 | | | | 6.0000 | | 11/25/34 | | | 181,294 | |
| | 27,390 | | | JP Morgan Mortgage Trust Series 2005-A3 11A2(e) | | | | 5.5540 | | 06/25/35 | | | 25,402 | |
| | 387,602 | | | JP Morgan Mortgage Trust Series 2005-A6 5A1(e) | | | | 5.3090 | | 08/25/35 | | | 384,802 | |
| | 711,996 | | | JP Morgan Mortgage Trust Series 2005-A8 1A1(e) | | | | 4.8890 | | 11/25/35 | | | 580,691 | |
| | 50,716 | | | JP Morgan Mortgage Trust Series 2007-A2 3A1(e) | | | | 4.1530 | | 04/25/37 | | | 40,653 | |
| | 193,592 | | | JP Morgan Mortgage Trust Series 2007-S2 3A2 | | | | 6.0000 | | 06/25/37 | | | 184,861 | |
See accompanying notes which are an integral part of these financial statements.
| RATIONAL SPECIAL SITUATIONS INCOME FUND |
| SCHEDULE OF INVESTMENTS (Continued) |
| December 31, 2023 |
| Principal | | | | | | | Coupon Rate | | | | | |
| Amount ($) | | | | | Spread | | (%) | | Maturity | | Fair Value | |
| | | | | ASSET BACKED SECURITIES — 79.8% (Continued) | | | | | | | | | | |
| | | | | COLLATERALIZED MORTGAGE OBLIGATIONS — 25.6% (Continued) | | | | | | | | | | |
| | 82,034 | | | JP Morgan Mortgage Trust Series 2007-S2 3A3 | | | | 6.5000 | | 06/25/37 | | $ | 79,765 | |
| | 128,957 | | | Lehman Mortgage Trust Series 2005-2 5A2(f) | | -4.6(TSFR1M + 0.114%) + 28.060% | | 2.8960 | | 12/25/35 | | | 117,814 | |
| | 674,736 | | | Lehman Mortgage Trust Series 2005-2 AX(d) | | | | 5.5000 | | 12/25/35 | | | 103,514 | |
| | 800,826 | | | Lehman Mortgage Trust Series 2005-2 5A1(f) | | TSFR1M + 1.014% | | 6.3700 | | 12/25/35 | | | 476,701 | |
| | 1,392,778 | | | Lehman Mortgage Trust Series 2007-5 8A2(d),(f) | | -(TSFR1M + 0.114%) + 7.720% | | 2.2500 | | 08/25/36 | | | 224,813 | |
| | 1,376,133 | | | Lehman Mortgage Trust Series 2007-5 8A1(f) | | TSFR1M + 0.394% | | 5.7400 | | 08/25/36 | | | 278,215 | |
| | 439,633 | | | Lehman Mortgage Trust Series 2006-7 5A1(e) | | | | 1.3670 | | 09/25/36 | | | 101,748 | |
| | 112,692 | | | Lehman Mortgage Trust Series 2007-3 2A1(g) | | | | 0.0000 | | 03/25/37 | | | 73,262 | |
| | 230,503 | | | Lehman Mortgage Trust Series 2007-10 2A2 | | | | 1.7010 | | 01/25/38 | | | 64,619 | |
| | 188,351 | | | Lehman Mortgage Trust Series 2006-4 4A1 | | | | 6.0000 | | 06/25/49 | | | 133,837 | |
| | 713,309 | | | Lehman XS Trust Series 2005-5N 1A2(f) | | TSFR1M + 0.474% | | 5.8300 | | 11/25/35 | | | 683,743 | |
| | 271,191 | | | Lehman XS Trust Series 2006-2N 1A1(f) | | TSFR1M + 0.634% | | 5.9900 | | 02/25/46 | | | 238,560 | |
| | 16,864 | | | Luminent Mortgage Trust Series 2006-7 2A1(f) | | TSFR1M + 0.454% | | 5.8100 | | 12/25/36 | | | 14,447 | |
| | 266,846 | | | Luminent Mortgage Trust Series 2006-7 1A1(f) | | TSFR1M + 0.474% | | 5.8300 | | 12/25/36 | | | 242,369 | |
| | 470,769 | | | Luminent Mortgage Trust Series 2007-2 2A1(f) | | TSFR1M + 0.574% | | 5.9300 | | 05/25/37 | | | 424,578 | |
| | 356,375 | | | MASTR Adjustable Rate Mortgages Trust Series 2004-11 B1(f) | | TSFR1M + 2.364% | | 7.7200 | | 11/25/34 | | | 344,033 | |
| | 2,525,299 | | | MASTR Adjustable Rate Mortgages Trust Series 2004-14 B2(f) | | TSFR1M + 3.514% | | 8.8700 | | 01/25/35 | | | 2,081,055 | |
| | 1,024,694 | | | MASTR Adjustable Rate Mortgages Trust Series 2005-6 3A1(e) | | | | 1.7410 | | 07/25/35 | | | 378,704 | |
| | 1,799,463 | | | MASTR Adjustable Rate Mortgages Trust Series 2005-6 3A2(e) | | | | 1.7410 | | 07/25/35 | | | 648,670 | |
| | 2,902,676 | | | MASTR Adjustable Rate Mortgages Trust Series 2007-1 2A1(e) | | | | 4.6260 | | 11/25/36 | | | 1,522,674 | |
| | 3,709,701 | | | MASTR Adjustable Rate Mortgages Trust Series 2006-OA2 1A1(f) | | 12MTA + 0.800% | | 5.8120 | | 12/25/46 | | | 2,582,675 | |
| | 318,231 | | | MASTR Adjustable Rate Mortgages Trust Series 2006-OA2 2A1(f) | | 12MTA + 0.800% | | 5.8120 | | 12/25/46 | | | 244,476 | |
| | 508,034 | | | MASTR Adjustable Rate Mortgages Trust Series 2007-1 I2A3(f) | | 12MTA + 0.740% | | 5.7520 | | 01/25/47 | | | 500,785 | |
| | 1,623 | | | MASTR Adjustable Rate Mortgages Trust Series 2007-1 I2A1(f) | | TSFR1M + 0.434% | | 5.7900 | | 01/25/47 | | | 1,607 | |
| | 300,000 | | | MASTR Adjustable Rate Mortgages Trust Series 2007-3 22A5(f) | | TSFR1M + 0.794% | | 6.1500 | | 05/25/47 | | | 235,107 | |
| | 25,718 | | | MASTR Alternative Loan Trust Series 2003-4 3A1 | | | | 6.0000 | | 06/25/33 | | | 25,598 | |
| | 39,192 | | | MASTR Alternative Loan Trust Series 2003-5 4A1 | | | | 5.5000 | | 07/25/33 | | | 38,262 | |
| | 15,660 | | | MASTR Alternative Loan Trust Series 2003-7 7A18 | | | | 5.7500 | | 11/25/33 | | | 15,090 | |
| | 14,573 | | | MASTR Alternative Loan Trust Series 2004-10 4A1 | | | | 6.0000 | | 09/25/34 | | | 13,966 | |
| | 31,955 | | | MASTR Alternative Loan Trust Series 2004-11 1A1(e) | | | | 5.7940 | | 10/25/34 | | | 30,848 | |
| | 17,383 | | | MASTR Alternative Loan Trust Series 2004-12 4A1 | | | | 5.5000 | | 12/25/34 | | | 16,940 | |
| | 545,583 | | | MASTR Alternative Loan Trust Series 2004-13 9A2 | | | | 5.5000 | | 01/25/35 | | | 293,397 | |
| | 45,516 | | | MASTR Alternative Loan Trust Series 2005-1 2A1 | | | | 6.0000 | | 02/25/35 | | | 45,233 | |
See accompanying notes which are an integral part of these financial statements.
| RATIONAL SPECIAL SITUATIONS INCOME FUND |
| SCHEDULE OF INVESTMENTS (Continued) |
| December 31, 2023 |
| Principal | | | | | | | Coupon Rate | | | | | |
| Amount ($) | | | | | Spread | | (%) | | Maturity | | Fair Value | |
| | | | | ASSET BACKED SECURITIES — 79.8% (Continued) | | | | | | | | | | |
| | | | | COLLATERALIZED MORTGAGE OBLIGATIONS — 25.6% (Continued) | | | | | | | | | | |
| | 56,045 | | | MASTR Alternative Loan Trust Series 2005-6 30PO(g) | | | | 0.0000 | | 12/25/35 | | $ | 14,183 | |
| | 36,215 | | | MASTR Alternative Loan Trust Series 2006-2 PO(g) | | | | 0.0000 | | 03/25/36 | | | 14,397 | |
| | 33,877 | | | MASTR Asset Securitization Trust Series 2003-11 6A16 | | | | 5.2500 | | 12/25/33 | | | 32,376 | |
| | 83,162 | | | MASTR Asset Securitization Trust Series 2004-9 3A7 | | | | 5.2500 | | 07/25/34 | | | 76,993 | |
| | 106,631 | | | MASTR Asset Securitization Trust Series 2004-11 5A5 | | | | 5.7500 | | 12/25/34 | | | 84,810 | |
| | 942,375 | | | MASTR Asset Securitization Trust Series 2004-11 5A4 | | | | 5.7500 | | 12/25/34 | | | 762,286 | |
| | 1,406,367 | | | MASTR Reperforming Loan Trust Series 2005-1 1A4(c) | | | | 7.5000 | | 08/25/34 | | | 1,074,894 | |
| | 50,435 | | | MASTR Seasoned Securitization Trust Series 2003-1 3A2(f) | | TSFR1M + 0.514% | | 5.8700 | | 02/25/33 | | | 47,746 | |
| | 73,133 | | | Mellon Residential Funding Cor Mor Pass Thru Trust Series 1999-TBC3 B4(c),(e) | | | | 6.0200 | | 10/20/29 | | | 69,469 | |
| | 45,188 | | | Mellon Residential Funding Cor Mor Pass Thru Trust Series 1999-TBC3 B5(c),(e) | | | | 6.0200 | | 10/20/29 | | | 42,921 | |
| | 1,836,276 | | | MERIT Securities Corporation Series 11PA B3(c),(f) | | SOFRRATE + 2.364% | | 7.7200 | | 09/28/32 | | | 1,626,105 | |
| | 135,236 | | | Merrill Lynch Alternative Note Asset Trust Series 2007-AF1 1AF2 | | | | 5.7500 | | 05/25/37 | | | 127,630 | |
| | 258,946 | | | Merrill Lynch Mortgage Backed Securities Trust Series 2007-1 2A1(e) | | | | 3.6290 | | 04/25/37 | | | 222,214 | |
| | 155,901 | | | Merrill Lynch Mortgage Investors Trust Series 2006-AF1 PO(g) | | | | 0.0000 | | 08/25/36 | | | 6,765 | |
| | 43,432 | | | Merrill Lynch Mortgage Investors Trust MLCC Series 2003-D B1(f) | | TSFR1M + 1.059% | | 6.4150 | | 08/25/28 | | | 38,112 | |
| | 33,013 | | | Merrill Lynch Mortgage Investors Trust MLCC Series 2003-D B2(f) | | TSFR1M + 2.364% | | 7.7200 | | 08/25/28 | | | 27,860 | |
| | 168,994 | | | Merrill Lynch Mortgage Investors Trust MLCC Series 2003-F B1(f) | | TSFR1M + 1.014% | | 6.3700 | | 10/25/28 | | | 155,484 | |
| | 122,580 | | | Merrill Lynch Mortgage Investors Trust MLCC Series 2007-2 1A(e) | | | | 5.2140 | | 06/25/37 | | | 120,314 | |
| | 79,474 | | | Merrill Lynch Mortgage Investors Trust MLMI Series 2003-A2 2M1(e) | | | | 4.7900 | | 03/25/33 | | | 64,922 | |
| | 1,141,463 | | | Merrill Lynch Mortgage Investors Trust MLMI Series 2005-A7 2A1(e) | | | | 4.7540 | | 09/25/35 | | | 917,622 | |
| | 94,761 | | | Morgan Stanley Dean Witter Capital I Inc Trust Series 2003-HYB1 A1(e) | | | | 6.0880 | | 03/25/33 | | | 81,982 | |
| | 95,689 | | | Morgan Stanley Mortgage Loan Trust Series 2006-7 1A | | | | 5.0000 | | 01/25/24 | | | 62,969 | |
| | 172,347 | | | Morgan Stanley Mortgage Loan Trust Series 2006-7 2A | | | | 6.0000 | | 06/25/31 | | | 112,426 | |
| | 27,787 | | | Morgan Stanley Mortgage Loan Trust Series 2004-3 3A | | | | 6.0000 | | 04/25/34 | | | 27,411 | |
| | 318,016 | | | Morgan Stanley Mortgage Loan Trust Series 2005-2AR B1(f) | | TSFR1M + 0.614% | | 5.9700 | | 04/25/35 | | | 239,011 | |
| | 183,968 | | | Morgan Stanley Mortgage Loan Trust Series 2005-4 1A | | | | 5.0000 | | 08/25/35 | | | 173,182 | |
| | 763,970 | | | Morgan Stanley Mortgage Loan Trust Series 2005-10 4A1 | | | | 5.5000 | | 12/25/35 | | | 457,336 | |
| | 88,526 | | | Morgan Stanley Mortgage Loan Trust Series 2006-2 1A | | | | 5.2500 | | 12/25/52 | | | 78,471 | |
| | 14,947 | | | Morgan Stanley Re-REMIC Trust Series 2010-R7 3B(c) | | | | 5.5000 | | 11/26/34 | | | 13,493 | |
| | 1,158,490 | | | Morgan Stanley Resecuritization Trust Series 2014-R4 4B2(c),(e) | | | | 5.2460 | | 11/21/35 | | | 1,019,365 | |
| | 10,533,644 | | | Mortgage Loan Resecuritization Trust Series 2009-RS1 B15(c),(f) | | SOFRRATE + 0.454% | | 5.7970 | | 04/16/36 | | | 6,637,830 | |
| | 2,592,600 | | | MortgageIT Mortgage Loan Trust Series 2006-1 1A2(f) | | TSFR1M + 0.514% | | 5.8700 | | 04/25/36 | | | 1,889,629 | |
See accompanying notes which are an integral part of these financial statements.
| RATIONAL SPECIAL SITUATIONS INCOME FUND |
| SCHEDULE OF INVESTMENTS (Continued) |
| December 31, 2023 |
| Principal | | | | | | | Coupon Rate | | | | | |
| Amount ($) | | | | | Spread | | (%) | | Maturity | | Fair Value | |
| | | | | ASSET BACKED SECURITIES — 79.8% (Continued) | | | | | | | | | | |
| | | | | COLLATERALIZED MORTGAGE OBLIGATIONS — 25.6% (Continued) | | | | | | | | | | |
| | 142,561 | | | MortgageIT Mortgage Loan Trust Series 2006-1 1A1(f) | | TSFR1M + 0.574% | | 5.9300 | | 04/25/36 | | $ | 132,381 | |
| | 253,898 | | | MortgageIT Trust Series 2004-1 B2(f) | | TSFR1M + 3.339% | | 8.6950 | | 11/25/34 | | | 245,060 | |
| | 338,798,775 | | | MortgageIT Trust Series 2005-2 (g) | | | | 0.0000 | | 05/25/35 | | | 2,725,000 | |
| | 60,867 | | | MortgageIT Trust Series 2005-2 1B1(f) | | SOFRRATE + 1.539% | | 6.8950 | | 05/25/35 | | | 59,960 | |
| | 11,113,141 | | | New Residential Mortgage Loan Trust Series 2019-5A B4IA(c),(d),(e) | | | | 0.5000 | | 08/25/59 | | | 242,971 | |
| | 15,618,952 | | | New Residential Mortgage Loan Trust Series 2019-5A B5IB(c),(d),(e) | | | | 0.7500 | | 08/25/59 | | | 508,423 | |
| | 184,658 | | | New York Mortgage Trust Series 2006-1 2A3(e) | | | | 4.1970 | | 05/25/36 | | | 154,431 | |
| | 18,696 | | | Nomura Asset Acceptance Corp Alternative Loan Series 2004-AP1 A5(h) | | | | 5.8030 | | 03/25/34 | | | 17,936 | |
| | 100,096 | | | Nomura Asset Acceptance Corp Alternative Loan Series 2004-AR1 5A3(f) | | TSFR1M + 1.134% | | 6.4900 | | 08/25/34 | | | 96,387 | |
| | 6,441 | | | Nomura Asset Acceptance Corp Alternative Loan Series 2004-AP3 A5A(h) | | | | 6.0710 | | 10/25/34 | | | 6,317 | |
| | 1,916,799 | | | Nomura Asset Acceptance Corp Alternative Loan Series 2004-AR2 M2(f) | | TSFR1M + 1.814% | | 7.1700 | | 10/25/34 | | | 1,956,011 | |
| | 446,902 | | | Nomura Asset Acceptance Corp Alternative Loan Series 2006-AF1 1A1B(e) | | | | 1.4290 | | 05/25/36 | | | 85,000 | |
| | 207,231 | | | Nomura Asset Acceptance Corp Alternative Loan Series 2006-AF1 2A(e) | | | | 5.5140 | | 06/25/36 | | | 151,398 | |
| | 95,581 | | | NovaStar Mortgage Funding Trust Series 2006-MTA1 2A1A(f) | | TSFR1M + 0.494% | | 0.5230 | | 09/25/46 | | | 86,328 | |
| | 64,355 | | | Ocwen Residential MBS Corporation Series 1999-R2 B2(c),(e) | | | | 0.6850 | | 06/25/39 | | | 28,104 | |
| | 80,520 | | | Opteum Mortgage Acceptance Corp Asset Backed Series 2005-1 M7(f) | | TSFR1M + 2.139% | | 7.4950 | | 02/25/35 | | | 88,665 | |
| | 233,216 | | | PHHMC Series Trust Series 2006-4 B1(e) | | | | 6.2900 | | 12/18/36 | | | 223,364 | |
| | 69,872 | | | Popular A.B.S, Inc. Series 1998-1 A1(h) | | | | 7.2000 | | 12/25/29 | | | 64,928 | |
| | 77,479 | | | Prime Mortgage Trust Series 2004-1 1A6 | | | | 5.2500 | | 08/25/34 | | | 73,515 | |
| | 2,903 | | | Prime Mortgage Trust Series 2005-1 2A4(c) | | | | 5.5000 | | 09/25/34 | | | 2,891 | |
| | 1,694,692 | | | Prime Mortgage Trust Series 2006-DR1 2A1(c) | | | | 5.5000 | | 05/25/35 | | | 1,456,714 | |
| | 460,944 | | | Prime Mortgage Trust Series 2006-DR1 2A2(c) | | | | 6.0000 | | 05/25/35 | | | 354,639 | |
| | 12,788 | | | Prime Mortgage Trust Series 2005-4 1A2 | | | | 5.0000 | | 10/25/35 | | | 11,897 | |
| | 95,396 | | | Prime Mortgage Trust Series 2005-4 1A5 | | | | 5.2500 | | 05/25/44 | | | 88,799 | |
| | 145,800 | | | RALI Series 2005-QA12 Trust Series QA12 NB2(e) | | | | 5.9390 | | 12/25/35 | | | 137,074 | |
| | 283,601 | | | RALI Series Trust Series 2004-QA4 NB21(e) | | | | 5.1120 | | 09/25/34 | | | 264,290 | |
| | 371,810 | | | RALI Series Trust Series 2004-QA4 NB1(e) | | | | 5.3950 | | 09/25/34 | | | 329,946 | |
| | 404,189 | | | RALI Series Trust Series 2004-QA6 NB2(e) | | | | 4.0340 | | 12/26/34 | | | 368,033 | |
| | 555,903 | | | RALI Series Trust Series 2004-QA6 NB4(e) | | | | 4.7460 | | 12/26/34 | | | 505,905 | |
| | 1,780,750 | | | RALI Series Trust Series 2005-QA2 A1I(e) | | | | 1.4900 | | 02/25/35 | | | 591,461 | |
| | 173,703 | | | RALI Series Trust Series 2005-QA2 NB2(e) | | | | 4.1300 | | 02/25/35 | | | 150,200 | |
See accompanying notes which are an integral part of these financial statements.
| RATIONAL SPECIAL SITUATIONS INCOME FUND |
| SCHEDULE OF INVESTMENTS (Continued) |
| December 31, 2023 |
| Principal | | | | | | | Coupon Rate | | | | | |
| Amount ($) | | | | | Spread | | (%) | | Maturity | | Fair Value | |
| | | | | ASSET BACKED SECURITIES — 79.8% (Continued) | | | | | | | | | | |
| | | | | COLLATERALIZED MORTGAGE OBLIGATIONS — 25.6% (Continued) | | | | | | | | | | |
| | 1,867,405 | | | RALI Series Trust Series 2005-QA2 A1II(e) | | | | 4.1650 | | 02/25/35 | | $ | 1,146,797 | |
| | 186,756 | | | RALI Series Trust Series 2005-QA3 NB4(e) | | | | 0.0000 | | 03/25/35 | | | 48,722 | |
| | 60,927 | | | RALI Series Trust Series 2005-QA3 NB1(e) | | | | 3.6200 | | 03/25/35 | | | 32,470 | |
| | 105,938 | | | RALI Series Trust Series 2005-QA4 A42(e) | | | | 4.3390 | | 04/25/35 | | | 99,757 | |
| | 13,177 | | | RALI Series Trust Series 2005-QA4 A5(e) | | | | 5.3760 | | 04/25/35 | | | 12,992 | |
| | 718,784 | | | RALI Series Trust Series 2005-QA6 NB23(e) | | | | 4.6160 | | 05/25/35 | | | 365,711 | |
| | 65,010 | | | RALI Series Trust Series 2005-QA8 NB2(e) | | | | 4.4310 | | 07/25/35 | | | 58,990 | |
| | 396,208 | | | RALI Series Trust Series 2005-QA8 CB21(e) | | | | 4.9720 | | 07/25/35 | | | 219,781 | |
| | 2,626,788 | | | RALI Series Trust Series 2005-QA9 NB21(e) | | | | 1.6340 | | 08/25/35 | | | 1,016,537 | |
| | 1,409,506 | | | RALI Series Trust Series 2005-QA9 CB3(e) | | | | 4.6930 | | 08/25/35 | | | 1,282,184 | |
| | 4,991,456 | | | RALI Series Trust Series 2005-QA11 3A1(e) | | | | 1.8430 | | 10/25/35 | | | 1,803,447 | |
| | 596,477 | | | RALI Series Trust Series 2005-QA11 6A1(e) | | | | 6.0790 | | 10/25/35 | | | 501,669 | |
| | 1,291,561 | | | RALI Series Trust Series 2005-QA12 CB3(e) | | | | 5.1180 | | 12/25/35 | | | 1,180,416 | |
| | 124,948 | | | RALI Series Trust Series 2006-QA2 3A1(e) | | | | 6.3420 | | 02/25/36 | | | 106,101 | |
| | 7,348,495 | | | RALI Series Trust Series 2006-QS11 2A1 | | | | 1.7020 | | 08/25/36 | | | 2,472,233 | |
| | 55,928 | | | RALI Series Trust Series 2006-QS12 2A11 | | | | 5.0000 | | 09/25/36 | | | 42,166 | |
| | 291,078 | | | RALI Series Trust Series 2007-QS4 1A4 | | | | 6.2500 | | 03/25/37 | | | 220,578 | |
| | 597,401 | | | RALI Series Trust Series 2005-QO4 2A1(f) | | TSFR1M + 0.674% | | 6.0300 | | 12/25/45 | | | 456,035 | |
| | 2,949,446 | | | RALI Series Trust Series 2007-QO5 A(f) | | 12MTA + 3.120% | | 7.3700 | | 08/25/47 | | | 526,700 | |
| | 477,762 | | | RAMP Series Trust Series 2003-SL1 A41 | | | | 8.0000 | | 04/25/31 | | | 480,957 | |
| | 462,485 | | | RAMP Series Trust Series 2005-SL2 A5 | | | | 4.1060 | | 10/25/31 | | | 216,648 | |
| | 730,535 | | | RAMP Series Trust Series 2004-SL1 A8 | | | | 6.5000 | | 11/25/31 | | | 656,784 | |
| | 351,411 | | | RAMP Series Trust Series 2005-SL1 A3 | | | | 0.9720 | | 05/25/32 | | | 46,719 | |
| | 417,289 | | | RAMP Series Trust Series 2005-SL1 A7 | | | | 8.0000 | | 05/25/32 | | | 271,134 | |
| | 253,854 | | | RAMP Series Trust Series 2004-SL4 A5 | | | | 2.5800 | | 07/25/32 | | | 104,377 | |
| | 2,320,022 | | | RBSGC Mortgage Loan Trust Series 2005-A 4A | | | | 6.0000 | | 04/25/35 | | | 2,009,642 | |
| | 497,165 | | | RBSGC Mortgage Loan Trust Series 2007-A 1A1 | | | | 6.0000 | | 01/25/37 | | | 422,994 | |
| | 1,327,605 | | | RBSSP Resecuritization Trust Series 2009-6 8A3(c),(e) | | | | 4.5080 | | 08/26/35 | | | 461,365 | |
| | 79,629 | | | Reperforming Loan REMIC Trust Series 2004-R1 2A(c) | | | | 6.5000 | | 11/25/34 | | | 73,818 | |
| | 479,785 | | | Reperforming Loan REMIC Trust Series 2005-R2 1AS(c),(d),(e) | | | | 0.3910 | | 06/25/35 | | | 20,558 | |
| | 374,910 | | | Reperforming Loan REMIC Trust Series 2006-R2 AF1(c),(f) | | TSFR1M + 0.534% | | 5.8900 | | 07/25/36 | | | 342,694 | |
| | 217,019 | | | Residential Asset Securitization Trust Series 2000-A6 B2 | | | | 8.0000 | | 10/25/30 | | | 150,629 | |
| | 21,778 | | | Residential Asset Securitization Trust Series 2004-A2 1A8 | | | | 5.2500 | | 05/25/34 | | | 20,727 | |
| | 355,160 | | | Residential Asset Securitization Trust Series 2004-A2 2A1(f) | | TSFR1M + 0.664% | | 6.0200 | | 05/25/34 | | | 349,187 | |
See accompanying notes which are an integral part of these financial statements.
| RATIONAL SPECIAL SITUATIONS INCOME FUND |
| SCHEDULE OF INVESTMENTS (Continued) |
| December 31, 2023 |
| Principal | | | | | | | Coupon Rate | | | | | |
| Amount ($) | | | | | Spread | | (%) | | Maturity | | Fair Value | |
| | | | | ASSET BACKED SECURITIES — 79.8% (Continued) | | | | | | | | | | |
| | | | | COLLATERALIZED MORTGAGE OBLIGATIONS — 25.6% (Continued) | | | | | | | | | | |
| | 226,968 | | | Residential Asset Securitization Trust Series 2006-A3CB PO(g) | | | | 0.0000 | | 01/25/46 | | $ | 15,089 | |
| | 192,871 | | | Residential Asset Securitization Trust Series 2006-A3CB AX(d),(e) | | | | 6.0000 | | 01/25/46 | | | 40,548 | |
| | 984,711 | | | RFMSI Series Trust Series 2005-SA1 2A(e) | | | | 3.7020 | | 03/25/35 | | | 864,375 | |
| | 260,813 | | | RFMSI Series Trust Series 2005-SA3 3A(e) | | | | 4.8710 | | 08/25/35 | | | 213,078 | |
| | 714,801 | | | RFMSI Series Trust Series 2005-SA5 2A(e) | | | | 5.0150 | | 11/25/35 | | | 624,650 | |
| | 107,307 | | | RFMSI Series Trust Series 2006-SA1 2A1(e) | | | | 5.8330 | | 02/25/36 | | | 96,827 | |
| | 212,236 | | | RFMSI Series Trust Series 2006-SA3 3A1(e) | | | | 5.4290 | | 09/25/36 | | | 186,474 | |
| | 120,656 | | | RFMSI Series Trust Series 2006-SA4 2A1(e) | | | | 5.5550 | | 11/25/36 | | | 104,774 | |
| | 244,529 | | | Sequoia Mortgage Trust Series 4 B(f) | | TSFR1M + 1.364% | | 6.6990 | | 04/22/25 | | | 166,594 | |
| | 47,764 | | | Sequoia Mortgage Trust Series 6 B2(f) | | TSFR1M + 0.814% | | 6.5200 | | 04/19/27 | | | 43,761 | |
| | 27,327 | | | Sequoia Mortgage Trust Series 2003-4 2B2(e) | | | | 6.7340 | | 07/20/33 | | | 23,235 | |
| | 41,125 | | | Sequoia Mortgage Trust Series 2003-4 2B3(e) | | | | 6.7340 | | 07/20/33 | | | 34,595 | |
| | 19,438 | | | Sequoia Mortgage Trust Series 2003-4 2B5(e) | | | | 6.7340 | | 07/20/33 | | | 15,336 | |
| | 147,529 | | | Sequoia Mortgage Trust Series 2004-1 B1(f) | | TSFR1M + 0.939% | | 6.2970 | | 02/20/34 | | | 98,210 | |
| | 105 | | | Sequoia Mortgage Trust Series 2004-5 B1(f) | | TSFR1M + 0.834% | | 6.1920 | | 06/20/34 | | | 92 | |
| | 9 | | | Sequoia Mortgage Trust Series 2004-6 B1(f) | | TSFR1M + 0.864% | | 6.2220 | | 07/20/34 | | | 7 | |
| | 32,434 | | | Sequoia Mortgage Trust Series 2013-2 B3(e) | | | | 3.6330 | | 02/25/43 | | | 30,742 | |
| | 157,882 | | | Sequoia Mortgage Trust Series 2007-1 3A1(e) | | | | 5.1090 | | 01/20/47 | | | 118,610 | |
| | 14,750 | | | Shellpoint Asset Funding Trust Series 2013-1 B2(c),(e) | | | | 3.8570 | | 07/25/43 | | | 14,496 | |
| | 39,976 | | | Sofi Mortgage Trust Series 2016-1A 1AMF(c),(e) | | | | 3.0000 | | 11/25/46 | | | 34,585 | |
| | 46,567 | | | Structured Adjustable Rate Mortgage Loan Trust Series 2004-2 1A1(e) | | | | 5.5140 | | 03/25/34 | | | 42,027 | |
| | 769,672 | | | Structured Adjustable Rate Mortgage Loan Trust Series 2005-14 A1(f) | | TSFR1M + 0.424% | | 5.7800 | | 07/25/35 | | | 462,932 | |
| | 199,790 | | | Structured Adjustable Rate Mortgage Loan Trust Series 2007-3 2A1(e) | | | | 3.9140 | | 04/25/47 | | | 181,904 | |
| | 1,675,193 | | | Structured Asset Investment Loan Trust Series 2003-BC10 M3(f) | | TSFR1M + 3.414% | | 8.7700 | | 10/25/33 | | | 1,763,589 | |
| | 198,369 | | | Structured Asset Mortgage Investments II Trust Series 2004-AR5 2A3(e) | | | | 4.8590 | | 10/19/34 | | | 174,571 | |
| | 193,200 | | | Structured Asset Mortgage Investments II Trust Series 2004-AR6 A1B(f) | | TSFR1M + 0.514% | | 5.8700 | | 02/19/35 | | | 179,572 | |
| | 1,169,222 | | | Structured Asset Mortgage Investments II Trust Series 2006-AR3 21A1(f) | | TSFR1M + 0.514% | | 5.8700 | | 02/25/36 | | | 922,293 | |
| | 341,683 | | | Structured Asset Mortgage Investments II Trust Series 2006-AR1 3A1(f) | | TSFR1M + 0.574% | | 5.9300 | | 02/25/36 | | | 265,177 | |
| | 69,820 | | | Structured Asset Mortgage Investments II Trust Series 2006-AR2 A1(f) | | TSFR1M + 0.574% | | 5.9300 | | 02/25/36 | | | 58,899 | |
| | 2,181,314 | | | Structured Asset Mortgage Investments II Trust Series 2006-AR1 2A2(f) | | TSFR1M + 0.734% | | 6.0900 | | 02/25/36 | | | 2,083,470 | |
| | 4,518,604 | | | Structured Asset Mortgage Investments II Trust Series 2006-AR3 24A1(e) | | | | 1.2140 | | 05/25/36 | | | 1,119,873 | |
| | 134,332 | | | Structured Asset Mortgage Investments II Trust Series 2006-AR3 22A1(e) | | | | 4.2450 | | 05/25/36 | | | 67,544 | |
| | 58,690 | | | Structured Asset Mortgage Investments II Trust Series 2007-AR2 1A1(f) | | TSFR1M + 0.414% | | 5.7700 | | 02/25/37 | | | 53,390 | |
See accompanying notes which are an integral part of these financial statements.
| RATIONAL SPECIAL SITUATIONS INCOME FUND |
| SCHEDULE OF INVESTMENTS (Continued) |
| December 31, 2023 |
| Principal | | | | | | | Coupon Rate | | | | | |
| Amount ($) | | | | | Spread | | (%) | | Maturity | | Fair Value | |
| | | | | ASSET BACKED SECURITIES — 79.8% (Continued) | | | | | | | | | | |
| | | | | COLLATERALIZED MORTGAGE OBLIGATIONS — 25.6% (Continued) | | | | | | | | | | |
| | 695,269 | | | Structured Asset Mortgage Investments II Trust Series 2007-AR2 2A1(f) | | TSFR1M + 0.374% | | 5.7200 | | 03/25/37 | | $ | 229,490 | |
| | 1,334,561 | | | Structured Asset Mortgage Investments II Trust Series 2006-AR5 3A1(f) | | TSFR1M + 0.534% | | 5.8800 | | 05/25/46 | | | 514,037 | |
| | 734,850 | | | Structured Asset Mortgage Investments II Trust Series 2006-AR5 2A1(f) | | TSFR1M + 0.534% | | 5.8900 | | 05/25/46 | | | 507,957 | |
| | 336,486 | | | Structured Asset Mortgage Investments Trust Series 2002-AR5 A2(f) | | TSFR1M + 1.314% | | 6.6700 | | 05/19/33 | | | 298,889 | |
| | 470,369 | | | Structured Asset Sec Corp Mort Pass Thru Certs Series 1998-6 B2 | | | | 6.5000 | | 07/25/28 | | | 300,436 | |
| | 1,633,631 | | | Structured Asset Sec Corp Mort Pass thru Certs Series 2003-40A B1(e) | | | | 6.5080 | | 01/25/34 | | | 1,229,556 | |
| | 10,373 | | | Structured Asset Sec Mortgage Pass-Through Series 2002-21A B1II(e) | | | | 7.4610 | | 11/25/32 | | | 10,337 | |
| | 104,372 | | | Structured Asset Securities Corp Assistance Loan Series AL2 B1(c) | | | | 3.3560 | | 01/25/31 | | | 74,014 | |
| | 1,156,672 | | | Structured Asset Securities Corp Mortgage Series 2003-31A B1(e) | | | | 6.7470 | | 10/25/33 | | | 1,014,116 | |
| | 79,015 | | | Structured Asset Securities Corp Mortgage Series 2003-39EX M3(h) | | | | 3.2830 | | 08/25/33 | | | 79,263 | |
| | 454,603 | | | Structured Asset Securities Corp Mortgage Series 2004-11XS 1A5A(h) | | | | 4.8630 | | 06/25/34 | | | 436,662 | |
| | 508,696 | | | TBW Mortgage-Backed Pass-Through Certificates Series 2006-1 2A1 | | | | 6.5000 | | 04/25/36 | | | 297,432 | |
| | 483,804 | | | TBW Mortgage-Backed Trust Series 2006-2 1A3 | | | | 1.6970 | | 07/25/36 | | | 182,588 | |
| | 1,221,136 | | | TBW Mortgage-Backed Trust Series 2006-6 A2B(h) | | | | 1.0620 | | 01/25/37 | | | 280,818 | |
| | 932,715 | | | Terwin Mortgage Trust Series 2006-9HGA A3(c),(f) | | TSFR1M + 0.674% | | 4.6100 | | 10/25/37 | | | 296,297 | |
| | 295,408 | | | Terwin Mortgage Trust Series 2007-6ALT A2(c),(f) | | TSFR1M + 0.714% | | 6.0700 | | 08/25/38 | | | 216,277 | |
| | 56,629 | | | Thornburg Mortgage Securities Trust Series 2005-1 A5(e) | | | | 4.2290 | | 04/25/45 | | | 53,626 | |
| | 124,734 | | | Thornburg Mortgage Securities Trust Series 2007-3 2A1(f) | | TSFR12M + 1.965% | | 7.2000 | | 06/25/47 | | | 117,455 | |
| | 5,673,987 | | | Voyager CBASS Delaware Trust Series 2009-1 KAB1(c),(e) | | | | 0.0630 | | 02/26/37 | | | 56,262 | |
| | 15,402,448 | | | Voyager CBASS Delaware Trust Series 2009-1 KAA3(c),(e),(j) | | | | 0.2370 | | 02/26/37 | | | 162,667 | |
| | 670,565 | | | Voyager CNTYW Delaware Trust Series 2009-1 3QB1(c),(e) | | | | 5.7260 | | 03/16/30 | | | 635,792 | |
| | 1,380,130 | | | Voyager CNTYW Delaware Trust Series 2009-1 3MY5(c),(e) | | | | 5.7760 | | 12/16/33 | | | 1,285,469 | |
| | 889,680 | | | Voyager CNTYW Delaware Trust Series 2009-1 5AU0(c),(e) | | | | 5.7160 | | 02/16/36 | | | 819,936 | |
| | 2,837,795 | | | Voyager CNTYW Delaware Trust Series 2009-1 5AT3(c),(e) | | | | 5.7160 | | 02/16/36 | | | 2,594,388 | |
| | 7,226,960 | | | Voyager CNTYW Delaware Trust Series 2009-1 5DS2(c),(e) | | | | 5.6760 | | 05/16/36 | | | 6,740,029 | |
| | 2,420,488 | | | Voyager OPTONE Delaware Trust Series 2009-1 SAA7(c),(d),(e) | | | | 1.1380 | | 02/25/38 | | | 558,871 | |
| | 1,005,528 | | | Wachovia Mortgage Loan Trust, LLC Series 2005-A 2A1(e) | | | | 3.9010 | | 08/20/35 | | | 899,190 | |
| | 392,031 | | | Wachovia Mortgage Loan Trust, LLC Series 2005-A 1A1(e) | | | | 5.3730 | | 08/20/35 | | | 372,987 | |
| | 45,314 | | | Wachovia Mortgage Loan Trust, LLC Series 2006-A 1A1(e) | | | | 2.8580 | | 05/20/36 | | | 41,408 | |
| | 283,097 | | | Wachovia Mortgage Loan Trust, LLC Series 2007-A 4A1(e) | | | | 5.0640 | | 03/20/37 | | | 253,820 | |
| | 109,830 | | | WaMu Mortgage Backed Pass Through Certificates Series 2001-AR5 B1(e) | | | | 4.3320 | | 12/19/39 | | | 101,054 | |
| | 37,457 | | | WaMu Mortgage Backed Pass Through Certificates Series 2001-AR5 B4(c),(e) | | | | 4.3320 | | 12/19/39 | | | 33,159 | |
| | 28,104 | | | WaMu Mortgage Backed Pass Through Certificates Series 2001-AR5 B5(c),(e) | | | | 4.3320 | | 12/19/39 | | | 24,513 | |
See accompanying notes which are an integral part of these financial statements.
| RATIONAL SPECIAL SITUATIONS INCOME FUND |
| SCHEDULE OF INVESTMENTS (Continued) |
| December 31, 2023 |
| Principal | | | | | | | Coupon Rate | | | | | |
| Amount ($) | | | | | Spread | | (%) | | Maturity | | Fair Value | |
| | | | | ASSET BACKED SECURITIES — 79.8% (Continued) | | | | | | | | | | |
| | | | | COLLATERALIZED MORTGAGE OBLIGATIONS — 25.6% (Continued) | | | | | | | | | | |
| | 22,552 | | | WaMu Mortgage Backed Pass Through Certificates Series 2001-AR5 B6(c),(e) | | | | 4.3320 | | 12/19/39 | | $ | 16,889 | |
| | 99,404 | | | WaMu Mortgage Pass-Through Certificates Series 2002-AR13 M1(e) | | | | 6.4950 | | 10/25/32 | | | 92,297 | |
| | 214,231 | | | WaMu Mortgage Pass-Through Certificates Series 2002-S8 1A7 | | | | 5.7500 | | 01/25/33 | | | 202,333 | |
| | 399,278 | | | WaMu Mortgage Pass-Through Certificates Series 2002-AR19 B1(e) | | | | 4.2420 | | 02/25/33 | | | 357,640 | |
| | 972,104 | | | WaMu Mortgage Pass-Through Certificates Series 2003-S4 CB2(e) | | | | 4.6880 | | 06/25/33 | | | 470,042 | |
| | 27,273 | | | WaMu Mortgage Pass-Through Certificates Series 2003-AR5 A7(e) | | | | 4.8220 | | 06/25/33 | | | 27,029 | |
| | 138,146 | | | WaMu Mortgage Pass-Through Certificates Series 2003-AR6 A1(e) | | | | 5.3460 | | 06/25/33 | | | 129,593 | |
| | 83,940 | | | WaMu Mortgage Pass-Through Certificates Series 2003-AR8 A(e) | | | | 5.5950 | | 08/25/33 | | | 79,633 | |
| | 142,676 | | | WaMu Mortgage Pass-Through Certificates Series 2003-AR9 1B2(e) | | | | 5.6680 | | 09/25/33 | | | 111,501 | |
| | 725,090 | | | WaMu Mortgage Pass-Through Certificates Series 2003-S13 CB1(e) | | | | 5.8910 | | 01/25/34 | | | 669,151 | |
| | 69,258 | | | WaMu Mortgage Pass-Through Certificates Series 2004-S2 2A4 | | | | 5.5000 | | 06/25/34 | | | 67,977 | |
| | 8,148 | | | WaMu Mortgage Pass-Through Certificates Series 2004-CB2 2A | | | | 5.5000 | | 07/25/34 | | | 7,939 | |
| | 73,804 | | | WaMu Mortgage Pass-Through Certificates Series AR16 2A2(e) | | | | 3.8660 | | 12/25/35 | | | 65,237 | |
| | 48,807 | | | WaMu Mortgage Pass-Through Certificates Series 2006-AR12 3A1(e) | | | | 3.9720 | | 10/25/36 | | | 42,219 | |
| | 212,304 | | | WaMu Mortgage Pass-Through Certificates Series 2001-AR3 B1(e) | | | | 4.3270 | | 11/25/41 | | | 176,168 | |
| | 80,030 | | | WaMu Mortgage Pass-Through Certificates Series 2002-AR6 B2(f) | | 12MTA + 1.400% | | 6.3290 | | 06/25/42 | | | 70,020 | |
| | 159,700 | | | WaMu Mortgage Pass-Through Certificates Series 2002-AR6 B1(f) | | 12MTA + 1.400% | | 6.3290 | | 06/25/42 | | | 140,966 | |
| | 82,548 | | | WaMu Mortgage Pass-Through Certificates Series 2002-AR6 B3(f) | | 12MTA + 1.400% | | 6.3290 | | 06/25/42 | | | 70,971 | |
| | 13,375 | | | WaMu Mortgage Pass-Through Certificates Series 2002-AR6 B4(c),(f) | | 12MTA + 1.400% | | 6.3290 | | 06/25/42 | | | 9,163 | |
| | 13,177 | | | WaMu Mortgage Pass-Through Certificates Series 2002-AR9 1B3(f) | | 12MTA + 1.400% | | 6.3290 | | 08/25/42 | | | 7,717 | |
| | 54,016 | | | WaMu Mortgage Pass-Through Certificates Series 2002-AR9 1B1(f) | | 12MTA + 1.400% | | 6.3290 | | 08/25/42 | | | 49,919 | |
| | 9,188 | | | WaMu Pass Through Certificates Series 2002-AR12 B1(e) | | | | 6.3250 | | 10/25/32 | | | 8,448 | |
| | 5,772 | | | WaMu Pass Through Certificates Series 2002-AR12 B2(e) | | | | 6.3250 | | 10/25/32 | | | 5,142 | |
| | 1,291,710 | | | Washington Mutual Mortgage Pass-Through Series 2005-1 7A1 | | | | 5.5000 | | 03/25/35 | | | 1,049,213 | |
| | 74,193 | | | Washington Mutual Mortgage Pass-Through Series 2005-1 1A1 | | | | 5.5000 | | 03/25/35 | | | 68,057 | |
| | 1,813,089 | | | Washington Mutual Mortgage Pass-Through Series 2006-AR1 A1A(f) | | TSFR1M + 0.614% | | 5.9700 | | 02/25/36 | | | 1,358,537 | |
| | 309,197 | | | Washington Mutual Mortgage Pass-Through Series 2006-2 3CB | | | | 6.0000 | | 03/25/36 | | | 233,043 | |
| | 253,213 | | | Washington Mutual Mortgage Pass-Through Series 2007-3 A2 | | | | 6.0000 | | 04/25/37 | | | 212,680 | |
| | 52,194 | | | Washington Mutual Mortgage Pass-Through Series 2006-AR2 A1A(f) | | 12MTA + 0.940% | | 5.8690 | | 04/25/46 | | | 40,352 | |
| | 402,454 | | | Washington Mutual Mortgage Pass-Through Series 2006-AR5 3A(f) | | 12MTA + 0.940% | | 5.8690 | | 07/25/46 | | | 243,250 | |
| | 827,826 | | | Washington Mutual Mortgage Pass-Through Series 2006-AR6 2A(f) | | 12MTA + 0.960% | | 5.8890 | | 08/25/46 | | | 450,795 | |
| | 150,944 | | | Washington Mutual Mortgage Pass-Through Series 2006-AR8 2A(f) | | 12MTA + 0.850% | | 5.7790 | | 10/25/46 | | | 119,076 | |
| | 25,500 | | | Washington Mutual MSC Mortgage Pass-Through Series 2002-S4 B4(c) | | | | 6.5000 | | 10/19/29 | | | 23,867 | |
| | 25,500 | | | Washington Mutual MSC Mortgage Pass-Through Series 2002-S4 B5(c) | | | | 6.5000 | | 10/19/29 | | | 23,881 | |
See accompanying notes which are an integral part of these financial statements.
| RATIONAL SPECIAL SITUATIONS INCOME FUND |
| SCHEDULE OF INVESTMENTS (Continued) |
| December 31, 2023 |
| Principal | | | | | | | Coupon Rate | | | | | |
| Amount ($) | | | | | Spread | | (%) | | Maturity | | Fair Value | |
| | | | | ASSET BACKED SECURITIES — 79.8% (Continued) | | | | | | | | | | |
| | | | | COLLATERALIZED MORTGAGE OBLIGATIONS — 25.6% (Continued) | | | | | | | | | | |
| | 330,550 | | | Washington Mutual MSC Mortgage Pass-Through Series 2003-MS2 CB4(c),(e) | | | | 0.0000 | | 02/25/33 | | $ | 36,323 | |
| | 36,083 | | | Washington Mutual MSC Mortgage Pass-Through Series 2003-AR1 2A(e) | | | | 3.9890 | | 02/25/33 | | | 33,640 | |
| | 161,251 | | | Washington Mutual MSC Mortgage Pass-Through Series 2003-MS3 CB3(e) | | | | 5.7500 | | 03/25/33 | | | 82,972 | |
| | 37,086 | | | Washington Mutual MSC Mortgage Pass-Through Series 2003-MS7 B1 | | | | 5.7500 | | 03/25/33 | | | 35,422 | |
| | 28,101 | | | Washington Mutual MSC Mortgage Pass-Through Series 2003-MS9 2A | | | | 7.5000 | | 04/25/33 | | | 28,239 | |
| | 604,037 | | | Washington Mutual MSC Mortgage Pass-Through Series 2003-AR2 M(e) | | | | 4.3270 | | 05/25/33 | | | 572,868 | |
| | 634,613 | | | Washington Mutual MSC Mortgage Pass-Through Series 2004-RA2 CB1(e) | | | | 7.0000 | | 07/25/33 | | | 512,878 | |
| | 36,288 | | | Wells Fargo Mortgage Backed Securities Series 2003-I B2(e) | | | | 6.0730 | | 09/25/33 | | | 28,425 | |
| | 23,042 | | | Wells Fargo Mortgage Backed Securities Series 2004-K 1A2(e) | | | | 5.6150 | | 07/25/34 | | | 23,219 | |
| | 38,230 | | | Wells Fargo Mortgage Backed Securities Series 2004-K 1A3(e) | | | | 5.6150 | | 07/25/34 | | | 38,513 | |
| | | | | | | | | | | | | | 199,323,653 | |
| | | | | CREDIT CARD — 0.1% | | | | | | | | | | |
| | 675,000 | | | Genesis Private Label Amortizing Trust Series 2020-1 E(c) | | | | 9.7600 | | 07/20/30 | | | 663,906 | |
| | | | | | | | | | | | | | | |
| | | | | HOME EQUITY — 11.2% | | | | | | | | | | |
| | 1,300,807 | | | ABFC Trust Series 2002-WF2 CE (g) | | | | 0.0000 | | 11/25/29 | | | 1,110,776 | |
| | 197,623 | | | ABFS Mortgage Loan Trust Series 2000-1 A1(h) | | | | 8.4250 | | 07/15/31 | | | 167,666 | |
| | 124,488 | | | ABFS Mortgage Loan Trust Series 2000-3 A(h) | | | | 8.1100 | | 09/15/31 | | | 106,571 | |
| | 2,450,194 | | | ABFS Mortgage Loan Trust Series 2002-1 A5(h) | | | | 7.0100 | | 12/15/32 | | | 2,054,873 | |
| | 762,227 | | | ABFS Mortgage Loan Trust Series 2003-1 M(f) | | TSFR1M + 2.364% | | 7.7260 | | 08/15/33 | | | 742,785 | |
| | 892,823 | | | Accredited Mortgage Loan Trust Series 2005-1 M5(f) | | TSFR1M + 3.414% | | 5.9510 | | 04/25/35 | | | 911,214 | |
| | 612,411 | | | ACE Securities Corp Home Equity Loan Trust Series 2002-HE2 M1(f) | | TSFR1M + 1.389% | | 6.7450 | | 08/25/32 | | | 690,458 | |
| | 59,766 | | | ACE Securities Corp Home Equity Loan Trust Series 2003-OP1 M2(f) | | TSFR1M + 2.364% | | 7.7200 | | 12/25/33 | | | 61,239 | |
| | 1,145,927 | | | ACE Securities Corp Home Equity Loan Trust Series HE1 M2(f) | | TSFR1M + 1.764% | | 7.1200 | | 03/25/34 | | | 1,158,175 | |
| | 64,544 | | | ACE Securities Corp Home Equity Loan Trust Series RM1 M1(f) | | TSFR1M + 1.164% | | 6.5200 | | 07/25/34 | | | 61,360 | |
| | 528,589 | | | ACE Securities Corp Home Equity Loan Trust Series 2004-RM1 B1(c),(f) | | TSFR1M + 5.364% | | 10.7200 | | 07/25/34 | | | 394,414 | |
| | 1,531,310 | | | ACE Securities Corp Home Equity Loan Trust Series 2005-WF1 M10(f) | | TSFR1M + 3.614% | | 8.9700 | | 05/25/35 | | | 1,625,108 | |
| | 8,205 | | | ACE Securities Corp Home Equity Loan Trust Series 2007-WM1 A2A(f) | | TSFR1M + 0.184% | | 5.5300 | | 11/25/36 | | | 3,293 | |
| | 210,087 | | | ACE Securities Corp Home Equity Loan Trust Series 2007-WM2 A2B(f) | | TSFR1M + 0.294% | | 5.6400 | | 02/25/37 | | | 87,149 | |
| | 31,812 | | | ACE Securities Corp Home Equity Loan Trust Series 2005-SD1 M2(f) | | TSFR1M + 1.989% | | 7.3450 | | 11/25/50 | | | 33,997 | |
| | 3,011,999 | | | ACE Securities Corp Home Equity Loan Trust Series Series HE1 CE (g) | | | | 0.0000 | | 11/20/31 | | | 2,450,000 | |
| | 65,055 | | | ACE Securities Corp Home Equity Loan Trust Series Series HE2 M3(f) | | TSFR1M + 3.339% | | 8.6950 | | 08/25/32 | | | 78,335 | |
See accompanying notes which are an integral part of these financial statements.
| RATIONAL SPECIAL SITUATIONS INCOME FUND |
| SCHEDULE OF INVESTMENTS (Continued) |
| December 31, 2023 |
| Principal | | | | | | | Coupon Rate | | | | | |
| Amount ($) | | | | | Spread | | (%) | | Maturity | | Fair Value | |
| | | | | ASSET BACKED SECURITIES — 79.8% (Continued) | | | | | | | | | | |
| | | | | HOME EQUITY — 11.2% (Continued) | | | | | | | | | | |
| | 275,031 | | | ACE Securities Corp Home Equity Loan Trust Series TC1 M2(f) | | TSFR1M + 3.039% | | 8.3950 | | 06/25/33 | | $ | 258,323 | |
| | 370,110 | | | Aegis Asset Backed Securities Trust Mortgage Series 2004-3 B2(f) | | TSFR1M + 3.264% | | 8.6200 | | 09/25/34 | | | 302,197 | |
| | 482,688 | | | Aegis Asset Backed Securities Trust Mortgage Series 2004-4 M3(f) | | TSFR1M + 2.139% | | 7.4950 | | 10/25/34 | | | 484,748 | |
| | 32,230 | | | AFC Home Equity Loan Trust Series 1998-3 1A2(f) | | TSFR1M + 0.834% | | 6.1770 | | 09/22/28 | | | 31,798 | |
| | 2,451,173 | | | AFC Trust Series 1999-3 2A(f) | | TSFR1M + 0.904% | | 6.2600 | | 09/28/29 | | | 1,898,131 | |
| | 72,826 | | | Ameriquest Mort Sec Inc Asset Bckd Ps Thru Cert Series AR1 M1(f) | | TSFR1M + 1.179% | | 3.7310 | | 09/25/32 | | | 77,532 | |
| | 2,868,793 | | | Ameriquest Mort Sec Inc Asset Bk Pass Thru Cert Series 2002-C M1(f) | | TSFR1M + 3.489% | | 8.8450 | | 11/25/32 | | | 2,843,405 | |
| | 161,625 | | | Ameriquest Mortgage Securities Asset-Backed Series 2002-3 M3(f) | | TSFR1M + 2.964% | | 8.3200 | | 08/25/32 | | | 162,060 | |
| | 146,081 | | | Ameriquest Mortgage Securities Asset-Backed Series 2003-AR1 M3(f) | | TSFR1M + 4.614% | | 3.9040 | | 01/25/33 | | | 141,300 | |
| | 323,608 | | | Ameriquest Mortgage Securities Inc Asset-Backed Series 2002-D M1(f) | | TSFR1M + 3.864% | | 3.4280 | | 02/25/33 | | | 301,284 | |
| | 589,587 | | | Amresco Residential Securities Corp Mort Loan Series 1999-1 M1(f) | | TSFR1M + 0.864% | | 6.7200 | | 11/25/29 | | | 549,724 | |
| | 889,697 | | | Argent Securities Inc Asset-Backed Pass-Through Series 2003-W3 M5(f) | | TSFR1M + 5.739% | | 4.2640 | | 09/25/33 | | | 758,022 | |
| | 1,428,307 | | | Asset Backed Securities Corp Home Equity Loan Series 2003-HE1 M3(f) | | TSFR1M + 5.364% | | 10.7260 | | 01/15/33 | | | 1,337,251 | |
| | 6,982 | | | Asset Backed Securities Corp Home Equity Loan Series 2007-HE2 A2(f) | | TSFR1M + 0.194% | | 5.5500 | | 05/25/37 | | | 4,745 | |
| | 418,002 | | | Bayview Financial Asset Trust Series 2007-SR1A M1(c),(f) | | TSFR1M + 0.914% | | 6.2700 | | 03/25/37 | | | 412,715 | |
| | 161,641 | | | Bayview Financial Asset Trust Series 2007-SR1A M2(c),(f) | | TSFR1M + 1.014% | | 6.3700 | | 03/25/37 | | | 159,440 | |
| | 144,139 | | | Bayview Financial Asset Trust Series 2007-SR1A M3(c),(f) | | TSFR1M + 1.264% | | 6.6200 | | 03/25/37 | | | 143,560 | |
| | 2,926,820 | | | Bayview Financial Mortgage Pass-Through Trust Series 2005-B B2(f) | | TSFR1M + 4.239% | | 9.5960 | | 04/28/39 | | | 2,944,543 | |
| | 23,193 | | | Bayview Financial Mortgage Pass-Through Trust Series 2004-D B1(f) | | TSFR1M + 2.964% | | 8.3200 | | 08/28/44 | | | 23,251 | |
| | 9,082,000 | | | Bear Stearns Asset Backed Securities I Trust Series 2004-BO1 M9A(f) | | TSFR1M + 6.114% | | 11.4700 | | 10/25/34 | | | 8,916,764 | |
| | 148,848 | | | Bear Stearns Asset Backed Securities I Trust Series 2004-HE10 M6(f) | | TSFR1M + 4.764% | | 6.0510 | | 12/25/34 | | | 172,083 | |
| | 674,813 | | | Bear Stearns Asset Backed Securities I Trust Series 2005-TC1 M6(f) | | TSFR1M + 2.664% | | 5.3560 | | 05/25/35 | | | 677,085 | |
| | 1,006,367 | | | Bear Stearns Asset Backed Securities I Trust Series TC1 M7(f) | | TSFR1M + 4.614% | | 5.3560 | | 05/25/35 | | | 1,057,354 | |
| | 3,547,332 | | | Bear Stearns Asset Backed Securities I Trust Series 2005-TC2 M8(c),(f) | | TSFR1M + 4.614% | | 5.3600 | | 08/25/35 | | | 3,644,480 | |
| | 321,551 | | | Bear Stearns Asset Backed Securities I Trust Series 2005-HE11 M3(f) | | TSFR1M + 0.834% | | 5.8360 | | 11/25/35 | | | 319,373 | |
| | 184,034 | | | Bear Stearns Asset Backed Securities I Trust Series 2006-EC2(f) | | TSFR1M + 0.744% | | 6.1000 | | 02/25/36 | | | 183,393 | |
| | 279,710 | | | Bear Stearns Asset Backed Securities I Trust Series 2007-HE1 2M1(f) | | TSFR1M + 0.384% | | 5.7400 | | 01/25/37 | | | 963,575 | |
| | 276,824 | | | Bear Stearns Second Lien Trust Series 2007-1 1A(f) | | TSFR1M + 0.304% | | 5.6600 | | 01/25/37 | | | 267,671 | |
| | 17,286 | | | Bear Stearns Second Lien Trust Series 2007-1 3A(f) | | TSFR1M + 0.554% | | 5.9100 | | 08/25/37 | | | 16,426 | |
| | 285,415 | | | Bond Securitization Trust Series 2003-1 X(e) | | | | 0.0000 | | 10/25/34 | | | 242,602 | |
| | 121,389 | | | Centex Home Equity Loan Trust Series 2004-C M2(f) | | TSFR1M + 0.909% | | 4.6810 | | 06/25/34 | | | 115,717 | |
| | 332,914 | | | Centex Home Equity Loan Trust Series 2004-D MF2(h) | | | | 6.0600 | | 09/25/34 | | | 327,852 | |
| | 559,421 | | | Citigroup Mortgage Loan Trust Series 2007-OPX1 A5B(h) | | | | 5.8600 | | 01/25/37 | | | 165,876 | |
| | 3,301,000 | | | Citigroup Mortgage Loan Trust, Inc. Series 2003-HE3 M4(f) | | TSFR1M + 4.614% | | 9.9700 | | 12/25/33 | | | 3,500,133 | |
See accompanying notes which are an integral part of these financial statements.
| RATIONAL SPECIAL SITUATIONS INCOME FUND |
| SCHEDULE OF INVESTMENTS (Continued) |
| December 31, 2023 |
| Principal | | | | | | | Coupon Rate | | | | | |
| Amount ($) | | | | | Spread | | (%) | | Maturity | | Fair Value | |
| | | | | ASSET BACKED SECURITIES — 79.8% (Continued) | | | | | | | | | | |
| | | | | HOME EQUITY — 11.2% (Continued) | | | | | | | | | | |
| | 77,812 | | | Contimortgage Home Equity Loan Trust Series 1996-4 A10(f) | | TSFR1M + 0.594% | | 5.9560 | | 01/15/28 | | $ | 63,505 | |
| | 38,953 | | | Countrywide Asset-Backed Certificates Series 2004-S1 M1(h) | | | | 5.2520 | | 02/25/35 | | | 38,366 | |
| | 23,478 | | | Countrywide Home Equity Loan Trust Series 2006-HW 2A1A(f) | | TSFR1M + 0.264% | | 5.6260 | | 11/15/36 | | | 21,563 | |
| | 513,143 | | | Countrywide Home Equity Loan Trust Series 2006-HW 2A1B(f) | | TSFR1M + 0.264% | | 5.6260 | | 11/15/36 | | | 474,886 | |
| | 647,652 | | | Credit Suisse First Boston Mortgage Securities Series 2002-HE1 A2(f) | | TSFR1M + 0.854% | | 4.4530 | | 08/25/32 | | | 611,166 | |
| | 578,775 | | | Credit Suisse First Boston Mortgage Securities Series 2004-FRE1 B3(f) | | TSFR1M + 3.364% | | 4.1930 | | 04/25/34 | | | 524,577 | |
| | 58,032 | | | CWABS Revolving Home Equity Loan Trust Series R 2A(f) | | TSFR1M + 0.364% | | 5.7260 | | 03/15/30 | | | 55,042 | |
| | 52,615 | | | CWABS Revolving Home Equity Loan Trust Series 2004-O 2A(f) | | TSFR1M + 0.394% | | 5.7560 | | 02/15/34 | | | 51,106 | |
| | 178,933 | | | CWHEQ Home Equity Loan Trust Series 2006-S6 A5(e) | | | | 5.9620 | | 03/25/34 | | | 170,273 | |
| | 1,459,763 | | | CWHEQ Home Equity Loan Trust Series 2006-S5 A5 | | | | 6.1550 | | 06/25/35 | | | 1,756,155 | |
| | 198,614 | | | CWHEQ Home Equity Loan Trust Series 2006-S7 A5(e) | | | | 5.9450 | | 11/25/35 | | | 196,206 | |
| | 36,792 | | | CWHEQ Revolving Home Equity Loan Trust Series H 2A(f) | | TSFR1M + 0.354% | | 5.7160 | | 12/15/35 | | | 36,615 | |
| | 294,943 | | | FirstCity Capital Home Equity Loan Trust Series 1998-2 A1(c) | | | | 6.9900 | | 01/25/29 | | | 289,615 | |
| | 192,024 | | | FirstCity Capital Home Equity Loan Trust Series 1998-2 A3(c),(f) | | TSFR1M + 1.714% | | 7.0700 | | 01/25/29 | | | 189,282 | |
| | 237,551 | | | Fremont Home Loan Trust Series 1999-3 A1(f) | | TSFR1M + 0.824% | | 6.1800 | | 12/25/29 | | | 226,357 | |
| | 229,791 | | | Fremont Home Loan Trust Series 1999-3 A2(f) | | TSFR1M + 0.904% | | 6.2600 | | 12/25/29 | | | 217,242 | |
| | 85,321 | | | GMACM Home Equity Loan Trust Series 2004-HE1 VPRN(c),(f) | | TSFR1M + 0.614% | | 5.9700 | | 06/25/34 | | | 82,975 | |
| | 43,588 | | | GMACM Home Equity Loan Trust Series 2004-HE1 A3(f) | | TSFR1M + 0.614% | | 5.9700 | | 06/25/34 | | | 42,389 | |
| | 94,364 | | | GMACM Home Equity Loan Trust Series 2004-HE3 A2VN(c),(f) | | TSFR1M + 0.614% | | 5.9700 | | 10/25/34 | | | 93,893 | |
| | 11,550 | | | GMACM Home Equity Loan Trust Series 2005-HE1 A1VN(c),(f) | | TSFR1M + 0.614% | | 5.9700 | | 08/25/35 | | | 6,682 | |
| | 957,238 | | | GMACM Home Equity Loan Trust Series 2007-HE2 A1(f) | | SOFRRATE + 0.254% | | 5.6100 | | 12/25/37 | | | 939,091 | |
| | 726,361 | | | GMACM Home Equity Loan Trust Series 2007-HE2 A4(h) | | | | 7.4240 | | 12/25/37 | | | 745,948 | |
| | 519,439 | | | GMACM Mortgage Loan Trust Series 2004-GH1 B(h) | | | | 5.5000 | | 07/25/35 | | | 335,023 | |
| | 59,153 | | | GreenPoint Mortgage Funding Trust Series 2005-HE3 A(f) | | TSFR1M + 0.294% | | 5.6560 | | 09/15/30 | | | 57,430 | |
| | 1,378,358 | | | GSAA Home Equity Trust Series 2005-2 B3(f) | | TSFR1M + 3.564% | | 8.9200 | | 12/25/34 | | | 1,241,940 | |
| | 3,010,051 | | | GSAA Home Equity Trust Series 2005-5 B3(f) | | TSFR1M + 2.664% | | 8.0200 | | 02/25/35 | | | 2,848,168 | |
| | 11,546 | | | GSAA Trust Series 2004-3 AF4(h) | | | | 6.7200 | | 04/25/34 | | | 11,167 | |
| | 18,412 | | | Home Equity Asset Trust Series 2002-2 B1(f) | | TSFR1M + 2.714% | | 8.0570 | | 06/25/32 | | | 32,812 | |
| | 27,557 | | | Home Equity Asset Trust Series 2002-4 M1(f) | | TSFR1M + 1.614% | | 6.9700 | | 03/25/33 | | | 26,913 | |
| | 160,222 | | | Home Equity Asset Trust Series 2003-1 B2(f) | | TSFR1M + 4.864% | | 10.2200 | | 06/25/33 | | | 1,120,235 | |
| | 96,264 | | | Home Equity Asset Trust Series 2003-8 B2(f) | | TSFR1M + 3.364% | | 8.7200 | | 04/25/34 | | | 130,387 | |
| | 15,613 | | | Home Equity Loan Trust Series 2006-HSA3 A(f) | | TSFR1M + 0.244% | | 5.6000 | | 05/25/36 | | | 15,600 | |
| | 283,125 | | | Home Equity Mortgage Loan Asset-Backed Trust Series C MV1(f) | | TSFR1M + 0.784% | | 4.6820 | | 12/25/31 | | | 418,991 | |
| | 196,997 | | | Home Equity Mortgage Loan Asset-Backed Trust Series 2002-B M1(f) | | TSFR1M + 1.539% | | 6.8950 | | 10/25/33 | | | 194,549 | |
See accompanying notes which are an integral part of these financial statements.
| RATIONAL SPECIAL SITUATIONS INCOME FUND |
| SCHEDULE OF INVESTMENTS (Continued) |
| December 31, 2023 |
| Principal | | | | | | | Coupon Rate | | | | | |
| Amount ($) | | | | | Spread | | (%) | | Maturity | | Fair Value | |
| | | | | ASSET BACKED SECURITIES — 79.8% (Continued) | | | | | | | | | | |
| | | | | HOME EQUITY — 11.2% (Continued) | | | | | | | | | | |
| | 65,574 | | | Home Equity Mortgage Loan Asset-Backed Trust Series 2004-A M2(f) | | TSFR1M + 2.139% | | 4.0310 | | 07/25/34 | | $ | 63,108 | |
| | 376,299 | | | Home Equity Mortgage Trust Series 2007-1 A1(f) | | TSFR1M + 0.454% | | 5.8100 | | 05/25/37 | | | 359,567 | |
| | 513,391 | | | Imc Home Equity Loan Trust Series 1998-3 A7(h) | | | | 5.4320 | | 08/20/29 | | | 502,348 | |
| | 309,426 | | | IMC Home Equity Loan Trust Series 1996-2 A7 | | | | 7.9500 | | 07/25/26 | | | 311,508 | |
| | 82,316 | | | IMC Home Equity Loan Trust Series 1998-5 A5(h) | | | | 5.6140 | | 12/20/29 | | | 81,733 | |
| | 41,306 | | | Irwin Home Equity Loan Trust Series 2004-1 2M2(f) | | TSFR1M + 1.989% | | 7.3450 | | 12/25/34 | | | 41,188 | |
| | 508,046 | | | Irwin Home Equity Loan Trust Series 2006-P1 1A(c),(f) | | TSFR1M + 0.394% | | 5.7500 | | 12/25/36 | | | 489,089 | |
| | 440,280 | | | Irwin Home Equity Loan Trust Series 2006-P1 2A3(c),(h) | | | | 6.3000 | | 06/25/37 | | | 435,491 | |
| | 25,071 | | | Irwin Home Equity Loan Trust 2004-1 Series 2004-1 2B1(f) | | TSFR1M + 3.189% | | 8.5450 | | 12/25/34 | | | 25,020 | |
| | 282,388 | | | IXIS Real Estate Capital Trust Series 2005-HE3 M3(f) | | TSFR1M + 0.879% | | 6.2350 | | 12/25/35 | | | 299,005 | |
| | 167,201 | | | MAFI II Remic Trust Series 1999-A B1(c),(e) | | | | 8.0000 | | 03/20/25 | | | 161,561 | |
| | 206,596 | | | Mastr Asset Backed Securities Trust Series 2003-NC1 M4(f) | | TSFR1M + 3.614% | | 4.6750 | | 04/25/33 | | | 206,979 | |
| | 58,345 | | | Mastr Asset Backed Securities Trust Series 2003-WMC2 M2(f) | | TSFR1M + 2.589% | | 4.4370 | | 08/25/33 | | | 60,009 | |
| | 55,334 | | | Meritage Mortgage Loan Trust Series 2003-1 M2(f) | | TSFR1M + 2.439% | | 7.7950 | | 11/25/33 | | | 52,655 | |
| | 927,752 | | | Merrill Lynch Mortgage Investors Trust Series 2005-NC1 B3(f) | | TSFR1M + 3.189% | | 8.5450 | | 10/25/35 | | | 858,190 | |
| | 52,624 | | | Morgan Stanley A.B.S Capital I Inc Trust Series 2003-NC8 M3(f) | | TSFR1M + 3.264% | | 8.6200 | | 09/25/33 | | | 52,622 | |
| | 889,084 | | | Morgan Stanley A.B.S Capital I Inc Trust Series 2003-NC10 B2(f) | | TSFR1M + 5.739% | | 11.0950 | | 10/25/33 | | | 963,000 | |
| | 2,058 | | | Morgan Stanley A.B.S Capital I Inc Trust Series 2007-HE4 A2A(f) | | TSFR1M + 0.224% | | 5.5700 | | 02/25/37 | | | 651 | |
| | 13,807 | | | Morgan Stanley Dean Witter Capital I Inc Trust Series 2001-AM1 M2(f) | | TSFR1M + 2.214% | | 7.5700 | | 02/25/32 | | | 14,030 | |
| | 112,851 | | | Morgan Stanley Dean Witter Capital I Inc Trust Series 2001-AM1 B1(f) | | TSFR1M + 3.414% | | 8.7700 | | 02/25/32 | | | 514,879 | |
| | 16,896 | | | Morgan Stanley Dean Witter Capital I Inc Trust Series 2002-AM3 B2(f) | | TSFR1M + 5.739% | | 11.0950 | | 02/25/33 | | | 629,263 | |
| | 1,642,789 | | | Morgan Stanley Dean Witter Capital I Inc Trust Series 2003-NC2 B1(f) | | TSFR1M + 5.739% | | 11.0950 | | 02/25/33 | | | 1,688,943 | |
| | 133,304 | | | Morgan Stanley Mortgage Loan Trust Series 2005-8SL M1(f) | | TSFR1M + 0.849% | | 6.2050 | | 11/25/35 | | | 306,429 | |
| | 4,469,863 | | | Morgan Stanley Mortgage Loan Trust Series 2007-8XS A3W(e) | | | | 6.0000 | | 04/25/37 | | | 2,757,137 | |
| | 2,334 | | | New Century Home Equity Loan Trust Series 2003-5 AI7(e) | | | | 4.8550 | | 11/25/33 | | | 2,261 | |
| | 333,558 | | | New Century Home Equity Loan Trust Series 2003-6 M1(f) | | TSFR1M + 1.194% | | 6.5500 | | 01/25/34 | | | 332,844 | |
| | 892,811 | | | New Century Home Equity Loan Trust Series Series 2003-3 M3(f) | | TSFR1M + 3.684% | | 9.0400 | | 07/25/33 | | | 1,024,369 | |
| | 488,508 | | | NovaStar Mortgage Funding Trust Series 2003-2 M2(f) | | TSFR1M + 2.889% | | 8.2450 | | 09/25/33 | | | 493,287 | |
| | 50,518 | | | Option One Mortgage Loan Trust Series 2004-1 M2(f) | | TSFR1M + 1.764% | | 7.1200 | | 01/25/34 | | | 47,966 | |
| | 178,972 | | | Option One Mortgage Loan Trust Series 2004-1 M4(f) | | TSFR1M + 2.589% | | 7.9450 | | 01/25/34 | | | 148,033 | |
| | 61,108 | | | Option One Mortgage Loan Trust Series 2004-2 M2(f) | | TSFR1M + 1.689% | | 7.0450 | | 05/25/34 | | | 63,007 | |
| | 104,819 | | | Option One Mortgage Loan Trust Series 2004-2 M5(f) | | TSFR1M + 3.114% | | 8.4700 | | 05/25/34 | | | 89,864 | |
| | 884,327 | | | Option One Mortgage Loan Trust Series 2007-FXD1 1A1(h) | | | | 5.8660 | | 01/25/37 | | | 717,856 | |
| | 201,101 | | | Option One Mortgage Loan Trust Series 2007-FXD2 2A6(h) | | | | 5.6800 | | 03/25/37 | | | 180,892 | |
See accompanying notes which are an integral part of these financial statements.
| RATIONAL SPECIAL SITUATIONS INCOME FUND |
| SCHEDULE OF INVESTMENTS (Continued) |
| December 31, 2023 |
| Principal | | | | | | | Coupon Rate | | | | | |
| Amount ($) | | | | | Spread | | (%) | | Maturity | | Fair Value | |
| | | | | ASSET BACKED SECURITIES — 79.8% (Continued) | | | | | | | | | | |
| | | | | HOME EQUITY — 11.2% (Continued) | | | | | | | | | | |
| | 350,992 | | | Option One Mortgage Loan Trust Series 2007-FXD2 2A5(h) | | | | 6.1020 | | 03/25/37 | | $ | 282,946 | |
| | 807,297 | | | Option One Woodbridge Loan Trust Series 2004-1 M(c),(f) | | TSFR1M + 1.614% | | 6.9700 | | 02/25/34 | | | 794,285 | |
| | 519,023 | | | Provident Bank Home Equity Loan Trust Series 1999-3 A3(f) | | TSFR1M + 0.894% | | 5.8600 | | 01/25/31 | | | 435,563 | |
| | 138,154 | | | Provident Bank Home Equity Loan Trust Series 1999-3 A2(f) | | TSFR1M + 0.954% | | 5.8900 | | 01/25/31 | | | 116,230 | |
| | 71,943 | | | RAAC Series Trust Series 2004-SP1 AI3(h) | | | | 6.1180 | | 03/25/34 | | | 69,879 | |
| | 2,742,835 | | | RASC Series Trust Series 2004-KS11 M2(f) | | SOFRRATE + 1.614% | | 6.9700 | | 12/25/34 | | | 2,760,644 | |
| | 67,659 | | | Renaissance Home Equity Loan Trust Series 2002-4 B(h) | | | | 4.3320 | | 03/25/33 | | | 10,514 | |
| | 115,151 | | | Renaissance Home Equity Loan Trust Series 2004-3 AF6(h) | | | | 5.3240 | | 11/25/34 | | | 107,485 | |
| | 127,070 | | | Renaissance Home Equity Loan Trust Series 2005-4 A4(h) | | | | 5.8250 | | 02/25/36 | | | 122,642 | |
| | 8,785 | | | Saco I Trust Series 2007-1 A1(f) | | TSFR1M + 0.434% | | 5.7900 | | 01/25/37 | | | 8,784 | |
| | 29,202 | | | Saco I Trust Series 2007-2 A1(f) | | TSFR1M + 0.434% | | 5.7900 | | 02/25/37 | | | 29,383 | |
| | 2,132,200 | | | Saxon Asset Securities Trust Series 2001-2 M1(f) | | TSFR1M + 0.909% | | 6.2650 | | 03/25/31 | | | 1,887,696 | |
| | 29,702,919 | | | Soundview Home Loan Trust Series 2007-OPT4 X1(d),(e) | | | | 0.3510 | | 09/25/37 | | | 779,332 | |
| | 227,237 | | | Structured Asset Securities Corp Mortgage Pass Series 2001-SB1 A2 | | | | 3.3750 | | 08/25/31 | | | 225,908 | |
| | 317,377 | | | Terwin Mortgage Trust Series 2004-1HE M2(c),(f) | | TSFR1M + 2.589% | | 7.9450 | | 02/25/34 | | | 231,526 | |
| | 2,301,638 | | | Terwin Mortgage Trust Series 2004-21HE 2M3(c),(f) | | TSFR1M + 2.739% | | 8.0950 | | 12/25/34 | | | 2,224,800 | |
| | 3,812,839 | | | Truman Capital Mortgage Loan Trust Series 2002-2 M2(c),(f) | | TSFR1M + 4.764% | | 10.1200 | | 11/25/32 | | | 3,204,906 | |
| | 400,000 | | | Truman Capital Mortgage Loan Trust Series 2006-1 M1(c),(f) | | TSFR1M + 0.594% | | 5.9500 | | 03/25/36 | | | 354,201 | |
| | 3,454 | | | United National Home Loan Owner Trust Series 1999-1 M1(h) | | | | 6.9100 | | 03/25/25 | | | 3,479 | |
| | 16,879 | | | Wells Fargo Home Equity Asset-Backed Securities Series 2004-2 AI9(e) | | | | 4.9800 | | 04/25/34 | | | 16,640 | |
| | 92,585 | | | Wells Fargo Home Equity Asset-Backed Securities Series 2004-2 M6(f) | | TSFR1M + 2.934% | | 8.2900 | | 10/25/34 | | | 91,255 | |
| | 693,175 | | | Wells Fargo Home Equity Asset-Backed Securities Series 2005-1 M9(f) | | TSFR1M + 2.664% | | 8.0200 | | 04/25/35 | | | 708,716 | |
| | | | | | | | | | | | | | 86,849,573 | |
| | | | | MANUFACTURED HOUSING — 4.2% | | | | | | | | | | |
| | 326,786 | | | ACE Securities Corp Manufactured Housing Trust Series 2003-MH1 B2(c),(g) | | | | 0.0000 | | 08/15/30 | | | 300,956 | |
| | 1,809,367 | | | BCMSC Trust Series 1998-C M1(e) | | | | 7.5100 | | 01/15/29 | | | 1,745,338 | |
| | 731,888 | | | BCMSC Trust Series 1999-B A2(e) | | | | 1.0540 | | 12/15/29 | | | 76,806 | |
| | 611,382 | | | BCMSC Trust Series 1999-B A3(e) | | | | 1.0540 | | 12/15/29 | | | 66,045 | |
| | 4,944,914 | | | BCMSC Trust Series 1999-B A5(e) | | | | 1.0540 | | 12/15/29 | | | 553,524 | |
| | 737,790 | | | BCMSC Trust Series 1999-B A6(e) | | | | 1.0540 | | 12/15/29 | | | 87,138 | |
| | 11,151,101 | | | Conseco Finance Corporation Series 7 B2(e) | | | | 0.9950 | | 10/15/26 | | | 1,156,341 | |
| | 1,509,277 | | | Conseco Finance Corporation Series 1997-8 M1(e) | | | | 7.0200 | | 10/15/27 | | | 1,413,084 | |
| | 1,525,723 | | | Conseco Finance Corporation Series 9 B1(e) | | | | 7.6500 | | 01/15/28 | | | 1,470,599 | |
See accompanying notes which are an integral part of these financial statements.
| RATIONAL SPECIAL SITUATIONS INCOME FUND |
| SCHEDULE OF INVESTMENTS (Continued) |
| December 31, 2023 |
| Principal | | | | | | | Coupon Rate | | | | | |
| Amount ($) | | | | | Spread | | (%) | | Maturity | | Fair Value | |
| | | | | ASSET BACKED SECURITIES — 79.8% (Continued) | | | | | | | | | | |
| | | | | MANUFACTURED HOUSING — 4.2% (Continued) | | | | | | | | | | |
| | 5,450,962 | | | Conseco Finance Corporation Series 1997-3 M1(e) | | | | 7.5300 | | 03/15/28 | | $ | 5,379,533 | |
| | 1,777,041 | | | Conseco Finance Corporation Series 1997-2 M1(e) | | | | 7.5400 | | 06/15/28 | | | 1,762,110 | |
| | 2,639,112 | | | Conseco Finance Corporation Series 1996-10 B1(e) | | | | 7.2400 | | 11/15/28 | | | 2,584,959 | |
| | 284,711 | | | Conseco Finance Corporation Series 1998-2 M1(e) | | | | 6.9400 | | 12/01/28 | | | 268,297 | |
| | 398,819 | | | Conseco Finance Corporation(e) | | | | 6.9700 | | 05/15/29 | | | 386,422 | |
| | 2,799,303 | | | Conseco Finance Corporation Series 1999-5 A6(e) | | | | 3.2140 | | 03/01/30 | | | 969,374 | |
| | 2,785,065 | | | Conseco Finance Corporation Series 3 M1(e) | | | | 6.8600 | | 03/01/30 | | | 2,668,934 | |
| | 2,847,234 | | | Conseco Finance Securitizations Corporation Series 2002-1 M2(e) | | | | 9.5460 | | 12/01/33 | | | 2,765,309 | |
| | 2,162,238 | | | Deutsche Financial Capital Securitization, LLC Series 1998-I B1 | | | | 7.2750 | | 04/15/28 | | | 2,036,836 | |
| | 152,711 | | | Madison Avenue Manufactured Housing Contract Trust Series A B2(f) | | TSFR1M + 3.364% | | 8.7200 | | 03/25/32 | | | 152,781 | |
| | 3,629 | | | MERIT Securities Corporation Series 12-1 1M1(h) | | | | 7.6300 | | 07/28/33 | | | 3,616 | |
| | 822,678 | | | Morgan Stanley Resecuritization Trust Series 2015-R7 1BXA(c),(e) | | | | 7.0600 | | 02/26/29 | | | 754,502 | |
| | 358,254 | | | Oakwood Mortgage Investors, Inc. Series 1997-A B1 | | | | 7.4500 | | 05/15/27 | | | 329,834 | |
| | 6,289 | | | Oakwood Mortgage Investors, Inc. Series 1997-B B1 | | | | 7.7500 | | 08/15/27 | | | 5,809 | |
| | 444,827 | | | Oakwood Mortgage Investors, Inc. Series 1997-D B1(e) | | | | 7.3250 | | 02/15/28 | | | 433,379 | |
| | 928,701 | | | Oakwood Mortgage Investors, Inc. Series 1998-D M1(c) | | | | 7.4150 | | 01/15/29 | | | 898,849 | |
| | 1,081,709 | | | Oakwood Mortgage Investors, Inc. Series 2000-C M1 | | | | 8.4900 | | 10/15/30 | | | 1,005,869 | |
| | 139,458 | | | Oakwood Mortgage Investors, Inc. Series 2001-D A2(e) | | | | 4.2360 | | 08/15/31 | | | 61,410 | |
| | 732,225 | | | Origen Manufactured Housing Contract Trust Series 2007-A A2(e) | | | | 7.8000 | | 04/15/37 | | | 685,948 | |
| | 1,394,380 | | | Origen Manufactured Housing Contract Trust Series 2006-A A2(e) | | | | 6.9620 | | 10/15/37 | | | 1,278,143 | |
| | 1,422,841 | | | UCFC Manufactured Housing Contract Series 1998-3 M1 | | | | 6.5060 | | 01/15/30 | | | 1,337,979 | |
| | | | | | | | | | | | | | 32,639,724 | |
| | | | | NON AGENCY CMBS — 26.4% | | | | | | | | | | |
| | 2,927,675 | | | BAMLL Re-REMIC Trust Series 2016-GG10 AJA(c),(e) | | | | 3.7960 | | 08/10/45 | | | 658,727 | |
| | 500,456 | | | Banc of America Commercial Mortgage Trust Series 2006-4 C(e) | | | | 5.7540 | | 07/10/46 | | | 464,314 | |
| | 7,050,244 | | | Banc of America Commercial Mortgage Trust Series 2007-1 AJ(e) | | | | 0.0000 | | 01/15/49 | | | 1,130,255 | |
| | 57,267 | | | Bayview Commercial Asset Trust Series 2005-1A B1(c),(f) | | TSFR1M + 1.239% | | 6.5950 | | 04/25/35 | | | 57,602 | |
| | 104,750 | | | Bayview Commercial Asset Trust Series 2005-2A M1(c),(f) | | TSFR1M + 0.759% | | 6.1150 | | 08/25/35 | | | 97,969 | |
| | 256,574 | | | Bayview Commercial Asset Trust Series 2005-3A B1(c),(f) | | TSFR1M + 1.764% | | 7.1200 | | 11/25/35 | | | 251,106 | |
| | 3,000,000 | | | Bayview Commercial Asset Trust Series 2005-4A B2(c),(f) | | SOFRRATE + 3.714% | | 0.0000 | | 01/25/36 | | | 491,288 | |
| | 116,416 | | | Bayview Commercial Asset Trust Series 2006-2A B1(c),(f) | | TSFR1M + 1.419% | | 6.7750 | | 07/25/36 | | | 111,614 | |
| | 3,492,217 | | | BB-UBS Trust(c) | | | | 2.8900 | | 06/05/30 | | | 3,079,230 | |
| | 180,000 | | | BB-UBS Trust 2012-SHOW Series SHOW B(c) | | | | 3.8820 | | 11/05/36 | | | 163,308 | |
See accompanying notes which are an integral part of these financial statements.
| RATIONAL SPECIAL SITUATIONS INCOME FUND |
| SCHEDULE OF INVESTMENTS (Continued) |
| December 31, 2023 |
| Principal | | | | | | | Coupon Rate | | | | | |
| Amount ($) | | | | | Spread | | (%) | | Maturity | | Fair Value | |
| | | | | ASSET BACKED SECURITIES — 79.8% (Continued) | | | | | | | | | | |
| | | | | NON AGENCY CMBS — 26.4% (Continued) | | | | | | | | | | |
| | 205,533 | | | Bear Stearns Asset Backed Securities Trust Series 2003-3 M1(f) | | TSFR1M + 1.344% | | 6.7000 | | 06/25/43 | | $ | 206,464 | |
| | 139,084 | | | Bear Stearns Commercial Mortgage Securities Trust Series 2007-T26 AJ(e) | | | | 5.5660 | | 01/12/45 | | | 135,204 | |
| | 2,445,190 | | | Carbon Capital VI Commercial Mortgage Series 2019-FL2 B(c),(f) | | TSFR1M + 2.964% | | 8.3260 | | 10/15/35 | | | 2,157,148 | |
| | 1,593,624 | | | CD Mortgage Trust Series 2007-CD5 G(c),(e) | | | | 6.3690 | | 11/15/44 | | | 1,577,684 | |
| | 958,633 | | | CFCRE Commercial Mortgage Trust Series 2011-C2 D(c),(e) | | | | 5.2490 | | 12/15/47 | | | 875,406 | |
| | 5,083,000 | | | CFCRE Commercial Mortgage Trust Series 2011-C2 E(c),(e) | | | | 5.2490 | | 12/15/47 | | | 3,964,740 | |
| | 3,401,495 | | | CG-CCRE Commercial Mortgage Trust Series 2014-FL1 B(c),(f) | | TSFR1M + 1.264% | | 6.6260 | | 06/15/31 | | | 3,399,450 | |
| | 4,500,000 | | | CG-CCRE Commercial Mortgage Trust Series 2014-FL1 D(c),(f) | | TSFR1M + 2.864% | | 8.2260 | | 06/15/31 | | | 3,300,460 | |
| | 209,640 | | | CG-CCRE Commercial Mortgage Trust Series 2014-FL2 A(c),(f) | | TSFR1M + 1.968% | | 7.3300 | | 11/15/31 | | | 202,387 | |
| | 32,253,755 | | | Citigroup Commercial Mortgage Trust Series 2014-GC23 XA(d),(e),(j) | | | | 0.8910 | | 07/10/47 | | | 73,687 | |
| | 1,884,669 | | | COMM 2013-CCRE9 Mortgage Trust Series CR9 E(c),(e) | | | | 4.4680 | | 07/10/45 | | | 1,689,001 | |
| | 2,000,000 | | | COMM Mortgage Trust Series 2013-300P C(c),(e) | | | | 4.3940 | | 08/10/30 | | | 1,700,000 | |
| | 19,343 | | | COMM Mortgage Trust Series 2012-LC4 B(e) | | | | 4.9340 | | 12/10/44 | | | 17,331 | |
| | 3,000,000 | | | COMM Mortgage Trust Series 2012-LC4 D(c),(e) | | | | 5.2940 | | 12/10/44 | | | 1,761,935 | |
| | 1,692,000 | | | COMM Mortgage Trust Series 2012-LC4 C(e) | | | | 5.2940 | | 12/10/44 | | | 1,359,985 | |
| | 134,574 | | | COMM Mortgage Trust Series 2012-CCRE2 E(c),(e) | | | | 4.5350 | | 08/15/45 | | | 121,116 | |
| | 415,000 | | | COMM Mortgage Trust Series 2012-CCRE3 B(c) | | | | 3.9220 | | 10/15/45 | | | 322,538 | |
| | 2,342,000 | | | COMM Mortgage Trust Series 2013-LC6 E(c) | | | | 3.5000 | | 01/10/46 | | | 1,866,408 | |
| | 413,188 | | | COMM Mortgage Trust Series 2013-LC6 D(c),(e) | | | | 3.9610 | | 01/10/46 | | | 378,050 | |
| | 4,185,539 | | | COMM Mortgage Trust Series 2013-CCRE6 B(c) | | | | 3.3970 | | 03/10/46 | | | 3,631,294 | |
| | 5,829,707 | | | COMM Mortgage Trust Series 2013-CCRE7 D(c),(e) | | | | 4.2430 | | 03/10/46 | | | 4,884,065 | |
| | 3,274,000 | | | COMM Mortgage Trust Series 2013-CCRE7 E(c),(e) | | | | 4.2430 | | 03/10/46 | | | 2,446,901 | |
| | 5,822,063 | | | COMM Mortgage Trust Series 2010-C1 D(c),(e) | | | | 5.7920 | | 07/10/46 | | | 5,297,774 | |
| | 108,610,000 | | | COMM Mortgage Trust Series 2014-CR19 XB(c),(d),(e) | | | | 0.0410 | | 08/10/47 | | | 13,631 | |
| | 19,644,195 | | | COMM Mortgage Trust Series 2015-LC21 XA(d),(e) | | | | 0.6340 | | 07/10/48 | | | 132,734 | |
| | 6,610,615 | | | Commercial Mortgage Pass Through Certificates Series 2012-LTRT A2(c) | | | | 3.4000 | | 10/05/30 | | | 5,732,630 | |
| | 2,935,145 | | | CSMC OA, LLC Series 2014-USA X1(c),(d),(e) | | | | 0.5400 | | 09/15/37 | | | 17,349 | |
| | 2,500,000 | | | DBUBS 2011-LC3 Mortgage Trust Series LC3A E(c),(e) | | | | 3.7500 | | 08/10/44 | | | 1,501,500 | |
| | 2,158,565 | | | DBUBS Mortgage Trust Series 2011-LC3A D(c),(e) | | | | 5.3580 | | 08/10/44 | | | 1,849,243 | |
| | 1,060,401 | | | Greenwich Capital Commercial Mortgage Trust Series 2006-RR1 A1(c),(e) | | | | 1.2990 | | 03/18/49 | | | 402,953 | |
| | 3,346,912 | | | GS Mortgage Securities Corporation II Series 2018-SRP5 A(c),(f) | | TSFR1M + 1.914% | | 7.2760 | | 09/15/31 | | | 2,290,636 | |
| | 1,798,075 | | | GS Mortgage Securities Corporation II Series 2018-SRP5 B(c),(f) | | TSFR1M + 3.114% | | 8.4760 | | 09/15/31 | | | 545,541 | |
| | 156,999 | | | GS Mortgage Securities Trust Series 2010-C1 B(c) | | | | 5.1480 | | 08/10/43 | | | 155,211 | |
See accompanying notes which are an integral part of these financial statements.
| RATIONAL SPECIAL SITUATIONS INCOME FUND |
| SCHEDULE OF INVESTMENTS (Continued) |
| December 31, 2023 |
| Principal | | | | | | | Coupon Rate | | | | | |
| Amount ($) | | | | | Spread | | (%) | | Maturity | | Fair Value | |
| | | | | ASSET BACKED SECURITIES — 79.8% (Continued) | | | | | | | | | | |
| | | | | NON AGENCY CMBS — 26.4% (Continued) | | | | | | | | | | |
| | 3,000,000 | | | GS Mortgage Securities Trust Series 2010-C1 C(c),(e) | | | | 5.6350 | | 08/10/43 | | $ | 2,909,284 | |
| | 15,137,000 | | | GS Mortgage Securities Trust Series 2010-C1 D(c),(e) | | | | 6.3590 | | 08/10/43 | | | 12,085,486 | |
| | 9,505,000 | | | GS Mortgage Securities Trust Series 2011-GC5 B(c),(e) | | | | 5.1530 | | 08/10/44 | | | 7,899,251 | |
| | 1,131,000 | | | GS Mortgage Securities Trust Series 2011-GC5 D(c),(e) | | | | 5.1530 | | 08/10/44 | | | 502,586 | |
| | 170,000 | | | GS Mortgage Securities Trust Series 2011-GC5 C(c),(e) | | | | 5.1530 | | 08/10/44 | | | 118,946 | |
| | 661,480 | | | GS Mortgage Securities Trust Series 2011-GC5 AS(c),(e) | | | | 5.1530 | | 08/10/44 | | | 638,448 | |
| | 1,986,605 | | | GS Mortgage Securities Trust Series 2012-GCJ9 D(c),(e) | | | | 4.6010 | | 11/10/45 | | | 1,783,793 | |
| | 1,000,000 | | | Harvest Commercial Capital Loan Trust Series 2020-1 M4(c),(e) | | | | 5.9640 | | 04/25/52 | | | 897,580 | |
| | 265,836 | | | Impac CMB Trust Series 2004-8 3M2(f) | | TSFR1M + 1.689% | | 7.0450 | | 08/25/34 | | | 245,582 | |
| | 184,040 | | | Impac CMB Trust Series 2004-8 3B(f) | | TSFR1M + 2.739% | | 8.0950 | | 08/25/34 | | | 176,562 | |
| | 10,643,227 | | | JP Morgan Chase Commercial Mortgage Securities Series 2012-WLDN A(c) | | | | 3.9100 | | 05/05/30 | | | 7,960,102 | |
| | 2,985,000 | | | JP Morgan Chase Commercial Mortgage Securities Series C2 F(c) | | | | 3.3920 | | 11/15/43 | | | 1,911,690 | |
| | 2,004,065 | | | JP Morgan Chase Commercial Mortgage Securities Series 2010-C2 D(c),(e) | | | | 5.5820 | | 11/15/43 | | | 1,832,717 | |
| | 2,100,000 | | | JP Morgan Chase Commercial Mortgage Securities Series 2010-C2 E(c),(e) | | | | 5.5820 | | 11/15/43 | | | 1,792,140 | |
| | 1,526,853 | | | JP Morgan Chase Commercial Mortgage Securities Series 2006-CB17 AJ(e) | | | | 5.4890 | | 12/12/43 | | | 1,116,586 | |
| | 1,325,000 | | | JP Morgan Chase Commercial Mortgage Securities Series C6 G(c),(e) | | | | 2.9720 | | 05/15/45 | | | 782,117 | |
| | 5,683,288 | | | JP Morgan Chase Commercial Mortgage Securities Series 2012-C6 E(c),(e) | | | | 4.9640 | | 05/15/45 | | | 4,598,922 | |
| | 553,648 | | | JP Morgan Chase Commercial Mortgage Securities Series C6 D(e) | | | | 4.9640 | | 05/15/45 | | | 500,681 | |
| | 401,000 | | | JP Morgan Chase Commercial Mortgage Securities(c),(e) | | | | 4.9640 | | 05/15/45 | | | 286,275 | |
| | 8,169,420 | | | JP Morgan Chase Commercial Mortgage Securities Series CBX E(c),(e) | | | | 4.6900 | | 06/15/45 | | | 7,171,610 | |
| | 3,888,868 | | | JP Morgan Chase Commercial Mortgage Securities Series C8 G(c),(e) | | | | 2.7330 | | 10/15/45 | | | 3,434,649 | |
| | 958,964 | | | JP Morgan Chase Commercial Mortgage Securities Series 2011-C3 B(c),(e) | | | | 5.0130 | | 02/15/46 | | | 891,131 | |
| | 9,260,000 | | | JP Morgan Chase Commercial Mortgage Securities Series 2011-C3 C(c),(e) | | | | 5.3600 | | 02/15/46 | | | 7,775,706 | |
| | 751,000 | | | JP Morgan Chase Commercial Mortgage Securities Series C3 F(c),(e) | | | | 5.5260 | | 02/15/46 | | | 172,637 | |
| | 6,930,000 | | | JP Morgan Chase Commercial Mortgage Securities Series 2011-C3 D(c),(e) | | | | 5.5260 | | 02/15/46 | | | 4,708,584 | |
| | 107,000 | | | JP Morgan Chase Commercial Mortgage Securities Series 2013-LC11 D(e) | | | | 4.1600 | | 04/15/46 | | | 46,171 | |
| | 18,455,689 | | | JP Morgan Chase Commercial Mortgage Securities Series 2006-LDP9 AMS | | | | 5.3370 | | 05/15/47 | | | 17,722,370 | |
| | 585,102 | | | JP Morgan Chase Commercial Mortgage Securities Series 2012-LC9 C(c),(e) | | | | 3.7840 | | 12/15/47 | | | 507,870 | |
| | 3,204,045 | | | JP Morgan Chase Commercial Mortgage Securities Series C2 AM(e) | | | | 7.0550 | | 02/12/51 | | | 1,639,819 | |
See accompanying notes which are an integral part of these financial statements.
| RATIONAL SPECIAL SITUATIONS INCOME FUND |
| SCHEDULE OF INVESTMENTS (Continued) |
| December 31, 2023 |
| Principal | | | | | | | Coupon Rate | | | | | |
| Amount ($) | | | | | Spread | | (%) | | Maturity | | Fair Value | |
| | | | | ASSET BACKED SECURITIES — 79.8% (Continued) | | | | | | | | | | |
| | | | | NON AGENCY CMBS — 26.4% (Continued) | | | | | | | | | | |
| | 17,254 | | | JP Morgan Chase Commercial Mortgage Securities Series 2007-LD12 AJ(e) | | | | 6.3490 | | 02/15/51 | | $ | 16,434 | |
| | 11,004,189 | | | JP Morgan Chase Commercial Mortgage Securities Series 2007-C1 AJ(e) | | | | 6.8240 | | 02/15/51 | | | 10,445,764 | |
| | 4,000,000 | | | JP Morgan Chase Commercial Mortgage Securities Series 2007-C1 C(c),(e) | | | | 6.8300 | | 02/15/51 | | | 1,198,862 | |
| | 2,191,277 | | | LBSBC NIM Company Series 2005-2A N3(c) | | | | 5.5000 | | 09/27/30 | | | 2,109,573 | |
| | 100 | | | LBSBN Series 2005-2A PS (g) | | | | 0.0000 | | 09/27/30 | | | 2,480,000 | |
| | 10,439,733 | | | LB-UBS Commercial Mortgage Trust Series 2006-C6 AJ(e) | | | | 5.4520 | | 09/15/39 | | | 4,088,077 | |
| | 185,651 | | | Merrill Lynch Mortgage Trust Series 2006-C1 B(e) | | | | 6.5970 | | 05/12/39 | | | 176,707 | |
| | 555,646 | | | ML-CFC Commercial Mortgage Trust Series 2007-9 AJ(e) | | | | 6.1930 | | 09/12/49 | | | 541,295 | |
| | 251,938 | | | ML-CFC Commercial Mortgage Trust Series 2007-9 AJA(e) | | | | 6.2220 | | 09/12/49 | | | 245,469 | |
| | 2,777,000 | | | Morgan Stanley Bank of America Merrill Lynch Trust Series 2012-C6 E(c),(e) | | | | 4.4250 | | 11/15/45 | | | 1,766,484 | |
| | 545,000 | | | Morgan Stanley Capital I Trust Series 2011-C2 E(c),(e) | | | | 5.2110 | | 06/15/44 | | | 303,413 | |
| | 108,620 | | | Morgan Stanley Capital I Trust Series 2011-C2 D(c),(e) | | | | 5.2110 | | 06/15/44 | | | 98,163 | |
| | 1,035,000 | | | Morgan Stanley Capital I Trust Series 2012-C4 E(c),(e) | | | | 5.1640 | | 03/15/45 | | | 628,355 | |
| | 186,593 | | | Morgan Stanley Capital I Trust Series 2012-C4 D(c),(e) | | | | 5.1640 | | 03/15/45 | | | 166,992 | |
| | 1,787,950 | | | Morgan Stanley Capital I Trust Series 2011-C3 F(c),(e) | | | | 4.9440 | | 07/15/49 | | | 1,521,653 | |
| | 2,132,000 | | | Morgan Stanley Capital I Trust Series 2011-C3 G(c),(e) | | | | 4.9440 | | 07/15/49 | | | 1,516,458 | |
| | 969,058 | | | Morgan Stanley Capital I Trust Series 2011-C3 E(c),(e) | | | | 4.9440 | | 07/15/49 | | | 903,510 | |
| | 1,680,000 | | | Natixis Commercial Mortgage Securities Trust Series 2018-FL1 Class C(c),(f) | | PRIME + 2.200% | | 8.5000 | | 06/15/35 | | | 675,852 | |
| | 3,000,000 | | | ReadyCap Commercial Mortgage Trust Series 2018-4 E(c),(e) | | | | 5.2140 | | 02/27/51 | | | 2,335,718 | |
| | 8,000,000 | | | TMSQ Mortgage Trust Series 2014-1500 XA(c),(d),(e) | | | | 0.1550 | | 10/10/36 | | | 3,824 | |
| | 1,629,832 | | | UBS Commercial Mortgage Trust Series 2012-C1 E(c),(e) | | | | 5.0000 | | 05/10/45 | | | 1,257,857 | |
| | 2,568,006 | | | UBS-Barclays Commercial Mortgage Trust 2013-C5 Series C5 B(c),(e) | | | | 3.6490 | | 03/10/46 | | | 2,286,014 | |
| | 5,190,585 | | | UBS-Citigroup Commercial Mortgage Trust Series 2011-C1 E(c),(e) | | | | 6.5580 | | 01/10/45 | | | 3,178,175 | |
| | 805,439 | | | Wachovia Bank Commercial Mortgage Trust Series 2004-C11 J(c),(e) | | | | 5.3100 | | 01/15/41 | | | 791,123 | |
| | 1,176,513 | | | Wachovia Bank Commercial Mortgage Trust Series 2005-C21 E(c),(e) | | | | 4.9700 | | 10/15/44 | | | 705,634 | |
| | 57,349 | | | WFRBS Commercial Mortgage Trust Series 2011-C4 C(c),(e) | | | | 4.9790 | | 06/15/44 | | | 52,480 | |
| | 2,234,000 | | | WFRBS Commercial Mortgage Trust Series 2011-C4 D(c),(e) | | | | 4.9790 | | 06/15/44 | | | 1,849,072 | |
| | 120,000 | | | WFRBS Commercial Mortgage Trust Series 2011-C4 E(c),(e) | | | | 4.9790 | | 06/15/44 | | | 88,261 | |
| | 225,000 | | | WFRBS Commercial Mortgage Trust Series 2013-C11 D(c),(e) | | | | 4.0540 | | 03/15/45 | | | 166,848 | |
| | 560,000 | | | WFRBS Commercial Mortgage Trust Series 2012-C10 C(e) | | | | 4.3290 | | 12/15/45 | | | 381,458 | |
| | 5,989,689 | | | WFRBS Commercial Mortgage Trust Series 2013-C14 C(e) | | | | 3.8360 | | 06/15/46 | | | 4,040,176 | |
| | 140,000 | | | WFRBS Commercial Mortgage Trust Series 2013-C14 B(e) | | | | 3.8410 | | 06/15/46 | | | 107,598 | |
See accompanying notes which are an integral part of these financial statements.
| RATIONAL SPECIAL SITUATIONS INCOME FUND |
| SCHEDULE OF INVESTMENTS (Continued) |
| December 31, 2023 |
| Principal | | | | | | | Coupon Rate | | | | | |
| Amount ($) | | | | | Spread | | (%) | | Maturity | | Fair Value | |
| | | | | ASSET BACKED SECURITIES — 79.8% (Continued) | | | | | | | | | | |
| | | | | NON AGENCY CMBS — 26.4% (Continued) | | | | | | | | | | |
| | 2,197,396 | | | WFRBS Commercial Mortgage Trust Series 2014-C19 XA(d),(e),(j) | | | | 0.8920 | | 03/15/47 | | $ | 700 | |
| | 102,827 | | | WF-RBS Commercial Mortgage Trust Series 2011-C2 E(c),(e) | | | | 5.0000 | | 02/15/44 | | | 98,133 | |
| | 3,555,000 | | | X-Caliber Funding, LLC Series SKOAK B1(c),(g) | | | | 0.0000 | | 05/15/25 | | | 2,941,814 | |
| | 3,000,000 | | | X-Caliber Funding, LLC Series 2021-7 A(c),(f) | | SOFRRATE + 3.120% | | 8.4350 | | 01/06/26 | | | 2,955,770 | |
| | 720,000 | | | X-Caliber Rural Lending, LLC Series SN1 B1(c) | | | | 15.0000 | | 06/15/24 | | | 716,352 | |
| | | | | | | | | | | | | | 205,465,232 | |
| | | | | OTHER ABS — 0.1% | | | | | | | | | | |
| | 85,132 | | | AFC Trust Series 2000-4 1A(c),(f) | | TSFR1M + 0.884% | | 6.2400 | | 01/25/31 | | | 82,212 | |
| | 76,406 | | | Oakwood Mortgage Investors, Inc. Series 1996-B B1(c),(e) | | | | 8.4500 | | 10/15/26 | | | 75,894 | |
| | 379,469 | | | Oakwood Mortgage Investors, Inc. Series C B1(c) | | | | 7.9600 | | 04/15/27 | | | 377,031 | |
| | | | | | | | | | | | | | 535,137 | |
| | | | | RESIDENTIAL MORTGAGE — 10.9% | | | | | | | | | | |
| | 992,136 | | | Ameriquest Mortgage Securities Asset-Backed Series 2004-R3 M4(f) | | TSFR1M + 2.874% | | 8.2300 | | 05/25/34 | | | 868,134 | |
| | 391,430 | | | Bear Stearns Asset Backed Securities Trust Series 2003-SD1 A(f) | | TSFR1M + 1.014% | | 6.3700 | | 12/25/33 | | | 374,023 | |
| | 1,788,000 | | | Bear Stearns Asset Backed Securities Trust Series 2006-SD1 M4(f) | | TSFR1M + 2.364% | | 7.7200 | | 04/25/36 | | | 1,828,280 | |
| | 7,688 | | | Bear Stearns Asset Backed Securities Trust Series 2006-SD3 21A1(e) | | | | 4.5780 | | 07/25/36 | | | 7,586 | |
| | 2,987,000 | | | Bear Stearns Asset Backed Securities Trust Series 2006-2 M6(f) | | TSFR1M + 2.739% | | 8.0950 | | 07/25/36 | | | 2,958,832 | |
| | 2,987,000 | | | Bear Stearns Asset Backed Securities Trust Series 2006-2 M7(f) | | TSFR1M + 3.864% | | 9.2200 | | 07/25/36 | | | 2,950,254 | |
| | 37,716 | | | Bear Stearns Asset Backed Securities Trust Series 2006-SD3 1A1A | | | | 5.5000 | | 08/25/36 | | | 37,573 | |
| | 305,007 | | | Bear Stearns Asset Backed Securities Trust Series 2007-SD1 1A2A | | | | 3.4360 | | 10/25/36 | | | 129,618 | |
| | 345,519 | | | Bear Stearns Asset Backed Securities Trust Series 2006-SD4 3A1(f) | | 12MTA + 0.980% | | 5.9100 | | 10/25/36 | | | 91,622 | |
| | 277,237 | | | Bear Stearns Asset Backed Securities Trust Series 2005-SD3 2M4(f) | | TSFR1M + 3.264% | | 8.6200 | | 11/25/39 | | | 287,272 | |
| | 902,000 | | | Bear Stearns Asset Backed Securities Trust Series 2005-SD4 2M4(f) | | TSFR1M + 3.264% | | 8.6200 | | 12/25/42 | | | 963,869 | |
| | 550,000 | | | Bear Stearns Asset Backed Securities Trust Series 2005-SD4 2M3(f) | | TSFR1M + 3.264% | | 8.6200 | | 12/25/42 | | | 594,383 | |
| | 29,750 | | | Bear Stearns Asset Backed Securities Trust Series 2007-SD2 1PO(g) | | | | 0.0000 | | 09/25/46 | | | 21,164 | |
| | 148,299 | | | Bear Stearns Asset Backed Securities Trust Series 2007-SD2 1A1B | | | | 5.5000 | | 09/25/46 | | | 136,154 | |
| | 49,087 | | | Chase Funding Trust Series 2003-6 1A7(h) | | | | 4.8380 | | 11/25/34 | | | 47,796 | |
| | 113,203 | | | Chase Funding Trust Series 2003-6 2M1(f) | | TSFR1M + 0.864% | | 6.2200 | | 11/25/34 | | | 124,237 | |
| | 92 | | | Citicorp Residential Mortgage Trust Series 2007-2 A6(h) | | | | 4.5860 | | 06/25/37 | | | 91 | |
| | 1,145 | | | Citigroup Mortgage Loan Trust, Inc. Series 2005-WF1 A4(h) | | | | 6.0300 | | 11/25/34 | | | 1,139 | |
| | 226,806 | | | Citigroup Mortgage Loan Trust, Inc. Series 2004-RES1 M7(f) | | TSFR1M + 2.739% | | 8.0950 | | 11/25/34 | | | 796,885 | |
| | 452,008 | | | Countrywide Asset-Backed Certificates Series 2004-BC2 M5(f) | | TSFR1M + 2.739% | | 8.0950 | | 10/25/33 | | | 453,886 | |
| | 662,325 | | | Countrywide Asset-Backed Certificates Series 2006-13 1AF5(h) | | | | 3.9950 | | 01/25/37 | | | 540,722 | |
See accompanying notes which are an integral part of these financial statements.
| RATIONAL SPECIAL SITUATIONS INCOME FUND |
| SCHEDULE OF INVESTMENTS (Continued) |
| December 31, 2023 |
| Principal | | | | | | | Coupon Rate | | | | | |
| Amount ($) | | | | | Spread | | (%) | | Maturity | | Fair Value | |
| | | | | ASSET BACKED SECURITIES — 79.8% (Continued) | | | | | | | | | | |
| | | | | RESIDENTIAL MORTGAGE — 10.9% (Continued) | | | | | | | | | | |
| | 843,606 | | | Countrywide Asset-Backed Certificates Series 2007-QX1 A1(f) | | TSFR1M + 0.614% | | 5.9550 | | 05/25/37 | | $ | 693,019 | |
| | 2,881 | | | Credit-Based Asset Servicing and Securitization, Series 1999-3 A(c),(e) | | | | 3.5220 | | 02/03/29 | | | 2,233 | |
| | 278,100 | | | Credit-Based Asset Servicing and Securitization, Series 2006-CB2 AF4(h) | | | | 3.0720 | | 12/25/36 | | | 230,813 | |
| | 720,813 | | | Credit-Based Asset Servicing and Securitization, Series 2007-SL1A A2(c),(f) | | TSFR1M + 0.574% | | 5.9300 | | 02/25/37 | | | 544,800 | |
| | 336,970 | | | Credit-Based Asset Servicing and Securitization, Series 2007-SP1 M1(c),(h) | | | | 4.7210 | | 12/25/37 | | | 372,896 | |
| | 1,548,374 | | | Credit-Based Asset Servicing and Securitization, Series 2004-RP1 M3(c),(f) | | TSFR1M + 3.114% | | 8.4700 | | 05/25/50 | | | 1,550,409 | |
| | 553,042 | | | CSFB Mortgage-Backed Pass-Through Certificates Series 2005-AGE1 B3(f) | | TSFR1M + 4.114% | | 9.4700 | | 02/25/32 | | | 576,834 | |
| | 311,028 | | | CWABS Asset-Backed Certificates Trust Series 2004-13 MF5(e) | | | | 5.5680 | | 01/25/35 | | | 201,010 | |
| | 16,144 | | | CWABS Asset-Backed Certificates Trust Series 2005-16 2AF3(e) | | | | 4.4040 | | 05/25/36 | | | 15,930 | |
| | 470,898 | | | CWABS Asset-Backed Certificates Trust Series 2005-17 1AF4(h) | | | | 6.5470 | | 05/25/36 | | | 373,024 | |
| | 235,319 | | | Equity One Mortgage Pass-Through Trust Series 2002-1 M1(e) | | | | 6.2820 | | 08/25/32 | | | 226,935 | |
| | 209,469 | | | Finance America Mortgage Loan Trust Series 2004-3 M2(f) | | TSFR1M + 1.059% | | 6.4150 | | 11/25/34 | | | 179,206 | |
| | 195,762 | | | Finance America Mortgage Loan Trust Series 2004-3 M3(f) | | TSFR1M + 1.134% | | 6.4900 | | 11/25/34 | | | 155,970 | |
| | 180,655 | | | First Franklin Mortgage Loan Trust Series 2004-FFA X(c),(g) | | | | 0.0000 | | 03/25/24 | | | 175,000 | |
| | 13,982 | | | First Franklin Mortgage Loan Trust Series 2003-FFB X(e),(g) | | | | 0.0000 | | 02/25/33 | | | 14,000 | |
| | 157,074 | | | First Franklin Mortgage Loan Trust Series 2004-FF2 M5(f) | | TSFR1M + 1.614% | | 6.9700 | | 03/25/34 | | | 147,366 | |
| | 977,580 | | | First Franklin Mortgage Loan Trust Series 2004-FFH3 M4(f) | | TSFR1M + 1.719% | | 7.0750 | | 10/25/34 | | | 881,423 | |
| | 1,742,693 | | | Fremont Home Loan Trust Series 2002-2 M1(f) | | TSFR1M + 1.839% | | 7.1950 | | 10/25/33 | | | 1,821,767 | |
| | 35,506 | | | Fremont Home Loan Trust Series 2004-B M7(f) | | TSFR1M + 3.114% | | 8.4700 | | 05/25/34 | | | 25,870 | |
| | 16,133 | | | Fremont Home Loan Trust Series 2005-A M3(f) | | TSFR1M + 0.849% | | 6.2050 | | 01/25/35 | | | 15,640 | |
| | 32,372 | | | GSAMP Trust Series 2003-SEA2 A1(h) | | | | 5.4210 | | 07/25/33 | | | 31,373 | |
| | 88,445 | | | GSAMP Trust Series 2004-HE1 M1(f) | | TSFR1M + 0.939% | | 6.2950 | | 05/25/34 | | | 80,146 | |
| | 32,962,708 | | | GSAMP Trust Series 2006-S6 A2(h),(j) | | | | 0.0200 | | 10/25/36 | | | 239,685 | |
| | 12,901,896 | | | GSAMP Trust Series 2006-S6 A3(f),(j) | | TSFR1M + 0.574% | | 2.5200 | | 10/25/36 | | | 96,084 | |
| | 4,446,251 | | | GSAMP Trust Series 2006-S6 A1C(f),(j) | | TSFR1M + 0.314% | | 2.5200 | | 10/25/36 | | | 33,209 | |
| | 3,337,289 | | | Lehman XS Trust Series 2005-4 1M1(f) | | TSFR1M + 0.864% | | 6.2200 | | 10/25/35 | | | 3,530,002 | |
| | 506,067 | | | Lehman XS Trust Series 2007-3 1AA1(f) | | TSFR1M + 0.434% | | 5.7900 | | 03/25/37 | | | 403,348 | |
| | 918,049 | | | Long Beach Mortgage Loan Trust Series 2002-1 M3(f) | | TSFR1M + 3.864% | | 9.2200 | | 05/25/32 | | | 935,462 | |
| | 25,339,793 | | | Long Beach Mortgage Loan Trust Series 2006-A A1(f) | | TSFR1M + 0.294% | | 5.6400 | | 05/25/36 | | | 507,853 | |
| | 16,399,758 | | | Long Beach Mortgage Loan Trust Series 2006-A A3(f)(j) | | TSFR1M + 0.514% | | 5.8600 | | 05/25/36 | | | 333,240 | |
| | 4,650,286 | | | Long Beach Mortgage Loan Trust Series 2005-WL1 3M3(f) | | TSFR1M + 1.089% | | 6.4450 | | 06/25/45 | | | 4,505,585 | |
| | 427,286 | | | Long Beach Mortgage Loan Trust 2003-2 Series 2 M3(f) | | TSFR1M + 3.489% | | 8.8450 | | 06/25/33 | | | 450,676 | |
See accompanying notes which are an integral part of these financial statements.
| RATIONAL SPECIAL SITUATIONS INCOME FUND |
| SCHEDULE OF INVESTMENTS (Continued) |
| December 31, 2023 |
| Principal | | | | | | | Coupon Rate | | | | | |
| Amount ($) | | | | | Spread | | (%) | | Maturity | | Fair Value | |
| | | | | ASSET BACKED SECURITIES — 79.8% (Continued) | | | | | | | | | | |
| | | | | RESIDENTIAL MORTGAGE — 10.9% (Continued) | | | | | | | | | | |
| | 1,720,548 | | | Merrill Lynch Mortgage Investors Trust Series 2003-WMC2 B1(f) | | TSFR1M + 4.389% | | 9.7450 | | 02/25/34 | | $ | 1,344,516 | |
| | 1,209,337 | | | Morgan Stanley A.B.S Capital I Inc Trust Series 2005-WMC2 M3(f) | | TSFR1M + 0.819% | | 6.1750 | | 02/25/35 | | | 1,183,244 | |
| | 1,964,518 | | | Ownit Mortgage Loan Trust Series 2005-4 M1(f) | | TSFR1M + 0.939% | | 6.2950 | | 08/25/36 | | | 1,727,186 | |
| | 3,080,000 | | | RAAC Series Trust Series 2005-RP2 M6(c),(f) | | SOFRRATE + 3.114% | | 7.4700 | | 06/25/35 | | | 3,092,712 | |
| | 8,103,518 | | | RAAC Series Trust Series 2005-SP3 SB (g) | | | | 0.0000 | | 12/25/35 | | | 5,694,654 | |
| | 1,748,183 | | | RAAC Series Trust Series 2006-SP4 M4(f) | | TSFR1M + 2.514% | | 7.8700 | | 11/25/36 | | | 1,990,381 | |
| | 1,648,964 | | | RAAC Series Trust Series 2006-SP1 M2(f) | | TSFR1M + 0.939% | | 6.2950 | | 09/25/45 | | | 1,162,747 | |
| | 8,375,433 | | | RAAC Series Trust Series 2006-RP1 M3(c),(f) | | TSFR1M + 1.964% | | 7.3200 | | 10/25/45 | | | 8,364,954 | |
| | 2,759,324 | | | RAAC Series Trust Series 2006-RP1 M4(c),(f) | | TSFR1M + 1.989% | | 7.3450 | | 10/25/45 | | | 2,768,845 | |
| | 4,000,000 | | | RAAC Series Trust Series 2006-RP4 M2(f) | | TSFR1M + 1.614% | | 6.9700 | | 01/25/46 | | | 3,974,987 | |
| | 4,638,000 | | | RAAC Series Trust Series 2006-RP4 M3(f) | | TSFR1M + 2.114% | | 7.4700 | | 01/25/46 | | | 4,578,566 | |
| | 508,785 | | | RAMP Series Trust Series 2004-SL3 A4 | | | | 3.9880 | | 12/25/31 | | | 242,316 | |
| | 650,166 | | | RAMP Series Trust Series 2003-RS7 MII2(f) | | TSFR1M + 1.914% | | 5.1140 | | 08/25/33 | | | 608,043 | |
| | 381,338 | | | RAMP Series Trust Series 2003-RS10 MII2(f) | | TSFR1M + 1.814% | | 5.1910 | | 11/25/33 | | | 368,867 | |
| | 172,139 | | | RAMP Series Trust Series 2006-RS6 A4(f) | | TSFR1M + 0.654% | | 6.0100 | | 11/25/36 | | | 136,658 | |
| | 616,847 | | | RFSC Series Trust Series 2002-RP2 A1(c),(f) | | TSFR1M + 1.614% | | 6.9700 | | 10/25/32 | | | 601,451 | |
| | 218,143 | | | RFSC Trust Series 2002-RP1 A1(c),(f) | | TSFR1M + 0.974% | | 6.3300 | | 03/25/33 | | | 213,543 | |
| | 54,389 | | | SACO I Trust Series 2005-WM2 M1(f) | | TSFR1M + 0.939% | | 6.2950 | | 07/25/35 | | | 55,696 | |
| | 28,157 | | | SACO I Trust Series 2006-6 A(f) | | TSFR1M + 0.374% | | 5.7300 | | 06/25/36 | | | 44,767 | |
| | 825,546 | | | Sail Net Interest Margin Notes Series BC1A B(c),(g) | | | | 0.0000 | | 01/27/33 | | | 634,166 | |
| | 576,011 | | | Sail Net Interest Margin Notes Series 2003-6A A(c) | | | | 7.0000 | | 07/27/33 | | | 1,627,580 | |
| | 3,180,517 | | | SASCO ARC NIM Series 2003-5(c) | | | | 6.0000 | | 06/27/33 | | | 3,236,592 | |
| | 3,156,043 | | | SHARPS OTC Series 2002-AQ1N (g) | | | | 0.0000 | | 04/25/31 | | | 1,900,000 | |
| | 24,040 | | | Soundview Home Loan Trust Series 2004-1 M2(f) | | TSFR1M + 1.134% | | 6.4900 | | 07/25/34 | | | 22,361 | |
| | 142,932 | | | Soundview Home Loan Trust Series 2004-1 M7(f) | | TSFR1M + 3.039% | | 8.3950 | | 07/25/34 | | | 121,058 | |
| | 930,065 | | | Soundview Home Loan Trust Series 2004-1 M9(f) | | TSFR1M + 4.989% | | 10.3450 | | 07/25/34 | | | 779,425 | |
| | 2,878,885 | | | Structured Asset Investment Loan Trust Series 2004-8 M9(f) | | TSFR1M + 3.864% | | 9.2200 | | 09/25/34 | | | 2,221,497 | |
| | 56,760 | | | Structured Asset Securities Corp Mortgage Series 2004-6XS A5B(h) | | | | 6.0500 | | 03/25/34 | | | 56,325 | |
| | 31,869 | | | Structured Asset Securities Corp Mortgage Loan Series 2005-2XS 2A2(f) | | TSFR1M + 1.614% | | 6.9350 | | 02/25/35 | | | 31,787 | |
| | 475,439 | | | Structured Asset Securities Corp Mortgage Loan Series 2005-WF2 M2(f) | | TSFR1M + 0.744% | | 6.1000 | | 05/25/35 | | | 467,858 | |
| | 470,541 | | | Structured Asset Securities Corp Mortgage Loan Series 2005-WF2 M5(f) | | TSFR1M + 1.059% | | 6.4150 | | 05/25/35 | | | 452,040 | |
| | 357,135 | | | Structured Asset Securities Corp Mortgage Loan Series 2005-WF2 M6(f) | | TSFR1M + 1.104% | | 6.4600 | | 05/25/35 | | | 342,670 | |
See accompanying notes which are an integral part of these financial statements.
| RATIONAL SPECIAL SITUATIONS INCOME |
| FUND SCHEDULE OF INVESTMENTS |
| (Continued) December 31, 2023 |
| Principal | | | | | | | Coupon Rate | | | | | |
| Amount ($) | | | | | Spread | | (%) | | Maturity | | Fair Value | |
| | | | | ASSET BACKED SECURITIES — 79.8% (Continued) | | | | | | | | | | |
| | | | | RESIDENTIAL MORTGAGE — 10.9% (Continued) | | | | | | | | | | |
| | 145,141 | | | Structured Asset Securities Corp Mortgage Loan Series 2005-WF2 M7(f) | | TSFR1M + 1.764% | | 7.1200 | | 05/25/35 | | $ | 142,757 | |
| | 3,499,574 | | | Washington Mutual Asset-Backed Certificates WMABS Series 2006- HE5 1A(f) | | TSFR1M + 0.424% | | 4.4860 | | 10/25/36 | | | 2,598,369 | |
| | | | | | | | | | | | | | 85,352,946 | |
| | | | | WHOLE BUSINESS — 0.0%(b) | | | | | | | | | | |
| | 2,000,000 | | | LOANME TRUST SBL Series 2019-1 C(c),(h) | | | | 15.0000 | | 08/15/30 | | | 320,000 | |
| | | | | | | | | | | | | | | |
| | | | | TOTAL ASSET BACKED SECURITIES (Cost $666,630,965) | | | | | | | | | 621,240,838 | |
| | | | | | | | | | | | | | | |
| | | | | CORPORATE BONDS — 17.8% | | | | | | | | | | |
| | | | | BANKING — 0.4% | | | | | | | | | | |
| | 3,410,000 | | | Southern Financial | | | | 10.6000 | | 09/07/30 | | | 3,230,975 | |
| | | | | | | | | | | | | | | |
| | | | | INSURANCE — 14.3% | | | | | | | | | | |
| | 572,271 | | | Ambac Assurance Corporation (g) | | | | 0.0000 | | 06/07/60 | | | 744,860 | |
| | 69,761,475 | | | Ambac Assurance Corporation(c),(g) | | | | 0.0000 | | 06/07/69 | | | 90,800,497 | |
| | 900,000 | | | MBIA Global Funding, LLC(e),(f) | | EUAMDB10 - 0.448% | | 2.2280 | | 06/09/25 | | | 904,173 | |
| | 10,652,561 | | | MBIA Global Funding, LLC(c),(g) | | | | 0.0000 | | 12/15/31 | | | 4,474,076 | |
| | 42,493,421 | | | MBIA Global Funding, LLC(g),(j) | | | | 0.0000 | | 12/15/33 | | | 14,022,829 | |
| | | | | | | | | | | | | | 110,946,435 | |
| | | | | SPECIALTY FINANCE — 1.2% | | | | | | | | | | |
| | 1,876,072 | | | OWS Cre Funding I, LLC Series MARG A(c),(f) | | SOFRRATE + 5.014% | | 10.3370 | | 09/15/24 | | | 1,873,305 | |
| | 2,000,000 | | | PDOF MSN Issuer, LLC(c),(f) | | SOFRRATE + 4.500% | | 9.9000 | | 03/01/25 | | | 1,975,964 | |
| | 996,970 | | | US Capital Funding II Ltd. Capital Funding II(c),(f),(j) | | TSFR3M + 1.912% | | 7.2890 | | 08/01/34 | | | 827,766 | |
| | 4,000,000 | | | X-Caliber Funding, LLC(c) | | | | 5.0000 | | 09/24/24 | | | 3,721,508 | |
| | 1,275,000 | | | X-Caliber Funding, LLC(c) | | | | 11.0000 | | 09/24/24 | | | 1,252,406 | |
| | | | | | | | | | | | | | 9,650,949 | |
| | | | | SYNTHETIC FIBERS AND CHEMICALS — 1.9% | | | | | | | | | | |
| | 9,926,807 | | | MSP DEER FINANCE SYNDICATED LOAN | | | | 17.0000 | | 04/09/25 | | | 9,926,806 | |
| | 4,986,915 | | | WATTS GUERRA 005-A DEER FINANCE SYNDICATE LOAN | | | | 15.5000 | | 10/30/25 | | | 4,986,915 | |
| | | | | | | | | | | | | | 14,913,721 | |
| | | | | TOTAL CORPORATE BONDS (Cost $148,333,036) | | | | | | | | | 138,742,080 | |
See accompanying notes which are an integral part of these financial statements.
| RATIONAL SPECIAL SITUATIONS INCOME FUND |
| SCHEDULE OF INVESTMENTS (Continued) |
| December 31, 2023 |
| Shares | | | | | Fair Value | |
| | | | | SHORT-TERM INVESTMENTS — 1.0% | | | | |
| | | | | MONEY MARKET FUNDS - 1.0% | | | | |
| | 7,652,259 | | | First American Treasury Obligations Fund, Class X, 5.28% (Cost $7,652,259)(i) | | $ | 7,652,259 | |
| | | | | | | | | |
| | | | | TOTAL INVESTMENTS - 99.1% (Cost $826,739,484) | | $ | 771,672,388 | |
| | | | | OTHER ASSETS IN EXCESS OF LIABILITIES- 0.9% | | | 6,904,205 | |
| | | | | NET ASSETS - 100.0% | | $ | 778,576,593 | |
| LLC | - Limited Liability Company |
| | |
| LTD | - Limited Company |
| | |
| REMIC | - Real Estate Mortgage Investment Conduit |
| | |
| 12MTA | Federal Reserve US 12 Month Cumulative Avg 1 Year CMT |
| | |
| EUAMDB10 | 10 Year Euribor ICE Swap Rate |
| | |
| H15T1Y | US Treasury Yield Curve Rate T Note Constant Maturity 1 Year |
| | |
| PRIME | Prime Rate by Country United States |
| | |
| SOFR30A | United States 30 Day Average SOFR Secured Overnight Financing Rate |
| | |
| SOFRRATE | United States SOFR Secured Overnight Financing Rate |
| | |
| TSFR1M | 1 Month Secure Overnight Financing Rate |
| | |
| TSFR3M | 3 Month Secure Overnight Financing Rate |
| | |
| TSFR6M | 6 Month Secure Overnight Financing Rate |
| | |
| TSFR12M | 12 Month Secure Overnight Financing Rate |
| | |
| 12MTA | Federal Reserve US 12 Month Cumulative Avg 1 Year CMT |
| | |
| EUAMDB10 | 10 Year Euribor ICE Swap Rate |
| | |
| H15T1Y | US Treasury Yield Curve Rate T Note Constant Maturity 1 Year |
| | |
| PRIME | Prime Rate by Country United States |
| (a) | Non-income producing security. |
| (b) | Percentage rounds to less than 0.1%. |
| (c) | Security exempt from registration under Rule 144A or Section 4(2) of the Securities Act of 1933. The security may be resold in transactions exempt from registration, normally to qualified institutional buyers. As of December 31, 2023 the total market value of 144A securities is 355,980,180 or 45.7% of net assets. |
| (d) | Interest only securities. |
| (e) | Variable or floating rate security, the interest rate of which adjusts periodically based on changes in current interest rates and prepayments on the underlying pool of assets. |
| (f) | Variable rate security: the rate shown represents the rate on December 31, 2023. |
| (h) | Step bond. Coupon rate is fixed rate that changes on a specified date. The rate shown is the current rate at December 31, 2023. |
| (i) | Rate disclosed is the seven day effective yield as of December 31, 2023. |
| (j) | Illiquid security. As of December 31, 2023 the total market value of illiquid securities is 18,234,224 or 2.3% of net assets. |
See accompanying notes which are an integral part of these financial statements.
| RATIONAL REAL ASSETS FUND (FORMERLY RATIONAL INFLATION GROWTH FUND) |
| SCHEDULE OF INVESTMENTS |
| December 31, 2023 |
| Shares | | | | | Fair Value | |
| | | | | COMMON STOCKS — 99.2% | | | | |
| | | | | AEROSPACE & DEFENSE - 6.1% | | | | |
| | 188 | | | General Dynamics Corporation | | $ | 48,818 | |
| | 93 | | | Lockheed Martin Corporation | | | 42,151 | |
| | 131 | | | Northrop Grumman Corporation | | | 61,326 | |
| | 525 | | | Raytheon Technologies Corporation | | | 44,174 | |
| | | | | | | | 196,469 | |
| | | | | CHEMICALS - 9.6% | | | | |
| | 181 | | | Air Products and Chemicals, Inc. | | | 49,558 | |
| | 991 | | | Dow, Inc. | | | 54,346 | |
| | 718 | | | DuPont de Nemours, Inc. | | | 55,236 | |
| | 239 | | | Ecolab, Inc. | | | 47,406 | |
| | 125 | | | New Linde plc | | | 51,339 | |
| | 165 | | | Sherwin-Williams Company (The) | | | 51,464 | |
| | | | | | | | 309,349 | |
| | | | | COMMERCIAL SUPPORT SERVICES - 4.4% | | | | |
| | 287 | | | Republic Services, Inc. | | | 47,329 | |
| | 306 | | | Waste Connections, Inc. | | | 45,677 | |
| | 266 | | | Waste Management, Inc. | | | 47,641 | |
| | | | | | | | 140,647 | |
| | | | | DATA CENTER REIT – 3.0% | | | | |
| | 343 | | | Digital Realty Trust, Inc. | | | 46,161 | |
| | 64 | | | Equinix, Inc. | | | 51,545 | |
| | | | | | | | 97,706 | |
| | | | | DIVERSIFIED INDUSTRIALS - 4.2% | | | | |
| | 438 | | | Emerson Electric Company | | | 42,631 | |
| | 226 | | | Honeywell International, Inc. | | | 47,394 | |
| | 633 | | | Pentair PLC | | | 46,025 | |
| | | | | | | | 136,050 | |
| | | | | ELECTRIC UTILITIES - 9.4% | | | | |
| | 538 | | | American Electric Power Company, Inc. | | | 43,696 | |
| | 1,335 | | | Brookfield Infrastructure Partners, L.P. | | | 42,039 | |
| | 472 | | | Duke Energy Corporation | | | 45,803 | |
| | 1,075 | | | Fortis, Inc. | | | 44,215 | |
| | 629 | | | NextEra Energy, Inc. | | | 38,205 | |
| | 595 | | | Sempra Energy | | | 44,464 | |
See accompanying notes which are an integral part of these financial statements.
| RATIONAL REAL ASSETS FUND (FORMERLY RATIONAL INFLATION GROWTH FUND) |
| SCHEDULE OF INVESTMENTS (Continued) |
| December 31, 2023 |
| Shares | | | | | Fair Value | |
| | | | | COMMON STOCKS — 99.2% (Continued) | | | | |
| | | | | ELECTRIC UTILITIES - 9.4% (Continued) | | | | |
| | 625 | | | Southern Company (The) | | $ | 43,825 | |
| | | | | | | | 302,247 | |
| | | | | GAS & WATER UTILITIES - 1.3% | | | | |
| | 308 | | | American Water Works Company, Inc. | | | 40,653 | |
| | | | | | | | | |
| | | | | HEALTH CARE REIT - 1.5% | | | | |
| | 524 | | | Welltower, Inc. | | | 47,249 | |
| | | | | | | | | |
| | | | | INDUSTRIAL REIT - 2.8% | | | | |
| | 327 | | | Prologis, Inc. | | | 43,589 | |
| | 1,204 | | | STAG Industrial, Inc. | | | 47,269 | |
| | | | | | | | 90,858 | |
| | | | | INFRASTRUCTURE REIT - 2.1% | | | | |
| | 176 | | | American Tower Corporation, A | | | 37,995 | |
| | 253 | | | Crown Castle, Inc. | | | 29,143 | |
| | | | | | | | 67,138 | |
| | | | | MACHINERY - 2.8% | | | | |
| | 155 | | | Caterpillar, Inc. | | | 45,829 | |
| | 108 | | | Deere & Company | | | 43,186 | |
| | | | | | | | 89,015 | |
| | | | | METALS & MINING - 1.6% | | | | |
| | 1,216 | | | Freeport-McMoRan, Inc. | | | 51,765 | |
| | | | | | | | | |
| | | | | OFFICE REIT - 1.5% | | | | |
| | 369 | | | Alexandria Real Estate Equities, Inc. | | | 46,778 | |
| | | | | | | | | |
| | | | | OIL & GAS PRODUCERS - 27.5% | | | | |
| | 353 | | | Cheniere Energy, Inc. | | | 60,261 | |
| | 380 | | | Chevron Corporation | | | 56,681 | |
| | 456 | | | ConocoPhillips | | | 52,928 | |
| | 1,132 | | | Enbridge, Inc. | | | 40,775 | |
| | 3,238 | | | Energy Transfer, L.P. | | | 44,684 | |
| | 1,584 | | | Enterprise Products Partners, L.P. | | | 41,738 | |
| | 349 | | | EOG Resources, Inc. | | | 42,212 | |
See accompanying notes which are an integral part of these financial statements.
| RATIONAL REAL ASSETS FUND (FORMERLY RATIONAL INFLATION GROWTH FUND) |
| SCHEDULE OF INVESTMENTS (Continued) |
| December 31, 2023 |
| Shares | | | | | Fair Value | |
| | | | | COMMON STOCKS — 99.2% (Continued) | | | | |
| | | | | OIL & GAS PRODUCERS - 27.5% (Continued) | | | | |
| | 590 | | | Exxon Mobil Corporation | | $ | 58,988 | |
| | 2,725 | | | Kinder Morgan, Inc. | | | 48,069 | |
| | 1,204 | | | MPLX, L.P. | | | 44,211 | |
| | 825 | | | Occidental Petroleum Corporation | | | 49,261 | |
| | 773 | | | ONEOK, Inc. | | | 54,280 | |
| | 1,350 | | | Pembina Pipeline Corporation | | | 46,467 | |
| | 461 | | | Phillips 66 | | | 61,377 | |
| | 2,643 | | | Plains GP Holdings, L.P., Class A | | | 42,156 | |
| | 499 | | | Targa Resources Corporation | | | 43,348 | |
| | 917 | | | TC Energy Corporation | | | 35,846 | |
| | 1,648 | | | Williams Companies, Inc. (The) | | | 57,400 | |
| | | | | | | | 880,682 | |
| | | | | OIL & GAS SERVICES & EQUIPMENT - 1.0% | | | | |
| | 636 | | | Schlumberger Ltd | | | 33,097 | |
| | | | | | | | | |
| | | | | RENEWABLE ENERGY - 1.3% | | | | |
| | 1,926 | | | Atlantica Sustainable Infrastructure plc | | | 41,409 | |
| | | | | | | | | |
| | | | | SELF-STORAGE REIT - 1.3% | | | | |
| | 138 | | | Public Storage | | | 42,090 | |
| | | | | | | | | |
| | | | | STEEL - 8.2% | | | | |
| | 366 | | | Nucor Corporation | | | 63,699 | |
| | 220 | | | Reliance Steel & Aluminum Company | | | 61,530 | |
| | 519 | | | Steel Dynamics, Inc. | | | 61,294 | |
| | 1,544 | | | United States Steel Corporation | | | 75,115 | |
| | | | | | | | 261,638 | |
| | | | | TIMBER REIT - 1.4% | | | | |
| | 1,295 | | | Weyerhaeuser Company | | | 45,027 | |
| | | | | | | | | |
| | | | | TRANSPORTATION & LOGISTICS - 8.2% | | | | |
| | 375 | | | Canadian National Railway Company | | | 47,111 | |
| | 594 | | | Canadian Pacific Kansas City Ltd. | | | 46,962 | |
| | 1,234 | | | CSX Corporation | | | 42,783 | |
See accompanying notes which are an integral part of these financial statements.
| RATIONAL REAL ASSETS FUND (FORMERLY RATIONAL INFLATION GROWTH FUND) |
| SCHEDULE OF INVESTMENTS (Continued) |
| December 31, 2023 |
| Shares | | | | | Fair Value | |
| | | | | COMMON STOCKS — 99.2% (Continued) | | | | |
| | | | | TRANSPORTATION & LOGISTICS - 8.2% (Continued) | | | | |
| | 156 | | | Norfolk Southern Corporation | | $ | 36,875 | |
| | 202 | | | Union Pacific Corporation | | | 49,615 | |
| | 239 | | | United Parcel Service, Inc., B | | | 37,578 | |
| | | | | | | | 260,924 | |
| | | | | | | | | |
| | | | | TOTAL COMMON STOCKS (Cost $2,963,525) | | | 3,180,791 | |
| | | | | | | | | |
| | | | | SHORT-TERM INVESTMENTS — 1.2% | | | | |
| | | | | MONEY MARKET FUNDS - 1.2% | | | | |
| | 37,041 | | | First American Treasury Obligations Fund, Class X, 5.28% (Cost $37,041)(a) | | | 37,041 | |
| | | | | | | | | |
| | | | | TOTAL INVESTMENTS - 100.4% (Cost $3,000,566) | | $ | 3,217,832 | |
| | | | | LIABILITIES IN EXCESS OF OTHER ASSETS - (0.4)% | | | (11,665 | ) |
| | | | | NET ASSETS - 100.0% | | $ | 3,206,167 | |
| LP | - Limited Partnership |
| | |
| LTD | - Limited Company |
| | |
| PLC | - Public Limited Company |
| | |
| REIT | - Real Estate Investment Trust |
| (a) | Rate disclosed is the seven day effective yield as of December 31, 2023. |
See accompanying notes which are an integral part of these financial statements.
| RATIONAL FUNDS |
| Statements of Assets and Liabilities |
| December 31, 2023 |
| | | Rational | | | Rational | | | Rational | | | Rational | |
| | | Equity Armor | | | Tactical Return | | | Dynamic Brands | | | Strategic Allocation | |
| | | Fund | | | Fund | | | Fund | | | Fund | |
| ASSETS: | | | | | | | | | | | | | | | | |
| Investments in Unaffiliated securities, at cost | | $ | 33,483,526 | | | $ | 122,124,531 | | | $ | 46,588,129 | | | $ | 572,305 | |
| Investments in Affiliated securities, at cost | | | — | | | | — | | | | — | | | | 8,517,289 | |
| Total Securities at Cost | | $ | 33,483,526 | | | $ | 122,124,531 | | | $ | 46,588,129 | | | $ | 9,089,594 | |
| | | | | | | | | | | | | | | | | |
| Investments in Unaffiliated securities, at value | | $ | 38,139,894 | | | $ | 122,105,492 | | | $ | 63,197,091 | | | $ | 571,879 | |
| Investments in Affiliated securities, at value | | | — | | | | — | | | | — | | | | 8,651,361 | |
| Total Securities at Value | | $ | 38,139,894 | | | $ | 122,105,492 | | | $ | 63,197,091 | | | $ | 9,223,240 | |
| Deposits with Brokers for futures and options | | | 3,575,244 | | | | 10,604,119 | | | | — | | | | 696,510 | |
| Receivable for Fund shares sold | | | 45,000 | | | | 93,525 | | | | 2,167 | | | | 7,145 | |
| Futures unrealized appreciation | | | 168,345 | | | | — | | | | — | | | | 71,400 | |
| Dividends and interest receivable | | | 33,416 | | | | 213,938 | | | | 100,432 | | | | 22,408 | |
| Due from Advisor | | | — | | | | — | | | | — | | | | 10,372 | |
| Prepaid expenses and other assets | | | 42,225 | | | | 27,013 | | | | 38,387 | | | | 17,624 | |
| Total Assets | | | 42,004,124 | | | | 133,044,087 | | | | 63,338,077 | | | | 10,048,699 | |
| | | | | | | | | | | | | | | | | |
| LIABILITIES: | | | | | | | | | | | | | | | | |
| Options written (premiums received $66,555, $103,740, $0, $0) | | | 30,667 | | | | 39,900 | | | | — | | | | — | |
| Payable for securities purchased | | | — | | | | — | | | | 251,174 | | | | 19,070 | |
| Management fees payable | | | 26,397 | | | | 197,824 | | | | 43,559 | | | | — | |
| Futures unrealized depreciation | | | 210,467 | | | | — | | | | — | | | | — | |
| Payable for Fund shares redeemed | | | 6,119,291 | | | | 935,604 | | | | 134,829 | | | | 410 | |
| Payable to related parties | | | 7,477 | | | | 14,304 | | | | 7,004 | | | | 2,983 | |
| Shareholder services fees payable | | | 4,664 | | | | 21,209 | | | | 8,299 | | | | 829 | |
| Accrued 12b-1 fees | | | 598 | | | | 12,718 | | | | 14,898 | | | | 3,420 | |
| Trustee fees payable | | | 4,159 | | | | 4,269 | | | | 4,151 | | | | 4,219 | |
| Accrued expenses and other liabilities | | | 32,867 | | | | 35,914 | | | | 30,953 | | | | 26,722 | |
| Total Liabilities | | | 6,436,587 | | | | 1,261,742 | | | | 494,867 | | | | 57,653 | |
| | | | | | | | | | | | | | | | | |
| Net Assets | | $ | 35,567,537 | | | $ | 131,782,345 | | | $ | 62,843,210 | | | $ | 9,991,046 | |
| | | | | | | | | | | | | | | | | |
| NET ASSETS CONSIST OF: | | | | | | | | | | | | | | | | |
| Paid in capital | | $ | 37,543,638 | | | $ | 133,138,319 | | | $ | 63,943,319 | | | $ | 11,520,290 | |
| Accumulated earnings (deficits) | | | (1,976,101 | ) | | | (1,355,974 | ) | | | (1,100,109 | ) | | | (1,529,244 | ) |
| Net Assets | | $ | 35,567,537 | | | $ | 131,782,345 | | | $ | 62,843,210 | | | $ | 9,991,046 | |
| | | | | | | | | | | | | | | | | |
| Institutional Shares | | | | | | | | | | | | | | | | |
| Net Assets | | $ | 25,740,978 | | | $ | 119,144,173 | | | $ | 44,767,059 | | | $ | 1,206,261 | |
| Shares of beneficial interest outstanding (a) | | | 3,143,244 | | | | 7,047,815 | | | | 862,034 | | | | 150,585 | |
| Net asset value, offering price and redemption price per share (c) | | $ | 8.19 | | | $ | 16.91 | | | $ | 51.93 | | | $ | 8.01 | |
| | | | | | | | | | | | | | | | | |
| Class A Shares | | | | | | | | | | | | | | | | |
| Net Assets | | $ | 8,603,816 | | | $ | 7,327,535 | | | $ | 14,455,598 | | | $ | 8,783,895 | |
| Shares of beneficial interest outstanding (a) | | | 1,054,516 | | | | 432,835 | | | | 459,018 | | | | 1,090,458 | |
| Net asset value and redemption price per share | | $ | 8.16 | | | $ | 16.93 | | | $ | 31.49 | | | $ | 8.06 | |
| Maximum offering price per share (b) | | $ | 8.57 | | | $ | 17.77 | | | $ | 33.06 | | | $ | 8.46 | |
| | | | | | | | | | | | | | | | | |
| Class C Shares | | | | | | | | | | | | | | | | |
| Net Assets | | $ | 1,222,743 | | | $ | 5,310,637 | | | $ | 3,620,553 | | | | 890 | |
| Shares of beneficial interest outstanding (a) | | | 152,030 | | | | 325,966 | | | | 140,205 | | | | 111 | |
| Net asset value, offering price and redemption price per share (c) | | $ | 8.04 | | | $ | 16.29 | | | $ | 25.82 | | | $ | 8.00 | (d) |
| (a) | Unlimited number of shares of no par value beneficial interest authorized. |
| (b) | There is a maximum front-end sales charge (load) of 4.75% imposed on purchases of Class A shares for each Fund. |
| (c) | A contingent deferred sales charge (“CDSC”) of 1.00% may be charged on shares held less than 12 months. |
| (d) | Does not calculate due to rounding. |
See accompanying notes which are an intergral part of these consolidated financial statements.
| RATIONAL FUNDS |
| Statements of Assets and Liabilities (Continued) |
| December 31, 2023 |
| | | Rational/ | | | Rational/Pier 88 | | | Rational | | | Rational Real Assets | |
| | | ReSolve Adaptive | | | Convertible Securities | | | Special Situations | | | (Formerly Inflation | |
| | | Asset Allocation Fund | | | Fund | | | Income Fund | | | Growth) Fund | |
| | | (Consolidated) | | | | | | | | | | |
| ASSETS: | | | | | | | | | | | | | | | | |
| Securities at Cost | | $ | 82,166,637 | | | $ | 132,785,515 | | | $ | 826,739,484 | | | $ | 3,000,566 | |
| Securities at Value | | $ | 82,172,483 | | | $ | 136,942,796 | | | $ | 771,672,388 | | | $ | 3,217,832 | |
| Cash | | | — | | | | — | | | | 3,638,958 | | | | — | |
| Deposits with Brokers for futures | | | 4,591,564 | | | | — | | | | — | | | | — | |
| Futures unrealized appreciation | | | 1,467,302 | | | | — | | | | — | | | | — | |
| Foreign cash deposits with brokers for futures (Cost $9,025,547, $0, $0, $0) | | | 9,157,385 | | | | — | | | | — | | | | — | |
| Receivable for securities sold | | | — | | | | — | | | | 140,101 | | | | — | |
| Dividends and interest receivable | | | 124,036 | | | | 317,100 | | | | 4,572,241 | | | | 3,833 | |
| Receivable for Fund shares sold | | | 16,599 | | | | 18,482 | | | | 1,224,672 | | | | — | |
| Due from Advisor | | | — | | | | — | | | | — | | | | 10,909 | |
| Prepaid expenses and other assets | | | 28,757 | | | | 33,959 | | | | 57,554 | | | | 5,726 | |
| Total Assets | | | 97,558,126 | | | | 137,312,337 | | | | 781,305,914 | | | | 3,238,300 | |
| | | | | | | | | | | | | | | | | |
| LIABILITIES: | | | | | | | | | | | | | | | | |
| Futures unrealized depreciation | | | 1,891,556 | | | | — | | | | — | | | | — | |
| Management fees payable | | | 128,098 | | | | 71,523 | | | | 947,374 | | | | — | |
| Payable for Fund shares redeemed | | | 787,125 | | | | 4,903 | | | | 1,391,723 | | | | — | |
| Payable to related parties | | | 11,700 | | | | 12,671 | | | | 90,101 | | | | 1,893 | |
| Accrued 12b-1 fees | | | 1,018 | | | | 2,375 | | | | 128,850 | | | | 95 | |
| Shareholder services fees payable | | | 7,379 | | | | 13,108 | | | | 78,281 | | | | 341 | |
| Trustee fees payable | | | 4,432 | | | | 4,206 | | | | 4,129 | | | | 4,164 | |
| Accrued expenses and other liabilities | | | 27,597 | | | | 28,392 | | | | 88,863 | | | | 25,640 | |
| Total Liabilities | | | 2,858,905 | | | | 137,178 | | | | 2,729,321 | | | | 32,133 | |
| | | | | | | | | | | | | | | | | |
| Net Assets | | $ | 94,699,221 | | | $ | 137,175,159 | | | $ | 778,576,593 | | | $ | 3,206,167 | |
| | | | | | | | | | | | | | | | | |
| NET ASSETS CONSIST OF: | | | | | | | | | | | | | | | | |
| Paid in capital | | $ | 98,800,478 | | | $ | 143,974,729 | | | $ | 858,212,066 | | | $ | 3,232,921 | |
| Accumulated earnings (deficits) | | | (4,101,257 | ) | | | (6,799,570 | ) | | | (79,635,473 | ) | | | (26,754 | ) |
| Net Assets | | $ | 94,699,221 | | | $ | 137,175,159 | | | $ | 778,576,593 | | | $ | 3,206,167 | |
| | | | | | | | | | | | | | | | | |
| Institutional Shares | | | | | | | | | | | | | | | | |
| Net Assets | | $ | 89,561,773 | | | $ | 135,200,521 | | | $ | 681,473,436 | | | $ | 2,866,381 | |
| Shares of beneficial interest outstanding (a) | | | 4,533,986 | | | | 12,836,775 | | | | 38,430,401 | | | | 279,368 | |
| Net asset value, offering price and redemption price per share | | $ | 19.75 | | | $ | 10.53 | | | $ | 17.73 | | | $ | 10.26 | |
| | | | | | | | | | | | | | | | | |
| Class A Shares | | | | | | | | | | | | | | | | |
| Net Assets | | $ | 2,113,481 | | | $ | 1,654,963 | | | $ | 62,427,522 | | | $ | 330,428 | |
| Shares of beneficial interest outstanding (a) | | | 108,159 | | | | 157,476 | | | | 3,524,928 | | | | 32,255 | |
| Net asset value and redemption price per share | | $ | 19.54 | | | $ | 10.51 | | | $ | 17.71 | | | $ | 10.24 | |
| Maximum offering price per share (b) | | $ | 20.73 | | | $ | 11.03 | | | $ | 18.59 | | | $ | 10.86 | |
| | | | | | | | | | | | | | | | | |
| Class C Shares | | | | | | | | | | | | | | | | |
| Net Assets | | $ | 3,023,967 | | | $ | 319,675 | | | $ | 34,675,635 | | | $ | 9,358 | |
| Shares of beneficial interest outstanding (a) | | | 161,031 | | | | 30,610 | | | | 1,963,532 | | | | 924 | |
| Net asset value, offering price and redemption price per share (c) | | $ | 18.78 | | | $ | 10.44 | | | $ | 17.66 | | | $ | 10.13 | |
| (a) | Unlimited number of shares of no par value beneficial interest authorized. |
| (b) | There is a maximum front-end sales charge (load) of 4.75% imposed on purchases of Class A shares for each Fund except Resolve Adaptive Asset Allocation Fund and Real Asset Fund whose maximum front-end sales charge (load) is 5.75%. |
| (c) | A contingent deferred sales charge (“CDSC”) of 1.00% may be charged on shares held less than 12 months. |
See accompanying notes which are an intergral part of these consolidated financial statements.
| RATIONAL FUNDS |
| Statements of Operations |
| For the Year Ended December 31, 2023 |
| | | Rational | | | Rational | | | Rational | | | Rational | |
| | | Equity Armor | | | Tactical Return | | | Dynamic Brands | | | Strategic Allocation | |
| | | Fund | | | Fund | | | Fund | | | Fund | |
| Investment Income: | | | | | | | | | | | | | | | | |
| Dividend income | | $ | 703,348 | | | $ | — | | | $ | 452,189 | | | $ | — | |
| Interest income | | | 54,886 | | | | 5,788,785 | | | | 42,599 | | | | 36,796 | |
| Dividend income - affiliated companies (Note 3) | | | — | | | | — | | | | — | | | | 329,677 | |
| Foreign tax withheld | | | (7,009 | ) | | | — | | | | (7,062 | ) | | | — | |
| Total Investment Income | | | 751,225 | | | | 5,788,785 | | | | 487,726 | | | | 366,473 | |
| | | | | | | | | | | | | | | | | |
| Operating Expenses: | | | | | | | | | | | | | | | | |
| Investment management fees | | | 390,600 | | | | 2,949,032 | | | | 385,826 | | | | 8,081 | |
| 12b-1 Fees - Class A Shares | | | 22,201 | | | | 19,305 | | | | 33,122 | | | | 17,621 | |
| 12b-1 Fees - Class C Shares | | | 14,288 | | | | 69,691 | | | | 32,231 | | | | 7 | |
| Shareholder Services Fees - Institutional Shares | | | 45,760 | | | | 174,033 | | | | 32,591 | | | | — | |
| Shareholder Services Fees - Class A Shares | | | 9,842 | | | | 8,784 | | | | 13,159 | | | | 6,910 | |
| Shareholder Services Fees - Class C Shares | | | 790 | | | | 4,678 | | | | 1,935 | | | | — | |
| Financial Administration fees/Fund Accounting fees | | | 57,695 | | | | 109,680 | | | | 45,118 | | | | 29,143 | |
| Registration fees | | | 51,828 | | | | 60,606 | | | | 53,768 | | | | 13,295 | |
| Legal Administration/Management Service Fees | | | 18,458 | | | | 59,717 | | | | 17,867 | | | | 2,869 | |
| Legal fees | | | 30,934 | | | | 29,741 | | | | 33,327 | | | | 27,223 | |
| Audit fees | | | 15,002 | | | | 14,922 | | | | 13,912 | | | | 14,922 | |
| Compliance officer fees | | | 13,804 | | | | 18,437 | | | | 15,460 | | | | 7,389 | |
| Printing expense | | | 7,528 | | | | 17,466 | | | | 7,324 | | | | 1,686 | |
| Trustees’ fees | | | 16,517 | | | | 16,625 | | | | 16,517 | | | | 16,625 | |
| Custody fees | | | 10,493 | | | | 4,947 | | | | 5,396 | | | | 3,497 | |
| Insurance expense | | | 3,519 | | | | 11,320 | | | | 2,640 | | | | 352 | |
| Interest expense | | | 80,353 | | | | 9,416 | | | | 1,778 | | | | 869 | |
| Miscellaneous expenses | | | 2,725 | | | | 2,425 | | | | 2,720 | | | | 2,426 | |
| Total Operating Expenses | | | 792,337 | | | | 3,580,825 | | | | 714,691 | | | | 152,915 | |
| | | | | | | | | | | | | | | | | |
| Less: Expenses waived/reimbursed by Advisor | | | — | | | | (133,607 | ) | | | (9,477 | ) | | | (97,614 | ) |
| Net Operating Expenses | | | 792,337 | | | | 3,447,218 | | | | 705,214 | | | | 55,301 | |
| | | | | | | | | | | | | | | | | |
| Net Investment Income (Loss) | | | (41,112 | ) | | | 2,341,567 | | | | (217,488 | ) | | | 311,172 | |
| | | | | | | | | | | | | | | | | |
| Realized and Unrealized Gain (Loss) on Investments: | | | | | | | | | | | | | | | | |
| Net Realized Gain (Loss) from: | | | | | | | | | | | | | | | | |
| Investments | | | 4,420,172 | | | | — | | | | 473,826 | | | | — | |
| Affiliated companies | | | — | | | | — | | | | — | | | | (313,863 | ) |
| Options purchased | | | (8,306,475 | ) | | | (8,192,683 | ) | | | — | | | | — | |
| Options written | | | 3,191,573 | | | | 12,975,490 | | | | — | | | | — | |
| Futures | | | 973,360 | | | | 16 | | | | — | | | | 936,417 | |
| Net Realized Gain on Investments | | | 278,630 | | | | 4,782,823 | | | | 473,826 | | | | 622,554 | |
| | | | | | | | | | | | | | | | | |
| Net Change in Unrealized Appreciation (Depreciation) on Investments | | | | | | | | | | | | | | | | |
| Investments | | | 323,200 | | | | 783,762 | | | | 17,738,399 | | | | (426 | ) |
| Affiliated companies | | | — | | | | — | | | | — | | | | 380,125 | |
| Options purchased | | | (186,329 | ) | | | (39,900 | ) | | | — | | | | — | |
| Options written | | | (29,737 | ) | | | 63,840 | | | | — | | | | — | |
| Futures | | | (3,872 | ) | | | — | | | | — | | | | 430,670 | |
| Net Change in Unrealized Appreciation on Investments | | | 103,262 | | | | 807,702 | | | | 17,738,399 | | | | 810,369 | |
| | | | | | | | | | | | | | | | | |
| Net Realized and Unrealized Gain on Investments | | | 381,892 | | | | 5,590,525 | | | | 18,212,225 | | | | 1,432,923 | |
| | | | | | | | | | | | | | | | | |
| Net Increase in Net Assets Resulting From Operations | | $ | 340,780 | | | $ | 7,932,092 | | | $ | 17,994,737 | | | $ | 1,744,095 | |
See accompanying notes which are an intergral part of these consolidated financial statements.
| RATIONAL FUNDS |
| Statements of Operations (Continued) |
| For the Year Ended December 31, 2023 |
| | | Rational/ | | | Rational/ Pier 88 | | | Rational | | | Rational Real Assets | |
| | | ReSolve Adaptive | | | Convertible Securities | | | Special Situations | | | (Formerly Inflation | |
| | | Asset Allocation Fund | | | Fund | | | Income Fund | | | Growth) Fund | |
| | | (Consolidated) | | | | | | | | | | |
| Investment Income: | | | | | | | | | | | | | | | | |
| Dividend income | | $ | — | | | $ | 1,725,414 | | | $ | 207,881 | | | $ | 83,891 | |
| Interest income | | | 5,570,511 | | | | 1,941,377 | | | | 60,694,554 | | | | 1,752 | |
| Foreign tax withheld | | | — | | | | — | | | | — | | | | (2,098 | ) |
| Total Investment Income | | | 5,570,511 | | | | 3,666,791 | | | | 60,902,435 | | | | 83,545 | |
| | | | | | | | | | | | | | | | | |
| Operating Expenses: | | | | | | | | | | | | | | | | |
| Investment management fees | | | 2,366,630 | | | | 978,744 | | | | 12,105,835 | | | | 42,836 | |
| 12b-1 Fees - Class A Shares | | | 6,135 | | | | 4,177 | | | | 165,367 | | | | 1,372 | |
| 12b-1 Fees - Class C Shares | | | 25,484 | | | | 2,931 | | | | 345,681 | | | | 212 | |
| Shareholder Services Fees - Institutional Shares | | | 156,833 | | | | 111,322 | | | | 779,799 | | | | 1,104 | |
| Shareholder Services Fees - Class A Shares | | | 3,021 | | | | 2,066 | | | | 80,379 | | | | 495 | |
| Shareholder Services Fees - Class C Shares | | | 457 | | | | 116 | | | | 21,981 | | | | 23 | |
| Financial Administrative fees /Fund Accounting fees | | | 104,506 | | | | 80,128 | | | | 781,191 | | | | 23,654 | |
| Legal Administration/Management Service Fees | | | 47,933 | | | | 40,890 | | | | 286,432 | | | | 1,215 | |
| Registration fees | | | 64,036 | | | | 34,851 | | | | 80,017 | | | | 12,122 | |
| Printing expenses | | | 15,138 | | | | 7,235 | | | | 82,770 | | | | 2,676 | |
| Legal fees | | | 45,543 | | | | 49,154 | | | | 153,095 | | | | 33,372 | |
| Audit fees | | | 16,258 | | | | 15,704 | | | | 57,253 | | | | 14,789 | |
| Compliance officer fees | | | 15,520 | | | | 17,673 | | | | 32,644 | | | | 11,896 | |
| Custody fees | | | 9,453 | | | | 6,905 | | | | 72,605 | | | | 4,083 | |
| Trustees’ fees | | | 16,772 | | | | 16,625 | | | | 16,517 | | | | 16,517 | |
| Insurance Expense | | | 8,298 | | | | 5,445 | | | | 40,656 | | | | 183 | |
| Interest expense | | | 22,913 | | | | 533 | | | | 533 | | | | 799 | |
| Miscellaneous expense | | | 3,463 | | | | 2,548 | | | | 2,731 | | | | 2,808 | |
| Total Operating Expenses | | | 2,928,393 | | | | 1,377,047 | | | | 15,105,486 | | | | 170,156 | |
| | | | | | | | | | | | | | | | | |
| Less: Expenses waived/reimbursed by Advisor | | | (213,553 | ) | | | (228,670 | ) | | | (348,053 | ) | | | (116,736 | ) |
| Net Operating Expenses | | | 2,714,840 | | | | 1,148,377 | | | | 14,757,433 | | | | 53,420 | |
| | | | | | | | | | | | | | | | | |
| Net Investment Income | | | 2,855,671 | | | | 2,518,414 | | | | 46,145,002 | | | | 30,125 | |
| | | | | | | | | | | | | | | | | |
| Realized and Unrealized Gain (Loss) on Investments: | | | | | | | | | | | | | | | | |
| Net Realized Gain (Loss) from: | | | | | | | | | | | | | | | | |
| Investments | | | — | | | | (4,930,731 | ) | | | (1,950,993 | ) | | | (132,975 | ) |
| Futures | | | (1,943,307 | ) | | | — | | | | — | | | | — | |
| Foreign currency translations | | | (375,068 | ) | | | — | | | | 2,524 | | | | — | |
| Net Realized (Loss) on Investments | | | (2,318,375 | ) | | | (4,930,731 | ) | | | (1,948,469 | ) | | | (132,975 | ) |
| | | | | | | | | | | | | | | | | |
| Net Change in Unrealized Appreciation/(Depreciation) on Investments | | | | | | | | | | | | | | | | |
| Investments | | | (16,432 | ) | | | 5,512,349 | | | | (10,567,327 | ) | | | 315,797 | |
| Futures | | | (1,027,316 | ) | | | — | | | | — | | | | — | |
| Foreign currency translations | | | 154,828 | | | | — | | | | 8 | | | | — | |
| Net Change in Unrealized Appreciation/(Depreciation) on Investments | | | (888,920 | ) | | | 5,512,349 | | | | (10,567,319 | ) | | | 315,797 | |
| | | | | | | | | | | | | | | | | |
| Net Realized and Unrealized Gain (Loss) on Investments | | | (3,207,295 | ) | | | 581,618 | | | | (12,515,788 | ) | | | 182,822 | |
| | | | | | | | | | | | | | | | | |
| Net Increase (Decrease) in Net Assets Resulting From Operations | | $ | (351,624 | ) | | $ | 3,100,032 | | | $ | 33,629,214 | | | $ | 212,947 | |
See accompanying notes which are an intergral part of these consolidated financial statements.
| RATIONAL FUNDS |
| Statements of Changes in Net Assets |
| | | Rational Equity Armor Fund | | | Rational Tactical Return Fund | | | Rational Dynamic Brands Fund | |
| | | | | | | | | | | | | | | | | | | |
| | | Year Ended | | | Year Ended | | | Year Ended | | | Year Ended | | | Year Ended | | | Year Ended | |
| | | December 31, 2023 | | | December 31, 2022 | | | December 31, 2023 | | | December 31, 2022 (a) | | | December 31, 2023 | | | December 31, 2022 | |
| Operations: | | | | | | | | | | | | | | | | | | | | | | | | |
| Net investment income (loss) | | $ | (41,112 | ) | | $ | 511,843 | | | $ | 2,341,567 | | | $ | (2,513,757 | ) | | $ | (217,488 | ) | | $ | (173,666 | ) |
| Net realized gain (loss) on investments, futures and options | | | 278,630 | | | | (2,318,092 | ) | | | 4,782,823 | | | | 2,075,085 | | | | 473,826 | | | | (17,352,970 | ) |
| Net change in unrealized appreciation (depreciation) on investments, options and futures | | | 103,262 | | | | (6,384,874 | ) | | | 807,702 | | | | (762,901 | ) | | | 17,738,399 | | | | (16,361,624 | ) |
| Net increase/(decrease) in net assets resulting from operations | | | 340,780 | | | | (8,191,123 | ) | | | 7,932,092 | | | | (1,201,573 | ) | | | 17,994,737 | | | | (33,888,260 | ) |
| | | | | | | | | | | | | | | | | | | | | | | | | |
| Distributions to Shareholders from: | | | | | | | | | | | | | | | | | | | | | | | | |
| From return of capital: | | | | | | | | | | | | | | | | | | | | | | | | |
| Institutional Class | | | (48,850 | ) | | | — | | | | — | | | | — | | | | — | | | | — | |
| Class A | | | (6,335 | ) | | | — | | | | — | | | | — | | | | — | | | | — | |
| Class C | | | — | | | | — | | | | — | | | | — | | | | — | | | | — | |
| Total Distributions: | | | | | | | | | | | | | | | | | | | | | | | | |
| Institutional | | | (37,091 | ) | | | (422,776 | ) | | | (6,533,525 | ) | | | (587,657 | ) | | | — | | | | (1,638,210 | ) |
| Class A | | | (3,223 | ) | | | (59,377 | ) | | | (372,568 | ) | | | (25,092 | ) | | | — | | | | (973,247 | ) |
| Class C | | | — | | | | (2,599 | ) | | | (249,601 | ) | | | (23,129 | ) | | | — | | | | (285,413 | ) |
| | | | | | | | | | | | | | | | | | | | | | | | | |
| Total distributions to shareholders | | | (95,499 | ) | | | (484,752 | ) | | | (7,155,694 | ) | | | (635,878 | ) | | | — | | | | (2,896,870 | ) |
| | | | | | | | | | | | | | | | | | | | | | | | | |
| Share Transactions of Beneficial Interest: | | | | | | | | | | | | | | | | | | | | | | | | |
| Net proceeds from shares sold | | | | | | | | | | | | | | | | | | | | | | | | |
| Institutional | | | 3,175,525 | | | | 21,027,361 | | | | 22,949,885 | | | | 87,740,700 | | | | 13,166,930 | | | | 5,680,529 | |
| Class A | | | 67,974 | | | | 304,693 | | | | 4,162,468 | | | | 6,155,633 | | | | 1,134,332 | | | | 764,212 | |
| Class C | | | 31,857 | | | | 283,227 | | | | 94,000 | | | | 748,138 | | | | 422,772 | | | | 323,999 | |
| Reinvestment of distributions | | | | | | | | | | | | | | | | | | | | | | | | |
| Institutional | | | 67,847 | | | | 329,729 | | | | 5,908,968 | | | | 559,987 | | | | — | | | | 1,511,755 | |
| Class A | | | 8,738 | | | | 54,332 | | | | 360,835 | | | | 24,328 | | | | — | | | | 945,925 | |
| Class C | | | — | | | | 1,989 | | | | 235,629 | | | | 21,828 | | | | — | | | | 275,353 | |
| Cost of shares redeemed | | | | | | | | | | | | | | �� | | | | | | | | | | |
| Institutional | | | (33,418,089 | ) | | | (17,315,530 | ) | | | (110,270,622 | ) | | | (151,499,329 | ) | | | (9,321,743 | ) | | | (35,122,033 | ) |
| Class A | | | (1,370,674 | ) | | | (1,194,230 | ) | | | (6,050,188 | ) | | | (15,688,159 | ) | | | (2,965,320 | ) | | | (4,581,709 | ) |
| Class C | | | (429,269 | ) | | | (231,797 | ) | | | (2,847,733 | ) | | | (2,258,373 | ) | | | (751,108 | ) | | | (600,543 | ) |
| Net increase (decrease) in net assets from share transactions of beneficial interest | | | (31,866,091 | ) | | | 3,259,774 | | | | (85,456,758 | ) | | | (74,195,247 | ) | | | 1,685,863 | | | | (30,802,512 | ) |
| | | | | | | | | | | | | | | | | | | | | | | | | |
| Total Increase/(Decrease) in Net Assets | | | (31,620,810 | ) | | | (5,416,101 | ) | | | (84,680,360 | ) | | | (76,032,698 | ) | | | 19,680,600 | | | | (67,587,642 | ) |
| | | | | | | | | | | | | | | | | | | | | | | | | |
| Net Assets: | | | | | | | | | | | | | | | | | | | | | | | | |
| Beginning of year | | | 67,188,347 | | | | 72,604,448 | | | | 216,462,705 | | | | 292,495,403 | | | | 43,162,610 | | | | 110,750,252 | |
| End of year | | $ | 35,567,537 | | | $ | 67,188,347 | | | $ | 131,782,345 | | | $ | 216,462,705 | | | $ | 62,843,210 | | | $ | 43,162,610 | |
| | | | | | | | | | | | | | | | | | | | | | | | | |
| Share Activity: | | | | | | | | | | | | | | | | | | | | | | | | |
| Institutional Class | | | | | | | | | | | | | | | | | | | | | | | | |
| Shares Sold | | | 406,114 | | | | 2,423,532 | | | | 1,331,011 | | | | 5,155,027 | | | | 290,990 | | | | 120,318 | |
| Shares Reinvested | | | 8,844 | | | | 39,490 | | | | 350,265 | | | | 32,979 | | | | — | | | | 41,463 | |
| Shares Redeemed | | | (4,278,438 | ) | | | (2,018,009 | ) | | | (6,388,079 | ) | | | (8,911,139 | ) | | | (214,724 | ) | | | (764,698 | ) |
| Net increase (decrease) in shares of Beneficial interest | | | (3,863,480 | ) | | | 445,013 | | | | (4,706,803 | ) | | | (3,723,133 | ) | | | 76,266 | | | | (602,917 | ) |
| | | | | | | | | | | | | | | | | | | | | | | | | |
| Class A | | | | | | | | | | | | | | | | | | | | | | | | |
| Shares Sold | | | 8,824 | | | | 36,260 | | | | 242,907 | | | | 361,310 | | | | 40,623 | | | | 26,807 | |
| Shares Reinvested | | | 1,138 | | | | 6,484 | | | | 21,351 | | | | 1,431 | | | | — | | | | 42,667 | |
| Shares Redeemed | | | (176,790 | ) | | | (142,455 | ) | | | (352,603 | ) | | | (919,797 | ) | | | (108,109 | ) | | | (161,949 | ) |
| Net decrease in shares of Beneficial interest | | | (166,828 | ) | | | (99,711 | ) | | | (88,345 | ) | | | (557,056 | ) | | | (67,486 | ) | | | (92,475 | ) |
| | | | | | | | | | | | | | | | | | | | | | | | | |
| Class C | | | | | | | | | | | | | | | | | | | | | | | | |
| Shares Sold | | | 4,104 | | | | 32,576 | | | | 5,632 | | | | 45,273 | | | | 18,790 | | | | 12,719 | |
| Shares Reinvested | | | — | | | | 239 | | | | 14,482 | | | | 1,333 | | | | — | | | | 15,030 | |
| Shares Redeemed | | | (56,144 | ) | | | (27,194 | ) | | | (170,925 | ) | | | (137,503 | ) | | | (34,381 | ) | | | (26,291 | ) |
| Net increase (decrease) in shares of Beneficial interest | | | (52,040 | ) | | | 5,621 | | | | (150,811 | ) | | | (90,897 | ) | | | (15,591 | ) | | | 1,458 | |
| (a) | Effective April 21, 2022, the Fund had a three-for-one reverse stock split. Per share amounts for the period have been adjusted to give effect to the three-for-one stock split. |
See accompanying notes which are an intergral part of these consolidated financial statements.
| RATIONAL FUNDS |
| Statements of Changes in Net Assets (Continued) |
| | | | | | | | | Rational/ReSolve Adaptive | |
| | | Rational Strategic Allocation Fund | | | Asset Allocation Fund | |
| | | | | | | | | (Consolidated) | |
| | | | | | | | | | | | | |
| | | Year Ended | | | Year Ended | | | Year Ended | | | Year Ended | |
| | | December 31, 2023 | | | December 31, 2022 | | | December 31, 2023 | | | December 31, 2022 | |
| Operations: | | | | | | | | | | | | | | | | |
| Net investment income (loss) | | $ | 311,172 | | | $ | 304,434 | | | $ | 2,855,671 | | | $ | (421,866 | ) |
| Net realized gain (loss) on investments, affiliated companies foreign currency transactions and futures | | | 622,554 | | | | (2,127,656 | ) | | | (2,318,375 | ) | | | (16,065,749 | ) |
| Net change in unrealized appreciation (depreciation) on investments, affiliated companies, foreign currency transactions and futures | | | 810,369 | | | | (1,159,987 | ) | | | (888,920 | ) | | | 247,140 | |
| Net increase (decrease) in net assets resulting from operations | | | 1,744,095 | | | | (2,983,209 | ) | | | (351,624 | ) | | | (16,240,475 | ) |
| | | | | | | | | | | | | | | | | |
| Distributions to Shareholders: | | | | | | | | | | | | | | | | |
| Total Distributions Paid : | | | | | | | | | | | | | | | | |
| Institutional | | | (64,156 | ) | | | (83,338 | ) | | | (9,417,275 | ) | | | (651,751 | ) |
| Class A | | | (380,060 | ) | | | (458,652 | ) | | | (200,067 | ) | | | (13,452 | ) |
| Class C | | | (40 | ) | | | (55 | ) | | | (216,476 | ) | | | (7,002 | ) |
| | | | | | | | | | | | | | | | | |
| Total distributions to shareholders | | | (444,256 | ) | | | (542,045 | ) | | | (9,833,818 | ) | | | (672,205 | ) |
| | | | | | | | | | | | | | | | | |
| Share Transactions of Beneficial Interest: | | | | | | | | | | | | | | | | |
| Net proceeds from shares sold | | | | | | | | | | | | | | | | |
| Institutional | | | 38,188 | | | | 1,002,000 | | | | 32,809,538 | | | | 187,098,307 | |
| Class A | | | 2,179,185 | | | | 222,827 | | | | 287,491 | | | | 4,552,296 | |
| Class C | | | — | | | | — | | | | 1,416,305 | | | | 2,286,395 | |
| Reinvestment of distributions | | | | | | | | | | | | | | | | |
| Institutional | | | 234 | | | | 112 | | | | 7,275,032 | | | | 536,624 | |
| Class A | | | 358,316 | | | | 439,821 | | | | 181,289 | | | | 12,890 | |
| Class C | | | — | | | | — | | | | 216,348 | | | | 6,448 | |
| Cost of shares redeemed | | | | | | | | | | | | | | | | |
| Institutional | | | (35,248 | ) | | | — | | | | (103,766,477 | ) | | | (73,170,887 | ) |
| Class A | | | (925,572 | ) | | | (1,413,314 | ) | | | (1,791,371 | ) | | | (1,153,274 | ) |
| Class C | | | — | | | | — | | | | (696,133 | ) | | | (40,396 | ) |
| Net increase (decrease) in net assets from share transactions of beneficial interest | | | 1,615,103 | | | | 251,446 | | | | (64,067,978 | ) | | | 120,128,403 | |
| | | | | | | | | | | | | | | | | |
| Total Increase (Decrease) in Net Assets | | | 2,914,942 | | | | (3,273,808 | ) | | | (74,253,420 | ) | | | 103,215,723 | |
| | | | | | | | | | | | | | | | | |
| Net Assets: | | | | | | | | | | | | | | | | |
| Beginning of year | | | 7,076,104 | | | | 10,349,912 | | | | 168,952,641 | | | | 65,736,918 | |
| End of year | | $ | 9,991,046 | | | $ | 7,076,104 | | | $ | 94,699,221 | | | $ | 168,952,641 | |
| | | | | | | | | | | | | | | | | |
| Share Activity: | | | | | | | | | | | | | | | | |
| Institutional Class | | | | | | | | | | | | | | | | |
| Shares Sold | | | 4,961 | | | | 99,464 | | | | 1,495,398 | | | | 7,677,669 | |
| Shares Reinvested | | | 32 | | | | 16 | | | | 364,663 | | | | 24,315 | |
| Shares Redeemed | | | (4,557 | ) | | | — | | | | (4,757,460 | ) | | | (3,127,828 | ) |
| Net increase (decrease) in shares of Beneficial interest | | | 436 | | | | 99,480 | | | | (2,897,399 | ) | | | 4,574,156 | |
| | | | | | | | | | | | | | | | | |
| Class A | | | | | | | | | | | | | | | | |
| Shares Sold | | | 285,345 | | | | 22,829 | | | | 13,364 | | | | 190,471 | |
| Shares Reinvested | | | 48,398 | | | | 61,865 | | | | 9,184 | | | | 590 | |
| Shares Redeemed | | | (122,648 | ) | | | (159,887 | ) | | | (82,170 | ) | | | (50,209 | ) |
| Net increase (decrease) in shares of Beneficial interest | | | 211,095 | | | | (75,193 | ) | | | (59,622 | ) | | | 140,852 | |
| | | | | | | | | | | | | | | | | |
| Class C | | | | | | | | | | | | | | | | |
| Shares Sold | | | — | | | | — | | | | 71,521 | | | | 101,635 | |
| Shares Reinvested | | | — | | | | — | | | | 11,404 | | | | 306 | |
| Shares Redeemed | | | — | | | | — | | | | (32,993 | ) | | | (1,837 | ) |
| Net increase in shares of Beneficial interest | | | — | | | | — | | | | 49,932 | | | | 100,104 | |
See accompanying notes which are an intergral part of these consolidated financial statements.
| RATIONAL FUNDS |
| Statements of Changes in Net Assets (Continued) |
| | | | | | | | | | | | | | | Rational Real Assets (Formerly | |
| | | Rational/ Pier 88 Convertible Securities Fund | | | Rational Special Situations Income Fund | | | Inflation Growth) Fund | |
| | | | | | | | | | | | | | | | | | | |
| | | Year Ended | | | Year Ended | | | Year Ended | | | Year Ended | | | Year Ended | | | Year Ended | |
| | | December 31, 2023 | | | December 31, 2022 | | | December 31, 2023 | | | December 31, 2022 | | | December 31, 2023 | | | December 31, 2022 | |
| Operations: | | | | | | | | | | | | | | | | | | | | | | | | |
| Net investment income | | $ | 2,518,414 | | | $ | 2,088,856 | | | $ | 46,145,002 | | | $ | 39,003,107 | | | $ | 30,125 | | | $ | 91,000 | |
| Net realized gain (loss) on investments | | | (4,930,731 | ) | | | (5,114,933 | ) | | | (1,948,469 | ) | | | 5,050,143 | | | | (132,975 | ) | | | (136,995 | ) |
| Net change in unrealized appreciation (depreciation) on investments and foreign currency translations | | | 5,512,349 | | | | (10,880,343 | ) | | | (10,567,319 | ) | | | (55,884,040 | ) | | | 315,797 | | | | (81,345 | ) |
| Net increase/(decrease) in net assets resulting from operations | | | 3,100,032 | | | | (13,906,420 | ) | | | 33,629,214 | | | | (11,830,790 | ) | | | 212,947 | | | | (127,340 | ) |
| | | | | | | | | | | | | | | | | | | | | | | | | |
| Distributions to Shareholders: | | | | | | | | | | | | | | | | | | | | | | | | |
| From return of capital: | | | | | | | | | | | | | | | | | | | | | | | | |
| Institutional Class | | | — | | | | — | | | | (2,023,963 | ) | | | — | | | | — | | | | — | |
| Class A | | | — | | | | — | | | | (189,054 | ) | | | — | | | | — | | | | — | |
| Class C | | | — | | | | — | | | | (99,543 | ) | | | — | | | | — | | | | — | |
| Total Distributions: | | | | | | | | | | | | | | | | | | | | | | | | |
| Institutional | | | (2,727,583 | ) | | | (2,415,541 | ) | | | (51,947,036 | ) | | | (41,509,648 | ) | | | (29,340 | ) | | | (11,474 | ) |
| Class A | | | (33,268 | ) | | | (38,397 | ) | | | (4,610,357 | ) | | | (3,784,353 | ) | | | (4,461 | ) | | | (2,216 | ) |
| Class C | | | (4,028 | ) | | | (3,981 | ) | | | (2,207,665 | ) | | | (1,766,515 | ) | | | (87 | ) | | | (19 | ) |
| | | | | | | | | | | | | | | | | | | | | | | | | |
| Total distributions to shareholders | | | (2,764,879 | ) | | | (2,457,919 | ) | | | (61,077,618 | ) | | | (47,060,516 | ) | | | (33,888 | ) | | | (13,709 | ) |
| | | | | | | | | | | | | | | | | | | | | | | | | |
| Share Transactions of Beneficial Interest: | | | | | | | | | | | | | | | | | | | | | | | | |
| Net proceeds from shares sold | | | | | | | | | | | | | | | | | | | | | | | | |
| Institutional | | | 51,416,853 | | | | 22,415,513 | | | | 320,990,029 | | | | 379,860,402 | | | | 292,470 | | | | 1,749,359 | |
| Class A | | | 180,921 | | | | 692,894 | | | | 20,969,464 | | | | 34,926,155 | | | | 4,713 | | | | 618,606 | |
| Class C | | | 49,358 | | | | 149,625 | | | | 7,224,614 | | | | 9,059,946 | | | | — | | | | 10,000 | |
| Reinvestment of distributions | | | | | | | | | | | | | | | | | | | | | | | | |
| Institutional | | | 866,468 | | | | 812,123 | | | | 46,897,705 | | | | 36,584,265 | | | | 16,694 | | | | 6,367 | |
| Class A | | | 33,268 | | | | 38,397 | | | | 4,324,353 | | | | 3,470,184 | | | | 4,428 | | | | 1,970 | |
| Class C | | | 4,028 | | | | 3,981 | | | | 1,900,968 | | | | 1,426,394 | | | | 23 | | | | 5 | |
| Cost of shares redeemed | | | | | | | | | | | | | | | | | | | | | | | | |
| Institutional | | | (25,292,003 | ) | | | (19,170,407 | ) | | | (328,271,645 | ) | | | (368,917,493 | ) | | | (495,014 | ) | | | (145,932 | ) |
| Class A | | | (428,126 | ) | | | (806,978 | ) | | | (30,894,328 | ) | | | (21,945,600 | ) | | | (479,685 | ) | | | (472,721 | ) |
| Class C | | | (33,700 | ) | | | (62,808 | ) | | | (7,733,843 | ) | | | (8,894,259 | ) | | | (24,174 | ) | | | (813 | ) |
| Capital Contribution | | | | | | | | | | | | | | | | | | | | | | | | |
| Institutional | | | 1,493,367 | | | | — | | | | — | | | | — | | | | — | | | | — | |
| Class A | | | 23,878 | | | | — | | | | — | | | | — | | | | — | | | | — | |
| Class C | | | 4,059 | | | | — | | | | — | | | | — | | | | — | | | | — | |
| Net increase (decrease) in net assets from share transactions of beneficial interest | | | 28,318,371 | | | | 4,072,340 | | | | 35,407,317 | | | | 65,569,994 | | | | (680,545 | ) | | | 1,766,841 | |
| | | | | | | | | | | | | | | | | | | | | | | | | |
| Total Increase/(Decrease) in Net Assets | | | 28,653,524 | | | | (12,291,999 | ) | | | 7,958,913 | | | | 6,678,688 | | | | (501,486 | ) | | | 1,625,792 | |
| | | | | | | | | | | | | | | | | | | | | | | | | |
| Net Assets: | | | | | | | | | | | | | | | | | | | | | | | | |
| Beginning of year | | | 108,521,635 | | | | 120,813,634 | | | | 770,617,680 | | | | 763,938,992 | | | | 3,707,653 | | | | 2,081,861 | |
| End of year | | $ | 137,175,159 | | | $ | 108,521,635 | | | $ | 778,576,593 | | | $ | 770,617,680 | | | $ | 3,206,167 | | | $ | 3,707,653 | |
| | | | | | | | | | | | | | | | | | | | | | | | | |
| Share Activity: | | | | | | | | | | | | | | | | | | | | | | | | |
| Institutional | | | | | | | | | | | | | | | | | | | | | | | | |
| Shares Sold | | | 5,062,725 | | | | 2,003,460 | | | | 17,545,812 | | | | 20,024,080 | | | | 30,468 | | | | 174,869 | |
| Shares Reinvested | | | 84,264 | | | | 77,374 | | | | 2,589,906 | | | | 1,961,926 | | | | 1,750 | | | | 688 | |
| Shares Redeemed | | | (2,506,411 | ) | | | (1,781,095 | ) | | | (18,023,184 | ) | | | (19,716,230 | ) | | | (51,890 | ) | | | (15,257 | ) |
| Net increase (decrease) in shares of Beneficial interest | | | 2,640,578 | | | | 299,739 | | | | 2,112,534 | | | | 2,269,776 | | | | (19,672 | ) | | | 160,300 | |
| | | | | | | | | | | | | | | | | | | | | | | | | |
| Class A | | | | | | | | | | | | | | | | | | | | | | | | |
| Shares Sold | | | 17,720 | | | | 63,854 | | | | 1,149,173 | | | | 1,847,038 | | | | 485 | | | | 61,605 | |
| Shares Reinvested | | | 3,237 | | | | 3,668 | | | | 238,965 | | | | 186,613 | | | | 464 | | | | 213 | |
| Shares Redeemed | | | (41,661 | ) | | | (75,713 | ) | | | (1,691,208 | ) | | | (1,163,524 | ) | | | (50,368 | ) | | | (51,263 | ) |
| Net increase (decrease) in shares of Beneficial interest | | | (20,704 | ) | | | (8,191 | ) | | | (303,070 | ) | | | 870,127 | | | | (49,419 | ) | | | 10,555 | |
| | | | | | | | | | | | | | | | | | | | | | | | | |
| Class C | | | | | | | | | | | | | | | | | | | | | | | | |
| Shares Sold | | | 4,812 | | | | 13,173 | | | | 397,937 | | | | 476,926 | | | | — | | | | 911 | |
| Shares Reinvested | | | 392 | | | | 385 | | | | 105,477 | | | | 76,805 | | | | 2 | | | | 1 | |
| Shares Redeemed | | | (3,349 | ) | | | (5,735 | ) | | | (425,810 | ) | | | (477,681 | ) | | | (2,523 | ) | | | (91 | ) |
| Net increase (decrease) in shares of Beneficial interest | | | 1,855 | | | | 7,823 | | | | 77,604 | | | | 76,050 | | | | (2,521 | ) | | | 821 | |
See accompanying notes which are an intergral part of these consolidated financial statements.
| RATIONAL FUNDS |
| Rational Equity Armor Fund |
| Financial Highlights |
For a Share Outstanding Throughout Each Year
| | | Institutional | |
| | | For the | | | For the | | | For the | | | For the | | | For the | |
| | | Year Ended | | | Year Ended | | | Year Ended | | | Year Ended | | | Year Ended | |
| | | December 31, | | | December 31, | | | December 31, | | | December 31, | | | December 31, | |
| | | 2023 | | | 2022 | | | 2021 | | | 2020 | | | 2019 | |
| Net asset value, beginning of year | | $ | 7.97 | | | $ | 8.99 | | | $ | 7.96 | | | $ | 6.94 | | | $ | 6.58 | |
| INCOME (LOSS) FROM INVESTMENT OPERATIONS: | | | | | | | | | | | | | | | | | | | | |
| Net investment income (A) | | | 0.00 | (F) | | | 0.07 | | | | 0.07 | | | | 0.08 | | | | 0.22 | |
| Net realized and unrealized gain (loss) on investments | | | 0.23 | | | | (1.03 | ) | | | 1.07 | | | | 1.03 | | | | 0.51 | |
| Total from investment operations | | | 0.23 | | | | (0.96 | ) | | | 1.14 | | | | 1.11 | | | | 0.73 | |
| LESS DISTRIBUTIONS: | | | | | | | | | | | | | | | | | | | | |
| From net investment income | | | (0.00 | ) (F) | | | (0.06 | ) | | | (0.11 | ) | | | (0.09 | ) | | | (0.37 | ) |
| From Return of Capital | | | (0.01 | ) | | | — | | | | — | | | | — | | | | — | |
| Total distributions | | | (0.01 | ) | | | (0.06 | ) | | | (0.11 | ) | | | (0.09 | ) | | | (0.37 | ) |
| Net asset value, end of year | | $ | 8.19 | | | $ | 7.97 | | | $ | 8.99 | | | $ | 7.96 | | | $ | 6.94 | |
| Total return (B) | | | 2.95 | % | | | (10.68 | )% | | | 14.37 | % (E) | | | 16.00 | % | | | 11.32 | % |
| RATIOS/SUPPLEMENTAL DATA: | | | | | | | | | | | | | | | | | | | | |
| Net assets, end of year (in 000’s) | | $ | 25,741 | | | $ | 55,862 | | | $ | 58,975 | | | $ | 46,451 | | | $ | 7,155 | |
| Ratios to average net assets (including interest expense) | | | | | | | | | | | | | | | | | | | | |
| Expenses, before waiver and reimbursement (C) | | | 1.45 | % | | | 1.20 | % | | | 1.15 | % | | | 1.32 | % | | | 1.75 | % |
| Expenses, net waiver and reimbursement (C) | | | 1.45 | % | | | 1.20 | % | | | 1.10 | % | | | 1.01 | % | | | 1.00 | % |
| Net investment income | | | -0.01 | % | | | 0.80 | % | | | 0.80 | % | | | 1.10 | % | | | 3.12 | % |
| Portfolio turnover rate | | | 580 | % | | | 281 | % | | | 239 | % | | | 480 | % | | | 394 | % |
| | | | | | | | | | | | | | | | | | | | | |
| | | | | | | | | | | | | | | | | | | | | |
| | | Class A | |
| | | For the | | | For the | | | For the | | | For the | | | For the | |
| | | Year Ended | | | Year Ended | | | Year Ended | | | Year Ended | | | Year Ended | |
| | | December 31, | | | December 31, | | | December 31, | | | December 31, | | | December 31, | |
| | | 2023 | | | 2022 | | | 2021 | | | 2020 | | | 2019 | |
| Net asset value, beginning of year | | $ | 7.96 | | | $ | 8.98 | | | $ | 7.95 | | | $ | 6.93 | | | $ | 6.57 | |
| INCOME (LOSS) FROM INVESTMENT OPERATIONS: | | | | | | | | | | | | | | | | | | | | |
| Net investment income (A) | | | (0.02 | ) | | | 0.04 | | | | 0.05 | | | | 0.04 | | | | 0.20 | |
| Net realized and unrealized gain (loss) on investments | | | 0.23 | | | | (1.01 | ) | | | 1.07 | | | | 1.05 | | | | 0.51 | |
| Total from investment operations | | | 0.21 | | | | (0.97 | ) | | | 1.12 | | | | 1.09 | | | | 0.71 | |
| LESS DISTRIBUTIONS: | | | | | | | | | | | | | | | | | | | | |
| From net investment income | | | (0.00 | ) (F) | | | (0.05 | ) | | | (0.09 | ) | | | (0.07 | ) | | | (0.35 | ) |
| From Return of Capital | | | (0.01 | ) | | | — | | | | — | | | | — | | | | — | |
| Total distributions | | | (0.01 | ) | | | (0.05 | ) | | | (0.09 | ) | | | (0.07 | ) | | | (0.35 | ) |
| Net asset value, end of year | | $ | 8.16 | | | $ | 7.96 | | | $ | 8.98 | | | $ | 7.95 | | | $ | 6.93 | |
| Total return (B) | | | 2.62 | % | | | (10.86 | )% | | | 14.11 | % | | | 15.74 | % | | | 11.03 | % |
| RATIOS/SUPPLEMENTAL DATA: | | | | | | | | | | | | | | | | | | | | |
| Net assets, end of year (in 000’s) | | $ | 8,604 | | | $ | 9,717 | | | $ | 11,858 | | | $ | 12,099 | | | $ | 11,462 | |
| Ratios to average net assets (including interest expense) | | | | | | | | | | | | | | | | | | | | |
| Expenses, before waiver and reimbursement (D) | | | 1.72 | % | | | 1.46 | % | | | 1.40 | % | | | 1.69 | % | | | 2.00 | % |
| Expenses, net waiver and reimbursement (D) | | | 1.72 | % | | | 1.46 | % | | | 1.35 | % | | | 1.26 | % | | | 1.25 | % |
| Net investment income | | | (0.28 | )% | | | 0.53 | % | | | 0.55 | % | | | 0.58 | % | | | 2.90 | % |
| Portfolio turnover rate | | | 580 | % | | | 281 | % | | | 239 | % | | | 480 | % | | | 394 | % |
| (A) | Per share amounts calculated using average shares method, which more appropriately presents the per share data for the year. |
| (B) | Total return in the above table represents the rate that the investor would have earned or lost on an investment in the Fund assuming reinvestment of dividends and does not reflect the impact of sales charges. Had the Advisor not waived its fees and reimbursed expenses, total return would have been lower. |
| (C) | Ratios to average net assets (excluding interest expense) |
| Expenses, before waiver and reimbursement | | | 1.30 | % | | | 1.19 | % | | | 1.15 | % | | | 1.31 | % | | | 1.75 | % |
| Expenses, net waiver and reimbursement | | | 1.30 | % | | | 1.19 | % | | | 1.10 | % | | | 1.00 | % | | | 1.00 | % |
| (D) | Ratios to average net assets (excluding interest expense) |
| Expenses, before waiver and reimbursement | | | 1.57 | % | | | 1.45 | % | | | 1.40 | % | | | 1.68 | % | | | 2.00 | % |
| Expenses, net waiver and reimbursement | | | 1.57 | % | | | 1.45 | % | | | 1.35 | % | | | 1.25 | % | | | 1.25 | % |
| (E) | Includes adjustments in accordance with accounting principles generally accepted in the United States and, consequently, the net asset value for financial reporting purposes and the returns based upon those net asset values may differ from the net asset values and returns for shareholder transactions. |
See accompanying notes which are an integral part of these financial statements.
| RATIONAL FUNDS |
| Rational Equity Armor Fund (Continued) |
| Financial Highlights |
For a Share Outstanding Throughout Each Year
| | | Class C | |
| | | For the | | | For the | | | For the | | | For the | | | For the | |
| | | Year Ended | | | Year Ended | | | Year Ended | | | Year Ended | | | Year Ended | |
| | | December 31, | | | December 31, | | | December 31, | | | December 31, | | | December 31, | |
| | | 2023 | | | 2022 | | | 2021 | | | 2020 | | | 2019 | |
| Net asset value, beginning of year | | $ | 7.89 | | | $ | 8.93 | | | $ | 7.90 | | | $ | 6.91 | | | $ | 6.55 | |
| INCOME (LOSS) FROM INVESTMENT OPERATIONS: | | | | | | | | | | | | | | | | | | | | |
| Net investment income (loss) (A) | | | (0.07 | ) | | | (0.01 | ) | | | (0.01 | ) | | | (0.01 | ) | | | 0.15 | |
| Net realized and unrealized gain (loss) on investments | | | 0.22 | | | | (1.02 | ) | | | 1.07 | | | | 1.04 | | | | 0.51 | |
| Total from investment operations | | | 0.15 | | | | (1.03 | ) | | | 1.06 | | | | 1.03 | | | | 0.66 | |
| LESS DISTRIBUTIONS: | | | | | | | | | | | | | | | | | | | | |
| From net investment income | | | — | | | | (0.01 | ) | | | (0.03 | ) | | | (0.04 | ) | | | (0.30 | ) |
| Total distributions | | | — | | | | (0.01 | ) | | | (0.03 | ) | | | (0.04 | ) | | | (0.30 | ) |
| Net asset value, end of year | | $ | 8.04 | | | $ | 7.89 | | | $ | 8.93 | | | $ | 7.90 | | | $ | 6.91 | |
| Total return (B) | | | 1.90 | % | | | (11.51 | )% | | | 13.40 | % | | | 14.88 | % | | | 10.23 | % (C) |
| RATIOS/SUPPLEMENTAL DATA: | | | | | | | | | | | | | | | | | | | | |
| Net assets, end of year (in 000’s) | | $ | 1,223 | | | $ | 1,610 | | | $ | 1,771 | | | $ | 1,164 | | | $ | 1,252 | |
| Ratios to average net assets (including interest expense) | | | | | | | | | | | | | | | | | | | | |
| Expenses, before waiver and reimbursement (D) | | | 2.41 | % | | | 2.15 | % | | | 2.15 | % | | | 2.39 | % | | | 2.75 | % |
| Expenses, net waiver and reimbursement (D) | | | 2.41 | % | | | 2.15 | % | | | 2.06 | % | | | 2.01 | % | | | 2.00 | % |
| Net investment income (loss) | | | (0.98 | )% | | | (0.15 | )% | | | (0.16 | )% | | | -0.18 | % | | | 2.16 | % |
| Portfolio turnover rate | | | 580 | % | | | 281 | % | | | 239 | % | | | 480 | % | | | 394 | % |
| (A) | Per share amounts calculated using average shares method, which more appropriately presents the per share data for the year. |
| (B) | Total return in the above table represents the rate that the investor would have earned or lost on an investment in the Fund assuming reinvestment of dividends. Had the Advisor not waived its fees and reimbursed expenses, total return would have been lower. |
| (C) | Includes adjustments in accordance with accounting principles generally accepted in the United States and, consequently, the net asset value for financial reporting purposes and the returns based upon those net asset values may differ from the net asset values and returns for shareholder transactions. |
| (D) | Ratios to average net assets (excluding interest expense) |
| Expenses, before waiver and reimbursement | | | 2.26 | % | | | 2.14 | % | | | 2.14 | % | | | 2.38 | % | | | 2.75 | % |
| Expenses, net waiver and reimbursement | | | 2.26 | % | | | 2.14 | % | | | 2.06 | % | | | 2.00 | % | | | 2.00 | % |
See accompanying notes which are an integral part of these financial statements.
| RATIONAL FUNDS |
| Rational Tactical Return Fund |
| Financial Highlights |
For a Share Outstanding Throughout Each Year
| | | Institutional | |
| | | For the | | | For the | | | For the | | | For the | | | For the | |
| | | Year Ended | | | Year Ended | | | Year Ended | | | Year Ended | | | Year Ended | |
| | | December 31, | | | December 31, | | | December 31, | | | December 31, | | | December 31, | |
| | | 2023 | | | 2022 (A) | | | 2021 (A) | | | 2020 (A) | | | 2019 (A) | |
| Net asset value, beginning of year | | $ | 17.00 | | | $ | 17.10 | | | $ | 17.07 | | | $ | 16.98 | | | $ | 16.20 | |
| INCOME (LOSS) FROM INVESTMENT OPERATIONS: | | | | | | | | | | | | | | | | | | | | |
| Net investment income (loss) (B) | | | 0.25 | | | | (0.09 | ) | | | (0.33 | ) | | | (0.27 | ) | | | (0.03 | ) |
| Net realized and unrealized gain on investments | | | 0.61 | | | | 0.04 | | | | 0.99 | | | | 0.72 | | | | 1.38 | |
| Total from investment operations | | | 0.86 | | | | (0.05 | ) | | | 0.66 | | | | 0.45 | | | | 1.35 | |
| LESS DISTRIBUTIONS: | | | | | | | | | | | | | | | | | | | | |
| From net investment income | | | (0.25 | ) | | | — | | | | — | | | | — | | | | — | |
| From net realized gains on investments | | | (0.70 | ) | | | (0.05 | ) | | | (0.63 | ) | | | (0.36 | ) | | | (0.57 | ) |
| Total distributions | | | (0.95 | ) | | | (0.05 | ) | | | (0.63 | ) | | | (0.36 | ) | | | (0.57 | ) |
| Net asset value, end of year | | $ | 16.91 | | | $ | 17.00 | | | $ | 17.10 | | | $ | 17.07 | | | $ | 16.98 | |
| Total return (C) | | | 5.06 | % | | | (0.30 | )% | | | 3.94 | % | | | 2.65 | % | | | 8.35 | % |
| RATIOS/SUPPLEMENTAL DATA: | | | | | | | | | | | | | | | | | | | | |
| Net assets, end of year (in 000’s) | | $ | 119,144 | | | $ | 199,786 | | | $ | 264,557 | | | $ | 199,987 | | | $ | 151,070 | |
| Ratios to average net assets (including interest expense) | | | | | | | | | | | | | | | | | | | | |
| Expenses, before waiver and reimbursement (D) | | | 2.08 | % | | | 2.02 | % | | | 2.04 | % | | | 2.05 | % | | | 2.15 | % |
| Expenses, net waiver and reimbursement (D) | | | 2.00 | % | | | 1.99 | % | | | 1.99 | % | | | 1.99 | % | | | 1.99 | % |
| Net investment income (loss) | | | 1.44 | % | | | (0.86 | )% | | | (1.98 | )% | | | (1.54 | )% | | | (0.15 | )% |
| Portfolio turnover rate | | | 0 | % | | | 0 | % | | | 0 | % | | | 0 | % | | | 0 | % |
| | | | | | | | | | | | | | | | | | | | | |
| | | | | | | | | | | | | | | | | | | | | |
| | | Class A | |
| | | For the | | | For the | | | For the | | | For the | | | For the | |
| | | Year Ended | | | Year Ended | | | Year Ended | | | Year Ended | | | Year Ended | |
| | | December 31, | | | December 31, | | | December 31, | | | December 31, | | | December 31, | |
| | | 2023 | | | 2022 (A) | | | 2021 (A) | | | 2020 (A) | | | 2019 (A) | |
| Net asset value, beginning of year | | $ | 17.02 | | | $ | 17.16 | | | $ | 17.16 | | | $ | 17.10 | | | $ | 16.35 | |
| INCOME (LOSS) FROM INVESTMENT OPERATIONS: | | | | | | | | | | | | | | | | | | | | |
| Net investment income (loss) (B) | | | 0.22 | | | | (0.12 | ) | | | (0.39 | ) | | | (0.27 | ) | | | (0.06 | ) |
| Net realized and unrealized gain on investments | | | 0.59 | | | | 0.03 | | | | 1.02 | | | | 0.69 | | | | 1.38 | |
| Total from investment operations | | | 0.81 | | | | (0.09 | ) | | | 0.63 | | | | 0.42 | | | | 1.32 | |
| LESS DISTRIBUTIONS: | | | | | | | | | | | | | | | | | | | | |
| From net investment income | | | (0.20 | ) | | | — | | | | — | | | | — | | | | — | |
| From net realized gains on investments | | | (0.70 | ) | | | (0.05 | ) | | | (0.63 | ) | | | (0.36 | ) | | | (0.57 | ) |
| Total distributions | | | (0.90 | ) | | | (0.05 | ) | | | (0.63 | ) | | | (0.36 | ) | | | (0.57 | ) |
| Net asset value, end of year | | $ | 16.93 | | | $ | 17.02 | | | $ | 17.16 | | | $ | 17.16 | | | $ | 17.10 | |
| Total return (C) | | | 4.77 | % | | | (0.53 | )% | | | 3.75 | % | | | 2.45 | % | | | 8.09 | % |
| RATIOS/SUPPLEMENTAL DATA: | | | | | | | | | | | | | | | | | | | | |
| Net assets, end of year (in 000’s) | | $ | 7,328 | | | $ | 8,868 | | | $ | 18,494 | | | $ | 7,423 | | | $ | 15,097 | |
| Ratios to average net assets (including interest expense) | | | | | | | | | | | | | | | | | | | | |
| Expenses, before waiver and reimbursement (E) | | | 2.33 | % | | | 2.29 | % | | | 2.29 | % | | | 2.33 | % | | | 2.51 | % |
| Expenses, net waiver and reimbursement (E) | | | 2.25 | % | | | 2.24 | % | | | 2.24 | % | | | 2.24 | % | | | 2.24 | % |
| Net investment income (loss) | | | 1.27 | % | | | (1.28 | )% | | | (2.23 | )% | | | (1.64 | )% | | | (0.31 | )% |
| Portfolio turnover rate | | | 0 | % | | | 0 | % | | | 0 | % | | | 0 | % | | | 0 | % |
| (A) | Effective April 22, 2022, the Fund had a one-to-three reverse stock split. Per Share amounts for the periods have been adjusted to give effect to the one-to-three stock split. |
| (B) | Per share amounts calculated using average shares method, which more appropriately presents the per share data for the year. |
| (C) | Total return in the above table represents the rate that the investor would have earned or lost on an investment in the Fund assuming reinvestment of dividends and does not reflect the impact of sales charges. Had the Advisor not waived its fees and reimbursed expenses, total return would have been lower. |
| (D) | Ratios to average net assets (excluding interest expense) |
| Expenses, before waiver and reimbursement | | | 2.07 | % | | | 2.02 | % | | | 2.04 | % | | | 2.05 | % | | | 2.51 | % |
| Expenses, net waiver and reimbursement | | | 1.99 | % | | | 1.99 | % | | | 1.99 | % | | | 1.99 | % | | | 2.24 | % |
| (E) | Ratios to average net assets (excluding interest expense) |
| Expenses, before waiver and reimbursement | | | 2.32 | % | | | 2.29 | % | | | 2.29 | % | | | 2.33 | % | | | 2.51 | % |
| Expenses, net waiver and reimbursement | | | 2.24 | % | | | 2.24 | % | | | 2.24 | % | | | 2.24 | % | | | 2.24 | % |
See accompanying notes which are an integral part of these financial statements.
| RATIONAL FUNDS |
| Rational Tactical Return Fund (Continued) |
| Financial Highlights |
For a Share Outstanding Throughout Each Year
| | | Class C | |
| | | For the | | | For the | | | For the | | | For the | | | For the | |
| | | Year Ended | | | Year Ended | | | Year Ended | | | Year Ended | | | Year Ended | |
| | | December 31, | | | December 31, | | | December 31, | | | December 31, | | | December 31, | |
| | | 2023 | | | 2022 (A) | | | 2021 (A) | | | 2020 (A) | | | 2019 (A) | |
| Net asset value, beginning of year | | $ | 16.38 | | | $ | 16.65 | | | $ | 16.80 | | | $ | 16.86 | | | $ | 16.29 | |
| INCOME (LOSS) FROM INVESTMENT OPERATIONS: | | | | | | | | | | | | | | | | | | | | |
| Net investment loss (B) | | | 0.08 | | | | (0.19 | ) | | | (0.51 | ) | | | (0.42 | ) | | | (0.21 | ) |
| Net realized and unrealized gain (loss) on investments | | | 0.57 | | | | (0.03 | ) (C) | | | 0.99 | | | | 0.72 | | | | 1.35 | |
| Total from investment operations | | | 0.65 | | | | (0.22 | ) | | | 0.48 | | | | 0.30 | | | | 1.14 | |
| LESS DISTRIBUTIONS: | | | | | | | | | | | | | | | | | | | | |
| From net investment income | | | (0.04 | ) | | | — | | | | — | | | | — | | | | — | |
| From net realized gains on investments | | | (0.70 | ) | | | (0.05 | ) | | | (0.63 | ) | | | (0.36 | ) | | | (0.57 | ) |
| Total distributions | | | (0.74 | ) | | | (0.05 | ) | | | (0.63 | ) | | | (0.36 | ) | | | (0.57 | ) |
| Net assets, end of year (in 000’s) | | $ | 16.29 | | | $ | 16.38 | | | $ | 16.65 | | | $ | 16.80 | | | $ | 16.86 | |
| Total return (D) | | | 3.97 | % | | | (1.33 | )% | | | 2.94 | % | | | 1.77 | % | | | 7.01 | % |
| RATIOS/SUPPLEMENTAL DATA: | | | | | | | | | | | | | | | | | | | | |
| Net assets, end of year (in 000’s) | | $ | 5,311 | | | $ | 7,808 | | | $ | 9,444 | | | $ | 9,130 | | | $ | 6,453 | |
| Ratios to average net assets (including interest expense) | | | | | | | | | | | | | | | | | | | | |
| Expenses, before waiver and reimbursement (E) | | | 3.04 | % | | | 2.99 | % | | | 3.00 | % | | | 3.04 | % | | | 3.11 | % |
| Expenses, net waiver and reimbursement (E) | | | 3.00 | % | | | 2.99 | % | | | 2.99 | % | | | 2.99 | % | | | 2.99 | % |
| Net investment loss | | | 0.50 | % | | | (1.85 | )% | | | (2.98 | )% | | | (2.54 | )% | | | (1.18 | )% |
| Portfolio turnover rate | | | 0 | % | | | 0 | % | | | 0 | % | | | 0 | % | | | 0 | % |
| (A) | Effective April 22, 2022, the Fund had a one-to-three reverse stock split. Per Share amounts for the periods have been adjusted to give effect to the one-to-three stock split. |
| (B) | Per share amounts calculated using average shares method, which more appropriately presents the per share data for the year. |
| (C) | As required by SEC standard per share data calculation methodology, this represents a balancing figure derived from the other amounts in the financial highlights tables that captures all other changes affecting net asset value per share. This per share gain amount. |
| (D) | Total return in the above table represents the rate that the investor would have earned or lost on an investment in the Fund assuming reinvestment of dividends. Had the Advisor not waived its fees and reimbursed expenses, total return would have been lower. |
| (E) | Ratios to average net assets (excluding interest expense) |
| Expenses, before waiver and reimbursement | | | 3.03 | % | | | 2.99 | % | | | 3.00 | % | | | 3.04 | % | | | 3.11 | % |
| Expenses, net waiver and reimbursement | | | 2.99 | % | | | 2.99 | % | | | 2.99 | % | | | 2.99 | % | | | 2.99 | % |
See accompanying notes which are an integral part of these financial statements.
| RATIONAL FUNDS |
| Rational Dynamic Brands Fund |
| Financial Highlights |
For a Share Outstanding Throughout Each Year
| | | Institutional | |
| | | For the | | | For the | | | For the | | | For the | | | For the | |
| | | Year Ended | | | Year Ended | | | Year Ended | | | Year Ended | | | Year Ended | |
| | | December 31, | | | December 31, | | | December 31, | | | December 31, | | | December 31, | |
| | | 2023 | | | 2022 | | | 2021 | | | 2020 | | | 2019 | |
| Net asset value, beginning of year | | $ | 36.45 | | | $ | 59.52 | | | $ | 56.20 | | | $ | 43.30 | | | $ | 34.20 | |
| INCOME (LOSS) FROM INVESTMENT OPERATIONS: | | | | | | | | | | | | | | | | | | | | |
| Net investment loss (A) | | | (0.13 | ) | | | (0.07 | ) | | | (0.41 | ) | | | (0.33 | ) | | | (0.14 | ) |
| Net realized and unrealized gain (loss) on investments | | | 15.61 | | | | (21.01 | ) | | | 8.68 | | | | 19.98 | | | | 9.38 | |
| Total from investment operations | | | 15.48 | | | | (21.08 | ) | | | 8.27 | | | | 19.65 | | | | 9.24 | |
| LESS DISTRIBUTIONS: | | | | | | | | | | | | | | | | | | | | |
| From net realized gains on investments | | | — | | | | (1.99 | ) | | | (4.95 | ) | | | (6.75 | ) | | | (0.14 | ) |
| Total distributions | | | — | | | | (1.99 | ) | | | (4.95 | ) | | | (6.75 | ) | | | (0.14 | ) |
| Net assets, end of year (in 000’s) | | $ | 51.93 | | | $ | 36.45 | | | $ | 59.52 | | | $ | 56.20 | | | $ | 43.30 | |
| Total return (B) | | | 42.47 | % (C) | | | (35.41 | )% | | | 14.97 | % | | | 45.28 | % | | | 27.03 | % |
| RATIOS/SUPPLEMENTAL DATA: | | | | | | | | | | | | | | | | | | | | |
| Net assets, end of year (in 000’s) | | $ | 44,767 | | | $ | 28,643 | | | $ | 82,648 | | | $ | 53,102 | | | $ | 21,627 | |
| Ratios to average net assets (including interest expense) | | | | | | | | | | | | | | | | | | | | |
| Expenses, before waiver and reimbursement (D) | | | 1.26 | % | | | 1.20 | % | | | 1.10 | % | | | 1.25 | % | | | 1.45 | % |
| Expenses, net waiver and reimbursement (D) | | | 1.24 | % | | | 1.20 | % | | | 1.14 | % | | | 1.24 | % | | | 1.17 | % |
| Net investment loss | | | (0.29 | )% | | | (0.16 | )% | | | (0.65 | )% | | | (0.56 | )% | | | (0.36 | )% |
| Portfolio turnover rate | | | 194 | % | | | 154 | % | | | 225 | % | | | 320 | % | | | 220 | % |
| | | | | | | | | | | | | | | | | | | | | |
| | | | | | | | | | | | | | | | | | | | | |
| | | Class A | |
| | | For the | | | For the | | | For the | | | For the | | | For the | |
| | | Year Ended | | | Year Ended | | | Year Ended | | | Year Ended | | | Year Ended | |
| | | December 31, | | | December 31, | | | December 31, | | | December 31, | | | December 31, | |
| | | 2023 | | | 2022 | | | 2021 | | | 2020 | | | 2019 | |
| Net asset value, beginning of year | | $ | 22.16 | | | $ | 37.49 | | | $ | 37.16 | | | $ | 30.27 | | | $ | 24.00 | |
| INCOME (LOSS) FROM INVESTMENT OPERATIONS: | | | | | | | | | | | | | | | | | | | | |
| Net investment loss (A) | | | (0.15 | ) | | | (0.11 | ) | | | (0.41 | ) | | | (0.28 | ) | | | (0.16 | ) |
| Net realized and unrealized gain (loss) on investments | | | 9.48 | | | | (13.23 | ) | | | 5.69 | | | | 13.92 | | | | 6.57 | |
| Total from investment operations | | | 9.33 | | | | (13.34 | ) | | | 5.28 | | | | 13.64 | | | | 6.41 | |
| LESS DISTRIBUTIONS: | | | | | | | | | | | | | | | | | | | | |
| From net realized gains on investments | | | — | | | | (1.99 | ) | | | (4.95 | ) | | | (6.75 | ) | | | (0.14 | ) |
| Total distributions | | | — | | | | (1.99 | ) | | | (4.95 | ) | | | (6.75 | ) | | | (0.14 | ) |
| Net assets, end of year (in 000’s) | | $ | 31.49 | | | $ | 22.16 | | | $ | 37.49 | | | $ | 37.16 | | | $ | 30.27 | |
| Total return (B) | | | 42.10 | % | | | (35.58 | )% | | | 14.59 | % | | | 44.91 | % | | | 26.72 | % |
| RATIOS/SUPPLEMENTAL DATA: | | | | | | | | | | | | | | | | | | | | |
| Net assets, end of year (in 000’s) | | $ | 14,456 | | | $ | 11,668 | | | $ | 23,205 | | | $ | 17,972 | | | $ | 12,387 | |
| Ratios to average net assets (including interest expense) | | | | | | | | | | | | | | | | | | | | |
| Expenses, before waiver and reimbursement (E) | | | 1.52 | % | | | 1.47 | % | | | 1.37 | % | | | 1.52 | % | | | 1.74 | % |
| Expenses, net waiver and reimbursement (E) | | | 1.49 | % | | | 1.47 | % | | | 1.47 | % | | | 1.49 | % | | | 1.41 | % |
| Net investment loss | | | (0.55 | )% | | | (0.41 | )% | | | (1.00 | )% | | | (0.82 | )% | | | (0.59 | )% |
| Portfolio turnover rate | | | 194 | % | | | 154 | % | | | 225 | % | | | 320 | % | | | 220 | % |
| (A) | Per share amounts calculated using average shares method, which more appropriately presents the per share data for the year. |
| (B) | Total return in the above table represents the rate that the investor would have earned or lost on an investment in the Fund assuming reinvestment of dividends and does not reflect the impact of sales. |
| (C) | Includes adjustments in accordance with accounting principles generally accepted in the United States and, consequently, the net asset value for financial reporting purposes and the returns based upon those net asset values may differ from the net asset values and returns for shareholder transactions. |
| (D) | Ratios to average net assets (excluding interest expense) |
| Expenses, before waiver and reimbursement | | | 1.26 | % | | | 1.19 | % | | | 1.10 | % | | | 1.25 | % | | | 1.45 | % |
| Expenses, net waiver and reimbursement | | | 1.24 | % | | | 1.19 | % | | | 1.14 | % | | | 1.24 | % | | | 1.17 | % |
| (E) | Ratios to average net assets (excluding interest expense) |
| Expenses, before waiver and reimbursement | | | 1.52 | % | | | 1.46 | % | | | 1.37 | % | | | 1.52 | % | | | 1.74 | % |
| Expenses, net waiver and reimbursement | | | 1.49 | % | | | 1.46 | % | | | 1.47 | % | | | 1.49 | % | | | 1.41 | % |
See accompanying notes which are an integral part of these financial statements.
| RATIONAL FUNDS |
| Rational Dynamic Brands Fund (Continued) |
| Financial Highlights |
For a Share Outstanding Throughout Each Year
| | | Class C | |
| | | For the | | | For the | | | For the | | | For the | | | For the | |
| | | Year Ended | | | Year Ended | | | Year Ended | | | Year Ended | | | Year Ended | |
| | | December 31, | | | December 31, | | | December 31, | | | December 31, | | | December 31, | |
| | | 2023 | | | 2022 | | | 2021 | | | 2020 | | | 2019 | |
| Net asset value, beginning of year | | $ | 18.31 | | | $ | 31.73 | | | $ | 32.34 | | | $ | 27.15 | | | $ | 21.70 | |
| INCOME (LOSS) FROM INVESTMENT OPERATIONS: | | | | | | | | | | | | | | | | | | | | |
| Net investment loss (A) | | | (0.28 | ) | | | (0.26 | ) | | | (0.58 | ) | | | (0.50 | ) | | | (0.32 | ) |
| Net realized and unrealized gain (loss) on investments | | | 7.79 | | | | (11.17 | ) | | | 4.92 | | | | 12.44 | | | | 5.91 | |
| Total from investment operations | | | 7.51 | | | | (11.43 | ) | | | 4.34 | | | | 11.94 | | | | 5.59 | |
| LESS DISTRIBUTIONS: | | | | | | | | | | | | | | | | | | | | |
| From net realized gains on investments | | | — | | | | (1.99 | ) | | | (4.95 | ) | | | (6.75 | ) | | | (0.14 | ) |
| Total distributions | | | — | | | | (1.99 | ) | | | (4.95 | ) | | | (6.75 | ) | | | (0.14 | ) |
| Net assets, end of year (in 000’s) | | $ | 25.82 | | | $ | 18.31 | | | $ | 31.73 | | | $ | 32.34 | | | $ | 27.15 | |
| Total return (B) | | | 41.02 | % (C) | | | (36.02 | )% | | | 13.85 | % | | | 43.80 | % | | | 25.78 | % (C) |
| RATIOS/SUPPLEMENTAL DATA: | | | | | | | | | | | | | | | | | | | | |
| Net assets, end of year (in 000’s) | | $ | 3,621 | | | $ | 2,852 | | | $ | 4,898 | | | $ | 1,525 | | | $ | 184 | |
| Ratios to average net assets (including interest expense) | | | | | | | | | | | | | | | | | | | | |
| Expenses, before waiver and reimbursement (D) | | | 2.23 | % | | | 2.18 | % | | | 2.08 | % | | | 2.41 | % | | | 2.68 | % |
| Expenses, net waiver and reimbursement (D) | | | 2.23 | % | | | 2.18 | % | | | 2.12 | % | | | 2.24 | % | | | 2.15 | % |
| Net investment loss | | | (1.28 | )% | | | (1.12 | )% | | | (1.62 | )% | | | (1.54 | )% | | | (1.30 | )% |
| Portfolio turnover rate | | | 194 | % | | | 154 | % | | | 225 | % | | | 320 | % | | | 220 | % |
| (A) | Per share amounts calculated using average shares method, which more appropriately presents the per share data for the year. |
| (B) | Total return in the above table represents the rate that the investor would have earned or lost on an investment in the Fund assuming reinvestment of dividends and does not reflect the impact of sales charges. |
| (C) | Includes adjustments in accordance with accounting principles generally accepted in the United States and, consequently, the net asset value for financial reporting purposes and the returns based upon those net asset values may differ from the net asset values and returns for shareholder transactions. |
| (D) | Ratios to average net assets (excluding interest expense) |
| Expenses, before waiver and reimbursement | | | 2.23 | % | | | 2.17 | % | | | 2.08 | % | | | 2.41 | % | | | 2.68 | % |
| Expenses, net waiver and reimbursement | | | 2.23 | % | | | 2.17 | % | | | 2.12 | % | | | 2.24 | % | | | 2.15 | % |
See accompanying notes which are an integral part of these financial statements.
| RATIONAL FUNDS |
| Rational Strategic Allocation Fund |
| Financial Highlights |
For a Share Outstanding Throughout Each Year
| | | Institutional | |
| | | For the | | | For the | | | For the | | | For the | | | For the | |
| | | Year Ended | | | Year Ended | | | Year Ended | | | Year Ended | | | Year Ended | |
| | | December 31, | | | December 31, | | | December 31, | | | December 31, | | | December 31, | |
| | | 2023 | | | 2022 | | | 2021 | | | 2020 | | | 2019 | |
| Net asset value, beginning of year | | $ | 6.84 | | | $ | 10.24 | | | $ | 8.94 | | | $ | 9.58 | | | $ | 9.12 | |
| INCOME (LOSS) FROM INVESTMENT OPERATIONS: | | | | | | | | | | | | | | | | | | | | |
| Net investment income (A) | | | 0.30 | | | | 0.31 | | | | 0.40 | | | | 0.27 | | | | 0.36 | |
| Net realized and unrealized gain (loss) on investments | | | 1.30 | | | | (3.16 | ) | | | 2.54 | | | | (0.61 | ) | | | 0.79 | |
| Total from investment operations | | | 1.60 | | | | (2.85 | ) | | | 2.94 | | | | (0.34 | ) | | | 1.15 | |
| LESS DISTRIBUTIONS: | | | | | | | | | | | | | | | | | | | | |
| From net investment income | | | (0.43 | ) | | | (0.18 | ) | | | (0.36 | ) | | | (0.28 | ) | | | (0.41 | ) |
| From net realized gains on investments | | | — | | | | (0.37 | ) | | | (1.28 | ) | | | — | | | | (0.22 | ) |
| From Return of capital | | | — | | | | — | | | | — | | | | (0.02 | ) | | | (0.06 | ) |
| Total distributions | | | (0.43 | ) | | | (0.55 | ) | | | (1.64 | ) | | | (0.30 | ) | | | (0.69 | ) |
| Net asset value, end of year | | $ | 8.01 | | | $ | 6.84 | | | $ | 10.24 | | | $ | 8.94 | | | $ | 9.58 | |
| Total return (B) | | | 24.05 | % | | | (27.87 | )% | | | 33.94 | % | | | (3.19 | )% | | | 12.64 | % |
| RATIOS/SUPPLEMENTAL DATA: | | | | | | | | | | | | | | | | | | | | |
| Net assets, end of year (in 000’s) | | $ | 1,206 | | | $ | 1,027 | | | $ | 519 | | | $ | 248 | | | $ | 266 | |
| Ratios to average net assets (including interest expense) | | | | | | | | | | | | | | | | | | | | |
| Expenses, before waiver and reimbursement (C,E) | | | 1.55 | % | | | 1.39 | % | | | 1.11 | % | | | 1.31 | % | | | 0.98 | % |
| Expenses, net waiver and reimbursement (C,E) | | | 0.46 | % | | | 0.46 | % | | | 0.46 | % | | | 0.45 | % | | | 0.45 | % |
| Net investment income (C,D) | | | 4.02 | % | | | 3.82 | % | | | 3.78 | % | | | 3.26 | % | | | 3.67 | % |
| Portfolio turnover rate | | | 105 | % | | | 27 | % | | | 2 | % | | | 89 | % | | | 62 | % |
| | | | | | | | | | | | | | | | | | | | | |
| | | | | | | | | | | | | | | | | | | | | |
| | | Class A | |
| | | For the | | | For the | | | For the | | | For the | | | For the | |
| | | Year Ended | | | Year Ended | | | Year Ended | | | Year Ended | | | Year Ended | |
| | | December 31, | | | December 31, | | | December 31, | | | December 31, | | | December 31, | |
| | | 2023 | | | 2022 | | | 2021 | | | 2020 | | | 2019 | |
| Net asset value, beginning of year | | $ | 6.88 | | | $ | 10.30 | | | $ | 8.99 | | | $ | 9.63 | | | $ | 9.15 | |
| INCOME (LOSS) FROM INVESTMENT OPERATIONS: | | | | | | | | | | | | | | | | | | | | |
| Net investment income (A) | | | 0.28 | | | | 0.29 | | | | 0.34 | | | | 0.25 | | | | 0.32 | |
| Net realized and unrealized gain (loss) on investments | | | 1.31 | | | | (3.17 | ) | | | 2.59 | | | | (0.61 | ) | | | 0.82 | |
| Total from investment operations | | | 1.59 | | | | (2.88 | ) | | | 2.93 | | | | (0.36 | ) | | | 1.14 | |
| LESS DISTRIBUTIONS: | | | | | | | | | | | | | | | | | | | | |
| From net investment income | | | (0.41 | ) | | | (0.17 | ) | | | (0.34 | ) | | | (0.26 | ) | | | (0.38 | ) |
| From net realized gains on investments | | | — | | | | (0.37 | ) | | | (1.28 | ) | | | — | | | | (0.22 | ) |
| From Return of capital | | | — | | | | — | | | | — | | | | (0.02 | ) | | | (0.06 | ) |
| Total distributions | | | (0.41 | ) | | | (0.54 | ) | | | (1.62 | ) | | | (0.28 | ) | | | (0.66 | ) |
| Net assets, end of year (in 000’s) | | $ | 8.06 | | | $ | 6.88 | | | $ | 10.30 | | | $ | 8.99 | | | $ | 9.63 | |
| Total return (B) | | | 23.75 | % | | | (28.04 | )% | | | 33.57 | % | | | (3.42 | )% | | | 12.49 | % |
| RATIOS/SUPPLEMENTAL DATA: | | | | | | | | | | | | | | | | | | | | |
| Net assets, end of year (in 000’s) | | $ | 8,784 | | | $ | 6,048 | | | $ | 9,830 | | | $ | 7,713 | | | $ | 9,395 | |
| Ratios to average net assets (including interest expense) | | | | | | | | | | | | | | | | | | | | |
| Expenses, before waiver and reimbursement (C,F) | | | 1.92 | % | | | 1.72 | % | | | 1.47 | % | | | 1.65 | % | | | 1.35 | % |
| Expenses, net waiver and reimbursement (C,F) | | | 0.71 | % | | | 0.71 | % | | | 0.71 | % | | | 0.70 | % | | | 0.70 | % |
| Net Investment income (C,D) | | | 3.77 | % | | | 3.48 | % | | | 3.30 | % | | | 2.98 | % | | | 3.25 | % |
| Portfolio turnover rate | | | 105 | % | | | 27 | % | | | 2 | % | | | 89 | % | | | 62 | % |
| (A) | Per share amounts calculated using average shares method, which more appropriately presents the per share data for the year. |
| (B) | Total return in the above table represents the rate that the investor would have earned or lost on an investment in the Fund assuming reinvestment of dividends and does not reflect the impact of sales charges. Had the Advisor not waived its fees and reimbursed expenses, total return would have been lower. |
| (C) | The ratios of expenses to average net assets and net investment income (loss) to average net assets do not reflect the expenses of the underlying investment companies in which the Fund invests. |
| (D) | Recognition of net investment income (loss) is affected by the timing and declaration of dividends by the underlying investment companies in which the Fund invests. |
| (E) | Ratios to average net assets (excluding interest expense) |
| Expenses, before waiver and reimbursement | | | 1.54 | % | | | 1.38 | % | | | 1.10 | % | | | 1.31 | % | | | 0.98 | % |
| Expenses, net waiver and reimbursement | | | 0.45 | % | | | 0.45 | % | | | 0.45 | % | | | 0.45 | % | | | 0.45 | % |
| (F) | Ratios to average net assets (excluding interest expense) |
| Expenses, before waiver and reimbursement | | | 1.91 | % | | | 1.71 | % | | | 1.46 | % | | | 1.65 | % | | | 1.35 | % |
| Expenses, net waiver and reimbursement | | | 0.70 | % | | | 0.70 | % | | | 0.70 | % | | | 0.70 | % | | | 0.70 | % |
See accompanying notes which are an integral part of these financial statements.
| RATIONAL FUNDS |
| Rational Strategic Allocation Fund (Continued) |
| Financial Highlights |
For a Share Outstanding Throughout Each Year
| | | Class C | |
| | | For the | | | For the | | | For the | | | For the | | | For the | |
| | | Year Ended | | | Year Ended | | | Year Ended | | | Year Ended | | | Year Ended | |
| | | December 31, | | | December 31, | | | December 31, | | | December 31, | | | December 31, | |
| | | 2023 | | | 2022 | | | 2021 | | | 2020 | | | 2019 | |
| Net asset value, beginning of year | | $ | 6.83 | | | $ | 10.25 | | | $ | 8.95 | | | $ | 9.58 | | | $ | 9.11 | |
| INCOME (LOSS) FROM INVESTMENT OPERATIONS: | | | | | | | | | | | | | | | | | | | | |
| Net investment income (A) | | | 0.23 | | | | 0.23 | | | | 0.26 | | | | 0.19 | | | | 0.26 | |
| Net realized and unrealized gain (loss) on investments | | | 1.30 | | | | (3.16 | ) | | | 2.58 | | | | (0.61 | ) | | | 0.80 | |
| Total from investment operations | | | 1.53 | | | | (2.93 | ) | | | 2.84 | | | | (0.42 | ) | | | 1.06 | |
| LESS DISTRIBUTIONS: | | | | | | | | | | | | | | | | | | | | |
| From net investment income | | | (0.36 | ) | | | (0.12 | ) | | | (0.26 | ) | | | (0.19 | ) | | | (0.31 | ) |
| From net realized gains on investments | | | — | | | | (0.37 | ) | | | (1.28 | ) | | | — | | | | (0.22 | ) |
| From Return of capital | | | — | | | | — | | | | — | | | | (0.02 | ) | | | (0.06 | ) |
| Total distributions | | | (0.36 | ) | | | (0.49 | ) | | | (1.54 | ) | | | (0.21 | ) | | | (0.59 | ) |
| Net asset value, end of year | | $ | 8.00 | | | $ | 6.83 | | | $ | 10.25 | | | $ | 8.95 | | | $ | 9.58 | |
| Total return (B) | | | 22.94 | % | | | (28.55 | )% | | | 32.60 | % | | | (4.13 | )% | | | 11.61 | % |
| RATIOS/SUPPLEMENTAL DATA: | | | | | | | | | | | | | | | | | | | | |
| Net assets, end of year (in 000’s) | | $ | 1 | | | $ | 1 | | | $ | 1 | | | $ | 1 | | | $ | 1 | |
| Ratios to average net assets (including interest expense) | | | | | | | | | | | | | | | | | | | | |
| Expenses, before waiver and reimbursement (C,E) | | | 2.26 | % | | | 2.37 | % | | | 2.24 | % | | | 2.33 | % | | | 2.02 | % |
| Expenses, net waiver and reimbursement (C,E) | | | 1.46 | % | | | 1.46 | % | | | 1.46 | % | | | 1.45 | % | | | 1.45 | % |
| Net investment income (C,D) | | | 3.13 | % | | | 2.78 | % | | | 2.53 | % | | | 2.26 | % | | | 2.65 | % |
| Portfolio turnover rate | | | 105 | % | | | 27 | % | | | 2 | % | | | 89 | % | | | 62 | % |
| (A) | Per share amounts calculated using average shares method, which more appropriately presents the per share data for the year. |
| (B) | Total return in the above table represents the rate that the investor would have earned or lost on an investment in the Fund assuming reinvestment of dividends and does not reflect the impact of sales charges. Had the Advisor not waived its fees and reimbursed expenses, total return would have been lower. |
| (C) | The ratios of expenses to average net assets and net investment income (loss) to average net assets do not reflect the expenses of the underlying investment companies in which the Fund invests. |
| (D) | Recognition of net investment income (loss) is affected by the timing and declaration of dividends by the underlying investment companies in which the Fund invests. |
| (E) | Ratios to average net assets (excluding interest expense) |
| Expenses, before waiver and reimbursement | | | 2.25 | % | | | 2.36 | % | | | 2.23 | % | | | 2.33 | % | | | 2.02 | % |
| Expenses, net waiver and reimbursement | | | 1.45 | % | | | 1.45 | % | | | 1.45 | % | | | 1.45 | % | | | 1.45 | % |
See accompanying notes which are an integral part of these financial statements.
| RATIONAL FUNDS |
| Rational/ReSolve Adaptive Asset Allocation Fund |
| Financial Highlights (Consolidated) |
For a Share Outstanding Throughout Each Year
| | | Institutional | |
| | | For the | | | For the | | | For the | | | For the | | | For the | |
| | | Year Ended | | | Year Ended | | | Year Ended | | | Year Ended | | | Year Ended | |
| | | December 31, | | | December 31, | | | December 31, | | | December 31, | | | December 31, | |
| | | 2023 | | | 2022 | | | 2021 | | | 2020 | | | 2019 | |
| Net asset value, beginning of year | | $ | 21.93 | | | $ | 22.71 | | | $ | 23.77 | | | $ | 23.73 | | | $ | 23.10 | |
| INCOME (LOSS) FROM INVESTMENT OPERATIONS: | | | | | | | | | | | | | | | | | | | | |
| Net investment income (loss) (A) | | | 0.47 | | | | (0.07 | ) | | | (0.50 | ) | | | (0.37 | ) | | | (0.02 | ) |
| Net realized and unrealized gain (loss) on investments | | | (0.55 | ) | | | (0.62 | ) | | | 3.16 | | | | 0.52 | | | | 4.32 | |
| Total from investment operations | | | (0.08 | ) | | | (0.69 | ) | | | 2.66 | | | | 0.15 | | | | 4.30 | |
| LESS DISTRIBUTIONS: | | | | | | | | | | | | | | | | | | | | |
| From net investment income | | | (0.59 | ) | | | (0.09 | ) | | | (3.72 | ) | | | (0.08 | ) | | | (0.69 | ) |
| From net realized gains on investments | | | (1.51 | ) | | | — | | | | — | | | | — | | | | (2.94 | ) |
| Total distributions | | | (2.10 | ) | | | (0.09 | ) | | | (3.72 | ) | | | (0.11 | ) | | | (3.67 | ) |
| Net asset value, end of year | | $ | 19.75 | | | $ | 21.93 | | | $ | 22.71 | | | $ | 23.77 | | | $ | 23.73 | |
| Total return (B) | | | (0.46 | )% | | | (3.06 | )% | | | 11.28 | % | | | 0.65 | % | | | 18.32 | % |
| RATIOS/SUPPLEMENTAL DATA: | | | | | | | | | | | | | | | | | | | | |
| Net assets, end of year (in 000’s) | | $ | 89,562 | | | $ | 162,983 | | | $ | 64,890 | | | $ | 62,176 | | | $ | 51,221 | |
| Ratios to average net assets (including interest expense) | | | | | | | | | | | | | | | | | | | | |
| Expenses, before waiver and reimbursement (C) | | | 2.15 | % | | | 2.05 | % | | | 2.17 | % | | | 2.18 | % | | | 2.32 | % |
| Expenses, net waiver and reimbursement (C) | | | 1.99 | % | | | 1.97 | % | | | 1.98 | % | | | 1.97 | % | | | 1.97 | % |
| Net investment income (loss) | | | 2.14 | % | | | (0.30 | )% | | | (1.95 | )% | | | (1.61 | )% | | | (0.06 | )% |
| Portfolio turnover rate | | | 0 | % | | | 0 | % | | | 0 | % | | | 0 | % | | | 0 | % |
| | | | | | | | | | | | | | | | | | | | | |
| | | | | | | | | | | | | | | | | | | | | |
| | | Class A | |
| | | For the | | | For the | | | For the | | | For the | | | For the | |
| | | Year Ended | | | Year Ended | | | Year Ended | | | Year Ended | | | Year Ended | |
| | | December 31, | | | December 31, | | | December 31, | | | December 31, | | | December 31, | |
| | | 2023 | | | 2022 | | | 2021 | | | 2020 | | | 2019 | |
| Net asset value, beginning of year | | $ | 21.71 | | | $ | 22.53 | | | $ | 23.61 | | | $ | 23.52 | | | $ | 22.96 | |
| INCOME (LOSS) FROM INVESTMENT OPERATIONS: | | | | | | | | | | | | | | | | | | | | |
| Net investment income (loss) (A) | | | 0.41 | | | | (0.04 | ) | | | (0.55 | ) | | | (0.36 | ) | | | (0.10 | ) |
| Net realized and unrealized gain (loss) on investments | | | (0.54 | ) | | | (0.70 | ) | | | 3.13 | | | | 0.45 | | | | 4.30 | |
| Total from investment operations | | | (0.13 | ) | | | (0.74 | ) | | | 2.58 | | | | 0.09 | | | | 4.20 | |
| LESS DISTRIBUTIONS: | | | | | | | | | | | | | | | | | | | | |
| From net investment income | | | (0.53 | ) | | | (0.08 | ) | | | (3.66 | ) | | | — | | | | (0.66 | ) |
| From net realized gains on investments | | | (1.51 | ) | | | — | | | | — | | | | — | | | | (2.94 | ) |
| Total distributions | | | (2.04 | ) | | | (0.08 | ) | | | (3.66 | ) | | | — | | | | (3.64 | ) |
| Net asset value, end of year | | $ | 19.54 | | | $ | 21.71 | | | $ | 22.53 | | | $ | 23.61 | | | $ | 23.52 | |
| Total return (B) | | | (0.71 | )% | | | (3.30 | )% | | | 10.99 | % | | | 0.38 | % | | | 18.01 | % |
| RATIOS/SUPPLEMENTAL DATA: | | | | | | | | | | | | | | | | | | | | |
| Net assets, end of year (in 000’s) | | $ | 2,113 | | | $ | 3,643 | | | $ | 607 | | | $ | 776 | | | $ | 5,425 | |
| Ratios to average net assets (including interest expense) | | | | | | | | | | | | | | | | | | | | |
| Expenses, before waiver and reimbursement (D) | | | 2.40 | % | | | 2.33 | % | | | 2.36 | % | | | 2.47 | % | | | 2.60 | % |
| Expenses, net waiver and reimbursement (D) | | | 2.24 | % | | | 2.22 | % | | | 2.23 | % | | | 2.22 | % | | | 2.22 | % |
| Net investment income (loss) | | | 1.88 | % | | | (0.18 | )% | | | (2.10 | )% | | | (1.43 | )% | | | (0.39 | )% |
| Portfolio turnover rate | | | 0 | % | | | 0 | % | | | 0 | % | | | 0 | % | | | 0 | % |
| (A) | Per share amounts calculated using average shares method, which more appropriately presents the per share data for the year. |
| (B) | Total return in the above table represents the rate that the investor would have earned or lost on an investment in the Fund assuming reinvestment of dividends and does not reflect the impact of sales charges. Had the Advisor not waived its fees and reimbursed expenses, total return would have been lower. |
| (C) | Ratios to average net assets (excluding interest expense) |
| Expenses, before waiver and reimbursement | | | 2.13 | % | | | 2.05 | % | | | 2.16 | % | | | 2.18 | % | | | 2.32 | % |
| Expenses, net waiver and reimbursement | | | 1.97 | % | | | 1.97 | % | | | 1.97 | % | | | 1.97 | % | | | 1.97 | % |
| (D) | Ratios to average net assets (excluding interest expense) |
| Expenses, before waiver and reimbursement | | | 2.38 | % | | | 2.33 | % | | | 2.35 | % | | | 2.47 | % | | | 2.60 | % |
| Expenses, net waiver and reimbursement | | | 2.22 | % | | | 2.22 | % | | | 2.22 | % | | | 2.22 | % | | | 2.22 | % |
See accompanying notes which are an integral part of these consolidated financial statements.
| RATIONAL FUNDS |
| Rational/ReSolve Adaptive Asset Allocation Fund (Continued) |
| Financial Highlights (Consolidated) |
For a Share Outstanding Throughout Each Year
| | | Class C | |
| | | For the | | | For the | | | For the | | | For the | | | For the | |
| | | Year Ended | | | Year Ended | | | Year Ended | | | Year Ended | | | Year Ended | |
| | | December 31, | | | December 31, | | | December 31, | | | December 31, | | | December 31, | |
| | | 2023 | | | 2022 | | | 2021 | | | 2020 | | | 2019 | |
| Net asset value, beginning of year | | $ | 20.94 | | | $ | 21.88 | | | $ | 23.03 | | | $ | 23.11 | | | $ | 22.61 | |
| INCOME (LOSS) FROM INVESTMENT OPERATIONS: | | | | | | | | | | | | | | | | | | | | |
| Net investment loss (A) | | | 0.24 | | | | (0.15 | ) | | | (0.72 | ) | | | (0.57 | ) | | | (0.26 | ) |
| Net realized and unrealized gain (loss) on investments | | | (0.52 | ) | | | (0.73 | ) | | | 3.05 | | | | 0.49 | | | | 4.20 | |
| Total from investment operations | | | (0.28 | ) | | | (0.88 | ) | | | 2.33 | | | | (0.08 | ) | | | 3.94 | |
| LESS DISTRIBUTIONS: | | | | | | | | | | | | | | | | | | | | |
| From net investment income | | | (0.37 | ) | | | (0.06 | ) | | | (3.48 | ) | | | — | | | | (0.46 | ) |
| From net realized gains on investments | | | (1.51 | ) | | | — | | | | — | | | | — | | | | (2.94 | ) |
| From Return of capital | | | — | | | | — | | | | — | | | | — | | | | (0.04 | ) |
| Total distributions | | | (1.88 | ) | | | (0.06 | ) | | | (3.48 | ) | | | — | | | | (3.44 | ) |
| Net asset value, end of year | | $ | 18.78 | | | $ | 20.94 | | | $ | 21.88 | | | $ | 23.03 | | | $ | 23.11 | |
| Total return (B) | | | (1.43 | )% | | | (4.01 | )% | | | 10.18 | % | | | (0.35 | )% | | | 17.15 | % |
| RATIOS/SUPPLEMENTAL DATA: | | | | | | | | | | | | | | | | | | | | |
| Net assets, end of year (in 000’s) | | $ | 3,024 | | | $ | 2,327 | | | $ | 241 | | | $ | 250 | | | $ | 438 | |
| Ratios to average net assets (including interest expense) | | | | | | | | | | | | | | | | | | | | |
| Expenses, before waiver and reimbursement (C) | | | 3.05 | % | | | 3.00 | % | | | 3.18 | % | | | 3.35 | % | | | 3.37 | % |
| Expenses, net waiver and reimbursement (C) | | | 2.99 | % | | | 2.97 | % | | | 2.98 | % | | | 2.97 | % | | | 2.97 | % |
| Net investment loss | | | 1.17 | % | | | (0.66 | )% | | | (2.95 | )% | | | (2.51 | )% | | | (1.04 | )% |
| Portfolio turnover rate | | | 0 | % | | | 0 | % | | | 0 | % | | | 0 | % | | | 0 | % |
| (A) | Per share amounts calculated using average shares method, which more appropriately presents the per share data for the year. |
| (B) | Total return in the above table represents the rate that the investor would have earned or lost on an investment in the Fund assuming reinvestment of dividends and does not reflect the impact of sales charges. Had the Advisor not waived its fees and reimbursed expenses, total return would have been lower. |
| (C) | Ratios to average net assets (excluding interest expense) |
| Expenses, before waiver and reimbursement | | | 3.03 | % | | | 3.00 | % | | | 3.17 | % | | | 3.35 | % | | | 3.37 | % |
| Expenses, net waiver and reimbursement | | | 2.97 | % | | | 2.97 | % | | | 2.97 | % | | | 2.97 | % | | | 2.97 | % |
See accompanying notes which are an integral part of these consolidated financial statements.
| RATIONAL FUNDS |
| Rational/Pier 88 Convertible Securities Fund |
| Financial Highlights |
For a Share Outstanding Throughout Each Year/Period
| | | Institutional | |
| | | For the | | | For the | | | For the | | | For the | | | For the | |
| | | Year Ended | | | Year Ended | | | Year Ended | | | Year Ended | | | Period Ended | |
| | | December 31, | | | December 31, | | | December 31, | | | December 31, | | | December 31, | |
| | | 2023 | | | 2022 | | | 2021 | | | 2020 | | | 2019 (A) | |
| Net asset value, beginning of year/period | | $ | 10.43 | | | $ | 11.96 | | | $ | 11.69 | | | $ | 10.17 | | | $ | 10.00 | |
| INCOME (LOSS) FROM INVESTMENT OPERATIONS: | | | | | | | | | | | | | | | | | | | | |
| Net investment income (B) | | | 0.22 | | | | 0.20 | | | | 0.13 | | | | 0.17 | | | | 0.03 | |
| Net realized and unrealized gain (loss) on investments | | | 0.11 | | | | (1.49 | ) | | | 1.04 | | | | 1.56 | | | | 0.14 | |
| Total from investment operations | | | 0.33 | | | | (1.29 | ) | | | 1.17 | | | | 1.73 | | | | 0.17 | |
| LESS DISTRIBUTIONS: | | | | | | | | | | | | | | | | | | | | |
| From net investment income | | | (0.23 | ) | | | (0.20 | ) | | | (0.17 | ) | | | (0.20 | ) | | | — | |
| From net realized gains on investments | | | — | | | | (0.04 | ) | | | (0.73 | ) | | | (0.01 | ) | | | — | |
| Total distributions | | | (0.23 | ) | | | (0.24 | ) | | | (0.90 | ) | | | (0.21 | ) | | | — | |
| Net asset value, end of year/period | | $ | 10.53 | | | $ | 10.43 | | | $ | 11.96 | | | $ | 11.69 | | | $ | 10.17 | |
| Total return (C) | | | 3.29 | % (D) | | | (10.82 | )% | | | 10.21 | % | | | 17.08 | % | | | 1.70 | % (E) |
| RATIOS/SUPPLEMENTAL DATA: | | | | | | | | | | | | | | | | | | | | |
| Net assets, end of year/period (in 000’s) | | $ | 135,201 | | | $ | 106,362 | | | $ | 118,333 | | | $ | 73,946 | | | $ | 5,707 | |
| Ratios to average net assets (including interest expense) | | | | | | | | | | | | | | | | | | | | |
| Expenses, before waiver and reimbursement (H) | | | 1.19 | % | | | 1.16 | % | | | 1.17 | % | | | 1.25 | % | | | 7.22 | % (F) |
| Expenses, net waiver and reimbursement (H) | | | 0.99 | % | | | 0.99 | % | | | 0.99 | % | | | 0.99 | % | | | 0.99 | % (F) |
| Net investment income | | | 2.19 | % | | | 1.81 | % | | | 1.07 | % | | | 1.62 | % | | | 4.22 | % (F) |
| Portfolio turnover rate | | | 180 | % | | | 116 | % | | | 130 | % | | | 140 | % | | | 5 | % (E) |
| | | | | | | | | | | | | | | | | | | | | |
| | | | | | | | | | | | | | | | | | | | | |
| | | Class A | |
| | | For the | | | For the | | | For the | | | For the | | | For the | |
| | | Year Ended | | | Year Ended | | | Year Ended | | | Year Ended | | | Period Ended | |
| | | December 31, | | | December 31, | | | December 31, | | | December 31, | | | December 31, | |
| | | 2023 | | | 2022 | | | 2021 | | | 2020 | | | 2019 (A) | |
| Net asset value, beginning of year/period | | $ | 10.44 | | | $ | 11.97 | | | $ | 11.69 | | | $ | 10.17 | | | $ | 10.00 | |
| INCOME (LOSS) FROM INVESTMENT OPERATIONS: | | | | | | | | | | | | | | | | | | | | |
| Net investment income (B) | | | 0.18 | | | | 0.17 | | | | 0.11 | | | | 0.39 | | | | 0.02 | |
| Net realized and unrealized gain (loss) on investments | | | 0.10 | | | | (1.49 | ) | | | 1.03 | | | | 1.33 | | | | 0.15 | |
| Total from investment operations | | | 0.28 | | | | (1.32 | ) | | | 1.14 | | | | 1.72 | | | | 0.17 | |
| LESS DISTRIBUTIONS: | | | | | | | | | | | | | | | | | | | | |
| From net investment income | | | (0.21 | ) | | | (0.17 | ) | | | (0.13 | ) | | | (0.19 | ) | | | — | |
| From net realized gains on investments | | | — | | | | (0.04 | ) | | | (0.73 | ) | | | (0.01 | ) | | | — | |
| Total distributions | | | (0.21 | ) | | | (0.21 | ) | | | (0.86 | ) | | | (0.20 | ) | | | — | |
| Net asset value, end of year/period | | $ | 10.51 | | | $ | 10.44 | | | $ | 11.97 | | | $ | 11.69 | | | $ | 10.17 | |
| Total return (C) | | | 2.73 | % (D) | | | (11.04 | )% | | | 9.97 | % | | | 16.97 | % | | | 1.70 | % (E) |
| RATIOS/SUPPLEMENTAL DATA: | | | | | | | | | | | | | | | | | | | | |
| Net assets, end of year/period (in 000’s) | | $ | 1,655 | | | $ | 1,861 | | | $ | 2,231 | | | $ | 337 | | | $ | 0 | (G) |
| Ratios to average net assets (including interest expense) | | | | | | | | | | | | | | | | | | | | |
| Expenses, before waiver and reimbursement (I) | | | 1.46 | % | | | 1.41 | % | | | 1.35 | % | | | 1.40 | % | | | 7.47 | % (F) |
| Expenses, net waiver and reimbursement (I) | | | 1.24 | % | | | 1.24 | % | | | 1.24 | % | | | 1.24 | % | | | 1.24 | % (F) |
| Net investment income | | | 1.81 | % | | | 1.55 | % | | | 0.88 | % | | | 3.50 | % | | | 3.17 | % (F) |
| Portfolio turnover rate | | | 180 | % | | | 116 | % | | | 130 | % | | | 140 | % | | | 5 | % (E) |
| (A) | Rational/Pier 88 Convertible Securities Fund Institutional, Class A, and Class C shares commenced operations December 6, 2019. |
| (B) | Per share amounts calculated using average shares method, which more appropriately presents the per share data for the year/period. |
| (C) | Total return in the above table represents the rate that the investor would have earned or lost on an investment in the Fund assuming reinvestment of dividends and does not reflect the impact of sales charges. |
| (D) | If the Sub Advisor had not made a special reimbursement during the year ended December 31 ,2023 the Total return would have been 2.19% and 1.25% for the Institutional and Class A, respectively. See Note 3. |
| (G) | Amount is less than $1000. (H) Ratios to average net assets (excluding interest expense) |
| Expenses, before waiver and reimbursement | | | 1.19 | % | | | 1.16 | % | | | 1.17 | % | | | 1.25 | % | | | 7.22 | % (F) |
| Expenses, net waiver and reimbursement | | | 0.99 | % | | | 0.99 | % | | | 0.99 | % | | | 0.99 | % | | | 0.99 | % (F) |
| (I) | Ratios to average net assets (excluding interest expense) |
| Expenses, before waiver and reimbursement | | | 1.46 | % | | | 1.41 | % | | | 1.35 | % | | | 1.40 | % | | | 7.47 | % (F) |
| Expenses, net waiver and reimbursement | | | 1.24 | % | | | 1.24 | % | | | 1.24 | % | | | 1.24 | % | | | 1.24 | % (F) |
See accompanying notes which are an integral part of these financial statements.
| RATIONAL FUNDS |
| Rational/Pier 88 Convertible Securities Fund (Continued) |
| Financial Highlights |
For a Share Outstanding Throughout Each Year/Period
| | | Class C | |
| | | For the | | | For the | | | For the | | | For the | | | For the | |
| | | Year Ended | | | Year Ended | | | Year Ended | | | Year Ended | | | Period Ended | |
| | | December 31, | | | December 31, | | | December 31, | | | December 31, | | | December 31, | |
| | | 2023 | | | 2022 | | | 2021 | | | 2020 | | | 2019 (A) | |
| Net asset value, beginning of year/period | | $ | 10.38 | | | $ | 11.90 | | | $ | 11.66 | | | $ | 10.17 | | | $ | 10.00 | |
| INCOME (LOSS) FROM INVESTMENT OPERATIONS: | | | | | | | | | | | | | | | | | | | | |
| Net investment income (loss) (B) | | | 0.11 | | | | 0.10 | | | | 0.02 | | | | 0.32 | | | | 0.02 | |
| Net realized and unrealized gain (loss) on investments | | | 0.09 | | | | (1.48 | ) | | | 1.02 | | | | 1.34 | | | | 0.15 | |
| Total from investment operations | | | 0.20 | | | | (1.38 | ) | | | 1.04 | | | | 1.66 | | | | 0.17 | |
| LESS DISTRIBUTIONS: | | | | | | | | | | | | | | | | | | | | |
| From net investment income | | | (0.14 | ) | | | (0.10 | ) | | | (0.07 | ) | | | (0.16 | ) | | | — | |
| From net realized gains on investments | | | — | | | | (0.04 | ) | | | (0.73 | ) | | | (0.01 | ) | | | — | |
| Total distributions | | | (0.14 | ) | | | (0.14 | ) | | | (0.80 | ) | | | (0.17 | ) | | | — | |
| Net asset value, end of year/period | | $ | 10.44 | | | $ | 10.38 | | | $ | 11.90 | | | $ | 11.66 | | | $ | 10.17 | |
| Total return (C) | | | 1.92 | % (D) | | | (11.63 | )% | | | 9.11 | % | | | 16.33 | % | | | 1.70 | % (E) |
| RATIOS/SUPPLEMENTAL DATA: | | | | | | | | | | | | | | | | | | | | |
| Net assets, end of year/period (in 000’s) | | $ | 320 | | | $ | 298 | | | $ | 249 | | | $ | 55 | | | $ | 0 | (G) |
| Ratios to average net assets (including interest expense) | | | | | | | | | | | | | | | | | | | | |
| Expenses, before waiver and reimbursement (H) | | | 2.13 | % | | | 2.11 | % | | | 2.10 | % | | | 2.13 | % | | | 8.22 | % (F) |
| Expenses, net waiver and reimbursement (H) | | | 1.99 | % | | | 1.99 | % | | | 1.99 | % | | | 1.99 | % | | | 1.99 | % (F) |
| Net investment income (loss) | | | 1.09 | % | | | 0.93 | % | | | 0.17 | % | | | 2.87 | % | | | 3.17 | % (F) |
| Portfolio turnover rate | | | 180 | % | | | 116 | % | | | 130 | % | | | 140 | % | | | 5 | % (E) |
| (A) | Rational/Pier 88 Convertible Securities Fund Institutional, Class A, and Class C shares commenced operations December 6, 2019. |
| (B) | Per share amounts calculated using average shares method, which more appropriately presents the per share data for the year/period. |
| (C) | Total return in the above table represents the rate that the investor would have earned or lost on an investment in the Fund assuming reinvestment of dividends and does not reflect the impact of sales charges. |
| (D) | If the Sub Advisor had not made a special reimbursement during the year ended December 31 ,2023 the Total return would have been .65% for Cl C. See Note 3. |
| (G) | Amount is less than $1000. |
| (H) | Ratios to average net assets (excluding interest expense) |
| Expenses, before waiver and reimbursement | | | 2.13 | % | | | 2.11 | % | | | 2.10 | % | | | 2.13 | % | | | 8.22 | % (E) |
| Expenses, net waiver and reimbursement | | | 1.99 | % | | | 1.99 | % | | | 1.99 | % | | | 1.99 | % | | | 1.99 | % (E) |
See accompanying notes which are an integral part of these financial statements.
| RATIONAL FUNDS |
| Rational Special Situations Income Fund |
| Financial Highlights |
For a Share Outstanding Throughout Each Year/Period
| | | Institutional | |
| | | For the | | | For the | | | For the | | | For the | | | For the | |
| | | Year Ended | | | Year Ended | | | Year Ended | | | Year Ended | | | Period Ended | |
| | | December 31, | | | December 31, | | | December 31, | | | December 31, | | | December 31, | |
| | | 2023 | | | 2022 | | | 2021 | | | 2020 | | | 2019 (A) | |
| Net asset value, beginning of year/period | | $ | 18.34 | | | $ | 19.69 | | | $ | 19.66 | | | $ | 20.10 | | | $ | 20.00 | |
| INCOME (LOSS) FROM INVESTMENT OPERATIONS: | | | | | | | | | | | | | | | | | | | | |
| Net investment income (B) | | | 1.06 | | | | 0.93 | | | | 0.74 | | | | 0.43 | | | | 0.32 | |
| Net realized and unrealized gain (loss) on investments | | | (0.28 | ) | | | (1.16 | ) | | | 0.28 | | | | 0.11 | | | | 0.06 | |
| Total from investment operations | | | 0.78 | | | | (0.23 | ) | | | 1.02 | | | | 0.54 | | | | 0.38 | |
| LESS DISTRIBUTIONS: | | | | | | | | | | | | | | | | | | | | |
| From net investment income | | | (1.34 | ) | | | (1.12 | ) | | | (0.99 | ) | | | (0.93 | ) | | | (0.25 | ) |
| From net realized gains on investments | | | — | | | | — | | | | — | | | | — | | | | (0.03 | ) |
| From Return of capital | | | (0.05 | ) | | | — | | | | (0.00 | ) (C) | | | (0.05 | ) | | | — | |
| Total distributions | | | (1.39 | ) | | | (1.12 | ) | | | (0.99 | ) | | | (0.98 | ) | | | (0.28 | ) |
| Net asset value, end of year/period | | $ | 17.73 | | | $ | 18.34 | | | $ | 19.69 | | | $ | 19.66 | | | $ | 20.10 | |
| Total return (D) | | | 4.36 | % (I) | | | (1.12 | )% (I) | | | 5.30 | % | | | 2.83 | % | | | 1.91 | % (E) |
| RATIOS/SUPPLEMENTAL DATA: | | | | | | | | | | | | | | | | | | | | |
| Net assets, end of year/period (in 000’s) | | $ | 681,473 | | | $ | 666,042 | | | $ | 670,278 | | | $ | 352,892 | | | $ | 76,833 | |
| Ratios to average net assets (including interest expense) | | | | | | | | | | | | | | | | | | | | |
| Expenses, before waiver and reimbursement (G) | | | 1.81 | % | | | 1.79 | % | | | 1.77 | % | | | 1.80 | % | | | 2.06 | % (F) |
| Expenses, net waiver and reimbursement (G) | | | 1.76 | % | | | 1.76 | % | | | 1.75 | % | | | 1.75 | % | | | 1.75 | % (F) |
| Net investment income | | | 5.79 | % | | | 4.93 | % | | | 3.75 | % | | | 2.17 | % | | | 3.48 | % (F) |
| Portfolio turnover rate | | | 21 | % | | | 27 | % | | | 37 | % | | | 4 | % | | | 14 | % (E) |
| | | | | | | | | | | | | | | | | | | | | |
| | | | | | | | | | | | | | | | | | | | | |
| | | Class A | |
| | | For the | | | For the | | | For the | | | For the | | | For the | |
| | | Year Ended | | | Year Ended | | | Year Ended | | | Year Ended | | | Period Ended | |
| | | December 31, | | | December 31, | | | December 31, | | | December 31, | | | December 31, | |
| | | 2023 | | | 2022 | | | 2021 | | | 2020 | | | 2019 (A) | |
| Net asset value, beginning of year/period | | $ | 18.32 | | | $ | 19.66 | | | $ | 19.64 | | | $ | 20.08 | | | $ | 20.00 | |
| INCOME (LOSS) FROM INVESTMENT OPERATIONS: | | | | | | | | | | | | | | | | | | | | |
| Net investment income (B) | | | 1.00 | | | | 0.88 | | | | 0.72 | | | | 0.37 | | | | 0.30 | |
| Net realized and unrealized gain (loss) on investments | | | (0.26 | ) | | | (1.15 | ) | | | 0.24 | | | | 0.13 | | | | 0.05 | |
| Total from investment operations | | | 0.74 | | | | (0.27 | ) | | | 0.96 | | | | 0.50 | | | | 0.35 | |
| LESS DISTRIBUTIONS: | | | | | | | | | | | | | | | | | | | | |
| From net investment income | | | (1.30 | ) | | | (1.07 | ) | | | (0.94 | ) | | | (0.89 | ) | | | (0.24 | ) |
| From net realized gains on investments | | | — | | | | — | | | | — | | | | — | | | | (0.03 | ) |
| From Return of capital | | | (0.05 | ) | | | — | | | | (0.00 | ) (C) | | | (0.05 | ) | | | — | |
| Total distributions | | | (1.35 | ) | | | (1.07 | ) | | | (0.94 | ) | | | (0.94 | ) | | | (0.27 | ) |
| Net asset value, end of year/period | | $ | 17.71 | | | $ | 18.32 | | | $ | 19.66 | | | $ | 19.64 | | | $ | 20.08 | |
| Total return (D) | | | 4.11 | % (I) | | | (1.31 | )% (I) | | | 5.00 | % | | | 2.60 | % | | | 1.74 | % (E) |
| RATIOS/SUPPLEMENTAL DATA: | | | | | | | | | | | | | | | | | | | | |
| Net assets, end of year/period (in 000’s) | | $ | 62,428 | | | $ | 70,121 | | | $ | 58,164 | | | $ | 37,224 | | | $ | 5,449 | |
| Ratios to average net assets (including interest expense) | | | | | | | | | | | | | | | | | | | | |
| Expenses, before waiver and reimbursement (H) | | | 2.07 | % | | | 2.05 | % | | | 2.03 | % | | | 2.10 | % | | | 2.21 | % (F) |
| Expenses, net waiver and reimbursement (H) | | | 2.01 | % | | | 2.02 | % | | | 2.00 | % | | | 2.00 | % | | | 2.00 | % (F) |
| Net investment income | | | 5.49 | % | | | 4.69 | % | | | 3.67 | % | | | 1.88 | % | | | 3.22 | % (F) |
| Portfolio turnover rate | | | 21 | % | | | 27 | % | | | 37 | % | | | 4 | % | | | 14 | % (E) |
| (A) | Rational Special Situations Income Fund Institutional, Class A, and Class C shares commenced operations July 17, 2019. |
| (B) | Per share amounts calculated using average shares method, which more appropriately presents the per share data for the year/period. |
| (C) | Represents an amount less than $0.01 per share. |
| (D) | Total return in the above table represents the rate that the investor would have earned or lost on an investment in the Fund assuming reinvestment of dividends and does not reflect the impact of sales charges. |
| (G) | Ratios to average net assets (excluding interest expense) |
| Expenses, before waiver and reimbursement | | | 1.81 | % | | | 1.79 | % | | | 1.77 | % | | | 1.80 | % | | | 2.06 | % (F) |
| Expenses, net waiver and reimbursement | | | 1.76 | % | | | 1.76 | % | | | 1.75 | % | | | 1.75 | % | | | 1.75 | % (F) |
| (H) | Ratios to average net assets (excluding interest expense) |
| Expenses, before waiver and reimbursement | | | 2.07 | % | | | 2.05 | % | | | 2.03 | % | | | 2.10 | % | | | 2.21 | % (F) |
| Expenses, net waiver and reimbursement | | | 2.01 | % | | | 2.02 | % | | | 2.00 | % | | | 2.00 | % | | | 2.00 | % (F) |
| (I) | Includes adjustments in accordance with accounting principles generally accepted in the United States and, consequently, the net asset value for financial reporting purposes and the returns based upon those net asset values may differ from the net asset values and returns for shareholder transactions. |
See accompanying notes which are an integral part of these financial statements.
| RATIONAL FUNDS |
| Rational Special Situations Income Fund (Continued) |
| Financial Highlights |
For a Share Outstanding Throughout Each Year/Period
| | | Class C | |
| | | For the | | | For the | | | For the | | | For the | | | For the | |
| | | Year Ended | | | Year Ended | | | Year Ended | | | Year Ended | | | Period Ended | |
| | | December 31, | | | December 31, | | | December 31, | | | December 31, | | | December 31, | |
| | | 2023 | | | 2022 | | | 2021 | | | 2020 | | | 2019(A) | |
| Net asset value, beginning of year/period | | $ | 18.27 | | | $ | 19.61 | | | $ | 19.60 | | | $ | 20.06 | | | $ | 20.00 | |
| INCOME (LOSS) FROM INVESTMENT OPERATIONS: | | | | | | | | | | | | | | | | | | | | |
| Net investment income (B) | | | 0.87 | | | | 0.74 | | | | 0.48 | | | | 0.21 | | | | 0.23 | |
| Net realized and unrealized gain (loss) on investments | | | (0.27 | ) | | | (1.15 | ) | | | 0.33 | | | | 0.14 | | | | 0.05 | |
| Total from investment operations | | | 0.60 | | | | (0.41 | ) | | | 0.81 | | | | 0.35 | | | | 0.28 | |
| LESS DISTRIBUTIONS: | | | | | | | | | | | | | | | | | | | | |
| From net investment income | | | (1.16 | ) | | | (0.93 | ) | | | (0.80 | ) | | | (0.76 | ) | | | (0.19 | ) |
| From net realized gains on investments | | | — | | | | — | | | | — | | | | — | | | | (0.03 | ) |
| From Return of capital | | | (0.05 | ) | | | — | | | | (0.00 | ) (C) | | | (0.05 | ) | | | — | |
| Total distributions | | | (1.21 | ) | | | (0.93 | ) | | | (0.80 | ) | | | (0.81 | ) | | | (0.22 | ) |
| Net asset value, end of year/period | | $ | 17.66 | | | $ | 18.27 | | | $ | 19.61 | | | $ | 19.60 | | | $ | 20.06 | |
| Total return (D) | | | 3.34 | % (H) | | | (2.05 | )% (H) | | | 4.22 | % | | | 1.82 | % | | | 1.43 | % (E) |
| RATIOS/SUPPLEMENTAL DATA: | | | | | | | | | | | | | | | | | | | | |
| Net assets, end of year/period (in 000’s) | | $ | 34,676 | | | $ | 34,455 | | | $ | 35,497 | | | $ | 14,123 | | | $ | 1,289 | |
| Ratios to average net assets (including interest expense) | | | | | | | | | | | | | | | | | | | | |
| Expenses, before waiver and reimbursement (G) | | | 2.76 | % | | | 2.76 | % | | | 2.74 | % | | | 2.77 | % | | | 2.97 | % (F) |
| Expenses, net waiver and reimbursement (G) | | | 2.76 | % | | | 2.76 | % | | | 2.75 | % | | | 2.75 | % | | | 2.75 | % (F) |
| Net investment income | | | 4.76 | % | | | 3.95 | % | | | 2.46 | % | | | 1.05 | % | | | 2.47 | % (F) |
| Portfolio turnover rate | | | 21 | % | | | 27 | % | | | 37 | % | | | 4 | % | | | 14 | % (E) |
| (A) | Rational Special Situations Income Fund Institutional, Class A, and Class C shares commenced operations July 17, 2019. |
| (B) | Per share amounts calculated using average shares method, which more appropriately presents the per share data for the year/period. |
| (C) | Represents an amount less than $0.01 per share. |
| (D) | Total return in the above table represents the rate that the investor would have earned or lost on an investment in the Fund assuming reinvestment of dividends and does not reflect the impact of sales charges. |
| (G) | Ratios to average net assets (excluding interest expense) |
| Expenses, before waiver and reimbursement | | | 2.76 | % | | | 2.75 | % | | | 2.74 | % | | | 2.77 | % | | | 2.97 | % (F) |
| Expenses, net waiver and reimbursement | | | 2.76 | % | | | 2.75 | % | | | 2.75 | % | | | 2.75 | % | | | 2.75 | % (F) |
| (H) | Includes adjustments in accordance with accounting principles generally accepted in the United States and, consequently, the net asset value for financial reporting purposes and the returns based upon those net asset values may differ from the net asset values and returns for shareholder transactions. |
See accompanying notes which are an integral part of these financial statements.
| RATIONAL FUNDS |
| Rational Real Assets Fund (Formerly Rational Inflation Growth Fund) |
| Financial Highlights |
For a Share Outstanding Throughout Each Year/Period
| | | Institutional | |
| | | For the | | | For the | | | For the | |
| | | Year Ended | | | Year Ended | | | Period Ended | |
| | | December 31, | | | December 31, | | | December 31, | |
| | | 2023 | | | 2022 | | | 2021 (A) | |
| Net asset value, beginning of year/period | | $ | 9.65 | | | $ | 9.80 | | | $ | 10.00 | |
| INCOME (LOSS) FROM INVESTMENT OPERATIONS: | | | | | | | | | | | | |
| Net investment income (loss) (B) | | | 0.09 | | | | 0.27 | | | | 0.25 | |
| Net realized and unrealized gain (loss) on investments | | | 0.62 | | | | (0.37 | ) | | | (0.38 | ) |
| Total from investment operations | | | 0.71 | | | | (0.10 | ) | | | (0.13 | ) |
| LESS DISTRIBUTIONS: | | | | | | | | | | | | |
| From net investment income | | | (0.10 | ) | | | (0.04 | ) | | | (0.07 | ) |
| From net realized gains on investments | | | — | | | | (0.01 | ) | | | — | |
| Total distributions | | | (0.10 | ) | | | (0.05 | ) | | | (0.07 | ) |
| Net asset value, end of year/period | | $ | 10.26 | | | $ | 9.65 | | | $ | 9.80 | |
| Total return (C) | | | 7.43 | % | | | (1.10 | )% | | | (1.26 | )% (D) |
| RATIOS/SUPPLEMENTAL DATA: | | | | | | | | | | | | |
| Net assets, end of year/period (in 000’s) | | $ | 2,866 | | | $ | 2,887 | | | $ | 1,360 | |
| Ratios to average net assets | | | | | | | | | | | | |
| Expenses, before waiver and reimbursement (G) | | | 4.94 | % | | | 4.56 | % | | | 12.47 | % (E) |
| Expenses, net waiver and reimbursement (G) | | | 1.52 | % | | | 1.49 | % | | | 1.49 | % (E) |
| Net investment income (loss) | | | 0.95 | % | | | 2.82 | % | | | 6.83 | % (E) |
| Portfolio turnover rate | | | 61 | % | | | 18 | % | | | 0 | % (D) |
| | | | | | | | | | | | | |
| | | | | | | | | | | | | |
| | | Class A | |
| | | For the | | | For the | | | For the | |
| | | Year Ended | | | Year Ended | | | Period Ended | |
| | | December 31, | | | December 31, | | | December 31, | |
| | | 2023 | | | 2022 | | | 2021 (A) | |
| Net asset value, beginning of year/period | | $ | 9.64 | | | $ | 9.79 | | | $ | 10.00 | |
| INCOME (LOSS) FROM INVESTMENT OPERATIONS: | | | | | | | | | | | | |
| Net investment income (B) | | | 0.05 | | | | 0.21 | | | | 0.49 | |
| Net realized and unrealized gain (loss) on investments | | | 0.63 | | | | (0.33 | ) | | | (0.63 | ) |
| Total from investment operations | | | 0.68 | | | | (0.12 | ) | | | (0.14 | ) |
| LESS DISTRIBUTIONS: | | | | | | | | | | | | |
| From net investment income | | | (0.08 | ) | | | (0.02 | ) | | | (0.07 | ) |
| From net realized gains on investments | | | — | | | | (0.01 | ) | | | — | |
| Total distributions | | | (0.08 | ) | | | (0.03 | ) | | | (0.07 | ) |
| Net asset value, end of year/period | | $ | 10.24 | | | $ | 9.64 | | | $ | 9.79 | |
| Total return (C) | | | 7.09 | % (I) | | | (1.29 | )% | | | (1.39 | )% (D) |
| RATIOS/SUPPLEMENTAL DATA: | | | | | | | | | | | | |
| Net assets, end of year/period (in 000’s) | | $ | 330 | | | $ | 788 | | | $ | 697 | |
| Ratios to average net assets | | | | | | | | | | | | |
| Expenses, before waiver and reimbursement (H) | | | 5.19 | % | | | 4.91 | % | | | 12.72 | % (E) |
| Expenses, net waiver and reimbursement (H) | | | 1.77 | % | | | 1.74 | % | | | 1.74 | % (E) |
| Net investment income (loss) | | | 0.55 | % | | | 2.11 | % | | | 13.23 | % (E) |
| Portfolio turnover rate | | | 61 | % | | | 18 | % | | | 0 | % (D) |
| (A) | Rational Real Assets Fund (formerly, Rational Inflation Growth Fund) commenced operations August 18, 2021. |
| (B) | Per share amounts calculated using average shares method, which more appropriately presents the per share data for the year/period. |
| (C) | Total return in the above table represents the rate that the investor would have earned or lost on an investment in the Fund assuming reinvestment of dividends and does not reflect the impact of sales charges. |
| (G) | Ratios to average net assets (excluding interest expense) |
| Expenses, before waiver and reimbursement | | | 4.92 | % | | | 4.56 | % | | | 12.47 | % (E) |
| Expenses, net waiver and reimbursement | | | 1.49 | % | | | 1.49 | % | | | 1.49 | % (E) |
| (H) | Ratios to average net assets (excluding interest expense) |
| Expenses, before waiver and reimbursement | | | 5.16 | % | | | 4.91 | % | | | 12.72 | % (E) |
| Expenses, net waiver and reimbursement | | | 1.74 | % | | | 1.74 | % | | | 1.74 | % (E) |
| (I) | Includes adjustments in accordance with accounting principles generally accepted in the United States and, consequently, the net asset value for financial reporting purposes and the returns based upon those net asset values may differ from the net asset values and returns for shareholder transactions. |
See accompanying notes which are an integral part of these financial statements.
| RATIONAL FUNDS |
| Rational Real Assets Fund (Formerly Rational Inflation Growth Fund) (Continued) |
| Financial Highlights |
For a Share Outstanding Throughout Each Year/Period
| | | Class C | |
| | | For the | | | For the | | | For the | |
| | | Year Ended | | | Year Ended | | | Period Ended | |
| | | December 31, | | | December 31, | | | December 31, | |
| | | 2023 | | | 2022 | | | 2021 (A) | |
| Net asset value, beginning of year/period | | $ | 9.56 | | | $ | 9.77 | | | $ | 10.00 | |
| INCOME (LOSS) FROM INVESTMENT OPERATIONS: | | | | | | | | | | | | |
| Net investment income (loss) (B) | | | (0.02 | ) | | | 0.16 | | | | 0.70 | |
| Net realized and unrealized gain (loss) on investments | | | 0.62 | | | | (0.36 | ) | | | (0.86 | ) |
| Total from investment operations | | | 0.60 | | | | (0.20 | ) | | | (0.16 | ) |
| LESS DISTRIBUTIONS: | | | | | | | | | | | | |
| From net investment income | | | (0.03 | ) | | | — | | | | (0.07 | ) |
| From net realized gains on investments | | | — | | | | (0.01 | ) | | | — | |
| Total distributions | | | (0.03 | ) | | | (0.01 | ) | | | (0.07 | ) |
| Net asset value, end of year/period | | $ | 10.13 | | | $ | 9.56 | | | $ | 9.77 | |
| Total return (C) | | | 6.25 | % | | | (2.09 | )% | | | (1.60 | )% (D) |
| RATIOS/SUPPLEMENTAL DATA: | | | | | | | | | | | | |
| Net assets, end of year/period (in 000’s) | | $ | 9 | | | $ | 33 | | | $ | 26 | |
| Ratios to average net assets | | | | | | | | | | | | |
| Expenses, before waiver and reimbursement (F) | | | 5.71 | % | | | 5.89 | % | | | 13.47 | % (E) |
| Expenses, net waiver and reimbursement (F) | | | 2.52 | % | | | 2.49 | % | | | 2.49 | % (E) |
| Net investment income (loss) | | | (0.23 | )% | | | 1.67 | % | | | 19.41 | % (E) |
| Portfolio turnover rate | | | 61 | % | | | 18 | % | | | 0 | % (D) |
| (A) | Rational Real Assets Fund (formerly, Rational Inflation Growth Fund) commenced operations August 18, 2021. |
| (B) | Per share amounts calculated using average shares method, which more appropriately presents the per share data for the year/period. |
| (C) | Total return in the above table represents the rate that the investor would have earned or lost on an investment in the Fund assuming reinvestment of dividends and does not reflect the impact of sales charges. |
| (F) | Ratios to average net assets (excluding interest expense) |
| Expenses, before waiver and reimbursement | | | 5.69 | % | | | 5.89 | % | | | 13.47 | % (E) |
| Expenses, net waiver and reimbursement | | | 2.49 | % | | | 2.49 | % | | | 2.49 | % (E) |
See accompanying notes which are an integral part of these financial statements.
| RATIONAL FUNDS | |
| CONSOLIDATED NOTES TO FINANCIAL STATEMENTS | |
| December 31, 2023 | ANNUAL REPORT |
(1) ORGANIZATION AND SIGNIFICANT ACCOUNTING POLICIES
Mutual Fund and Variable Insurance Trust (the “Trust”) was organized as a Delaware statutory trust on June 23, 2006. The Trust is registered under the Investment Company Act of 1940, as amended (the “1940 Act”), as an open-end management investment company. As of December 31, 2023, the Trust operated 8 separate series, or mutual funds, each with its own investment objective and strategy. This report contains financial statements and financial highlights of the funds listed below (individually referred to as a “Fund”, or collectively as the “Funds”):
| Fund | Sub-Advisor | Primary Objective |
| Rational Equity Armor Fund (“Equity Armor”) | Equity Armor Investments, LLC | Total return on investment, with dividend income an important component of that return. |
| Rational Tactical Return Fund (“Tactical Return”) | Warrington Asset Management, LLC | Total return consisting of long-term capital appreciation and income. |
| Rational Dynamic Brands Fund (“Dynamic Brands”) | Accuvest Global Advisors, Inc. | Long-term capital appreciation. |
| Rational Strategic Allocation Fund (“Strategic Allocation”) | | Current income and moderate appreciation of capital. |
| Rational/ReSolve Adaptive Asset Allocation Fund (“ReSolve Adaptive”) | ReSolve Asset Management, Inc., Sub- Advisor; ReSolve Asset Management SEZC (Cayman), Futures Trading | Long-term capital appreciation. |
| Rational/Pier 88 Convertible Securities Fund (“Pier 88”) | Pier 88 Investment Partners, LLC | Total return consisting of capital appreciation and income. |
| Rational Special Situations Income Fund (“Special Situations”) | ESM Management, LLC | Total return consisting of capital appreciation and income. |
| Rational Real Assets Fund (Formerly, Rational Inflation Growth Fund) (“Real Assets”) | SL Advisors, LLC | Long-term capital appreciation. |
The Funds are classified as diversified funds under the 1940 Act, except Pier 88 and Real Assets, which are classified as non- diversified funds. The Strategic Allocation Fund is a “fund of funds”, in that it generally invest in other investment companies.
Currently, all Funds offer Class A, Class C, and Institutional shares. Each class of shares for each Fund has identical rights and privileges except with respect to distribution (12b-1) and service fees, if any, voting rights on matters affecting a single class of shares, exchange privileges of each class of shares and sales charges. The price at which the Funds will offer or redeem shares is the net asset value (“NAV”) per share next determined after the order is considered received, subject to any applicable front end or contingent deferred sales charges. Class A shares have a maximum sales charge on purchases of 5.75% for ReSolve Adaptive and Real Assets and 4.75% for all other Funds as a percentage of the original purchase price. Class C shares have a contingent deferred sales charge of 1.00% on shares sold within one year of purchase. Each Fund’s prospectus provides a description of the Fund’s investment objectives, policies and strategies along with information on the classes of shares currently being offered.
(2) SIGNIFICANT ACCOUNTING POLICIES
The following is a summary of significant accounting policies consistently followed by the Funds and are in accordance with accounting principles generally accepted in the United States of America (“GAAP”). Each Fund is an investment company and accordingly follows the investment company accounting and reporting guidance of the Financial Accounting Standards Board (“FASB”) Accounting Standard Codification Topic 946 Financial Services – Investment Companies.
The preparation of financial statements in conformity with GAAP requires management to make estimates and assumptions that affect the amounts of assets, liabilities, and disclosure of contingent assets and liabilities at the date of the financial statements and the reported amounts increases and decreases in net assets resulting from operations during the period. Actual results could differ from those estimates.
A. Investment Valuations
All investments in securities are recorded at their estimated fair value. In computing the NAV of the Funds, fair value is based on market valuations with respect to portfolio securities for which market quotations are readily available. Pursuant to the valuation procedures approved by the Board of Trustees of the Trust (the “Board” or “Trustees”) pursuant to Rule
| RATIONAL FUNDS | |
| CONSOLIDATED NOTES TO FINANCIAL STATEMENTS (Continued) | |
| December 31, 2023 | ANNUAL REPORT |
2a-5 under the 1940 Act, the Trust relies on certain security pricing services to provide the current market value of securities. Those security pricing services value equity securities (including foreign equity securities, exchange-traded funds and closed-end funds) traded on a securities exchange at the last reported sales price on the principal exchange. Equity securities quoted by NASDAQ are valued at the NASDAQ official closing price. If there is no reported sale on the principal exchange, and in the case of over-the-counter securities, equity securities are valued at a bid price estimated by the security pricing service. Debt securities (other than short-term obligations) are valued each day by an independent pricing service in accordance with valuation procedures approved by the Board using methods which include current market quotations from a major market maker in the securities and based on methods which include the consideration of yields or prices of securities of comparable quality, coupon, maturity and type. Option contracts are generally valued at the close. If the close price is outside the bid and the ask price; the quote closest to the close is used. When there is no trading volume the mean of the bid and ask is used. Foreign securities quoted in foreign currencies are translated into U.S. dollars at the foreign exchange rate in effect as of the close of the New York Stock Exchange (the “NYSE”). Investments in open-end investment companies (except for exchange-traded funds, “ETFs”) are valued at their respective net asset value as reported by such companies. Futures, which are traded on an exchange, are valued at the settlement price determined by the exchange. Short-term debt obligations having 60 days or less remaining until maturity, at time of purchase, may be valued at amortized cost.
Securities for which market quotations are not readily available are valued at fair value under Trust procedures approved by the Board. In these cases, a valuation designee, determines in good faith, subject to Trust procedures, the fair value of portfolio securities held by a Fund (“good faith fair valuation”). When a good faith fair valuation of a security is required, consideration is generally given to a number of factors including, but not limited to the following: dealer quotes, published analyses by dealers or analysts regarding the security, transactions which provide implicit valuation of the security (such as a merger or tender offer transaction), the value of other securities or contracts which derive their value from the security at issue, and the implications of any other circumstances which have caused trading in the security to halt. With respect to certain categories of securities, the procedures utilized by the valuation designee detail specific valuation methodologies to be applied in lieu of considering the aforementioned list of factors.
Fair valuation procedures are also used when a significant event affecting the value of a portfolio security is determined to have occurred between the time when the price of the portfolio security is determined and the close of trading on the NYSE, which is when each Fund’s NAV is computed. An event is considered significant if there is both an affirmative expectation that the security’s value will change in response to the event and a reasonable basis for quantifying the resulting change in value. Significant events include significant securities’ market movements occurring between the time the price of the portfolio security is determined and the close of trading on the NYSE. For securities normally priced at their last sale price in a foreign market, such events can occur between the close of trading in the foreign market and the close of trading on the NYSE.
In some cases, events affecting the issuer of a portfolio security may be considered significant events. Examples of potentially significant events include announcements concerning earnings, acquisitions, new products, management changes, litigation developments, a strike or natural disaster affecting the company’s operations or regulatory changes or market developments affecting the issuer’s industry occurring between the time when the price of the portfolio security is determined and the close of trading on the NYSE. For securities of foreign issuers, such events could also include political or other developments affecting the economy or markets in which the issuer conducts its operations or its securities are traded.
There can be no assurance that a Fund could purchase or sell a portfolio security at the price used to calculate the Fund’s NAV. In the case of good faith fair valued portfolio securities, lack of information and uncertainty as to the significance of information may lead to a conclusion that a prior valuation is the best indication of a portfolio security’s present value. Good faith fair valuations generally remain unchanged until new information becomes available. Consequently, changes in good faith fair valuation of portfolio securities may be less frequent and of greater magnitude than changes in the price of portfolio securities valued at their last sale price, by an independent pricing service, or based on market quotations.
| RATIONAL FUNDS | |
| CONSOLIDATED NOTES TO FINANCIAL STATEMENTS (Continued) | |
| December 31, 2023 | ANNUAL REPORT |
Valuation of Fund of Funds – The Funds may invest in portfolios of open-end or closed-end investment companies (the “Underlying Funds”). Open-end investment companies that are not ETFs are valued at their respective net asset values as reported by such investment companies. The shares of many closed-end investment companies and ETFs, after their initial public offering, frequently trade at a price per share, which is different than the net asset value per share. The difference represents a market premium or market discount of such shares. There can be no assurances that the market discount or market premium on shares of any closed-end investment company or ETF purchased by the Funds will not change.
The Trust calculates the NAV for each of the Funds by valuing securities held based on fair value. Fair value is defined as the price that would be received to sell an asset or paid to transfer a liability in an orderly transaction between market participants at the measurement date. The valuation techniques described below maximize the use of observable inputs and minimize the use of unobservable inputs in determining fair value. The inputs used for valuing the Funds’ investments are summarized in the three broad levels listed below:
| ● | Level 1 - unadjusted quoted prices in active markets for identical investments and/or registered investment companies where the value per share is determined and published and is the basis for current transactions for identical assets or liabilities at the valuation date. |
| ● | Level 2 - other significant observable inputs (including quoted prices for similar securities, interest rates, prepayment speeds, credit risk, etc.). |
| ● | Level 3 - significant unobservable inputs (including the Funds’ own assumptions in determining the fair value of investments). |
Changes in valuation techniques may result in transfers in or out of an assigned level within the disclosure hierarchy. The inputs or methodology used for valuing investments is not necessarily an indication of the risk associated with investing in those investments.
The following tables summarize the inputs used as of December 31, 2023, for each Fund’s assets and liabilities measured at fair value:
Equity Armor
| Assets* | | Level 1 | | | Level 2 | | | Level 3 | | | Total | |
| Common Stocks | | $ | 24,690,340 | | | $ | — | | | $ | — | | | $ | 24,690,340 | |
| Exchange Traded Funds | | | 13,119,096 | | | | — | | | | — | | | | 13,119,096 | |
| Short-Term Investments | | | 168,457 | | | | — | | | | — | | | | 168,457 | |
| Derivatives | | | | | | | | | | | | | | | | |
| Purchased Options | | $ | 162,001 | | | $ | — | | | $ | — | | | $ | 162,001 | |
| Futures Contracts | | | 168,345 | | | | — | | | | — | | | | 168,345 | |
| Total Assets | | $ | 38,308,239 | | | $ | — | | | $ | — | | | $ | 38,308,239 | |
| Liabilities* | | | | | | | | | | | | | | | | |
| Derivatives | | | | | | | | | | | | | | | | |
| Written Options | | $ | 30,667 | | | $ | — | | | $ | — | | | $ | 30,667 | |
| Futures Contracts | | $ | 210,467 | | | | — | | | | — | | | | 210,467 | |
| Total Liabilities | | $ | 241,134 | | | $ | — | | | $ | — | | | $ | 241,134 | |
| RATIONAL FUNDS | |
| CONSOLIDATED NOTES TO FINANCIAL STATEMENTS (Continued) | |
| December 31, 2023 | ANNUAL REPORT |
Tactical Return
| Assets* | | Level 1 | | | Level 2 | | | Level 3 | | | Total | |
| U.S. Treasury Bills | | $ | — | | | $ | 69,316,984 | | | $ | — | | | $ | 69,316,984 | |
| Short-Term Investments | | | 52,763,568 | | | | — | | | | — | | | | 52,763,568 | |
| Derivatives | | | | | | | | | | | | | | | | |
| Purchased Options | | $ | 24,940 | | | $ | — | | | $ | — | | | $ | 24,940 | |
| Total Assets | | $ | 52,788,508 | | | $ | 69,316,984 | | | $ | — | | | $ | 122,105,492 | |
| Liabilities* | | | | | | | | | | | | | | | | |
| Derivatives | | | | | | | | | | | | | | | | |
| Written Options | | $ | 39,900 | | | $ | — | | | $ | — | | | $ | 39,900 | |
| Total Liabilities | | $ | 39,900 | | | $ | — | | | $ | — | | | $ | 39,900 | |
Dynamic Brands
| Assets* | | Level 1 | | | Level 2 | | | Level 3 | | | Total | |
| Common Stocks | | $ | 62,771,548 | | | $ | — | | | $ | — | | | $ | 62,771,548 | |
| Short-Term Investments | | | 425,543 | | | | — | | | | — | | | | 425,543 | |
| Total Assets | | $ | 63,197,091 | | | $ | — | | | $ | — | | | $ | 63,197,091 | |
Strategic Allocation
| Assets* | | Level 1 | | | Level 2 | | | Level 3 | | | Total | |
| Open End Funds | | $ | 8,651,361 | | | $ | — | | | $ | — | | | $ | 8,651,361 | |
| U.S. Treasury Bills | | | — | | | | 490,412 | | | | — | | | | 490,412 | |
| Short-Term Investments | | | 81,467 | | | | — | | | | — | | | | 81,467 | |
| Derivatives | | | | | | | | | | | | | | | | |
| Futures Contract | | $ | 71,400 | | | $ | — | | | $ | — | | | $ | 71,400 | |
| Total Assets | | $ | 8,804,228 | | | $ | 490,412 | | | $ | — | | | $ | 9,294,640 | |
ReSolve Adaptive
| Assets* | | Level 1 | | | Level 2 | | | Level 3 | | | Total | |
| U.S. Treasury Bills | | $ | — | | | $ | 59,780,168 | | | $ | — | | | $ | 59,780,168 | |
| Short-Term Investments | | | 22,392,315 | | | | — | | | | — | | | | 22,392,315 | |
| Derivatives | | | | | | | | | | | | | | | | |
| Futures Contracts | | | 1,467,302 | | | | — | | | | — | | | | 1,467,302 | |
| Total Assets | | $ | 23,859,617 | | | $ | 59,780,168 | | | $ | — | | | $ | 83,639,785 | |
| Liabilities* | | | | | | | | | | | | | | | | |
| Derivatives | | | | | | | | | | | | | | | | |
| Futures Contracts | | $ | 1,891,556 | | | $ | — | | | $ | — | | | $ | 1,891,556 | |
| Total Liabilities | | $ | 1,891,556 | | | $ | — | | | $ | — | | | $ | 1,891,556 | |
| RATIONAL FUNDS | |
| CONSOLIDATED NOTES TO FINANCIAL STATEMENTS (Continued) | |
| December 31, 2023 | ANNUAL REPORT |
Pier 88
| Assets* | | Level 1 | | | Level 2 | | | Level 3 | | | Total | |
| Common Stocks | | $ | 20,299,806 | | | $ | — | | | $ | — | | | $ | 20,299,806 | |
| Preferred Stocks | | | 25,236,418 | | | | — | | | | — | | | | 25,236,418 | |
| Convertible Bonds | | | — | | | | 86,717,229 | | | | — | | | | 86,717,229 | |
| Short-Term Investments | | | 4,689,343 | | | | — | | | | — | | | | 4,689,343 | |
| Total Assets | | $ | 50,225,567 | | | $ | 86,717,229 | | | $ | — | | | $ | 136,942,796 | |
Special Situations
| Assets* | | Level 1 | | | Level 2 | | | Level 3 | | | Total | |
| Preferred Stocks | | $ | — | | | $ | 4,037,211 | | | $ | — | | | $ | 4,037,211 | |
| Asset Backed Securities | | | — | | | | 621,240,838 | | | | — | | | | 621,240,838 | |
| Corporate Bonds | | | — | | | | 138,742,080 | | | | — | | | | 138,742,080 | |
| Short-Term Investments | | | 7,652,259 | | | | — | | | | — | | | | 7,652,259 | |
| Total Assets | | $ | 7,652,259 | | | $ | 764,020,129 | | | $ | — | | | $ | 771,672,388 | |
Real Assets
| Assets* | | Level 1 | | | Level 2 | | | Level 3 | | | Total | |
| Common Stocks | | $ | 3,180,791 | | | $ | — | | | $ | — | | | $ | 3,180,791 | |
| Short-Term Investments | | | 37,041 | | | | — | | | | — | | | | 37,041 | |
| Total Assets | | $ | 3,217,832 | | | $ | — | | | $ | — | | | $ | 3,217,832 | |
| * | Refer to the Schedule of Investments for industry classifications. |
There were no level 3 securities held during the year for any Fund.
Consolidation of Subsidiaries – The consolidated financial statements of ReSolve Adaptive include the accounts of RDMF Fund Ltd. (“RDMF”), a wholly-owned and controlled foreign subsidiary. All inter-company accounts and transactions have been eliminated in consolidation.
ReSolve Adaptive may invest up to 25% of its total assets in RDMF, a controlled foreign corporation (“CFC”), that acts as an investment vehicle in order to effect certain investments consistent with ReSolve Adaptive’s investment objectives and policies.
| | Inception Date of | RDMF Net Assets as of | % of Net Assets as of |
| | RDMF | December 31, 2023 | December 31, 2023 |
| RDMF | 8/5/2016 | $ 17,319,008 | 18.29% |
For tax purposes, RDMF is an exempted Cayman investment company. RDMF has received an undertaking from the Government of the Cayman Islands exempting it from all local income, profits and capital gains taxes. No such taxes are levied in the Cayman Islands at the present time. For U.S. income tax purposes, RDMF is a controlled foreign corporation that generates and is allocated no income which is considered effectively connected with U.S. trade or business and as such is not subject to U.S. income tax. However, as a wholly-owned controlled foreign corporation, RDMF’s net income and capital gain, to the extent of its earnings and profits, will be included each year in ReSolve Adaptive’s investment company taxable income.
| RATIONAL FUNDS | |
| CONSOLIDATED NOTES TO FINANCIAL STATEMENTS (Continued) | |
| December 31, 2023 | ANNUAL REPORT |
B. Foreign Currency Translation
The accounting records of the Funds are maintained in U.S. dollars. Foreign currency amounts are translated into U.S. dollars at the current rate of exchange each business day to determine the value of investments, and other assets and liabilities. Purchases and sales of foreign securities, and income and expenses, are translated at the prevailing rate of exchange on the respective date of these transactions. The Funds do not isolate that portion of the results of operations resulting from changes in foreign exchange rates on investments from fluctuation arising from changes in market prices of securities held. These fluctuations are included with the net realized and unrealized gain or loss from investments and foreign currency transactions.
Reported net realized foreign exchange gains or losses arise from sales of portfolio securities; sales and maturities of short term securities; sales of foreign currencies; currency gains or losses realized between the trade and settlement dates on securities transactions; and the difference between the amounts of dividends, interest, and foreign withholding taxes recorded on the Funds’ books and the U.S. dollar equivalent of the amounts actually received or paid. Net unrealized foreign exchange gains and losses arise from changes in the values of assets and liabilities, including investments in securities at fiscal period-end, resulting from changes in the exchange rate.
C. Derivative Instruments
Certain of the Funds may be subject to equity price risk, commodity risk, interest rate risk and foreign currency exchange risk in the normal course of pursuing their investment objectives. Certain of the Funds may invest in various financial instruments including positions in foreign currency contracts, written and purchased option contracts and futures contracts to gain exposure to or hedge against changes in the value of equities or foreign currencies. The following is a description of the derivative instruments utilized by the Funds, including the primary underlying risk exposure related to each instrument type.
Futures Contracts – Certain of the Funds may purchase and sell futures contracts. A Fund may use futures contracts to gain exposure to, or hedge against changes in the value of underlying reference assets, such as equities, interest rates, commodities prices or foreign currencies. Upon entering into a contract, the Fund deposits and maintains as collateral such initial margin as required by the exchange on which the transaction is affected. Pursuant to the contract, the Fund agrees to receive from or pay to the broker an amount of cash equal to the daily fluctuation in value of the contract. Such receipts or payments are known as “variation margin” and are recorded by the Fund as unrealized gains and losses. When the contract is closed, the Fund records a realized gain or loss equal to the difference between the value of the contract at the time it was opened and the value at the time it was closed.
Options Contracts – Certain Funds may purchase put and call options and write put and call options. The premium paid for a purchased put or call option plus any transaction costs will reduce the benefit, if any, realized by a Fund upon exercise of the option, and, unless the price of the underlying security rises or declines sufficiently, the option may expire worthless to the Funds. In addition, in the event that the price of the security in connection with which an option was purchased moves in a direction favorable to the Funds, the benefits realized by the Funds as a result of such favorable movement will be reduced by the amount of the premium paid for the option and related transaction costs.
When a Fund writes an option, an amount equal to the premium received by the Fund is recorded as a liability and is subsequently adjusted to the current fair value of the option written. Premiums received from writing options that expire unexercised are treated by the Funds on the expiration date as realized gains from investments. The difference between the premium and the amount paid on effecting a closing purchase transaction, including brokerage commissions, is also treated as a realized gain, or, if the premium is less than the amount paid for the closing purchase transaction, as a realized loss. If a call option is exercised, the premium is added to the proceeds from the sale of the underlying security or currency in determining whether the Funds have realized gains or losses. If a put option is exercised, the premium reduces the cost basis of the securities purchased by the Funds.
| RATIONAL FUNDS | |
| CONSOLIDATED NOTES TO FINANCIAL STATEMENTS (Continued) | |
| December 31, 2023 | ANNUAL REPORT |
Written and purchased options are non-income producing securities. With options, there is minimal counterparty risk to the Funds since these options are exchange traded and the exchange’s clearinghouse acts as counterparty to all exchange traded options and guarantees against a possible default. Initial margin deposits required upon entering into options contracts are satisfied by the deposits of cash as collateral for the account of the broker (the Fund’s agent in acquiring the options).
Convertible Securities – Pier 88 invests in convertible securities, which include fixed income securities that may be exchanged or converted into a predetermined number of shares of the issuer’s underlying common stock at the option of the holder during a specified period. Convertible securities may take the form of convertible preferred stock, convertible bonds or debentures, units consisting of “usable” bonds and warrants or a combination of the features of several of these securities. The investment characteristics of each convertible security vary widely, which allows convertible securities to be employed for a variety of investment strategies. The Fund will exchange or convert the convertible securities held in its portfolio into shares of the underlying common stock when, in the Advisor’s or Sub-Advisor’s opinion, the investment characteristics of the underlying common shares will assist the Fund in achieving its investment objective. Otherwise, the Fund may hold or trade convertible securities.
The derivatives are not accounted for as hedging instruments under GAAP. The effect of derivative instruments on the Statements of Assets and Liabilities and Consolidated Statements of Assets and Liabilities at December 31, 2023, were as follows:
| | | | | | | Location of derivatives on Statements of | | Fair value of asset/liability | |
| Fund | | Derivative | | Risk Type | | Assets and Liabilities | | derivatives | |
| Equity Armor | | | | | | | | |
| | | Futures | | Equity | | Futures unrealized appreciation | | $ | 168,345 | |
| | | | | | | Futures unrealized depreciation | | | (210,467 | ) |
| | | | | | | Totals | | $ | (42,122 | ) |
| | | | | | | | | | | |
| | | Options | | Equity | | Total Securities at value | | $ | 162,001 | |
| | | | | Equity | | Options Written | | | (30,667 | ) |
| | | | | | | Totals | | $ | 131,334 | |
| Tactical Return | | | | | | | | |
| | | Options | | Equity | | Total Securities at value | | $ | 24,940 | |
| | | | | Equity | | Options Written | | | (39,900 | ) |
| | | | | | | Totals | | $ | (14,960 | ) |
| Strategic Allocation | | | | | | | | |
| | | Futures | | Equity | | Futures unrealized appreciation | | $ | 71,400 | |
| | | | | | | Totals | | $ | 71,400 | |
| ReSolve Adaptive | | | | | | | | |
| | | Futures | | Equity | | Futures unrealized appreciation | | $ | 329,225 | |
| | | | | | | Futures unrealized depreciation | | | (173,707 | ) |
| | | | | Commodity | | Futures unrealized appreciation | | | 478,448 | |
| | | | | | | Futures unrealized depreciation | | | (887,635 | ) |
| | | | | Currency | | Futures unrealized appreciation | | | 380,869 | |
| | | | | | | Futures unrealized depreciation | | | (409,465 | ) |
| | | | | Interest | | Futures unrealized appreciation | | | 278,760 | |
| | | | | | | Futures unrealized depreciation | | | (420,749 | ) |
| | | | | | | Totals | | $ | (424,254 | ) |
| RATIONAL FUNDS | |
| CONSOLIDATED NOTES TO FINANCIAL STATEMENTS (Continued) | |
| December 31, 2023 | ANNUAL REPORT |
The effect of derivative instruments on the Statements of Operations and Consolidated Statements of Operations for the Funds, for the year ended December 31, 2023, were as follows:
| | | | | | | | | Realized and unrealized gain | |
| Fund | | Derivative | | Risk Type | | Location of gain (loss) on derivatives | | (loss) on derivatives | |
| Equity Armor | | | | | | | | |
| | | Options Purchased | | Equity | | Net realized loss from options purchased | | $ | (8,306,475 | ) |
| | | Options Written | | Equity | | Net realized gain from options written | | | 3,191,573 | |
| | | Futures | | Equity | | Net realized gain from futures | | | 973,360 | |
| | | | | | | Totals | | $ | (4,141,542 | ) |
| | | | | | | | | | | |
| | | Options Purchased | | Equity | | Net change in unrealized depreciation on options purchased | | $ | (186,329 | ) |
| | | Options Written | | Equity | | Net change in unrealized depreciation on options written | | | (29,737 | ) |
| | | Futures | | Equity | | Net change in unrealized depreciation on futures | | | (3,872 | ) |
| | | | | | | Totals | | $ | (219,938 | ) |
| Tactical Return | | | | | | | | |
| | | Options Purchased | | Equity | | Net realized loss from options purchased | | $ | (8,192,683 | ) |
| | | Options Written | | Equity | | Net realized gain from options written | | | 12,975,490 | |
| | | Futures | | Equity | | Net realized gain from futures | | | 16 | |
| | | | | | | Totals | | $ | 4,782,823 | |
| | | | | | | | | | | |
| | | Options Purchased | | Equity | | Net change in unrealized depreciation on options purchased | | $ | (39,900 | ) |
| | | Options Written | | Equity | | Net change in unrealized appreciation on options written | | | 63,840 | |
| | | | | | | Totals | | $ | 23,940 | |
| Strategic Allocation | | | | | | | | |
| | | Futures | | Equity | | Net realized gain from futures | | $ | 936,417 | |
| | | | | | | Totals | | $ | 936,417 | |
| | | | | | | | | | | |
| | | Futures | | Equity | | Net change in unrealized appreciation on futures | | $ | 430,670 | |
| | | | | | | Totals | | $ | 430,670 | |
| ReSolve Adaptive | | | | | | | | |
| | | Futures | | Equity | | Net realized gain from futures | | $ | 13,020,299 | |
| | | | | Commodity | | Net realized loss from futures | | | (10,646,029 | ) |
| | | | | Currency | | Net realized gain from futures | | | 265,619 | |
| | | | | Interest | | Net realized loss from futures | | | (4,583,196 | ) |
| | | | | | | Totals | | $ | (1,943,307 | ) |
| | | | | | | | | | | |
| | | Futures | | Equity | | Net change in unrealized appreciation on futures | | $ | 1,514,941 | |
| | | | | Commodity | | Net change in unrealized depreciation on futures | | | (2,930,465 | ) |
| | | | | Currency | | Net change in unrealized appreciation on futures | | | 248,819 | |
| | | | | Interest | | Net change in unrealized appreciation on futures | | | 139,389 | |
| | | | | | | Totals | | $ | (1,027,316 | ) |
The value of derivative instruments outstanding as of December 31, 2023 as disclosed in the Schedules of Investments (Consolidated Schedule of Investments for ReSolve Adaptive) and the amounts of realized and changes in unrealized gains and losses on derivative instruments during the period as disclosed above and within the Statements of Operations (Consolidated Statement of Operations for ReSolve Adaptive) serve as indicators of the volume of derivative activity for the Funds.
| RATIONAL FUNDS | |
| CONSOLIDATED NOTES TO FINANCIAL STATEMENTS (Continued) | |
| December 31, 2023 | ANNUAL REPORT |
Balance Sheet Offsetting Information
The following table provides a summary of offsetting financial assets and liabilities derivatives and the effect of the derivative instruments on the Statements of Assets and Liabilities and Consolidated Statements of Assets and Liabilities as of December 31, 2023:
| | | | | | | | | | | | Gross Amounts of Assets Presented in the | | | | |
| | | | | | | | | | | | (Consolidated) Statement of Assets & Liabilities | | | | |
| | | | | | Gross Amounts | | | Net Amounts | | | | | | | | | | |
| | | Gross Amounts | | | Offset in the | | | Presented in the | | | | | | | | | | |
| | | Recognized in the | | | (Consolidated) | | | (Consolidated) | | | | | | | | | | |
| | | (Consolidated) | | | Statements of | | | Statements of | | | | | | | | | | |
| | | Statements of Assets | | | Assets and | | | Assets and | | | Financial | | | Cash Collateral | | | | |
| | | and Liabilities | | | Liabilities | | | Liabilities | | | Instruments | | | Pledged/Received (1) | | | Net Amount | |
| Equity Armor | | | | | | | | | | | | | | | | | | | | | | | | |
| Description of Asset: | | | | | | | | | | | | | | | | | | | | | | | | |
| Futures Contracts | | $ | 168,345 | | | $ | — | | | $ | 168,345 | | | $ | (168,345 | ) | | $ | — | | | $ | — | |
| Description of Liability: | | | | | | | | | | | | | | | | | | | | | | | | |
| Futures Contracts | | $ | 210,467 | | | $ | — | | | $ | 210,467 | | | $ | (168,345 | ) | | $ | (42,122 | ) | | $ | — | |
| Strategic Allocation | | | | | | | | | | | | | | | | | | | | | | | | |
| Description of Asset: | | | | | | | | | | | | | | | | | | | | | | | | |
| Futures Contracts | | $ | 71,400 | | | $ | — | | | $ | 71,400 | | | $ | — | | | $ | — | | | $ | 71,400 | |
| ReSolve Adaptive | | | | | | | | | | | | | | | | | | | | | | | | |
| Description of Asset: | | | | | | | | | | | | | | | | | | | | | | | | |
| Futures Contracts | | $ | 1,467,302 | | | $ | — | | | $ | 1,467,302 | | | $ | (1,467,302 | ) | | $ | — | | | $ | — | |
| Description of Liability: | | | | | | | | | | | | | | | | | | | | | | | | |
| Futures Contracts | | $ | 1,891,556 | | | $ | — | | | $ | 1,891,556 | | | $ | (1,467,302 | ) | | $ | (424,254 | ) | | $ | — | |
| (1) | The amount is limited to the derivative liability balance and accordingly does not include excess collateral pledged. |
D. Security Transactions and Related Income
During the period, investment transactions are accounted for no later than the first calculation of the NAV on the business day following the trade date. For financial reporting purposes, however, security transactions are accounted for on the trade date on the last business day of the reporting period. Discounts and premiums on securities purchased are accreted and amortized over the lives of the respective securities using the effective interest method. For convertible securities, premiums attributable to the conversion feature are not amortized. Securities gains and losses are calculated on the identified cost basis. Interest income and expenses are accrued daily. Dividends, less foreign tax withholding (if any), are recorded on the ex-dividend date. Withholding taxes and capital gains on foreign dividends have been provided for in accordance with the Funds’ understanding of the applicable country’s tax rules and rates.
E. Dividends and Distributions to Shareholders
The amount of dividends from net investment income and net realized gains recorded on the ex-dividend date are determined in accordance with the federal income tax regulations, which may differ from GAAP and are recorded on ex- date. These “book/tax” differences are either considered temporary or permanent in nature. To the extent these differences are permanent in nature (e.g. tax treatment of foreign currency gain/loss, non-deductible stock issuance costs, distributions and income received from pass through investments and net investment loss adjustments), such amounts are reclassified within the capital accounts based on their nature for federal income tax purposes; temporary differences do not require reclassification. Temporary differences are primarily due to market discounts, capital loss carryforwards and losses deferred due to wash sales, straddles and return of capital from investments. Dividends are declared separately for each class. No class has preferential rights; differences in per share dividend rates are generally due to differences in separate class expenses.
| RATIONAL FUNDS | |
| CONSOLIDATED NOTES TO FINANCIAL STATEMENTS (Continued) | |
| December 31, 2023 | ANNUAL REPORT |
| Fund | Income Dividends | Capital Gains |
| Equity Armor | Monthly | Annually |
| Tactical Return | Annually | Annually |
| Dynamic Brands | Annually | Annually |
| Strategic Allocation | Quarterly | Annually |
| ReSolve Adaptive | Annually | Annually |
| Pier 88 | Quarterly | Annually |
| Special Situations | Monthly | Annually |
| Real Assets | Quarterly | Annually |
Certain Funds may own shares of real estate investments trusts (“REITs”), which report information on the source of their distributions annually. Distributions received from investments in REITs in excess of income from underlying investments are recorded as realized gain and/or as a reduction to the cost of the individual REIT, when such information is available.
F. Allocation of Expenses, Income, and Gains and Losses
Expenses directly attributable to a Fund are charged to that Fund. Expenses not directly attributable to a Fund are allocated proportionally among various Funds or all Funds within the Trust in relation to the net assets of each Fund or on another reasonable basis. Income, non-class specific expenses and realized/unrealized gains or losses are allocated to each class based on relative net assets. Distribution fees are charged to each respective share class in accordance with the distribution plan.
G. Federal Income Taxes
It is the policy of each Fund to qualify or continue to qualify as a regulated investment company by complying with the provisions available to certain investment companies, as defined in applicable sections of the Internal Revenue Code, and to make distributions of net investment income and net realized capital gains sufficient to relieve it from all, or substantially all, federal income taxes.
The Funds recognize the tax benefits of uncertain tax positions only where the position is “more likely than not” to be sustained assuming examination by tax authorities. Management has analyzed each Fund’s tax positions and has concluded that no liability for unrecognized tax benefits should be recorded related to uncertain tax positions taken on returns filed for open tax years ended December 31, 2020 to December 31, 2022 (as applicable), or expected to be taken in the Funds’ December 31, 2023 year-end tax returns. Each Fund identifies its major tax jurisdictions as U.S. Federal, and foreign jurisdictions where the Funds make significant investments; however the Funds are not aware of any tax positions for which it is reasonably possible that the total amounts of unrecognized tax benefits will change materially in the next twelve months. The Funds recognize interest and penalties, if any, related to unrecognized tax benefits, as income tax expenses in the Statements of Operations. As of December 31, 2023, the Funds did not incur any interest or penalties.
H. Indemnification
The Trust indemnifies its Officers and Trustees for certain liabilities that may arise from the performance of their duties to the Trust. Additionally, in the normal course of business, the Funds enter into contracts that contain a variety of representations and warranties and which provide general indemnities. The Funds’ maximum exposure under these arrangements is unknown, as this would involve future claims that may be made against the Funds that have not yet occurred. However, based on experience, the risk of loss due to these warranties and indemnities appears to be remote.
(3) FEES AND OTHER TRANSACTIONS WITH AFFILIATES AND OTHER SERVICE PROVIDERS
Investment Advisory Fee — Rational Advisors, Inc. (the “Advisor”) serves as the Funds’ investment adviser. Under the terms of the Advisory Agreement, the Advisor manages the investment operations of the Funds in accordance with each Fund’s respective investment policies and restrictions. The Funds’ sub-advisors are responsible for the day-to-day management of each Fund’s portfolios. The Advisor provides the Funds with investment advice and supervision and furnishes an investment program for the Funds. For its investment management services, the Funds pay to the Advisor, as of the last day of each
| RATIONAL FUNDS | |
| CONSOLIDATED NOTES TO FINANCIAL STATEMENTS (Continued) | |
| December 31, 2023 | ANNUAL REPORT |
month, an annualized fee as shown in the below table, such fees to be computed daily based upon daily average net assets of the Funds. The Funds’ sub-advisors are paid by the Advisor, not the Funds.
| Fund | | Advisory Fee Tiered Annual Rate |
| | | Rate for the First $500 Million | | Rate for the Next $500 Million | | Rate for Excess Over $1 Billion |
| Equity Armor | | 0.75% | | 0.70% | | 0.65% |
| Dynamic Brands | | 0.75% | | 0.70% | | 0.65% |
| | | | | | | |
| | | Advisory Fee Annual Rate | | | | |
| Tactical Return | | 1.75% | | | | |
| Strategic Allocation | | 0.10% | | | | |
| ReSolve Adaptive | | 1.75% | | | | |
| Pier 88 | | 0.85% | | | | |
| Special Situations | | 1.50% | | | | |
| Real Assets | | 1.25% | | | | |
The Advisor has contractually agreed to waive all or a portion of its investment advisory fee (based on average daily net assets) and/or reimburse certain operating expenses of each Fund (other than Equity Armor) to the extent necessary in order to limit each Fund’s total annual fund operating expenses (exclusive of acquired fund fees and expenses, brokerage commissions and trading costs, interest (including borrowing costs and overdraft charges), taxes, short sale dividends and interest expenses, non-routine or extraordinary expenses (such as litigation or reorganizational costs), and with respect to Special Situations only, costs and expenses of litigation or claims on behalf of Special Situations regarding portfolio investments initiated (or threatened) by the investment advisor or sub-advisor, as listed below:
| | | Expense Caps | | Expiration |
| Fund | | Institutional Class Shares | | Class A Shares | | Class C Shares | | |
| Tactical Return | | 1.99% | | 2.24% | | 2.99% | | April 30, 2024 |
| Dynamic Brands | | 1.24% | | 1.49% | | 2.24% | | April 30, 2024 |
| Strategic Allocation | | 0.45% | | 0.70% | | 1.45% | | April 30, 2024 |
| ReSolve Adaptive | | 1.97% | | 2.22% | | 2.97% | | April 30, 2024 |
| Pier 88 | | 0.99% | | 1.24% | | 1.99% | | April 30, 2024 |
| Special Situations | | 1.75% | | 2.00% | | 2.75% | | April 30, 2024 |
| Real Assets | | 1.49% | | 1.74% | | 2.49% | | April 30, 2024 |
| RATIONAL FUNDS | |
| CONSOLIDATED NOTES TO FINANCIAL STATEMENTS (Continued) | |
| December 31, 2023 | ANNUAL REPORT |
Amounts waived or reimbursed in the contractual period may be recouped by the Advisor within three years of the waiver and/or reimbursement. As of December 31, 2023, the following amounts have been waived or reimbursed by the Advisor and are subject to repayment by the respective Fund:
| | | Amount Waived or | | | Expiring Beginning | |
| Fund | | Reimbursed | | | December 31, 2023 | |
| Equity Armor | | $ | 38,723 | | | | 2024 | |
| | | | — | | | | 2025 | |
| | | | — | | | | 2026 | |
| Tactical Return | | | 104,062 | | | | 2024 | |
| | | | 91,334 | | | | 2025 | |
| | | | 133,607 | | | | 2026 | |
| Dynamic Brands | | | — | | | | 2024 | |
| | | | — | | | | 2025 | |
| | | | 9,477 | | | | 2026 | |
| Strategic Allocation | | | 67,124 | | | | 2024 | |
| | | | 86,462 | | | | 2025 | |
| | | | 97,614 | | | | 2026 | |
| ReSolve Adaptive | | | 125,327 | | | | 2024 | |
| | | | 117,342 | | | | 2025 | |
| | | | 213,553 | | | | 2026 | |
| Pier 88 | | | 174,835 | | | | 2024 | |
| | | | 193,523 | | | | 2025 | |
| | | | 228,670 | | | | 2026 | |
| Special Situations | | | 119,447 | | | | 2024 | |
| | | | 152,205 | | | | 2025 | |
| | | | 348,053 | | | | 2026 | |
| Real Assets | | | 52,120 | | | | 2024 | |
| | | | 107,456 | | | | 2025 | |
| | | | 116,736 | | | | 2026 | |
During the year ended December 31, 2023, the sub-advisor reimbursed Pier 88 in the amount of $1,521,304 in connection with a trading matter.
The Independent Trustees are paid quarterly retainers for their service on the Board of Trustees and on the Risk and Compliance/Investment Committee and receive compensation for each special meeting attended. The fees paid to the Independent Trustees for their attendance at a meeting will be shared equally by the Funds of the Trust in which the meeting relates. The Chairman of the Board of Trustees of the Trust, and the Chairman of the Trust’s Audit Committee and Risk and Compliance/Investment Committee receive an additional quarterly retainer. Officers receive no compensation from the Trust. The Trust reimburses each of the Independent Trustees for travel and other expenses incurred in connection with attendance at such meetings. The Trust has no retirement or pension plans. Additional information regarding the Trust’s Trustees is available in the Funds’ Statement of Additional Information.
| RATIONAL FUNDS | |
| CONSOLIDATED NOTES TO FINANCIAL STATEMENTS (Continued) | |
| December 31, 2023 | ANNUAL REPORT |
The Board has adopted the Trust’s Distribution Plan (the “12b-1 Plan”) which allows each Fund to pay fees up to 0.25% for Class A shares and up to 1.00% for Class C shares based on average daily net assets of each class to financial intermediaries (which may be paid through the Funds’ distributor) for the sale and distribution of these shares. Pursuant to the 12b-1 Plan, the Funds may finance from their assets certain activities or expenses that are intended primarily to result in the sale of Fund shares and to reimburse Northern Lights Distributors, LLC., the Funds’ distributor (the “Distributor” or “NLD”), and the Advisor for distribution related expenses. For the year ended December 31, 2023, the amounts accrued by the Funds were as follows:
| | | 12b-1 Fees | |
| Fund | | Class A | | | Class C | |
| Equity Armor | | $ | 22,201 | | | $ | 14,288 | |
| Tactical Return | | | 19,305 | | | | 69,691 | |
| Dynamic Brands | | | 33,122 | | | | 32,231 | |
| Strategic Allocation | | | 17,621 | | | | 7 | |
| ReSolve Adaptive | | | 6,135 | | | | 25,484 | |
| Pier 88 | | | 4,177 | | | | 2,931 | |
| Special Situations | | | 165,367 | | | | 345,681 | |
| Real Assets | | | 1,372 | | | | 212 | |
Shareholder Servicing Fees - The Trust has adopted a Shareholder Services Plan pursuant to which the Funds may pay Shareholder Services Fees up to 0.25% of the average daily net assets to financial intermediaries for providing shareholder assistance, maintaining shareholder accounts and communicating or facilitating purchases and redemptions of shares for Institutional, Class A, and Class C shares.
In addition, certain affiliates of the Distributor provide services to the Funds as follows:
Ultimus Fund Solutions, LLC (“UFS”) – UFS, an affiliate of the Distributor, provides administrative, fund accounting, and transfer agency services to the Funds pursuant to agreements with the Trust, for which it receives from each Fund the greater of an annual minimum fee or an asset based fee, which scales downward based upon net assets for fund administration, fund accounting and transfer agency services and are reflected as such on the Statements of Operations under Financial Administrative fees/Fund Accounting fees. The Funds also pay UFS for any out-of-pocket expenses. Officers of the Trust are also employees of UFS and are not paid any fees directly by the Trust for serving in such capacity.
Blu Giant, LLC (“Blu Giant”) – Blu Giant, an affiliate of UFS and the Distributor, provides EDGAR conversion and filing services as well as print management services for the Funds on an ad-hoc basis. For the provision of these services, Blu Giant receives customary fees from the Funds, which are included in printing expenses on the Statements of Operations.
Pursuant to the Management Services Agreement between the Trust and MFund, MFund, an affiliate of the Advisor, MFund provides the Funds with various management and legal administrative services (the “Management Services Agreement”). For these services, the Funds pay MFund an annual asset-based fee in accordance with the following schedule applied at the Fund family level (i.e., all the Funds in the Trust advised by the Advisor): 0.10% of net assets up to $50 million; 0.07% of net assets from $50 million to $100 million; 0.05% of net assets from $100 million to $250 million; 0.04% of net assets from $250 million to $500 million; 0.03% of net assets from $500 million to $1 billion; 0.02% of net assets from $1 billion to $5 billion; and 0.01% of net assets from $5 billion and above. In addition, the Funds reimburse MFund for any reasonable out- of- pocket expenses incurred in the performance of its duties under the Management Services Agreement. The amounts due to MFund for the Management Services Agreement are listed in the Statements of Assets and Liabilities under “Payable to related parties” and the amounts accrued for the year are shown in the Statements of Operations under “Legal administration/Management service fees.”
Pursuant to the Compliance Services Agreement (the “Compliance Services Agreement”), MFund an affiliate of the Manager, provides chief compliance officer services to the Funds. For these services, the Funds pay MFund $1,200 per month for the first fund in the fund family and $400 each additional fund; $400 for each adviser and sub-adviser; and
| RATIONAL FUNDS | |
| CONSOLIDATED NOTES TO FINANCIAL STATEMENTS (Continued) | |
| December 31, 2023 | ANNUAL REPORT |
.0025% of the assets of each Fund. In addition, the Funds reimburse MFund for any reasonable out-of-pocket expenses incurred in the performance of its duties under the Compliance Services Agreement. The amounts due to MFund for chief compliance officer services are listed in the Statements of Assets and Liabilities under “Payable to related parties” and the amounts accrued for the year are shown in the Statements of Operations under “Compliance officer fees.”
Affiliated Funds — Affiliated companies are mutual funds that are advised by Catalyst Capital Advisors, AlphaCentric Advisors, LLC or Rational Advisors, Inc. Companies that are affiliates of the Funds at December 31, 2023, are noted in Strategic Allocation’s Schedule of Investments. A summary of these investments in affiliated funds is set forth below:
| | | Shares Balance | | | | | | | | | Shares Balance | | | | | | Change in | | | Dividends | | | Amount of Gain | |
| | | December 31, | | | | | | | | | December 31, | | | | | | Unrealized | | | Credited to | | | (Loss) Realized on | |
| Fund | | 2022 | | | Purchases | | | Sales | | | 2023 | | | Fair Value | | | Gain/(Loss) | | | Income | | | Sale of Shares | |
| AlphaCentric Income Opportunities Fund, Inst. Sh. | | | 36,557 | | | | 1,046 | | | | 37,603 | | | | — | | | $ | — | | | $ | (29,003 | ) | | $ | 4,085 | | | $ | 13,063 | |
| Catalyst Enhanced Income Strategy Fund, Inst. Sh. | | | 137,375 | | | | 4,090 | | | | 141,465 | | | | — | | | | — | | | | 144,277 | | | | 38,625 | | | | (187,976 | ) |
| Catalyst Insider Income Fund Inst. Sh. | | | 95,940 | | | | 135,750 | | | | 231,690 | | | | — | | | | — | | | | 60,252 | | | | 57,051 | | | | (37,639 | ) |
| Catalyst Systematic Alpha Fund | | | — | | | | 516,466 | | | | 4,068 | | | | 512,398 | | | | 6,314,234 | | | | 17,789 | | | | 43,041 | | | | (977 | ) |
| Catalyst/CIFC Floating Rate Income Fund | | | 93,531 | | | | 137,825 | | | | 73,537 | | | | 157,819 | | | | 1,459,825 | | | | 91,559 | | | | 125,815 | | | | (33,209 | ) |
| Rational Special Situations Income Fund, Inst. Sh. | | | 72,453 | | | | 1,719 | | | | 74,172 | | | | — | | | | — | | | | 90,683 | | | | 31,660 | | | | (85,308 | ) |
| Rational/Pier 88 Convertible Securities Fund, Inst. Sh. | | | 121,625 | | | | 76,551 | | | | 114,861 | | | | 83,315 | | | | 877,302 | | | | 4,568 | | | | 29,400 | | | | 18,183 | |
| Total | | | 557,481 | | | | 873,447 | | | | 677,396 | | | | 753,532 | | | $ | 8,651,361 | | | $ | 380,125 | | | $ | 329,677 | | | $ | (313,863 | ) |
(4) INVESTMENT TRANSACTIONS
For the year ended December 31, 2023, aggregate purchases and proceeds from sales of investment securities (excluding short-term investments) for the Funds were as follows:
| Fund | | Purchases | | | Sales | |
| Equity Armor | | $ | 262,496,528 | | | $ | 287,156,953 | |
| Tactical Return | | | — | | | | — | |
| Dynamic Brands | | | 98,632,849 | | | | 99,120,702 | |
| Strategic Allocation | | | 9,606,177 | | | | 6,969,797 | |
| ReSolve Adaptive | | | — | | | | — | |
| Pier 88 | | | 228,797,836 | | | | 196,291,259 | |
| Special Situations | | | 196,703,280 | | | | 161,925,118 | |
| Real Assets | | | 2,062,613 | | | | 2,623,035 | |
(5) INVESTMENT RISK
Market Risk - Overall market risks may also affect the value of a Fund. The market values of securities or other investments owned by a Fund will go up or down, sometimes rapidly or unpredictably. Factors such as economic growth and market conditions, interest rate levels, exchange rates and political events affect the securities markets. Changes in market conditions and interest rates generally do not have the same impact on all types of securities and instruments. Unexpected local, regional or global events and their aftermath, such as war; acts of terrorism; financial, political or social disruptions; natural, environmental or man-made disasters; the spread of infectious illnesses or other public health issues; recessions and depressions; or other tragedies, catastrophes and events could have a significant impact on a Fund and its investments and could result in increased premiums or discounts to the Fund’s net asset value, and may impair market liquidity, thereby increasing liquidity risk. Such events can cause investor fear and panic, which can adversely affect the economies of many companies, sectors, nations, regions and the market in general, in ways that cannot necessarily be foreseen. A Fund could lose money over short periods due to short-term market movements and over longer periods during more prolonged market downturns. During a general market downturn, multiple asset classes may be negatively affected. In times of severe market disruptions, you could lose your entire investment.
| RATIONAL FUNDS | |
| CONSOLIDATED NOTES TO FINANCIAL STATEMENTS (Continued) | |
| December 31, 2023 | ANNUAL REPORT |
In accordance with its investment objectives and through its exposure to futures contracts, each of Equity Armor, Strategic Allocation, ReSolve Adaptive, and Real Assets may have increased or decreased exposure to one or more of the following risk factors defined below:
Commodity Risk - Commodity risk relates to the change in value of commodities or commodity indexes as they relate to increases or decreases in the commodities market. Commodities are physical assets that have tangible properties. Examples of these types of assets are crude oil, heating oil, metals, livestock, and agricultural products.
Foreign Exchange Rate Risk - Foreign exchange rate risk relates to the change in the U.S. dollar value of a security held that is denominated in a foreign currency. The U.S. dollar value of a foreign currency denominated security will decrease as the dollar appreciates against the currency, while the U.S. dollar value will increase as the dollar depreciates against the currency.
Interest Rate Risk - Interest rate risk refers to the fluctuations in value of fixed-income securities resulting from the inverse relationship between price and yield. For example, an increase in general interest rates will tend to reduce the market value of already issued fixed-income investments, and a decline in general interest rates will tend to increase their value. In addition, debt securities with longer maturities, which tend to have higher yields, are subject to potentially greater fluctuations in value from changes in interest rates than obligations with shorter maturities.
Volatility Risk - Volatility risk refers to the magnitude of the movement, but not the direction of the movement, in a financial instrument’s price over a defined time period. Large increases or decreases in a financial instrument’s price over a relative time period typically indicate greater volatility risk, while small increases or decreases in its price typically indicate lower volatility risk.
In accordance with its investment objectives and through its exposure to options, Tactical Return and Equity Armor may have increased or decreased exposure to Option Risk factors defined below:
Options Risk - Tactical Return and Equity Armor are subject to equity price risks in the normal course of pursuing their investment objective and may purchase or sell options. The seller (writer) of a call option which is covered (e.g., the writer holds the underlying security) assumes the risk of a decline in the market price of an underlying security below the purchase price of an underlying security less the premium received and gives up the opportunity for gain on the underlying security above the exercise price of the option. The seller of an uncovered call option assumes the risk of a theoretical unlimited increase in the market price of an underlying security above the exercise price of the option. The securities necessary to satisfy the exercise of the call option may be unavailable for purchase except at much higher prices. Purchasing securities to satisfy the exercise of the call option can itself cause the price of securities to rise further, sometimes by a significant amount, thereby exacerbating the loss. The buyer of a call option assumes the risk of losing its entire premium invested in the call option. The seller (writer) of a put option which is covered (e.g., the writer has a short position in the underlying security) assumes the risk of an increase in the market price of the underlying security above the sales price (in establishing the short position) of the underlying security plus the premium received and gives up the opportunity for gain on the underlying security below the exercise price of the option. The seller of an uncovered put option assumes the risk of a decline in the market price of the underlying security below the exercise price of the option. The buyer of a put option assumes the risk of losing his entire premium invested in the put option.
Activist Strategies Risk - As part of Special Situation’s principal investment strategy, the Sub-Advisor seeks to identify “special situations” where it can seek to remedy legal, technical or structural issues it has identified in the securities held by the Fund through activist strategies, including through litigation or the threat of litigation. Such activist strategies may not be successful and may have a negative impact on the Fund, including causing the Fund to incur legal related costs and expenses and portfolio turnover if the Sub-Advisor determines to sell such securities.
Please refer to the Funds’ prospectus for a full listing of risks associated with these investments.
| RATIONAL FUNDS | |
| CONSOLIDATED NOTES TO FINANCIAL STATEMENTS (Continued) | |
| December 31, 2023 | ANNUAL REPORT |
(6) AGGREGATE UNREALIZED APPRECIATION AND DEPRECIATION – TAX BASIS
The identified cost of investments in securities owned by each Fund for federal income tax purposes (including options written), and its respective gross unrealized appreciation and depreciation at December 31, 2023, were as follows:
| | | | | | Gross | | | Gross | | | Net Unrealized | |
| | | Tax | | | Unrealized | | | Unrealized | | | Appreciation/ | |
| | | Cost | | | Appreciation | | | Depreciation | | | (Depreciation) | |
| Equity Armor | | $ | 34,084,112 | | | $ | 4,905,565 | | | $ | (880,450 | ) | | $ | 4,025,115 | |
| Tactical Return | | | 122,044,731 | | | | 20,861 | | | | — | | | | 20,861 | |
| Dynamic Brands | | | 46,722,213 | | | | 16,618,065 | | | | (143,187 | ) | | | 16,474,878 | |
| Strategic Allocation | | | 9,094,625 | | | | 134,186 | | | | (5,571 | ) | | | 128,615 | |
| ReSolve Adaptive | | | 82,166,637 | | | | 617,030 | | | | (869,760 | ) | | | (252,730 | ) |
| Pier 88 | | | 135,339,193 | | | | 5,384,846 | | | | (3,781,243 | ) | | | 1,603,603 | |
| Special Situations | | | 827,125,818 | | | | 22,776,386 | | | | (78,229,816 | ) | | | (55,453,430 | ) |
| Real Assets | | | 2,988,657 | | | | 308,374 | | | | (79,199 | ) | | | 229,175 | |
(7) DISTRIBUTIONS TO SHAREHOLDERS AND TAX COMPONENTS OF CAPITAL
The tax character of fund distributions paid for the year ended December 31, 2023 and December 31, 2022 was as follows:
| For fiscal year ended | | Ordinary | | | Long-Term | | | Return of | | | | |
| December 31, 2023 | | Income | | | Capital Gains | | | Capital | | | Total | |
| Equity Armor | | $ | 40,314 | | | $ | — | | | $ | 55,185 | | | $ | 95,499 | |
| Tactical Return | | | 3,787,078 | | | | 3,368,616 | | | | — | | | | 7,155,694 | |
| Dynamic Brands | | | — | | | | — | | | | — | | | | — | |
| Strategic Allocation | | | 444,256 | | | | — | | | | — | | | | 444,256 | |
| ReSolve Adaptive | | | 9,700,852 | | | | 132,966 | | | | — | | | | 9,833,818 | |
| Pier 88 | | | 2,764,879 | | | | — | | | | — | | | | 2,764,879 | |
| Special Situations | | | 58,765,058 | | | | — | | | | 2,312,560 | | | | 61,077,618 | |
| Real Assets | | | 33,888 | | | | — | | | | — | | | | 33,888 | |
| | | | | | | | | | | | | | | | | |
| For fiscal year ended | | Ordinary | | | Long-Term | | | Return of | | | | |
| December 31, 2022 | | Income | | | Capital Gains | | | Capital | | | Total | |
| Equity Armor | | $ | 484,752 | | | $ | — | | | $ | — | | | $ | 484,752 | |
| Tactical Return | | | 59,296 | | | | 576,582 | | | | — | | | | 635,878 | |
| Dynamic Brands | | | 2,896,870 | | | | — | | | | — | | | | 2,896,870 | |
| Strategic Allocation | | | 306,907 | | | | 235,138 | | | | — | | | | 542,045 | |
| ReSolve Adaptive | | | 672,205 | | | | — | | | | — | | | | 672,205 | |
| Pier 88 | | | 2,457,919 | | | | — | | | | — | | | | 2,457,919 | |
| Special Situations | | | 47,060,516 | | | | — | | | | — | | | | 47,060,516 | |
| Real Assets | | | 11,627 | | | | 2,082 | | | | — | | | | 13,709 | |
| RATIONAL FUNDS | |
| CONSOLIDATED NOTES TO FINANCIAL STATEMENTS (Continued) | |
| December 31, 2023 | ANNUAL REPORT |
As of December 31, 2023, the components of accumulated earnings/(deficit) on a tax basis were as follows:
| | | Undistributed | | | Undistributed | | | Post October Loss | | | Capital Loss | | | Other | | | Unrealized | | | Total | |
| | | Ordinary | | | Long-Term | | | and | | | Carry | | | Book/Tax | | | Appreciation/ | | | Distributable Earnings/ | |
| | | Income | | | Capital Gains | | | Late Year Loss | | | Forwards | | | Differences | | | (Depreciation) | | | (Accumulated Deficits) | |
| Equity Armor | | $ | — | | | $ | — | | | $ | (738,472 | ) | | $ | (5,262,744 | ) | | $ | — | | | $ | 4,025,115 | | | $ | (1,976,101 | ) |
| Tactical Return | | | 423,716 | | | | 106,569 | | | | — | | | | (1,907,120 | ) | | | — | | | | 20,861 | | | | (1,355,974 | ) |
| Dynamic Brands | | | — | | | | — | | | | — | | | | (17,574,987 | ) | | | — | | | | 16,474,878 | | | | (1,100,109 | ) |
| Strategic Allocation | | | — | | | | — | | | | — | | | | (1,657,860 | ) | | | — | | | | 128,616 | | | | (1,529,244 | ) |
| ReSolve Adaptive | | | — | | | | — | | | | (3,980,365 | ) | | | — | | | | — | | | | (120,892 | ) | | | (4,101,257 | ) |
| Pier 88 | | | 446,283 | | | | — | | | | (1,240,742 | ) | | | (7,608,714 | ) | | | — | | | | 1,603,603 | | | | (6,799,570 | ) |
| Special Situations | | | — | | | | — | | | | (4,246,928 | ) | | | (19,935,123 | ) | | | — | | | | (55,453,422 | ) | | | (79,635,473 | ) |
| Real Assets | | | 138 | | | | — | | | | — | | | | (256,067 | ) | | | — | | | | 229,175 | | | | (26,754 | ) |
The difference between book basis and tax basis unrealized appreciation (depreciation), undistributed ordinary income (loss) and accumulated net realized gain (loss) from investments is primarily attributable to the tax deferral of losses on wash sales, mark-to-market on open Section 1256 futures and options contracts, and adjustments for C-Corporation return of capital distributions, partnerships, perpetual bonds, trust preferred securities, income on contingent convertible debt securities, and Section 305(c) deemed dividend distributions. The unrealized appreciation (depreciation) in the table above includes unrealized foreign currency gains of $131,838 and $8 for Resolve Adaptive and Special Situations, respectively.
Late year losses incurred after December 31 within the fiscal year are deemed to arise on the first business day of the following fiscal year for tax purposes. The Funds incurred and elected to defer such late year losses as follows:
| | | Late Year | |
| | | Losses | |
| Equity Armor | | $ | — | |
| Tactical Return | | | — | |
| Dynamic Brands | | | — | |
| Strategic Allocation | | | — | |
| ReSolve Adaptive | | | 1,041,489 | |
| Pier 88 | | | — | |
| Special Situations | | | — | |
| Real Assets | | | — | |
Capital losses incurred after October 31 within the fiscal year are deemed to arise on the first business day of the following fiscal year for tax purposes. The Funds incurred and elected to defer such capital losses as follows:
| | | Post October | |
| | | Losses | |
| Equity Armor | | $ | 738,472 | |
| Tactical Return | | | — | |
| Dynamic Brands | | | — | |
| Strategic Allocation | | | — | |
| ReSolve Adaptive | | | 2,938,876 | |
| Pier 88 | | | 1,240,742 | |
| Special Situations | | | 4,246,928 | |
| Real Assets | | | — | |
| RATIONAL FUNDS | |
| CONSOLIDATED NOTES TO FINANCIAL STATEMENTS (Continued) | |
| December 31, 2023 | ANNUAL REPORT |
At December 31, 2023, the Funds had capital loss carry forwards for federal income tax purposes available to offset future capital gains, along with capital loss carry forwards utilized in the current year as follows:
| | | | | | | | | | | | Capital Loss Carry | |
| | | Short-Term | | | Long-Term | | | Total | | | Forwards Utilized | |
| Equity Armor | | $ | 4,363,673 | | | $ | 899,071 | | | $ | 5,262,744 | | | $ | — | |
| Tactical Return* | | | 196,514 | | | | 1,710,606 | | | | 1,907,120 | | | | 92,691 | |
| Dynamic Brands | | | 15,426,902 | | | | 2,148,085 | | | | 17,574,987 | | | | — | |
| Strategic Allocation | | | 485,005 | | | | 1,172,855 | | | | 1,657,860 | | | | 611,268 | |
| ReSolve Adaptive | | | — | | | | — | | | | — | | | | 426,884 | |
| Pier 88 | | | 5,145,208 | | | | 2,463,506 | | | | 7,608,714 | | | | — | |
| Special Situations | | | 12,562,483 | | | | 7,372,640 | | | | 19,935,123 | | | | — | |
| Real Assets | | | 96,960 | | | | 159,107 | | | | 256,067 | | | | — | |
| * | Tactical Return experienced a shareholder change in ownership resulting in an annual limitation on the amount of pre- change capital loss carry forwards available to be recognized in each year. Due to IRC Section 382 limitations, utilization of these carry forwards is limited to a maximum of $92,691 per year. |
Permanent book and tax differences, primarily attributable to net operating losses, nondeductible expenses, distributions in excess, and adjustments for ReSolve Adaptive’s wholly owned subsidiary, which has a November 30 tax year end, resulted in reclassifications for the Funds for the fiscal year ended December 31, 2023 as follows:
| | | Paid In | | | Accumulated | |
| | | Capital | | | Earnings (Deficit) | |
| Equity Armor | | $ | (41,112 | ) | | $ | 41,112 | |
| Tactical Return | | | — | | | | — | |
| Dynamic Brands | | | (217,488 | ) | | | 217,488 | |
| Strategic Allocation | | | (2,869 | ) | | | 2,869 | |
| ReSolve Adaptive | | | (14,386,771 | ) | | | 14,386,771 | |
| Pier 88 | | | — | | | | — | |
| Special Situations | | | (32,884 | ) | | | 32,884 | |
| Real Assets | | | (260 | ) | | | 260 | |
(8) LINE OF CREDIT
Effective December 8, 2022, the Trust has a $100,000,000 uncommitted line of credit provided by U.S. Bank National Association (the “Bank”) under an agreement (the “Uncommitted Line”) with a maturity date of December 5, 2024. Any advance under the Uncommitted Line is contemplated primarily for temporary or emergency purposes, including the meeting of redemption requests that otherwise might require the untimely disposition of securities. The interest rate on any borrowings is the current Prime Rate payable monthly. The Uncommitted Line is not a “committed” line of credit, which is to say that the Bank is not obligated to lend money to the Funds. Accordingly, it is possible that the Funds may wish to borrow money for a temporary or emergency purpose but may not be able to do so.
| RATIONAL FUNDS | |
| CONSOLIDATED NOTES TO FINANCIAL STATEMENTS (Continued) | |
| December 31, 2023 | ANNUAL REPORT |
During the year ended December 31, 2023, the average amount of borrowings outstanding based on days borrowed was as follows:
| | | Average | | | Maximum | | | | | | Average | | | Current | |
| | | borrowings | | | Outstanding | | | Interest | | | borrowings | | | Interest | |
| Fund | | outstanding | | | balance | | | Expense* | | | rate | | | Rate | |
| Equity Armor | | $ | 1,321,984 | | | $ | 4,342,000 | | | $ | 37,343 | | | | 8.34 | % | | | 8.50 | % |
| Dynamic Brands | | | 220,074 | | | | 1,963,000 | | | | 1,269 | | | | 7.69 | % | | | 8.50 | % |
| Strategic Allocation | | | 213,000 | | | | 213,000 | | | | 50 | | | | 8.50 | % | | | 8.50 | % |
| Real Assets | | | 26,600 | | | | 122,000 | | | | 274 | | | | 8.26 | % | | | 8.50 | % |
| * | Includes interest expenses for borrowings on the line of credit and may not agree to the Statement of Operations, which may include overdraft fees, line of credit fees and broker interest. |
(9) BENEFICIAL OWNERSHIP
The beneficial ownership, either directly or indirectly, of more than 25% of the voting securities of a fund creates a presumption of control of the fund, under Section 2(a)(9) of the 1940 Act. As of December 31, 2023, the companies that held more than 25% of the voting securities of the Funds, and may be deemed to control each respective Fund, are as follows:
| | | Equity | | | Tactical | | | Dynamic | | | Strategic | | | ReSolve | | | Pier | | | Special | | | Real | |
| | | Armor | | | Return | | | Brands | | | Allocation | | | Adaptive | | | 88 | | | Situations | | | Assets | |
| Jerry and Isobel Szilagyi | | | — | | | | — | | | | — | | | | — | | | | — | | | | — | | | | — | | | | 40.53 | % |
| NFS LLC(1) | | | 43.03 | % | | | 28.46 | % | | | 26.01 | % | | | 85.47 | % | | | 25.47 | % | | | 51.62 | % | | | — | | | | — | |
| Charles Schwab (1) | | | 32.55 | % | | | 31.47 | % | | | — | | | | — | | | | 43.01 | % | | | — | | | | 37.94 | % | | | — | |
| LPL Financial (1) | | | — | | | | 25.86 | % | | | — | | | | — | | | | — | | | | — | | | | — | | | | — | |
| (1) | This owner is comprised of multiple investors and accounts. |
(10) UNDERLYING INVESTMENTS IN OTHER INVESTMENT COMPANIES
Each underlying fund, including each ETF, is subject to specific risks, depending on the nature of the underlying fund. These risks could include liquidity risk, sector risk, foreign and related currency risk, as well as risks associated with real estate investments and commodities. Investors in the Funds will indirectly bear fees and expenses charged by the underlying investment companies in which the Funds invest in addition to the Funds’ direct fees and expenses.
The performance of Tactical Return will be directly affected by the performance of the First American Treasury Obligations Fund and the performance of Strategic Allocation will be directly affected by the performance of the Catalyst Systematic Alpha Fund. The financial statements of the First American Treasury Obligations Fund and the Catalyst Systematic Alpha Fund, including the Schedule of Investments, can be found at the SEC’s website www.sec.gov and should be read in conjunction with the Fund’s financial statements. As of December 31, 2023, the percentage of Tactical Return’s net assets invested in the First American Treasury Obligations Fund was 40.0%. The percentage of Strategic Allocation’s net assets invested in the Catalyst Systematic Alpha Fund was 63.2%.
| RATIONAL FUNDS | |
| CONSOLIDATED NOTES TO FINANCIAL STATEMENTS (Continued) | |
| December 31, 2023 | ANNUAL REPORT |
(11) RECENT REGULATORY UPDATES
On January 24, 2023, the SEC adopted rules and form amendments to require mutual funds and ETFs to transmit concise and visually engaging streamlined annual and semiannual reports to shareholders that highlight key information. Other information, including financial statements, will not appear in a streamlined shareholder report but must be available online, delivered free of charge upon request, and filed on a semiannual basis on Form N-CSR. The rule and form amendments have a compliance date of July 24, 2024. At this time, management is evaluating the impact of these amendments on the shareholder reports for the Funds.
(12) SUBSEQUENT EVENTS
Subsequent events after the date of the Statements of Assets and Liabilities have been evaluated through the date the financial statements were issued.
Effective January 18, 2024, Rational Real Assets Fund changed its name from Rational Inflation Growth Fund and adopted the following policy: Under normal market conditions, the Fund invests at least 80% of its net assets (plus borrowings for investment purposes) in exchange-traded equity securities of “real assets” companies. The Fund defines “real assets” companies as those in energy, materials, industrials, real estate and utility sectors. The Rational Real Assets Fund also changed the management fee to 0.95% and the expense caps to 1.19%, 1.44%, and 2.19% of the daily net assets of the Fund’s Institutional, Class A, and Class C shares, respectively, through April 30, 2025.

REPORT OF INDEPENDENT REGISTERED PUBLIC ACCOUNTING FIRM
To the Shareholders of Rational Equity Armor Fund, Rational Tactical Return Fund, Rational Dynamic Brands Fund, Rational Strategic Allocation Fund, Rational/ReSolve Adaptive Asset Allocation Fund, Rational/Pier 88 Convertible Securities Fund, Rational Special Situations Income Fund, and Rational Real Assets Fund (formerly, Rational Inflation Growth Fund) and
Board of Trustees of Mutual Fund and Variable Insurance Trust
Opinion on the Financial Statements
We have audited the accompanying statements of assets and liabilities, including the schedules of investments, of the funds listed below (the “Funds”), each a series of Mutual Fund and Variable Insurance Trust, as of December 31, 2023, the related statements of operations, the statements of changes in net assets, the related notes, and the financial highlights for each of the periods indicated below (collectively referred to as the “financial statements”). In our opinion, the financial statements present fairly, in all material respects, the financial position of each of the Funds as of December 31, 2023, the results of their operations, the changes in net assets, and the financial highlights for each of the periods indicated below in conformity with accounting principles generally accepted in the United States of America.
| Fund Name | Statements of
Operations | Statements of
Changes in Net
Assets | Financial Highlights |
| Rational Equity Armor Fund, Rational Tactical Return Fund, Rational Dynamic Brands Fund, Rational Strategic Allocation Fund, and Rational/ReSolve Adaptive Asset Allocation Fund * | For the year ended December 31, 2023 | For the years ended December 31, 2023 and 2022 | For the years ended December 31, 2023, 2022, 2021, 2020, and 2019 |
| Rational/Pier 88 Convertible Securities Fund | For the year ended December 31, 2023 | For the years ended December 31, 2023 and 2022 | For the years ended December 31, 2023, 2022, 2021, 2020, and for the period from December 6, 2019 (commencement of operations) through December 31, 2019 |
| Rational Special Situations Income Fund | For the year ended December 31, 2023 | For the years ended December 31, 2023 and 2022 | For the years ended December 31, 2023, 2022, 2021, 2020, and for the period from July 17, 2019 (commencement of operations) through December 31, 2019 |
| Rational Real Assets Fund (formerly, Rational Inflation Growth Fund) | For the year ended December 31, 2023 | For the years ended December 31, 2023 and 2022 | For the years ended December 31, 2023, 2022, and for the period from August 18, 2021 (commencement of operations) through December 31, 2021 |
| * | The financial statements referred to above are Consolidated Financial Statements. |
COHEN & COMPANY, LTD.
800.229.1099 | 866.818.4538 fax | cohencpa.com
Registered with the Public Company Accounting Oversight Board
Basis for Opinion
These financial statements are the responsibility of the Funds’ management. Our responsibility is to express an opinion on the Funds’ financial statements based on our audits. We are a public accounting firm registered with the Public Company Accounting Oversight Board (United States) (“PCAOB”) and are required to be independent with respect to the Funds in accordance with the U.S. federal securities laws and the applicable rules and regulations of the Securities and Exchange Commission and the PCAOB.
We conducted our audits in accordance with the standards of the PCAOB. Those standards require that we plan and perform the audit to obtain reasonable assurance about whether the financial statements are free of material misstatement whether due to error or fraud.
Our audits included performing procedures to assess the risks of material misstatement of the financial statements, whether due to error or fraud, and performing procedures that respond to those risks. Such procedures included examining, on a test basis, evidence regarding the amounts and disclosures in the financial statements. Our procedures included confirmation of securities owned as of December 31, 2023, by correspondence with the custodians and brokers. Our audits also included evaluating the accounting principles used and significant estimates made by management, as well as evaluating the overall presentation of the financial statements. We believe that our audits provide a reasonable basis for our opinion.
We have served as the Funds’ auditor since 2016.

COHEN & COMPANY, LTD.
Cleveland, Ohio
February 29, 2024
| RATIONAL FUNDS | |
| Supplemental Information (Unaudited) | |
| December 31, 2023 | ANNUAL REPORT |
Renewal of Management Agreement between Mutual Fund and Variable Insurance Trust and Rational Advisors, Inc. with respect to Rational Equity Armor Fund, Rational Tactical Return Fund, Rational Dynamic Brands Fund, Rational Strategic Allocation Fund, Rational Special Situations Income Fund, Rational/Pier 88 Convertible Securities Fund, Rational/ReSolve Adaptive Asset Allocation Fund, and Rational Real Assets Fund (formerly, Rational Inflation Growth Fund)
At a videoconference meeting held on December 7, 2023, and continued on December 15, 2023, the Board of Trustees (the “Board” or the “Trustees”) of Mutual Fund and Variable Insurance Trust (the “Trust”), including a majority of the Trustees who are not “interested persons,” as that term is defined in the Investment Company Act of 1940, as amended, of the Trust, discussed the renewal of the management agreement (the “Management Agreement”) between the Trust and Rational Advisors, Inc. (“Rational”) with respect to Rational Equity Armor Fund (the “Equity Armor Fund”), Rational Tactical Return Fund (the “Tactical Return Fund”), Rational Dynamic Brands Fund (the “Dynamic Brands Fund”), Rational Strategic Allocation Fund (the “Strategic Allocation Fund”), Rational Special Situations Income Fund (the “Special Situations Fund”), Rational/Pier 88 Convertible Securities Fund (the “Pier 88 Fund”), Rational/ReSolve Adaptive Asset Allocation Fund (the “ReSolve Fund”), and Rational Real Assets Fund (the “Real Assets Fund”), each a series of the Trust (collectively the “Renewal Funds”).
The Board reviewed the completed questionnaire submitted by Rational in connection with the proposed renewal of the Management Agreement with respect to the Trust (the “Rational 15(c) Response”). The Board was assisted by legal counsel throughout the review process. The Board relied upon the advice of legal counsel and its own business judgment in evaluating the Management Agreement and the weight to be given to each factor considered. The conclusions reached by the Board were based upon a comprehensive evaluation and discussion of all the information provided for each Fund with respect to the approval of the Management Agreement and were not the result of any one factor. Moreover, each Trustee might have afforded different weight to the various factors in reaching his conclusions with respect to the Management Agreement. In connection with its deliberations regarding approval of the Management Agreement, the Board reviewed materials prepared by Rational and considered the information presented at Board meetings throughout the year.
Review of Rational 15(c) Response
Nature, Extent, and Quality of Services. The Board reviewed the nature, extent, and quality of the services that Rational provided to the Renewal Funds pursuant to the Management Agreement. The Board reviewed information concerning Rational’s resources, personnel, and business operations. The Board considered Rational’s oversight of the Funds’ investment strategies, including derivative risk management and fair valuation. The Board reviewed Rational’s Form ADV. The Board discussed the financial health of Rational and reviewed its balance sheet. The Board considered that MFund, an affiliate of Rational, provides the Funds with certain management, legal administrative, and compliance services including providing the Trust’s CCO. The Board reviewed Rational’s compliance program, including its business continuity and cybersecurity programs, and its oversight of the Funds’ sub-advisors’ compliance programs.
| RATIONAL FUNDS | |
| Supplemental Information (Unaudited) (Continued) | |
| December 31, 2023 | ANNUAL REPORT |
Performance. The Board reviewed the performance of each Renewal Fund relative to its peer group, Morningstar category, and benchmark index for various periods ended September 30, 2023.
Equity Armor Fund. The Fund underperformed its peer group, the Morningstar Long/Short Equity and Morningstar Options Trading categories, the S&P 500 Value Total Return Index, and S&P 500 Total Return Index for the one-, three-, five, and ten-year periods. Rational attributed the Fund’s underperformance to a focus on dividend-paying stocks rather than better-performing growth stocks, and the Fund’s hedging strategy.
Tactical Return Fund. The Fund underperformed the Morningstar Options Trading category, its peer group, and the S&P 500 Total Return Index for the one-, three-, and ten-year periods. The Fund outperformed its peer group for the five-year period. Rational noted that the Fund’s strategy is not expected to produce the types of strong returns witnessed in the equity markets as the Fund does not maintain any long equity exposure.
Dynamic Brands Fund. The Fund outperformed the Morningstar Large Growth category, its peer group, and the S&P 500 Total Return Index for the one-year period, while lagging behind each for the three-, five-, and ten-year periods. The Fund’s performance was attributed to investments focused on global consumption, consumer discretionary and staples companies, and to a lesser extent, technology companies.
Strategic Allocation Fund. The Fund outperformed the Morningstar Moderately Conservative Allocation category for the one-, three-, and ten-year periods, and lagged for the five-year period. The Fund outperformed its peer group for the one- and three-year periods, and underperformed for the five - and ten-year periods. The Fund underperformed the S&P 500 Total Return Index for all periods as its fixed income holdings were a drag on returns.
Special Situations Fund. The Fund outperformed its peer group, the Morningstar Nontraditional Bond and Multisector Bond categories, the Bloomberg U.S. Aggregate Bond Total Return Index, and the Bloomberg Mortgage-Backed Securities Total Return Index for the one-, three-, five- and ten-year periods. The outperformance compared to traditional fixed income funds and indices is attributable to lower interest rate sensitivity of the Fund’s holdings.
Pier 88 Fund. The Fund underperformed its peer group for the one- and five-year periods and since inception, while outperforming for the three-year period. The Fund underperformed the Morningstar Convertibles category for the one- and five-year periods and since inception, while outperforming for the three- year period. The Fund outperformed the Bloomberg U.S. Aggregate Bond Total Return Index for all periods, while it underperformed the ICE BofA Investment Grade U.S. Convertible 5% Index and S&P 500 Total Return Index for all periods. Rational attributed the Fund’s underperformance relative to ICE BofA Investment Grade U.S. Index for the one-year period to the fact that the Fund does not invest in certain sectors that have performed well during the year, and the Fund’s underperformance relative to the S&P 500 Total Return Index to its exposure to convertible bonds during a period of strong equity returns.
| RATIONAL FUNDS | |
| Supplemental Information (Unaudited) (Continued) | |
| December 31, 2023 | ANNUAL REPORT |
ReSolve Fund. The Fund outperformed its peer group, Morningstar Macro Trading category, and Barclay CTA Index for the one-, three-, five- and ten-year periods, and underperformed the S&P 500 Total Return Index for those periods. Rational attributed the Fund’s performance to investments in the energy sector and the uncorrelated nature of the Fund’s strategy relative to equities.
Real Assets Fund. The Fund outperformed its peer group and the Morningstar Moderate Allocation for the one-year period and since inception. The Fund outperformed a blended index comprising 60% S&P 500 Total Return Index/40% Bloomberg U.S. Aggregate Bond Index for the one -year period, while underperforming since inception which Rational attributed to the fact that the returns of the equity component of the blended index are driven by stocks that typically do not fall within the Fund’s investment parameters. The Fund underperformed the S&P 500 Total Return Index for all periods.
Fees and Expenses. The Board reviewed the advisory fees and the net expenses for each Renewal Fund compared to its peer group and Morningstar category.
Equity Armor Fund. The Fund’s advisory fee was lower than the peer group average and median, lower than the average for Morningstar Long-Short Equity and Options Trading categories, lower than the median for the Morningstar Long-Short Equity category, and equal to the median for the Morningstar Options Trading category. The Fund’s advisory fee was within the range of fees for the peer group and the Long-Short Equity and Options Trading Morningstar categories. Rational noted that the Morningstar categories includes funds that are passively managed and that the peer group is a more appropriate comparison for an actively managed equity strategy with a hedging overlay.
The Fund’s net expense ratio was higher than the median and average next expenses of the Morningstar Options Trading category, and lower than both the median and average expense ratios for the peer group and Morningstar Long-Short Equity category. The Fund’s net expenses were within the range of net expenses of its peer group and each Morningstar category.
Tactical Return Fund. The Fund’s advisory fee was above both the average and median of its peer group and the Morningstar Options Trading category. Rational stated that the Fund offers a distinct strategy that has proven to perform well during a challenging investing environment. The Board also considered that only a few unaffiliated funds in the Morningstar category have strategies similar to those of the Fund, and that two of them have the same 1.75% advisory fee as the Fund, which is the highest for both the peer group and Morningstar category.
The Fund’s net expense ratio was higher than its peer group and Morningstar category average and median and was within the range of net expense ratios for both.
Dynamic Brands Fund. The Fund’s advisory fee was slightly below the average and equal to the median of the peer group, while above the Morningstar Large Growth category average and median, and within the range of advisory fees for both. Rational stated its belief that the Fund’s advisory fee was competitive relative to the peer group and other funds in the Morningstar category that implement a more active strategy.
| RATIONAL FUNDS | |
| Supplemental Information (Unaudited) (Continued) | |
| December 31, 2023 | ANNUAL REPORT |
The Fund’s net expense ratio was above its peer group and Morningstar category averages and medians, but within the range of net expense ratios of the peer group and the Morningstar category.
Strategic Allocation Fund. The Fund’s advisory fee was lower than average and median advisory fees for its peer group and the Morningstar Moderately Conservative Allocation category. Rational stated that the fee was priced to account for its fund-of funds strategy and its belief that the Fund’s advisory fee was comparable to other funds that implement fund-of-funds strategies.
The Fund’s net expense ratio was above the average and median expense ratio of its peer group and the Morningstar Moderately Conservative Allocation category, but within the range of net expense ratios for both the peer group and Morningstar category.
Special Situations Fund. The Fund’s advisory fee was higher than the average and median of the peer group and the Morningstar Non-Traditional Bond and Multisector Bond categories, but within the range of advisory fees of each. Rational stated its belief that the Fund’s advisory fee was reasonable given the unique nature of the investment strategy, including the in depth research and distinct investment expertise of ESM, as reflected in the Fund’s returns relative to its benchmarks.
The Fund’s net expense ratio was above the average and median of the peer group and both Morningstar categories, but within the range of net expenses of each.
Pier 88 Fund. The Fund’s advisory fee was slightly above the average of the peer group, as well as above the median, above the Morningstar Convertibles category average and median, but within the range of advisory fees for both. The Board considered the reasonableness of the advisory fee in light of the unique nature of the Fund’s investment strategy, including the focus on investment grade convertible bonds.
The Fund’s net expense ratio was slightly below the peer group average, above the peer group median, and above the Morningstar Convertible category average and median, but within the range of net expenses of both the peer group and Morningstar category.
ReSolve Fund. The Fund’s advisory fee was higher than the peer group and Morningstar Macro Trading category average and median, higher than the highest advisory fee of the peer group, and equal to the highest fee of the Morningstar category. The Board considered the specialized nature of the Fund’s hedge fund-like investment strategy when evaluating the advisory fee compared to the funds in the peer group and Morningstar Category.
The Fund’s net expense ratio was higher than the peer group and Morningstar Macro Trading category average and median, and outside the range of net expenses for the peer group, but within the range of net expenses for the Morningstar category.
Real Assets Fund. The Fund’s advisory fee was above the average and median of the peer group and the Morningstar Moderate Allocation category. The Fund’s advisory fee was at the high end of the advisory fees of Morningstar category and the highest fee of the peer group.
| RATIONAL FUNDS | |
| Supplemental Information (Unaudited) (Continued) | |
| December 31, 2023 | ANNUAL REPORT |
The Fund’s net expense ratio was above the average and median for the peer group and Morningstar Moderate Allocation category, but within the range of net expenses of both.
The Board took notice that, in January 2024, the Fund’s annual advisory fee rate would be reduced to 0.95% and its net expense ratio would be reduced to 1.62%, along with changes to the Fund’s name and principal strategy.
The Board considered the allocation of advisory fees between Rational and the sub-advisors of the Equity Armor Fund, Tactical Return Fund, Dynamic Brands Fund, Special Situations Fund, Pier 88 Fund, ReSolve Fund, and Real Assets Fund in light of Rational’s and each sub-advisor’s respective duties and other factors.
Profitability. A profitability analysis from Rational demonstrated that Rational realized a loss in connection with its management of the Strategic Allocation Fund, Pier 88 Fund, and Real Assets Fund, and realized a profit with respect to the Equity Armor Fund, Dynamic Brands Fund, Tactical Return Fund, Special Situations Fund, and ReSolve Fund.
“Fall-out” Benefits. The Board considered fall-out benefits that Rational received from its relationship with the Renewal Funds, including the fact that the Renewal Funds utilize affiliates to provide certain services.
Economies of Scale. The Board considered that asset-based breakpoints in advisory fees were included for the Equity Armor Fund and Dynamic Brands Fund, and that Rational did not receive its full advisory fees for any of the Funds as a result of expense limitation agreements.
Conclusion. The Board considered many factors, and no single factor was determinative to the decision of the Board concerning the renewal of the Management Agreement. In connection with its deliberations, the Board reviewed materials prepared by Rational and considered the information presented at Board meetings throughout the year. Having requested, reviewed, and discussed in depth such information from Rational as the Board believed to be reasonably necessary to evaluate the terms of the Management Agreement, and as assisted by the advice of counsel, the Board concluded the renewal of the Management Agreement was in the best interest of each Renewal Fund and its shareholders.
| RATIONAL FUNDS | |
| Supplemental Information (Unaudited) | |
| December 31, 2023 | ANNUAL REPORT |
Renewal of Sub-Advisory Agreements for Rational Tactical Return Fund, Rational Dynamic Brands Fund, Rational Special Situations Income Fund, Rational/ReSolve Adaptive Asset Allocation Fund, Rational/Pier 88 Convertible Securities Fund, Rational Equity Armor Fund, and Rational Real Assets Fund (formerly Rational Inflation Growth Fund)
At a videoconference meeting held on December 7, 2023, and continued on December 15, 2023, the Board of Trustees (the “Board” or the “Trustees”) of Mutual Fund and Variable Insurance Trust (the “Trust”), including a majority of the Trustees who are not “interested persons”, as that term is defined in the Investment Company Act of 1940, as amended, of the Trust discussed the renewal of sub-advisory agreements between Rational Advisors, Inc., the investment advisor of each Fund listed above (“Rational”), and: Warrington Asset Management, LLC (“Warrington”) pertaining to Rational Tactical Return Fund (the “Tactical Return Fund”) (the “Warrington Sub-Advisory Agreement”); Accuvest Global Advisors (“Accuvest”) pertaining to Rational Dynamic Brands Fund (the “Dynamic Brands Fund”); (the “Accuvest Sub-Advisory Agreement”); ESM Management, LLC (“ESM”) pertaining to Rational Special Situations Income Fund (the “Special Situations Fund”) (the “ESM Sub-Advisory Agreement”); Pier 88 Investment Partners, LLC (“Pier 88”) pertaining to Rational/Pier 88 Convertible Securities Fund (the “Pier 88 Fund”) (the “Pier 88 Sub-Advisory Agreement”); Equity Armor Investments, LLC (“Equity Armor”) pertaining to Rational Equity Armor Fund (the “Equity Armor Fund”) (the “Equity Armor Sub-Advisory Agreement”); and SL Advisors, LLC (“SL Advisors”) pertaining to Rational Real Assets Fund (the “Real Assets Fund”) (the “SL Advisors Sub-Advisory Agreement”) (collectively, the “Sub-Advisory Agreements”).
The Board reviewed the completed questionnaires submitted by each sub-advisor in connection with the proposed renewal of the Sub-Advisory Agreements with respect to the Trust (each, a “15(c) Response”). The Board was assisted by legal counsel throughout the review process. The Board relied upon the advice of counsel and its own business judgment in evaluating the Sub-Advisory Agreements and the weight to be given to each of the factors considered. The conclusions reached by the Board were based upon a comprehensive evaluation and discussion of all the information provided and were not the result of any one factor. Moreover, each Trustee might have afforded different weight to the various factors in reaching his conclusions with the Sub-Advisory Agreements. The Board reviewed the materials prepared by Rational and each sub-advisor and considered the information presented at Board meetings throughout the year during which management of the sub-advisor had participated.
Review of Warrington 15(c) Response
Nature, Extent, and Quality of Services. The Board reviewed the nature, extent, and quality of the services provided by the investment professionals at Warrington. The Board reviewed information concerning Warrington’s resources, personnel, business operations, and compliance program. The Board considered that Warrington manages the Tactical Return Fund’s portfolio in accordance with its investment objective. The Board reviewed Warrington’s Form ADV, including details of its compliance program, including its business continuity and cybersecurity programs.
Performance. The Tactical Return Fund underperformed the Morningstar Options Trading category, its peer group, and the S&P 500 Total Return Index for the one-, three-, and ten-year
| RATIONAL FUNDS | |
| Supplemental Information (Unaudited) (Continued) | |
| December 31, 2023 | ANNUAL REPORT |
periods. The Fund outperformed its peer group for the five-year period. A representative of Rational noted the Fund’s strategy is not expected to produce the types of strong returns witnessed in the equity markets as the Fund does not maintain any long equity exposure.
Fees and Expenses. The Tactical Return Fund’s sub-advisory fees are paid entirely by Rational. The Fund’s sub-advisory fee was lower than the fees that Warrington receives for managing other pooled investment vehicles and or separately managed accounts (“SMAs”) with comparable investment objectives and strategies, some of which include performance fees. The Board considered the respective duties of Rational and Warrington and analyzed how fees were allocated.
Profitability. A profitability analysis from Warrington demonstrated that Warrington makes a profit from managing the Tactical Return Fund. Warrington’s profit is further reduced after adjusting for salaries of the Fund’s portfolio management team.
“Fall-out” Benefits. The Board considered fall-out benefits received by Warrington and its relationship with the Tactical Return Fund and acknowledged that any such benefits are immaterial and cannot otherwise be quantified.
Economies of Scale. The Board agreed that economies of scale are primarily an advisor-level issue and should be considered with respect to the overall management agreement with Rational, taking into consideration the impact of sub-advisory expenses.
Conclusion. The Board considered many factors, and no single factor was determinative to the decision of the Board concerning the renewal of the Warrington Sub-Advisory Agreement. Having requested, reviewed, and discussed in dept such information from Warrington as the Board believed to be reasonably necessary to evaluate the terms of the Agreement, and as assisted by the advice of counsel, the Board concluded that renewal of the Agreement was in the best interests of the Tactical Return Fund and its shareholders.
Review of Accuvest 15(c) Response
Nature, Extent, and Quality of Services. The Board reviewed the nature, extent, and quality of the services provided by the investment professionals at Accuvest. The Board reviewed information concerning Accuvest’s resources, operations and compliance program. The Board considered that Accuvest manages the Dynamic Brands Fund’s portfolio in accordance with its investment objective. The Board reviewed Accuvest’s Form ADV and acknowledged that changes will be filed with respect to new ownership post-Transaction. The Board analyzed financial information provided by Accuvest. The Board reviewed Accuvest’s compliance program, including its business continuity and cybersecurity programs.
Performance. The Dynamic Brands Fund outperformed the Morningstar Large Growth category, its peer group, and the S&P 500 Total Return Index for the one-year period, while lagging behind each for the three-, five-, and ten-year periods. The Fund’s performance was attributed to investments focused on global consumption, consumer discretionary and staples companies, and to a lesser extent, technology companies.
| RATIONAL FUNDS | |
| Supplemental Information (Unaudited) (Continued) | |
| December 31, 2023 | ANNUAL REPORT |
Fees and Expenses. The sub-advisory fees for the Dynamic Brands Fund are paid by Rational. The sub-advisory fees paid to Accuvest for the Fund are lower than the fees that Accuvest receives for managing SMAs with similar investment strategies as well as fees received from Accuvest Alpha Brand Fund, a similarly managed offshore fund. The Board considered the respective duties of Rational and Accuvest and analyzed how fees were allocated.
Profitability. A profitability analysis from Accuvest demonstrated that Accuvest realizes a loss from managing the Dynamic Brands Fund.
“Fall-out” Benefits. The Board considered fall-out benefits received by Accuvest and its relationship with Dynamic Brands Fund and acknowledged that any such benefits are immaterial and cannot otherwise be quantified.
Economies of Scale. The Board agreed that economies of scale are primarily an advisor-level issue and should be considered with respect to the overall management agreement with Rational, taking into consideration the impact of sub-advisory expenses.
Conclusion. The Board considered many factors, and no single factor was determinative to the decision of the Board concerning the Accuvest Sub-Advisory Agreement. Having requested, reviewed, and discussed in depth such information from Accuvest as the Board believed to be reasonably necessary to evaluate the terms of the Agreement, and as assisted by the advice of counsel, the Board concluded that renewal of the Agreement was in the best interests of the Dynamic Brands Fund and its shareholders.
Review of ESM 15(c) Response
Nature, Extent, and Quality of Services. The Board reviewed the nature, extent, and quality of the services provided by the investment professionals at ESM. The Board reviewed information concerning ESM’s resources, personnel, operations and compliance program. The Board considered that ESM manages the Special Situations Fund’s portfolio in accordance with its investment objective and proprietary investment strategy. The Board analyzed financial information provided by ESM. The Board reviewed ESM’s Form ADV, and details of their compliance program, including its business continuity and cybersecurity programs.
Performance. The Special Situations Fund outperformed its peer group, the Morningstar Nontraditional Bond and Multisector Bond categories, the Bloomberg U.S. Aggregate Bond Total Return Index, and the Bloomberg Mortgage-Backed Securities Total Return Index for the one-, three-, five-, and ten -year periods. The outperformance compared to traditional fixed income fund and indices is attributable to lower interest rate sensitivity.
Fees and Expenses. The sub-advisory fees paid to ESM are paid by Rational. ESM stated that it does not manage similar investment products that are charged a lower aggregate fee, as it receives incentive fees on most other products that it manages. The Board considered the respective duties of Rational and ESM and analyzed how fees were allocated.
| RATIONAL FUNDS | |
| Supplemental Information (Unaudited) (Continued) | |
| December 31, 2023 | ANNUAL REPORT |
Profitability. A profitability analysis from ESM demonstrated that ESM realizes a profit from managing the Special Situations Fund (net of compensation to key personnel).
“Fall-out” Benefits. The Board considered fall-out benefits received by ESM and its relationship with the Special Situations Fund and acknowledged that any such benefits are immaterial and cannot otherwise be quantified.
Economies of Scale. The Board agreed that economies of scale are primarily an advisor-level issue and should be considered with respect to the overall management agreement with Rational, taking into consideration the impact of sub-advisory expenses.
Conclusion. The Board considered many factors, and no single factor was determinative to the decision of the Board concerning the renewal of the ESM Sub-Advisory Agreement. Having requested, reviewed, and discussed in depth such information from ESM as the Board believed to be reasonably necessary to evaluate the terms of the Agreement, and as assisted by the advice of counsel, the Board concluded that renewal of the Agreement was in the best interests of the Special Situations Fund and its shareholders.
Review of Pier 88 15(c) Response
Nature, Extent, and Quality of Services. The Board reviewed the nature, extent, and quality of the services provided by the investment professionals at Pier 88. The Board reviewed information concerning Pier 88’s resources; personnel, operations and compliance program. The Board considered that Pier 88 manages the Pier 88 Fund’s portfolio in accordance with its investment objective. The Board reviewed financial information provided by Pier 88. The Board reviewed a copy of Pier 88’s Form ADV and discussed Pier 88’s compliance program, including its business continuity and cybersecurity programs.
Performance. The Pier 88 Fund underperformed its peer group for the one- and five-year periods and since inception, while outperforming for the three-year period. The Fund underperformed the Morningstar Convertibles category for the one- and five-year periods and since inception, while outperforming for the three-year period. The Fund outperformed the Bloomberg U.S. Aggregate Bond Total Return Index for all periods, while it underperformed the ICE BofA Investment Grade U.S. Convertible 5% Index and S&P 500 Total Return Index for all periods. Rational attributed the Fund’s underperformance relative to ICE BofA Investment Grade U.S. Index for the one-year period to the fact that the Fund does not invest in certain sectors that have performed well during the year, and the Fund’s underperformance relative to the S&P 500 Total Return Index to its exposure to convertible bonds during a period of strong equity returns.
Fees and Expenses. The sub-advisory fees paid to Pier 88 are paid by Rational. Pier 88 stated that other accounts it manages pay higher or lower fees relative to those charged with respect to the Pier 88 Fund, based on performance, asset levels and resources necessary to manage such other accounts. The Board considered the respective duties of Rational and Pier 88 and analyzed how fees were allocated between them.
| RATIONAL FUNDS | |
| Supplemental Information (Unaudited) (Continued) | |
| December 31, 2023 | ANNUAL REPORT |
Profitability. A profitability analysis from Pier 88 demonstrated that Pier 88 realizes a loss from managing the Pier 88 Fund after taking into account marketing and distribution expenses.
“Fall-out” Benefits. The Board considered fall-out benefits received by Pier 88 and its relationship with Pier 88 Fund and acknowledged that any such benefits are immaterial and cannot otherwise be quantified.
Economies of Scale. The Board agreed that economies of scale are primarily an advisor-level issue and should be considered with respect to the overall management agreement with Rational, taking into consideration the impact of sub-advisory expenses.
Conclusion. The Board considered many factors, and no single factor was determinative to the decision of the Board concerning the renewal of the Pier 88 Sub-Advisory Agreement. Having requested, reviewed, and discussed such information from Pier 88 as the Board believed to be reasonably necessary to evaluate the terms of the Agreement, and as assisted by the advice of counsel, the Board concluded that renewal of the Agreement was in the best interests of the Pier 88 Fund and its shareholders.
Review of Equity Armor 15(c) Response
Nature, Extent, and Quality of Services. The Board reviewed the nature, extent, and quality of the services provided by the investment professionals at Equity Armor. The Board reviewed information concerning Equity Armor’s resources, personnel, operations and compliance program. The Board considered that Equity Armor manages the Equity Armor Fund’s portfolio in accordance with its investment objective. The Board reviewed financial information provided by Equity Armor. The Board reviewed Equity Armor’s Form ADV, compliance program, including its business continuity and cybersecurity programs.
Performance. The Equity Armor Fund underperformed its peer group, the Morningstar Long/Short Equity and Morningstar Options Trading categories, the S&P 500 Value Total Return Index, and S&P 500 Total Return Index for the one-, three-, five-, and ten-year periods. Rational attributed the Fund’s underperformance to a focus on dividend-paying stocks rather than better-performing growth stocks, and the Fund’s hedging strategy.
Fees and Expenses. The sub-advisory fees paid to Equity Armor are paid by Rational. The sub-advisory fees paid to Equity Armor are low relative to other funds that use derivatives or volatility products or are actively managed. The Board considered the respective duties of Rational and Equity Armor and analyzed how fees were allocated between them.
Profitability. A profitability analysis from Equity Armor demonstrated that Equity Armor realizes a profit from managing the Equity Armor Fund.
“Fall-out” Benefits. The Board considered fall-out benefits received by Equity Armor and its relationship with the Equity Armor Fund, but that any such benefits are immaterial and cannot otherwise be quantified.
| RATIONAL FUNDS | |
| Supplemental Information (Unaudited) (Continued) | |
| December 31, 2023 | ANNUAL REPORT |
Economies of Scale. The Board agreed that economies of scale are primarily an advisor-level issue and should be considered with respect to the overall management agreement with Rational, taking into consideration the impact of sub-advisory expenses.
Conclusion. The Board considered many factors, and no single factor was determinative to the decision of the Board concerning the renewal of the Equity Armor Sub-Advisory Agreement. Having requested, reviewed, and discussed such information from Equity Armor as the Board believed to be reasonably necessary to evaluate the terms of the Agreement, and as assisted by the advice of counsel, the Board concluded that renewal of the Agreement was in the best interests of the Equity Armor Fund and its shareholders.
Review of SL Advisors 15(c) Response
Nature, Extent, and Quality of Services. The Board reviewed the nature, extent, and quality of the services provided by the investment professionals at SL Advisors. The Board reviewed information concerning SL Advisors’ resources, personnel, operations and compliance program. The Board considered that SL Advisors manages the Fund’s portfolio in accordance with its principal strategies in seeking to achieve the Fund’s investment objective. The Board analyzed financial information provided by SL Advisors and reviewed a copy of SL Advisors’ Form ADV and compliance program, including its business continuity and cybersecurity programs.
Performance. The Fund outperformed its peer group and the Morningstar Moderate Allocation for the one-year period and since inception. The Fund outperformed a blended index comprising 60% S&P 500 Total Return Index/40% Bloomberg U.S. Aggregate Bond Index for the one -year period, while underperforming since inception which Rational attributed to the fact that the returns of the equity component of the blended index are driven by stocks that typically do not fall within the Fund’s investment parameters. The Fund underperformed the S&P 500 Total Return Index for all periods.
Fees and Expenses. The Board considered that the sub-advisory fees were entirely paid by Rational. The Board found the sub-advisory fees to be in line with other actively managed funds. The Board further acknowledged the decrease in advisory fees and corresponding decrease in sub-advisory fees paid to SL Advisor. The Board considered the respective duties of Rational and SL Advisors and analyzed how fees were allocated between Rational and SL Advisors.
Profitability. A profitability analysis from SL Advisors demonstrated that SL Advisors realized a loss from managing the Fund.
“Fall-out” Benefits. The Board considered fall-out benefits received by SL Advisors and its relationship with the Fund and acknowledged that any such benefits are immaterial and cannot otherwise be quantified.
Economies of Scale. The Board agreed to continue evaluating the economies of scale with respect to the investment advisory relationship overall, taking into consideration the impact of the sub-advisory expense.
| RATIONAL FUNDS | |
| Supplemental Information (Unaudited) (Continued) | |
| December 31, 2023 | ANNUAL REPORT |
Conclusion. The Board considered many factors, and no single factor was determinative to the decision of the Board concerning the renewal of the SL Advisors Sub-Advisory Agreement. Having requested, reviewed, and discussed such information from SL Advisors as the Board believed to be reasonably necessary to evaluate the terms of the Agreement, and as assisted by the advice of counsel, the Board concluded that renewal of the Agreement was in the best interests of the Fund and its shareholders.
| RATIONAL FUNDS | |
| Supplemental Information (Unaudited) | |
| December 31, 2023 | ANNUAL REPORT |
Approval of a Sub-Advisory Agreement for Rational Dynamic Brands Fund
At a videoconference meeting held on December 22, 2023, the Board of Trustees (the “Board” or the “Trustees”) of Mutual Fund and Variable Insurance Trust (the “Trust”), including a majority of the Trustees who are not “interested persons,” as that term is defined in the Investment Company Act of 1940, as amended, of the Trust, discussed the sub-advisory agreement (the “Sub-Advisory Agreement”) between Rational Advisers, Inc. (“Rational”) and Accuvest Global Advisors (“Accuvest”) with respect to Rational Dynamic Brands Fund (the “Dynamic Brands Fund”), a series of the Trust.
The Board reviewed the completed questionnaire submitted by Accuvest in connection with the proposed Sub-Advisory Agreement with respect to the Dynamic Brands Fund (the “Accuvest 15(c) Response”). The Board was assisted by legal counsel throughout the review process. The Board relied upon the advice of legal counsel and its own business judgment in evaluating the Sub-Advisory Agreement and the weight to be given to each factor considered. The conclusions reached by the Board were based upon a comprehensive evaluation and discussion of all the information provided with respect to the approval of the Sub-Advisory Agreement and were not the result of any one factor. Moreover, each Trustee might have afforded different weight to the various factors in reaching his conclusions with respect to the Sub-Advisory Agreement. In connection with its deliberations regarding approval of the Sub-Advisory Agreement, the Board reviewed materials prepared by Accuvest and considered the information presented at Board meetings throughout the year.
Review of Accuvest 15(c) Response
Nature, Extent, and Quality of Services. The Board reviewed the nature, extent, and quality of the services provided by the investment professionals at Accuvest. The Board reviewed information concerning Accuvest’s resources, operations and compliance program. The Board considered that Accuvest manages the Dynamic Brands Fund’s portfolio in accordance with its investment objective. The Board reviewed Accuvest’s Form ADV and acknowledged that changes will be filed with respect to new ownership post-Transaction. The Board analyzed financial information provided by Accuvest. The Board reviewed Accuvest’s compliance program, including its business continuity and cybersecurity programs.
Performance. The Dynamic Brands Fund outperformed the Morningstar Large Growth category, its peer group, and the S&P 500 Total Return Index for the one-year period, while lagging behind each for the three-, five-, and ten-year periods. The Fund’s performance was attributed to investments focused on global consumption, consumer discretionary and staples companies, and to a lesser extent, technology companies.
Fees and Expenses. The sub-advisory fees for the Dynamic Brands Fund are paid by Rational. The sub-advisory fees paid to Accuvest for the Fund are lower than the fees that Accuvest receives for managing SMAs with similar investment strategies as well as fees received from Accuvest Alpha Brand Fund, a similarly managed offshore fund. The Board considered the respective duties of Rational and Accuvest and analyzed how fees were allocated.
| RATIONAL FUNDS | |
| Supplemental Information (Unaudited) (Continued) | |
| December 31, 2023 | ANNUAL REPORT |
Profitability. A profitability analysis from Accuvest demonstrated that Accuvest realizes a loss from managing the Dynamic Brands Fund.
“Fall-out” Benefits . The Board considered fall-out benefits received by Accuvest and its relationship with Dynamic Brands Fund and acknowledged that any such benefits are immaterial and cannot otherwise be quantified.
Economies of Scale. The Board agreed that economies of scale are primarily an advisor-level issue and should be considered with respect to the overall management agreement with Rational, taking into consideration the impact of sub-advisory expenses.
Conclusion. The Board considered many factors, and no single factor was determinative to the decision of the Board concerning the Accuvest Sub-Advisory Agreement. Having requested, reviewed, and discussed in depth such information from Accuvest as the Board believed to be reasonably necessary to evaluate the terms of the Sub- Advisory Agreement, and as assisted by the advice of counsel, the Board concluded that approval of the Sub-Advisory Agreement was in the best interests of the Dynamic Brands Fund and its shareholders.
| RATIONAL FUNDS | |
| Boards of Trustees and Trust Officers (Unaudited) | |
| December 31, 2023 | ANNUAL REPORT |
Independent Trustees Background
Name,
Address and
Year of Birth | Position with
the Trust | Term of
Office and
Length of
Time Served* | Principal Occupation(s)
During Past 5 Years | Number of
Portfolios in
Fund
Complex
Overseen by
Trustee | Other Directorships
Held During Past 5 Years |
Tobias Caldwell
Year of Birth:
1967 | Chairman of the Board and Trustee | Since 2016 | Manager, Genovese Family Enterprises, LLC (and affiliates, family office) 1999- present; Managing Member, Bear Properties, LLC (real estate firm) (2006-present). | 49 | Lead Independent Trustee and Chair of Audit Committee, Mutual Fund Series Trust, since 2006; Chairman of the Board of Strategy Shares since 2016; Chairman of the Board of Strategy Shares since 2016; Trustee of IDX Funds Trust (formerly, M3Sixty Funds Trust) since 2016; Chairman of the Board of AlphaCentric Prime Meridian Income Fund from 2018 to August 2023. |
Stephen P. Lachenauer
Year of Birth:
1967 | Trustee and Chair of the Audit, Risk and Compliance, and Investment Committees | Trustee and Chair of Audit and Risk and Compliance Committees since 2016; Chair of Investment Committee since November 2020 | Attorney, private practice, since 2011. | 49 | Trustee and Chair of the Audit and Risk and Compliance Committees since 2016, and Chair of the Investment Committee since November 2020, Strategy Shares; Trustee and Chair of the Audit and Risk and Compliance Committees from 2018 to 2023, and Chair of the Investment Committee from 2020 to 2023, AlphaCentric Prime Meridian Income Fund; Trustee, Mutual Fund Series Trust since April 2022. |
Donald McIntosh
Year of Birth:
1967 | Trustee | Since 2016 | Internal Audit Supervisor, Santander Bank, since 2021; Commercial Banking Business Control Officer, Santander Bank, 2017-2021. | 14 | Trustee, Strategy Shares, since 2016; Trustee, AlphaCentric Prime Meridian Income Fund from 2018 to 2023. |
| * | The term of office of each Trustee is indefinite. |
| RATIONAL FUNDS | |
| Boards of Trustees and Trust Officers (Unaudited) (Continued) | |
| December 31, 2023 | ANNUAL REPORT |
Officers*
Name, Address,
Year of Birth | Position(s)
Held
with Registrant | Term and
Length
Served* | Principal Occupation(s)
During Past 5 Years |
Michael Schoonover
53 Palmeras St. Suite 601
San Juan, PR 00901
Year of Birth: 1983 | President | Since 2022 | Vice President of the Trust, 2018-2021; Chief Operating Officer (“COO”), Catalyst Capital Advisors LLC and Rational Advisors, Inc. since 2017; Portfolio Manager, Catalyst Capital Advisors LLC, 2013 – May 2021; President, MFund Distributors LLC since January 2020; COO, Catalyst International Advisors LLC, since 2019; COO, Insights Media LLC since 2019; COO, MFund Management LLC since 2019; COO, AlphaCentric Advisors LLC since January 2021; Portfolio Manager, Rational Advisors, Inc., 2016–2018. |
Alex Merino
53 Palmeras St. Suite 601
San Juan, PR 00901
Year of Birth: 1985 | Vice President | Since 2022 | Investment Operations Manager, MFund Management LLC since 2022; Investment Operations Analyst, MFund Management LLC, 2020--2021. |
Erik Naviloff
4221 North 203rd Street,
Suite 100
Elkhorn, Nebraska, 68022
Year of Birth: 1968 | Treasurer | Since 2016 | Vice President—Fund Administration, Ultimus Fund Solutions, LLC since 2012. |
Frederick J. Schmidt
Year of Birth: 1959 | Chief Compliance Officer | Since 2016 | Director, MFund Services LLC since 2015. |
Jennifer A. Bailey
Year of Birth: 1968 | Secretary | Since 2016 | Director of Legal Services, MFund Services LLC since 2012. |
| * | Officers do not receive any compensation from the Trust. |
The Funds’ SAI includes additional information about the Trustees and is available free of charge, upon request, by calling toll-free at 1-800-253-0412.
| RATIONAL FUNDS |
| INFORMATION ABOUT YOUR FUNDS’ EXPENSES (Unaudited) |
As a shareholder of the Fund(s), you incur two types of costs: (1) transaction costs, including sales charges (loads) on purchase payments; and (2) ongoing costs, including management fees, distribution and/or service (12b-1) fees; and other Fund expenses. The example below is intended to help you understand your ongoing costs (in dollars) of investing in the Funds and to compare these costs with the ongoing costs of investing in other mutual funds.
The example below illustrates an investment of $1,000 invested at the beginning of the period 07/01/23 and held for the entire period through 12/31/23
Actual Expenses
The first section of each table below provides information about actual account values and actual expenses. You may use the information in these sections, together with the amount you invested, to estimate the expenses that you paid over the period. Simply divide your account value by $1,000 (for example, an $8,600 account value divided by $1,000 = 8.6), then multiply the result by the number in the first row under the heading entitled “Expenses Paid During Period” to estimate the expenses you paid on your account during this period.
Hypothetical Example for Comparison Purposes
The second section of each table provides information about the hypothetical account values and hypothetical expenses based on each Fund’s actual expense ratio and an assumed rate of return of 5% per year before expenses, which is not the Funds’ actual return. The hypothetical account values and expenses may not be used to estimate the actual ending account balance or expenses you paid for the period. You may use this information to compare the ongoing costs of investing in the Funds and other funds. To do so, compare this 5% hypothetical example with the 5% hypothetical examples that appear in the shareholder reports of the other funds.
Please note that the expenses shown in the table are meant to highlight your ongoing costs only and do not reflect any transactional costs, such as sales charges (loads) or exchange fees. Therefore, the second section of the table is useful in comparing ongoing costs only, and will not help you determine the relative total costs of owning different funds. In addition, if these transactional costs were included, your costs would have been higher. For more information on transactional costs, please refer to the Funds’ prospectus.
| | | | | | | | | | | | | | Hypothetical | |
| | | | | | | | Actual | | | (5% return before expenses) | |
| | | Fund’s | | Beginning | | | Ending | | | | | | Ending | | | | |
| | | Annualized | | Account Value | | | Account Value | | | Expenses Paid | | | Account Value | | | Expenses Paid | |
| | | Expense Ratio | | 07/01/2023 | | | 12/31/2023 | | | During Period * | | | 12/31/2023 | | | During Period * | |
| Rational Equity Armor Fund - Class A | | 1.86% | | $ | 1,000.00 | | | $ | 1,042.10 | | | $ | 9.58 | | | $ | 1,015.82 | | | $ | 9.46 | |
| Rational Equity Armor Fund - Class C | | 2.55% | | | 1,000.00 | | | | 1,038.80 | | | | 13.13 | | | | 1,012.33 | | | | 12.96 | |
| Rational Equity Armor Fund - Institutional | | 1.62% | | | 1,000.00 | | | | 1,043.30 | | | | 8.33 | | | | 1,017.05 | | | | 8.23 | |
| Rational Tactical Return Fund - Class A | | 2.25% | | | 1,000.00 | | | | 1,027.80 | | | | 11.48 | | | | 1,013.89 | | | | 11.40 | |
| Rational Tactical Return Fund - Class C | | 3.00% | | | 1,000.00 | | | | 1,024.10 | | | | 15.28 | | | | 1,010.10 | | | | 15.18 | |
| Rational Tactical Return Fund - Institutional | | 2.00% | | | 1,000.00 | | | | 1,029.40 | | | | 10.21 | | | | 1,015.15 | | | | 10.14 | |
| Rational Dynamic Brands Fund - Class A | | 1.49% | | | 1,000.00 | | | | 1,170.60 | | | | 8.16 | | | | 1,017.69 | | | | 7.58 | |
| Rational Dynamic Brands Fund - Class C | | 2.21% | | | 1,000.00 | | | | 1,166.70 | | | | 12.09 | | | | 1,014.05 | | | | 11.23 | |
| Rational Dynamic Brands Fund - Institutional | | 1.24% | | | 1,000.00 | | | | 1,172.50 | | | | 6.79 | | | | 1,018.95 | | | | 6.31 | |
| Rational Strategic Allocation Fund - Class A | | 0.71% | | | 1,000.00 | | | | 1,069.80 | | | | 3.68 | | | | 1,021.65 | | | | 3.59 | |
| Rational Strategic Allocation Fund - Class C | | 1.45% | | | 1,000.00 | | | | 1,066.20 | | | | 7.58 | | | | 1,017.87 | | | | 7.40 | |
| Rational Strategic Allocation Fund - Institutional | | 0.46% | | | 1,000.00 | | | | 1,070.10 | | | | 2.37 | | | | 1,022.91 | | | | 2.32 | |
| Rational/ReSolve Adaptive Asset Allocation Fund - Class A | | 2.25% | | | 1,000.00 | | | | 1,013.50 | | | | 11.40 | | | | 1,013.89 | | | | 11.40 | |
| Rational/ReSolve Adaptive Asset Allocation Fund - Class C | | 3.00% | | | 1,000.00 | | | | 1,009.80 | | | | 15.18 | | | | 1,010.10 | | | | 15.18 | |
| Rational/ReSolve Adaptive Asset Allocation Fund - Institutional | | 2.00% | | | 1,000.00 | | | | 1,014.80 | | | | 10.14 | | | | 1,015.14 | | | | 10.14 | |
| Rational/Pier 88 Convertible Securities Fund - Class A | | 1.24% | | | 1,000.00 | | | | 1,069.20 | | | | 6.47 | | | | 1,018.95 | | | | 6.31 | |
| Rational/Pier 88 Convertible Securities Fund - Class C | | 1.99% | | | 1,000.00 | | | | 1,064.10 | | | | 10.35 | | | | 1,015.17 | | | | 10.11 | |
| Rational/Pier 88 Convertible Securities Fund - Institutional | | 0.99% | | | 1,000.00 | | | | 1,070.00 | | | | 5.17 | | | | 1,020.21 | | | | 5.04 | |
| Rational Special Situations Income Fund - Class A | | 2.02% | | | 1,000.00 | | | | 1,012.50 | | | | 10.27 | | | | 1,015.00 | | | | 10.28 | |
| Rational Special Situations Income Fund - Class C | | 2.78% | | | 1,000.00 | | | | 1,008.70 | | | | 14.05 | | | | 1,011.21 | | | | 14.07 | |
| Rational Special Situations Income Fund - Institutional | | 1.77% | | | 1,000.00 | | | | 1,013.80 | | | | 9.01 | | | | 1,016.26 | | | | 9.02 | |
| Rational Real Assets Fund (formerly Rational Inflation Growth Fund) - Class A | | 1.75% | | | 1,000.00 | | | | 1,069.20 | | | | 9.14 | | | | 1,016.38 | | | | 8.90 | |
| Rational Real Assets Fund (formerly Rational Inflation Growth Fund) - Class C | | 2.50% | | | 1,000.00 | | | | 1,064.10 | | | | 13.01 | | | | 1,012.60 | | | | 12.69 | |
| Rational Real Assets Fund (formerly Rational Inflation Growth Fund) - Institutional | | 1.50% | | | 1,000.00 | | | | 1,070.00 | | | | 7.84 | | | | 1,017.63 | | | | 7.64 | |
| * | Expenses are equal to the average account value over the period, multiplied by the Fund’s annualized expense ratio, multiplied by the number of days in the period (184) divided by the numbe of days in the fiscal year (365). |
PRIVACY NOTICE
Mutual Fund & Variable Insurance Trust
Rev. June 2022
| FACTS | WHAT DOES MUTUAL FUND & VARIABLE INSURANCE TRUST DO WITH YOUR PERSONAL INFORMATION? |
| Why? | Financial companies choose how they share your personal information. Federal law gives consumers the right to limit some, but not all sharing. Federal law also requires us to tell you how we collect, share, and protect your personal information. Please read this notice carefully to understand what we do. |
| What? | The types of personal information we collect and share depends on the product or service that you have with us. This information can include: ● Social Security number and wire transfer instructions ● account transactions and transaction history ● investment experience and purchase history When you are no longer our customer, we continue to share your information as described in this notice. |
| How? | All financial companies need to share customers’ personal information to run their everyday business. In the section below, we list the reasons financial companies can share their customers’ personal information; the reasons Mutual Fund & Variable Insurance Trust chooses to share; and whether you can limit this sharing. |
Reasons we can share your
personal information: | Does Mutual Fund &
Variable Insurance Trust
share information? | Can you limit this
sharing? |
| For our everyday business purposes - such as to process your transactions, maintain your account(s), respond to court orders and legal investigations, or report to credit bureaus. | YES | NO |
| For our marketing purposes - to offer our products and services to you. | NO | We don’t share |
| For joint marketing with other financial companies. | NO | We don’t share |
| For our affiliates’ everyday business purposes - information about your transactions and records. | NO | We don’t share |
| For our affiliates’ everyday business purposes - information about your credit worthiness. | NO | We don’t share |
| For our affiliates to market to you | NO | We don’t share |
| For non-affiliates to market to you | NO | We don’t share |
PRIVACY NOTICE
Mutual Fund & Variable Insurance Trust
| What we do: |
How does Mutual Fund & Variable Insurance Trust protect my personal information? | To protect your personal information from unauthorized access and use, we use security measures that comply with federal law. These measures include computer safeguards and secured files and buildings. Our service providers are held accountable for adhering to strict policies and procedures to prevent any misuse of your nonpublic personal information. |
How does Mutual Fund & Variable Insurance Trust collect my personal information? | We collect your personal information, for example, when you: ● open an account or deposit money ● direct us to buy securities or direct us to sell your securities ● seek advice about your investments We also collect your personal information from others, such as credit bureaus, affiliates, or other companies. |
Why can’t I limit all sharing? | Federal law gives you the right to limit only: ● sharing for affiliates’ everyday business purposes – information about your creditworthiness. ● affiliates from using your information to market to you. ● sharing for non-affiliates to market to you. State laws and individual companies may give you additional rights to limit sharing. |
| Definitions |
| Affiliates | Companies related by common ownership or control. They can be financial and non-financial companies. ● Mutual Fund & Variable Insurance Trust does not share with affiliates. |
| Non-affiliates | Companies not related by common ownership or control. They can be financial and non-financial companies. ● Mutual Fund & Variable Insurance Trust doesn’t share with non-affiliates so they can market to you. |
| Joint marketing | A formal agreement between nonaffiliated financial companies that together market financial products or services to you. ● Mutual Fund & Variable Insurance Trust doesn’t jointly market. |
| QUESTIONS? | Call 1-800-253-0412 |
A copy of the policies and procedures that the Funds use to determine how to vote proxies relating to securities held in the Funds’ portfolios, as well as a record of how the Funds voted any such proxies during the most recent 12-month period ended June 30, is available without charge and upon request by calling 800-253-0412. This information is also available from the EDGAR database on the SEC’s website at www.sec.gov.
Funds file a complete schedule of portfolio holdings with the Securities and Exchange Commission (the “SEC”) for the first and third quarters of each fiscal year as an exhibit to its reports on Form N-PORT, within sixty days after the end of the period. Form N-PORT reports are available at the SEC’s website at www.sec.gov.
Rational Advisors, Inc., serves as Investment Advisor to the Funds.
This report is authorized for distribution to prospective investors only when preceded or accompanied by a prospectus which contains facts concerning the Funds’ objectives and policies, management fees, expenses and other information.
Shareholder Services: 800-253-0412
(a) The Registrant has, as of the end of the period covered by this report, adopted a code of ethics that applies to the Registrant's principal executive officer, principal financial officer, and principal accounting officer or controller, or persons performing similar functions, regardless of whether these individuals are employed by the Registrant or a third party.
(c) During the period covered by this report, there were no amendments to any provision of the code of ethics.
(d) During the period covered by the report, with respect to the registrant’s code of ethics that applies to its Principal Executive Officer and Principal Financial Officer: there have been no amendments to a provision that relates to any element of the code of ethics definition enumerated in paragraph (b) of this Item 2.
| Item 3. | Audit Committee Financial Expert. |
3(a) The registrant’s board of trustees has determined that the registrant does not have an audit committee financial expert. The audit committee determined that, although none of its members meet the technical definition of an audit committee financial expert, the committee has sufficient financial expertise to adequately perform its duties under the Audit Committee Charter without the addition of a qualified expert.
| Item 4. | Principal Accountant Fees and Services. |
(a) Audit Fees. The aggregate fees billed for each of the last two fiscal years for professional services rendered by the registrant's principal accountant for the audit of the registrant's annual financial statements or services that are normally provided by the accountant in connection with statutory and regulatory filings or engagements for those fiscal years are as follows:
Fiscal year ended 2023: $134,500
Fiscal year ended 2022: $111,500
(b) Audit-Related Fees. There were no fees billed in each of the last two fiscal years for assurances and related services by the principal accountant that are reasonably related to the performance of the audit of the registrant’s financial statements and are not reported under paragraph (a) of this item.
Fiscal year ended 2023: $0
Fiscal year ended 2022: $0
(c) Tax Fees. The aggregate fees billed in each of the last two fiscal years for professional services rendered by the principal accountant for tax compliance are as follows:
Fiscal year ended 2023: $24,100
Fiscal year ended 2022: $20,800
(d) All other fees billed to the registrant by its principal accountants for the two most recent fiscal years:
Fiscal year ended 2023: $0
Fiscal year ended 2022: $0
(e)(1) The audit committee does not have pre-approval policies and procedures. Instead, the audit committee or audit committee chairman approves on a case-by-case basis each audit or non-audit service before the principal accountant is engaged by the Registrant.
(e)(2) There were no services described in each of paragraphs (b) through (d) of this Item that were approved by the audit committee pursuant to paragraph (c)(7)(i)(C) of Rule 2-01 of Regulation S-X. |
| (f) Not applicable. The percentage of hours expended on the principal accountant's engagement to audit the Registrant's financial statements for the most recent fiscal year that were attributed to work performed by persons other than the principal accountant's full-time, permanent employees was zero percent (0%). |
(g) All non-audit fees billed by the Registrant's principal accountant for services rendered to the Registrant for the fiscal years ended June 30, 2016 and 2015, respectively, are disclosed in (b)-(d) above. There were no audit or non-audit services performed by the Registrant's principal accountant for the Registrant's adviser.
(h) Not applicable
(i) Not applicable
(j) Not applicable
Item 5. | Audit Committee of Listed Registrants.
|
Not applicable.
| Item 6. | Schedule of Investments. |
Included in annual report to shareholders filed under item 1 of this form.
| Item 7. | Disclosure of Proxy Voting Policies and Procedures for Closed-End Management Investment Companies. |
Not applicable.
| Item 8. | Portfolio Managers of Closed-End Management Investment Companies. |
Not applicable.
| Item 9. | Purchases of Equity Securities by Closed-End Management Investment Company and Affiliated Purchasers. |
Not applicable.
| Item 10. | Submission of Matters to a Vote of Security Holders. |
Not applicable.
| Item 11. | Controls and Procedures. |
(a) The registrant’s Principal Executive Officer and Principal Financial Officer, or persons performing similar functions, have concluded that the registrant’s disclosure controls and procedures (as defined in Rule 30a-3(c) under the Act) are effective in design and operation and are sufficient to form the basis of the certifications required by Rule 30a-2 under the Act, based on their evaluation of these disclosure controls and procedures within 90 days of the filing of this report on Form N-CSR.
(b) There were no changes in the registrant’s internal control over financial reporting (as defined in Rule 30a-3(d) under the Act (17 CFR 270.30a-3(d)) that occurred during the period covered by this report that have materially affected or are reasonably likely to materially affect, the registrant’s internal control over financial reporting.
Item 12. Disclosure of Securities Lending Activities for Closed-Ended Management Investment Companies
Not applicable.
(a)(1) Code of Ethics filed herewith.
(a)(2) Certifications required by Section 302 of the Sarbanes-Oxley Act of 2002 (and Item 11(a)(2) of Form N-CSR) are filed herewith.
(a)(3) Not applicable for open-end investment companies.
(b) Certifications required by Section 906 of the Sarbanes-Oxley Act of 2002 (and Item 11(b) of Form N-CSR) are filed herewith.
SIGNATURES
Pursuant to the requirements of the Securities Exchange Act of 1934 and the Investment Company Act of 1940, the registrant has duly caused this report to be signed on its behalf by the undersigned, thereunto duly authorized.
(Registrant) Mutual Fund and Variable Insurance Trust
| | | |
| By (Signature and Title) | | /s/ Michael Schoonover |
| | | Michael Schoonover, President and Principal Executive Officer |
| | | | |
| Date | | 3/5/24 | |
| | | | | | |
Pursuant to the requirements of the Securities Exchange Act of 1934 and the Investment Company Act of 1940, this report has been signed below by the following persons on behalf of the registrant and in the capacities and on the dates indicated.
| | | |
| By (Signature and Title) | | /s/ Michael Schoonover |
| | | Michael Schoonover, President and Principal Executive Officer |
| | | |
| By (Signature and Title) | | /s/ Erik Naviloff |
| | | Erik Naviloff, Treasurer and Principal Financial Officer |
| | | | |
| Date | | 3/5/24 | |
| | | | | | |