UNITED STATES
SECURITIES AND EXCHANGE COMMISSION
Washington, D.C. 20549
FORM N-CSR
CERTIFIED SHAREHOLDER REPORT OF REGISTERED
MANAGEMENT INVESTMENT COMPANIES
Investment Company Act file number: 811-05009
COLORADO BONDSHARES — A TAX-EXEMPT FUND
(Exact name of registrant as specified in its charter)
1200 17TH STREET, SUITE 850
DENVER, COLORADO 80202-5808
(Address of principal executive offices) (Zip code)
FRED R. KELLY, JR.
1200 17TH STREET, SUITE 850
DENVER, COLORADO 80202-5808
(Name and address of agent for service)
Registrant’s telephone number, including area code: 303-572-6990
Date of fiscal year end: 09/30
Date of reporting period: 03/31/2021
ITEM 1. REPORT TO STOCKHOLDERS.
May 26, 2021
Dear Shareholders,
Attached is the semi-annual report for Colorado BondShares for period ended March 31, 2021. I last reported to you, in November 2020, that I felt we were well positioned at the time. This statement proved to be accurate and, according to Thomson Reuters Lipper, the Fund ranked #1 in its category for the 12-month period posting a 10.38% total return. We are off to a good start.
But now the question on every bondholder’s mind is “Where do interest rates go from here?” It is a difficult question with a conditional answer because there are several acts still to be played out. We, as a country, have extravagantly spent over $6 trillion at this writing causing the national debt to run close to $28 trillion. This constitutes 102% of Gross Domestic Product (GDP). Previously 100% of GDP was considered the absolute ceiling. From 2009 through 2017, the government doubled the amount borrowed by all previous administrations dating back to this country’s beginning. Since that time, we have increased it by almost 30%, much of this within the last 3 months. We have not been this deeply indebted since the end of WWII. I think it was Margaret Thatcher who said “The problem with Socialism is that at some point, you run out of other people’s money.” We are there.
For the first time in many years, we can see the prospect of inflation looming. Some say don’t worry about it because it will be a short-term aberration caused by pandemic-related shortages. In part, this is true. I’m told there are numerous ships sitting off-shore which simply need to be unloaded to restock. That solves part of the problem. Others say, look out — obscene spending by government coupled with pent up demand and huge liquidity by individuals and others. This will lead to a demand-pull type inflation as people begin to buy all the things they could not buy for the last year and a half. I think some of that money, maybe a lot, gets spent on dinners and vacations which are not by themselves particularly inflationary.
To the extent that inflation affects asset prices like homes it is positive for our bonds because it translates into enhanced tax revenues. There are also deflationary forces at work from technology raising productivity and from sending manufacturing as well as phone banks offshore which may offset increases. However, money supply has always been a key factor when analyzing inflation and it has rarely been more abundant. If you add digital currencies to the equation, it’s off the charts. GDP in the U.S. has
already returned to where it was pre-pandemic and there are still 8 million Americans unemployed. Imagine the stimulus when those people go back to work; if they do. Many wages are indexed to cost of living and once this gets reported, it is largely automatic. We have the unusual challenge of high unemployment and scarcity of candidates for jobs simultaneously. This is a first but it serves to put even more pressure on wage increases. Companies are already responding by cutting salaries for stay-at-home employees and reducing office space. To add to these concerns, the Federal Reserve has indicated that they wish to cut back on their purchases which has in the past temporarily lead to higher rates however, this is probably not an option any time soon. Rate increases by the Fed are likely at least a year away.
All this said, I have no doubt that the cost of living is going up. It’s already in evidence almost everywhere from the tax man to the showroom to the grocery store. Once they go up, prices seldom go back down. For fixed income investors a little increase in interest earnings might be welcome. But here is the reason why interest rates will not be going up precipitously; if they do, interest costs alone would consume the entire federal budget and the government could not pay its obligations. This has been true for quite a while, but in today’s world every time interest rates start sneaking up the Federal Reserve and U.S. Treasury intervene at some predetermined price point. By doing so, they change the direction of the trend. In years past, the Federal Reserve controlled only the short end of the market, however now its influence is across the board.
Financial markets may force a little recalculation of returns based on inflation expectations but it will be limited. Colorado BondShares experienced a little volatility in the first quarter 2021 when bond investors first spotted inflation on the horizon and attempted to improve returns only to be thwarted by market intervention. Our share price quickly returned to and exceeded pre-pandemic levels. With our profile as it is, largely Colorado-based tax exempt, high cash balances, improving quality, relatively short average maturities and comparatively high yields, we believe any effects of higher interest rates on the Fund will be muted. There appears to be almost insatiable demand for municipal bonds, given the yield differential between tax-exempts and treasuries. As long as that is true, it is hard to visualize significant or long lasting price corrections.
Planning for the future is never an easy task. Given the events of the past year, this has been especially challenging for everyone. Please know that we at Colorado BondShares take our responsibility of caretaking your investments very seriously. We firmly believe the Fund’s past history as well as future prospects equip us with the tools to ultimately prevail even in a higher interest rate environment, if that is what is in store. Thus, we strive to work toward a result that you will find satisfactory. Thank you for your business; your continued confidence means the world to us.
Sincerely,

Fred R. Kelly, Jr.
Portfolio Manager
Officers and Trustees
George N. Donnelly, Chairman of the Board of Trustees, Interim President, Secretary, Treasurer and Trustee
Bruce G. Ely, Trustee
James R. Madden, Trustee
Fred R. Kelly, Jr., Portfolio Manager
Investment Adviser
Freedom Funds Management Company
Transfer, Shareholder Servicing, and
Dividend Disbursing Agent
Freedom Funds Management Company
Distributor
Colorado Financial Service Corporation
Custodian of Portfolio Securities
UMB Bank, N.A.
Independent Registered Public Accounting Firm
Plante & Moran, PLLC
Special Legal Counsel
Kutak Rock LLP
This report is submitted for the general information of the shareholders of Colorado BondShares — A Tax-Exempt Fund. This report must be preceded or accompanied by a Prospectus of the Fund. The prospectus contains information concerning the investment policies and expenses of the portfolio in addition to other pertinent information. Shares of Colorado BondShares — A Tax-Exempt Fund are not deposits or obligations of any bank, are not guaranteed by any bank, are not insured by the FDIC or any other agency, and involve investment risks, including possible loss of the principal amount invested.
Officers and Trustees of the Fund (unaudited)
The following table lists the trustees and officers of the Fund, together with their address, age, positions held with the Fund, the term of each office held and the length of time served in each office, principal business occupations during the past five years and other directorships, if any, held by each trustee and officer. Each trustee and officer has served in that capacity for the Fund continuously since originally elected or appointed. The Board supervises the business activities of the Fund. Each trustee serves as a trustee until termination of the Fund unless the Trustee dies, resigns, retires, or is removed. The Fund’s Statement of Additional Information includes more information about the trustees. Shareholders may call (800) 572-0069 to request a free copy.
Name, Address and Age | Position held with | Principal Occupation | Other Directorships | |||
| Non-Interested Trustees | ||||||
Bruce G. Ely 1200 17th Street, Suite 850 Denver CO 80202 Age: 70 | Trustee since July 2002 | Mr. Ely was a Regional Director for Cutwater Asset Management, a wholly owned subsidiary of MBIA, Inc. until his retirement in September 2013. | None | |||
James R. Madden 1200 17th Street, Suite 850 Denver CO 80202 Age: 77 | Trustee since September 2004 | Mr. Madden has owned Madden Enterprises, a real estate company that owns and leases commercial buildings and real estate, for the past thirty years. He is also a stockholder and director of The Community Bank in western Kansas. He has been a bank director for 25 years. | None | |||
| Interested Trustees* | ||||||
George N. Donnelly 1200 17th Street, Suite 850 Denver CO 80202 Age: 74 | Chairman of the Board of Trustees, Trustee since inception of the Fund in 1987 and Interim President, Secretary and Treasurer of the Fund since September 26, 2008 | Mr. Donnelly was a Senior Regional Vice President for Phoenix Life Insurance Company until his retirement in January 2010. | None | |||
*George N. Donnelly is an “interested person” of the Fund as defined in the Investment Company Act of 1940 (the “1940 Act”) by virtue of his position as both an officer and a trustee of the Fund as described in the table above. None of the trustees nor the officers of the Fund have any positions with the Investment Adviser, the principal underwriter of the Fund, the distribution agent of the Fund, the service agent of the Fund or the custodian of the Fund, or any affiliates thereof. There is no family relationship between any officers and trustees of the Fund.
1
FUND EXPENSES (unaudited)
The following examples are intended to help you understand the ongoing costs (in dollars) of investing in the Fund and compare these costs with those of other mutual funds. The examples (actual and hypothetical 5% return) are based on an investment of $1,000 made at the beginning of the period shown and held for the entire period.
As a shareholder of Colorado BondShares — A Tax-Exempt Fund (the “Fund’) you can incur two types of costs:
| • | Sales charges (front loads) on fund purchases and |
| • | Ongoing fund costs, including management fees, administrative services, and other fund expenses. All mutual funds have operating expenses. Operating expenses, which are deducted from the Fund’s gross income, directly reduce the investment return of the Fund. |
Actual Fund Expenses
The first line of the table below provides information about actual account values and actual expenses. You may use the information in this line, together with the amount you invested, to estimate the expenses that you paid over the period. Simply divide your account value by $1,000 (for example, an $8,600 account value divided by $1,000 = 8.6), then multiply the result by the number in the first line under the heading entitled “Expenses Paid During Period” to estimate the expenses you paid on your account during this period.
Hypothetical Example for Comparison Purposes
The second line of the table below provides information about hypothetical account values and hypothetical expenses based on the Fund’s actual expense ratio and an assumed rate of return of 5% per year before expenses, which is not the Fund’s actual return. The hypothetical account values and expenses may not be used to estimate the actual ending account balance or expenses you paid for the period. You may use this information to compare the ongoing cost of investing in the Fund and other funds. To do so, compare this 5% hypothetical example with the 5% hypothetical examples that appear in shareholder reports of other funds.
Six Months Ended March 31, 2021
Colorado BondShares — A Tax- Exempt Fund | Beginning Account Value 10/01/20 | Ending Account Value 03/31/21 | Expenses Paid During Period(1) | ||||||||||||
Based on Actual Fund Return | $ | 1,000.00 | $ | 1039.03 | $ | 3.30 | |||||||||
Based on Hypothetical 5% Annual Return Before Expenses | $ | 1,000.00 | $ | 1,021.75 | $ | 3.28 | |||||||||
| (1) | The expenses shown in this table are equal to the Fund’s annualized expense ratio of 0.65% for semi-annual year ended March 31, 2021, multiplied by the average account value over the period, multiplied by 182/365 to reflect the one-half year period. |
Please note that expenses shown in the table are meant to highlight your ongoing costs only and do not reflect any transactional costs, such as sales charges (loads), redemption fees or exchange fees. Therefore, the second line of the table is useful in comparing ongoing costs only, and will not help you determine the relative total costs of owning different funds. In addition, if transactional costs were included, your costs would have been higher. You can find more information about the Fund’s expenses in the Financial Statements section of this report. For additional information on operating costs, please see the Fund’s prospectus.
2
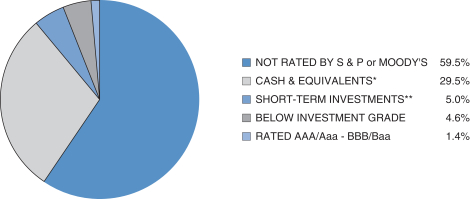
CREDIT QUALITY (unaudited)
Colorado BondShares — A Tax-Exempt Fund
Based on a Percentage of Total Net Assets as of March 31, 2021
SECTOR BREAKDOWN (unaudited)
Colorado BondShares — A Tax-Exempt Fund
Based on a Percentage of Total Net Assets as of March 31, 2021
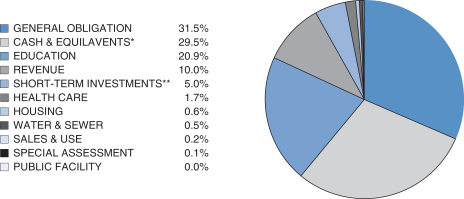
* Cash & equivalents include cash and receivables less liabilities.
** Short-term investments include securities with a maturity date or redemption feature of one year or less, as identified in the Schedule of Investments.
3
Colorado BondShares
A Tax-Exempt Fund
Schedule of Investments
March 31, 2021 (unaudited)
| Colorado Municipal Bonds 53.0% | Maturity | Coupon | Principal | Value | ||||||||||||||
| Colorado 100.0% | ||||||||||||||||||
ABERDEEN METROPOLITAN DISTRICT #1 | 12/1/2035 | 7.50% | $ | 1,600,000 | $ | 476,000 | ||||||||||||
ANTHOLOGY WEST METROPOLITAN DISTRICT #4(g) | 12/15/2037 | 6.00% | 6,440,000 | 6,631,461 | ||||||||||||||
ANTHOLOGY WEST METROPOLITAN DISTRICT #5, SER A | 12/1/2049 | 4.88% | 4,630,000 | 4,877,381 | ||||||||||||||
ANTHOLOGY WEST METROPOLITAN DISTRICT #5, SER B SUBS(g) | 12/15/2049 | 7.63% | 698,000 | 734,757 | ||||||||||||||
BANNING LEWIS RANCH REGIONAL METROPOLITAN DISTRICT | 12/1/2048 | 5.38% | 2,500,000 | 2,678,100 | ||||||||||||||
BANNING LEWIS RANCH REGIONAL METROPOLITAN DISTRICT, SERIES 2018B(g) | 12/15/2041 | 7.75% | 625,000 | 667,425 | ||||||||||||||
BASE VILLAGE METROPOLITAN DISTRICT NO. 2(g) | 12/15/2048 | 6.50% | 3,500,000 | 2,928,800 | ||||||||||||||
BELFORD NORTH METROPOLITAN DISTRICT, SER 2020 A SENIORS | 12/1/2050 | 5.50% | 4,000,000 | 4,311,760 | ||||||||||||||
BELFORD NORTH METROPOLITAN DISTRICT, SER 2020 B SUBORDINATES(g) | 12/15/2050 | 8.50% | 3,475,000 | 3,669,079 | ||||||||||||||
BENNETT CROSSING METROPOLITAN DISTRICT NO. 1 | 12/1/2049 | 6.13% | 6,160,000 | 6,719,513 | ||||||||||||||
BENNETT RANCH METROPOLITAN DISTRICT NO. 1, SUBs(g) | 12/15/2051 | 7.50% | 1,221,000 | 1,235,737 | ||||||||||||||
BENT GRASS METROPOLITAN DISTRICT | 12/1/2049 | 5.25% | 1,690,000 | 1,825,961 | ||||||||||||||
BRADBURN METROPOLITAN DISTRICT NO. 2 JUNIOR LIEN SER C(g) | 12/15/2051 | 7.50% | 3,271,000 | 3,258,734 | ||||||||||||||
BRAMMING FARM METROPOLITAN DISTRICT #1(d) | 12/1/2044 | 6.00% | 1,965,000 | 2,057,807 | ||||||||||||||
BRENNAN METROPOLITIAN DISTRICT – SENIOR 2016A | 12/1/2046 | 5.25% | 1,177,000 | 1,223,668 | ||||||||||||||
BRENNAN METROPOLITAN DISTRICT – SUBORDINATE 2016b(g) | 12/15/2046 | 7.50% | 516,000 | 535,138 | ||||||||||||||
BRIGHTON CROSSING METROPOLITAN DISTRICT #4 – SENIOR 2017A | 12/1/2037 | 5.00% | 525,000 | 555,387 | ||||||||||||||
BRIGHTON CROSSING METROPOLITAN DISTRICT NO. 4, SER 2017A | 12/1/2047 | 5.00% | 2,965,000 | 3,121,671 | ||||||||||||||
BRIGHTON CROSSING METROPOLITAN DISTRICT #4 – SUBORDINATE 2017B(g) | 12/1/2047 | 7.00% | 670,000 | 701,061 | ||||||||||||||
CASTLEVIEW METROPOLITAN DISTRICT NO. 2 | 12/1/2050 | 5.00% | 3,435,000 | 3,675,038 | ||||||||||||||
CHERRY HILLS CITY METROPOLITAN DISTRICT(g) | 12/1/2047 | 5.00% | 1,380,000 | 1,480,423 | ||||||||||||||
CITY CTR WEST RSDL METROPOLITAN DISTRICT NO. 2 | 12/1/2049 | 5.00% | 1,040,000 | 1,110,907 | ||||||||||||||
4
Colorado BondShares
A Tax-Exempt Fund
Schedule of Investments (unaudited) — (Continued)
| Colorado Municipal Bonds (Continued) | Maturity | Coupon | Principal | Value | ||||||||||||||
| Colorado (Continued) | ||||||||||||||||||
CITY CTR WEST RSDL METROPOLITAN DISTRICT NO. 2, SUBORDINATES(g) | 12/15/2049 | 7.75% | $ | 1,425,000 | $ | 1,499,713 | ||||||||||||
CITYSET METROPOLITAN DISTRICT #2 | 12/1/2030 | 3.50% | 6,075,000 | 6,387,680 | ||||||||||||||
CITYSET METROPOLITAN DISTRICT #2 | 12/1/2040 | 4.38% | 8,360,000 | 8,865,780 | ||||||||||||||
CITYSET METROPOLITAN DISTRICT #2 | 12/1/2045 | 4.50% | 3,180,000 | 3,365,140 | ||||||||||||||
COLLIERS HILL METROPOLITAN DISTRICT #2 – SUBORDINATE 2017B(g) | 12/15/2047 | 8.50% | 3,501,000 | 3,654,974 | ||||||||||||||
COLLIERS HILL METROPOLITAN DISTRICT NO. 3, SER A | 12/1/2040 | 5.25% | 8,300,000 | 8,968,482 | ||||||||||||||
COLLIERS HILL METROPOLITAN DISTRICT NO. 3, SER A | 12/1/2048 | 5.50% | 18,250,000 | 19,703,065 | ||||||||||||||
COLORADO CENTRE METROPOLITAN DISTRICT – SERIES B(g)(i) | 1/1/2032 | 0.00% | 6,563,312 | 3,412,922 | ||||||||||||||
COLORADO CENTRE METROPOLITAN DISTRICT – SERIES 1992 P/O(e)(i) | 1/1/2027 | 0.00% | 2,056,083 | 1,868,918 | ||||||||||||||
COLORADO CENTRE METROPOLITAN DISTRICT – SERIES 1992 I/O(f)(i) | 1/1/2027 | 9.00% | 2,032,420 | 1,463,342 | ||||||||||||||
CECFA – SWALLOW ACADEMY CHARTER SCHOOL | 11/15/2027 | 5.35% | 3,365,000 | 3,433,410 | ||||||||||||||
CECFA-NEW VISION CHARTER SCHOOL | 6/1/2025 | 5.38% | 23,135,000 | 23,168,546 | ||||||||||||||
CECFA – GRAND PEAK ACADEMY CHARTER SCHOOL | 7/1/2025 | 5.60% | 20,975,000 | 21,019,677 | ||||||||||||||
CECFA ADDENBROOKE CLASSICAL ACADEMY | 6/1/2027 | 4.50% | 25,285,000 | 26,002,841 | ||||||||||||||
CECFA IMAGINE CHARTER SCHOOL AT FIRESTONE | 6/1/2027 | 4.50% | 17,380,000 | 18,268,118 | ||||||||||||||
CECFA – MONARCH MONTESSORI CHARTER SCHOOL – EXCHANGE | 5/15/2025 | 4.75% | 8,325,000 | 8,393,681 | ||||||||||||||
CECFA – ACADEMY OF ADVANCED LEARNING | 6/1/2027 | 4.38% | 8,420,000 | 8,510,094 | ||||||||||||||
CECFA CHAVEZ/HUERTA PREP ACADEMY | 7/1/2027 | 4.38% | 36,525,000 | 37,063,013 | ||||||||||||||
CECFA SWALLOWS CHARTER ACADEMY | 11/15/2027 | 4.38% | 6,560,000 | 6,570,955 | ||||||||||||||
CECFA VANGUARD CLASSICAL SCHOOL, SER A | 7/1/2027 | 4.38% | 24,500,000 | 24,534,790 | ||||||||||||||
COLORADO HOUSING & FINANCE AUTHORITY(a) | 12/1/2013 | 0.00% | 3,755,000 | 3,755,000 | ||||||||||||||
CHFA – CASEY’S POND SENIOR LIVING(l) | 6/1/2032 | 0.00% | 8,110,000 | 4,460,500 | ||||||||||||||
CHFA – CASEY’S POND SENIOR LIVING(l) | 6/1/2042 | 0.00% | 10,665,000 | 5,865,750 | ||||||||||||||
CHFA – CASEY’S POND SENIOR LIVING(l) | 6/1/2047 | 0.00% | 8,600,000 | 4,730,000 | ||||||||||||||
COLORADO INTERNATIONAL CENTER METROPOLITAN DISTRICT #3 | 12/1/2031 | 4.63% | 626,000 | 649,901 | ||||||||||||||
CONIFER METROPOLITAN DISTRICT | 12/1/2030 | 0.00% | 10,000,000 | 4,000,000 | ||||||||||||||
CONIFER METROPOLITAN DISTRICT | 12/1/2032 | 0.00% | 1,450,000 | 580,000 | ||||||||||||||
5
Colorado BondShares
A Tax-Exempt Fund
Schedule of Investments (unaudited) — (Continued)
| Colorado Municipal Bonds (Continued) | Maturity | Coupon | Principal | Value | ||||||||||||||
| Colorado (Continued) | ||||||||||||||||||
CONIFER METROPOLITAN DISTRICT | 12/1/2033 | 0.00% | $ | 1,550,000 | $ | 620,000 | ||||||||||||
CONSTITUTION HEIGHTS METROPOLITAN DISTRICT | 12/1/2049 | 5.00% | 1,765,000 | 1,913,366 | ||||||||||||||
COPPERLEAF METROPOLITAN DISTRICT #3 | 12/1/2037 | 5.00% | 1,000,000 | 1,053,870 | ||||||||||||||
COUNTRY CLUB HIGHLANDS METROPOLITAN DISTRICT | 12/1/2037 | 7.25% | 1,030,000 | 947,600 | ||||||||||||||
CUCHARES RANCH METROPOLITAN DISTRICT | 12/1/2045 | 5.00% | 2,039,000 | 2,116,992 | ||||||||||||||
DACONO URBAN RENEWAL AUTHORITY(g) | 12/1/2039 | 6.25% | 4,013,000 | 4,259,278 | ||||||||||||||
DENVER INTL BUSINESS CTR METROPOLITAN DISTRICT NO. 1 – SERIES 2019B SUB(g) | 12/1/2048 | 6.00% | 4,585,000 | 4,962,712 | ||||||||||||||
DENVER WEST PROMENADE METROPOLITAN DISTRICT | 12/1/2031 | 5.13% | 500,000 | 519,555 | ||||||||||||||
DENVER WEST PROMENADE METROPOLITAN DISTRICT | 12/15/2046 | 6.00% | 500,000 | 514,175 | ||||||||||||||
UNITED W & S – EAST CHERRY CREEK(c) | 11/15/2023 | 5.00% | 2,269,000 | 2,274,287 | ||||||||||||||
ELBERT & HWY 86 COML METROPOLITAN DISTRICT | 12/1/2032 | 7.50% | 4,500,000 | 4,050,000 | ||||||||||||||
ERIE FARM METROPOLITAN DISTRICT – SERIES 2016A | 12/1/2045 | 5.50% | 2,000,000 | 2,080,560 | ||||||||||||||
ERIE HIGHLANDS METROPOLITAN DISTRICT NO2, SER 2018A | 12/1/2048 | 5.25% | 6,000,000 | 6,378,780 | ||||||||||||||
ERIE HIGHLANDS METROPOLITAN DISTRICT NO 2, SER 2018B SUBORDINATES(g) | 12/15/2048 | 7.63% | 1,819,000 | 1,920,609 | ||||||||||||||
FITZSIMONS VILLAGE METROPOLITAN DISTRICT NO. 1, SER B SUBS(g) | 12/15/2049 | 7.00% | 611,000 | 636,247 | ||||||||||||||
FLATIRON MEADOWS METROPOLITAN DISTRICT | 12/1/2046 | 5.13% | 2,000,000 | 2,076,840 | ||||||||||||||
FLYING HORSE METROPOLITAN DISTRICT NO. 2 SER 2020 SUBS(g) | 12/15/2050 | 7.25% | 15,405,000 | 16,260,594 | ||||||||||||||
FLYING HORSE METROPOLITAN DISTRICT NO 3(g) | 12/1/2049 | 6.00% | 2,965,000 | 3,145,361 | ||||||||||||||
FOREST TRACE METROPOLITAN DISTRICT #3 – SUBORDINATE 2016B(g) | 12/15/2046 | 7.25% | 683,000 | 736,937 | ||||||||||||||
FORT LUPTON GOLF COURSE(a) | 12/15/2037 | 0.00% | 620,000 | 6,200 | ||||||||||||||
GREAT WESTERN PARK METROPOLITAN DISTRICT #2 – SENIOR 2016A | 12/1/2026 | 4.00% | 556,000 | 577,223 | ||||||||||||||
GREAT WESTERN PARK METROPOLITAN DISTRICT #2 – SUBORDINATE 2016B(g) | 12/15/2046 | 7.25% | 775,000 | 802,985 | ||||||||||||||
GREEN GABLES METROPOLITAN DISTRICT #1 – SENIOR 2016A | 12/1/2046 | 5.30% | 1,241,000 | 1,317,123 | ||||||||||||||
6
Colorado BondShares
A Tax-Exempt Fund
Schedule of Investments (unaudited) — (Continued)
| Colorado Municipal Bonds (Continued) | Maturity | Coupon | Principal | Value | ||||||||||||||
| Colorado (Continued) | ||||||||||||||||||
GREEN GABLES METROPOLITAN DISTRICT #1 – SUBORDINATE 2016B(g) | 12/15/2046 | 7.75% | $ | 740,000 | $ | 799,022 | ||||||||||||
GREEN GABLES METROPOLITAN DISTRICT NO. 2 SERIES 2018B SUBORDINATE(g) | 12/15/2048 | 8.25% | 1,689,000 | 1,789,394 | ||||||||||||||
GREEN VALLEY RANCH EAST METROPOLITAN DISTRICT NO. 6 | 12/1/2050 | 5.88% | 3,325,000 | 3,633,992 | ||||||||||||||
HIGHLANDS METROPOLITAN DISTRICT #2 – SENIOR 2016A | 12/1/2046 | 5.13% | 1,960,000 | 2,037,126 | ||||||||||||||
HIGHLANDS METROPOLITAN DISTRICT #2 – SUBORDINATE 2016B(g) | 12/15/2046 | 7.50% | 1,269,000 | 1,316,664 | ||||||||||||||
HIGHLANDS-MEAD METROPOLITAN DISTRICT | 12/1/2050 | 5.13% | 1,395,000 | 1,499,472 | ||||||||||||||
HUNTER’S OVERLOOK METROPOLITAN DISTRICT NO. 5, SUBS(g) | 12/15/2049 | 8.50% | 1,827,000 | 1,931,742 | ||||||||||||||
HYLAND VILLAGE METROPOLITAN DISTRICT | 12/1/2027 | 8.00% | 4,770,000 | 2,385,000 | ||||||||||||||
INDY OAK TOD METROPOLITAN DISTRICT SER A | 12/1/2050 | 5.50% | 1,075,000 | 1,177,856 | ||||||||||||||
INDY OAK TOD METROPOLITAN DISTRICT SER B(g) | 12/15/2050 | 8.00% | 736,000 | 798,258 | ||||||||||||||
INSPIRATION METROPOLITAN DISTRICT, SER D | 12/15/2051 | 7.50% | 2,487,000 | 2,486,179 | ||||||||||||||
IRON WORKS VILLAGE METROPOLITAN DISTRICT | 12/1/2048 | 5.88% | 1,500,000 | 1,618,155 | ||||||||||||||
JEFFERSON CENTER METROPOLITAN DISTRICT NO. 1 SUB SER B(g) | 12/15/2050 | 5.75% | 7,500,000 | 7,995,900 | ||||||||||||||
KARL’S FARM METROPOLITAN DISTRICT NO. 2, SER A | 12/1/2040 | 5.38% | 515,000 | 560,423 | ||||||||||||||
KARL’S FARM METROPOLITAN DISTRICT NO. 2, SER A | 12/1/2050 | 5.63% | 1,415,000 | 1,534,723 | ||||||||||||||
LEWIS POINTE METROPOLITAN DISTRICT – SENIOR 2015A | 12/1/2044 | 6.00% | 2,590,000 | 2,590,414 | ||||||||||||||
LEWIS POINTE METROPOLITAN DISTRICT – JUNIOR LIEN 2017C(g) | 12/15/2047 | 9.00% | 536,000 | 536,129 | ||||||||||||||
LEYDEN ROCK METROPOLITAN DISTRICT – SENIOR 2016A | 12/1/2025 | 4.00% | 500,000 | 520,970 | ||||||||||||||
LEYDEN ROCK METROPOLITAN DISTRICT – SENIOR 2016A | 12/1/2033 | 4.38% | 2,905,000 | 3,018,905 | ||||||||||||||
LEYDEN ROCK METROPOLITAN DISTRICT – SENIOR 2016A | 12/1/2045 | 5.00% | 1,525,000 | 1,585,482 | ||||||||||||||
LEYDEN ROCK METROPOLITAN DISTRICT – SUBORDINATE 2016B(g) | 12/15/2045 | 7.25% | 1,195,000 | 1,241,378 | ||||||||||||||
LEYDEN ROCK METROPOLITAN DISTRICT #10 – JUNIOR LIEN 2017C(g) | 12/15/2049 | 10.75% | 1,025,000 | 1,057,841 | ||||||||||||||
7
Colorado BondShares
A Tax-Exempt Fund
Schedule of Investments (unaudited) — (Continued)
| Colorado Municipal Bonds (Continued) | Maturity | Coupon | Principal | Value | ||||||||||||||
| Colorado (Continued) | ||||||||||||||||||
LINCOLN MEADOWS METROPOLITAN DISTRICT | 12/1/2031 | 8.00% | $ | 7,150,000 | $ | 7,590,583 | ||||||||||||
LITTLETON VILLAGE METROPOLITAN DISTRICT #2 | 12/1/2045 | 5.38% | 1,670,000 | 1,721,904 | ||||||||||||||
LITTLETON VILLAGE METROPOLITAN DISTRICT NO 2, SERIES 2018B SUBORDINATES(g) | 12/15/2028 | 7.63% | 1,140,000 | 1,219,378 | ||||||||||||||
MARIN METROPOLITAN DISTRICT(a)(j) | 12/1/2028 | 0.00% | 17,485,000 | 1,573,650 | ||||||||||||||
MARVELLA METROPOLITAN DISTRICT – SENIOR 2016A | 12/1/2046 | 5.13% | 1,393,000 | 1,477,332 | ||||||||||||||
MAYFIELD METROPOLITAN DISTRICT, SERIES 2020 A | 12/1/2050 | 5.75% | 1,190,000 | 1,306,727 | ||||||||||||||
MAYFIELD METROPOLITAN DISTRICT, SERIES 2020 B SUBS(g) | 12/15/2050 | 8.25% | 622,000 | 673,533 | ||||||||||||||
MEADOWS METROPOLITAN DISTRICT #1(k) | 6/1/2029 | 8.00% | 30,730,000 | 33,715,727 | ||||||||||||||
MEADOWS METROPOLITAN DISTRICT #2(k) | 6/1/2029 | 8.00% | 23,830,000 | 26,145,323 | ||||||||||||||
MEADOWS METROPOLITAN DISTRICT #7(k) | 6/1/2029 | 8.00% | 15,440,000 | 16,940,150 | ||||||||||||||
MEADOWLARK METROPOLITAN DISTRICT SER A | 12/1/2040 | 4.88% | 520,000 | 556,488 | ||||||||||||||
MEADOWLARK METROPOLITAN DISTRICT SER A | 12/1/2050 | 5.13% | 750,000 | 806,168 | ||||||||||||||
MIDCITIES METROPOLITAN DISTRICT #2 – SUBORDINATE 2016B(g) | 12/15/2046 | 7.75% | 1,919,000 | 1,990,636 | ||||||||||||||
MIRABELLE METROPOLITAN DISTRICT NO. 2 SER 2020A SENIORS | 12/1/2049 | 5.00% | 1,250,000 | 1,336,775 | ||||||||||||||
MIRABELLE METROPOLITAN DISTRICT NO. 2, SER B SUBS(g) | 12/15/2049 | 7.38% | 1,473,000 | 1,541,819 | ||||||||||||||
MOUNT CARBON METROPOLITAN DISTRICT – SERIES 2004A(g) | 6/1/2043 | 7.00% | 197,916 | 197,926 | ||||||||||||||
MOUNT CARBON METROPOLITAN DISTRICT – SERIES 2004B(g) | 6/1/2043 | 7.00% | 1,410,000 | 1,410,071 | ||||||||||||||
MOUNT CARBON METROPOLITAN DISTRICT – SERIES 2004C(e)(g) | 6/1/2043 | 0.00% | 565,000 | 124,300 | ||||||||||||||
MOUNTAIN SHADOWS METROPOLITAN DISTRICT – SUBORDINATE 2016B(g) | 12/15/2046 | 7.50% | 1,800,000 | 1,866,402 | ||||||||||||||
MOUNTAIN SHADOWS METROPOLITAN DISTRICT – SUBORDINATE 2018C-1(g) | 12/15/2040 | 10.00% | 1,994,000 | 2,062,813 | ||||||||||||||
MURPHY CREEK METROPOLITAN DISTRICT #3 | 12/1/2026 | 6.00% | 2,540,000 | 2,540,000 | ||||||||||||||
MURPHY CREEK METROPOLITAN DISTRICT #3 | 12/1/2035 | 6.13% | 1,880,000 | 1,880,000 | ||||||||||||||
NINE MILE METROPOLITAN DISTRICT | 12/1/2030 | 4.63% | 1,125,000 | 1,224,698 | ||||||||||||||
NINE MILE METROPOLITAN DISTRICT | 12/1/2040 | 5.13% | 2,500,000 | 2,732,275 | ||||||||||||||
NORTH PINE VISTAS METROPOLITAN DISTRICT #2 – SENIOR 2016A | 12/1/2046 | 6.75% | 6,735,000 | 5,702,390 | ||||||||||||||
8
Colorado BondShares
A Tax-Exempt Fund
Schedule of Investments (unaudited) — (Continued)
| Colorado Municipal Bonds (Continued) | Maturity | Coupon | Principal | Value | ||||||||||||||
| Colorado (Continued) | ||||||||||||||||||
NORTH PINE VISTAS METROPOLITAN DISTRICT #2 – SUBORDINATE 2016B(g) | 12/15/2046 | 8.50% | $ | 1,810,000 | $ | 1,570,193 | ||||||||||||
NORTH PINE VISTAS METROPOLITAN DISTRICT #3 – SENIOR 2016A | 12/1/2036 | 6.00% | 3,393,000 | 3,523,698 | ||||||||||||||
NORTH PINE VISTAS METROPOLITAN DISTRICT #3 – SUBORDINATE 2016B(g) | 12/15/2046 | 8.25% | 1,188,000 | 1,232,372 | ||||||||||||||
NORTH RANGE METROPOLITAN DISTRICT NO. 3, SER A | 12/1/2040 | 5.00% | 2,000,000 | 2,187,900 | ||||||||||||||
OVERLOOK METROPOLITAN DISTRICT – SENIOR 2016A | 12/1/2046 | 5.50% | 1,500,000 | 1,559,880 | ||||||||||||||
PAINTED PRAIRIE PUBLIC IMPROVEMENT AUTHORITY | 12/1/2029 | 4.00% | 1,000,000 | 1,073,590 | ||||||||||||||
PALISADE METROPOLITAN DISTRICT #2 | 12/1/2031 | 4.38% | 2,229,000 | 2,311,963 | ||||||||||||||
PALISADE PARK NORTH METROPOLITAN DISTRICT #1 – SENIOR 2016A | 12/1/2046 | 5.88% | 2,075,000 | 2,159,764 | ||||||||||||||
PALISADE PARK NORTH METROPOLITAN DISTRICT #1 – SUBORDINATE 2016B(g) | 12/15/2046 | 8.00% | 525,000 | 544,887 | ||||||||||||||
PALISADE PARK NORTH METROPOLITAN DISTRICT #2 – SENIOR 2018A | 12/1/2047 | 5.63% | 1,745,000 | 1,870,727 | ||||||||||||||
PARKDALE COMMUNITY AUTHORITY SER A | 12/1/2040 | 5.00% | 2,140,000 | 2,307,605 | ||||||||||||||
PARKDALE COMMUNITY AUTHORITY SER A | 12/1/2050 | 5.25% | 3,335,000 | 3,593,296 | ||||||||||||||
PARKDALE COMMUNITY AUTHORITY SUB SER B(g) | 12/15/2050 | 7.75% | 2,424,000 | 2,567,404 | ||||||||||||||
PARKER AUTOMOTIVE METROPOLITAN DISTRICT | 12/1/2045 | 5.00% | 1,983,000 | 2,133,272 | ||||||||||||||
PARKER AUTOMOTIVE METROPOLITAN DISTRICT SUB SERIES 2018B(g) | 12/15/2032 | 8.00% | 3,785,000 | 4,023,039 | ||||||||||||||
PIONEER CMNTY AUTH BRD | 12/15/2050 | 6.75% | 24,592,000 | 25,661,998 | ||||||||||||||
PIONEER METROPOLITAN DISTRICT #3(g) | 12/1/2046 | 6.50% | 3,183,000 | 3,297,174 | ||||||||||||||
THE PLAZA METROPOLITAN DISTRICT #1 | 12/1/2022 | 5.00% | 500,000 | 525,870 | ||||||||||||||
THE PLAZA METROPOLITAN DISTRICT #1 | 12/1/2040 | 5.00% | 7,850,000 | 8,079,691 | ||||||||||||||
PROMENADE AT CASTLE ROCK METROPOLITAN DISTRICT #1 – SERIES A | 12/1/2025 | 5.13% | 500,000 | 516,050 | ||||||||||||||
PROMENADE AT CASTLE ROCK METROPOLITAN DISTRICT NO. 1 | 12/1/2039 | 5.75% | 7,100,000 | 7,325,283 | ||||||||||||||
PUBLIC FINANCE AUTH CHARTER SCHOOL-COLORADO SPRINGS | 7/1/2029 | 4.95% | 6,620,000 | 6,703,412 | ||||||||||||||
PUBLIC FINANCE AUTH CHARTER SCHOOL-FT COLLINS, A | 7/1/2029 | 4.95% | 21,320,000 | 21,588,632 | ||||||||||||||
9
Colorado BondShares
A Tax-Exempt Fund
Schedule of Investments (unaudited) — (Continued)
| Colorado Municipal Bonds (Continued) | Maturity | Coupon | Principal | Value | ||||||||||||||
| Colorado (Continued) | ||||||||||||||||||
PUBLIC FINANCE AUTH CHARTER SCHOOL-DOUGLAS CNTY | 7/1/2029 | 4.95% | $ | 14,620,000 | $ | 14,804,212 | ||||||||||||
PUBLIC FINANCE AUTH CHARTER SCHOOL-DOUGLAS CNTY TXBL | 7/1/2026 | 4.95% | 3,310,000 | 3,365,840 | ||||||||||||||
PUBLIC FINANCE AUTH CHARTER SCHOOL-FT COLLINS | 7/1/2029 | 4.95% | 10,720,000 | 10,855,072 | ||||||||||||||
PUBLIC FINANCE AUTH CHARTER SCHOOL-WINDSOR | 7/1/2029 | 4.95% | 13,210,000 | 13,376,446 | ||||||||||||||
PFA AURORA CHARTER SCHOOL BC PROJ, SER B – FED EXEMPT/STATE TAXABLE | 7/1/2029 | 4.75% | 18,365,000 | 18,394,568 | ||||||||||||||
PUBLIC FINANCE AUTHORITY – COLORADO SKIES ACADEMY CHARTER SCHOOL, SER A | 7/1/2025 | 5.63% | 10,290,000 | 10,304,509 | ||||||||||||||
PFA DOUGLAS COUNTY CHARTER SCHOOL BC, SER 2020A | 7/1/2029 | 4.65% | 30,830,000 | 30,840,791 | ||||||||||||||
PUBLIC FINANCE AUTHORITY – MONUMENT ACADEMY SER. 2019A | 6/1/2026 | 5.00% | 28,725,000 | 29,015,123 | ||||||||||||||
RAVENNA METROPOLITAN DISTRICT CONV CABS – SUBORDINATE SERIES 2017B(d) | 12/15/2026 | 7.50% | 8,000,000 | 8,355,840 | ||||||||||||||
REATA RIDGE VILLAGE METROPOLITAN DISTRICT NO. 2 | 12/1/2049 | 5.00% | 900,000 | 964,197 | ||||||||||||||
RENDEZVOUS METROPOLITAN DISTRICT NO 4 – SUBORDINATE, SERIES 2018B(g) | 10/15/2048 | 8.00% | 1,189,000 | 1,252,302 | ||||||||||||||
REX RANCH METROPOLITAN DISTRICT – SUBORDINATE 2018B(g) | 12/15/2047 | 7.88% | 445,000 | 471,971 | ||||||||||||||
RIVERDALE PEAKS II METROPOLITAN DISTRICT | 12/1/2025 | 6.40% | 930,000 | 465,000 | ||||||||||||||
RIVERDALE PEAKS II METROPOLITAN DISTRICT | 12/1/2035 | 6.50% | 1,135,000 | 567,500 | ||||||||||||||
ROSE HILL ACRES METROPOLITAN DISTRICT, SER A | 12/1/2050 | 5.00% | 2,990,000 | 3,224,177 | ||||||||||||||
ROSE HILL ACRES METROPOLITAN DISTRICT, SER B SUB(g) | 12/15/2050 | 8.75% | 910,000 | 959,659 | ||||||||||||||
ROUTT CNTY LID – SERIES 2004A | 8/1/2024 | 6.50% | 68,000 | 68,597 | ||||||||||||||
ROXBOROUGH VILLAGE METROPOLITAN DISTRICT – SERIES 1993B I/O(f)(i) | 12/31/2042 | 0.00% | 242,645 | 26,691 | ||||||||||||||
SABELL METROPOLITAN DISTRICT, SER 2020 B3 SUBS(g) | 12/15/2050 | 8.25% | 605,000 | 634,524 | ||||||||||||||
SIERRA RIDGE METROPOLITAN DISTRICT #2 – SENIOR SERIES 2016A | 12/1/2031 | 4.50% | 1,000,000 | 1,038,710 | ||||||||||||||
10
Colorado BondShares
A Tax-Exempt Fund
Schedule of Investments (unaudited) — (Continued)
| Colorado Municipal Bonds (Continued) | Maturity | Coupon | Principal | Value | ||||||||||||||
| Colorado (Continued) | ||||||||||||||||||
SIERRA RIDGE METROPOLITAN DISTRICT #2 – SUBORDINATE SERIES 2016B(g) | 12/15/2046 | 7.63% | $ | 1,500,000 | $ | 1,557,570 | ||||||||||||
64TH AVENUE ARI AUTHORITY(g) | 12/1/2043 | 6.50% | 5,000,000 | 5,379,050 | ||||||||||||||
SOLARIS METROPOLITIAN DISTRICT #3 – SUBORDINATE SERIES 2016B(g) | 12/15/2046 | 7.00% | 1,000,000 | 1,040,490 | ||||||||||||||
SOLITUDE METROPOLITAN DISTRICT(j) | 12/1/2026 | 7.00% | 3,520,000 | 2,288,000 | ||||||||||||||
SPRING VALLEY METROPOLITAN DISTRICT NO. 4 | 12/1/2040 | 5.00% | 1,410,000 | 1,523,745 | ||||||||||||||
SPRING VALLEY METROPOLITAN DISTRICT NO. 4 | 12/1/2050 | 5.13% | 1,775,000 | 1,910,859 | ||||||||||||||
SPRING VALLEY METROPOLITAN DISTRICT NO. 4 SUB(g) | 12/15/2050 | 7.63% | 2,811,000 | 2,973,757 | ||||||||||||||
ST VRAIN LAKES METROPOLITAN DISTRICT #2 – SENIOR SERIES 2017A | 12/1/2037 | 5.00% | 1,500,000 | 1,601,535 | ||||||||||||||
ST VRAIN LAKES METROPOLITAN DISTRICT #2 – SUBORDINATE SERIES 2017B(g) | 12/15/2047 | 7.63% | 1,083,000 | 1,154,196 | ||||||||||||||
STC METROPOLITAN DISTRICT NO. 2, SER A | 12/1/2029 | 4.00% | 1,615,000 | 1,735,641 | ||||||||||||||
STC METROPOLITAN DISTRICT NO. 2 | 12/1/2038 | 5.00% | 8,160,000 | 8,856,782 | ||||||||||||||
STC METROPOLITAN DISTRICT, SER 2019 SUBS(g) | 12/15/2049 | 8.00% | 3,954,000 | 4,173,407 | ||||||||||||||
STETSON RIDGE METROPOLITAN DISTRICT NO. 3, SUBs(g) | 12/15/2042 | 7.50% | 345,000 | 365,748 | ||||||||||||||
STONE RIDGE METROPOLITAN DISTRICT #2 | 12/1/2031 | 0.00% | 11,896,000 | 1,903,360 | ||||||||||||||
TABLE MOUNTAIN METROPOLITAN DISTRICT – SENIOR SERIES 2016A | 12/1/2045 | 5.25% | 1,589,000 | 1,652,195 | ||||||||||||||
TABLE MOUNTAIN METROPOLITAN DISTRICT – SUBORDINATE SERIES 2016B(g) | 12/15/2045 | 7.75% | 570,000 | 615,463 | ||||||||||||||
TALLYN’S REACH METROPOLITAN DISTRICT #3 | 11/1/2038 | 5.13% | 2,070,000 | 2,316,972 | ||||||||||||||
THOMPSON CROSSING METROPOLITAN DISTRICT NO #4 | 12/1/2039 | 5.00% | 1,410,000 | 1,528,722 | ||||||||||||||
THOMPSON CROSSING METROPOLITAN DISTRICT NO. 4 | 12/1/2049 | 5.00% | 1,315,000 | 1,405,761 | ||||||||||||||
TRAILS AT CROWFOOT METROPOLITAN DISTRICT NO 3(g) | 12/15/2049 | 9.00% | 3,135,000 | 3,305,325 | ||||||||||||||
VDW METROPOLITAN DISTRICT #2 – SUBORDINATE SERIES 2016B(g) | 12/15/2045 | 7.25% | 1,459,000 | 1,516,149 | ||||||||||||||
VALAGUA METROPOLITAN DISTRICT | 12/1/2037 | 0.00% | 11,500,000 | 2,196,500 | ||||||||||||||
VILLAS EASTLAKE RESERVOIR METROPOLITAN DISTRICT – SUBORDINATE SERIES 2016B(g) | 12/15/2046 | 8.00% | 355,000 | 368,302 | ||||||||||||||
WESTCREEK METROPOLITAN DISTRICT NO 2 | 12/1/2048 | 5.38% | 1,300,000 | 1,394,978 | ||||||||||||||
WESTOWN METROPOLITAN DISTRICT – SENIOR SERIES 2017A | 12/1/2047 | 5.00% | 1,392,000 | 1,487,937 | ||||||||||||||
11
Colorado BondShares
A Tax-Exempt Fund
Schedule of Investments (unaudited) — (Continued)
| Colorado Municipal Bonds (Continued) | Maturity | Coupon | Principal | Value | ||||||||||||||
| Colorado (Continued) | ||||||||||||||||||
WHISPERING PINES METROPOLITAN DISTRICT #1 – SENIOR SERIES 2017A | 12/1/2037 | 5.00% | $ | 2,000,000 | $ | 2,110,500 | ||||||||||||
WHITE BUFFALO METROPOLITAN DISTRICT, NO. 3 | 12/1/2050 | 5.50% | 2,780,000 | 3,018,885 | ||||||||||||||
WILD PLUM METROPOLITAN DISTRICT, SER A | 12/1/2049 | 5.00% | 595,000 | 642,255 | ||||||||||||||
WILLOW SPRINGS METROPOLITAN DISTRICT, SER 2019B SUBORDINATES(g) | 12/15/2049 | 7.75% | 650,000 | 683,930 | ||||||||||||||
WOODMEN HEIGHTS METROPOLITAN DISTRICT NO. 2 SER B-2 | 12/15/2040 | 7.50% | 3,358,000 | 3,540,339 | ||||||||||||||
WYNDHAM HILL METROPOLITAN DISTRICT NO. 2 2020B SUBS(g) | 12/15/2049 | 7.63% | 9,600,000 | 10,372,992 | ||||||||||||||
|
|
|
| |||||||||||||||
Colorado (amortized cost $848,487,226) | 901,044,376 | 864,260,255 | ||||||||||||||||
|
|
|
| |||||||||||||||
Colorado Municipal Bonds | $ | 901,044,376 | $ | 864,260,255 | ||||||||||||||
|
|
|
| |||||||||||||||
| Other Municipal Bonds 7.6% | ||||||||||||||||||
| South Dakota 75.3% | ||||||||||||||||||
FLANDREAU SANTEE SIOUX TRIBE | 1/1/2036 | 5.75% | $ | 6,055,000 | $ | 5,452,467 | ||||||||||||
FLANDREAU SANTEE SIOUX TRIBE | 1/1/2026 | 5.00% | 2,765,000 | 2,685,230 | ||||||||||||||
FLANDREAU SANTEE SIOUX TRIBE | 1/1/2031 | 5.50% | 3,565,000 | 3,317,482 | ||||||||||||||
FLANDREAU SANTEE SIOUX TRIBE TE SERIES 2018B | 1/1/2038 | 6.00% | 6,120,000 | 6,011,676 | ||||||||||||||
FLANDREAU SANTEE SIOUX TRIBE TE SERIES 2018C | 1/1/2038 | 6.00% | 5,450,000 | 5,353,535 | ||||||||||||||
FLANDREAU SANTEE SIOUX TRIBE TAXABLE SERIES 2018A | 1/1/2023 | 8.28% | 875,000 | 882,088 | ||||||||||||||
FLANDREAU SANTEE SIOUX TRIBE TAXABLE SERIES 2018A | 1/1/2024 | 8.28% | 950,000 | 961,296 | ||||||||||||||
FLANDREAU SANTEE SIOUX TRIBE TAXABLE SERIES 2018A | 1/1/2025 | 8.28% | 1,030,000 | 1,041,196 | ||||||||||||||
FLANDREAU SANTEE SIOUX TRIBE TAXABLE SERIES 2018A | 1/1/2026 | 8.28% | 1,115,000 | 1,126,351 | ||||||||||||||
FLANDREAU SANTEE SIOUX TRIBE TAXABLE SERIES 2018A | 1/1/2027 | 8.28% | 1,205,000 | 1,219,074 | ||||||||||||||
FLANDREAU SANTEE SIOUX TRIBE TAXABLE SERIES 2018A | 1/1/2028 | 8.28% | 1,305,000 | 1,318,246 | ||||||||||||||
FLANDREAU SANTEE SIOUX TRIBE TAXABLE SERIES 2018A | 1/1/2033 | 8.28% | 8,670,000 | 8,695,750 | ||||||||||||||
12
Colorado BondShares
A Tax-Exempt Fund
Schedule of Investments (unaudited) — (Continued)
| Other Municipal Bonds (Continued) | Maturity | Coupon | Principal | Value | ||||||||||||||
| South Dakota (Continued) | ||||||||||||||||||
FLANDREAU SANTEE SIOUX TRIBE – TRIBAL HEALTHCARE | 7/1/2025 | 5.75% | $ | 740,000 | $ | 743,789 | ||||||||||||
FLANDREAU SANTEE SIOUX TRIBE – TRIBAL HEALTHCARE | 7/1/2026 | 5.75% | 785,000 | 789,851 | ||||||||||||||
FLANDREAU SANTEE SIOUX TRIBE – TRIBAL HEALTHCARE | 7/1/2027 | 5.75% | 830,000 | 835,968 | ||||||||||||||
FLANDREAU SANTEE SIOUX TRIBE – TRIBAL HEALTHCARE | 7/1/2028 | 5.75% | 875,000 | 882,123 | ||||||||||||||
FLANDREAU SANTEE SIOUX TRIBE – TRIBAL HEALTHCARE | 7/1/2029 | 5.75% | 930,000 | 938,407 | ||||||||||||||
FLANDREAU SANTEE SIOUX TRIBE – TRIBAL HEALTHCARE | 7/1/2030 | 5.75% | 980,000 | 989,692 | ||||||||||||||
FLANDREAU SANTEE SIOUX TRIBE – TRIBAL HEALTHCARE | 7/1/2031 | 5.75% | 1,040,000 | 1,050,286 | ||||||||||||||
FLANDREAU SANTEE SIOUX TRIBE – TRIBAL HEALTHCARE | 7/1/2032 | 5.75% | 1,095,000 | 1,105,830 | ||||||||||||||
FLANDREAU SANTEE SIOUX TRIBE – TRIBAL HEALTHCARE | 7/1/2033 | 5.75% | 1,160,000 | 1,171,472 | ||||||||||||||
FLANDREAU SANTEE SIOUX TRIBE – TRIBAL HEALTHCARE | 7/1/2034 | 5.75% | 1,225,000 | 1,237,115 | ||||||||||||||
FLANDREAU SANTEE SIOUX TRIBE – TRIBAL HEALTHCARE | 7/1/2035 | 5.75% | 1,300,000 | 1,312,857 | ||||||||||||||
FLANDREAU SANTEE SIOUX TRIBE – TRIBAL HEALTHCARE | 7/1/2040 | 6.00% | 7,730,000 | 7,805,522 | ||||||||||||||
FLANDREAU SANTEE SIOUX TRIBE – TRIBAL HEALTHCARE | 7/1/2045 | 6.25% | 10,395,000 | 10,495,416 | ||||||||||||||
LOWER BRULE SIOUX TRIBE | 3/1/2025 | 5.88% | 1,210,000 | 1,154,183 | ||||||||||||||
OGLALA SIOUX TRIBE OF PINE RIDGE | 10/1/2022 | 5.00% | 750,000 | 750,765 | ||||||||||||||
OGLALA SIOUX TRIBE, SERIES 2018 | 7/1/2028 | 5.50% | 3,300,000 | 3,356,826 | ||||||||||||||
OGLALA SIOUX TRIBE, SERIES 2018 | 7/1/2037 | 6.00% | 9,270,000 | 9,136,790 | ||||||||||||||
OGLALA SIOUX TRIBE, SERIES 2018B | 9/1/2041 | 6.50% | 6,360,000 | 6,437,592 | ||||||||||||||
OGLALA SIOUX TRIBE OF PINE RIDGE | 10/1/2024 | 5.50% | 1,985,000 | 1,986,092 | ||||||||||||||
OGLALA SIOUX TRIBE, SERIES 2018C | 10/1/2026 | 8.00% | 800,000 | 854,464 | ||||||||||||||
OGLALA SIOUX TRIBE, SER 2019A | 10/1/2027 | 4.50% | 2,370,000 | 2,338,526 | ||||||||||||||
|
|
|
| |||||||||||||||
South Dakota (amortized cost $94,222,704) | 94,235,000 | 93,437,955 | ||||||||||||||||
|
|
|
| |||||||||||||||
| Puerto Rico 9.2% | ||||||||||||||||||
COMMONWEALTH OF PUERTO RICO(a) | 7/1/2035 | 8.00% | 2,500,000 | 1,962,500 | ||||||||||||||
13
Colorado BondShares
A Tax-Exempt Fund
Schedule of Investments (unaudited) — (Continued)
| Other Municipal Bonds (Continued) | Maturity | Coupon | Principal | Value | ||||||||||||||
| Puerto Rico (Continued) | ||||||||||||||||||
PUERTO RICO SALES TAX FINANCING CORP RESTRUCTURED SER 2019 A-1 | 7/1/2034 | 4.50% | $ | 277,000 | $ | 298,811 | ||||||||||||
PUERTO RICO SALES TAX FINANCING CORP RESTRUCTURED SER 2019 A-1 | 7/1/2040 | 4.55% | 140,000 | 151,732 | ||||||||||||||
PUERTO RICO SALES TAX FINANCING CORP RESTRUCTURED SER 2019 A-1 | 7/1/2053 | 4.75% | 1,028,000 | 1,116,305 | ||||||||||||||
PUERTO RICO SALES TAX FINANCING CORP RESTRUCTURED SER 2019 A-1 | 7/1/2058 | 5.00% | 2,600,000 | 2,863,068 | ||||||||||||||
PUERTO RICO SALES TAX FINANCING CORP RESTRUCTURED SER 2019 A-1 | 7/1/2024 | 0.00% | 140,000 | 131,397 | ||||||||||||||
PUERTO RICO SALES TAX FINANCING CORP RESTRUCTURED SER 2019 A-1 | 7/1/2027 | 0.00% | 267,000 | 233,913 | ||||||||||||||
PUERTO RICO SALES TAX FINANCING CORP RESTRUCTURED SER 2019 A-1 | 7/1/2029 | 0.00% | 260,000 | 214,128 | ||||||||||||||
PUERTO RICO SALES TAX FINANCING CORP RESTRUCTURED SER 2019 A-1 | 7/1/2031 | 0.00% | 336,000 | 257,154 | ||||||||||||||
PUERTO RICO SALES TAX FINANCING CORP RESTRUCTURED SER 2019 A-1 | 7/1/2033 | 0.00% | 378,000 | 268,312 | ||||||||||||||
PUERTO RICO SALES TAX FINANCING CORP RESTRUCTURED SER 2019 A-1 | 7/1/2046 | 0.00% | 3,597,000 | 1,097,696 | ||||||||||||||
PUERTO RICO SALES TAX FINANCING CORP RESTRUCTURED SER 2019 A-1 | 7/1/2051 | 0.00% | 2,930,000 | 644,893 | ||||||||||||||
PUERTO RICO SALES TAX FING CORP TAX REV DTD 8/1/2019 4.329% SER A-2 7/1/2040 | 7/1/2040 | 4.33% | 1,424,000 | 1,523,281 | ||||||||||||||
PUERTO RICO SALES TAX FING CORP TAX REV DTD 8/1/2019 4.536% SER A-2 7/1/2053 | 7/1/2053 | 4.54% | 43,000 | 46,108 | ||||||||||||||
PUERTO RICO SALES TAX FING CORP TAX REV DTD 8/1/2019 4.784% SER A-2 7/1/2058 | 7/1/2058 | 4.78% | 571,000 | 617,885 | ||||||||||||||
|
|
|
| |||||||||||||||
Puerto Rico (amortized cost $9,582,674) | 16,491,000 | 11,427,184 | ||||||||||||||||
|
|
|
| |||||||||||||||
| Oregon 4.7% | ||||||||||||||||||
MULTNOMAH CITY HOSPITAL FACILITY ODD FELLOWS | 10/1/2023 | 5.45% | 5,815,000 | 5,815,000 | ||||||||||||||
|
|
|
| |||||||||||||||
Oregon (amortized cost $5,815,000) | 5,815,000 | 5,815,000 | ||||||||||||||||
|
|
|
| |||||||||||||||
| Arizona 4.1% | ||||||||||||||||||
HERITAGE ACADEMY CHARTER SCHOOL MARICOPA COUNTY | 7/1/2027 | 5.25% | 5,000,000 | 5,089,650 | ||||||||||||||
|
|
|
| |||||||||||||||
Arizona (amortized cost $5,000,000) | 5,000,000 | 5,089,650 | ||||||||||||||||
|
|
|
| |||||||||||||||
14
Colorado BondShares
A Tax-Exempt Fund
Schedule of Investments (unaudited) — (Continued)
| Other Municipal Bonds (Continued) | Maturity | Coupon | Principal | Value | ||||||||||||||
| California 3.7% | ||||||||||||||||||
FREDDIE MAC (g)(j) | 1/1/2037 | 9.75% | $ | 4,652,347 | $ | 4,652,347 | ||||||||||||
|
|
|
| |||||||||||||||
California (amortized cost $4,652,347) | 4,652,347 | 4,652,347 | ||||||||||||||||
|
|
|
| |||||||||||||||
| Washington 1.8% | ||||||||||||||||||
TACOMA CONSOLIDATED LID | 4/1/2043 | 5.75% | 2,185,000 | 2,204,949 | ||||||||||||||
|
|
|
| |||||||||||||||
Washington (amortized cost $2,045,947) | 2,185,000 | 2,204,949 | ||||||||||||||||
|
|
|
| |||||||||||||||
| Missouri 0.8% | ||||||||||||||||||
KANSAS CITY INDL DEV AUTH | 1/1/2028 | 6.75% | 185,000 | 185,692 | ||||||||||||||
ST LOUIS INDL DEV AUTH SR HSG – SENIOR SERIES 2005A | 5/1/2027 | 6.75% | 843,000 | 833,887 | ||||||||||||||
|
|
|
| |||||||||||||||
Missouri (amortized cost $1,028,000) | 1,028,000 | 1,019,579 | ||||||||||||||||
|
|
|
| |||||||||||||||
| Oklahoma 0.4% | ||||||||||||||||||
HASKELL CNTY PUBLIC FAC. | 4/1/2024 | 5.25% | 450,000 | 465,696 | ||||||||||||||
|
|
|
| |||||||||||||||
Oklahoma (amortized cost $450,000) | 450,000 | 465,696 | ||||||||||||||||
|
|
|
| |||||||||||||||
Other Municipal Bonds | $ | 129,856,347 | $ | 124,112,360 | ||||||||||||||
|
|
|
| |||||||||||||||
| Short-Term Municipal Bonds 5.0% | ||||||||||||||||||
| Multi-State 64.7% | ||||||||||||||||||
FREDDIE MAC VR AMT TAX (LOC 6) | 5/15/2046 | 0.11% | $ | 4,125,000 | $ | 4,125,000 | ||||||||||||
FREDDIE MAC AMT (LOC 6) | 11/15/2036 | 0.09% | 7,977,000 | 7,977,000 | ||||||||||||||
FREDDIE MAC VR AMT (LOC 6) | 6/15/2036 | 0.09% | 21,935,000 | 21,935,000 | ||||||||||||||
FREDDIE MAC VR (LOC 6) | 12/15/2045 | 0.08% | 18,945,000 | 18,945,000 | ||||||||||||||
|
|
|
| |||||||||||||||
Multi-State (amortized cost $52,982,000) | 52,982,000 | 52,982,000 | ||||||||||||||||
|
|
|
| |||||||||||||||
| Colorado 34.4% | ||||||||||||||||||
BOULDER CO HSG AUTH MF BROADWAY EAST APTS (LOC 3) | 9/1/2037 | 0.10% | 1,590,000 | 1,590,000 | ||||||||||||||
BOULDER COUNTY – BOULDER COLLEGE OF MASSAGE(a)(j) | 10/15/2031 | 0.00% | 4,315,000 | 4,315,000 | ||||||||||||||
BROOMFIELD URBAN RENEWAL AUTHORITY (LOC 1) | 12/1/2030 | 0.12% | 8,270,000 | 8,270,000 | ||||||||||||||
COLORADO HOUSING & FINANCE AUTHORITY – SERIES 2007A (LOC 3) | 1/1/2032 | 0.10% | 5,695,000 | 5,695,000 | ||||||||||||||
COLORADO SPRINGS UTILITIES (LOC 3) | 11/1/2041 | 0.05% | 1,300,000 | 1,300,000 | ||||||||||||||
JEFFCO BUSINESS CENTER METROPOLITAN DISTRICT #1(j) | 7/1/2021 | 0.00% | 1,006,000 | 1,006,000 | ||||||||||||||
15
Colorado BondShares
A Tax-Exempt Fund
Schedule of Investments (unaudited) — (Continued)
| Short-Term Municipal Bonds (Continued) | Maturity | Coupon | Principal | Value | ||||||||||||||
| Colorado (Continued) | ||||||||||||||||||
MESA COUNTY -ENSTROM CANDIES INC PROJ | 7/1/2022 | 0.25% | $ | 235,000 | $ | 235,000 | ||||||||||||
RAVENNA METROPOLITAN DISTRICT CONV CABS – SERIES 2017 SUPPLEMENTAL B(d) | 12/1/2021 | 0.00% | 15,000 | 14,655 | ||||||||||||||
ROXBOROUGH VILLAGE METROPOLITAN DISTRICT – SERIES 1993B P/O(e)(i) | 12/31/2021 | 0.00% | 24,707 | 22,237 | ||||||||||||||
SHERIDAN REDEVLOPMENT AGENCY – SERIES 2011A-1 (LOC 5) | 12/1/2029 | 0.08% | 5,200,000 | 5,200,000 | ||||||||||||||
SOUTHGLENN METROPOLITAN DISTRICT | 12/1/2021 | 3.00% | 533,000 | 535,622 | ||||||||||||||
|
|
|
| |||||||||||||||
Colorado (amortized cost $27,659,062) | 28,183,707 | 28,183,514 | ||||||||||||||||
|
|
|
| |||||||||||||||
| South Dakota 0.9% | ||||||||||||||||||
OGLALA SIOUX TRIBE, SERIES 2020 | 3/1/2022 | 4.00% | 700,000 | 700,847 | ||||||||||||||
|
|
|
| |||||||||||||||
South Dakota (amortized cost $700,000) | 700,000 | 700,847 | ||||||||||||||||
|
|
|
| |||||||||||||||
Short-Term Municipal Bonds | $ | 81,865,707 | $ | 81,866,361 | ||||||||||||||
|
|
|
| |||||||||||||||
| Colorado Capital Appreciation and Zero Coupon Bonds 4.2% | ||||||||||||||||||
| Colorado 100.0% | ||||||||||||||||||
BELLA MESA METROPOLITAN DISTRICT CONV CABS SER A | 12/1/2049 | 0.00% | $ | 3,780,000 | $ | 3,017,083 | ||||||||||||
CONIFER METROPOLITAN DISTRICT(a)(d)(j) | 12/1/2031 | 0.00% | 7,470,000 | 2,988,000 | ||||||||||||||
MAYFIELD METROPOLITAN DISTRICT, SER 2020C | 12/15/2050 | 3.00% | 766,000 | 245,740 | ||||||||||||||
PV-ERU HOLDING TRUST(a) | 12/15/2037 | 0.00% | 14,000,000 | 2,940,000 | ||||||||||||||
PV-ERU HOLDING TRUST(a) | 2/14/2039 | 0.00% | 710,000 | 149,100 | ||||||||||||||
PV-ERU HOLDING TRUST(a) | 2/14/2039 | 0.00% | 3,122,000 | 655,620 | ||||||||||||||
PV-ERU HOLDING TRUST(a) | 2/14/2039 | 0.00% | 13,168,000 | 2,765,280 | ||||||||||||||
RAVENNA METROPOLITAN DISTRICT CONV CABS – SERIES 2017A(d) | 12/1/2046 | 5.00% | 33,685,000 | 35,297,838 | ||||||||||||||
RAVENNA METROPOLITAN DISTRICT CONV CABS – SERIES 2017 SUPPLEMENTAL B(d) | 12/1/2022 | 0.00% | 170,000 | 160,266 | ||||||||||||||
RAVENNA METROPOLITAN DISTRICT CONV CABS – SERIES 2017 SUPPLEMENTAL B(d) | 12/1/2023 | 0.00% | 325,000 | 295,467 | ||||||||||||||
RAVENNA METROPOLITAN DISTRICT CONV CABS – SERIES 2017 SUPPLEMENTAL B(d) | 12/1/2024 | 0.00% | 490,000 | 429,157 | ||||||||||||||
RAVENNA METROPOLITAN DISTRICT CONV CABS – SERIES 2017 SUPPLEMENTAL B(d) | 12/1/2025 | 0.00% | 585,000 | 488,978 | ||||||||||||||
16
Colorado BondShares
A Tax-Exempt Fund
Schedule of Investments (unaudited) — (Continued)
| Colorado Capital Appreciation and Zero Coupon Bonds (Continued) | Maturity | Coupon | Principal | Value | ||||||||||||||||
| Colorado (Continued) | ||||||||||||||||||||
SOUTHSHORE METROPOLITAN DISTRICT NO. 2 SUB B(g) |
| 12/15/2041 | 4.13% | $ | 9,690,000 | $ | 11,183,423 | |||||||||||||
STC METROPOLITAN DISTRICT NO. 2, SER A |
| 12/1/2025 | 3.00% | 555,000 | 574,358 | |||||||||||||||
STERLING RANCH METROPOLITAN DISTRICT #2 CONV CAB(d) |
| 12/1/2045 | 8.00% | 6,685,000 | 6,896,380 | |||||||||||||||
WILDWING METROPOLITAN DISTRICT #1(d) |
| 12/1/2023 | 0.00% | 725,000 | 596,668 | |||||||||||||||
|
|
|
| |||||||||||||||||
Colorado (amortized cost $72,547,792) |
| 95,926,000 | 68,683,357 | |||||||||||||||||
|
|
|
| |||||||||||||||||
Colorado Capital Appreciation and Zero Coupon Bonds (amortized cost $72,547,792) |
| $ | 95,926,000 | $ | 68,683,357 | |||||||||||||||
|
|
|
| |||||||||||||||||
| Colorado Taxable Certificates/Notes/Bonds 0.6% | ||||||||||||||||||||
| Colorado 100.0% | ||||||||||||||||||||
PUBLIC FINANCE AUTH CHARTER SCHOOL-COLORADO SPRINGS TXBL |
| 7/1/2026 | 7.00% | $ | 5,975,000 | $ | 5,988,145 | |||||||||||||
PFA AURORA CHARTER SCHOOL BC PROJECT SER C – TAXABLE |
| 7/1/2029 | 7.00% | 1,235,000 | 1,183,402 | |||||||||||||||
WOODMEN HEIGHTS METROPOLITAN DISTRICT NO. 2 SER B-1 TAXABLE BOTH ST & FED INITIALLY |
| 12/15/2040 | 6.25% | 1,830,000 | 1,872,859 | |||||||||||||||
TABERNASH POLE CREEK NOTE(a)(j) |
| 12/31/2021 | 0.00% | 227,347 | 88,199 | |||||||||||||||
|
|
|
| |||||||||||||||||
Colorado (amortized cost $9,267,347) |
| 9,267,347 | 9,132,605 | |||||||||||||||||
|
|
|
| |||||||||||||||||
Colorado Taxable Certificates/Notes/Bonds |
| $ | 9,267,347 | $ | 9,132,605 | |||||||||||||||
|
|
|
| |||||||||||||||||
Total investments, at value | 70.5 | % | $ | 1,148,054,938 | ||||||||||||||||
Other assets net of liabilities | 29.5 | % | 481,201,851 | |||||||||||||||||
|
|
|
| |||||||||||||||||
Net Assets | 100.0 | % | $ | 1,629,256,789 | ||||||||||||||||
|
|
|
| |||||||||||||||||
17
Colorado BondShares
A Tax-Exempt Fund
Schedule of Investments (unaudited) — (Continued)
| (a) | Defaulted or non-income producing based upon the financial condition of the issuer (see note 2 in notes to financial statements). |
| (b) | Originally issued as general obligation bonds but are now pre-refunded and are secured by an escrow fund consisting entirely of direct U.S. Government obligations. |
| (c) | Represents securities whose blended characteristics are reflective of a zero coupon bond and a step rate bond. Interest rate shown represents effective yield at acquisition. |
| (d) | Interest rate shown for capital appreciation and zero coupon bonds represents the effective yield at the date of acquisition. |
| (e) | Principal-only certificate represents the right to receive the principal payments on the underlying debt security upon maturity. The price of this security is typically more volatile than that of coupon-bearing bonds of the same maturity. |
| (f) | Interest-only certificate represents the right to receive semi-annual interest payments on the underlying debt security. The principal amount of the underlying security represents the notional amount on which current interest is calculated. The interest rate shown represents the effective yield at the date of acquisition. |
| (g) | Interest rate disclosed for cash flow bond represents the effective yield at March 31, 2021. Income on this security is derived from the cash flow of the issuer. |
| (h) | Represents current interest rate for a step rate bond. No step rate bonds were owned by the Fund at March 31, 2021. |
| (i) | Terms of security have been restructured since the original issuance. The total face amount of all such restructured securities approximates $10,919,167 and a value of $6,794,110 or less than 1.0% of net assets, as of March 31, 2021. |
| (j) | Securities valued at fair value (see note 2 in notes to financial statements). |
| (k) | See note 7 in notes to financial statements for further information on purchase accrued interest related to these bonds. |
| (l) | The Fund has entered into a forbearance agreement under which it agrees that the issuer may pay a reduced rate of interest in lieu of the contract rate for a period of time (see note 2 in notes to financial statements). |
See accompanying notes to financial statements.
18
Colorado BondShares
A Tax-Exempt Fund
Schedule of Investments (unaudited) — (Continued)
| (LOC) | These securities are Variable Rate Demand Obligations (“VRDO”) with scheduled principal and interest payments that have a guaranteed liquidity provider in the form of a letter of credit. These obligations bear interest at a rate that resets daily or weekly (see note 2 in notes to financial statements). The numbered list below corresponds to the liquidity provider associated with the respective LOC. |
1. BNP Paribas
2. FHLB Topeka
3. US Bank, N. A.
4. Royal Bank of Canada
5. JPMorgan Chase Bank, N.A.
6. Freddie Mac
The following abbreviations are used in the descriptions of securities included in the Schedule of Investments:
CABS — Capital Appreciation Bonds
CONV — Convertible
I/O — Interest Only
L/D — Local Improvement District
P/O — Principal Only
See accompanying notes to financial statements.
19
Colorado BondShares
A Tax-Exempt Fund
Statement of Assets and Liabilities
March 31, 2021 (unaudited)
| ASSETS |
| |||
Investments, at value (amortized cost 1,134,440,099) | $ | 1,148,054,938 | ||
— see accompanying schedule | ||||
Cash | 281,063,517 | |||
Interest receivable | 111,067,708 | |||
Purchase accrued interest (note 7) | 92,740,878 | |||
Bond interest receivable | 14,654 | |||
Receivable for shares of beneficial interest sold | 644,083 | |||
|
| |||
TOTAL ASSETS | 1,633,585,778 | |||
|
| |||
| LIABILITIES |
| |||
Payables and other liabilities: | ||||
Dividends payable | 2,734,721 | |||
Payable for shares of beneficial interest redeemed | 263,770 | |||
Management fees payable | 685,386 | |||
Accrued expenses payable | 645,112 | |||
|
| |||
TOTAL LIABILITIES | 4,328,989 | |||
|
| |||
NET ASSETS | $ | 1,629,256,789 | ||
|
| |||
COMPOSITION OF NET ASSETS | ||||
Paid-in capital | $ | 1,613,453,061 | ||
Accumulated net realized gain | 2,188,889 | |||
Net unrealized appreciation (depreciation) of investments | 13,614,839 | |||
|
| |||
NET ASSETS | $ | 1,629,256,789 | ||
|
| |||
NET ASSET PRICE AND REDEMPTION PRICE PER SHARE | $ | 9.38 | ||
|
| |||
MAXIMUM OFFERING PRICE PER SHARE | $ | 9.85 | ||
|
| |||
See accompanying notes to financial statements.
20
Colorado BondShares
A Tax-Exempt Fund
Statement of Operations
For the Six Months Ended March 31, 2021 (unaudited)
INVESTMENT INCOME | ||||
Interest | $ | 37,006,680 | ||
EXPENSES | ||||
Management fees (note 4) | 3,884,652 | |||
Custodian fees (note 5) | 42,480 | |||
Legal and auditing fees | 64,974 | |||
Portfolio pricing fees | 15,652 | |||
Registration fees | 5,642 | |||
Shareholders’ reports | 46,774 | |||
Transfer agency expenses (note 4) | 91,000 | |||
Trustees’ fees | 6,006 | |||
Other | 964,967 | |||
|
| |||
Total expenses | 5,122,147 | |||
Custody credits (note 5) | (30,468 | ) | ||
|
| |||
Net expenses | 5,091,679 | |||
|
| |||
NET INVESTMENT INCOME | 31,915,001 | |||
|
| |||
REALIZED AND UNREALIZED GAIN ON INVESTMENTS | ||||
Net realized gain on investments | 2,477,779 | |||
Net unrealized appreciation (depreciation) on investments | 27,213,964 | |||
|
| |||
NET REALIZED AND UNREALIZED GAIN ON INVESTMENTS | 29,691,743 | |||
|
| |||
NET INCREASE (DECREASE) IN NET ASSETS RESULTING FROM OPERATIONS | $ | 61,606,744 | ||
|
|
See accompanying notes to financial statements.
21
Colorado BondShares
A Tax-Exempt Fund
Statements of Changes in Net Assets
For the Periods Indicated
| Six Months Ended March 31, 2021 | Year Ended September 30, 2020 | |||||||
| (unaudited) | ||||||||
FROM OPERATIONS: | ||||||||
Net investment income | $ | 31,915,001 | $ | 58,171,764 | ||||
Net realized gain on investments | 2,477,779 | 1,848,139 | ||||||
Unrealized appreciation on investments | 27,213,964 | (8,592,447 | ) | |||||
|
|
|
| |||||
Net increase in net assets resulting from operations | 61,606,744 | 51,427,456 | ||||||
|
|
|
| |||||
FROM DISTRIBUTIONS TO SHAREHOLDERS: (note 2) | ||||||||
Dividends to shareholders from net investment income | (31,915,001 | ) | (58,171,764 | ) | ||||
Net realized gain to shareholders from investment transactions | (2,933,082 | ) | (781,461 | ) | ||||
|
|
|
| |||||
Total distributions to shareholders | (34,848,083 | ) | (58,953,225 | ) | ||||
|
|
|
| |||||
FROM BENEFICIAL INTEREST TRANSACTIONS: | ||||||||
Proceeds from sale of shares | 121,142,805 | 191,605,128 | ||||||
Reinvested dividends and distributions | 24,759,366 | 41,141,389 | ||||||
Redemption of shares | (37,881,243 | ) | (153,440,867 | ) | ||||
|
|
|
| |||||
Increase in net assets derived from beneficial interest transactions | 108,020,928 | 79,305,650 | ||||||
|
|
|
| |||||
Net increase in net assets | 134,779,589 | 71,779,881 | ||||||
NET ASSETS: | ||||||||
Beginning of period | 1,494,477,200 | 1,422,697,319 | ||||||
|
|
|
| |||||
End of period | $ | 1,629,256,789 | $ | 1,494,477,200 | ||||
|
|
|
| |||||
See accompanying notes to financial statements.
22
Colorado BondShares
A Tax-Exempt Fund
Financial Highlights
The financial highlights table is intended to help you understand the Fund’s financial performance. Certain information reflects financial results for a single Fund share. The total returns in the table represent the rate that an investor would have earned (or lost) on an investment in the Fund (assuming reinvestment of all dividends and distributions). Sales charges are not reflected in the total returns.
| For Fiscal Years Ended September 30 | ||||||||||||||||||||
| 3/31/2021 | 2020 | 2019 | 2018 | 2017 | ||||||||||||||||
| For a share outstanding throughout the period | (unaudited) | |||||||||||||||||||
Net asset value, beginning of period | $ | 9.22 | $ | 9.25 | $ | 9.13 | $ | 9.05 | $ | 9.18 | ||||||||||
|
|
|
|
|
|
|
|
|
| |||||||||||
Income From Investment Operations | ||||||||||||||||||||
Net investment income(1) | 0.19 | 0.37 | 0.37 | 0.36 | 0.41 | |||||||||||||||
Net gain or (loss) on investments (both realized and unrealized) | 0.18 | (0.03 | ) | 0.17 | 0.10 | (0.06 | ) | |||||||||||||
|
|
|
|
|
|
|
|
|
| |||||||||||
Increase from investment operations | 0.37 | 0.34 | 0.54 | 0.46 | 0.35 | |||||||||||||||
Less Distributions | ||||||||||||||||||||
Dividends to shareholders from net investment income | (0.19 | ) | (0.37 | ) | (0.37 | ) | (0.36 | ) | (0.41 | ) | ||||||||||
Distributions from realized capital gains | (0.02 | ) | — | (0.05 | ) | (0.02 | ) | (0.07 | ) | |||||||||||
|
|
|
|
|
|
|
|
|
| |||||||||||
Total Distributions | (0.21 | ) | (0.37 | ) | (0.42 | ) | (0.38 | ) | (0.48 | ) | ||||||||||
|
|
|
|
|
|
|
|
|
| |||||||||||
Net increase (decrease) in net asset value | 0.16 | (0.03 | ) | 0.12 | 0.08 | (0.13 | ) | |||||||||||||
|
|
|
|
|
|
|
|
|
| |||||||||||
Net Asset Value, end of period | $ | 9.38 | $ | 9.22 | $ | 9.25 | $ | 9.13 | $ | 9.05 | ||||||||||
|
|
|
|
|
|
|
|
|
| |||||||||||
Total Return, at Net Asset Value(2) | 3.83 | %+ | 3.83 | % | 6.09 | % | 5.29 | % | 4.03 | % | ||||||||||
|
|
|
|
|
|
|
|
|
| |||||||||||
Ratios/Supplemental Data: | ||||||||||||||||||||
Ratios to average net assets: | ||||||||||||||||||||
Net investment income | 4.09 | %* | 4.02 | % | 4.02 | % | 4.00 | % | 4.54 | % | ||||||||||
Total expenses | 0.66 | * | 0.58 | % | 0.55 | % | 0.56 | % | 0.62 | % | ||||||||||
Net expenses | 0.65 | * | 0.57 | % | 0.55 | % | 0.56 | % | 0.61 | % | ||||||||||
Net assets, end of period (000s) | $ | 1,629,257 | $ | 1,494,477 | $ | 1,422,697 | $ | 1,265,958 | $ | 1,137,817 | ||||||||||
|
|
|
|
|
|
|
|
|
| |||||||||||
Portfolio turnover rate(3) | 9.45 | % | 22.54 | % | 9.62 | % | 27.02 | % | 8.77 | % | ||||||||||
|
|
|
|
|
|
|
|
|
| |||||||||||
| + | not annualized |
| * | annualized |
| (1) | Net investment income per share was calculated using an average shares method. |
| (2) | Assumes a hypothetical initial investment on the business day before the first day of the fiscal period, with all dividends reinvested in additional shares on the reinvestment date, and redemption at the net asset value calculated on the last business day of the fiscal period. Sales charges are not reflected in the total returns. |
| (3) | The portfolio turnover rate is computed by dividing the lesser of purchases or sales of portfolio securities for a period by the monthly average of the value of portfolio securities owned during the period. Sales of securities include the proceeds of securities that have been called or for which payment has been made through redemption or maturity. Securities with a maturity date of one year or less at the time of acquisition are excluded from the calculation. Cost of purchases and proceeds from sales of investment securities (excluding short-term securities) for the period ended March 31, 2021 were $189,317,223 and $98,620,088 respectively. |
See accompanying notes to financial statements.
23
Colorado BondShares
A Tax-Exempt Fund
Notes to Financial Statements (unaudited)
| (1) | Organization |
Colorado BondShares — A Tax-Exempt Fund (the “Fund”) is registered under the Investment Company Act of 1940, as amended, as a diversified, open-end management company. The Fund’s investment objectives are to maximize income exempt from federal income taxes and from personal income taxes of the State of Colorado to the extent consistent with the preservation of capital and to seek opportunities for capital appreciation. The Fund’s investment adviser is Freedom Funds Management Company (“Freedom Funds”). The following is a summary of significant accounting policies consistently followed by the Fund.
| (2) | Summary of Significant Accounting Policies |
These financial statements have been prepared in conformity with accounting principles generally accepted in the United States of America. This requires management to make estimates and assumptions that affect the reported amounts of assets and liabilities and disclosure of contingent assets and liabilities at the date of the financial statements and the reported amounts of income and expenses during the reporting period. Actual results could differ from those estimates. These financial statements reflect all adjustments that are, in the opinion of management, necessary to a fair statement of the results for the reporting period. The following summarizes the significant accounting policies of the Fund:
| (a) | Investment Valuation and Risk |
Securities for which there is no last sales price are valued by an independent pricing service based on evaluated prices that considers such factors as transactions in bonds, quotations from bond dealers, market transactions in comparable securities and various relationships between securities, or are fair valued by management.
Securities for which market quotations are not readily available (or management considers otherwise are no longer valid or reliable) are valued at fair value determined in accordance with procedures approved by the Board of Trustees. This can occur in the event of, among other things, natural disasters, acts of terrorism, market disruptions, intra-day trading halts, and extreme market volatility. The determination of fair value involves subjective judgments. As a result, using fair value to price a security may result in a price materially different from the prices used by other mutual funds to determine net asset value or the price that may be realized upon the actual sale of the security. Short-term holdings are valued at current market quotations or amortized cost whichever management believes best approximates fair value.
Fixed-income securities owned by the Fund are subject to interest-rate risk, credit risk, prepayment risk and market risk. The Fund invests in not rated securities which, may be subject to a greater degree of credit risk and risk of loss of income and principal, and may be more sensitive to economic conditions than lower yielding, higher rated fixed income securities. The Fund concentrates its investments in Colorado and, therefore, may be impacted by specific events, issuers or factors affecting Colorado. The Fund has more credit risk related to the economic conditions of Colorado than a portfolio with a broader geographical diversification.
24
Colorado BondShares
A Tax-Exempt Fund
Notes to Financial Statements (unaudited) — (Continued)
Accounting Standards Codification (“ASC”) 820 Fair Value Measurements and Disclosures establishes a fair value hierarchy that classifies securities based on valuation techniques used to measure fair value and distinguish between observable inputs (market data obtained from independent sources) and the reporting entities own assumptions, which are not readily observable to market participants. The fair value hierarchy gives the highest priority to quoted prices (unadjusted) in active markets for identical assets or liabilities (Level 1) and the lowest priority to unobservable inputs (Level 3).
Level 1 Inputs: Quoted prices (unadjusted) in active markets for identical assets or liabilities that the reporting entity has the ability to access at the measurement date.
Level 2 Inputs: Inputs other than quoted prices included within Level 1 that are observable for the asset or liability, either directly or indirectly. If the asset or liability has a specified (contractual) term, a Level 2 input must be observable for substantially the full term of the asset or liability.
Level 3 Inputs: Significant unobservable inputs for the asset or liability including management’s own assumptions. Unobservable inputs shall be used to measure fair value to the extent that observable inputs are not available.
The following table summarizes the valuation of the Fund’s investments as defined by ASC 820 hierarchy levels as of March 31, 2021:
Valuation Inputs Summary
| Colorado Municipal Bonds | Other Municipal Bonds | Short-Term Municipal Bonds | Colorado Capital Appreciation and Zero Coupon Bonds | Colorado Taxable Certificates/ Notes/ Bonds | Total Securities March 31, 2021 | |||||||||||||||||||
Level 1 Securities | $ | — | $ | — | $ | — | $ | — | $ | — | $ | — | ||||||||||||
Level 2 Securities | 860,398,605 | 119,460,013 | 76,545,361 | 65,695,357 | 9,044,406 | 1,131,143,742 | ||||||||||||||||||
Level 3 Securities | 3,861,650 | 4,652,347 | 5,321,000 | 2,988,000 | 88,199 | 16,911,196 | ||||||||||||||||||
|
|
|
|
|
|
|
|
|
|
|
| |||||||||||||
Totals | $ | 864,260,255 | $ | 124,112,360 | $ | 81,866,361 | $ | 68,683,357 | $ | 9,132,605 | $ | 1,148,054,938 | ||||||||||||
|
|
|
|
|
|
|
|
|
|
|
| |||||||||||||
25
Colorado BondShares
A Tax-Exempt Fund
Notes to Financial Statements (unaudited) — (Continued)
| Colorado Municipal Bonds | Other Municipal Bonds | Short-Term Municipal Bonds | Colorado Capital Appreciation and Zero Coupon Bonds | Colorado Taxable Certificates/ Notes/Bonds | Totals | |||||||||||||||||||
Level 3 Beginning Balance September 30, 2020 | $ | 12,708,664 | $ | 4,904,915 | $ | 5,321,000 | | $ | 2,988,000 | $ | 88,199 | $ | 26,010,778 | |||||||||||
Unrealized Losses | — | — | — | — | — | — | ||||||||||||||||||
Unrealized Gains | — | — | — | — | — | — | ||||||||||||||||||
Realized Losses | — | — | — | — | — | — | ||||||||||||||||||
Realized Gains | — | — | — | — | — | — | ||||||||||||||||||
Purchases | 948 | — | — | — | — | 948 | ||||||||||||||||||
Sales | — | (252,568 | ) | — | — | — | (252,568 | ) | ||||||||||||||||
Transfers In to Level 3* | — | — | — | — | — | — | ||||||||||||||||||
Transfers Out of Level 3* | (8,847,962 | ) | — | — | — | — | (8,847,962 | ) | ||||||||||||||||
|
|
|
|
|
|
|
|
|
|
|
| |||||||||||||
Balance as of March 31, 2021 | $ | 3,861,650 | $ | 4,652,347 | $ | 5,321,000 | $ | 2,988,000 | $ | 88,199 | $ | 16,911,196 | ||||||||||||
|
|
|
|
|
|
|
|
|
|
|
| |||||||||||||
* Transfers from Level 2 to Level 3 are because of a lack, or change of observable inputs or reduced market data reliability. Transfers from Level 3 to Level 2 are the result of observable inputs becoming available or increased market data reliability. The Fund’s policy is to recognize transfers into and out of Level 3 when management becomes aware of a change to significant observable input or market data reliability.
From September 30, 2020 to March 31, 2021, there were no Level 1 Securities.
Significant Unobservable Inputs Quantitative Disclosure
Level 3 Securities* | Fair Value as of March 31, 2021 | Valuation Technique(s)** | Unobservable Inputs | Low | High | Weighted Average | ||||||||||||||
Colorado Municipal Bonds | $ | 3,861,650 | discounted cash flow | probability of default | 5.00% | 5.00% | 5.00% | |||||||||||||
Other Municipal Bonds | 4,652,347 | discounted cash flow | probability of default | 1.00% | 1.00% | 1.00% | ||||||||||||||
Short-Term Municipal Bonds | 5,321,000 | discounted cash flow | probability of default | 5.00% | 10.00% | 5.95% | ||||||||||||||
Colorado Capital Appreciation and Zero Coupon Bonds | 2,988,000 | discounted cash flow | probability of default | 100.00% | 100.00% | 100.00% | ||||||||||||||
Colorado Taxable Certificates/Notes/Bonds | 88,199 | discounted cash flow | probability of default | 100.00% | 100.00% | 100.00% | ||||||||||||||
|
| |||||||||||||||||||
Total Level 3 Securities at | $ | 16,911,196 | ||||||||||||||||||
|
| |||||||||||||||||||
The significant unobservable inputs used in the fair value measurement of the Fund’s securities are collateral value, probability of default, and loss severity in the event of default. Any changes in unobservable inputs may result in substantial changes to fair value measurements.
* The inputs for these securities are not readily available or cannot be reasonably estimated and are generally those inputs described in Note 2(a). The appropriateness of fair values for these securities is based on results of back testing, broker due diligence, unchanged price review and consideration of macro or security specific events.
** Other unobservable inputs used in the discounted cash flow technique include collateral value and loss severity. These unobservable inputs are specific to the characteristics of each security being valued.
26
Colorado BondShares
A Tax-Exempt Fund
Notes to Financial Statements (unaudited) — (Continued)
| (b) | Cash |
The Fund continually monitors its positions with, and the credit quality of, the financial institutions with which it invests. As of March 31, 2021, and periodically throughout the year, the Fund has maintained balances in various operating accounts in excess of federally insured limits.
| (c) | Income Tax Information and Distributions to Shareholders |
The Fund intends to comply with the requirements of Subchapter M of the Internal Revenue Code, as amended, applicable to regulated investment companies and to distribute all its net investment income and any net realized gain on investments not offset by capital loss carryforwards to shareholders. The Fund distributes investment income monthly and due to the tax-exempt nature of its investments the income is generally non-taxable to the shareholders. The Fund distributes net realized capital gains, if any, to its shareholders at least annually. Income distributions and capital gain distributions are determined in accordance with income tax regulations, which may differ from generally accepted accounting principles. These differences are primarily due to the differing treatment of tax allocations.
Management has reviewed the Fund’s tax position for all open tax years. As of March 31, 2021, the Fund did not have a liability for any unrecognized tax benefits. The fund recognizes interest and penalties, if any, related to unrecognized tax benefits as income tax expense in the Statement of Operations. The Fund has no examinations in progress.
At March 31, 2021, the cost and unrealized appreciation (depreciation) of investments, as determined on a federal income tax basis, were as follows:
Cost of investments | $ | 1,134,440,099 | ||
|
| |||
Gross unrealized appreciation | $ | 47,899,372 | ||
Gross unrealized depreciation | (34,284,533 | ) | ||
|
| |||
Net unrealized appreciation (depreciation) of investments | $ | 13,614,839 | ||
|
|
For tax purposes, capital losses may be carried over to offset future capital gains, if any. Under the Regulated Investment Company Modernization Act of 2010, capital losses incurred by the Fund in taxable years beginning after December 22, 2010 are not subject to expiration and such losses retain their character as either short-term or long-term rather than being considered short-term as under previous law. Post-enactment capital losses must be fully utilized prior to utilizing any losses incurred in pre-enactment tax years.
| (d) | Defaulted or Non-income Producing Investments |
The Fund discontinues the accrual of interest income on municipal bonds when the securities become delinquent as to payment of principal or interest, or when the Fund’s investment adviser determines that an
27
Colorado BondShares
A Tax-Exempt Fund
Notes to Financial Statements (unaudited) — (Continued)
uncertainty exists as to the realization of all or a portion of the principal balance. The face amount of bonds for which the accrual of interest income has been discontinued approximates $67,372,347 and such bonds have a value of $21,198,549 or 1.30% of net assets, as of March 31, 2021. These securities have been identified in the accompanying Schedule of Investments.
The Fund has entered into forbearance agreements with one district under which it agrees that the issuer may pay a reduced rate of interest in lieu of the contract rate for a period of time. Face amount of the bonds for which the Fund has entered into forbearance agreements total $27,375,000 and have a value of $15,056,250 or 0.92% of net assets, as of March 31, 2021. These securities have been identified in the Schedule of Investments.
| (e) | Investment Transactions and Revenue Recognition |
Investment transactions are accounted for on the date the investments are purchased or sold (trade date). Purchases and sales of securities, other than short-term securities, aggregated to $189,317,223 and $98,620,088 respectively.
Dividends to shareholders are declared each business day and paid monthly. Distributions to shareholders are recorded on the ex-dividend date. Realized gains and losses from investment transactions are calculated using the identified-cost basis, which is the same basis the Fund uses for federal income tax purposes. Interest income is recorded on the accrual basis.
Variable Rate Demand Obligations (“VRDO”) purchased by the Fund are floating rate obligations that have a nominal long-term maturity but have a coupon rate that is reset periodically (e.g., daily or weekly). The investor has the option to put the issue back to the trustee or tender agent at any time with specified (e.g., seven days) notice; accordingly, the Fund treats these obligations as short-term holdings. On March 31, 2021, the interest rates paid on these obligations ranged from 0.05% to 0.25%.
| (f) | Classification of Distributions to Shareholders |
The character of distributions made during the year from net investment income or net realized gains may differ from its ultimate characterization for federal income tax purposes. Also, due to timing of dividend distributions, the fiscal year in which amounts are distributed may differ from the fiscal year in which the income or realized gain was recorded by the Fund.
| (g) | Securities Purchased on a When-Issued Basis |
The Fund may purchase securities on a when-issued basis with payment and delivery scheduled for a future date. These transactions are subject to market fluctuations and may increase or decrease in value prior to the delivery date. The Fund maintains segregated assets with a value equal to or greater than the amount of its purchase commitments. The Fund did not have any when-issued securities at March 31, 2021.
28
Colorado BondShares
A Tax-Exempt Fund
Notes to Financial Statements (unaudited) — (Continued)
| (3) | Shares of Beneficial Interest |
The Fund has an unlimited number of no par value shares of beneficial interest authorized. Transactions in shares of beneficial interest were as follows:
| Six Months Ended March 31, 2021 | Year Ended September 30, 2020 | |||||||||||||||
| Shares | Amount | Shares | Amount | |||||||||||||
| (unaudited) | ||||||||||||||||
Shares sold | 13,026,833 | $ | 121,423,411 | 20,938,233 | $ | 191,605,817 | ||||||||||
Dividends reinvested | 2,656,823 | 24,759,366 | 4,497,685 | 41,141,389 | ||||||||||||
|
|
|
|
|
|
|
| |||||||||
| 15,683,656 | 146,182,777 | 25,435,918 | 232,747,206 | |||||||||||||
Shares redeemed | (4,098,030 | ) | (38,170,864 | ) | (17,162,039 | ) | (153,441,639 | ) | ||||||||
|
|
|
|
|
|
|
| |||||||||
Net increase in shares outstanding | 11,585,626 | $ | 108,011,913 | 8,273,879 | $ | 79,305,567 | ||||||||||
|
|
|
|
|
|
|
| |||||||||
| (4) | Management Fees and Other Transactions with Affiliates |
Management fees paid to Freedom Funds were in accordance with the investment advisory agreement with the Fund, which provides for an annual fee equivalent to 0.5% of the net assets of the Fund. Freedom Funds pays all expense associated with advertising, marketing, and distributing the Fund’s shares and serves as the transfer agent, dividend disbursing agent, and registrar for the Fund. Freedom Funds provided certain transfer agency and shareholder services as part of the management fee arrangement for the period ended March 31, 2021. Transfer agency expenses on the Statement of Operations represent direct expenses charged to the Fund by third parties.
Allen Insurance, an affiliate of the investment adviser, acted as agent for the Fidelity Bond and the Errors and Omissions insurance policy maintained by the Fund and as a result received compensation in the form of commissions. The policies were provided by Travelers Insurance Company and all the commissions referred to above were paid by Travelers Insurance Company. Allen Insurance received no compensation directly from the assets of the Fund.
The Fund does not have any Trustees who are affiliated with the Advisor or Distributor. The Board of Trustees appointed a Chief Compliance Officer to the Fund in accordance with federal securities regulations. The Fund does not reimburse the Advisor for any compensation or fees associated with the Chief Compliance Officer.
| (5) | Custody Credits |
Expenses paid indirectly by the Fund represent earnings credits on cash balances maintained with the Fund’s custodian bank, UMB Bank, N.A. The earnings credits resulted in offsetting custodian fees of $30,468 the period ended March 31, 2021.
29
Colorado BondShares
A Tax-Exempt Fund
Notes to Financial Statements (unaudited) — (Continued)
| (6) | Indemnification |
From time to time, the Fund may be involved in certain disputes and legal actions arising in the ordinary course of its business. While it is not feasible to predict or determine the outcome of these proceedings, in management’s opinion, based on a review with legal counsel, none of these disputes or legal actions are expected to have a material impact on its financial position or results of operations. However, litigation is subject to inherent uncertainties, and an adverse result in these matters may arise from time to time that may harm the Fund’s business.
In the normal course of business, the Fund enters into contracts that contain a variety of representations, which provide general indemnifications. The Fund’s maximum exposure under these arrangements is unknown, as this would involve future claims that may be made against the Fund that have not yet occurred. However, based on experience, the Fund expects the risk of loss to be remote.
| (7) | Purchase Accrued Interest |
Purchase accrued interest is typically a component of a municipal bond purchase and is paid on settlement date. The accrual period begins on the last interest payment date (or original issue date) and runs through the day immediately preceding the settlement date. The Fund has purchased three bonds from the Meadows Metropolitan Districts No. 1, 2 and 7 with an aggregate balance of purchase accrued of $90,436,317 (97.5% of the March 31, 2021 balance of $92,740,878). Approximately $184,183,988 of additional interest has accrued on the purchase accrued interest since its purchase in 2007. This additional accrued interest has been fair valued in accordance with ASC 820 at approximately $74,801,663 and is included in other assets net of liabilities in the Schedule of Investments. This amount bears interest at the rate of 7.999% and will be received over an uncertain period of years. The value of the Meadows bonds is contained within three separate line items of the financial statements which all relate to a single set of bonds that cannot be sold separately.
| (8) | Litigation |
The Fund is periodically involved in various legal proceedings. At March 31, 2021, the Fund has a litigation accrual of $214,777 for all pending litigation matters primarily for the purpose of paying lawyer fees. Possible additional amounts cannot be currently estimated but will be set aside as needed. Although there can be no assurances, based on information available, management believes that it is probable that the ultimate outcome of the action described below and other matters that are pending or threatened will not have a material effect on the Fund’s financial condition.
Marin Metropolitan District LTD Tax G.O. Series 2008 Bond
The Fund is the beneficial owner of bonds issued in 2008 (the “Bonds”) by Marin Metropolitan District (the “District”) as described more fully in the Fund’s most recent quarterly schedule of portfolio holdings for
30
Colorado BondShares
A Tax-Exempt Fund
Notes to Financial Statements (unaudited) — (Continued)
the period ended December 31, 2020 on Form NPORT-P filed with the Securities and Exchange Commission (“SEC”) on February 26, 2021. The original principal amount of Bonds was $30,485,000. The current principal amount of the Bonds is $17,485,000. The valuation of these Bonds as of March 31, 2021 is set forth in the Schedule of Investments.
On June 1, 2011, Landmark Towers Association, Inc. (“Landmark”), a homeowners association, filed an action on behalf of its members entitled Landmark Towers Ass’n, et al. v. UMB Bank, et al., Case Number 2011-CV-1076 in Arapahoe County District Court, Colorado (“Landmark Litigation”). The complaint filed in the Landmark Litigation sought a temporary restraining order, declaratory relief and permanent injunction against the District, the Fund, and UMB Bank (“UMB”), the trustee, alleging that the taxes imposed by the District pledged to pay the Bonds violated TABOR.
In August 2011, Landmark sought to freeze approximately $13,000,000 in original proceeds from the sale of the Bonds to the Fund, which moneys were held by UMB as trustee. The District Court denied Landmark’s efforts to freeze the $13,000,000 and allowed those moneys to be paid to the Fund, which reduced the principal amount of the Bonds to the current level.
In July and August of 2013, the District Court held a bench trial regarding Landmark’s claims for declaratory relief and permanent injunction. On September 6, 2013, the District Court issued an order (“Sept. 6 Order”) that the District was properly formed and that the election approving the taxes was proper, but nonetheless held that there were violations of TABOR relating to the property taxes. In particular, the District Court held that (1) bond proceeds were used to pay improper charges of the developer; (2) the taxes exceeded the maximum mill levy for debt service; and (3) the taxes did not benefit the Landmark taxpayers. After holding that the taxes did not provide a benefit to the Landmark taxpayers, the Court enjoined the District from imposing its taxes on the Landmark members for purposes of paying the Bonds (the “Injunction”). The Fund, the District, and UMB filed a motion for reconsideration of the Sept. 6 Order, which the District Court denied in an order dated October 31, 2013 (“Oct. 31 Order”).
While the Fund was not found to be responsible for damages based on the asserted TABOR violations, the District Court on March 10, 2014, entered an order allowing Landmark to pursue claims for fraudulent transfer and constructive trust that could result in the Fund being ordered to pay some or all of the tax refund obligations of the District.
In August 2014, the District Court held a four-day trial on the newly asserted claims against the Fund, and on September 10, 2014, the District Court issued an order (the “Sept. 10 Order”) denying each of the new claims asserted against the Fund. Landmark, however, filed a post-trial motion for reconsideration of the Sept. 10 Order, which motion was denied on November 12, 2014.
The Fund filed a Notice of Appeal of the Sept. 6 Order and the Oct. 31 Order, including the Injunction.
On April 21, 2016, the Colorado Court of Appeals issued an Opinion (the “April 2016 Opinion”), in which it concluded that the TABOR election held for approving the Bonds and the District’s ad valorem property taxes was invalid because eligible electors were denied the right to vote in the election and that ineligible
31
Colorado BondShares
A Tax-Exempt Fund
Notes to Financial Statements (unaudited) — (Continued)
electors voted in the election. Based on those decisions, the Court of Appeals upheld the injunction against the District, prohibiting it from levying taxes for payment of the Bonds.
The April 2016 Opinion created uncertainty in the Colorado public finance market in that it calls into question the process that is routinely used to qualify electors for special district elections in Colorado. Emergency legislation was introduced in the Colorado legislature to remove the uncertainty and any impact the April 2016 Opinion may have on other special district financings. The Colorado General Assembly unanimously passed the legislation, and it was signed by the Governor on May 18, 2016.
In a further effort to reduce any impact the April 2016 Opinion may have on the Colorado public finance market, the Fund filed a Petition for Rehearing with the Court of Appeals, asking it to withdraw a portion of its April 2016 Opinion as unnecessary. That Petition was filed on May 5, 2016, and was denied on May 12, 2016.
The Fund filed a petition with the Colorado Supreme Court to review the April 2016 Opinion on various grounds. On November 7, 2016, the Supreme Court granted the petition for review. On December 11, 2017, the Supreme Court reversed the April 2016 Opinion on the grounds that all claims challenging the election held by the District in 2007 were barred under C.R.S. § 1-11-213(4) (which requires an election contest to be filed no later than 10 days after the certification of the results of an election). The Supreme Court, however, remanded the case back to the Court of Appeals to decide issues that were not decided in the April 2016 Opinion.
On January 8, 2018, Landmark filed a Petition for Rehearing asking the Supreme Court to reconsider its decision to reverse the April 2016 Opinion. On January 22, 2018, the Supreme Court denied the Petition for Rehearing.
On May 5, 2018, the Court of Appeals issued an opinion on remanded issues (the “May 2018 Opinion”), concluding that the due process rights of the District taxpayers were violated and upholding the injunction that prevents the District from collecting taxes for repayment of the Bonds.
The Fund filed a petition with the Colorado Supreme Court to review the May 2018 Opinion on various grounds. The petition to the Colorado Supreme Court was fully briefed on August 31, 2018. The Colorado Supreme Court denied the petition for review on March 25, 2019.
Because the May 2018 Opinion was based on federal due process, on August 21, 2019, the Fund filed a Petition for Writ of Certiorari with the U.S. Supreme Court seeking review and reversal of the May 2018 Opinion. The U.S. Supreme Court denied the Petition for Writ of Certiorari on November 25, 2019.
A final order and judgment was entered in the Landmark Litigation on September 3, 2020. That litigation is now complete. The judgment was entered against the District, not the Fund. However, the judgment prevents the District from imposing a mill levy on Landmark property owners for purposes of debt service.
32
Colorado BondShares
A Tax-Exempt Fund
Notes to Financial Statements (unaudited) — (Continued)
As a result of the foregoing, the tax revenues originally pledged to pay the Bonds have been reduced, and such reduction may have adverse effects on dividend distributions and net asset values of the Fund.
| (9) | Subsequent Events |
Management has evaluated the possibility of subsequent events in the Fund’s financial statements through the date of issuance. Management has determined that there are no material events that would require recognition or disclosure in the Fund’s financial statements through this date.
33
Other Information (unaudited)
Proxy Voting Record
The Fund does not invest in equity securities. Accordingly, there were no matters relating to a portfolio security considered during the 12 months ended June 30, 2020 with respect to which the Fund was entitled to vote. Applicable regulations require us to inform you that the foregoing proxy voting information is available on the SEC website at http://www.sec.gov or you may call us at 1-800-572-0069.
Quarterly Statement of Investments
The Fund files a complete statement of investments with the Securities and Exchange Commission for the first and third quarters for each fiscal year on Form N-PORT. Shareholders may view the filed Form N-PORT by visiting the Commission’s website at http://www.sec.gov. The filed form may also be viewed and copied at the Commission’s Public Reference Room in Washington, DC. Information regarding the operations of the Public Reference Room may be obtained by calling 1-800-732-0330 or you may call us at 1-800-572-0069.
34

A Tax-Exempt Fund
SEMI-ANNUAL REPORT
March 31, 2021
ITEM 2. CODE OF ETHICS.
Not required in this filing.
ITEM 3. AUDIT COMMITTEE FINANCIAL EXPERT.
Not required in this filing.
ITEM 4. PRINCIPAL ACCOUNTANT FEES AND SERVICES.
Not required in this filing.
ITEM 5. AUDIT COMMITTEE OF LISTED REGISTRANTS.
Not applicable.
ITEM 6. INVESTMENTS.
(a) Please see the Schedule of Investments contained in the Semi-Annual Report included under Item 1 of this Form N-CSR.
(b) Not applicable.
ITEM 7. DISCLOSURE OF PROXY VOTING POLICIES AND PROCEDURES FOR CLOSED-END MANAGEMENT INVESTMENT COMPANIES.
Not applicable.
ITEM 8. PORTFOLIO MANAGERS OF CLOSED-END MANAGEMENT INVESTMENT COMPANIES.
Not applicable.
ITEM 9. PURCHASES OF EQUITY SECURITIES BY CLOSED-END MANAGEMENT INVESTMENT COMPANY AND AFFILIATED PURCHASERS.
Not applicable.
ITEM 10. SUBMISSION OF MATTERS TO A VOTE OF SECURITY HOLDERS.
The registrant has not adopted procedures by which shareholders may recommend nominees to the registrant’s board of trustees.
ITEM 11. CONTROLS AND PROCEDURES.
(a) The registrant has adopted and maintained disclosure controls and procedures (as such term is defined in Rules 30a-3(c) under the Investment Company Act of 1940, as amended (the “Act”)) that are designed to ensure that information required to be disclosed in the registrant’s reports under the Act, is recorded, processed, summarized and reported within the time periods required under the SEC’s rules and forms and that the information is accumulated and communicated to the registrant’s management, including its principal executive officer and principal financial officer to allow for timely decisions regarding required disclosure.
As required by Rule 30a-3(b) of the Act, the registrant carried out an evaluation under the supervision and with the participation of its management, including its principal executive officer and principal financial officer, of the effectiveness of the design and operation of the registrant’s disclosure controls and procedures within the 90-day period prior to the filing date of this report. Based on the foregoing, the registrant’s principal executive officer and principal financial officer have concluded that the registrant’s disclosure controls and procedures were effective, as of that date.
(b) There were no changes in the registrant’s internal control over financial reporting (as defined in Rule 30a-3(d) under the Act) during the period covered by this report that has materially affected, or is reasonably likely to materially affect, the registrant’s internal control over financial reporting.
ITEM 12. DISCLOSURE OF SECURITIES LENDING ACTIVITIES FOR CLOSED-END MANAGEMENT INVESTMENT COMPANIES.
Not applicable.
ITEM 13. EXHIBITS.
| (a)(2)(i) |
(99.302) Interim President’s (Principal Executive Officer) Section 302 Certification |
| (a)(2)(ii) |
(99.302) Interim Treasurer’s (Principal Financial Officer) Section 302 Certification |
| (a)(3) Not applicable. |
| (b) |
Signatures
Pursuant to the requirements of the Securities Exchange Act of 1934 and the Investment Company Act of 1940, the registrant has duly caused this report to be signed on its behalf by the undersigned, thereunto duly authorized.
| Colorado BondShares — A Tax-Exempt Fund |
/s/ George N. Donnelly |
| George N. Donnelly, |
Interim President, Secretary and Treasurer Date: June 7, 2021 |
Pursuant to the requirements of the Securities Exchange Act of 1934 and the Investment Company Act of 1940, this report has been signed below by the following persons on behalf of the registrant and in the capacities and on the dates indicated.
/s/ George N. Donnelly |
| George N. Donnelly, |
Interim President, Secretary and Treasurer (Principal Executive Officer and Principal Financial Officer) Date: June 7, 2021 |