UNITED STATES
SECURITIES AND EXCHANGE COMMISSION
Washington, D.C. 20549
FORM N-CSR
CERTIFIED SHAREHOLDER REPORT OF REGISTERED
MANAGEMENT INVESTMENT COMPANIES
Investment Company Act file number: 811-05009
COLORADO BONDSHARES — A TAX-EXEMPT FUND
(Exact name of registrant as specified in its charter)
1200 17TH STREET, SUITE 850
DENVER, COLORADO 80202-5808
(Address of principal executive offices) (Zip code)
FRED R. KELLY, JR.
1200 17TH STREET, SUITE 850
DENVER, COLORADO 80202-5808
(Name and address of agent for service)
Registrant’s telephone number, including area code: 303-572-6990
Date of fiscal year end: 09/30
Date of reporting period: 03/31/2024
ITEM 1. REPORT TO STOCKHOLDERS.
May 26, 2024
Dear Shareholders:
If you are feeling like everything around you is broken and the country is not like the one we grew up in, you are not alone. But read on. The attached pages of our semiannual report dated March 31 detail something that is working and working well. At Colorado BondShares we are not doing nothing about the present state of affairs and each and every day we example old style values.
You shareholders are currently providing over $300 million in school finance to Colorado kids. We estimate that thousands of students have now received a superior education in beautiful safe facilities because of you. These kids are our future and unlike ones making headlines, the only protests we are aware of involve pop quizzes on Friday.
Colorado’s special district financing pays for infrastructure over a period of years, rather than adding these costs to the initial price of the house. By participating, you are helping families buy their home on a more affordable basis than would otherwise be possible while simultaneously contributing to solving our housing shortage. The positive financial impact to the economy of these investments has been in the billions. In fact, it is hard to drive almost anywhere along the front range without passing one or more of the projects you sponsored through your investments. Maybe you even live there, shop there, or recreate there which may even sweeten your satisfaction.
Your generosity has further allowed dramatic and much needed enhancements to living conditions for some of our Native Americans. Among the projects financed are water improvements, senior living, hospitality and health care facilities - all of which also carried with them employment opportunities for tribal members.
This year we will distribute something like $88 million on a prorated basis to our shareholders constituting a mostly tax-exempt dividend currently reflecting a 5% return on the value of your shares. Those distributions are better than last year and may help pay some of those inflated expenses that you are experiencing. Think about it: you would have to be earning 8 to 10 percent on a taxable investment to end up in the same place after tax. In addition, our share price is very gradually clawing its way back from its low. I believe it will continue to do so, helped by a future downward pressure on interest rates. That beats a $5 McDonald’s hamburger any day.
As always I wish to express our appreciation for your patronage. There are lots of other places you could choose to invest, many not as good in my opinion, but our entire staff thanks you for choosing us. We are honored and constantly strive to be worthy of your continued confidence.
Sincerely,

Fred R. Kelly, Jr.
Portfolio Manager
Officers and Trustees
George N. Donnelly, Chairman of the Board of Trustees, Interim President, Secretary, Treasurer and Trustee
Bruce G. Ely, Trustee
James R. Madden, Trustee
Fred R. Kelly, Jr., Portfolio Manager
Investment Adviser
Freedom Funds Management Company
Transfer, Shareholder Servicing, and Dividend Disbursing Agent
Freedom Funds Management Company
Distributor
Colorado Financial Service Corporation
Custodian of Portfolio Securities
UMB Bank, N.A.
Independent Registered Public Accounting Firm
Plante & Moran, PLLC
Special Legal Counsel
Thompson Hine LLP
This report is submitted for the general information of the shareholders of Colorado BondShares — A Tax-Exempt Fund. This report must be preceded or accompanied by a Prospectus of the Fund. The prospectus contains information concerning the investment policies and expenses of the portfolio in addition to other pertinent information. Shares of Colorado BondShares — A Tax-Exempt Fund are not deposits or obligations of any bank, are not guaranteed by any bank, are not insured by the FDIC or any other agency, and involve investment risks, including possible loss of the principal amount invested.
Officers and Trustees of the Fund (unaudited)
The following tables list the trustees and officers of the Fund, together with their address, age, positions held with the Fund, the term of each office held and the length of time served in each office, principal business occupations during the past five years and other directorships, if any, held by each trustee and officer. Each trustee and officer has served in that capacity for the Fund continuously since originally elected or appointed. The Board of Trustees supervises the business activities of the Fund. Each trustee serves as a trustee until termination of the Fund unless the trustee dies, resigns, retires, or is removed. The Statement of Additional Information of the Fund includes additional information about Fund trustees and is available, without charge, upon request. Shareholders may call (800) 572-0069 to request the Statement of Additional Information.
Name, Address and Age | Position held with | Principal Occupation | Other Directorships | |||
| Non-Interested Trustees | ||||||
Bruce G. Ely 1200 17th Street, Suite 850 Denver CO 80202 Age: 73 | Trustee since July 2002 | Mr. Ely was a Regional Director for Cutwater Asset Management, a wholly owned subsidiary of MBIA, Inc., until his retirement in September 2013. | None | |||
James R. Madden 1200 17th Street, Suite 850 Denver CO 80202 Age: 80 | Trustee since September 2004 | Mr. Madden has owned Madden Enterprises, a real estate company that owns and leases commercial buildings and real estate, for the past thirty years. He is also a stockholder and director of The Community Bank in western Kansas. He has been a bank director for 25 years. | None | |||
| Interested Trustees* | ||||||
George N. Donnelly 1200 17th Street, Suite 850 Denver CO 80202 Age: 77 | Chairman of the Board of Trustees, Trustee since inception of the Fund in 1987 and Interim President, Secretary and Treasurer of the Fund since September 26, 2008 | Mr. Donnelly was a Senior Regional Vice President for Phoenix Life Insurance Company until his retirement in January 2010. | None | |||
*George N. Donnelly is an “interested person” of the Fund as defined in the Investment Company Act of 1940 (the “1940 Act”) by virtue of his position as both an officer and a trustee of the Fund as described in the table above. None of the trustees nor the officers of the Fund have any position with the Investment Adviser, the principal underwriter of the Fund, the distribution agent of the Fund, the service agent of the Fund or the custodian of the Fund, or any affiliates thereof. There is no family relationship between any officers and trustees of the Fund.
1
FUND EXPENSES (unaudited)
The following examples are intended to help you understand the ongoing costs (in dollars) of investing in the Fund and compare these costs with those of other mutual funds. The examples (actual and hypothetical 5% return) are based on an investment of $1,000 made at the beginning of the period shown and held for the entire period.
As a shareholder of Colorado BondShares — A Tax-Exempt Fund (the “Fund’) you can incur two types of costs:
| • | Sales charges (front loads) on fund purchases and |
| • | Ongoing fund costs, including management fees, administrative services, and other fund expenses. All mutual funds have operating expenses. Operating expenses, which are deducted from the Fund’s gross income, directly reduce the investment return of the Fund. |
Actual Fund Expenses
The first line of the table below provides information about actual account values and actual expenses. You may use the information in this line, together with the amount you invested, to estimate the expenses that you paid over the period. Simply divide your account value by $1,000 (for example, an $8,600 account value divided by $1,000 = 8.6), then multiply the result by the number in the first line under the heading entitled “Expenses Paid During Period” to estimate the expenses you paid on your account during this period.
Hypothetical Example for Comparison Purposes
The second line of the table below provides information about hypothetical account values and hypothetical expenses based on the Fund’s actual expense ratio and an assumed rate of return of 5% per year before expenses, which is not the Fund’s actual return. The hypothetical account values and expenses may not be used to estimate the actual ending account balance or expenses you paid for the period. You may use this information to compare the ongoing cost of investing in the Fund and other funds. To do so, compare this 5% hypothetical example with the 5% hypothetical examples that appear in shareholder reports of other funds.
Six Months Ended March 31, 2024
Colorado BondShares — A Tax- Exempt Fund | Beginning Account Value 10/01/23 | Ending Account Value 03/31/24 | Expenses Paid During Period(1) | ||||||||||||
Based on Actual Fund Return | $ | 1,000.00 | $ | 1,083.20 | $ | 3.08 | |||||||||
Based on Hypothetical 5% Annual Return Before Expenses | $ | 1,000.00 | $ | 1,022.05 | $ | 2.99 | |||||||||
| (1) | The expenses shown in this table are equal to the Fund’s annualized expense ratio of 0.59% for semi-annual year ended March 31, 2024, multiplied by the average account value over the period, multiplied by 183/366 to reflect the one-half year period. |
Please note that expenses shown in the table are meant to highlight your ongoing costs only and do not reflect any transactional costs, such as sales charges (loads), redemption fees or exchange fees. Therefore, the second line of the table is useful in comparing ongoing costs only, and will not help you determine the relative total costs of owning different funds. In addition, if transactional costs were included, your costs would have been higher. You can find more information about the Fund’s expenses in the Financial Statements section of this report. For additional information on operating costs, please see the Fund’s prospectus.
2
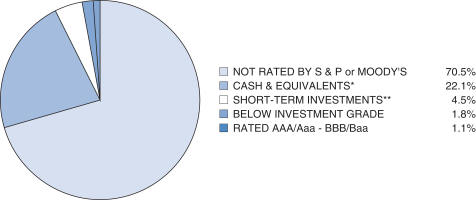
CREDIT QUALITY (unaudited)
Colorado BondShares — A Tax-Exempt Fund
Based on a Percentage of Total Net Assets as of March 31, 2024
SECTOR BREAKDOWN (unaudited)
Colorado BondShares — A Tax-Exempt Fund
Based on a Percentage of Total Net Assets as of March 31, 2024
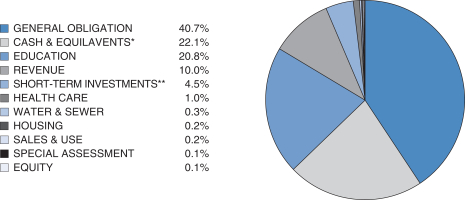
* Cash & equivalents include cash and receivables less liabilities.
** Short-term investments include securities with a maturity date or redemption feature of one year or less, as identified in the Schedule of Investments.
3
Colorado BondShares
A Tax-Exempt Fund
Schedule of Investments
March 31, 2024 (unaudited)
| Colorado Municipal Bonds 65.5% | Maturity | Coupon | Principal | Value | ||||||||||||||
| Colorado 100.0% | ||||||||||||||||||
Aberdeen MD #1 – Series A – 2035 | 12/1/2035 | 7.50% | $ | 1,600,000 | $ | 476,000 | ||||||||||||
Anthology West MD #4 – Series A – 2041(g) | 12/15/2041 | 6.25% | 1,100,000 | 1,053,855 | ||||||||||||||
Anthology West MD #5 – Series A – 2049 | 12/1/2049 | 4.88% | 4,630,000 | 4,058,936 | ||||||||||||||
Anthology West MD #5 – Series B – 2049(g) | 12/15/2049 | 7.63% | 698,000 | 658,200 | ||||||||||||||
Aspen Street MD – Series A – 2050(g) | 12/1/2050 | 5.13% | 4,300,000 | 3,558,336 | ||||||||||||||
Banning Lewis Ranch Regional MD – Series A – 2048 | 12/1/2048 | 5.38% | 2,500,000 | 2,493,075 | ||||||||||||||
Banning Lewis Ranch Regional MD – Series B – 2041(g) | 12/15/2041 | 7.75% | 625,000 | 615,081 | ||||||||||||||
Base Village MD #2 – Series B – 2048(g) | 12/15/2048 | 6.50% | 3,500,000 | 2,312,345 | ||||||||||||||
Belford North MD – Series A – 2050 | 12/1/2050 | 5.50% | 4,000,000 | 3,690,200 | ||||||||||||||
Belford North MD – Series B – 2050(g) | 12/15/2050 | 8.50% | 3,475,000 | 3,335,166 | ||||||||||||||
Bennett Crossing MD #1 – Series A – 2049 | 12/1/2049 | 6.13% | 6,160,000 | 6,170,657 | ||||||||||||||
Bennett Ranch MD #1 – Series A – 2051 | 12/1/2051 | 5.00% | 3,000,000 | 2,669,970 | ||||||||||||||
Bennett Ranch MD #1 – Series B – 2051(g) | 12/15/2051 | 7.50% | 1,221,000 | 1,132,270 | ||||||||||||||
Bent Grass MD – Series A – 2049 | 12/1/2049 | 5.25% | 1,690,000 | 1,631,120 | ||||||||||||||
Bradburn MD #2 – Series C – 2051(g) | 12/15/2051 | 7.50% | 3,271,000 | 3,023,287 | ||||||||||||||
Bramming Farm MD #1 – Series A – 2044 | 12/1/2044 | 6.00% | 1,910,000 | 1,888,360 | ||||||||||||||
Brighton Crossing MD #4 – Series A – 2037 | 12/1/2037 | 5.00% | 1,050,000 | 1,051,134 | ||||||||||||||
Brighton Crossing MD #4 – Series A – 2047 | 12/1/2047 | 5.00% | 4,685,000 | 4,543,888 | ||||||||||||||
Brighton Crossing MD #4 – Series B – 2047(g) | 12/1/2047 | 7.00% | 670,000 | 637,686 | ||||||||||||||
Brighton Crossing MD #6 – Series A – 2035 | 12/1/2035 | 5.00% | 525,000 | 516,784 | ||||||||||||||
Brighton Crossing MD #6 – Series A – 2040 | 12/1/2040 | 5.00% | 1,545,000 | 1,438,117 | ||||||||||||||
Brighton Crossing MD #6 – Series A – 2050 | 12/1/2050 | 5.00% | 9,020,000 | 7,990,006 | ||||||||||||||
Broomfield Village MD #2 – Series A – 2049 | 12/1/2049 | 5.00% | 1,450,000 | 1,378,617 | ||||||||||||||
Buckley Yard MD #2 – Series A – 2052 | 12/1/2052 | 6.25% | 6,800,000 | 6,810,948 | ||||||||||||||
Buckley Yard MD #2 – Series B – 2052(g) | 12/15/2052 | 9.25% | 1,569,000 | 1,574,899 | ||||||||||||||
Castleview MD #2 – Series A – 2050 | 12/1/2050 | 5.00% | 3,435,000 | 3,072,470 | ||||||||||||||
Castleview MD #1 – Series A – 2050(g) | 12/1/2050 | 5.00% | 4,727,000 | 3,925,348 | ||||||||||||||
Cherry Creek South MD #5 – Series A – 2051(g) | 12/1/2051 | 6.00% | 22,500,000 | 18,862,200 | ||||||||||||||
Cherry Hills City MD – Series A – 2047(g) | 12/1/2047 | 5.00% | 1,380,000 | 1,253,137 | ||||||||||||||
Cielo MD – Series A – 2050(g) | 12/1/2050 | 5.25% | 12,442,000 | 10,476,911 | ||||||||||||||
City Center West Residential MD #2 – Series A – 2049 | 12/1/2049 | 5.00% | 2,080,000 | 1,941,909 | ||||||||||||||
City Center West Residential MD #2 – Series B – 2049(g) | 12/15/2049 | 7.75% | 1,425,000 | 1,346,725 | ||||||||||||||
Cityset MD #2 – Series A – 2030 | 12/1/2030 | 3.50% | 5,150,000 | 4,673,110 | ||||||||||||||
Cityset MD #2 – Series A – 2040 | 12/1/2040 | 4.38% | 8,360,000 | 7,446,503 | ||||||||||||||
Cityset MD #2 – Series A – 2045 | 12/1/2045 | 4.50% | 3,180,000 | 2,773,055 | ||||||||||||||
4
Colorado BondShares
A Tax-Exempt Fund
Schedule of Investments (unaudited) — (Continued)
| Colorado Municipal Bonds (Continued) | Maturity | Coupon | Principal | Value | ||||||||||||||
| Colorado (Continued) | ||||||||||||||||||
Clear Creek Transit MD #2 – Series A – 2050 | 12/1/2050 | 5.00% | $ | 2,000,000 | $ | 1,686,360 | ||||||||||||
Cloverleaf MD – Series A – 2051 | 12/1/2051 | 6.00% | 2,330,000 | 2,355,397 | ||||||||||||||
Cloverleaf MD – Series B – 2051(g) | 12/15/2051 | 9.25% | 1,034,000 | 1,053,739 | ||||||||||||||
Colliers Hill MD #3 – Series A – 2040 | 12/1/2040 | 5.25% | 8,300,000 | 8,096,650 | ||||||||||||||
Colliers Hill MD #3 – Series A – 2048 | 12/1/2048 | 5.50% | 18,250,000 | 17,709,800 | ||||||||||||||
Colliers Hill MD #3 – Series B – 2043(g) | 12/15/2043 | 8.50% | 2,213,000 | 2,055,412 | ||||||||||||||
Colorado Centre MD – Series B – 2032(g)(i) | 1/1/2032 | 0.00% | 6,592,306 | 3,427,999 | ||||||||||||||
Colorado Centre MD – Series A – 2027(e)(i) | 1/1/2027 | 0.00% | 2,074,674 | 1,853,617 | ||||||||||||||
Colorado Centre MD – Series A – 2027(f)(i) | 1/1/2027 | 9.00% | 2,131,449 | 1,428,071 | ||||||||||||||
CECFA Swallow Academy – Series A – 2027(m) | 11/15/2027 | 5.35% | 3,180,000 | 3,083,328 | ||||||||||||||
CECFA Addenbrooke Classical Academy – Series A – 2027(m) | 6/1/2027 | 4.50% | 24,385,000 | 24,171,144 | ||||||||||||||
CECFA Imagine Charter School at Firestone – Series A – 2027(m) | 6/1/2027 | 4.50% | 17,380,000 | 17,227,577 | ||||||||||||||
CECFA Monarch Montessori – Series A – 2025(m) | 5/15/2025 | 4.75% | 8,325,000 | 8,222,186 | ||||||||||||||
CECFA Academy Of Advanced Learning – Series A – 2027(m) | 6/1/2027 | 4.38% | 8,420,000 | 8,052,551 | ||||||||||||||
CECFA Chavez/Huerta Preparatory – Series A – 2027(m) | 7/1/2027 | 4.38% | 36,520,000 | 34,236,770 | ||||||||||||||
CECFA Swallows Charter Academy – Series A – 2027(m) | 11/15/2027 | 4.38% | 6,560,000 | 6,161,546 | ||||||||||||||
CECFA Vanguard Classical School – Series A – 2027(m) | 7/1/2027 | 4.38% | 24,045,000 | 22,726,132 | ||||||||||||||
CECFA Third Future School – Series A – 2029(m) | 7/1/2029 | 4.25% | 5,645,000 | 5,087,387 | ||||||||||||||
CECFA Grand Peak Academy – Series A – 2031(m) | 7/1/2031 | 4.00% | 2,150,000 | 1,881,637 | ||||||||||||||
CECFA Grand Peak Academy – Series A – 2041(m) | 7/1/2041 | 4.25% | 5,040,000 | 3,886,898 | ||||||||||||||
CECFA Grand Peak Academy – Series A – 2051(m) | 7/1/2051 | 4.50% | 13,070,000 | 9,489,604 | ||||||||||||||
CECFA Doral Academy – Series A – 2028(m) | 7/15/2028 | 4.50% | 19,405,000 | 18,261,657 | ||||||||||||||
CECFA Civica Career & Collegiate Academy – Series A – 2029(m) | 7/15/2029 | 4.75% | 7,790,000 | 7,377,364 | ||||||||||||||
CECFA Chavez/Huerta Academy – Series A – 2027(m) | 7/1/2027 | 4.50% | 8,220,000 | 7,735,760 | ||||||||||||||
CECFA Mountain Sage Community School – Series A – 2029(m) | 7/1/2029 | 4.75% | 8,760,000 | 8,580,332 | ||||||||||||||
CECFA Mountain Song Community School – Series A – 2029(m) | 7/1/2029 | 4.75% | 5,810,000 | 5,696,066 | ||||||||||||||
CECFA CEC / Aurora Charter School – Series A – 2032(m) | 7/1/2032 | 5.00% | 80,470,000 | 79,554,251 | ||||||||||||||
CECFA CEC / CSEC BC Project – Series A – 2032(m) | 1/1/2032 | 4.88% | 4,060,000 | 4,015,868 | ||||||||||||||
5
Colorado BondShares
A Tax-Exempt Fund
Schedule of Investments (unaudited) — (Continued)
| Colorado Municipal Bonds (Continued) | Maturity | Coupon | Principal | Value | ||||||||||||||
| Colorado (Continued) | ||||||||||||||||||
CECFA CEC / CSEC BC Project – Series A – 2037(m) | 1/1/2037 | 5.00% | $ | 3,595,000 | $ | 3,538,163 | ||||||||||||
CECFA CEC / CSEC BC Project – Series A – 2042(m) | 1/1/2042 | 5.13% | 40,335,000 | 39,548,871 | ||||||||||||||
CECFA Global Village Academy – Senior Bonds – 2029(m) | 6/15/2029 | 5.85% | 11,630,000 | 11,683,731 | ||||||||||||||
CECFA Fort Collins Montessori School – Series A – 2029(m) | 7/1/2029 | 6.13% | 17,790,000 | 17,925,738 | ||||||||||||||
CECFA Colorado Skies Academy – Series A – 2030(m) | 7/1/2030 | 7.00% | 10,595,000 | 10,820,779 | ||||||||||||||
Colorado Crossing MD #2 – Series A – 2047 | 12/1/2047 | 5.00% | 4,000,000 | 3,705,560 | ||||||||||||||
Colorado Crossing MD #2 – Series A – 2050 | 12/1/2050 | 5.00% | 4,000,000 | 3,643,520 | ||||||||||||||
700 Kalamath LLC – Series A – 2013(a)(j) | 12/1/2013 | 0.00% | 3,755,000 | 4,000,000 | ||||||||||||||
CHFA / Casey’s Pond Living – Series A – 2032(l) | 6/1/2032 | 0.00% | 8,110,000 | 3,649,500 | ||||||||||||||
CHFA / Casey’s Pond Living – Series A – 2042(l) | 6/1/2042 | 0.00% | 10,665,000 | 4,799,250 | ||||||||||||||
CHFA / Casey’s Pond Living – Series A – 2047(l) | 6/1/2047 | 0.00% | 8,600,000 | 3,870,000 | ||||||||||||||
Hudson Asphalt Terminal Project – Series A – 2034(m) | 10/1/2034 | 7.25% | 10,000,000 | 10,403,100 | ||||||||||||||
Hudson Asphalt Terminal Project – Series B – 2034(m) | 10/1/2031 | 9.75% | 10,000,000 | 10,273,900 | ||||||||||||||
Colorado International Center MD #3 – Series A – 2031 | 12/1/2031 | 4.63% | 564,000 | 548,293 | ||||||||||||||
Conestoga MD #2 – Series A – 2051(g) | 12/1/2051 | 5.25% | 1,625,000 | 1,483,544 | ||||||||||||||
Conifer MD – Series A – 2030(j) | 12/1/2030 | 0.00% | 10,000,000 | 4,472,039 | ||||||||||||||
Conifer MD – Series A – 2032(j) | 12/1/2032 | 0.00% | 1,450,000 | 648,446 | ||||||||||||||
Conifer MD – Series A – 2033(j) | 12/1/2033 | 0.00% | 1,550,000 | 693,166 | ||||||||||||||
Constitution Heights MD – Series A – 2049 | 12/1/2049 | 5.00% | 1,765,000 | 1,675,762 | ||||||||||||||
Copperleaf MD #9 – Series A – 2051(g) | 12/1/2051 | 4.88% | 8,175,000 | 6,634,585 | ||||||||||||||
Country Club Highlands MD – Series A – 2037 | 12/1/2037 | 7.25% | 1,030,000 | 947,600 | ||||||||||||||
Dakota Ridge MD – Series A – 2052(g) | 12/1/2052 | 6.00% | 2,339,000 | 2,185,421 | ||||||||||||||
Deer Creek Villas MD – Series A – 2055 | 12/1/2055 | 5.00% | 6,085,000 | 5,344,638 | ||||||||||||||
Denver Intl Business Center MD #1 – Series B – 2048(g) | 12/1/2048 | 6.00% | 4,585,000 | 4,620,809 | ||||||||||||||
Denver West Promenade MD – Series A – 2031 | 12/1/2031 | 5.13% | 500,000 | 500,085 | ||||||||||||||
Denver West Promenade MD – Series B – 2046(g) | 12/15/2046 | 6.00% | 413,000 | 408,494 | ||||||||||||||
E86 MD – Series A – 2051(g) | 12/1/2051 | 5.13% | 4,060,000 | 3,458,349 | ||||||||||||||
Eagle Brook MD – Series A – 2051(g) | 12/1/2051 | 5.00% | 1,600,000 | 1,424,624 | ||||||||||||||
ECCV Water & Sanitation District – Series A – 2023(c) | 11/15/2030 | 5.00% | 619,000 | 619,000 | ||||||||||||||
Erie Highlands MD #2 – Series A – 2048 | 12/1/2048 | 5.25% | 6,000,000 | 5,810,220 | ||||||||||||||
Erie Highlands MD #2 – Series B – 2048(g) | 12/15/2048 | 7.63% | 1,819,000 | 1,733,034 | ||||||||||||||
Fitzsimons Village MD #1 – Series A – 2049 | 12/1/2049 | 5.00% | 1,040,000 | 945,703 | ||||||||||||||
Fitzsimons Village MD #1 – Series B – 2049(g) | 12/15/2049 | 7.00% | 611,000 | 564,289 | ||||||||||||||
Fitzsimons Village MD #3 – Series A – 2026 | 12/1/2026 | 4.00% | 1,640,000 | 1,566,233 | ||||||||||||||
Fitzsimons Village MD #3 – Series A – 2031 | 12/1/2031 | 4.00% | 500,000 | 452,205 | ||||||||||||||
Fitzsimons Village MD #3 – Series A – 2041 | 12/1/2041 | 4.00% | 4,445,000 | 3,446,475 | ||||||||||||||
6
Colorado BondShares
A Tax-Exempt Fund
Schedule of Investments (unaudited) — (Continued)
| Colorado Municipal Bonds (Continued) | Maturity | Coupon | Principal | Value | ||||||||||||||
| Colorado (Continued) | ||||||||||||||||||
Fitzsimons Village MD #3 – Series A – 2055 | 12/1/2055 | 4.25% | $ | 9,660,000 | $ | 7,000,505 | ||||||||||||
Flying Horse MD #2 – Series B – 2050(g)(m) | 12/15/2050 | 7.25% | 15,405,000 | 14,486,554 | ||||||||||||||
Flying Horse MD #3 – Series A – 2049(g) | 12/1/2049 | 6.00% | 2,965,000 | 2,912,905 | ||||||||||||||
Golden Eagle Acres MD #2 – Series A – 2051(g) | 12/1/2051 | 4.50% | 3,325,000 | 2,598,388 | ||||||||||||||
Green Gables MD #3 – Series B – 2053(g) | 12/15/2053 | 8.25% | 2,984,000 | 3,126,188 | ||||||||||||||
Green Valley Ranch East MD #6 – Series A – 2050 | 12/1/2050 | 5.88% | 3,325,000 | 3,335,640 | ||||||||||||||
Greenspire MD #1 – Series A – 2051 | 12/1/2051 | 5.13% | 1,925,000 | 1,765,957 | ||||||||||||||
Greenways MD #1 – Series A – 2051(g) | 12/1/2051 | 4.63% | 6,845,000 | 5,006,091 | ||||||||||||||
Hess Ranch MD #6 – Series A – 2049 | 12/1/2049 | 5.00% | 5,000,000 | 4,578,150 | ||||||||||||||
Hidden Creek MD – Series A – 2045(g) | 12/1/2045 | 4.63% | 3,430,000 | 2,801,555 | ||||||||||||||
Highlands Mead MD – Series A – 2050 | 12/1/2050 | 5.13% | 1,395,000 | 1,281,977 | ||||||||||||||
Hogback MD – Series A – 2041 | 12/1/2041 | 5.00% | 725,000 | 668,631 | ||||||||||||||
Hogback MD – Series A – 2051 | 12/1/2051 | 5.00% | 1,550,000 | 1,362,125 | ||||||||||||||
Horizon MD #2 – Series A – 2051(g) | 12/1/2051 | 4.50% | 11,657,000 | 8,447,362 | ||||||||||||||
Hunter’s Overlook MD #5 – Series B – 2049(g) | 12/15/2049 | 8.50% | 1,827,000 | 1,753,445 | ||||||||||||||
Hunter’s Overlook MD #7 – Series A – 2051(g) | 12/1/2051 | 5.50% | 3,525,000 | 3,273,950 | ||||||||||||||
Hyland Village MD – Series A – 2027 | 12/1/2027 | 10.00% | 4,770,000 | 2,623,500 | ||||||||||||||
Indy Oak Tod MD – Series A – 2050 | 12/1/2050 | 5.50% | 1,070,000 | 1,089,560 | ||||||||||||||
Indy Oak Tod MD – Series B – 2050(g) | 12/15/2050 | 8.00% | 736,000 | 785,916 | ||||||||||||||
Inspiration MD – Series B – 2036(g) | 12/15/2036 | 5.00% | 761,000 | 698,484 | ||||||||||||||
Jay Grove MD – Series A – 2051(g) | 12/1/2051 | 4.25% | 2,450,000 | 1,895,467 | ||||||||||||||
Jefferson Center MD #1 – Series B – 2050(g) | 12/15/2050 | 5.75% | 14,414,000 | 14,453,639 | ||||||||||||||
Karl’s Farm MD #2 – Series A – 2040 | 12/1/2040 | 5.38% | 1,155,000 | 1,120,258 | ||||||||||||||
Karl’s Farm MD #2 – Series A – 2050 | 12/1/2050 | 5.63% | 3,030,000 | 2,902,649 | ||||||||||||||
The Lakes MD #4 – Series A – 2061(g) | 12/1/2061 | 5.50% | 20,080,000 | 16,960,371 | ||||||||||||||
Lanterns MD #2 – Series A – 2050(g) | 12/1/2050 | 4.50% | 12,492,000 | 9,398,856 | ||||||||||||||
Legato Community Authority – Series A – 2036 | 12/1/2036 | 4.00% | 2,130,000 | 1,830,714 | ||||||||||||||
Legato Community Authority – Series A – 2046 | 12/1/2046 | 5.00% | 1,000,000 | 887,650 | ||||||||||||||
Legato Community Authority – Series A – 2051 | 12/1/2051 | 5.00% | 2,500,000 | 2,169,500 | ||||||||||||||
Lincoln Meadows MD – Series A – 2031 | 12/1/2031 | 8.00% | 6,565,000 | 6,934,872 | ||||||||||||||
Loretto Heights Community Authority – Series A – 2051(g) | 12/1/2051 | 4.88% | 12,750,000 | 10,249,725 | ||||||||||||||
Marin MD – Series A – 2028(a)(j) | 12/1/2028 | 0.00% | 17,485,000 | 1,573,650 | ||||||||||||||
Mayfield MD – Series A – 2050 | 12/1/2050 | 5.75% | 1,189,000 | 1,191,925 | ||||||||||||||
Mayfield MD – Series B – 2050(g) | 12/15/2050 | 8.25% | 622,000 | 611,662 | ||||||||||||||
Mayfield MD – Series C – 2050 | 12/15/2050 | 3.00% | 766,000 | 294,443 | ||||||||||||||
Meadows MD #1 – Series A – 2029(k) | 6/1/2029 | 8.00% | 30,730,000 | 30,336,656 | ||||||||||||||
Meadows MD #2 – Series A – 2029(k) | 6/1/2029 | 8.00% | 23,830,000 | 23,524,976 | ||||||||||||||
7
Colorado BondShares
A Tax-Exempt Fund
Schedule of Investments (unaudited) — (Continued)
| Colorado Municipal Bonds (Continued) | Maturity | Coupon | Principal | Value | ||||||||||||||
| Colorado (Continued) | ||||||||||||||||||
Meadows MD #7 – Series A – 2029(k) | 6/1/2029 | 8.00% | $ | 15,440,000 | $ | 15,242,368 | ||||||||||||
Meadowlark MD – Series A – 2040 | 12/1/2040 | 4.88% | 1,045,000 | 956,614 | ||||||||||||||
Meadowlark MD – Series A – 2050 | 12/1/2050 | 5.13% | 1,505,000 | 1,386,918 | ||||||||||||||
Mirabelle MD #2 – Series A – 2049 | 12/1/2049 | 5.00% | 1,250,000 | 1,167,013 | ||||||||||||||
Mirabelle MD #2 – Series B – 2049(g) | 12/15/2049 | 7.38% | 1,473,000 | 1,381,158 | ||||||||||||||
Monument Junction MD #1 – Series A – 2051(g) | 12/1/2051 | 5.75% | 12,258,000 | 10,939,652 | ||||||||||||||
Mount Carbon MD – Series C – 2043 | 6/1/2043 | 0.00% | 521,078 | 521,448 | ||||||||||||||
Mountain Brook MD – Series A – 2051 | 12/1/2051 | 4.75% | 7,740,000 | 6,132,634 | ||||||||||||||
Mountain Brook MD – Series A – 2041 | 12/1/2041 | 4.50% | 1,000,000 | 830,880 | ||||||||||||||
Mountain Shadows MD – Series A – 2035 | 12/1/2035 | 5.00% | 500,000 | 502,425 | ||||||||||||||
Mountain Shadows MD – Series B – 2046(g) | 12/15/2046 | 7.50% | 1,650,000 | 1,609,526 | ||||||||||||||
Mountain Shadows MD – Series C – 2040(g) | 12/15/2040 | 10.00% | 1,994,000 | 1,947,001 | ||||||||||||||
Muegge Farms MD #1 – Series A – 2051(g) | 12/1/2051 | 5.00% | 6,300,000 | 5,395,320 | ||||||||||||||
Muegge Farms MD #3 – Series A – 2051(g) | 12/1/2051 | 5.50% | 10,431,000 | 9,244,682 | ||||||||||||||
Murphy Creek MD #5 – Series A – 2052 | 12/1/2052 | 6.00% | 2,645,000 | 2,653,490 | ||||||||||||||
Nine Mile MD – Series A – 2030 | 12/1/2030 | 4.63% | 1,125,000 | 1,129,331 | ||||||||||||||
Nine Mile MD – Series A – 2040 | 12/1/2040 | 5.13% | 2,500,000 | 2,506,975 | ||||||||||||||
North Range MD #3 – Series A – 2040 | 12/1/2040 | 5.00% | 2,000,000 | 1,978,640 | ||||||||||||||
Painted Prairie Improvement Authority – Series A – 2029 | 12/1/2029 | 4.00% | 1,000,000 | 943,790 | ||||||||||||||
Palisade Park North MD #2 – Series A – 2047 | 12/1/2047 | 5.63% | 1,723,000 | 1,727,583 | ||||||||||||||
Parkdale Community Authority – Series A – 2040 | 12/1/2040 | 5.00% | 3,140,000 | 3,021,151 | ||||||||||||||
Parkdale Community Authority – Series A – 2050 | 12/1/2050 | 5.25% | 5,620,000 | 5,216,765 | ||||||||||||||
Parkdale Community Authority – Series B – 2050(g) | 12/15/2050 | 7.75% | 2,424,000 | 2,263,531 | ||||||||||||||
Parkdale Community Authority MD #2 – Series B – 2053(g) | 12/15/2053 | 9.00% | 1,391,000 | 1,381,124 | ||||||||||||||
Parker Automotive MD – Series A – 2045 | 12/1/2045 | 5.00% | 1,864,000 | 1,940,051 | ||||||||||||||
Pioneer Community Authority – Series B – 2050(g) | 12/15/2050 | 6.75% | 24,592,000 | 23,114,513 | ||||||||||||||
The Plaza MD #1 – Series A – 2040(m) | 12/1/2040 | 5.00% | 7,850,000 | 7,818,443 | ||||||||||||||
Powhaton Community Authority – Series A – 2051(g) | 12/1/2051 | 5.00% | 7,450,000 | 6,504,968 | ||||||||||||||
Pronghorn Valley MD – Series A – 2041 | 12/1/2041 | 3.75% | 515,000 | 416,305 | ||||||||||||||
Pronghorn Valley MD – Series A – 2051 | 12/1/2051 | 4.00% | 4,400,000 | 3,419,020 | ||||||||||||||
PFA / Monument Academy – Series A – 2026(m) | 6/1/2026 | 5.00% | 28,570,000 | 28,126,308 | ||||||||||||||
Reata Ridge Village MD #2 – Series A – 2049 | 12/1/2049 | 5.00% | 1,784,000 | 1,696,174 | ||||||||||||||
Rendezvous MD #4 – Series B – 2048(g) | 10/15/2048 | 8.00% | 1,189,000 | 1,131,524 | ||||||||||||||
Remuda Ridge MD – Series A – 2051(g) | 12/1/2051 | 5.63% | 5,520,000 | 4,935,211 | ||||||||||||||
Reserve MD #2 – Series A – 2045 | 12/1/2045 | 5.00% | 500,000 | 477,100 | ||||||||||||||
Ritoro MD – Series B – 2049(g) | 12/15/2049 | 8.50% | 2,190,000 | 2,254,561 | ||||||||||||||
Riverdale Peaks II MD – Series A – 2025 | 12/1/2025 | 6.40% | 930,000 | 762,600 | ||||||||||||||
8
Colorado BondShares
A Tax-Exempt Fund
Schedule of Investments (unaudited) — (Continued)
| Colorado Municipal Bonds (Continued) | Maturity | Coupon | Principal | Value | ||||||||||||||
| Colorado (Continued) | ||||||||||||||||||
Riverdale Peaks II MD – Series A – 2035 | 12/1/2035 | 6.50% | $ | 1,135,000 | $ | 930,700 | ||||||||||||
Riverview MD – Series A – 2041 | 12/1/2041 | 5.00% | 1,105,000 | 1,019,086 | ||||||||||||||
Riverview MD – Series A – 2051 | 12/1/2051 | 5.00% | 2,075,000 | 1,841,521 | ||||||||||||||
Rock Creek MD – Series A – 2041 | 12/1/2041 | 4.50% | 2,230,000 | 1,863,500 | ||||||||||||||
Rock Creek MD – Series A – 2050 | 12/1/2050 | 4.75% | 3,880,000 | 3,086,501 | ||||||||||||||
Rock Creek MD – Series A – 2031(g) | 12/1/2031 | 4.00% | 3,432,000 | 3,132,627 | ||||||||||||||
Rose Hill Acres MD – Series A – 2050 | 12/1/2050 | 5.00% | 2,965,000 | 2,700,759 | ||||||||||||||
Rose Hill Acres MD – Series B – 2050(g) | 12/15/2050 | 8.75% | 910,000 | 874,091 | ||||||||||||||
RRC MD #2 – Series A – 2051(g) | 12/1/2051 | 5.25% | 5,625,000 | 4,895,888 | ||||||||||||||
Sabell MD – Series A – 2050(g) | 12/1/2050 | 5.00% | 1,055,000 | 963,679 | ||||||||||||||
Sabell MD – Series B – 2050(g) | 12/15/2050 | 8.25% | 605,000 | 577,164 | ||||||||||||||
Silver Peaks East MD – Series A – 2051(g) | 12/1/2051 | 5.00% | 5,410,000 | 4,639,508 | ||||||||||||||
64th Avenue ARI Authority – Series A – 2043(g) | 12/1/2043 | 6.50% | 5,000,000 | 4,981,400 | ||||||||||||||
Solitude MD – Series A – 2026(j) | 12/1/2026 | 7.00% | 3,520,000 | 2,820,968 | ||||||||||||||
Southglenn MD – Series A – 2030 | 12/1/2030 | 5.00% | 2,285,000 | 2,282,418 | ||||||||||||||
Southglenn MD – Series A – 2046 | 12/1/2046 | 5.00% | 2,075,000 | 1,935,021 | ||||||||||||||
Southlands MD #1 – Series A – 2037 | 12/1/2037 | 5.00% | 500,000 | 501,505 | ||||||||||||||
Southlands MD #1 – Series A – 2047 | 12/1/2047 | 5.00% | 3,000,000 | 2,917,590 | ||||||||||||||
Southshore MD #2 – Series B – 2041(g) | 12/15/2041 | 4.13% | 9,690,000 | 9,723,043 | ||||||||||||||
Spring Hill MD #3 – Series A – 2052 | 12/1/2052 | 6.75% | 10,305,000 | 10,559,740 | ||||||||||||||
Spring Valley MD #4 – Series A – 2040 | 12/1/2040 | 5.00% | 1,410,000 | 1,324,046 | ||||||||||||||
Spring Valley MD #4 – Series A – 2050 | 12/1/2050 | 5.12% | 1,775,000 | 1,584,543 | ||||||||||||||
Spring Valley MD #4 – Series B – 2050(g) | 12/15/2050 | 7.63% | 2,811,000 | 2,607,427 | ||||||||||||||
St Vrain Lakes MD #2 – Series A – 2037 | 12/1/2037 | 5.00% | 4,000,000 | 4,004,960 | ||||||||||||||
St Vrain Lakes MD #2 – Series A – 2047 | 12/1/2047 | 5.13% | 3,050,000 | 3,009,588 | ||||||||||||||
St Vrain Lakes MD #2 – Series B – 2047(g) | 12/15/2047 | 7.63% | 1,083,000 | 1,089,509 | ||||||||||||||
STC MD #2 – Series A – 2025 | 12/1/2025 | 3.00% | 555,000 | 536,635 | ||||||||||||||
STC MD #2 – Series A – 2029 | 12/1/2029 | 4.00% | 1,615,000 | 1,538,724 | ||||||||||||||
STC MD #2 – Series A – 2038 | 12/1/2038 | 5.00% | 15,160,000 | 14,335,296 | ||||||||||||||
STC MD #2 – Series B – 2049(g) | 12/15/2049 | 8.00% | 3,954,000 | 3,698,651 | ||||||||||||||
Sterling Ranch MD #2 – Series A – 2032 | 12/1/2032 | 5.25% | 1,340,000 | 1,356,294 | ||||||||||||||
Sterling Ranch MD #2 – Series A – 2042 | 12/1/2042 | 5.50% | 5,645,000 | 5,607,461 | ||||||||||||||
Sterling Ranch MD #2 – Series A – 2051 | 12/1/2051 | 5.75% | 11,750,000 | 11,744,243 | ||||||||||||||
Stetson Ridge MD #3 – Series B – 2042(g)(m) | 12/15/2042 | 7.50% | 210,000 | 199,099 | ||||||||||||||
Stone Ridge MD #2 – Series A – 2031 | 12/1/2031 | 0.00% | 11,896,000 | 1,903,360 | ||||||||||||||
Third Creek MD #1 – Series A – 2037 | 12/1/2037 | 4.50% | 1,130,000 | 998,728 | ||||||||||||||
Third Creek MD #1 – Series A – 2042 | 12/1/2042 | 4.50% | 3,140,000 | 2,600,705 | ||||||||||||||
Third Creek MD #1 – Series A – 2051 | 12/1/2051 | 4.75% | 7,390,000 | 5,895,742 | ||||||||||||||
9
Colorado BondShares
A Tax-Exempt Fund
Schedule of Investments (unaudited) — (Continued)
| Colorado Municipal Bonds (Continued) | Maturity | Coupon | Principal | Value | ||||||||||||||
| Colorado (Continued) | ||||||||||||||||||
Thompson Crossing MD #4 – Series A – 2039 | 12/1/2039 | 5.00% | $ | 1,410,000 | $ | 1,394,631 | ||||||||||||
Thompson Crossing MD #4 – Series A – 2049 | 12/1/2049 | 5.00% | 1,315,000 | 1,212,417 | ||||||||||||||
Trails At Crowfoot MD #3 – Series B – 2049(g) | 12/15/2049 | 9.00% | 3,135,000 | 3,124,498 | ||||||||||||||
Valagua MD – Series A – 2037 | 12/1/2037 | 0.00% | 11,500,000 | 2,300,000 | ||||||||||||||
Villages At Murphy Creek MD #1 – Series A – 2051(g) | 12/1/2051 | 5.50% | 12,358,000 | 10,837,719 | ||||||||||||||
Vincent Village MD – Series A – 2051 | 12/1/2051 | 5.00% | 1,970,000 | 1,721,544 | ||||||||||||||
Waterfall MD #1 – Series A – 2052 | 12/1/2052 | 5.25% | 2,282,000 | 2,166,006 | ||||||||||||||
Westcreek MD #2 – Series A – 2048 | 12/1/2048 | 5.38% | 1,300,000 | 1,260,207 | ||||||||||||||
Westerly MD #4 – Series A – 2031 | 12/1/2031 | 4.13% | 600,000 | 549,738 | ||||||||||||||
Westerly MD #4 – Series A – 2040 | 12/1/2040 | 5.00% | 2,255,000 | 2,053,583 | ||||||||||||||
Westerly MD #4 – Series A – 2050 | 12/1/2050 | 5.00% | 5,250,000 | 4,561,515 | ||||||||||||||
White Buffalo MD #3 – Series A – 2050 | 12/1/2050 | 5.50% | 4,780,000 | 4,585,932 | ||||||||||||||
Wild Plum MD – Series A – 2049 | 12/1/2049 | 5.00% | 595,000 | 617,949 | ||||||||||||||
Willow Springs MD – Series B – 2049(g) | 12/15/2049 | 7.75% | 650,000 | 611,039 | ||||||||||||||
Woodmen Heights MD #2 – Series B – 2040(g) | 12/15/2040 | 7.50% | 3,358,000 | 3,175,459 | ||||||||||||||
Wyndham Hill MD #2 – Series B – 2049(g) | 12/15/2049 | 7.63% | 9,600,000 | 9,192,384 | ||||||||||||||
|
|
|
| |||||||||||||||
Colorado (amortized cost $1,218,229,572) | 1,292,494,507 | 1,147,897,560 | ||||||||||||||||
|
|
|
| |||||||||||||||
Colorado Municipal Bonds | $ | 1,292,494,507 | $ | 1,147,897,560 | ||||||||||||||
|
|
|
| |||||||||||||||
| Other Municipal Bonds 5.3% | ||||||||||||||||||
| South Dakota 76.5% | ||||||||||||||||||
Flandreau Santee Sioux Tribe / Healthcare – Series A – 2036(m) | 1/1/2036 | 5.75% | $ | 6,055,000 | $ | 4,583,696 | ||||||||||||
Flandreau Santee Sioux Tribe / Healthcare – Series A – 2026(m) | 1/1/2026 | 5.00% | 1,190,000 | 1,131,226 | ||||||||||||||
Flandreau Santee Sioux Tribe / Healthcare – Series A – 2031(m) | 1/1/2031 | 5.50% | 3,565,000 | 2,975,385 | ||||||||||||||
Flandreau Santee Sioux Tribe / Gaming – Series B – 2038(g)(m) | 1/1/2038 | 6.00% | 6,120,000 | 5,177,520 | ||||||||||||||
Flandreau Santee Sioux Tribe / Gaming – Series C – 2038(m) | 1/1/2038 | 6.00% | 5,450,000 | 4,610,700 | ||||||||||||||
Flandreau Santee Sioux Tribe / Gaming – Series A – 2026(m) | 1/1/2026 | 8.28% | 1,115,000 | 1,070,378 | ||||||||||||||
Flandreau Santee Sioux Tribe / Gaming – Series A – 2027(m) | 1/1/2027 | 8.28% | 1,205,000 | 1,145,413 | ||||||||||||||
10
Colorado BondShares
A Tax-Exempt Fund
Schedule of Investments (unaudited) — (Continued)
| Other Municipal Bonds (Continued) | Maturity | Coupon | Principal | Value | ||||||||||||||
| South Dakota (Continued) | ||||||||||||||||||
Flandreau Santee Sioux Tribe / Gaming – Series A – 2028(m) | 1/1/2028 | 8.28% | $ | 1,305,000 | $ | 1,233,225 | ||||||||||||
Flandreau Santee Sioux Tribe / Gaming – Series A – 2033(m) | 1/1/2033 | 8.28% | 8,670,000 | 8,079,833 | ||||||||||||||
Flandreau Santee Sioux Tribe / Healthcare NH – Series A – 2025(m) | 7/1/2025 | 5.75% | 740,000 | 718,903 | ||||||||||||||
Flandreau Santee Sioux Tribe / Healthcare NH – Series A – 2026(m) | 7/1/2026 | 5.75% | 785,000 | 749,377 | ||||||||||||||
Flandreau Santee Sioux Tribe / Healthcare NH – Series A – 2027(m) | 7/1/2027 | 5.75% | 830,000 | 777,635 | ||||||||||||||
Flandreau Santee Sioux Tribe / Healthcare NH – Series A – 2028(m) | 7/1/2028 | 5.75% | 875,000 | 806,951 | ||||||||||||||
Flandreau Santee Sioux Tribe / Healthcare NH – Series A – 2029(m) | 7/1/2029 | 5.75% | 930,000 | 843,873 | ||||||||||||||
Flandreau Santee Sioux Tribe / Healthcare NH – Series A – 2030(m) | 7/1/2030 | 5.75% | 980,000 | 875,787 | ||||||||||||||
Flandreau Santee Sioux Tribe / Healthcare NH – Series A – 2031(m) | 7/1/2031 | 5.75% | 1,040,000 | 916,209 | ||||||||||||||
Flandreau Santee Sioux Tribe / Healthcare NH – Series A – 2032(m) | 7/1/2032 | 5.75% | 1,095,000 | 951,194 | ||||||||||||||
Flandreau Santee Sioux Tribe / Healthcare NH – Series A – 2033(m) | 7/1/2033 | 5.75% | 1,160,000 | 995,002 | ||||||||||||||
Flandreau Santee Sioux Tribe / Healthcare NH – Series A – 2034(m) | 7/1/2034 | 5.75% | 1,225,000 | 1,038,396 | ||||||||||||||
Flandreau Santee Sioux Tribe / Healthcare NH – Series A – 2035(m) | 7/1/2035 | 5.75% | 1,300,000 | 1,089,842 | ||||||||||||||
Flandreau Santee Sioux Tribe / Healthcare NH – Series A – 2040(m) | 7/1/2040 | 6.00% | 7,730,000 | 6,217,548 | ||||||||||||||
Flandreau Santee Sioux Tribe / Healthcare NH – Series A – 2045(m) | 7/1/2045 | 6.25% | 10,395,000 | 8,154,150 | ||||||||||||||
Oglala Sioux Tribe / Healthcare – Series A – 2028(m) | 7/1/2028 | 5.50% | 2,200,000 | 2,039,246 | ||||||||||||||
Oglala Sioux Tribe / Healthcare – Series A – 2037(m) | 7/1/2037 | 6.00% | 9,270,000 | 7,460,403 | ||||||||||||||
Oglala Sioux Tribe / Healthcare – Series B – 2041(m) | 9/1/2041 | 6.50% | 5,880,000 | 4,761,859 | ||||||||||||||
Oglala Sioux Tribe – Series C – 2026(m) | 10/1/2026 | 8.00% | 800,000 | 781,936 | ||||||||||||||
Oglala Sioux Tribe – Series A – 2027(m) | 10/1/2027 | 4.50% | 2,370,000 | 2,180,779 | ||||||||||||||
|
|
|
| |||||||||||||||
South Dakota (amortized cost $84,280,000) | 84,280,000 | 71,366,464 | ||||||||||||||||
|
|
|
| |||||||||||||||
11
Colorado BondShares
A Tax-Exempt Fund
Schedule of Investments (unaudited) — (Continued)
| Other Municipal Bonds (Continued) | Maturity | Coupon | Principal | Value | ||||||||||||||
| Puerto Rico 10.8% | ||||||||||||||||||
Puerto Rico – Series A – 2025 | 7/1/2025 | 5.38% | $ | 103,109 | $ | 105,161 | ||||||||||||
Puerto Rico – Series A – 2027 | 7/1/2027 | 5.63% | 102,175 | 108,650 | ||||||||||||||
Puerto Rico – Series A – 2029 | 7/1/2029 | 5.63% | 100,517 | 109,964 | ||||||||||||||
Puerto Rico – Series A – 2031 | 7/1/2031 | 5.75% | 97,632 | 109,982 | ||||||||||||||
Puerto Rico – Series A – 2033 | 7/1/2033 | 4.00% | 92,580 | 92,222 | ||||||||||||||
Puerto Rico – Series A – 2035 | 7/1/2035 | 4.00% | 83,217 | 81,587 | ||||||||||||||
Puerto Rico – Series A – 2037 | 7/1/2037 | 4.00% | 71,422 | 68,922 | ||||||||||||||
Puerto Rico – Series A – 2041 | 7/1/2041 | 4.00% | 97,107 | 91,320 | ||||||||||||||
Puerto Rico – Series A – 2046 | 7/1/2046 | 4.00% | 100,990 | 92,601 | ||||||||||||||
Puerto Rico – Series A – 2033 | 7/1/2033 | 4.64% | 119,142 | 78,164 | ||||||||||||||
Puerto Rico – Series A – 2043 | 7/1/2043 | 3.00% | 410,371 | 237,195 | ||||||||||||||
Puerto Rico / Sales Tax – Series A – 2034 | 7/1/2034 | 4.50% | 277,000 | 278,485 | ||||||||||||||
Puerto Rico / Sales Tax – Series A – 2040 | 7/1/2040 | 4.55% | 140,000 | 141,229 | ||||||||||||||
Puerto Rico / Sales Tax – Series A – 2053 | 7/1/2053 | 4.75% | 1,028,000 | 1,023,096 | ||||||||||||||
Puerto Rico / Sales Tax – Series A – 2058 | 7/1/2058 | 5.00% | 2,600,000 | 2,607,696 | ||||||||||||||
Puerto Rico / Sales Tax – Series A – 2027 | 7/1/2027 | 4.41% | 267,000 | 236,204 | ||||||||||||||
Puerto Rico / Sales Tax – Series A – 2029 | 7/1/2029 | 4.69% | 260,000 | 212,958 | ||||||||||||||
Puerto Rico / Sales Tax – Series A – 2031 | 7/1/2031 | 4.96% | 336,000 | 253,660 | ||||||||||||||
Puerto Rico / Sales Tax – Series A – 2033 | 7/1/2033 | 5.20% | 378,000 | 261,606 | ||||||||||||||
Puerto Rico / Sales Tax – Series A – 2046 | 7/1/2046 | 5.97% | 3,597,000 | 1,146,436 | ||||||||||||||
Puerto Rico / Sales Tax – Series A – 2051 | 7/1/2051 | 6.02% | 2,930,000 | 683,012 | ||||||||||||||
Puerto Rico / Sales Tax – Series A – 2040 | 7/1/2040 | 4.33% | 1,424,000 | 1,424,413 | ||||||||||||||
Puerto Rico / Sales Tax – Series A – 2053 | 7/1/2053 | 4.54% | 43,000 | 41,354 | ||||||||||||||
Puerto Rico / Sales Tax – Series A – 2058 | 7/1/2058 | 4.78% | 571,000 | 566,723 | ||||||||||||||
|
|
|
| |||||||||||||||
Puerto Rico (amortized cost $8,977,158) | 15,229,262 | 10,052,640 | ||||||||||||||||
|
|
|
| |||||||||||||||
| Utah 10.3% | ||||||||||||||||||
Ares Strategic Mining – Series A – 2034(m) | 12/15/2034 | 10.00% | 10,000,000 | 9,201,000 | ||||||||||||||
Ares Strategic Mining / Taxable – Series A – 2025(m) | 12/15/2025 | 12.00% | 500,000 | 455,825 | ||||||||||||||
|
|
|
| |||||||||||||||
Utah (amortized cost $9,500,000) | 10,500,000 | 9,656,825 | ||||||||||||||||
|
|
|
| |||||||||||||||
| Washington 2.1% | ||||||||||||||||||
Tacoma / Local Improvement District #65 – Series A – 2043 | 4/1/2043 | 5.75% | 2,040,000 | 2,001,607 | ||||||||||||||
|
|
|
| |||||||||||||||
Washington (amortized cost $1,910,174) | 2,040,000 | 2,001,607 | ||||||||||||||||
|
|
|
| |||||||||||||||
12
Colorado BondShares
A Tax-Exempt Fund
Schedule of Investments (unaudited) — (Continued)
| Other Municipal Bonds (Continued) | Maturity | Coupon | Principal | Value | ||||||||||||||
| California 0.3% | ||||||||||||||||||
Freddie Mac – 2035(g)(j) | 8/15/2035 | 6.50% | $ | 256,185 | $ | 268,312 | ||||||||||||
|
|
|
| |||||||||||||||
California (amortized cost $256,185) | 256,185 | 268,312 | ||||||||||||||||
|
|
|
| |||||||||||||||
Other Municipal Bonds | $ | 112,305,447 | $ | 93,345,848 | ||||||||||||||
|
|
|
| |||||||||||||||
| Short-Term Municipal Bonds 4.5% | ||||||||||||||||||
| Colorado 66.6% | ||||||||||||||||||
Boulder Housing Authority / Broadway East – Series A – 2037 (LOC 1) | 9/1/2037 | 3.69% | $ | 1,410,000 | $ | 1,410,000 | ||||||||||||
Boulder College of Massage – Series A – 2031(a)(j) | 10/15/2031 | 0.00% | 4,315,000 | 2,337,500 | ||||||||||||||
Broomfield URA / Event Center – Series A – 2030 (LOC 2) | 12/1/2030 | 3.70% | 6,635,000 | 6,635,000 | ||||||||||||||
CHFA / Ready Foods – Series A – 2032 (LOC 1) | 1/1/2032 | 3.69% | 4,225,000 | 4,225,000 | ||||||||||||||
Colorado Springs Utilities – Series A – 2041 (LOC 1) | 11/1/2041 | 3.63% | 1,100,000 | 1,100,000 | ||||||||||||||
Jeffco Business Center MD #1 – Series A – 2023(j) | 5/1/2024 | 8.00% | 1,006,000 | 1,053,714 | ||||||||||||||
Sheridan Redevelopment Agency / Santa Fe – Series A – 2029 (LOC 3) | 12/1/2029 | 3.70% | 35,530,000 | 35,530,000 | ||||||||||||||
|
|
|
| |||||||||||||||
Colorado (amortized cost $53,715,000) | 54,221,000 | 52,291,214 | ||||||||||||||||
|
|
|
| |||||||||||||||
| Multi-State 20.5% | ||||||||||||||||||
Freddie Mac VR – 2045 (LOC 4) | 12/15/2045 | 3.67% | 16,080,000 | 16,080,000 | ||||||||||||||
|
|
|
| |||||||||||||||
Multi-State (amortized cost $16,080,000) | 16,080,000 | 16,080,000 | ||||||||||||||||
|
|
|
| |||||||||||||||
| Oregon 7.4% | ||||||||||||||||||
Multnomah County Hospital – Series A – 2023(m) | 10/1/2024 | 5.45% | 5,815,000 | 5,815,000 | ||||||||||||||
|
|
|
| |||||||||||||||
Oregon (amortized cost $5,815,000) | 5,815,000 | 5,815,000 | ||||||||||||||||
|
|
|
| |||||||||||||||
| South Dakota 4.9% | ||||||||||||||||||
Flandreau Santee Sioux Tribe / Gaming – Series A – 2025(m) | 1/1/2025 | 8.28% | 1,030,000 | 1,007,495 | ||||||||||||||
Lower Brule Sioux Tribe – Series A – 2025(m) | 3/1/2025 | 5.88% | 890,000 | 860,016 | ||||||||||||||
Oglala Sioux Tribe – Series A – 2024(m) | 10/1/2024 | 5.50% | 1,985,000 | 1,968,703 | ||||||||||||||
|
|
|
| |||||||||||||||
South Dakota (amortized cost $3,903,051) | 3,905,000 | 3,836,214 | ||||||||||||||||
|
|
|
| |||||||||||||||
| Oklahoma 0.6% | ||||||||||||||||||
Haskell County Public Facilities – Series B – 2024(g) | 4/1/2024 | 5.25% | 450,000 | 450,000 | ||||||||||||||
|
|
|
| |||||||||||||||
Oklahoma (amortized cost $450,000) | 450,000 | 450,000 | ||||||||||||||||
|
|
|
| |||||||||||||||
13
Colorado BondShares
A Tax-Exempt Fund
Schedule of Investments (unaudited) — (Continued)
| Short-Term Municipal Bonds (Continued) | Maturity | Coupon | Principal | Value | ||||||||||||||
| Puerto Rico 0.1% | ||||||||||||||||||
Puerto Rico – Series A – 2024 | 7/1/2024 | 3.20% | $ | 15,095 | $ | 14,945 | ||||||||||||
Puerto Rico / Sales Tax – Series A – 2024 | 7/1/2024 | 4.79% | 55,000 | 54,480 | ||||||||||||||
|
|
|
| |||||||||||||||
Puerto Rico (amortized cost $67,909) | 70,095 | 69,425 | ||||||||||||||||
|
|
|
| |||||||||||||||
Short-Term Municipal Bonds | $ | 80,541,095 | $ | 78,541,853 | ||||||||||||||
|
|
|
| |||||||||||||||
| Colorado Capital Appreciation and Zero Coupon Bonds 2.0% | ||||||||||||||||||
| Colorado 100.0% | ||||||||||||||||||
Bella Mesa MD – Series A CABs – 2049(m) | 12/1/2049 | 6.75% | $ | 7,565,000 | $ | 6,794,656 | ||||||||||||
Colorado International Center MD #7 – Series A CABs – 2027 | 12/1/2027 | 5.25% | 21,285,000 | 12,845,923 | ||||||||||||||
Conifer MD – Series B – 2031(a)(j) | 12/1/2031 | 0.00% | 7,470,000 | 2,323,849 | ||||||||||||||
Lanterns MD #3 – Series A CABs – 2053 | 12/1/2053 | 8.00% | 2,250,000 | 1,669,793 | ||||||||||||||
PV ERU Holding Trust – Series A CABs – 2039(a)(j)(m) | 2/14/2039 | 0.00% | 710,000 | 101,468 | ||||||||||||||
PV ERU Holding Trust – Series A CABs – 2039(a)(j)(m) | 2/14/2039 | 0.00% | 3,122,000 | 446,174 | ||||||||||||||
PV ERU Holding Trust – Series A CABs – 2039(a)(j)(m) | 2/14/2039 | 0.00% | 13,168,000 | 1,881,875 | ||||||||||||||
PV ERU Holding Trust – Series A CABs – 2039(a)(j)(m) | 12/15/2037 | 0.00% | 14,000,000 | 2,000,778 | ||||||||||||||
Parkdale Community Authority MD #2 – Series A – 2053 | 12/1/2027 | 7.75% | 5,670,000 | 4,247,170 | ||||||||||||||
Third Creek MD #1 – Series A CABs – 2026 | 12/1/2026 | 5.25% | 2,285,000 | 1,598,358 | ||||||||||||||
Westerly MD #4 – Series A CABs – 2050 | 12/1/2026 | 5.20% | 1,000,000 | 723,000 | ||||||||||||||
|
|
|
| |||||||||||||||
Colorado (amortized cost $45,305,342) | 78,525,000 | 34,633,043 | ||||||||||||||||
|
|
|
| |||||||||||||||
Colorado Capital Appreciation and Zero Coupon Bonds | $ | 78,525,000 | $ | 34,633,043 | ||||||||||||||
|
|
|
| |||||||||||||||
| Colorado Taxable Certificates/Notes/Bonds 0.5% | ||||||||||||||||||
| Colorado 100.0% | ||||||||||||||||||
Colliers Hill MD #2 / Taxable – Series B – 2047(g) | 12/15/2047 | 6.00% | $ | 2,250,000 | $ | 2,188,935 | ||||||||||||
CECFA CEC / Aurora Charter School / Taxable – Series B – 2029(m) | 7/1/2029 | 6.00% | 2,270,000 | 2,204,170 | ||||||||||||||
CECFA CEC / Aurora Charter School / Taxable – Series A – 2031(m) | 7/1/2031 | 6.13% | 1,960,000 | 1,860,295 | ||||||||||||||
CECFA Colorado Skies Academy / Taxable – Series B – 2030 | 7/1/2030 | 7.50% | 500,000 | 510,720 | ||||||||||||||
Woodmen Heights MD #2 / Taxable – Series B – 2040(g) | 12/15/2040 | 6.25% | 1,770,000 | 1,708,758 | ||||||||||||||
14
Colorado BondShares
A Tax-Exempt Fund
Schedule of Investments (unaudited) — (Continued)
| Colorado Taxable Certificates/Notes/Bonds (Continued) | Maturity | Coupon | Principal | Value | ||||||||||||||||
| Colorado (Continued) | ||||||||||||||||||||
Tabernash Pole Creek Note – 2022(a)(j) |
| 12/31/2024 | 0.00% | $ | 227,347 | $ | 200,000 | |||||||||||||
|
|
|
| |||||||||||||||||
Colorado (amortized cost $8,977,347) |
| 8,977,347 | 8,672,878 | |||||||||||||||||
|
|
|
| |||||||||||||||||
Colorado Taxable Certificates/Notes/Bonds |
| $ | 8,977,347 | $ | 8,672,878 | |||||||||||||||
|
|
|
| |||||||||||||||||
| Other Assets 0.1% | ||||||||||||||||||||
| Utah 100.0% | ||||||||||||||||||||
Ares Strategic Mining – Equity |
| 12/15/2034 | 0.00% | $ | 6,780,500 | $ | 991,038 | |||||||||||||
|
|
|
| |||||||||||||||||
Utah (amortized cost $1,000,000) |
| 6,780,500 | 991,038 | |||||||||||||||||
|
|
|
| |||||||||||||||||
Other Assets |
| $ | 6,780,500 | $ | 991,038 | |||||||||||||||
|
|
|
| |||||||||||||||||
Total investments, at value | 77.9% | $ | 1,364,082,219 | |||||||||||||||||
Other assets net of liabilities | 22.1% | 386,991,938 | ||||||||||||||||||
|
|
|
| |||||||||||||||||
Net Assets | 100.0% | $ | 1,751,074,157 | |||||||||||||||||
|
|
|
| |||||||||||||||||
15
Colorado BondShares
A Tax-Exempt Fund
Schedule of Investments (unaudited) — (Continued)
| (a) | Defaulted or non-income producing based upon the financial condition of the issuer (see note 2 in notes to financial statements). |
| (b) | Originally issued as general obligation bonds but are now pre-refunded and are secured by an escrow fund consisting entirely of direct U.S. Government obligations. No pre-refunded bonds were owned by the Fund at March 31, 2024. |
| (c) | Represents securities whose blended characteristics are reflective of a zero coupon bond and a step rate bond. Interest rate shown represents effective yield at acquisition. |
| (d) | Interest rate shown for capital appreciation and zero coupon bonds represents the effective yield at the date of acquisition. |
| (e) | Principal-only certificate represents the right to receive the principal payments on the underlying debt security upon maturity. The price of this security is typically more volatile than that of coupon-bearing bonds of the same maturity. |
| (f) | Interest-only certificate represents the right to receive semi-annual interest payments on the underlying debt security. The principal amount of the underlying security represents the notional amount on which current interest is calculated. The interest rate shown represents the effective yield at the date of acquisition. |
| (g) | Interest rate disclosed for cash flow bond represents the effective yield at March 31, 2024. Income on this security is derived from the cash flow of the issuer. |
| (h) | Represents current interest rate for a step rate bond. No step rate bonds were owned by the Fund at March 31, 2024. |
| (i) | Terms of security have been restructured since the original issuance. The total face amount of all such restructured securities approximates $10,798,429 and a value of $6,709,687 or less than 1.0% of net assets, as of March 31, 2024. |
| (j) | Securities valued at fair value (see note 2 in notes to financial statements). |
| (k) | See note 7 in notes to financial statements for further information on purchase accrued interest related to these bonds. |
| (l) | The Fund has entered into a forbearance agreement under which it agrees that the issuer may pay a reduced rate of interest in lieu of the contract rate for a period of time (see note 2 in notes to financial statements). |
See accompanying notes to financial statements.
16
Colorado BondShares
A Tax-Exempt Fund
Schedule of Investments (unaudited) — (Continued)
| (m) | Security exempt from registration under Rule 144A of the Securities Act of 1933. Such securities may be sold in transactions exempt from registration, normally to qualified institutional buyers. At March 31, 2024 the aggregate value was $536,236,661 representing 30.62% of net assets. |
| (LOC) | These securities are Variable Rate Demand Obligations (“VRDO”) with scheduled principal and interest payments that have a guaranteed liquidity provider in the form of a letter of credit. These obligations bear interest at a rate that resets daily or weekly (see note 2 in notes to financial statements). The numbered list below corresponds to the liquidity provider associated with the respective LOC. |
1. US Bank, N.A.
2. BNP Paribas
3. JP Morgan Chase Bank N.A.
4. Freddie Mac
The following abbreviations are used in the descriptions of securities included in the Schedule of Investments:
CABs — Capital Appreciation Bonds
CONV — Convertible
I/O — Interest Only
L/D — Local Improvement District
MD — Metropolitan District
P/O — Principal Only
See accompanying notes to financial statements.
17
Colorado BondShares
A Tax-Exempt Fund
Statement of Assets and Liabilities
March 31, 2024 (unaudited)
| ASSETS |
| |||
Investments, at value (amortized cost 1,458,466,738) | $ | 1,364,082,219 | ||
— see accompanying schedule | ||||
Cash | 128,553,371 | |||
Interest receivable | 171,172,936 | |||
Purchase accrued interest (note 7) | 92,156,671 | |||
Receivable for shares of beneficial interest sold | 525,836 | |||
|
| |||
TOTAL ASSETS | 1,756,491,033 | |||
|
| |||
| LIABILITIES |
| |||
Payables and other liabilities: | ||||
Dividends payable | 3,642,010 | |||
Payable for shares of beneficial interest redeemed | 701,443 | |||
Management fees payable | 743,350 | |||
Accrued expenses payable | 330,073 | |||
|
| |||
TOTAL LIABILITIES | 5,416,876 | |||
|
| |||
NET ASSETS | $ | 1,751,074,157 | ||
|
| |||
COMPOSITION OF NET ASSETS | ||||
Paid-in capital | $ | 1,842,421,580 | ||
Accumulated net realized gain | 3,037,096 | |||
Net unrealized appreciation (depreciation) of investments | (94,384,519 | ) | ||
|
| |||
NET ASSETS | $ | 1,751,074,157 | ||
|
| |||
NET ASSET PRICE AND REDEMPTION PRICE PER SHARE | $ | 8.85 | ||
|
| |||
MAXIMUM OFFERING PRICE PER SHARE | $ | 9.29 | ||
|
| |||
See accompanying notes to financial statements.
18
Colorado BondShares
A Tax-Exempt Fund
Statement of Operations
For the Six Months Ended March 31, 2024 (unaudited)
INVESTMENT INCOME | ||||
Interest | $ | 49,105,320 | ||
EXPENSES | ||||
Management fees (note 4) | 4,264,720 | |||
Custodian fees (note 5) | 53,068 | |||
Legal and auditing fees | 300,569 | |||
Portfolio pricing fees | 33,126 | |||
Registration fees | 13,353 | |||
Shareholders’ reports | 62,711 | |||
Transfer agency expenses (note 4) | 132,967 | |||
Trustees’ fees | 6,006 | |||
Other | 170,628 | |||
|
| |||
Total expenses | 5,037,148 | |||
Custody credits (note 5) | (41,056 | ) | ||
|
| |||
Net expenses | 4,996,092 | |||
|
| |||
NET INVESTMENT INCOME | 44,109,228 | |||
|
| |||
REALIZED AND UNREALIZED GAIN ON INVESTMENTS | ||||
Net realized gain on investments | 2,078,060 | |||
Net unrealized appreciation (depreciation) on investments | 84,136,822 | |||
|
| |||
NET REALIZED AND UNREALIZED GAIN ON INVESTMENTS | 86,214,882 | |||
|
| |||
NET INCREASE (DECREASE) IN NET ASSETS RESULTING FROM OPERATIONS | $ | 130,324,110 | ||
|
|
See accompanying notes to financial statements.
19
Colorado BondShares
A Tax-Exempt Fund
Statements of Changes in Net Assets
For the Periods Indicated
| Six Months Ended March 31, 2024 | Year Ended September 30, 2023 | |||||||
| (unaudited) | ||||||||
FROM OPERATIONS: | ||||||||
Net investment income | $ | 44,109,228 | $ | 84,472,368 | ||||
Net realized gain on investments | 2,078,060 | 948,317 | ||||||
Unrealized appreciation (depreciation) on investments | 84,136,822 | (15,174,705 | ) | |||||
|
|
|
| |||||
Net increase (decrease) in net assets resulting from operations | 130,324,110 | 70,245,980 | ||||||
|
|
|
| |||||
FROM DISTRIBUTIONS TO SHAREHOLDERS: (note 2) | ||||||||
Dividends to shareholders from net investment income | (44,109,228 | ) | (84,472,368 | ) | ||||
Net realized gain to shareholders from investment transactions | (885,589 | ) | (3,499,687 | ) | ||||
|
|
|
| |||||
Total distributions to shareholders | (44,994,817 | ) | (87,972,055 | ) | ||||
|
|
|
| |||||
FROM BENEFICIAL INTEREST TRANSACTIONS: | ||||||||
Proceeds from sale of shares | 70,723,597 | 114,662,292 | ||||||
Reinvested dividends and distributions | 31,499,221 | 60,880,851 | ||||||
Redemption of shares | (82,655,007 | ) | (187,309,859 | ) | ||||
|
|
|
| |||||
Increase (decrease) in net assets derived from beneficial interest transactions | 19,567,811 | (11,766,716 | ) | |||||
|
|
|
| |||||
Net increase (decrease) in net assets | 104,897,105 | (29,492,791 | ) | |||||
NET ASSETS: | ||||||||
Beginning of period | 1,646,177,052 | 1,675,669,843 | ||||||
|
|
|
| |||||
End of period | $ | 1,751,074,157 | $ | 1,646,177,052 | ||||
|
|
|
| |||||
See accompanying notes to financial statements.
20
Colorado BondShares
A Tax-Exempt Fund
Financial Highlights
The financial highlights table is intended to help you understand the Fund’s financial performance. Certain information reflects financial results for a single Fund share. The total returns in the table represent the rate that an investor would have earned (or lost) on an investment in the Fund (assuming reinvestment of all dividends and distributions). Sales charges are not reflected in the total returns.
| For the Fiscal Year Ended September 30 | ||||||||||||||||||||
| 3/31/2024 | 2023 | 2022 | 2021 | 2020 | ||||||||||||||||
| For a share outstanding throughout the period | (unaudited) | |||||||||||||||||||
Net asset value, beginning of period | $ | 8.41 | $ | 8.50 | $ | 9.39 | $ | 9.22 | $ | 9.25 | ||||||||||
|
|
|
|
|
|
|
|
|
| |||||||||||
Income From Investment Operations | ||||||||||||||||||||
Net investment income(1) | 0.22 | 0.43 | 0.37 | 0.37 | 0.37 | |||||||||||||||
Net gain or (loss) on investments (both realized and unrealized) | 0.45 | (0.07 | ) | (0.88 | ) | 0.19 | (0.03 | ) | ||||||||||||
|
|
|
|
|
|
|
|
|
| |||||||||||
Increase (decrease) from investment operations | 0.67 | 0.36 | (0.51 | ) | 0.56 | 0.34 | ||||||||||||||
Less Distributions | ||||||||||||||||||||
Dividends to shareholders from net investment income | (0.22 | ) | (0.43 | ) | (0.37 | ) | (0.37 | ) | (0.37 | ) | ||||||||||
Distributions from realized capital gains | — | (0.02 | ) | (0.01 | ) | (0.02 | ) | — | ||||||||||||
|
|
|
|
|
|
|
|
|
| |||||||||||
Total Distributions | (0.22 | ) | (0.45 | ) | (0.38 | ) | (0.39 | ) | (0.37 | ) | ||||||||||
|
|
|
|
|
|
|
|
|
| |||||||||||
Net increase (decrease) in net asset value | 0.44 | (0.09 | ) | (0.89 | ) | 0.17 | (0.03 | ) | ||||||||||||
|
|
|
|
|
|
|
|
|
| |||||||||||
Net Asset Value, end of period | $ | 8.85 | $ | 8.41 | $ | 8.50 | $ | 9.39 | $ | 9.22 | ||||||||||
|
|
|
|
|
|
|
|
|
| |||||||||||
Total Return, at Net Asset Value(2) | 8.00 | %+ | 4.21 | % | -5.72 | % | 5.91 | % | 3.83 | % | ||||||||||
|
|
|
|
|
|
|
|
|
| |||||||||||
Ratios/Supplemental Data: | ||||||||||||||||||||
Ratios to average net assets: | ||||||||||||||||||||
Net investment income | 5.19 | %* | 4.99 | % | 4.01 | % | 3.92 | % | 4.02 | % | ||||||||||
Total expenses | 0.59 | %* | 0.61 | % | 0.55 | % | 0.61 | % | 0.58 | % | ||||||||||
Net expenses | 0.59 | %* | 0.61 | % | 0.55 | % | 0.61 | % | 0.57 | % | ||||||||||
Net assets, end of period (000s) | $ | 1,751,074 | $ | 1,646,177 | $ | 1,675,670 | $ | 1,768,143 | $ | 1,494,477 | ||||||||||
|
|
|
|
|
|
|
|
|
| |||||||||||
Portfolio turnover rate(3) | 4.05 | % | 6.23 | % | 9.94 | % | 10.66 | % | 22.54 | % | ||||||||||
|
|
|
|
|
|
|
|
|
| |||||||||||
| + | not annualized |
| * | annualized |
| (1) | Net investment income per share was calculated using an average shares method. |
| (2) | Assumes a hypothetical initial investment on the business day before the first day of the fiscal period, with all dividends reinvested in additional shares on the reinvestment date, and redemption at the net asset value calculated on the last business day of the fiscal period. Sales charges are not reflected in the total returns. |
| (3) | The portfolio turnover rate is computed by dividing the lesser of purchases or sales of portfolio securities for a period by the monthly average of the value of portfolio securities owned during the period. Sales of securities include the proceeds of securities that have been called or for which payment has been made through redemption or maturity. Securities with a maturity date of one year or less at the time of acquisition are excluded from the calculation. Cost of purchases and proceeds from sales of investment securities (excluding short-term securities) for the period ended March 31, 2024 were $51,753,792 and $86,017,298 respectively. |
See accompanying notes to financial statements.
21
Colorado BondShares
A Tax-Exempt Fund
Notes to Financial Statements (unaudited)
| (1) | Organization |
Colorado BondShares — Tax-Exempt Fund (the “Fund”) is registered under the Investment Company Act of 1940, as amended, as a diversified, open-end management company. The Fund’s investment objectives are to maximize income exempt from federal income taxes and from personal income taxes of the State of Colorado to the extent consistent with the preservation of capital and to seek opportunities for capital appreciation. The Fund’s investment adviser is Freedom Funds Management Company (“Freedom Funds”).
| (2) | Summary of Significant Accounting Policies |
These financial statements have been prepared in conformity with accounting principles generally accepted in the United States of America. This requires management to make estimates and assumptions that affect the reported amounts of assets and liabilities and disclosure of contingent assets and liabilities at the date of the financial statements and the reported amounts of income and expenses during the reporting period. Actual results could differ from those estimates. These financial statements reflect all adjustments which are, in the opinion of management, necessary to a fair statement of financial position and results of operations for the reporting period. The following summarizes the significant accounting policies of the Fund:
| (a) | Investment Valuation and Risk |
The fair value of securities for which there is no last sales price is determined either by an independent pricing service or management, considering market transactions and dealer quotes of comparable securities as well as proprietary pricing models.
Securities for which market quotations are not readily available (or management considers otherwise are no longer valid or reliable) are valued at fair value determined in accordance with procedures approved by the Board of Trustees. This can occur in the event of, among other things, natural disasters, acts of terrorism, market disruptions, intra-day trading halts, and extreme market volatility. The determination of fair value involves subjective judgments. As a result, using fair value to price a security may result in a price materially different from the prices used by other mutual funds to determine net asset value or the price that may be realized upon the actual sale of the security. Short-term holdings are valued at current market quotations or amortized cost, whichever management believes best approximates fair value.
Fixed-income securities owned by the Fund are subject to interest-rate risk, credit risk, prepayment risk and market risk. The Fund invests in non-rated securities which may be subject to a greater degree of credit risk and risk of loss of income and principal and may be more sensitive to economic conditions than lower yielding, higher rated fixed income securities. The Fund concentrates its investments in Colorado and, therefore, may be impacted by specific events, issuers or factors affecting Colorado. The Fund has more credit risk related to the economic conditions of Colorado than a portfolio with a broader geographical diversification. The Fund concentrates its investments in and the majority of the Fund’s shareholders are
22
Colorado BondShares
A Tax-Exempt Fund
Notes to Financial Statements (unaudited) — (Continued)
located within Colorado and, therefore, may be impacted by specific events, issuers or factors affecting Colorado. The Company does not have any significant concentrations within any one shareholder.
Accounting Standards Codification (“ASC”) 820 Fair Value Measurements and Disclosures establishes a fair value hierarchy that classifies securities based on valuation techniques used to measure fair value and distinguish between observable inputs (market data obtained from independent sources) and the reporting entities own assumptions, which are not readily observable to market participants. The fair value hierarchy gives the highest priority to quoted prices (unadjusted) in active markets for identical assets or liabilities (Level 1) and the lowest priority to unobservable inputs (Level 3).
Level 1 Inputs: Quoted prices (unadjusted) in active markets for identical assets or liabilities that the reporting entity has the ability to access at the measurement date.
Level 2 Inputs: Inputs other than quoted prices included within Level 1 that are observable for the asset or liability, either directly or indirectly. If the asset or liability has a specified (contractual) term, a Level 2 input must be observable for substantially the full term of the asset or liability.
Level 3 Inputs: Significant unobservable inputs for the asset or liability including management’s own assumptions. Unobservable inputs shall be used to measure fair value to the extent that observable inputs are not available.
The following table summarizes the valuation of the Fund’s investments as defined by ASC 820 hierarchy levels as of March 31, 2024:
Valuation Inputs Summary
| Colorado Municipal Bonds | Other Municipal Bonds | Short-Term Municipal Bonds | Colorado Capital Appreciation and Zero Coupon Bonds | Colorado Taxable Certificates/ Notes/ Bonds | Other Assets | Total Securities March 31, 2024 | ||||||||||||||||||||||
Level 1 Securities | $ | — | $ | — | $ | — | $ | — | $ | — | $ | — | $ | — | ||||||||||||||
Level 2 Securities | 1,133,689,291 | 93,077,536 | 75,150,639 | 27,878,899 | 8,472,878 | 991,038 | 1,339,260,281 | |||||||||||||||||||||
Level 3 Securities | 14,208,269 | 268,312 | 3,391,214 | 6,754,143 | 200,000 | — | 24,821,938 | |||||||||||||||||||||
|
|
|
|
|
|
|
|
|
|
|
|
|
| |||||||||||||||
Totals | $ | 1,147,897,560 | $ | 93,345,848 | $ | 78,541,853 | $ | 34,633,042 | $ | 8,672,878 | $ | 991,038 | $ | 1,364,082,219 | ||||||||||||||
|
|
|
|
|
|
|
|
|
|
|
|
|
| |||||||||||||||
23
Colorado BondShares
A Tax-Exempt Fund
Notes to Financial Statements (unaudited) — (Continued)
| Colorado Municipal Bonds | Other Municipal Bonds | Short-Term Municipal Bonds | Colorado Capital Appreciation and Zero Coupon Bonds | Colorado Taxable Certificates/ Notes/Bonds | Other Assets | Totals | ||||||||||||||||||||||
Level 3 Beginning Balance September 30, 2023 | $ | 13,472,289 | $ | 273,893 | $ | 3,351,064 | $ | 8,749,428 | $ | 200,000 | $ | 0 | $ | 26,046,674 | ||||||||||||||
Unrealized Losses | — | (228 | ) | — | (2,079,706 | ) | — | — | (2,079,934 | ) | ||||||||||||||||||
Unrealized Gains | 735,980 | — | 40,150 | 84,421 | — | — | 860,551 | |||||||||||||||||||||
Realized Losses | — | — | — | — | — | — | — | |||||||||||||||||||||
Realized Gains | — | — | — | — | — | — | — | |||||||||||||||||||||
Purchases | — | — | — | — | — | — | — | |||||||||||||||||||||
Sales | — | (5,353 | ) | — | — | — | — | (5,353 | ) | |||||||||||||||||||
Transfers In to Level 3* | — | — | — | — | — | — | — | |||||||||||||||||||||
Transfers Out of Level 3* | — | — | — | — | — | — | — | |||||||||||||||||||||
|
|
|
|
|
|
|
|
|
|
|
|
|
| |||||||||||||||
Balance as of March 31, 2024 | $ | 14,208,269 | $ | 268,312 | $ | 3,391,214 | $ | 6,754,143 | $ | 200,000 | $ | 0 | $ | 24,821,938 | ||||||||||||||
|
|
|
|
|
|
|
|
|
|
|
|
|
| |||||||||||||||
* Transfers from Level 2 to Level 3 are because of a lack, or change of observable inputs or reduced market data reliability. Transfers from Level 3 to Level 2 are the result of observable inputs becoming available or increased market data reliability. The Fund’s policy is to recognize transfers into and out of Level 3 when management becomes aware of a change to significant observable input or market data reliability.
From September 30, 2023 to March 31, 2024, there were no Level 1 Securities.
Significant Unobservable Inputs Quantitative Disclosure
Level 3 Securities* | Fair Value as of March 31, 2024 | Valuation Technique(s)** | Unobservable Inputs | Low | High | Weighted Average | ||||||||||||||
Colorado Municipal Bonds | $ | 14,208,269 | discounted cash flow | probability of default | 5.00% | 100.00% | 31.74% | |||||||||||||
Other Municipal Bonds | 268,312 | discounted cash flow | probability of default | 1.00% | 1.00% | 1.00% | ||||||||||||||
Short-Term Municipal Bonds | 3,391,214 | discounted cash flow | probability of default | 5.00% | 10.00% | 6.55% | ||||||||||||||
Colorado Capital Appreciation and Zero Coupon Bonds | 6,754,143 | discounted cash flow | probability of default | 5.00% | 100.00% | 98.57% | ||||||||||||||
Colorado Taxable Certificates/Notes/Bonds | 200,000 | discounted cash flow | probability of default | 100.00% | 100.00% | 100.00% | ||||||||||||||
Other Assets | — | discounted cash flow | probability of default | 0.00% | 0.00% | 0.00% | ||||||||||||||
|
| |||||||||||||||||||
Total Level 3 Securities at March 31, 2024 | $ | 24,821,938 | ||||||||||||||||||
|
| |||||||||||||||||||
24
Colorado BondShares
A Tax-Exempt Fund
Notes to Financial Statements (unaudited) — (Continued)
The significant unobservable inputs used in the fair value measurement of the Fund’s securities are collateral value, probability of default, and loss severity in the event of default. Any changes in unobservable inputs may result in substantial changes to fair value measurements.
* The inputs for these securities are not readily available or cannot be reasonably estimated and are generally those inputs described in Note 2(a). The appropriateness of fair values for these securities is based on results of back testing, broker due diligence, unchanged price review and consideration of macro or security specific events.
** Other unobservable inputs used in the discounted cash flow technique include collateral value and loss severity. These unobservable inputs are specific to the characteristics of each security being valued.
| (b) | Cash |
The Fund continually monitors its positions with, and the credit quality of, the financial institutions with which it invests. As of March 31, 2024, and periodically throughout the year, the Fund has maintained balances in various operating accounts in excess of federally insured limits.
| (c) | Income Tax Information and Distributions to Shareholders |
The Fund intends to comply with the requirements of Subchapter M of the Internal Revenue Code, as amended, applicable to regulated investment companies and to distribute all its net investment income and any net realized gain on investments not offset by capital loss carryforwards to shareholders. The Fund distributes investment income monthly and due to the tax-exempt nature of its investments, the income is generally non-taxable to the shareholders. The Fund distributes net realized capital gains, if any, to its shareholders at least annually. Income distributions and capital gain distributions are determined in accordance with income tax regulations, which may differ from generally accepted accounting principles. These differences are primarily due to the differing treatment of tax allocations.
Management has reviewed the Fund’s tax position for all open tax years. As of March 31, 2024 the Fund did not have a liability for any unrecognized tax obligations. The Fund recognizes interest and penalties, if any, related to unrecognized tax obligations as income tax expense in the Statement of Operations. The Fund has no examinations in progress.
25
Colorado BondShares
A Tax-Exempt Fund
Notes to Financial Statements (unaudited) — (Continued)
At March 31, 2024 the cost and unrealized appreciation (depreciation) of investments, as determined on a federal income tax basis, were as follows:
| Colorado Municipal Bonds | Other Municipal Bonds | Short-Term Municipal Bonds | Colorado Capital Appreciation and Zero Coupon Bonds | Colorado Taxable Certificates/ Notes/ Bonds | Other Assets | Totals | ||||||||||||||||||||||
Cost of investments | $ | 1,218,229,572 | $ | 104,923,517 | $ | 80,030,960 | $ | 45,305,342 | $ | 8,977,347 | $ | 1,000,000 | $ | 1,458,466,738 | ||||||||||||||
|
|
|
|
|
|
|
|
|
|
|
|
|
| |||||||||||||||
Gross unrealized appreciation | $ | 13,734,546 | $ | 1,372,710 | $ | 555,260 | $ | 1,197,755 | $ | 10,720 | — | $ | 16,870,991 | |||||||||||||||
Gross unrealized depreciation | ($ | 84,066,559 | ) | ($ | 12,950,379 | ) | ($ | 2,044,367 | ) | ($ | 11,870,054 | ) | ($ | 315,189 | ) | ($ | 8,962 | ) | ($ | 111,255,510 | ) | |||||||
|
|
|
|
|
|
|
|
|
|
|
|
|
| |||||||||||||||
Net unrealized appreciation (depreciation) of investments | ($ | 70,332,013 | ) | ($ | 11,577,669 | ) | ($ | 1,489,107 | ) | ($ | 10,672,299 | ) | ($ | 304,469 | ) | ($ | 8,962 | ) | ($ | 94,384,519 | ) | |||||||
|
|
|
|
|
|
|
|
|
|
|
|
|
| |||||||||||||||
For tax purposes, capital losses may be carried over to offset future capital gains, if any. Under the Regulated Investment Company Modernization Act of 2010, capital losses incurred by the Fund in taxable years beginning after December 22, 2010 are not subject to expiration and such losses retain their character as either short-term or long-term rather than being considered short-term as under previous law. Post-enactment capital losses must be fully utilized prior to utilizing any losses incurred in pre-enactment tax years.
| (d) | Defaulted or Non-income Producing Investments |
The Fund discontinues the accrual of interest income on municipal bonds when the securities become delinquent as to payment of principal or interest, or when the Fund’s investment adviser determines that an uncertainty exists as to the realization of all or a portion of the principal balance. The face amount of bonds for which the accrual of interest income has been discontinued approximates $64,252,347 and such bonds have a value of $14,865,293 or 0.85% of net assets, as of March 31, 2024. These securities have been identified in the accompanying Schedule of Investments.
The Fund has entered into forbearance agreements with one district under which it agrees that the issuer may pay a reduced rate of interest in lieu of the contract rate for a period of time. Face amount of the bonds for which the Fund has entered into forbearance agreements total $27,375,000 and have a value of $12,318,750 or 0.70% of net assets, as of March 31, 2024. These securities have been identified in the Schedule of Investments.
26
Colorado BondShares
A Tax-Exempt Fund
Notes to Financial Statements (unaudited) — (Continued)
| (e) | Investment Transactions and Revenue Recognition |
Investment transactions are accounted for on the date the investments are purchased or sold (trade date). Purchases and sales of securities, other than short-term securities, aggregated to $51,753,792 and $86,017,298 respectively.
Dividends to shareholders are declared each business day and paid monthly. Distributions to shareholders are recorded on the ex-dividend date. Realized gains and losses from investment transactions are calculated using the identified-cost basis, which is the same basis the Fund uses for federal income tax purposes. Interest income is recorded on the accrual basis.
Variable Rate Demand Obligations (“VRDO”) purchased by the Fund are floating rate obligations that have a nominal long-term maturity but have a coupon rate that is reset periodically (e.g., daily or weekly). The investor has the option to put the issue back to the trustee or tender agent at any time with specified (e.g., seven days) notice; accordingly the Fund treats these obligations as short-term holdings. On March 31, 2024, the interest rates paid on these obligations ranged from 3.63% to 3.70%.
| (f) | Classification of Distributions to Shareholders |
The character of distributions made during the year from net investment income or net realized gains may differ from its ultimate characterization for federal income tax purposes. Also, due to timing of dividend distributions, the fiscal year in which amounts are distributed may differ from the fiscal year in which the income or realized gain was recorded by the Fund.
| (g) | Securities Purchased on a When-Issued Basis |
The Fund may purchase securities on a when-issued basis with payment and delivery scheduled for a future date. These transactions are subject to market fluctuations and may increase or decrease in value prior to the delivery date. The Fund maintains segregated assets with a value equal to or greater than the amount of its purchase commitments. The Fund did not have any when-issued securities at March 31, 2024.
27
Colorado BondShares
A Tax-Exempt Fund
Notes to Financial Statements (unaudited) — (Continued)
| (3) | Shares of Beneficial Interest |
The Fund has an unlimited number of no par value shares of beneficial interest authorized. Transactions in shares of beneficial interest were as follows:
| Six Months Ended March 31, 2024 | Year Ended September 30, 2023 | |||||||||||||||
| Shares | Amount | Shares | Amount | |||||||||||||
| (unaudited) | ||||||||||||||||
Shares sold | 8,153,551 | $ | 70,723,598 | 13,268,616 | $ | 114,662,292 | ||||||||||
Dividends reinvested | 3,631,882 | 31,497,122 | 7,036,312 | 60,878,716 | ||||||||||||
|
|
|
|
|
|
|
| |||||||||
| 11,785,433 | 102,220,720 | 20,304,928 | 175,541,008 | |||||||||||||
Shares redeemed | (9,598,374 | ) | (82,652,908 | ) | (21,751,488 | ) | (187,307,725 | ) | ||||||||
|
|
|
|
|
|
|
| |||||||||
Net increase (decrease) in shares outstanding | 2,187,059 | $ | 19,567,812 | (1,446,560 | ) | $ | (11,766,717 | ) | ||||||||
|
|
|
|
|
|
|
| |||||||||
| (4) | Management Fees and Other Transactions with Affiliates |
Management fees paid to Freedom Funds were in accordance with the investment advisory agreement with the Fund which provides for an annual fee equivalent to 0.5% of the net assets of the Fund. Freedom Funds pays all expense associated with advertising, marketing, and distributing the Fund’s shares and serves as the transfer agent, dividend disbursing agent, and registrar for the Fund. Freedom Funds provided certain transfer agency and shareholder services as part of the management fee arrangement for the period ended March 31, 2024. Transfer agency expenses on the Statement of Operations represent direct expenses charged to the Fund by third parties.
Crest Insurance, an affiliate of the investment adviser, acted as agent for the Fidelity Bond and the Errors and Omissions insurance policy maintained by the Fund and as a result received compensation in the form of commissions. The policies were provided by Traveler’s Insurance Company and all the commissions referred to above were paid by Travelers. Crest Insurance received no compensation directly from the assets of the Fund.
The Fund does not have any Trustees who are affiliated with the Adviser or Distributor. The Board of Trustees appointed a Chief Compliance Officer to the Fund in accordance with federal securities regulations. The Fund does not reimburse the Adviser for any compensation or fees associated with the Chief Compliance Officer.
| (5) | Custody Credits |
Expenses paid indirectly by the Fund represent earnings credits on cash balances maintained with the Fund’s custodian bank, UMB Bank, N.A. The earnings credits resulted in offsetting custodian fees of $41,056 for the period ended March 31, 2024.
28
Colorado BondShares
A Tax-Exempt Fund
Notes to Financial Statements (unaudited) — (Continued)
| (6) | Indemnification |
From time to time the Fund may be involved in certain disputes and legal actions arising in the ordinary course of its business. While it is not feasible to predict or determine the outcome of these proceedings, in management’s opinion, based on a review with legal counsel, none of these disputes and legal actions is expected to have a material impact on its financial position or results of operations. However, litigation is subject to inherent uncertainties, and an adverse result in these matters may arise from time to time that may harm the Fund’s business.
In the normal course of business, the Fund enters into contracts that contain a variety of representations which provide general indemnifications. The Fund’s maximum exposure under these arrangements is unknown, as this would involve future claims that may be made against the Fund that have not yet occurred. However, based on experience, the Fund expects the risk of loss to be remote.
| (7) | Purchase Accrued Interest |
Purchase accrued interest is typically a component of a municipal bond purchase and is paid on settlement date. The accrual period begins on the last interest payment date (or original issue date) and runs through the day immediately preceding the settlement date. The Fund has purchased three bonds from the Meadows Metropolitan Districts No. 1, 2 and 7 with an aggregate balance of purchase accrued of $90,436,317 (98.1% of the March 31, 2024 balance of $92,156,671). Approximately $251,620,106 of additional interest has accrued on the purchase accrued interest since its purchase in 2007. This additional accrued interest has been fair valued in accordance with ASC 820 at approximately $97,046,120 and is included in other assets net of liabilities in the Schedule of Investments. This amount bears interest at the rate of 7.999% and will be received over an uncertain period of years. The value of the Meadows bonds is contained within three separate line items of the financial statements which all relate to a single set of bonds that cannot be sold separately.
| (8) | Litigation |
The Fund is periodically involved in various legal proceedings. As of March 31, 2024, the Fund has a litigation payable of $69,793 for all pending litigation matters primarily for the purpose of paying lawyer fees. Possible additional amounts cannot be currently estimated but will be set aside as needed. Although there can be no assurances, based on information available, management believes that it is probable that the ultimate outcome of the action described below and other matters that are pending or threatened will not have a material effect on the Fund’s financial condition.
Marin Metropolitan District LTD Tax G.O. Series 2008 Bond
The Fund is the beneficial owner of bonds issued in 2008 (the “Bonds”) by Marin Metropolitan District (the “District”) as described more fully in the Fund’s most recent quarterly schedule of portfolio holdings for the period ended December 31, 2023 on Form NPORT-P filed with the Securities and Exchange
29
Colorado BondShares
A Tax-Exempt Fund
Notes to Financial Statements (unaudited) — (Continued)
Commission (“SEC”) on February 28, 2024. The Bonds were issued in 2008 pursuant to a trust indenture (the “Trust Indenture”) between the District, as issuer and UMB Bank, N.A. (“UMB”), as trustee (the “Trustee”). The original principal amount of Bonds was $30,485,000. The current principal amount of the Bonds is $17,485,000. The valuation of these Bonds as of March 31, 2024 is set forth in the schedule of investments.
On about June 24, 2022, the District filed an Amended Complaint for Declaratory and Injunctive Relief (the “Complaint”) against the Fund and the Trustee with the District Court, Arapahoe County, Colorado (the “Court”). The Complaint also names Century at Landmark, LLC, a Colorado limited liability company (“Century”) as an “Interested Party” in the Complaint on the grounds that Century is the owner of the real property remaining in the District. In the Complaint, the District has asserted a single claim for relief for declaratory judgment. In essence, based on the rulings in Landmark Towers Association, Inc. v. UMB Bank, N.A. and Colorado BondShares (District Court, Arapahoe County, Colorado Case No. 11CV1076) (the “Landmark Litigation”), the District has requested that the Court declare that the Fund and the Trustee cannot compel the District to impose a tax levy on Century’s parcel of real property within the District and that, further, the Court enjoin the Fund and the Trustee from attempting to compel the District to impose the Required Mill Levy on Century’s parcel of real property within the District. In response, the Fund and the Trustee filed Amended Counterclaims for breach of the District’s resolution authorizing public debt in accordance with, and as required by, the Colorado Constitution (the “Bond Resolution”), declaratory judgment for breach of the Bond Resolution, declaratory judgment that the District has violated Colo. Const. art. XI, section 6 and the Bond Resolution, breach of the Trust Indenture, declaratory judgment that the District has violated the Trust Indenture, promissory estoppel and unjust enrichment (the “Counterclaims”). The Counterclaims seek a judgment in the full amount due and owing on the Bonds with accrued interest along with a declaration that the District is obligated to impose the Required Mill Levy under the terms of the Trust Indenture.
The District filed two motions for summary judgment on the claims in the Complaint and the Counterclaims (“MSJ”). The Fund and UMB opposed the District’s MSJ and filed a cross motion for summary judgment (“Cross MSJ”). The Court denied the District’s MSJ, except it held that the Landmark Litigation was binding on the parties on the issue that the Required Mill Levy approved and imposed by the District was a special assessment and restricted the Fund and UMB from presenting evidence to the contrary at trial. The Court also denied the Cross MSJ.
On October 16 and 17, 2023, the Court held a two-day non-jury trial on all remaining issues presented in the Complaint and the Counterclaims. The Court has not yet issued a decision on the issues and claims. At this point, it is impossible to determine the direction, cost, duration or ultimate outcome of these matters.
| (9) | Subsequent Events |
Management has evaluated the possibility of subsequent events in the Fund’s financial statements through the date of issuance. Management has determined that there are no material events that would require disclosure in the Fund’s financial statements through this date.
30
Other Information (unaudited)
Proxy Voting Record
The Fund does not invest in equity securities. Accordingly, there were no matters relating to a portfolio security considered during the 12 months ended June 30, 2023 with respect to which the Fund was entitled to vote. Applicable regulations require us to inform you that the foregoing proxy voting information is available on the SEC website at http://www.sec.gov or you may call us at 1-800-572-0069.
Quarterly Statement of Investments
The Fund files a complete statement of investments with the Securities and Exchange Commission for the first and third quarters for each fiscal year on Form N-PORT. Shareholders may view the filed Form N-PORT by visiting the Commission’s website at http://www.sec.gov. The filed form may also be viewed and copied at the Commission’s Public Reference Room in Washington, DC. Information regarding the operations of the Public Reference Room may be obtained by calling 1-800-732-0330 or you may call us at 1-800-572-0069.
31

A Tax-Exempt Fund
SEMI-ANNUAL REPORT
March 31, 2024
ITEM 2. CODE OF ETHICS.
Not required in this filing.
ITEM 3. AUDIT COMMITTEE FINANCIAL EXPERT.
Not required in this filing.
ITEM 4. PRINCIPAL ACCOUNTANT FEES AND SERVICES.
Not required in this filing.
ITEM 5. AUDIT COMMITTEE OF LISTED REGISTRANTS.
Not applicable.
ITEM 6. INVESTMENTS.
(a) Please see the Schedule of Investments contained in the Semi-Annual Report included under Item 1 of this Form N-CSR.
(b) Not applicable.
ITEM 7. DISCLOSURE OF PROXY VOTING POLICIES AND PROCEDURES FOR CLOSED-END MANAGEMENT INVESTMENT COMPANIES.
Not applicable.
ITEM 8. PORTFOLIO MANAGERS OF CLOSED-END MANAGEMENT INVESTMENT COMPANIES.
Not applicable.
ITEM 9. PURCHASES OF EQUITY SECURITIES BY CLOSED-END MANAGEMENT INVESTMENT COMPANY AND AFFILIATED PURCHASERS.
Not applicable.
ITEM 10. SUBMISSION OF MATTERS TO A VOTE OF SECURITY HOLDERS.
The registrant has not adopted procedures by which shareholders may recommend nominees to the registrant’s board of trustees.
ITEM 11. CONTROLS AND PROCEDURES.
(a) The registrant has adopted and maintained disclosure controls and procedures (as such term is defined in Rules 30a-3(c) under the Investment Company Act of 1940, as amended (the “Act”)) that are designed to ensure that information required to be disclosed in the registrant’s reports under the Act, is recorded, processed, summarized and reported within the time periods required under the SEC’s rules and forms and that the information is accumulated and communicated to the registrant’s management, including its principal executive officer and principal financial officer to allow for timely decisions regarding required disclosure.
As required by Rule 30a-3(b) of the Act, the registrant carried out an evaluation under the supervision and with the participation of its management, including its principal executive officer and principal financial officer, of the effectiveness of the design and operation of the registrant’s disclosure controls and procedures within the 90-day period prior to the filing date of this report. Based on the foregoing, the registrant’s principal executive officer and principal financial officer have concluded that the registrant’s disclosure controls and procedures were effective, as of that date.
(b) There were no changes in the registrant’s internal control over financial reporting (as defined in Rule 30a-3(d) under the Act) during the period covered by this report that has materially affected, or is reasonably likely to materially affect, the registrant’s internal control over financial reporting.
ITEM 12. DISCLOSURE OF SECURITIES LENDING ACTIVITIES FOR CLOSED-END MANAGEMENT INVESTMENT COMPANIES.
Not applicable.
ITEM 13. EXHIBITS.
| (a)(2)(i) |
(99.302) Interim President’s (Principal Executive Officer) Section 302 Certification |
| (a)(2)(ii) |
(99.302) Interim Treasurer’s (Principal Financial Officer) Section 302 Certification |
| (a)(3) Not applicable. |
| (b) |
Signatures
Pursuant to the requirements of the Securities Exchange Act of 1934 and the Investment Company Act of 1940, the registrant has duly caused this report to be signed on its behalf by the undersigned, thereunto duly authorized.
| Colorado BondShares — A Tax-Exempt Fund |
/s/ George N. Donnelly |
| George N. Donnelly, |
Interim President, Secretary and Treasurer Date: June 5, 2024 |
Pursuant to the requirements of the Securities Exchange Act of 1934 and the Investment Company Act of 1940, this report has been signed below by the following persons on behalf of the registrant and in the capacities and on the dates indicated.
/s/ George N. Donnelly |
| George N. Donnelly, |
Interim President, Secretary and Treasurer (Principal Executive Officer and Principal Financial Officer) Date: June 5, 2024 |