UNITED STATES
SECURITIES AND EXCHANGE COMMISSION
Washington, D.C. 20549
FORM N-CSR
CERTIFIED SHAREHOLDER REPORT OF REGISTERED
MANAGEMENT INVESTMENT COMPANIES
Investment Company Act file number: 811-05009
COLORADO BONDSHARES — A TAX-EXEMPT FUND
(Exact name of registrant as specified in its charter)
1200 17TH STREET, SUITE 850
DENVER, COLORADO 80202-5808
(Address of principal executive offices) (Zip code)
FRED R. KELLY, JR.
1200 17TH STREET, SUITE 850
DENVER, COLORADO 80202-5808
(Name and address of agent for service)
Registrant’s telephone number, including area code: 303-572-6990
Date of fiscal year end: 09/30
Date of reporting period: 03/31/2022
ITEM 1. REPORT TO STOCKHOLDERS.
May 26, 2022
Dear Shareholders:
If I had done my job perfectly I would have stood on our good performance last year, sold everything on December 31, 2021 and bought it all back when the market finished correcting. This strategy would have allowed us to sidestep the unsettling effects of inflation, Federal Reserve rate hikes, war in Europe, and supply troubles in China. Of course, in the real world that scenario is neither possible nor desirable. We have a portfolio of handpicked credits that took a lifetime to assemble. Some are irreplaceable and will be recognized and appreciated and distinguished by evaluators at some point. Also, if I had done as I suggested in the opening sentence then shareholders would have gone almost entirely without a dividend for all this time- unacceptable. And when it came time to buy back into the market, we would have found that there weren’t enough available bonds out there to fill the bill, likewise unacceptable.
So instead of perfect, here is what we actually did, backed up by the attached details. Last fall I worried that we had too much cash on hand totaling over $400 million. As the events of 2022 unfolded and bonds saw the worst start to a year, ever in history, this proved to be not so much of a concern as propitious. As bonds got cheaper and cheaper, we started buying not selling and have continued to do so; spending about $155 million so far in the last few months. Yes, you can make the case that we started too early and paid too much for the earlier purchases but even so we were able to buy good bonds way below their prices just weeks earlier. Of course, as we were buying bonds, the pricing services were using the trade data to price the rest of our portfolio causing additional markdowns and declines in our share price. Since we have not sold anything, the price changes are temporary, not permanent. Unlike stocks, we already know what bonds will be worth when they mature or are called, no matter what someone says they are worth today.
As of this writing, it looks like the bond market may have turned the tide, at least for now. It is a very welcome relief after roughly 12 weeks of steady declines resulting in our lowest share price since 1987. All of you that are reinvesting your dividends or periodically adding money to your account are getting more shares than before and they are now earning a higher return. There will likely be some capital gains in store for you down the road as well.
The other thing we have going for us is our shareholder base. Our shareholders are fantastic. While investors at other funds have cut and run at the first sign of distress, ours have overwhelmingly stayed
put. Many have been with us through tough times before in 2008 and 2020. They have expressed their faith that like before we will come back from a rocky start to the year and they know that they have our undying commitment to accomplish just that. Your loyalty gives us greater certainty to make plans in order to make you money.
Today is my birthday. I cannot imagine a greater birthday gift than to spare you from further agony from price declines. Today, BondShares is up 21 cents per share in the last few days of trading. Like a lot of other things this year this is unprecedented given the short time frame. Happy Birthday to me!
Sincerely,

Fred R. Kelly, Jr.
Portfolio Manager
Officers and Trustees
George N. Donnelly, Chairman of the Board of Trustees, Interim President, Secretary, Treasurer and Trustee
Bruce G. Ely, Trustee
James R. Madden, Trustee
Fred R. Kelly, Jr., Portfolio Manager
Investment Adviser
Freedom Funds Management Company
Transfer, Shareholder Servicing, and Dividend Disbursing Agent
Freedom Funds Management
Company
Distributor
Colorado Financial Service Corporation
Custodian of Portfolio Securities
UMB Bank, N.A.
Independent Registered Public Accounting Firm
Plante & Moran, PLLC
Special Legal Counsel
Kutak Rock LLP
This report is submitted for the general information of the shareholders of Colorado BondShares — A Tax-Exempt Fund. This report must be preceded or accompanied by a Prospectus of the Fund. The prospectus contains information concerning the investment policies and expenses of the portfolio in addition to other pertinent information. Shares of Colorado BondShares — A Tax-Exempt Fund are not deposits or obligations of any bank, are not guaranteed by any bank, are not insured by the FDIC or any other agency, and involve investment risks, including possible loss of the principal amount invested.
Officers and Trustees of the Fund (unaudited)
The following table lists the trustees and officers of the Fund, together with their address, age, positions held with the Fund, the term of each office held and the length of time served in each office, principal business occupations during the past five years and other directorships, if any, held by each trustee and officer. Each trustee and officer has served in that capacity for the Fund continuously since originally elected or appointed. The Board supervises the business activities of the Fund. Each trustee serves as a trustee until termination of the Fund unless the Trustee dies, resigns, retires, or is removed. The Fund's Statement of Additional Information includes more information about the trustees. Shareholders may call (800) 572 -0069 to request a free copy.
Name, Address and Age | Position held with | Principal Occupation | Other Directorships | |||
| Non-Interested Trustees | ||||||
Bruce G. Ely 1200 17th Street, Suite 850 Denver CO 80202 Age: 71 | Trustee since July 2002 | Mr. Ely was a Regional Director for Cutwater Asset Management, a wholly owned subsidiary of MBIA, Inc. until his retirement in September 2013. | None | |||
James R. Madden 1200 17th Street, Suite 850 Denver CO 80202 Age: 78 | Trustee since September 2004 | Mr. Madden has owned Madden Enterprises, a real estate company that owns and leases commercial buildings and real estate, for the past thirty years. He is also a stockholder and director of The Community Bank in western Kansas. He has been a bank director for 25 years. | None | |||
| Interested Trustees* | ||||||
George N. Donnelly 1200 17th Street, Suite 850 Denver CO 80202 Age: 75 | Chairman of the Board of Trustees, Trustee since inception of the Fund in 1987 and Interim President, Secretary and Treasurer of the Fund since September 26, 2008 | Mr. Donnelly was a Senior Regional Vice President for Phoenix Life Insurance Company until his retirement in January 2010. | None | |||
*George N. Donnelly is an “interested person” of the Fund as defined in the Investment Company Act of 1940 (the "1940 Act") by virtue of his position as both an officer and a trustee of the Fund as described in the table above. None of the trustees nor the officers of the Fund have any positions with the Investment Adviser, the principal underwriter of the Fund, the distribution agent of the Fund, the service agent of the Fund or the custodian of the Fund, or any affiliates thereof. There is no family relationship between any officers and trustees of the Fund.
1
FUND EXPENSES (unaudited)
The following examples are intended to help you understand the ongoing costs (in dollars) of investing in the Fund and compare these costs with those of other mutual funds. The examples (actual and hypothetical 5% return) are based on an investment of $1,000 made at the beginning of the period shown and held for the entire period.
As a shareholder of Colorado BondShares — A Tax-Exempt Fund (the “Fund’) you can incur two types of costs:
| • | Sales charges (front loads) on fund purchases and |
| • | Ongoing fund costs, including management fees, administrative services, and other fund expenses. All mutual funds have operating expenses. Operating expenses, which are deducted from the Fund’s gross income, directly reduce the investment return of the Fund. |
Actual Fund Expenses
The first line of the table below provides information about actual account values and actual expenses. You may use the information in this line, together with the amount you invested, to estimate the expenses that you paid over the period. Simply divide your account value by $1,000 (for example, an $8,600 account value divided by $1,000 = 8.6), then multiply the result by the number in the first line under the heading entitled “Expenses Paid During Period” to estimate the expenses you paid on your account during this period.
Hypothetical Example for Comparison Purposes
The second line of the table below provides information about hypothetical account values and hypothetical expenses based on the Fund’s actual expense ratio and an assumed rate of return of 5% per year before expenses, which is not the Fund’s actual return. The hypothetical account values and expenses may not be used to estimate the actual ending account balance or expenses you paid for the period. You may use this information to compare the ongoing cost of investing in the Fund and other funds. To do so, compare this 5% hypothetical example with the 5% hypothetical examples that appear in shareholder reports of other funds.
Six Months Ended March 31, 2022
Colorado BondShares — A Tax- Exempt Fund | Beginning Account Value 10/01/21 | Ending Account Value 03/31/22 | Expenses Paid During Period(1) | ||||||||||||
Based on Actual Fund Return | $ | 1,000.00 | $ | 980.79 | $ | 2.72 | |||||||||
Based on Hypothetical 5% Annual Return Before Expenses | $ | 1,000.00 | $ | 1,022.25 | $ | 2.77 | |||||||||
| (1) | The expenses shown in this table are equal to the Fund’s annualized expense ratio of 0.55% for semi-annual year ended March 31, 2022, multiplied by the average account value over the period, multiplied by 182/365 to reflect the one-half year period. |
Please note that expenses shown in the table are meant to highlight your ongoing costs only and do not reflect any transactional costs, such as sales charges (loads), redemption fees or exchange fees. Therefore, the second line of the table is useful in comparing ongoing costs only, and will not help you determine the relative total costs of owning different funds. In addition, if transactional costs were included, your costs would have been higher. You can find more information about the Fund’s expenses in the Financial Statements section of this report. For additional information on operating costs, please see the Fund’s prospectus.
2
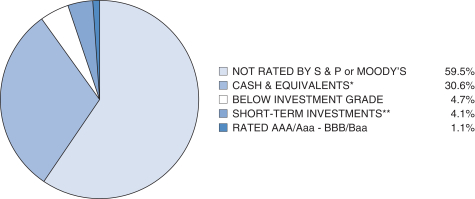
CREDIT QUALITY (unaudited)
Colorado BondShares — A Tax-Exempt Fund
Based on a Percentage of Total Net Assets as of March 31, 2022
SECTOR BREAKDOWN (unaudited)
Colorado BondShares — A Tax-Exempt Fund
Based on a Percentage of Total Net Assets as of March 31, 2022
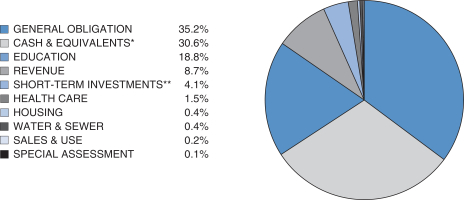
* Cash & equivalents include cash and receivables less liabilities.
** Short-term investments include securities with a maturity date or redemption feature of one year or less, as identified in the Schedule of Investments.
3
Colorado BondShares
A Tax-Exempt Fund
Schedule of Investments
March 31, 2022 (unaudited)
| Colorado Municipal Bonds 53.2% | Maturity | Coupon | Principal | Value | ||||||||||||||
| Colorado 100.0% | ||||||||||||||||||
ABERDEEN METROPOLITAN DISTRICT #1 | 12/1/2035 | 7.50% | $ | 1,600,000 | $ | 476,000 | ||||||||||||
ANTHOLOGY WEST METROPOLITAN DISTRICT NO. 4(g) | 12/15/2041 | 6.25% | 1,100,000 | 1,083,764 | ||||||||||||||
ANTHOLOGY WEST METROPOLITAN DISTRICT #5, SER A | 12/1/2049 | 4.88% | 4,630,000 | 4,596,155 | ||||||||||||||
ANTHOLOGY WEST METROPOLITAN DISTRICT #5, SER B SUBS(g) | 12/15/2049 | 7.63% | 698,000 | 679,957 | ||||||||||||||
ASPEN STREET METROPOLITAN DISTRICT(g) | 12/1/2050 | 5.13% | 1,075,000 | 992,386 | ||||||||||||||
BANNING LEWIS RANCH REGIONAL METROPOLITAN DISTRICT | 12/1/2048 | 5.38% | 2,500,000 | 2,583,300 | ||||||||||||||
BANNING LEWIS RANCH REGIONAL METROPOLITAN DISTRICT, SERIES 2018B(g) | 12/15/2041 | 7.75% | 625,000 | 629,269 | ||||||||||||||
BASE VILLAGE METROPOLITAN DISTRICT NO. 2(g) | 12/15/2048 | 6.50% | 3,500,000 | 2,637,250 | ||||||||||||||
BELFORD NORTH METROPOLITAN DISTRICT, SER 2020 A SENIORS | 12/1/2050 | 5.50% | 4,000,000 | 3,860,000 | ||||||||||||||
BELFORD NORTH METROPOLITAN DISTRICT, SER 2020 B SUBORDINATES(g) | 12/15/2050 | 8.50% | 3,475,000 | 3,395,284 | ||||||||||||||
BENNETT CROSSING METROPOLITAN DISTRICT NO. 1 | 12/1/2049 | 6.13% | 6,160,000 | 6,314,678 | ||||||||||||||
BENNETT RANCH METROPOLITAN DISTRICT NO. 1, SUBs(g) | 12/15/2051 | 7.50% | 1,221,000 | 1,166,238 | ||||||||||||||
BENT GRASS METROPOLITAN DISTRICT | 12/1/2049 | 5.25% | 1,690,000 | 1,733,636 | ||||||||||||||
BRADBURN METROPOLITAN DISTRICT NO. 2 JUNIOR LIEN SER C(g) | 12/15/2051 | 7.50% | 3,271,000 | 3,124,296 | ||||||||||||||
BRAMMING FARM METROPOLITAN DISTRICT #1(d) | 12/1/2044 | 6.00% | 1,940,000 | 1,952,086 | ||||||||||||||
BRIGHTON CROSSING METROPOLITAN DISTRICT #4 – SENIOR 2017A | 12/1/2037 | 5.00% | 525,000 | 539,779 | ||||||||||||||
BRIGHTON CROSSING METROPOLITAN DISTRICT NO. 4, SER 2017A | 12/1/2047 | 5.00% | 2,965,000 | 3,021,157 | ||||||||||||||
BRIGHTON CROSSING METROPOLITAN DISTRICT #4 – SUBORDINATE 2017B(g) | 12/1/2047 | 7.00% | 670,000 | 656,453 | ||||||||||||||
CASTLEVIEW METROPOLITAN DISTRICT NO. 2 | 12/1/2050 | 5.00% | 3,435,000 | 3,444,412 | ||||||||||||||
CHERRY CREEK SOUTH METROPOLITAN DISTRICT NO. 5(g) | 12/1/2051 | 6.00% | 20,000,000 | 18,775,200 | ||||||||||||||
CHERRY HILLS CITY METROPOLITAN DISTRICT(g) | 12/1/2047 | 5.00% | 1,380,000 | 1,375,957 | ||||||||||||||
CIELO METROPOLITAN DISTRICT(g) | 12/1/2050 | 5.25% | 4,500,000 | 4,233,465 | ||||||||||||||
4
Colorado BondShares
A Tax-Exempt Fund
Schedule of Investments (unaudited) — (Continued)
| Colorado Municipal Bonds (Continued) | Maturity | Coupon | Principal | Value | ||||||||||||||
| Colorado (Continued) | ||||||||||||||||||
CITY CTR WEST RSDL METROPOLITAN DISTRICT NO. 2 | 12/1/2049 | 5.00% | $ | 1,040,000 | $ | 1,054,862 | ||||||||||||
CITY CTR WEST RSDL METROPOLITAN DISTRICT NO. 2, SUBORDINATES(g) | 12/15/2049 | 7.75% | 1,425,000 | 1,383,162 | ||||||||||||||
CITYSET METROPOLITAN DISTRICT #2 | 12/1/2030 | 3.50% | 6,075,000 | 5,958,056 | ||||||||||||||
CITYSET METROPOLITAN DISTRICT #2 | 12/1/2040 | 4.38% | 8,360,000 | 8,283,004 | ||||||||||||||
CITYSET METROPOLITAN DISTRICT #2 | 12/1/2045 | 4.50% | 3,180,000 | 3,133,477 | ||||||||||||||
COLLIERS HILL METROPOLITAN DISTRICT #2 – SUBORDINATE 2017B(g) | 12/15/2047 | 8.50% | 3,501,000 | 3,769,247 | ||||||||||||||
COLLIERS HILL METROPOLITAN DISTRICT NO. 3, SER A | 12/1/2040 | 5.25% | 8,300,000 | 8,485,422 | ||||||||||||||
COLLIERS HILL METROPOLITAN DISTRICT NO. 3, SER A | 12/1/2048 | 5.50% | 18,250,000 | 18,647,485 | ||||||||||||||
COLLIERS HILL METROPOLITAN DISTRICT NO. 3 SUB SER B(g) | 12/15/2043 | 8.50% | 2,213,000 | 2,096,950 | ||||||||||||||
COLORADO CENTRE METROPOLITAN DISTRICT – SERIES B(g)(i) | 1/1/2032 | 0.00% | 6,571,179 | 3,417,013 | ||||||||||||||
COLORADO CENTRE METROPOLITAN DISTRICT – SERIES 1992 P/O(e)(i) | 1/1/2027 | 0.00% | 2,071,119 | 1,797,980 | ||||||||||||||
COLORADO CENTRE METROPOLITAN DISTRICT – SERIES 1992 I/O(f)(i) | 1/1/2027 | 9.00% | 2,069,093 | 1,489,747 | ||||||||||||||
CECFA – SWALLOW ACADEMY CHARTER SCHOOL(m) | 11/15/2027 | 5.35% | 3,305,000 | 3,306,818 | ||||||||||||||
CECFA ADDENBROOKE CLASSICAL ACADEMY(m) | 6/1/2027 | 4.50% | 25,285,000 | 25,476,913 | ||||||||||||||
CECFA IMAGINE CHARTER SCHOOL AT FIRESTONE(m) | 6/1/2027 | 4.50% | 17,380,000 | 17,675,981 | ||||||||||||||
CECFA – MONARCH MONTESSORI CHARTER SCHOOL – EXCHANGE(m) | 5/15/2025 | 4.75% | 8,325,000 | 8,265,227 | ||||||||||||||
CECFA – ACADEMY OF ADVANCED LEARNING(m) | 6/1/2027 | 4.38% | 8,420,000 | 8,210,847 | ||||||||||||||
CECFA CHAVEZ/HUERTA PREP ACADEMY(m) | 7/1/2027 | 4.38% | 36,525,000 | 35,703,188 | ||||||||||||||
CECFA SWALLOWS CHARTER ACADEMY(m) | 11/15/2027 | 4.38% | 6,560,000 | 6,272,934 | ||||||||||||||
CECFA VANGUARD CLASSICAL SCHOOL, SER A(m) | 7/1/2027 | 4.38% | 24,465,000 | 23,455,574 | ||||||||||||||
CECFA COPERNI 2 PROJ | 7/1/2029 | 4.25% | 5,645,000 | 5,199,158 | ||||||||||||||
CECFA GRAND PEAK ACAD SER A-1(m) | 7/1/2031 | 4.00% | 2,150,000 | 1,944,783 | ||||||||||||||
CECFA GRAND PEAK ACAD SER A-1(m) | 7/1/2041 | 4.25% | 5,040,000 | 4,276,138 | ||||||||||||||
CECFA GRAND PEAK ACAD SER A-1(m) | 7/1/2051 | 4.50% | 13,070,000 | 10,705,637 | ||||||||||||||
CECFA DORAL ACADEMY | 7/15/2028 | 4.50% | 19,405,000 | 18,744,260 | ||||||||||||||
5
Colorado BondShares
A Tax-Exempt Fund
Schedule of Investments (unaudited) — (Continued)
| Colorado Municipal Bonds (Continued) | Maturity | Coupon | Principal | Value | ||||||||||||||
| Colorado (Continued) | ||||||||||||||||||
CECFA CIVICA CAREER & COLLEGIATE ACADEMY(m) | 7/15/2029 | 4.75% | $ | 7,790,000 | $ | 7,662,478 | ||||||||||||
700 KALAMATH LLC(a) | 12/1/2013 | 0.00% | 3,755,000 | 3,755,000 | ||||||||||||||
CHFA – CASEY'S POND SENIOR LIVING(l) | 6/1/2032 | 0.00% | 8,110,000 | 4,460,500 | ||||||||||||||
CHFA – CASEY'S POND SENIOR LIVING(l) | 6/1/2042 | 0.00% | 10,665,000 | 5,865,750 | ||||||||||||||
CHFA – CASEY'S POND SENIOR LIVING(l) | 6/1/2047 | 0.00% | 8,600,000 | 4,730,000 | ||||||||||||||
COLORADO INTERNATIONAL CENTER METROPOLITAN DISTRICT #3 | 12/1/2031 | 4.63% | 607,000 | 612,160 | ||||||||||||||
CONESTOGA METRO DISTRICT #2(g) | 12/1/2051 | 5.25% | 1,625,000 | 1,565,038 | ||||||||||||||
CONIFER METROPOLITAN DISTRICT | 12/1/2030 | 0.00% | 10,000,000 | 4,000,000 | ||||||||||||||
CONIFER METROPOLITAN DISTRICT | 12/1/2032 | 0.00% | 1,450,000 | 580,000 | ||||||||||||||
CONIFER METROPOLITAN DISTRICT | 12/1/2033 | 0.00% | 1,550,000 | 620,000 | ||||||||||||||
CONSTITUTION HEIGHTS METROPOLITAN DISTRICT | 12/1/2049 | 5.00% | 1,765,000 | 1,797,635 | ||||||||||||||
COPPERLEAF METROPOLITAN DISTRICT #3 | 12/1/2037 | 5.00% | 1,000,000 | 1,053,560 | ||||||||||||||
COPPERLEAF METRO DISTRICT #9 (g) | 12/1/2051 | 4.88% | 8,175,000 | 7,261,526 | ||||||||||||||
COUNTRY CLUB HIGHLANDS METROPOLITAN DISTRICT | 12/1/2037 | 7.25% | 1,030,000 | 947,600 | ||||||||||||||
DACONO URBAN RENEWAL AUTHORITY(g) | 12/1/2039 | 6.25% | 4,013,000 | 3,994,460 | ||||||||||||||
DAKOTA RIDGE METROPOLITAN DISTRICT(g) | 12/1/2052 | 6.00% | 2,339,000 | 2,274,537 | ||||||||||||||
DEER CREEK VILLAS METROPOLITAN DISTRICT | 12/1/2055 | 5.00% | 2,900,000 | 2,712,225 | ||||||||||||||
DENVER INTL BUSINESS CTR METROPOLITAN DISTRICT NO. 1 – SERIES 2019B SUB(g) | 12/1/2048 | 6.00% | 4,585,000 | 4,758,863 | ||||||||||||||
DENVER WEST PROMENADE METROPOLITAN DISTRICT | 12/1/2031 | 5.13% | 500,000 | 505,485 | ||||||||||||||
DENVER WEST PROMENADE METROPOLITAN DISTRICT | 12/15/2046 | 6.00% | 500,000 | 501,305 | ||||||||||||||
E-86 METROPOLITAN DISTRICT(g) | 12/1/2051 | 5.13% | 1,015,000 | 923,640 | ||||||||||||||
EAGLE BROOK METROPOLITAN DISTRICT(g) | 12/1/2051 | 5.00% | 1,600,000 | 1,506,144 | ||||||||||||||
UNITED W & S – EAST CHERRY CREEK(c) | 11/15/2023 | 5.00% | 1,152,000 | 1,153,440 | ||||||||||||||
ERIE HIGHLANDS METROPOLITAN DISTRICT NO2, SER 2018A | 12/1/2048 | 5.25% | 6,000,000 | 6,123,660 | ||||||||||||||
ERIE HIGHLANDS METROPOLITAN DISTRICT NO 2, SER 2018B SUBORDINATES(g) | 12/15/2048 | 7.63% | 1,819,000 | 1,788,568 | ||||||||||||||
FITZSIMONS VLG METROPOLITAN DISTRICT NO. 1 | 12/1/2049 | 5.00% | 1,043,000 | 1,015,496 | ||||||||||||||
FITZSIMONS VILLAGE METROPOLITAN DISTRICT NO. 1, SER B SUBS(g) | 12/15/2049 | 7.00% | 611,000 | 584,978 | ||||||||||||||
6
Colorado BondShares
A Tax-Exempt Fund
Schedule of Investments (unaudited) — (Continued)
| Colorado Municipal Bonds (Continued) | Maturity | Coupon | Principal | Value | ||||||||||||||
| Colorado (Continued) | ||||||||||||||||||
FITZSIMONS VILLAGE METROPOLITAN DISTRICT NO. 3 | 12/1/2041 | 4.00% | $ | 1,500,000 | $ | 1,313,040 | ||||||||||||
FITZSIMONS VILLAGE METROPOLITAN DISTRICT NO. 3 | 12/1/2055 | 4.25% | 4,830,000 | 4,076,327 | ||||||||||||||
FLYING HORSE METROPOLITAN DISTRICT NO. 2 SER 2020 SUBS(g)(m) | 12/15/2050 | 7.25% | 15,405,000 | 14,982,595 | ||||||||||||||
FLYING HORSE METROPOLITAN DISTRICT | 12/1/2049 | 6.00% | 2,965,000 | 2,963,755 | ||||||||||||||
FORT LUPTON GOLF COURSE(a) | 12/15/2037 | 0.00% | 620,000 | 6,200 | ||||||||||||||
GOLDEN EAGLE ACRES METROPOLITAN DISTRICT NO. 2(g) | 12/1/2051 | 4.50% | 3,981,000 | 3,471,671 | ||||||||||||||
GREEN GABLES METROPOLITAN DISTRICT NO. 2 SERIES 2018B SUBORDINATE(g) | 12/15/2048 | 8.25% | 1,689,000 | 1,671,755 | ||||||||||||||
GREEN VALLEY RANCH EAST METROPOLITAN DISTRICT NO. 6 | 12/1/2050 | 5.88% | 3,325,000 | 3,430,336 | ||||||||||||||
GREENWAYS METROPOLITAN DISTRICT NO. 1(g) | 12/1/2051 | 4.63% | 3,685,000 | 3,223,785 | ||||||||||||||
HIDDEN CREEK METROPOLITAN DISTRICT(g) | 12/1/2045 | 4.63% | 3,430,000 | 2,992,092 | ||||||||||||||
HIGHLANDS-MEAD METROPOLITAN DISTRICT | 12/1/2050 | 5.13% | 1,395,000 | 1,393,856 | ||||||||||||||
HOGBACK METROPOLITAN DISTRICT SER A | 12/1/2041 | 5.00% | 725,000 | 715,263 | ||||||||||||||
HOGBACK METROPOLITAN DISTRICT SER A | 12/1/2051 | 5.00% | 1,550,000 | 1,438,230 | ||||||||||||||
HORIZON METROPOLITAN DISTRICT NO. 2(g) | 12/1/2051 | 4.50% | 7,765,000 | 6,621,604 | ||||||||||||||
HUNTER'S OVERLOOK METROPOLITAN DISTRICT NO. 5, SUBS(g) | 12/15/2049 | 8.50% | 1,827,000 | 1,787,811 | ||||||||||||||
HUNTER'S OVERLOOK METROPOLITAN DISTRICT NO. 7(g) | 12/1/2051 | 5.50% | 3,525,000 | 3,430,847 | ||||||||||||||
HYLAND VILLAGE METROPOLITAN DISTRICT | 12/1/2027 | 8.00% | 4,770,000 | 2,385,000 | ||||||||||||||
INDY OAK TOD METROPOLITAN DISTRICT SER A | 12/1/2050 | 5.50% | 1,075,000 | 1,110,013 | ||||||||||||||
INDY OAK TOD METROPOLITAN DISTRICT | 12/15/2050 | 8.00% | 736,000 | 736,390 | ||||||||||||||
INSPIRATION METROPOLITAN DISTRICT SUB SER 2021B | 12/15/2036 | 5.00% | 812,000 | 756,199 | ||||||||||||||
IRON WORKS VILLAGE METROPOLITAN DISTRICT | 12/1/2048 | 5.88% | 1,500,000 | 1,593,240 | ||||||||||||||
JAY GROVE METROPOLITAN DISTRICT(g) | 12/1/2051 | 4.25% | 1,225,000 | 1,044,913 | ||||||||||||||
JEFFERSON CENTER METROPOLITAN DISTRICT NO. 1 SUB SER B(g) | 12/15/2050 | 5.75% | 7,500,000 | 7,679,850 | ||||||||||||||
KARL'S FARM METROPOLITAN DISTRICT NO. 2, SER A | 12/1/2040 | 5.38% | 515,000 | 532,520 | ||||||||||||||
7
Colorado BondShares
A Tax-Exempt Fund
Schedule of Investments (unaudited) — (Continued)
| Colorado Municipal Bonds (Continued) | Maturity | Coupon | Principal | Value | ||||||||||||||
| Colorado (Continued) | ||||||||||||||||||
KARL'S FARM METROPOLITAN DISTRICT NO. 2, SER A | 12/1/2050 | 5.63% | $ | 1,415,000 | $ | 1,444,673 | ||||||||||||
LAKES METROPOLITAN DISTRICT NO 4(g) | 12/1/2061 | 5.50% | 20,080,000 | 17,798,711 | ||||||||||||||
LANTERNS METROPOLITAN DISTRICT No. 2(g) | 12/1/2050 | 4.50% | 7,332,000 | 6,323,703 | ||||||||||||||
LEGATO COMMUNITY AUTHORITY | 12/1/2036 | 4.00% | 2,130,000 | 2,047,122 | ||||||||||||||
LINCOLN MEADOWS METROPOLITAN DISTRICT | 12/1/2031 | 8.00% | 6,970,000 | 7,911,438 | ||||||||||||||
LITTLETON VILLAGE METROPOLITAN DISTRICT #2 | 12/1/2045 | 5.38% | 1,650,000 | 1,672,011 | ||||||||||||||
LITTLETON VILLAGE METROPOLITAN DISTRICT NO 2, SERIES 2018B SUBORDINATES(g) | 12/15/2028 | 7.63% | 1,140,000 | 1,155,436 | ||||||||||||||
LORETTO HEIGHTS COMNTY AUTHORITY(g) | 12/1/2051 | 4.88% | 5,000,000 | 4,462,050 | ||||||||||||||
MARIN METROPOLITAN DISTRICT(a)(j) | 12/1/2028 | 0.00% | 17,485,000 | 1,573,650 | ||||||||||||||
MAYFIELD METROPOLITAN DISTRICT, | 12/1/2050 | 5.75% | 1,190,000 | 1,236,422 | ||||||||||||||
MAYFIELD METROPOLITAN DISTRICT, | 12/15/2050 | 8.25% | 622,000 | 622,311 | ||||||||||||||
MEADOWS METROPOLITAN DISTRICT #1(k) | 6/1/2029 | 8.00% | 30,730,000 | 30,977,991 | ||||||||||||||
MEADOWS METROPOLITAN DISTRICT #2(k) | 6/1/2029 | 8.00% | 23,830,000 | 24,022,308 | ||||||||||||||
MEADOWS METROPOLITAN DISTRICT #7(k) | 6/1/2029 | 8.00% | 15,440,000 | 15,564,601 | ||||||||||||||
MEADOWLARK METROPOLITAN DISTRICT SER A | 12/1/2040 | 4.88% | 520,000 | 522,012 | ||||||||||||||
MEADOWLARK METROPOLITAN DISTRICT SER A | 12/1/2050 | 5.13% | 750,000 | 749,385 | ||||||||||||||
MIRABELLE METROPOLITAN DISTRICT NO. 2 SER 2020A SENIORS | 12/1/2049 | 5.00% | 1,250,000 | 1,254,400 | ||||||||||||||
MIRABELLE METROPOLITAN DISTRICT NO. 2, SER B SUBS(g) | 12/15/2049 | 7.38% | 1,473,000 | 1,425,481 | ||||||||||||||
MONUMENT JUNCTION METROPOLITAN DISTRICT NO. 1(g) | 12/1/2051 | 5.75% | 12,258,000 | 11,342,327 | ||||||||||||||
MOUNT CARBON METROPOLITAN DISTRICT – SERIES 2004A(g) | 6/1/2043 | 7.00% | 197,916 | 183,551 | ||||||||||||||
MOUNT CARBON METROPOLITAN DISTRICT – SERIES 2004B(g) | 6/1/2043 | 7.00% | 1,340,000 | 1,242,274 | ||||||||||||||
MOUNT CARBON METROPOLITAN DISTRICT – SERIES 2004C(e)(g) | 6/1/2043 | 0.00% | 565,000 | 124,300 | ||||||||||||||
MOUNTAIN BROOK METROPOLITAN DISTRICT | 12/1/2051 | 4.75% | 2,915,000 | 2,550,742 | ||||||||||||||
MOUNTAIN BROOK METROPOLITAN DISTRICT | 12/1/2041 | 4.50% | 1,000,000 | 897,330 | ||||||||||||||
MOUNTAIN SHADOWS METROPOLITAN DISTRICT – SUBORDINATE 2016B(g) | 12/15/2046 | 7.50% | 1,800,000 | 1,791,000 | ||||||||||||||
8
Colorado BondShares
A Tax-Exempt Fund
Schedule of Investments (unaudited) — (Continued)
| Colorado Municipal Bonds (Continued) | Maturity | Coupon | Principal | Value | ||||||||||||||
| Colorado (Continued) | ||||||||||||||||||
MOUNTAIN SHADOWS METROPOLITAN DISTRICT – SUBORDINATE 2018C-1(g) | 12/15/2040 | 10.00% | $ | 1,994,000 | $ | 1,987,041 | ||||||||||||
MUEGGE FARMS METROPOLITAN DISTRICT #1(g) | 12/1/2051 | 5.00% | 3,000,000 | 2,694,030 | ||||||||||||||
MUEGGE FARMS METROPOLITAN DISTRICT NO. 3(g) | 12/1/2051 | 5.50% | 10,431,000 | 9,565,123 | ||||||||||||||
MURPHY CREEK METROPOLITAN DISTRICT #3 | 12/1/2026 | 6.00% | 2,540,000 | 2,540,000 | ||||||||||||||
MURPHY CREEK METROPOLITAN DISTRICT #3 | 12/1/2035 | 6.13% | 1,880,000 | 1,880,000 | ||||||||||||||
NINE MILE METROPOLITAN DISTRICT | 12/1/2030 | 4.63% | 1,125,000 | 1,149,649 | ||||||||||||||
NINE MILE METROPOLITAN DISTRICT | 12/1/2040 | 5.13% | 2,500,000 | 2,604,975 | ||||||||||||||
NORTH PINE VISTAS METROPOLITAN DISTRICT #2 – SENIOR 2016A | 12/1/2046 | 6.75% | 6,680,000 | 5,115,744 | ||||||||||||||
NORTH PINE VISTAS METROPOLITAN DISTRICT #2 – SUBORDINATE 2016B(g) | 12/15/2046 | 8.50% | 1,810,000 | 1,440,326 | ||||||||||||||
NORTH RANGE METROPOLITAN DISTRICT NO. 3, SER A | 12/1/2040 | 5.00% | 2,000,000 | 2,075,380 | ||||||||||||||
PAINTED PRAIRIE PUBLIC IMPROVEMENT AUTHORITY | 12/1/2029 | 4.00% | 1,000,000 | 1,006,510 | ||||||||||||||
PALISADE PARK NORTH METROPOLITAN DISTRICT #2 – SENIOR 2018A | 12/1/2047 | 5.63% | 1,745,000 | 1,806,721 | ||||||||||||||
PARKDALE COMMUNITY AUTHORITY SER A | 12/1/2040 | 5.00% | 2,140,000 | 2,183,378 | ||||||||||||||
PARKDALE COMMUNITY AUTHORITY SER A | 12/1/2050 | 5.25% | 3,335,000 | 3,356,444 | ||||||||||||||
PARKDALE COMMUNITY AUTHORITY SUB SER B(g) | 12/15/2050 | 7.75% | 2,424,000 | 2,366,939 | ||||||||||||||
PARKER AUTOMOTIVE METROPOLITAN DISTRICT | 12/1/2045 | 5.00% | 1,946,000 | 1,988,831 | ||||||||||||||
PARKER AUTOMOTIVE METROPOLITAN DISTRICT SUB SERIES 2018B(g) | 12/15/2032 | 8.00% | 3,785,000 | 3,800,254 | ||||||||||||||
PIONEER CMNTY AUTH BRD | 12/15/2050 | 6.75% | 24,592,000 | 24,062,042 | ||||||||||||||
PIONEER METROPOLITAN DISTRICT #3(g) | 12/1/2046 | 6.50% | 2,866,000 | 2,844,792 | ||||||||||||||
THE PLAZA METROPOLITAN DISTRICT #1(m) | 12/1/2040 | 5.00% | 7,850,000 | 7,891,527 | ||||||||||||||
POWHATON COMMUNITY AUTHORITY DISTRICT NO. 3 – CASH FLOW BONDS(g) | 12/1/2051 | 5.00% | 7,450,000 | 6,839,622 | ||||||||||||||
PRONGHORN VALLEY METROPOLITAN DISTRICT, SER A | 12/1/2041 | 3.75% | 515,000 | 452,644 | ||||||||||||||
PRONGHORN VALLEY METROPOLITAN DISTRICT, SER A | 12/1/2051 | 4.00% | 650,000 | 564,467 | ||||||||||||||
PUBLIC FINANCE AUTH CHARTER SCHOOL-COLORADO SPRINGS(m) | 7/1/2029 | 4.95% | 6,515,000 | 6,382,615 | ||||||||||||||
9
Colorado BondShares
A Tax-Exempt Fund
Schedule of Investments (unaudited) — (Continued)
| Colorado Municipal Bonds (Continued) | Maturity | Coupon | Principal | Value | ||||||||||||||
| Colorado (Continued) | ||||||||||||||||||
PUBLIC FINANCE AUTH CHARTER SCHOOL-FT COLLINS, A(m) | 7/1/2029 | 4.95% | $ | 20,975,000 | $ | 20,548,788 | ||||||||||||
PUBLIC FINANCE AUTH CHARTER SCHOOL-DOUGLAS CNTY(m) | 7/1/2029 | 4.95% | 14,620,000 | 14,322,922 | ||||||||||||||
PUBLIC FINANCE AUTH CHARTER SCHOOL-DOUGLAS CNTY TXBL(m) | 7/1/2026 | 4.95% | 3,310,000 | 3,283,553 | ||||||||||||||
PUBLIC FINANCE AUTH CHARTER SCHOOL-FT COLLINS(m) | 7/1/2029 | 4.95% | 10,720,000 | 10,502,170 | ||||||||||||||
PUBLIC FINANCE AUTH CHARTER SCHOOL-WINDSOR(m) | 7/1/2029 | 4.95% | 13,210,000 | 12,941,573 | ||||||||||||||
PFA AURORA CHARTER SCHOOL BC PROJ, | 7/1/2029 | 4.75% | 18,365,000 | 17,434,078 | ||||||||||||||
PUBLIC FINANCE AUTHORITY – COLORADO SKIES ACADEMY CHARTER SCHOOL, SER A(m) | 7/1/2025 | 5.63% | 10,290,000 | 10,184,219 | ||||||||||||||
PFA DOUGLAS COUNTY CHARTER SCHOOL BC, SER 2020A(m) | 7/1/2029 | 4.65% | 30,830,000 | 29,156,239 | ||||||||||||||
PUBLIC FINANCE AUTHORITY – MONUMENT ACADEMY SER. 2019A(m) | 6/1/2026 | 5.00% | 28,725,000 | 28,184,970 | ||||||||||||||
RAVENNA METROPOLITAN DISTRICT CONV CABS – SUBORDINATE SERIES 2017B(d) | 12/15/2026 | 7.50% | 8,000,000 | 7,812,800 | ||||||||||||||
REATA RIDGE VILLAGE METROPOLITAN DISTRICT NO. 2 | 12/1/2049 | 5.00% | 900,000 | 916,803 | ||||||||||||||
RENDEZVOUS METROPOLITAN DISTRICT NO 4 – SUBORDINATE, SERIES 2018B(g) | 10/15/2048 | 8.00% | 1,189,000 | 1,161,498 | ||||||||||||||
REMUDA RIDGE METROPOLITAN DISTRICT, | 12/1/2051 | 5.63% | 5,520,000 | 5,119,910 | ||||||||||||||
REX RANCH METROPOLITAN DISTRICT – SUBORDINATE 2018B(g) | 12/15/2047 | 7.88% | 445,000 | 444,025 | ||||||||||||||
RITORO METROPOLITAN DISTRICT, SER 2019B SUBORDINATE(g) | 12/15/2049 | 8.50% | 2,190,000 | 2,321,137 | ||||||||||||||
RIVERDALE PEAKS II METROPOLITAN DISTRICT | 12/1/2025 | 6.40% | 930,000 | 465,000 | ||||||||||||||
RIVERDALE PEAKS II METROPOLITAN DISTRICT | 12/1/2035 | 6.50% | 1,135,000 | 567,500 | ||||||||||||||
ROCK CREEK METROPOLITAN DISTRICT A-1(g) | 12/1/2041 | 4.50% | 2,230,000 | 1,999,084 | ||||||||||||||
ROCK CREEK METROPOLITAN DISTRICT A-1(g) | 12/1/2050 | 4.75% | 3,880,000 | 3,397,832 | ||||||||||||||
ROCK CREEK METROPOLITAN DISTRICT A-2 SUB CASH FLOW(g) | 12/1/2031 | 4.00% | 3,432,000 | 3,221,859 | ||||||||||||||
10
Colorado BondShares
A Tax-Exempt Fund
Schedule of Investments (unaudited) — (Continued)
| Colorado Municipal Bonds (Continued) | Maturity | Coupon | Principal | Value | ||||||||||||||
| Colorado (Continued) | ||||||||||||||||||
ROSE HILL ACRES METROPOLITAN DISTRICT, SER A | 12/1/2050 | 5.00% | $ | 2,990,000 | $ | 3,011,050 | ||||||||||||
ROSE HILL ACRES METROPOLITAN DISTRICT, SER B SUB(g) | 12/15/2050 | 8.75% | 910,000 | 889,771 | ||||||||||||||
ROXBOROUGH VILLAGE METROPOLITAN DISTRICT – SERIES 1993B I/O(f)(i) | 12/31/2042 | 0.00% | 242,645 | 26,691 | ||||||||||||||
RRC METROPOLITAN DISTRICT NO. 2(g) | 12/1/2051 | 5.25% | 5,625,000 | 5,073,356 | ||||||||||||||
SABELL METROPOLITAN DISTRICT, SER 2020 B3 SUBS(g) | 12/15/2050 | 8.25% | 605,000 | 595,483 | ||||||||||||||
SILVER PEAKS EAST METROPOLITAN DISTRICT(g) | 12/1/2051 | 5.00% | 5,410,000 | 4,823,123 | ||||||||||||||
64TH AVENUE ARI AUTHORITY(g) | 12/1/2043 | 6.50% | 5,000,000 | 5,031,600 | ||||||||||||||
SOLITUDE METROPOLITAN DISTRICT(j) | 12/1/2026 | 7.00% | 3,520,000 | 2,288,000 | ||||||||||||||
SPRING VALLEY METROPOLITAN DISTRICT NO. 4 | 12/1/2040 | 5.00% | 1,410,000 | 1,396,408 | ||||||||||||||
SPRING VALLEY METROPOLITAN DISTRICT NO. 4 | 12/1/2050 | 5.12% | 1,775,000 | 1,721,715 | ||||||||||||||
SPRING VALLEY METROPOLITAN DISTRICT NO. 4 SUB(g) | 12/15/2050 | 7.63% | 2,811,000 | 2,725,546 | ||||||||||||||
ST VRAIN LAKES METROPOLITAN DISTRICT #2 – SENIOR SERIES 2017A | 12/1/2037 | 5.00% | 1,500,000 | 1,554,615 | ||||||||||||||
ST VRAIN LAKES METROPOLITAN DISTRICT #2 – SUBORDINATE SERIES 2017B(g) | 12/15/2047 | 7.63% | 1,083,000 | 1,116,151 | ||||||||||||||
STC METROPOLITAN DISTRICT NO. 2, SER A | 12/1/2029 | 4.00% | 1,615,000 | 1,624,674 | ||||||||||||||
STC METROPOLITAN DISTRICT NO. 2 | 12/1/2038 | 5.00% | 8,160,000 | 8,418,998 | ||||||||||||||
STC METROPOLITAN DISTRICT, SER 2019 SUBS(g) | 12/15/2049 | 8.00% | 3,954,000 | 3,857,404 | ||||||||||||||
STETSON RIDGE METROPOLITAN DISTRICT NO. 3, SUBs(g)(m) | 12/15/2042 | 7.50% | 345,000 | 337,075 | ||||||||||||||
STONE RIDGE METROPOLITAN DISTRICT #2 | 12/1/2031 | 0.00% | 11,896,000 | 1,903,360 | ||||||||||||||
TALLYN'S REACH METROPOLITAN DISTRICT #3 | 11/1/2038 | 5.13% | 2,070,000 | 2,169,215 | ||||||||||||||
THIRD CREEK METROPOLITAN DISTRICT NO. 1, SER A-1 | 12/1/2037 | 4.50% | 1,130,000 | 1,056,256 | ||||||||||||||
THIRD CREEK METROPOLITAN DISTRICT NO. 1, SER A-1 | 12/1/2051 | 4.75% | 5,115,000 | 4,492,095 | ||||||||||||||
THOMPSON CROSSING METROPOLITAN DISTRICT NO #4 | 12/1/2039 | 5.00% | 1,410,000 | 1,463,326 | ||||||||||||||
THOMPSON CROSSING METROPOLITAN DISTRICT NO. 4 | 12/1/2049 | 5.00% | 1,315,000 | 1,339,249 | ||||||||||||||
TRAILS AT CROWFOOT METROPOLITAN DISTRICT NO 3(g) | 12/15/2049 | 9.00% | 3,135,000 | 3,081,047 | ||||||||||||||
11
Colorado BondShares
A Tax-Exempt Fund
Schedule of Investments (unaudited) — (Continued)
| Colorado Municipal Bonds (Continued) | Maturity | Coupon | Principal | Value | ||||||||||||||
| Colorado (Continued) | ||||||||||||||||||
VALAGUA METROPOLITAN DISTRICT | 12/1/2037 | 0.00% | $ | 11,500,000 | $ | 2,196,500 | ||||||||||||
VILGS AT MURPHY CREEK METROPOLITAN DISTRICT NO. 1(g) | 12/1/2051 | 5.50% | 12,358,000 | 11,223,288 | ||||||||||||||
VINCENT VILLAGE METROPOLITAN DISTRICT | 12/1/2051 | 5.00% | 1,970,000 | 1,815,808 | ||||||||||||||
WESTCREEK METROPOLITAN DISTRICT NO 2 | 12/1/2048 | 5.38% | 1,300,000 | 1,336,803 | ||||||||||||||
WESTOWN METROPOLITAN DISTRICT – SENIOR SERIES 2017A | 12/1/2047 | 5.00% | 1,369,000 | 1,440,914 | ||||||||||||||
WHISPERING PINES METROPOLITAN DISTRICT #1 – SENIOR SERIES 2017A | 12/1/2037 | 5.00% | 2,000,000 | 2,046,960 | ||||||||||||||
WHITE BUFFALO METROPOLITAN DISTRICT, NO. 3 | 12/1/2050 | 5.50% | 2,780,000 | 2,840,882 | ||||||||||||||
WILD PLUM METROPOLITAN DISTRICT, SER A | 12/1/2049 | 5.00% | 595,000 | 611,934 | ||||||||||||||
WILLOW SPRINGS METROPOLITAN DISTRICT, SER 2019B SUBORDINATES(g) | 12/15/2049 | 7.75% | 650,000 | 630,988 | ||||||||||||||
WOODMEN HEIGHTS METROPOLITAN DISTRICT NO. 2 SER B-2 | 12/15/2040 | 7.50% | 3,358,000 | 3,261,760 | ||||||||||||||
WYNDHAM HILL METROPOLITAN DISTRICT NO. 2 2020B SUBS(g) | 12/15/2049 | 7.63% | 9,600,000 | 9,505,536 | ||||||||||||||
|
|
|
| |||||||||||||||
Colorado (amortized cost $988,347,228) | 1,041,397,952 | 944,523,738 | ||||||||||||||||
|
|
|
| |||||||||||||||
Colorado Municipal Bonds | $ | 1,041,397,952 | $ | 944,523,738 | ||||||||||||||
|
|
|
| |||||||||||||||
| Other Municipal Bonds 6.4% | ||||||||||||||||||
| South Dakota 75.5% | ||||||||||||||||||
FLANDREAU SANTEE SIOUX TRIBE(m) | 1/1/2036 | 5.75% | $ | 6,055,000 | $ | 5,018,687 | ||||||||||||
FLANDREAU SANTEE SIOUX TRIBE(m) | 1/1/2026 | 5.00% | 2,265,000 | 2,141,240 | ||||||||||||||
FLANDREAU SANTEE SIOUX TRIBE(m) | 1/1/2031 | 5.50% | 3,565,000 | 3,125,721 | ||||||||||||||
FLANDREAU SANTEE SIOUX TRIBE TE SERIES 2018B(m) | 1/1/2038 | 6.00% | 6,120,000 | 5,831,809 | ||||||||||||||
FLANDREAU SANTEE SIOUX TRIBE TE SERIES 2018C(m) | 1/1/2038 | 6.00% | 5,450,000 | 5,193,360 | ||||||||||||||
FLANDREAU SANTEE SIOUX TRIBE TAXABLE SERIES 2018A(m) | 1/1/2024 | 8.28% | 950,000 | 941,678 | ||||||||||||||
FLANDREAU SANTEE SIOUX TRIBE TAXABLE SERIES 2018A(m) | 1/1/2025 | 8.28% | 1,030,000 | 1,012,027 | ||||||||||||||
FLANDREAU SANTEE SIOUX TRIBE TAXABLE SERIES 2018A(m) | 1/1/2026 | 8.28% | 1,115,000 | 1,093,402 | ||||||||||||||
12
Colorado BondShares
A Tax-Exempt Fund
Schedule of Investments (unaudited) — (Continued)
| Other Municipal Bonds (Continued) | Maturity | Coupon | Principal | Value | ||||||||||||||
| South Dakota (Continued) | ||||||||||||||||||
FLANDREAU SANTEE SIOUX TRIBE TAXABLE SERIES 2018A(m) | 1/1/2027 | 8.28% | $ | 1,205,000 | $ | 1,185,419 | ||||||||||||
FLANDREAU SANTEE SIOUX TRIBE TAXABLE SERIES 2018A(m) | 1/1/2028 | 8.28% | 1,305,000 | 1,288,296 | ||||||||||||||
FLANDREAU SANTEE SIOUX TRIBE TAXABLE SERIES 2018A(m) | 1/1/2033 | 8.28% | 8,670,000 | 8,661,764 | ||||||||||||||
FLANDREAU SANTEE SIOUX TRIBE – TRIBAL HEALTHCARE(m) | 7/1/2025 | 5.75% | 740,000 | 722,240 | ||||||||||||||
FLANDREAU SANTEE SIOUX TRIBE – TRIBAL HEALTHCARE(m) | 7/1/2026 | 5.75% | 785,000 | 761,128 | ||||||||||||||
FLANDREAU SANTEE SIOUX TRIBE – TRIBAL HEALTHCARE(m) | 7/1/2027 | 5.75% | 830,000 | 799,780 | ||||||||||||||
FLANDREAU SANTEE SIOUX TRIBE – TRIBAL HEALTHCARE(m) | 7/1/2028 | 5.75% | 875,000 | 838,206 | ||||||||||||||
FLANDREAU SANTEE SIOUX TRIBE – TRIBAL HEALTHCARE(m) | 7/1/2029 | 5.75% | 930,000 | 885,983 | ||||||||||||||
FLANDREAU SANTEE SIOUX TRIBE – TRIBAL HEALTHCARE(m) | 7/1/2030 | 5.75% | 980,000 | 928,775 | ||||||||||||||
FLANDREAU SANTEE SIOUX TRIBE – TRIBAL HEALTHCARE(m) | 7/1/2031 | 5.75% | 1,040,000 | 980,814 | ||||||||||||||
FLANDREAU SANTEE SIOUX TRIBE – TRIBAL HEALTHCARE(m) | 7/1/2032 | 5.75% | 1,095,000 | 1,027,920 | ||||||||||||||
FLANDREAU SANTEE SIOUX TRIBE – TRIBAL HEALTHCARE(m) | 7/1/2033 | 5.75% | 1,160,000 | 1,084,217 | ||||||||||||||
FLANDREAU SANTEE SIOUX TRIBE – TRIBAL HEALTHCARE(m) | 7/1/2034 | 5.75% | 1,225,000 | 1,140,291 | ||||||||||||||
FLANDREAU SANTEE SIOUX TRIBE – TRIBAL HEALTHCARE(m) | 7/1/2035 | 5.75% | 1,300,000 | 1,205,451 | ||||||||||||||
FLANDREAU SANTEE SIOUX TRIBE – TRIBAL HEALTHCARE(m) | 7/1/2040 | 6.00% | 7,730,000 | 7,065,607 | ||||||||||||||
FLANDREAU SANTEE SIOUX TRIBE – TRIBAL HEALTHCARE(m) | 7/1/2045 | 6.25% | 10,395,000 | 9,416,831 | ||||||||||||||
LOWER BRULE SIOUX TRIBE(m) | 3/1/2025 | 5.88% | 1,110,000 | 1,044,887 | ||||||||||||||
OGLALA SIOUX TRIBE, SERIES 2018(m) | 7/1/2028 | 5.50% | 3,000,000 | 2,895,360 | ||||||||||||||
OGLALA SIOUX TRIBE, SERIES 2018(m) | 7/1/2037 | 6.00% | 9,270,000 | 8,320,567 | ||||||||||||||
OGLALA SIOUX TRIBE, SERIES 2018B(m) | 9/1/2041 | 6.50% | 6,210,000 | 5,722,267 | ||||||||||||||
OGLALA SIOUX TRIBE OF PINE RIDGE(m) | 10/1/2024 | 5.50% | 1,985,000 | 1,980,435 | ||||||||||||||
13
Colorado BondShares
A Tax-Exempt Fund
Schedule of Investments (unaudited) — (Continued)
| Other Municipal Bonds (Continued) | Maturity | Coupon | Principal | Value | ||||||||||||||
| South Dakota (Continued) | ||||||||||||||||||
OGLALA SIOUX TRIBE, SERIES 2018C(m) | 10/1/2026 | 8.00% | $ | 800,000 | $ | 822,240 | ||||||||||||
OGLALA SIOUX TRIBE, SER 2019A(m) | 10/1/2027 | 4.50% | 2,370,000 | 2,236,427 | ||||||||||||||
|
|
|
| |||||||||||||||
South Dakota (amortized cost $91,551,055) | 91,560,000 | 85,372,827 | ||||||||||||||||
|
|
|
| |||||||||||||||
| Puerto Rico 10.1% | ||||||||||||||||||
COMMONWEALTH OF PUERTO RICO(a) | 7/1/2035 | 8.00% | 2,500,000 | 2,209,375 | ||||||||||||||
PUERTO RICO SALES TAX FINANCING CORP RESTRUCTURED SER 2019 A-1 | 7/1/2034 | 4.50% | 277,000 | 289,520 | ||||||||||||||
PUERTO RICO SALES TAX FINANCING CORP RESTRUCTURED SER 2019 A-1 | 7/1/2040 | 4.55% | 140,000 | 146,639 | ||||||||||||||
PUERTO RICO SALES TAX FINANCING CORP RESTRUCTURED SER 2019 A-1 | 7/1/2053 | 4.75% | 1,028,000 | 1,078,557 | ||||||||||||||
PUERTO RICO SALES TAX FINANCING CORP RESTRUCTURED SER 2019 A-1 | 7/1/2058 | 5.00% | 2,600,000 | 2,764,320 | ||||||||||||||
PUERTO RICO SALES TAX FINANCING CORP RESTRUCTURED SER 2019 A-1 | 7/1/2024 | 0.00% | 126,000 | 118,112 | ||||||||||||||
PUERTO RICO SALES TAX FINANCING CORP RESTRUCTURED SER 2019 A-1 | 7/1/2027 | 0.00% | 267,000 | 228,480 | ||||||||||||||
PUERTO RICO SALES TAX FINANCING CORP RESTRUCTURED SER 2019 A-1 | 7/1/2029 | 0.00% | 260,000 | 207,269 | ||||||||||||||
PUERTO RICO SALES TAX FINANCING CORP RESTRUCTURED SER 2019 A-1 | 7/1/2031 | 0.00% | 336,000 | 248,700 | ||||||||||||||
PUERTO RICO SALES TAX FINANCING CORP RESTRUCTURED SER 2019 A-1 | 7/1/2033 | 0.00% | 378,000 | 257,902 | ||||||||||||||
PUERTO RICO SALES TAX FINANCING CORP RESTRUCTURED SER 2019 A-1 | 7/1/2046 | 0.00% | 3,597,000 | 1,099,243 | ||||||||||||||
PUERTO RICO SALES TAX FINANCING CORP RESTRUCTURED SER 2019 A-1 | 7/1/2051 | 0.00% | 2,930,000 | 648,643 | ||||||||||||||
PUERTO RICO SALES TAX FING CORP TAX REV DTD 8/1/2019 4.329% SER A-2 7/1/2040 | 7/1/2040 | 4.33% | 1,424,000 | 1,473,085 | ||||||||||||||
PUERTO RICO SALES TAX FING CORP TAX REV DTD 8/1/2019 4.536% SER A-2 7/1/2053 | 7/1/2053 | 4.54% | 43,000 | 44,608 | ||||||||||||||
PUERTO RICO SALES TAX FING CORP TAX REV DTD 8/1/2019 4.784% SER A-2 7/1/2058 | 7/1/2058 | 4.78% | 571,000 | 600,309 | ||||||||||||||
|
|
|
| |||||||||||||||
Puerto Rico (amortized cost $9,698,477) | 16,477,000 | 11,414,764 | ||||||||||||||||
|
|
|
| |||||||||||||||
14
Colorado BondShares
A Tax-Exempt Fund
Schedule of Investments (unaudited) — (Continued)
| Other Municipal Bonds (Continued) | Maturity | Coupon | Principal | Value | ||||||||||||||
| Oregon 5.1% | ||||||||||||||||||
MULTNOMAH CITY HOSPITAL FACILITY ODD FELLOWS(m) | 10/1/2023 | 5.45% | $ | 5,815,000 | $ | 5,815,000 | ||||||||||||
|
|
|
| |||||||||||||||
Oregon (amortized cost $5,815,000) | 5,815,000 | 5,815,000 | ||||||||||||||||
|
|
|
| |||||||||||||||
| Arizona 4.4% | ||||||||||||||||||
HERITAGE ACADEMY CHARTER SCHOOL MARICOPA COUNTY(m) | 7/1/2027 | 5.25% | 4,915,000 | 4,964,445 | ||||||||||||||
|
|
|
| |||||||||||||||
Arizona (amortized cost $4,915,000) | 4,915,000 | 4,964,445 | ||||||||||||||||
|
|
|
| |||||||||||||||
| Washington 1.9% | ||||||||||||||||||
TACOMA CONSOLIDATED LID | 4/1/2043 | 5.75% | 2,185,000 | 2,187,622 | ||||||||||||||
|
|
|
| |||||||||||||||
Washington (amortized cost $2,045,947) | 2,185,000 | 2,187,622 | ||||||||||||||||
|
|
|
| |||||||||||||||
| California 1.6% | ||||||||||||||||||
FREDDIE MAC(g)(j) | 1/1/2037 | 0.00% | 1,861,157 | 1,861,157 | ||||||||||||||
|
|
|
| |||||||||||||||
California (amortized cost $1,861,157) | 1,861,157 | 1,861,157 | ||||||||||||||||
|
|
|
| |||||||||||||||
| Missouri 0.9% | ||||||||||||||||||
KANSAS CITY INDL DEV AUTH | 1/1/2028 | 6.75% | 175,000 | 175,530 | ||||||||||||||
ST LOUIS INDL DEV AUTH SR HSG – SENIOR SERIES 2005A | 5/1/2027 | 6.75% | 825,000 | 808,360 | ||||||||||||||
|
|
|
| |||||||||||||||
Missouri (amortized cost $1,000,000) | 1,000,000 | 983,890 | ||||||||||||||||
|
|
|
| |||||||||||||||
| Oklahoma 0.4% | ||||||||||||||||||
HASKELL CNTY PUBLIC FAC. | 4/1/2024 | 5.25% | 450,000 | 452,696 | ||||||||||||||
|
|
|
| |||||||||||||||
Oklahoma (amortized cost $450,000) | 450,000 | 452,696 | ||||||||||||||||
|
|
|
| |||||||||||||||
Other Municipal Bonds (amortized cost $117,336,636) | $ | 124,263,157 | $ | 113,052,400 | ||||||||||||||
|
|
|
| |||||||||||||||
| Colorado Capital Appreciation and Zero Coupon Bonds 5.0% | ||||||||||||||||||
| Colorado 100.0% | ||||||||||||||||||
BELLA MESA METROPOLITAN DISTRICT CONV CABS SER A(m) | 12/1/2049 | 0.00% | $ | 3,780,000 | $ | 3,090,415 | ||||||||||||
COLORADO INTERNATIONAL CENTER METROPOLITAN DISTRICT NO. 7 | 12/1/2027 | 0.00% | 15,660,000 | 10,650,053 | ||||||||||||||
CONIFER METROPOLITAN DISTRICT(a)(d)(j) | 12/1/2031 | 0.00% | 7,470,000 | 2,988,000 | ||||||||||||||
MAYFIELD METROPOLITAN DISTRICT, SER 2020C | 12/15/2050 | 3.00% | 766,000 | 269,732 | ||||||||||||||
PV-ERU HOLDING TRUST(a)(m) | 2/14/2039 | 0.00% | 710,000 | 149,100 | ||||||||||||||
PV-ERU HOLDING TRUST(a)(m) | 2/14/2039 | 0.00% | 3,122,000 | 655,620 | ||||||||||||||
PV-ERU HOLDING TRUST(a)(m) | 2/14/2039 | 0.00% | 13,168,000 | 2,765,280 | ||||||||||||||
15
Colorado BondShares
A Tax-Exempt Fund
Schedule of Investments (unaudited) — (Continued)
| Colorado Capital Appreciation and Zero Coupon Bonds (Continued) | Maturity | Coupon | Principal | Value | ||||||||||||||
| Colorado (Continued) | ||||||||||||||||||
PV-ERU HOLDING TRUST(a)(m) | 12/15/2037 | 0.00% | $ | 14,000,000 | $ | 2,940,000 | ||||||||||||
RAVENNA METROPOLITAN DISTRICT CONV CABS – SERIES 2017A(d) | 12/1/2046 | 5.00% | 33,685,000 | 34,007,702 | ||||||||||||||
RAVENNA METROPOLITAN DISTRICT CONV CABS – SERIES 2017 SUPPLEMENTAL B(d) | 12/1/2023 | 0.00% | 325,000 | 301,831 | ||||||||||||||
RAVENNA METROPOLITAN DISTRICT CONV CABS – SERIES 2017 SUPPLEMENTAL B(d) | 12/1/2024 | 0.00% | 490,000 | 434,993 | ||||||||||||||
RAVENNA METROPOLITAN DISTRICT CONV CABS – SERIES 2017 SUPPLEMENTAL B(d) | 12/1/2025 | 0.00% | 585,000 | 495,869 | ||||||||||||||
ROCKINGHORSE METROPOLITAN DISTRICT NO. 2 CONV CABS REF SER A | 1/1/2024 | 6.00% | 3,565,000 | 3,806,030 | ||||||||||||||
ROCKINGHORSE METROPOLITAN DISTRICT NO. 2 CONV CABS REF SER B | 1/1/2024 | 6.50% | 3,885,000 | 4,177,230 | ||||||||||||||
ROCKINGHORSE METROPOLITAN DISTRICT NO. 2 CONV CABS JUNIOR LIEN SER C | 6/1/2024 | 0.00% | 1,115,000 | 1,081,048 | ||||||||||||||
SOUTHSHORE METROPOLITAN DISTRICT NO. 2 SUB B(g) | 12/15/2041 | 4.13% | 9,690,000 | 10,397,951 | ||||||||||||||
STC METROPOLITAN DISTRICT NO. 2, SER A | 12/1/2025 | 3.00% | 555,000 | 548,407 | ||||||||||||||
STERLING RANCH METROPOLITAN DISTRICT #2 CONV CAB(d) | 12/1/2045 | 8.00% | 6,685,000 | 6,517,942 | ||||||||||||||
THIRD CREEK METROPOLITAN DISTRICT NO. 1, SER A-1 | 12/1/2042 | 4.50% | 1,500,000 | 1,342,515 | ||||||||||||||
THIRD CREEK METROPOLITAN DISTRICT NO. 1, SER A-2 CONV CABS: 12/01/2026 | 12/1/2026 | 0.00% | 2,285,000 | 1,545,757 | ||||||||||||||
WILDWING METROPOLITAN DISTRICT #1(d) | 12/1/2023 | 0.00% | 255,000 | 225,764 | ||||||||||||||
|
|
|
| |||||||||||||||
Colorado (amortized cost $96,293,040) | 123,296,000 | 88,391,238 | ||||||||||||||||
|
|
|
| |||||||||||||||
Colorado Capital Appreciation and Zero Coupon Bonds (amortized cost $96,293,040) | $ | 123,296,000 | $ | 88,391,238 | ||||||||||||||
|
|
|
| |||||||||||||||
| Short-Term Municipal Bonds 4.2% | ||||||||||||||||||
| Multi-State 59.2% | ||||||||||||||||||
FREDDIE MAC AMT (LOC 6) | 11/15/2036 | 0.52% | $ | 4,468,000 | $ | 4,468,000 | ||||||||||||
FREDDIE MAC VR AMT (LOC 6) | 6/15/2036 | 0.52% | 21,345,000 | 21,345,000 | ||||||||||||||
FREDDIE MAC VR (LOC 6) | 12/15/2045 | 0.52% | 18,620,000 | 18,620,000 | ||||||||||||||
|
|
|
| |||||||||||||||
Multi-State (amortized cost $44,433,000) | 44,433,000 | 44,433,000 | ||||||||||||||||
|
|
|
| |||||||||||||||
16
Colorado BondShares
A Tax-Exempt Fund
Schedule of Investments (unaudited) — (Continued)
| Short-Term Municipal Bonds (Continued) | Maturity | Coupon | Principal | Value | ||||||||||||||
| Colorado 38.2% | ||||||||||||||||||
BOULDER CO HSG AUTH MF BROADWAY EAST APTS (LOC 3) | 9/1/2037 | 0.54% | $ | 1,530,000 | $ | 1,530,000 | ||||||||||||
BOULDER COUNTY – BOULDER COLLEGE OF MASSAGE(a)(j) | 10/15/2031 | 0.00% | 4,315,000 | 4,315,000 | ||||||||||||||
BROOMFIELD URBAN RENEWAL AUTHORITY (LOC 1) | 12/1/2030 | 0.53% | 7,795,000 | 7,795,000 | ||||||||||||||
COLORADO HOUSING & FINANCE AUTHORITY – SERIES 2007A (LOC 3) | 1/1/2032 | 0.54% | 5,205,000 | 5,205,000 | ||||||||||||||
COLORADO SPRINGS UTILITIES (LOC 3) | 11/1/2041 | 0.50% | 1,200,000 | 1,200,000 | ||||||||||||||
JEFFCO BUSINESS CENTER METROPOLITAN DISTRICT #1(j) | 7/1/2022 | 0.00% | 1,006,000 | 1,006,000 | ||||||||||||||
MESA COUNTY – ENSTROM CANDIES INC PROJ (LOC 7) | 7/1/2022 | 0.67% | 195,000 | 195,000 | ||||||||||||||
MIDCITIES METROPOLITAN DISTRICT #2 – SUBORDINATE 2016B(g) | 12/15/2046 | 7.75% | 1,919,000 | 1,915,757 | ||||||||||||||
THE PLAZA METROPOLITAN DISTRICT #1(m) | 12/1/2022 | 5.00% | 500,000 | 506,805 | ||||||||||||||
RAVENNA METROPOLITAN DISTRICT CONV CABS – SERIES 2017 SUPPLEMENTAL B(d) | 12/1/2022 | 0.00% | 170,000 | 165,109 | ||||||||||||||
ROXBOROUGH VILLAGE METROPOLITAN DISTRICT – SERIES 1993B P/O(e)(i) | 12/31/2022 | 0.00% | 24,707 | 22,237 | ||||||||||||||
SHERIDAN REDEVLOPMENT AGENCY – SERIES 2011A-1 (LOC 5) | 12/1/2029 | 0.52% | 4,800,000 | 4,800,000 | ||||||||||||||
|
|
|
| |||||||||||||||
Colorado (amortized cost $28,137,702) | 28,659,707 | 28,655,908 | ||||||||||||||||
|
|
|
| |||||||||||||||
| South Dakota 2.7% | ||||||||||||||||||
FLANDREAU SANTEE SIOUX TRIBE TAXABLE SERIES 2018A(m) | 1/1/2023 | 8.28% | 875,000 | 872,218 | ||||||||||||||
OGLALA SIOUX TRIBE OF PINE RIDGE(m) | 10/1/2022 | 5.00% | 435,000 | 435,139 | ||||||||||||||
OGLALA SIOUX TRIBE – SEVEN YRS SEVEN GEN PROJ(m) | 3/1/2023 | 4.50% | 700,000 | 696,479 | ||||||||||||||
|
|
|
| |||||||||||||||
South Dakota (amortized cost $2,010,000) | 2,010,000 | 2,003,836 | ||||||||||||||||
|
|
|
| |||||||||||||||
Short-Term Municipal Bonds (amortized cost $74,580,702) | $ | 75,102,707 | $ | 75,092,743 | ||||||||||||||
|
|
|
| |||||||||||||||
17
Colorado BondShares
A Tax-Exempt Fund
Schedule of Investments (unaudited) — (Continued)
| Colorado Taxable Certificates/Notes/Bonds 0.6% | Maturity | Coupon | Principal | Value | ||||||||||||||||
| Colorado 100.0% | ||||||||||||||||||||
COLLIERS HILL METROPOLITAN DISTRICT #2 – SUB SER B-1 TAXABLE CONVERTIBLE TO TAX EXEMPT @ T.E. RATE |
| 12/15/2047 | 6.00% | $ | 2,250,000 | $ | 2,147,738 | |||||||||||||
PUBLIC FINANCE AUTH CHARTER SCHOOL-COLORADO SPRINGS TXBL(m) |
| 7/1/2026 | 7.00% | 5,885,000 | 5,744,231 | |||||||||||||||
PFA AURORA CHARTER SCHOOL BC PROJECT SER C – TAXABLE(m) |
| 7/1/2029 | 7.00% | 1,235,000 | 1,169,014 | |||||||||||||||
WOODMEN HEIGHTS METROPOLITAN DISTRICT NO. 2 SER B-1 TAXABLE BOTH ST & FED INITIALLY |
| 12/15/2040 | 6.25% | 1,830,000 | 1,888,432 | |||||||||||||||
TABERNASH POLE CREEK NOTE(a)(j) |
| 12/31/2022 | 0.00% | 227,347 | 88,199 | |||||||||||||||
|
|
|
| |||||||||||||||||
Colorado (amortized cost $11,427,347) |
| 11,427,347 | 11,037,614 | |||||||||||||||||
|
|
|
| |||||||||||||||||
Colorado Taxable Certificates/Notes/Bonds (amortized cost $11,427,347) |
| $ | 11,427,347 | $ | 11,037,614 | |||||||||||||||
|
|
|
| |||||||||||||||||
Total investments, at value | 69.4 | % | $ | 1,232,097,732 | ||||||||||||||||
Other assets net of liabilities | 30.6 | % | 542,860,977 | |||||||||||||||||
|
|
|
| |||||||||||||||||
Net Assets | 100.0 | % | $ | 1,774,958,709 | ||||||||||||||||
|
|
|
| |||||||||||||||||
18
Colorado BondShares
A Tax-Exempt Fund
Schedule of Investments (unaudited) — (Continued)
| (a) | Defaulted or non-income producing based upon the financial condition of the issuer (see note 2 in notes to financial statements). |
| (b) | Originally issued as general obligation bonds but are now pre-refunded and are secured by an escrow fund consisting entirely of direct U.S. Government obligations. |
| (c) | Represents securities whose blended characteristics are reflective of a zero coupon bond and a step rate bond. Interest rate shown represents effective yield at acquisition. |
| (d) | Interest rate shown for capital appreciation and zero coupon bonds represents the effective yield at the date of acquisition. |
| (e) | Principal-only certificate represents the right to receive the principal payments on the underlying debt security upon maturity. The price of this security is typically more volatile than that of coupon-bearing bonds of the same maturity. |
| (f) | Interest-only certificate represents the right to receive semi-annual interest payments on the underlying debt security. The principal amount of the underlying security represents the notional amount on which current interest is calculated. The interest rate shown represents the effective yield at the date of acquisition. |
| (g) | Interest rate disclosed for cash flow bond represents the effective yield at March 31, 2022. Income on this security is derived from the cash flow of the issuer. |
| (h) | Represents current interest rate for a step rate bond. No step rate bonds were owned by the Fund at March 31, 2022. |
| (i) | Terms of security have been restructured since the original issuance. The total face amount of all such restructured securities approximates $10,978,743 and a value of $6,753,667 or less than 1.0% of net assets, as of March 31, 2022. |
| (j) | Securities valued at fair value (see note 2 in notes to financial statements). |
| (k) | See note 7 in notes to financial statements for further information on purchase accrued interest related to these bonds. |
| (l) | The Fund has entered into a forbearance agreement under which it agrees that the issuer may pay a reduced rate of interest in lieu of the contract rate for a period of time (see note 2 in notes to financial statements). |
| (m) | Security exempt from registration under Rule 144A of the Securities Act of 1933. Such securities may be sold in transactions exempt from registration, normally to qualified institutional buyers. At March 31, 2022, the aggregate value was $444,285,411 representing 25.03% of net assets. |
See accompanying notes to financial statements.
19
COLORADO BONDSHARES
A TAX-EXEMPT FUND
Schedule of Investments (unaudited) — (Continued)
| (LOC) | These securities are Variable Rate Demand Obligations ("VRDO") with scheduled principal and interest payments that have a guaranteed liquidity provider in the form of a letter of credit. These obligations bear interest at a rate that resets daily or weekly (see note 2 in notes to financial statements). The numbered list below corresponds to the liquidity provider associated with the respective LOC. |
1. BNP Paribas
2. FHLB Topeka
3. US Bank, N. A.
4. Royal Bank of Canada
5. JPMorgan Chase Bank, N.A.
6. Freddie Mac
7. Wells Fargo Bank, N.A.
The following abbreviations are used in the descriptions of securities included in the Schedule of Investments:
CABS — Capital Appreciation Bonds
CONV — Convertible
I/O — Interest Only
L/D — Local Improvement District
P/O — Principal Only
See accompanying notes to financial statements.
20
Colorado BondShares
A Tax-Exempt Fund
Statement of Assets and Liabilities
March 31, 2022 (unaudited)
| ASSETS |
| |||
Investments, at value (amortized cost 1,287,984,952) | $ | 1,232,097,732 | ||
— see accompanying schedule | ||||
Cash | 328,141,367 | |||
Interest receivable | 126,222,885 | |||
Purchase accrued interest (note 7) | 92,740,878 | |||
Receivable for shares of beneficial interest sold | 540,115 | |||
|
| |||
TOTAL ASSETS | 1,779,742,977 | |||
|
| |||
| LIABILITIES |
| |||
Payables and other liabilities: | ||||
Dividends payable | 3,027,499 | |||
Payable for shares of beneficial interest redeemed | 298,014 | |||
Management fees payable | 760,542 | |||
Accrued expenses payable | 698,213 | |||
|
| |||
TOTAL LIABILITIES | 4,784,268 | |||
|
| |||
NET ASSETS | $ | 1,774,958,709 | ||
|
| |||
COMPOSITION OF NET ASSETS | ||||
Paid-in capital | $ | 1,828,493,059 | ||
Accumulated net realized gain | 2,352,870 | |||
Net unrealized appreciation (depreciation) of investments | (55,887,220 | ) | ||
|
| |||
NET ASSETS | $ | 1,774,958,709 | ||
|
| |||
NET ASSET PRICE AND REDEMPTION PRICE PER SHARE | $ | 9.03 | ||
|
| |||
MAXIMUM OFFERING PRICE PER SHARE | $ | 9.48 | ||
|
| |||
See accompanying notes to financial statements.
21
Colorado BondShares
A Tax-Exempt Fund
Statement of Operations
For the Six Months Ended March 31, 2022 (unaudited)
INVESTMENT INCOME | ||||
Interest | $ | 38,556,624 | ||
EXPENSES | ||||
Management fees (note 4) | 4,482,716 | |||
Custodian fees (note 5) | 57,818 | |||
Legal and auditing fees | 123,733 | |||
Portfolio pricing fees | 15,824 | |||
Registration fees | 5,704 | |||
Shareholders' reports | 47,288 | |||
Transfer agency expenses (note 4) | 92,000 | |||
Trustees' fees | 6,072 | |||
Other | 122,077 | |||
|
| |||
Total expenses | 4,953,232 | |||
Custody credits (note 5) | (45,674 | ) | ||
|
| |||
Net expenses | 4,907,558 | |||
|
| |||
NET INVESTMENT INCOME | 33,649,066 | |||
|
| |||
REALIZED AND UNREALIZED GAIN ON INVESTMENTS | ||||
Net realized gain on investments | 1,565,957 | |||
Net unrealized appreciation (depreciation) on investments | (70,536,665 | ) | ||
|
| |||
NET REALIZED AND UNREALIZED GAIN (LOSS) ON INVESTMENTS | (68,970,708 | ) | ||
|
| |||
NET INCREASE (DECREASE) IN NET ASSETS RESULTING FROM OPERATIONS | $ | (35,321,642 | ) | |
|
|
See accompanying notes to financial statements.
22
Colorado BondShares
A Tax-Exempt Fund
Statements of Changes in Net Assets
For the Periods Indicated
| Six Months Ended March 31, 2022 | Year Ended September 30, 2021 | |||||||
| (unaudited) | ||||||||
FROM OPERATIONS: | ||||||||
Net investment income | $ | 33,649,066 | $ | 63,836,562 | ||||
Net realized gain on investments | 1,565,957 | 2,539,720 | ||||||
Unrealized appreciation (depreciation) on investments | (70,536,665 | ) | 28,248,570 | |||||
|
|
|
| |||||
Net increase (decrease) in net assets resulting from operations | (35,321,642 | ) | 94,624,852 | |||||
|
|
|
| |||||
FROM DISTRIBUTIONS TO SHAREHOLDERS: (note 2) | ||||||||
Dividends to shareholders from net investment income | (33,649,066 | ) | (63,836,562 | ) | ||||
Net realized gain to shareholders from investment transactions | (1,463,919 | ) | (2,933,082 | ) | ||||
|
|
|
| |||||
Total distributions to shareholders | (35,112,985 | ) | (66,769,644 | ) | ||||
|
|
|
| |||||
FROM BENEFICIAL INTEREST TRANSACTIONS: | ||||||||
Proceeds from sale of shares | 119,675,773 | 284,305,602 | ||||||
Reinvested dividends and distributions | 24,982,423 | 47,782,882 | ||||||
Redemption of shares | (67,408,303 | ) | (86,277,451 | ) | ||||
|
|
|
| |||||
Increase in net assets derived from beneficial interest transactions | 77,249,893 | 245,811,033 | ||||||
|
|
|
| |||||
Net increase in net assets | 6,815,267 | 273,666,242 | ||||||
NET ASSETS: | ||||||||
Beginning of period | 1,768,143,442 | 1,494,477,200 | ||||||
|
|
|
| |||||
End of period | $ | 1,774,958,709 | $ | 1,768,143,442 | ||||
|
|
|
| |||||
See accompanying notes to financial statements.
23
Colorado BondShares
A Tax-Exempt Fund
Financial Highlights
The financial highlights table is intended to help you understand the Fund’s financial performance. Certain information reflects financial results for a single Fund share. The total returns in the table represent the rate that an investor would have earned (or lost) on an investment in the Fund (assuming reinvestment of all dividends and distributions). Sales charges are not reflected in the total returns.
| For Fiscal Years Ended September 30 | ||||||||||||||||||||
| 3/31/2022 | 2021 | 2020 | 2019 | 2018 | ||||||||||||||||
| For a share outstanding throughout the period | (unaudited) | |||||||||||||||||||
Net asset value, beginning of period | $ | 9.39 | $ | 9.22 | $ | 9.25 | $ | 9.13 | $ | 9.05 | ||||||||||
|
|
|
|
|
|
|
|
|
| |||||||||||
Income From Investment Operations | ||||||||||||||||||||
Net investment income(1) | 0.17 | 0.37 | 0.37 | 0.37 | 0.36 | |||||||||||||||
Net gain or (loss) on investments (both realized and unrealized) | (0.35 | ) | 0.19 | (0.03 | ) | 0.17 | 0.10 | |||||||||||||
|
|
|
|
|
|
|
|
|
| |||||||||||
Increase (decrease) from investment operations | (0.18 | ) | 0.56 | 0.34 | 0.54 | 0.46 | ||||||||||||||
Less Distributions | ||||||||||||||||||||
Dividends to shareholders from net investment income | (0.17 | ) | (0.37 | ) | (0.37 | ) | (0.37 | ) | (0.36 | ) | ||||||||||
Distributions from realized capital gains | $ | (0.01 | ) | $ | (0.02 | ) | $ | — | $ | (0.05 | ) | $ | (0.02 | ) | ||||||
|
|
|
|
|
|
|
|
|
| |||||||||||
Total Distributions | (0.18 | ) | (0.39 | ) | (0.37 | ) | (0.42 | ) | (0.38 | ) | ||||||||||
|
|
|
|
|
|
|
|
|
| |||||||||||
Net increase (decrease) in net asset value | (0.36 | ) | 0.17 | (0.03 | ) | 0.12 | 0.08 | |||||||||||||
|
|
|
|
|
|
|
|
|
| |||||||||||
Net Asset Value, end of period | $ | 9.03 | $ | 9.39 | $ | 9.22 | $ | 9.25 | $ | 9.13 | ||||||||||
|
|
|
|
|
|
|
|
|
| |||||||||||
Total Return, at Net Asset Value(2) | -1.94 | %+ | 5.91 | % | 3.83 | % | 6.09 | % | 5.29 | % | ||||||||||
|
|
|
|
|
|
|
|
|
| |||||||||||
Ratios/Supplemental Data: | ||||||||||||||||||||
Ratios to average net assets: | ||||||||||||||||||||
Net investment income | 3.75 | %* | 3.92 | % | 4.02 | % | 4.02 | % | 4.00 | % | ||||||||||
Total expenses | 0.55 | * | 0.61 | % | 0.58 | % | 0.55 | % | 0.56 | % | ||||||||||
Net expenses | 0.55 | * | 0.61 | % | 0.57 | % | 0.55 | % | 0.56 | % | ||||||||||
Net assets, end of period (000s) | $ | 1,774,959 | $ | 1,768,143 | $ | 1,494,477 | $ | 1,422,697 | $ | 1,265,958 | ||||||||||
|
|
|
|
|
|
|
|
|
| |||||||||||
Portfolio turnover rate(3) | 8.72 | % | 10.66 | % | 22.54 | % | 9.62 | % | 27.02 | % | ||||||||||
|
|
|
|
|
|
|
|
|
| |||||||||||
| + | not annualized |
| * | annualized |
| (1) | Net investment income per share was calculated using an average shares method. |
| (2) | Assumes a hypothetical initial investment on the business day before the first day of the fiscal period, with all dividends reinvested in additional shares on the reinvestment date, and redemption at the net asset value calculated on the last business day of the fiscal period. Sales charges are not reflected in the total returns. |
| (3) | The portfolio turnover rate is computed by dividing the lesser of purchases or sales of portfolio securities for a period by the monthly average of the value of portfolio securities owned during the period. Sales of securities include the proceeds of securities that have been called or for which payment has been made through redemption or maturity. Securities with a maturity date of one year or less at the time of acquisition are excluded from the calculation. Cost of purchases and proceeds from sales of investment securities (excluding short-term securities) for the period ended March 31, 2022 were $234,324,416 and $100,674,617 respectively. |
See accompanying notes to financial statements.
24
Colorado BondShares
A Tax-Exempt Fund
Notes to Financial Statements (unaudited)
| (1) | Organization |
Colorado BondShares — A Tax-Exempt Fund (the "Fund") is registered under the Investment Company Act of 1940, as amended, as a diversified, open-end management company. The Fund’s investment objectives are to maximize income exempt from federal income taxes and from personal income taxes of the State of Colorado to the extent consistent with the preservation of capital and to seek opportunities for capital appreciation. The Fund’s investment adviser is Freedom Funds Management Company ("Freedom Funds"). The following is a summary of significant accounting policies consistently followed by the Fund.
| (2) | Summary of Significant Accounting Policies |
These financial statements have been prepared in conformity with accounting principles generally accepted in the United States of America. This requires management to make estimates and assumptions that affect the reported amounts of assets and liabilities and disclosure of contingent assets and liabilities at the date of the financial statements and the reported amounts of income and expenses during the reporting period. Actual results could differ from those estimates. These financial statements reflect all adjustments that are, in the opinion of management, necessary to a fair statement of the results for the reporting period. The following summarizes the significant accounting policies of the Fund:
| (a) | Investment Valuation and Risk |
Securities for which there is no last sales price are valued by an independent pricing service based on evaluated prices that considers such factors as transactions in bonds, quotations from bond dealers, market transactions in comparable securities and various relationships between securities, or are fair valued by management.
Securities for which market quotations are not readily available (or management considers otherwise are no longer valid or reliable) are valued at fair value determined in accordance with procedures approved by the Board of Trustees. This can occur in the event of, among other things, natural disasters, acts of terrorism, market disruptions, intra-day trading halts, and extreme market volatility. The determination of fair value involves subjective judgments. As a result, using fair value to price a security may result in a price materially different from the prices used by other mutual funds to determine net asset value or the price that may be realized upon the actual sale of the security. Short-term holdings are valued at current market quotations or amortized cost whichever management believes best approximates fair value.
Fixed-income securities owned by the Fund are subject to interest-rate risk, credit risk, prepayment risk and market risk. The Fund invests in not rated securities which, may be subject to a greater degree of credit risk and risk of loss of income and principal, and may be more sensitive to economic conditions than lower yielding, higher rated fixed income securities. The Fund concentrates its investments in Colorado and, therefore, may be impacted by specific events, issuers or factors affecting Colorado. The Fund has more
25
Colorado BondShares
A Tax-Exempt Fund
Notes to Financial Statements (unaudited) — (Continued)
credit risk related to the economic conditions of Colorado than a portfolio with a broader geographical diversification.
Accounting Standards Codification ("ASC") 820 Fair Value Measurements and Disclosures establishes a fair value hierarchy that classifies securities based on valuation techniques used to measure fair value and distinguish between observable inputs (market data obtained from independent sources) and the reporting entities own assumptions, which are not readily observable to market participants. The fair value hierarchy gives the highest priority to quoted prices (unadjusted) in active markets for identical assets or liabilities (Level 1) and the lowest priority to unobservable inputs (Level 3).
Level 1 Inputs: Quoted prices (unadjusted) in active markets for identical assets or liabilities that the reporting entity has the ability to access at the measurement date.
Level 2 Inputs: Inputs other than quoted prices included within Level 1 that are observable for the asset or liability, either directly or indirectly. If the asset or liability has a specified (contractual) term, a Level 2 input must be observable for substantially the full term of the asset or liability.
Level 3 Inputs: Significant unobservable inputs for the asset or liability including management's own assumptions. Unobservable inputs shall be used to measure fair value to the extent that observable inputs are not available.
The following table summarizes the valuation of the Fund's investments as defined by ASC 820 hierarchy levels as of March 31, 2022:
Valuation Inputs Summary
| Colorado Municipal Bonds | Other Municipal Bonds | Colorado Capital Appreciation and Zero Coupon Bonds | Short-Term Municipal Bonds | Colorado Taxable Certificates/ Notes/ Bonds | Total Securities March 31, 2022 | |||||||||||||||||||
Level 1 Securities | $ | — | $ | — | $ | — | $ | — | $ | — | $ | — | ||||||||||||
Level 2 Securities | 942,809,825 | 111,191,243 | 85,403,238 | 69,771,743 | 8,801,677 | 1,217,977,726 | ||||||||||||||||||
Level 3 Securities | 3,861,650 | 1,861,157 | 2,988,000 | 5,321,000 | 88,199 | 14,120,006 | ||||||||||||||||||
|
|
|
|
|
|
|
|
|
|
|
| |||||||||||||
Totals | $ | 946,671,475 | $ | 113,052,400 | $ | 88,391,238 | $ | 75,092,743 | $ | 8,889,876 | $ | 1,232,097,732 | ||||||||||||
|
|
|
|
|
|
|
|
|
|
|
| |||||||||||||
26
Colorado BondShares
A Tax-Exempt Fund
Notes to Financial Statements (unaudited) — (Continued)
| Colorado Municipal Bonds | Other Municipal Bonds | Colorado Capital Appreciation and Zero Coupon Bonds | Short-Term Municipal Bonds | Colorado Taxable Certificates/ Notes/Bonds | Totals | |||||||||||||||||||
Level 3 Beginning Balance September 30, 2021 | $ | 3,861,650 | $ | 1,865,780 | $ | 2,988,000 | $ | 5,321,000 | $ | 88,199 | $ | 14,124,629 | ||||||||||||
Unrealized Losses | — | — | — | — | — | — | ||||||||||||||||||
Unrealized Gains | — | — | — | — | — | — | ||||||||||||||||||
Realized Losses | — | — | — | — | — | — | ||||||||||||||||||
Realized Gains | — | — | — | — | — | — | ||||||||||||||||||
Purchases | — | — | — | — | — | — | ||||||||||||||||||
Sales | — | (4,623 | ) | — | — | — | (4,623 | ) | ||||||||||||||||
Transfers In to Level 3* | — | — | — | — | — | — | ||||||||||||||||||
Transfers Out of Level 3* | — | — | — | — | — | — | ||||||||||||||||||
|
|
|
|
|
|
|
|
|
|
|
| |||||||||||||
Balance as of March 31, 2022 | $ | 3,861,650 | $ | 1,861,157 | $ | 2,988,000 | $ | 5,321,000 | $ | 88,199 | $ | 14,120,006 | ||||||||||||
|
|
|
|
|
|
|
|
|
|
|
| |||||||||||||
* Transfers from Level 2 to Level 3 are because of a lack, or change of observable inputs or reduced market data reliability. Transfers from Level 3 to Level 2 are the result of observable inputs becoming available or increased market data reliability. The Fund’s policy is to recognize transfers into and out of Level 3 when management becomes aware of a change to significant observable input or market data reliability.
From September 30, 2021 to March 31, 2022, there were no Level 1 Securities.
Significant Unobservable Inputs Quantitative Disclosure
Level 3 Securities* | Fair Value as of March 31, 2022 | Valuation Technique(s)** | Unobservable Inputs | Low | High | Weighted Average | ||||||||||||||
Colorado Municipal Bonds | $ | 3,861,650 | discounted cash flow | probability of default | 5.00% | 5.00% | 5.00% | |||||||||||||
Other Municipal Bonds | 1,861,157 | discounted cash flow | probability of default | 1.00% | 1.00% | 1.00% | ||||||||||||||
Colorado Capital Appreciation and Zero Coupon Bonds | 2,988,000 | discounted cash flow | probability of default | 100.00% | 100.00% | 100.00% | ||||||||||||||
Short-Term Municipal Bonds | 5,321,000 | discounted cash flow | probability of default | 5.00% | 10.00% | 5.95% | ||||||||||||||
Colorado Taxable Certificates/Notes/Bonds | 88,199 | discounted cash flow | probability of default | 100.00% | 100.00% | 100.00% | ||||||||||||||
|
| |||||||||||||||||||
Total Level 3 Securities at March 31, 2022 | $ | 14,120,006 | ||||||||||||||||||
|
| |||||||||||||||||||
The significant unobservable inputs used in the fair value measurement of the Fund’s securities are collateral value, probability of default, and loss severity in the event of default. Any changes in unobservable inputs may result in substantial changes to fair value measurements.
* The inputs for these securities are not readily available or cannot be reasonably estimated and are generally those inputs described in Note 2(a). The appropriateness of fair values for these securities is based on results of back testing, broker due diligence, unchanged price review and consideration of macro or security specific events.
** Other unobservable inputs used in the discounted cash flow technique include collateral value and loss severity. These unobservable inputs are specific to the characteristics of each security being valued.
27
Colorado BondShares
A Tax-Exempt Fund
Notes to Financial Statements (unaudited) — (Continued)
| (b) | Cash |
The Fund continually monitors its positions with, and the credit quality of, the financial institutions with which it invests. As of March 31, 2022, and periodically throughout the year, the Fund has maintained balances in various operating accounts in excess of federally insured limits.
| (c) | Income Tax Information and Distributions to Shareholders |
The Fund intends to comply with the requirements of Subchapter M of the Internal Revenue Code, as amended, applicable to regulated investment companies and to distribute all its net investment income and any net realized gain on investments not offset by capital loss carryforwards to shareholders. The Fund distributes investment income monthly and due to the tax-exempt nature of its investments the income is generally non-taxable to the shareholders. The Fund distributes net realized capital gains, if any, to its shareholders at least annually. Income distributions and capital gain distributions are determined in accordance with income tax regulations, which may differ from generally accepted accounting principles. These differences are primarily due to the differing treatment of tax allocations.
Management has reviewed the Fund's tax position for all open tax years. As of March 31, 2022, the Fund did not have a liability for any unrecognized tax benefits. The fund recognizes interest and penalties, if any, related to unrecognized tax benefits as income tax expense in the Statement of Operations. The Fund has no examinations in progress.
At March 31, 2022, the cost and unrealized appreciation (depreciation) of investments, as determined on a federal income tax basis, were as follows:
Cost of investments | $ | 1,287,984,952 | ||
|
| |||
Gross unrealized appreciation | $ | 17,926,485 | ||
Gross unrealized depreciation | (73,813,705 | ) | ||
|
| |||
Net unrealized appreciation (depreciation) of investments | $ | (55,887,220 | ) | |
|
|
For tax purposes, capital losses may be carried over to offset future capital gains, if any. Under the Regulated Investment Company Modernization Act of 2010, capital losses incurred by the Fund in taxable years beginning after December 22, 2010 are not subject to expiration and such losses retain their character as either short-term or long-term rather than being considered short-term as under previous law. Post-enactment capital losses must be fully utilized prior to utilizing any losses incurred in pre-enactment tax years.
| (d) | Defaulted or Non-income Producing Investments |
The Fund discontinues the accrual of interest income on municipal bonds when the securities become delinquent as to payment of principal or interest, or when the Fund's investment adviser determines that an uncertainty exists as to the realization of all or a portion of the principal balance. The face amount of bonds
28
Colorado BondShares
A Tax-Exempt Fund
Notes to Financial Statements (unaudited) — (Continued)
for which the accrual of interest income has been discontinued approximates $67,372,347 and such bonds have a value of $21,445,424 or 1.21% of net assets as of March 31, 2022. These securities have been identified in the accompanying Schedule of Investments.
The Fund has entered into forbearance agreements with one district under which it agrees that the issuer may pay a reduced rate of interest in lieu of the contract rate for a period of time. Face amount of the bonds for which the Fund has entered into forbearance agreements total $27,375,000 and have a value of $15,056,250 or 0.85% of net assets, as of March 31, 2022. These securities have been identified in the Schedule of Investments.
| (e) | Investment Transactions and Revenue Recognition |
Investment transactions are accounted for on the date the investments are purchased or sold (trade date). Purchases and sales of securities, other than short-term securities, aggregated to $234,324,416 and $100,674,617 respectively.
Dividends to shareholders are declared each business day and paid monthly. Distributions to shareholders are recorded on the ex-dividend date. Realized gains and losses from investment transactions are calculated using the identified-cost basis, which is the same basis the Fund uses for federal income tax purposes. Interest income is recorded on the accrual basis.
Variable Rate Demand Obligations ("VRDO") purchased by the Fund are floating rate obligations that have a nominal long-term maturity but have a coupon rate that is reset periodically (e.g., daily or weekly). The investor has the option to put the issue back to the trustee or tender agent at any time with specified (e.g., seven days) notice; accordingly, the Fund treats these obligations as short-term holdings. On March 31, 2022, the interest rates paid on these obligations ranged from 0.50% to 0.67%.
| (f) | Classification of Distributions to Shareholders |
The character of distributions made during the year from net investment income or net realized gains may differ from its ultimate characterization for federal income tax purposes. Also, due to timing of dividend distributions, the fiscal year in which amounts are distributed may differ from the fiscal year in which the income or realized gain was recorded by the Fund.
| (g) | Securities Purchased on a When-Issued Basis |
The Fund may purchase securities on a when-issued basis with payment and delivery scheduled for a future date. These transactions are subject to market fluctuations and may increase or decrease in value prior to the delivery date. The Fund maintains segregated assets with a value equal to or greater than the amount of its purchase commitments. The Fund did not have any when-issued securities at March 31, 2022.
29
Colorado BondShares
A Tax-Exempt Fund
Notes to Financial Statements (unaudited) — (Continued)
| (3) | Shares of Beneficial Interest |
The Fund has an unlimited number of no par value shares of beneficial interest authorized. Transactions in shares of beneficial interest were as follows:
| Six Months Ended March 31, 2022 | Year Ended September 30, 2021 | |||||||||||||||
| Shares | Amount | Shares | Amount | |||||||||||||
| (unaudited) | ||||||||||||||||
Shares sold | 12,877,036 | $ | 119,964,607 | 30,310,105 | $ | 284,304,913 | ||||||||||
Dividends reinvested | 2,684,247 | 24,982,423 | 5,099,548 | 47,782,882 | ||||||||||||
|
|
|
|
|
|
|
| |||||||||
| 15,561,283 | 144,947,030 | 35,409,653 | 332,087,795 | |||||||||||||
Shares redeemed | (7,338,236 | ) | (68,043,547 | ) | (9,204,679 | ) | (86,276,679 | ) | ||||||||
|
|
|
|
|
|
|
| |||||||||
Net increase in shares outstanding | 8,223,047 | $ | 76,903,483 | 26,204,974 | $ | 245,811,116 | ||||||||||
|
|
|
|
|
|
|
| |||||||||
| (4) | Management Fees and Other Transactions with Affiliates |
Management fees paid to Freedom Funds were in accordance with the investment advisory agreement with the Fund, which provides for an annual fee equivalent to 0.5% of the net assets of the Fund. Freedom Funds pays all expense associated with advertising, marketing, and distributing the Fund's shares and serves as the transfer agent, dividend disbursing agent, and registrar for the Fund. Freedom Funds provided certain transfer agency and shareholder services as part of the management fee arrangement for the period ended March 31, 2022. Transfer agency expenses on the Statement of Operations represent direct expenses charged to the Fund by third parties.
Allen Insurance, an affiliate of the investment adviser, acted as agent for the Fidelity Bond and the Errors and Omissions insurance policy maintained by the Fund and as a result received compensation in the form of commissions. The policies were provided by Travelers Insurance Company and all the commissions referred to above were paid by Travelers Insurance Company. Allen Insurance received no compensation directly from the assets of the Fund.
The Fund does not have any Trustees who are affiliated with the Advisor or Distributor. The Board of Trustees appointed a Chief Compliance Officer to the Fund in accordance with federal securities regulations. The Fund does not reimburse the Advisor for any compensation or fees associated with the Chief Compliance Officer.
| (5) | Custody Credits |
Expenses paid indirectly by the Fund represent earnings credits on cash balances maintained with the Fund’s custodian bank, UMB Bank, N.A. The earnings credits resulted in offsetting custodian fees of $45,674 the period ended March 31, 2022.
30
Colorado BondShares
A Tax-Exempt Fund
Notes to Financial Statements (unaudited) — (Continued)
| (6) | Indemnification |
From time to time, the Fund may be involved in certain disputes and legal actions arising in the ordinary course of its business. While it is not feasible to predict or determine the outcome of these proceedings, in management's opinion, based on a review with legal counsel, none of these disputes or legal actions are expected to have a material impact on its financial position or results of operations. However, litigation is subject to inherent uncertainties, and an adverse result in these matters may arise from time to time that may harm the Fund's business.
In the normal course of business, the Fund enters into contracts that contain a variety of representations, which provide general indemnifications. The Fund’s maximum exposure under these arrangements is unknown, as this would involve future claims that may be made against the Fund that have not yet occurred. However, based on experience, the Fund expects the risk of loss to be remote.
| (7) | Purchase Accrued Interest |
Purchase accrued interest is typically a component of a municipal bond purchase and is paid on settlement date. The accrual period begins on the last interest payment date (or original issue date) and runs through the day immediately preceding the settlement date. The Fund has purchased three bonds from the Meadows Metropolitan Districts No. 1, 2 and 7 with an aggregate balance of purchase accrued of $90,436,317 (97.5% of the March 31, 2022 balance of $92,740,878). Approximately $210,153,660 of additional interest has accrued on the purchase accrued interest since its purchase in 2007. This additional accrued interest has been fair valued in accordance with ASC 820 at approximately $86,618,245 and is included in other assets net of liabilities in the Schedule of Investments. This amount bears interest at the rate of 7.999% and will be received over an uncertain period of years. The value of the Meadows bonds is contained within three separate line items of the financial statements which all relate to a single set of bonds that cannot be sold separately.
| (8) | Litigation |
The Fund is periodically involved in various legal proceedings. As of March 31, 2022, the Fund has a litigation payable of $139,794 for all pending litigation matters primarily for the purpose of paying lawyer fees. Possible additional amounts cannot be currently estimated but will be set aside as needed. Although there can be no assurances, based on information available, management believes that it is probable that the ultimate outcome of the action described below and other matters that are pending or threatened will not have a material effect on the Fund’s financial condition.
Marin Metropolitan District LTD Tax G.O. Series 2008 Bond
The Fund is the beneficial owner of bonds issued in 2008 (the “Bonds”) by Marin Metropolitan District (the “District”) as described more fully in the Fund’s most recent quarterly schedule of portfolio holdings for the period ended December 31, 2021 on Form NPORT-P filed with the Securities and Exchange
31
Colorado BondShares
A Tax-Exempt Fund
Notes to Financial Statements (unaudited) — (Continued)
Commission (“SEC”) on February 28, 2022. The Bonds were issued in 2008 pursuant to a trust indenture between the District, as issuer and UMB Bank, N.A. (“UMB”), as trustee (the “Trust Indenture”). The original principal amount of Bonds was $30,485,000. The current principal amount of the Bonds is $17,485,000. The valuation of these Bonds as of March 31, 2022 is set forth in the schedule of investments.
On June 4, 2021 Century at Landmark, LLC (“Century”), which owns one of two parcels of taxable property within the District, filed a Complaint for Declaratory and Injunctive Relief in Arapahoe County District Court (the “Court”) against the Fund, UMB, and the District, Case No. 2021CV30989 (the “Century Claim”) asserting declaratory judgment causes of action seeking declarations that (1) the Century property cannot be taxed by the District for the Bonds because the District tax has been deemed an unconstitutional “special assessment,” (2) the Century property cannot be taxed for the Bonds even if the District’s tax is deemed a tax and not a special assessment, (3) the Fund lacks a legally enforceable contract right to compel the District to impose a mill levy on the District’s property on the grounds that the Trust Indenture and related documents would violate the Colorado Uniform Taxation Clause and the Due Process Clause of the United States Constitution, and (4) the Bonds are not legally enforceable debt obligations as they materially deviated from the Service Plan under Title 32, the Trust Indenture has become impossible to perform and its essential purpose has become frustrated, and because the Trust Indenture was the subject of fraud. On September 24, 2021 the Court dismissed this action without prejudice for lack of subject matter jurisdiction because the claims were not ripe.
Separately, on or about August 23, 2021, the City of Greenwood Village, Colorado (the “City”) filed a Petition for Exclusion with the Court to exclude the other parcel of taxable property within the District — the Landmark Towers property that was the subject of Landmark Towers Ass’n v. UMB Bank, et al. (District Court, Arapahoe County Case No. 2011CV1076) (described in the Fund’s 2020 shareholder report (and earlier reports of the Fund)). In response to the City’s filing, the Court issued an Order of Exclusion dated January 3, 2022 that, pursuant to Section 32-1-502 of the Colorado Revied Statutes (“C.R.S.”), excluded the Landmark Towers property (such property as more fully and specifically described therein, the “Landmark Towers”) without an election under Section 32-1-502(7)(a) of the C.R.S. (collectively, the “Exclusion Order”). In the proceedings leading up to the Exclusion Order, Century filed a “Motion for Findings Prior to Exclusion” with the Court, in which Century argued that it did not oppose the exclusion of the Landmark Towers from the District “so long as the exclusion process resolves the District’s outstanding debt, as required by law, and finds that no property owner in the District, including Century, has responsibility for the District’s debt.” The District’s outstanding debt consists of the Bonds. On November 22, 2021, the Court denied this Motion by Century on the grounds that the Colorado exclusion statutes do not provide any basis for the relief requested by Century. After Century renewed this Motion at an evidentiary hearing on December 27, 2021, in an Order dated December 27, 2021 (the “December 2021 Order”), the Court held that it “declines to enter prospective orders regarding Century’s request for the renewal of its Motion for Findings Prior to Exclusion.” Further, in the December 2021 Order, the Court held that “[t]hese proceedings are governed under C.R.S. section 32-1-502,” which “does not require an order in the form of relief requested by Century.”
32
Colorado BondShares
A Tax-Exempt Fund
Notes to Financial Statements (unaudited) — (Continued)
In light of the dismissal of the Century Claim and the December 2021 Order, the Fund has not taken any further action. However, the Fund intends to continue to vigorously defend its position with respect to this matter. It is impossible to determine the direction, cost, duration or ultimate outcome of these matters.
| (9) | Subsequent Events |
Management has evaluated the possibility of subsequent events in the Fund's financial statements through the date of issuance. Management has determined that there are no material events that would require recognition or disclosure in the Fund's financial statements through this date.
33
Other Information (unaudited)
Proxy Voting Record
The Fund does not invest in equity securities. Accordingly, there were no matters relating to a portfolio security considered during the 12 months ended June 30, 2021 with respect to which the Fund was entitled to vote. Applicable regulations require us to inform you that the foregoing proxy voting information is available on the SEC website at http://www.sec.gov or you may call us at 1-800-572-0069.
Quarterly Statement of Investments
The Fund files a complete statement of investments with the Securities and Exchange Commission for the first and third quarters for each fiscal year on Form N-PORT. Shareholders may view the filed Form N-PORT by visiting the Commission’s website at http://www.sec.gov. The filed form may also be viewed and copied at the Commission’s Public Reference Room in Washington, DC. Information regarding the operations of the Public Reference Room may be obtained by calling 1-800-732-0330 or you may call us at 1-800-572-0069.
34
(This page intentionally left blank)
(This page intentionally left blank)

A Tax-Exempt Fund
SEMI-ANNUAL REPORT
March 31, 2022
ITEM 2. CODE OF ETHICS.
Not required in this filing.
ITEM 3. AUDIT COMMITTEE FINANCIAL EXPERT.
Not required in this filing.
ITEM 4. PRINCIPAL ACCOUNTANT FEES AND SERVICES.
Not required in this filing.
ITEM 5. AUDIT COMMITTEE OF LISTED REGISTRANTS.
Not applicable.
ITEM 6. INVESTMENTS.
(a) Please see the Schedule of Investments contained in the Semi-Annual Report included under Item 1 of this Form N-CSR.
(b) Not applicable.
ITEM 7. DISCLOSURE OF PROXY VOTING POLICIES AND PROCEDURES FOR CLOSED-END MANAGEMENT INVESTMENT COMPANIES.
Not applicable.
ITEM 8. PORTFOLIO MANAGERS OF CLOSED-END MANAGEMENT INVESTMENT COMPANIES.
Not applicable.
ITEM 9. PURCHASES OF EQUITY SECURITIES BY CLOSED-END MANAGEMENT INVESTMENT COMPANY AND AFFILIATED PURCHASERS.
Not applicable.
ITEM 10. SUBMISSION OF MATTERS TO A VOTE OF SECURITY HOLDERS.
The registrant has not adopted procedures by which shareholders may recommend nominees to the registrant’s board of trustees.
ITEM 11. CONTROLS AND PROCEDURES.
(a) The registrant has adopted and maintained disclosure controls and procedures (as such term is defined in Rules 30a-3(c) under the Investment Company Act of 1940, as amended (the “Act”)) that are designed to ensure that information required to be disclosed in the registrant’s reports under the Act, is recorded, processed, summarized and reported within the time periods required under the SEC’s rules and forms and that the information is accumulated and communicated to the registrant’s management, including its principal executive officer and principal financial officer to allow for timely decisions regarding required disclosure.
As required by Rule 30a-3(b) of the Act, the registrant carried out an evaluation under the supervision and with the participation of its management, including its principal executive officer and principal financial officer, of the effectiveness of the design and operation of the registrant’s disclosure controls and procedures within the 90-day period prior to the filing date of this report. Based on the foregoing, the registrant’s principal executive officer and principal financial officer have concluded that the registrant’s disclosure controls and procedures were effective, as of that date.
(b) There were no changes in the registrant’s internal control over financial reporting (as defined in Rule 30a-3(d) under the Act) during the period covered by this report that has materially affected, or is reasonably likely to materially affect, the registrant’s internal control over financial reporting.
ITEM 12. DISCLOSURE OF SECURITIES LENDING ACTIVITIES FOR CLOSED-END MANAGEMENT INVESTMENT COMPANIES.
Not applicable.
ITEM 13. EXHIBITS.
| (a)(2)(i) |
(99.302) Interim President’s (Principal Executive Officer) Section 302 Certification |
| (a)(2)(ii) |
(99.302) Interim Treasurer’s (Principal Financial Officer) Section 302 Certification |
| (a)(3) Not applicable. |
| (b) |
Signatures
Pursuant to the requirements of the Securities Exchange Act of 1934 and the Investment Company Act of 1940, the registrant has duly caused this report to be signed on its behalf by the undersigned, thereunto duly authorized.
| Colorado BondShares — A Tax-Exempt Fund |
/s/ George N. Donnelly |
| George N. Donnelly, |
Interim President, Secretary and Treasurer Date: June 8, 2022 |
Pursuant to the requirements of the Securities Exchange Act of 1934 and the Investment Company Act of 1940, this report has been signed below by the following persons on behalf of the registrant and in the capacities and on the dates indicated.
/s/ George N. Donnelly |
| George N. Donnelly, |
Interim President, Secretary and Treasurer (Principal Executive Officer and Principal Financial Officer) Date: June 8, 2022 |