| | |
OMB APPROVAL |
OMB Number: | | 3235 - 0570 |
Expires: | | August 31, 2011 |
Estimated average burden |
hours per response . . . | | 18.9 |
UNITED STATES
SECURITIES AND EXCHANGE COMMISSION
Washington, D.C. 20549
FORM N-CSR
CERTIFIED SHAREHOLDER REPORT OF REGISTERED
MANAGEMENT INVESTMENT COMPANIES
| | |
Investment Company Act file number: 811-5032 | | |
BARON INVESTMENT FUNDS TRUST f/k/a
BARON ASSET FUND
|
| (Exact name of registrant as specified in charter) |
| | |
| 767 Fifth Avenue, 49th Floor | �� | New York, NY 10153 |
| (Address of Principal Executive Offices) | | (Zip Code) |
Patrick M. Patalino, Esq.
c/o Baron Investment Funds Trust
767 Fifth Avenue, 49th Floor
New York, NY 10153
|
| (Name and Address of Agent for Service) |
Registrant’s Telephone Number, including Area Code: 212-583-2000
Date of fiscal year end: September 30
Date of reporting period: September 30, 2010
Form N-CSR is to be used by management investment companies to file reports with the Commission not later than 10 days after the transmission to stockholders of any report that is required to be transmitted to stockholders under Rule 30e-1 under the Investment Company Act of 1940 (17CRF 270.30e-1). The Commission may use the information provided on Form N-CSR in its regulatory, disclosure review, inspection, and policymaking roles.
A registrant is required to disclose the information specified by Form N-CSR, and the Commission will make this information public. A registrant is not required to respond to the collection of information contained in Form N-CSR unless the Form displays a currently valid Office of Management and Budget (“OMB”) control number. Please direct comments concerning the accuracy of the information collection burden estimate and suggestions for reducing the burden to Secretary, Securities and Exchange Commission, 450 5th Street, NW, Washington, D.C. 20549-0609. The OMB has reviewed this collection of information under the clearance requirements of 44 U.S.C. Section 3507.
Persons who are to respond to the collection of information contained in this form are not required to respond unless the form displays a currently valid OMB control number.
SEC 2569 (5-07)
Item 1. Reports to Stockholders.
Baron Investment Funds Trust Annual Report for the period ended September 30, 2010.
Baron Asset Fund
Baron Growth Fund
Baron Small Cap Fund
Baron Opportunity Fund
Baron Fifth Avenue Growth Fund
September 30, 2010
Baron Funds®
Annual Financial Report
DEAR BARON FUNDS SHAREHOLDER:
In this report you will find audited financial statements for Baron Asset Fund, Baron Growth Fund, Baron Small Cap Fund, Baron Opportunity Fund and Baron Fifth Avenue Growth Fund (the “Funds”) for the fiscal year ended September 30, 2010. The Securities and Exchange Commission (the “SEC”) requires mutual funds to furnish these statements semi-annually to their shareholders. We hope you find these statements informative and useful.
We thank you for choosing to join us as fellow shareholders in Baron Funds. We will continue to work hard to justify your confidence.
Sincerely,
| | | | |
 | |  | |  |
Ronald Baron Chief Executive Officer and Chief Investment Officer November 22, 2010 | | Linda S. Martinson Chairman, President and Chief Operating Officer November 22, 2010 | | Peggy Wong Treasurer and Chief Financial Officer November 22, 2010 |
This Annual Financial Report is for the Baron Investment Funds Trust, which currently has five series: Baron Asset Fund, Baron Growth Fund, Baron Small Cap Fund, Baron Opportunity Fund and Baron Fifth Avenue Growth Fund. If you are interested in the Baron Select Funds, which contains the Baron Partners Fund, Baron Retirement Income Fund, Baron International Growth Fund and Baron Real Estate Fund series, please visit the Funds’ website at www.BaronFunds.com or contact us at 1-800-99BARON.
A description of the Funds’ proxy voting policies and procedures is available without charge on the Funds’ website, www.BaronFunds.com, or by calling 1-800-99BARON and on the SEC’s website at www.sec.gov. The Funds’ most current proxy voting record, Form N-PX, is also available on the Funds’ website at www.BaronFunds.com and on the SEC’s website at www.sec.gov.
The Funds file their complete schedules of portfolio holdings with the SEC for the first and third quarters of each fiscal year on Form N-Q. The Funds’ Forms N-Q are available on the SEC’s website at www.sec.gov. The Funds’ Forms N-Q may also be reviewed and copied at the SEC’s Public Reference Room in Washington, DC; information on the operation of the SEC’s Public Reference Room may be obtained by calling 1-202-551-8090. A copy of the Funds’ Forms N-Q may also be obtained upon request by calling 1-800-99BARON. Schedules of portfolio holdings current to the most recent quarter are also available on the Funds’ website at www.BaronFunds.com.
Some of the comments are based on current management expectations and are considered “forward-looking statements.” Actual future results, however, may prove to be different from our expectations. You can identify forward-looking statements by words such as “estimate,” “may,” “expect,” “should,” “could,” “believe,” “plan” and other similar terms. We cannot promise future returns and our opinions are a reflection of our best judgment at the time this report is compiled.
The views expressed in this report reflect those of the BAMCO, Inc. (“BAMCO” or the “Adviser”) only through the end of the period stated in this report. The views are not intended as recommendations or investment advice to any person reading this report and are subject to change at any time without notice based on market and other conditions.
Past performance is no guarantee of future results. The investment return and principal value of an investment will fluctuate; an investor’s shares, when redeemed, may be worth more or less than their original cost. For more complete information about Baron Funds, including charges and expenses, call or write for a prospectus. Read it carefully before you invest or send money. This report is not authorized for use as an offer of sale or a solicitation of an offer to buy shares of the Funds, unless accompanied or preceded by the Funds’ current prospectus.

767 Fifth Avenue
NY, NY 10153
212-583-2100
| | |
| Baron Asset Fund | | September 30, 2010 |
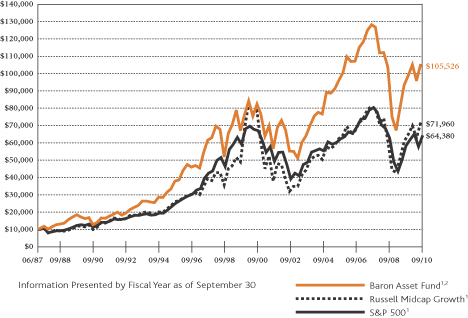
COMPARISONOFTHECHANGEIN VALUEOF $10,000INVESTMENTINBARON ASSET FUND†INRELATIONTOTHE RUSSELL MIDCAP GROWTHANDTHE S&P 500 INDEXES
AVERAGE ANNUAL TOTAL RETURNSFORTHEPERIODSENDED SEPTEMBER 30, 2010
| | | | | | | | | | | | | | | | | | | | |
| | | One
Year | | | Three
Years | | | Five
Years | | | Ten
Years | | | Since
Inception
(June 12,
1987) | |
Baron Asset Fund — Retail Shares1,2 | | | 12.95% | | | | –6.28% | | | | 1.88% | | | | 2.50% | | | | 10.64% | |
Baron Asset Fund — Institutional Shares1,2,4 | | | 13.24% | | | | –6.18% | | | | 1.95% | | | | 2.54% | | | | 10.66% | |
Russell Midcap Growth1 | | | 18.27% | | | | –3.90% | | | | 2.86% | | | | –0.88% | | | | 8.86% | 3 |
S&P 5001 | | | 10.16% | | | | –7.16% | | | | 0.64% | | | | –0.43% | | | | 8.32% | |
| 1 | The S&P 500 and the Russell Midcap Growth are unmanaged indexes. The S&P 500 measures the performance of larger cap equities in the stock market in general. The Russell Midcap Growth measures the performance of mid-sized companies that are classified as growth. The indexes and the Baron Asset Fund are with dividends, which positively impact the performance results. |
| 2 | Past performance is not predictive of future performance. The performance data in the table does not reflect the deduction of taxes that a shareholder would pay on dividends, capital gain distributions, or redemption of Fund shares. |
| 3 | For the period June 30, 1987 to September 30, 2010. |
| 4 | Performance for the Institutional Shares prior to May 29, 2009 is based on the performance of the Retail Shares, which have a distribution fee. The Institutional Shares do not have a distribution fee. If the annual returns prior to May 29, 2009 did not reflect this fee, the returns would be higher. |
| † | Performance information reflects results of the Retail Shares. |
1.800.99.BARON
www.BaronFunds.com
©2010 All Rights Reserved
2
| | |
| September 30, 2010 | | Baron Asset Fund |
TOP TEN HOLDINGSASOF SEPTEMBER 30, 2010
| | | | |
| Baron Asset Fund | | % of Net
Assets | |
C.H. Robinson Worldwide, Inc. | | | 3.5% | |
Charles Schwab Corp. | | | 3.5% | |
Gartner, Inc. | | | 3.2% | |
Arch Capital Group, Ltd. | | | 3.1% | |
IDEXX Laboratories, Inc. | | | 3.0% | |
Polo Ralph Lauren Corp. | | | 3.0% | |
FactSet Research Systems, Inc. | | | 2.8% | |
Fastenal Co. | | | 2.7% | |
Equinix, Inc. | | | 2.7% | |
DeVry, Inc. | | | 2.7% | |
| | | | 30.2% | |
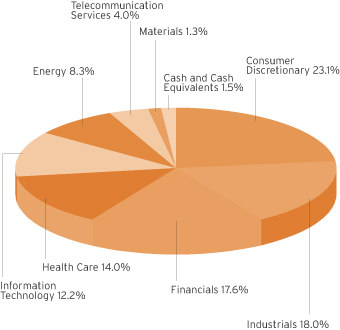
SECTOR BREAKDOWNASOF SEPTEMBER 30, 20102
(as a percentage of net assets)
MANAGEMENT’S DISCUSSIONOF FUND PERFORMANCE
Baron Asset Fund† gained 12.95% for the fiscal year ended September 30, 2010, underperforming the Russell Midcap Growth index, which gained 18.27% and outperforming the S&P 500, which gained 10.16%.
Baron Asset Fund invests primarily in medium-sized growth companies for the long-term while using value-oriented purchase and sell disciplines1. The Fund purchases companies that the Adviser believes have sustainable competitive advantages and strong financial characteristics, operating in industries with favorable macroeconomic trends led by strong management.
The market seesawed throughout the 12-month period ended September 30, peaking in April, declining sharply through May and June, and gaining solidly in July and September. We believe the stock market’s September rally was primarily driven by investors anticipating further quantitative easing by the Federal Reserve. Despite the September rally, the best performing September for the S&P 500 Index since 1939, the equity markets are on par with January 2010 levels and remain close to what they were in March of 1999. The S&P 500 Index on March 31, 1999 was 1,286.37, and as of September 30, 2010, it was 1,141.20. After 11 years the S&P 500 remains at similar levels, yet the earnings per share of the companies in the index could be double.
While economic growth remained weak in the third quarter, a double-dip recession did not materialize. We believe the economy is at a critical inflection point regarding deflation and “reflation”. Many companies, strong financially, hold approximately $1.8 trillion in cash defensively. Towards the end of September, the Fed stated that if the economy does not show improvement, it would seek ways to ease monetary conditions or provide additional stimulus. It is our view that macro economic events continue to overwhelm company fundamentals as the main drivers of stock performance. We continue to find quality businesses selling at compelling valuations and remain fully invested.
The largest contributor to the Fund’s performance for the year ended September 30, 2010 was Gartner, Inc., the leading independent provider of research and analysis on the information technology industry. Gartner benefited from strong earnings and accelerating sales throughout the year. We expect the company to show continued sales momentum across 2010 and beyond as it adds capacity to its sales force, raises prices, launches innovative new products, and leverages its global sales network to cost-effectively distribute research from recent acquisitions AMR and Burton.
Charles Schwab Corp. had the most negative impact on the Fund’s performance for the period. This leading discount brokerage is currently achieving less than its full earnings potential due to the exceptionally low-interest-rate environment. This reduces earnings on client cash balances, and results in the company waiving a significant portion of its asset management fees on money market funds. We think that Schwab’s franchise remains strong, and that the current valuation is low given both the company’s earnings growth potential from ongoing asset gathering, and the step-up in earnings that should occur when interest rates rise.
The Adviser expects to continue to invest in companies that, in our opinion, are undervalued relative to their long-term growth prospects and have the ability to sustain superior levels of profitability. We intend to continue to identify superior quality companies through our independent research efforts. We expect the Fund will remain diversified not only by industry and investment theme, but also by external factors we believe could affect company performance. This approach to investing in companies, not trading of stocks, we believe will allow the Fund to produce above-average rates of return.
| 1 | Prior to February 15, 2007, the Fund’s strategy was also to invest primarily in small- and mid-sized growth companies. |
| 2 | Industry sector or sub-industry group levels are derived from the Global Industry Classification Standard (“GICS”), developed and exclusively owned by MSCI, Inc. and Standard & Poor’s Financial Services LLC, unless otherwise stated that they have been reclassified or classified by the Adviser. All GICS data is provided “As Is” with no warranties. |
| † | Performance information reflects results of the Retail Shares. |
3
| | |
| Baron Growth Fund | | September 30, 2010 |
| | | | | | | | |
Baron Growth Fund | | | | | | | | |
| | |
Ticker Symbols: | | | | | | | | |
Retail Shares: BGRFX | | | | | | | | |
Institutional Shares: BGRIX | | | | | | | | |
Performance | | | 4 | | | | | |
Top Ten Holdings | | | 5 | | | | | |
Sector Breakdown | | | 5 | | | | | |
Management’s Discussion of
Fund Performance | | | 5 | | | | | |
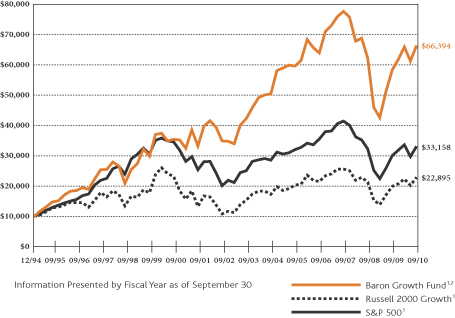
COMPARISONOFTHECHANGEIN VALUEOF $10,000INVESTMENTIN BARON GROWTH FUND†INRELATIONTOTHE RUSSELL 2000 GROWTHANDTHE S&P 500 INDEXES
AVERAGE ANNUAL TOTAL RETURNSFORTHEPERIODSENDED SEPTEMBER 30, 2010
| | | | | | | | | | | | | | | | | | | | |
| | | One
Year | | | Three
Years | | | Five
Years | | | Ten
Years | | | Since
Inception
(December 31,
1994) | |
Baron Growth Fund — Retail Shares1,2 | | | 13.77% | | | | –5.10% | | | | 2.19% | | | | 6.48% | | | | 12.77% | |
Baron Growth Fund — Institutional Shares1,2,3 | | | 14.07% | | | | –4.99% | | | | 2.25% | | | | 6.52% | | | | 12.80% | |
Russell 2000 Growth1 | | | 14.79% | | | | –3.75% | | | | 2.35% | | | | –0.13% | | | | 5.40% | |
Russell 20001 | | | 13.35% | | | | –4.29% | | | | 1.60% | | | | 4.00% | | | | 7.95% | |
S&P 5001 | | | 10.16% | | | | –7.16% | | | | 0.64% | | | | –0.43% | | | | 7.91% | |
| 1 | The Russell 2000 Growth has replaced the Russell 2000 as the primary broad-based index for the Fund because the Adviser believes that the Russell 2000 Growth is more representative of the Fund's investment strategy, as the companies in that index are growth companies. The Russell 2000 remains in the table above for comparison purposes. The Russell 2000, Russell 2000 Growth and S&P 500 are unmanaged indexes. The Russell 2000 measures the performance of 2000 small companies. The Russell 2000 Growth measures the performance of those Russell 2000 companies classified as growth. The S&P 500 measures the performance of larger cap equities in the stock market in general. These indexes and the Baron Growth Fund are with dividends, which positively impact the performance results. |
| 2 | Past performance is not predictive of future performance. The performance data in the table does not reflect the deduction of taxes that a shareholder would pay on dividends, capital gain distributions, or redemption of Fund shares. |
| 3 | Performance for the Institutional Shares prior to May 29, 2009 is based on the performance of the Retail Shares, which have a distribution fee. The Institutional Shares do not have a distribution fee. If the annual returns prior to May 29, 2009 did not reflect this fee, the returns would be higher. |
| † | Performance information reflects results of the Retail Shares. |
1.800.99 BARON
www.BaronFunds.com
©2010 All Rights Reserved
4
| | |
| September 30, 2010 | | Baron Growth Fund |
TOP TEN HOLDINGSASOF SEPTEMBER 30, 2010
| | | | |
| Baron Growth Fund | | % of Net
Assets | |
Edwards Lifesciences Corp. | | | 4.2% | |
DeVry, Inc. | | | 3.2% | |
MSCI, Inc. | | | 2.5% | |
Dick’s Sporting Goods, Inc. | | | 2.5% | |
ITC Holdings Corp. | | | 2.5% | |
Mettler-Toledo International, Inc. | | | 2.5% | |
Arch Capital Group, Ltd. | | | 2.4% | |
FactSet Research Systems, Inc. | | | 2.4% | |
Core Laboratories N.V. | | | 2.2% | |
Community Health Systems, Inc. | | | 2.2% | |
| | | | 26.6% | |
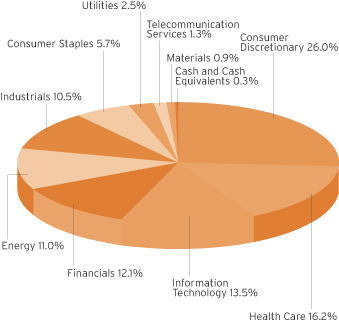
SECTOR BREAKDOWNASOF SEPTEMBER 30, 20101
(as a percentage of net assets)
MANAGEMENT’S DISCUSSIONOF FUND PERFORMANCE
Baron Growth Fund† gained 13.77% for the fiscal year ended September 30, 2010, compared to a 14.79% gain for the Russell 2000 Growth index and a 10.16% gain for the S&P 500.
Baron Growth Fund is a long-term investor in primarily small- sized growth companies. The Adviser, through its independent research of companies, utilizes an investment approach that it believes allows it to look beyond the current market environment and invest based upon the potential profitability of a business, and therefore its value in the future.
The market seesawed throughout the 12-month period ended September 30, peaking in April, declining sharply through May and June, and gaining solidly in July and September. We believe the stock market’s September rally was primarily driven by investors anticipating further quantitative easing by the Federal Reserve. Despite the September rally, the best performing September for the S&P 500 Index since 1939, the equity markets are on par with January 2010 levels and remain close to what they were in March of 1999. The S&P 500 Index on March 31, 1999 was 1,286.37, and as of September 30, 2010, it was 1,141.20. After 11 years the S&P 500 remains at similar levels, yet the earnings per share of the companies in the index could be double.
While economic growth remained weak in the third quarter, a double-dip recession did not materialize. We believe the economy is at a critical inflection point regarding deflation and “reflation.” Many companies, strong financially, hold approximately $1.8 trillion in cash defensively. Towards the end of September, the Fed stated that if the economy does not show improvement, it would seek ways to ease monetary conditions or provide additional stimulus. It is our view that macro economic events continue to overwhelm company fundamentals as the main drivers of stock performance. We continue to find quality businesses selling at compelling valuations and remain fully invested.
Edwards Lifesciences Corp., a leading manufacturer of tissue heart valves, was the largest contributor to the Fund’s performance for the year ended September 30, 2010. We continue to think highly of Edwards’ prospects. Results from a trial of its transcatheter heart valve are encouraging, suggesting its new SAPIEN valve should be the standard of care for patients with aortic stenosis who are not suitable candidates for surgery. We believe the success of the trial will lead to the emergence of a new, multi-billion dollar market opportunity for Edwards in transcatheter heart valves.
Strayer Education, Inc. had the most negative impact on the Fund during the period. The 115-year-old institution, serving more than 50,000 students, sustained sharp stock-price declines as investors grew concerned with the likelihood of increased government regulation. We believe that Strayer will ultimately benefit from tighter regulation as questionable and inappropriate practices of less reputable schools are eliminated.
We believe that our investment process, with its focus on research and long-term investing, will enable the Fund to take advantage of opportunities as they arise throughout the economic recovery. We intend to continue to invest in small businesses that we believe have the potential to grow substantially in the years ahead. We expect the Fund will remain diversified not only by industry and investment theme, but also by external factors we believe could affect company performance. This approach to investing in companies, not trading of stocks, we believe will allow the Fund to produce above-average rates of return.
| 1 | Industry sector or sub-industry group levels are derived from the Global Industry Classification Standard (“GICS”), developed and exclusively owned by MSCI, Inc. and Standard & Poor’s Financial Services LLC, unless otherwise stated that they have been reclassified or classified by the Adviser. All GICS data is provided “As Is” with no warranties. |
| † | Performance information reflects results of the Retail Shares. |
5
| | |
| Baron Small Cap Fund | | September 30, 2010 |
| | | | | | | | |
Baron Small Cap Fund | | | | | | | | |
| | |
Ticker Symbols: | | | | | | | | |
Retail Shares: BSCFX | | | | | | | | |
Institutional Shares: BSFIX | | | | | | | | |
Performance | | | 6 | | | | | |
Top Ten Holdings | | | 7 | | | | | |
Sector Breakdown | | | 7 | | | | | |
Management’s Discussion of Fund Performance | | | 7 | | | | | |
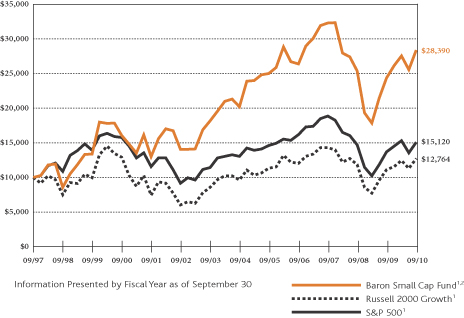
COMPARISONOFTHECHANGEIN VALUEOF $10,000INVESTMENTIN BARON SMALL CAP FUND†INRELATIONTOTHE RUSSELL 2000 GROWTHANDTHE S&P 500 INDEXES
AVERAGE ANNUAL TOTAL RETURNSFORTHEPERIODSENDED SEPTEMBER 30, 2010
| | | | | | | | | | | | | | | | | | | | |
| | | One
Year | | | Three
Years | | | Five
Years | | | Ten
Years | | | Since Inception
(September 30,
1997) | |
Baron Small Cap Fund — Retail Shares1,2 | | | 16.37% | | | – | 4.24% | | | | 2.57% | | | | 5.87% | | | | 8.36% | |
Baron Small Cap Fund — Institutional Shares1,2,3 | | | 16.69% | | | – | 4.13% | | | | 2.64% | | | | 5.90% | | | | 8.39% | |
Russell 2000 Growth1 | | | 14.79% | | | – | 3.75% | | | | 2.35% | | | – | 0.13% | | | | 1.89% | |
Russell 20001 | | | 13.35% | | | – | 4.29% | | | | 1.60% | | | | 4.00% | | | | 4.45% | |
S&P 5001 | | | 10.16% | | | – | 7.16% | | | | 0.64% | | | – | 0.43% | | | | 3.23% | |
| 1 | The Russell 2000 Growth has replaced the Russell 2000 as the primary broad-based index for the Fund because the Adviser believes that the Russell 2000 Growth is more representative of the Fund’s investment strategy, as the companies in that index are growth companies. The Russell 2000 remains in the table above for comparison purposes. The Russell 2000, Russell 2000 Growth and S&P 500 are unmanaged indexes. The Russell 2000 measures the performance of 2000 small companies. The Russell 2000 Growth measures the performance of those Russell 2000 companies classified as growth. The S&P 500 measures the performance of larger cap equities in the stock market in general. These indexes and the Baron Small Cap Fund are with dividends, which positively impact the performance results. |
| 2 | Past performance is not predictive of future performance. The performance data in the table does not reflect the deduction of taxes that a shareholder would pay on dividends, capital gain distributions, or redemption of Fund shares. |
| 3 | Performance for the Institutional Shares prior to May 29, 2009 is based on the performance of the Retail Shares, which have a distribution fee. The Institutional Shares do not have a distribution fee. If the annual returns prior to May 29, 2009 did not reflect this fee, the returns would be higher. |
| † | Performance information reflects results of the Retail Shares. |
1.800.99 BARON
www.BaronFunds.com
©2010 All Rights Reserved
6
| | |
| September 30, 2010 | | Baron Small Cap Fund |
TOP TEN HOLDINGSASOF SEPTEMBER 30, 2010
| | | | |
| Baron Small Cap Fund | | % of Net
Assets | |
SBA Communications Corp. | | | 3.4% | |
Penn National Gaming, Inc. | | | 2.8% | |
Equinix, Inc. | | | 2.7% | |
TransDigm Group, Inc. | | | 2.5% | |
Waste Connections, Inc. | | | 2.4% | |
Liberty Media Corp. | | | 2.4% | |
Iconix Brand Group, Inc. | | | 2.1% | |
Gartner, Inc. | | | 2.0% | |
Atlas Energy, Inc. | | | 2.0% | |
Clean Harbors, Inc. | | | 1.9% | |
| | | | 24.2% | |
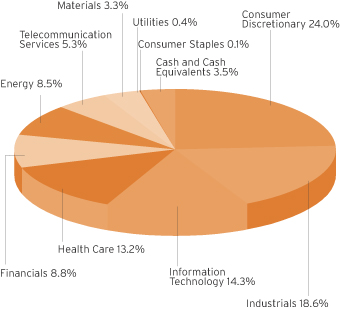
SECTOR BREAKDOWNASOF SEPTEMBER 30, 20101
(as a percentage of net assets)
MANAGEMENT’S DISCUSSIONOF FUND PERFORMANCE
Baron Small Cap Fund† gained 16.37% for the fiscal year ended September 30, 2010, outperforming both the Russell 2000 Growth index of small-cap stocks, which gained 14.79%, and the S&P 500, which gained 10.16%.
Baron Small Cap Fund invests primarily in small-cap growth companies. The Fund is a long-term investor in what the Adviser believes are well-run small-cap growth businesses that can be purchased at prices that represent a significant discount to our assessment of true value.
The market seesawed throughout the 12-month period ended September 30, peaking in April, declining sharply through May and June, and gaining solidly in July and September. We believe the stock market’s September rally was primarily driven by investors anticipating further quantitative easing by the Federal Reserve. Despite the September rally, the best performing September for the S&P 500 Index since 1939, the equity markets are on par with January 2010 levels and remain close to what they were in March of 1999. The S&P 500 Index on March 31, 1999 was 1,286.37, and as of September 30, 2010, it was 1,141.20. After 11 years the S&P 500 remains at similar levels, yet the earnings per share of the companies in the index could be double.
While economic growth remained weak in the third quarter, a double-dip recession did not materialize. We believe the economy is at a critical inflection point regarding deflation and “reflation”. Many companies, strong financially, hold approximately $1.8 trillion in cash defensively. Towards the end of September, the Fed stated that if the economy does not show improvement, it would seek ways to ease monetary conditions or provide additional stimulus. It is our view that macro economic events continue to overwhelm company fundamentals as the main drivers of stock performance. We continue to find quality businesses selling at compelling valuations and remain fully invested.
Liberty Media Corp., with interests in a broad range of electronic retailing, media, communications and entertainment businesses, was the largest contributor to the Fund for the fiscal year ended September 30, 2010. Liberty’s shares were strong throughout the year, in part due to the sharp rise in value in the shares of Sirius XM Radio, 40%-owned by Liberty. Management deserves credit, too, for making clear to investors that the stock was trading at a large discount to its underlying net asset value. Additionally, the company repurchased about 10% of its outstanding shares, further improving the shares’ underlying value.
Strayer Education, Inc. had the most negative impact on the Fund during the period. The 115-year-old institution, serving more than 50,000 students, sustained sharp stock-price declines as investors grew concerned with the likelihood of increased government regulation. We believe that Strayer will ultimately benefit from tighter regulation as questionable and inappropriate practices of less reputable schools are eliminated.
Baron Small Cap’s investments fall into three categories: Growth Stocks, Fallen Angels and Special Situations. The Fund intends to continue to invest in “Growth Stocks” that we believe have significant long-term growth prospects and can be purchased at what we believe are attractive prices because their prospects have not yet been appreciated by investors. “Fallen Angels” are companies that we believe have strong long-term franchises but have disappointed investors with short-term results, creating what we believe is a buying opportunity. “Special Situations” include spin-offs and recapitalizations, where lack of investor awareness creates opportunities to purchase what we believe are strong businesses at attractive prices.
7
| 1 | Industry sector or sub-industry group levels are derived from the Global Industry Classification Standard (“GICS”), developed and exclusively owned by MSCI, Inc. and Standard & Poor’s Financial Services LLC, unless otherwise stated that they have been reclassified or classified by the Adviser. All GICS data is provided “As Is” with no warranties. |
| † | Performance information reflects results of the Retail Shares. |
| | |
| Baron Opportunity Fund | | September 30, 2010 |
| | | | | | | | |
Baron Opportunity Fund | | | | | | | | |
| | |
Ticker Symbols: | | | | | | | | |
Retail Shares: BIOPX | | | | | | | | |
Institutional Shares: BIOIX | | | | | | | | |
Performance | | | 8 | | | | | |
Top Ten Holdings | | | 9 | | | | | |
Sector Breakdown | | | 9 | | | | | |
Management’s Discussion of Fund Performance | | | 9 | | | | | |
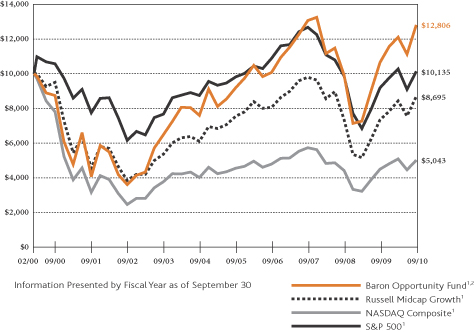
COMPARISONOFTHECHANGEIN VALUEOF $10,000INVESTMENTIN BARON OPPORTUNITY FUND†INRELATIONTOTHE RUSSELL MIDCAP GROWTH,THE NASDAQ COMPOSITE,ANDTHE S&P 500 INDEXES
AVERAGE ANNUAL TOTAL RETURNSFORTHEPERIODSENDED SEPTEMBER 30, 2010
| | | | | | | | | | | | | | | | | | | | |
| | | One
Year | | | Three
Years | | | Five
Years | | | Ten
Years | | | Since
Inception
(February 29,
2000) | |
Baron Opportunity Fund — Retail Shares1,2 | | | 20.26% | | | | –0.64% | | | | 6.85% | | | | 3.87% | | | | 2.36% | |
Baron Opportunity Fund — Institutional Shares1,2,3 | | | 20.53% | | | | –0.54% | | | | 6.92% | | | | 3.90% | | | | 2.39% | |
Russell Midcap Growth1 | | | 18.27% | | | | –3.90% | | | | 2.86% | | | | –0.88% | | | | –1.31% | |
NASDAQ Composite1 | | | 11.60% | | | | –4.29% | | | | 1.94% | | | | –4.29% | | | | –6.26% | |
S&P 5001 | | | 10.16% | | | | –7.16% | | | | 0.64% | | | | –0.43% | | | | 0.13% | |
| 1 | The Russell Midcap Growth has replaced the NASDAQ Composite as the primary broad-based index for the Fund because the Adviser believes that the Russell Midcap Growth is more representative of the Fund’s investment strategy. The NASDAQ Composite remains in the table above for comparison purposes. The Russell Midcap Growth, the NASDAQ Composite and the S&P 500 are unmanaged indexes. The Russell Midcap Growth measures the performance of mid-sized companies that are classified as growth. The NASDAQ Composite tracks the performance of market-value weighted common stocks listed on NASDAQ. The S&P 500 measures the performance of larger cap equities in the stock market in general. The NASDAQ Composite is without dividends. The S&P 500, the Russell Midcap Growth and the Baron Opportunity Fund are with dividends, which positively impact the performance results. |
| 2 | Past performance is not predictive of future performance. The performance data in the table does not reflect the deduction of taxes that a shareholder would pay on dividends, capital gain distributions, or redemption of Fund shares. |
| 3 | Performance for the Institutional Shares prior to May 29, 2009 is based on the performance of the Retail Shares, which have a distribution fee. The Institutional Shares do not have a distribution fee. If the annual returns prior to May 29, 2009 did not reflect this fee, the returns would be higher. |
| † | Performance information reflects results of the Retail Shares. |
1.800.99.BARON
www.BaronFunds.com
©2010 All Rights Reserved
8
| | |
| September 30, 2010 | | Baron Opportunity Fund |
TOP TEN HOLDINGSASOF SEPTEMBER 30, 2010
| | | | |
| Baron Opportunity Fund | | % of Net
Assets | |
Equinix, Inc. | | | 4.7% | |
SBA Communications Corp. | | | 3.6% | |
NII Holdings, Inc. | | | 3.5% | |
Apple, Inc. | | | 3.1% | |
MSCI, Inc. | | | 3.0% | |
Gartner, Inc. | | | 2.8% | |
Discovery Communications, Inc. | | | 2.5% | |
Lamar Advertising Co. | | | 2.3% | |
Pegasystems, Inc. | | | 2.3% | |
Amazon.com, Inc. | | | 2.1% | |
| | | | 29.9% | |
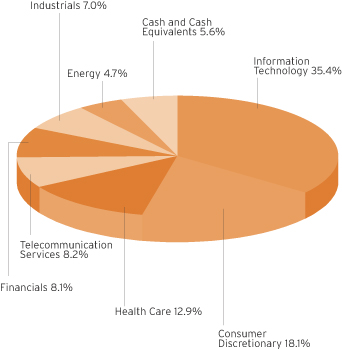
SECTOR BREAKDOWNASOF SEPTEMBER 30, 20101
(as a percentage of net assets)
MANAGEMENT’S DISCUSSIONOF FUND PERFORMANCE
Baron Opportunity Fund† gained 20.26% in the fiscal year ended September 30, 2010 while the Russell Midcap Growth index gained 18.27%, the NASDAQ Composite gained 11.60% and the S&P 500 gained 10.16%.
Baron Opportunity Fund, like the other Baron Funds, utilizes value purchase disciplines while investing in growth companies that the Adviser believes are driving or benefiting from innovation through development of pioneering, transformative or technologically advanced products and services.
The market seesawed throughout the 12-month period ended September 30, peaking in April, declining sharply through May and June, and gaining solidly in July and September. We believe the stock market’s September rally was primarily driven by investors anticipating further quantitative easing by the Federal Reserve. Despite the September rally, the best performing September for the S&P 500 Index since 1939, the equity markets are on par with January 2010 levels and remain close to what they were in March of 1999. The S&P 500 Index on March 31, 1999 was 1,286.37, and as of September 30, 2010, it was 1,141.20. After 11 years the S&P 500 remains at similar levels, yet the earnings per share of the companies in the index could be double.
The focus of the Fund is innovation. Coming out of the economic downturn, we believe innovation is more important than ever. Technological innovation is the main source of productivity and growth, and more economists and business leaders believe that innovation is the most promising way for the U.S. to recover. With our open, pioneering and entrepreneurial culture, innovation is something America still does well. Innovation breeds change – and in times of change, new leaders emerge. We are focusing on those businesses that are disrupting and transforming their industries, creating cutting-edge products and services that are rapidly changing the way we live and do business. The pace of innovation hasn’t slowed because of the recession or the slow economic recovery and we are finding investment opportunities across a wide array of sectors such as Health Care, Energy, Financials, Consumer Discretionary and Information Technology.
SBA Communications Corp., one of the largest independent owners of wireless communications infrastructure – tower and antenna systems – in the U.S., was the largest contributor to the Fund for the fiscal year ended September 30, 2010. SBA’s shares gained on strong leasing activity by wireless carriers. Smartphones, iPads and mobile laptops have driven insatiable consumer demand for wireless data. In turn carriers are improving the coverage and capacity of their existing networks. Investment in the next generation of networks has been driving incrementally more tower leasing activity. And, as financing markets have improved, SBA has reduced its cost of borrowing, while pushing out debt maturities.
Vitacost.com, Inc., the largest detractor from Fund performance during the period, is a leading online retailer of vitamins, nutritional supplements, health and wellness products, food & grocery items and beauty & personal products. Shares of Vitacost dropped sharply during the period as the company confronted manufacturing problems and a contentious proxy battle that resulted in a new board and senior management. We think the company is now well positioned to capitalize on a $25 billion market opportunity. Vitacost is the current online market leader and, with better execution, we think it can growth significantly.
We believe that our investment process, with its focus on research and long-term investing, will enable the Fund to continue taking advantage of opportunities as they arise throughout the economic recovery. We expect to continue to invest in high-growth businesses of all market capitalizations in any sector or industry that we believe will benefit from innovations and advances in technology.
9
| 1 | Industry sector or sub-industry group levels are derived from the Global Industry Classification Standard (“GICS”), developed and exclusively owned by MSCI, Inc. and Standard & Poor’s Financial Services LLC, unless otherwise stated that they have been reclassified or classified by the Adviser. All GICS data is provided “As Is” with no warranties. |
| † | Performance information reflects results of the Retail Shares. |
| | |
| Baron Fifth Avenue Growth Fund | | September 30, 2010 |
| | | | | | | | |
Baron Fifth Avenue Growth Fund | | | | | |
| | |
Ticker Symbols: | | | | | | | | |
Retail Shares: BFTHX | | | | | | | | |
Institutional Shares: BFTIX | | | | | | | | |
Performance | | | 10 | | | | | |
Top Ten Holdings | | | 11 | | | | | |
Sector Breakdown | | | 11 | | | | | |
Management’s Discussion of Fund Performance | | | 11 | | | | | |
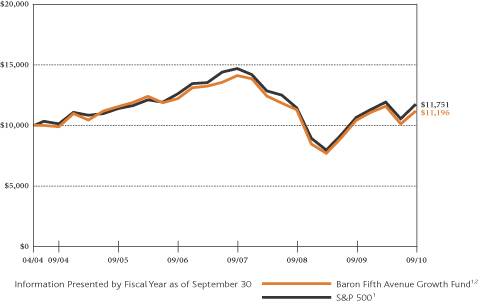
COMPARISONOFTHECHANGEIN VALUEOF $10,000INVESTMENTIN BARON FIFTH AVENUE GROWTH FUND†INRELATIONTOTHE S&P 500 INDEX
AVERAGE ANNUAL TOTAL RETURNSFORTHEPERIODSENDED SEPTEMBER 30, 2010
| | | | | | | | | | | | | | | | |
| | | One
Year | | | Three
Years | | | Five
Years | | | Since
Inception
(April 30,
2004) | |
Baron Fifth Avenue Growth Fund — Retail Shares1,2 | | | 7.38% | | | | –7.44% | | | | –0.64% | | | | 1.78% | |
Baron Fifth Avenue Growth Fund — Institutional Shares1,2,3 | | | 7.59% | | | | –7.35% | | | | –0.58% | | | | 1.82% | |
S&P 5001 | | | 10.16% | | | | –7.16% | | | | 0.64% | | | | 2.55% | |
| 1 | The S&P 500 is an unmanaged index. The S&P 500 measures the performance of larger cap equities in the stock market in general. The index and the Baron Fifth Avenue Growth Fund are with dividends, which positively impact the performance results. |
| 2 | Past performance is not predictive of future performance. The performance data in the table does not reflect the deduction of taxes that a shareholder would pay on dividends, capital gain distributions, or redemption of Fund shares. |
| 3 | Performance for the Institutional Shares prior to May 29, 2009 is based on the performance of the Retail Shares, which have a distribution fee. The Institutional Shares do not have a distribution fee. If the annual returns prior to May 29, 2009 did not reflect this fee, the returns would be higher. |
| † | Performance information reflects results of the Retail Shares. |
1.800.99 BARON
www.BaronFunds.com
©2010 All Rights Reserved
10
| | |
| September 30, 2010 | | Baron Fifth Avenue Growth Fund |
TOP TEN HOLDINGSASOF SEPTEMBER 30, 2010
| | | | |
| Baron Fifth Avenue Growth Fund | | % of Net
Assets | |
American Tower Corp. | | | 3.9% | |
Occidental Petroleum Corp. | | | 3.5% | |
FedEx Corp. | | | 3.5% | |
McDonald’s Corp. | | | 3.4% | |
Equinix, Inc. | | | 3.4% | |
Apple, Inc. | | | 3.3% | |
Carnival Corp. | | | 3.3% | |
Toll Brothers, Inc. | | | 3.3% | |
Republic Services, Inc. | | | 3.2% | |
Fastenal Co. | | | 3.1% | |
| | | | 33.9% | |
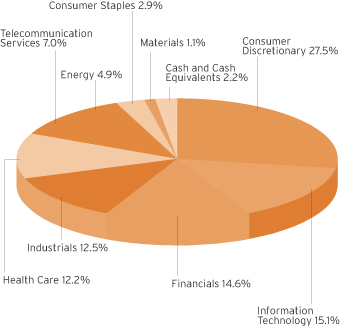
SECTOR BREAKDOWNASOF SEPTEMBER 30, 20101
(as a percentage of net assets)
MANAGEMENT’S DISCUSSIONOF FUND PERFORMANCE
Baron Fifth Avenue Growth Fund† gained 7.38% for the fiscal year ended September 30, 2010, while the Fund’s relative index, the S&P 500, gained 10.16%.
Baron Fifth Avenue Growth Fund focuses on the long-term fundamental prospects of the businesses in which it invests. This
contrasts with other investors’ focus on historical operating results or current earnings expectations. The Adviser believes that historical results and the outlook for near-term earnings are often not indicative of superior longer-term prospects that can be identified through research efforts.
The market seesawed throughout the 12-month period ended September 30, peaking in April, declining sharply through May and June, and gaining solidly in July and September. We believe the stock market’s September rally was primarily driven by investors anticipating further quantitative easing by the Federal Reserve. Despite the September rally, the best performing September for the S&P 500 Index since 1939, the equity markets are on par with January 2010 levels and remain close to what they were in March of 1999. The S&P 500 Index on March 31, 1999 was 1,286.37, and as of September 30, 2010, it was 1,141.20. After 11 years the S&P 500 remains at similar levels, yet the earnings per share of the companies in the index could be double.
While economic growth remained weak in the third quarter, a double-dip recession did not materialize. We believe that the economy is at a critical inflection point regarding deflation and “reflation”. Many companies, strong financially, hold approximately $1.8 trillion in cash defensively. The Fed stated that if the economy does not show improvement, it would seek ways to ease monetary conditions or provide additional stimulus. It is our view that macro economic events continue to overwhelm company fundamentals as the main drivers of stock performance. We continue to find quality businesses selling at compelling valuations and remain fully invested.
American Tower Corp., the largest wireless tower operator in the U.S. with 20,000 towers and an additional 6,000 towers in Latin America and India, was the largest contributor to the Fund for the fiscal year ended September 30, 2010. The growing use of smart phones, iPads and mobile computers is driving demand for wireless voice and data coverage. The result is more leasing activity for American Tower, which has been expanding its international operations by bringing the U.S. tower model to new markets. We expect the addition of new tenants, the adoption of next-generation networks and higher prices to drive earnings and increase free cash flow.
Community Health Systems, Inc., one of the nation’s leading operators of for-profit general acute care hospitals, was the largest detractor from Fund performance during the period. While we believe that the health care reform bill will have a long-term positive impact on Community’s business by insuring 35 million additional people, thus reducing the hospital’s high bad debt load, in the short run, the continued high level of unemployment has continued to weigh on Community’s results.
The Adviser invests in what we believe are some of the best companies in America. The Fund is positioned, in our view, in blue-chip, best-of-breed growth companies with a strong emphasis on quality to reduce risk. We believe the key to long-term stock appreciation is consistent earnings growth. We invest in those companies that are market share leaders who dominate their industry, companies with strong franchises and a strong brand name, avoiding fads and other short-term, unsustainable trends. We target companies that are the low-cost operators in their industry with, in our view, high barriers to entry. We also try to invest in growth companies that are positioned in industries that are themselves growing as opposed to industries that are stagnant or structurally challenged.
| 1 | Industry sector or sub-industry group levels are derived from the Global Industry Classification Standard (“GICS”), developed and exclusively owned by MSCI, Inc. and Standard & Poor’s Financial Services LLC, unless otherwise stated that they have been reclassified or classified by the Adviser. All GICS data is provided “As Is” with no warranties. |
| † | Performance information reflects results of the Retail Shares. |
11
| | |
| Baron Asset Fund | | September 30, 2010 |
STATEMENT OF NET ASSETS
SEPTEMBER 30, 2010
| | | | | | | | | | | | |
| Shares | | | | | Cost | | | Value | |
| Common Stocks (97.12%) | |
| Consumer Discretionary (22.51%) | |
| | | | Advertising (1.10%) | | | | | | | | |
| | 923,493 | | | Lamar Advertising Co., Cl A1 | | $ | 49,630,649 | | | $ | 29,385,547 | |
| | | |
| | | | Apparel Retail (1.12%) | | | | | | | | |
| | 950,000 | | | Urban Outfitters, Inc.1 | | | 15,905,626 | | | | 29,868,000 | |
| | | |
| | | | Apparel, Accessories & Luxury Goods (2.95%) | | | | | | | | |
| | 875,000 | | | Polo Ralph Lauren Corp., Cl A | | | 17,007,094 | | | | 78,627,500 | |
| | | |
| | | | Automotive Retail (0.52%) | | | | | | | | |
| | 500,000 | | | CarMax, Inc.1 | | | 5,701,415 | | | | 13,930,000 | |
| | | |
| | | | Broadcasting (1.80%) | | | | | | | | |
| | 1,100,000 | | | Discovery Communications, Inc., Cl A1 | | | 29,767,574 | | | | 47,905,000 | |
| | | |
| | | | Casinos & Gaming (1.71%) | | | | | | | | |
| | 525,000 | | | Wynn Resorts, Ltd. | | | 1,743,976 | | | | 45,554,250 | |
| | | |
| | | | Education Services (2.68%) | | | | | | | | |
| | 1,450,000 | | | DeVry, Inc. | | | 15,178,463 | | | | 71,354,500 | |
| | | |
| | | | Hotels, Resorts & Cruise Lines (2.35%) | | | | | | | | |
| | 850,000 | | | Choice Hotels Intl., Inc. | | | 4,185,563 | | | | 30,991,000 | |
| | 850,000 | | | Hyatt Hotels Corp., Cl A1 | | | 24,084,647 | | | | 31,781,500 | |
| | | | | | | | | | | | |
| | | | | | | 28,270,210 | | | | 62,772,500 | |
| | | |
| | | | Household Appliances (0.46%) | | | | | | | | |
| | 200,000 | | | Stanley Black & Decker, Inc. | | | 11,721,438 | | | | 12,256,000 | |
| | | |
| | | | Internet Retail (2.13%) | | | | | | | | |
| | 650,000 | | | Expedia, Inc. | | | 18,495,801 | | | | 18,336,500 | |
| | 110,000 | | | priceline.com, Inc.1 | | | 17,910,917 | | | | 38,317,400 | |
| | | | | | | | | | | | |
| | | | | | | 36,406,718 | | | | 56,653,900 | |
| | | |
| | | | Leisure Facilities (2.53%) | | | | | | | | |
| | 1,799,200 | | | Vail Resorts, Inc.1,5 | | | 35,613,086 | | | | 67,505,984 | |
| | | |
| | | | Specialty Stores (3.16%) | | | | | | | | |
| | 1,250,000 | | | Dick’s Sporting Goods, Inc.1 | | | 35,113,986 | | | | 35,050,000 | |
| | 1,050,000 | | | Tiffany & Co. | | | 33,710,690 | | | | 49,339,500 | |
| | | | | | | | | | | | |
| | | | | | | 68,824,676 | | | | 84,389,500 | |
| | | | | | | | | | | | |
| Total Consumer Discretionary | | | 315,770,925 | | | | 600,202,681 | |
| | | | | | | | | | | | |
| | | | | | | | | | | | |
| Energy (8.33%) | |
| | | | Oil & Gas Drilling (1.18%) | | | | | | | | |
| | 775,000 | | | Helmerich & Payne, Inc. | | | 23,964,498 | | | | 31,356,500 | |
| | |
| | | | Oil & Gas Equipment & Services (2.33%) | | | | | |
| | 440,000 | | | Core Laboratories N.V.2 | | | 30,622,516 | | | | 38,737,600 | |
| | 275,000 | | | SEACOR Holdings, Inc.1 | | | 7,751,166 | | | | 23,419,000 | |
| | | | | | | | | | | | |
| | | | | | | 38,373,682 | | | | 62,156,600 | |
| | | |
| | | | Oil & Gas Exploration & Production (2.84%) | | | | | | | | |
| | 239,500 | | | Concho Resources, Inc.1 | | | 11,554,901 | | | | 15,847,715 | |
| | 575,200 | | | Ultra Petroleum Corp.1,2 | | | 24,843,913 | | | | 24,146,896 | |
| | 375,000 | | | Whiting Petroleum Corp.1 | | | 26,220,923 | | | | 35,816,250 | |
| | | | | | | | | | | | |
| | | | | | | 62,619,737 | | | | 75,810,861 | |
| | | |
| | | | Oil & Gas Storage & Transportation (1.98%) | | | | | | | | |
| | 2,200,000 | | | Southern Union Co. | | | 27,493,069 | | | | 52,932,000 | |
| | | | | | | | | | | | |
| Total Energy | | | 152,450,986 | | | | 222,255,961 | |
| | | | | | | | | | | | |
| | | | | | | | | | | | |
| | | | | | | | | | | | |
| Shares | | | | | Cost | | | Value | |
| Common Stocks (continued) | |
| Financials (16.75%) | |
| | | | Asset Management & Custody Banks (3.87%) | | | | | | | | |
| | 2,089,799 | | | Eaton Vance Corp. | | $ | 54,642,489 | | | $ | 60,687,763 | |
| | 850,000 | | | T. Rowe Price Group, Inc. | | | 23,450,029 | | | | 42,555,250 | |
| | | | | | | | | | | | |
| | | | | | | 78,092,518 | | | | 103,243,013 | |
| | | |
| | | | Consumer Finance (0.06%) | | | | | | | | |
| | 35,000 | | | Green Dot Corp., Cl A1 | | | 1,387,515 | | | | 1,696,800 | |
| | | |
| | | | Insurance Brokers (0.76%) | | | | | | | | |
| | 1,000,000 | | | Brown & Brown, Inc. | | | 19,454,527 | | | | 20,190,000 | |
| | |
| | | | Investment Banking & Brokerage (3.49%) | | | | | |
| | 6,700,000 | | | Charles Schwab Corp. | | | 14,065,115 | | | | 93,130,000 | |
| | | |
| | | | Office REITs (1.66%) | | | | | | | | |
| | 140,300 | | | Alexander’s, Inc.4 | | | 7,704,958 | | | | 44,303,934 | |
| | | |
| | | | Real Estate Services (1.27%) | | | | | | | | |
| | 1,850,000 | | | CB Richard Ellis Group, Inc., Cl A1 | | | 22,237,711 | | | | 33,818,000 | |
| | | |
| | | | Reinsurance (3.14%) | | | | | | | | |
| | 1,000,000 | | | Arch Capital Group, Ltd.1,2 | | | 33,841,383 | | | | 83,800,000 | |
| | | |
| | | | Specialized Finance (2.50%) | | | | | | | | |
| | 90,000 | | | CME Group, Inc., Cl A | | | 6,209,144 | | | | 23,440,500 | |
| | 1,300,000 | | | MSCI, Inc., Cl A1 | | | 39,123,416 | | | | 43,173,000 | |
| | | | | | | | | | | | |
| | | | | | | 45,332,560 | | | | 66,613,500 | |
| | | | | | | | | | | | |
| Total Financials | | | 222,116,287 | | | | 446,795,247 | |
| | | | | | | | | | | | |
| | | | | | | | | | | | |
| Health Care (13.97%) | |
| | | | Health Care Distributors (1.54%) | | | | | | | | |
| | 700,000 | | | Henry Schein, Inc.1 | | | 19,695,528 | | | | 41,006,000 | |
| | | |
| | | | Health Care Equipment (4.29%) | | | | | | | | |
| | 1,300,000 | | | IDEXX Laboratories, Inc.1 | | | 53,002,191 | | | | 80,236,000 | |
| | 110,000 | | | Intuitive Surgical, Inc.1 | | | 12,538,359 | | | | 31,211,400 | |
| | 25,000 | | | Sonova Holding AG2 | | | 3,136,936 | | | | 3,052,969 | |
| | | | | | | | | | | | |
| | | | | | | 68,677,486 | | | | 114,500,369 | |
| | | |
| | | | Health Care Facilities (1.57%) | | | | | | | | |
| | 1,350,000 | | | Community Health Systems, Inc.1 | | | 40,200,024 | | | | 41,809,500 | |
| | | |
| | | | Health Care Supplies (1.38%) | | | | | | | | |
| | 850,000 | | | DENTSPLY International, Inc. | | | 18,183,366 | | | | 27,174,500 | |
| | 200,000 | | | Gen-Probe, Inc.1,4 | | | 8,252,158 | | | | 9,692,000 | |
| | | | | | | | | | | | |
| | | | | | | 26,435,524 | | | | 36,866,500 | |
| | |
| | | | Life Sciences Tools & Services (5.19%) | | | | | |
| | 453,214 | | | Covance, Inc.1 | | | 24,159,315 | | | | 21,205,883 | |
| | 725,000 | | | Life Technologies Corp.1 | | | 37,595,422 | | | | 33,850,250 | |
| | 400,000 | | | Mettler-Toledo International, Inc.1 | | | 26,298,876 | | | | 49,776,000 | |
| | 700,000 | | | Thermo Fisher Scientific, Inc.1 | | | 20,053,400 | | | | 33,516,000 | |
| | | | | | | | | | | | |
| | | | | | | 108,107,013 | | | | 138,348,133 | |
| | | | | | | | | | | | |
| Total Health Care | | | 263,115,575 | | | | 372,530,502 | |
| | | | | | | | | | | | |
| | | | | | | | | | | | |
| Industrials (17.99%) | |
| | | | Aerospace & Defense (0.38%) | | | | | | | | |
| | 80,000 | | | Precision Castparts Corp. | | | 4,744,426 | | | | 10,188,000 | |
| | | |
| | | | Air Freight & Logistics (5.53%) | | | | | | | | |
| | 1,350,000 | | | C. H. Robinson Worldwide, Inc. | | | 24,942,053 | | | | 94,392,000 | |
| | 1,150,000 | | | Expeditors International of
Washington, Inc. | | | 29,708,326 | | | | 53,164,500 | |
| | | | | | | | | | | | |
| | | | | | | 54,650,379 | | | | 147,556,500 | |
| | |
| 12 | | See Notes to Financial Statements. |
| | |
| September 30, 2010 | | Baron Asset Fund |
STATEMENT OF NET ASSETS (Continued)
SEPTEMBER 30, 2010
| | | | | | | | | | | | |
| Shares | | | | | Cost | | | Value | |
| Common Stocks (continued) | |
| Industrials (continued) | |
| | | | Construction &
Engineering (0.10%) | | | | | | | | |
| | 141,197 | | | Quanta Services, Inc.1 | | $ | 2,375,183 | | | $ | 2,694,039 | |
| | | |
| | | | Diversified Support
Services (2.63%) | | | | | | | | |
| | 1,150,000 | | | Copart, Inc.1 | | | 42,059,264 | | | | 37,915,500 | |
| | 1,550,000 | | | Ritchie Bros. Auctioneers, Inc.2 | | | 38,130,924 | | | | 32,193,500 | |
| | | | | | | | | | | | |
| | | | | | | 80,190,188 | | | | 70,109,000 | |
| | | |
| | | | Environmental & Facilities Services (2.35%) | | | | | | | | |
| | 900,000 | | | Stericycle, Inc.1 | | | 26,498,096 | | | | 62,532,000 | |
| | | |
| | | | Human Resource & Employment Services (0.98%) | | | | | | | | |
| | 1,000,000 | | | Robert Half International, Inc. | | | 972,552 | | | | 26,000,000 | |
| | | |
| | | | Research & Consulting
Services (2.42%) | | | | | | | | |
| | 50,000 | | | Dun & Bradstreet Corp. | | | 3,714,762 | | | | 3,707,000 | |
| | 650,000 | | | Equifax, Inc. | | | 21,482,511 | | | | 20,280,000 | |
| | 1,450,000 | | | Verisk Analytics, Inc., Cl A1 | | | 37,700,535 | | | | 40,614,500 | |
| | | | | | | | | | | | |
| | | | | | | 62,897,808 | | | | 64,601,500 | |
| | | |
| | | | Trading Companies & Distributors (3.60%) | | | | | | | | |
| | 1,375,000 | | | Fastenal Co. | | | 54,825,095 | | | | 73,136,250 | |
| | 425,000 | | | MSC Industrial Direct Co., Inc., Cl A | | | 19,842,798 | | | | 22,967,000 | |
| | | | | | | | | | | | |
| | | | | | | 74,667,893 | | | | 96,103,250 | |
| | | | | | | | | | | | |
| Total Industrials | | | 306,996,525 | | | | 479,784,289 | |
| | | | | | | | | | | | |
| | | | | | | | | | | | |
| Information Technology (12.20%) | |
| | | | Application Software (5.52%) | | | | | | | | |
| | 700,000 | | | ANSYS, Inc.1 | | | 21,311,741 | | | | 29,575,000 | |
| | 428,807 | | | Blackboard, Inc.1 | | | 17,998,577 | | | | 15,454,204 | |
| | 400,000 | | | Citrix Systems, Inc.1 | | | 15,691,132 | | | | 27,296,000 | |
| | 925,000 | | | FactSet Research Systems, Inc. | | | 53,842,905 | | | | 75,045,250 | |
| | | | | | | | | | | | |
| | | | | | | 108,844,355 | | | | 147,370,454 | |
| | | |
| | | | Electronic Equipment & Instruments (0.82%) | | | | | | | | |
| | 850,000 | | | FLIR Systems, Inc.1 | | | 18,928,164 | | | | 21,845,000 | �� |
| | | |
| | | | IT Consulting & Other Services (5.86%) | | | | | | | | |
| | 700,000 | | | Equinix, Inc.1,4 | | | 56,983,955 | | | | 71,645,000 | |
| | 2,875,000 | | | Gartner, Inc.1 | | | 68,065,780 | | | | 84,640,000 | |
| | | | | | | | | | | | |
| | | | | | | 125,049,735 | | | | 156,285,000 | |
| | | | | | | | | | | | |
| Total Information Technology | | | 252,822,254 | | | | 325,500,454 | |
| | | | | | | | | | | | |
| | | | | | | | | | | | |
| Materials (1.33%) | |
| | | | Specialty Chemicals (1.33%) | | | | | | | | |
| | 700,000 | | | Ecolab, Inc. | | | 23,937,958 | | | | 35,518,000 | |
| | | | | | | | | | | | |
| | | | | | | | | | | | |
| Telecommunication Services (4.04%) | |
| | | | Wireless Telecommunication Services (4.04%) | | | | | | | | |
| | 1,025,000 | | | NII Holdings, Inc.1 | | | 39,262,199 | | | | 42,127,500 | |
| | 1,625,000 | | | SBA Communications Corp., Cl A1 | | | 53,434,220 | | | | 65,487,500 | |
| | | | | | | | | | | | |
| Total Telecommunication Services | | | 92,696,419 | | | | 107,615,000 | |
| | | | | | | | | | | | |
| Total Common Stocks | | | 1,629,906,929 | | | | 2,590,202,134 | |
| | | | | | | | | | | | |
| | | | | | | | | | |
| Shares | | | | Cost | | | Value | |
Private Equity Investments (1.38%) | |
Consumer Discretionary (0.58%) | |
| | Hotels, Resorts & Cruise Lines (0.58%) | | | | | | | | |
| 5,200,000 | | Kerzner International Holdings, Ltd., Cl A1,2,3,4,6 | | $ | 52,000,000 | | | $ | 15,600,000 | |
| | | | | | | | | | |
| | | | | | | | | | |
Financials (0.80%) | |
| | Asset Management & Custody Banks (0.80%) | | | | | | | | |
| 5,600,004 | | Windy City Investments
Holdings LLC1,3,4,6 | | | 31,960,710 | | | | 21,280,013 | |
| | | | | | | | | | |
Total Private Equity Investments | | | 83,960,710 | | | | 36,880,013 | |
| | | | | | | | | | |
| | | | | | | | | | |
Principal
Amount | | | | | | | | |
Short Term Investments (1.90%) | |
| $50,560,338 | | Repurchase Agreement with Fixed Income Clearing Corp., dated 09/30/2010, 0.08% due 10/01/2010; Proceeds at maturity - $50,560,450; (Fully collateralized by U.S. Treasury Note, 3.375% due 11/15/2019; Market value - $53,089,313) | | | 50,560,338 | | | | 50,560,338 | |
| | | | | | | | | | |
Total Investments (100.40%) | | $ | 1,764,427,977 | | | | 2,677,642,485 | |
| | | | | | | | | | |
Liabilities Less Cash and Other Assets (-0.40%) | | | | (10,643,662 | ) |
| | | | | | | | | | |
Net Assets | | | | | | $ | 2,666,998,823 | |
| | | | | | | | | | |
Retail Shares (Equivalent to $49.27 per share based on 49,204,228 shares outstanding) | | | $ | 2,424,208,476 | |
| | | | | | | | | | |
Institutional Shares (Equivalent to $49.43 per share based on 4,911,677 shares outstanding) | | | $ | 242,790,347 | |
| | | | | | | | | | |
| % | Represents percentage of net assets. |
| 1 | Non-income producing securities. |
| 3 | At September 30, 2010, the market value of restricted and fair valued securities amounted to $36,880,013 or 1.38% of net assets. None of these securities are deemed liquid. See Note 6. |
| 4 | The Adviser has reclassified/classified certain securities in or out of this sub-industry. Such reclassifications/classifications are not supported by S&P or MSCI. |
| 5 | See Note 9 regarding “Affiliated” companies. |
| 6 | Level 3 security. See Note 7 regarding Fair Value Measurements. |
| | |
| See Notes to Financial Statements. | | 13 |
| | |
| Baron Growth Fund | | September 30, 2010 |
STATEMENT OF NET ASSETS
SEPTEMBER 30, 2010
| | | | | | | | | | | | |
| Shares | | | | | Cost | | | Value | |
| Common Stocks (99.19%) | |
| Consumer Discretionary (25.65%) | |
| | | | Advertising (0.47%) | | | | | | | | |
| | 825,000 | | | Lamar Advertising Co., Cl A1 | | $ | 10,621,218 | | | $ | 26,251,500 | |
| | | |
| | | | Apparel Retail (1.81%) | | | | | | | | |
| | 3,000,000 | | | J. Crew Group, Inc.1 | | | 94,519,543 | | | | 100,860,000 | |
| | | |
| | | | Apparel, Accessories &
Luxury Goods (1.60%) | | | | | | | | |
| | 215,000 | | | Companhia Hering SA2 | | | 9,459,777 | | | | 9,250,591 | |
| | 1,775,000 | | | Under Armour, Inc., Cl A1 | | | 61,385,419 | | | | 79,946,000 | |
| | | | | | | | | | | | |
| | | | | | | 70,845,196 | | | | 89,196,591 | |
| | | |
| | | | Automotive Retail (0.56%) | | | | | | | | |
| | 650,000 | | | CarMax, Inc.1 | | | 6,333,646 | | | | 18,109,000 | |
| | 1,000,000 | | | Penske Automotive Group, Inc.1 | | | 17,800,673 | | | | 13,200,000 | |
| | | | | | | | | | | | |
| | | | | | | 24,134,319 | | | | 31,309,000 | |
| | | |
| | | | Casinos & Gaming (1.44%) | | | | | | | | |
| | 2,700,000 | | | Penn National Gaming, Inc.1 | | | 75,975,993 | | | | 79,947,000 | |
| | | |
| | | | Distributors (2.02%) | | | | | | | | |
| | 5,400,000 | | | LKQ Corp.1 | | | 75,125,818 | | | | 112,320,000 | |
| | | |
| | | | Education Services (6.80%) | | | | | | | | |
| | 4,667,005 | | | Anhanguera Educacional Participacoes SA2 | | | 61,955,342 | | | | 82,775,899 | |
| | 3,625,000 | | | DeVry, Inc.4 | | | 60,704,873 | | | | 178,386,250 | |
| | 675,000 | | | Strayer Education, Inc. | | | 55,103,824 | | | | 117,787,500 | |
| | | | | | | | | | | | |
| | | | | | | 177,764,039 | | | | 378,949,649 | |
| | | |
| | | | Home Furnishings (0.48%) | | | | | | | | |
| | 500,000 | | | Mohawk Industries, Inc.1 | | | 14,039,361 | | | | 26,650,000 | |
| | | |
| | | | Home Improvement Retail (0.27%) | | | | | | | | |
| | 600,000 | | | Lumber Liquidators Holdings, Inc.1 | | | 14,918,289 | | | | 14,742,000 | |
| | |
| | | | Hotels, Resorts & Cruise Lines (1.96%) | | | | | |
| | 3,000,000 | | | Choice Hotels International, Inc.4 | | | 74,119,736 | | | | 109,380,000 | |
| | | |
| | | | Internet Retail (0.88%) | | | | | | | | |
| | 1,105,000 | | | Blue Nile, Inc.1,4 | | | 36,573,734 | | | | 49,161,450 | |
| | | |
| | | | Leisure Facilities (1.28%) | | | | | | | | |
| | 1,900,000 | | | Vail Resorts, Inc.1,4 | | | 51,691,238 | | | | 71,288,000 | |
| | | |
| | | | Publishing (1.72%) | | | | | | | | |
| | 2,154,552 | | | Morningstar, Inc.1 | | | 62,871,271 | | | | 96,006,837 | |
| | | |
| | | | Restaurants (1.84%) | | | | | | | | |
| | 850,000 | | | Panera Bread Co., Cl A1 | | | 32,809,975 | | | | 75,318,500 | |
| | 800,000 | | | Peet’s Coffee & Tea, Inc.1,4 | | | 18,562,773 | | | | 27,384,000 | |
| | | | | | | | | | | | |
| | | | | | | 51,372,748 | | | | 102,702,500 | |
| | | |
| | | | Specialty Stores (2.52%) | | | | | | | | |
| | 5,000,000 | | | Dick’s Sporting Goods, Inc.1 | | | 86,074,246 | | | | 140,200,000 | |
| | | | | | | | | | | | |
| Total Consumer Discretionary | | | 920,646,749 | | | | 1,428,964,527 | |
| | | | | | | | | | | | |
| | | | | | | | | | | | |
| Consumer Staples (5.70%) | |
| | | | Food Retail (0.66%) | | | | | | | | |
| | 1,000,000 | | | Whole Foods Market, Inc.1 | | | 10,286,645 | | | | 37,110,000 | |
| | | |
| | | | Household Products (1.34%) | | | | | | | | |
| | 1,150,000 | | | Church & Dwight Co., Inc. | | | 42,111,789 | | | | 74,681,000 | |
| | | |
| | | | Packaged Foods & Meats (3.70%) | | | | | | | | |
| | 1,064,823 | | | Diamond Foods, Inc. | | | 38,931,996 | | | | 43,647,095 | |
| | 4,275,000 | | | Dole Food Co., Inc.1 | | | 52,309,280 | | | | 39,116,250 | |
| | 1,107,649 | | | Ralcorp Holdings, Inc.1 | | | 40,376,485 | | | | 64,775,313 | |
| | 200,000 | | | Seneca Foods Corp., Cl A1 | | | 4,400,000 | | | | 5,238,000 | |
| | 1,155,000 | | | TreeHouse Foods, Inc.1 | | | 43,870,004 | | | | 53,245,500 | |
| | | | | | | | | | | | |
| | | | | | | 179,887,765 | | | | 206,022,158 | |
| | | | | | | | | | | | |
| Total Consumer Staples | | | 232,286,199 | | | | 317,813,158 | |
| | | | | | | | | | | | |
| | | | | | | | | | | | |
| Shares | | | | | Cost | | | Value | |
| Common Stocks (continued) | |
| Energy (11.00%) | |
| | | | Oil & Gas Drilling (0.73%) | | | | | | | | |
| | 1,000,000 | | | Helmerich & Payne, Inc. | | $ | 22,564,231 | | | $ | 40,460,000 | |
| | | |
| | | | Oil & Gas Equipment &
Services (5.00%) | | | | | | | | |
| | 875,764 | | | CARBO Ceramics, Inc. | | | 59,006,928 | | | | 70,936,884 | |
| | 1,388,272 | | | Core Laboratories N.V.2 | | | 43,036,240 | | | | 122,223,467 | |
| | 1,000,000 | | | SEACOR Holdings, Inc.1 | | | 69,798,678 | | | | 85,160,000 | |
| | | | | | | | | | | | |
| | | | | | | 171,841,846 | | | | 278,320,351 | |
| | | |
| | | | Oil & Gas Exploration &
Production (3.72%) | | | | | | | | |
| | 300,000 | | | Atlas Energy, Inc.1 | | | 7,280,474 | | | | 8,592,000 | |
| | 1,600,000 | | | Brigham Exploration Co.1 | | | 24,210,346 | | | | 30,000,000 | |
| | 775,463 | | | Concho Resources, Inc.1 | | | 22,257,149 | | | | 51,312,387 | |
| | 3,550,000 | | | Denbury Resources, Inc.1 | | | 22,572,014 | | | | 56,409,500 | |
| | 247,191 | | | Oasis Petroleum, Inc.1 | | | 3,460,674 | | | | 4,788,089 | |
| | 1,500,000 | | | SM Energy Co. | | | 52,961,473 | | | | 56,190,000 | |
| | | | | | | | | | | | |
| | | | | | | 132,742,130 | | | | 207,291,976 | |
| | | |
| | | | Oil & Gas Storage &
Transportation (1.55%) | | | | | | | | |
| | 3,600,000 | | | Southern Union Co. | | | 48,544,865 | | | | 86,616,000 | |
| | | | | | | | | | | | |
| Total Energy | | | 375,693,072 | | | | 612,688,327 | |
| | | | | | | | | | | | |
| | | | | | | | | | | | |
| Financials (11.91%) | |
| | | | Asset Management &
Custody Banks (1.34%) | | | | | | | | |
| | 500,000 | | | Cohen & Steers, Inc. | | | 6,508,019 | | | | 10,850,000 | |
| | 1,725,000 | | | Eaton Vance Corp. | | | 31,263,362 | | | | 50,094,000 | |
| | 1,050,000 | | | Financial Engines, Inc.1 | | | 16,029,116 | | | | 13,944,000 | |
| | | | | | | | | | | | |
| | | | | | | 53,800,497 | | | | 74,888,000 | |
| | | |
| | | | Investment Banking &
Brokerage (0.72%) | | | | | | | | |
| | 75,000 | | | Greenhill & Co., Inc. | | | 5,684,625 | | | | 5,949,000 | |
| | 1,500,000 | | | Jefferies Group, Inc. | | | 15,172,939 | | | | 34,035,000 | |
| | | | | | | | | | | | |
| | | | | | | 20,857,564 | | | | 39,984,000 | |
| | | |
| | | | Life & Health Insurance (0.77%) | | | | | | | | |
| | 2,100,000 | | | Primerica, Inc. | | | 46,453,115 | | | | 42,714,000 | |
| | | |
| | | | Office REITs (1.12%) | | | | | | | | |
| | 135,500 | | | Alexander’s, Inc.5 | | | 28,639,989 | | | | 42,788,190 | |
| | 1,125,000 | | | Douglas Emmett, Inc. | | | 9,868,662 | | | | 19,698,750 | |
| | | | | | | | | | | | |
| | | | | | | 38,508,651 | | | | 62,486,940 | |
| | | |
| | | | Real Estate Services (0.33%) | | | | | | | | |
| | 1,000,000 | | | CB Richard Ellis Group, Inc., Cl A1 | | | 6,223,695 | | | | 18,280,000 | |
| | | |
| | | | Regional Banks (0.44%) | | | | | | | | |
| | 1,250,000 | | | SJB Escrow Corp., Cl A, 144A1,5,6 | | | 25,000,000 | | | | 24,750,000 | |
| | | |
| | | | Reinsurance (2.40%) | | | | | | | | |
| | 1,600,000 | | | Arch Capital Group, Ltd.1,2 | | | 49,270,621 | | | | 134,080,000 | |
| | | |
| | | | Residential REITs (0.33%) | | | | | | | | |
| | 600,000 | | | American Campus Communities, Inc. | | | 16,235,192 | | | | 18,264,000 | |
| | | |
| | | | Specialized Finance (2.69%) | | | | | | | | |
| | 564,722 | | | Interactive Brokers Group, Inc., Cl A1 | | | 9,785,165 | | | | 9,718,866 | |
| | 4,222,433 | | | MSCI, Inc., Cl A1 | | | 96,041,636 | | | | 140,227,000 | |
| | | | | | | | | | | | |
| | | | | | | 105,826,801 | | | | 149,945,866 | |
| | | |
| | | | Specialized REITs (1.77%) | | | | | | | | |
| | 775,000 | | | Alexandria Real Estate Equities, Inc.5 | | | 29,669,521 | | | | 54,250,000 | |
| | 575,000 | | | Digital Realty Trust, Inc.5 | | | 19,908,610 | | | | 35,477,500 | |
| | 375,000 | | | LaSalle Hotel Properties | | | 7,923,417 | | | | 8,771,250 | |
| | | | | | | | | | | | |
| | | | | | | 57,501,548 | | | | 98,498,750 | |
| | | | | | | | | | | | |
| Total Financials | | | 419,677,684 | | | | 663,891,556 | |
| | | | | | | | | | | | |
| | |
| 14 | | See Notes to Financial Statements. |
| | |
| September 30, 2010 | | Baron Growth Fund |
STATEMENT OF NET ASSETS (Continued)
SEPTEMBER 30, 2010
| | | | | | | | | | | | |
| Shares | | | | | Cost | | | Value | |
| Common Stocks (continued) | |
| Health Care (16.23%) | |
| | | | Health Care Equipment (5.48%) | | | | | | | | |
| | 3,450,000 | | | Edwards Lifesciences Corp.1 | | $ | 50,202,518 | | | $ | 231,322,500 | |
| | 1,200,000 | | | IDEXX Laboratories, Inc.1 | | | 40,918,632 | | | | 74,064,000 | |
| | | | | | | | | | | | |
| | | | | | | 91,121,150 | | | | 305,386,500 | |
| | | |
| | | | Health Care Facilities (2.74%) | | | | | | | | |
| | 3,900,000 | | | Community Health Systems, Inc.1 | | | 78,526,524 | | | | 120,783,000 | |
| | 1,500,000 | | | VCA Antech, Inc.1 | | | 40,683,257 | | | | 31,635,000 | |
| | | | | | | | | | | | |
| | | | | | | 119,209,781 | | | | 152,418,000 | |
| | | |
| | | | Health Care Services (0.68%) | | | | | | | | |
| | 600,000 | | | Chemed Corp. | | | 21,302,479 | | | | 34,182,000 | |
| | 125,000 | | | IPC The Hospitalist Co., Inc.1 | | | 2,062,500 | | | | 3,415,000 | |
| | | | | | | | | | | | |
| | | | | | | 23,364,979 | | | | 37,597,000 | |
| | | |
| | | | Health Care Supplies (1.17%) | | | | | | | | |
| | 1,225,000 | | | Gen-Probe, Inc.1,5 | | | 51,159,642 | | | | 59,363,500 | |
| | 175,000 | | | Neogen Corp.1 | | | 3,887,774 | | | | 5,923,750 | |
| | | | | | | | | | | | |
| | | | | | | 55,047,416 | | | | 65,287,250 | |
| | | |
| | | | Health Care Technology (0.33%) | | | | | | | | |
| | 1,000,000 | | | Allscripts Healthcare Solutions, Inc.1 | | | 16,782,598 | | | | 18,470,000 | |
| | | |
| | | | Life Sciences Tools &
Services (3.83%) | | | | | | | | |
| | 410,715 | | | Covance, Inc.1 | | | 14,769,880 | | | | 19,217,355 | |
| | 1,125,000 | | | Mettler-Toledo International, Inc.1 | | | 67,867,886 | | | | 139,995,000 | |
| | 880,943 | | | Techne Corp. | | | 46,631,249 | | | | 54,380,611 | |
| | | | | | | | | | | | |
| | | | | | | 129,269,015 | | | | 213,592,966 | |
| | | |
| | | | Managed Health Care (2.00%) | | | | | | | | |
| | 2,625,000 | | | AMERIGROUP Corp.1,4 | | | 45,833,394 | | | | 111,483,750 | |
| | | | | | | | | | | | |
| Total Health Care | | | 480,628,333 | | | | 904,235,466 | |
| | | | | | | | | | | | |
| | | | | | | | | | | | |
| Industrials (10.54%) | |
| | | | Construction & Engineering (1.37%) | | | | | | | | |
| | 3,150,000 | | | AECOM Technology Corp.1 | | | 69,718,649 | | | | 76,419,000 | |
| | | |
| | | | Diversified Support Services (2.81%) | | | | | | | | |
| | 2,725,000 | | | Copart, Inc.1 | | | 69,029,357 | | | | 89,843,250 | |
| | 3,225,000 | | | Ritchie Bros. Auctioneers, Inc.2 | | | 74,472,792 | | | | 66,983,250 | |
| | | | | | | | | | | | |
| | | | | | | 143,502,149 | | | | 156,826,500 | |
| | | |
| | | | Electrical Components &
Equipment (0.79%) | | | | | | | | |
| | 3,243,578 | | | Generac Holdings, Inc.1 | | | 43,195,908 | | | | 44,242,404 | |
| | | |
| | | | Environmental & Facilities
Services (1.12%) | | | | | | | | |
| | 2,975,000 | | | Tetra Tech, Inc.1 | | | 74,558,202 | | | | 62,385,750 | |
| | | |
| | | | Industrial Machinery (0.65%) | | | | | | | | |
| | 500,000 | | | Valmont Industries, Inc. | | | 40,979,514 | | | | 36,200,000 | |
| | | |
| | | | Railroads (1.56%) | | | | | | | | |
| | 2,000,000 | | | Genesee & Wyoming, Inc., Cl A1 | | | 32,221,169 | | | | 86,780,000 | |
| | | |
| | | | Research & Consulting
Services (1.42%) | | | | | | | | |
| | 925,000 | | | CoStar Group, Inc.1 | | | 39,770,735 | | | | 45,056,750 | |
| | 400,000 | | | IHS, Inc., Cl A1 | | | 16,387,387 | | | | 27,200,000 | |
| | 600,000 | | | Mistras Group, Inc.1 | | | 7,563,468 | | | | 6,948,000 | |
| | | | | | | | | | | | |
| | | | | | | 63,721,590 | | | | 79,204,750 | |
| | | |
| | | | Trading Companies &
Distributors (0.49%) | | | | | | | | |
| | 500,000 | | | MSC Industrial Direct Co., Inc., Cl A | | | 17,821,237 | | | | 27,020,000 | |
| | | |
| | | | Trucking (0.33%) | | | | | | | | |
| | 475,000 | | | Landstar System, Inc. | | | 11,073,375 | | | | 18,344,500 | |
| | | | | | | | | | | | |
| Total Industrials | | | 496,791,793 | | | | 587,422,904 | |
| | | | | | | | | | | | |
| | | | | | | | | | | | |
| Shares | | | | | Cost | | | Value | |
| Common Stocks (continued) | |
| Information Technology (13.45%) | |
| | | | Application Software (7.47%) | | | | | | | | |
| | 700,000 | | | Advent Software, Inc.1 | | $ | 26,532,888 | | | $ | 36,533,000 | |
| | 2,250,000 | | | ANSYS, Inc.1 | | | 54,764,730 | | | | 95,062,500 | |
| | 700,000 | | | Blackboard, Inc.1 | | | 28,468,974 | | | | 25,228,000 | |
| | 1,050,000 | | | Concur Technologies, Inc.1 | | | 23,510,687 | | | | 51,912,000 | |
| | 1,635,000 | | | FactSet Research Systems, Inc. | | | 82,436,633 | | | | 132,647,550 | |
| | 1,594,900 | | | Pegasystems, Inc. | | | 48,994,332 | | | | 49,521,645 | |
| | 1,600,000 | | | SS&C Technologies Holdings, Inc.1 | | | 25,368,776 | | | | 25,280,000 | |
| | | | | | | | | | | | |
| | | | | | | 290,077,020 | | | | 416,184,695 | |
| | | |
| | | | Internet Software &
Services (1.34%) | | | | | | | | |
| | 1,500,000 | | | WebMD Health Corp., Cl A1 | | | 44,434,390 | | | | 74,805,000 | |
| | | |
| | | | IT Consulting & Other
Services (3.42%) | | | | | | | | |
| | 1,000,000 | | | Equinix, Inc.1,5 | | | 32,200,829 | | | | 102,350,000 | |
| | 3,000,000 | | | Gartner, Inc.1 | | | 49,076,691 | | | | 88,320,000 | |
| | | | | | | | | | | | |
| | | | | | | 81,277,520 | | | | 190,670,000 | |
| | | |
| | | | Systems Software (1.22%) | | | | | | | | |
| | 883,600 | | | TOTVS SA2 | | | 60,197,679 | | | | 67,836,667 | |
| | | | | | | | | | | | |
| Total Information Technology | | | 475,986,609 | | | | 749,496,362 | |
| | | | | | | | | | | | |
| | | | | | | | | | | | |
| Materials (0.92%) | | | | | | | | |
| | | | Diversified Metals &
Mining (0.92%) | | | | | | | | |
| | 1,807,294 | | | Molycorp, Inc.1 | | | 44,286,017 | | | | 51,128,347 | |
| | | | | | | | | | | | |
| | | | | | | | | | | | |
| Telecommunication Services (1.28%) | | | | | |
| | | | Wireless Telecommunication
Services (1.28%) | | | | | | | | |
| | 1,765,015 | | | SBA Communications Corp., Cl A1 | | | 7,768,187 | | | | 71,130,104 | |
| | | | | | | | | | | | |
| | | | | | | | | | | | |
| Utilities (2.51%) | | | | | | | | |
| | | | Electric Utilities (2.51%) | | | | | | | | |
| | 2,250,000 | | | ITC Holdings Corp. | | | 69,934,399 | | | | 140,062,500 | |
| | | | | | | | | | | | |
| Total Common Stocks | | | 3,523,699,042 | | | | 5,526,833,251 | |
| | | | | | | | | | | | |
| | | | | | | | | | | | |
| Private Equity Investments (0.53%) | |
| Consumer Discretionary (0.40%) | |
| | | | Hotels, Resorts & Cruise
Lines (0.40%) | | | | | | | | |
| | 7,400,000 | | | Kerzner International Holdings, Ltd., Cl A1,2,3,5,7 | | | 74,000,000 | | | | 22,200,000 | |
| | | | | | | | | | | | |
| | | | | | | | | | | | |
| Financials (0.13%) | |
| | | | Asset Management & Custody
Banks (0.13%) | | | | | | | | |
| | 1,885,000 | | | Windy City Investments
Holdings LLC1,3,5,7 | | | 7,748,686 | | | | 7,163,000 | |
| | | | | | | | | | | | |
| Total Private Equity Investments | | | 81,748,686 | | | | 29,363,000 | |
| | | | | | | | | | | | |
| | |
| See Notes to Financial Statements. | | 15 |
| | |
| Baron Growth Fund | | September 30, 2010 |
STATEMENT OF NET ASSETS (Continued)
SEPTEMBER 30, 2010
| | | | | | | | | | |
| Shares | | | | Cost | | | Value | |
Warrants (0.01%) | |
Financials (0.01%) | |
| | Regional Banks (0.01%) | | | | | | | | |
| 75,000 | | SJB Escrow Corp. Warrants,
Exp 02/16/20171,5,6 | | $ | 0 | | | $ | 513,165 | |
| | | | | | | | | | |
Total Investments (99.73%) | | $ | 3,605,447,728 | | | $ | 5,556,709,416 | |
| | | | | | | | | | |
Cash and Other Assets Less Liabilities (0.27%) | | | | 14,966,118 | |
| | | | | | | | | | |
Net Assets | | | | | | $ | 5,571,675,534 | |
| | | | | | | | | | |
Retail Shares (Equivalent to $44.37 per share
based on 109,148,707 shares outstanding) | | | $ | 4,842,792,325 | |
| | | | | | | | | | |
Institutional Shares (Equivalent to $44.52
per share based on 16,373,127 shares outstanding) | | | $ | 728,883,209 | |
| | | | | | | | | | |
| % | Represents percentage of net assets. |
| 1 | Non-income producing securities. |
| 3 | At September 30, 2010, the market value of restricted and fair valued securities amounted to $29,363,000 or 0.53% of net assets. None of these securities are deemed liquid. See Note 6. |
| 4 | See Note 9 regarding “Affiliated” companies. |
| 5 | The Adviser has reclassified/classified certain securities in or out of this sub-industry. Such reclassifications/classifications are not supported by S&P or MSCI. |
| 6 | Level 2 security. See Note 7 regarding Fair Value Measurements. |
| 7 | Level 3 security. See Note 7 regarding Fair Value Measurements. |
| 144A | Security is exempt from registration under Rule 144A of the Securities Act of 1933. This security may be resold in transactions that are exempt from registration, normally to qualified institutional buyers. This security has been deemed liquid pursuant to policies and procedures approved by the Board of Trustees, unless otherwise noted. At September 30, 2010, the market value of Rule 144A securities amounted to $24,750,000 or 0.44% of net assets. |
| | |
| 16 | | See Notes to Financial Statements. |
| | |
| September 30, 2010 | | Baron Small Cap Fund |
STATEMENT OF NET ASSETS
SEPTEMBER 30, 2010
| | | | | | | | | | | | |
| Shares | | | | | Cost | | | Value | |
| Common Stocks (96.14%) | | | | | |
| Consumer Discretionary (23.64%) | | | | | |
| | | | Advertising (2.62%) | | | | | | | | |
| | 1,225,000 | | | Lamar Advertising Co., Cl A1 | | $ | 32,190,708 | | | $ | 38,979,500 | |
| | 2,650,000 | | | National CineMedia, Inc. | | | 55,570,049 | | | | 47,435,000 | |
| | | | | | | | | | | | |
| | | | | | | 87,760,757 | | | | 86,414,500 | |
| | | |
| | | | Apparel Retail (2.50%) | | | | | | | | |
| | 1,750,000 | | | J. Crew Group, Inc.1 | | | 47,919,608 | | | | 58,835,000 | |
| | 750,000 | | | Urban Outfitters, Inc.1 | | | 10,990,211 | | | | 23,580,000 | |
| | | | | | | | | | | | |
| | | | | | | 58,909,819 | | | | 82,415,000 | |
| | | |
| | | | Apparel, Accessories & Luxury Goods (3.71%) | | | | | | | | |
| | 1,000,000 | | | Fossil, Inc.1 | | | 27,432,600 | | | | 53,790,000 | |
| | 3,900,000 | | | Iconix Brand Group, Inc.1,4,5 | | | 62,609,371 | | | | 68,250,000 | |
| | | | | | | | | | | | |
| | | | | | | 90,041,971 | | | | 122,040,000 | |
| | | |
| | | | Casinos & Gaming (4.42%) | | | | | | | | |
| | 3,100,000 | | | Penn National Gaming, Inc.1 | | | 81,039,971 | | | | 91,791,000 | |
| | 500,000 | | | WMS Industries, Inc.1 | | | 19,220,008 | | | | 19,035,000 | |
| | 400,000 | | | Wynn Resorts, Ltd. | | | 4,213,528 | | | | 34,708,000 | |
| | | | | | | | | | | | |
| | | | | | | 104,473,507 | | | | 145,534,000 | |
| | | |
| | | | Computer & Electronics Retail (1.13%) | | | | | | | | |
| | 1,500,000 | | | hhgregg, Inc.1 | | | 25,839,828 | | | | 37,140,000 | |
| | | |
| | | | Education Services (2.22%) | | | | | | | | |
| | 250,000 | | | Capella Education Co.1 | | | 8,668,802 | | | | 19,405,000 | |
| | 308,808 | | | Strayer Education, Inc. | | | 27,539,086 | | | | 53,886,996 | |
| | | | | | | | | | | | |
| | | | | | | 36,207,888 | | | | 73,291,996 | |
| | | |
| | | | Home Improvement Retail (0.75%) | | | | | | | | |
| | 1,000,000 | | | Lumber Liquidators Holdings, Inc.1 | | | 21,558,372 | | | | 24,570,000 | |
| | | |
| | | | Hotels, Resorts & Cruise Lines (1.54%) | | | | | | | | |
| | 350,000 | | | Gaylord Entertainment Co.1 | | | 9,894,521 | | | | 10,675,000 | |
| | 3,060,000 | | | Great Wolf Resorts, Inc.1,4 | | | 55,012,502 | | | | 5,814,000 | |
| | 20,000,000 | | | Mandarin Oriental International, Ltd.2 | | | 40,047,095 | | | | 34,200,000 | |
| | | | | | | | | | | | |
| | | | | | | 104,954,118 | | | | 50,689,000 | |
| | | |
| | | | Internet Retail (0.42%) | | | | | | | | |
| | 2,325,000 | | | Vitacost.com, Inc.1,4 | | | 23,626,535 | | | | 13,973,250 | |
| | | |
| | | | Movies & Entertainment (2.71%) | | | | | | | | |
| | 1,500,000 | | | Liberty Media Corp.1 | | | 24,179,193 | | | | 78,090,000 | |
| | 800,000 | | | World Wrestling Entertainment, Inc. | | | 13,802,898 | | | | 11,128,000 | |
| | | | | | | | | | | | |
| | | | | | | 37,982,091 | | | | 89,218,000 | |
| | | |
| | | | Restaurants (1.62%) | | | | | | | | |
| | 950,000 | | | Cheesecake Factory, Inc.1 | | | 18,719,871 | | | | 25,146,500 | |
| | 2,000,000 | | | Texas Roadhouse, Inc., Cl A1 | | | 21,811,221 | | | | 28,120,000 | |
| | | | | | | | | | | | |
| | | | | | | 40,531,092 | | | | 53,266,500 | |
| | | | | | | | | | | | |
| Total Consumer Discretionary | | | 631,885,978 | | | | 778,552,246 | |
| | | | | | | | | | | | |
| | | | | | | | | | | | |
| Consumer Staples (0.06%) | | | | | | | | |
| | | | Soft Drinks (0.06%) | | | | | | | | |
| | 519,800 | | | Heckmann Corp.1 | | | 3,108,852 | | | | 2,027,220 | |
| | | | | | | | | | | | |
| | | | | | | | | | | | |
| Energy (8.51%) | | | | | | | | |
| | | | Oil & Gas Equipment & Services (2.83%) | | | | | | | | |
| | 500,000 | | | CARBO Ceramics, Inc. | | | 34,457,138 | | | | 40,500,000 | |
| | 600,000 | | | Core Laboratories N.V.2 | | | 23,095,109 | | | | 52,824,000 | |
| | | | | | | | | | | | |
| | | | | | | 57,552,247 | | | | 93,324,000 | |
| | | | | | | | | | | | |
| Shares | | | | | Cost | | | Value | |
| Common Stocks (continued) | | | | | |
| Energy (continued) | | | | | |
| | | | Oil & Gas Exploration & Production (5.53%) | | | | | | | | |
| | 2,250,000 | | | Atlas Energy, Inc.1 | | $ | 57,328,242 | | | $ | 64,440,000 | |
| | 2,000,000 | | | Brigham Exploration Co.1 | | | 21,988,814 | | | | 37,500,000 | |
| | 800,000 | | | Concho Resources, Inc.1 | | | 22,541,595 | | | | 52,936,000 | |
| | 500,000 | | | GeoResources, Inc.1 | | | 5,100,000 | | | | 7,950,000 | |
| | 1,000,000 | | | Oasis Petroleum, Inc.1 | | | 14,212,944 | | | | 19,370,000 | |
| | | | | | | | | | | | |
| | | | | | | 121,171,595 | | | | 182,196,000 | |
| | | |
| | | | Oil & Gas Storage &
Transportation (0.15%) | | | | | | | | |
| | 201,995 | | | PAA Natural Gas Storage LP | | | 4,349,046 | | | | 4,876,159 | |
| | | | | | | | | | | | |
| Total Energy | | | 183,072,888 | | | | 280,396,159 | |
| | | | | | | | | | | | |
| | | | | | | | | | | | |
| Financials (8.84%) | | | | | | | | |
| | | | Asset Management & Custody
Banks (0.54%) | | | | | | | | |
| | 1,350,000 | | | Financial Engines, Inc.1 | | | 21,033,666 | | | | 17,928,000 | |
| | | |
| | | | Consumer Finance (0.29%) | | | | | | | | |
| | 200,000 | | | Green Dot Corp., Cl A1 | | | 8,858,908 | | | | 9,696,000 | |
| | | |
| | | | Diversified Real Estate
Activities (0.52%) | | | | | | | | |
| | 1,051,974 | | | Coresite Realty Corp.1,4 | | | 16,859,686 | | | | 17,241,854 | |
| | | |
| | | | Office REITs (1.44%) | | | | | | | | |
| | 750,000 | | | SL Green Realty Corp. | | | 17,178,705 | | | | 47,497,500 | |
| | | |
| | | | Real Estate Services (1.39%) | | | | | | | | |
| | 2,500,000 | | | CB Richard Ellis Group, Inc., Cl A1 | | | 15,237,593 | | | | 45,700,000 | |
| | | |
| | | | Regional Banks (0.75%) | | | | | | | | |
| | 1,250,000 | | | SJB Escrow Corp., Cl A, 144A1,5,8 | | | 25,000,000 | | | | 24,750,000 | |
| | | |
| | | | Reinsurance (0.51%) | | | | | | | | |
| | 200,000 | | | Arch Capital Group, Ltd.1,2 | | | 5,515,966 | | | | 16,760,000 | |
| | | |
| | | | Specialized Finance (1.14%) | | | | | | | | |
| | 1,126,513 | | | MSCI, Inc., Cl A1 | | | 25,427,990 | | | | 37,411,496 | |
| | | |
| | | | Specialized REITs (2.26%) | | | | | | | | |
| | 901,862 | | | Chesapeake Lodging Trust3,4,5,8 | | | 16,955,006 | | | | 14,456,848 | |
| | 750,000 | | | Digital Realty Trust, Inc.5 | | | 26,031,848 | | | | 46,275,000 | |
| | 750,000 | | | Pebblebrook Hotel Trust1 | | | 14,262,777 | | | | 13,507,500 | |
| | | | | | | | | | | | |
| | | | | | | 57,249,631 | | | | 74,239,348 | |
| | | | | | | | | | | | |
| Total Financials | | | 192,362,145 | | | | 291,224,198 | |
| | | | | | | | | | | | |
| | | | | | | | | | | | |
| Health Care (13.18%) | | | | | | | | |
| | | | Health Care Equipment (4.44%) | | | | | | | | |
| | 900,000 | | | IDEXX Laboratories, Inc.1 | | | 29,711,916 | | | | 55,548,000 | |
| | 175,000 | | | Intuitive Surgical, Inc.1 | | | 2,537,500 | | | | 49,654,500 | |
| | 1,500,000 | | | Masimo Corp. | | | 33,862,646 | | | | 40,965,000 | |
| | | | | | | | | | | | |
| | | | | | | 66,112,062 | | | | 146,167,500 | |
| | | |
| | | | Health Care Facilities (2.62%) | | | | | | | | |
| | 3,550,000 | | | Brookdale Senior Living, Inc.1 | | | 68,396,819 | | | | 57,900,500 | |
| | 1,525,000 | | | Emeritus Corp.1 | | | 46,025,139 | | | | 26,016,500 | |
| | 650,000 | | | Skilled Healthcare Group, Inc., Cl A1 | | | 7,595,670 | | | | 2,554,500 | |
| | | | | | | | | | | | |
| | | | | | | 122,017,628 | | | | 86,471,500 | |
| | | |
| | | | Health Care Services (0.54%) | | | | | | | | |
| | 300,000 | | | HMS Holdings Corp.1 | | | 14,106,317 | | | | 17,682,000 | |
| | | |
| | | | Health Care Supplies (1.86%) | | | | | | | | |
| | 750,000 | | | Gen-Probe, Inc.1,5 | | | 31,517,368 | | | | 36,345,000 | |
| | 1,250,000 | | | Immucor, Inc.1 | | | 11,965,689 | | | | 24,787,500 | |
| | | | | | | | | | | | |
| | | | | | | 43,483,057 | | | | 61,132,500 | |
| | |
| See Notes to Financial Statements. | | 17 |
| | |
| Baron Small Cap Fund | | September 30, 2010 |
STATEMENT OF NET ASSETS (Continued)
SEPTEMBER 30, 2010
| | | | | | | | | | | | |
| Shares | | | | | Cost | | | Value | |
| Common Stocks (continued) | | | | | |
| Health Care (continued) | | | | | |
| | | | Life Sciences Tools & Services (3.72%) | | | | | | | | |
| | 900,000 | | | Covance, Inc.1 | | $ | 33,410,943 | | | $ | 42,111,000 | |
| | 1,139,146 | | | Luminex Corp.1 | | | 18,857,300 | | | | 18,226,336 | |
| | 500,000 | | | Mettler-Toledo International, Inc.1 | | | 31,248,358 | | | | 62,220,000 | |
| | | | | | | | | | | | |
| | | | | | | 83,516,601 | | | | 122,557,336 | |
| | | | | | | | | | | | |
| Total Health Care | | | 329,235,665 | | | | 434,010,836 | |
| | | | | | | | | | | | |
| | | | | | | | | | | | |
| Industrials (18.57%) | | | | | |
| | | | Aerospace & Defense (2.54%) | | | | | |
| | 1,350,000 | | | TransDigm Group, Inc.1 | | | 35,096,586 | | | | 83,767,500 | |
| | |
| | | | Construction & Engineering (0.53%) | | | | | |
| | 1,400,000 | | | Orion Marine Group, Inc.1,4 | | | 20,411,939 | | | | 17,374,000 | |
| | | |
| | | | Construction & Farm Machinery & Heavy Trucks (1.16%) | | | | | | | | |
| | 800,000 | | | Wabtec Corp. | | | 26,349,851 | | | | 38,232,000 | |
| | | |
| | | | Diversified Support Services (1.26%) | | | | | | | | |
| | 2,000,000 | | | Ritchie Bros. Auctioneers, Inc.2 | | | 37,985,919 | | | | 41,540,000 | |
| | | |
| | | | Electrical Components & Equipment (0.46%) | | | | | | | | |
| | 500,000 | | | Polypore International, Inc.1 | | | 13,874,331 | | | | 15,080,000 | |
| | | |
| | | | Environmental & Facilities Services (6.20%) | | | | | | | | |
| | 950,000 | | | Clean Harbors, Inc.1 | | | 51,362,631 | | | | 64,362,500 | |
| | 2,500,000 | | | Covanta Holding Corp. | | | 37,034,760 | | | | 39,375,000 | |
| | 1,000,000 | | | Tetra Tech, Inc.1 | | | 25,773,708 | | | | 20,970,000 | |
| | 2,000,010 | | | Waste Connections, Inc.1 | | | 54,338,658 | | | | 79,320,397 | |
| | | | | | | | | | | | |
| | | | | | | 168,509,757 | | | | 204,027,897 | |
| | | |
| | | | Human Resource & Employment Services (1.27%) | | | | | | | | |
| | 850,000 | | | Towers Watson & Co., Cl A | | | 33,744,465 | | | | 41,803,000 | |
| | |
| | | | Industrial Machinery (2.51%) | | | | | |
| | 1,100,000 | | | Graco, Inc. | | | 25,662,211 | | | | 34,903,000 | |
| | 650,000 | | | Nordson Corp. | | | 42,812,853 | | | | 47,898,500 | |
| | | | | | | | | | | | |
| | | | | | | 68,475,064 | | | | 82,801,500 | |
| | | |
| | | | Railroads (1.19%) | | | | | | | | |
| | 900,000 | | | Genesee & Wyoming, Inc., Cl A1 | | | 23,192,198 | | | | 39,051,000 | |
| | | |
| | | | Research & Consulting Services (1.45%) | | | | | | | | |
| | 1,250,000 | | | Huron Consulting Group, Inc.1,4 | | | 40,540,236 | | | | 27,487,500 | |
| | 1,750,000 | | | Mistras Group, Inc.1,4 | | | 20,709,995 | | | | 20,265,000 | |
| | | | | | | | | | | | |
| | | | | | | 61,250,231 | | | | 47,752,500 | |
| | | | | | | | | | | | |
| Total Industrials | | | 488,890,341 | | | | 611,429,397 | |
| | | | | | | | | | | | |
| | | | | | | | | | | | |
| Information Technology (14.33%) | | | | | |
| | | | Application Software (2.34%) | | | | | |
| | 600,000 | | | Advent Software, Inc.1 | | | 16,654,197 | | | | 31,314,000 | |
| | 1,079,700 | | | RealPage, Inc.1 | | | 12,425,486 | | | | 20,600,676 | |
| | 650,001 | | | Ultimate Software Group, Inc.1 | | | 14,157,645 | | | | 25,116,039 | |
| | | | | | | | | | | | |
| | | | | | | 43,237,328 | | | | 77,030,715 | |
| | |
| | | | Computer Hardware (1.14%) | | | | | |
| | 2,750,000 | | | NCR Corp.1 | | | 35,727,844 | | | | 37,482,500 | |
| | | |
| | | | Electronic Equipment & Instruments (2.28%) | | | | | | | | |
| | 1,650,000 | | | FLIR Systems, Inc.1 | | | 11,034,434 | | | | 42,405,000 | |
| | 1,000,000 | | | National Instruments Corp. | | | 29,401,075 | | | | 32,660,000 | |
| | | | | | | | | | | | |
| | | | | | | 40,435,509 | | | | 75,065,000 | |
| | | | | | | | | | | | |
| Shares | | | | | Cost | | | Value | |
| Common Stocks (continued) | | | | | |
| Information Technology (continued) | | | | | |
| | | | Internet Software & Services (0.75%) | | | | | | | | |
| | 1,000,000 | | | AOL, Inc.1 | | $ | 23,050,041 | | | $ | 24,750,000 | |
| | | |
| | | | IT Consulting & Other Services (5.59%) | | | | | | | | |
| | 875,000 | | | Equinix, Inc.1,5 | | | 55,025,037 | | | | 89,556,250 | |
| | 2,250,000 | | | Gartner, Inc.1 | | | 41,942,702 | | | | 66,240,000 | |
| | 1,250,000 | | | Telvent GIT SA1,2 | | | 40,609,861 | | | | 28,275,000 | |
| | | | | | | | | | | | |
| | | | | | | 137,577,600 | | | | 184,071,250 | |
| | | | Semiconductor Equipment (0.69%) | | | | | | | | |
| | 1,000,000 | | | Rubicon Technology, Inc.1,6 | | | 13,703,720 | | | | 22,690,000 | |
| | |
| | | | Semiconductors (0.97%) | | | | | |
| | 1,000,000 | | | Power Integrations, Inc. | | | 37,060,909 | | | | 31,790,000 | |
| | | |
| | | | Technology Distributors (0.57%) | | | | | | | | |
| | 350,000 | | | Anixter International, Inc.1 | | | 16,167,504 | | | | 18,896,500 | |
| | | | | | | | | | | | |
| Total Information Technology | | | 346,960,455 | | | | 471,775,965 | |
| | | | | | | | | | | | |
| | | | | | | | | | | | |
| Materials (3.27%) | | | | | |
| | | | Construction Materials (0.43%) | | | | | | | | |
| | 600,000 | | | Eagle Materials, Inc. | | | 10,395,268 | | | | 14,220,000 | |
| | | |
| | | | Diversified Metals & Mining (1.49%) | | | | | | | | |
| | 3,500,000 | | | Globe Specialty Metals, Inc.1 | | | 36,717,668 | | | | 49,140,000 | |
| | |
| | | | Specialty Chemicals (1.35%) | | | | | |
| | 700,000 | | | Kraton Performance Polymers, Inc.1 | | | 18,644,025 | | | | 19,005,000 | |
| | 1,000,000 | | | Nalco Holding Co. | | | 17,014,844 | | | | 25,210,000 | |
| | | | | | | | | | | | |
| | | | | | | 35,658,869 | | | | 44,215,000 | |
| | | | | | | | | | | | |
| Total Materials | | | 82,771,805 | | | | 107,575,000 | |
| | | | | | | | | | | | |
| | | | | | | | | | | | |
| Telecommunication Services (5.31%) | | | | | |
| | | | Wireless Telecommunication Services (5.31%) | | | | | | | | |
| | 1,250,000 | | | American Tower Corp., Cl A1 | | | 4,384,197 | | | | 64,075,000 | |
| | 2,750,000 | | | SBA Communications Corp., Cl A1 | | | 26,849,041 | | | | 110,825,000 | |
| | | | | | | | | | | | |
| Total Telecommunication Services | | | 31,233,238 | | | | 174,900,000 | |
| | | | | | | | | | | | |
| | | | | | | | | | | | |
| Utilities (0.43%) | | | | | |
| | | | Electric Utilities (0.43%) | | | | | |
| | 225,000 | | | ITC Holdings Corp. | | | 9,427,959 | | | | 14,006,250 | |
| | | | | | | | | | | | |
| Total Common Stocks | | | 2,298,949,326 | | | | 3,165,897,271 | |
| | | | | | | | | | | | |
| | | | | | | | | | | | |
| Private Equity Investments (0.32%) | | | | | |
| Consumer Discretionary (0.32%) | | | | | |
| | | | Hotels, Resorts & Cruise Lines (0.32%) | | | | | | | | |
| | 3,500,000 | | | Kerzner International Holdings, Ltd., Cl A1,2,3,5,9 | | | 35,000,000 | | | | 10,500,000 | |
| | | | | | | | | | | | |
| | | | | | | | | | | | |
| Warrants (0.02%) | | | | | | | | |
| Financials (0.02%) | | | | | |
| | | | Regional Banks (0.02%) | | | | | |
| | 75,000 | | | SJB Escrow Corp.1,5 | | | 0 | | | | 513,165 | |
| | | | | | | | | | | | |
| | |
| 18 | | See Notes to Financial Statements. |
| | |
| September 30, 2010 | | Baron Small Cap Fund |
STATEMENT OF NET ASSETS (Continued)
SEPTEMBER 30, 2010
| | | | | | | | | | |
Principal
Amount | | Cost | | | Value | |
Short Term Investments (3.69%) | | | | | |
| $115,886,011 | | Repurchase Agreement with Fixed Income Clearing Corp., dated 09/30/2010, 0.08% due 10/01/2010; Proceeds at maturity - $115,886,268; (Fully collateralized by U.S. Treasury Note, 3.125% due 05/15/2019; Market value - $6,017,838 and U.S. Treasury Note, 2.625% due 04/30/2016; Market value - $60,869,738 and U.S. Treasury Note, 3.375% due 11/15/2019; Market value - $28,574,381 and U.S. Treasury Note, 2.50% due 06/30/2017; Market value - $26,218,750) | | $ | 115,886,011 | | | $ | 115,886,011 | |
| 5,750,000 | | Repurchase Agreement with Fixed Income Clearing Corp., dated 09/30/2010, 0.08% due 10/01/2010; Proceeds at maturity - $5,750,013; (Fully collateralized by U.S. Treasury Note, 3.375% due 11/15/2019; Market value - $6,040,069)7 | | | 5,750,000 | | | | 5,750,000 | |
| | | | | | | | | | |
Total Short Term Investments | | | 121,636,011 | | | | 121,636,011 | |
| | | | | | | | | | |
Total Investments (100.17%) | | $ | 2,455,585,337 | | | | 3,298,546,447 | |
| | | | | | | | | | |
Liabilities Less Cash and Other Assets (-0.17%) | | | | (5,480,904 | ) |
| | | | | | | | | | |
Net Assets | | | $ | 3,293,065,543 | |
| | | | | | | | | | |
Retail Shares (Equivalent to $20.90 per share based on 145,062,232 shares outstanding) | | | $ | 3,031,999,003 | |
| | | | | | | | | | |
Institutional Shares (Equivalent to $20.97 per share based on 12,450,359 shares outstanding) | | | $ | 261,066,540 | |
| | | | | | | | | | |
| % | Represents percentage of net assets. |
| 1 | Non-income producing securities. |
| 3 | At September 30, 2010, the market value of restricted and fair valued securities amounted to $24,956,848 or 0.76% of net assets. 0.44% of these securities are deemed liquid. See Note 6. |
| 4 | See Note 9 regarding “Affiliated” companies. |
| 5 | The Adviser has reclassified/classified certain securities in or out of this sub-industry. Such reclassifications/classifications are not supported by S&P or MSCI. |
| 6 | All or a portion of this security is on loan. The value of all securities loaned at September 30, 2010 amounted to $5,672,500, which is 0.17% of net assets. See Note 2 regarding “Securities Lending”. |
| 7 | Represents security purchased with the cash collateral received for security on loan. |
| 8 | Level 2 security. See Note 7 regarding Fair Value Measurements. |
| 9 | Level 3 security. See Note 7 regarding Fair Value Measurements. |
| 144A | Security is exempt from registration under Rule 144A of the Securities Act of 1933. This security may be resold in transactions that are exempt from registration, normally to qualified institutional buyers. This security has been deemed liquid pursuant to policies and procedures approved by the Board of Trustees, unless otherwise noted. At September 30, 2010, the market value of Rule 144A securities amounted to $24,750,000 or 0.75% of net assets. |
| | |
| See Notes to Financial Statements. | | 19 |
| | |
| Baron Opportunity Fund | | September 30, 2010 |
STATEMENT OF NET ASSETS
SEPTEMBER 30, 2010
| | | | | | | | | | | | |
| Shares | | | | | Cost | | | Value | |
| Common Stocks (94.35%) | | | | | |
| Consumer Discretionary (18.09%) | | | | | |
| | | | Advertising (3.81%) | | | | | | | | |
| | 175,500 | | | Lamar Advertising Co., Cl A1 | | $ | 5,581,388 | | | $ | 5,584,410 | |
| | 198,500 | | | National CineMedia, Inc. | | | 3,524,779 | | | | 3,553,150 | |
| | | | | | | | | | | | |
| | | | | | | 9,106,167 | | | | 9,137,560 | |
| | | |
| | | | Automotive Retail (0.79%) | | | | | | | | |
| | 68,000 | | | CarMax, Inc.1 | | | 1,449,640 | | | | 1,894,480 | |
| | | |
| | | | Broadcasting (2.47%) | | | | | | | | |
| | 155,000 | | | Discovery Communications, Inc., Series C1 | | | 5,779,349 | | | | 5,919,450 | |
| | | |
| | | | Casinos & Gaming (0.95%) | | | | | | | | |
| | 60,000 | | | WMS Industries, Inc.1 | | | 2,288,756 | | | | 2,284,200 | |
| | | |
| | | | Education Services (0.79%) | | | | | | | | |
| | 10,900 | | | Strayer Education, Inc. | | | 1,981,897 | | | | 1,902,050 | |
| | | |
| | | | Internet Retail (7.76%) | | | | | | | | |
| | 32,500 | | | Amazon.com, Inc.1 | | | 3,530,358 | | | | 5,104,450 | |
| | 85,100 | | | Blue Nile, Inc.1 | | | 3,704,608 | | | | 3,786,099 | |
| | 131,500 | | | Expedia, Inc. | | | 3,167,728 | | | | 3,709,615 | |
| | 10,000 | | | priceline.com, Inc.1 | | | 1,661,754 | | | | 3,483,400 | |
| | 425,000 | | | Vitacost.com, Inc.1 | | | 4,243,835 | | | | 2,554,250 | |
| | | | | | | | | | | | |
| | | | | | | 16,308,283 | | | | 18,637,814 | |
| | | |
| | | | Movies & Entertainment (1.52%) | | | | | | | | |
| | 70,000 | | | Liberty Media Corp.1 | | | 3,061,079 | | | | 3,644,200 | |
| | | | | | | | | | | | |
| Total Consumer Discretionary | | | 39,975,171 | | | | 43,419,754 | |
| | | | | | | | | | | | |
| | | | | | | | | | | | |
| Energy (4.68%) | | | | | |
| | | | Oil & Gas Equipment & Services (1.98%) | | | | | | | | |
| | 58,500 | | | CARBO Ceramics, Inc. | | | 3,917,060 | | | | 4,738,500 | |
| | | |
| | | | Oil & Gas Exploration & Production (2.70%) | | | | | | | | |
| | 177,500 | | | Oasis Petroleum, Inc.1 | | | 2,650,115 | | | | 3,438,175 | |
| | 91,000 | | | Southwestern Energy Co.1 | | | 3,301,630 | | | | 3,043,040 | |
| | | | | | | | | | | | |
| | | | | | | 5,951,745 | | | | 6,481,215 | |
| | | | | | | | | | | | |
| Total Energy | | | 9,868,805 | | | | 11,219,715 | |
| | | | | | | | | | | | |
| | | | | | | | | | | | |
| Financials (8.08%) | | | | | | | | |
| | | | Asset Management & Custody Banks (0.99%) | | | | | | | | |
| | 179,711 | | | Financial Engines, Inc.1 | | | 2,560,483 | | | | 2,386,562 | |
| | | |
| | | | Consumer Finance (0.57%) | | | | | | | | |
| | 28,246 | | | Green Dot Corp., Cl A1 | | | 1,266,782 | | | | 1,369,366 | |
| | | |
| | | | Diversified Real Estate Activities (2.07%) | | | | | | | | |
| | 90,000 | | | Brookfield Asset Management, Inc., Cl A2 | | | 2,546,008 | | | | 2,553,300 | |
| | 146,873 | | | Coresite Realty Corp.1 | | | 2,351,256 | | | | 2,407,249 | |
| | | | | | | | | | | | |
| | | | | | | 4,897,264 | | | | 4,960,549 | |
| | |
| | | | Investment Banking & Brokerage (1.42%) | | | | | |
| | 245,000 | | | Charles Schwab Corp. | | | 3,614,887 | | | | 3,405,500 | |
| | | |
| | | | Specialized Finance (3.03%) | | | | | | | | |
| | 219,100 | | | MSCI, Inc., Cl A1 | | | 5,788,659 | | | | 7,276,311 | |
| | | | | | | | | | | | |
| Total Financials | | | 18,128,075 | | | | 19,398,288 | |
| | | | | | | | | | | | |
| | | | | | | | | | | | |
| Health Care (12.90%) | | | | | | | | |
| | | | Health Care Equipment (4.15%) | | | | | | | | |
| | 28,000 | | | Edwards Lifesciences Corp.1 | | | 1,229,683 | | | | 1,877,400 | |
| | 11,400 | | | Intuitive Surgical, Inc.1 | | | 2,524,461 | | | | 3,234,636 | |
| | 177,000 | | | Masimo Corp. | | | 4,463,123 | | | | 4,833,870 | |
| | | | | | | | | | | | |
| | | | | | | 8,217,267 | | | | 9,945,906 | |
| | | | | | | | | | | | |
| Shares | | | | | Cost | | | Value | |
| Common Stocks (continued) | | | | | |
| Health Care (continued) | | | | | |
| | | | Health Care Services (2.94%) | | | | | | | | |
| | 820,000 | | | Clarient, Inc.1 | | $ | 2,588,867 | | | $ | 2,771,600 | |
| | 72,500 | | | HMS Holdings Corp.1 | | | 3,822,122 | | | | 4,273,150 | |
| | | | | | | | | | | | |
| | | | | | | 6,410,989 | | | | 7,044,750 | |
| | | |
| | | | Health Care Supplies (1.67%) | | | | | | | | |
| | 176,500 | | | AGA Medical Holdings, Inc.1 | | | 2,443,704 | | | | 2,463,940 | |
| | 32,000 | | | Gen-Probe, Inc.1,4 | | | 1,461,454 | | | | 1,550,720 | |
| | | | | | | | | | | | |
| | | | | | | 3,905,158 | | | | 4,014,660 | |
| | | |
| | | | Health Care Technology (2.05%) | | | | | | | | |
| | 266,000 | | | Allscripts Healthcare Solutions, Inc.1 | | | 4,528,449 | | | | 4,913,020 | |
| | | |
| | | | Life Sciences Tools & Services (2.09%) | | | | | | | | |
| | 54,000 | | | Illumina, Inc.1 | | | 2,195,659 | | | | 2,656,800 | |
| | 148,066 | | | Luminex Corp.1 | | | 2,465,652 | | | | 2,369,056 | |
| | | | | | | | | | | | |
| | | | | | | 4,661,311 | | | | 5,025,856 | |
| | | | | | | | | | | | |
| Total Health Care | | | 27,723,174 | | | | 30,944,192 | |
| | | | | | | | | | | | |
| | | | | | | | | | | | |
| Industrials (7.02%) | | | | | |
| | | | Diversified Support Services (1.18%) | | | | | | | | |
| | 90,000 | | | EnerNOC, Inc.1 | | | 1,145,859 | | | | 2,826,900 | |
| | | |
| | | | Electrical Components & Equipment (1.01%) | | | | | | | | |
| | 80,500 | | | Polypore International, Inc.1 | | | 2,208,891 | | | | 2,427,880 | |
| | | |
| | | | Environmental & Facilities Services (1.76%) | | | | | | | | |
| | 201,500 | | | Tetra Tech, Inc.1 | | | 4,569,930 | | | | 4,225,455 | |
| | | |
| | | | Research & Consulting Services (3.07%) | | | | | | | | |
| | 69,000 | | | CoStar Group, Inc.1 | | | 2,280,376 | | | | 3,360,990 | |
| | 59,000 | | | IHS, Inc., Cl A1 | | | 2,464,761 | | | | 4,012,000 | |
| | | | | | | | | | | | |
| | | | | | | 4,745,137 | | | | 7,372,990 | |
| | | | | | | | | | | | |
| Total Industrials | | | 12,669,817 | | | | 16,853,225 | |
| | | | | | | | | | | | |
| | | | | | | | | | | | |
| Information Technology (35.39%) | | | | | |
| | | | Application Software (11.51%) | | | | | | | | |
| | 38,000 | | | Advent Software, Inc.1 | | | 1,304,334 | | | | 1,983,220 | |
| | 118,866 | | | ANSYS, Inc.1 | | | 3,609,066 | | | | 5,022,088 | |
| | 30,939 | | | Blackboard, Inc.1 | | | 1,189,728 | | | | 1,115,042 | |
| | 50,000 | | | Citrix Systems, Inc.1 | | | 1,673,926 | | | | 3,412,000 | |
| | 41,000 | | | FactSet Research Systems, Inc. | | | 2,388,971 | | | | 3,326,330 | |
| | 66,000 | | | Informatica Corp.1 | | | 1,633,852 | | | | 2,535,060 | |
| | 175,000 | | | Pegasystems, Inc. | | | 5,150,254 | | | | 5,433,750 | |
| | 120,110 | | | RealPage, Inc.1 | | | 1,382,876 | | | | 2,291,699 | |
| | 100,000 | | | SuccessFactors, Inc.1 | | | 2,072,225 | | | | 2,511,000 | |
| | | | | | | | | | | | |
| | | | | | | 20,405,232 | | | | 27,630,189 | |
| | | |
| | | | Communications Equipment (2.74%) | | | | | | | | |
| | 57,500 | | | QUALCOMM, Inc. | | | 2,038,510 | | | | 2,594,400 | |
| | 87,500 | | | Riverbed Technology, Inc.1 | | | 2,431,480 | | | | 3,988,250 | |
| | | | | | | | | | | | |
| | | | | | | 4,469,990 | | | | 6,582,650 | |
| | | |
| | | | Computer Hardware (3.05%) | | | | | | | | |
| | 25,800 | | | Apple, Inc.1 | | | 2,635,258 | | | | 7,320,750 | |
| | | |
| | | | Home Entertainment Software (1.29%) | | | | | | | | |
| | 285,000 | | | Activision Blizzard, Inc. | | | 2,406,390 | | | | 3,083,700 | |
| | | |
| | | | Internet Software & Services (6.73%) | | | | | | | | |
| | 204,500 | | | AOL, Inc.1 | | | 5,083,311 | | | | 5,061,375 | |
| | 148,000 | | | GSI Commerce, Inc.1 | | | 2,553,482 | | | | 3,655,600 | |
| | 653,791 | | | TechTarget, Inc.1 | | | 2,456,802 | | | | 3,432,403 | |
| | 80,000 | | | WebMD Health Corp., Cl A1 | | | 2,031,231 | | | | 3,989,600 | |
| | | | | | | | | | | | |
| | | | | | | 12,124,826 | | | | 16,138,978 | |
| | |
| 20 | | See Notes to Financial Statements. |
| | |
| September 30, 2010 | | Baron Opportunity Fund |
STATEMENT OF NET ASSETS (Continued)
SEPTEMBER 30, 2010
| | | | | | | | | | |
| Shares | | | | Cost | | | Value | |
Common Stocks (continued) | |
Information Technology (continued) | |
| | IT Consulting & Other Services (7.57%) | | | | | | | | |
| 111,000 | | Equinix, Inc.1,4 | | $ | 5,543,643 | | | $ | 11,360,850 | |
| 231,144 | | Gartner, Inc.1 | | | 3,998,104 | | | | 6,804,879 | |
| | | | | | | | | | |
| | | | | 9,541,747 | | | | 18,165,729 | |
| |
| | Systems Software (2.50%) | |
| 50,000 | | TOTVS SA2 | | | 2,397,371 | | | | 3,838,652 | |
| 25,500 | | VMware, Inc., Cl A1 | | | 2,196,466 | | | | 2,165,970 | |
| | | | | | | | | | |
| | | | | 4,593,837 | | | | 6,004,622 | |
| | | | | | | | | | |
Total Information Technology | | | 56,177,280 | | | | 84,926,618 | |
| | | | | | | | | | |
| | | | | | | | | | |
Telecommunication Services (8.19%) | |
| | Wireless Telecommunication Services (8.19%) | | | | | | | | |
| 52,000 | | American Tower Corp., Cl A1 | | | 488,162 | | | | 2,665,520 | |
| 202,500 | | NII Holdings, Inc.1 | | | 9,280,972 | | | | 8,322,750 | |
| 215,000 | | SBA Communications Corp., Cl A1 | | | 3,789,303 | | | | 8,664,500 | |
| | | | | | | | | | |
Total Telecommunication Services | | | 13,558,437 | | | | 19,652,770 | |
| | | | | | | | | | |
Total Common Stocks | | | 178,100,759 | | | | 226,414,562 | |
| | | | | | | | | | |
| | | | | | | | | | |
Warrants (0.00%) | |
Information Technology (0.00%) | |
| | Communications Equipment (0.00%) | |
| 200,000 | | Loudeye Corp. Warrants, Exp 12/23/20101,3,5 | | | 0 | | | | 0 | |
| | | | | | | | | | |
| | | | | | | | | | |
Principal Amount | |
Short Term Investments (6.69%) | |
| $16,063,325 | | Repurchase Agreement with Fixed Income Clearing Corp., dated 09/30/2010, 0.08% due 10/01/2010; Proceeds at maturity -$16,063,361; (Fully collateralized by U.S. Treasury Note, 3.375% due 11/15/2019; Market value -$16,870,725) | | | 16,063,325 | | | | 16,063,325 | |
| | | | | | | | | | |
Total Investments (101.04%) | | $ | 194,164,084 | | | | 242,477,887 | |
| | | | | | | | | | |
Liabilities Less Cash and Other Assets (-1.04%) | | | | (2,501,472 | ) |
| | | | | | | | | | |
Net Assets | | | $ | 239,976,415 | |
| | | | | | | | | | |
Retail Shares (Equivalent to $12.76 per share
based on 16,809,782 shares outstanding) | | | $ | 214,432,757 | |
| | | | | | | | | | |
Institutional Shares (Equivalent to $12.80
per share based on 1,995,208 shares outstanding) | | | $ | 25,543,658 | |
| | | | | | | | | | |
| % | Represents percentage of net assets. |
| 1 | Non-income producing securities. |
| 3 | At September 30, 2010, the market value of restricted and fair valued securities amounted to $0 or 0.00% of net assets. None of these securities are deemed liquid. See Note 6. |
| 4 | The Adviser has reclassified/classified certain securities in or out of this sub-industry. Such reclassifications/classifications are not supported by S&P or MSCI. |
| 5 | Level 2 security. See Note 7 regarding Fair Value Measurements. |
| | |
| See Notes to Financial Statements. | | 21 |
| | |
| Baron Fifth Avenue Growth Fund | | September 30, 2010 |
STATEMENT OF NET ASSETS
SEPTEMBER 30, 2010
| | | | | | | | | | | | |
| Shares | | | | | Cost | | | Value | |
| Common Stocks (97.79%) | | | | | |
| Consumer Discretionary (27.52%) | | | | | |
| | | | Automobile Manufacturers (1.40%) | | | | | | | | |
| | 45,000 | | | Ford Motor Co.1 | | $ | 539,717 | | | $ | 550,800 | |
| | | | Broadcasting (2.38%) | | | | | | | | |
| | 21,500 | | | Discovery Communications, Inc., Cl A1 | | | 687,032 | | | | 936,325 | |
| | | | General Merchandise Stores (2.04%) | | | | | | | | |
| | 15,000 | | | Target Corp. | | | 631,476 | | | | 801,600 | |
| | | | Home Improvement Retail (2.66%) | | | | | | | | |
| | 33,000 | | | Home Depot, Inc. | | | 1,085,848 | | | | 1,045,440 | |
| | | | Homebuilding (3.28%) | | | | | | | | |
| | 68,000 | | | Toll Brothers, Inc.1 | | | 1,280,674 | | | | 1,293,360 | |
| | | | Hotels, Resorts & Cruise Lines (6.24%) | | | | | | | | |
| | 34,000 | | | Carnival Corp.2 | | | 1,308,496 | | | | 1,299,140 | |
| | 31,000 | | | Hyatt Hotels Corp., Cl A1 | | | 845,688 | | | | 1,159,090 | |
| | | | | | | | | | | | |
| | | | | | | 2,154,184 | | | | 2,458,230 | |
| | | | Internet Retail (2.63%) | | | | | | | | |
| | 6,600 | | | Amazon.com, Inc.1 | | | 629,428 | | | | 1,036,596 | |
| | | | Movies & Entertainment (3.48%) | | | | | | | | |
| | 18,000 | | | Liberty Media Corp.1 | | | 817,980 | | | | 937,080 | |
| | 12,000 | | | Viacom, Inc. | | | 408,825 | | | | 434,280 | |
| | | | | | | | | | | | |
| | | | | | | 1,226,805 | | | | 1,371,360 | |
| | | | Restaurants (3.41%) | | | | | | | | |
| | 18,000 | | | McDonald’s Corp. | | | 1,060,502 | | | | 1,341,180 | |
| | | | | | | | | | | | |
| Total Consumer Discretionary | | | 9,295,666 | | | | 10,834,891 | |
| | | | | | | | | | | | |
| | | | | | | | | | | | |
| Consumer Staples (2.87%) | | | | | |
| | | | Hypermarkets & Super Centers (2.87%) | | | | | | | | |
| | 17,500 | | | Costco Wholesale Corp. | | | 859,886 | | | | 1,128,575 | |
| | | | | | | | | | | | |
| | | | | | | | | | | | |
| Energy (4.87%) | | | | | |
| | | | Integrated Oil & Gas (3.48%) | | | | | | | | |
| | 17,500 | | | Occidental Petroleum Corp. | | | 1,381,530 | | | | 1,370,250 | |
| | | | Oil & Gas Equipment & Services (1.39%) | | | | | | | | |
| | 16,500 | | | Halliburton Co. | | | 468,017 | | | | 545,655 | |
| | | | | | | | | | | | |
| Total Energy | | | 1,849,547 | | | | 1,915,905 | |
| | | | | | | | | | | | |
| | | | | | | | | | | | |
| Financials (14.60%) | | | | | |
| | | | Consumer Finance (2.78%) | | | | | | | | |
| | 26,000 | | | American Express Co. | | | 855,220 | | | | 1,092,780 | |
| | | | Diversified Banks (2.71%) | | | | | | | | |
| | 42,500 | | | Wells Fargo & Company | | | 1,242,616 | | | | 1,068,025 | |
| | | | Investment Banking & Brokerage (3.56%) | | | | | | | | |
| | 28,000 | | | Charles Schwab Corp. | | | 279,423 | | | | 389,200 | |
| | 7,000 | | | Goldman Sachs Group, Inc. | | | 1,028,802 | | | | 1,012,060 | |
| | | | | | | | | | | | |
| | | | | | | 1,308,225 | | | | 1,401,260 | |
| | | | Other Diversified Financial Services (2.90%) | |
| | 30,000 | | | JPMorgan Chase & Co. | | | 978,914 | | | | 1,142,100 | |
| | | | Property & Casualty Insurance (0.95%) | | | | | | | | |
| | 3 | | | Berkshire Hathaway, Inc., Cl A1 | | | 224,597 | | | | 373,500 | |
| | | | Reinsurance (1.70%) | | | | | | | | |
| | 8,000 | | | Arch Capital Group, Ltd.1,2 | | | 532,173 | | | | 670,400 | |
| | | | | | | | | | | | |
| Total Financials | | | 5,141,745 | | | | 5,748,065 | |
| | | | | | | | | | | | |
| | | | | | | | | | | | |
| Health Care (12.17%) | | | | | |
| | | | Health Care Distributors (2.28%) | | | | | | | | |
| | 14,500 | | | McKesson Corp. | | | 1,007,049 | | | | 895,810 | |
| | | | Health Care Facilities (2.75%) | | | | | | | | |
| | 35,000 | | | Community Health Systems, Inc.1 | | | 1,329,062 | | | | 1,083,950 | |
| | | | Health Care Services (1.73%) | | | | | | | | |
| | 14,000 | | | Express Scripts, Inc.1 | | | 641,384 | | | | 681,800 | |
| | | | Life Sciences Tools & Services (3.36%) | | | | | | | | |
| | 14,000 | | | Life Technologies Corp.1 | | | 716,625 | | | | 653,660 | |
| | 14,000 | | | Thermo Fisher Scientific, Inc.1 | | | 756,120 | | | | 670,320 | |
| | | | | | | | | | | | |
| | | | | | | 1,472,745 | | | | 1,323,980 | |
| | | | Pharmaceuticals (2.05%) | | | | | | | | |
| | 15,300 | | | Teva Pharmaceutical Industries Ltd., ADR2 | | | 940,445 | | | | 807,075 | |
| | | | | | | | | | | | |
| Total Health Care | | | 5,390,685 | | | | 4,792,615 | |
| | | | | | | | | | | | |
| | | | | | | | | | |
| Shares | | | | Cost | | | Value | |
Common Stocks (continued) | | | | | |
Industrials (12.48%) | | | | | |
| | Air Freight & Logistics (3.48%) | | | | | | | | |
| 16,000 | | FedEx Corp. | | $ | 1,358,371 | | | $ | 1,368,000 | |
| | Environmental & Facilities Services (3.25%) | | | | | | | | |
| 42,000 | | Republic Services, Inc. | | | 892,460 | | | | 1,280,580 | |
| | Industrial Conglomerates (2.64%) | | | | | | | | |
| 12,000 | | 3M Co. | | | 994,908 | | | | 1,040,520 | |
| | Trading Companies & Distributors (3.11%) | |
| 23,000 | | Fastenal Co. | | | 854,747 | | | | 1,223,370 | |
| | | | | | | | | | |
Total Industrials | | | 4,100,486 | | | | 4,912,470 | |
| | | | | | | | | | |
| | | | | | | | | | |
Information Technology (15.14%) | | | | | |
| | Application Software (1.94%) | | | | | | | | |
| 11,200 | | Citrix Systems, Inc.1 | | | 450,006 | | | | 764,288 | |
| | Computer Hardware (3.32%) | | | | | | | | |
| 4,600 | | Apple, Inc.1 | | | 185,512 | | | | 1,305,250 | |
| | Internet Software & Services (3.70%) | | | | | | | | |
| 27,000 | | AOL, Inc.1 | | | 635,493 | | | | 668,250 | |
| 1,500 | | Google, Inc., Cl A1 | | | 326,747 | | | | 788,685 | |
| | | | | | | | | | |
| | | | | 962,240 | | | | 1,456,935 | |
| | IT Consulting & Other Services (3.38%) | | | | | | | | |
| 13,000 | | Equinix, Inc.1,3 | | | 961,680 | | | | 1,330,550 | |
| | Systems Software (2.80%) | | | | | | | | |
| 45,000 | | Microsoft Corp. | | | 981,974 | | | | 1,102,050 | |
| | | | | | | | | | |
Total Information Technology | | | 3,541,412 | | | | 5,959,073 | |
| | | | | | | | | | |
| | | | | | | | | | |
Materials (1.16%) | | | | | | | | |
| | Specialty Chemicals (1.16%) | | | | | | | | |
| 9,000 | | Ecolab, Inc. | | | 389,889 | | | | 456,660 | |
| | | | | | | | | | |
| | | | | | | | | | |
Telecommunication Services (6.98%) | | | | | |
| | Wireless Telecommunication Services (6.98%) | |
| 30,000 | | American Tower Corp., Cl A1 | | | 513,722 | | | | 1,537,800 | |
| 29,500 | | NII Holdings, Inc.1 | | | 888,815 | | | | 1,212,450 | |
| | | | | | | | | | |
Total Telecommunication Services | | | 1,402,537 | | | | 2,750,250 | |
| | | | | | | | | | |
Total Common Stocks | | | 31,971,853 | | | | 38,498,504 | |
| �� | | | | | | | | | |
| | | | | | | | | | |
Principal
Amount | | | | | | |
Short Term Investments (2.18%) | | | | | | | | |
| $856,590 | | Repurchase Agreement with Fixed Income Clearing Corp., dated 09/30/2010, 0.08% due 10/01/2010; Proceeds at maturity - $856,592; (Fully collateralized by U.S. Treasury Note, 3.375% - due 11/15/2019; Market value - $900,281) | | | 856,590 | | | | 856,590 | |
| | | | | | | | | | |
Total Investments (99.97%) | | $ | 32,828,443 | | | | 39,355,094 | |
| | | | | | | | | | |
Cash and Other Assets Less Liabilities (0.03%) | | | | 13,339 | |
| | | | | | | | | | |
Net Assets | | | | | | $ | 39,368,433 | |
| | | | | | | | | | |
Retail Shares (Equivalent to $9.21 per share based on 3,143,794 shares outstanding) | | | | | |
| | $ | 28,949,399 | |
| | | | | | | | | | |
Institutional Shares (Equivalent to $9.21 per share based on 1,131,264 shares outstanding) | | | | | |
| | $ | 10,419,034 | |
| | | | | | | | | | |
| % | Represents percentage of net assets. |
| 1 | Non-income producing securities. |
| 3 | The Adviser has reclassified/classified certain securities in or out of this sub-industry. Such reclassifications/classifications are not supported by S&P or MSCI. |
| ADR | American Depositary Receipt. |
| | |
| 22 | | See Notes to Financial Statements. |
| | |
| September 30, 2010 | | Baron Funds |
STATEMENTS OF ASSETS AND LIABILITIES
SEPTEMBER 30, 2010
| | | | | | | | | | | | | | | | | | | | |
| | | Baron Asset
Fund | | | Baron Growth
Fund | | | Baron Small
Cap Fund | | | Baron
Opportunity
Fund | | | Baron Fifth
Avenue Growth
Fund | |
Assets: | | | | | | | | | | | | | | | | | | | | |
Investments in securities, at cost | | | | | | | | | | | | | | | | | | | | |
Unaffiliated investments | | $ | 1,728,814,891 | | | $ | 3,317,961,980 | | | $ | 2,198,860,067 | | | $ | 194,164,084 | | | $ | 32,828,443 | |
“Affiliated” investments | | | 35,613,086 | | | | 287,485,748 | | | | 256,725,270 | | | | — | | | | — | |
| | | | | | | | | | | | | | | | | | | | |
Investments in securities, at value | | | | | | | | | | | | | | | | | | | | |
Unaffiliated investments | | $ | 2,610,136,501 | | | $ | 5,009,625,966 | | | $ | 3,113,683,995 | | | $ | 242,477,887 | | | $ | 39,355,094 | |
“Affiliated” investments | | | 67,505,984 | | | | 547,083,450 | | | | 184,862,452 | | | | — | | | | — | |
Cash | | | — | | | | 3,341 | | | | — | | | | 1,924,300 | | | | — | |
Receivable for securities sold | | | 4,937,950 | | | | 41,806,859 | | | | 3,550,672 | | | | 2,984,175 | | | | 325,746 | |
Receivable for shares sold | | | 1,561,118 | | | | 8,502,904 | | | | 4,089,447 | | | | 522,556 | | | | 487 | |
Dividends and interest receivable | | | 1,328,362 | | | | 1,650,347 | | | | 752,465 | | | | 5,286 | | | | 24,047 | |
Prepaid expenses | | | 20,321 | | | | 41,197 | | | | 22,797 | | | | 1,382 | | | | 277 | |
| | | | | | | | | | | | | | | | | | | | |
| | | 2,685,490,236 | | | | 5,608,714,064 | | | | 3,306,961,828 | | | | 247,915,586 | | | | 39,705,651 | |
| | | | | | | | | | | | | | | | | | | | |
Liabilities: | | | | | | | | | | | | | | | | | | | | |
Payable for shares redeemed | | | 12,382,034 | | | | 12,646,860 | | | | 5,645,056 | | | | 102,559 | | | | 58,078 | |
Payable for securities purchased | | | 5,746,462 | | | | 23,612,019 | | | | 2,180,647 | | | | 7,754,760 | | | | 209,086 | |
Payable for collateral on loaned securities | | | — | | | | — | | | | 5,750,000 | | | | — | | | | — | |
Accrued foreign taxes | | | — | | | | 149,641 | | | | — | | | | 20,832 | | | | — | |
Investment advisory fees payable (Note 4) | | | 159 | | | | 20,392 | | | | 693 | | | | 99 | | | | 549 | |
Distribution fees payable (Note 4) | | | 531 | | | | 928 | | | | 344 | | | | 212 | | | | 737 | |
Accrued expenses and other payables | | | 362,227 | | | | 608,690 | | | | 319,545 | | | | 60,709 | | | | 68,768 | |
| | | | | | | | | | | | | | | | | | | | |
| | | 18,491,413 | | | | 37,038,530 | | | | 13,896,285 | | | | 7,939,171 | | | | 337,218 | |
| | | | | | | | | | | | | | | | | | | | |
Net Assets | | $ | 2,666,998,823 | | | $ | 5,571,675,534 | | | $ | 3,293,065,543 | | | $ | 239,976,415 | | | $ | 39,368,433 | |
| | | | | | | | | | | | | | | | | | | | |
Net Assets consist of: | | | | | | | | | | | | | | | | | | | | |
Paid-in capital | | $ | 1,733,617,168 | | | $ | 4,272,735,187 | | | $ | 2,682,256,364 | | | $ | 224,949,554 | | | $ | 39,668,687 | |
Accumulated net investment loss | | | (139 | ) | | | (3,237,884 | ) | | | (233 | ) | | | (19,463 | ) | | | — | |
Accumulated net realized gain (loss) on investments and foreign currency transactions | | | 20,167,930 | | | | (649,049,447 | ) | | | (232,151,698 | ) | | | (33,264,278 | ) | | | (6,826,905 | ) |
Net unrealized appreciation of investments and foreign currency transactions | | | 913,213,864 | | | | 1,951,227,678 | | | | 842,961,110 | | | | 48,310,602 | | | | 6,526,651 | |
| | | | | | | | | | | | | | | | | | | | |
Net Assets | | $ | 2,666,998,823 | | | $ | 5,571,675,534 | | | $ | 3,293,065,543 | | | $ | 239,976,415 | | | $ | 39,368,433 | |
| | | | | | | | | | | | | | | | | | | | |
Retail Shares: | | | | | | | | | | | | | | | | | | | | |
Net Assets | | $ | 2,424,208,476 | | | $ | 4,842,792,325 | | | $ | 3,031,999,003 | | | $ | 214,432,757 | | | $ | 28,949,399 | |
| | | | | | | | | | | | | | | | | | | | |
Shares Outstanding ($0.01 par value; indefinite shares authorized) | | | 49,204,228 | | | | 109,148,707 | | | | 145,062,232 | | | | 16,809,782 | | | | 3,143,794 | |
| | | | | | | | | | | | | | | | | | | | |
Net Asset Value Per Share | | $ | 49.27 | | | $ | 44.37 | | | $ | 20.90 | | | $ | 12.76 | | | $ | 9.21 | |
| | | | | | | | | | | | | | | | | | | | |
Institutional Shares: | | | | | | | | | | | | | | | | | | | | |
Net Assets | | $ | 242,790,347 | | | $ | 728,883,209 | | | $ | 261,066,540 | | | $ | 25,543,658 | | | $ | 10,419,034 | |
| | | | | | | | | | | | | | | | | | | | |
Shares Outstanding ($0.01 par value; indefinite shares authorized) | | | 4,911,677 | | | | 16,373,127 | | | | 12,450,359 | | | | 1,995,208 | | | | 1,131,264 | |
| | | | | | | | | | | | | | | | | | | | |
Net Asset Value Per Share | | $ | 49.43 | | | $ | 44.52 | | | $ | 20.97 | | | $ | 12.80 | | | $ | 9.21 | |
| | | | | | | | | | | | | | | | | | | | |
| | |
| See Notes to Financial Statements. | | 23 |
| | |
| Baron Funds | | September 30, 2010 |
STATEMENTS OF OPERATIONS
FOR THE YEAR ENDED SEPTEMBER 30, 2010
| | | | | | | | | | | | | | | | | | | | |
| | | Baron Asset
Fund | | | Baron Growth
Fund | | | Baron Small
Cap Fund | | | Baron
Opportunity
Fund | | | Baron Fifth
Avenue Growth
Fund | |
Investment income: | | | | | | | | | | | | | | | | | | | | |
Income: | | | | | | | | | | | | | | | | | | | | |
Interest | | $ | 7,478 | | | $ | 3,917,801 | | | $ | 21,403 | | | $ | 1,672 | | | $ | 108 | |
Dividends — unaffiliated investments | | | 19,990,855 | | | | 20,181,552 | | | | 29,247,558 | | | | 679,549 | | | | 445,079 | |
Dividends — “affiliated” investments | | | — | | | | 5,050,000 | | | | 1,706,150 | | | | — | | | | — | |
Securities lending income | | | — | | | | — | | | | 251,094 | | | | — | | | | — | |
Foreign taxes withheld on dividends | | | (149,904 | ) | | | (384,448 | ) | | | (190,200 | ) | | | (2,799 | ) | | | (579 | ) |
| | | | | | | | | | | | | | | | | | | | |
Total income | | | 19,848,429 | | | | 28,764,905 | | | | 31,036,005 | | | | 678,422 | | | | 444,608 | |
| | | | | | | | | | | | | | | | | | | | |
Expenses: | | | | | | | | | | | | | | | | | | | | |
Investment advisory fees (Note 4) | | | 27,630,230 | | | | 55,277,765 | | | | 30,957,041 | | | | 1,878,277 | | | | 411,210 | |
Distribution fees — Retail Shares (Note 4) | | | 6,429,104 | | | | 12,449,851 | | | | 7,279,541 | | | | 431,201 | | | | 81,062 | |
Shareholder servicing agent fees and expenses — Retail Shares | | | 784,000 | | | | 1,144,800 | | | | 576,510 | | | | 138,655 | | | | 35,409 | |
Shareholder servicing agent fees and expenses — Institutional Shares | | | 22,909 | | | | 45,825 | | | | 26,600 | | | | 9,927 | | | | 9,255 | |
Reports to shareholders | | | 759,500 | | | | 1,607,130 | | | | 714,415 | | | | 71,970 | | | | 7,910 | |
Custodian fees | | | 119,520 | | | | 332,890 | | | | 150,931 | | | | 33,003 | | | | 24,266 | |
Professional fees | | | 80,387 | | | | 102,483 | | | | 86,559 | | | | 39,225 | | | | 38,570 | |
Registration and filing fees | | | 67,552 | | | | 116,537 | | | | 73,120 | | | | 30,931 | | | | 23,021 | |
Trustee fees and expenses | | | 65,380 | | | | 133,770 | | | | 73,760 | | | | 4,874 | | | | 1,861 | |
Insurance expense | | | 58,569 | | | | 112,784 | | | | 61,016 | | | | 3,461 | | | | 989 | |
Line of credit fees | | | 35,521 | | | | 71,701 | | | | 40,160 | | | | 2,407 | | | | 630 | |
Administration fees | | | 27,610 | | | | 27,825 | | | | 27,199 | | | | 26,808 | | | | 26,696 | |
Miscellaneous expenses | | | 1,520 | | | | 1,466 | | | | 1,488 | | | | 1,591 | | | | 2,114 | |
| | | | | | | | | | | | | | | | | | | | |
Total operating expenses | | | 36,081,802 | | | | 71,424,827 | | | | 40,068,340 | | | | 2,672,330 | | | | 662,993 | |
Reimbursement of expenses by Adviser — Retail Shares (Note 4) | | | — | | | | — | | | | — | | | | — | | | | (82,737 | ) |
Reimbursement of expenses by Adviser — Institutional Shares (Note 4) | | | — | | | | — | | | | — | | | | — | | | | (24,095 | ) |
| | | | | | | | | | | | | | | | | | | | |
Net expenses | | | 36,081,802 | | | | 71,424,827 | | | | 40,068,340 | | | | 2,672,330 | | | | 556,161 | |
| | | | | | | | | | | | | | | | | | | | |
Net investment loss | | | (16,233,373 | ) | | | (42,659,922 | ) | | | (9,032,335 | ) | | | (1,993,908 | ) | | | (111,553 | ) |
| | | | | | | | | | | | | | | | | | | | |
Realized and unrealized gain (loss) on investments: | | | | | | | | | | | | | | | | | | | | |
Net realized gain on investments sold — unaffiliated investments | | | 129,475,399 | | | | 266,242,402 | | | | 39,301,864 | | | | 22,404,976 | | | | 1,433,374 | |
Net realized gain on investments sold — “affiliated” investments | | | 6,583,464 | | | | 41,293,327 | | | | 25,173,819 | | | | — | | | | — | |
Net realized loss on foreign currency transactions | | | (48 | ) | | | (3,237,884 | ) | | | (233 | ) | | | (19,463 | ) | | | — | |
Net change in unrealized appreciation (depreciation) of: | | | | | | | | | | | | | | | | | | | | |
Investments | | | 210,618,057 | | | | 444,455,447 | | | | 404,476,808 | | | | 14,974,548 | | | | 1,583,629 | |
Foreign currency transactions | | | (644 | ) | | | (34,010 | ) | | | 161 | | | | (3,201 | ) | | | — | |
| | | | | | | | | | | | | | | | | | | | |
Net gain on investments | | | 346,676,228 | | | | 748,719,282 | | | | 468,952,419 | | | | 37,356,860 | | | | 3,017,003 | |
| | | | | | | | | | | | | | | | | | | | |
Net increase in net assets resulting from operations | | $ | 330,442,855 | | | $ | 706,059,360 | | | $ | 459,920,084 | | | $ | 35,362,952 | | | $ | 2,905,450 | |
| | | | | | | | | | | | | | | | | | | | |
| | |
| 24 | | See Notes to Financial Statements. |
| | |
| September 30, 2010 | | Baron Funds |
STATEMENTS OF CHANGES IN NET ASSETS
| | | | | | | | | | | | | | | | | | | | | | | | |
| | | Baron Asset Fund | | | Baron Growth Fund | | | Baron Small Cap Fund | |
| | | For the Year
Ended
September 30,
2010 | | | For the Year
Ended
September 30,
2009 | | | For the Year
Ended
September 30,
2010 | | | For the Year
Ended
September 30,
2009 | | | For the Year
Ended
September 30,
2010 | | | For the Year
Ended
September 30,
2009 | |
Increase (Decrease) in Net Assets: | | | | | | | | | | | | | | | | | | | | | | | | |
Operations: | | | | | | | | | | | | | | | | | | | | | | | | |
Net investment loss | | $ | (16,233,373 | ) | | $ | (12,450,114 | ) | | $ | (42,659,922 | ) | | $ | (23,897,639 | ) | | $ | (9,032,335 | ) | | $ | (19,205,044 | ) |
Net realized gain (loss) | | | 136,058,815 | | | | (116,226,621 | ) | | | 304,297,845 | | | | (749,563,878 | ) | | | 64,475,450 | | | | (298,353,154 | ) |
Net change in unrealized appreciation | | | 210,617,413 | | | | (249,681,917 | ) | | | 444,421,437 | | | | 379,850,895 | | | | 404,476,969 | | | | 191,963,047 | |
| | | | | | | | | | | | | | | | | | | | | | | | |
Increase (decrease) in net assets resulting from operations | | | 330,442,855 | | | | (378,358,652 | ) | | | 706,059,360 | | | | (393,610,622 | ) | | | 459,920,084 | | | | (125,595,151 | ) |
| | | | | | | | | | | | | | | | | | | | | | | | |
Distributions to shareholders from: | | | | | | | | | | | | | | | | | | | | | | | | |
Net realized gain on investments | | | — | | | | (159,976,493 | ) | | | — | | | | (5,233,210 | ) | | | — | | | | (151,470 | ) |
| | | | | | | | | | | | | | | | | | | | | | | | |
Decrease in net assets from distributions to shareholders | | | — | | | | (159,976,493 | ) | | | — | | | | (5,233,210 | ) | | | — | | | | (151,470 | ) |
| | | | | | | | | | | | | | | | | | | | | | | | |
Capital share transactions: | | | | | | | | | | | | | | | | | | | | | | | | |
Proceeds from the sale of shares — Retail Shares | | | 223,668,701 | | | | 384,968,070 | | | | 744,810,840 | | | | 1,074,615,478 | | | | 678,413,256 | | | | 591,968,768 | |
Proceeds from the sale of shares — Institutional Shares | | | 75,467,673 | | | | 56,912,251 | | | | 194,483,686 | | | | 39,914,086 | | | | 84,078,870 | | | | 6,056,990 | |
Exchanges-in — Retail Shares | | | 597,096 | | | | 17,760,318 | | | | 1,544,115 | | | | 39,138,545 | | | | 610,680 | | | | 69,663,454 | |
Exchanges-in — Institutional Shares | | | 93,455,534 | | | | 22,568,302 | | | | 368,955,243 | | | | 184,673,530 | | | | 105,154,585 | | | | 78,611,289 | |
Net asset value of shares issued in reinvestment of distributions — Retail Shares | | | — | | | | 155,786,419 | | | | — | | | | 5,042,688 | | | | — | | | | 147,814 | |
Cost of shares redeemed — Retail Shares | | | (667,137,887 | ) | | | (645,461,104 | ) | | | (1,215,140,647 | ) | | | (1,095,812,166 | ) | | | (693,384,493 | ) | | | (601,682,496 | ) |
Cost of shares redeemed — Institutional Shares | | | (29,757,589 | ) | | | (781,702 | ) | | | (132,116,194 | ) | | | (2,424,956 | ) | | | (44,051,534 | ) | | | (1,003,649 | ) |
Exchanges-out — Retail Shares | | | (94,554,660 | ) | | | (30,368,981 | ) | | | (370,105,985 | ) | | | (188,098,850 | ) | | | (106,459,705 | ) | | | (80,810,186 | ) |
Exchanges-out — Institutional Shares | | | (74,268 | ) | | | — | | | | (39,400 | ) | | | — | | | | (20,531 | ) | | | — | |
| | | | | | | | | | | | | | | | | | | | | | | | |
Increase (decrease) in net assets derived from capital share transactions | | | (398,335,400 | ) | | | (38,616,427 | ) | | | (407,608,342 | ) | | | 57,048,355 | | | | 24,341,128 | | | | 62,951,984 | |
| | | | | | | | | | | | | | | | | | | | | | | | |
Increase (decrease) in net assets | | | (67,892,545 | ) | | | (576,951,572 | ) | | | 298,451,018 | | | | (341,795,477 | ) | | | 484,261,212 | | | | (62,794,637 | ) |
| | | | | | | | | | | | | | | | | | | | | | | | |
Net Assets: | | | | | | | | | | | | | | | | | | | | | | | | |
Beginning of year | | | 2,734,891,368 | | | | 3,311,842,940 | | | | 5,273,224,516 | | | | 5,615,019,993 | | | | 2,808,804,331 | | | | 2,871,598,968 | |
| | | | | | | | | | | | | | | | | | | | | | | | |
End of year | | $ | 2,666,998,823 | | | $ | 2,734,891,368 | | | $ | 5,571,675,534 | | | $ | 5,273,224,516 | | | $ | 3,293,065,543 | | | $ | 2,808,804,331 | |
| | | | | | | | | | | | | | | | | | | | | | | | |
Accumulated net investment loss at end of year | | $ | (139 | ) | | $ | — | | | $ | (3,237,884 | ) | | $ | (13 | ) | | $ | (233 | ) | | $ | — | |
| | | | | | | | | | | | | | | | | | | | | | | | |
Capital share transactions — Retail Shares | | | | | | | | | | | | | | | | | | | | | | | | |
Shares sold | | | 4,767,497 | | | | 10,611,429 | | | | 17,713,313 | | | | 33,539,665 | | | | 34,731,191 | | | | 40,627,067 | |
Exchanges-in | | | 12,771 | | | | 471,857 | | | | 37,392 | | | | 1,173,128 | | | | 30,986 | | | | 4,172,125 | |
Shares issued in reinvestment of distributions | | | — | | | | 4,510,598 | | | | — | | | | 152,439 | | | | — | | | | 9,738 | |
Shares redeemed | | | (14,316,865 | ) | | | (17,268,596 | ) | | | (28,949,482 | ) | | | (35,087,955 | ) | | | (35,619,258 | ) | | | (42,166,069 | ) |
Exchanges-out | | | (2,066,609 | ) | | | (1,063,406 | ) | | | (8,740,327 | ) | | | (5,374,331 | ) | | | (5,483,084 | ) | | | (4,787,212 | ) |
| | | | | | | | | | | | | | | | | | | | | | | | |
Net decrease | | | (11,603,206 | ) | | | (2,738,118 | ) | | | (19,939,104 | ) | | | (5,597,054 | ) | | | (6,340,165 | ) | | | (2,144,351 | ) |
| | | | | | | | | | | | | | | | | | | | | | | | |
Capital share transactions — Institutional Shares | | | | | | | | | | | | | | | | | | | | | | | | |
Shares sold | | | 1,627,305 | | | | 1,321,082 | | | | 4,679,328 | | | | 1,046,155 | | | | 4,323,804 | | | | 363,464 | |
Exchanges-in | | | 2,040,449 | | | | 581,079 | | | | 8,697,744 | | | | 5,134,709 | | | | 5,408,587 | | | | 4,666,911 | |
Shares redeemed | | | (638,836 | ) | | | (17,829 | ) | | | (3,119,195 | ) | | | (64,715 | ) | | | (2,253,827 | ) | | | (57,464 | ) |
Exchanges-out | | | (1,573 | ) | | | — | | | | (899 | ) | | | — | | | | (1,116 | ) | | | — | |
| | | | | | | | | | | | | | | | | | | | | | | | |
Net increase | | | 3,027,345 | | | | 1,884,332 | | | | 10,256,978 | | | | 6,116,149 | | | | 7,477,448 | | | | 4,972,911 | |
| | | | | | | | | | | | | | | | | | | | | | | | |
| | |
| See Notes to Financial Statements. | | 25 |
| | |
| Baron Funds | | September 30, 2010 |
STATEMENTS OF CHANGES IN NET ASSETS (Continued)
| | | | | | | | | | | | | | | | |
| | | Baron Opportunity Fund | | | Baron Fifth Avenue Growth Fund | |
| | | For the Year
Ended
September 30,
2010 | | | For the Year
Ended
September 30,
2009 | | | For the Year
Ended
September 30,
2010 | | | For the Year
Ended
September 30,
2009 | |
Increase (Decrease) in Net Assets: | | | | | | | | | | | | | | | | |
Operations: | | | | | | | | | | | | | | | | |
Net investment income (loss) | | $ | (1,993,908 | ) | | $ | (1,142,631 | ) | | $ | (111,553 | ) | | $ | 162,255 | |
Net realized gain (loss) | | | 22,385,513 | | | | (24,998,160 | ) | | | 1,433,374 | | | | (7,753,857 | ) |
Net change in unrealized appreciation | | | 14,971,347 | | | | 31,846,800 | | | | 1,583,629 | | | | 1,291,851 | |
| | | | | | | | | | | | | | | | |
Increase (decrease) in net assets resulting from operations | | | 35,362,952 | | | | 5,706,009 | | | | 2,905,450 | | | | (6,299,751 | ) |
| | | | | | | | | | | | | | | | |
Distributions to shareholders from: | | | | | | | | | | | | | | | | |
Net investment income — Retail Shares | | | — | | | | — | | | | (80,564 | ) | | | (51,146 | ) |
Net investment income — Institutional Shares | | | — | | | | — | | | | (56,411 | ) | | | — | |
Net realized gain on investments — Retail Shares | | | — | | | | — | | | | — | | | | (4,091,158 | ) |
| | | | | | | | | | | | | | | | |
Decrease in net assets from distributions to shareholders | | | — | | | | — | | | | (136,975 | ) | | | (4,142,304 | ) |
| | | | | | | | | | | | | | | | |
Capital share transactions: | | | | | | | | | | | | | | | | |
Proceeds from the sale of shares — Retail Shares | | | 76,648,691 | | | | 13,622,709 | | | | 3,797,699 | | | | 2,307,884 | |
Proceeds from the sale of shares — Institutional Shares | | | 11,338,552 | | | | 2,607,452 | | | | 98,531 | | | | 32,349 | |
Exchanges-in — Retail Shares | | | 2,346,419 | | | | 6,884,725 | | | | 391,801 | | | | 1,550,634 | |
Exchanges-in — Institutional Shares | | | 1,620,688 | | | | 6,888,947 | | | | 101,632 | | | | 8,517,710 | |
Net asset value of shares issued in reinvestment of distributions — Retail Shares | | | — | | | | — | | | | 78,269 | | | | 4,044,741 | |
Net asset value of shares issued in reinvestment of distributions — Institutional Shares | | | — | | | | — | | | | 56,029 | | | | — | |
Cost of shares redeemed — Retail Shares | | | (37,358,968 | ) | | | (29,241,560 | ) | | | (9,721,988 | ) | | | (8,804,624 | ) |
Cost of shares redeemed — Institutional Shares | | | (1,642,355 | ) | | | (1,748 | ) | | | (62,551 | ) | | | (16,304 | ) |
Exchanges-out — Retail Shares | | | (1,978,865 | ) | | | (7,257,555 | ) | | | (461,765 | ) | | | (13,111,717 | ) |
Exchanges-out — Institutional Shares | | | — | | | | — | | | | — | | | | — | |
| | | | | | | | | | | | | | | | |
Increase (decrease) in net assets derived from capital share transactions | | | 50,974,162 | | | | (6,497,030 | ) | | | (5,722,343 | ) | | | (5,479,327 | ) |
Redemption fees | | | 16,915 | | | | 26,680 | | | | — | | | | — | |
| | | | | | | | | | | | | | | | |
Increase (decrease) in net assets | | | 86,354,029 | | | | (764,341 | ) | | | (2,953,868 | ) | | | (15,921,382 | ) |
| | | | | | | | | | | | | | | | |
Net Assets: | | | | | | | | | | | | | | | | |
Beginning of year | | | 153,622,386 | | | | 154,386,727 | | | | 42,322,301 | | | | 58,243,683 | |
| | | | | | | | | | | | | | | | |
End of year | | $ | 239,976,415 | | | $ | 153,622,386 | | | $ | 39,368,433 | | | $ | 42,322,301 | |
| | | | | | | | | | | | | | | | |
Accumulated net investment income (loss) at end of year | | $ | (19,463 | ) | | $ | — | | | $ | — | | | $ | 144,364 | |
| | | | | | | | | | | | | | | | |
Capital share transactions — Retail Shares | | | | | | | | | | | | | | | | |
Shares sold | | | 6,538,844 | | | | 1,632,710 | | | | 424,961 | | | | 286,205 | |
Exchanges-in | | | 206,804 | | | | 758,075 | | | | 44,308 | | | | 250,972 | |
Shares issued in reinvestment of distributions | | | — | | | | — | | | | 9,017 | | | | 576,230 | |
Shares redeemed | | | (3,202,165 | ) | | | (3,744,642 | ) | | | (1,095,227 | ) | | | (1,562,645 | ) |
Exchanges-out | | | (177,533 | ) | | | (793,371 | ) | | | (51,559 | ) | | | (1,347,636 | ) |
| | | | | | | | | | | | | | | | |
Net increase (decrease) | | | 3,365,950 | | | | (2,147,228 | ) | | | (668,500 | ) | | | (1,796,874 | ) |
| | | | | | | | | | | | | | | | |
Capital share transactions — Institutional Shares | | | | | | | | | | | | | | | | |
Shares sold | | | 962,330 | | | | 276,772 | | | | 11,206 | | | | 3,920 | |
Exchanges-in | | | 147,212 | | | | 752,017 | | | | 11,671 | | | | 1,107,181 | |
Shares issued in reinvestment of distributions | | | — | | | | — | | | | 6,463 | | | | — | |
Shares redeemed | | | (142,959 | ) | | | (164 | ) | | | (6,922 | ) | | | (2,255 | ) |
Exchanges-out | | | — | | | | — | | | | — | | | | — | |
| | | | | | | | | | | | | | | | |
Net increase | | | 966,583 | | | | 1,028,625 | | | | 22,418 | | | | 1,108,846 | |
| | | | | | | | | | | | | | | | |
| | |
| 26 | | See Notes to Financial Statements. |
| | |
| September 30, 2010 | | Baron Funds |
NOTES TO FINANCIAL STATEMENTS
1. ORGANIZATION
Baron Investment Funds Trust (the “Trust”) is registered under the Investment Company Act of 1940, as amended (the “1940 Act”), as an open-end management investment company established as a Massachusetts business trust on February 19, 1987. The Trust currently offers five series (individually, a “Fund” and collectively, the “Funds”): Baron Asset Fund, Baron Growth Fund, Baron Small Cap Fund, Baron Opportunity Fund (effective May 20, 2010, Baron iOpportunity Fund was renamed Baron Opportunity Fund) and Baron Fifth Avenue Growth Fund. Prior to October 22, 2004, the name of the Trust was Baron Asset Fund.
Each Fund offers two classes of shares, Retail Shares and Institutional Shares, which differ only in their ongoing fees, expenses and eligibility requirements. Retail Shares are offered to all investors. Institutional Shares are for accounts in the amount of $1 million or more per Fund and are intended for certain financial intermediaries that offer shares through fee based platforms, retirement platforms or other platforms. Each class of shares has equal rights to earnings and assets except that each class bears different expenses for distribution and shareholder servicing. Investment income, realized and unrealized gains or losses on investment and foreign currency, and expenses other than those attributable to a specific class are allocated to each class based on its relative net assets. Each class of shares has exclusive voting rights with respect to matters that affect just that class.
The investment objectives of the Funds are as follows:
Baron Asset Fund seeks capital appreciation through long-term investments primarily in securities of medium-sized companies with undervalued assets or favorable growth prospects. Prior to February 15, 2007, the Fund’s objective was to invest in small- and medium-sized growth companies.
Baron Growth Fund seeks capital appreciation through long-term investments primarily in securities of small-sized growth companies.
Baron Small Cap Fund seeks capital appreciation through investments primarily in securities of small-sized growth companies.
Baron Opportunity Fund seeks capital appreciation through investments primarily in growth companies that benefit from technology advances.
Baron Fifth Avenue Growth Fund seeks capital appreciation through investments primarily in securities of large-sized growth companies.
2. SIGNIFICANT ACCOUNTING POLICIES
The following is a summary of significant accounting policies followed by the Funds. The policies are in conformity with accounting principles generally accepted in the United States of America (“GAAP”). Events occurring subsequent to the date of the Statements of Assets and Liabilities and through the date of the issuance of the financial statements have been evaluated for adjustment to or disclosure in the financial statements.
a) Security Valuation. The Funds’ share prices or net asset values are calculated as of the close of regular session trading (usually 4 p.m. E.T.) on the New York Stock Exchange (“NYSE”) on any day on which the NYSE is open for trading. Portfolio securities traded on any national stock exchange are valued based on the last sale price. For securities traded on NASDAQ, the Funds use the NASDAQ Official Closing Price. Where market quotations are not readily available, or, if in the Adviser’s judgment, they do not accurately reflect the fair value of a security, or an event occurs after the market close but before the Funds are priced that materially affects the value of a security, the securities will be valued by the Adviser using policies and procedures approved by the Board of Trustees (the “Board”). The Adviser has a Fair Valuation Committee (the “Committee”) comprised of senior executives and the Committee reports to the Board every quarter. Factors the Committee considers when valuing a security include whether a current price is stale, there is recent news, the security is thinly traded, transactions are infrequent or quotations are genuine. There can be no guarantee, however, that a fair valuation used by the Funds on any given day will more accurately reflect the market value of an investment than the closing price of such investment in its market. Debt instruments having a remaining maturity greater than sixty days will be valued on the basis of prices obtained from a pricing service approved by the Board or at the mean of the bid and ask prices from the dealer maintaining an active market in that security. Money market instruments held by the Funds with a remaining maturity of sixty days or less are valued at amortized cost, which approximates fair value.
Non-U.S. equity securities are valued on the basis of their most recent closing market prices and translated into U.S. dollars at 4 p.m. E.T., except under the circumstances described below. Most foreign markets close before 4 p.m. E.T. For securities primarily traded in the Far East, for example, the most recent closing prices may be as much as 15 hours old at 4 p.m. E.T. If the Adviser determines that developments between the close of the foreign market and 4 p.m. E.T. will, in its judgment, materially affect the value of some or all of the Funds’ securities, the Adviser will adjust the previous closing prices to reflect what it believes to be the fair value of the securities as of 4 p.m. E.T. In deciding whether to make these adjustments, the Adviser reviews a variety of factors, including developments in foreign markets, the performance of U.S. securities markets, and the performance of instruments trading in U.S. markets that represent non-U.S. securities and baskets of non-U.S. securities. The Adviser may also fair value securities in other situations, for example, when a particular foreign market is closed but the Funds are open. The Adviser uses outside pricing services to provide it with closing market prices and information used for adjusting those prices. The Adviser cannot predict how often it will use closing prices or how often it will adjust those prices. As a means of evaluating its fair value process, the Adviser routinely compares closing market prices, the next day’s opening prices in the same markets, and adjusted prices. Other mutual funds may adjust the prices of their securities by different amounts.
27
| | |
| Baron Funds | | September 30, 2010 |
NOTES TO FINANCIAL STATEMENTS (Continued)
2. SIGNIFICANT ACCOUNTING POLICIES (Continued)
b) Foreign Currency Translations. Values of assets and liabilities denominated in foreign currencies are translated into U.S. dollars using the price of such currencies at the time the net asset value is determined. Purchases and sales of investments and dividend income are converted at the prevailing rate of exchange on the respective dates of such transactions. Net realized gain (loss) on foreign currency transactions include gain (loss) arising from the fluctuation in the exchange rates between trade and settlement dates on security transactions and currency gain (loss) between the accrual and payment dates on dividends and foreign withholding taxes. The Funds do not isolate that portion of the results of operations resulting from changes in foreign exchange rates on investments from the fluctuations arising from changes in market prices of securities held. Such fluctuations are included with the net realized and unrealized gain or loss from investments and foreign currency transactions.
c) Securities Transactions, Investment Income and Expense Allocation. Securities transactions are recorded on a trade date basis. Realized gain and loss from securities transactions are recorded on an identified cost basis for financial reporting and federal income tax purposes. Dividend income is recognized on the ex-dividend date and interest income is recognized on an accrual basis which includes the accretion of discounts and amortization of premiums. Certain dividends from foreign securities will be recorded as soon as the Funds are informed of the dividend if such information is obtained subsequent to the ex-dividend date. Distributions received from certain investments held by the Funds may be comprised of dividends, realized gains and returns of capital. The Funds originally estimate the expected classification of such payments. The amounts may subsequently be reclassified upon receipt of information from the issuer. The Funds are charged for those expenses of the Trust that are directly attributable to each Fund, such as advisory and custodian fees. Expenses that are not directly attributable to a Fund are typically allocated among the Funds in proportion to their respective net assets.
d) Securities Lending. The Funds may lend securities to certain brokers. Upon such loans, the Funds receive collateral which is maintained by the custodian. The Funds earn interest on such collateral and earn income in the form of negotiated lenders’ fees, both of which are included in securities lending income in the Statements of Operations. Securities loaned are required to be secured at all times by collateral equal to at least 102% of the market value of the securities loaned. Risks may arise upon entering into securities lending to the extent that the value of the collateral is less than the value of the securities loaned due to the changes in the value of collateral or the loaned securities. The Funds may receive collateral in the form of cash or other eligible securities, such as a letter of credit issued by a U.S. bank or securities issued or guaranteed by the U.S. government. Securities purchased with cash collateral are subject to the risks inherent in investing in these securities.
At September 30, 2010, Baron Small Cap Fund had securities on loan with a value of $5,672,500 and held $5,750,000 of short-term investments as collateral for these loans. For the year ended September 30, 2010, Baron Small Cap Fund had securities lending income of $251,094 which is included in the Statements of Operations.
e) Repurchase Agreements. The Funds may invest in repurchase agreements, which are short-term investments whereby the Funds acquire ownership of a debt security and the seller agrees to repurchase the security at a future date at a specified price. When entering into repurchase agreements, it is the Funds’ policy that their custodian or a third party custodian take possession of the underlying collateral securities, the market value of which, at all times, equals at least 105% of the principal amount of the repurchase transaction. To the extent that any repurchase transaction exceeds one business day, the value of the collateral is marked-to-market to ensure the adequacy of the collateral. If the seller defaults and the market value of the collateral declines or if bankruptcy proceedings are commenced with respect to the seller of the security, realization of the collateral by the Funds may be delayed or limited.
f) Federal Income Taxes. Each Fund is treated as a separate entity for federal income tax purposes. It is the policy of each Fund to qualify as a regulated investment company under Subchapter M of the Internal Revenue Code and to distribute all of its taxable income, including net realized capital gains, if any, to its shareholders. Therefore, no federal income tax provision is required. The Funds’ tax loss carryforwards from prior years offset most, if not all, net realized capital gains for the fiscal year ended September 30, 2010.
g) Restricted Securities. The Funds may invest in securities which are restricted as to public sale in accordance with the Securities Act of 1933. Such assets are valued by the Adviser pursuant to policies and procedures approved by the Board.
h) Distributions to Shareholders. Income and capital gain distributions to shareholders are determined in accordance with income tax regulations which may differ from GAAP. These differences are primarily due to differing treatments for net investment loss, foreign currency gains and losses, partnership basis adjustments and wash sale losses deferred.
i) Use of Estimates. The preparation of financial statements in accordance with GAAP requires management to make estimates and assumptions that affect the reported amounts of assets and liabilities at the date of the financial statements and the amounts of income and expenses during the period. Actual results could differ from those estimates.
j) Commitments and Contingencies. In the normal course of business, the Funds may enter into contracts and agreements that contain a variety of representations and warranties, which provide general indemnification. The maximum exposure to the Funds under these agreements is unknown, as this
28
| | |
| September 30, 2010 | | Baron Funds |
NOTES TO FINANCIAL STATEMENTS (Continued)
2. SIGNIFICANT ACCOUNTING POLICIES (Continued)
would involve future claims that may be made against the Funds that have not yet occurred. However, based on experience, the Funds expect the risk of loss to be remote.
k) Cash and Cash Equivalents. The Funds consider all short term liquid investments with a maturity of three months or less when purchased to be cash equivalents.
l) Foreign Taxes. The Funds may be subject to foreign taxes on income, gains on investments or currency repatriation, a portion of which may be recoverable. The Funds will accrue such taxes and recoveries as applicable, based upon their current interpretation of tax rules and regulations that exist in the markets in which they invest.
m) Short-term Trading Fee. Prior to February 19, 2010, Baron Opportunity Fund imposed a 1% short-term trading fee on redemptions and exchanges of shares held for less than six months. The fee was retained by Baron Opportunity Fund for the benefit of the remaining shareholders to offset the administrative costs associated with processing redemptions and exchanges and to offset the portfolio transaction costs and facilitate portfolio management. The fee was accounted for as an addition to paid-in capital.
3. PURCHASES AND SALES OF SECURITIES
Purchases and sales of securities, other than short term securities, for the year ended September 30, 2010 were as follows:
| | | | | | | | |
| Fund | | Purchases | | | Sales | |
Baron Asset Fund | | $ | 348,434,955 | | | $ | 701,305,299 | |
Baron Growth Fund | | | 855,520,609 | | | | 943,860,914 | |
Baron Small Cap Fund | | | 874,609,809 | | | | 794,009,058 | |
Baron Opportunity Fund | | | 179,820,588 | | | | 135,150,460 | |
Baron Fifth Avenue Growth Fund | | | 23,751,453 | | | | 29,224,511 | |
4. INVESTMENT ADVISORY FEES AND OTHER TRANSACTIONS WITH AFFILIATES
a) Investment Advisory Fees. BAMCO, Inc. (the “Adviser”), a wholly owned subsidiary of Baron Capital Group, Inc. (“BCG”), serves as investment adviser to the Funds. As compensation for services rendered, the Adviser receives a fee payable monthly from Baron Asset Fund, Baron Growth Fund, Baron Small Cap Fund and Baron Opportunity Fund equal to 1% per annum of the average daily net assets of the respective Funds. Effective May 20, 2010, Baron Fifth Avenue Growth Fund reduced the management fee it pays to the Adviser. The reduced management fee is as follows: 0.90% per annum for daily net assets under $1 billion, 0.85% per annum for daily net assets greater than $1 billion but less than $2 billion and 0.80% per annum for daily net assets greater than $2 billion. Prior to May 20, 2010, Baron Fifth Avenue Growth Fund paid the Adviser 1% per annum for daily net assets under $1 billion, 0.95% per annum for daily net assets greater than $1 billion but less than $2 billion, 0.90% per annum for daily net assets over $2 billion but less than $3 billion, 0.85% per annum for daily net assets over $3 billion but less than $4 billion, and 0.80% per annum for daily net assets greater than $4 billion. For Baron Opportunity Fund and Baron Fifth Avenue Growth Fund, the Adviser has contractually agreed to reduce its fee, until January 28, 2011, to the extent required to limit the net operating expense ratio (excluding portfolio transaction costs, interest and extraordinary expenses) to 1.50% and 1.30% of average daily net assets of the Retail Shares, and 1.25% and 1.05% of average daily net assets of the Institutional Shares, respectively. Prior to May 20, 2010, the Adviser had contractually agreed for Baron Fifth Avenue Growth Fund, to reduce its fee to limit the net operating expense ratio to 1.40% for the Retail Shares and 1.15% for the Institutional Shares.
b) Distribution Fees. Baron Capital, Inc. (“BCI”), a wholly owned subsidiary of BCG, is a registered broker-dealer and the distributor of the Retail Shares pursuant to a distribution plan under Rule 12b-1 of the 1940 Act. The distribution plan authorizes the Funds to pay BCI a distribution fee payable monthly equal to 0.25% per annum of the Retail Shares’ average daily net assets of the respective Funds.
c) Trustee Fees. Certain Trustees of the Trust may be deemed to be affiliated with, or interested persons (as defined by the 1940 Act) of the Funds’ Adviser or of BCI. None of the Trustees so affiliated received compensation for his or her services as a Trustee of the Trust. None of the Funds’ officers received compensation from the Funds in that capacity.
d) Fund Accounting and Administration Fees. The Funds have entered into an agreement with State Street Bank and Trust Company (the “Custodian”) to perform accounting and certain administrative services. The Custodian is compensated for fund accounting based on a percentage of the Funds’ net assets, subject to certain minimums plus fixed annual fees for the administrative services.
29
| | |
| Baron Funds | | September 30, 2010 |
NOTES TO FINANCIAL STATEMENTS (Continued)
5. LINE OF CREDIT
The Funds participate in a committed line of credit agreement with the Custodian to be used for temporary purposes, primarily for financing redemptions. Each Fund may borrow up to the lesser of $100 million or the maximum amount each Fund may borrow under the 1940 Act, the limitations included in each Fund’s prospectus, or any limit or restriction under any law or regulation to which each Fund is subject or any agreement to which each Fund is a party; provided that the aggregate outstanding principal amount of all loans to any of the Funds may not exceed $100 million. Interest is charged to each Fund, based on its borrowings, at a rate per annum equal to the higher of the Federal Funds Rate or the Overnight Libor Rate plus a margin of 1.00%. A commitment fee of 0.12% per annum is incurred on the unused portion of the line of credit and is allocated to the participating Funds. During the year ended September 30, 2010, there were no loans outstanding under the line of credit.
6. RESTRICTED SECURITIES
At September 30, 2010, investments in securities included securities that are restricted and/or illiquid. Restricted securities are often purchased in private placement transactions, are not registered under the Securities Act of 1933, may have contractual restrictions on resale and are valued pursuant to the policies and procedures for fair value pricing approved by the Board. A security may be considered illiquid if it lacks a readily available market or if its valuation has not changed for a certain period of time. The Funds may receive more or less than this valuation in an actual sale and that difference could be material. At September 30, 2010, the Funds held investments in restricted and/or illiquid securities that were valued pursuant to policies and procedures for fair value pricing as follows:
| | | | | | | | |
| | | Baron Asset Fund | |
| Name of Issuer | | Acquisition
Date | | | Value | |
Private Equity Investments | | | | | | | | |
Kerzner Intl. Holdings, Ltd., Cl A | | | 09/27/06 | | | $ | 15,600,000 | |
Windy City Investments Holdings LLC | | | 11/13/07 | | | | 21,280,013 | |
| | | | | | | | |
Total Restricted Securities: | | | | | | | | |
(Cost $83,960,710) (1.38% of Net Assets) | | | | | | $ | 36,880,013 | |
| | | | | | | | |
| | | Baron Growth Fund | |
| Name of Issuer | | Acquisition
Date | | | Value | |
Private Equity Investments | | | | | | | | |
Kerzner Intl. Holdings, Ltd., Cl A | | | 09/27/06 | | | $ | 22,200,000 | |
Windy City Investments Holdings LLC | | | 11/13/07 | | | | 7,163,000 | |
| | | | | | | | |
Total Restricted Securities: | | | | | | | | |
(Cost $81,748,686) (0.53% of Net Assets) | | | | | | $ | 29,363,000 | |
| | | | | | | | |
| | | | | | | | |
| | | Baron Small Cap Fund | |
| Name of Issuer | | Acquisition
Date | | | Value | |
Common Stocks | | | | | | | | |
Chesapeake Lodging Trust | | | 01/21/10 | | | $ | 14,456,848 | |
Private Equity Investments | | | | | | | | |
Kerzner Intl. Holdings, Ltd., Cl A | | | 09/27/06 | | | | 10,500,000 | |
| | | | | | | | |
Total Restricted Securities: | | | | | | | | |
(Cost $51,955,006) (0.76% of Net Assets) | | | | | | $ | 24,956,848 | |
| | | | | | | | |
30
| | |
| September 30, 2010 | | Baron Funds |
NOTES TO FINANCIAL STATEMENTS (Continued)
6. RESTRICTED SECURITIES (Continued)
| | | | | | | | |
| | | Baron Opportunity Fund | |
| Name of Issuer | | Acquisition
Date | | | Value | |
Warrants | | | | | | | | |
Loudeye Corp.
Warrants, Exp 12/23/2010 | | | 12/22/04 | | | $ | 0 | |
| | | | | | | | |
Total Restricted Securities: | | | | | | | | |
(Cost $0) (0.00% of Net Assets) | | | | | | $ | 0 | |
| | | | | | | | |
7. FAIR VALUE MEASUREMENTS
Fair value is defined by GAAP as the price that the Funds would receive upon selling an investment in a timely transaction to an independent buyer in the principal or most advantageous market for the investment. GAAP provides a three-tier hierarchy to maximize the use of observable market data and minimize the use of unobservable inputs and to establish classification of fair value measurements for disclosure purposes. Inputs refer broadly to the assumptions that market participants would use in pricing the asset or liability. Inputs may be observable or unobservable. Observable inputs are based on market data obtained from sources independent of the Funds. Unobservable inputs are inputs that reflect the Funds’ own assumptions based on the best information available in the circumstances. The three-tier hierarchy of inputs is summarized in the three broad Levels listed below.
| | • | | Level 1 — quoted prices in active markets for identical investments |
| | • | | Level 2 — other significant observable inputs (including quoted prices for similar investments, for non-U.S. securities that may be fair valued, repurchase agreements, etc.) |
| | • | | Level 3 — significant unobservable inputs (including the Funds’ own assumptions in determining the fair value of investments) |
The inputs or methodology used for valuing securities are not necessarily an indication of the risk associated with investing in those securities. For example, non-U.S. securities, whose markets close hours before the Funds value their holdings, may require revised valuations due to significant movement in the U.S. markets. Since these values are not obtained from quoted prices in an active market such securities are reflected as Level 2.
The following is a summary of the inputs used as of September 30, 2010 in valuing the Funds’ investments carried at fair value:
| | | | | | | | | | | | | | | | |
| | | Baron Asset Fund | |
| Description | | Quoted Prices in
Active Markets
for Identical
Assets
(Level 1) | | | Other
Significant
Observable
Inputs
(Level 2) | | | Significant
Unobservable
Inputs
(Level 3) | | | Total | |
Common Stocks† | | $ | 2,590,202,134 | | | $ | — | | | $ | — | | | $ | 2,590,202,134 | |
Private Equity Investments† | | | — | | | | — | | | | 36,880,013 | | | | 36,880,013 | |
Short Term Investments | | | — | | | | 50,560,338 | | | | — | | | | 50,560,338 | |
| | | | | | | | | | | | | | | | |
Total Investments | | $ | 2,590,202,134 | | | $ | 50,560,338 | | | $ | 36,880,013 | | | $ | 2,677,642,485 | |
| | | | | | | | | | | | | | | | |
| | | | | | | | | | | | | | | | |
| | | Baron Growth Fund | |
| Description | | Quoted Prices in
Active Markets
for Identical
Assets (Level 1) | | | Other Significant Observable Inputs (Level 2) | | | Significant Unobservable Inputs (Level 3) | | | Total | |
Common Stocks† | | $ | 5,502,083,251 | | | $ | 24,750,000 | | | $ | — | | | $ | 5,526,833,251 | |
Private Equity Investments† | | | — | | | | — | | | | 29,363,000 | | | | 29,363,000 | |
Warrants | | | — | | | | 513,165 | | | | — | | | | 513,165 | |
| | | | | | | | | | | | | | | | |
Total Investments | | $ | 5,502,083,251 | | | $ | 25,263,165 | | | $ | 29,363,000 | | | $ | 5,556,709,416 | |
| | | | | | | | | | | | | | | | |
| † | See Statements of Net Assets for additional detailed categorizations. |
31
| | |
| Baron Funds | | September 30, 2010 |
NOTES TO FINANCIAL STATEMENTS (Continued)
7. FAIR VALUE MEASUREMENTS (Continued)
| | | | | | | | | | | | | | | | |
| | | Baron Small Cap Fund | |
| Description | | Quoted Prices in
Active Markets
for Identical
Assets (Level 1) | | | Other Significant Observable Inputs
(Level 2) | | | Significant Unobservable Inputs
(Level 3) | | | Total | |
Common Stocks† | | $ | 3,126,690,423 | | | $ | 39,206,848 | | | $ | — | | | $ | 3,165,897,271 | |
Private Equity Investments | | | — | | | | — | | | | 10,500,000 | | | | 10,500,000 | |
Warrants | | | — | | | | 513,165 | | | | — | | | | 513,165 | |
Short Term Investments | | | — | | | | 121,636,011 | | | | — | | | | 121,636,011 | |
| | | | | | | | | | | | | | | | |
Total Investments | | $ | 3,126,690,423 | | | $ | 161,356,024 | | | $ | 10,500,000 | | | $ | 3,298,546,447 | |
| | | | | | | | | | | | | | | | |
| | | | | | | | | | | | | | | | |
| | | Baron Opportunity Fund | |
| Description | | Quoted Prices in
Active Markets
for Identical
Assets
(Level 1) | | | Other
Significant
Observable
Inputs
(Level 2) | | | Significant
Unobservable
Inputs
(Level 3) | | | Total | |
Common Stocks† | | $ | 226,414,562 | | | $ | — | | | $ | — | | | $ | 226,414,562 | |
Warrants | | | — | | | | 0 | | | | — | | | | 0 | |
Short Term Investments | | | — | | | | 16,063,325 | | | | — | | | | 16,063,325 | |
| | | | | | | | | | | | | | | | |
Total Investments | | $ | 226,414,562 | | | $ | 16,063,325 | | | $ | — | | | $ | 242,477,887 | |
| | | | | | | | | | | | | | | | |
| | | | | | | | | | | | | | | | |
| | | Baron Fifth Avenue Growth Fund | |
| Description | | Quoted Prices in
Active Markets
for Identical
Assets
(Level 1) | | | Other Significant Observable Inputs
(Level 2) | | | Significant Unobservable Inputs
(Level 3) | | | Total | |
Common Stocks† | | $ | 38,498,504 | | | $ | — | | | $ | — | | | $ | 38,498,504 | |
Short Term Investments | | | — | | | | 856,590 | | | | — | | | | 856,590 | |
| | | | | | | | | | | | | | | | |
Total Investments | | $ | 38,498,504 | | | $ | 856,590 | | | $ | — | | | $ | 39,355,094 | |
| | | | | | | | | | | | | | | | |
| † | See Statements of Net Assets for additional detailed categorizations. |
The following is a reconciliation of investments in which significant unobservable inputs (Level 3) were used in determining fair value:
| | | | | | | | | | | | | | | | | | | | | | | | | | | | | | | | |
| | | Baron Asset Fund | |
Investments in
Securities | | Balance as of
September 30,
2009 | | | Accrued
Premiums/
Discounts | | | Net
Realized
Gain
(Loss) | | | Net Change in
Unrealized
Appreciation
(Depreciation) | | | Net
Purchases
(Sales) | | | Net
Transfers
In (Out) | | | Balance as of
September 30,
2010 | | | Change in Net
Unrealized
Appreciation
(Depreciation)
from Investments
still held at
September 30,
2010 | |
Private Equity Investments | | | | | | | | | | | | | | | | | | | | | | | | | | | | | | | | |
Consumer
Discretionary | | $ | 20,800,000 | | | $ | — | | | $ | (757,901 | ) | | $ | (4,399,993 | ) | | $ | (42,106 | ) | | $ | — | | | $ | 15,600,000 | | | $ | (5,200,000 | ) |
Financials | | | 11,200,007 | | | | — | | | | — | | | | 10,080,006 | | | | — | | | | — | | | | 21,280,013 | | | | 10,080,006 | |
| | | | | | | | | | | | | | | | | | | | | | | | | | | | | | | | |
Total | | $ | 32,000,007 | | | $ | — | | | $ | (757,901 | ) | | $ | 5,680,013 | | | $ | (42,106 | ) | | $ | — | | | $ | 36,880,013 | | | $ | 4,880,006 | |
| | | | | | | | | | | | | | | | | | | | | | | | | | | | | | | | |
32
| | |
| September 30, 2010 | | Baron Funds |
NOTES TO FINANCIAL STATEMENTS (Continued)
7. FAIR VALUE MEASUREMENTS (Continued)
| | | | | | | | | | | | | | | | | | | | | | | | | | | | | | | | |
| | | Baron Growth Fund | |
Investments in
Securities | | Balance as of
September 30,
2009 | | | Accrued
Premiums/
Discounts | | | Net
Realized
Gain
(Loss) | | | Net Change in
Unrealized
Appreciation
(Depreciation) | | | Net
Purchases
(Sales) | | | Net
Transfers
In (Out) | | | Balance as of
September 30,
2010 | | | Change in Net
Unrealized
Appreciation
(Depreciation)
from Investments
still held at
September 30,
2010 | |
Private Equity Investments | | | | | | | | | | | | | | | | | | | | | | | | | | | | | | | | |
Consumer
Discretionary | | $ | 29,600,000 | | | $ | — | | | $ | — | | | $ | (7,400,000 | ) | | $ | — | | | $ | — | | | $ | 22,200,000 | | | $ | (7,400,000 | ) |
Financials | | | 3,770,000 | | | | — | | | | — | | | | 3,393,000 | | | | — | | | | — | | | | 7,163,000 | | | | 3,393,000 | |
| | | | | | | | | | | | | | | | | | | | | | | | | | | | | | | | |
Total | | $ | 33,370,000 | | | $ | — | | | $ | — | | | $ | (4,007,000 | ) | | $ | — | | | $ | — | | | $ | 29,363,000 | | | $ | (4,007,000 | ) |
| | | | | | | | | | | | | | | | | | | | | | | | | | | | | | | | |
| | | | | | | | | | | | | | | | | | | | | | | | | | | | | | | | |
| | | Baron Small Cap Fund | |
Investments in
Securities | | Balance as of
September 30,
2009 | | | Accrued
Premiums/
Discounts | | | Net
Realized
Gain
(Loss) | | | Net Change in
Unrealized
Appreciation
(Depreciation) | | | Net
Purchases
(Sales) | | | Net
Transfers
In (Out) | | | Balance as of
September 30,
2010 | | | Change in Net
Unrealized
Appreciation
(Depreciation)
from Investments
still held at
September 30,
2010 | |
Private Equity
Investments | | | | | | | | | | | | | | | | | | | | | | | | | | | | | |
Consumer
Discretionary | | $ | 14,000,000 | | | $ | — | | | $ | — | | | $ | (3,500,000 | ) | | $ | — | | | $ | — | | | $ | 10,500,000 | | | $ | (3,500,000 | ) |
| | | | | | | | | | | | | | | | | | | | | | | | | | | | | | | | |
8. INCOME TAXES AND DISTRIBUTIONS TO SHAREHOLDERS
Federal income tax regulations differ from GAAP. Therefore, distributions determined in accordance with tax regulations may differ in amount or character from net investment income and net realized gain for financial reporting purposes. Net investment income (loss) and net realized and unrealized gain (loss) differ for financial statement and tax purposes due to differing treatments of wash sale losses deferred, foreign currency gains and losses and net investment loss. Financial reporting records are adjusted for permanent book/tax differences to reflect tax character. Financial records are not adjusted for temporary differences.
For the year ended September 30, 2010, the Funds recorded the following permanent reclassifications to reflect tax character. Reclassifications between income, gains and paid-in capital relate primarily to the tax treatment of net investment loss, foreign currency gains and losses and partnership basis adjustments. Results of operations and net assets were not affected by these reclassifications.
| | | | | | | | | | | | |
| Fund | | Undistributed Net Investment Income | | | Accumulated Realized Gain/(Loss) | | | Paid-In
Capital | |
Baron Asset Fund | | $ | 16,233,234 | | | $ | (19,477 | ) | | $ | (16,213,757 | ) |
Baron Growth Fund | | | 39,422,051 | | | | 5,352,919 | | | | (44,774,970 | ) |
Baron Small Cap Fund | | | 9,032,102 | | | | (1,133,672 | ) | | | (7,898,430 | ) |
Baron Opportunity Fund | | | 1,974,445 | | | | 19,465 | | | | (1,993,910 | ) |
Baron Fifth Avenue Growth Fund | | | 104,164 | | | | (65,141 | ) | | | (39,023 | ) |
33
| | |
| Baron Funds | | September 30, 2010 |
NOTES TO FINANCIAL STATEMENTS (Continued)
8. INCOME TAXES AND DISTRIBUTIONS TO SHAREHOLDERS (Continued)
As of September 30, 2010, the components of net assets on a tax basis were as follows:
| | | | | | | | | | | | | | | | | | | | |
| | | Baron Asset
Fund | | | Baron Growth
Fund | | | Baron
Small Cap
Fund | | | Baron
Opportunity
Fund | | | Baron Fifth
Avenue Growth
Fund | |
Cost of investments | | $ | 1,764,470,410 | | | $ | 3,615,727,036 | | | $ | 2,463,163,029 | | | $ | 195,498,224 | | | $ | 32,992,720 | |
| | | | | | | | | | | | | | | | | | | | |
Gross tax unrealized appreciation | | | 1,002,036,584 | | | | 2,055,122,757 | | | | 1,018,390,227 | | | | 50,921,961 | | | | 7,253,236 | |
Gross tax unrealized depreciation | | | (88,864,509 | ) | | | (114,140,377 | ) | | | (183,006,809 | ) | | | (3,942,298 | ) | | | (890,862 | ) |
| | | | | | | | | | | | | | | | | | | | |
Net tax unrealized appreciation (depreciation) | | | 913,172,075 | | | | 1,940,982,380 | | | | 835,383,418 | | | | 46,979,663 | | | | 6,362,374 | |
Net tax unrealized currency appreciation (depreciation) | | | (644 | ) | | | (34,010 | ) | | | — | | | | (3,201 | ) | | | — | |
Accumulated net realized gain (loss) | | | 20,210,363 | | | | — | | | | — | | | | — | | | | — | |
Post October capital/currency loss deferral | | | (139 | ) | | | (3,237,884 | ) | | | (233 | ) | | | (19,463 | ) | | | — | |
Capital loss carryforwards | | | — | | | | (638,770,139 | ) | | | (224,574,006 | ) | | | (31,930,138 | ) | | | (6,662,628 | ) |
Paid-in capital | | | 1,733,617,168 | | | | 4,272,735,187 | | | | 2,682,256,364 | | | | 224,949,554 | | | | 39,668,687 | |
| | | | | | | | | | | | | | | | | | | | |
Net Assets | | $ | 2,666,998,823 | | | $ | 5,571,675,534 | | | $ | 3,293,065,543 | | | $ | 239,976,415 | | | $ | 39,368,433 | |
| | | | | | | | | | | | | | | | | | | | |
As of September 30, 2010, the Funds had capital loss carryforwards expiring as follows:
| | | | | | | | | | | | | | | | | | | | |
| | | Baron Asset
Fund | | | Baron Growth
Fund | | | Baron
Small Cap
Fund | | | Baron
Opportunity
Fund | | | Baron Fifth
Avenue Growth
Fund | |
September 30, 2011 | | $ | — | | | $ | — | | | $ | — | | | $ | 19,968,339 | | | $ | — | |
September 30, 2017 | | | — | | | | 343,959,998 | | | | 64,973,001 | | | | 11,961,799 | | | | 924,163 | |
September 30, 2018 | | | — | | | | 294,810,141 | | | | 159,601,005 | | | | — | | | | 5,738,465 | |
| | | | | | | | | | | | | | | | | | | | |
| | $ | — | | | $ | 638,770,139 | | | $ | 224,574,006 | | | $ | 31,930,138 | | | $ | 6,662,628 | |
| | | | | | | | | | | | | | | | | | | | |
Capital loss carryforward utilized during the year ended September 30, 2010 | | $ | 36,507,458 | | | $ | — | | | $ | — | | | $ | 10,383,006 | | | $ | — | |
| | | | | | | | | | | | | | | | | | | | |
The tax character of distributions paid during the fiscal years ended September 30, 2010 and September 30, 2009 was as follows:
| | | | | | | | | | | | | | | | |
| | | Year Ended
September 30, 2010 | | | Year Ended
September 30, 2009 | |
| Fund | | Ordinary1 | | | Long Term
Capital Gain | | | Ordinary1 | | | Long Term
Capital Gain | |
Baron Asset Fund | | $ | — | | | $ | — | | | $ | — | | | $ | 159,976,493 | |
Baron Growth Fund | | | — | | | | — | | | | — | | | | 5,233,210 | |
Baron Small Cap Fund | | | — | | | | — | | | | — | | | | 151,470 | |
Baron Opportunity Fund | | | — | | | | — | | | | — | | | | — | |
Baron Fifth Avenue Growth Fund | | | 136,975 | | | | — | | | | 51,146 | | | | 4,091,158 | |
| 1 | For tax purposes, short-term capital gains are considered ordinary income distributions. |
The Funds follow the provisions of the FASB Codification Section 740 (“ASC Section 740”) “Accounting for Uncertainty in Income Taxes” which clarifies the accounting for uncertainty in tax positions taken or expected to be taken on a tax return. ASC Section 740 sets forth a threshold for financial statement recognition, measurement and disclosure of tax positions taken or expected to be taken on a tax return. The Funds are required to recognize the tax effects of certain tax positions under a “more likely than not” standard, that based on their technical merits, have more than 50 percent likelihood of being sustained upon examination. Management has analyzed the tax positions taken on the Funds’ federal income tax returns for all open years (current and prior three years), and has concluded that no provision for federal income tax is required in the Funds’ financial statements. At September 30, 2010, the Funds did not have any unrecognized tax benefits in the accompanying financial statements. The Funds’ federal, state and local income and federal excise tax returns for which the applicable statutes of limitations have not expired are subject to examination by the Internal Revenue Service and state departments of revenue.
34
| | |
| September 30, 2010 | | Baron Funds |
NOTES TO FINANCIAL STATEMENTS (Continued)
9. TRANSACTIONS IN “AFFILIATED” COMPANIES1
BARON ASSET FUND
| | | | | | | | | | | | | | | | | | | | | | | | |
| Name of Issuer | | Balance of
Shares Held on September 30,
2009 | | | Gross
Purchases and
Additions | | | Gross Sales
and
Reductions | | | Balance of
Shares Held on September 30,
2010 | | | Fair
Value
September 30,
2010 | | | Dividend Income For the Year ended
September 30,
2010 | |
Apollo International, Inc. S-A Conv. Pfd.4 | | | 105,264 | | | | — | | | | 105,264 | | | | — | | | $ | — | | | $ | — | |
Vail Resorts, Inc. | | | 2,236,741 | | | | — | | | | 437,541 | | | | 1,799,200 | | | | 67,505,984 | | | | — | |
| | | | | | | | | | | | | | | | | | | | | | | | |
Total investments in “affiliated” companies (2.53% of Net Assets) | | | $ | 67,505,984 | | | $ | — | |
| | | | | | | | | | | | | | | | | | | | | | | | |
BARON GROWTH FUND
| | | | | | | | | | | | | | | | | | | | | | | | |
| Name of Issuer | | Balance of
Shares Held on September 30,
2009 | | | Gross
Purchases and
Additions | | | Gross Sales
and
Reductions | | | Balance of
Shares
Held on
September 30,
2010 | | | Fair
Value
September 30,
2010 | | | Dividend Income
For the Year ended
September 30,
2010 | |
AMERIGROUP Corp. | | | 2,625,000 | | | | — | | | | — | | | | 2,625,000 | | | $ | 111,483,750 | | | $ | — | |
Blue Nile, Inc. | | | 800,000 | | | | 305,000 | | | | — | | | | 1,105,000 | | | | 49,161,450 | | | | — | |
Choice Hotels Intl., Inc. | | | 3,000,000 | | | | — | | | | — | | | | 3,000,000 | | | | 109,380,000 | | | | 2,220,000 | |
DeVry, Inc. | | | 3,650,000 | | | | — | | | | 25,000 | | | | 3,625,000 | | | | 178,386,250 | | | | 730,000 | |
Denbury Resources, Inc. (formerly Encore Acquisition Co.)3 | | | 2,800,000 | | | | — | | | | 2,800,000 | | | | — | | | | — | | | | — | |
Peet’s Coffee & Tea, Inc. | | | 700,000 | | | | 100,000 | | | | — | | | | 800,000 | | | | 27,384,000 | | | | — | |
SEACOR Holdings, Inc.2 | | | 1,100,000 | | | | — | | | | 100,000 | | | | 1,000,000 | | | | — | | | | — | |
Strayer Education, Inc.2 | | | 700,000 | | | | — | | | | 25,000 | | | | 675,000 | | | | — | | | | 2,100,000 | |
Vail Resorts, Inc. | | | 1,900,000 | | | | — | | | | — | | | | 1,900,000 | | | | 71,288,000 | | | | — | |
| | | | | | | | | | | | | | | | | | | | | | | | |
Total investments in “affiliated” companies (9.82% of Net Assets) | | | $ | 547,083,450 | | | $ | 5,050,000 | |
| | | | | | | | | | | | | | | | | | | | | | | | |
BARON SMALL CAP FUND
| | | | | | | | | | | | | | | | | | | | | | | | |
| Name of Issuer | | Balance of
Shares
Held on
September 30,
2009 | | | Gross
Purchases and
Additions | | | Gross Sales
and
Reductions | | | Balance of
Shares
Held on
September 30,
2010 | | | Fair
Value
September 30,
2010 | | | Dividend Income
For the
Year ended
September 30,
2010 | |
AeroVironment, Inc. | | | 1,000,000 | | | | 150,000 | | | | 1,150,000 | | | | — | | | $ | — | | | $ | — | |
Chesapeake Lodging Trust | | | — | | | | 901,862 | | | | — | | | | 901,862 | | | | 14,456,848 | | | | — | |
Coresite Realty Corp. | | | — | | | | 1,051,974 | | | | — | | | | 1,051,974 | | | | 17,241,854 | | | | — | |
GeoResources, Inc.2 | | | — | | | | 1,100,000 | | | | 600,000 | | | | 500,000 | | | | — | | | | — | |
Great Wolf Resorts, Inc. | | | 3,060,000 | | | | — | | | | — | | | | 3,060,000 | | | | 5,814,000 | | | | — | |
Huron Consulting Group, Inc. | | | 1,250,000 | | | | — | | | | — | | | | 1,250,000 | | | | 27,487,500 | | | | — | |
Iconix Brand Group, Inc. | | | 3,750,000 | | | | 150,000 | | | | — | | | | 3,900,000 | | | | 68,250,000 | | | | — | |
Mistras Group, Inc. | | | — | | | | 1,750,000 | | | | — | | | | 1,750,000 | | | | 20,265,000 | | | | — | |
National CineMedia, Inc.2 | | | 2,400,000 | | | | 250,000 | | | | — | | | | 2,650,000 | | | | — | | | | 1,706,150 | |
Orion Marine Group, Inc. | | | 1,100,000 | | | | 300,000 | | | | — | | | | 1,400,000 | | | | 17,374,000 | | | | — | |
Rubicon Technology, Inc.2 | | | 1,915,995 | | | | — | | | | 915,995 | | | | 1,000,000 | | | | — | | | | — | |
Stanley, Inc. | | | 1,350,000 | | | | — | | | | 1,350,000 | | | | — | | | | — | | | | — | |
Vitacost.com, Inc. | | | 800,000 | | | | 1,525,000 | | | | — | | | | 2,325,000 | | | | 13,973,250 | | | | — | |
| | | | | | | | | | | | | | | | | | | | | | | | |
Total investments in “affiliated” companies (5.61% of Net Assets) | | | | | | | | | | | $ | 184,862,452 | | | $ | 1,706,150 | |
| | | | | | | | | | | | | | | | | | | | | | | | |
| 1 | An “Affiliated” Company, as defined in the 1940 Act, is a company in which a Fund held 5% or more of the company’s outstanding voting securities at any time during the year ended September 30, 2010. |
| 2 | As of September 30, 2010, no longer an affiliate. |
| 4 | Decrease due to dissolution. |
35
| | |
| Baron Funds | | September 30, 2010 |
FINANCIAL HIGHLIGHTS
BARON ASSET FUND
Selected data for a share outstanding throughout each period:
| | | | | | | | | | | | | | | | | | | | | | | | | | | | | | | | | | | | | | | | | | | | | | | | |
| | | RETAIL SHARES | | | INSTITUTIONAL
SHARES | |
| | | Year Ended September 30, | | | Year Ended
September 30, | |
| | | 2010 | | | 2009 | | | 2008 | | | 2007 | | | 2006 | | | 2005 | | | 2004 | | | 2003 | | | 2002 | | | 2001 | | | 2010 | | | 20093 | |
| | | | | | | | | | | | |
Net asset value, beginning of year | | $ | 43.62 | | | $ | 52.12 | | | $ | 66.57 | | | $ | 60.08 | | | $ | 56.52 | | | $ | 47.89 | | | $ | 40.05 | | | $ | 35.65 | | | $ | 40.22 | | | $ | 63.35 | | | $ | 43.65 | | | $ | 37.38 | |
| | | | | | | | | | | | | | | | | | | | | | | | | | | | | | | | | | | | | | | | | | | | | | | | |
| | | | | | | | | | | | |
Income (loss) from
investment operations: | | | | | | | | | | | | | | | | | | | | | | | | | | | | | | | | | | | | | | | | | | | | | | | | |
Net investment loss | | | (0.28 | )1 | | | (0.20 | )1 | | | (0.29 | )1 | | | (0.10 | )1 | | | (0.27 | ) | | | (0.46 | ) | | | (0.43 | ) | | | (0.46 | ) | | | (0.55 | ) | | | (0.65 | ) | | | (0.15 | )1 | | | (0.05 | )1 |
Net realized and unrealized gain (loss) on investments | | | 5.93 | | | | (5.68 | ) | | | (12.08 | ) | | | 11.27 | | | | 6.64 | | | | 12.08 | | | | 8.27 | | | | 6.04 | | | | 0.05 | | | | (17.87 | ) | | | 5.93 | | | | 6.32 | |
| | | | | | | | | | | | | | | | | | | | | | | | | | | | | | | | | | | | | | | | | | | | | | | | |
Total from
investment operations | | | 5.65 | | | | (5.88 | ) | | | (12.37 | ) | | | 11.17 | | | | 6.37 | | | | 11.62 | | | | 7.84 | | | | 5.58 | | | | (0.50 | ) | | | (18.52 | ) | | | 5.78 | | | | 6.27 | |
| | | | | | | | | | | | | | | | | | | | | | | | | | | | | | | | | | | | | | | | | | | | | | | | |
| | | | | | | | | | | | |
Less distributions to
shareholders from: | | | | | | | | | | | | | | | | | | | | | | | | | | | | | | | | | | | | | | | | | | | | | | | | |
Net investment income | | | 0.00 | | | | 0.00 | | | | 0.00 | | | | 0.00 | | | | 0.00 | | | | 0.00 | | | | 0.00 | | | | 0.00 | | | | 0.00 | | | | 0.00 | | | | 0.00 | | | | 0.00 | |
Net realized gain on investments | | | 0.00 | | | | (2.62 | ) | | | (2.08 | ) | | | (4.68 | ) | | | (2.81 | ) | | | (2.99 | ) | | | 0.00 | | | | (1.18 | ) | | | (4.07 | ) | | | (4.61 | ) | | | 0.00 | | | | 0.00 | |
| | | | | | | | | | | | | | | | | | | | | | | | | | | | | | | | | | | | | | | | | | | | | | | | |
Total distributions | | | 0.00 | | | | (2.62 | ) | | | (2.08 | ) | | | (4.68 | ) | | | (2.81 | ) | | | (2.99 | ) | | | 0.00 | | | | (1.18 | ) | | | (4.07 | ) | | | (4.61 | ) | | | 0.00 | | | | 0.00 | |
| | | | | | | | | | | | | | | | | | | | | | | | | | | | | | | | | | | | | | | | | | | | | | | | |
| | | | | | | | | | | | |
Net asset value, end of year | | $ | 49.27 | | | $ | 43.62 | | | $ | 52.12 | | | $ | 66.57 | | | $ | 60.08 | | | $ | 56.52 | | | $ | 47.89 | | | $ | 40.05 | | | $ | 35.65 | | | $ | 40.22 | | | $ | 49.43 | | | $ | 43.65 | |
| | | | | | | | | | | | | | | | | | | | | | | | | | | | | | | | | | | | | | | | | | | | | | | | |
Total return | | | 12.95 | % | | | (9.88 | )% | | | (19.14 | )% | | | 19.56 | % | | | 11.54 | % | | | 25.21 | % | | | 19.58 | % | | | 16.11 | % | | | (2.54 | )% | | | (31.16 | )% | | | 13.24 | % | | | 16.77 | %4 |
| | | | | | | | | | | | | | | | | | | | | | | | | | | | | | | | | | | | | | | | | | | | | | | | |
| | | | | | | | | | | | |
Ratios/Supplemental data: | | | | | | | | | | | | | | | | | | | | | | | | | | | | | | | | | | | | | | | | | | | | | | | | |
Net assets (in millions), end of year | | $ | 2,424.2 | | | $ | 2,652.6 | | | $ | 3,311.8 | | | $ | 4,468.0 | | | $ | 3,365.6 | | | $ | 2,687.4 | | | $ | 2,002.4 | | | $ | 1,957.2 | | | $ | 2,055.2 | | | $ | 2,692.3 | | | $ | 242.8 | | | $ | 82.3 | |
| | | | | | | | | | | | | | | | | | | | | | | | | | | | | | | | | | | | | | | | | | | | | | | | |
Ratio of total expenses to average
net assets | | | 1.32 | % | | | 1.36 | %2 | | | 1.33 | %2 | | | 1.34 | %2 | | | 1.33 | % | | | 1.34 | % | | | 1.34 | % | | | 1.34 | % | | | 1.35 | % | | | 1.37 | % | | | 1.06 | % | | | 1.16 | %5 |
Less: Ratio of interest expense to average net assets | | | 0.00 | % | | | 0.00 | % | | | 0.00 | % | | | 0.00 | % | | | 0.00 | % | | | 0.00 | % | | | 0.00 | % | | | 0.00 | % | | | (0.02 | )% | | | (0.01 | )% | | | 0.00 | % | | | 0.00 | % |
| | | | | | | | | | | | | | | | | | | | | | | | | | | | | | | | | | | | | | | | | | | | | | | | |
Ratio of operating expenses to average net assets | | | 1.32 | % | | | 1.36 | % | | | 1.33 | % | | | 1.34 | % | | | 1.33 | % | | | 1.34 | % | | | 1.34 | % | | | 1.34 | % | | | 1.33 | % | | | 1.36 | % | | | 1.06 | % | | | 1.16 | %5 |
| | | | | | | | | | | | | | | | | | | | | | | | | | | | | | | | | | | | | | | | | | | | | | | | |
Ratio of net investment loss to average net assets | | | (0.61 | )% | | | (0.54 | )% | | | (0.49 | )% | | | (0.17 | )% | | | (0.49 | )% | | | (0.91 | )% | | | (0.90 | )% | | | (1.14 | )% | | | (1.16 | )% | | | (1.14 | )% | | | (0.33 | )% | | | (0.39 | )%5 |
| | | | | | | | | | | | | | | | | | | | | | | | | | | | | | | | | | | | | | | | | | | | | | | | |
Portfolio turnover rate | | | 13.04 | % | | | 14.67 | % | | | 16.02 | % | | | 13.39 | % | | | 21.87 | % | | | 11.47 | % | | | 19.57 | % | | | 27.95 | % | | | 6.01 | % | | | 4.33 | % | | | 13.04 | % | | | 14.67 | % |
| | | | | | | | | | | | | | | | | | | | | | | | | | | | | | | | | | | | | | | | | | | | | | | | |
| 1 | Based on average shares outstanding. |
| 2 | Benefit of expense reduction rounds to less than 0.01%. |
| 3 | For the period May 29, 2009 (Commencement of Operations) to September 30, 2009. |
| | |
| 36 | | See Notes to Financial Statements. |
| | |
| September 30, 2010 | | Baron Funds |
FINANCIAL HIGHLIGHTS (Continued)
BARON GROWTH FUND
Selected data for a share outstanding throughout each period:
| | | | | | | | | | | | | | | | | | | | | | | | | | | | | | | | | | | | | | | | | | | | | | | | |
| | | RETAIL SHARES | | | INSTITUTIONAL
SHARES | |
| | | Year Ended September 30, | | | Year Ended
September 30, | |
| | 2010 | | | 2009 | | | 2008 | | | 2007 | | | 2006 | | | 2005 | | | 2004 | | | 2003 | | | 2002 | | | 2001 | | | 2010 | | | 20093 | |
| | | | | | | | | | | | |
Net asset value, beginning of year | | $ | 39.00 | | | $ | 41.69 | | | $ | 54.55 | | | $ | 47.23 | | | $ | 45.96 | | | $ | 38.92 | | | $ | 32.65 | | | $ | 26.96 | | | $ | 27.18 | | | $ | 32.26 | | | $ | 39.03 | | | $ | 33.71 | |
| | | | | | | | | | | | | | | | | | | | | | | | | | | | | | | | | | | | | | | | | | | | | | | | |
| | | | | | | | | | | | |
Income (loss) from
investment operations: | | | | | | | | | | | | | | | | | | | | | | | | | | | | | | | | | | | | | | | | | | | | | | | | |
Net investment loss | | | (0.34 | )1 | | | (0.18 | )1 | | | (0.28 | )1 | | | (0.25 | )1 | | | (0.29 | ) | | | (0.29 | ) | | | (0.30 | ) | | | (0.25 | ) | | | (0.23 | ) | | | (0.22 | ) | | | (0.22 | )1 | | | (0.04 | )1 |
Net realized and unrealized gain (loss)
on investments | | | 5.71 | | | | (2.47 | ) | | | (10.07 | ) | | | 10.11 | | | | 3.61 | | | | 7.33 | | | | 6.57 | | | | 5.94 | | | | 1.65 | | | | (1.67 | ) | | | 5.71 | | | | 5.36 | |
| | | | | | | | | | | | | | | | | | | | | | | | | | | | | | | | | | | | | | | | | | | | | | | | |
Total from
investment operations | | | 5.37 | | | | (2.65 | ) | | | (10.35 | ) | | | 9.86 | | | | 3.32 | | | | 7.04 | | | | 6.27 | | | | 5.69 | | | | 1.42 | | | | (1.89 | ) | | | 5.49 | | | | 5.32 | |
| | | | | | | | | | | | | | | | | | | | | | | | | | | | | | | | | | | | | | | | | | | | | | | | |
| | | | | | | | | | | | |
Less distributions to
shareholders from: | | | | | | | | | | | | | | | | | | | | | | | | | | | | | | | | | | | | | | | | | | | | | | | | |
Net investment income | | | 0.00 | | | | 0.00 | | | | 0.00 | | | | 0.00 | | | | 0.00 | | | | 0.00 | | | | 0.00 | | | | 0.00 | | | | 0.00 | | | | 0.00 | | | | 0.00 | | | | 0.00 | |
Net realized gain on investments | | | 0.00 | | | | (0.04 | ) | | | (2.51 | ) | | | (2.54 | ) | | | (2.05 | ) | | | 0.00 | | | | 0.00 | | | | 0.00 | | | | (1.64 | ) | | | (3.19 | ) | | | 0.00 | | | | 0.00 | |
| | | | | | | | | | | | | | | | | | | | | | | | | | | | | | | | | | | | | | | | | | | | | | | | |
Total distributions | | | 0.00 | | | | (0.04 | ) | | | (2.51 | ) | | | (2.54 | ) | | | (2.05 | ) | | | 0.00 | | | | 0.00 | | | | 0.00 | | | | (1.64 | ) | | | (3.19 | ) | | | 0.00 | | | | 0.00 | |
| | | | | | | | | | | | | | | | | | | | | | | | | | | | | | | | | | | | | | | | | | | | | | | | |
| | | | | | | | | | | | |
Net asset value, end of year | | $ | 44.37 | | | $ | 39.00 | | | $ | 41.69 | | | $ | 54.55 | | | $ | 47.23 | | | $ | 45.96 | | | $ | 38.92 | | | $ | 32.65 | | | $ | 26.96 | | | $ | 27.18 | | | $ | 44.52 | | | $ | 39.03 | |
| | | | | | | | | | | | | | | | | | | | | | | | | | | | | | | | | | | | | | | | | | | | | | | | |
Total return | | | 13.77 | % | | | (6.34 | )% | | | (19.78 | )% | | | 21.41 | % | | | 7.36 | % | | | 18.09 | % | | | 19.20 | % | | | 21.11 | % | | | 5.02 | % | | | (6.06 | )% | | | 14.07 | % | | | 15.78 | %4 |
| | | | | | | | | | | | | | | | | | | | | | | | | | | | | | | | | | | | | | | | | | | | | | | | |
| | | | | | | | | | | | |
Ratios/Supplemental data: | | | | | | | | | | | | | | | | | | | | | | | | | | | | | | | | | | | | | | | | | | | | | | | | |
Net assets (in millions), end of year | | $ | 4,842.8 | | | $ | 5,034.5 | | | $ | 5,615.0 | | | $ | 7,075.9 | | | $ | 5,315.8 | | | $ | 5,005.1 | | | $ | 3,135.6 | | | $ | 2,185.4 | | | $ | 1,030.3 | | | $ | 512.3 | | | $ | 728.9 | | | $ | 238.7 | |
| | | | | | | | | | | | | | | | | | | | | | | | | | | | | | | | | | | | | | | | | | | | | | | | |
Ratio of operating expenses to average net assets | | | 1.32 | % | | | 1.35 | %2 | | | 1.32 | %2 | | | 1.31 | %2 | | | 1.31 | % | | | 1.31 | % | | | 1.33 | % | | | 1.36 | % | | | 1.35 | % | | | 1.36 | % | | | 1.06 | % | | | 1.13 | %5 |
| | | | | | | | | | | | | | | | | | | | | | | | | | | | | | | | | | | | | | | | | | | | | | | | |
Ratio of net investment loss to average net assets | | | (0.80 | )% | | | (0.56 | )% | | | (0.59 | )% | | | (0.49 | )% | | | (0.61 | )% | | | (0.73 | )% | | | (0.89 | )% | | | (1.11 | )% | | | (1.02 | )% | | | (0.79 | )% | | | (0.53 | )% | | | (0.29 | )%5 |
| | | | | | | | | | | | | | | | | | | | | | | | | | | | | | | | | | | | | | | | | | | | | | | | |
Portfolio turnover rate | | | 16.12 | % | | | 26.65 | % | | | 25.97 | % | | | 21.37 | % | | | 21.27 | % | | | 15.50 | % | | | 27.15 | % | | | 32.63 | % | | | 18.31 | % | | | 34.94 | % | | | 16.12 | % | | | 26.65 | % |
| | | | | | | | | | | | | | | | | | | | | | | | | | | | | | | | | | | | | | | | | | | | | | | | |
| 1 | Based on average shares outstanding. |
| 2 | Benefit of expense reduction rounds to less than 0.01%. |
| 3 | For the period May 29, 2009 (Commencement of Operations) to September 30, 2009. |
| | |
| See Notes to Financial Statements. | | 37 |
| | |
| Baron Funds | | September 30, 2010 |
FINANCIAL HIGHLIGHTS (Continued)
BARON SMALL CAP FUND
Selected data for a share outstanding throughout each period:
| | | | | | | | | | | | | | | | | | | | | | | | | | | | | | | | | | | | | | | | | | | | | | | | |
| | | RETAIL SHARES | | | INSTITUTIONAL
SHARES | |
| | | Year Ended September 30, | | | Year Ended
September 30, | |
| | | 2010 | | | 2009 | | | 2008 | | | 2007 | | | 2006 | | | 2005 | | | 2004 | | | 2003 | | | 2002 | | | 2001 | | | 2010 | | | 20094 | |
| | | | | | | | | | | | |
Net asset value, beginning of year | | $ | 17.96 | | | $ | 18.70 | | | $ | 25.47 | | | $ | 23.59 | | | $ | 23.08 | | | $ | 19.18 | | | $ | 17.26 | | | $ | 13.73 | | | $ | 12.69 | | | $ | 16.05 | | | $ | 17.97 | | | $ | 15.52 | |
| | | | | | | | | | | | | | | | | | | | | | | | | | | | | | | | | | | | | | | | | | | | | | | | |
| | | | | | | | | | | | |
Income (loss) from investment operations: | | | | | | | | | | | | | | | | | | | | | | | | | | | | | | | | | | | | | | | | | | | | | | | | |
Net investment loss | | | (0.06 | )1 | | | (0.13 | )1 | | | (0.09 | )1 | | | (0.02 | )1 | | | (0.18 | ) | | | (0.10 | ) | | | (0.15 | ) | | | (0.11 | ) | | | (0.14 | ) | | | (0.11 | ) | | | (0.03 | )1 | | | (0.04 | )1 |
Net realized and unrealized gain (loss) on investments | | | 3.00 | | | | (0.61 | ) | | | (5.01 | ) | | | 4.96 | | | | 1.43 | | | | 4.55 | | | | 2.07 | | | | 4.02 | | | | 1.18 | | | | (2.87 | ) | | | 3.03 | | | | 2.49 | |
| | | | | | | | | | | | | | | | | | | | | | | | | | | | | | | | | | | | | | | | | | | | | | | | |
Total from
investment operations | | | 2.94 | | | | (0.74 | ) | | | (5.10 | ) | | | 4.94 | | | | 1.25 | | | | 4.45 | | | | 1.92 | | | | 3.91 | | | | 1.04 | | | | (2.98 | ) | | | 3.00 | | | | 2.45 | |
| | | | | | | | | | | | | | | | | | | | | | | | | | | | | | | | | | | | | | | | | | | | | | | | |
| | | | | | | | | | | | |
Less distributions to shareholders from: | | | | | | | | | | | | | | | | | | | | | | | | | | | | | | | | | | | | | | | | | | | | | | | | |
Net investment income | | | 0.00 | | | | 0.00 | | | | 0.00 | | | | 0.00 | | | | 0.00 | | | | 0.00 | | | | 0.00 | | | | 0.00 | | | | 0.00 | | | | 0.00 | | | | 0.00 | | | | 0.00 | |
Net realized gain on investments | | | 0.00 | | | | (0.00 | )2 | | | (1.67 | ) | | | (3.06 | ) | | | (0.74 | ) | | | (0.55 | ) | | | 0.00 | | | | (0.38 | ) | | | 0.00 | | | | (0.38 | ) | | | 0.00 | | | | 0.00 | |
| | | | | | | | | | | | | | | | | | | | | | | | | | | | | | | | | | | | | | | | | | | | | | | | |
Total distributions | | | 0.00 | | | | (0.00 | ) | | | (1.67 | ) | | | (3.06 | ) | | | (0.74 | ) | | | (0.55 | ) | | | 0.00 | | | | (0.38 | ) | | | 0.00 | | | | (0.38 | ) | | | 0.00 | | | | 0.00 | |
| | | | | | | | | | | | | | | | | | | | | | | | | | | | | | | | | | | | | | | | | | | | | | | | |
| | | | | | | | | | | | |
Net asset value, end of year | | $ | 20.90 | | | $ | 17.96 | | | $ | 18.70 | | | $ | 25.47 | | | $ | 23.59 | | | $ | 23.08 | | | $ | 19.18 | | | $ | 17.26 | | | $ | 13.73 | | | $ | 12.69 | | | $ | 20.97 | | | $ | 17.97 | |
| | | | | | | | | | | | | | | | | | | | | | | | | | | | | | | | | | | | | | | | | | | | | | | | |
Total return | | | 16.37 | % | | | (3.95 | )% | | | (21.44 | )% | | | 22.54 | % | | | 5.52 | % | | | 23.56 | % | | | 11.12 | % | | | 29.20 | % | | | 8.20 | % | | | (18.83 | )% | | | 16.69 | % | | | 15.79 | %5 |
| | | | | | | | | | | | | | | | | | | | | | | | | | | | | | | | | | | | | | | | | | | | | | | | |
| | | | | | | | | | | | |
Ratios/Supplemental data: | | | | | | | | | | | | | | | | | | | | | | | | | | | | | | | | | | | | | | | | | | | | | | | | |
Net assets (in millions), end of year | | $ | 3,032.0 | | | $ | 2,719.4 | | | $ | 2,871.6 | | | $ | 3,522.4 | | | $ | 2,921.7 | | | $ | 2,828.6 | | | $ | 1,782.1 | | | $ | 1,210.5 | | | $ | 719.1 | | | $ | 585.9 | | | $ | 261.1 | | | $ | 89.4 | |
| | | | | | | | | | | | | | | | | | | | | | | | | | | | | | | | | | | | | | | | | | | | | | | | |
Ratio of operating expenses to average net assets | | | 1.31 | % | | | 1.34 | %3 | | | 1.32 | %3 | | | 1.31 | %3 | | | 1.33 | % | | | 1.33 | % | | | 1.33 | % | | | 1.36 | % | | | 1.36 | % | | | 1.35 | % | | | 1.06 | % | | | 1.16 | %6 |
| | | | | | | | | | | | | | | | | | | | | | | | | | | | | | | | | | | | | | | | | | | | | | | | |
Ratio of net investment gain (loss) to average net assets | | | (0.30 | )% | | | (0.86 | )% | | | (0.42 | )% | | | (0.09 | )% | | | (0.73 | )% | | | (0.48 | )% | | | (0.88 | )% | | | (0.87 | )% | | | (0.97 | )% | | | (0.68 | )% | | | (0.15 | )% | | | (0.75 | )%6 |
| | | | | | | | | | | | | | | | | | | | | | | | | | | | | | | | | | | | | | | | | | | | | | | | |
Portfolio turnover rate | | | 27.22 | % | | | 35.83 | % | | | 41.52 | % | | | 36.51 | % | | | 39.99 | % | | | 24.68 | % | | | 32.92 | % | | | 30.29 | % | | | 55.07 | % | | | 55.77 | % | | | 27.22 | % | | | 35.83 | % |
| | | | | | | | | | | | | | | | | | | | | | | | | | | | | | | | | | | | | | | | | | | | | | | | |
| 1 | Based on average shares outstanding. |
| 2 | Less than $0.01 per share. |
| 3 | Benefit of expense reduction rounds to less than 0.01%. |
| 4 | For the period May 29, 2009 (Commencement of Operations) to September 30, 2009. |
| | |
| 38 | | See Notes to Financial Statements. |
| | |
| September 30, 2010 | | Baron Funds |
FINANCIAL HIGHLIGHTS (Continued)
BARON OPPORTUNITY FUND
Selected data for a share outstanding throughout each period:
| | | | | | | | | | | | | | | | | | | | | | | | | | | | | | | | | | | | | | | | | | | | | | | | |
| | | RETAIL SHARES | | | INSTITUTIONAL
SHARES | |
| | | Year Ended September 30, | | | Year Ended
September 30, | |
| | | 2010 | | | 2009 | | | 2008 | | | 2007 | | | 2006 | | | 2005 | | | 2004 | | | 2003 | | | 2002 | | | 2001 | | | 2010 | | | 20097 | |
| | | | | | | | | | | | |
Net asset value, beginning of year | | $ | 10.61 | | | $ | 9.90 | | | $ | 13.01 | | | $ | 10.05 | | | $ | 9.16 | | | $ | 7.58 | | | $ | 6.48 | | | $ | 3.63 | | | $ | 4.09 | | | $ | 8.76 | | | $ | 10.62 | | | $ | 8.88 | |
| | | | | | | | | | | | | | | | | | | | | | | | | | | | | | | | | | | | | | | | | | | | | | | | |
| | | | | | | | | | |
Income (loss) from investment operations: | | | | | | | | | | | | | | | | | | | | | | | | | | | | | | | | | | | | | | | | | |
Net investment loss | | | (0.13 | )1 | | | (0.08 | )1 | | | (0.09 | )1 | | | (0.07 | )1 | | | (0.03 | ) | | | (0.09 | ) | | | (0.10 | ) | | | (0.05 | ) | | | (0.06 | ) | | | (0.05 | ) | | | (0.10 | )1 | | | (0.02 | )1 |
Net realized and unrealized gain (loss) on investments | | | 2.28 | | | | 0.79 | | | | (3.02 | ) | | | 3.03 | | | | 0.92 | | | | 1.66 | | | | 1.18 | | | | 2.89 | | | | (0.40 | ) | | | (4.59 | ) | | | 2.28 | | | | 1.76 | |
| | | | | | | | | | | | | | | | | | | | | | | | | | | | | | | | | | | | | | | | | | | | | | | | |
Total from
investment operations | | | 2.15 | | | | 0.71 | | | | (3.11 | ) | | | 2.96 | | | | 0.89 | | | | 1.57 | | | | 1.08 | | | | 2.84 | | | | (0.46 | ) | | | (4.64 | ) | | | 2.18 | | | | 1.74 | |
| | | | | | | | | | | | | | | | | | | | | | | | | | | | | | | | | | | | | | | | | | | | | | | | |
| | | | | | | | | | |
Less distributions to shareholders from: | | | | | | | | | | | | | | | | | | | | | | | | | | | | | | | | | | | | | | | | | |
Net investment income | | | 0.00 | | | | 0.00 | | | | 0.00 | | | | 0.00 | | | | 0.00 | | | | 0.00 | | | | 0.00 | | | | 0.00 | | | | 0.00 | | | | (0.03 | ) | | | 0.00 | | | | 0.00 | |
Net realized gain on investments | | | 0.00 | | | | 0.00 | | | | 0.00 | | | | 0.00 | | | | 0.00 | | | | 0.00 | | | | 0.00 | | | | 0.00 | | | | 0.00 | | | | 0.00 | | | | 0.00 | | | | 0.00 | |
| | | | | | | | | | | | | | | | | | | | | | | | | | | | | | | | | | | | | | | | | | | | | | | | |
Total distributions | | | 0.00 | | | | 0.00 | | | | 0.00 | | | | 0.00 | | | | 0.00 | | | | 0.00 | | | | 0.00 | | | | 0.00 | | | | 0.00 | | | | (0.03 | ) | | | 0.00 | | | | 0.00 | |
| | | | | | | | | | | | | | | | | | | | | | | | | | | | | | | | | | | | | | | | | | | | | | | | |
Redemption fees added to capital paid in | | | 0.00 | 2 | | | 0.00 | 2 | | | 0.00 | 2 | | | 0.00 | 2 | | | 0.00 | 2 | | | 0.01 | | | | 0.02 | | | | 0.01 | | | | 0.00 | 2 | | | 0.00 | 2 | | | 0.00 | 2 | | | 0.00 | |
| | | | | | | | | | | | | | | | | | | | | | | | | | | | | | | | | | | | | | | | | | | | | | | | |
Net asset value, end of year | | $ | 12.76 | | | $ | 10.61 | | | $ | 9.90 | | | $ | 13.01 | | | $ | 10.05 | | | $ | 9.16 | | | $ | 7.58 | | | $ | 6.48 | | | $ | 3.63 | | | $ | 4.09 | | | $ | 12.80 | | | $ | 10.62 | |
| | | | | | | | | | | | | | | | | | | | | | | | | | | | | | | | | | | | | | | | | | | | | | | | |
Total return | | | 20.26 | % | | | 7.17 | % | | | (23.90 | )% | | | 29.45 | %3 | | | 9.72 | % | | | 20.84 | %3 | | | 16.98 | %3 | | | 78.51 | %3 | | | (11.25 | )%3 | | | (53.14 | )%3 | | | 20.53 | % | | | 19.59 | %3,4 |
| | | | | | | | | | | | | | | | | | | | | | | | | | | | | | | | | | | | | | | | | | | | | | | | |
| | | | | | | | | | |
Ratios/Supplemental data: | | | | | | | | | | | | | | | | | | | | | | | | | | | | | | | | | | | | | | | | | |
Net assets (in millions), end of year | | $ | 214.4 | | | $ | 142.7 | | | $ | 154.4 | | | $ | 198.0 | | | $ | 145.4 | | | $ | 145.7 | | | $ | 133.9 | | | $ | 109.3 | | | $ | 57.5 | | | $ | 73.7 | | | $ | 25.5 | | | $ | 10.9 | |
| | | | | | | | | | | | | | | | | | | | | | | | | | | | | | | | | | | | | | | | | | | | | | | | |
Ratio of operating expenses to average net assets | | | 1.44 | % | | | 1.50 | % | | | 1.42 | % | | | 1.43 | % | | | 1.45 | % | | | 1.52 | % | | | 1.56 | % | | | 1.67 | % | | | 1.65 | % | | | 1.55 | % | | | 1.18 | % | | | 1.37 | %6 |
Less: Reimbursement of expenses by Adviser and/or offsets | | | 0.00 | % | | | 0.00 | %5 | | | 0.00 | %5 | | | (0.01 | )% | | | 0.00 | % | | | (0.02 | )% | | | (0.06 | )% | | | (0.17 | )% | | | (0.15 | )% | | | (0.05 | )% | | | 0.00 | % | | | (0.12 | )%6 |
| | | | | | | | | | | | | | | | | | | | | | | | | | | | | | | | | | | | | | | | | | | | | | | | |
Ratio of net expenses to average net assets | | | 1.44 | % | | | 1.50 | % | | | 1.42 | % | | | 1.42 | % | | | 1.45 | % | | | 1.50 | % | | | 1.50 | % | | | 1.50 | % | | | 1.50 | % | | | 1.50 | % | | | 1.18 | % | | | 1.25 | %6 |
| | | | | | | | | | | | | | | | | | | | | | | | | | | | | | | | | | | | | | | | | | | | | | | | |
Ratio of net investment loss to average net assets | | | (1.08 | )% | | | (1.00 | )% | | | (0.79 | )% | | | (0.61 | )% | | | (0.26 | )% | | | (1.01 | )% | | | (1.25 | )% | | | (1.18 | )% | | | (1.20 | )% | | | (0.75 | )% | | | (0.83 | )% | | | (0.74 | )%6 |
| | | | | | | | | | | | | | | | | | | | | | | | | | | | | | | | | | | | | | | | | | | | | | | | |
Portfolio turnover rate | | | 76.44 | % | | | 68.09 | % | | | 61.44 | % | | | 46.20 | % | | | 67.25 | % | | | 83.64 | % | | | 86.35 | % | | | 89.72 | % | | | 96.41 | % | | | 123.30 | % | | | 76.44 | % | | | 68.09 | % |
| | | | | | | | | | | | | | | | | | | | | | | | | | | | | | | | | | | | | | | | | | | | | | | | |
| 1 | Based on average shares outstanding. |
| 2 | Less than $0.01 per share. |
| 3 | The total returns would have been lower had certain expenses not been reduced during the periods shown. |
| 5 | Benefit of expense reduction rounds to less than 0.01%. |
| 7 | For the period May 29, 2009 (Commencement of Operations) to September 30, 2009. |
| | |
| See Notes to Financial Statements. | | 39 |
| | |
| Baron Funds | | September 30, 2010 |
FINANCIAL HIGHLIGHTS (Continued)
BARON FIFTH AVENUE GROWTH FUND
Selected data for a share outstanding throughout each period:
| | | | | | | | | | | | | | | | | | | | | | | | | | | | | | | | | | | | |
| | | RETAIL SHARES | | | INSTITUTIONAL
SHARES | |
| | | Year Ended September 30, | | | Year Ended
September 30, | |
| | | 2010 | | | 2009 | | | 2008 | | | 2007 | | | 2006 | | | 2005 | | | 20041 | | | 2010 | | | 20098 | |
| | | | | | | | | |
Net asset value, beginning of year | | $ | 8.60 | | | $ | 10.38 | | | $ | 14.12 | | | $ | 12.22 | | | $ | 11.56 | | | $ | 9.89 | | | $ | 10.00 | | | $ | 8.61 | | | $ | 7.54 | |
| | | | | | | | | | | | | | | | | | | | | | | | | | | | | | | | | | | | |
| | | | | | | | | |
Income (loss) from investment operations: | | | | | | | | | | | | | | | | | | | | | | | | | | | | | | | | | | | | |
Net investment income (loss) | | | (0.03 | )2 | | | 0.03 | 2 | | | 0.00 | 2,3 | | | (0.01 | )2 | | | (0.02 | ) | | | (0.05 | ) | | | (0.02 | ) | | | (0.01 | )2 | | | 0.02 | 2 |
Net realized and unrealized gain (loss) on investments | | | 0.66 | | | | (1.03 | ) | | | (2.62 | ) | | | 1.91 | | | | 0.68 | | | | 1.72 | | | | (0.09 | ) | | | 0.66 | | | | 1.05 | |
| | | | | | | | | | | | | | | | | | | | | | | | | | | | | | | | | | | | |
Total from investment operations | | | 0.63 | | | | (1.00 | ) | | | (2.62 | ) | | | 1.90 | | | | 0.66 | | | | 1.67 | | | | (0.11 | ) | | | 0.65 | | | | 1.07 | |
| | | | | | | | | | | | | | | | | | | | | | | | | | | | | | | | | | | | |
| | | | | | | | | |
Less distributions to shareholders from: | | | | | | | | | | | | | | | | | | | | | | | | | | | | | | | | | | | | |
Net investment income | | | (0.02 | ) | | | (0.01 | ) | | | 0.00 | | | | 0.00 | | | | 0.00 | | | | 0.00 | | | | 0.00 | | | | (0.05 | ) | | | 0.00 | |
Net realized gain on investments | | | 0.00 | | | | (0.77 | ) | | | (1.12 | ) | | | 0.00 | | | | 0.00 | | | | 0.00 | | | | 0.00 | | | | 0.00 | | | | 0.00 | |
| | | | | | | | | | | | | | | | | | | | | | | | | | | | | | | | | | | | |
Total distributions | | | (0.02 | ) | | | (0.78 | ) | | | (1.12 | ) | | | 0.00 | | | | 0.00 | | | | 0.00 | | | | 0.00 | | | | (0.05 | ) | | | 0.00 | |
| | | | | | | | | | | | | | | | | | | | | | | | | | | | | | | | | | | | |
| | | | | | | | | |
Net asset value, end of year | | $ | 9.21 | | | $ | 8.60 | | | $ | 10.38 | | | $ | 14.12 | | | $ | 12.22 | | | $ | 11.56 | | | $ | 9.89 | | | $ | 9.21 | | | $ | 8.61 | |
| | | | | | | | | | | | | | | | | | | | | | | | | | | | | | | | | | | | |
Total return | | | 7.38 | %4 | | | (7.75 | )%4 | | | (19.96 | )%4 | | | 15.55 | % | | | 5.71 | % | | | 16.89 | %4 | | | (1.10 | )%4,5 | | | 7.59 | %4 | | | 14.19 | %4,5 |
| | | | | | | | | | | | | | | | | | | | | | | | | | | | | | | | | | | | |
| | | | | | | | | |
Ratios/Supplemental data: | | | | | | | | | | | | | | | | | | | | | | | | | | | | | | | | | | | | |
Net assets (in millions), end of year | | $ | 29.0 | | | $ | 32.8 | | | $ | 58.2 | | | $ | 110.2 | | | $ | 123.3 | | | $ | 96.5 | | | $ | 49.3 | | | $ | 10.4 | | | $ | 9.5 | |
| | | | | | | | | | | | | | | | | | | | | | | | | | | | | | | | | | | | |
Ratio of operating expenses to average net assets | | | 1.62 | % | | | 1.69 | % | | | 1.47 | % | | | 1.36 | % | | | 1.39 | % | | | 1.49 | % | | | 1.67 | %7 | | | 1.35 | % | | | 1.61 | %7 |
Less: Reimbursement of expenses by Adviser and/or offsets | | | (0.25 | )% | | | (0.29 | )% | | | (0.07 | )% | | | 0.00 | %6 | | | 0.00 | % | | | (0.09 | )% | | | (0.27 | )%7 | | | (0.24 | )% | | | (0.46 | )%7 |
| | | | | | | | | | | | | | | | | | | | | | | | | | | | | | | | | | | | |
Ratio of net expenses to average net assets | | | 1.37 | % | | | 1.40 | % | | | 1.40 | % | | | 1.36 | % | | | 1.39 | % | | | 1.40 | % | | | 1.40 | %7 | | | 1.11 | % | | | 1.15 | %7 |
| | | | | | | | | | | | | | | | | | | | | | | | | | | | | | | | | | | | |
Ratio of net investment income (loss) to average net assets | | | (0.32 | )% | | | 0.40 | % | | | (0.01 | )% | | | (0.08 | )% | | | (0.16 | )% | | | (0.58 | )% | | | (0.79 | )%7 | | | (0.07 | ) | | | 0.58 | %7 |
| | | | | | | | | | | | | | | | | | | | | | | | | | | | | | | | | | | | |
Portfolio turnover rate | | | 57.67 | % | | | 39.61 | % | | | 39.59 | % | | | 28.75 | % | | | 105.77 | % | | | 46.71 | % | | | 7.58 | %5 | | | 57.67 | % | | | 39.61 | % |
| | | | | | | | | | | | | | | | | | | | | | | | | | | | | | | | | | | | |
| 1 | For the period April 30, 2004 (Commencement of Operations) to September 30, 2004. |
| 2 | Based on average shares outstanding. |
| 3 | Less than $0.01 per share. |
| 4 | The total returns would have been lower had certain expenses not been reduced during the periods shown. |
| 6 | Benefit of expense reduction rounds to less than 0.01%. |
| 8 | For the period May 29, 2009 (Commencement of Operations) to September 30, 2009. |
| | |
| 40 | | See Notes to Financial Statements. |
| | |
| September 30, 2010 | | Baron Funds |
REPORT OF INDEPENDENT REGISTERED PUBLIC ACCOUNTING FIRM
To the Shareholders and Board of Trustees of
Baron Investment Funds Trust
In our opinion, the accompanying statements of assets and liabilities, including the statements of net assets, and the related statements of operations and of changes in net assets and the financial highlights present fairly, in all material respects, the financial position of each of Baron Asset Fund, Baron Growth Fund, Baron Small Cap Fund, Baron Opportunity Fund (formerly Baron iOpportunity Fund) and Baron Fifth Avenue Growth Fund (five of the portfolios constituting the Baron Investment Funds Trust, hereafter referred to as the “Funds”) at September 30, 2010, and the results of each of their operations, the changes in each of their net assets and the financial highlights for each of the periods presented, in conformity with accounting principles generally accepted in the United States of America. These financial statements and financial highlights (hereafter referred to as “financial statements”) are the responsibility of the Funds’ management. Our responsibility is to express an opinion on these financial statements based on our audits. We conducted our audits of these financial statements in accordance with the standards of the Public Company Accounting Oversight Board (United States). Those standards require that we plan and perform the audit to obtain reasonable assurance about whether the financial statements are free of material misstatement. An audit includes examining, on a test basis, evidence supporting the amounts and disclosures in the financial statements, assessing the accounting principles used and significant estimates made by management, and evaluating the overall financial statement presentation. We believe that our audits, which included confirmation of securities at September 30, 2010 by correspondence with the custodian and brokers, provide a reasonable basis for our opinion.
PricewaterhouseCoopers LLP
New York, New York
November 22, 2010
41
| | |
| Baron Funds | | September 30, 2010 |
FUND EXPENSES (UNAUDITED)
As a shareholder of the Funds, you may incur two types of costs: ongoing expenses and transaction costs. Ongoing expenses include advisory fees, distribution and service (12b-1) fees and other Fund expenses. Due to the payment of Rule 12b-1 fees, long-term shareholders may indirectly pay more than the maximum permitted front-end sales charge. The information on this page is intended to help you understand your ongoing costs of investing in the Funds and to compare these costs with the ongoing costs of investing in other mutual funds.
The information in the following table is based on an investment of $1,000 invested on April 1, 2010 and held for the six months ended September 30, 2010.
ACTUAL EXPENSES
The table below titled “Based on Actual Total Return” provides information about actual account values and actual expenses. You may use the information provided in this table, together with the amount you invested, to estimate the expenses that you paid over the period. To estimate the expenses you paid on your account, divide your ending account value by $1,000 (for example, an $8,600 ending account value divided by $1,000 = 8.6), then multiply the result by the number under the heading titled “Expenses Paid During the Period”.
BASED ON ACTUAL TOTAL RETURN FOR THE SIX MONTHS ENDED SEPTEMBER 30, 20101
| | | | | | | | | | | | | | | | | | | | |
| | | Actual
Total
Return | | | Beginning
Account Value
April 1, 2010 | | | Ending
Account Value September 30, 2010 | | | Annualized Expense Ratio | | | Expenses
Paid During
the Period2 | |
Baron Asset Fund — Retail Shares | | | 0.37% | | | $ | 1,000.00 | | | $ | 1,003.70 | | | | 1.32% | | | $ | 6.63 | |
Baron Asset Fund — Institutional Shares | | | 0.51% | | | $ | 1,000.00 | | | $ | 1,005.10 | | | | 1.05% | | | $ | 5.28 | |
Baron Growth Fund — Retail Shares | | | 0.75% | | | $ | 1,000.00 | | | $ | 1,007.50 | | | | 1.32% | | | $ | 6.64 | |
Baron Growth Fund — Institutional Shares | | | 0.88% | | | $ | 1,000.00 | | | $ | 1,008.80 | | | | 1.06% | | | $ | 5.34 | |
Baron Small Cap Fund — Retail Shares | | | 2.96% | | | $ | 1,000.00 | | | $ | 1,029.60 | | | | 1.30% | | | $ | 6.61 | |
Baron Small Cap Fund — Institutional Shares | | | 3.10% | | | $ | 1,000.00 | | | $ | 1,031.00 | | | | 1.05% | | | $ | 5.35 | |
Baron Opportunity Fund — Retail Shares | | | 5.80% | | | $ | 1,000.00 | | | $ | 1,058.00 | | | | 1.43% | | | $ | 7.38 | |
Baron Opportunity Fund — Institutional Shares | | | 5.87% | | | $ | 1,000.00 | | | $ | 1,058.70 | | | | 1.16% | | | $ | 5.99 | |
Baron Fifth Avenue Growth Fund — Retail Shares | | | (3.30% | ) | | $ | 1,000.00 | | | $ | 967.00 | | | | 1.33% | | | $ | 6.56 | |
Baron Fifth Avenue Growth Fund — Institutional Shares | | | (3.21% | ) | | $ | 1,000.00 | | | $ | 967.90 | | | | 1.08% | | | $ | 5.33 | |
HYPOTHETICAL EXAMPLE FOR COMPARISON PURPOSES
The table below titled “Based on Hypothetical Total Return” provides information about hypothetical account values and hypothetical expenses based on the actual expense ratio and an assumed rate of return of 5% per year before expenses, which is not the Funds’ actual return. The hypothetical account values and expenses may not be used to estimate the actual ending account values and expenses you paid for the period. You may use the information provided in this table to compare the ongoing costs of investing in the Funds and other funds. To do so, compare the 5% hypothetical example relating to the Funds with the 5% hypothetical examples that appear in the shareholder reports of other funds.
Please note that expenses shown in the table below are meant to highlight your ongoing costs and do not reflect any transactional costs, such as redemption fees, if any. Therefore, the table is useful in comparing ongoing costs only and will not help you determine your relative total costs of owning different mutual funds. In addition, if these transactional costs were included, your costs would have been higher.
BASED ON HYPOTHETICAL TOTAL RETURN FOR THE SIX MONTHS ENDED SEPTEMBER 30, 2010
| | | | | | | | | | | | | | | | | | | | |
| | | Hypothetical
Annualized
Total Return | | | Beginning
Account Value
April 1, 2010 | | | Ending
Account Value
September 30, 2010 | | | Annualized
Expense
Ratio | | | Expenses
Paid During
the Period2 | |
Baron Asset Fund — Retail Shares | | | 5.00% | | | $ | 1,000.00 | | | $ | 1,018.45 | | | | 1.32% | | | $ | 6.68 | |
Baron Asset Fund — Institutional Shares | | | 5.00% | | | $ | 1,000.00 | | | $ | 1,019.80 | | | | 1.05% | | | $ | 5.32 | |
Baron Growth Fund — Retail Shares | | | 5.00% | | | $ | 1,000.00 | | | $ | 1,018.45 | | | | 1.32% | | | $ | 6.68 | |
Baron Growth Fund — Institutional Shares | | | 5.00% | | | $ | 1,000.00 | | | $ | 1,019.75 | | | | 1.06% | | | $ | 5.37 | |
Baron Small Cap Fund — Retail Shares | | | 5.00% | | | $ | 1,000.00 | | | $ | 1,018.55 | | | | 1.30% | | | $ | 6.58 | |
Baron Small Cap Fund — Institutional Shares | | | 5.00% | | | $ | 1,000.00 | | | $ | 1,019.80 | | | | 1.05% | | | $ | 5.32 | |
Baron Opportunity Fund — Retail Shares | | | 5.00% | | | $ | 1,000.00 | | | $ | 1,017.90 | | | | 1.43% | | | $ | 7.23 | |
Baron Opportunity Fund — Institutional Shares | | | 5.00% | | | $ | 1,000.00 | | | $ | 1,019.25 | | | | 1.16% | | | $ | 5.87 | |
Baron Fifth Avenue Growth Fund — Retail Shares | | | 5.00% | | | $ | 1,000.00 | | | $ | 1,018.40 | | | | 1.33% | | | $ | 6.73 | |
Baron Fifth Avenue Growth Fund — Institutional Shares | | | 5.00% | | | $ | 1,000.00 | | | $ | 1,019.65 | | | | 1.08% | | | $ | 5.47 | |
| 1 | Assumes reinvestment of all dividends and capital gain distributions, if any. |
| 2 | Expenses are equal to each Share Class’ respective annualized expense ratio multiplied by the average account value over the period, multiplied by the number of days in the most recent fiscal half-year, then divided by 365. |
42
| | |
| September 30, 2010 | | Baron Funds |
DISCLOSURE REGARDING THE APPROVAL OF THE INVESTMENT ADVISORY AGREEMENTS FOR BARON ASSET FUND, BARON GROWTH FUND, BARON SMALL CAP FUND, BARON OPPORTUNITY FUND AND BARON FIFTH AVENUE GROWTH FUND, BY THE BOARD OF TRUSTEES (UNAUDITED)
The Board of Trustees (the “Board”) of Baron Investment Funds Trust (“Trust”) met on May 18, 2010 to discuss the selection of BAMCO, Inc. (the “Adviser”) as the investment adviser and the approval of the investment advisory agreements for Baron Asset Fund, Baron Growth Fund, Baron Small Cap Fund, Baron Opportunity Fund and Baron Fifth Avenue Growth Fund (each a “Fund” and collectively, the “Funds”). The members of the Board who are not affiliated with the Trust (the “Independent Trustees”) met in a separate session to discuss and consider the renewal of the advisory contract for the Funds. An independent consultant provided reports to the Board and attended the Board meeting. The Trustees received a substantial amount of information from the Adviser and from the consultant, and were advised by independent counsel. Based on its evaluation of this and other information, the Board, including a majority of the Independent Trustees, approved the continuation of the advisory agreements for the Funds for an additional one year period.
In reaching its determination, the Board considered various factors that it deemed relevant, including the factors listed below.
1. NATURE, EXTENT AND QUALITY OF SERVICES
As part of their consideration of the nature, extent and quality of services provided by the Adviser, the Independent Trustees relied on the information they received at the Board meeting, as well as on the information they had considered in past years. In particular, the Board considered the following:
| | • | | Their confidence in the Adviser’s senior personnel, portfolio management, the financial condition of the Adviser and its affiliates and the Adviser’s available resources; |
| | • | | The nature, quality and the level of long-term performance of the services provided by the Adviser, including: intensive devotion to research, selection of broker/dealers for Fund portfolio transactions, relationships with and supervision of third party service providers, such as the Funds’ custodian and transfer agent, the quality of shareholder reports, the ability to monitor adherence to investment guidelines and restrictions, the legal, accounting and compliance services provided to the Funds and the support services provided to the Board; |
| | • | | The Adviser’s investment principles and processes and the historical performance of the Funds as compared to similar funds managed by other advisers and other funds managed by the Adviser over comparable periods; |
| | • | | The total expense ratio of the Funds and comparisons to similar funds managed by other advisers over comparable periods; |
| | • | | The costs of portfolio management, including the types of investments made for the Funds, the personnel and systems necessary for the implementation of investment strategies and the pre-tax profits realized by the Adviser and its affiliates from their relationship with the Funds; and |
| | • | | Any additional services provided by the Adviser. |
The Board concluded that the nature, extent and quality of the services provided by the Adviser to each Fund were appropriate and that each Fund was likely to continue to benefit from those services provided under the relevant advisory agreement with the Adviser.
2. INVESTMENT PERFORMANCE OF THE FUNDS AND THE ADVISER
As part of its consideration of the investment performance of the Funds and the Adviser, the Board took into account the analyses performed by and discussed with the independent consultant. The Board considered for each Fund, among other information, the independent consultant’s comparisons of the expense ratio and contractual advisory fee with those of expense group funds. The Board also considered the independent consultant’s risk-adjusted performance comparisons with comparable funds and comparisons of each Fund’s annualized total return over one-, three-, five- and ten-year periods, where applicable, against expense group and performance universe averages. After considering all the information, the Board concluded that the Adviser continued to invest in accordance with its long-standing principles and that each Fund’s more relative performance was consistent with expectations for the Adviser’s investment style under recent market conditions. The Board noted the Funds’ favorable absolute performance in the most recent one-year period and the risk-adjusted performance comparisons. The Board also concluded that the Funds and their shareholders had benefited over the long-term from the Adviser’s investment management of the Funds.
3. COSTS OF SERVICES PROVIDED AND PROFITS TO BE REALIZED BY THE ADVISER
The Board was provided with information from the Adviser and the independent consultant regarding the fees charged by the Adviser as compared to the fees charged by comparable funds. This information compared various fees and expenses, as well as the total expense ratios, of the Funds against the same fees, expenses and total expense ratios of other funds of similar size, character and investment strategies. The total expense ratios of the Funds were generally competitive with the total expense ratios of the funds against which it was compared.
43
| | |
| Baron Funds | | September 30, 2010 |
DISCLOSURE REGARDING THE APPROVAL OF THE INVESTMENT ADVISORY AGREEMENTS FOR BARON ASSET FUND, BARON GROWTH FUND, BARON SMALL CAP FUND, BARON OPPORTUNITY FUND AND BARON FIFTH AVENUE GROWTH FUND, BY THE BOARD OF TRUSTEES (UNAUDITED) (Continued)
The Board considered comparisons of the advisory fees charged and services provided by the Adviser and its investment adviser affiliate to the Funds, sub-advised accounts and separately managed accounts. The Board considered that, while the advisory fees for the other clients are the same as, or lower than, the fees for the Funds, the Adviser or its affiliate performs significantly fewer services for those clients compared with those provided by the Adviser to the Funds.
The Board also considered the costs of portfolio management, including the types of investments made for the Funds, the personnel and systems necessary to implement investment strategies and the pre-tax profits realized by the Adviser and its affiliates from their relationship with each Fund. The Board also considered benefits that accrue to the Adviser and its affiliates from their relationship with the Funds.
4. ECONOMIES OF SCALE AND BENEFITS TO INVESTORS
The Board considered the extent to which the Funds’ management fee reflected economies of scale for the benefit of Fund shareholders. The Board considered that, except for Baron Fifth Avenue Growth Fund, the Funds do not have breakpoint fees. The Board considered that the small- and mid-cap investment strategy required more attention by the Adviser than a strategy that involved other types of investing, particularly as the asset size increases. The Board considered that the Adviser was continuing to grow and upgrade its staff and invest in its business even during this recent period of declining assets and reduced revenues. The Board concluded that the management fee for each Fund was reasonable in light of the services provided as discussed at the meeting, including the Adviser’s investments in resources to support the Funds. The Board will continue to scrutinize the extent of economies of scale, asset growth and the Adviser’s plans to reinvest further to support the Funds.
After due consideration of the above enumerated factors and other factors, the Board, including a majority of the Independent Trustees, concluded that approval of each Fund’s investment advisory agreement was in the best interests of the respective Fund and its shareholders.
44
| | |
| September 30, 2010 | | Baron Funds |
TAX INFORMATION (Unaudited)
We are required by the Internal Revenue Code to advise you within 60 days of the Funds’ fiscal year end as to the federal tax status of distributions paid by the Funds during such fiscal year.
During the fiscal year ended September 30, 2010, the Funds’ distributions to shareholders included:
| | | | | | | | |
| Fund | | Ordinary Income1 | | | Long-Term Capital
Gains2 | |
Baron Fifth Avenue Growth Fund | | $ | 136,975 | | | $ | — | |
| 1 | For tax purposes, short-term capital gains are considered ordinary income distributions. |
| 2 | Long-term capital gains are subject to a maximum allowable rate of 15% for individuals pursuant to The Jobs and Growth Tax Relief Reconciliation Act of 2003. |
Of the total ordinary income distributions paid by Baron Fifth Avenue Growth Fund, 100% is qualified dividend income subject to a reduced tax rate and 100% qualifies for the Corporate Dividends Received Deduction.
The information and distributions reported may differ from the information and distributions taxable to the shareholders for the calendar year ended December 31, 2010. The information necessary to complete your income tax return for the calendar year ended December 31, 2010 will be listed on the Form 1099-DIV, which will be mailed to you in January 2011.
45
| | |
| Baron Funds | | September 30, 2010 |
MANAGEMENT OF THE FUNDS
Board of Trustees and Officers.
The Board of Trustee’s (the “Board”) role in management of the Trust is oversight. As is the case with virtually all investment companies (as distinguished from operating companies), service providers to the Trust, primarily the Adviser and its affiliates, have responsibility for the day-to-day management of the Funds, which includes responsibility for risk management (including management of investment performance and investment risk, valuation risk, issuer and counterparty credit risk, compliance risk and operational risk). As part of its oversight, the Board, acting at its scheduled meetings, or the Chairman, acting between Board meetings, regularly interacts with and receives reports from senior personnel of service providers, including the Adviser’s Chief Investment Officer, the Trust’s and the Adviser’s Chief Compliance Officer and portfolio management personnel. The Board’s Audit Committee (which consists of two independent Trustees) meets regularly with the Trust’s independent registered public accounting firm and the Trust’s Chief Financial Officer. The Board also receives periodic presentations from senior personnel of the Adviser or its affiliates regarding risk management generally, as well as periodic presentations regarding specific operational, compliance or investment areas, such as business continuity, anti-money laundering, personal trading, valuation, credit, investment research and securities lending. The Board has adopted policies and procedures designed to address certain risks to the Funds. In addition, the Adviser and other service providers to the Funds have adopted a variety of policies, procedures and controls designed to address particular risks to the Funds. However, it is not possible to eliminate all of the risks applicable to the Funds. The Board also receives reports from counsel to the Trust or counsel to the Adviser and the Board’s own independent legal counsel regarding regulatory compliance and governance matters. The Board’s oversight role does not make the Board a guarantor of the Trust’s investments or activities.
The 1940 Act requires that at least 40% of a fund’s trustees not be “interested persons” (as defined in the 1940 Act) of the fund, and to rely on certain exemptive rules under the 1940 Act, a majority of a fund’s trustees must not be interested persons of the fund. For certain important matters, such as the approval of investment advisory agreements or transactions with affiliates, the 1940 Act or the rules thereunder require the approval of a majority of the trustees who are not interested persons of the fund. Currently, six of the Trustees are not interested persons of the Trust (as such, the Trustees are not affiliated with the Adviser (“Independent Trustees”)). The Chairman of the Board, Linda Martinson, is an interested person of the Trust (“Interested Trustee”), and the Independent Trustees have designated two lead Independent Trustees who chair meetings or executive sessions of the Independent Trustees, review and comment on Board meeting agendas, represent the views of the Independent Trustees to management and facilitate communication among the Independent Trustees and their independent legal counsel. The Board has determined that its leadership structure, in which the Independent Trustees have designated two lead Independent Trustees to function as described above is appropriate in light of the services that the Adviser and its affiliates provide to the Trust and potential conflicts of interest that could arise from these relationships.
Trustees of the Trust, together with information as to their positions with the Trust, principal occupations and other board memberships and affiliations for the past five years, are shown below. Each Trustee serves as Trustee of a Fund until its termination; until the Trustee’s retirement, resignation or death; or as other specified in the Trust’s organizational documents. Unless otherwise noted, the address of each Executive Officer and Trustee is Baron Investment Funds Trust, 767 Fifth Avenue, 49th Floor, New York, NY 10153. All Trustees listed below, whether Interested or Independent, serve as Trustees for the Trust. Additional information about the Trustees and Officers of the Trust can be found in the Trust’s Statement of Additional Information (the “SAI”) which may be obtained without charge by writing or calling 1-800-99Baron. The SAI is also available on the Baron Funds® website, www.BaronFunds.com.
| | | | | | | | | | | | |
| Name, Address & Age | | Position(s) Held
With the Funds | | Length of
Time Served | | Principal Occupation(s)
During the Past Five Years | | Number of
Portfolios
in Fund
Complex
Overseen
by Trustee | | | Other
Trustee/Directorships
Held by the Trustee |
Interested Trustees | | | | | | | | | | | | |
| | | | | |
Ronald Baron(1),(2) 767 Fifth Avenue New York, NY 10153 Age: 67 | | Chief Executive Officer, Chief Investment Officer, Trustee and Portfolio Manager | | 23 years | | Director, Chairman, CEO and CIO: the Firm* (2003-Present); President (2004-02/07), Chairman (1999-2004), and Trustee (1987-Present): Baron Investment Funds Trust; President (2004-02/07), Chairman (2003-2004), and Trustee (2003-Present): Baron Select Funds; Portfolio Manager: Baron USA Partners Fund, Ltd. (2003-Present); President: the Firm* (03/06-06/07); Portfolio Manager: Baron Managed Funds plc (2005-2009); President (2004-02/07), Chairman (1997-2004), and Trustee (1997-06/07): Baron Capital Funds Trust. | | | 9 | | | None |
46
| | |
| September 30, 2010 | | Baron Funds |
| | | | | | | | | | | | |
| Name, Address & Age | | Position(s) Held
With the Funds | | Length of
Time Served | | Principal Occupation(s)
During the Past Five Years | | Number of
Portfolios
in Fund
Complex
Overseen
by Trustee | | | Other
Trustee/Directorships
Held by the Trustee |
Interested Trustees (continued) | | | | | | | | | | |
| | | | | |
Linda S. Martinson(1),(2) 767 Fifth Avenue New York, NY 10153 Age: 55 | | Chairman, President, Chief Operating Officer and Trustee | | 23 years | | Director: the Firm* (2003-Present); Secretary: the Firm* (2003-04/08); President: the Firm* (02/07-Present); Chief Operating Officer: the Firm (05/06-present); General Counsel and Vice President: the Firm* (2003-2007); Chairman (10/10-Present); President (02/07-Present), Trustee (1987-Present), Secretary (2003-10/08): Baron Investment Funds Trust; Chairman (10/10-Present); President (02/07-Present), Trustee (2003-Present): Baron Select Funds; Director: Baron USA Partners Fund, Ltd. (2006-Present); Director: Baron Managed Funds plc (2005-2009); President (02/07-06/07) Trustee (1998-06/07): Baron Capital Funds Trust. | | | 9 | | | None |
Independent Trustees | | | | | | | | | | | | |
| | | | | |
Norman S. Edelcup(3),(4),(5) City of Sunny Isles Beach 18070 Collins Avenue Sunny Isles Beach, FL 33160 Age: 75 | | Trustee | | 23 years | | Director: Marquis Bank (2007-Present) Director: CompX International, Inc. (diversified manufacturer of engineered components) (2006-Present); Mayor (2003-Present), Commissioner (2001-2003): Sunny Isles Beach, Florida; Director (2001-2006), Senior Vice President (2001-2004): Florida Savings Bank; Director: Valhi, Inc. (diversified company) (1975-Present); Trustee: Baron Investment Funds Trust (1987-Present), Baron Capital Funds Trust (1997-06/07), Baron Select Funds (2003-Present). | | | 9 | | | Director: Marquis Bank (2007-Present); Director: CompX International, Inc. (diversified manufacturer of engineered components) (2006-Present); Director: Valhi, Inc. (diversified company) (1985-1998). |
| | | | | |
Charles N. Mathewson(4),(5) 9295 Prototype Drive Reno, NV 89521 Age: 82 | | Trustee | | 23 years | | Chairman Emeritus (October 2003-Present), Chairman (1986-2003): International Game Technology, Inc. (manufacturer of microprocessor-controlled gaming machines and monitoring systems); Chairman: Baron Capital Funds Trust (2004-06/07), Baron Investment Funds Trust, Baron Select Funds (2004-10/10); Trustee: Baron Investment Funds Trust (1987-Present), Baron Capital Funds Trust (1997-06/07), Baron Select Funds (2003-Present). | | | 9 | | | None |
| | | | | |
Harold W. Milner(4),(5) 2293 Morningstar Drive Park City, UT 84060 Age: 76 | | Trustee | | 23 years | | Retired; Trustee: Baron Investment Funds Trust (1987-Present), Baron Capital Funds Trust (1997-06/07), Baron Select Funds (2003-Present); Chairman: Lighting Protection Systems, LLC (10/06-Present); Director: CompletexRM (2009-Present). | | | 9 | | | None |
| | | | | |
Raymond Noveck(3),(4),(5) 31 Karen Road Waban, MA 02168 Age: 67 | | Trustee | | 23 years | | Private Investor (1999-Present); Trustee: Baron Investment Funds Trust (1987-Present), Baron Capital Funds Trust (1997-06/07), Baron Select Funds (2003-Present). | | | 9 | | | None |
| | | | | |
David A. Silverman, MD(4),(5) 146 Central Park West New York, NY 10024 Age: 60 | | Trustee | | 23 years | | Physician and Faculty: New York University School of Medicine (1976-Present); Trustee: Baron Investment Funds Trust (1987-Present), Baron Capital Funds Trust (1997-06/07), Baron Select Funds (2003-Present). | | | 9 | | | Director: New York Blood Center (1999-Present). |
47
| | |
| Baron Funds | | September 30, 2010 |
| | | | | | | | | | | | |
| Name, Address & Age | | Position(s) Held
With the Funds | | Length of
Time Served | | Principal Occupation(s)
During the Past Five Years | | Number of
Portfolios
in Fund
Complex
Overseen
by Trustee | | | Other
Trustee/Directorships
Held by the Trustee |
Independent Trustees (continued) | | | | | | | | | | |
| | | | | |
Alex Yemenidjian(4),(5) 1925 Century Park East Suite 1975 Los Angeles, CA 90067 Age: 54 | | Trustee | | 4 years | | Chairman and CEO: Tropicana Las Vegas (gaming) (2009-Present); Chairman and CEO: Armenco Holdings, LLC (investment company) (2005-Present); Director: Guess?, Inc. (retail) (2005-Present); Director: Regal Entertainment Group (entertainment company) (2005-Present); Director: USC Marshall School of Business Board of Leaders (2005-Present); Co-chair: Imagine the Arts Campaign, California State University-Northridge (2005-Present); Trustee: American Film Institute (2000-2007); Chairman and CEO: Metro-Goldwyn-Mayer, Inc. (1999-2005); Director: The Lincy Foundation (1989-Present); Chairman: The United Armenian Fund (1989-Present); Director and member of Executive Committee: MGM MIRAGE, Inc. (1989-2005); Trustee: Baron Investment Funds Trust (2006-Present), Baron Capital Funds Trust (12/06-06/07), Baron Select Funds (12/06-Present). | | | 9 | | | Chairman: Tropicana Las Vegas (2009-Present); Director: Guess?, Inc. (2005-Present); Director: Regal Entertainment Group (2005-Present); Director, USC Marshall School of Business Board of Leaders (2005-Present); Co-chair: Imagine the Arts Campaign, California State University-Northridge (2005-Present); Trustee: American Film Institute (2000-2007); Director: The Lincy Foundation (1989-Present); Chairman: The United Armenian Fund (1989-Present); Director and member of Executive Committee: MGM MIRAGE, Inc. (1989-2005). |
Additional Officers of the Funds | | | | | | | | | | |
| | | | | |
Clifford Greenberg 767 Fifth Avenue New York, NY 10153 Age: 51 | | Senior Vice President and Portfolio Manager | | 13 years | | Director and Senior Vice President: the Firm* (2003-Present); Vice President: Baron Capital, Inc. (1997-2003); Portfolio Manager: Baron Small Cap Fund (1997-Present). | | | 9 | | | None |
| | | | | |
Gretta J. Heaney 767 Fifth Avenue New York, NY 10153 Age: 50 | | Vice President and Chief Compliance Officer | | 7 years | | Vice President and Chief Compliance Officer: the Firm* (2003-Present), Baron Investment Funds Trust, Baron Select Funds (2004-Present), Baron USA Partners Fund, Ltd (2006-Present), Baron Managed Funds plc (2005-2009), Baron Capital Funds Trust (2003-06/07). | | | 9 | | | None |
| | | | | |
Patrick M. Patalino 767 Fifth Avenue New York, NY 10153 Age: 42 | | Vice President, General Counsel and Secretary | | 3 years | | Vice President and General Counsel: the Firm*, Baron Investment Funds Trust, Baron Select Funds, (08/07-Present); Baron USA Partners Fund, Ltd. (08/07-Present); Secretary: the Firm* (04/08-Present); Secretary: Baron Investment Funds Trust, Baron Select Funds (10/08-Present); Managing Director and Chief Operating Officer: Legal and Compliance Division, Morgan Stanley (01/06-06/07); Director of Regulatory Matters: Credit Suisse Securities (USA) (04/04-01/06); Counsel to Vice Chairman: Credit Suisse Securities (USA) (09/02-04/04). | | | 9 | | | None |
| | | | | |
Andrew Peck 767 Fifth Avenue New York, NY 10153 Age: 41 | | Senior Vice President and Portfolio Manager | | 8 years | | Portfolio Manager: Baron Asset Fund (01/08-Present); Vice President: BAMCO, Inc. (2003-Present); Vice President: Baron Investment Funds Trust (2003-Present); Vice President, Research Analyst: Baron Capital, Inc. (1998-2003); Co-Portfolio Manager: Baron Asset Fund (2003-01/08); Co-Portfolio Manager (mid cap accounts): Baron Capital Management, Inc. (04/06-Present). | | | 9 | | | None |
48
| | |
| September 30, 2010 | | Baron Funds |
| | | | | | | | | | | | |
| Name, Address & Age | | Position(s) Held
With the Funds | | Length of
Time Served | | Principal Occupation(s)
During the Past Five Years | | Number of
Portfolios
in Fund
Complex
Overseen
by Trustee | | | Other
Trustee/Directorships
Held by the Trustee |
Additional Officers of the Funds (continued) | | | | | | | | | | |
| | | | | |
Susan Robbins 767 Fifth Avenue New York, NY 10153 Age: 56 | | Vice President | | 23 years | | Director, Vice President and Senior Analyst: the Firm* (2003-Present); Vice President: Baron Investment Funds Trust (1994-Present), Baron Select Funds (2003-Present), Baron Capital Funds Trust (1998-06/07). | | | 9 | | | None |
| | | | | |
Peggy C. Wong 767 Fifth Avenue New York, NY 10153 Age: 49 | | Treasurer and Chief Financial Officer | | 23 years | | Chief Financial Officer and Treasurer: the Firm* (2003-Present), Baron Investment Funds Trust (1987-Present), Baron Select Funds (2003-Present), Baron USA Partners Fund, Ltd. (1993-Present), Baron Managed Funds plc. (2005-2009), Baron Capital Funds Trust (1998-06/07). | | | 9 | | | None |
| * | The Firm (Baron Capital Group, Inc. (“BCG”) with its subsidiaries BCI, Baron Capital Management, Inc. (“BCM”) and BAMCO). |
| (1) | Trustees deemed to be “Interested Trustees” of the Funds, as that term is defined in the 1940 Act by reason of their employment with the Funds’ Adviser and Distributor. |
| (2) | Members of the Executive Committee, which is empowered to exercise all of the powers, including the power to declare dividends, of the full Board when the full Board is not in session. |
| (3) | Members of the Audit Committee. |
| (4) | Members of the Nominating Committee. |
| (5) | Members of the Independent Committee. |
49
767 Fifth Avenue, 49th Fl.
New York, NY 10153
1.800.99.BARON
212-583-2000
www.BaronFunds.com
SEP10
Item 2. Code of Ethics.
The Registrant has adopted a Code of Ethics for Principal Executive and Senior Financial Officers (the “Code”). Upon request, the Registrant will provide a copy of the Code to any person without charge. To obtain a copy of the Code, please send your request to info@Baronfunds.com or call 1-800-99BARON (1-800-992-2766).
Item 3. Audit Committee Financial Expert.
The Registrant’s Board of Trustees has determined that the Registrant has two audit committee financial experts serving on its Audit Committee, Norman S. Edelcup and Raymond Noveck. Both Mr. Edelcup and Mr. Noveck are “independent” for purposes of Item 3(a)(2) of Form N-CSR.
Item 4. Principal Accountant Fees and Services.
The following table shows the fees paid to PricewaterhouseCoopers, LLP, the Registrant’s principal accounting firm during the fiscal years ended September 30, 2010 and September 30, 2009 (a) for professional services rendered for the audit of the Registrant’s annual financial statements or services that are normally provided in connection with statutory and regulatory filings or engagements (“Audit Fees”), (b) for assurance and related services that are reasonably related to the performance of the audit and are not included as Audit Fees (“Audit-Related Fees”), (c) for professional services rendered for tax compliance, tax advice and tax planning (“Tax Fees”), and (d) for products and services provided by such accounting firm that are not included in (a), (b) or (c) above (“All Other Fees”).
| | | | | | | | | | | | | | | | |
| For the Fiscal Year Ended: | | September 30, 2010 | | | September 30, 2009 | |
| | | Audit Fees | | | Tax Fees | | | Audit Fees | | | Tax Fees | |
Baron Asset Fund | | $ | 45,000 | | | $ | 11,450 | | | $ | 45,000 | | | $ | 15,300 | |
Baron Growth Fund | | | 47,250 | | | | 11,300 | | | | 47,250 | | | | 10,640 | |
Baron Small Cap Fund | | | 45,000 | | | | 12,250 | | | | 45,000 | | | | 12,390 | |
Baron Opportunity Fund | | | 25,000 | | | | 8,800 | | | | 25,000 | | | | 10,420 | |
Baron Fifth Avenue Growth Fund | | | 25,000 | | | | 12,850 | | | | 25,000 | | | | 13,030 | |
Pursuant to its charter, the Audit Committee shall pre-approve all audit and non-audit services provided by the independent auditors and in connection therewith to review and evaluate the qualifications, independence and performance of the Funds’ independent auditors.
Item 5. Audit Committee of Listed Registrants.
The Registrant has a separately-designated standing Audit Committee established in accordance with Section 3(a)(58)(A) of the Securities Exchange Act of 1934. The members of the Audit Committee are Norman S. Edelcup and Raymond Noveck.
Item 6. Schedule of Investments.
Included herein under Item 1.
Item 7. Disclosure of Proxy Voting Policies and Procedures for Closed-End Management Investment Companies.
Not applicable.
Item 8. Portfolio Managers of Closed-End Management Investment Companies.
Not applicable.
Item 9. Purchases of Equity Securities by Closed-End Management Investment Company and Affiliated Purchasers.
Not applicable.
Item 10. Submission of Matters to a Vote of Security Holders.
Not applicable.
Item 11. Controls and Procedures.
(a) The Registrant’s principal executive officer and principal financial officer have concluded that the Registrant’s disclosure controls and procedures (as defined in Rule 30a-3(c) under the Investment Company Act of 1940 (the “1940 Act”)) are effective based on their evaluation of these controls and procedures as of a date within 90 days of the filing date of this report.
(b) There were no changes in the Registrant’s internal control over financial reporting (as defined in Rule 30a-3(d) under the 1940 Act) that occurred during the Registrant’s second fiscal quarter of the period covered by this report that have materially affected, or are reasonably likely to materially affect, the Registrant’s internal control over financial reporting.
Item 12. Exhibits.
(a) (2) Certification of each of the principal executive officers and principal financial officers of the Registrant as required by Rule 30a-2 under the Act (17 CFR 270.30a-2) is attached hereto as a part of EX-99.CERT.
(b) Certification of each of the principal executive officers and principal financial officers of the Registrant as required by Section 906 of the Sarbanes-Oxley Act of 2002 is attached hereto as a part of EX-99.906CERT.
SIGNATURES
Pursuant to the requirements of the Securities Exchange Act of 1934 and the Investment Company Act of 1940, the registrant has duly caused this report to be signed on its behalf by the undersigned, thereunto duly authorized.
| | |
| BARON INVESTMENT FUNDS TRUST |
| |
| By: | | /s/ Ronald Baron |
| | Ronald Baron |
| | Chief Executive Officer |
|
| Date: November 22, 2010 |
Pursuant to the requirements of the Securities Exchange Act of 1934 and the Investment Company Act of 1940, this report has been signed below by the following persons on behalf of the registrant and in the capacities and on the dates indicated.
| | |
| By: | | /s/ Ronald Baron |
| | Ronald Baron |
| | Chief Executive Officer |
|
| Date: November 22, 2010 |
| |
| By: | | /s/ Peggy Wong |
| | Peggy Wong |
| | Treasurer and Chief Financial Officer |
|
| Date: November 22, 2010 |