| | | | |
OMB APPROVAL |
| OMB Number: | | 3235-0570 |
| Expires: | | June 30, 2017 |
| Estimated average burden |
Hours per response | | 20.6 |
UNITED STATES
SECURITIES AND EXCHANGE COMMISSION
Washington, DC 20549
FORM N-CSR
CERTIFIED SHAREHOLDER REPORT OF REGISTERED
MANAGEMENT INVESTMENT COMPANIES
Investment Company Act file number: 811-5032
BARON INVESTMENT FUNDS TRUST f/k/a
BARON ASSET FUND
(Exact Name of Registrant as Specified in Charter)
767 Fifth Avenue, 49th Floor
New York, NY 10153
(Address of Principal Executive Offices) (Zip Code)
Patrick M. Patalino, General Counsel
c/o Baron Investment Funds Trust
767 Fifth Avenue, 49th Floor
New York, NY 10153
(Name and Address of Agent for Service)
(Registrant’s Telephone Number, including Area Code): 212-583-2000
Date of fiscal year end: September 30
Date of reporting period: March 31, 2017
Form N-CSR is to be used by management investment companies to file reports with the Commission not later than 10 days after the transmission to stockholders of any report that is required to be transmitted to stockholders under Rule 30e-1 under the Investment Company Act of 1940 (17CRF 270.30e-1). The Commission may use the information provided on Form N-CSR in its regulatory, disclosure review, inspection, and policymaking roles.
A registrant is required to disclose the information specified by Form N-CSR, and the Commission will make this information public. A registrant is not required to respond to the collection of information contained in Form N-CSR unless the Form displays a currently valid Office of Management and Budget (“OMB”) control number. Please direct comments concerning the accuracy of the information collection burden estimate and suggestions for reducing the burden to Secretary, Securities and Exchange Commission, 450 5th Street, NW, Washington, D.C. 20549-0609. The OMB has reviewed this collection of information under the clearance requirements of 44 U.S.C. Section 3507.
Persons who are to respond to the collection of information contained in this form are not required to respond unless the form displays a currently valid OMB control number.
SEC 2569 (5-07)
Item 1. Report to Stockholders.
Baron Asset Fund
Baron Growth Fund
Baron Small Cap Fund
Baron Opportunity Fund
Baron Fifth Avenue Growth Fund
Baron Discovery Fund
March 31, 2017
Baron Funds®
Semi-Annual Financial Report
DEAR BARON FUNDS SHAREHOLDER:
In this report, you will find unaudited financial statements for Baron Asset Fund, Baron Growth Fund, Baron Small Cap Fund, Baron Opportunity Fund, Baron Fifth Avenue Growth Fund and Baron Discovery Fund (the “Funds”) for the six months ended March 31, 2017. The U.S. Securities and Exchange Commission (the “SEC”) requires mutual funds to furnish these statements semi-annually to their shareholders. We hope you find these statements informative and useful.
We thank you for choosing to join us as fellow shareholders in Baron Funds. We will continue to work hard to justify your confidence.
Sincerely,
| | | | |
 | |  | |  |
Ronald Baron Chief Executive Officer and Chief Investment Officer May 19, 2017 | | Linda S. Martinson Chairman, President and Chief Operating Officer May 19, 2017 | | Peggy Wong Treasurer and Chief Financial Officer May 19, 2017 |
This Semi-Annual Financial Report is for the Baron Investment Funds Trust, which currently has six series: Baron Asset Fund, Baron Growth Fund, Baron Small Cap Fund, Baron Opportunity Fund, Baron Fifth Avenue Growth Fund and Baron Discovery Fund. If you are interested in the Baron Select Funds, which contains the Baron Partners Fund, Baron Focused Growth Fund, Baron International Growth Fund, Baron Real Estate Fund, Baron Emerging Markets Fund, Baron Energy and Resources Fund and Baron Global Advantage Fund series, please visit the Funds’ website at www.BaronFunds.com or contact us at 1-800-99BARON.
The Funds’ Proxy Voting Policy is available without charge and can be found on the Funds’ website at www.BaronFunds.com, by clicking on the “Legal Notices” link at the bottom left corner of the homepage or by calling 1-800-99BARON and on the SEC’s website at www.sec.gov. The Funds’ most current proxy voting record, Form N-PX, is also available on the Funds’ website and on the SEC’s website.
The Funds file their complete schedules of portfolio holdings with the SEC for the first and third quarters of each fiscal year on Form N-Q. The Funds’ Forms N-Q are available on the SEC’s website at www.sec.gov. The Funds’ Forms N-Q may also be reviewed and copied at the SEC’s Public Reference Room in Washington, DC; information on the operation of the SEC’s Public Reference Room may be obtained by calling 1-202-551-8090. A copy of the Funds’ Forms N-Q may also be obtained upon request by calling 1-800-99BARON. Schedules of portfolio holdings current to the most recent quarter are also available on the Funds’ website.
Some of the comments contained in this report are based on current management expectations and are considered “forward-looking statements.” Actual future results, however, may prove to be different from our expectations. You can identify forward-looking statements by words such as “estimate,” “may,” “expect,” “should,” “could,” “believe,” “plan” and other similar terms. We cannot promise future returns and our opinions are a reflection of our best judgment at the time this report is compiled.
The views expressed in this report reflect those of BAMCO, Inc. (“BAMCO” or the “Adviser”) only through the end of the period stated in this report. The views are not intended as recommendations or investment advice to any person reading this report and are subject to change at any time without notice based on market and other conditions.
Past performance is no guarantee of future results. The investment return and principal value of an investment will fluctuate; an investor’s shares, when redeemed, may be worth more or less than their original cost. For more complete information about Baron Funds, including charges and expenses, call, write or go to www.BaronFunds.com for a prospectus or summary prospectus. Read them carefully before you invest or send money. This report is not authorized for use as an offer of sale or a solicitation of an offer to buy shares of the Funds, unless accompanied or preceded by the Funds’ current prospectus or summary prospectus.

| | |
| Baron Asset Fund (Unaudited) | | March 31, 2017 |
COMPARISONOFTHECHANGEIN VALUEOF $10,000INVESTMENTIN BARON ASSET FUND (RETAIL SHARES)
INRELATIONTOTHE RUSSELL MIDCAP GROWTH INDEXANDTHE S&P 500 INDEX

| | | | | | | | | | | | | | | | | | | | | | | | |
| AVERAGE ANNUAL TOTAL RETURNSFORTHEPERIODSENDED MARCH 31, 2017 | |
| | | Six
Months* | | | One
Year | | | Three
Years | | | Five
Years | | | Ten
Years | | | Since
Inception
(June 12,
1987) | |
Baron Asset Fund — Retail Shares1,2 | | | 10.08% | | | | 18.82% | | | | 8.34% | | | | 12.37% | | | | 7.25% | | | | 11.23% | |
Baron Asset Fund — Institutional Shares1,2,4 | | | 10.24% | | | | 19.15% | | | | 8.64% | | | | 12.69% | | | | 7.48% | | | | 11.31% | |
Baron Asset Fund — R6 Shares1,2,4 | | | 10.22% | | | | 19.13% | | | | 8.63% | | | | 12.68% | | | | 7.48% | | | | 11.31% | |
Russell Midcap Growth Index1 | | | 7.38% | | | | 14.07% | | | | 7.88% | | | | 11.95% | | | | 8.13% | | | | 9.83% | 3 |
S&P 500 Index1 | | | 10.12% | | | | 17.17% | | | | 10.37% | | | | 13.30% | | | | 7.51% | | | | 9.59% | |
| 1 | The indexes are unmanaged. The Russell MidcapTM Growth Index measures the performance of medium-sized U.S. companies that are classified as growth and the S&P 500 Index of 500 widely held large cap U.S. companies. The indexes and the Fund are with dividends, which positively impact the performance results. |
| 2 | Past performance is not predictive of future performance. The performance data does not reflect the deduction of taxes that a shareholder would pay on Fund distributions or redemption of Fund shares. The Fund’s transfer agency expenses may be reduced by expense offsets from an unaffiliated transfer agent, without which performance would have been lower. |
| 3 | For the period June 30, 1987 to March 31, 2017. |
| 4 | Performance for the Institutional Shares prior to May 29, 2009 is based on the performance of the Retail Shares. Performance for the R6 Shares prior to January 29, 2016 is based on the performance of the Institutional Shares, and prior to May 29, 2009 is based on the Retail Shares. The Retail Shares have a distribution fee, but Institutional Shares and R6 Shares do not. If the annual returns for the Institutional Shares and R6 Shares prior to May 29, 2009 did not reflect this fee, the returns would be higher. |
2
| | |
| March 31, 2017 (Unaudited) | | Baron Asset Fund |
TOP TEN HOLDINGSASOF MARCH 31, 2017
| | | | |
| | | Percent of Net Assets | |
IDEXX Laboratories, Inc. | | | 6.7% | |
Gartner, Inc. | | | 6.2% | |
Vail Resorts, Inc. | | | 5.2% | |
Arch Capital Group Ltd. | | | 4.5% | |
Mettler-Toledo International, Inc. | | | 4.5% | |
Verisk Analytics, Inc. | | | 3.9% | |
The Charles Schwab Corp. | | | 3.7% | |
FactSet Research Systems, Inc. | | | 2.7% | |
SBA Communications Corp. | | | 2.6% | |
Guidewire Software, Inc. | | | 2.6% | |
| | | | 42.6% | |
SECTOR BREAKDOWNASOF MARCH 31, 2017†
(as a percentage of net assets)

MANAGEMENT’S DISCUSSIONOF FUND PERFORMANCE
For the six-month period ended March 31, 2017, Baron Asset Fund1 increased 10.08%, while the Russell Midcap Growth Index gained 7.38% and the S&P 500 Index gained 10.12%.
Baron Asset Fund invests primarily in medium-sized growth companies for the long term, using a value-oriented purchase discipline. The Fund purchases companies that we believe have sustainable competitive advantages, strong financial characteristics, and exceptional management; and operate in industries with favorable growth characteristics.
The market’s reaction to the November 8 U.S. presidential election results dominated the period. After moving mostly sideways in September and October, equities embarked on a strong rally in early November, with major U.S. stock indexes establishing record highs in the period. Beneath the surface, the market experienced a significant rotation among sectors and investment approaches. Initially, the market responded to the possibility that the policies of a Trump administration would lead to increased infrastructure spending, higher inflation, higher interest rates, lower corporate taxes, and ultimately accelerated economic growth. Financials acted best, as those businesses benefit from higher interest rates. Industrials and Energy sectors rose as presumed beneficiaries of faster growth. Value outpaced growth. Early in 2017, leaders and laggards swapped positions. Information Technology, Health Care, and Consumer Discretionary led the markets, taking over from the prior sector leaders. In a reversal of the first half of the six-month period, growth stocks also outperformed value stocks.
The Fund’s investments in Health Care, Financials, and Consumer Discretionary contributed the most to performance. The Telecommunication Services and Energy sectors were modest detractors in the period.
Veterinary diagnostics leader IDEXX Laboratories, Inc. was the top contributor. The stock rallied on strong financial results and multiple expansion throughout the six-month period. Competitive trends are strong and improving, highlighted by instrument revenue growth, domestic lab growth, rising sales productivity, and stability in rapid assays. We believe that IDEXX’s direct go-to-market model coupled with research and development-driven product enhancements will put steady upward pressure on organic revenue and earnings growth over time.
The top detractor was FleetCor Technologies, Inc. Shares of this global payment processing services provider fell on disappointing results and a modest reduction in revenue guidance. Investors expected an acceleration in the second half of 2016, but organic growth modestly decelerated. Sentiment was also hit after a large contract loss and intensifying forex market headwinds. We expect these headwinds to abate and strong earnings growth to persist.
We continue to believe that mid-sized growth stocks represent an attractive investment opportunity. The U.S. economy remains among the world’s healthiest, its equity market multiples remain within the range of their long-term historic averages, and interest rates continue to be quite low by historic standards. We believe our diversified portfolio of fast growing, well managed, competitively advantaged businesses will continue to perform well in this environment. There is, of course, no guarantee that this will be the case.
| † | Industry sector group levels are provided by the Global Industry Classification Standard (“GICS”), developed and exclusively owned by MSCI, Inc. and Standard & Poor’s Financial Services LLC, unless otherwise stated that they have been classified by the Adviser. All GICS data is provided “as is” with no warranties. |
| 1 | Performance information reflects results of the Retail Shares. |
3
| | |
| Baron Growth Fund (Unaudited) | | March 31, 2017 |
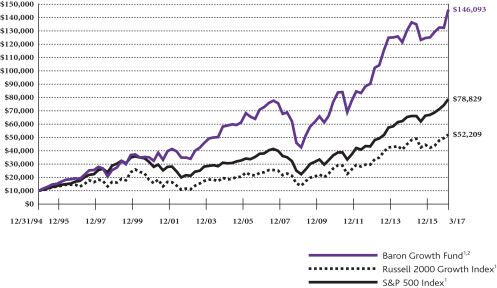
COMPARISONOFTHECHANGEIN VALUEOF $10,000INVESTMENTIN BARON GROWTH FUND (RETAIL SHARES)
INRELATIONTOTHE RUSSELL 2000 GROWTH INDEXANDTHE S&P 500 INDEX
| | | | | | | | | | | | | | | | | | | | | | | | |
| AVERAGE ANNUAL TOTAL RETURNSFORTHEPERIODSENDED MARCH 31, 2017 | |
| | | Six
Months* | | | One
Year | | | Three
Years | | | Five
Years | | | Ten
Years | | | Since
Inception
(December 31,
1994) | |
Baron Growth Fund — Retail Shares1,2 | | | 10.18% | | | | 16.70% | | | | 5.27% | | | | 11.54% | | | | 7.19% | | | | 12.81% | |
Baron Growth Fund — Institutional Shares1,2,3 | | | 10.32% | | | | 17.01% | | | | 5.54% | | | | 11.83% | | | | 7.40% | | | | 12.91% | |
Baron Growth Fund — R6 Shares1,2,3 | | | 10.32% | | | | 16.99% | | | | 5.54% | | | | 11.83% | | | | 7.40% | | | | 12.91% | |
Russell 2000 Growth Index1 | | | 9.11% | | | | 23.03% | | | | 6.72% | | | | 12.10% | | | | 8.06% | | | | 7.71% | |
S&P 500 Index1 | | | 10.12% | | | | 17.17% | | | | 10.37% | | | | 13.30% | | | | 7.51% | | | | 9.72% | |
| 1 | The indexes are unmanaged. The Russell 2000® Growth Index measures the performance of small-sized U.S. companies that are classified as growth and the S&P 500 Index of 500 widely held large cap U.S. companies. The indexes and the Fund are with dividends, which positively impact the performance results. |
| 2 | Past performance is not predictive of future performance. The performance data does not reflect the deduction of taxes that a shareholder would pay on Fund distributions or redemption of Fund shares. The Fund’s transfer agency expenses may be reduced by expense offsets from an unaffiliated transfer agent, without which performance would have been lower. |
| 3 | Performance for the Institutional Shares prior to May 29, 2009 is based on the performance of the Retail Shares. Performance for the R6 Shares prior to January 29, 2016 is based on the performance of the Institutional Shares, and prior to May 29, 2009 is based on the Retail Shares. The Retail Shares have a distribution fee, but Institutional Shares and R6 Shares do not. If the annual returns for the Institutional Shares and R6 Shares prior to May 29, 2009 did not reflect this fee, the returns would be higher. |
4
| | |
| March 31, 2017 (Unaudited) | | Baron Growth Fund |
TOP TEN HOLDINGSASOF MARCH 31, 2017
| | | | |
| | | Percent of Net Assets | |
Vail Resorts, Inc. | | | 7.1% | |
Arch Capital Group Ltd. | | | 6.1% | |
Gartner, Inc. | | | 4.4% | |
FactSet Research Systems, Inc. | | | 3.9% | |
IDEXX Laboratories, Inc. | | | 3.9% | |
CoStar Group, Inc. | | | 3.4% | |
Choice Hotels International, Inc. | | | 3.2% | |
SS&C Technologies Holdings, Inc. | | | 3.2% | |
MSCI, Inc. | | | 3.1% | |
Gaming and Leisure Properties, Inc. | | | 3.1% | |
| | | | 41.4% | |
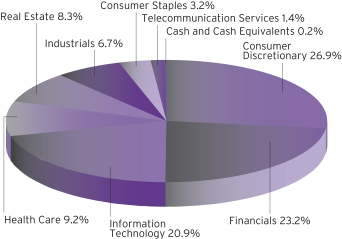
SECTOR BREAKDOWNASOF MARCH 31, 2017†
(as a percentage of net assets)
MANAGEMENT’S DISCUSSIONOF FUND PERFORMANCE
For the six-month period ended March 31, 2017, Baron Growth Fund1 gained 10.18%, while the Russell 2000 Growth Index gained 9.11% and the S&P 500 Index gained 10.12%.
Baron Growth Fund invests primarily in small-sized U.S. growth companies for the long term. Through independent research, we utilize an investment approach that we believe allows us to look at a business’s fundamental characteristics and beyond the current market environment. We invest based on the potential profitability of a business at what we believe are attractive valuations.
The market’s reaction to the November 8 U.S. presidential election results dominated the period. After moving mostly sideways in September and October, equities embarked on a strong rally in early November, with major U.S. stock indexes establishing record highs in the period. Beneath the surface, the market experienced a significant rotation among sectors and investment approaches. Initially, the market responded to the possibility that the policies of a Trump administration would lead to increased infrastructure spending, higher inflation, higher interest rates, lower corporate taxes, and ultimately accelerated economic growth. Financials acted best, as those businesses benefit from higher interest rates. Industrials and Energy sectors rose as presumed beneficiaries of faster growth. Value outpaced growth. Early in 2017, leaders and laggards swapped positions. Information Technology, Health Care, and Consumer Discretionary led the markets, taking over from the prior sector leaders. In a reversal of the first half of the six-month period, growth stocks also outperformed value stocks.
Financials, Consumer Discretionary, and Information Technology were the top contributing sectors in the period. Holdings in the Consumer Staples sector detracted slightly.
Vail Resorts, Inc. was the top contributor in the period. Shares of this operator of ski resorts in the U.S., Canada, and Australia increased on strong earnings growth due to increased visitation and spend levels in a strong ski season. We believe Vail’s recent acquisitions of Whistler Blackcomb, Park City in Utah, Perisher in Australia, and most recently, Stowe in Vermont, continue to help drive season pass sales and visitation, which, in turn, help insulate earnings from poor snowfall seasons and improve cash flow.
The top detractor was Under Armour, Inc. Shares of this athletic apparel company declined on reported earnings and guidance that missed Street expectations. Increased promotional activity, improved competitor positioning, and a key distributor’s bankruptcy lowered revenue. The company is attempting to diversify its wholesale distribution domestically while growing into other geographies and categories. We believe many of these issues are temporary and the long-term demand and earnings potential remain relatively intact.
The Fund continues to invest in a portfolio of businesses that have better financial characteristics than the benchmark index against which it is compared. These businesses have higher operating profit margins, net margins, EBITDA margins, return on invested capital, return on equity, return on assets, and lower standard deviations of earnings growth. While we do not try to predict short-term macro developments or current events, we believe conditions remain favorable for the U.S. economy and equity markets.
| † | Industry sector group levels are provided by the Global Industry Classification Standard (“GICS”), developed and exclusively owned by MSCI, Inc. and Standard & Poor’s Financial Services LLC, unless otherwise stated that they have been classified by the Adviser. All GICS data is provided “as is” with no warranties. |
| 1 | Performance information reflects results of the Retail Shares. |
5
| | |
| Baron Small Cap Fund (Unaudited) | | March 31, 2017 |
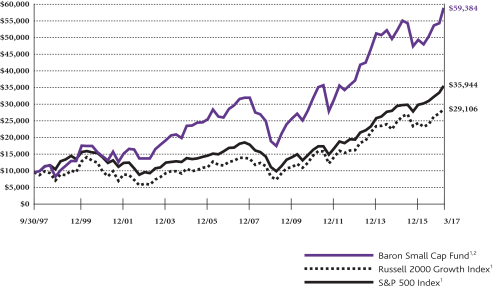
COMPARISONOFTHECHANGEIN VALUEOF $10,000INVESTMENTIN BARON SMALL CAP FUND (RETAIL SHARES)IN RELATIONTOTHE RUSSELL 2000 GROWTH INDEXANDTHE S&P 500 INDEX
| | | | | | | | | | | | | | | | | | | | | | | | |
| AVERAGE ANNUAL TOTAL RETURNSFORTHEPERIODSENDED MARCH 31, 2017 | |
| | | Six
Months* | | | One
Year | | | Three
Years | | | Five
Years | | | Ten
Years | | | Since
Inception
(September 30,
1997) | |
Baron Small Cap Fund — Retail Shares1,2 | | | 9.90% | | | | 22.74% | | | | 5.09% | | | | 10.50% | | | | 7.03% | | | | 9.57% | |
Baron Small Cap Fund — Institutional Shares1,2,3 | | | 10.05% | | | | 23.07% | | | | 5.36% | | | | 10.78% | | | | 7.25% | | | | 9.68% | |
Baron Small Cap Fund — R6 Shares1,2,3 | | | 10.05% | | | | 23.07% | | | | 5.36% | | | | 10.78% | | | | 7.25% | | | | 9.68% | |
Russell 2000 Growth Index1 | | | 9.11% | | | | 23.03% | | | | 6.72% | | | | 12.10% | | | | 8.06% | | | | 5.63% | |
S&P 500 Index1 | | | 10.12% | | | | 17.17% | | | | 10.37% | | | | 13.30% | | | | 7.51% | | | | 6.78% | |
| 1 | The indexes are unmanaged. The Russell 2000® Growth Index measures the performance of small-sized U.S. companies that are classified as growth and the S&P 500 Index of 500 widely held large cap U.S. companies. The indexes and the Fund are with dividends, which positively impact the performance results. |
| 2 | Past performance is not predictive of future performance. The performance data does not reflect the deduction of taxes that a shareholder would pay on Fund distributions or redemption of Fund shares. The Fund’s transfer agency expenses may be reduced by expense offsets from an unaffiliated transfer agent, without which performance would have been lower. |
| 3 | Performance for the Institutional Shares prior to May 29, 2009 is based on the performance of the Retail Shares. Performance for the R6 Shares prior to January 29, 2016 is based on the performance of the Institutional Shares, and prior to May 29, 2009 is based on the Retail Shares. The Retail Shares have a distribution fee, but Institutional Shares and R6 Shares do not. If the annual returns for the Institutional Shares and R6 Shares prior to May 29, 2009 did not reflect this fee, the returns would be higher. |
6
| | |
| March 31, 2017 (Unaudited) | | Baron Small Cap Fund |
TOP TEN HOLDINGSASOF MARCH 31, 2017
| | | | |
| | | Percent of Net Assets | |
Gartner, Inc. | | | 4.6% | |
Waste Connections, Inc. | | | 3.8% | |
IDEXX Laboratories, Inc. | | | 3.8% | |
Bright Horizons Family Solutions, Inc. | | | 3.8% | |
TransDigm Group, Inc. | | | 3.6% | |
SBA Communications Corp. | | | 2.9% | |
On Assignment, Inc. | | | 2.9% | |
Acuity Brands, Inc. | | | 2.7% | |
Guidewire Software, Inc. | | | 2.7% | |
Cognex Corp. | | | 2.5% | |
| | | | 33.3% | |
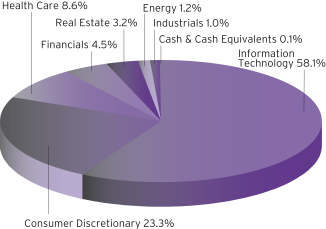
SECTOR BREAKDOWNASOF MARCH 31, 2017†
(as a percentage of net assets)

MANAGEMENT’S DISCUSSIONOF FUND PERFORMANCE
For the six-month period ended March 31, 2017, Baron Small Cap Fund1 gained 9.90%, while the Russell 2000 Growth Index increased 9.11% and the S&P 500 Index increased 10.12%.
Baron Small Cap Fund invests primarily in small-cap growth companies for the long term. The Fund invests in what we believe are well-run small-cap growth businesses that can be purchased at prices that represent a significant discount to our assessment of future value.
The market’s reaction to the November 8 U.S. presidential election results dominated the period. After moving mostly sideways in September and October, equities embarked on a strong rally in early November, with major U.S. stock indexes establishing record highs in the period. Beneath the surface, the market experienced a significant rotation among sectors and investment approaches. Initially, the market responded to the possibility that the policies of a Trump administration would lead to increased infrastructure spending, higher inflation, higher interest rates, lower corporate taxes, and ultimately accelerated economic growth. Financials acted best, as those businesses benefit from higher interest rates. Industrials and Energy sectors rose as presumed beneficiaries of faster growth. Value outpaced growth. Early in 2017, leaders and laggards swapped positions. Information Technology, Health Care, and Consumer Discretionary led the markets, taking over from the prior sector leaders. In a reversal of the first half of the six-month period, growth stocks also outperformed value stocks.
Investments in Consumer Discretionary, Information Technology, and Industrials were the top contributors to performance. Holdings in Telecommunication Services detracted slightly.
Veterinary diagnostics leader IDEXX Laboratories, Inc. was the top contributor. The stock rallied on strong financial results and multiple expansion. Competitive trends are strong and improving, highlighted by instrument revenue growth, domestic lab growth, rising sales productivity, and stability in rapid assays. We believe that IDEXX’s direct go-to-market model coupled with research and development-driven product enhancements will put steady upward pressure on organic revenue and earnings growth over time.
Aircraft parts supplier TransDigm Group, Inc. was the top detractor. Shares fell due to a short seller report accusing the company of improper government contracting practices. Our analysis indicates that no actual infractions likely occurred; but if they did, they were minor missteps affecting a small part of the business and any penalties will likely be minimal. Meanwhile, the company continued to execute its unique, proprietary, protected aircraft parts franchise at a high level of profitability.
Baron Small Cap Fund invests primarily in classic growth stocks that we believe have significant long-term growth prospects and can be purchased at what we believe are attractive prices because their prospects have not yet been appreciated by investors. We also invest in fallen angels, which are companies that we believe have strong long-term franchises but have disappointed investors with short-term results, creating what we believe is a buying opportunity. A third category of investments is special situations, including spin-offs and recapitalizations, where lack of investor awareness creates opportunities to purchase what we believe are strong businesses at attractive prices.
| † | Industry sector group levels are provided by the Global Industry Classification Standard (“GICS”), developed and exclusively owned by MSCI, Inc. and Standard & Poor’s Financial Services LLC, unless otherwise stated that they have been classified by the Adviser. All GICS data is provided “as is” with no warranties. |
| 1 | Performance information reflects results of the Retail Shares. |
7
| | |
| Baron Opportunity Fund (Unaudited) | | March 31, 2017 |
COMPARISONOFTHECHANGEIN VALUEOF $10,000INVESTMENTIN BARON OPPORTUNITY FUND† (RETAIL SHARES)
INRELATIONTOTHE RUSSELL 3000 GROWTH INDEXANDTHE S&P 500 INDEX

| | | | | | | | | | | | | | | | | | | | | | | | |
| AVERAGE ANNUAL TOTAL RETURNSFORTHEPERIODSENDED MARCH 31, 2017 | |
| | | Six
Months* | | | One
Year | | | Three
Years | | | Five
Years | | | Ten
Years | | | Since
Inception
(February 29,
2000) | |
Baron Opportunity Fund — Retail Shares1,2 | | | 7.95% | | | | 18.72% | | | | 3.18% | | | | 7.82% | | | | 7.23% | | | | 5.04% | |
Baron Opportunity Fund — Institutional Shares1,2,3 | | | 8.12% | | | | 19.09% | | | | 3.47% | | | | 8.10% | | | | 7.46% | | | | 5.17% | |
Baron Opportunity Fund — R6 Shares1,2,3 | | | 8.12% | | | | 19.16% | | | | 3.49% | | | | 8.11% | | | | 7.46% | | | | 5.18% | |
Russell 3000 Growth Index1 | | | 9.94% | | | | 16.27% | | | | 10.90% | | | | 13.22% | | | | 9.04% | | | | 3.21% | |
S&P 500 Index1 | | | 10.12% | | | | 17.17% | | | | 10.37% | | | | 13.30% | | | | 7.51% | | | | 5.28% | |
| † | The Fund’s historical performance was impacted by gains from IPOs and/or secondary offerings. There is no guarantee that these results can be repeated or that the Fund’s level of participation in IPOs and secondary offerings will be the same in the future. |
| 1 | The indexes are unmanaged. The Russell 3000® Growth Index measures the performance of those companies classified as growth among the largest 3,000 U.S. companies, and the S&P 500 Index of 500 widely held large cap U.S. companies. The indexes and the Fund are with dividends, which positively impact the performance results. |
| 2 | Past performance is not predictive of future performance. The performance data does not reflect the deduction of taxes that a shareholder would pay on Fund distributions or redemption of Fund shares. The Adviser has reimbursed certain Fund expenses and the Fund’s transfer agency expenses may be reduced by expense offsets from an unaffiliated transfer agent, without which performance would have been lower. |
| 3 | Performance for the Institutional Shares prior to May 29, 2009 is based on the performance of the Retail Shares. Performance for the R6 Shares prior to August 31, 2016 is based on the performance of the Institutional Shares, and prior to May 29, 2009 is based on the Retail Shares. The Retail Shares have a distribution fee, but Institutional Shares and R6 Shares do not. If the annual returns for the Institutional Shares and R6 Shares prior to May 29, 2009 did not reflect this fee, the returns would be higher. |
8
| | |
| March 31, 2017 (Unaudited) | | Baron Opportunity Fund |
TOP TEN HOLDINGSASOF MARCH 31, 2017
| | | | |
| | | Percent of Net Assets | |
Amazon.com, Inc. | | | 7.2% | |
CoStar Group, Inc. | | | 5.9% | |
Guidewire Software, Inc. | | | 5.4% | |
Gartner, Inc. | | | 5.2% | |
Tesla, Inc. | | | 5.0% | |
Alphabet Inc. | | | 4.3% | |
Acxiom Corporation | | | 3.8% | |
Visa, Inc. | | | 3.0% | |
Netflix, Inc. | | | 2.9% | |
ServiceNow, Inc. | | | 2.6% | |
| | | | 45.3% | |
SECTOR BREAKDOWNASOF MARCH 31, 2017†
(as a percentage of net assets)
MANAGEMENT’S DISCUSSIONOF FUND PERFORMANCE
For the six-month period ended March 31, 2017, Baron Opportunity Fund1 gained 7.95%, while the Russell 3000 Growth Index gained 9.94% and the S&P 500 Index gained 10.12%.
Baron Opportunity Fund invests primarily in U.S. growth companies that we believe are driving or benefiting from innovation, through development of pioneering, transformative, or technologically advanced products and services. The Fund invests in high growth businesses of any market capitalization, selected for their capital appreciation potential.
The market’s reaction to the November 8 U.S. presidential election results dominated the period. After moving mostly sideways in September and October, equities embarked on a strong rally in early November, with major U.S. stock indexes establishing record highs in the period. Beneath the surface, the market experienced a significant rotation among sectors and investment approaches. Initially, the market responded to the possibility that the policies of a Trump administration would lead to increased infrastructure spending, higher inflation, higher interest rates, lower corporate taxes, and ultimately accelerated economic growth. Financials acted best, as those businesses benefit from higher interest rates. Industrials and Energy sectors rose as presumed beneficiaries of faster growth. Value outpaced growth. Early in 2017, leaders and laggards swapped positions. Information Technology, Health Care, and Consumer Discretionary led the markets, taking over from the prior sector leaders. In a reversal of the first half of the six-month period, growth stocks also outperformed value stocks.
Investments in Consumer Discretionary, Information Technology, and Health Care contributed to the Fund’s performance during the period. Energy and Telecommunication Services holdings detracted slightly.
The top contributor to Fund performance was electric vehicle company Tesla, Inc. Shares rose following the company’s launch of GigaFactory, one of the world’s largest manufacturing facilities, which will potentially drive significant cost reduction. Tesla is on target for a 2017 launch of its mass market Model 3, potentially the largest product cycle in history. Additionally, the company’s SolarCity merger is on track, showing less cash drain than initially feared by investors. We believe a pro-U.S. jobs administration is a tailwind for Tesla as it is one of North America’s fastest growing employers.
The top detractor was benefits software vendor Benefitfocus, Inc. Shares were down after the company reported 2017 guidance that was lower than analysts expected. We see several short-term headwinds, including longer implementation periods for national accounts, slower employer signings because of a sales restructuring, and a revenue share of BenefitStore commissions. While we believe these headwinds will weigh on reported growth through mid-2017, we don’t believe they impact the significant long-term opportunity.
We remain focused on finding unique businesses across different segments of the economy that we believe offer long-term secular growth, sustainable competitive advantages, high-quality management teams, and attractive stock prices. We believe that investment returns for stocks are driven by earnings growth, and therefore direct our research towards understanding the drivers of business profit and projecting future profit growth as accurately as we can.
| † | Industry sector group levels are provided by the Global Industry Classification Standard (“GICS”), developed and exclusively owned by MSCI, Inc. and Standard & Poor’s Financial Services LLC, unless otherwise stated that they have been classified by the Adviser. All GICS data is provided “as is” with no warranties. |
| 1 | Performance information reflects results of the Retail Shares. |
9
| | |
| Baron Fifth Avenue Growth Fund (Unaudited) | | March 31, 2017 |
COMPARISONOFTHECHANGEIN VALUEOF $10,000INVESTMENTIN BARON FIFTH AVENUE GROWTH FUND (RETAIL SHARES)INRELATIONTOTHE RUSSELL 1000 GROWTH INDEXANDTHE S&P 500 INDEX

| | | | | | | | | | | | | | | | | | | | | | | | |
| AVERAGE ANNUAL TOTAL RETURNSFORTHEPERIODSENDED MARCH 31, 2017 | |
| | | Six
Months* | | | One
Year | | | Three
Years | | | Five
Years | | | Ten
Years | | | Since
Inception
(April 30,
2004) | |
Baron Fifth Avenue Growth Fund — Retail Shares1,2 | | | 7.75% | | | | 18.67% | | | | 8.93% | | | | 11.57% | | | | 6.71% | | | | 7.47% | |
Baron Fifth Avenue Growth Fund — Institutional Shares1,2,3 | | | 7.90% | | | | 19.00% | | | | 9.20% | | | | 11.87% | | | | 6.92% | | | | 7.63% | |
Baron Fifth Avenue Growth Fund — R6 Shares1,2,3 | | | 7.90% | | | | 19.06% | | | | 9.21% | | | | 11.88% | | | | 6.92% | | | | 7.63% | |
Russell 1000 Growth Index1 | | | 10.01% | | | | 15.76% | | | | 11.27% | | | | 13.32% | | | | 9.13% | | | | 8.80% | |
S&P 500 Index1 | | | 10.12% | | | | 17.17% | | | | 10.37% | | | | 13.30% | | | | 7.51% | | | | 8.28% | |
| 1 | The indexes are unmanaged. The Russell 1000® Growth Index measures the performance of large-sized U.S. companies that are classified as growth and the S&P 500 Index of 500 widely held large cap U.S. companies. The indexes and the Fund are with dividends, which positively impact the performance results. |
| 2 | Past performance is not predictive of future performance. The performance data does not reflect the deduction of taxes that a shareholder would pay on Fund distributions or redemption of Fund shares. The Adviser has reimbursed certain Fund expenses and the Fund’s transfer agency expenses may be reduced by expense offsets from an unaffiliated transfer agent, without which performance would have been lower. |
| 3 | Performance for the Institutional Shares prior to May 29, 2009 is based on the performance of the Retail Shares. Performance for the R6 Shares prior to January 29, 2016 is based on the performance of the Institutional Shares, and prior to May 29, 2009 is based on the Retail Shares. The Retail Shares have a distribution fee, but Institutional Shares and R6 Shares do not. If the annual returns for the Institutional Shares and R6 Shares prior to May 29, 2009 did not reflect this fee, the returns would be higher. |
10
| | |
| March 31, 2017 (Unaudited) | | Baron Fifth Avenue Growth Fund |
TOP TEN HOLDINGSASOF MARCH 31, 2017
| | | | |
| | | Percent of Net Assets | |
Amazon.com, Inc. | | | 15.6% | |
Alibaba Group Holding Limited | | | 6.6% | |
Alphabet Inc. | | | 6.6% | |
Facebook, Inc. | | | 6.1% | |
Equinix, Inc. | | | 5.2% | |
The Priceline Group, Inc. | | | 5.1% | |
Visa, Inc. | | | 4.9% | |
Mastercard Incorporated | | | 4.8% | |
Illumina, Inc. | | | 3.5% | |
Apple, Inc. | | | 3.5% | |
| | | | 61.9% | |
SECTOR BREAKDOWNASOF MARCH 31, 2017†
(as a percentage of net assets)
MANAGEMENT’S DISCUSSIONOF FUND PERFORMANCE
For the six-month period ended March 31, 2017, Baron Fifth Avenue Growth Fund1 gained 7.75%, while the Russell 1000 Growth Index gained 10.01% and the S&P 500 Index gained 10.12%.
Baron Fifth Avenue Growth Fund focuses on identifying and investing in what we believe are unique companies with sustainable competitive advantages that have the ability to redeploy capital at high rates of return. The portfolio is constructed on a bottom-up basis, with the quality of ideas and conviction level the most important determinants of the size of
each investment. We expect our highest conviction businesses to have meaningful weight in the portfolio. Sector weightings are incidental to portfolio construction, and exposure to any sector is a result of stock selection.
The market’s reaction to the November 8 U.S. presidential election results dominated the period. After moving mostly sideways in September and October, equities embarked on a strong rally in early November, with major U.S. stock indexes establishing record highs in the period. Beneath the surface, the market experienced a significant rotation among sectors and investment approaches. Initially, the market responded to the possibility that the policies of a Trump administration would lead to increased infrastructure spending, higher inflation, higher interest rates, lower corporate taxes, and ultimately accelerated economic growth. Financials acted best, as those businesses benefit from higher interest rates. Industrials and Energy sectors rose as presumed beneficiaries of faster growth. Value outpaced growth. Early in 2017, leaders and laggards swapped positions. Information Technology, Health Care, and Consumer Discretionary led the markets, taking over from the prior sector leaders. In a reversal of the first half of the six-month period, growth stocks also outperformed value stocks.
Information Technology, Financials, and Consumer Discretionary were the top contributing sectors in the period. The Health Care and Energy sectors detracted.
The top contributor to Fund performance was Mobileye N.V. Shares of this designer and manufacturer of vision-based advanced driver assistance systems increased after Intel made an offer to buy the company. We have long believed in the potential for Mobileye to become the “Intel Inside” of the future of cars. We think Mobileye’s entrepreneurial management team has clear goals that can benefit society, and we look forward to its product development around semi-autonomous and autonomous driving.
Shares of athletic apparel company Under Armour, Inc. fell due to several challenges, including increased competition, weak consumer dynamics, and decreased distribution as a result of retailer bankruptcies. The company has lowered 2017 earnings guidance as it plans to increase spending to drive sales growth. We exited our position.
The Fund seeks to manage risk by focusing on business risk (competition, management, regulations), valuation risk (purchase price providing a large enough margin of safety), financial risk (leverage and capital structure), and analysis risk (our assumptions). Our objective is not to predict how markets may perform in a given year. Instead, we aim to create a portfolio of unique companies with different end markets because, in our experience, this is the best way to manage market risk over time.
| † | Industry sector group levels are provided by the Global Industry Classification Standard (“GICS”), developed and exclusively owned by MSCI, Inc. and Standard & Poor’s Financial Services LLC, unless otherwise stated that they have been classified by the Adviser. All GICS data is provided “as is” with no warranties. |
| 1 | Performance information reflects results of the Retail Shares. |
11
| | |
| Baron Discovery Fund (Unaudited) | | March 31, 2017 |
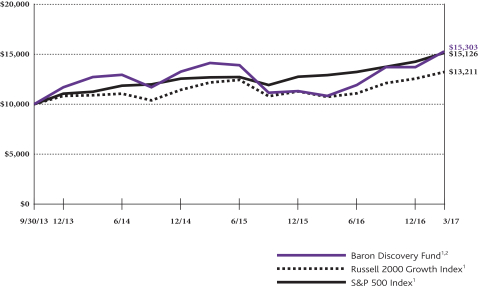
COMPARISONOFTHECHANGEIN VALUEOF $10,000INVESTMENTIN BARON DISCOVERY FUND† (RETAIL SHARES)
INRELATIONTOTHE RUSSELL 2000 GROWTH INDEXANDTHE S&P 500 INDEX
| | | | | | | | | | | | | | | | |
| AVERAGE ANNUAL TOTAL RETURNSFORTHEPERIODSENDED MARCH 31, 2017 | |
| | | Six
Months* | | | One
Year | | | Three
Years | | | Since
Inception
(September 30,
2013) | |
Baron Discovery Fund — Retail Shares1,2 | | | 11.49% | | | | 41.47% | | | | 6.36% | | | | 12.91% | |
Baron Discovery Fund — Institutional Shares1,2 | | | 11.63% | | | | 41.89% | | | | 6.61% | | | | 13.18% | |
Baron Discovery Fund — R6 Shares1,2,3 | | | 11.70% | | | | 41.98% | | | | 6.63% | | | | 13.20% | |
Russell 2000 Growth Index1 | | | 9.11% | | | | 23.03% | | | | 6.72% | | | | 8.28% | |
S&P 500 Index1 | | | 10.12% | | | | 17.17% | | | | 10.37% | | | | 12.55% | |
| † | The Fund’s historical performance was impacted by gains from IPOs and/or secondary offerings. There is no guarantee that these results can be repeated or that the Fund’s level of participation in IPOs and secondary offerings will be the same in the future. |
| 1 | The indexes are unmanaged. The Russell 2000® Growth Index measures the performance of small-sized U.S. companies that are classified as growth and the S&P 500 Index of 500 widely held large cap U.S. companies. The indexes and the Fund are with dividends, which positively impact the performance results. |
| 2 | Past performance is not predictive of future performance. The performance data does not reflect the deduction of taxes that a shareholder would pay on Fund distributions or redemption of Fund shares. The Adviser has reimbursed certain Fund expenses and the Fund’s transfer agency expenses may be reduced by expense offsets from an unaffiliated transfer agent, without which performance would have been lower. |
| 3 | Performance for the R6 Shares prior to August 31, 2016 is based on the performance of the Institutional Shares. |
12
| | |
| March 31, 2017 (Unaudited) | | Baron Discovery Fund |
TOP TEN HOLDINGSASOF MARCH 31, 2017
| | | | |
| | | Percent of Net Assets | |
Qualys, Inc. | | | 3.9% | |
Mercury Systems, Inc. | | | 3.8% | |
MACOM Technology Solutions Holdings, Inc. | | | 3.7% | |
Red Rock Resorts, Inc. | | | 3.1% | |
Wingstop Inc. | | | 2.8% | |
The Trade Desk, Inc. | | | 2.7% | |
Liberty Expedia Holdings, Inc. | | | 2.7% | |
Impinj, Inc. | | | 2.5% | |
Varonis Systems, Inc. | | | 2.4% | |
Flexion Therapeutics Inc. | | | 2.4% | |
| | | | 30.0% | |
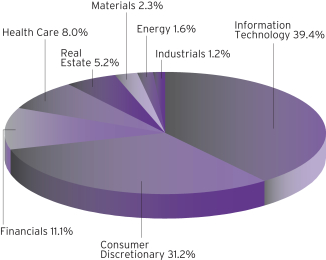
SECTOR BREAKDOWNASOF MARCH 31, 2017†
(as a percentage of net assets)

MANAGEMENT’S DISCUSSIONOF FUND PERFORMANCE
For the six-month period ended March 31, 2017, Baron Discovery Fund1 increased 11.49%, while the Russell 2000 Growth Index gained 9.11% and the S&P 500 Index gained 10.12%.
Baron Discovery Fund invests primarily in small-sized U.S. companies with significant growth potential and market capitalizations up to the weighted median market capitalization of the Russell 2000 Growth Index at reconstitution, or companies with market capitalizations up to $1.5 billion, whichever is larger. The Fund invests for the long term at attractive valuations in appropriately capitalized companies with, in our view, open-ended growth opportunities, exceptional leadership, and sustainable competitive advantages.
The market’s reaction to the November 8 U.S. presidential election results dominated the period. After moving mostly sideways in September and October, equities embarked on a strong rally in early November, with major U.S. stock indexes establishing record highs in the period. Beneath the surface, the market experienced a significant rotation among sectors and investment approaches. Initially, the market responded to the possibility that the policies of a Trump administration would lead to increased infrastructure spending, higher inflation, higher interest rates, lower corporate taxes, and ultimately accelerated economic growth. Financials acted best, as those businesses benefit from higher interest rates. Industrials and Energy sectors rose as presumed beneficiaries of faster growth. Value outpaced growth. Early in 2017, leaders and laggards swapped positions. Information Technology, Health Care, and Consumer Discretionary led the markets, taking over from the prior sector leaders. In a reversal of the first half of the six-month period, growth stocks also outperformed value stocks.
The Industrials, Information Technology, and Health Care sectors contributed the most in the period. Real Estate and Materials detracted.
The top contributor in the period was Mercury Systems, Inc., a provider of complex electronic subsystems to major defense contractors. Shares were up in the period as Mercury continued to win contract awards and completed a successful secondary offering to provide funding for accretive future acquisitions. We believe defense spending and outsourcing will continue to grow under the new presidential administration, which could benefit Mercury.
The top detractor was medical imaging company Novadaq Technologies Inc. Shares declined due to what we think was a misunderstanding regarding the halting of a clinical trial in colon resection. Novadaq’s devices, which show blood flow, have been clinically proven to dramatically improve outcomes in many types of surgeries. We believe that revenue will continue to grow by close to 30%, and that at the current valuation the company is a potentially great investment.
We think the long-term fundamentals of our companies remain strong. We believe the companies we own are high quality, innovative and run by excellent management teams. We are optimistic that they will be significantly bigger next year than they are today and that this growth can continue for years after. There is, of course, no guarantee that this will be the case.
| † | Industry sector group levels are provided by the Global Industry Classification Standard (“GICS”), developed and exclusively owned by MSCI, Inc. and Standard & Poor’s Financial Services LLC, unless otherwise stated that they have been classified by the Adviser. All GICS data is provided “as is” with no warranties. |
| 1 | Performance information reflects results of the Retail Shares. |
13
| | |
| Baron Asset Fund | | March 31, 2017 |
STATEMENT OF NET ASSETS (Unaudited)
| | | | | | | | | | | | |
| Shares | | | | | Cost | | | Value | |
| Common Stocks (98.77%) | |
| Consumer Discretionary (13.38%) | |
| | | | Automotive Retail (1.36%) | | | | | | | | |
| | 92,000 | | | Advance Auto Parts, Inc. | | $ | 15,941,373 | | | $ | 13,639,920 | |
| | 388,000 | | | CarMax, Inc.1 | | | 4,415,017 | | | | 22,977,360 | |
| | | | | | | | | | | | |
| | | | | | | 20,356,390 | | | | 36,617,280 | |
| | | |
| | | | Hotels, Resorts & Cruise Lines (2.23%) | | | | | | | | |
| | 525,400 | | | Choice Hotels International, Inc. | | | 2,254,244 | | | | 32,890,040 | |
| | 500,000 | | | Hyatt Hotels Corp., Cl A1 | | | 13,523,436 | | | | 26,990,000 | |
| | | | | | | | | | | | |
| | | | | | | 15,777,680 | | | | 59,880,040 | |
| | | |
| | | | Internet & Direct Marketing Retail (3.12%) | | | | | | | | |
| | 212,000 | | | Expedia, Inc. | | | 25,262,837 | | | | 26,748,040 | |
| | 32,000 | | | The Priceline Group, Inc.1 | | | 5,125,131 | | | | 56,959,040 | |
| | | | | | | | | | | | |
| | | | | | | 30,387,968 | | | | 83,707,080 | |
| | | |
| | | | Leisure Facilities (5.18%) | | | | | | | | |
| | 725,000 | | | Vail Resorts, Inc. | | | 14,063,109 | | | | 139,127,500 | |
| | | |
| | | | Specialty Stores (1.49%) | | | | | | | | |
| | 260,000 | | | Tiffany & Co. | | | 8,018,828 | | | | 24,778,000 | |
| | 220,000 | | | Tractor Supply Co. | | | 6,736,191 | | | | 15,173,400 | |
| | | | | | | | | | | | |
| | | | | | | 14,755,019 | | | | 39,951,400 | |
| | | | | | | | | | | | |
| | Total Consumer Discretionary | | | 95,340,166 | | | | 359,283,300 | |
| | | | | | | | | | | | |
|
| Energy (0.52%) | |
| | | | Oil & Gas Exploration & Production (0.52%) | | | | | | | | |
| | 107,500 | | | Concho Resources, Inc.1 | | | 4,595,625 | | | | 13,796,550 | |
| | | | | | | | | | | | |
|
| Financials (17.10%) | |
| | | | Asset Management & Custody Banks (0.63%) | | | | | | | | |
| | 250,000 | | | T. Rowe Price Group, Inc. | | | 6,031,231 | | | | 17,037,500 | |
| | | |
| | | | Financial Exchanges & Data (4.28%) | | | | | | | | |
| | 435,000 | | | FactSet Research Systems, Inc. | | | 23,564,473 | | | | 71,735,850 | |
| | 230,000 | | | MarketAxess Holdings, Inc. | | | 25,489,330 | | | | 43,122,700 | |
| | | | | | | | | | | | |
| | | | | | | 49,053,803 | | | | 114,858,550 | |
| | | |
| | | | Insurance Brokers (2.31%) | | | | | | | | |
| | 475,000 | | | Willis Towers Watson plc2 | | | 58,514,776 | | | | 62,172,750 | |
| | | |
| | | | Investment Banking & Brokerage (3.72%) | | | | | | | | |
| | 2,450,000 | | | The Charles Schwab Corp. | | | 2,351,369 | | | | 99,984,500 | |
| | | |
| | | | Property & Casualty Insurance (4.50%) | | | | | | | | |
| | 1,275,000 | | | Arch Capital Group Ltd.1,2 | | | 13,874,064 | | | | 120,831,750 | |
| | | |
| | | | Regional Banks (1.66%) | | | | | | | | |
| | 475,000 | | | First Republic Bank | | | 15,197,602 | | | | 44,559,750 | |
| | | | | | | | | | | | |
| | Total Financials | | | 145,022,845 | | | | 459,444,800 | |
| | | | | | | | | | | | |
| | | | | | | | | | | | |
| Shares | | | | | Cost | | | Value | |
| Common Stocks (continued) | |
| Health Care (22.06%) | |
| | | | Health Care Distributors (2.13%) | | | | | | | | |
| | 337,000 | | | Henry Schein, Inc.1 | | $ | 9,010,382 | | | $ | 57,279,890 | |
| | | | Health Care Equipment (7.47%) | | | | | | | | |
| | 1,161,000 | | | IDEXX Laboratories, Inc.1 | | | 22,010,924 | | | | 179,502,210 | |
| | 110,000 | | | Teleflex, Inc. | | | 17,089,386 | | | | 21,310,300 | |
| | | | | | | | | | | | |
| | | | | | | 39,100,310 | | | | 200,812,510 | |
| | | |
| | | | Health Care Facilities (0.69%) | | | | | | | | |
| | 148,000 | | | Universal Health Services, Inc., Cl B | | | 8,389,889 | | | | 18,418,600 | |
| | | |
| | | | Health Care Supplies (3.64%) | | | | | | | | |
| | 240,000 | | | The Cooper Companies, Inc. | | | 30,555,224 | | | | 47,973,600 | |
| | 610,000 | | | West Pharmaceutical Services, Inc. | | | 26,714,894 | | | | 49,782,100 | |
| | | | | | | | | | | | |
| | | | | | | 57,270,118 | | | | 97,755,700 | |
| | | |
| | | | Life Sciences Tools & Services (8.13%) | | | | | | | | |
| | 380,000 | | | Bio-Techne Corporation | | | 36,982,041 | | | | 38,627,000 | |
| | 352,000 | | | Illumina, Inc.1 | | | 15,181,108 | | | | 60,065,280 | |
| | 250,000 | | | Mettler-Toledo International, Inc.1 | | | 15,496,167 | | | | 119,727,500 | |
| | | | | | | | | | | | |
| | | | | | | 67,659,316 | | | | 218,419,780 | |
| | | | | | | | | | | | |
| | Total Health Care | | | 181,430,015 | | | | 592,686,480 | |
| | | | | | | | | | | | |
|
| Industrials (15.26%) | |
| | | | Aerospace & Defense (0.45%) | | | | | | | | |
| | 255,000 | | | BWX Technologies, Inc. | | | 12,127,190 | | | | 12,138,000 | |
| | | |
| | | | Building Products (0.61%) | | | | | | | | |
| | 320,000 | | | AO Smith Corp. | | | 15,918,938 | | | | 16,371,200 | |
| | | |
| | | | Construction Machinery & Heavy Trucks (1.86%) | | | | | | | | |
| | 90,000 | | | WABCO Holdings, Inc.1 | | | 10,455,704 | | | | 10,567,800 | |
| | 505,000 | | | Westinghouse Air Brake Technologies Corporation | | | 33,676,456 | | | | 39,390,000 | |
| | | | | | | | | | | | |
| | | | | | | 44,132,160 | | | | 49,957,800 | |
| | | |
| | | | Electrical Components & Equipment (0.72%) | | | | | | | | |
| | 95,000 | | | Acuity Brands, Inc. | | | 19,770,549 | | | | 19,380,000 | |
| | | |
| | | | Environmental & Facilities Services (0.80%) | | | | | | | | |
| | 581,087 | | | Rollins, Inc. | | | 16,726,225 | | | | 21,575,760 | |
| | | |
| | | | Industrial Conglomerates (1.85%) | | | | | | | | |
| | 240,000 | | | Roper Technologies, Inc. | | | 20,050,484 | | | | 49,557,600 | |
| | | |
| | | | Industrial Machinery (2.61%) | | | | | | | | |
| | 430,000 | | | IDEX Corporation | | | 31,397,849 | | | | 40,209,300 | |
| | 220,000 | | | The Middleby Corp.1 | | | 10,736,494 | | | | 30,019,000 | |
| | | | | | | | | | | | |
| | | | | | | 42,134,343 | | | | 70,228,300 | |
| | |
| 14 | | See Notes to Financial Statements. |
| | |
| March 31, 2017 | | Baron Asset Fund |
STATEMENT OF NET ASSETS (Unaudited) (Continued)
| | | | | | | | | | | | |
| Shares | | | | | Cost | | | Value | |
| Common Stocks (continued) | |
| Industrials (continued) | |
| | | | Research & Consulting Services (5.07%) | | | | | | | | |
| | 740,000 | | | Nielsen Holdings PLC2 | | $ | 17,543,972 | | | $ | 30,569,400 | |
| | 1,300,000 | | | Verisk Analytics, Inc.1 | | | 33,418,943 | | | | 105,482,000 | |
| | | | | | | | | | | | |
| | | | | | | 50,962,915 | | | | 136,051,400 | |
| | | |
| | | | Trading Companies & Distributors (1.29%) | | | | | | | | |
| | 675,000 | | | Fastenal Co. | | | 11,933,597 | | | | 34,762,500 | |
| | | | | | | | | | | | |
| | Total Industrials | | | 233,756,401 | | | | 410,022,560 | |
| | | | | | | | | | | | |
| Information Technology (22.58%) | |
| | | | Application Software (7.37%) | | | | | | | | |
| | 550,000 | | | ANSYS, Inc.1 | | | 14,771,001 | | | | 58,778,500 | |
| | 220,000 | | | CDK Global, Inc. | | | 10,973,416 | | | | 14,302,200 | |
| | 1,220,000 | | | Guidewire Software, Inc.1 | | | 58,902,936 | | | | 68,722,600 | |
| | 285,000 | | | Mobileye N.V.1,2 | | | 7,329,168 | | | | 17,499,000 | |
| | 919,000 | | | SS&C Technologies Holdings, Inc. | | | 25,120,157 | | | | 32,532,600 | |
| | 32,000 | | | The Ultimate Software Group, Inc.1 | | | 6,098,077 | | | | 6,246,720 | |
| | | | | | | | | | | | |
| | | | | | | 123,194,755 | | | | 198,081,620 | |
| | | |
| | | | Data Processing & Outsourced Services (4.22%) | | | | | | | | |
| | 277,000 | | | FleetCor Technologies, Inc.1 | | | 10,071,962 | | | | 41,946,110 | |
| | 400,000 | | | MAXIMUS, Inc. | | | 20,233,990 | | | | 24,880,000 | |
| | 725,000 | | | Vantiv, Inc., Cl A1 | | | 39,304,846 | | | | 46,487,000 | |
| | | | | | | | | | | | |
| | | | | | | 69,610,798 | | | | 113,313,110 | |
| | | |
| | | | Internet Software & Services (4.76%) | | | | | | | | |
| | 200,000 | | | CoStar Group, Inc.1 | | | 34,528,695 | | | | 41,444,000 | |
| | 650,000 | | | Verisign, Inc.1 | | | 31,889,164 | | | | 56,621,500 | |
| | 270,872 | | | Zillow Group, Inc., Cl A1 | | | 7,666,898 | | | | 9,158,183 | |
| | 614,000 | | | Zillow Group, Inc., CI C1 | | | 15,676,412 | | | | 20,673,380 | |
| | | | | | | | | | | | |
| | | | | | | 89,761,169 | | | | 127,897,063 | |
| | | |
| | | | IT Consulting & Other Services (6.23%) | | | | | | | | |
| | 1,550,000 | | | Gartner, Inc.1 | | | 33,739,350 | | | | 167,384,500 | |
| | | | | | | | | | | | |
| | Total Information Technology | | | 316,306,072 | | | | 606,676,293 | |
| | | | | | | | | | | | |
|
| Real Estate (7.87%) | |
| | | | Office REITs (1.00%) | | | | | | | | |
| | 62,000 | | | Alexander’s, Inc.3 | | | 2,779,303 | | | | 26,775,320 | |
| | | |
| | | | Real Estate Services (2.07%) | | | | | | | | |
| | 1,600,000 | | | CBRE Group, Inc., Cl A1 | | | 19,628,157 | | | | 55,664,000 | |
| | | |
| | | | Specialized REITs (4.80%) | | | | | | | | |
| | 144,505 | | | Equinix, Inc. | | | 9,802,123 | | | | 57,855,467 | |
| | 590,000 | | | SBA Communications Corp.1 | | | 16,542,706 | | | | 71,018,300 | |
| | | | | | | | | | | | |
| | | | | | | 26,344,829 | | | | 128,873,767 | |
| | | | | | | | | | | | |
| | Total Real Estate | | | 48,752,289 | | | | 211,313,087 | |
| | | | | | | | | | | | |
| | Total Common Stocks | | | 1,025,203,413 | | | | 2,653,223,070 | |
| | | | | | | | | | | | |
| | | | | | | | | | | | |
| Shares | | | | | Cost | | | Value | |
| Private Equity Investments (0.12%) | |
| Financials (0.12%) | |
| | | | Asset Management & Custody Banks (0.12%) | | | | | | | | |
| | 7,056,223 | | | Windy City Investments Holdings, L.L.C.1,3,4,6 | | $ | 0 | | | $ | 3,245,862 | |
| | | | | | | | | | | | |
| Principal Amount | | | | | | |
| Short Term Investments (0.95%) | |
| | $25,551,931 | | | Repurchase Agreement with Fixed Income Clearing Corp., dated 3/31/2017, 0.09% due 4/3/2017; Proceeds at maturity - $25,552,122; (Fully collateralized by $26,440,000 U.S. Treasury Inflation Indexed Note, 0.125% due 7/15/2026; Market value - $26,063,732)5 | | | 25,551,931 | | | | 25,551,931 | |
| | | | | | | | | | | | |
| | Total Investments (99.84%) | | $ | 1,050,755,344 | | | | 2,682,020,863 | |
| | | | | | | | | | | | |
| | Cash and Other Assets Less Liabilities (0.16%) | | | | 4,384,921 | |
| | | | | | | | | | | | |
| | Net Assets | | | $ | 2,686,405,784 | |
| | | | | | | | | | | | |
| Retail Shares (Equivalent to $63.73 per share
based on 29,087,303 shares outstanding) |
| | $ | 1,853,709,690 | |
| | | | | | | | | | | | |
| Institutional Shares (Equivalent to $65.62 per share
based on 12,557,782 shares outstanding) |
| | $ | 824,077,418 | |
| | | | | | | | | | | | |
| R6 Shares (Equivalent to $65.61 per share
based on 131,357 shares outstanding) |
| | $ | 8,618,676 | |
| | | | | | | | | | | | |
| % | Represents percentage of net assets. |
| 1 | Non-income producing securities. |
| 3 | The Adviser has reclassified/classified certain securities in or out of this sub-industry. Such reclassifications/classifications are not supported by S&P or MSCI. |
| 4 | At March 31, 2017, the market value of restricted and fair valued securities amounted to $3,245,862 or 0.12% of net assets. This security is not deemed liquid. See Note 6 regarding Restricted Securities. |
| 5 | Level 2 security. See Note 7 regarding Fair Value Measurements. |
| 6 | Level 3 security. See Note 7 regarding Fair Value Measurements. |
All securities are Level 1, unless otherwise noted.
| | |
| See Notes to Financial Statements. | | 15 |
| | |
| Baron Growth Fund | | March 31, 2017 |
STATEMENT OF NET ASSETS (Unaudited)
| | | | | | | | | | | | |
| Shares | | | | | Cost | | | Value | |
| Common Stocks (99.58%) | |
| Consumer Discretionary (26.89%) | |
| | | | Apparel, Accessories & Luxury Goods (2.15%) | | | | | | | | |
| | 3,475,000 | | | Under Armour, Inc., Cl A1 | | $ | 13,912,447 | | | $ | 68,735,500 | |
| | 3,190,000 | | | Under Armour, Inc., Cl C1 | | | 12,023,168 | | | | 58,377,000 | |
| | | | | | | | | | | | |
| | | | | | | 25,935,615 | | | | 127,112,500 | |
| | | |
| | | | Casinos & Gaming (2.83%) | | | | | | | | |
| | 4,155,000 | | | Penn National Gaming, Inc.1 | | | 36,915,622 | | | | 76,576,650 | |
| | 2,625,000 | | | Pinnacle Entertainment, Inc.1 | | | 29,435,112 | | | | 51,240,000 | |
| | 1,760,582 | | | Red Rock Resorts, Inc., Cl A | | | 34,437,581 | | | | 39,049,709 | |
| | | | | | | | | | | | |
| | | | | | | 100,788,315 | | | | 166,866,359 | |
| | | |
| | | | Education Services (3.48%) | | | | | | | | |
| | 1,985,000 | | | Bright Horizons Family Solutions, Inc.1 | | | 64,647,112 | | | | 143,892,650 | |
| | 2,423,500 | | | Nord Anglia Education, Inc.1,2 | | | 45,906,790 | | | | 61,411,490 | |
| | | | | | | | | | | | |
| | | | | | | 110,553,902 | | | | 205,304,140 | |
| | | |
| | | | Hotels, Resorts & Cruise Lines (5.90%) | | | | | | | | |
| | 3,007,500 | | | Choice Hotels International, Inc.4 | | | 73,061,456 | | | | 188,269,500 | |
| | 1,600,000 | | | Marriott Vacations Worldwide Corp.4 | | | 87,504,361 | | | | 159,888,000 | |
| | | | | | | | | | | | |
| | | | | | | 160,565,817 | | | | 348,157,500 | |
| | | |
| | | | Internet & Direct Marketing Retail (0.34%) | | | | | | | | |
| | 11,704,702 | | | AO World plc (United Kingdom)1,2 | | | 26,353,820 | | | | 19,797,516 | |
| | | |
| | | | Leisure Facilities (7.44%) | | | | | | | | |
| | 1,100,000 | | | ClubCorp Holdings, Inc. | | | 19,230,077 | | | | 17,655,000 | |
| | 2,196,993 | | | Vail Resorts, Inc.4 | | | 80,228,702 | | | | 421,602,957 | |
| | | | | | | | | | | | |
| | | | | | | 99,458,779 | | | | 439,257,957 | |
| | | |
| | | | Movies & Entertainment (1.56%) | | | | | | | | |
| | 5,450,018 | | | Manchester United plc, Cl A2 | | | 77,159,985 | | | | 92,105,304 | |
| | | |
| | | | Restaurants (2.00%) | | | | | | | | |
| | 450,000 | | | Panera Bread Co., Cl A1 | | | 15,602,751 | | | | 117,841,500 | |
| | | |
| | | | Specialty Stores (1.19%) | | | | | | | | |
| | 1,450,000 | | | Dick’s Sporting Goods, Inc. | | | 22,908,317 | | | | 70,557,000 | |
| | | | | | | | | | | | |
| | Total Consumer Discretionary | | | 639,327,301 | | | | 1,586,999,776 | |
| | | | | | | | | | | | |
|
| Consumer Staples (3.19%) | |
| | | | Food Distributors (0.45%) | | | | | | | | |
| | 1,105,000 | | | Performance Food Group Co.1 | | | 20,995,000 | | | | 26,299,000 | |
| | | |
| | | | Food Retail (0.43%) | | | | | | | | |
| | 2,100,000 | | | Smart & Final Stores, Inc.1 | | | 35,919,688 | | | | 25,410,000 | |
| | | |
| | | | Household Products (1.48%) | | | | | | | | |
| | 1,750,000 | | | Church & Dwight Co., Inc. | | | 15,890,587 | | | | 87,272,500 | |
| | | |
| | | | Packaged Foods & Meats (0.83%) | | | | | | | | |
| | 580,000 | | | TreeHouse Foods, Inc.1 | | | 19,567,560 | | | | 49,102,800 | |
| | | | | | | | | | | | |
| | Total Consumer Staples | | | 92,372,835 | | | | 188,084,300 | |
| | | | | | | | | | | | |
| | | | | | | | | | | | |
| Shares | | | | | Cost | | | Value | |
| Common Stocks (continued) | |
| Financials (23.20%) | |
| | | | Asset Management & Custody Banks (4.63%) | | | | | | | | |
| | 1,500,000 | | | The Carlyle Group | | $ | 32,844,320 | | | $ | 23,925,000 | |
| | 2,140,000 | | | Cohen & Steers, Inc. | | | 54,011,768 | | | | 85,535,800 | |
| | 2,250,000 | | | Financial Engines, Inc. | | | 63,928,705 | | | | 97,987,500 | |
| | 1,455,195 | | | Oaktree Capital Group, LLC | | | 65,648,565 | | | | 65,920,333 | |
| | | | | | | | | | | | |
| | | | | | | 216,433,358 | | | | 273,368,633 | |
| | | |
| | | | Financial Exchanges & Data (8.56%) | | | | | | | | |
| | 1,395,000 | | | FactSet Research Systems, Inc. | | | 70,024,081 | | | | 230,049,450 | |
| | 1,185,000 | | | Morningstar, Inc. | | | 30,128,461 | | | | 93,141,000 | |
| | 1,875,000 | | | MSCI, Inc. | | | 35,989,456 | | | | 182,231,250 | |
| | | | | | | | | | | | |
| | | | | | | 136,141,998 | | | | 505,421,700 | |
| | | |
| | | | Investment Banking & Brokerage (0.58%) | | | | | | | | |
| | 775,000 | | | Moelis & Co., Cl A | | | 22,607,788 | | | | 29,837,500 | |
| | 250,000 | | | Virtu Financial, Inc., Cl A | | | 4,750,000 | | | | 4,250,000 | |
| | | | | | | | | | | | |
| | | | | | | 27,357,788 | | | | 34,087,500 | |
| | | |
| | | | Life & Health Insurance (3.01%) | | | | | | | | |
| | 2,160,000 | | | Primerica, Inc. | | | 47,146,305 | | | | 177,552,000 | |
| | | |
| | | | Property & Casualty Insurance (6.18%) | | | | | | | | |
| | 3,800,000 | | | Arch Capital Group Ltd.1,2 | | | 36,852,471 | | | | 360,126,000 | |
| | 147,000 | | | Kinsale Capital Group, Inc. | | | 4,042,500 | | | | 4,709,880 | |
| | | | | | | | | | | | |
| | | | | | | 40,894,971 | | | | 364,835,880 | |
| | | |
| | | | Thrifts & Mortgage Finance (0.24%) | | | | | | | | |
| | 400,000 | | | Essent Group, Ltd.1,2 | | | 9,483,065 | | | | 14,468,000 | |
| | | | | | | | | | | | |
| | Total Financials | | | 477,457,485 | | | | 1,369,733,713 | |
| | | | | | | | | | | | |
|
| Health Care (9.17%) | |
| | | | Health Care Equipment (4.15%) | | | | | | | | |
| | 348,374 | | | Glaukos Corporation1 | | | 11,729,755 | | | | 17,871,586 | |
| | 1,470,000 | | | IDEXX Laboratories, Inc.1 | | | 22,572,748 | | | | 227,276,700 | |
| | | | | | | | | | | | |
| | | | | | | 34,302,503 | | | | 245,148,286 | |
| | | |
| | | | Health Care Supplies (1.62%) | | | | | | | | |
| | 365,038 | | | Neogen Corp.1 | | | 8,075,677 | | | | 23,928,241 | |
| | 875,000 | | | West Pharmaceutical Services, Inc. | | | 30,383,156 | | | | 71,408,750 | |
| | | | | | | | | | | | |
| | | | | | | 38,458,833 | | | | 95,336,991 | |
| | | |
| | | | Health Care Technology (0.51%) | | | | | | | | |
| | 2,395,957 | | | Inovalon Holdings, Inc., CI A1 | | | 53,135,542 | | | | 30,189,058 | |
| | | |
| | | | Life Sciences Tools & Services (2.89%) | | | | | | | | |
| | 875,000 | | | Bio-Techne Corporation | | | 46,302,066 | | | | 88,943,750 | |
| | 170,000 | | | Mettler-Toledo International, Inc.1 | | | 7,810,313 | | | | 81,414,700 | |
| | | | | | | | | | | | |
| | | | | | | 54,112,379 | | | | 170,358,450 | |
| | | | | | | | | | | | |
| | Total Health Care | | | 180,009,257 | | | | 541,032,785 | |
| | | | | | | | | | | | |
| | |
| 16 | | See Notes to Financial Statements. |
| | |
| March 31, 2017 | | Baron Growth Fund |
STATEMENT OF NET ASSETS (Unaudited) (Continued)
| | | | | | | | | | | | |
| Shares | | | | | Cost | | | Value | |
| Common Stocks (continued) | |
| Industrials (6.70%) | |
| | | | Building Products (4.14%) | | | | | | | | |
| | 2,000,000 | | | CaesarStone Ltd.1,2,4 | | $ | 39,958,972 | | | $ | 72,500,000 | |
| | 1,380,000 | | | Masonite International Corp.1,2 | | | 76,932,413 | | | | 109,365,000 | |
| | 900,000 | | | Trex Company, Inc.1 | | | 32,905,548 | | | | 62,451,000 | |
| | | | | | | | | | | | |
| | | | | | | 149,796,933 | | | | 244,316,000 | |
| | | |
| | | | Industrial Machinery (1.91%) | | | | | | | | |
| | 825,000 | | | The Middleby Corp.1 | | | 23,225,508 | | | | 112,571,250 | |
| | | |
| | | | Trading Companies & Distributors (0.65%) | | | | | | | | |
| | 1,000,000 | | | Air Lease Corp. | | | 23,203,508 | | | | 38,750,000 | |
| | | | | | | | | | | | |
| | Total Industrials | | | 196,225,949 | | | | 395,637,250 | |
| | | | | | | | | | | | |
|
| Information Technology (20.90%) | |
| | | | Application Software (7.93%) | | | | | | | | |
| | 1,600,000 | | | ANSYS, Inc.1 | | | 37,902,179 | | | | 170,992,000 | |
| | 1,190,000 | | | Guidewire Software, Inc.1 | | | 38,711,926 | | | | 67,032,700 | |
| | 1,000,000 | | | Pegasystems, Inc. | | | 13,997,009 | | | | 43,850,000 | |
| | 5,265,000 | | | SS&C Technologies Holdings, Inc. | | | 43,555,278 | | | | 186,381,000 | |
| | | | | | | | | | | | |
| | | | | | | 134,166,392 | | | | 468,255,700 | |
| | | |
| | | | Data Processing & Outsourced Services (2.50%) | | | | | | | | |
| | 2,375,000 | | | MAXIMUS, Inc. | | | 44,768,159 | | | | 147,725,000 | |
| | | |
| | | | Electronic Components (0.76%) | | | | | | | | |
| | 280,000 | | | Littelfuse, Inc. | | | 31,472,950 | | | | 44,774,800 | |
| | | |
| | | | Internet Software & Services (4.70%) | | | | | | | | |
| | 2,324,374 | | | Benefitfocus, Inc.1,4 | | | 86,529,482 | | | | 64,966,253 | |
| | 975,000 | | | CoStar Group, Inc.1 | | | 42,637,436 | | | | 202,039,500 | |
| | 156,672 | | | Wix.com Ltd.1,2 | | | 7,560,889 | | | | 10,638,029 | |
| | | | | | | | | | | | |
| | | | | | | 136,727,807 | | | | 277,643,782 | |
| | | |
| | | | IT Consulting & Other Services (5.01%) | | | | | | | | |
| | 950,000 | | | Booz Allen Hamilton Holding Corp. | | | 10,162,552 | | | | 33,620,500 | |
| | 2,425,000 | | | Gartner, Inc.1 | | | 37,453,863 | | | | 261,875,750 | |
| | | | | | | | | | | | |
| | | | | | | 47,616,415 | | | | 295,496,250 | |
| | | | | | | | | | | | |
| | Total Information Technology | | | 394,751,723 | | | | 1,233,895,532 | |
| | | | | | | | | | | | |
|
| Real Estate (8.31%) | |
| | | | Diversified REITs (0.50%) | | | | | | | | |
| | 710,000 | | | American Assets Trust, Inc. | | | 13,409,206 | | | | 29,706,400 | |
| | | |
| | | | Office REITs (3.35%) | | | | | | | | |
| | 124,000 | | | Alexander’s, Inc.5 | | | 23,989,393 | | | | 53,550,640 | |
| | 3,750,000 | | | Douglas Emmett, Inc. | | | 50,560,518 | | | | 144,000,000 | |
| | | | | | | | | | | | |
| | | | | | | 74,549,911 | | | | 197,550,640 | |
| | | |
| | | | Specialized REITs (4.46%) | | | | | | | | |
| | 750,000 | | | Alexandria Real Estate Equities, Inc.5 | | | 27,827,790 | | | | 82,890,000 | |
| | 5,400,000 | | | Gaming and Leisure Properties, Inc. | | | 119,506,198 | | | | 180,468,000 | |
| | | | | | | | | | | | |
| | | | | | | 147,333,988 | | | | 263,358,000 | |
| | | | | | | | | | | | |
| | Total Real Estate | | | 235,293,105 | | | | 490,615,040 | |
| | | | | | | | | | | | |
| | | | | | | | | | | | |
| Shares | | | | | Cost | | | Value | |
| Common Stocks (continued) | |
| Telecommunication Services (1.22%) | |
| | | | Alternative Carriers (1.22%) | | | | | | | | |
| | 7,493,437 | | | Iridium Communications, Inc.1,4 | | $ | 45,709,971 | | | $ | 72,311,667 | |
| | | | | | | | | | | | |
| | Total Common Stocks | | | 2,261,147,626 | | | | 5,878,310,063 | |
| | | | | | | | | | | | |
| | | | | | | | | | | | |
| Preferred Stocks (0.24%) | |
| Telecommunication Services (0.24%) | |
| | | | Alternative Carriers (0.24%) | | | | | | | | |
| | 41,074 | | | Iridium Communications, Inc., Series B, 6.75%4,6 | | | 10,268,500 | | | | 14,098,651 | |
| | | | | | | | | | | | |
| | | | | | | | | | | | |
| Private Equity Investments (0.02%) | |
| Financials (0.02%) | |
| | | | Asset Management & Custody Banks (0.02%) | | | | | | | | |
| | 2,375,173 | | | Windy City Investments Holdings, L.L.C.1,3,5,7 | | | 0 | | | | 1,092,580 | |
| | | | | | | | | | | | |
| | Total Investments (99.84%) | | $ | 2,271,416,126 | | | | 5,893,501,294 | |
| | | | | | | | | | | | |
| | Cash and Other Assets Less Liabilities (0.16%) | | | | 9,357,514 | |
| | | | | | | | | | | | |
| | Net Assets | | | $ | 5,902,858,808 | |
| | | | | | | | | | | | |
| Retail Shares (Equivalent to $65.64 per share
based on 41,672,320 shares outstanding) |
| | $ | 2,735,249,812 | |
| | | | | | | | | | | | |
| Institutional Shares (Equivalent to $67.15 per share
based on 47,135,693 shares outstanding) |
| | $ | 3,164,956,909 | |
| | | | | | | | | | | | |
| R6 Shares (Equivalent to $67.15 per share
based on 39,494 shares outstanding) |
| | $ | 2,652,087 | |
| | | | | | | | | | | | |
| % | Represents percentage of net assets. |
| 1 | Non-income producing securities. |
| 3 | At March 31, 2017, the market value of restricted and fair valued securities amounted to $1,092,580 or 0.02% of net assets. This security is not deemed liquid. See Note 6 regarding Restricted Securities. |
| 4 | See Note 10 regarding “Affiliated” companies. |
| 5 | The Adviser has reclassified/classified certain securities in or out of this sub-industry. Such reclassifications/classifications are not supported by S&P or MSCI. |
| 6 | Level 2 security. See Note 7 regarding Fair Value Measurements. |
| 7 | Level 3 security. See Note 7 regarding Fair Value Measurements. |
All securities are Level 1, unless otherwise noted.
| | |
| See Notes to Financial Statements. | | 17 |
| | |
| Baron Small Cap Fund | | March 31, 2017 |
STATEMENT OF NET ASSETS (Unaudited)
| | | | | | | | | | | | |
| Shares | | | | | Cost | | | Value | |
| Common Stocks (98.76%) | |
| Consumer Discretionary (18.64%) | |
| | | | Automotive Retail (1.05%) | | | | | | | | |
| | 1,100,000 | | | Camping World Holdings, Inc., Cl A | | $ | 25,857,601 | | | $ | 35,464,000 | |
| | | |
| | | | Cable & Satellite (3.26%) | | | | | | | | |
| | 100,000 | | | Liberty Broadband Corporation, Cl A1 | | | 404,823 | | | | 8,509,000 | |
| | 300,000 | | | Liberty Broadband Corporation, Cl C1 | | | 1,184,602 | | | | 25,920,000 | |
| | 150,000 | | | Liberty SiriusXM Group, Cl A1 | | | 305,046 | | | | 5,838,000 | |
| | 1,200,000 | | | Liberty SiriusXM Group, Cl C1 | | | 2,632,540 | | | | 46,536,000 | |
| | 1,000,000 | | | MSG Networks Inc., Cl A1 | | | 7,003,117 | | | | 23,350,000 | |
| | | | | | | | | | | | |
| | | | | | | 11,530,128 | | | | 110,153,000 | |
| | | |
| | | | Casinos & Gaming (1.15%) | | | | | | | | |
| | 1,750,000 | | | Red Rock Resorts, Inc., Cl A | | | 35,354,171 | | | | 38,815,000 | |
| | | |
| | | | Education Services (6.09%) | | | | | | | | |
| | 1,750,000 | | | Bright Horizons Family Solutions, Inc.1 | | | 57,731,206 | | | | 126,857,500 | |
| | 3,100,000 | | | Nord Anglia Education, Inc.1,2 | | | 56,903,384 | | | | 78,554,000 | |
| | | | | | | | | | | | |
| | | | | | | 114,634,590 | | | | 205,411,500 | |
| | | |
| | | | Internet & Direct Marketing Retail (1.15%) | | | | | | | | |
| | 850,000 | | | Liberty Expedia Holdings, Inc., Cl A1 | | | 36,289,832 | | | | 38,658,000 | |
| | | |
| | | | Movies & Entertainment (2.24%) | | | | | | | | |
| | 750,000 | | | Liberty Media Corporation - Liberty Formula One, Cl C (formerly, Liberty Media Group, Cl C)1 | | | 10,168,679 | | | | 25,612,500 | |
| | 250,000 | | | The Madison Square Garden Company, Cl A1 | | | 13,336,230 | | | | 49,927,500 | |
| | | | | | | | | | | | |
| | | | | | | 23,504,909 | | | | 75,540,000 | |
| | | |
| | | | Restaurants (2.76%) | | | | | | | | |
| | 500,000 | | | BJ’s Restaurants, Inc.1 | | | 16,384,828 | | | | 20,200,000 | |
| | 500,000 | | | The Cheesecake Factory, Inc. | | | 9,055,187 | | | | 31,680,000 | |
| | 850,000 | | | Wingstop Inc.1 | | | 20,620,955 | | | | 24,038,000 | |
| | 934,569 | | | Zoe’s Kitchen, Inc.1 | | | 23,954,573 | | | | 17,289,527 | |
| | | | | | | | | | | | |
| | | | | | | 70,015,543 | | | | 93,207,527 | |
| | | |
| | | | Specialty Stores (0.94%) | | | | | | | | |
| | 2,250,000 | | | Party City Holdco, Inc.1 | | | 32,984,775 | | | | 31,612,500 | |
| | | | | | | | | | | | |
| | Total Consumer Discretionary | | | 350,171,549 | | | | 628,861,527 | |
| | | | | | | | | | | | |
|
| Consumer Staples (0.62%) | |
| | | | Food Distributors (0.62%) | | | | | | | | |
| | 1,500,000 | | | The Chefs’ Warehouse, Inc.1,3 | | | 22,433,215 | | | | 20,850,000 | |
| | | | | | | | | | | | |
|
| Energy (2.28%) | |
| | | | Oil & Gas Storage & Transportation (2.28%) | | | | | | | | |
| | 400,000 | | | Dominion Midstream Partners, L.P. | | | 8,400,000 | | | | 12,780,000 | |
| | 800,000 | | | PBF Logistics LP | | | 20,465,744 | | | | 17,240,000 | |
| | 2,500,000 | | | Scorpio Tankers Inc.2 | | | 20,750,000 | | | | 11,100,000 | |
| | 745,500 | | | Valero Energy Partners LP | | | 20,810,301 | | | | 35,716,905 | |
| | | | | | | | | | | | |
| | Total Energy | | | 70,426,045 | | | | 76,836,905 | |
| | | | | | | | | | | | |
| | | | | | | | | | | | |
| Shares | | | | | Cost | | | Value | |
| Common Stocks (continued) | |
| Financials (2.63%) | |
| | | | Asset Management & Custody Banks (1.29%) | | | | | | | | |
| | 1,000,000 | | | Financial Engines, Inc. | | $ | 14,907,587 | | | $ | 43,550,000 | |
| | | |
| | | | Financial Exchanges & Data (0.48%) | | | | | | | | |
| | 200,000 | | | CBOE Holdings, Inc. | | | 15,498,427 | | | | 16,214,000 | |
| | | |
| | | | Investment Banking & Brokerage (0.86%) | | | | | | | | |
| | 750,000 | | | Moelis & Co., Cl A | | | 18,642,401 | | | | 28,875,000 | |
| | | | | | | | | | | | |
| | Total Financials | | | 49,048,415 | | | | 88,639,000 | |
| | | | | | | | | | | | |
|
| Health Care (16.86%) | |
| | | | Biotechnology (0.46%) | | | | | | | | |
| | 1,500,000 | | | Abcam plc (United Kingdom)2 | | | 14,075,553 | | | | 15,514,040 | |
| | | |
| | | | Health Care Equipment (6.85%) | | | | | | | | |
| | 500,000 | | | Cantel Medical Corp. | | | 20,804,109 | | | | 40,050,000 | |
| | 750,000 | | | DexCom, Inc.1 | | | 10,073,448 | | | | 63,547,500 | |
| | 825,000 | | | IDEXX Laboratories, Inc.1 | | | 12,962,146 | | | | 127,553,250 | |
| | | | | | | | | | | | |
| | | | | | | 43,839,703 | | | | 231,150,750 | |
| | | |
| | | | Health Care Supplies (1.08%) | | | | | | | | |
| | 1,250,000 | | | The Spectranetics Corporation1 | | | 33,281,895 | | | | 36,406,250 | |
| | | |
| | | | Life Sciences Tools & Services (6.90%) | | | | | | | | |
| | 800,000 | | | ICON plc1,2 | | | 22,757,019 | | | | 63,776,000 | |
| | 750,000 | | | INC Research Holdings, Inc., Cl A1 | | | 15,497,628 | | | | 34,387,500 | |
| | 150,000 | | | Mettler-Toledo International, Inc.1 | | | 7,800,480 | | | | 71,836,500 | |
| | 25,000 | | | Patheon N.V.1,2 | | | 525,000 | | | | 658,500 | |
| | 950,000 | | | PRA Health Sciences, Inc.1 | | | 17,544,444 | | | | 61,968,500 | |
| | | | | | | | | | | | |
| | | | | | | 64,124,571 | | | | 232,627,000 | |
| | | |
| | | | Managed Health Care (1.57%) | | | | | | | | |
| | 1,250,000 | | | HealthEquity, Inc.1 | | | 21,851,091 | | | | 53,062,500 | |
| | | | | | | | | | | | |
| | Total Health Care | | | 177,172,813 | | | | 568,760,540 | |
| | | | | | | | | | | | |
|
| Industrials (22.85%) | |
| | | | Aerospace & Defense (5.47%) | | | | | | | | |
| | 750,000 | | | DigitalGlobe, Inc.1 | | | 21,329,051 | | | | 24,562,500 | |
| | 1,000,000 | | | Mercury Systems, Inc.1 | | | 26,116,728 | | | | 39,050,000 | |
| | 550,000 | | | TransDigm Group, Inc.1 | | | 101,351 | | | | 121,088,000 | |
| | | | | | | | | | | | |
| | | | | | | 47,547,130 | | | | 184,700,500 | |
| | | |
| | | | Construction & Farm Machinery & Heavy Trucks (0.61%) | | | | | | | | |
| | 750,000 | | | REV Group, Inc.1 | | | 16,959,272 | | | | 20,677,500 | |
| | | |
| | | | Diversified Support Services (0.29%) | | | | | | | | |
| | 225,000 | | | Healthcare Services Group, Inc. | | | 6,618,783 | | | | 9,695,250 | |
| | | |
| | | | Electrical Components & Equipment (2.72%) | | | | | | | | |
| | 450,000 | | | Acuity Brands, Inc. | | | 22,758,773 | | | | 91,800,000 | |
| | | |
| | | | Environmental & Facilities Services (3.79%) | | | | | | | | |
| | 1,450,000 | | | Waste Connections, Inc.2 | | | 94,975,000 | | | | 127,919,000 | |
| | | |
| | | | Human Resource & Employment Services (2.88%) | | | | | | | | |
| | 2,000,000 | | | On Assignment, Inc.1 | | | 50,117,846 | | | | 97,060,000 | |
| | |
| 18 | | See Notes to Financial Statements. |
| | |
| March 31, 2017 | | Baron Small Cap Fund |
STATEMENT OF NET ASSETS (Unaudited) (Continued)
| | | | | | | | | | | | |
| Shares | | | | | Cost | | | Value | |
| Common Stocks (continued) | |
| Industrials (continued) | |
| | | | Industrial Machinery (3.73%) | | | | | | | | |
| | 300,000 | | | John Bean Technologies Corp. | | $ | 25,500,000 | | | $ | 26,385,000 | |
| | 250,000 | | | Nordson Corp. | | | 6,938,012 | | | | 30,710,000 | |
| | 425,000 | | | RBC Bearings, Incorporated1 | | | 27,497,364 | | | | 41,263,250 | |
| | 1,400,000 | | | Welbilt, Inc. (formerly, Manitowoc Foodservice, Inc.)1 | | | 23,278,555 | | | | 27,482,000 | |
| | | | | | | | | | | | |
| | | | | | | 83,213,931 | | | | 125,840,250 | |
| | | |
| | | | Trading Companies & Distributors (3.36%) | | | | | | | | |
| | 1,250,000 | | | SiteOne Landscape Supply, Inc.1 | | | 34,435,562 | | | | 60,512,500 | |
| | 1,725,000 | | | Univar, Inc.1 | | | 34,414,942 | | | | 52,888,500 | |
| | | | | | | | | | | | |
| | | | | | | 68,850,504 | | | | 113,401,000 | |
| | | | | | | | | | | | |
| | Total Industrials | | | 391,041,239 | | | | 771,093,500 | |
| | | | | | | | | | | | |
|
| Information Technology (23.25%) | |
| | | | Application Software (7.51%) | | | | | | | | |
| | 1,000,000 | | | ACI Worldwide, Inc.1 | | | 11,814,864 | | | | 21,390,000 | |
| | 1,000,000 | | | Aspen Technology, Inc.1 | | | 38,193,570 | | | | 58,920,000 | |
| | 1,600,000 | | | Guidewire Software, Inc.1 | | | 45,300,515 | | | | 90,128,000 | |
| | 425,000 | | | The Ultimate Software Group, Inc.1 | | | 7,817,737 | | | | 82,964,250 | |
| | | | | | | | | | | | |
| | | | | | | 103,126,686 | | | | 253,402,250 | |
| | | |
| | | | Data Processing & Outsourced Services (3.40%) | | | | | | | | |
| | 450,000 | | | FleetCor Technologies, Inc.1 | | | 10,686,190 | | | | 68,143,500 | |
| | 450,000 | | | WEX, Inc.1 | | | 18,982,530 | | | | 46,575,000 | |
| | | | | | | | | | | | |
| | | | | | | 29,668,720 | | | | 114,718,500 | |
| | | |
| | | | Electronic Equipment & Instruments (2.49%) | | | | | | | | |
| | 1,000,000 | | | Cognex Corp. | | | 17,347,926 | | | | 83,950,000 | |
| | |
| | | | Internet Software & Services (1.30%) | | | | | |
| | 400,000 | | | The Trade Desk, Inc., Cl A1 | | | 14,200,000 | | | | 14,900,000 | |
| | 425,000 | | | Wix.com Ltd.1,2 | | | 24,028,337 | | | | 28,857,500 | |
| | | | | | | | | | | | |
| | | | | | | 38,228,337 | | | | 43,757,500 | |
| | |
| | | | IT Consulting & Other Services (6.07%) | | | | | |
| | 1,700,000 | | | Acxiom Corp.1 | | | 38,602,270 | | | | 48,399,000 | |
| | 1,450,000 | | | Gartner, Inc.1 | | | 24,467,994 | | | | 156,585,500 | |
| | | | | | | | | | | | |
| | | | | | | 63,070,264 | | | | 204,984,500 | |
| | | |
| | | | Systems Software (0.67%) | | | | | | | | |
| | 600,000 | | | Qualys, Inc.1 | | | 21,455,294 | | | | 22,740,000 | |
| | | |
| | | | Technology Hardware, Storage & Peripherals (1.81%) | | | | | | | | |
| | 1,250,000 | | | Electronics For Imaging, Inc.1 | | | 53,031,020 | | | | 61,037,500 | |
| | | | | | | | | | | | |
| | Total Information Technology | | | 325,928,247 | | | | 784,590,250 | |
| | | | | | | | | | | | |
|
| Materials (3.85%) | |
| | | | Commodity Chemicals (0.22%) | | | | | | | | |
| | 300,000 | | | Westlake Chemical Partners LP | | | 7,200,000 | | | | 7,545,000 | |
| | | |
| | | | Construction Materials (1.72%) | | | | | | | | |
| | 2,350,000 | | | Summit Materials, Inc., Cl A1 | | | 48,083,703 | | | | 58,068,500 | |
| | | |
| | | | Metal & Glass Containers (1.15%) | | | | | | | | |
| | 800,000 | | | Berry Plastics Group, Inc.1 | | | 12,652,147 | | | | 38,856,000 | |
| | | |
| | | | Specialty Chemicals (0.76%) | | | | | | | | |
| | 2,000,000 | | | Flotek Industries, Inc.1 | | | 37,558,366 | | | | 25,580,000 | |
| | | | | | | | | | | | |
| | Total Materials | | | 105,494,216 | | | | 130,049,500 | |
| | | | | | | | | | | | |
| | | | | | | | | | | | |
| Shares | | | | | Cost | | | Value | |
| Common Stocks (continued) | |
| Real Estate (5.75%) | |
| | | | Office REITs (0.32%) | | | | | | | | |
| | 100,000 | | | SL Green Realty Corp. | | $ | 2,127,325 | | | $ | 10,662,000 | |
| | | |
| | | | Real Estate Services (0.51%) | | | | | | | | |
| | 500,000 | | | CBRE Group, Inc., Cl A1 | | | 2,180,507 | | | | 17,395,000 | |
| | | |
| | | | Specialized REITs (4.92%) | | | | | | | | |
| | 2,000,000 | | | Gaming and Leisure Properties, Inc. | | | 37,589,735 | | | | 66,840,000 | |
| | 825,000 | | | SBA Communications Corp.1 | | | 3,327,866 | | | | 99,305,250 | |
| | | | | | | | | | | | |
| | | | | | | 40,917,601 | | | | 166,145,250 | |
| | | | | | | | | | | | |
| | Total Real Estate | | | 45,225,433 | | | | 194,202,250 | |
| | | | | | | | | | | | |
|
| Telecommunication Services (1.09%) | |
| | | | Wireless Telecommunication Services (1.09%) | | | | | | | | |
| | 126,306,053 | | | PT Sarana Menara Nusantara Tbk. (Indonesia)1,2 | | | 26,340,798 | | | | 36,776,668 | |
| | | | | | | | | | | | |
|
| Unclassified (0.94%) | |
| | 3,000,000 | | | Capitol Acquisition Corp. III1,3 | | | 30,900,086 | | | | 31,650,000 | |
| | | | | | | | | | | | |
| | Total Common Stocks | | | 1,594,182,056 | | | | 3,332,310,140 | |
| | | | | | | | | | | | |
| | | | | | | | | | | | |
| Principal Amount | | | | | | |
| Short Term Investments (1.21%) | |
| | $40,676,306 | | | Repurchase Agreement with Fixed Income Clearing Corp., dated 3/31/2017, 0.09% due 4/3/2017; Proceeds at maturity - $40,676,611; (Fully collateralized by $42,090,000 U.S. Treasury Inflation-Indexed Note, 0.125% due 7/15/2026; Market value - $41,491,017)4 | | | 40,676,306 | | | | 40,676,306 | |
| | | | | | | | | | | | |
| | Total Investments (99.97%) | | $ | 1,634,858,362 | | | | 3,372,986,446 | |
| | | | | | | | | | | | |
| | Cash and Other Assets Less Liabilities (0.03%) | | | | 1,179,922 | |
| | | | | | | | | | | | |
| | Net Assets | | | $ | 3,374,166,368 | |
| | | | | | | | | | | | |
| Retail Shares (Equivalent to $27.50 per share
based on 61,673,322 shares outstanding) |
| | $ | 1,696,213,520 | |
| | | | | | | | | | | | |
| Institutional Shares (Equivalent to $28.31 per share
based on 56,515,005 shares outstanding) |
| | $ | 1,600,015,958 | |
| | | | | | | | | | | | |
| R6 Shares (Equivalent to $28.31 per share
based on 2,753,389 shares outstanding) |
| | $ | 77,936,890 | |
| | | | | | | | | | | | |
| % | Represents percentage of net assets. |
| 1 | Non-income producing securities. |
| 3 | See Note 10 regarding “Affiliated” companies. |
| 4 | Level 2 security. See Note 7 regarding Fair Value Measurements. |
All securities are Level 1, unless otherwise noted.
| | |
| See Notes to Financial Statements. | | 19 |
| | |
| Baron Opportunity Fund | | March 31, 2017 |
STATEMENT OF NET ASSETS (Unaudited)
| | | | | | | | | | | | |
| Shares | | | | | Cost | | | Value | |
| Common Stocks (99.91%) | |
| Consumer Discretionary (23.29%) | |
| | | | Automobile Manufacturers (5.03%) | | | | | | | | |
| | 40,000 | | | Tesla, Inc. (formerly, Tesla Motors, Inc.)1 | | $ | 8,209,677 | | | $ | 11,132,000 | |
| | | |
| | | | Internet & Direct Marketing Retail (15.98%) | | | | | | | | |
| | 17,875 | | | Amazon.com, Inc.1 | | | 5,857,528 | | | | 15,846,903 | |
| | 65,900 | | | Ctrip.com International Ltd., ADR1,2 | | | 2,957,581 | | | | 3,238,985 | |
| | 45,200 | | | Expedia, Inc. | | | 4,991,663 | | | | 5,702,884 | |
| | 42,725 | | | Netflix, Inc.1 | | | 1,515,569 | | | | 6,315,182 | |
| | 2,385 | | | The Priceline Group, Inc.1 | | | 377,932 | | | | 4,245,228 | |
| | | | | | | | | | | | |
| | | | | | | 15,700,273 | | | | 35,349,182 | |
| | | |
| | | | Movies & Entertainment (2.28%) | | | | | | | | |
| | 298,014 | | | Manchester United plc, Cl A2 | | | 4,836,160 | | | | 5,036,437 | |
| | | | | | | | | | | | |
| | Total Consumer Discretionary | | | 28,746,110 | | | | 51,517,619 | |
| | | | | | | | | | | | |
|
| Energy (1.21%) | |
| | | | Oil & Gas Exploration & Production (1.21%) | | | | | | | | |
| | 20,815 | | | Concho Resources, Inc.1 | | | 1,878,134 | | | | 2,671,397 | |
| | | | | | | | | | | | |
|
| Financials (4.51%) | |
| | | | Consumer Finance (0.87%) | | | | | | | | |
| | 56,000 | | | Synchrony Financial | | | 2,060,207 | | | | 1,920,800 | |
| | | |
| | | | Financial Exchanges & Data (1.56%) | | | | | | | | |
| | 18,400 | | | MarketAxess Holdings, Inc. | | | 1,838,546 | | | | 3,449,816 | |
| | | |
| | | | Investment Banking & Brokerage (2.08%) | | | | | | | | |
| | 112,600 | | | The Charles Schwab Corp. | | | 3,276,303 | | | | 4,595,206 | |
| | | | | | | | | | | | |
| | Total Financials | | | 7,175,056 | | | | 9,965,822 | |
| | | | | | | | | | | | |
|
| Health Care (8.57%) | |
| | | | Biotechnology (2.23%) | | | | | | | | |
| | 48,600 | | | Sage Therapeutics, Inc.1 | | | 1,536,111 | | | | 3,454,002 | |
| | 21,800 | | | Ultragenyx Pharmaceutical, Inc.1 | | | 1,377,719 | | | | 1,477,604 | |
| | | | | | | | | | | | |
| | | | | | | 2,913,830 | | | | 4,931,606 | |
| | | |
| | | | Health Care Equipment (4.90%) | | | | | | | | |
| | 29,500 | | | Edwards Lifesciences Corp.1 | | | 2,603,315 | | | | 2,775,065 | |
| | 87,800 | | | Glaukos Corporation1 | | | 2,835,326 | | | | 4,504,140 | |
| | 4,645 | | | Intuitive Surgical, Inc.1 | | | 3,073,750 | | | | 3,560,253 | |
| | | | | | | | | | | | |
| | | | | | | 8,512,391 | | | | 10,839,458 | |
| | | |
| | | | Life Sciences Tools & Services (1.44%) | | | | | | | | |
| | 18,615 | | | Illumina, Inc.1 | | | 1,282,663 | | | | 3,176,464 | |
| | | | | | | | | | | | |
| | Total Health Care | | | 12,708,884 | | | | 18,947,528 | |
| | | | | | | | | | | | |
|
| Industrials (1.04%) | |
| | | | Research & Consulting Services (1.04%) | | | | | | | | |
| | 28,490 | | | Verisk Analytics, Inc.1 | | | 1,328,353 | | | | 2,311,679 | |
| | | | | | | | | | | | |
| Information Technology (58.11%) | |
| | | | Application Software (13.04%) | | | | | | | | |
| | 20,675 | | | ANSYS, Inc.1 | | | 426,505 | | | | 2,209,538 | |
| | 213,000 | | | Guidewire Software, Inc.1 | | | 5,657,084 | | | | 11,998,290 | |
| | 48,400 | | | Mobileye N.V.1,2 | | | 2,026,390 | | | | 2,971,760 | |
| | 50,580 | | | salesforce.com, Inc.1 | | | 2,963,866 | | | | 4,172,344 | |
| | 51,204 | | | Snap, Inc., Cl A1 | | | 870,468 | | | | 1,153,626 | |
| | 36,500 | | | Splunk, Inc.1 | | | 2,003,403 | | | | 2,273,585 | |
| | 115,000 | | | SS&C Technologies Holdings, Inc. | | | 3,862,463 | | | | 4,071,000 | |
| | | | | | | | | | | | |
| | | | | | | 17,810,179 | | | | 28,850,143 | |
| | | | | | | | | | | | |
| Shares | | | | | Cost | | | Value | |
| Common Stocks (continued) | |
| Information Technology (continued) | |
| | | | Data Processing & Outsourced Services (5.49%) | | | | | | | | |
| | 49,200 | | | MasterCard Incorporated, Cl A | | $ | 4,071,905 | | | $ | 5,533,524 | |
| | 74,500 | | | Visa, Inc., Cl A | | | 5,463,796 | | | | 6,620,815 | |
| | | | | | | | | | | | |
| | | | | | | 9,535,701 | | | | 12,154,339 | |
| | | |
| | | | Home Entertainment Software (0.91%) | | | | | | | | |
| | 22,500 | | | Electronic Arts, Inc.1 | | | 1,958,903 | | | | 2,014,200 | |
| | | |
| | | | Internet Software & Services (21.66%) | | | | | | | | |
| | 42,400 | | | Alibaba Group Holding Ltd., ADR1,2 | | | 2,981,539 | | | | 4,571,992 | |
| | 11,350 | | | Alphabet, Inc., Cl C1 | | | 7,058,160 | | | | 9,415,506 | |
| | 197,714 | | | Benefitfocus, Inc.1 | | | 7,315,343 | | | | 5,526,106 | |
| | 63,133 | | | CoStar Group, Inc.1 | | | 3,606,416 | | | | 13,082,420 | |
| | 37,350 | | | Facebook, Inc., Cl A1 | | | 2,501,678 | | | | 5,305,567 | |
| | 71,510 | | | The Trade Desk, Inc., Cl A1 | | | 1,287,180 | | | | 2,663,748 | |
| | 55,143 | | | Wix.com Ltd.1,2 | | | 3,059,112 | | | | 3,744,210 | |
| | 106,650 | | | Zillow Group, Inc., Cl C1 | | | 2,522,068 | | | | 3,590,906 | |
| | | | | | | | | | | | |
| | | | | | | 30,331,496 | | | | 47,900,455 | |
| | | |
| | | | IT Consulting & Other Services (8.97%) | | | | | | | | |
| | 292,300 | | | Acxiom Corp.1 | | | 4,465,284 | | | | 8,321,781 | |
| | 106,570 | | | Gartner, Inc.1 | | | 1,964,945 | | | | 11,508,494 | |
| | | | | | | | | | | | |
| | | | | | | 6,430,229 | | | | 19,830,275 | |
| | | |
| | | | Semiconductors (1.33%) | | | | | | | | |
| | 57,700 | | | Mellanox Technologies Ltd.1,2 | | | 2,390,079 | | | | 2,939,815 | |
| | | |
| | | | Systems Software (6.71%) | | | | | | | | |
| | 16,471 | | | MuleSoft, Inc., Cl A1,3 | | | 280,007 | | | | 400,739 | |
| | 27,800 | | | Proofpoint, Inc.1 | | | 2,258,261 | | | | 2,067,208 | |
| | 42,300 | | | Red Hat, Inc.1 | | | 1,870,121 | | | | 3,658,950 | |
| | 65,300 | | | ServiceNow, Inc.1 | | | 4,049,328 | | | | 5,711,791 | |
| | 94,300 | | | Varonis Systems, Inc.1 | | | 2,654,385 | | | | 2,998,740 | |
| | | | | | | | | | | | |
| | | | | | | 11,112,102 | | | | 14,837,428 | |
| | | | | | | | | | | | |
| | Total Information Technology | | | 79,568,689 | | | | 128,526,655 | |
| | | | | | | | | | | | |
|
| Real Estate (3.18%) | |
| | | | Specialized REITs (3.18%) | | | | | | | | |
| | 10,625 | | | Equinix, Inc. | | | 201,123 | | | | 4,253,931 | |
| | 23,100 | | | SBA Communications Corp.1 | | | 77,260 | | | | 2,780,547 | |
| | | | | | | | | | | | |
| | Total Real Estate | | | 278,383 | | | | 7,034,478 | |
| | | | | | | | | | | | |
| | Total Investments (99.91%) | | $ | 131,683,609 | | | | 220,975,178 | |
| | | | | | | | | | | | |
| | Cash and Other Assets Less Liabilities (0.09%) | | | | 191,277 | |
| | | | | | | | | | | | |
| | Net Assets | | | $ | 221,166,455 | |
| | | | | | | | | | | | |
| Retail Shares (Equivalent to $16.09 per share
based on 11,105,462 shares outstanding) |
| | $ | 178,693,377 | |
| | | | | | | | | | | | |
| Institutional Shares (Equivalent to $16.55 per share
based on 2,541,693 shares outstanding) |
| | $ | 42,061,329 | |
| | | | | | | | | | | | |
| R6 Shares (Equivalent to $16.56 per share
based on 24,868 shares outstanding) |
| | $ | 411,749 | |
| | | | | | | | | | | | |
| % | Represents percentage of net assets. |
| 1 | Non-income producing securities. |
| 3 | The Adviser has reclassified/classified certain securities in or out of this sub-industry. Such reclassifications/classifications are not supported by S&P or MSCI. |
| ADR | American Depositary Receipt. |
All securities are Level 1, unless otherwise noted.
| | |
| 20 | | See Notes to Financial Statements. |
| | |
| March 31, 2017 | | Baron Fifth Avenue Growth Fund |
STATEMENT OF NET ASSETS (Unaudited)
| | | | | | | | | | | | |
| Shares | | | | | Cost | | | Value | |
| Common Stocks (100.00%) | |
| Consumer Discretionary (31.15%) | |
| | | | Automobile Manufacturers (0.87%) | | | | | | | | |
| | 4,713 | | | Tesla, Inc. (formerly, Tesla Motors, Inc.)1 | | $ | 1,177,304 | | | $ | 1,311,628 | |
| | | |
| | | | Cable & Satellite (2.78%) | | | | | | | | |
| | 24,450 | | | Naspers Limited, Cl N (South Africa)2 | | | 3,602,327 | | | | 4,218,895 | |
| | | |
| | | | Internet & Direct Marketing Retail (26.05%) | | | | | | | | |
| | 26,724 | | | Amazon.com, Inc.1 | | | 6,730,600 | | | | 23,691,895 | |
| | 91,960 | | | Ctrip.com International Ltd., ADR1,2 | | | 2,980,456 | | | | 4,519,834 | |
| | 28,359 | | | Expedia, Inc. | | | 3,363,712 | | | | 3,578,055 | |
| | 4,337 | | | The Priceline Group, Inc.1 | | | 2,941,040 | | | | 7,719,730 | |
| | | | | | | | | | | | |
| | | | | | | 16,015,808 | | | | 39,509,514 | |
| | | |
| | | | Restaurants (1.45%) | | | | | | | | |
| | 37,710 | | | Starbucks Corp. | | | 1,003,746 | | | | 2,201,887 | |
| | | | | | | | | | | | |
| | Total Consumer Discretionary | | | 21,799,185 | | | | 47,241,924 | |
| | | | | | | | | | | | |
|
| Energy (1.57%) | |
| | | | Oil & Gas Exploration & Production (1.57%) | | | | | | | | |
| | 18,548 | | | Concho Resources, Inc.1 | | | 1,774,387 | | | | 2,380,450 | |
| | | | | | | | | | | | |
|
| Financials (11.13%) | |
| | | | Asset Management & Custody Banks (2.04%) | | | | | | | | |
| | 84,940 | | | Brookfield Asset Management, Inc., Cl A2 | | | 1,721,560 | | | | 3,096,912 | |
| | | |
| | | | Consumer Finance (1.60%) | | | | | | | | |
| | 70,872 | | | Synchrony Financial | | | 2,361,704 | | | | 2,430,910 | |
| | | |
| | | | Financial Exchanges & Data (2.79%) | | | | | | | | |
| | 35,570 | | | CME Group, Inc. | | | 2,088,336 | | | | 4,225,716 | |
| | | |
| | | | Investment Banking & Brokerage (2.43%) | | | | | | | | |
| | 90,198 | | | The Charles Schwab Corp. | | | 2,618,943 | | | | 3,680,980 | |
| | | |
| | | | Regional Banks (2.27%) | | | | | | | | |
| | 36,627 | | | First Republic Bank | | | 2,619,742 | | | | 3,435,979 | |
| | | | | | | | | | | | |
| | Total Financials | | | 11,410,285 | | | | 16,870,497 | |
| | | | | | | | | | | | |
|
| Health Care (8.04%) | |
| | | | Biotechnology (2.23%) | | | | | | | | |
| | 5,423 | | | Biogen, Inc.1 | | | 1,453,971 | | | | 1,482,757 | |
| | 4,911 | | | Regeneron Pharmaceuticals, Inc.1 | | | 1,502,927 | | | | 1,903,062 | |
| | | | | | | | | | | | |
| | | | | | | 2,956,898 | | | | 3,385,819 | |
| | | |
| | | | Health Care Equipment (2.31%) | | | | | | | | |
| | 4,562 | | | Intuitive Surgical, Inc.1 | | | 2,885,519 | | | | 3,496,636 | |
| | | |
| | | | Life Sciences Tools & Services (3.50%) | | | | | | | | |
| | 31,122 | | | Illumina, Inc.1 | | | 1,119,172 | | | | 5,310,658 | |
| | | | | | | | | | | | |
| | Total Health Care | | | 6,961,589 | | | | 12,193,113 | |
| | | | | | | | | | | | |
|
| Industrials (1.25%) | |
| | | | Research & Consulting Services (1.25%) | | | | | | | | |
| | 23,408 | | | Verisk Analytics, Inc.1 | | | 870,323 | | | | 1,899,325 | |
| | | | | | | | | | | | |
| | | | | | | | | | | | |
| Shares | | | | | Cost | | | Value | |
| Common Stocks (continued) | |
| Information Technology (39.37%) | |
| | | | Application Software (1.03%) | | | | | | | | |
| | 12,409 | | | Mobileye N.V.1,2 | | $ | 310,225 | | | $ | 761,913 | |
| | 35,597 | | | Snap, Inc., Cl A1 | | | 605,149 | | | | 802,000 | |
| | | | | | | | | | | | |
| | | | | | | 915,374 | | | | 1,563,913 | |
| | | |
| | | | Data Processing & Outsourced Services (9.72%) | | | | | | | | |
| | 65,205 | | | MasterCard Incorporated, Cl A | | | 3,418,561 | | | | 7,333,606 | |
| | 83,299 | | | Visa, Inc., Cl A | | | 2,537,808 | | | | 7,402,782 | |
| | | | | | | | | | | | |
| | | | | | | 5,956,369 | | | | 14,736,388 | |
| | | |
| | | | Internet Software & Services (19.28%) | | | | | | | | |
| | 92,830 | | | Alibaba Group Holding Ltd., ADR1,2 | | | 7,959,441 | | | | 10,009,859 | |
| | 1,948 | | | Alphabet, Inc., Cl A1 | | | 280,365 | | | | 1,651,514 | |
| | 10,046 | | | Alphabet, Inc., Cl C1 | | | 4,142,964 | | | | 8,333,760 | |
| | 65,002 | | | Facebook, Inc., Cl A1 | | | 1,611,512 | | | | 9,233,534 | |
| | | | | | | | | | | | |
| | | | | | | 13,994,282 | | | | 29,228,667 | |
| | | |
| | | | IT Consulting & Other Services (1.27%) | | | | | | | | |
| | 25,579 | | | EPAM Systems, Inc.1 | | | 1,727,106 | | | | 1,931,726 | |
| | | |
| | | | Semiconductor Equipment (2.43%) | | | | | | | | |
| | 27,701 | | | ASML Holding N.V.2 | | | 1,817,805 | | | | 3,678,693 | |
| | | |
| | | | Systems Software (2.17%) | | | | | | | | |
| | 38,097 | | | Red Hat, Inc.1 | | | 1,910,187 | | | | 3,295,391 | |
| | | |
| | | | Technology Hardware, Storage & Peripherals (3.47%) | | | | | | | | |
| | 36,662 | | | Apple, Inc. | | | 869,664 | | | | 5,266,863 | |
| | | | | | | | | | | | |
| | Total Information Technology | | | 27,190,787 | | | | 59,701,641 | |
| | | | | | | | | | | | |
|
| Materials (2.33%) | |
| | | | Fertilizers & Agricultural Chemicals (2.33%) | | | | | | | | |
| | 31,146 | | | Monsanto Co. | | | 2,616,700 | | | | 3,525,727 | |
| | | | | | | | | | | | |
|
| Real Estate (5.16%) | |
| | | | Specialized REITs (5.16%) | | | | | | | | |
| | 19,555 | | | Equinix, Inc. | | | 3,178,515 | | | | 7,829,235 | |
| | | | | | | | | | | | |
| | Total Investments (100.00%) | | $ | 75,801,771 | | | | 151,641,912 | |
| | | | | | | | | | | | |
| | Cash and Other Assets Less Liabilities (0.00%) | | | | 3,895 | |
| | | | | | | | | | | | |
| | Net Assets | | | $ | 151,645,807 | |
| | | | | | | | | | | | |
| Retail Shares (Equivalent to $20.85 per share
based on 3,423,732 shares outstanding) |
| | $ | 71,399,486 | |
| | | | | | | | | | | | |
| Institutional Shares (Equivalent to $21.17 per share
based on 3,719,423 shares outstanding) |
| | $ | 78,758,566 | |
| | | | | | | | | | | | |
| R6 Shares (Equivalent to $21.18 per share
based on 70,241 shares outstanding) |
| | $ | 1,487,755 | |
| | | | | | | | | | | | |
| % | Represents percentage of net assets. |
| 1 | Non-income producing securities. |
| ADR | American Depositary Receipt. |
All securities are Level 1, unless otherwise noted.
| | |
| See Notes to Financial Statements. | | 21 |
| | |
| Baron Discovery Fund | | March 31, 2017 |
STATEMENT OF NET ASSETS (Unaudited)
| | | | | | | | | | | | |
| Shares | | | | | Cost | | | Value | |
| Common Stocks (92.57%) | |
| Consumer Discretionary (15.84%) | |
| | | | Casinos & Gaming (4.21%) | | | | | | | | |
| | 70,000 | | | Pinnacle Entertainment, Inc.1 | | $ | 828,267 | | | $ | 1,366,400 | |
| | 165,000 | | | Red Rock Resorts, Inc., Cl A | | | 3,696,732 | | | | 3,659,700 | |
| | | | | | | | | | | | |
| | | | | | | 4,524,999 | | | | 5,026,100 | |
| | | |
| | | | Education Services (1.91%) | | | | | | | | |
| | 90,000 | | | Nord Anglia Education, Inc.1,2 | | | 2,044,504 | | | | 2,280,600 | |
| | | |
| | | | Internet & Direct Marketing Retail (2.74%) | | | | | | | | |
| | 72,000 | | | Liberty Expedia Holdings, Inc., Cl A1 | | | 3,171,534 | | | | 3,274,560 | |
| | | |
| | | | Movies & Entertainment (1.75%) | | | | | | | | |
| | 64,000 | | | Liberty Media Corporation - Liberty Formula One, Cl A (formerly, Liberty Media Group, Cl A)1 | | | 1,753,426 | | | | 2,092,800 | |
| | | |
| | | | Restaurants (3.80%) | | | | | | | | |
| | 250,000 | | | Domino’s Pizza Group plc (United Kingdom)2 | | | 1,140,996 | | | | 967,239 | |
| | 117,000 | | | Wingstop, Inc.1 | | | 2,858,228 | | | | 3,308,760 | |
| | 14,000 | | | Zoe’s Kitchen, Inc.1 | | | 312,966 | | | | 259,000 | |
| | | | | | | | | | | | |
| | | | | | | 4,312,190 | | | | 4,534,999 | |
| | | |
| | | | Specialty Stores (1.43%) | | | | | | | | |
| | 121,000 | | | Party City Holdco, Inc.1 | | | 1,696,053 | | | | 1,700,050 | |
| | | | | | | | | | | | |
| | Total Consumer Discretionary | | | 17,502,706 | | | | 18,909,109 | |
| | | | | | | | | | | | |
|
| Consumer Staples (0.40%) | |
| | | | Packaged Foods & Meats (0.40%) | | | | | | | | |
| | 750,000 | | | Barfresh Food Group, Inc.1 | | | 417,200 | | | | 472,500 | |
| | | | | | | | | | | | |
|
| Energy (1.71%) | |
| | | | Oil & Gas Exploration & Production (0.51%) | | | | | | | | |
| | 239,233 | | | Jones Energy, Inc.1 | | | 1,090,123 | | | | 610,044 | |
| | | |
| | | | Oil & Gas Storage & Transportation (1.20%) | | | | | | | | |
| | 45,000 | | | Dominion Midstream Partners, L.P. | | | 1,060,813 | | | | 1,437,750 | |
| | | | | | | | | | | | |
| | Total Energy | | | 2,150,936 | | | | 2,047,794 | |
| | | | | | | | | | | | |
|
| Financials (1.64%) | |
| | | | Property & Casualty Insurance (1.64%) | | | | | | | | |
| | 61,000 | | | Kinsale Capital Group, Inc. | | | 1,319,112 | | | | 1,954,440 | |
| | | | | | | | | | | | |
|
| Health Care (26.00%) | |
| | | | Biotechnology (9.17%) | | | | | | | | |
| | 52,200 | | | Adamas Pharmaceuticals, Inc.1 | | | 872,079 | | | | 913,500 | |
| | 105,400 | | | Flexion Therapeutics, Inc.1 | | | 1,932,809 | | | | 2,836,314 | |
| | 87,900 | | | Foundation Medicine, Inc.1 | | | 2,145,641 | | | | 2,834,775 | |
| | 136,500 | | | Myriad Genetics, Inc.1 | | | 2,591,482 | | | | 2,620,800 | |
| | 19,700 | | | Sage Therapeutics, Inc.1 | | | 1,038,015 | | | | 1,400,079 | |
| | 5,000 | | | Ultragenyx Pharmaceutical, Inc.1 | | | 331,462 | | | | 338,900 | |
| | | | | | | | | | | | |
| | | | | | | 8,911,488 | | | | 10,944,368 | |
| | | | | | | | | | | | |
| Shares | | | | | Cost | | | Value | |
| Common Stocks (continued) | |
| Health Care (continued) | |
| | | | Health Care Equipment (5.41%) | | | | | | | | |
| | 37,700 | | | Glaukos Corporation1 | | $ | 1,050,692 | | | $ | 1,934,010 | |
| | 20,000 | | | Inogen, Inc.1 | | | 952,384 | | | | 1,551,200 | |
| | 16,300 | | | Nevro Corp.1 | | | 1,217,453 | | | | 1,527,310 | |
| | 185,700 | | | Novadaq Technologies, Inc.1,2 | | | 1,554,021 | | | | 1,446,603 | |
| | | | | | | | | | | | |
| | | | | | | 4,774,550 | | | | 6,459,123 | |
| | | |
| | | | Health Care Services (1.41%) | | | | | | | | |
| | 67,500 | | | Teladoc, Inc.1 | | | 1,680,612 | | | | 1,687,500 | |
| | | |
| | | | Health Care Supplies (4.58%) | | | | | | | | |
| | 464,300 | | | Cerus Corp.1 | | | 2,332,246 | | | | 2,066,135 | |
| | 225,317 | | | Sientra, Inc.1 | | | 1,870,573 | | | | 1,897,169 | |
| | 51,500 | | | The Spectranetics Corporation1 | | | 1,186,873 | | | | 1,499,938 | |
| | | | | | | | | | | | |
| | | | | | | 5,389,692 | | | | 5,463,242 | |
| | | |
| | | | Life Sciences Tools & Services (1.17%) | | | | | | | | |
| | 46,904 | | | Medpace Holdings, Inc.1 | | | 1,297,337 | | | | 1,400,084 | |
| | | |
| | | | Managed Health Care (0.39%) | | | | | | | | |
| | 11,000 | | | HealthEquity, Inc.1 | | | 277,296 | | | | 466,950 | |
| | | |
| | | | Pharmaceuticals (3.87%) | | | | | | | | |
| | 42,100 | | | Pacira Pharmaceuticals, Inc.1 | | | 1,842,934 | | | | 1,919,760 | |
| | 374,800 | | | TherapeuticsMD, Inc.1 | | | 2,333,804 | | | | 2,698,560 | |
| | | | | | | | | | | | |
| | | | | | | 4,176,738 | | | | 4,618,320 | |
| | | | | | | | | | | | |
| | Total Health Care | | | 26,507,713 | | | | 31,039,587 | |
| | | | | | | | | | | | |
|
| Industrials (12.70%) | |
| | | | Aerospace & Defense (6.78%) | | | | | | | | |
| | 41,800 | | | DigitalGlobe, Inc.1 | | | 1,171,073 | | | | 1,368,950 | |
| | 228,000 | | | The KEYW Holding Corporation1 | | | 2,153,914 | | | | 2,152,320 | |
| | 117,000 | | | Mercury Systems, Inc.1 | | | 2,668,697 | | | | 4,568,850 | |
| | | | | | | | | | | | |
| | | | | | | 5,993,684 | | | | 8,090,120 | |
| | | |
| | | | Heavy Electrical Equipment (1.47%) | | | | | | | | |
| | 92,500 | | | TPI Composites, Inc.1 | | | 1,620,030 | | | | 1,758,425 | |
| | | |
| | | | Industrial Machinery (2.22%) | | | | | | | | |
| | 16,500 | | | ESCO Technologies, Inc. | | | 579,185 | | | | 958,650 | |
| | 88,500 | | | Kornit Digital Ltd.1,2 | | | 1,141,807 | | | | 1,690,350 | |
| | | | | | | | | | | | |
| | | | | | | 1,720,992 | | | | 2,649,000 | |
| | | |
| | | | Trading Companies & Distributors (2.23%) | | | | | | | | |
| | 55,000 | | | SiteOne Landscape Supply, Inc.1 | | | 2,016,505 | | | | 2,662,550 | |
| | | | | | | | | | | | |
| | Total Industrials | | | 11,351,211 | | | | 15,160,095 | |
| | | | | | | | | | | | |
|
| Information Technology (31.27%) | |
| | | | Application Software (1.52%) | | | | | | | | |
| | 20,000 | | | Blackline, Inc.1 | | | 340,000 | | | | 595,200 | |
| | 12,000 | | | QAD, Inc., Cl A | | | 331,712 | | | | 334,200 | |
| | 37,000 | | | QAD, Inc., Cl B | | | 776,036 | | | | 887,260 | |
| | | | | | | | | | | | |
| | | | | | | 1,447,748 | | | | 1,816,660 | |
| | | |
| | | | Electronic Equipment & Instruments (1.05%) | | | | | | | | |
| | 6,100 | | | Coherent, Inc.1 | | | 480,442 | | | | 1,254,404 | |
| | |
| 22 | | See Notes to Financial Statements. |
| | |
| March 31, 2017 | | Baron Discovery Fund |
STATEMENT OF NET ASSETS (Unaudited) (Continued)
| | | | | | | | | | | | |
| Shares | | | | | Cost | | | Value | |
| Common Stocks (continued) | |
| Information Technology (continued) | |
| | | | Internet Software & Services (11.72%) | | | | | | | | |
| | 194,200 | | | Amber Road, Inc.1 | | $ | 1,494,499 | | | $ | 1,499,224 | |
| | 90,000 | | | CommerceHub, Inc., Series C1 | | | 1,369,150 | | | | 1,397,700 | |
| | 60,700 | | | Envestnet, Inc.1 | | | 2,221,737 | | | | 1,960,610 | |
| | 355,000 | | | JUST EAT plc (United Kingdom)1,2 | | | 2,203,217 | | | | 2,517,453 | |
| | 115,000 | | | Quotient Technology, Inc.1 | | | 1,269,621 | | | | 1,098,250 | |
| | 88,000 | | | The Trade Desk, Inc., Cl A1 | | | 2,523,397 | | | | 3,278,000 | |
| | 145,000 | | | TrueCar, Inc.1 | | | 2,019,371 | | | | 2,243,150 | |
| | | | | | | | | | | | |
| | | | | | | 13,100,992 | | | | 13,994,387 | |
| | | |
| | | | IT Consulting & Other Services (1.93%) | | | | | | | | |
| | 81,000 | | | Acxiom Corp.1 | | | 2,081,534 | | | | 2,306,070 | |
| | | |
| | | | Semiconductor Equipment (1.15%) | | | | | | | | |
| | 68,900 | | | Ichor Holdings Ltd.1,2 | | | 662,177 | | | | 1,366,287 | |
| | | |
| | | | Semiconductors (7.48%) | | | | | | | | |
| | 175,542 | | | Everspin Technologies, Inc.1 | | | 1,433,684 | | | | 1,471,042 | |
| | 99,000 | | | Impinj, Inc.1 | | | 2,653,014 | | | | 2,996,730 | |
| | 92,500 | | | MACOM Technology Solutions Holdings, Inc.1 | | | 3,710,454 | | | | 4,467,750 | |
| | | | | | | | | | | | |
| | | | | | | 7,797,152 | | | | 8,935,522 | |
| | | |
| | | | Systems Software (6.42%) | | | | | | | | |
| | 6,969 | | | MuleSoft, Inc., Cl A1,3 | | | 118,473 | | | | 169,556 | |
| | 121,600 | | | Qualys, Inc.1 | | | 3,716,868 | | | | 4,608,640 | |
| | 90,900 | | | Varonis Systems, Inc.1 | | | 2,519,292 | | | | 2,890,620 | |
| | | | | | | | | | | | |
| | | | | | | 6,354,633 | | | | 7,668,816 | |
| | | | | | | | | | | | |
| | Total Information Technology | | | 31,924,678 | | | | 37,342,146 | |
| | | | | | | | | | | | |
|
| Materials (1.56%) | |
| | | | Specialty Chemicals (1.56%) | | | | | | | | |
| | 146,000 | | | Flotek Industries, Inc.1 | | | 1,635,534 | | | | 1,867,340 | |
| | | | | | | | | | | | |
|
| Real Estate (1.45%) | |
| | | | Industrial REITs (1.45%) | | | | | | | | |
| | 77,000 | | | Rexford Industrial Realty, Inc. | | | 1,688,011 | | | | 1,734,040 | |
| | | | | | | | | | | | |
| | Total Common Stocks | | | 94,497,101 | | | | 110,527,051 | |
| | | | | | | | | | | | |
| | | | | | | | | | | | |
| Warrants (0.05%) | |
| Consumer Staples (0.05%) | |
| | | | Packaged Foods & Meats (0.05%) | | | | | | | | |
| | 300,000 | | | Barfresh Food Group, Inc. Warrants Exp 3/13/20201,4,5 | | | 0 | | | | 60,000 | |
| | | | | | | | | | | | |
| | | | | | | | | | | | |
| Principal Amount | | Cost | | | Value | |
| Short Term Investments (10.08%) | |
| | $12,037,372 | | | Repurchase Agreement with Fixed Income Clearing Corp., dated 3/31/2017, 0.09% due 4/3/2017; Proceeds at maturity - $12,037,462; (Fully collateralized by $12,460,000 U.S. Treasury Inflation-Indexed Note, 0.125% due 7/15/2026; Market value - $12,282,682)5 | | $ | 12,037,372 | | | $ | 12,037,372 | |
| | | | | | | | | | | | |
| | Total Investments (102.70%) | | $ | 106,534,473 | | | | 122,624,423 | |
| | | | | | | | | | | | |
| | Liabilities Less Cash and Other Assets (-2.70%) | | | | (3,225,020 | ) |
| | | | | | | | | | | | |
| | Net Assets | | | $ | 119,399,403 | |
| | | | | | | | | | | | |
| Retail Shares (Equivalent to $14.94 per share
based on 3,198,289 shares outstanding) |
| | $ | 47,797,539 | |
| | | | | | | | | | | | |
| Institutional Shares (Equivalent to $15.07 per share
based on 4,584,547 shares outstanding) |
| | $ | 69,110,957 | |
| | | | | | | | | | | | |
| R6 Shares (Equivalent to $15.08 per share
based on 165,233 shares outstanding) |
| | $ | 2,490,907 | |
| | | | | | | | | | | | |
| % | Represents percentage of net assets. |
| 1 | Non-income producing securities. |
| 3 | The Adviser has reclassified/classified certain securities in or out of this sub-industry. Such reclassifications/classifications are not supported by S&P or MSCI. |
| 4 | At March 31, 2017, the market value of restricted and fair valued securities amounted to $60,000 or 0.05% of net assets. This security is not deemed liquid. See Note 6 regarding Restricted Securities. |
| 5 | Level 2 security. See Note 7 regarding Fair Value Measurements. |
All securities are Level 1, unless otherwise noted.
| | |
| See Notes to Financial Statements. | | 23 |
| | |
| Baron Funds | | March 31, 2017 |
STATEMENTS OF ASSETS AND LIABILITIES (Unaudited)
| | | | | | | | | | | | | | | | | | | | | | | | |
| | | Baron Asset
Fund | | | Baron Growth
Fund | | | Baron Small
Cap Fund | | | Baron
Opportunity
Fund | | | Baron Fifth
Avenue Growth
Fund | | | Baron
Discovery
Fund | |
Assets: | | | | | | | | | | | | | | | | | | | | | | | | |
Investments in securities, at value* | | | | | | | | | | | | | | | | | | | | | | | | |
Unaffiliated investments | | $ | 2,656,468,932 | | | $ | 4,899,864,266 | | | $ | 3,279,810,140 | | | $ | 220,975,178 | | | $ | 151,641,912 | | | $ | 110,587,051 | |
“Affiliated” investments | | | — | | | | 993,637,028 | | | | 52,500,000 | | | | — | | | | — | | | | — | |
Repurchase agreements, at value** | | | 25,551,931 | | | | — | | | | 40,676,306 | | | | — | | | | — | | | | 12,037,372 | |
| | | | | | | | | | | | | | | | | | | | | | | | |
Total investments, at value | | | 2,682,020,863 | | | | 5,893,501,294 | | | | 3,372,986,446 | | | | 220,975,178 | | | | 151,641,912 | | | | 122,624,423 | |
Cash | | | — | | | | 54,682 | | | | 75,125 | | | | 67,668 | | | | 74,005 | | | | — | |
Receivable for securities sold | | | 7,746,967 | | | | 19,447,268 | | | | 4,871,947 | | | | 570,362 | | | | 221,278 | | | | 153,424 | |
Receivable for shares sold | | | 6,739,791 | | | | 52,076,617 | | | | 5,846,745 | | | | 208,409 | | | | 70,958 | | | | 11,506,835 | |
Dividends and interest receivable | | | 1,250,720 | | | | 4,707,546 | | | | 200,720 | | | | 8,089 | | | | 363 | | | | 30,219 | |
Prepaid expenses | | | 33,896 | | | | 77,061 | | | | 44,790 | | | | 2,632 | | | | 1,929 | | | | 6,176 | |
| | | | | | | | | | | | | | | | | | | | | | | | |
| | | 2,697,792,237 | | | | 5,969,864,468 | | | | 3,384,025,773 | | | | 221,832,338 | | | | 152,010,445 | | | | 134,321,077 | |
| | | | | | | | | | | | | | | | | | | | | | | | |
Liabilities: | | | | | | | | | | | | | | | | | | | | | | | | |
Payable for shares redeemed | | | 6,717,018 | | | | 52,493,416 | | | | 6,688,192 | | | | 117,857 | | | | 19,458 | | | | 38,224 | |
Payable for securities purchased | | | 4,466,809 | | | | — | | | | 2,747,244 | | | | — | | | | — | | | | 14,837,182 | |
Trustee fees payable | | | 24,205 | | | | 53,549 | | | | 37,462 | | | | 2,771 | | | | 1,680 | | | | 440 | |
Investment advisory fees payable (Note 4) | | | 608 | | | | 155 | | | | 18 | | | | 816 | | | | 751 | | | | 466 | |
Distribution fees payable (Note 4) | | | 167 | | | | 544 | | | | 731 | | | | 561 | | | | 96 | | | | 127 | |
Payable for borrowings against line of credit | | | — | | | | 14,000,000 | | | | — | | | | 500,000 | | | | 300,000 | | | | — | |
Accrued expenses and other payables | | | 177,646 | | | | 457,996 | | | | 385,758 | | | | 43,878 | | | | 42,653 | | | | 45,235 | |
| | | | | | | | | | | | | | | | | | | | | | | | |
| | | 11,386,453 | | | | 67,005,660 | | | | 9,859,405 | | | | 665,883 | | | | 364,638 | | | | 14,921,674 | |
| | | | | | | | | | | | | | | | | | | | | | | | |
Net Assets | | $ | 2,686,405,784 | | | $ | 5,902,858,808 | | | $ | 3,374,166,368 | | | $ | 221,166,455 | | | $ | 151,645,807 | | | $ | 119,399,403 | |
| | | | | | | | | | | | | | | | | | | | | | | | |
Net Assets consist of: | | | | | | | | | | | | | | | | | | | | | | | | |
Paid-in capital | | $ | 947,670,392 | | | $ | 1,965,471,506 | | | $ | 1,351,568,324 | | | $ | 115,513,282 | | | $ | 85,335,269 | | | $ | 111,634,590 | |
Undistributed (accumulated) net investment income (loss) | | | (20,512,852 | ) | | | 8,193,777 | | | | 290,838 | | | | (3,393,289 | ) | | | (793,464 | ) | | | (277,136 | ) |
Undistributed (accumulated) net realized gain (loss) on investments and foreign currency transactions | | | 127,982,725 | | | | 307,108,357 | | | | 284,178,419 | | | | 19,754,893 | | | | (8,736,163 | ) | | | (8,047,320 | ) |
Net unrealized appreciation on investments and foreign currency translations | | | 1,631,265,519 | | | | 3,622,085,168 | | | | 1,738,128,787 | | | | 89,291,569 | | | | 75,840,165 | | | | 16,089,269 | |
| | | | | | | | | | | | | | | | | | | | | | | | |
Net Assets | | $ | 2,686,405,784 | | | $ | 5,902,858,808 | | | $ | 3,374,166,368 | | | $ | 221,166,455 | | | $ | 151,645,807 | | | $ | 119,399,403 | |
| | | | | | | | | | | | | | | | | | | | | | | | |
Retail Shares: | | | | | | | | | | | | | | | | | | | | | | | | |
Net Assets | | $ | 1,853,709,690 | | | $ | 2,735,249,812 | | | $ | 1,696,213,520 | | | $ | 178,693,377 | | | $ | 71,399,486 | | | $ | 47,797,539 | |
Shares Outstanding ($0.01 par value; indefinite shares authorized) | | | 29,087,303 | | | | 41,672,320 | | | | 61,673,322 | | | | 11,105,462 | | | | 3,423,732 | | | | 3,198,289 | |
| | | | | | | | | | | | | | | | | | | | | | | | |
Net Asset Value and Offering Price Per Share | | $ | 63.73 | | | $ | 65.64 | | | $ | 27.50 | | | $ | 16.09 | | | $ | 20.85 | | | $ | 14.94 | |
| | | | | | | | | | | | | | | | | | | | | | | | |
Institutional Shares: | | | | | | | | | | | | | | | | | | | | | | | | |
Net Assets | | $ | 824,077,418 | | | $ | 3,164,956,909 | | | $ | 1,600,015,958 | | | $ | 42,061,329 | | | $ | 78,758,566 | | | $ | 69,110,957 | |
Shares Outstanding ($0.01 par value; indefinite shares authorized) | | | 12,557,782 | | | | 47,135,693 | | | | 56,515,005 | | | | 2,541,693 | | | | 3,719,423 | | | | 4,584,547 | |
| | | | | | | | | | | | | | | | | | | | | | | | |
Net Asset Value and Offering Price Per Share | | $ | 65.62 | | | $ | 67.15 | | | $ | 28.31 | | | $ | 16.55 | | | $ | 21.17 | | | $ | 15.07 | |
| | | | | | | | | | | | | | | | | | | | | | | | |
R6 Shares: | | | | | | | | | | | | | | | | | | | | | | | | |
Net Assets | | $ | 8,618,676 | | | $ | 2,652,087 | | | $ | 77,936,890 | | | $ | 411,749 | | | $ | 1,487,755 | | | $ | 2,490,907 | |
Shares Outstanding ($0.01 par value; indefinite shares authorized) | | | 131,357 | | | | 39,494 | | | | 2,753,389 | | | | 24,868 | | | | 70,241 | | | | 165,233 | |
| | | | | | | | | | | | | | | | | | | | | | | | |
Net Asset Value and Offering Price Per Share | | $ | 65.61 | | | $ | 67.15 | | | $ | 28.31 | | | $ | 16.56 | | | $ | 21.18 | | | $ | 15.08 | |
| | | | | | | | | | | | | | | | | | | | | | | | |
| | | | | | |
*Investments in securities, at cost: | | | | | | | | | | | | | | | | | | | | | | | | |
Unaffiliated investments | | $ | 1,025,203,413 | | | $ | 1,848,154,682 | | | $ | 1,540,848,755 | | | $ | 131,683,609 | | | $ | 75,801,771 | | | $ | 94,497,101 | |
“Affiliated” investments | | | — | | | | 423,261,444 | | | | 53,333,301 | | | | — | | | | — | | | | — | |
**Repurchase agreements, at cost | | | 25,551,931 | | | | — | | | | 40,676,306 | | | | — | | | | — | | | | 12,037,372 | |
| | | | | | | | | | | | | | | | | | | | | | | | |
Total investments, at cost | | $ | 1,050,755,344 | | | $ | 2,271,416,126 | | | $ | 1,634,858,362 | | | $ | 131,683,609 | | | $ | 75,801,771 | | | $ | 106,534,473 | |
| | | | | | | | | | | | | | | | | | | | | | | | |
| | |
| 24 | | See Notes to Financial Statements. |
| | |
| March 31, 2017 | | Baron Funds |
STATEMENTS OF OPERATIONS (Unaudited)
|
FOR THE SIX MONTHS ENDED MARCH 31, 2017 |
| | | | | | | | | | | | | | | | | | | | | | | | |
| | | Baron Asset
Fund | | | Baron Growth
Fund | | | Baron Small
Cap Fund | | | Baron
Opportunity
Fund | | | Baron Fifth
Avenue Growth
Fund | | | Baron
Discovery
Fund | |
Investment income: | | | | | | | | | | | | | | | | | | | | | | | | |
Income: | | | | | | | | | | | | | | | | | | | | | | | | |
Dividends — Unaffiliated investments | | $ | 8,070,303 | | | $ | 26,377,518 | | | $ | 25,741,319 | | | $ | 207,952 | | | $ | 495,026 | | | $ | 106,599 | |
Dividends — “Affiliated” investments | | | — | | | | 9,393,248 | | | | — | | | | — | | | | — | | | | — | |
Interest | | | 4,126 | | | | 830 | | | | 7,337 | | | | 190 | | | | 91 | | | | 701 | |
Securities lending income, net | | | — | | | | 171,263 | | | | — | | | | 34,998 | | | | — | | | | 17,570 | |
Foreign taxes withheld on dividends | | | — | | | | — | | | | (83,700 | ) | | | — | | | | (3,572 | ) | | | — | |
| | | | | | | | | | | | | | | | | | | | | | | | |
Total income | | | 8,074,429 | | | | 35,942,859 | | | | 25,664,956 | | | | 243,140 | | | | 491,545 | | | | 124,870 | |
| | | | | | | | | | | | | | | | | | | | | | | | |
Expenses: | | | | | | | | | | | | | | | | | | | | | | | | |
Investment advisory fees (Note 4) | | | 12,718,652 | | | | 28,743,473 | | | | 16,805,316 | | | | 1,106,326 | | | | 519,847 | | | | 343,186 | |
Distribution fees — Retail Shares (Note 4) | | | 2,235,227 | | | | 3,425,258 | | | | 2,148,469 | | | | 225,968 | | | | 85,434 | | | | 29,498 | |
Shareholder servicing agent fees and expenses —
Retail Shares | | | 204,115 | | | | 181,974 | | | | 133,790 | | | | 42,975 | | | | 16,502 | | | | 10,390 | |
Shareholder servicing agent fees and expenses —
Institutional Shares | | | 25,480 | | | | 129,185 | | | | 42,015 | | | | 6,340 | | | | 6,855 | | | | 7,867 | |
Shareholder servicing agent fees and expenses —
R6 Shares | | | 180 | | | | 54 | | | | 692 | | | | 9 | | | | 31 | | | | 49 | |
Reports to shareholders | | | 204,400 | | | | 488,000 | | | | 474,600 | | | | 44,890 | | | | 5,585 | | | | 7,027 | |
Registration and filing fees | | | 70,950 | | | | 117,930 | | | | 97,560 | | | | 40,370 | | | | 36,460 | | | | 40,920 | |
Trustee fees and expenses | | | 59,033 | | | | 130,575 | | | | 81,676 | | | | 5,548 | | | | 3,681 | | | | 977 | |
Custodian and fund accounting fees | | | 54,780 | | | | 120,700 | | | | 94,295 | | | | 24,060 | | | | 22,009 | | | | 22,331 | |
Professional fees | | | 33,500 | | | | 92,850 | | | | 41,280 | | | | 21,218 | | | | 19,821 | | | | 20,510 | |
Insurance expense | | | 19,762 | | | | 47,485 | | | | 28,550 | | | | 2,089 | | | | 1,247 | | | | 205 | |
Line of credit fees | | | 16,121 | | | | 36,035 | | | | 21,087 | | | | 1,409 | | | | 939 | | | | 448 | |
Administration fees | | | 15,120 | | | | 15,025 | | | | 14,970 | | | | 15,120 | | | | 15,095 | | | | 15,095 | |
Miscellaneous expenses | | | 1,856 | | | | 6,779 | | | | 1,969 | | | | 1,856 | | | | 1,856 | | | | 1,856 | |
| | | | | | | | | | | | | | | | | | | | | | | | |
Total operating expenses | | | 15,659,176 | | | | 33,535,323 | | | | 19,986,269 | | | | 1,538,178 | | | | 735,362 | | | | 500,359 | |
Interest expense on borrowings | | | — | | | | 95,259 | | | | 2,612 | | | | 5,066 | | | | 4,080 | | | | — | |
| | | | | | | | | | | | | | | | | | | | | | | | |
Total expenses | | | 15,659,176 | | | | 33,630,582 | | | | 19,988,881 | | | | 1,543,244 | | | | 739,442 | | | | 500,359 | |
Reimbursement of expenses by Adviser —
Retail Shares (Note 4) | | | — | | | | — | | | | — | | | | — | | | | (14,546 | ) | | | (35,972 | ) |
Reimbursement of expenses by Adviser —
Institutional Shares (Note 4) | | | — | | | | — | | | | — | | | | — | | | | (4,138 | ) | | | (55,066 | ) |
Reimbursement of expenses by Adviser —
R6 Shares (Note 4) | | | — | | | | — | | | | — | | | | — | | | | (69 | ) | | | (2,426 | ) |
| | | | | | | | | | | | | | | | | | | | | | | | |
Net expenses | | | 15,659,176 | | | | 33,630,582 | | | | 19,988,881 | | | | 1,543,244 | | | | 720,689 | | | | 406,895 | |
| | | | | | | | | | | | | | | | | | | | | | | | |
Net investment income (loss) | | | (7,584,747 | ) | | | 2,312,277 | | | | 5,676,075 | | | | (1,300,104 | ) | | | (229,144 | ) | | | (282,025 | ) |
| | | | | | | | | | | | | | | | | | | | | | | | |
Realized and unrealized gain (loss) on investments: | | | | | | | | | | | | | | | | | | | | | | | | |
Net realized gain (loss) on investments sold — Unaffiliated investments | | | 131,197,345 | | | | 325,569,034 | | | | 304,958,818 | | | | 20,735,800 | | | | (3,913,333 | ) | | | 908,789 | |
Net realized gain (loss) on investments sold — “Affiliated” investments | | | — | | | | 13,620,760 | | | | (951,523 | ) | | | — | | | | — | | | | — | |
Net realized gain (loss) on foreign currency transactions | | | — | | | | (21,699 | ) | | | 1,344 | | | | — | | | | 5 | | | | (1,553 | ) |
Change in net unrealized appreciation (depreciation) of: | | | | | | | | | | | | | | | | | | | | | | | | |
Investments — Unaffiliated investments | | | 124,881,727 | | | | 6,649,532 | | | | 3,885,006 | | | | (4,733,564 | ) | | | 15,020,078 | | | | 8,623,772 | |
Investments — “Affiliated” investments | | | — | | | | 210,204,043 | | | | 5,989,831 | | | | — | | | | — | | | | — | |
Foreign currency translations | | | — | | | | (230 | ) | | | 703 | | | | — | | | | (69 | ) | | | (681 | ) |
| | | | | | | | | | | | | | | | | | | | | | | | |
Net gain on investments | | | 256,079,072 | | | | 556,021,440 | | | | 313,884,179 | | | | 16,002,236 | | | | 11,106,681 | | | | 9,530,327 | |
| | | | | | | | | | | | | | | | | | | | | | | | |
Net increase in net assets resulting from operations | | $ | 248,494,325 | | | $ | 558,333,717 | | | $ | 319,560,254 | | | $ | 14,702,132 | | | $ | 10,877,537 | | | $ | 9,248,302 | |
| | | | | | | | | | | | | | | | | | | | | | | | |
| | |
| See Notes to Financial Statements. | | 25 |
| | |
| Baron Funds | | March 31, 2017 |
STATEMENTS OF CHANGES IN NET ASSETS (Unaudited)
| | | | | | | | | | | | | | | | | | | | | | | | |
| | | Baron Asset Fund | | | Baron Growth Fund | | | Baron Small Cap Fund | |
| | | For the Six
Months Ended
March 31,
2017 | | | For the Year
Ended
September 30,
2016 | | | For the Six
Months Ended
March 31,
2017 | | | For the Year
Ended
September 30,
2016 | | | For the Six
Months Ended
March 31,
2017 | | | For the Year
Ended
September 30,
2016 | |
Increase (Decrease) in Net Assets: | | | | | | | | | | | | | | | | | | | | |
Operations: | | | | | | | | | | | | | | | | | | | | |
Net investment income (loss) | | $ | (7,584,747 | ) | | $ | (8,914,391 | ) | | $ | 2,312,277 | | | $ | 15,241,504 | | | $ | 5,676,075 | | | $ | (20,432,156 | ) |
Net realized gain | | | 131,197,345 | | | | 115,016,633 | | | | 339,168,095 | | | | 677,283,345 | | | | 304,008,639 | | | | 611,465,766 | |
Change in net unrealized appreciation (depreciation) | | | 124,881,727 | | | | 162,597,930 | | | | 216,853,345 | | | | (261,093,859 | ) | | | 9,875,540 | | | | (127,761,526 | ) |
| | | | | | | | | | | | | | | | | | | | | | | | |
Increase in net assets resulting from operations | | | 248,494,325 | | | | 268,700,172 | | | | 558,333,717 | | | | 431,430,990 | | | | 319,560,254 | | | | 463,272,084 | |
| | | | | | | | | | | | | | | | | | | | | | | | |
Distributions to shareholders from: | | | | | | | | | | | | | | | | | | | | |
Net realized gain on investments — Retail Shares | | | (81,908,923 | ) | | | (192,857,983 | ) | | | (315,911,802 | ) | | | (300,771,852 | ) | | | (325,929,736 | ) | | | (249,256,906 | ) |
Net realized gain on investments — Institutional Shares | | | (32,742,122 | ) | | | (75,706,896 | ) | | | (335,828,188 | ) | | | (292,771,461 | ) | | | (293,355,641 | ) | | | (200,060,422 | ) |
Net realized gain on investments — R6 Shares | | | (351,281 | ) | | | (2,496 | ) | | | (261,804 | ) | | | — | | | | (720,045 | ) | | | — | |
| | | | | | | | | | | | | | | | | | | | | | | | |
Decrease in net assets from distributions to shareholders | | | (115,002,326 | ) | | | (268,567,375 | ) | | | (652,001,794 | ) | | | (593,543,313 | ) | | | (620,005,422 | ) | | | (449,317,328 | ) |
| | | | | | | | | | | | | | | | | | | | | | | | |
Capital share transactions: | | | | | | | | | | | | | | | | | | | | |
Proceeds from the sale of shares — Retail Shares | | | 40,682,080 | | | | 74,173,128 | | | | 97,838,594 | | | | 209,973,033 | | | | 103,434,488 | | | | 159,998,217 | |
Proceeds from the sale of shares — Institutional Shares | | | 85,064,293 | | | | 104,274,919 | | | | 338,172,548 | | | | 587,751,924 | | | | 213,431,215 | | | | 459,238,081 | |
Proceeds from the sale of shares — R6 Shares | | | 16,303 | | | | 7,361,253 | | | | 73,355 | | | | 2,239,695 | | | | 72,193,940 | | | | 3,449,895 | |
Net asset value of shares issued in reinvestment of distributions — Retail Shares | | | 79,981,714 | | | | 188,688,679 | | | | 308,276,661 | | | | 295,137,151 | | | | 320,323,421 | | | | 245,730,982 | |
Net asset value of shares issued in reinvestment of distributions — Institutional Shares | | | 31,600,055 | | | | 73,173,688 | | | | 322,216,695 | | | | 276,721,034 | | | | 272,997,394 | | | | 184,345,711 | |
Net asset value of shares issues in reinvestment of distribution — R6 Shares | | | 351,281 | | | | 2,496 | | | | 261,804 | | | | — | | | | 720,045 | | | | — | |
Cost of shares redeemed — Retail Shares | | | (160,712,494 | ) | | | (260,675,946 | ) | | | (533,858,213 | ) | | | (1,016,386,109 | ) | | | (388,212,399 | ) | | | (1,178,412,830 | ) |
Cost of shares redeemed — Institutional Shares | | | (57,775,788 | ) | | | (176,801,922 | ) | | | (499,238,011 | ) | | | (1,182,140,006 | ) | | | (427,593,282 | ) | | | (902,239,753 | ) |
Cost of shares redeemed — R6 Shares | | | — | | | | — | | | | (1,223 | ) | | | (275 | ) | | | (3,336,333 | ) | | | — | |
| | | | | | | | | | | | | | | | | | | | | | | | |
Increase (decrease) in net assets derived from capital share transactions | | | 19,207,444 | | | | 10,196,295 | | | | 33,742,210 | | | | (826,703,553 | ) | | | 163,958,489 | | | | (1,027,889,697 | ) |
| | | | | | | | | | | | | | | | | | | | | | | | |
Net increase (decrease) in net assets | | | 152,699,443 | | | | 10,329,092 | | | | (59,925,867 | ) | | | (988,815,876 | ) | | | (136,486,679 | ) | | | (1,013,934,941 | ) |
| | | | | | | | | | | | | | | | | | | | | | | | |
Net Assets: | | | | | | | | | | | | | | | | | | | | |
Beginning of period | | | 2,533,706,341 | | | | 2,523,377,249 | | | | 5,962,784,675 | | | | 6,951,600,551 | | | | 3,510,653,047 | | | | 4,524,587,988 | |
| | | | | | | | | | | | | | | | | | | | | | | | |
End of period | | $ | 2,686,405,784 | | | $ | 2,533,706,341 | | | $ | 5,902,858,808 | | | $ | 5,962,784,675 | | | $ | 3,374,166,368 | | | $ | 3,510,653,047 | |
| | | | | | | | | | | | | | | | | | | | | | | | |
Undistributed (accumulated) net investment income (loss) at end of period | | $ | (20,512,852 | ) | | $ | (12,928,105 | ) | | $ | 8,193,777 | | | $ | 5,881,500 | | | $ | 290,838 | | | $ | (5,385,237 | ) |
| | | | | | | | | | | | | | | | | | | | | | | | |
Capital share transactions — Retail Shares | | | | | | | | | | | | | | | | | | | | |
Shares sold | | | 669,175 | | | | 1,303,840 | | | | 1,550,242 | | | | 3,267,882 | | | | 3,884,415 | | | | 5,675,541 | |
Shares issued in reinvestment of distributions | | | 1,367,677 | | | | 3,295,576 | | | | 5,120,028 | | | | 4,600,018 | | | | 12,546,941 | | | | 8,616,093 | |
Shares redeemed | | | (2,659,356 | ) | | | (4,527,322 | ) | | | (8,455,157 | ) | | | (15,856,841 | ) | | | (14,457,424 | ) | | | (40,336,749 | ) |
| | | | | | | | | | | | | | | | | | | | | | | | |
Net increase (decrease) | | | (622,504 | ) | | | 72,094 | | | | (1,784,887 | ) | | | (7,988,941 | ) | | | 1,973,932 | | | | (26,045,115 | ) |
| | | | | | | | | | | | | | | | | | | | | | | | |
Capital share transactions — Institutional Shares | | | | | | | | | | | | | | | | | | | | |
Shares sold | | | 1,354,249 | | | | 1,784,611 | | | | 5,197,174 | | | | 9,007,462 | | | | 7,687,848 | | | | 15,866,935 | |
Shares issued in reinvestment of distributions | | | 525,354 | | | | 1,247,530 | | | | 5,235,890 | | | | 4,240,286 | | | | 10,395,941 | | | | 6,332,728 | |
Shares redeemed | | | (932,284 | ) | | | (2,984,894 | ) | | | (7,778,450 | ) | | | (18,424,376 | ) | | | (15,278,749 | ) | | | (30,763,117 | ) |
| | | | | | | | | | | | | | | | | | | | | | | | |
Net increase (decrease) | | | 947,319 | | | | 47,247 | | | | 2,654,614 | | | | (5,176,628 | ) | | | 2,805,040 | | | | (8,563,454 | ) |
| | | | | | | | | | | | | | | | | | | | | | | | |
Capital share transactions — R6 Shares | | | | | | | | | | | | | | | | | | | | |
Shares sold | | | 256 | | | | 125,217 | | | | 1,168 | | | | 34,095 | | | | 2,730,503 | | | | 117,047 | |
Shares issued in reinvestment of dividends | | | 5,840 | | | | 44 | | | | 4,254 | | | | — | | | | 27,420 | | | | — | |
Shares redeemed | | | — | | | | — | | | | (19 | ) | | | (4 | ) | | | (121,581 | ) | | | — | |
| | | | | | | | | | | | | | | | | | | | | | | | |
Net increase | | | 6,096 | | | | 125,261 | | | | 5,403 | | | | 34,091 | | | | 2,636,342 | | | | 117,047 | |
| | | | | | | | | | | | | | | | | | | | | | | | |
| | |
| 26 | | See Notes to Financial Statements. |
| | |
| March 31, 2017 | | Baron Funds |
STATEMENTS OF CHANGES IN NET ASSETS (Unaudited) (Continued)
| | | | | | | | | | | | | | | | | | | | | | | | |
| | | Baron Opportunity Fund | | | Baron Fifth Avenue Growth
Fund | | | Baron Discovery Fund | |
| | | For the Six
Months Ended
March 31,
2017 | | | For the Year
Ended
September 30,
2016 | | | For the Six
Months Ended
March 31,
2017 | | | For the Year
Ended
September 30,
2016 | | | For the Six
Months Ended
March 31,
2017 | | | For the Year
Ended
September 30,
2016 | |
Increase (Decrease) in Net Assets: | | | | | | | | | | | | | | | | | | | | | | | | |
Operations: | | | | | | | | | | | | | | | | | | | | | | | | |
Net investment income (loss) | | $ | (1,300,104 | ) | | $ | (2,072,319 | ) | | $ | (229,144 | ) | | $ | (475,449 | ) | | $ | (282,025 | ) | | $ | 459,288 | |
Net realized gain (loss) | | | 20,735,800 | | | | 26,739,948 | | | | (3,913,328 | ) | | | (4,123,105 | ) | | | 907,236 | | | | (7,492,617 | ) |
Change in net unrealized appreciation (depreciation) | | | (4,733,564 | ) | | | (1,100,590 | ) | | | 15,020,009 | | | | 24,216,389 | | | | 8,623,091 | | | | 13,484,335 | |
| | | | | | | | | | | | | | | | | | | | | | | | |
Increase in net assets resulting from operations | | | 14,702,132 | | | | 23,567,039 | | | | 10,877,537 | | | | 19,617,835 | | | | 9,248,302 | | | | 6,451,006 | |
| | | | | | | | | | | | | | | | | | | | | | | | |
Distributions to shareholders from: | | | | | | | | | | | | | | | | | | | | |
Net realized gain on investments — Retail Shares | | | (22,424,986 | ) | | | (23,538,224 | ) | | | — | | | | — | | | | — | | | | (362,976 | ) |
Net realized gain on investments — Institutional Shares | | | (4,531,300 | ) | | | (9,136,197 | ) | | | — | | | | — | | | | — | | | | (338,882 | ) |
Net realized gain on investments — R6 Shares | | | (44,520 | ) | | | — | | | | — | | | | — | | | | — | | | | — | |
| | | | | | | | | | | | | | | | | | | | | | | | |
Decrease in net assets from distributions to shareholders | | | (27,000,806 | ) | | | (32,674,421 | ) | | | — | | | | — | | | | — | | | | (701,858 | ) |
| | | | | | | | | | | | | | | | | | | | | | | | |
Capital share transactions: | | | | | | | | | | | | | | | | | | | | |
Proceeds from the sale of shares — Retail Shares | | | 13,534,701 | | | | 20,711,733 | | | | 4,462,638 | | | | 13,334,709 | | | | 32,067,809 | | | | 3,325,323 | |
Proceeds from the sale of shares — Institutional Shares | | | 3,728,895 | | | | 4,351,441 | | | | 5,253,674 | | | | 21,707,323 | | | | 42,505,180 | | | | 9,434,873 | |
Proceeds from the sale of shares — R6 Shares | | | — | | | | 434,469 | | | | 3,000 | | | | 1,259,756 | | | | 244,042 | | | | 1,982,543 | |
Net asset value of shares issued in reinvestment of distributions — Retail Shares | | | 21,793,006 | | | | 22,746,010 | | | | — | | | | — | | | | — | | | | 360,715 | |
Net asset value of shares issued in reinvestment of distributions — Institutional Shares | | | 4,021,193 | | | | 8,314,026 | | | | — | | | | — | | | | — | | | | 271,096 | |
Net asset value of shares issues in reinvestment of distribution — R6 Shares | | | 44,520 | | | | — | | | | — | | | | — | | | | — | | | | — | |
Cost of shares redeemed — Retail Shares | | | (52,906,269 | ) | | | (63,302,681 | ) | | | (11,407,180 | ) | | | (20,733,353 | ) | | | (5,890,900 | ) | | | (8,059,970 | ) |
Cost of shares redeemed — Institutional Shares | | | (7,468,281 | ) | | | (57,314,953 | ) | | | (14,345,774 | ) | | | (24,613,301 | ) | | | (2,208,703 | ) | | | (43,422,332 | ) |
Cost of shares redeemed — R6 Shares | | | (51,938 | ) | | | — | | | | (5,464 | ) | | | — | | | | — | | | | — | |
| | | | | | | | | | | | | | | | | | | | | | | | |
Increase (decrease) in net assets derived from capital share transactions | | | (17,304,173 | ) | | | (64,059,955 | ) | | | (16,039,106 | ) | | | (9,044,866 | ) | | | 66,717,428 | | | | (36,107,752 | ) |
| | | | | | | | | | | | | | | | | | | | | | | | |
Net increase (decrease) in net assets | | | (29,602,847 | ) | | | (73,167,337 | ) | | | (5,161,569 | ) | | | 10,572,969 | | | | 75,965,730 | | | | (30,358,604 | ) |
| | | | | | | | | | | | | | | | | | | | | | | | |
Net Assets: | | | | | | | | | | | | | | | | | | | | |
Beginning of period | | | 250,769,302 | | | | 323,936,639 | | | | 156,807,376 | | | | 146,234,407 | | | | 43,433,673 | | | | 73,792,277 | |
| | | | | | | | | | | | | | | | | | | | | | | | |
End of period | | $ | 221,166,455 | | | $ | 250,769,302 | | | $ | 151,645,807 | | | $ | 156,807,376 | | | $ | 119,399,403 | | | $ | 43,433,673 | |
| | | | | | | | | | | | | | | | | | | | | | | | |
Undistributed (accumulated) net investment income (loss) at end of period | | $ | (3,393,289 | ) | | $ | (2,093,185 | ) | | $ | (793,464 | ) | | $ | (564,320 | ) | | $ | (277,136 | ) | | $ | 4,889 | |
| | | | | | | | | | | | | | | | | | | | | | | | |
Capital share transactions — Retail Shares | | | | | | | | | | | | | | | | | | | | |
Shares sold | | | 887,936 | | | | 1,289,427 | | | | 229,821 | | | | 751,628 | | | | 2,237,019 | | | | 278,949 | |
Shares issued in reinvestment of distributions | | | 1,519,736 | | | | 1,353,124 | | | | — | | | | — | | | | — | | | | 32,007 | |
Shares redeemed | | | (3,576,760 | ) | | | (3,926,468 | ) | | | (604,919 | ) | | | (1,179,010 | ) | | | (425,805 | ) | | | (712,512 | ) |
| | | | | | | | | | | | | | | | | | | | | | | | |
Net increase (decrease) | | | (1,169,088 | ) | | | (1,283,917 | ) | | | (375,098 | ) | | | (427,382 | ) | | | 1,811,214 | | | | (401,556 | ) |
| | | | | | | | | | | | | | | | | | | | | | | | |
Capital share transactions — Institutional Shares | | | | | | | | | | | | | | | | | | | | |
Shares sold | | | 236,963 | | | | 259,249 | | | | 268,424 | | | | 1,180,779 | | | | 3,051,801 | | | | 738,254 | |
Shares issued in reinvestment of distributions | | | 272,808 | | | | 483,936 | | | | — | | | | — | | | | — | | | | 23,885 | |
Shares redeemed | | | (475,838 | ) | | | (3,493,332 | ) | | | (724,560 | ) | | | (1,376,764 | ) | | | (159,670 | ) | | | (3,886,277 | ) |
| | | | | | | | | | | | | | | | | | | | | | | | |
Net increase (decrease) | | | 33,933 | | | | (2,750,147 | ) | | | (456,136 | ) | | | (195,985 | ) | | | 2,892,131 | | | | (3,124,138 | ) |
| | | | | | | | | | | | | | | | | | | | | | | | |
Capital share transactions — R6 Shares | | | | | | | | | | | | | | | | | | | | |
Shares sold | | | — | | | | 25,224 | | | | 156 | | | | 70,371 | | | | 17,545 | | | | 147,688 | |
Shares issued in reinvestment of dividends | | | 3,021 | | | | — | | | | — | | | | — | | | | — | | | | — | |
Shares redeemed | | | (3,377 | ) | | | — | | | | (286 | ) | | | — | | | | — | | | | — | |
| | | | | | | | | | | | | | | | | | | | | | | | |
Net increase (decrease) | | | (356 | ) | | | 25,224 | | | | (130 | ) | | | 70,371 | | | | 17,545 | | | | 147,688 | |
| | | | | | | | | | | | | | | | | | | | | | | | |
| | |
| See Notes to Financial Statements. | | 27 |
| | |
| Baron Funds | | March 31, 2017 |
NOTES TO FINANCIAL STATEMENTS (Unaudited)
1. ORGANIZATION
Baron Investment Funds Trust (the “Trust”) is registered under the Investment Company Act of 1940, as amended (the “1940 Act”), as an open-end management investment company established as a Massachusetts business trust on February 19, 1987, and accordingly follows the investment company accounting and reporting guidance of the Financial Accounting Standards Board (“FASB”) Accounting Standard Codification Topic 946 Financial Services – Investment Companies. The Trust currently offers six series (individually, a “Fund” and collectively, the “Funds”): Baron Asset Fund, Baron Growth Fund, Baron Small Cap Fund, Baron Opportunity Fund, Baron Fifth Avenue Growth Fund and Baron Discovery Fund.
Each Fund offers Retail Shares, Institutional Shares and R6 Shares. Each class of shares differs only in its ongoing fees, expenses and eligibility requirements. Retail Shares are offered to all investors. Institutional Shares are for investments in the amount of $1 million or more per Fund. Institutional Shares are intended for certain financial intermediaries that offer shares of Baron Funds through fee-based platforms, retirement platforms or other platforms. R6 Shares are for investments in the amount of $5 million or more per Fund. R6 Shares are available only to qualified 401(a) plans (including 401(k) plans, Keogh plans, profit sharing plans, money purchase pension plans, target benefit plans, defined benefit pension plans and Taft-Hartley multi-employer pension plans), endowment funds and foundations, any state, county or city, or its instrumentality, department, authority, or agency, 457 plans, including 457(a) governmental entity plans and tax-exempt plans, accounts registered to insurance companies, trust companies and bank trust departments, investment companies, both affiliated and not affiliated with the adviser, and any entity that is considered a corporation for tax purposes, including corporate non-qualified deferred compensation plans of such corporations. Each class of shares has equal rights to earnings and assets, except that each class bears different expenses for distribution and shareholder servicing. Each Fund’s investment income, realized and unrealized gains or losses on investments and foreign currency, and expenses other than those attributable to a specific class are allocated to each class based on its relative net assets. Each class of shares has exclusive voting rights with respect to matters that affect just that class.
The investment goals of the Funds are as follows:
Baron Asset Fund seeks capital appreciation through long-term investments primarily in securities of medium-sized companies with undervalued assets or favorable growth prospects.
Baron Growth Fund seeks capital appreciation through long-term investments primarily in securities of small-sized growth companies.
Baron Small Cap Fund seeks capital appreciation through investments primarily in securities of small-sized growth companies.
Baron Opportunity Fund seeks capital appreciation through investments primarily in growth companies that benefit from technology advances.
Baron Fifth Avenue Growth Fund seeks capital appreciation through investments primarily in securities of large-sized growth companies.
Baron Discovery Fund seeks capital appreciation through investments primarily in securities of small-sized growth companies.
2. SIGNIFICANT ACCOUNTING POLICIES
The following is a summary of significant accounting policies followed by the Funds. The policies are in conformity with accounting principles generally accepted in the United States of America (“GAAP”). The preparation of financial statements in accordance with GAAP requires management to make estimates and assumptions that affect the reported amounts of assets and liabilities at the date of the financial statements and the amounts of income and expenses during the period. Actual results could differ from those estimates. Events occurring subsequent to the date of the Statements of Assets and Liabilities and through the date of issuance of the financial statements have been evaluated for adjustment to or disclosure in the financial statements.
a) Security Valuation. The Funds’ share prices or net asset values (“NAV”) are calculated as of the scheduled close of the regular trading session (usually 4 p.m. E.T. or such other time as of which the Funds’ NAV is calculated (the “NAV Calculation Time”)) on the New York Stock Exchange (the “Exchange”) on any day the Exchange is scheduled to be open. Portfolio securities traded on any national stock exchange are valued based on the last sale price on the exchange where such shares are principally traded. For securities traded on NASDAQ, the Funds use the NASDAQ Official Closing Price. If there are no sales on a given day, the value of the security may be the average of the most recent bid and asked quotations on such exchange or the last sale price from a prior day. Where market quotations are not readily available, or, if in BAMCO, Inc.’s (the “Adviser”) judgment, they do not accurately reflect the fair value of a security, or an event occurs after the market close but before the Funds are priced that materially affects the value of a security, the security will be valued by the Adviser using policies and procedures approved by the Board of Trustees (the “Board”). The Adviser has a Fair Valuation Committee (the “Committee”) comprised of senior management representatives and the Committee reports to the Board every quarter. Factors the Committee may consider when valuing a security include whether a current price is stale, there is recent news, the security is thinly traded, transactions are infrequent or quotations are genuine. There can be no guarantee, however, that a fair valuation used by the Funds on any given day will more accurately reflect the market value of an investment than the closing price of such investment in its market. U.S. Government obligations, money market instruments, and other debt instruments held by the Funds with a remaining maturity of 60 days or less are generally valued at amortized cost, which approximates fair value. Debt instruments having a greater remaining maturity will be valued on the basis of prices obtained from a pricing service approved by the Board or at the mean of the bid and ask prices from the dealer maintaining an active market in that security. The value of the Funds’ investments in convertible bonds is determined primarily by obtaining valuations from independent pricing services based on readily available bid quotations or, if quotations are not available, by methods which include various considerations such as yields or prices of securities of comparable quality, coupon, maturity and type; indications as to values from dealers; and general market conditions. Other inputs used by an independent pricing service to value convertible bonds generally include underlying stock data, conversion premiums, listed bond and preferred stock prices and other market information which may include benchmark curves, trade execution data, and sensitivity analysis, when available. Open-end investment companies, including securities lending collateral invested in registered investment company money market funds, are valued at their NAV each day.
Non-U.S. equity securities are valued on the basis of their most recent closing market prices and translated into U.S. dollars at the NAV Calculation Time, except under the circumstances described below. Most foreign markets close before the NAV Calculation Time. For securities primarily traded in the Far East, for example, the most recent
28
| | |
| March 31, 2017 | | Baron Funds |
NOTES TO FINANCIAL STATEMENTS (Unaudited) (Continued)
2. SIGNIFICANT ACCOUNTING POLICIES (Continued)
closing prices may be as much as 15 hours old at the NAV Calculation Time. As a result, the Adviser may use a third-party pricing service to assist in determining fair value of foreign securities. This service utilizes a systematic methodology in making fair value estimates. The Adviser may also fair value securities in other situations, for example, when a particular foreign market is closed but the Funds are open. The Adviser cannot predict how often it will use closing prices or how often it will adjust those prices. As a means of evaluating its fair value process, the Adviser routinely compares closing market prices, the next day’s opening prices in the same markets, and the adjusted prices. Other mutual funds may adjust the prices of their securities by different amounts.
b) Securities Transactions, Investment Income and Expense Allocation. Securities transactions are recorded on a trade date basis. Realized gain and loss from securities transactions are recorded on an identified cost basis for financial reporting and federal income tax purposes. Dividend income is recognized on the ex-dividend date and interest income is recognized on an accrual basis, which includes the accretion of discounts and amortization of premiums. Certain dividends from foreign securities will be recorded as soon as the Funds are informed of the dividend if such information is obtained subsequent to the ex-dividend date. Distributions received from certain investments held by the Funds may be comprised of dividends, realized gains and returns of capital. The Funds originally estimate the expected classification of such payments. The amounts may subsequently be reclassified upon receipt of information from the issuer. The Funds are charged for those expenses of the Trust that are directly attributable to each Fund, such as advisory and custodian fees. Expenses that are not directly attributable to a Fund are typically allocated among the Funds in proportion to their respective net assets.
c) Foreign Currency Translations. Values of assets and liabilities denominated in foreign currencies are translated into U.S. dollars using the price of such currencies at the time the net asset value is determined. Purchases and sales of investments and dividend income are converted at the prevailing rate of exchange on the respective dates of such transactions. Net realized gain (loss) on foreign currency transactions includes gain (loss) arising from the fluctuation in the exchange rates between trade and settlement dates on security transactions and currency gain (loss) between the accrual and payment dates on dividends and foreign withholding taxes. The Funds do not isolate that portion of the results of operations resulting from changes in foreign exchange rates on investments from the fluctuations arising from changes in market prices of securities held. Such fluctuations are included with the net realized and unrealized gain or loss from investments and foreign currency transactions on the Statements of Operations. The Funds may invest in foreign securities and foreign currency transactions that may involve risks not associated with domestic investments as a result of the level of governmental supervision and regulation of foreign securities markets and the possibility of political or economic instability, among others.
Pursuant to U.S. federal income tax regulations, gains and losses from certain foreign currency transactions and the foreign currency portion of gains and losses realized on sales and maturities of foreign denominated debt securities are generally treated as ordinary income for U.S. federal income tax purposes.
d) Securities Lending. The Funds may lend securities to certain brokers under the terms of a master netting agreement. Upon such loans, the Funds receive collateral which is maintained by the custodian. The Funds may pay fees to the custodian for administering the securities lending program. The Funds earn interest on such collateral and earn income in the form of negotiated lenders’ fees, both of which are included in securities lending income in the Statements of Operations. Securities loaned are required to be secured at all times by collateral equal to at least 102% of the market value of the securities loaned. Risks may arise upon entering into securities lending to the extent that the value of the collateral is less than the value of the securities loaned due to the changes in the value of collateral or the loaned securities. The collateral is marked-to-market daily and settled on the next business day. The Funds may receive collateral in the form of cash or other eligible securities, such as a letter of credit issued by a U.S. bank or securities issued or guaranteed by the U.S. government. Securities purchased with cash collateral are subject to the risks inherent in investing in these securities.
The Funds did not hold derivatives or participate in securities lending/borrowing activities at March 31, 2017.
e) Repurchase Agreements. The Funds may invest in repurchase agreements, which are short term investments whereby the Funds acquire ownership of a debt security and the seller agrees to repurchase the security at a future date at a specified price. When entering into repurchase agreements, it is the Funds’ policy that their custodian take possession of the underlying collateral securities, the market value of which, at all times, equals at least 102% of the principal amount of the repurchase transaction. To the extent that any repurchase transaction exceeds one business day, the value of the collateral is marked-to-market to ensure the adequacy of the collateral. If the seller defaults and the market value of the collateral declines or if bankruptcy proceedings are commenced with respect to the seller of the security, realization of the collateral by the Funds may be delayed or limited. The information required to be disclosed by ASU No. 2011-11 for the Funds’ investments in repurchase agreements at March 31, 2017, including the fair value of the repurchase agreement and the amount of collateral, can be found in each respective Fund’s Statement of Net Assets.
f) Master Limited Partnerships. The Funds may invest in master limited partnerships (“MLPs”). MLPs are limited partnerships or limited liability companies, whose partnership units or limited liability interests are listed and traded on a U.S. securities exchange, and are treated as publicly traded partnerships for federal income tax purposes. To qualify to be treated as a partnership for tax purposes, an MLP must receive at least 90% of its income from qualifying sources as set forth in Section 7704(d) of the Internal Revenue Code of 1986, as amended. These qualifying sources include interest, dividend, real property rent, gain from sale or other disposition of real property and income from activities such as the exploration, development, mining, production, processing, refining, transportation, storage and marketing of mineral or natural resources.
g) Federal and Foreign Income Taxes. The Trust treats each Fund as a separate entity for federal income tax purposes. Each Fund intends to meet the requirements of the Internal Revenue Code of 1986, as amended, applicable to regulated investment companies, and to distribute to its shareholders substantially all of its net investment income and any net realized capital gains at least annually. None of the Funds will be subject to federal or state income taxes to the extent that they qualify as regulated investment companies and substantially all of their income is distributed.
The Funds may be subject to foreign taxes on income and gains on investments that are accrued based upon the Funds’ understanding of the tax rules and regulations that exist in the countries in which the Funds invest. Foreign governments may also impose taxes or other payments on investments with respect to foreign securities. Such taxes are accrued as applicable.
29
| | |
| Baron Funds | | March 31, 2017 |
NOTES TO FINANCIAL STATEMENTS (Continued)
2. SIGNIFICANT ACCOUNTING POLICIES (Continued)
h) Restricted Securities. The Funds may invest in securities that are restricted as to public sale in accordance with the Securities Act of 1933. Such assets are valued by the Adviser pursuant to policies and procedures approved by the Board.
i) Distributions to Shareholders. Income and capital gain distributions to shareholders are determined in accordance with income tax regulations which may differ from GAAP. These differences are primarily due to differing treatments for net investment loss, foreign currency gains and losses, reclassification of distributions, partnership basis adjustments, income from passive foreign investment companies and wash sale losses deferred.
j) Commitments and Contingencies. In the normal course of business, the Funds may enter into contracts and agreements that contain a variety of representations and warranties, which provide general indemnification. The maximum exposure to the Funds under these agreements is unknown, as this would involve future claims that may be made against the Funds that have not yet occurred. However, based on experience, the Funds expect the risk of loss to be remote.
k) Cash and Cash Equivalents. The Funds consider all short term liquid investments with a maturity of three months or less when purchased to be cash equivalents.
3. PURCHASES AND SALES OF SECURITIES
Purchases and sales of securities, other than short term securities, for the six months ended March 31, 2017 were as follows:
| | | | | | | | |
| Fund | | Purchases | | | Sales | |
Baron Asset Fund | | $ | 117,649,659 | | | $ | 233,920,669 | |
Baron Growth Fund | | | 28,639,508 | | | | 640,623,243 | |
Baron Small Cap Fund | | | 256,440,044 | | | | 715,393,871 | |
Baron Opportunity Fund | | | 37,133,939 | | | | 82,897,448 | |
Baron Fifth Avenue Growth Fund | | | 10,500,554 | | | | 26,863,523 | |
Baron Discovery Fund | | | 73,360,156 | | | | 15,103,620 | |
4. INVESTMENT ADVISORY FEES AND OTHER TRANSACTIONS WITH AFFILIATES
a) Investment Advisory Fees. The Adviser, a wholly owned subsidiary of Baron Capital Group, Inc. (“BCG”), serves as investment adviser to the Funds. As compensation for services rendered, the Adviser receives a fee payable monthly from Baron Asset Fund, Baron Growth Fund, Baron Small Cap Fund, Baron Opportunity Fund and Baron Discovery Fund equal to 1% per annum of the average daily net assets of the respective Funds. The Adviser receives a fee payable monthly from Baron Fifth Avenue Growth Fund equal to 0.70% per annum of the daily net assets.
For Baron Opportunity Fund, Baron Fifth Avenue Growth Fund and Baron Discovery Fund, the Adviser has contractually agreed to reduce its fee, to the extent required to limit the net annual operating expense ratio (excluding portfolio transaction costs, interest, dividend and extraordinary expenses), as follows.
| | | | | | | | | | | | |
| | | Annual Operating
Expense Ratio Cap | |
| Fund | | Retail Shares | | | Institutional Shares | | | R6 Shares | |
Baron Opportunity Fund | | | 1.50 | % | | | 1.25 | % | | | 1.24 | % |
Baron Fifth Avenue Growth Fund | | | 1.10 | % | | | 0.85 | % | | | 0.84 | % |
Baron Discovery Fund | | | 1.35 | % | | | 1.10 | % | | | 1.09 | % |
b) Distribution Fees. Baron Capital, Inc. (“BCI”), a wholly owned subsidiary of BCG, is a registered limited purpose broker-dealer and the distributor of the Funds’ shares. The Funds are authorized to pay BCI a distribution fee payable monthly pursuant to a distribution plan under Rule 12b-1 of the 1940 Act equal to 0.25% per annum of the Retail Shares’ average daily net assets of the respective Funds.
c) Trustee Fees. Certain Trustees of the Trust may be deemed to be affiliated with, or interested persons (as defined by the 1940 Act) of the Funds’ Adviser or of BCI. None of the Trustees so affiliated received compensation for his or her services as a Trustee of the Trust. None of the Funds’ officers received compensation from the Funds for their services as an officer.
d) Fund Accounting and Administration Fees. The Funds have entered into an agreement with State Street Bank and Trust Company (“State Street”) to perform accounting and certain administrative services. State Street is compensated for fund accounting services based on a percentage of the Funds’ net assets, subject to certain minimums plus fixed annual fees for the administrative services.
30
| | |
| March 31, 2017 | | Baron Funds |
NOTES TO FINANCIAL STATEMENTS (Unaudited) (Continued)
4. INVESTMENT ADVISORY FEES AND OTHER TRANSACTIONS WITH AFFILIATES (Continued)
e) Cross Trades. The Funds are permitted to purchase securities from, or sell securities to, other Funds within the Trust, other funds in the Baron Select Funds, and other entities advised or subadvised by the Adviser, pursuant to “Cross-Trading” Procedures adopted by the Board. These procedures have been designed to ensure that any cross-trade of securities by a Fund from or to another fund/other entity that is or could be considered an affiliate of the respective Baron Fund under certain limited circumstances by virtue of having a common investment adviser, common officers, or common trustees complies with Rule 17a-7 under the 1940 Act. Further, as defined under these procedures, each cross-trade is effected at the current market price and with no commissions. Pursuant to these procedures, for the six months ended March 31, 2017, the Funds engaged in the following cross-trades:
| | | | | | | | | | | | |
| | | Purchases | | | Sales | | | Net Realized
Gains (Losses) | |
Baron Discovery Fund | | $ | 139,200 | | | $ | — | | | $ | — | |
5. LINE OF CREDIT
The Funds, together with other funds in Baron Select Funds (except Baron Partners Fund), participate in a committed line of credit agreement with State Street to be used for temporary purposes, primarily for financing redemptions. Each fund may borrow up to the lesser of $100 million or the maximum amount each fund may borrow under the 1940 Act, the limitations included in each fund’s prospectus, or any limit or restriction under any law or regulation to which each fund is subject or any agreement to which each fund is a party; provided that the aggregate outstanding principal amount of all loans to any of the funds may not exceed $100 million. Interest is charged to each fund, based on its borrowings, at a rate per annum equal to the higher of the Overnight Federal Funds Rate or the One Month LIBOR Rate plus a margin of 1.00%. An upfront fee of 0.05% is incurred on the commitment amount and a commitment fee of 0.20% per annum is incurred on the unused portion of the line of credit. Both fees are allocated to the participating funds based on their relative net assets.
During the six months ended March 31, 2017, Baron Growth Fund, Baron Small Cap Fund, Baron Opportunity Fund and Baron Fifth Avenue Growth Fund had borrowings under the line of credit and incurred interest expense of $95,259, $2,612, $5,066 and $4,080, respectively. For the 128 days during which there were borrowings, Baron Growth Fund had an average daily balance on the line of credit of $15.5 million at a weighted average interest rate of 1.75%. For the 10 days during which there were borrowings, Baron Small Cap Fund had an average daily balance on the line of credit of $6.2 million at a weighted average interest rate of 1.55%. For the 56 days during which there were borrowings, Baron Opportunity Fund had an average daily balance on the line of credit of $1.8 million at a weighted average interest rate of 1.79%. For the 48 days during which there were borrowings, Baron Fifth Avenue Growth Fund had an average daily balance on the line of credit of $1.6 million at a weighted average interest rate of 1.93%.
At March 31, 2017, Baron Growth Fund, Baron Opportunity Fund and Baron Fifth Avenue Growth Fund had outstanding balances in the amounts of $14,000,000, $500,000 and $300,000, respectively.
6. RESTRICTED SECURITIES
At March 31, 2017, investments in securities included securities that are restricted and/or illiquid. Restricted securities are often purchased in private placement transactions, are not registered under the Securities Act of 1933, may have contractual restrictions on resale and are valued pursuant to the policies and procedures for fair value pricing approved by the Board. A security may be considered illiquid if it lacks a readily available market or if its valuation has not changed for a certain period of time. The Funds may receive more or less than this valuation in an actual sale and that difference could be material. At March 31, 2017, the Funds held investments in restricted and/or illiquid securities that were valued pursuant to policies and procedures for fair value pricing as follows:
| | | | | | | | |
| | | Baron Asset Fund | |
| Name of Issuer | | Acquisition Date(s) | | | Value | |
Private Equity Investments | | | | | | | | |
Windy City Investments Holdings, L.L.C. | | | 11/13/2007-1/27/2011 | | | $ | 3,245,862 | |
| | | | | | | | |
(Cost $0) (0.12% of Net Assets) | | | | | | | | |
| | | Baron Growth Fund | |
| Name of Issuer | | Acquisition Date(s) | | | Value | |
Private Equity Investments | | | | | | | | |
Windy City Investments Holdings, L.L.C. | | | 11/13/2007-1/27/2011 | | | $ | 1,092,580 | |
| | | | | | | | |
(Cost $0) (0.02% of Net Assets) | | | | | | | | |
| | | Baron Discovery Fund | |
| Name of Issuer | | Acquisition Date(s) | | | Value | |
Warrants | | | | | | | | |
Barfresh Food Group, Inc., Warrants Exp 3/13/2020 | | | 2/23/2015 | | | $ | 60,000 | |
| | | | | | | | |
(Cost $0) (0.05% of Net Assets) | | | | | | | | |
31
| | |
| Baron Funds | | March 31, 2017 |
NOTES TO FINANCIAL STATEMENTS (Continued)
7. FAIR VALUE MEASUREMENTS
Fair value is defined by GAAP as the price that the Funds would receive upon selling an investment in a timely transaction to an independent buyer in the principal or most advantageous market for the investment. GAAP provides a three-tier hierarchy to maximize the use of observable market data and minimize the use of unobservable inputs and to establish classification of fair value measurements for disclosure purposes. Inputs refer broadly to the assumptions that market participants would use in pricing the asset or liability. Inputs may be observable or unobservable. Observable inputs are based on market data obtained from sources independent of the Funds. Unobservable inputs are inputs that reflect the Funds’ own assumptions based on the best information available in the circumstances. The three-tier hierarchy of inputs is summarized in the three broad Levels listed below.
| | • | | Level 1 — quoted prices in active markets for identical assets or liabilities; |
| | • | | Level 2 — prices determined using other inputs that are observable either directly or indirectly through corroboration with observable market data (which could include quoted prices for similar assets or liabilities, interest rates, credit risk, etc.); |
| | • | | Level 3 — prices determined using unobservable inputs when quoted prices or observable inputs are unavailable, such as when there is little or no market activity for an asset or liability (unobservable inputs reflect each Fund’s own assumptions in determining the fair value of assets or liabilities and would be based on the best information available). |
The inputs or methodology used for valuing securities are not necessarily an indication of the risk associated with investing in those securities. For example, non-U.S. securities, with markets that close hours before the Funds value their holdings, may require revised valuations due to significant movement in the U.S. markets. Since these values are not obtained from quoted prices in an active market, such securities are reflected as Level 2.
The Funds have procedures to determine the fair value of securities and other financial instruments for which market prices are not readily available or which may not be reliably priced. Under these procedures, the Funds primarily employ a market-based approach that may use related or comparable assets or liabilities, recent transactions, market multiples, book values, and other relevant information for the investment to determine its fair value. The Funds may also use an income-based valuation approach in which the anticipated future cash flows of the investment are discounted to calculate fair value. Discounts may also be applied due to the nature or duration of any restrictions on the disposition of the investments. Due to the inherent uncertainty of valuations of such investments, the fair values may differ significantly from the values that would have been used had an active market existed.
The following is a summary of the inputs used as of March 31, 2017 in valuing the Funds’ investments carried at fair value:
| | | | | | | | | | | | | | | | |
| | | Baron Asset Fund | |
| Description | | Quoted Prices in
Active Markets
for Identical
Assets (Level 1) | | | Other
Observable
Inputs
(Level 2) | | | Unobservable
Inputs
(Level 3) | | | Total | |
Common Stocks† | | $ | 2,653,223,070 | | | $ | — | | | $ | — | | | $ | 2,653,223,070 | |
Private Equity Investments | | | — | | | | — | | | | 3,245,862 | | | | 3,245,862 | |
Short Term Investments | | | — | | | | 25,551,931 | | | | — | | | | 25,551,931 | |
| | | | | | | | | | | | | | | | |
Total Investments | | $ | 2,653,223,070 | | | $ | 25,551,931 | | | $ | 3,245,862 | | | $ | 2,682,020,863 | |
| | | | | | | | | | | | | | | | |
Transfers between Levels 1, 2 or 3, if any, are recognized at ending value on March 31, 2017. There have been no transfers in and out of Level 1, 2 or 3 fair value measurements for the Fund for the six months ended March 31, 2017.
| | | | | | | | | | | | | | | | |
| | | Baron Growth Fund | |
| Description | | Quoted Prices in
Active Markets
for Identical
Assets (Level 1) | | | Other
Observable
Inputs
(Level 2) | | | Unobservable
Inputs (Level 3) | | | Total | |
Common Stocks† | | $ | 5,878,310,063 | | | $ | — | | | $ | — | | | $ | 5,878,310,063 | |
Preferred Stocks | | | — | | | | 14,098,651 | | | | — | | | | 14,098,651 | |
Private Equity Investments | | | — | | | | — | | | | 1,092,580 | | | | 1,092,580 | |
| | | | | | | | | | | | | | | | |
Total Investments | | $ | 5,878,310,063 | | | $ | 14,098,651 | | | $ | 1,092,580 | | | $ | 5,893,501,294 | |
| | | | | | | | | | | | | | | | |
Transfers between Levels 1, 2 or 3, if any, are recognized at ending value on March 31, 2017. There have been no transfers in and out of Level 1, 2 or 3 fair value measurements for the Fund for the six months ended March 31, 2017.
| † | See Statements of Net Assets for additional detailed categorizations. |
32
| | |
| March 31, 2017 | | Baron Funds |
NOTES TO FINANCIAL STATEMENTS (Unaudited) (Continued)
7. FAIR VALUE MEASUREMENTS (Continued)
| | | | | | | | | | | | | | | | |
| | | Baron Small Cap Fund | |
| Description | | Quoted Prices in
Active Markets
for Identical
Assets (Level 1) | | | Other
Observable
Inputs
(Level 2) | | | Unobservable
Inputs
(Level 3) | | | Total | |
Common Stocks† | | $ | 3,332,310,140 | | | $ | — | | | $ | — | | | $ | 3,332,310,140 | |
Short Term Investments | | | — | | | | 40,676,306 | | | | — | | | | 40,676,306 | |
| | | | | | | | | | | | | | | | |
Total Investments | | $ | 3,332,310,140 | | | $ | 40,676,306 | | | $ | — | | | $ | 3,372,986,446 | |
| | | | | | | | | | | | | | | | |
Transfers between Levels 1, 2 or 3, if any, are recognized at ending value on March 31, 2017. There have been no transfers in and out of Level 1, 2 or 3 fair value measurements for the Fund for the six months ended March 31, 2017.
| | | | | | | | | | | | | | | | |
| | | Baron Opportunity Fund | |
| Description | | Quoted Prices in
Active Markets
for Identical
Assets
(Level 1) | | | Other
Observable
Inputs
(Level 2) | | | Unobservable
Inputs
(Level 3) | | | Total | |
Common Stocks† | | $ | 220,975,178 | | | $ | — | | | $ | — | | | $ | 220,975,178 | |
| | | | | | | | | | | | | | | | |
Total Investments | | $ | 220,975,178 | | | $ | — | | | $ | — | | | $ | 220,975,178 | |
| | | | | | | | | | | | | | | | |
Transfers between Levels 1, 2 or 3, if any, are recognized at ending value on March 31, 2017. There have been no transfers in and out of Level 1, 2 or 3 fair value measurements for the Fund for the six months ended March 31, 2017.
| | | | | | | | | | | | | | | | |
| | | Baron Fifth Avenue Growth Fund | |
| Description | | Quoted Prices in
Active Markets
for Identical
Assets
(Level 1) | | | Other
Observable
Inputs
(Level 2) | | | Unobservable
Inputs
(Level 3) | | | Total | |
Common Stocks† | | $ | 151,641,912 | | | $ | — | | | $ | — | | | $ | 151,641,912 | |
| | | | | | | | | | | | | | | | |
Total Investments | | $ | 151,641,912 | | | $ | — | | | $ | — | | | $ | 151,641,912 | |
| | | | | | | | | | | | | | | | |
Transfers between Levels 1, 2 or 3, if any, are recognized at ending value on March 31, 2017. There have been no transfers in and out of Level 1, 2 or 3 fair value measurements for the Fund for the six months ended March 31, 2017.
| | | | | | | | | | | | | | | | |
| | | Baron Discovery Fund | |
| Description | | Quoted Prices in
Active Markets
for Identical
Assets (Level 1) | | | Other
Observable
Inputs
(Level 2) | | | Unobservable
Inputs (Level 3) | | | Total | |
Common Stocks† | | $ | 110,527,051 | | | $ | — | | | $ | — | | | $ | 110,527,051 | |
Warrants | | | — | | | | 60,000 | | | | — | | | | 60,000 | |
Short Term Investments | | | — | | | | 12,037,372 | | | | — | | | | 12,037,372 | |
| | | | | | | | | | | | | | | | |
Total Investments | | $ | 110,527,051 | | | $ | 12,097,372 | | | $ | — | | | $ | 122,624,423 | |
| | | | | | | | | | | | | | | | |
Transfers between Levels 1, 2 or 3, if any, are recognized at ending value on March 31, 2017. There have been no transfers in and out of Level 1, 2 or 3 fair value measurements for the Fund for the six months ended March 31, 2017.
| † | See Statements of Net Assets for additional detailed categorizations. |
33
| | |
| Baron Funds | | March 31, 2017 |
NOTES TO FINANCIAL STATEMENTS (Continued)
7. FAIR VALUE MEASUREMENTS (Continued)
The following is a reconciliation of investments in which unobservable inputs (Level 3) were used in determining fair value:
| | | | | | | | | | | | | | | | | | | | | | | | | | | | | | | | | | | | | | | | |
| | | Baron Asset Fund | |
Investments in
Securities | | Balance as of
September 30,
2016 | | | Accrued
Premiums/
Discounts | | | Net
Realized
Gain
(Loss) | | | Change in Net
Unrealized
Appreciation
(Depreciation) | | | Purchases | | | Sales/
Distributions | | | Transfers
Into
Level 3 | | | Transfers
Out of
Level 3 | | | Balance as of
March 31,
2017 | | | Change in Net
Unrealized
Appreciation
(Depreciation)
from Investments
still held at
March 31, 2017 | |
Private Equity Investments | | | | | | | | | | | | | | | | | | | | | | | | | | | | | | | | | | | | | | | | |
Financials | | $ | 3,175,300 | | | $ | — | | | $ | — | | | $ | 70,562 | | | $ | — | | | $ | — | | | $ | — | | | $ | — | | | $ | 3,245,862 | | | $ | 70,562 | |
| | | | | | | | | | | | | | | | | | | | | | | | | | | | | | | | | | | | | | | | |
Total | | $ | 3,175,300 | | | $ | — | | | $ | — | | | $ | 70,562 | | | $ | — | | | $ | — | | | $ | — | | | $ | — | | | $ | 3,245,862 | | | $ | 70,562 | |
| | | | | | | | | | | | | | | | | | | | | | | | | | | | | | | | | | | | | | | | |
| | | Baron Growth Fund | |
Investments in
Securities | | Balance as of
September 30,
2016 | | | Accrued
Premiums/
Discounts | | | Net
Realized
Gain
(Loss) | | | Change in Net
Unrealized
Appreciation
(Depreciation) | | | Purchases | | | Sales/
Distributions | | | Transfers
Into
Level 3 | | | Transfers
Out of
Level 3 | | | Balance as of
March 31,
2017 | | | Change in Net
Unrealized
Appreciation
(Depreciation)
from Investments
still held at
March 31, 2017 | |
Private Equity Investments | | | | | | | | | | | | | | | | | | | | | | | | | | | | | | | | | | | | | | | | |
Financials | | $ | 1,068,828 | | | $ | — | | | $ | — | | | $ | 23,752 | | | $ | — | | | $ | — | | | $ | — | | | $ | — | | | $ | 1,092,580 | | | $ | 23,752 | |
| | | | | | | | | | | | | | | | | | | | | | | | | | | | | | | | | | | | | | | | |
Total | | $ | 1,068,828 | | | $ | — | | | $ | — | | | $ | 23,752 | | | $ | — | | | $ | — | | | $ | — | | | $ | — | | | $ | 1,092,580 | | | $ | 23,752 | |
| | | | | | | | | | | | | | | | | | | | | | | | | | | | | | | | | | | | | | | | |
8. INCOME TAXES AND DISTRIBUTIONS TO SHAREHOLDERS
Federal income tax regulations differ from GAAP. Therefore, distributions determined in accordance with tax regulations may differ in amount or character from net investment income and net realized gain for financial reporting purposes. Net investment income (loss) and net realized and unrealized gain (loss) differ for financial statement and tax purposes due to differing treatments of net investment loss, foreign currency gains and losses, reclassification of distributions, partnership basis adjustments, income from passive foreign investment companies and wash sale losses deferred. Financial reporting records are adjusted for permanent book/tax differences to reflect tax character. Financial records are not adjusted for temporary differences.
As of March 31, 2017, the components of net assets on a tax basis were as follows:
| | | | | | | | | | | | | | | | | | | | | | | | |
| | | Baron
Asset Fund | | | Baron
Growth Fund | | | Baron
Small Cap
Fund | | | Baron
Opportunity Fund | | | Baron
Fifth Avenue
Growth Fund | | | Baron
Discovery
Fund | |
Cost of investments | | $ | 1,050,755,344 | | | $ | 2,271,416,126 | | | $ | 1,634,858,362 | | | $ | 131,683,609 | | | $ | 75,801,771 | | | $ | 106,534,473 | |
| | | | | | | | | | | | | | | | | | | | | | | | |
Gross tax unrealized appreciation | | | 1,633,957,522 | | | | 3,694,655,268 | | | | 1,772,670,230 | | | | 91,411,266 | | | | 75,840,141 | | | | 17,642,405 | |
Gross tax unrealized depreciation | | | (2,692,003 | ) | | | (72,570,100 | ) | | | (34,542,146 | ) | | | (2,119,697 | ) | | | — | | | | (1,552,455 | ) |
| | | | | | | | | | | | | | | | | | | | | | | | |
Net tax unrealized appreciation | | | 1,631,265,519 | | | | 3,622,085,168 | | | | 1,738,128,084 | | | | 89,291,569 | | | | 75,840,141 | | | | 16,089,950 | |
Net tax unrealized currency appreciation (depreciation) | | | — | | | | — | | | | 703 | | | | — | | | | 24 | | | | (681 | ) |
Undistributed (accumulated) net investment income (loss) | | | (20,512,852 | ) | | | 8,193,777 | | | | 290,838 | | | | (3,393,289 | ) | | | (793,464 | ) | | | (277,136 | ) |
Undistributed (accumulated) net realized gain (loss) | | | 127,982,725 | | | | 307,108,357 | | | | 284,178,419 | | | | 19,754,893 | | | | (8,736,163 | ) | | | (8,047,320 | ) |
Paid-in capital | | | 947,670,392 | | | | 1,965,471,506 | | | | 1,351,568,324 | | | | 115,513,282 | | | | 85,335,269 | | | | 111,634,590 | |
| | | | | | | | | | | | | | | | | | | | | | | | |
Net Assets | | $ | 2,686,405,784 | | | $ | 5,902,858,808 | | | $ | 3,374,166,368 | | | $ | 221,166,455 | | | $ | 151,645,807 | | | $ | 119,399,403 | |
| | | | | | | | | | | | | | | | | | | | | | | | |
34
| | |
| March 31, 2017 | | Baron Funds |
NOTES TO FINANCIAL STATEMENTS (Unaudited) (Continued)
8. INCOME TAXES AND DISTRIBUTIONS TO SHAREHOLDERS (Continued)
As of September 30, 2016, the Funds had capital loss carryforwards expiring as follows:
| | | | | | | | | | | | | | | | | | | | | | | | |
| | | Baron
Asset Fund | | | Baron
Growth Fund | | | Baron
Small Cap
Fund | | | Baron
Opportunity Fund | | | Baron
Fifth Avenue
Growth Fund | | | Baron
Discovery
Fund | |
Short term capital loss carryforwards: | | | | | | | | | | | | | | | | | | | | | | | | |
September 30, 2018 | | $ | — | | | $ | — | | | $ | — | | | $ | — | | | $ | 85,567 | | | $ | — | |
No expiration date | | | — | | | | — | | | | — | | | | — | | | | 211,422 | | | | 1,483,090 | |
| | | | | | | | | | | | | | | | | | | | | | | | |
| | $ | — | | | $ | — | | | $ | — | | | $ | — | | | $ | 296,989 | | | $ | 1,483,090 | |
| | | | | | | | | | | | | | | | | | | | | | | | |
The tax character of distributions paid during the six months ended March 31, 2017 and the fiscal year ended September 30, 2016 was as follows:
| | | | | | | | | | | | | | | | |
| | | Six Months Ended
March 31, 2017 | | | Year Ended
September 30, 2016 | |
| Fund | | Ordinary1 | | | Long Term Capital Gain | | | Ordinary1 | | | Long Term Capital Gain | |
Baron Asset Fund | | $ | — | | | $ | 115,002,326 | | | $ | — | | | $ | 268,567,375 | |
Baron Growth Fund | | | — | | | | 652,001,794 | | | | — | | | | 593,543,313 | |
Baron Small Cap Fund | | | — | | | | 620,005,422 | | | | — | | | | 449,317,328 | |
Baron Opportunity Fund | | | — | | | | 27,000,806 | | | | — | | | | 32,674,421 | |
Baron Fifth Avenue Growth Fund | | | — | | | | — | | | | — | | | | — | |
Baron Discovery Fund | | | — | | | | — | | | | — | | | | 701,858 | |
| 1 | For tax purposes, short-term capital gains are considered ordinary income distributions. |
The Funds follow the provisions of FASB Codification Section 740 (“ASC Section 740”) “Accounting for Uncertainty in Income Taxes” which clarifies the accounting for uncertainty in tax positions taken or expected to be taken on a tax return. ASC Section 740 sets forth a threshold for financial statement recognition, measurement and disclosure of tax positions taken or expected to be taken on a tax return. The Funds are required to recognize the tax effects of certain tax positions under a “more likely than not” standard, that based on their technical merits, have more than 50 percent likelihood of being sustained upon examination. Management has analyzed the tax positions taken on the Funds’ federal income tax returns for all open years (current and prior three years), and has concluded that no provision for federal income tax is required in the Funds’ financial statements. At March 31, 2017, the Funds did not have any uncertain tax benefits that require recognition, de-recognition or disclosure. The Funds’ federal, state and local income and federal excise tax returns for which the applicable statutes of limitations have not expired (current and prior three years) are subject to examination by the Internal Revenue Service and state departments of revenue.
9. OWNERSHIP CONCENTRATION
As of March 31, 2017, the officers, trustees, and portfolio managers owned, directly or indirectly, 18.21% of Baron Fifth Avenue Growth Fund. As a result of their ownership, these investors may be able to materially affect the outcome of matters presented to Baron Fifth Avenue Growth Fund shareholders.
10. TRANSACTIONS IN “AFFILIATED” COMPANIES1
BARON GROWTH FUND
| | | | | | | | | | | | | | | | | | | | | | | | | | | | | | | | |
| Name of Issuer | | Value at
September 30,
2016 | | | Purchase
Cost | | | Sales
Proceeds | | | Change in Net
Unrealized
Appreciation
(Depreciation) | | | Realized
Gains/ (Losses) | | | Dividend
Income | | | Shares
Held at
March 31,
2017 | | | Value at
March 31,
2017 | |
“Affiliated” Company as of March 31, 2017: | | | | | | | | | | | | | | | | | |
Benefitfocus, Inc. | | $ | 92,789,010 | | | $ | — | | | $ | — | | | $ | (27,822,757 | ) | | $ | — | | | $ | — | | | | 2,324,374 | | | $ | 64,966,253 | |
CaesarStone Ltd. | | | 78,813,900 | | | | — | | | | 2,655,350 | | | | (3,230,920 | ) | | | (427,630 | ) | | | — | | | | 2,000,000 | | | | 72,500,000 | |
Choice Hotels International, Inc. | | | 135,578,100 | | | | — | | | | — | | | | 52,691,400 | | | | — | | | | 1,293,225 | | | | 3,007,500 | | | | 188,269,500 | |
Iridium Communications, Inc. | | | 60,771,774 | | | | — | | | | — | | | | 11,539,893 | | | | — | | | | — | | | | 7,493,437 | | | | 72,311,667 | |
Iridium Communications, Inc., Series B, 6.75% | | | 12,353,827 | | | | — | | | | — | | | | 1,744,824 | | | | — | | | | 346,562 | | | | 41,074 | | | | 14,098,651 | |
Marriott Vacations Worldwide Corp. | | | 117,312,000 | | | | — | | | | — | | | | 42,576,000 | | | | — | | | | 1,120,000 | | | | 1,600,000 | | | | 159,888,000 | |
Vail Resorts, Inc. | | | 323,925,824 | | | | 20,357,722 | | | | | | | | 77,319,411 | | | | | | | | 5,765,486 | | | | 2,196,993 | | | | 421,602,957 | |
| | | | | | | | | | | | | | | | | | | | | | | | | | | | | | | | |
| | $ | 821,544,435 | | | $ | 20,357,722 | | | $ | 2,655,350 | | | $ | 154,817,851 | | | $ | (427,630 | ) | | $ | 8,525,273 | | | | | | | $ | 993,637,028 | |
| | | | | | | | | | | | | | | | | | | | | | | | | | | | | | | | |
No Longer an “Affiliated” Company as of March 31, 2017: | | | | | | | | | | | | | | | | | |
Primerica, Inc. | | $ | 132,575,000 | | | $ | — | | | $ | 24,457,582 | | | $ | 55,386,192 | | | $ | 14,048,390 | | | $ | 867,975 | | | | 2,160,000 | | | $ | 177,552,000 | |
| | | | | | | | | | | | | | | | | | | | | | | | | | | | | | | | |
| 1 | An “Affiliated” Company (“affiliated person” as defined in the 1940 Act) is a company in which a Fund held 5% or more of the company’s outstanding voting securities at any time during the six months ended March 31, 2017. |
35
| | |
| Baron Funds | | March 31, 2017 |
NOTES TO FINANCIAL STATEMENTS (Continued)
10. TRANSACTIONS IN “AFFILIATED” COMPANIES1 (Continued)
BARON SMALL CAP FUND
| | | | | | | | | | | | | | | | | | | | | | | | | | | | | | | | |
| Name of Issuer | | Value at
September 30,
2016 | | | Purchase
Cost | | | Sales
Proceeds | | | Change in Net
Unrealized
Appreciation
(Depreciation) | | | Realized
Gains/ (Losses) | | | Dividend
Income | | | Shares
Held at
March 31,
2017 | | | Value at
March 31,
2017 | |
“Affiliated” Company as of March 31, 2017: | | | | | | | | | | | | | | | | | |
Capitol Acquisition Corp. III | | $ | — | | | $ | 30,900,086 | | | $ | — | | | $ | 749,914 | | | $ | — | | | $ | — | | | | 3,000,000 | | | $ | 31,650,000 | |
The Chefs’ Warehouse, Inc. | | | 18,721,472 | | | | — | | | | 2,159,866 | | | | 5,239,917 | | | | (951,523 | ) | | | — | | | | 1,500,000 | | | | 20,850,000 | |
| | | | | | | | | | | | | | | | | | | | | | | | | | | | | | | | |
| | $ | 18,721,472 | | | $ | 30,900,086 | | | $ | 2,159,866 | | | $ | 5,989,831 | | | $ | (951,523 | ) | | $ | — | | | | | | | $ | 52,500,000 | |
| | | | | | | | | | | | | | | | | | | | | | | | | | | | | | | | |
| 1 | An “Affiliated” Company (“affiliated person” as defined in the 1940 Act) is a company in which a Fund held 5% or more of the company’s outstanding voting securities at any time during the six months ended March 31, 2017. |
11. RECENT ACCOUNTING PRONOUNCEMENTS
In October 2016, the U.S. Securities and Exchange Commission (“SEC”) adopted new rules and forms, and amendments to certain current rules and forms, to modernize reporting and disclosure of information by registered investment companies. The amendments to Regulation S-X will require standardized, enhanced disclosure about derivatives in investment company financial statements, and will also change the rules governing the form and content of such financial statements. The compliance date for the amendments to Regulation S-X is August 1, 2017. The Adviser is currently evaluating the impact that the adoption of the amendments to Regulation S-X will have on the Funds’ financial statements and related disclosures.
In December 2016, the Financial Accounting Standards Board issued Accounting Standards Update No. 2016-19 (“ASU 2016-19”), “Technical Corrections and Improvements.” The guidance includes an amendment to Topic 820, Fair Value Measurement, which clarifies the difference between a valuation approach and a valuation technique when applying the guidance in that Topic. The amendment also requires an entity to disclose when there has been a change in either or both a valuation approach and/or a valuation technique. The transition guidance for the amendment must be applied prospectively because it could potentially involve the use of hindsight that includes fair value measurements. The guidance is effective for interim periods beginning after December 15, 2016. Management is currently evaluating the implication, if any, of the additional disclosure requirements and its impact on the Funds’ financial statements.
36
| | |
| March 31, 2017 | | Baron Funds |
FINANCIAL HIGHLIGHTS (Unaudited)
BARON ASSET FUND
Selected data for a share outstanding throughout each period:
| | | | | | | | | | | | | | | | | | | | | | | | | | | | | | | | | | | | | | | | | | | | | | | | |
| | | RETAIL SHARES | | | | | | | |
| | | Six Months
Ended
March 31, | | | Year Ended September 30, | | | | | | | |
| | | 2017 | | | 2016 | | | 2015 | | | 2014 | | | 2013 | | | 2012 | | | 2011 | | | 2010 | | | 2009 | | | 2008 | | | | | | | |
Net asset value, beginning of period | | $ | 60.67 | | | $ | 60.88 | | | $ | 63.75 | | | $ | 61.37 | | | $ | 52.03 | | | $ | 49.00 | | | $ | 49.27 | | | $ | 43.62 | | | $ | 52.12 | | | $ | 66.57 | | | | | | | | | |
| | | | | | | | | | | | | | | | | | | | | | | | | | | | | | | | | | | | | | | | | | | | | | | | |
Income (loss) from investment operations: | | | | | | | | | | | | | | | | | | | | | | | | | | | | | | | | | | | | | | | | | | | | | | | | |
Net investment loss | | | (0.20 | )1 | | | (0.25 | )1 | | | (0.41 | )1 | | | (0.44 | )1 | | | (0.34 | )1 | | | (0.14 | )1 | | | (0.23 | )1 | | | (0.28 | )1 | | | (0.20 | )1 | | | (0.29 | )1 | | | | | | | | |
Net realized and unrealized gain (loss) on investments | | | 6.06 | | | | 6.63 | | | | 1.71 | | | | 8.42 | | | | 13.44 | | | | 10.94 | | | | 0.73 | | | | 5.93 | | | | (5.68 | ) | | | (12.08 | ) | | | | | | | | |
| | | | | | | | | | | | | | | | | | | | | | | | | | | | | | | | | | | | | | | | | | | | | | | | |
Total from investment operations | | | 5.86 | | | | 6.38 | | | | 1.30 | | | | 7.98 | | | | 13.10 | | | | 10.80 | | | | 0.50 | | | | 5.65 | | | | (5.88 | ) | | | (12.37 | ) | | | | | | | | |
| | | | | | | | | | | | | | | | | | | | | | | | | | | | | | | | | | | | | | | | | | | | | | | | |
Less distributions to shareholders from: | | | | | | | | | | | | | | | | | | | | | | | | | | | | | | | | | | | | | | | | | | | | | | | | |
Net investment income | | | 0.00 | | | | 0.00 | | | | 0.00 | | | | 0.00 | | | | 0.00 | | | | 0.00 | | | | 0.00 | | | | 0.00 | | | | 0.00 | | | | 0.00 | | | | | | | | | |
Net realized gain on investments | | | (2.80 | ) | | | (6.59 | ) | | | (4.17 | ) | | | (5.60 | ) | | | (3.76 | ) | | | (7.77 | ) | | | (0.77 | ) | | | 0.00 | | | | (2.62 | ) | | | (2.08 | ) | | | | | | | | |
| | | | | | | | | | | | | | | | | | | | | | | | | | | | | | | | | | | | | | | | | | | | | | | | |
Total distributions | | | (2.80 | ) | | | (6.59 | ) | | | (4.17 | ) | | | (5.60 | ) | | | (3.76 | ) | | | (7.77 | ) | | | (0.77 | ) | | | 0.00 | | | | (2.62 | ) | | | (2.08 | ) | | | | | | | | |
| | | | | | | | | | | | | | | | | | | | | | | | | | | | | | | | | | | | | | | | | | | | | | | | |
Net asset value, end of period | | $ | 63.73 | | | $ | 60.67 | | | $ | 60.88 | | | $ | 63.75 | | | $ | 61.37 | | | $ | 52.03 | | | $ | 49.00 | | | $ | 49.27 | | | $ | 43.62 | | | $ | 52.12 | | | | | | | | | |
| | | | | | | | | | | | | | | | | | | | | | | | | | | | | | | | | | | | | | | | | | | | | | | | |
Total return | | | 10.08 | %4 | | | 11.14 | % | | | 1.81 | % | | | 13.59 | % | | | 27.17 | % | | | 24.65 | % | | | 0.85 | % | | | 12.95 | % | | | (9.88 | )% | | | (19.14 | )% | | | | | | | | |
| | | | | | | | | | | | | | | | | | | | | | | | | | | | | | | | | | | | | | | | | | | | | | | | |
Ratios/Supplemental data: | | | | | | | | | | | | | | | | | | | | | | | | | | | | | | | | | | | | | | | | | | | | | | | | |
Net assets (in millions), end of period | | $ | 1,853.7 | | | $ | 1,802.6 | | | $ | 1,804.3 | | | $ | 2,000.5 | | | $ | 2,024.2 | | | $ | 1,845.6 | | | $ | 1,924.9 | | | $ | 2,424.2 | | | $ | 2,652.6 | | | $ | 3,311.8 | | | | | | | | | |
| | | | | | | | | | | | | | | | | | | | | | | | | | | | | | | | | | | | | | | | | | | | | | | | |
Ratio of operating expenses to average net assets | | | 1.31 | %5 | | | 1.31 | % | | | 1.31 | % | | | 1.31 | % | | | 1.32 | % | | | 1.33 | % | | | 1.33 | % | | | 1.32 | % | | | 1.36 | %2 | | | 1.33 | %2 | | | | | | | | |
| | | | | | | | | | | | | | | | | | | | | | | | | | | | | | | | | | | | | | | | | | | | | | | | |
Ratio of net investment loss to average net assets | | | (0.68 | )%5 | | | (0.43 | )% | | | (0.62 | )% | | | (0.70 | )% | | | (0.62 | )% | | | (0.28 | )% | | | (0.41 | )% | | | (0.61 | )% | | | (0.54 | )% | | | (0.49 | )% | | | | | | | | |
| | | | | | | | | | | | | | | | | | | | | | | | | | | | | | | | | | | | | | | | | | | | | | | | |
Portfolio turnover rate | | | 4.66 | %4 | | | 12.54 | % | | | 13.53 | % | | | 11.26 | % | | | 12.04 | % | | | 13.11 | % | | | 23.89 | % | | | 13.04 | % | | | 14.67 | % | | | 16.02 | % | | | | | | | | |
| | | | | | | | | | | | | | | | | | | | | | | | | | | | | | | | | | | | | | | | | | | | | | | | |
| | | INSTITUTIONAL SHARES | | | | | | R6 SHARES | |
| | | Six Months
Ended
March 31, | | | Year Ended September 30, | | | | | | Six Months
Ended
March 31, | | | Year Ended
September 30, | |
| | | 2017 | | | 2016 | | | 2015 | | | 2014 | | | 2013 | | | 2012 | | | 2011 | | | 2010 | | | 20093 | | | | | | 2017 | | | 20166 | |
Net asset value, beginning of period | | $ | 62.30 | | | $ | 62.19 | | | $ | 64.87 | | | $ | 62.20 | | | $ | 52.55 | | | $ | 49.30 | | | $ | 49.43 | | | $ | 43.65 | | | $ | 37.38 | | | | | | | $ | 62.30 | | | $ | 53.85 | |
| | | | | | | | | | | | | | | | | | | | | | | | | | | | | | | | | | | | | | | | | | | | | | | | |
Income (loss) from investment operations: | | | | | | | | | | | | | | | | | | | | | | | | | | | | | | | | | | | | | | | | | | | | | | | | |
Net investment income (loss) | | | (0.13 | )1 | | | (0.10 | )1 | | | (0.24 | )1 | | | (0.28 | )1 | | | (0.21 | )1 | | | 0.01 | 1 | | | (0.10 | )1 | | | (0.15 | )1 | | | (0.05 | )1 | | | | | | | (0.13 | )1 | | | (0.21 | )1 |
Net realized and unrealized gain on investments | | | 6.25 | | | | 6.80 | | | | 1.73 | | | | 8.55 | | | | 13.62 | | | | 11.01 | | | | 0.74 | | | | 5.93 | | | | 6.32 | | | | | | | | 6.24 | | | | 8.68 | |
| | | | | | | | | | | | | | | | | | | | | | | | | | | | | | | | | | | | | | | | | | | | | | | | |
Total from investment operations | | | 6.12 | | | | 6.70 | | | | 1.49 | | | | 8.27 | | | | 13.41 | | | | 11.02 | | | | 0.64 | | | | 5.78 | | | | 6.27 | | | | | | | | 6.11 | | | | 8.47 | |
| | | | | | | | | | | | | | | | | | | | | | | | | | | | | | | | | | | | | | | | | | | | | | | | |
Less distributions to shareholders from: | | | | | | | | | | | | | | | | | | | | | | | | | | | | | | | | | | | | | | | | | | | | | | | | |
Net investment income | | | 0.00 | | | | 0.00 | | | | 0.00 | | | | 0.00 | | | | 0.00 | | | | 0.00 | | | | 0.00 | | | | 0.00 | | | | 0.00 | | | | | | | | 0.00 | | | | 0.00 | |
Net realized gain on investments | | | (2.80 | ) | | | (6.59 | ) | | | (4.17 | ) | | | (5.60 | ) | | | (3.76 | ) | | | (7.77 | ) | | | (0.77 | ) | | | 0.00 | | | | 0.00 | | | | | | | | (2.80 | ) | | | (0.02 | ) |
| | | | | | | | | | | | | | | | | | | | | | | | | | | | | | | | | | | | | | | | | | | | | | | | |
Total distributions | | | (2.80 | ) | | | (6.59 | ) | | | (4.17 | ) | | | (5.60 | ) | | | (3.76 | ) | | | (7.77 | ) | | | (0.77 | ) | | | 0.00 | | | | 0.00 | | | | | | | | (2.80 | ) | | | (0.02 | ) |
| | | | | | | | | | | | | | | | | | | | | | | | | | | | | | | | | | | | | | | | | | | | | | | | |
Net asset value, end of period | | $ | 65.62 | | | $ | 62.30 | | | $ | 62.19 | | | $ | 64.87 | | | $ | 62.20 | | | $ | 52.55 | | | $ | 49.30 | | | $ | 49.43 | | | $ | 43.65 | | | | | | | $ | 65.61 | | | $ | 62.30 | |
| | | | | | | | | | | | | | | | | | | | | | | | | | | | | | | | | | | | | | | | | | | | | | | | |
Total return | | | 10.24 | %4 | | | 11.44 | % | | | 2.09 | % | | | 13.90 | % | | | 27.51 | % | | | 24.99 | % | | | 1.14 | % | | | 13.24 | % | | | 16.77 | %4 | | | | | | | 10.22 | %4 | | | 15.73 | %4 |
| | | | | | | | | | | | | | | | | | | | | | | | | | | | | | | | | | | | | | | | | | | | | | | | |
Ratios/Supplemental data: | | | | | | | | | | | | | | | | | | | | | | | | | | | | | | | | | | | | | | | | | | | | | | | | |
Net assets (in millions), end of period | | $ | 824.1 | | | $ | 723.3 | | | $ | 719.1 | | | $ | 689.8 | | | $ | 506.1 | | | $ | 386.7 | | | $ | 288.9 | | | $ | 242.8 | | | $ | 82.3 | | | | | | | $ | 8.6 | | | $ | 7.8 | |
| | | | | | | | | | | | | | | | | | | | | | | | | | | | | | | | | | | | | | | | | | | | | | | | |
Ratio of operating expenses to average net assets | | | 1.04 | %5 | | | 1.04 | % | | | 1.04 | % | | | 1.04 | % | | | 1.05 | % | | | 1.06 | % | | | 1.06 | % | | | 1.06 | % | | | 1.16 | %5 | | | | | | | 1.04 | %5 | | | 1.04 | %5 |
| | | | | | | | | | | | | | | | | | | | | | | | | | | | | | | | | | | | | | | | | | | | | | | | |
Ratio of net investment income (loss) to average net assets | | | (0.41 | )%5 | | | (0.17 | )% | | | (0.36 | )% | | | (0.43 | )% | | | (0.38 | )% | | | 0.02 | % | | | (0.18 | )% | | | (0.33 | )% | | | (0.39 | )%5 | | | | | | | (0.41 | )%5 | | | (0.52 | )%5 |
| | | | | | | | | | | | | | | | | | | | | | | | | | | | | | | | | | | | | | | | | | | | | | | | |
Portfolio turnover rate | | | 4.66 | %4 | | | 12.54 | % | | | 13.53 | % | | | 11.26 | % | | | 12.04 | % | | | 13.11 | % | | | 23.89 | % | | | 13.04 | % | | | 14.67 | % | | | | | | | 4.66 | %4 | | | 12.54 | % |
| | | | | | | | | | | | | | | | | | | | | | | | | | | | | | | | | | | | | | | | | | | | | | | | |
| | |
1 Based on average shares outstanding. 2 Benefit of expense reduction rounds to less than 0.01%. 3 For the period May 29, 2009 (initial offering of Institutional Shares) to September 30, 2009. | | 4 Not Annualized. 5 Annualized. 6 For the period January 29, 2016 (initial offering of R6 Shares) to September 30, 2016. |
| | |
| See Notes to Financial Statements. | | 37 |
| | |
| Baron Funds | | March 31, 2017 |
FINANCIAL HIGHLIGHTS (Unaudited) (Continued)
BARON GROWTH FUND
Selected data for a share outstanding throughout each period:
| | | | | | | | | | | | | | | | | | | | | | | | | | | | | | | | | | | | | | | | | | | | | | | | |
| | | RETAIL SHARES | | | | | | | |
| | | Six Months
Ended
March 31, | | | Year Ended September 30, | | | | | | | |
| | | 2017 | | | 2016 | | | 2015 | | | 2014 | | | 2013 | | | 2012 | | | 2011 | | | 2010 | | | 2009 | | | 2008 | | | | | | | |
Net asset value, beginning of period | | $ | 67.13 | | | $ | 68.25 | | | $ | 70.46 | | | $ | 68.67 | | | $ | 58.19 | | | $ | 46.18 | | | $ | 44.37 | | | $ | 39.00 | | | $ | 41.69 | | | $ | 54.55 | | | | | | | | | |
| | | | | | | | | | | | | | | | | | | | | | | | | | | | | | | | | | | | | | | | | | | | | | | | |
Income (loss) from investment operations: | | | | | | | | | | | | | | | | | | | | | | | | | | | | | | | | | | | | | | | | | | | | | | | | |
Net investment income (loss) | | | (0.02 | )1 | | | 0.08 | 1 | | | (0.27 | )1 | | | 0.06 | 1 | | | (0.12 | )1 | | | 0.20 | 1 | | | (0.29 | )1 | | | (0.34 | )1 | | | (0.18 | )1 | | | (0.28 | )1 | | | | | | | | |
Net realized and unrealized gain (loss) on investments | | | 6.17 | | | | 4.83 | | | | 1.28 | | | | 3.45 | | | | 16.37 | | | | 12.64 | | | | 2.10 | | | | 5.71 | | | | (2.47 | ) | | | (10.07 | ) | | | | | | | | |
| | | | | | | | | | | | | | | | | | | | | | | | | | | | | | | | | | | | | | | | | | | | | | | | |
Total from investment operations | | | 6.15 | | | | 4.91 | | | | 1.01 | | | | 3.51 | | | | 16.25 | | | | 12.84 | | | | 1.81 | | | | 5.37 | | | | (2.65 | ) | | | (10.35 | ) | | | | | | | | |
| | | | | | | | | | | | | | | | | | | | | | | | | | | | | | | | | | | | | | | | | | | | | | | | |
Less distributions to shareholders from: | | | | | | | | | | | | | | | | | | | | | | | | | | | | | | | | | | | | | | | | | | | | | | | | |
Net investment income | | | 0.00 | | | | 0.00 | | | | 0.00 | | | | (0.03 | ) | | | (0.18 | ) | | | 0.00 | | | | 0.00 | | | | 0.00 | | | | 0.00 | | | | 0.00 | | | | | | | | | |
Net realized gain on investments | | | (7.64 | ) | | | (6.03 | ) | | | (3.22 | ) | | | (1.69 | ) | | | (5.59 | ) | | | (0.83 | ) | | | 0.00 | | | | 0.00 | | | | (0.04 | ) | | | (2.51 | ) | | | | | | | | |
| | | | | | | | | | | | | | | | | | | | | | | | | | | | | | | | | | | | | | | | | | | | | | | | |
Total distributions | | | (7.64 | ) | | | (6.03 | ) | | | (3.22 | ) | | | (1.72 | ) | | | (5.77 | ) | | | (0.83 | ) | | | 0.00 | | | | 0.00 | | | | (0.04 | ) | | | (2.51 | ) | | | | | | | | |
| | | | | | | | | | | | | | | | | | | | | | | | | | | | | | | | | | | | | | | | | | | | | | | | |
Net asset value, end of period | | $ | 65.64 | | | $ | 67.13 | | | $ | 68.25 | | | $ | 70.46 | | | $ | 68.67 | | | $ | 58.19 | | | $ | 46.18 | | | $ | 44.37 | | | $ | 39.00 | | | $ | 41.69 | | | | | | | | | |
| | | | | | | | | | | | | | | | | | | | | | | | | | | | | | | | | | | | | | | | | | | | | | | | |
Total return | | | 10.18 | %5 | | | 7.60 | % | | | 1.27 | % | | | 5.11 | % | | | 30.76 | % | | | 28.12 | % | | | 4.08 | % | | | 13.77 | % | | | (6.34 | )% | | | (19.78 | )% | | | | | | | | |
| | | | | | | | | | | | | | | | | | | | | | | | | | | | | | | | | | | | | | | | | | | | | | | | |
Ratios/Supplemental data: | | | | | | | | | | | | | | | | | | | | | | | | | | | | | | | | | | | | | | | | | | | | | | | | |
Net assets (in millions), end of period | | $ | 2,735.2 | | | $ | 2,917.2 | | | $ | 3,511.2 | | | $ | 4,076.1 | | | $ | 4,644.2 | | | $ | 4,073.5 | | | $ | 4,110.8 | | | $ | 4,842.8 | | | $ | 5,034.5 | | | $ | 5,615.0 | | | | | | | | | |
| | | | | | | | | | | | | | | | | | | | | | | | | | | | | | | | | | | | | | | | | | | | | | | | |
Ratio of operating expenses to average net assets | | | 1.30 | %4,6 | | | 1.30 | %4 | | | 1.29 | %4 | | | 1.29 | %4 | | | 1.30 | % | | | 1.32 | % | | | 1.32 | % | | | 1.32 | % | | | 1.35 | %2 | | | 1.32 | %2 | | | | | | | | |
| | | | | | | | | | | | | | | | | | | | | | | | | | | | | | | | | | | | | | | | | | | | | | | | |
Ratio of net investment income (loss) to average net assets | | | (0.06 | )%6 | | | 0.12 | % | | | (0.37 | )% | | | 0.08 | % | | | (0.20 | )% | | | 0.38 | % | | | (0.56 | )% | | | (0.80 | )% | | | (0.56 | )% | | | (0.59 | )% | | | | | | | | |
| | | | | | | | | | | | | | | | | | | | | | | | | | | | | | | | | | | | | | | | | | | | | | | | |
Portfolio turnover rate | | | 0.50 | %5 | | | 4.68 | % | | | 6.95 | % | | | 13.15 | % | | | 9.63 | % | | | 13.70 | % | | | 13.51 | % | | | 16.12 | % | | | 26.65 | % | | | 25.97 | % | | | | | | | | |
| | | | | | | | | | | | | | | | | | | | | | | | | | | | | | | | | | | | | | | | | | | | | | | | |
| | | INSTITUTIONAL SHARES | | | | | | R6 SHARES | |
| | | Six Months
Ended
March 31, | | | Year Ended September 30, | | | | | | Six Months
Ended
March 31, | | | Year Ended
September 30, | |
| | | 2017 | | | 2016 | | | 2015 | | | 2014 | | | 2013 | | | 2012 | | | 2011 | | | 2010 | | | 20093 | | | | | | 2017 | | | 20167 | |
Net asset value, beginning of period | | $ | 68.42 | | | $ | 69.28 | | | $ | 71.33 | | | $ | 69.32 | | | $ | 58.70 | | | $ | 46.46 | | | $ | 44.52 | | | $ | 39.03 | | | $ | 33.71 | | | | | | | $ | 68.42 | | | $ | 60.02 | |
| | | | | | | | | | | | | | | | | | | | | | | | | | | | | | | | | | | | | | | | | | | | | | | | |
Income (loss) from investment operations: | | | | | | | | | | | | | | | | | | | | | | | | | | | | | | | | | | | | | | | | | | | | | | | | |
Net investment income (loss) | | | 0.07 | 1 | | | 0.24 | 1 | | | (0.09 | )1 | | | 0.20 | 1 | | | 0.02 | 1 | | | 0.45 | 1 | | | (0.17 | )1 | | | (0.22 | )1 | | | (0.04 | )1 | | | | | | | 0.07 | 1 | | | (0.15 | )1 |
Net realized and unrealized gain on investments | | | 6.30 | | | | 4.93 | | | | 1.28 | | | | 3.53 | | | | 16.52 | | | | 12.62 | | | | 2.11 | | | | 5.71 | | | | 5.36 | | | | | | | | 6.30 | | | | 8.55 | |
| | | | | | | | | | | | | | | | | | | | | | | | | | | | | | | | | | | | | | | | | | | | | | | | |
Total from investment operations | | | 6.37 | | | | 5.17 | | | | 1.19 | | | | 3.73 | | | | 16.54 | | | | 13.07 | | | | 1.94 | | | | 5.49 | | | | 5.32 | | | | | | | | 6.37 | | | | 8.40 | |
| | | | | | | | | | | | | | | | | | | | | | | | | | | | | | | | | | | | | | | | | | | | | | | | |
Less distributions to shareholders from: | | | | | | | | | | | | | | | | | | | | | | | | | | | | | | | | | | | | | | | | | | | | | | | | |
Net investment income | | | 0.00 | | | | 0.00 | | | | (0.02 | ) | | | (0.03 | ) | | | (0.33 | ) | | | 0.00 | | | | 0.00 | | | | 0.00 | | | | 0.00 | | | | | | | | 0.00 | | | | 0.00 | |
Net realized gain on investments | | | (7.64 | ) | | | (6.03 | ) | | | (3.22 | ) | | | (1.69 | ) | | | (5.59 | ) | | | (0.83 | ) | | | 0.00 | | | | 0.00 | | | | 0.00 | | | | | | | | (7.64 | ) | | | 0.00 | |
| | | | | | | | | | | | | | | | | | | | | | | | | | | | | | | | | | | | | | | | | | | | | | | | |
Total distributions | | | (7.64 | ) | | | (6.03 | ) | | | (3.24 | ) | | | (1.72 | ) | | | (5.92 | ) | | | (0.83 | ) | | | 0.00 | | | | 0.00 | | | | 0.00 | | | | | | | | (7.64 | ) | | | 0.00 | |
| | | | | | | | | | | | | | | | | | | | | | | | | | | | | | | | | | | | | | | | | | | | | | | | |
Net asset value, end of period | | $ | 67.15 | | | $ | 68.42 | | | $ | 69.28 | | | $ | 71.33 | | | $ | 69.32 | | | $ | 58.70 | | | $ | 46.46 | | | $ | 44.52 | | | $ | 39.03 | | | | | | | $ | 67.15 | | | $ | 68.42 | |
| | | | | | | | | | | | | | | | | | | | | | | | | | | | | | | | | | | | | | | | | | | | | | | | |
Total return | | | 10.32 | %5 | | | 7.88 | % | | | 1.51 | % | | | 5.39 | % | | | 31.10 | % | | | 28.45 | % | | | 4.36 | % | | | 14.07 | % | | | 15.78 | %5 | | | | | | | 10.32 | %5 | | | 14.00 | %5 |
| | | | | | | | | | | | | | | | | | | | | | | | | | | | | | | | | | | | | | | | | | | | | | | | |
Ratios/Supplemental data: | | | | | | | | | | | | | | | | | | | | | | | | | | | | | | | | | | | | | | | | | | | | | | | | |
Net assets (in millions), end of period | | $ | 3,165.0 | | | $ | 3,043.3 | | | $ | 3,440.4 | | | $ | 3,694.5 | | | $ | 2,976.7 | | | $ | 1,747.3 | | | $ | 1,261.8 | | | $ | 728.9 | | | $ | 238.7 | | | | | | | $ | 2.7 | | | $ | 2.3 | |
| | | | | | | | | | | | | | | | | | | | | | | | | | | | | | | | | | | | | | | | | | | | | | | | |
Ratio of operating expenses to average net assets | | | 1.05 | %4,6 | | | 1.05 | %4 | | | 1.04 | %4 | | | 1.04 | %4 | | | 1.05 | % | | | 1.06 | % | | | 1.06 | % | | | 1.06 | % | | | 1.13 | %6 | | | | | | | 1.05 | %4,6 | | | 1.05 | %4,6 |
| | | | | | | | | | | | | | | | | | | | | | | | | | | | | | | | | | | | | | | | | | | | | | | | |
Ratio of net investment income (loss) to average net assets | | | 0.21 | %6 | | | 0.37 | % | | | (0.12 | )% | | | 0.28 | % | | | 0.04 | % | | | 0.83 | % | | | (0.33 | )% | | | (0.53 | )% | | | (0.29 | )%6 | | | | | | | 0.21 | %6 | | | (0.33 | )%6 |
| | | | | | | | | | | | | | | | | | | | | | | | | | | | | | | | | | | | | | | | | | | | | | | | |
Portfolio turnover rate | | | 0.50 | %5 | | | 4.68 | % | | | 6.95 | % | | | 13.15 | % | | | 9.63 | % | | | 13.70 | % | | | 13.51 | % | | | 16.12 | % | | | 26.65 | % | | | | | | | 0.50 | %5 | | | 4.68 | % |
| | | | | | | | | | | | | | | | | | | | | | | | | | | | | | | | | | | | | | | | | | | | | | | | |
| | |
1 Based on average shares outstanding. 2 Benefit of expense reduction rounds to less than 0.01%. 3 For the period May 29, 2009 (initial offering of Institutional Shares) to September 30, 2009. 4 Interest expense rounds to less than 0.01%. | | 5 Not Annualized. 6 Annualized. 7 For the period January 29, 2016 (initial offering of R6 Shares) to September 30, 2016. |
| | |
| 38 | | See Notes to Financial Statements. |
| | |
| March 31, 2017 | | Baron Funds |
FINANCIAL HIGHLIGHTS (Unaudited) (Continued)
BARON SMALL CAP FUND
Selected data for a share outstanding throughout each period:
| | | | | | | | | | | | | | | | | | | | | | | | | | | | | | | | | | | | | | | | | | | | | | | | |
| | | RETAIL SHARES | | | | | | | |
| | | Six Months
Ended
March 31, | | | Year Ended September 30, | | | | | | | |
| | | 2017 | | | 2016 | | | 2015 | | | 2014 | | | 2013 | | | 2012 | | | 2011 | | | 2010 | | | 2009 | | | 2008 | | | | | | | |
Net asset value, beginning of period | | $ | 30.59 | | | $ | 30.34 | | | $ | 33.68 | | | $ | 32.83 | | | $ | 26.14 | | | $ | 20.84 | | | $ | 20.90 | | | $ | 17.96 | | | $ | 18.70 | | | $ | 25.47 | | | | | | | | | |
| | | | | | | | | | | | | | | | | | | | | | | | | | | | | | | | | | | | | | | | | | | | | | | | |
Income (loss) from investment operations: | | | | | | | | | | | | | | | | | | | | | | | | | | | | | | | | | | | | | | | | | | | | | | | | |
Net investment income (loss) | | | 0.03 | 1 | | | (0.18 | )1 | | | (0.21 | )1 | | | (0.01 | )1 | | | (0.12 | )1 | | | (0.19 | )1 | | | (0.15 | )1 | | | (0.06 | )1 | | | (0.13 | )1 | | | (0.09 | )1 | | | | | | | | |
Net realized and unrealized gain (loss) on investments | | | 2.56 | | | | 3.84 | | | | (1.10 | ) | | | 2.14 | | | | 7.61 | | | | 5.96 | | | | 0.09 | 2 | | | 3.00 | | | | (0.61 | ) | | | (5.01 | ) | | | | | | | | |
| | | | | | | | | | | | | | | | | | | | | | | | | | | | | | | | | | | | | | | | | | | | | | | | |
Total from investment operations | | | 2.59 | | | | 3.66 | | | | (1.31 | ) | | | 2.13 | | | | 7.49 | | | | 5.77 | | | | (0.06 | ) | | | 2.94 | | | | (0.74 | ) | | | (5.10 | ) | | | | | | | | |
| | | | | | | | | | | | | | | | | | | | | | | | | | | | | | | | | | | | | | | | | | | | | | | | |
Less distributions to shareholders from: | | | | | | | | | | | | | | | | | | | | | | | | | | | | | | | | | | | | | | | | | | | | | | | | |
Net investment income | | | 0.00 | | | | 0.00 | | | | 0.00 | | | | 0.00 | | | | 0.00 | | | | 0.00 | | | | 0.00 | | | | 0.00 | | | | 0.00 | | | | 0.00 | | | | | | | | | |
Net realized gain on investments | | | (5.68 | ) | | | (3.41 | ) | | | (2.03 | ) | | | (1.28 | ) | | | (0.80 | ) | | | (0.47 | ) | | | 0.00 | | | | 0.00 | | | | (0.00 | )3 | | | (1.67 | ) | | | | | | | | |
| | | | | | | | | | | | | | | | | | | | | | | | | | | | | | | | | | | | | | | | | | | | | | | | |
Total distributions | | | (5.68 | ) | | | (3.41 | ) | | | (2.03 | ) | | | (1.28 | ) | | | (0.80 | ) | | | (0.47 | ) | | | 0.00 | | | | 0.00 | | | | (0.00 | ) | | | (1.67 | ) | | | | | | | | |
| | | | | | | | | | | | | | | | | | | | | | | | | | | | | | | | | | | | | | | | | | | | | | | | |
Net asset value, end of period | | $ | 27.50 | | | $ | 30.59 | | | $ | 30.34 | | | $ | 33.68 | | | $ | 32.83 | | | $ | 26.14 | | | $ | 20.84 | | | $ | 20.90 | | | $ | 17.96 | | | $ | 18.70 | | | | | | | | | |
| | | | | | | | | | | | | | | | | | | | | | | | | | | | | | | | | | | | | | | | | | | | | | | | |
Total return | | | 9.90 | %6 | | | 12.89 | % | | | (4.32 | )% | | | 6.52 | % | | | 29.51 | % | | | 28.09 | % | | | (0.29 | )% | | | 16.37 | % | | | (3.95 | )% | | | (21.44 | )% | | | | | | | | |
| | | | | | | | | | | | | | | | | | | | | | | | | | | | | | | | | | | | | | | | | | | | | | | | |
Ratios/Supplemental data: | | | | | | | | | | | | | | | | | | | | | | | | | | | | | | | | | | | | | | | | | | | | | | | | |
Net assets (in millions), end of period | | $ | 1,696.2 | | | $ | 1,826.3 | | | $ | 2,601.4 | | | $ | 3,192.8 | | | $ | 3,626.1 | | | $ | 3,081.8 | | | $ | 2,842.0 | | | $ | 3,032.0 | | | $ | 2,719.4 | | | $ | 2,871.6 | | | | | | | | | |
| | | | | | | | | | | | | | | | | | | | | | | | | | | | | | | | | | | | | | | | | | | | | | | | |
Ratio of operating expenses to average net assets | | | 1.32 | %7,8 | | | 1.32 | %8 | | | 1.30 | % | | | 1.30 | % | | | 1.31 | % | | | 1.31 | % | | | 1.31 | % | | | 1.31 | % | | | 1.34 | %4 | | | 1.32 | %4 | | | | | | | | |
| | | | | | | | | | | | | | | | | | | | | | | | | | | | | | | | | | | | | | | | | | | | | | | | |
Ratio of net investment income (loss) to average net assets | | | 0.23 | %7 | | | (0.64 | )% | | | (0.61 | )% | | | (0.04 | )% | | | (0.42 | )% | | | (0.76 | )% | | | (0.63 | )% | | | (0.30 | )% | | | (0.86 | )% | | | (0.42 | )% | | | | | | | | |
| | | | | | | | | | | | | | | | | | | | | | | | | | | | | | | | | | | | | | | | | | | | | | | | |
Portfolio turnover rate | | | 7.70 | %6 | | | 10.25 | % | | | 14.66 | % | | | 16.41 | % | | | 20.35 | % | | | 28.02 | % | | | 32.81 | % | | | 27.22 | % | | | 35.83 | % | | | 41.52 | % | | | | | | | | |
| | | | | | | | | | | | | | | | | | | | | | | | | | | | | | | | | | | | | | | | | | | | | | | | |
| | | INSTITUTIONAL SHARES | | | | | | R6 SHARES | |
| | | Six Months
Ended
March 31, | | | Year Ended September 30, | | | | | | Six Months
Ended
March 31, | | | Year Ended
September 30, | |
| | | 2017 | | | 2016 | | | 2015 | | | 2014 | | | 2013 | | | 2012 | | | 2011 | | | 2010 | | | 20095 | | | | | | 2017 | | | 20169 | |
Net asset value, beginning of period | | $ | 31.29 | | | $ | 30.88 | | | $ | 34.16 | | | $ | 33.20 | | | $ | 26.36 | | | $ | 20.96 | | | $ | 20.97 | | | $ | 17.97 | | | $ | 15.52 | | | | | | | $ | 31.29 | | | $ | 26.06 | |
| | | | | | | | | | | | | | | | | | | | | | | | | | | | | | | | | | | | | | | | | | | | | | | | |
Income (loss) from investment operations: | | | | | | | | | | | | | | | | | | | | | | | | | | | | | | | | | | | | | | | | | | | | | | | | |
Net investment income (loss) | | | 0.07 | 1 | | | (0.12 | )1 | | | (0.13 | )1 | | | 0.06 | 1 | | | (0.05 | )1 | | | (0.13 | )1 | | | (0.10 | )1 | | | (0.03 | )1 | | | (0.04 | )1 | | | | | | | (0.05 | )1 | | | (0.17 | )1 |
Net realized and unrealized gain (loss) on investments | | | 2.63 | | | | 3.94 | | | | (1.12 | ) | | | 2.18 | | | | 7.69 | | | | 6.00 | | | | 0.09 | 2 | | | 3.03 | | | | 2.49 | | | | | | | | 2.75 | | | | 5.40 | |
| | | | | | | | | | | | | | | | | | | | | | | | | | | | | | | | | | | | | | | | | | | | | | | | |
Total from investment operations | | | 2.70 | | | | 3.82 | | | | (1.25 | ) | | | 2.24 | | | | 7.64 | | | | 5.87 | | | | (0.01 | ) | | | 3.00 | | | | 2.45 | | | | | | | | 2.70 | | | | 5.23 | |
| | | | | | | | | | | | | | | | | | | | | | | | | | | | | | | | | | | | | | | | | | | | | | | | |
Less distributions to shareholders from: | | | | | | | | | | | | | | | | | | | | | | | | | | | | | | | | | | | | | | | | | | | | | | | | |
Net investment income | | | 0.00 | | | | 0.00 | | | | 0.00 | | | | 0.00 | | | | 0.00 | | | | 0.00 | | | | 0.00 | | | | 0.00 | | | | 0.00 | | | | | | | | 0.00 | | | | 0.00 | |
Net realized gain on investments | | | (5.68 | ) | | | (3.41 | ) | | | (2.03 | ) | | | (1.28 | ) | | | (0.80 | ) | | | (0.47 | ) | | | 0.00 | | | | 0.00 | | | | 0.00 | | | | | | | | (5.68 | ) | | | 0.00 | |
| | | | | | | | | | | | | | | | | | | | | | | | | | | | | | | | | | | | | | | | | | | | | | | | |
Total distributions | | | (5.68 | ) | | | (3.41 | ) | | | (2.03 | ) | | | (1.28 | ) | | | (0.80 | ) | | | (0.47 | ) | | | 0.00 | | | | 0.00 | | | | 0.00 | | | | | | | | (5.68 | ) | | | 0.00 | |
| | | | | | | | | | | | | | | | | | | | | | | | | | | | | | | | | | | | | | | | | | | | | | | | |
Net asset value, end of period | | $ | 28.31 | | | $ | 31.29 | | | $ | 30.88 | | | $ | 34.16 | | | $ | 33.20 | | | $ | 26.36 | | | $ | 20.96 | | | $ | 20.97 | | | $ | 17.97 | | | | | | | $ | 28.31 | | | $ | 31.29 | |
| | | | | | | | | | | | | | | | | | | | | | | | | | | | | | | | | | | | | | | | | | | | | | | | |
Total return | | | 10.05 | %6 | | | 13.21 | % | | | (4.08 | )% | | | 6.79 | % | | | 29.85 | % | | | 28.41 | % | | | (0.05 | )% | | | 16.69 | % | | | 15.79 | %6 | | | | | | | 10.05 | %6 | | | 20.07 | %6 |
| | | | | | | | | | | | | | | | | | | | | | | | | | | | | | | | | | | | | | | | | | | | | | | | |
Ratios/Supplemental data: | | | | | | | | | | | | | | | | | | | | | | | | | | | | | | | | | | | | | | | | | | | | | | | | |
Net assets (in millions), end of period | | $ | 1,600.0 | | | $ | 1,680.7 | | | $ | 1,923.2 | | | $ | 2,057.4 | | | $ | 1,775.7 | | | $ | 1,111.0 | | | $ | 518.6 | | | $ | 261.1 | | | $ | 89.4 | | | | | | | $ | 78.0 | | | $ | 3.7 | |
| | | | | | | | | | | | | | | | | | | | | | | | | | | | | | | | | | | | | | | | | | | | | | | | |
Ratio of operating expenses to average net assets | | | 1.06 | %7,8 | | | 1.06 | %8 | | | 1.04 | % | | | 1.04 | % | | | 1.05 | % | | | 1.05 | % | | | 1.06 | % | | | 1.06 | % | | | 1.16 | %7 | | | | | | | 1.09 | %7,8 | | | 1.06 | %7,8 |
| | | | | | | | | | | | | | | | | | | | | | | | | | | | | | | | | | | | | | | | | | | | | | | | |
Ratio of net investment income (loss) to average net assets | | | 0.46 | %7 | | | (0.41 | )% | | | (0.37 | )% | | | 0.18 | % | | | (0.16 | )% | | | (0.53 | )% | | | (0.42 | )% | | | (0.15 | )% | | | (0.75 | )%7 | | | | | | | (0.39 | )%7 | | | (0.85 | )%7 |
| | | | | | | | | | | | | | | | | | | | | | | | | | | | | | | | | | | | | | | | | | | | | | | | |
Portfolio turnover rate | | | 7.70 | %6 | | | 10.25 | % | | | 14.66 | % | | | 16.41 | % | | | 20.35 | % | | | 28.02 | % | | | 32.81 | % | | | 27.22 | % | | | 35.83 | % | | | | | | | 7.70 | %6 | | | 10.25 | % |
| | | | | | | | | | | | | | | | | | | | | | | | | | | | | | | | | | | | | | | | | | | | | | | | |
| | |
1 Based on average shares outstanding. 2 The amount shown for a share outstanding does not correspond with the aggregate realized and unrealized gain (loss) on investments for the period due to the timing of sales and redemptions of fund shares in relation to fluctuating market values of investments of the Fund. 3 Less than $0.01 per share. 4 Benefit of expense reduction rounds to less than 0.01%. | | 5 For the period May 29, 2009 (initial offering of Institutional Shares) to September 30, 2009. 6 Not Annualized. 7 Annualized. 8 Interest expense rounds to less than 0.01%. 9 For the period January 29, 2016 (initial offering of R6 Shares) to September 30, 2016. |
| | |
| See Notes to Financial Statements. | | 39 |
| | |
| Baron Funds | | March 31, 2017 |
FINANCIAL HIGHLIGHTS (Unaudited) (Continued)
BARON OPPORTUNITY FUND
Selected data for a share outstanding throughout each period:
| | | | | | | | | | | | | | | | | | | | | | | | | | | | | | | | | | | | | | | | | | | | | | | | |
| | | RETAIL SHARES | | | | | | | |
| | | Six Months
Ended
March 31, | | | Year Ended September 30, | | | | | | | |
| | | 2017 | | | 2016 | | | 2015 | | | 2014 | | | 2013 | | | 2012 | | | 2011 | | | 2010 | | | 2009 | | | 2008 | | | | | | | |
Net asset value, beginning of period | | $ | 16.87 | | | $ | 17.12 | | | $ | 18.61 | | | $ | 19.26 | | | $ | 15.61 | | | $ | 12.83 | | | $ | 12.76 | | | $ | 10.61 | | | $ | 9.90 | | | $ | 13.01 | | | | | | | | | |
| | | | | | | | | | | | | | | | | | | | | | | | | | | | | | | | | | | | | | | | | | | | | | | | |
Income (loss) from investment operations: | | | | | | | | | | | | | | | | | | | | | | | | | | | | | | | | | | | | | | | | | | | | | | | | |
Net investment loss | | | (0.09 | )1 | | | (0.13 | )1 | | | (0.21 | )1 | | | (0.24 | )1 | | | (0.17 | )1 | | | (0.17 | )1 | | | (0.16 | )1 | | | (0.13 | )1 | | | (0.08 | )1 | | | (0.09 | )1 | | | | | | | | |
Net realized and unrealized gain (loss) on investments | | | 1.20 | | | | 1.70 | | | | (0.25 | ) | | | 0.79 | | | | 4.06 | | | | 2.95 | | | | 0.23 | | | | 2.28 | | | | 0.79 | | | | (3.02 | ) | | | | | | | | |
| | | | | | | | | | | | | | | | | | | | | | | | | | | | | | | | | | | | | | | | | | | | | | | | |
Total from investment operations | | | 1.11 | | | | 1.57 | | | | (0.46 | ) | | | 0.55 | | | | 3.89 | | | | 2.78 | | | | 0.07 | | | | 2.15 | | | | 0.71 | | | | (3.11 | ) | | | | | | | | |
| | | | | | | | | | | | | | | | | | | | | | | | | | | | | | | | | | | | | | | | | | | | | | | | |
Less distributions to shareholders from: | | | | | | | | | | | | | | | | | | | | | | | | | | | | | | | | | | | | | | | | | | | | | | | | |
Net investment income | | | 0.00 | | | | 0.00 | | | | 0.00 | | | | 0.00 | | | | 0.00 | | | | 0.00 | | | | 0.00 | | | | 0.00 | | | | 0.00 | | | | 0.00 | | | | | | | | | |
Net realized gain on investments | | | (1.89 | ) | | | (1.82 | ) | | | (1.03 | ) | | | (1.20 | ) | | | (0.24 | ) | | | 0.00 | | | | 0.00 | | | | 0.00 | | | | 0.00 | | | | 0.00 | | | | | | | | | |
| | | | | | | | | | | | | | | | | | | | | | | | | | | | | | | | | | | | | | | | | | | | | | | | |
Total distributions | | | (1.89 | ) | | | (1.82 | ) | | | (1.03 | ) | | | (1.20 | ) | | | (0.24 | ) | | | 0.00 | | | | 0.00 | | | | 0.00 | | | | 0.00 | | | | 0.00 | | | | | | | | | |
| | | | | | | | | | | | | | | | | | | | | | | | | | | | | | | | | | | | | | | | | | | | | | | | |
Redemption fees added to paid-in capital | | | 0.00 | | | | 0.00 | | | | 0.00 | | | | 0.00 | | | | 0.00 | | | | 0.00 | | | | 0.00 | | | | 0.00 | 2 | | | 0.00 | 2 | | | 0.00 | 2 | | | | | | | | |
| | | | | | | | | | | | | | | | | | | | | | | | | | | | | | | | | | | | | | | | | | | | | | | | |
Net asset value, end of period | | $ | 16.09 | | | $ | 16.87 | | | $ | 17.12 | | | $ | 18.61 | | | $ | 19.26 | | | $ | 15.61 | | | $ | 12.83 | | | $ | 12.76 | | | $ | 10.61 | | | $ | 9.90 | | | | | | | | | |
| | | | | | | | | | | | | | | | | | | | | | | | | | | | | | | | | | | | | | | | | | | | | | | | |
Total return | | | 7.95 | %8 | | | 9.19 | % | | | (2.70 | )% | | | 2.87 | %5 | | | 25.39 | % | | | 21.67 | % | | | 0.55 | % | | | 20.26 | % | | | 7.17 | % | | | (23.90 | )% | | | | | | | | |
| | | | | | | | | | | | | | | | | | | | | | | | | | | | | | | | | | | | | | | | | | | | | | | | |
Ratios/Supplemental data: | | | | | | | | | | | | | | | | | | | | | | | | | | | | | | | | | | | | | | | | | | | | | | | | |
Net assets (in millions), end of period | | $ | 178.7 | | | $ | 207.0 | | | $ | 232.2 | | | $ | 331.2 | | | $ | 359.9 | | | $ | 332.4 | | | $ | 240.4 | | | $ | 214.4 | | | $ | 142.7 | | | $ | 154.4 | | | | | | | | | |
| | | | | | | | | | | | | | | | | | | | | | | | | | | | | | | | | | | | | | | | | | | | | | | | |
Ratio of operating expenses to average net assets | | | 1.44 | %7,9 | | | 1.41 | %7 | | | 1.38 | %7 | | | 1.35 | % | | | 1.37 | % | | | 1.39 | % | | | 1.41 | % | | | 1.44 | % | | | 1.50 | % | | | 1.42 | % | | | | | | | | |
Less: Reimbursement of expenses by Adviser and/or offsets | | | 0.00 | % | | | 0.00 | % | | | 0.00 | % | | | 0.00 | % | | | 0.00 | % | | | 0.00 | % | | | 0.00 | % | | | 0.00 | % | | | 0.00 | %4 | | | 0.00 | %4 | | | | | | | | |
| | | | | | | | | | | | | | | | | | | | | | | | | | | | | | | | | | | | | | | | | | | | | | | | |
Ratio of net operating expenses to average net assets | | | 1.44 | %9 | | | 1.41 | % | | | 1.38 | % | | | 1.35 | % | | | 1.37 | % | | | 1.39 | % | | | 1.41 | % | | | 1.44 | % | | | 1.50 | % | | | 1.42 | % | | | | | | | | |
| | | | | | | | | | | | | | | | | | | | | | | | | | | | | | | | | | | | | | | | | | | | | | | | |
Ratio of net investment loss to average net assets | | | (1.22 | )%9 | | | (0.83 | )% | | | (1.10 | )% | | | (1.24 | )% | | | (1.02 | )% | | | (1.16 | )% | | | (1.11 | )% | | | (1.08 | )% | | | (1.00 | )% | | | (0.79 | )% | | | | | | | | |
| | | | | | | | | | | | | | | | | | | | | | | | | | | | | | | | | | | | | | | | | | | | | | | | |
Portfolio turnover rate | | | 16.80 | %8 | | | 32.38 | % | | | 41.87 | % | | | 63.40 | % | | | 70.44 | % | | | 88.56 | % | | | 65.43 | % | | | 76.44 | % | | | 68.09 | % | | | 61.44 | % | | | | | | | | |
| | | | | | | | | | | | | | | | | | | | | | | | | | | | | | | | | | | | | | | | | | | | | | | | |
| | | INSTITUTIONAL SHARES | | | | | | R6 SHARES | |
| | | Six Months
Ended
March 31, | | | Year Ended September 30, | | | | | | Six Months
Ended
March 31, | | | Year Ended
September 30, | |
| | | 2017 | | | 2016 | | | 2015 | | | 2014 | | | 2013 | | | 2012 | | | 2011 | | | 2010 | | | 20096 | | | | | | 2017 | | | 201610 | |
Net asset value, beginning of period | | $ | 17.27 | | | $ | 17.45 | | | $ | 18.89 | | | $ | 19.49 | | | $ | 15.75 | | | $ | 12.91 | | | $ | 12.80 | | | $ | 10.62 | | | $ | 8.88 | | | | | | | $ | 17.28 | | | $ | 16.88 | |
| | | | | | | | | | | | | | | | | | | | | | | | | | | | | | | | | | | | | | | | | | | | | | | | |
Income (loss) from investment operations: | | | | | | | | | | | | | | | | | | | | | | | | | | | | | | | | | | | | | | | | | | | | | | | | |
Net investment loss | | | (0.08 | )1 | | | (0.08 | )1 | | | (0.16 | )1 | | | (0.19 | )1 | | | (0.13 | )1 | | | (0.13 | )1 | | | (0.12 | )1 | | | (0.10 | )1 | | | (0.02 | )1 | | | | | | | (0.07 | )1 | | | (0.02 | )1 |
Net realized and unrealized gain (loss) on investments | | | 1.25 | | | | 1.72 | | | | (0.25 | ) | | | 0.79 | | | | 4.11 | | | | 2.97 | | | | 0.23 | | | | 2.28 | | | | 1.76 | | | | | | | | 1.24 | | | | 0.42 | |
| | | | | | | | | | | | | | | | | | | | | | | | | | | | | | | | | | | | | | | | | | | | | | | | |
Total from investment operations | | | 1.17 | | | | 1.64 | | | | (0.41 | ) | | | 0.60 | | | | 3.98 | | | | 2.84 | | | | 0.11 | | | | 2.18 | | | | 1.74 | | | | | | | | 1.17 | | | | 0.40 | |
| | | | | | | | | | | | | | | | | | | | | | | | | | | | | | | | | | | | | | | | | | | | | | | | |
Less distributions to shareholders from: | | | | | | | | | | | | | | | | | | | | | | | | | | | | | | | | | | | | | | | | | | | | | | | | |
Net investment income | | | 0.00 | | | | 0.00 | | | | 0.00 | | | | 0.00 | | | | 0.00 | | | | 0.00 | | | | 0.00 | | | | 0.00 | | | | 0.00 | | | | | | | | 0.00 | | | | 0.00 | |
Net realized gain on investments | | | (1.89 | ) | | | (1.82 | ) | | | (1.03 | ) | | | (1.20 | ) | | | (0.24 | ) | | | 0.00 | | | | 0.00 | | | | 0.00 | | | | 0.00 | | | | | | | | (1.89 | ) | | | 0.00 | |
| | | | | | | | | | | | | | | | | | | | | | | | | | | | | | | | | | | | | | | | | | | | | | | | |
Total distributions | | | (1.89 | ) | | | (1.82 | ) | | | (1.03 | ) | | | (1.20 | ) | | | (0.24 | ) | | | 0.00 | | | | 0.00 | | | | 0.00 | | | | 0.00 | | | | | | | | (1.89 | ) | | | 0.00 | |
| | | | | | | | | | | | | | | | | | | | | | | | | | | | | | | | | | | | | | | | | | | | | | | | |
Redemption fees added to paid-in capital | | | 0.00 | | | | 0.00 | | | | 0.00 | | | | 0.00 | | | | 0.00 | | | | 0.00 | | | | 0.00 | | | | 0.00 | 2 | | | 0.00 | | | | | | | | 0.00 | | | | 0.00 | |
| | | | | | | | | | | | | | | | | | | | | | | | | | | | | | | | | | | | | | | | | | | | | | | | |
Net asset value, end of period | | $ | 16.55 | | | $ | 17.27 | | | $ | 17.45 | | | $ | 18.89 | | | $ | 19.49 | | | $ | 15.75 | | | $ | 12.91 | | | $ | 12.80 | | | $ | 10.62 | | | | | | | $ | 16.56 | | | $ | 17.28 | |
| | | | | | | | | | | | | | | | | | | | | | | | | | | | | | | | | | | | | | | | | | | | | | | | |
Total return | | | 8.12 | %8 | | | 9.44 | % | | | (2.38 | )% | | | 3.10 | %5 | | | 25.74 | % | | | 22.00 | % | | | 0.86 | % | | | 20.53 | % | | | 19.59 | %3,8 | | | | | | | 8.12 | %8 | | | 2.37 | %8 |
| | | | | | | | | | | | | | | | | | | | | | | | | | | | | | | | | | | | | | | | | | | | | | | | |
Ratios/Supplemental data: | | | | | | | | | | | | | | | | | | | | | | | | | | | | | | | | | | | | | | | | | | | | | | | | |
Net assets (in millions), end of period | | $ | 42.1 | | | $ | 43.3 | | | $ | 91.7 | | | $ | 109.4 | | | $ | 101.3 | | | $ | 62.5 | | | $ | 35.5 | | | $ | 25.5 | | | $ | 10.9 | | | | | | | $ | 0.4 | | | $ | 0.5 | |
| | | | | | | | | | | | | | | | | | | | | | | | | | | | | | | | | | | | | | | | | | | | | | | | |
Ratio of operating expenses to average net assets | | | 1.18 | %7,9 | | | 1.13 | %7 | | | 1.10 | %7 | | | 1.08 | % | | | 1.11 | % | | | 1.13 | % | | | 1.14 | % | | | 1.18 | % | | | 1.37 | %9 | | | | | | | 1.15 | %7,9 | | | 1.12 | %7,9 |
Less: Reimbursement of expenses by Adviser and/or offsets | | | 0.00 | % | | | 0.00 | % | | | 0.00 | % | | | 0.00 | % | | | 0.00 | % | | | 0.00 | % | | | 0.00 | % | | | 0.00 | % | | | (0.12 | )%9 | | | | | | | 0.00 | % | | | 0.00 | % |
| | | | | | | | | | | | | | | | | | | | | | | | | | | | | | | | | | | | | | | | | | | | | | | | |
Ratio of net operating expenses to average net assets | | | 1.18 | %9 | | | 1.13 | % | | | 1.10 | % | | | 1.08 | % | | | 1.11 | % | | | 1.13 | % | | | 1.14 | % | | | 1.18 | % | | | 1.25 | %9 | | | | | | | 1.15 | %9 | | | 1.12 | %9 |
| | | | | | | | | | | | | | | | | | | | | | | | | | | | | | | | | | | | | | | | | | | | | | | | |
Ratio of net investment loss to average net assets | | | (0.96 | )%9 | | | (0.46 | )% | | | (0.84 | )% | | | (0.97 | )% | | | (0.79 | )% | | | (0.90 | )% | | | (0.84 | )% | | | (0.83 | )% | | | (0.74 | )%9 | | | | | | | (0.94 | )%9 | | | (1.25 | )%9 |
| | | | | | | | | | | | | | | | | | | | | | | | | | | | | | | | | | | | | | | | | | | | | | | | |
Portfolio turnover rate | | | 16.80 | %8 | | | 32.38 | % | | | 41.87 | % | | | 63.40 | % | | | 70.44 | % | | | 88.56 | % | | | 65.43 | % | | | 76.44 | % | | | 68.09 | % | | | | | | | 16.80 | %8 | | | 32.38 | % |
| | | | | | | | | | | | | | | | | | | | | | | | | | | | | | | | | | | | | | | | | | | | | | | | |
| | |
1 Based on average shares outstanding. 2 Less than $0.01 per share. 3 The total returns would have been lower had certain expenses not been reduced during the period shown. 4 Benefit of expense reduction rounds to less than 0.01%. 5 The Adviser made a voluntary payment to the Fund in the amount of $140,762 to compensate the Fund for a loss incurred due to a trade processing error. The impact of this payment increased the Fund’s total return by 0.03%. | | 6 For the period May 29, 2009 (initial offering of Institutional Shares) to September 30, 2009. 7 Interest expense rounds to less than 0.01% 8 Not Annualized. 9 Annualized. 10 For the period August 31, 2016 (initial offering of R6 Shares) to September 30, 2016. |
| | |
| 40 | | See Notes to Financial Statements. |
| | |
| March 31, 2017 | | Baron Funds |
FINANCIAL HIGHLIGHTS (Unaudited) (Continued)
BARON FIFTH AVENUE GROWTH FUND
Selected data for a share outstanding throughout each period:
| | | | | | | | | | | | | | | | | | | | | | | | | | | | | | | | | | | | | | | | | | | | | | | | |
| | | RETAIL SHARES | | | | | | | |
| | | Six Months
Ended
March 31, | | | Year Ended September 30, | | | | | | | |
| | | 2017 | | | 2016 | | | 2015 | | | 2014 | | | 2013 | | | 2012 | | | 2011 | | | 2010 | | | 2009 | | | 2008 | | | | | | | |
Net asset value, beginning of period | | $ | 19.35 | | | $ | 16.91 | | | $ | 16.83 | | | $ | 14.42 | | | $ | 11.83 | | | $ | 8.98 | | | $ | 9.21 | | | $ | 8.60 | | | $ | 10.38 | | | $ | 14.12 | | | | | | | | | |
| | | | | | | | | | | | | | | | | | | | | | | | | | | | | | | | | | | | | | | | | | | | | | | | |
Income (loss) from investment operations: | | | | | | | | | | | | | | | | | | | | | | | | | | | | | | | | | | | | | | | | | | | | | | | | |
Net investment income (loss) | | | (0.04 | )1 | | | (0.08 | )1 | | | (0.09 | )1 | | | (0.05 | )1 | | | 0.02 | 1 | | | (0.03 | )1 | | | (0.06 | )1 | | | (0.03 | )1 | | | 0.03 | 1 | | | 0.00 | 1,2 | | | | | | | | |
Net realized and unrealized gain (loss) on investments | | | 1.54 | | | | 2.52 | | | | 0.17 | 7 | | | 2.46 | | | | 2.57 | | | | 2.88 | | | | (0.17 | ) | | | 0.66 | | | | (1.03 | ) | | | (2.62 | ) | | | | | | | | |
| | | | | | | | | | | | | | | | | | | | | | | | | | | | | | | | | | | | | | | | | | | | | | | | |
Total from investment operations | | | 1.50 | | | | 2.44 | | | | 0.08 | | | | 2.41 | | | | 2.59 | | | | 2.85 | | | | (0.23 | ) | | | 0.63 | | | | (1.00 | ) | | | (2.62 | ) | | | | | | | | |
| | | | | | | | | | | | | | | | | | | | | | | | | | | | | | | | | | | | | | | | | | | | | | | | |
Less distributions to shareholders from: | | | | | | | | | | | | | | | | | | | | | | | | | | | | | | | | | | | | | | | | | | | | | | | | |
Net investment income | | | 0.00 | | | | 0.00 | | | | 0.00 | | | | 0.00 | | | | 0.00 | | | | 0.00 | | | | 0.00 | | | | (0.02 | ) | | | (0.01 | ) | | | 0.00 | | | | | | | | | |
Net realized gain on investments | | | 0.00 | | | | 0.00 | | | | 0.00 | | | | 0.00 | | | | 0.00 | | | | 0.00 | | | | 0.00 | | | | 0.00 | | | | (0.77 | ) | | | (1.12 | ) | | | | | | | | |
| | | | | | | | | | | | | | | | | | | | | | | | | | | | | | | | | | | | | | | | | | | | | | | | |
Total distributions | | | 0.00 | | | | 0.00 | | | | 0.00 | | | | 0.00 | | | | 0.00 | | | | 0.00 | | | | 0.00 | | | | (0.02 | ) | | | (0.78 | ) | | | (1.12 | ) | | | | | | | | |
| | | | | | | | | | | | | | | | | | | | | | | | | | | | | | | | | | | | | | | | | | | | | | | | |
Net asset value, end of period | | $ | 20.85 | | | $ | 19.35 | | | $ | 16.91 | | | $ | 16.83 | | | $ | 14.42 | | | $ | 11.83 | | | $ | 8.98 | | | $ | 9.21 | | | $ | 8.60 | | | $ | 10.38 | | | | | | | | | |
| | | | | | | | | | | | | | | | | | | | | | | | | | | | | | | | | | | | | | | | | | | | | | | | |
Total return | | | 7.75 | %3,5 | | | 14.43 | %3 | | | 0.48 | %3 | | | 16.71 | %3 | | | 21.89 | %3 | | | 31.74 | %3 | | | (2.50 | )%3 | | | 7.38 | %3 | | | (7.75 | )%3 | | | (19.96 | )%3 | | | | | | | | |
| | | | | | | | | | | | | | | | | | | | | | | | | | | | | | | | | | | | | | | | | | | | | | | | |
Ratios/Supplemental data: | | | | | | | | | | | | | | | | | | | | | | | | | | | | | | | | | | | | | | | | | | | | | | | | |
Net assets (in millions), end of period | | $ | 71.4 | | | $ | 73.5 | | | $ | 71.5 | | | $ | 53.2 | | | $ | 47.8 | | | $ | 34.8 | | | $ | 23.4 | | | $ | 29.0 | | | $ | 32.8 | | | $ | 58.2 | | | | | | | | | |
| | | | | | | | | | | | | | | | | | | | | | | | | | | | | | | | | | | | | | | | | | | | | | | | |
Ratio of total expenses to average net assets | | | 1.15 | %6 | | | 1.26 | % | | | 1.32 | % | | | 1.37 | % | | | 1.47 | % | | | 1.55 | % | | | 1.59 | % | | | 1.62 | % | | | 1.69 | % | | | 1.47 | % | | | | | | | | |
Less: Ratio of interest expense to average net assets | | | (0.01 | )%6 | | | 0.00 | % | | | 0.00 | % | | | 0.00 | % | | | 0.00 | % | | | 0.00 | % | | | 0.00 | % | | | 0.00 | % | | | 0.00 | % | | | 0.00 | % | | | | | | | | |
| | | | | | | | | | | | | | | | | | | | | | | | | | | | | | | | | | | | | | | | | | | | | | | | |
Ratio of operating expenses to average net assets | | | 1.14 | %6 | | | 1.26 | % | | | 1.32 | % | | | 1.37 | % | | | 1.47 | % | | | 1.55 | % | | | 1.59 | % | | | 1.62 | % | | | 1.69 | % | | | 1.47 | % | | | | | | | | |
Less: Reimbursement of expenses by Adviser and/or offsets | | | (0.04 | )%6 | | | (0.04 | )% | | | (0.02 | )% | | | (0.07 | )% | | | (0.17 | )% | | | (0.25 | )% | | | (0.29 | )% | | | (0.25 | )% | | | (0.29 | )% | | | (0.07 | )% | | | | | | | | |
| | | | | | | | | | | | | | | | | | | | | | | | | | | | | | | | | | | | | | | | | | | | | | | | |
Ratio of net operating expenses to average net assets | | | 1.10 | %6 | | | 1.22 | % | | | 1.30 | % | | | 1.30 | % | | | 1.30 | % | | | 1.30 | % | | | 1.30 | % | | | 1.37 | % | | | 1.40 | % | | | 1.40 | % | | | | | | | | |
| | | | | | | | | | | | | | | | | | | | | | | | | | | | | | | | | | | | | | | | | | | | | | | | |
Ratio of net investment income (loss) to average net assets | | | (0.45 | )%6 | | | (0.43 | )% | | | (0.49 | )% | | | (0.29 | )% | | | 0.14 | % | | | (0.30 | )% | | | (0.55 | )% | | | (0.32 | )% | | | 0.40 | % | | | (0.01 | )% | | | | | | | | |
| | | | | | | | | | | | | | | | | | | | | | | | | | | | | | | | | | | | | | | | | | | | | | | | |
Portfolio turnover rate | | | 7.09 | %5 | | | 19.30 | % | | | 14.54 | % | | | 16.84 | % | | | 22.91 | % | | | 79.07 | % | | | 75.36 | % | | | 57.67 | % | | | 39.61 | % | | | 39.59 | % | | | | | | | | |
| | | | | | | | | | | | | | | | | | | | | | | | | | | | | | | | | | | | | | | | | | | | | | | | |
| | | INSTITUTIONAL SHARES | | | | | | R6 SHARES | |
| | | Six Months
Ended
March 31, | | | Year Ended September 30, | | | | | | Six Months
Ended
March 31, | | | Year Ended
September 30, | |
| | | 2017 | | | 2016 | | | 2015 | | | 2014 | | | 2013 | | | 2012 | | | 2011 | | | 2010 | | | 20094 | | | | | | 2017 | | | 20168 | |
Net asset value, beginning of period | | $ | 19.62 | | | $ | 17.10 | | | $ | 17.00 | | | $ | 14.53 | | | $ | 11.89 | | | $ | 9.00 | | | $ | 9.21 | | | $ | 8.61 | | | $ | 7.54 | | | | | | | $ | 19.63 | | | $ | 17.03 | |
| | | | | | | | | | | | | | | | | | | | | | | | | | | | | | | | | | | | | | | | | | | | | | | | |
Income (loss) from investment operations: | | | | | | | | | | | | | | | | | | | | | | | | | | | | | | | | | | | | | | | | | | | | | | | | |
Net investment income (loss) | | | (0.02 | )1 | | | (0.03 | )1 | | | (0.04 | )1 | | | (0.01 | )1 | | | 0.05 | 1 | | | (0.01 | )1 | | | (0.03 | )1 | | | (0.01 | )1 | | | 0.02 | 1 | | | | | | | (0.02 | )1 | | | (0.05 | )1 |
Net realized and unrealized gain (loss) on investments | | | 1.57 | | | | 2.55 | | | | 0.16 | 7 | | | 2.48 | | | | 2.59 | | | | 2.90 | | | | (0.18 | ) | | | 0.66 | | | | 1.05 | | | | | | | | 1.57 | | | | 2.65 | |
| | | | | | | | | | | | | | | | | | | | | | | | | | | | | | | | | | | | | | | | | | | | | | | | |
Total from investment operations | | | 1.55 | | | | 2.52 | | | | 0.12 | | | | 2.47 | | | | 2.64 | | | | 2.89 | | | | (0.21 | ) | | | 0.65 | | | | 1.07 | | | | | | | | 1.55 | | | | 2.60 | |
| | | | | | | | | | | | | | | | | | | | | | | | | | | | | | | | | | | | | | | | | | | | | | | | |
Less distributions to shareholders from: | | | | | | | | | | | | | | | | | | | | | | | | | | | | | | | | | | | | | | | | | | | | | | | | |
Net investment income | | | 0.00 | | | | 0.00 | | | | (0.02 | ) | | | 0.00 | | | | 0.00 | | | | 0.00 | | | | 0.00 | | | | (0.05 | ) | | | 0.00 | | | | | | | | 0.00 | | | | 0.00 | |
Net realized gain on investments | | | 0.00 | | | | 0.00 | | | | 0.00 | | | | 0.00 | | | | 0.00 | | | | 0.00 | | | | 0.00 | | | | 0.00 | | | | 0.00 | | | | | | | | 0.00 | | | | 0.00 | |
| | | | | | | | | | | | | | | | | | | | | | | | | | | | | | | | | | | | | | | | | | | | | | | | |
Total distributions | | | 0.00 | | | | 0.00 | | | | (0.02 | ) | | | 0.00 | | | | 0.00 | | | | 0.00 | | | | 0.00 | | | | (0.05 | ) | | | 0.00 | | | | | | | | 0.00 | | | | 0.00 | |
| | | | | | | | | | | | | | | | | | | | | | | | | | | | | | | | | | | | | | | | | | | | | | | | |
Net asset value, end of period | | $ | 21.17 | | | $ | 19.62 | | | $ | 17.10 | | | $ | 17.00 | | | $ | 14.53 | | | $ | 11.89 | | | $ | 9.00 | | | $ | 9.21 | | | $ | 8.61 | | | | | | | $ | 21.18 | | | $ | 19.63 | |
| | | | | | | | | | | | | | | | | | | | | | | | | | | | | | | | | | | | | | | | | | | | | | | | |
Total return | | | 7.90 | %3,5 | | | 14.74 | %3 | | | 0.72 | % | | | 17.00 | %3 | | | 22.20 | %3 | | | 32.11 | %3 | | | (2.28 | )%3 | | | 7.59 | %3 | | | 14.19 | %3,5 | | | | | | | 7.90 | %3,5 | | | 15.27 | %3,5 |
| | | | | | | | | | | | | | | | | | | | | | | | | | | | | | | | | | | | | | | | | | | | | | | | |
Ratios/Supplemental data: | | | | | | | | | | | | | | | | | | | | | | | | | | | | | | | | | | | | | | | | | | | | | | | | |
Net assets (in millions), end of period | | $ | 78.7 | | | $ | 81.9 | | | $ | 74.7 | | | $ | 56.0 | | | $ | 33.8 | | | $ | 18.9 | | | $ | 10.2 | | | $ | 10.4 | | | $ | 9.5 | | | | | | | $ | 1.5 | | | $ | 1.4 | |
| | | | | | | | | | | | | | | | | | | | | | | | | | | | | | | | | | | | | | | | | | | | | | | | |
Ratio of total expenses to average net assets | | | 0.87 | %6 | | | 0.98 | % | | | 1.04 | % | | | 1.08 | % | | | 1.18 | % | | | 1.26 | % | | | 1.31 | % | | | 1.35 | % | | | 1.61 | %6 | | | | | | | 0.86 | %6 | | | 0.85 | %6 |
Less: Ratio of interest expense to average net assets | | | (0.01 | )%6 | | | 0.00 | % | | | 0.00 | % | | | 0.00 | % | | | 0.00 | % | | | 0.00 | % | | | 0.00 | % | | | 0.00 | % | | | 0.00 | % | | | | | | | (0.01 | )%6 | | | 0.00 | % |
| | | | | | | | | | | | | | | | | | | | | | | | | | | | | | | | | | | | | | | | | | | | | | | | |
Ratio of operating expenses to average net assets | | | 0.86 | %6 | | | 0.98 | % | | | 1.04 | % | | | 1.08 | % | | | 1.18 | % | | | 1.26 | % | | | 1.31 | % | | | 1.35 | % | | | 1.61 | %6 | | | | | | | 0.85 | %6 | | | 0.85 | %6 |
Less: Reimbursement of expenses by Adviser and/or offsets | | | (0.01 | )%6 | | | (0.01 | )% | | | 0.00 | % | | | (0.03 | )% | | | (0.13 | )% | | | (0.21 | )% | | | (0.26 | )% | | | (0.24 | )% | | | (0.46 | )%6 | | | | | | | (0.01 | )%6 | | | (0.01 | )%6 |
| | | | | | | | | | | | | | | | | | | | | | | | | | | | | | | | | | | | | | | | | | | | | | | | |
Ratio of net operating expenses to average net assets | | | 0.85 | %6 | | | 0.97 | % | | | 1.04 | % | | | 1.05 | % | | | 1.05 | % | | | 1.05 | % | | | 1.05 | % | | | 1.11 | % | | | 1.15 | %6 | | | | | | | 0.84 | %6 | | | 0.84 | %6 |
| | | | | | | | | | | | | | | | | | | | | | | | | | | | | | | | | | | | | | | | | | | | | | | | |
Ratio of net investment income (loss) to average net assets | | | (0.19 | )%6 | | | (0.19 | )% | | | (0.23 | )% | | | (0.08 | )% | | | 0.36 | % | | | (0.05 | )% | | | (0.30 | )% | | | (0.07 | )% | | | 0.58 | %6 | | | | | | | (0.19 | )%6 | | | (0.37 | )%6 |
| | | | | | | | | | | | | | | | | | | | | | | | | | | | | | | | | | | | | | | | | | | | | | | | |
Portfolio turnover rate | | | 7.09 | %5 | | | 19.30 | % | | | 14.54 | % | | | 16.84 | % | | | 22.91 | % | | | 79.07 | % | | | 75.36 | % | | | 57.67 | % | | | 39.61 | % | | | | | | | 7.09 | %5 | | | 19.30 | % |
| | | | | | | | | | | | | | | | | | | | | | | | | | | | | | | | | | | | | | | | | | | | | | | | |
| | |
1 Based on average shares outstanding. 2 Less than $0.01 per share. 3 The total returns would have been lower had certain expenses not been reduced during the period shown. 4 For the period May 29, 2009 (initial offering of Institutional Shares) to September 30, 2009. 5 Not Annualized. | | 6 Annualized. 7 The amount shown for a share outstanding does not correspond with the aggregate realized and unrealized gain (loss) on investments for the period due to the timing of sales and redemptions of Fund shares in relation to fluctuating market values of investments of the Fund. 8 For the period January 29, 2016 (initial offering of R6 Shares) to September 30, 2016. |
| | |
| See Notes to Financial Statements. | | 41 |
| | |
| Baron Funds | | March 31, 2017 |
FINANCIAL HIGHLIGHTS (Unaudited) (Continued)
BARON DISCOVERY FUND
Selected data for a share outstanding throughout each period:
| | | | | | | | | | | | | | | | | | | | | | | | | | | | |
| | | RETAIL SHARES | | | | | | | | | | |
| | | Six Months
Ended
March 31, | | | Year Ended September 30, | | | | | | | | | | |
| | | 2017 | | | 2016 | | | 2015 | | | 2014 | | | | | | | | | | |
Net asset value, beginning of period | | $ | 13.40 | | | $ | 11.13 | | | $ | 11.68 | | | $ | 10.00 | | | | | | | | | | | | | |
| | | | | | | | | | | | | | | | | | | | | | | | | | | | |
Income (loss) from investment operations: | | | | | | | | | | | | | | | | | | | | | | | | | | | | |
Net investment income (loss) | | | (0.07 | )1 | | | 0.16 | 1 | | | (0.13 | )1 | | | (0.10 | )1 | | | | | | | | | | | | |
Net realized and unrealized gain (loss) on investments | | | 1.61 | | | | 2.38 | | | | (0.42 | ) | | | 1.78 | 2 | | | | | | | | | | | | |
| | | | | | | | | | | | | | | | | | | | | | | | | | | | |
Total from investment operations | | | 1.54 | | | | 2.54 | | | | (0.55 | ) | | | 1.68 | | | | | | | | | | | | | |
| | | | | | | | | | | | | | | | | | | | | | | | | | | | |
Less distributions to shareholders from: | | | | | | | | | | | | | | | | | | | | | | | | | | | | |
Net investment income | | | 0.00 | | | | 0.00 | | | | 0.00 | | | | 0.00 | | | | | | | | | | | | | |
Net realized gain on investments | | | 0.00 | | | | (0.27 | ) | | | 0.00 | | | | 0.00 | | | | | | | | | | | | | |
| | | | | | | | | | | | | | | | | | | | | | | | | | | | |
Total distributions | | | 0.00 | | | | (0.27 | ) | | | 0.00 | | | | 0.00 | | | | | | | | | | | | | |
| | | | | | | | | | | | | | | | | | | | | | | | | | | | |
Net asset value, end of period | | $ | 14.94 | | | $ | 13.40 | | | $ | 11.13 | | | $ | 11.68 | | | | | | | | | | | | | |
| | | | | | | | | | | | | | | | | | | | | | | | | | | | |
Total return | | | 11.49 | %3,6 | | | 23.24 | %3 | | | (4.71 | )%3,4 | | | 16.80 | %3 | | | | | | | | | | | | |
| | | | | | | | | | | | | | | | | | | | | | | | | | | | |
Ratios/Supplemental data: | | | | | | | | | | | | | | | | | | | | | | | | | | | | |
Net assets (in millions), end of period | | $ | 47.8 | | | $ | 18.6 | | | $ | 19.9 | | | $ | 16.6 | | | | | | | | | | | | | |
| | | | | | | | | | | | | | | | | | | | | | | | | | | | |
Ratio of operating expenses to average net assets | | | 1.65 | %7 | | | 1.88 | % | | | 1.57 | % | �� | | 2.16 | % | | | | | | | | | | | | |
Less: Reimbursement of expenses by Adviser and/or offsets | | | (0.30 | )%7 | | | (0.53 | )% | | | (0.22 | )% | | | (0.81 | )% | | | | | | | | | | | | |
| | | | | | | | | | | | | | | | | | | | | | | | | | | | |
Ratio of net operating expenses to average net assets | | | 1.35 | %7 | | | 1.35 | % | | | 1.35 | % | | | 1.35 | % | | | | | | | | | | | | |
| | | | | | | | | | | | | | | | | | | | | | | | | | | | |
Ratio of net investment income (loss) to average net assets | | | (0.99 | )%7 | | | 1.38 | % | | | (0.97 | )% | | | (0.85 | )% | | | | | | | | | | | | |
| | | | | | | | | | | | | | | | | | | | | | | | | | | | |
Portfolio turnover rate | | | 21.85 | %6 | | | 90.74 | % | | | 114.82 | % | | | 109.40 | % | | | | | | | | | | | | |
| | | | | | | | | | | | | | | | | | | | | | | | | | | | |
| | | INSTITUTIONAL SHARES | | | | | | R6 SHARES | |
| | | Six Months
Ended
March 31, | | | Year Ended September 30, | | | | | | Six Months
Ended
March 31, 2017 | | | Year Ended
September 30, 20165 | |
| | | 2017 | | | 2016 | | | 2015 | | | 2014 | | | | | | |
Net asset value, beginning of period | | $ | 13.50 | | | $ | 11.19 | | | $ | 11.71 | | | $ | 10.00 | | | | | | | $ | 13.50 | | | $ | 12.89 | |
| | | | | | | | | | | | | | | | | | | | | | | | | | | | |
Income (loss) from investment operations: | | | | | | | | | | | | | | | | | | | | | | | | | | | | |
Net investment income (loss) | | | (0.05 | )1 | | | 0.12 | 1 | | | (0.10 | )1 | | | (0.08 | )1 | | | | | | | (0.05 | )1 | | | (0.01 | )1 |
Net realized and unrealized gain (loss) on investments | | | 1.62 | | | | 2.46 | | | | (0.42 | ) | | | 1.79 | 2 | | | | | | | 1.63 | | | | 0.62 | |
| | | | | | | | | | | | | | | | | | | | | | | | | | | | |
Total from investment operations | | | 1.57 | | | | 2.58 | | | | (0.52 | ) | | | 1.71 | | | | | | | | 1.58 | | | | 0.61 | |
| | | | | | | | | | | | | | | | | | | | | | | | | | | | |
Less distributions to shareholders from: | | | | | | | | | | | | | | | | | | | | | | | | | | | | |
Net investment income | | | 0.00 | | | | 0.00 | | | | 0.00 | | | | 0.00 | | | | | | | | 0.00 | | | | 0.00 | |
Net realized gain on investments | | | 0.00 | | | | (0.27 | ) | | | 0.00 | | | | 0.00 | | | | | | | | 0.00 | | | | 0.00 | |
| | | | | | | | | | | | | | | | | | | | | | | | | | | | |
Total distributions | | | 0.00 | | | | (0.27 | ) | | | 0.00 | | | | 0.00 | | | | | | | | 0.00 | | | | 0.00 | |
| | | | | | | | | | | | | | | | | | | | | | | | | | | | |
Net asset value, end of period | | $ | 15.07 | | | $ | 13.50 | | | $ | 11.19 | | | $ | 11.71 | | | | | | | $ | 15.08 | | | $ | 13.50 | |
| | | | | | | | | | | | | | | | | | | | | | | | | | | | |
Total return | | | 11.63 | %3,6 | | | 23.47 | %3 | | | (4.44 | )%3,4 | | | 17.10 | %3 | | | | | | | 11.70 | %3 6 | | | 4.73 | %3 6 |
| | | | | | | | | | | | | | | | | | | | | | | | | | | | |
Ratios/Supplemental data: | | | | | | | | | | | | | | | | | | | | | | | | | | | | |
Net assets (in millions), end of period | | $ | 69.1 | | | $ | 22.8 | | | $ | 53.9 | | | $ | 48.7 | | | | | | | $ | 2.5 | | | $ | 2.0 | |
| | | | | | | | | | | | | | | | | | | | | | | | | | | | |
Ratio of operating expenses to average net assets | | | 1.36 | %7 | | | 1.49 | % | | | 1.25 | % | | | 1.91 | % | | | | | | | 1.31 | %7 | | | 1.48 | %7 |
Less: Reimbursement of expenses by Adviser and/or offsets | | | (0.26 | )%7 | | | (0.39 | )% | | | (0.15 | )% | | | (0.81 | )% | | | | | | | (0.22 | )%7 | | | (0.39 | )%7 |
| | | | | | | | | | | | | | | | | | | | | | | | | | | | |
Ratio of net operating expenses to average net assets | | | 1.10 | %7 | | | 1.10 | % | | | 1.10 | % | | | 1.10 | % | | | | | | | 1.09 | %7 | | | 1.09 | %7 |
| | | | | | | | | | | | | | | | | | | | | | | | | | | | |
Ratio of net investment income (loss) to average net assets | | | (0.74 | )%7 | | | 1.06 | % | | | (0.72 | )% | | | (0.64 | )% | | | | | | | (0.73 | )%7 | | | (0.66 | )%7 |
| | | | | | | | | | | | | | | | | | | | | | | | | | | | |
Portfolio turnover rate | | | 21.85 | %6 | | | 90.74 | % | | | 114.82 | % | | | 109.40 | % | | | | | | | 21.85 | %6 | | | 90.74 | % |
| | | | | | | | | | | | | | | | | | | | | | | | | | | | |
| | |
1 Based on average shares outstanding. 2 The amount shown for a share outstanding does not correspond with the aggregate realized and unrealized gain (loss) on investments for the period due to the timing of sales and redemptions of fund shares in relation to fluctuating market values of investments of the Fund. 3 The total returns would have been lower had certain expenses not been reduced during the period shown. | | 4 The Adviser made a voluntary payment to the Fund in the amount of $1,000 to compensate the Fund for a loss incurred due to a trade processing error. The impact of this payment increased the Fund’s total return by less than 0.01%. 5 For the period August 31, 2016 (initial offering of R6 Shares) to September 30, 2016. 6 Not Annualized. 7 Annualized. |
| | |
| 42 | | See Notes to Financial Statements. |
| | |
| March 31, 2017 | | Baron Funds |
FUND EXPENSES (Unaudited)
As a shareholder of the Funds, you may incur two types of costs: ongoing expenses and transaction costs. Ongoing expenses include advisory fees, distribution and service (12b-1) fees and other Fund expenses. Due to the payment of Rule 12b-1 fees, long-term shareholders may indirectly pay more than the maximum permitted front-end sales charge. The information on this page is intended to help you understand your ongoing costs of investing in the Funds and to compare these costs with the ongoing costs of investing in other mutual funds.
The information in the following table is based on an investment of $1,000 invested on October 1, 2016 and held for the six months ended March 30, 2017.
ACTUAL EXPENSES
The table below titled “Based on Actual Total Return” provides information about actual account values and actual expenses. You may use the information provided in this table, together with the amount you invested, to estimate the expenses that you paid over the period. To estimate the expenses you paid on your account, divide your ending account value by $1,000 (for example, an $8,600 ending account value divided by $1,000 = 8.6), then multiply the result by the number under the heading titled “Expenses Paid During the Period”.
BASED ON ACTUAL TOTAL RETURN FOR THE SIX MONTHS ENDED MARCH 31, 20171
| | | | | | | | | | | | | | | | | | | | |
| | | Actual Total Return | | | Beginning Account Value October 1, 2016 | | | Ending Account Value March 31, 2017 | | | Annualized Expense Ratio | | | Expenses Paid During the Period3 | |
Baron Asset Fund — Retail Shares | | | 10.08 | % | | $ | 1,000.00 | | | $ | 1,100.80 | | | | 1.31 | % | | $ | 6.86 | |
Baron Asset Fund — Institutional Shares | | | 10.24 | % | | $ | 1,000.00 | | | $ | 1,102.40 | | | | 1.04 | % | | $ | 5.45 | |
Baron Asset Fund — R6 Shares | | | 10.22 | % | | $ | 1,000.00 | | | $ | 1,102.20 | | | | 1.04 | % | | $ | 5.45 | |
Baron Growth Fund — Retail Shares | | | 10.18 | % | | $ | 1,000.00 | | | $ | 1,101.80 | | | | 1.30 | % | | $ | 6.81 | |
Baron Growth Fund — Institutional Shares | | | 10.32 | % | | $ | 1,000.00 | | | $ | 1,103.20 | | | | 1.05 | % | | $ | 5.51 | |
Baron Growth Fund — R6 Shares | | | 10.32 | % | | $ | 1,000.00 | | | $ | 1,103.20 | | | | 1.05 | % | | $ | 5.51 | |
Baron Small Cap Fund — Retail Shares | | | 9.90 | % | | $ | 1,000.00 | | | $ | 1,099.00 | | | | 1.32 | % | | $ | 6.91 | |
Baron Small Cap Fund — Institutional Shares | | | 10.05 | % | | $ | 1,000.00 | | | $ | 1,100.50 | | | | 1.06 | % | | $ | 5.55 | |
Baron Small Cap Fund — R6 Shares | | | 10.05 | % | | $ | 1,000.00 | | | $ | 1,100.50 | | | | 1.09 | % | | $ | 5.71 | |
Baron Opportunity Fund — Retail Shares | | | 7.95 | % | | $ | 1,000.00 | | | $ | 1,079.50 | | | | 1.44 | % | | $ | 7.47 | |
Baron Opportunity Fund — Institutional Shares | | | 8.12 | % | | $ | 1,000.00 | | | $ | 1,081.20 | | | | 1.18 | % | | $ | 6.12 | |
Baron Opportunity Fund — R6 Shares | | | 8.12 | % | | $ | 1,000.00 | | | $ | 1,081.20 | | | | 1.15 | % | | $ | 5.97 | |
Baron Fifth Avenue Growth Fund — Retail Shares | | | 7.75 | % | | $ | 1,000.00 | | | $ | 1,077.50 | 4 | | | 1.11 | %2,5 | | $ | 5.75 | |
Baron Fifth Avenue Growth Fund — Institutional Shares | | | 7.90 | % | | $ | 1,000.00 | | | $ | 1,079.00 | 4 | | | 0.86 | %2,5 | | $ | 4.46 | |
Baron Fifth Avenue Growth Fund — R6 Shares | | | 7.90 | % | | $ | 1,000.00 | | | $ | 1,079.00 | 4 | | | 0.85 | %2,5 | | $ | 4.41 | |
Baron Discovery Fund — Retail Shares | | | 11.49 | % | | $ | 1,000.00 | | | $ | 1,114.90 | 4 | | | 1.35 | %5 | | $ | 7.12 | |
Baron Discovery Fund — Institutional Shares | | | 11.63 | % | | $ | 1,000.00 | | | $ | 1,116.30 | 4 | | | 1.10 | %5 | | $ | 5.80 | |
Baron Discovery Fund — R6 Shares | | | 11.70 | % | | $ | 1,000.00 | | | $ | 1,117.00 | 4 | | | 1.09 | %5 | | $ | 5.75 | |
| 1 | Assumes reinvestment of all dividends and capital gain distributions, if any. |
| 2 | Annualized expense ratio for Baron Fifth Avenue Growth Fund for the six months ended March 31, 2017, includes 1.10%, 0.85% and 0.84% for net operating expenses and 0.01%, 0.01% and 0.01% for interest expense for the Retail, Institutional and R6 Shares, respectively. |
| 3 | Expenses are equal to each Share Class’ respective annualized expense ratio multiplied by the average account value over the period, multiplied by the number of days in the most recent fiscal half-year, then divided by 365. |
| 4 | Ending account value assumes the return earned after waiver and would have been lower if a portion of the expenses had not been waived. |
| 5 | Annualized expense ratios are adjusted to reflect fee waiver. |
43
| | |
| Baron Funds | | March 31, 2017 |
HYPOTHETICAL EXAMPLE FOR COMPARISON PURPOSES
The table below titled “Based on Hypothetical Total Return” provides information about hypothetical account values and hypothetical expenses based on the actual expense ratio and an assumed rate of return of 5% per year before expenses, which is not the Funds’ actual return. The hypothetical account values and expenses may not be used to estimate the actual ending account values and expenses you paid for the period. You may use the information provided in this table to compare the ongoing costs of investing in the Funds and other funds. To do so, compare the 5% hypothetical example relating to the Funds with the 5% hypothetical examples that appear in the shareholder reports of other funds.
Please note that expenses shown in the table below are meant to highlight your ongoing costs and do not reflect any transactional costs, such as redemption fees, if any. Therefore, the table is useful in comparing ongoing costs only and will not help you determine your relative total costs of owning different mutual funds. In addition, if these transactional costs were included, your costs would have been higher.
BASED ON HYPOTHETICAL TOTAL RETURN FOR THE SIX MONTHS ENDED MARCH 31, 2017
| | | | | | | | | | | | | | | | | | | | |
| | | Hypothetical Annualized Total Return | | | Beginning Account Value October 1, 2016 | | | Ending Account Value March 31, 2017 | | | Annualized Expense Ratio | | | Expenses Paid During the Period3 | |
Baron Asset Fund — Retail Shares | | | 5.00 | % | | $ | 1,000.00 | | | $ | 1,018.40 | | | | 1.31 | % | | $ | 6.59 | |
Baron Asset Fund — Institutional Shares | | | 5.00 | % | | $ | 1,000.00 | | | $ | 1.019.75 | | | | 1.04 | % | | $ | 5.24 | |
Baron Asset Fund — R6 Shares | | | 5.00 | % | | $ | 1,000.00 | | | $ | 1,019.75 | | | | 1.04 | % | | $ | 5.24 | |
Baron Growth Fund — Retail Shares | | | 5.00 | % | | $ | 1,000.00 | | | $ | 1,018.45 | | | | 1.30 | % | | $ | 6.54 | |
Baron Growth Fund — Institutional Shares | | | 5.00 | % | | $ | 1,000.00 | | | $ | 1,019.70 | | | | 1.05 | % | | $ | 5.29 | |
Baron Growth Fund — R6 Shares | | | 5.00 | % | | $ | 1,000.00 | | | $ | 1,019.70 | | | | 1.05 | % | | $ | 5.29 | |
Baron Small Cap Fund — Retail Shares | | | 5.00 | % | | $ | 1,000.00 | | | $ | 1,018.35 | | | | 1.32 | % | | $ | 6.64 | |
Baron Small Cap Fund — Institutional Shares | | | 5.00 | % | | $ | 1,000.00 | | | $ | 1,019.65 | | | | 1.06 | % | | $ | 5.34 | |
Baron Small Cap Fund — R6 Shares | | | 5.00 | % | | $ | 1,000.00 | | | $ | 1,019.50 | | | | 1.09 | % | | $ | 5.49 | |
Baron Opportunity Fund — Retail Shares | | | 5.00 | % | | $ | 1,000.00 | | | $ | 1,017.75 | | | | 1.44 | % | | $ | 7.24 | |
Baron Opportunity Fund — Institutional Shares | | | 5.00 | % | | $ | 1,000.00 | | | $ | 1,019.05 | | | | 1.18 | % | | $ | 5.94 | |
Baron Opportunity Fund — R6 Shares | | | 5.00 | % | | $ | 1,000.00 | | | $ | 1,019.20 | | | | 1.15 | % | | $ | 5.79 | |
Baron Fifth Avenue Growth Fund — Retail Shares | | | 5.00 | % | | $ | 1,000.00 | | | $ | 1,019.40 | 4 | | | 1.11 | %2,5 | | $ | 5.59 | |
Baron Fifth Avenue Growth Fund — Institutional Shares | | | 5.00 | % | | $ | 1,000.00 | | | $ | 1,020.64 | 4 | | | 0.86 | %2,5 | | $ | 4.33 | |
Baron Fifth Avenue Growth Fund — R6 Shares | | | 5.00 | % | | $ | 1,000.00 | | | $ | 1,020.69 | 4 | | | 0.85 | %2,5 | | $ | 4.28 | |
Baron Discovery Fund — Retail Shares | | | 5.00 | % | | $ | 1,000.00 | | | $ | 1,018.20 | 4 | | | 1.35 | %5 | | $ | 6.79 | |
Baron Discovery Fund — Institutional Shares | | | 5.00 | % | | $ | 1,000.00 | | | $ | 1,019.45 | 4 | | | 1.10 | %5 | | $ | 5.54 | |
Baron Discovery Fund — R6 Shares | | | 5.00 | % | | $ | 1,000.00 | | | $ | 1,019.50 | 4 | | | 1.09 | %5 | | $ | 5.49 | |
| 1 | Assumes reinvestment of all dividends and capital gain distributions, if any. |
| 2 | Annualized expense ratio for Baron Fifth Avenue Growth Fund for the six months ended March 31, 2017, includes 1.10%, 0.85% and 0.84% for net operating expenses and 0.01%, 0.01% and 0.01% for interest expense for the Retail, Institutional and R6 Shares, respectively. |
| 3 | Expenses are equal to each Share Class’ respective annualized expense ratio multiplied by the average account value over the period, multiplied by the number of days in the most recent fiscal half-year, then divided by 365. |
| 4 | Ending account value assumes the return earned after waiver and would have been lower if a portion of the expenses had not been waived. |
| 5 | Annualized expense ratios are adjusted to reflect fee waiver. |
44
Go Paperless!
It’s fast, simple and a smart way to help the environment.
Enjoy the speed and convenience of receiving Fund documents electronically.
For more information, and to enroll today, go to www.baronfunds.com/edelivery.

767 Fifth Avenue, 49th Fl.
New York, NY 10153
1.800.99.BARON
212-583-2000
www.BaronFunds.com
MARCH 17
Item 2. Code of Ethics.
Not applicable.
Item 3. Audit Committee Financial Expert.
Not applicable.
Item 4. Principal Accountant Fees and Services.
Not applicable.
Item 5. Audit Committee of Listed Registrants.
Not applicable.
Item 6. Schedule of Investments.
Included herein under Item 1.
Item 7. Disclosure of Proxy Voting Policies and Procedures for Closed-End Management Investment Companies.
Not applicable.
Item 8. Portfolio Managers of Closed-End Management Investment Companies.
Not applicable.
Item 9. Purchases of Equity Securities by Closed-End Management Investment Company and Affiliated Purchasers.
Not applicable.
Item 10. Submission of Matters to a Vote of Security Holders.
Not applicable.
Item 11. Controls and Procedures.
(a) The Registrant’s principal executive officer and principal financial officer have concluded that the Registrant’s disclosure controls and procedures (as defined in Rule 30a-3(c) under the Investment Company Act of 1940 (the “1940 Act”)) are effective based on their evaluation of these controls and procedures as of a date within 90 days of the filing date of this report.
(b) There were no changes in the Registrant’s internal control over financial reporting (as defined in Rule 30a-3(d) under the 1940 Act) that occurred during the Registrant’s second fiscal quarter of the period covered by this report that have materially affected, or are reasonably likely to materially affect, the Registrant’s internal control over financial reporting.
Item 12. Exhibits.
(a)(1) Not applicable.
(a)(2) Certification of each of the principal executive officers and principal financial officers of the Registrant as required by Rule 30a-2 under the Act (17 CFR 270.30a-2) is attached hereto as a part of EX-99.CERT.
(b) Certification of each of the principal executive officers and principal financial officers of the Registrant as required by Section 906 of the Sarbanes-Oxley Act of 2002 is attached hereto as a part of EX-99.906CERT.
SIGNATURES
Pursuant to the requirements of the Securities Exchange Act of 1934 and the Investment Company Act of 1940, the registrant has duly caused this report to be signed on its behalf by the undersigned, thereunto duly authorized.
| | |
| BARON INVESTMENT FUNDS TRUST |
| |
| By: | | /s/ Ronald Baron |
| | Ronald Baron |
| | Chief Executive Officer |
|
| Date: May 26, 2017 |
Pursuant to the requirements of the Securities Exchange Act of 1934 and the Investment Company Act of 1940, this report has been signed below by the following persons on behalf of the registrant and in the capacities and on the dates indicated.
| | |
| By: | | /s/ Ronald Baron |
| | Ronald Baron |
| | Chief Executive Officer |
|
| Date: May 26, 2017 |
| |
| By: | | /s/ Peggy Wong |
| | Peggy Wong |
| | Treasurer and Chief Financial Officer |
|
| Date: May 26, 2017 |