| OMB APPROVAL | ||
| OMB Number: | 3235-0570 | |
| Expires: | August 31, 2020 | |
| Estimated average burden | ||
| Hours per response | 20.6 | |
UNITED STATES
SECURITIES AND EXCHANGE COMMISSION
Washington, D.C. 20549
FORMN-CSR
CERTIFIED SHAREHOLDER REPORT OF REGISTERED
MANAGEMENT INVESTMENT COMPANIES
Investment Company Act file number:811-5032
BARON INVESTMENT FUNDS TRUST f/k/a
BARON ASSET FUND
(Exact Name of Registrant as Specified in Charter)
767 Fifth Avenue, 49th Floor
New York, NY 10153
(Address of Principal Executive Offices) (Zip Code)
Patrick M. Patalino, General Counsel
c/o Baron Investment Funds Trust
767 Fifth Avenue, 49th Floor
New York, NY 10153
(Name and Address of Agent for Service)
(Registrant’s Telephone Number, including Area Code):212-583-2000
Date of fiscal year end: September 30
Date of reporting period: March 31, 2020
FormN-CSR is to be used by management investment companies to file reports with the Commission not later than 10 days after the transmission to stockholders of any report that is required to be transmitted to stockholders under Rule30e-1 under the Investment Company Act of 1940 (17CRF270.30e-1). The Commission may use the information provided on FormN-CSR in its regulatory, disclosure review, inspection, and policymaking roles.
A registrant is required to disclose the information specified by FormN-CSR, and the Commission will make this information public. A registrant is not required to respond to the collection of information contained in FormN-CSR unless the Form displays a currently valid Office of Management and Budget (“OMB”) control number. Please direct comments concerning the accuracy of the information collection burden estimate and suggestions for reducing the burden to Secretary, Securities and Exchange Commission, 450 5th Street, NW, Washington, D.C. 20549-0609. The OMB has reviewed this collection of information under the clearance requirements of 44 U.S.C. Section 3507.
Persons who are to respond to the collection of information contained in this form are not required to respond unless the form displays a currently valid OMB control number.
SEC 2569(5-07)
| Item 1. | Reports to Stockholders. |
Baron Asset Fund
Baron Growth Fund
Baron Small Cap Fund
Baron Opportunity Fund
Baron Fifth Avenue Growth Fund
Baron Discovery Fund
Baron Durable Advantage Fund
March 31, 2020
| Baron Asset Fund | ||||
| Ticker Symbols: | ||||
Retail Shares: BARAX Institutional Shares: BARIX R6 Shares: BARUX | ||||
| Performance | 2 | |||
| Top Ten Holdings | 3 | |||
| Sector Breakdown | 3 | |||
| Management’s Discussion of Fund Performance | 3 | |||
| Baron Growth Fund | ||||
| Ticker Symbols: | ||||
Retail Shares: BGRFX Institutional Shares: BGRIX R6 Shares: BGRUX | ||||
| Performance | 4 | |||
| Top Ten Holdings | 5 | |||
| Sector Breakdown | 5 | |||
| Management’s Discussion of Fund Performance | 5 | |||
| Baron Small Cap Fund | ||||
| Ticker Symbols: | ||||
Retail Shares: BSCFX Institutional Shares: BSFIX R6 Shares: BSCUX | ||||
| Performance | 6 | |||
| Top Ten Holdings | 7 | |||
| Sector Breakdown | 7 | |||
| Management’s Discussion of Fund Performance | 7 | |||
| Baron Opportunity Fund | ||||
| Ticker Symbols: | ||||
Retail Shares: BIOPX Institutional Shares: BIOIX R6 Shares: BIOUX | ||||
| Performance | 8 | |||
| Top Ten Holdings | 9 | |||
| Sector Breakdown | 9 | |||
| Management’s Discussion of Fund Performance | 9 | |||
| Baron Fifth Avenue Growth Fund | ||||
| Ticker Symbols: | ||||
Retail Shares: BFTHX Institutional Shares: BFTIX R6 Shares: BFTUX | ||||
| Performance | 10 | |||
| Top Ten Holdings | 11 | |||
| Sector Breakdown | 11 | |||
| Management’s Discussion of Fund Performance | 11 | |||
| Baron Discovery Fund | ||||
| Ticker Symbols: | ||||
Retail Shares: BDFFX Institutional Shares: BDFIX R6 Shares: BDFUX | ||||
| Performance | 12 | |||
| Top Ten Holdings | 13 | |||
| Sector Breakdown | 13 | |||
| Management’s Discussion of Fund Performance | 13 | |||
| Baron Durable Advantage Fund | ||||
| Ticker Symbols: | ||||
Retail Shares: BDAFX Institutional Shares: BDAIX R6 Shares: BDAUX | ||||
| Performance | 14 | |||
| Top Ten Holdings | 15 | |||
| Sector Breakdown | 15 | |||
| Management’s Discussion of Fund Performance | 15 | |||
| Financial Statements | ||||
| Statements of Net Assets | 16 | |||
| Statements of Assets and Liabilities | 28 | |||
| Statements of Operations | 30 | |||
| Statements of Changes in Net Assets | 32 | |||
| Notes to Financial Statements | 35 | |||
| Financial Highlights | 44 | |||
| Fund Expenses | 51 |
Beginning on January 1, 2021, as permitted by regulations adopted by the U.S. Securities and Exchange Commission, paper copies of the Funds’ shareholder reports like this one will no longer be sent by mail, unless you specifically request paper copies of the reports from Baron Funds (“Baron”) or from your financial intermediary, such as a broker-dealer or bank. Instead, the reports will be made available on the Baron website, and you will be notified by mail each time a report is posted and provided with a website link to access the report.
If you already elected to receive shareholder reports electronically, you will not be affected by this change and you need not take any action. You may elect to receive shareholder reports and other communications from Baron or your financial intermediary electronically by contacting your financial intermediary or going toicsdelivery.com/baronfunds.
You may elect to receive all future reports in paper free of charge. You can inform Baron or your financial intermediary that you wish to continue receiving paper copies of your shareholder reports by following the instructions included on the envelope or slip inserted with this disclosure. Your election to receive reports in paper will apply to all funds held with Baron or your financial intermediary.
DEAR BARON INVESTMENT FUNDS SHAREHOLDER:
In this report, you will find unaudited financial statements for Baron Asset Fund, Baron Growth Fund, Baron Small Cap Fund, Baron Opportunity Fund, Baron Fifth Avenue Growth Fund, Baron Discovery Fund, and Baron Durable Advantage Fund (the “Funds”) for the six months ended March 31, 2020. The U.S. Securities and Exchange Commission (the “SEC”) requires mutual funds to furnish these statements semi-annually to their shareholders. We hope you find these statements informative and useful.
We thank you for choosing to join us as fellow shareholders in Baron Funds. We will continue to work hard to justify your confidence.
Sincerely,
 |
|  | ||
Ronald Baron Chief Executive Officer May 20, 2020 | Linda S. Martinson Chairman, President and Chief Operating Officer May 20, 2020 | Peggy Wong Treasurer and Chief Financial Officer May 20, 2020 |

This Semi-Annual Financial Report is for the Baron Investment Funds Trust, which currently has seven series: Baron Asset Fund, Baron Growth Fund, Baron Small Cap Fund, Baron Opportunity Fund, Baron Fifth Avenue Growth Fund, Baron Discovery Fund, and Baron Durable Advantage Fund. If you are interested in Baron Select Funds, which contains the Baron Partners Fund, Baron Focused Growth Fund, Baron International Growth Fund, Baron Real Estate Fund, Baron Emerging Markets Fund, Baron Global Advantage Fund, Baron Real Estate Income Fund, Baron WealthBuilder Fund, Baron Health Care Fund, and Baron FinTech Fund series, please visit the Funds’ website at www.BaronFunds.com or contact us at1-800-99BARON.
The Funds’ Proxy Voting Policy is available without charge and can be found on the Funds’ website at www.BaronFunds.com, by clicking on the “Legal Notices” link at the bottom left corner of the homepage or by calling1-800-99BARON and on the SEC’s website at www.sec.gov. The Funds’ most current proxy voting record, Form N-PX, is also available on the Funds’ website and on the SEC’s website.
The Funds file their complete schedules of portfolio holdings with the SEC for the first and third quarters of each fiscal year as an exhibit to their reports on Form N-PORT. The Funds’ Form N-PORT reports are available on the SEC’s website at www.sec.gov. Schedules of portfolio holdings current to the most recent quarter are also available on the Funds’ website.
Some of the comments contained in this report are based on current management expectations and are considered “forward-looking statements.” Actual future results, however, may prove to be different from our expectations. You can identify forward-looking statements by words such as “estimate,” “may,” “expect,” “should,” “could,” “believe,” “plan” and other similar terms. We cannot promise future returns and our opinions are a reflection of our best judgment at the time this report is compiled.
The views expressed in this report reflect those of BAMCO, Inc. (“BAMCO” or the “Adviser”) only through the end of the period stated in this report. The views are not intended as recommendations or investment advice to any person reading this report and are subject to change at any time without notice based on market and other conditions.
Past performance is no guarantee of future results. The investment return and principal value of an investment will fluctuate; an investor’s shares, when redeemed, may be worth more or less than their original cost. For more complete information about Baron Funds, including charges and expenses, call, write or go to www.BaronFunds.com for a prospectus or summary prospectus. Read them carefully before you invest or send money. This report is not authorized for use as an offer of sale or a solicitation of an offer to buy shares of the Funds, unless accompanied or preceded by the Funds’ current prospectus or summary prospectus.

| Baron Asset Fund(Unaudited) | March 31, 2020 |
COMPARISONOFTHECHANGEIN VALUEOF $10,000INVESTMENTIN BARON ASSET FUND (RETAIL SHARES)
INRELATIONTOTHE RUSSELL MIDCAP GROWTH INDEXANDTHE S&P 500 INDEX

| AVERAGE ANNUAL TOTAL RETURNSFORTHEPERIODSENDED MARCH 31, 2020 |
| |||||||||||||||||||||||
| Six Months* | One Year | Three Years | Five Years | Ten Years | Since Inception (June 12, 1987) | |||||||||||||||||||
Baron Asset Fund — Retail Shares1,2 | (11.12)% | (4.73)% | 9.47% | 8.18% | 11.53% | 11.07% | ||||||||||||||||||
Baron Asset Fund — Institutional Shares1,2,4 | (11.01)% | (4.48)% | 9.76% | 8.47% | 11.83% | 11.17% | ||||||||||||||||||
Baron Asset Fund — R6 Shares1,2,4 | (11.01)% | (4.49)% | 9.76% | 8.47% | 11.83% | 11.17% | ||||||||||||||||||
Russell Midcap Growth Index1 | (13.50)% | (9.45)% | 6.53% | 5.61% | 10.89% | 9.52% | 3 | |||||||||||||||||
S&P 500 Index1 | (12.31)% | (6.98)% | 5.10% | 6.73% | 10.53% | 9.17% | ||||||||||||||||||
| * | Not Annualized. |
| 1 | The indexes are unmanaged. The index performance is not Fund performance; one cannot invest directly into an index. The Russell MidcapTM Growth Index measures the performance of medium-sized U.S. companies that are classified as growth and the S&P 500 Index of 500 widely held large cap U.S. companies. The indexes and the Fund are with dividends reinvested, which positively impact the performance results. |
| 2 | Past performance is not predictive of future performance. The performance data does not reflect the deduction of taxes that a shareholder would pay on Fund distributions or redemption of Fund shares. The Fund’s transfer agency expenses may be reduced by expense offsets from an unaffiliated transfer agent, without which performance would have been lower. |
| 3 | For the period June 30, 1987 to March 31, 2020. |
| 4 | Performance for the Institutional Shares prior to May 29, 2009 is based on the performance of the Retail Shares. Performance for the R6 Shares prior to January 29, 2016 is based on the performance of the Institutional Shares, and prior to May 29, 2009 is based on the Retail Shares. The Retail Shares have a distribution fee, but Institutional Shares and R6 Shares do not. If the annual returns for the Institutional Shares and R6 Shares prior to May 29, 2009 did not reflect this fee, the returns would be higher. |
2
| March 31, 2020 (Unaudited) | Baron Asset Fund |
TOP TEN HOLDINGSASOF MARCH 31, 2020
| Percent of Net Assets | ||||
IDEXX Laboratories, Inc. | 6.2% | |||
Verisk Analytics, Inc. | 4.8% | |||
Gartner, Inc. | 4.3% | |||
Mettler-Toledo International, Inc. | 4.2% | |||
ANSYS, Inc. | 3.7% | |||
SBA Communications Corp. | 3.5% | |||
CoStar Group, Inc. | 3.4% | |||
Verisign, Inc. | 3.4% | |||
Guidewire Software, Inc. | 3.0% | |||
FactSet Research Systems, Inc. | 2.7% | |||
| 39.2% | ||||
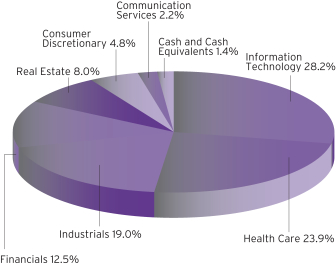
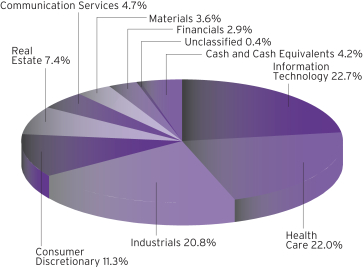
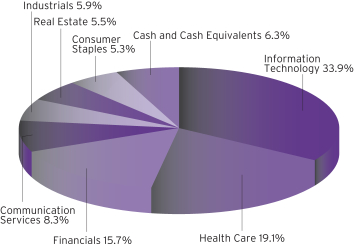
SECTOR BREAKDOWNASOF MARCH 31, 2020†
(as a percentage of net assets)
MANAGEMENT’S DISCUSSIONOF FUND PERFORMANCE
For the six-month period ended March 31, 2020, Baron Asset Fund1 declined 11.12%, while the Russell Midcap Growth Index declined 13.50% and the S&P 500 Index declined 12.31%.
Baron Asset Fund invests primarily inmedium-sized growth companies for the long term, using a value-oriented purchase discipline. The Fund purchases companies that we believe have sustainable competitive advantages, strong financial characteristics, and exceptional management; and operate in industries with favorable growth characteristics.
U.S. equities rose throughout most of thesix-month period, achievingall-time highs inmid-February before falling sharply as the spread of theCOVID-19 virus escalated outside of China, raising concerns about global health risks and impacts on global supply chains and economies. The situation was made worse by an escalating oil price war between Russia and Saudi Arabia, which sent oil prices tumbling more than 20% in early March. Despite the Federal Reserve’s drastic actions and Washington’s massive stimulus plan to counter the Coronavirus-induced economic slowdown, stock prices remained under pressure as the number of reported cases continued to rise globally. It was a precipitous and alarming end to the historic11-year bull market.
The Communication Services sector was a modest contributor in the period. Information Technology, Industrials, and Consumer Discretionary were the top detracting sectors.
DexCom, Inc. was the top contributor during the period. The company sells continuous blood glucose monitoring devices for patients with diabetes. The stock rose after DexCom reported significantly higher sales and profit driven by strong demand for the company’s G6 device. Although we expect DexCom’s growth to experience some disruption from theCOVID-19 pandemic, we continue to believe the company benefits from a long runway for growth.
Gartner, Inc., a provider of syndicated research, was the top detractor. Despite robust forward-looking metrics in the company’s traditional research business, shares fell on investor concerns that Gartner’s destination events business, which represents approximately 11% of revenue, will be disproportionately impacted by theCOVID-19 pandemic. We believe this headwind is transitory and the company’s core research business should remain resilient despite elevated uncertainty.
Although we are, of course, closely following the unprecedented social, political, and economic effects stemming from theCOVID-19 pandemic, we are not making meaningful changes to the portfolio based on them. Instead, we continue to follow our tried and true approach, with an emphasis on ensuring that businesses in our portfolio have sufficient financial flexibility and balance sheet strength to weather these unprecedented times. The most recent periods of extreme uncertainty and disruption in the equity markets prior to the current one — the 2008 financial crisis and the aftermath of 9/11 — proved to be attractive times to make long-term investments in high-quality,mid-sized growth stocks. We are optimistic that this current period will ultimately provide similar upside for our portfolio.
| † | Sector levels are provided from the Global Industry Classification Standard (“GICS”), developed and exclusively owned by MSCI, Inc. and Standard & Poor’s Financial Services LLC, unless otherwise stated that they have been reclassified or classified by the Adviser. All GICS data is provided “as is” with no warranties. |
| 1 | Performance information reflects results of the Retail Shares. |
3
| Baron Growth Fund(Unaudited) | March 31, 2020 |
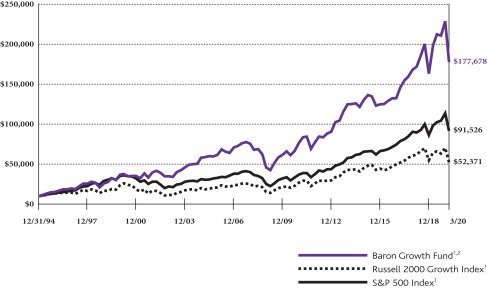
COMPARISONOFTHECHANGEIN VALUEOF $10,000INVESTMENTIN BARON GROWTH FUND (RETAIL SHARES)
INRELATIONTOTHE RUSSELL 2000 GROWTH INDEXANDTHE S&P 500 INDEX
| AVERAGE ANNUAL TOTAL RETURNSFORTHEPERIODSENDED MARCH 31, 2020 |
| |||||||||||||||||||||||
| Six Months* | One Year | Three Years | Five Years | Ten Years | Since Inception (December 31, 1994) | |||||||||||||||||||
Baron Growth Fund — Retail Shares1,2 | (15.69)% | (10.51)% | 6.74% | 5.40% | 10.43% | 12.07% | ||||||||||||||||||
Baron Growth Fund — Institutional Shares1,2,3 | (15.58)% | (10.27)% | 7.02% | 5.67% | 10.71% | 12.19% | ||||||||||||||||||
Baron Growth Fund — R6 Shares1,2,3 | (15.58)% | (10.27)% | 7.02% | 5.67% | 10.71% | 12.19% | ||||||||||||||||||
Russell 2000 Growth Index1 | (17.31)% | (18.58)% | 0.10% | 1.70% | 8.89% | 6.78% | ||||||||||||||||||
S&P 500 Index1 | (12.31)% | (6.98)% | 5.10% | 6.73% | 10.53% | 9.16% | ||||||||||||||||||
| * | Not Annualized. |
| 1 | The indexes are unmanaged. The index performance is not Fund performance; one cannot invest directly into an index. The Russell 2000® Growth Index measures the performance of small-sized U.S. companies that are classified as growth and the S&P 500 Index of 500 widely held large cap U.S. companies. The indexes and the Fund are with dividends reinvested, which positively impact the performance results. |
| 2 | Past performance is not predictive of future performance. The performance data does not reflect the deduction of taxes that a shareholder would pay on Fund distributions or redemption of Fund shares. The Fund’s transfer agency expenses may be reduced by expense offsets from an unaffiliated transfer agent, without which performance would have been lower. |
| 3 | Performance for the Institutional Shares prior to May 29, 2009 is based on the performance of the Retail Shares. Performance for the R6 Shares prior to January 29, 2016 is based on the performance of the Institutional Shares, and prior to May 29, 2009 is based on the Retail Shares. The Retail Shares have a distribution fee, but Institutional Shares and R6 Shares do not. If the annual returns for the Institutional Shares and R6 Shares prior to May 29, 2009 did not reflect this fee, the returns would be higher. |
4
| March 31, 2020 (Unaudited) | Baron Growth Fund |
TOP TEN HOLDINGSASOF MARCH 31, 2020
| Percent of Net Assets | ||||
MSCI, Inc. | 9.5% | |||
CoStar Group, Inc. | 8.0% | |||
ANSYS, Inc. | 6.4% | |||
FactSet Research Systems, Inc. | 6.0% | |||
Vail Resorts, Inc. | 5.5% | |||
Arch Capital Group Ltd. | 5.0% | |||
IDEXX Laboratories, Inc. | 4.5% | |||
Iridium Communications Inc. | 3.6% | |||
Gartner, Inc. | 3.4% | |||
Choice Hotels International, Inc. | 3.4% | |||
| 55.3% | ||||
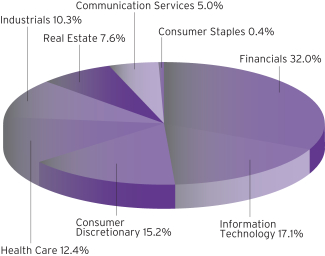
SECTOR BREAKDOWNASOF MARCH 31, 2020†
(as a percentage of total investments)
MANAGEMENT’S DISCUSSIONOF FUND PERFORMANCE
For thesix-month period ended March 31, 2020, Baron Growth Fund1 declined 15.69%, while the Russell 2000 Growth Index lost 17.31% and the S&P 500 Index declined 12.31%.
Baron Growth Fund invests primarily insmall-sized U.S. growth companies for the long term. Through independent research, we utilize an investment approach that we believe allows us to look at a business’s fundamental characteristics and beyond the current market environment. We invest based on the potential profitability of a business at what we believe are attractive valuations.
U.S. equities rose throughout most of thesix-month period, achievingall-time highs inmid-February before falling sharply as the spread of theCOVID-19 virus escalated outside of China, raising concerns about global health risks and impacts on global supply chains and economies. The situation was made worse by an escalating oil price war between Russia and Saudi Arabia, which sent oil prices tumbling more than 20% in early March. Despite the Federal Reserve’s drastic actions and Washington’s massive stimulus plan to counter the Coronavirus-induced economic slowdown, stock prices remained under pressure as the number of reported cases continued to rise globally. It was a precipitous and alarming end to the historic11-year bull market.
Health Care investments contributed modestly during the period. Consumer Discretionary, Financials, and Information Technology detracted the most.
MSCI, Inc., a leading provider of investment decision support tools, was the top contributor. Shares increased on strong earnings reports. MSCI also benefited from its reputation as a durable “all weather franchise” during the disruption created by theCOVID-19 pandemic. We retain long-term conviction as the company owns strong franchises and, in our view, remains well positioned to benefit from a number of prominent tailwinds in the investment community.
Arch Capital Group Ltd., a specialty insurance company based in Bermuda, detracted the most. Despite reporting strong earnings, the stock declined late in the period due to concerns that theCOVID-19 pandemic will lead to an increase in claims and cancellations of business interruption and event cancellation policies. Although a recession could also cause higher losses for the economically sensitive mortgage insurance business, we continue to own the stock due to Arch’s strong management team and underwriting discipline.
As long-term, fundamental,bottom-up investors, our goal has always been to deliver superior returns over time with less risk. In unusual or unprecedented times such as now, we do research to understand what is happening to our companies, how management teams are adapting, and what the financial implications may be. Our businesses share a set of common attributes: large adjustable markets; favorable secular trends; high and growing barriers to entry; recurring and/or highly visible revenue; high margins; strong free cash flow conversion; andbest-in-class management teams. We think these attributes, which are valuable in good times, are even more important in challenging times.
| † | Sector levels are provided from the Global Industry Classification Standard (“GICS”), developed and exclusively owned by MSCI, Inc. and Standard & Poor’s Financial Services LLC, unless otherwise stated that they have been reclassified or classified by the Adviser. All GICS data is provided “as is” with no warranties. |
| 1 | Performance information reflects results of the Retail Shares. |
5
| Baron Small Cap Fund(Unaudited) | March 31, 2020 |
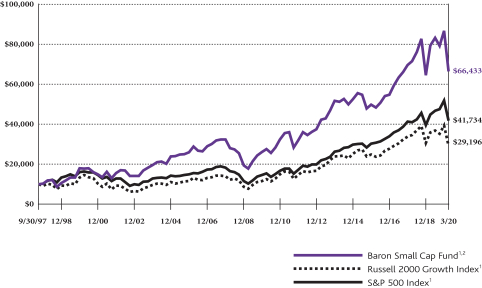
COMPARISONOFTHECHANGEIN VALUEOF $10,000INVESTMENTIN BARON SMALL CAP FUND (RETAIL SHARES)
IN RELATIONTOTHE RUSSELL 2000 GROWTH INDEXANDTHE S&P 500 INDEX
| AVERAGE ANNUAL TOTAL RETURNSFORTHEPERIODSENDED MARCH 31, 2020 |
| |||||||||||||||||||||||
| Six Months* | One Year | Three Years | Five Years | Ten Years | Since Inception (September 30, 1997) | |||||||||||||||||||
Baron Small Cap Fund — Retail Shares1,2 | (16.18)% | (16.24)% | 3.81% | 3.66% | 9.19% | 8.78% | ||||||||||||||||||
Baron Small Cap Fund — Institutional Shares1,2,3 | (16.08)% | (16.05)% | 4.08% | 3.93% | 9.47% | 8.91% | ||||||||||||||||||
Baron Small Cap Fund — R6 Shares1,2,3 | (16.09)% | (16.06)% | 4.07% | 3.92% | 9.47% | 8.91% | ||||||||||||||||||
Russell 2000 Growth Index1 | (17.31)% | (18.58)% | 0.10% | 1.70% | 8.89% | 4.88% | ||||||||||||||||||
S&P 500 Index1 | (12.31)% | (6.98)% | 5.10% | 6.73% | 10.53% | 6.56% | ||||||||||||||||||
| * | Not Annualized. |
| 1 | The indexes are unmanaged. The index performance is not Fund performance; one cannot invest directly into an index. The Russell 2000® Growth Index measures the performance of small-sized U.S. companies that are classified as growth and the S&P 500 Index of 500 widely held large cap U.S. companies. The indexes and the Fund are with dividends reinvested, which positively impact the performance results. |
| 2 | Past performance is not predictive of future performance. The performance data does not reflect the deduction of taxes that a shareholder would pay on Fund distributions or redemption of Fund shares. The Fund’s transfer agency expenses may be reduced by expense offsets from an unaffiliated transfer agent, without which performance would have been lower. |
| 3 | Performance for the Institutional Shares prior to May 29, 2009 is based on the performance of the Retail Shares. Performance for the R6 Shares prior to January 29, 2016 is based on the performance of the Institutional Shares, and prior to May 29, 2009 is based on the Retail Shares. The Retail Shares have a distribution fee, but Institutional Shares and R6 Shares do not. If the annual returns for the Institutional Shares and R6 Shares prior to May 29, 2009 did not reflect this fee, the returns would be higher. |
6
| March 31, 2020 (Unaudited) | Baron Small Cap Fund |
TOP TEN HOLDINGSASOF MARCH 31, 2020
| Percent of Net Assets | ||||
SBA Communications Corp. | 4.2% | |||
Teladoc Health, Inc. | 4.2% | |||
Guidewire Software, Inc. | 3.9% | |||
Gartner, Inc. | 3.3% | |||
ICON Plc | 3.1% | |||
Americold Realty Trust | 2.9% | |||
Clarivate Analytics Plc | 2.7% | |||
SiteOne Landscape Supply, Inc. | 2.7% | |||
DexCom, Inc. | 2.7% | |||
IDEXX Laboratories, Inc. | 2.6% | |||
| 32.3% | ||||
SECTOR BREAKDOWNASOF MARCH 31, 2020†
(as a percentage of net assets)
MANAGEMENT’S DISCUSSIONOF FUND PERFORMANCE
For thesix-month period ended March 31, 2020, Baron Small Cap Fund1 declined 16.18%, while the Russell 2000 Growth Index declined 17.31% and the S&P 500 Index declined 12.31%.
Baron Small Cap Fund invests primarily insmall-cap growth companies for the long term. The Fund invests in what we believe arewell-runsmall-cap growth businesses that can be purchased at prices that represent a significant discount to our assessment of future value.
U.S. equities rose throughout most of thesix-month period, achievingall-time highs inmid-February before falling sharply as the spread of theCOVID-19 virus escalated outside of China, raising concerns about global health risks and impacts on global supply chains and economies. The situation was made worse by an escalating oil price war between Russia and Saudi Arabia, which sent oil prices tumbling more than 20% in early March. Despite the Federal Reserve’s drastic actions and Washington’s massive stimulus plan to counter the Coronavirus-induced economic slowdown, stock prices remained under pressure as the number of reported cases continued to rise globally. It was a precipitous and alarming end to the historic11-year bull market.
Holdings in the Health Care and Real Estate sectors contributed. Consumer Discretionary, Information Technology, and Industrials detracted the most.
Teladoc Health Inc., the U.S.’s leading provider of telehealth services, was the top contributor after shares soared due to the COVID-19 outbreak. Telehealth is perfectly suited as an initial patient touchpoint in a time of social distancing and growing concerns of overwhelming the health care system. Call volumes have spiked, reimbursement for telehealth has been widely expanded, and restrictions on MD cross-state licensure have been lifted to expand the pool of available doctors. We believe the crisis has accelerated the adoption and cemented the use of telehealth.
Floor & Decor Holdings Inc., a hard-surface flooring retailer, detracted the most. Shares fell after the company closed all stores in March due to theCOVID-19 pandemic. Although online orders are still being accepted, we expect store closures and weaker end-demand to negatively impact 2020 results. We believe Floor & Decor is a differentiated retail concept with a big long-term opportunity for store growth (120 stores today vs. 400 target), and expect the company to emerge from this crisis stronger and in a better position to open stores and gain market share in the long term.
As of this writing, we are seeing cautious optimism from early signs that theCOVID-19 spread across the U.S. may be slowing and hope that the government’s resolve and response to carry its citizens and businesses during the shutdown would succeed. While we are concerned that it will not be so easy to quickly reopen the economy, that substantial damage will be done the longer the economy stays shut, and that a robust recovery is unlikely, we believe that, eventually, this will pass. We believe small caps are set up to shine when the equity markets recover, as usually is the case. At the bottom, bearishness is extreme and anxiety high, which is a good time to buy. We think investors who can stomach the uncertainty and stay invested will benefit in the long run.
| † | Sector levels are provided from the Global Industry Classification Standard (“GICS”), developed and exclusively owned by MSCI, Inc. and Standard & Poor’s Financial Services LLC, unless otherwise stated that they have been reclassified or classified by the Adviser. All GICS data is provided “as is” with no warranties. |
| 1 | Performance information reflects results of the Retail Shares. |
7
| Baron Opportunity Fund(Unaudited) | March 31, 2020 |
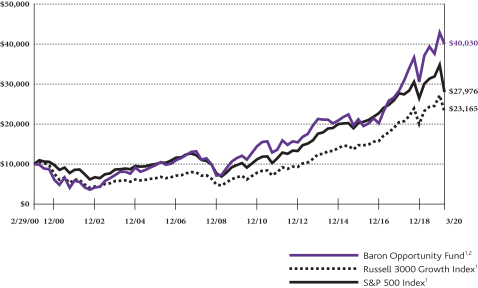
COMPARISONOFTHECHANGEIN VALUEOF $10,000INVESTMENTIN BARON OPPORTUNITY FUND† (RETAIL SHARES)
INRELATIONTOTHE RUSSELL 3000 GROWTH INDEXANDTHE S&P 500 INDEX
| AVERAGE ANNUAL TOTAL RETURNSFORTHEPERIODSENDED MARCH 31, 2020 |
| |||||||||||||||||||||||
| Six Months* | One Year | Three Years | Five Years | Ten Years | Since Inception (February 29, 2000) | |||||||||||||||||||
Baron Opportunity Fund — Retail Shares1,2 | 6.47% | 7.82% | 19.98% | 12.95% | 12.71% | 7.15% | ||||||||||||||||||
Baron Opportunity Fund — Institutional Shares1,2,3 | 6.67% | 8.11% | 20.30% | 13.26% | 13.00% | 7.31% | ||||||||||||||||||
Baron Opportunity Fund — R6 Shares1,2,3 | 6.66% | 8.15% | 20.32% | 13.28% | 13.02% | 7.31% | ||||||||||||||||||
Russell 3000 Growth Index1 | (5.77)% | (0.44)% | 10.54% | 9.74% | 12.68% | 4.27% | ||||||||||||||||||
S&P 500 Index1 | (12.31)% | (6.98)% | 5.10% | 6.73% | 10.53% | 5.26% | ||||||||||||||||||
| * | Not Annualized. |
| † | The Fund’s 1, 3, 5 and 10-year historical performance was impacted by gains from IPOs and/or secondary offerings, and there is no guarantee that these results can be repeated or that the Fund’s level of participation in IPOs and secondary offerings will be the same in the future. |
| 1 | The indexes are unmanaged. The index performance is not Fund performance; one cannot invest directly into an index. The Russell 3000® Growth Index measures the performance of those companies classified as growth among the largest 3,000 U.S. companies, and the S&P 500 Index of 500 widely held large cap U.S. companies. The indexes and the Fund are with dividends reinvested, which positively impact the performance results. |
| 2 | Past performance is not predictive of future performance. The performance data does not reflect the deduction of taxes that a shareholder would pay on Fund distributions or redemption of Fund shares. The Adviser reimburses certain Fund expenses pursuant to a contract expiring on August 29, 2030, unless renewed for another 11-year term and the Fund’s transfer agency expenses may be reduced by expense offsets from an unaffiliated transfer agent, without which performance would have been lower. |
| 3 | Performance for the Institutional Shares prior to May 29, 2009 is based on the performance of the Retail Shares. Performance for the R6 Shares prior to August 31, 2016 is based on the performance of the Institutional Shares, and prior to May 29, 2009 is based on the Retail Shares. The Retail Shares have a distribution fee, but Institutional Shares and R6 Shares do not. If the annual returns for the Institutional Shares and R6 Shares prior to May 29, 2009 did not reflect this fee, the returns would be higher. |
8
| March 31, 2020 (Unaudited) | Baron Opportunity Fund |
TOP TEN HOLDINGSASOF MARCH 31, 2020
| Percent of Net Assets | ||||
Microsoft Corporation | 7.6% | |||
Amazon.com, Inc. | 6.7% | |||
Tesla, Inc. | 4.9% | |||
Alphabet Inc. | 4.2% | |||
Guidewire Software, Inc. | 2.7% | |||
Mellanox Technologies Ltd. | 2.6% | |||
Alibaba Group Holding Limited | 2.3% | |||
CoStar Group, Inc. | 2.3% | |||
Adobe Inc. | 2.1% | |||
Gartner, Inc. | 2.0% | |||
| 37.4% | ||||
SECTOR BREAKDOWNASOF MARCH 31, 2020†
(as a percentage of net assets)
MANAGEMENT’S DISCUSSIONOF FUND PERFORMANCE
For thesix-month period ended March 31, 2020, Baron Opportunity Fund1 increased 6.47%, while the Russell 3000 Growth Index declined 5.77% and the S&P 500 Index declined 12.31%.
Baron Opportunity Fund invests primarily in U.S. growth companies that we believe are driving or benefiting from innovation, through development of pioneering, transformative, or technologically advanced products and services. The Fund invests
in high growth businesses of any market capitalization, selected for their capital appreciation potential.
U.S. equities rose throughout most of thesix-month period, achievingall-time highs inmid-February before falling sharply as the spread of theCOVID-19 virus escalated outside of China, raising concerns about global health risks and impacts on global supply chains and economies. The situation was made worse by an escalating oil price war between Russia and Saudi Arabia, which sent oil prices tumbling more than 20% in early March. Despite the Federal Reserve’s drastic actions and Washington’s massive stimulus plan to counter the Coronavirus-induced economic slowdown, stock prices remained under pressure as the number of reported cases continued to rise globally. It was a precipitous and alarming end to the historic11-year bull market.
Investments in Consumer Discretionary, Health Care, and Information Technology contributed the most during the period. Financials, Industrials, and Communication Services detracted.
Tesla, Inc., which makes electric vehicles, solar products, and energy storage solutions, contributed the most. DespiteCOVID-19 disruptions, shares ended the period up significantly on strong results, including robust demand trends, market share growth, and improved gross margins, cost controls, and cash generation, leading to increased revenue and free cash flow. Tesla’s China factory project is moving ahead of schedule, and investors are anticipating that the new Model Y will positively impact the company’s P&L.
Gartner, Inc., a provider of syndicated research, was the top detractor. Despite robust forward-looking metrics in the company’s traditional research business, shares fell on investor concerns that Gartner’s destination events business, which represents approximately 11% of revenue, will be disproportionately impacted by theCOVID-19 pandemic. We believe this headwind is transitory and the company’s core research business should remain resilient despite elevated uncertainty.
This is a time of significant unknowns. However, we don’t have to answer the unanswerable to deliver strong investment returns. Rather, we are focusing our research, analysis and investment decisions, as we always do, on what we can know and what matters. This means identifying the powerful, durable secular growth trends that we believe will drive economic growth regardless of short-term economic cycles or stock market gyrations as well as the companies with sustainable competitive advantages, profitable business models, and long-term-oriented managers driving or riding those trends. We establish and monitor short- and long-term price targets for all our holdings and target companies, using internal projections of revenues, earnings, and free cash flow and appropriate multiples, and we buy or add to our stakes in these companies at prices where we believe we can deliver substantial returns.
| † | Sector levels are provided from the Global Industry Classification Standard (“GICS”), developed and exclusively owned by MSCI, Inc. and Standard & Poor’s Financial Services LLC, unless otherwise stated that they have been reclassified or classified by the Adviser. All GICS data is provided “as is” with no warranties. |
| 1 | Performance information reflects results of the Retail Shares. |
9
| Baron Fifth Avenue Growth Fund(Unaudited) | March 31, 2020 |
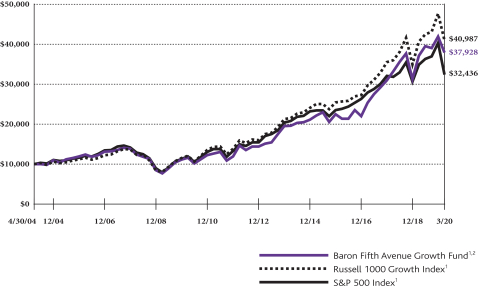
COMPARISONOFTHECHANGEIN VALUEOF $10,000INVESTMENTIN BARON FIFTH AVENUE GROWTH FUND†
(RETAIL SHARES)INRELATIONTOTHE RUSSELL 1000 GROWTH INDEXANDTHE S&P 500 INDEX
| AVERAGE ANNUAL TOTAL RETURNSFORTHEPERIODSENDED MARCH 31, 2020 |
| |||||||||||||||||||||||
| Six Months* | One Year | Three Years | Five Years | Ten Years | Since Inception (April 30, 2004) | |||||||||||||||||||
Baron Fifth Avenue Growth Fund — Retail Shares1,2 | (2.80)% | 2.10% | 14.38% | 11.32% | 12.60% | 8.74% | ||||||||||||||||||
Baron Fifth Avenue Growth Fund — Institutional Shares1,2,3 | (2.68)% | 2.35% | 14.67% | 11.61% | 12.88% | 8.92% | ||||||||||||||||||
Baron Fifth Avenue Growth Fund — R6 Shares1,2,3 | (2.67)% | 2.35% | 14.67% | 11.62% | 12.89% | 8.92% | ||||||||||||||||||
Russell 1000 Growth Index1 | (4.98)% | 0.91% | 11.32% | 10.36% | 12.97% | 9.27% | ||||||||||||||||||
S&P 500 Index1 | (12.31)% | (6.98)% | 5.10% | 6.73% | 10.53% | 7.67% | ||||||||||||||||||
| * | Not Annualized. |
| † | The Fund’s 1-year historical performance was impacted by gains from IPOs and/or secondary offerings, and there is no guarantee that these results can be repeated or that the Fund’s level of participation in IPOs and secondary offerings will be the same in the future. |
| 1 | The indexes are unmanaged. The index performance is not Fund performance; one cannot invest directly into an index. The Russell 1000® Growth Index measures the performance of large-sized U.S. companies that are classified as growth and the S&P 500 Index of 500 widely held large cap U.S. companies. The indexes and the Fund are with dividends reinvested, which positively impact the performance results. |
| 2 | Past performance is not predictive of future performance. The performance data does not reflect the deduction of taxes that a shareholder would pay on Fund distributions or redemption of Fund shares. The Adviser reimburses certain Fund expenses pursuant to a contract expiring on August 29, 2030, unless renewed for another 11-year term and the Fund’s transfer agency expenses may be reduced by expense offsets from an unaffiliated transfer agent, without which performance would have been lower. |
| 3 | Performance for the Institutional Shares prior to May 29, 2009 is based on the performance of the Retail Shares. Performance for the R6 Shares prior to January 29, 2016 is based on the performance of the Institutional Shares, and prior to May 29, 2009 is based on the Retail Shares. The Retail Shares have a distribution fee, but Institutional Shares and R6 Shares do not. If the annual returns for the Institutional Shares and R6 Shares prior to May 29, 2009 did not reflect this fee, the returns would be higher. |
10
| March 31, 2020 (Unaudited) | Baron Fifth Avenue Growth Fund |
TOP TEN HOLDINGSASOF MARCH 31, 2020
| Percent of Net Assets | ||||
Amazon.com, Inc. | 11.7% | |||
Alibaba Group Holding Limited | 6.1% | |||
Mastercard Incorporated | 5.5% | |||
Veeva Systems Inc. | 5.3% | |||
Alphabet Inc. | 4.8% | |||
Visa, Inc. | 4.7% | |||
Illumina, Inc. | 4.2% | |||
Equinix, Inc. | 4.2% | |||
Intuitive Surgical, Inc. | 4.1% | |||
Fidelity National Information Services, Inc. | 3.7% | |||
| 54.3% | ||||
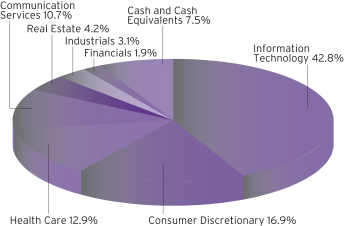
SECTOR BREAKDOWNASOF MARCH 31, 2020†
(as a percentage of net assets)
MANAGEMENT’S DISCUSSIONOF FUND PERFORMANCE
For thesix-month period ended March 31, 2020, Baron Fifth Avenue Growth Fund1 declined 2.80%, while the Russell 1000 Growth Index declined 4.98% and the S&P 500 Index declined 12.31%.
Baron Fifth Avenue Growth Fund focuses on identifying and investing in what we believe are unique companies with sustainable competitive advantages that have the ability to redeploy capital at
high rates of return. The portfolio is constructed on abottom-up basis, with the quality of ideas and conviction level the most important determinants of the size of each investment. We expect our highest conviction businesses to have meaningful weight in the portfolio. Sector weightings are incidental to portfolio construction, and exposure to any sector is a result of stock selection.
U.S. equities rose throughout most of thesix-month period, achievingall-time highs inmid-February before falling sharply as the spread of theCOVID-19 virus escalated outside of China, raising concerns about global health risks and impacts on global supply chains and economies. The situation was made worse by an escalating oil price war between Russia and Saudi Arabia, which sent oil prices tumbling more than 20% in early March. Despite the Federal Reserve’s drastic actions and Washington’s massive stimulus plan to counter the Coronavirus-induced economic slowdown, stock prices remained under pressure as the number of reported cases continued to rise globally. It was a precipitous and alarming end to the historic11-year bull market.
Consumer Discretionary and Real Estate investments contributed in the period. Information Technology, Health Care, and Financials detracted the most.
Amazon.com, Inc., the world’s largest retailer and cloud services provider, was the top contributor. Shares rose on strong quarter revenue and profitability metrics as well as resilience during theCOVID-19 pandemic. Whilee-commerce penetration is rising rapidly and Amazon continues to grow its addressable market by entering new verticals, we believe the more material driver of growth is Amazon Web Services (AWS). AWS is the leader in the vast and growing cloud infrastructure market, and we expect this business to compete in application software as well.
The Fund’s largest detractor during the period, PagSeguro Digital Ltd., is a payment processor and merchant acquirer in Brazil targeting small- andmicro-sized merchants with no formal banking relationship. Shares declined on expected softness in merchant sales due to theCOVID-19 pandemic, resulting in a decline in revenues and, to a lesser extent, a rise in delinquencies in PagSeguro’s lending business. We believe earnings will be impacted less than investors anticipate due to a high proportion of variable costs, and we expect these impacts to be temporary.
Every day we live and invest in a world full of uncertainty. The challenges we face are real and serious, with clearly uncertain outcomes. History would suggest that most will prove passing or manageable. The business of capital allocation is the business of taking risk, managing uncertainty, and taking advantage of long-term opportunities that risks and uncertainties create. Our goal remains to maximize long-term returns without taking significant risks of a permanent loss of capital. We are optimistic about the long-term prospects of our investments and continue to search for new ideas while remaining patient and investing only when we believe companies are trading significantly below their intrinsic values.
| † | Sector levels are provided from the Global Industry Classification Standard (“GICS”), developed and exclusively owned by MSCI, Inc. and Standard & Poor’s Financial Services LLC, unless otherwise stated that they have been reclassified or classified by the Adviser. All GICS data is provided “as is” with no warranties. |
| 1 | Performance information reflects results of the Retail Shares. |
11
| Baron Discovery Fund(Unaudited) | March 31, 2020 |
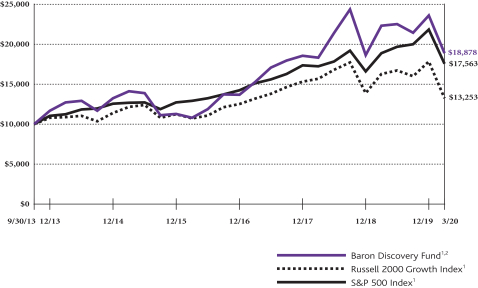
COMPARISONOFTHECHANGEIN VALUEOF $10,000INVESTMENTIN BARON DISCOVERY FUND† (RETAIL SHARES)
INRELATIONTOTHE RUSSELL 2000 GROWTH INDEXANDTHE S&P 500 INDEX
| AVERAGE ANNUAL TOTAL RETURNSFORTHEPERIODSENDED MARCH 31, 2020 |
| |||||||||||||||||||
| Six Months* | One Year | Three Years | Five Years | Since Inception | ||||||||||||||||
Baron Discovery Fund — Retail Shares1,2 | (11.94)% | (15.38)% | 7.25% | 5.96% | 10.27% | |||||||||||||||
Baron Discovery Fund — Institutional Shares1,2 | (11.82)% | (15.18)% | 7.51% | 6.22% | 10.54% | |||||||||||||||
Baron Discovery Fund — R6 Shares1,2,3 | (11.82)% | (15.18)% | 7.53% | 6.24% | 10.55% | |||||||||||||||
Russell 2000 Growth Index1 | (17.31)% | (18.58)% | 0.10% | 1.70% | 4.43% | |||||||||||||||
S&P 500 Index1 | (12.31)% | (6.98)% | 5.10% | 6.73% | 9.05% | |||||||||||||||
| * | Not Annualized. |
| † | The Fund’s 1-, 3-, and 5-year historical performance was impacted by gains from IPOs and/or secondary offerings, and there is no guarantee that these results can be repeated or that the Fund’s level of participation in IPOs and secondary offerings will be the same in the future. |
| 1 | The indexes are unmanaged. The index performance is not Fund performance; one cannot invest directly into an index. The Russell 2000® Growth Index measures the performance of small-sized U.S. companies that are classified as growth and the S&P 500 Index of 500 widely held large cap U.S. companies. The indexes and the Fund are with dividends reinvested, which positively impact the performance results. |
| 2 | Past performance is not predictive of future performance. The performance data does not reflect the deduction of taxes that a shareholder would pay on Fund distributions or redemption of Fund shares. The Adviser reimburses certain Fund expenses pursuant to a contract expiring on August 29, 2030, unless renewed for another 11-year term and the Fund’s transfer agency expenses may be reduced by expense offsets from an unaffiliated transfer agent, without which performance would have been lower. |
| 3 | Performance for the R6 Shares prior to August 31, 2016 is based on the performance of the Institutional Shares. |
12
| March 31, 2020 (Unaudited) | Baron Discovery Fund |
TOP TEN HOLDINGSASOF MARCH 31, 2020
| Percent of Net Assets | ||||
Kinsale Capital Group, Inc. | 4.0% | |||
Emergent BioSolutions Inc. | 3.5% | |||
Mercury Systems, Inc. | 3.4% | |||
Americold Realty Trust | 3.3% | |||
Qualys, Inc. | 3.2% | |||
Inogen, Inc. | 3.1% | |||
SiteOne Landscape Supply, Inc. | 2.9% | |||
Everbridge, Inc. | 2.8% | |||
Endava plc | 2.7% | |||
Veracyte, Inc. | 2.6% | |||
| 31.5% | ||||
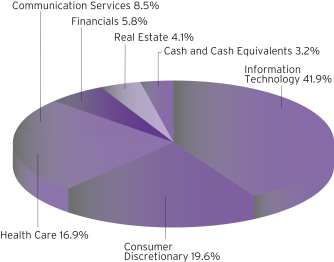
SECTOR BREAKDOWNASOF MARCH 31, 2020†
(as a percentage of net assets)
MANAGEMENT’S DISCUSSIONOF FUND PERFORMANCE
For thesix-month period ended March 31, 2020, Baron Discovery Fund1 declined 11.94%, while the Russell 2000 Growth Index declined 17.31% and the S&P 500 Index declined 12.31%.
Baron Discovery Fund invests primarily insmall-sized U.S. companies, at time of purchase, with market capitalizations up to the largest market cap stock in the Russell 2000 Growth Index at June 30, or companies with market capitalizations up to $2.5 billion, whichever is larger, so long as the purchase of those
securities would not cause the Fund’s weighted average market
capitalization to exceed that of the Russell 2000 Growth Index. If at any time, the Fund’s weighted average market capitalization exceeds that of the Russell 2000 Growth Index, the Fund may only purchase securities with market capitalizations up to the weighted average market capitalization of the Russell 2000 Growth Index. We seek investments for the Fund that are for the long term at attractive valuations in companies with appropriately capitalized, open-ended growth opportunities, exceptional leadership, and sustainable competitive advantages.
U.S. equities rose throughout most of thesix-month period, achievingall-time highs inmid-February before falling sharply as the spread of theCOVID-19 virus escalated outside of China, raising concerns about global health risks and impacts on global supply chains and economies. The situation was made worse by an escalating oil price war between Russia and Saudi Arabia, which sent oil prices tumbling more than 20% in early March. Despite the Federal Reserve’s drastic actions and Washington’s massive stimulus plan to counter the Coronavirus-induced economic slowdown, stock prices remained under pressure as the number of reported cases continued to rise globally. It was a precipitous and alarming end to the historic11-year bull market.
No sector contributed during the period. Consumer Discretionary, Industrials, and Health Care investments detracted the most.
Teladoc Health, Inc., the U.S.’s leading provider of telehealth services, was the top contributor after shares soared due to theCOVID-19 outbreak. Telehealth is perfectly suited as an initial patient touchpoint in a time of social distancing and growing concerns of overwhelming the health care system. Call volumes have spiked, reimbursement for telehealth has been widely expanded, and restrictions on MD cross-state licensure have been lifted to expand the pool of available doctors. We believe the crisis has accelerated the adoption and cemented the use of telehealth.
TherapeuticsMD, Inc. detracted the most. TherapeuticsMD is a specialty pharmaceutical company focused on the hormone replacement therapy market with three FDA approved drugs in the process of being launched. Shares declined late in the period on expectations of hampered launch efforts due to theCOVID-19 outbreak, resulting in unmet goals for the year. We believe the company is well capitalized after a recent equity raise in October 2019 and shares are drastically undervalued as the health crisis is merely delaying product launches.
The companies we own are high quality, innovative, and run by excellent management teams. We think their long-term fundamentals remain strong and fully expect them to weather the current economic environment and emerge in a stronger competitive position on the other side. We also believe the current uncertainty and dislocation will create opportunities to purchase additional fast-growing businesses at reasonable valuations. Economic recoveries have typically been good environments to be invested in fast growing small companies and we would expect the next recovery to be no different.
| † | Sector levels are provided from the Global Industry Classification Standard (“GICS”), developed and exclusively owned by MSCI, Inc. and Standard & Poor’s Financial Services LLC, unless otherwise stated that they have been reclassified or classified by the Adviser. All GICS data is provided “as is” with no warranties. |
| 1 | Performance information reflects results of the Retail Shares. |
13
| Baron Durable Advantage Fund | March 31, 2020 |
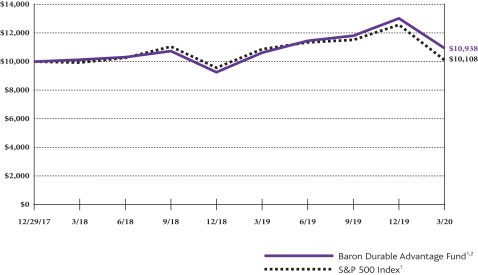
COMPARISONOFTHECHANGEIN VALUEOF $10,000INVESTMENTIN BARON DURABLE ADVANTAGE FUND
(RETAIL SHARES)INRELATIONTOTHE S&P 500 INDEX
| AVERAGE ANNUAL TOTAL RETURNSFORTHEPERIODSENDED MARCH 31, 2020 |
| |||||||||||
| Six Months* | One Year | Since Inception (December 29, 2017) | ||||||||||
Baron Durable Advantage Fund — Retail Shares1,2 | (7.39)% | 3.02% | 4.07% | |||||||||
Baron Durable Advantage Fund — Institutional Shares1,2 | (7.28)% | 3.30% | 4.32% | |||||||||
Baron Durable Advantage Fund — R6 Shares1,2 | (7.28)% | 3.30% | 4.32% | |||||||||
S&P 500 Index1 | (12.31)% | (6.98)% | 0.48% | |||||||||
| * | Not Annualized. |
| 1 | The index is unmanaged. The index performance is not Fund performance; one cannot invest directly into an index. The S&P 500 Index measures the performance of 500 widely held large cap U.S. companies. The index and the Fund are with dividends reinvested, which positively impact the performance results. |
| 2 | Past performance is not predictive of future performance. The performance data does not reflect the deduction of taxes that a shareholder would pay on Fund distributions or redemption of Fund shares. The Adviser reimburses certain Fund expenses pursuant to a contract expiring on August 29, 2030, unless renewed for another 11-year term and the Fund’s transfer agency expenses may be reduced by expense offsets from an unaffiliated transfer agent, without which performance would have been lower. |
14
| March 31, 2020 (Unaudited) | Baron Durable Advantage Fund |
TOP TEN HOLDINGSASOF MARCH 31, 2020
| Percent of Net Assets | ||||
Microsoft Corporation | 6.0% | |||
Adobe Inc. | 5.3% | |||
S&P Global Inc. | 5.0% | |||
Moody’s Corporation | 4.9% | |||
Mastercard Incorporated | 4.4% | |||
Accenture plc | 4.2% | |||
Alphabet Inc. | 4.2% | |||
Danaher Corporation | 4.1% | |||
IHS Markit Ltd. | 3.8% | |||
Fidelity National Information Services, Inc. | 3.7% | |||
| 45.6% | ||||
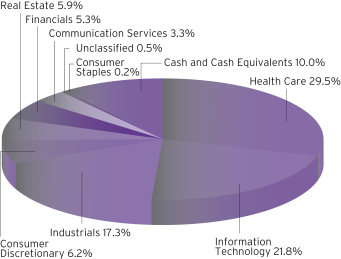
SECTOR BREAKDOWNASOF MARCH 31, 2020†
(as a percentage of net assets)
MANAGEMENT’S DISCUSSIONOF FUND PERFORMANCE
For thesix-month period ended March 31, 2020, Baron Durable Advantage Fund1 declined 7.39% while the S&P 500 Index declined 12.31%.
Baron Durable Advantage Fund invests mainly inlarge-sized U.S. companies with competitive advantages and market capitalizations no smaller than the top 90th percentile by market capitalization of the S&P 500 Index at June 30, or companies with
market capitalizations above $10 billion, whichever is smaller. The Fund emphasizes businesses with excess free cash flow that can be returned to shareholders.
U.S. equities rose throughout most of thesix-month period, achievingall-time highs inmid-February before falling sharply as the spread of theCOVID-19 virus escalated outside of China, raising concerns about global health risks and impacts on global supply chains and economies. The situation was made worse by an escalating oil price war between Russia and Saudi Arabia, which sent oil prices tumbling more than 20% in early March. Despite the Federal Reserve’s drastic actions and Washington’s massive stimulus plan to counter the Coronavirus-induced economic slowdown, stock prices remained under pressure as the number of reported cases continued to rise globally. It was a precipitous and alarming end to the historic11-year bull market.
The Materials sector was a modest contributor during the period. Communication Services, Consumer Staples, and Information Technology holdings detracted the most.
Apple, Inc., maker of the iPhone and other hardware products, contributed the most after the company guided to revenues and margin that beat investor expectations as well as successful product launches of the new iPhone and a host of services. While shares gave up some gains in theCOVID-19 pandemic, we retain conviction based on Apple’s status as a leading brand and capital returns post tax reform.
Constellation Brands, Inc., the third largest beer producer in the U.S. and the world’s leading premium wine company, detracted the most. Shares declined due to investor concerns over growth and profitability at Canopy (in which Constellation owns a 40% stake) and slower share gains for its Corona brand, as well as growth of the hard seltzer category to which Constellation has not had exposure. We retain conviction based on Constellation’s fast growing portfolio of Mexican imports and recent divestitures of itslow-end wine business and underperforming beer business.
Every day we live and invest in a world full of uncertainty. The challenges we face are real and serious, with clearly uncertain outcomes. History would suggest that most will prove passing or manageable. The business of capital allocation is the business of taking risk, managing uncertainty, and taking advantage of long-term opportunities that risks and uncertainties create. Our goal is to invest inlarge-cap companies that we believe have strong and durable competitive advantages, proven track records of successful capital allocation, high returns on invested capital, and high free cash flow generation, a significant portion of which is returned to shareholders as dividends or share repurchases. We hope to maximize long-term returns without taking significant risks of permanent loss of capital. We are optimistic about the prospects of the companies in which we are invested and will always continue to search for new ideas and opportunities.
| † | Sector levels are provided from the Global Industry Classification Standard (“GICS”), developed and exclusively owned by MSCI, Inc. and Standard & Poor’s Financial Services LLC, unless otherwise stated that they have been reclassified or classified by the Adviser. All GICS data is provided “as is” with no warranties. |
| 1 | Performance information reflects results of the Retail Shares. |
15
| Baron Asset Fund | March 31, 2020 |
STATEMENT OF NET ASSETS (Unaudited)
MARCH 31, 2020
|
| Shares | Cost | Value | ||||||||||
| Common Stocks (98.62%) | ||||||||||||
| Communication Services (2.26%) | ||||||||||||
Cable & Satellite (1.27%) | ||||||||||||
| 425,000 | Liberty Broadband Corporation, Cl C1 | $ | 32,000,689 | $ | 47,056,000 | |||||||
Interactive Media & Services (0.99%) | ||||||||||||
| 1,018,374 | Zillow Group, Inc., Cl C1 | 31,099,419 | 36,681,832 | |||||||||
|
|
|
| |||||||||
Total Communication Services | 63,100,108 | 83,737,832 | ||||||||||
|
|
|
| |||||||||
| Consumer Discretionary (4.84%) | ||||||||||||
Hotels, Resorts & Cruise Lines (1.62%) | ||||||||||||
| 556,442 | Choice Hotels International, Inc. | 5,979,508 | 34,082,072 | |||||||||
| 543,233 | Hyatt Hotels Corp., Cl A | 16,817,762 | 26,020,861 | |||||||||
|
|
|
| |||||||||
| 22,797,270 | 60,102,933 | |||||||||||
Internet & Direct Marketing Retail (0.72%) | ||||||||||||
| 19,759 | Booking Holdings, Inc.1 | 3,141,065 | 26,582,178 | |||||||||
Leisure Facilities (2.50%) | ||||||||||||
| 626,538 | Vail Resorts, Inc. | 12,134,164 | 92,545,928 | |||||||||
|
|
|
| |||||||||
Total Consumer Discretionary | 38,072,499 | 179,231,039 | ||||||||||
|
|
|
| |||||||||
| Financials (12.48%) | ||||||||||||
Asset Management & Custody Banks (0.76%) | ||||||||||||
| 287,514 | T. Rowe Price Group, Inc. | 9,128,544 | 28,075,742 | |||||||||
Financial Exchanges & Data (5.63%) | ||||||||||||
| 385,725 | FactSet Research Systems, Inc. | 20,748,103 | 100,550,793 | |||||||||
| 257,267 | MarketAxess Holdings, Inc. | 31,487,484 | 85,559,286 | |||||||||
| 30,000 | MSCI, Inc. | 7,783,774 | 8,668,800 | |||||||||
| 326,189 | Tradeweb Markets, Inc., Cl A | 11,978,713 | 13,712,986 | |||||||||
|
|
|
| |||||||||
| 71,998,074 | 208,491,865 | |||||||||||
Insurance Brokers (1.79%) | ||||||||||||
| 390,421 | Willis Towers Watson plc2 | 49,888,995 | 66,313,007 | |||||||||
Investment Banking & Brokerage (1.75%) | ||||||||||||
| 1,935,936 | The Charles Schwab Corp. | 1,708,435 | 65,086,168 | |||||||||
Property & Casualty Insurance (1.84%) | ||||||||||||
| 2,393,444 | Arch Capital Group Ltd.1,2 | 8,625,560 | 68,117,416 | |||||||||
Regional Banks (0.71%) | ||||||||||||
| 320,421 | First Republic Bank | 8,284,701 | 26,364,240 | |||||||||
|
|
|
| |||||||||
Total Financials | 149,634,309 | 462,448,438 | ||||||||||
|
|
|
| |||||||||
| Health Care (23.87%) | ||||||||||||
Health Care Equipment (9.10%) | ||||||||||||
| 178,000 | DexCom, Inc.1 | 26,639,704 | 47,930,060 | |||||||||
| 951,630 | IDEXX Laboratories, Inc.1 | 17,699,053 | 230,522,851 | |||||||||
| 199,644 | Teleflex, Inc. | 40,334,965 | 58,467,742 | |||||||||
|
|
|
| |||||||||
| 84,673,722 | 336,920,653 | |||||||||||
Health Care Supplies (4.06%) | ||||||||||||
| 215,418 | The Cooper Companies, Inc. | 36,713,299 | 59,384,280 | |||||||||
| 598,404 | West Pharmaceutical Services, Inc. | 26,107,582 | 91,107,009 | |||||||||
|
|
|
| |||||||||
| 62,820,881 | 150,491,289 | |||||||||||
| Shares | Cost | Value | ||||||||||
| Common Stocks (continued) | ||||||||||||
| Health Care (continued) | ||||||||||||
Health Care Technology (1.94%) | ||||||||||||
| 459,386 | Veeva Systems, Inc., Cl A1 | $ | 27,115,596 | $ | 71,834,189 | |||||||
Life Sciences Tools & Services (8.77%) | ||||||||||||
| 100,682 | 10X Genomics, Inc., Cl A1 | 3,926,598 | 6,274,502 | |||||||||
| 431,986 | Bio-Techne Corporation | 45,942,864 | 81,913,185 | |||||||||
| 302,552 | Illumina, Inc.1 | 13,002,071 | 82,633,002 | |||||||||
| 223,117 | Mettler-Toledo International, Inc.1 | 13,651,858 | 154,064,520 | |||||||||
|
|
|
| |||||||||
| 76,523,391 | 324,885,209 | |||||||||||
|
|
|
| |||||||||
Total Health Care | 251,133,590 | 884,131,340 | ||||||||||
|
|
|
| |||||||||
| Industrials (19.03%) | ||||||||||||
Aerospace & Defense (0.77%) | ||||||||||||
| 588,082 | BWX Technologies, Inc. | 29,416,776 | 28,645,474 | |||||||||
Agricultural & Farm Machinery (1.01%) | ||||||||||||
| 573,045 | The Toro Co. | 35,465,155 | 37,299,499 | |||||||||
Environmental & Facilities Services (1.07%) | ||||||||||||
| 1,095,612 | Rollins, Inc. | 24,597,483 | 39,595,418 | |||||||||
Industrial Conglomerates (2.37%) | ||||||||||||
| 282,192 | Roper Technologies, Inc. | 34,625,205 | 87,990,287 | |||||||||
Industrial Machinery (1.68%) | ||||||||||||
| 450,760 | IDEX Corporation | 34,712,821 | 62,254,464 | |||||||||
Research & Consulting Services (12.13%) | ||||||||||||
| 2,230,474 | Clarivate Analytics Plc1,2 | 35,903,681 | 46,282,335 | |||||||||
| 215,493 | CoStar Group, Inc.1 | 42,162,593 | 126,539,645 | |||||||||
| 1,468,500 | TransUnion | 79,691,638 | 97,185,330 | |||||||||
| 1,286,206 | Verisk Analytics, Inc. | 41,840,861 | 179,271,392 | |||||||||
|
|
|
| |||||||||
| 199,598,773 | 449,278,702 | |||||||||||
|
|
|
| |||||||||
Total Industrials | 358,416,213 | 705,063,844 | ||||||||||
|
|
|
| |||||||||
| Information Technology (28.18%) | ||||||||||||
Application Software (13.08%) | ||||||||||||
| 596,856 | ANSYS, Inc.1 | 25,747,537 | 138,751,114 | |||||||||
| 395,300 | Aspen Technology, Inc.1 | 40,628,908 | 37,581,171 | |||||||||
| 1,636,093 | Ceridian HCM Holding, Inc.1 | 64,026,866 | 81,919,177 | |||||||||
| 75,000 | Fair Isaac Corp.1 | 29,841,190 | 23,076,750 | |||||||||
| 1,421,809 | Guidewire Software, Inc.1 | 77,473,157 | 112,763,672 | |||||||||
| 136,000 | RingCentral, Inc., Cl A1 | 25,147,336 | 28,819,760 | |||||||||
| 1,042,076 | SS&C Technologies Holdings, Inc. | 32,682,577 | 45,663,770 | |||||||||
| 83,000 | The Trade Desk, Inc., Cl A1 | 16,471,979 | 16,019,000 | |||||||||
|
|
|
| |||||||||
| 312,019,550 | 484,594,414 | |||||||||||
Data Processing & Outsourced Services (3.51%) | ||||||||||||
| 734,217 | Fidelity National Information Services, Inc. | 44,913,879 | 89,310,156 | |||||||||
| 217,448 | FleetCor Technologies, Inc.1 | 12,816,767 | 40,562,750 | |||||||||
|
|
|
| |||||||||
| 57,730,646 | 129,872,906 | |||||||||||
Electronic Components (0.88%) | ||||||||||||
| 450,000 | Amphenol Corp., Cl A | 42,881,684 | 32,796,000 | |||||||||
Internet Services & Infrastructure (5.42%) | ||||||||||||
| 457,986 | GDS Holdings Limited, ADR1,2 | 25,799,648 | 26,549,449 | |||||||||
| 699,103 | Verisign, Inc.1 | 42,196,952 | 125,901,459 | |||||||||
| 480,000 | Wix.com Ltd.1,2 | 43,353,666 | 48,393,600 | |||||||||
|
|
|
| |||||||||
| 111,350,266 | 200,844,508 | |||||||||||
| 16 | See Notes to Financial Statements. |
| March 31, 2020 | Baron Asset Fund |
STATEMENT OF NET ASSETS (Unaudited) (Continued)
MARCH 31, 2020
|
| Shares | Cost | Value | ||||||||||
| Common Stocks (continued) | ||||||||||||
| Information Technology (continued) | ||||||||||||
IT Consulting & Other Services (4.26%) | ||||||||||||
| 1,584,323 | Gartner, Inc.1 | $ | 39,586,888 | $ | 157,751,041 | |||||||
Technology Distributors (1.03%) | ||||||||||||
| 407,363 | CDW Corp. | 27,215,415 | 37,994,747 | |||||||||
|
|
|
| |||||||||
Total Information Technology | 590,784,449 | 1,043,853,616 | ||||||||||
|
|
|
| |||||||||
| Real Estate (7.96%) | ||||||||||||
Office REITs (0.31%) | ||||||||||||
| 41,583 | Alexander’s, Inc.4 | 1,760,107 | 11,474,829 | |||||||||
Real Estate Services (1.27%) | ||||||||||||
| 1,243,323 | CBRE Group, Inc., Cl A1 | 19,021,762 | 46,885,710 | |||||||||
Specialized REITs (6.38%) | ||||||||||||
| 200,000 | Alexandria Real Estate Equities, Inc.4 | 30,325,124 | 27,412,000 | |||||||||
| 127,416 | Equinix, Inc. | 10,066,062 | 79,580,211 | |||||||||
| 479,856 | SBA Communications Corp. | 16,169,379 | 129,546,725 | |||||||||
|
|
|
| |||||||||
| 56,560,565 | 236,538,936 | |||||||||||
|
|
|
| |||||||||
Total Real Estate | 77,342,434 | 294,899,475 | ||||||||||
|
|
|
| |||||||||
Total Common Stocks | 1,528,483,602 | 3,653,365,584 | ||||||||||
|
|
|
| |||||||||
| Private Partnerships (0.00%) | ||||||||||||
| Financials (0.00%) | ||||||||||||
Asset Management & Custody Banks (0.00%) | ||||||||||||
| 7,056,223 | Windy City Investments Holdings, L.L.C.1,3,4,6 | 0 | 180,639 | |||||||||
|
|
|
| |||||||||
| Principal Amount | Cost | Value | ||||||||||
| Short Term Investments (1.22%) | ||||||||||||
| $44,975,314 | Repurchase Agreement with Fixed Income Clearing Corp., dated 3/31/2020, 0.00% due 4/1/2020; Proceeds at maturity - $44,975,314; (Fully collateralized by $44,215,000 U.S. Treasury Note, 1.125% due 2/28/2025; Market value - $45,878,324)5 | $ | 44,975,314 | $ | 44,975,314 | |||||||
|
|
|
| |||||||||
Total Investments (99.84%) | $ | 1,573,458,916 | 3,698,521,537 | |||||||||
|
| |||||||||||
Cash and Other Assets Less Liabilities (0.16%) | 6,032,831 | |||||||||||
|
| |||||||||||
Net Assets | $ | 3,704,554,368 | ||||||||||
|
| |||||||||||
| | Retail Shares (Equivalent to $71.87 per share | | $ | 1,882,653,141 | ||||||||
|
| |||||||||||
| | Institutional Shares (Equivalent to $74.98 per share | | $ | 1,721,593,378 | ||||||||
|
| |||||||||||
| | R6 Shares (Equivalent to $74.96 per share | | $ | 100,307,849 | ||||||||
|
| |||||||||||
| % | Represents percentage of net assets. |
| 1 | Non-income producing securities. |
| 2 | Foreign corporation. |
| 3 | At March 31, 2020, the market value of restricted and fair valued securities amounted to $180,639 or 0.00% of net assets. This security is not deemed liquid. See Note 6 regarding Restricted Securities. |
| 4 | The Adviser has reclassified/classified certain securities in or out of thissub-industry. Such reclassifications/classifications are not supported by S&P or MSCI (unaudited). |
| 5 | Level 2 security. See Note 7 regarding Fair Value Measurements. |
| 6 | Level 3 security. See Note 7 regarding Fair Value Measurements. |
| ADR | American Depositary Receipt. |
All securities are Level 1, unless otherwise noted.
| See Notes to Financial Statements. | 17 |
| Baron Growth Fund | March 31, 2020 |
STATEMENT OF NET ASSETS (Unaudited)
MARCH 31, 2020
|
| Shares | Cost | Value | ||||||||||
| Common Stocks (99.87%) | ||||||||||||
| Communication Services (5.03%) | ||||||||||||
Alternative Carriers (3.65%) | ||||||||||||
| 8,862,608 | Iridium Communications, Inc.1,4 | $ | 55,774,685 | $ | 197,902,037 | |||||||
Movies & Entertainment (1.38%) | ||||||||||||
| 4,950,000 | Manchester United plc, Cl A2 | 69,534,954 | 74,497,500 | |||||||||
|
|
|
| |||||||||
Total Communication Services | 125,309,639 | 272,399,537 | ||||||||||
|
|
|
| |||||||||
| Consumer Discretionary (15.19%) | ||||||||||||
Casinos & Gaming (1.99%) | ||||||||||||
| 725,000 | Boyd Gaming Corporation | 18,479,841 | 10,454,500 | |||||||||
| 5,640,000 | Penn National Gaming, Inc.1 | 76,554,318 | 71,346,000 | |||||||||
| 3,047,233 | Red Rock Resorts, Inc., Cl A | 63,585,466 | 26,053,842 | |||||||||
|
|
|
| |||||||||
| 158,619,625 | 107,854,342 | |||||||||||
Education Services (2.64%) | ||||||||||||
| 1,400,000 | Bright Horizons Family Solutions, Inc.1 | 44,395,570 | 142,800,000 | |||||||||
Hotels, Resorts & Cruise Lines (5.00%) | ||||||||||||
| 3,000,000 | Choice Hotels International, Inc.4 | 72,782,127 | 183,750,000 | |||||||||
| 1,520,186 | Marriott Vacations Worldwide Corp. | 82,409,035 | 84,491,938 | |||||||||
| 555,000 | OneSpaWorld Holdings Ltd.5 | 5,550,000 | 2,253,300 | |||||||||
|
|
|
| |||||||||
| 160,741,162 | 270,495,238 | |||||||||||
Leisure Facilities (5.56%) | ||||||||||||
| 2,040,000 | Vail Resorts, Inc.4 | 58,372,047 | 301,328,400 | |||||||||
|
|
|
| |||||||||
Total Consumer Discretionary | 422,128,404 | 822,477,980 | ||||||||||
|
|
|
| |||||||||
| Consumer Staples (0.46%) | ||||||||||||
Food Distributors (0.46%) | ||||||||||||
| 1,000,000 | Performance Food Group Co.1 | 19,000,000 | 24,720,000 | |||||||||
|
|
|
| |||||||||
| Financials (32.06%) | ||||||||||||
Asset Management & Custody Banks (2.64%) | ||||||||||||
| 2,400,000 | The Carlyle Group, Inc. (formerly, The Carlyle Group) | 50,219,527 | 51,960,000 | |||||||||
| 2,000,000 | Cohen & Steers, Inc. | 48,597,830 | 90,900,000 | |||||||||
|
|
|
| |||||||||
| 98,817,357 | 142,860,000 | |||||||||||
Consumer Finance (0.22%) | ||||||||||||
| 65,500 | LendingTree, Inc.1 | 14,670,615 | 12,012,045 | |||||||||
Financial Exchanges & Data (17.97%) | ||||||||||||
| 1,250,000 | FactSet Research Systems, Inc. | 62,536,096 | 325,850,000 | |||||||||
| 1,120,000 | Morningstar, Inc. | 24,781,088 | 130,200,000 | |||||||||
| 1,790,000 | MSCI, Inc. | 34,035,194 | 517,238,400 | |||||||||
|
|
|
| |||||||||
| 121,352,378 | 973,288,400 | |||||||||||
Insurance Brokers (0.16%) | ||||||||||||
| 828,955 | BRP Group, Inc., Cl A1 | 11,605,370 | 8,745,475 | |||||||||
Investment Banking & Brokerage (0.84%) | ||||||||||||
| 450,000 | Houlihan Lokey, Inc. | 19,625,873 | 23,454,000 | |||||||||
| 775,000 | Moelis & Co., Cl A | 19,151,133 | 21,777,500 | |||||||||
|
|
|
| |||||||||
| 38,777,006 | 45,231,500 | |||||||||||
Life & Health Insurance (2.99%) | ||||||||||||
| 1,830,000 | Primerica, Inc. | 39,022,572 | 161,918,400 | |||||||||
| Shares | Cost | Value | ||||||||||
| Common Stocks (continued) | ||||||||||||
| Financials (continued) | ||||||||||||
Property & Casualty Insurance (6.98%) | ||||||||||||
| 9,590,000 | Arch Capital Group Ltd.1,2 | $ | 30,163,413 | $ | 272,931,400 | |||||||
| 1,003,449 | Kinsale Capital Group, Inc. | 35,154,566 | 104,890,524 | |||||||||
|
|
|
| |||||||||
| 65,317,979 | 377,821,924 | |||||||||||
Thrifts & Mortgage Finance (0.26%) | ||||||||||||
| 530,000 | Essent Group Ltd.2 | 14,737,154 | 13,960,200 | |||||||||
|
|
|
| |||||||||
Total Financials | 404,300,431 | 1,735,837,944 | ||||||||||
|
|
|
| |||||||||
| Health Care (12.06%) | ||||||||||||
Biotechnology (0.37%) | ||||||||||||
| 330,000 | Alector, Inc.1 | 7,092,149 | 7,962,900 | |||||||||
| 678,051 | Denali Therapeutics, Inc.1 | 12,825,338 | 11,872,673 | |||||||||
|
|
|
| |||||||||
| 19,917,487 | 19,835,573 | |||||||||||
Health Care Equipment (4.47%) | ||||||||||||
| 1,000,000 | IDEXX Laboratories, Inc.1 | 14,678,113 | 242,240,000 | |||||||||
Health Care Supplies (2.20%) | ||||||||||||
| 573,717 | Neogen Corp.1 | 13,141,410 | 38,433,302 | |||||||||
| 530,000 | West Pharmaceutical Services, Inc. | 18,069,792 | 80,692,500 | |||||||||
|
|
|
| |||||||||
| 31,211,202 | 119,125,802 | |||||||||||
Health Care Technology (0.39%) | ||||||||||||
| 483,399 | Schrödinger, Inc.1 | 8,870,882 | 20,844,165 | |||||||||
Life Sciences Tools & Services (4.47%) | ||||||||||||
| 432,655 | Adaptive Biotechnologies Corporation1 | 14,268,834 | 12,019,156 | |||||||||
| 850,000 | Bio-Techne Corporation | 44,923,357 | 161,177,000 | |||||||||
| 100,000 | Mettler-Toledo International, Inc.1 | 4,577,488 | 69,051,000 | |||||||||
|
|
|
| |||||||||
| 63,769,679 | 242,247,156 | |||||||||||
Pharmaceuticals (0.16%) | ||||||||||||
| 300,000 | Dechra Pharmaceuticals PLC (United Kingdom)2,6 | 8,518,489 | 8,651,226 | |||||||||
|
|
|
| |||||||||
Total Health Care | 146,965,852 | 652,943,922 | ||||||||||
|
|
|
| |||||||||
| Industrials (10.37%) | ||||||||||||
Building Products (1.96%) | ||||||||||||
| 1,325,000 | Trex Company, Inc.1 | 24,067,433 | 106,185,500 | |||||||||
Environmental & Facilities Services (0.08%) | ||||||||||||
| 396,108 | BrightView Holdings, Inc.1 | 4,825,022 | 4,380,955 | |||||||||
Industrial Machinery (0.31%) | ||||||||||||
| 4,275,000 | Marel hf (Netherlands)2,6 | 18,281,670 | 16,607,015 | |||||||||
Research & Consulting Services (8.02%) | ||||||||||||
| 740,000 | CoStar Group, Inc.1 | 31,299,135 | 434,535,400 | |||||||||
|
|
|
| |||||||||
Total Industrials | 78,473,260 | 561,708,870 | ||||||||||
|
|
|
| |||||||||
| Information Technology (17.12%) | ||||||||||||
Application Software (12.54%) | ||||||||||||
| 725,000 | Altair Engineering, Inc., Cl A1 | 11,330,019 | 19,212,500 | |||||||||
| 1,500,000 | ANSYS, Inc.1 | 35,363,291 | 348,705,000 | |||||||||
| 1,160,000 | Guidewire Software, Inc.1 | 37,235,023 | 91,999,600 | |||||||||
| 1,000,000 | Pegasystems, Inc. | 13,997,009 | 71,230,000 | |||||||||
| 3,375,000 | SS&C Technologies Holdings, Inc. | 26,445,719 | 147,892,500 | |||||||||
|
|
|
| |||||||||
| 124,371,061 | 679,039,600 | |||||||||||
| 18 | See Notes to Financial Statements. |
| March 31, 2020 | Baron Growth Fund |
STATEMENT OF NET ASSETS (Unaudited) (Continued)
MARCH 31, 2020
|
| Shares | Cost | Value | ||||||||||
| Common Stocks (continued) | ||||||||||||
| Information Technology (continued) | ||||||||||||
Electronic Components (0.60%) | ||||||||||||
| 243,500 | Littelfuse, Inc. | $ | 27,149,296 | $ | 32,487,770 | |||||||
Internet Services & Infrastructure (0.56%) | ||||||||||||
| 300,000 | Wix.com Ltd.1,2 | 18,156,068 | 30,246,000 | |||||||||
IT Consulting & Other Services (3.42%) | ||||||||||||
| 1,861,053 | Gartner, Inc.1 | 27,129,354 | 185,305,047 | |||||||||
|
|
|
| |||||||||
Total Information Technology | 196,805,779 | 927,078,417 | ||||||||||
|
|
|
| |||||||||
| Real Estate (7.58%) | ||||||||||||
Diversified REITs (0.22%) | ||||||||||||
| 460,135 | American Assets Trust, Inc. | 8,484,044 | 11,503,375 | |||||||||
Office REITs (2.57%) | ||||||||||||
| 90,000 | Alexander’s, Inc.5 | 11,140,498 | 24,835,500 | |||||||||
| 3,750,000 | Douglas Emmett, Inc. | 43,603,704 | 114,412,500 | |||||||||
|
|
|
| |||||||||
| 54,744,202 | 139,248,000 | |||||||||||
Real Estate Development (0.13%) | ||||||||||||
| 675,000 | Forestar Group, Inc.1 | 11,930,668 | 6,986,250 | |||||||||
Specialized REITs (4.66%) | ||||||||||||
| 750,000 | Alexandria Real Estate Equities, Inc.5 | 26,438,288 | 102,795,000 | |||||||||
| 5,400,000 | Gaming and Leisure Properties, Inc. | 117,127,090 | 149,634,000 | |||||||||
|
|
|
| |||||||||
| 143,565,378 | 252,429,000 | |||||||||||
|
|
|
| |||||||||
Total Real Estate | 218,724,292 | 410,166,625 | ||||||||||
|
|
|
| |||||||||
Total Common Stocks | 1,611,707,657 | 5,407,333,295 | ||||||||||
|
|
|
| |||||||||
| Private Preferred Stocks (0.33%) | ||||||||||||
| Health Care (0.33%) | ||||||||||||
Health Care Technology (0.33%) | ||||||||||||
| 448,722 | Schrödinger, Inc., Series E1,3,6 | 4,999,999 | 18,087,984 | |||||||||
|
|
|
| |||||||||
| Shares | Cost | Value | ||||||||||
| Private Partnerships (0.00%) | ||||||||||||
| Financials (0.00%) | ||||||||||||
Asset Management & Custody Banks (0.00%) | ||||||||||||
| 2,375,173 | Windy City Investments Holdings, L.L.C.1,3,5,7 | $ | 0 | $ | 60,804 | |||||||
|
|
|
| |||||||||
| Warrants (0.00%) | ||||||||||||
| Consumer Discretionary (0.00%) | ||||||||||||
Hotels, Resorts & Cruise Lines (0.00%) | ||||||||||||
| 96,515 | OneSpaWorld Holdings Ltd. Warrants, Exp 3/19/20241,2,5,6 | 0 | 113,888 | |||||||||
|
|
|
| |||||||||
Total Investments (100.20%) | $ | 1,616,707,656 | 5,425,595,971 | |||||||||
|
| |||||||||||
Liabilities Less Cash and Other Assets(-0.20%) | (10,964,011 | ) | ||||||||||
|
| |||||||||||
Net Assets | $ | 5,414,631,960 | ||||||||||
|
| |||||||||||
| | Retail Shares (Equivalent to $64.18 per share | | $ | 1,942,644,821 | ||||||||
|
| |||||||||||
| | Institutional Shares (Equivalent to $66.58 per share | | $ | 3,349,033,732 | ||||||||
|
| |||||||||||
| | R6 Shares (Equivalent to $66.59 per share | | $ | 122,953,407 | ||||||||
|
| |||||||||||
| % | Represents percentage of net assets. |
| 1 | Non-income producing securities. |
| 2 | Foreign corporation. |
| 3 | At March 31, 2020, the market value of restricted and fair valued securities amounted to $18,148,788 or 0.33% of net assets. These securities are not deemed liquid. See Note 6 regarding Restricted Securities. |
| 4 | See Note 10 regarding “Affiliated” companies. |
| 5 | The Adviser has reclassified/classified certain securities in or out of thissub-industry. Such reclassifications/classifications are not supported by S&P or MSCI (unaudited). |
| 6 | Level 2 security. See Note 7 regarding Fair Value Measurements. |
| 7 | Level 3 security. See Note 7 regarding Fair Value Measurements. |
All securities are Level 1, unless otherwise noted.
| See Notes to Financial Statements. | 19 |
| Baron Small Cap Fund | March 31, 2020 |
STATEMENT OF NET ASSETS (Unaudited)
MARCH 31, 2020
|
| Shares | Cost | Value | ||||||||||
| Common Stocks (95.65%) | ||||||||||||
| Communication Services (4.65%) | ||||||||||||
Cable & Satellite (2.40%) | ||||||||||||
| 100,000 | Liberty Broadband Corporation, Cl A1 | $ | 404,823 | $ | 10,700,000 | |||||||
| 275,000 | Liberty Broadband Corporation, Cl C1 | 1,079,680 | 30,448,000 | |||||||||
| 1,000,000 | Liberty Media Corp.-Liberty SiriusXM, Cl C1 | 2,168,308 | 31,620,000 | |||||||||
|
|
|
| |||||||||
| 3,652,811 | 72,768,000 | |||||||||||
Movies & Entertainment (2.25%) | ||||||||||||
| 750,000 | Liberty Media Corporation-Liberty Formula One, Cl C1 | 10,168,679 | 20,422,500 | |||||||||
| 225,000 | The Madison Square Garden Company, Cl A1 | 11,968,716 | 47,567,250 | |||||||||
|
|
|
| |||||||||
| 22,137,395 | 67,989,750 | |||||||||||
|
|
|
| |||||||||
Total Communication Services | 25,790,206 | 140,757,750 | ||||||||||
|
|
|
| |||||||||
| Consumer Discretionary (11.29%) | ||||||||||||
Casinos & Gaming (0.85%) | ||||||||||||
| 3,000,000 | Red Rock Resorts, Inc., Cl A | 65,067,490 | 25,650,000 | |||||||||
Education Services (2.44%) | ||||||||||||
| 725,000 | Bright Horizons Family Solutions, Inc.1 | 22,479,147 | 73,950,000 | |||||||||
General Merchandise Stores (1.11%) | ||||||||||||
| 725,000 | Ollie’s Bargain Outlet Holdings, Inc.1 | 42,455,413 | 33,596,500 | |||||||||
Home Improvement Retail (2.12%) | ||||||||||||
| 2,000,000 | Floor & Decor Holdings, Inc., Cl A1 | 78,500,578 | 64,180,000 | |||||||||
Homebuilding (2.17%) | ||||||||||||
| 1,650,000 | Installed Building Products, Inc.1,3 | 94,760,518 | 65,785,500 | |||||||||
Hotels, Resorts & Cruise Lines (0.33%) | ||||||||||||
| 2,500,000 | OneSpaWorld Holdings Ltd.1,2,4 | 27,000,000 | 10,150,000 | |||||||||
Leisure Facilities (1.29%) | ||||||||||||
| 800,000 | Planet Fitness, Inc., Cl A1 | 28,416,504 | 38,960,000 | |||||||||
Restaurants (0.68%) | ||||||||||||
| 500,000 | BJ’s Restaurants, Inc. | 18,498,709 | 6,945,000 | |||||||||
| 800,000 | The Cheesecake Factory, Inc. | 21,568,144 | 13,664,000 | |||||||||
|
|
|
| |||||||||
| 40,066,853 | 20,609,000 | |||||||||||
Specialty Stores (0.30%) | ||||||||||||
| 1,823,425 | Hudson Ltd., Cl A1,2 | 31,959,608 | 9,153,594 | |||||||||
|
|
|
| |||||||||
Total Consumer Discretionary | 430,706,111 | 342,034,594 | ||||||||||
|
|
|
| |||||||||
| Financials (2.93%) | ||||||||||||
Insurance Brokers (0.47%) | ||||||||||||
| 1,360,000 | BRP Group, Inc., Cl A1 | 20,582,945 | 14,348,000 | |||||||||
Investment Banking & Brokerage (1.77%) | ||||||||||||
| 625,000 | Houlihan Lokey, Inc. | 28,909,333 | 32,575,000 | |||||||||
| 750,000 | Moelis & Co., Cl A | 15,297,251 | 21,075,000 | |||||||||
|
|
|
| |||||||||
| 44,206,584 | 53,650,000 | |||||||||||
Property & Casualty Insurance (0.69%) | ||||||||||||
| 200,000 | Kinsale Capital Group, Inc. | 17,719,714 | 20,906,000 | |||||||||
|
|
|
| |||||||||
Total Financials | 82,509,243 | 88,904,000 | ||||||||||
|
|
|
| |||||||||
| Shares | Cost | Value | ||||||||||
| Common Stocks (continued) | ||||||||||||
| Health Care (22.04%) | ||||||||||||
Health Care Equipment (7.44%) | ||||||||||||
| 450,000 | Cantel Medical Corp. | $ | 18,658,868 | $ | 16,155,000 | |||||||
| 300,000 | DexCom, Inc.1 | 3,984,388 | 80,781,000 | |||||||||
| 325,000 | IDEXX Laboratories, Inc.1 | 4,831,318 | 78,728,000 | |||||||||
| 300,000 | Inspire Medical Systems, Inc.1,4 | 15,398,160 | 18,084,000 | |||||||||
| 1,000,000 | Silk Road Medical, Inc.1,4 | 38,341,580 | 31,480,000 | |||||||||
|
|
|
| |||||||||
| 81,214,314 | 225,228,000 | |||||||||||
Health Care Supplies (0.39%) | ||||||||||||
| 175,000 | Neogen Corp.1 | 9,472,399 | 11,723,250 | |||||||||
Health Care Technology (4.22%) | ||||||||||||
| 825,000 | Teladoc Health, Inc.1 | 25,812,122 | 127,883,250 | |||||||||
Life Sciences Tools & Services (7.37%) | ||||||||||||
| 250,000 | Guardant Health, Inc.1,4 | 4,953,265 | 17,400,000 | |||||||||
| 700,000 | ICON plc1,2 | 19,870,562 | 95,200,000 | |||||||||
| 70,000 | Mettler-Toledo International, Inc.1 | 3,418,551 | 48,335,700 | |||||||||
| 750,000 | PRA Health Sciences, Inc.1 | 13,594,033 | 62,280,000 | |||||||||
|
|
|
| |||||||||
| 41,836,411 | 223,215,700 | |||||||||||
Managed Health Care (1.67%) | ||||||||||||
| 1,000,000 | HealthEquity, Inc.1 | 23,274,522 | 50,590,000 | |||||||||
Pharmaceuticals (0.95%) | ||||||||||||
| 1,000,000 | Dechra Pharmaceuticals PLC (United Kingdom)2,5 | 28,027,985 | 28,837,421 | |||||||||
|
|
|
| |||||||||
Total Health Care | 209,637,753 | 667,477,621 | ||||||||||
|
|
|
| |||||||||
| Industrials (20.84%) | ||||||||||||
Aerospace & Defense (3.84%) | ||||||||||||
| 1,000,000 | Mercury Systems, Inc.1 | 25,872,953 | 71,340,000 | |||||||||
| 140,000 | TransDigm Group, Inc. | 0 | 44,826,600 | |||||||||
|
|
|
| |||||||||
| 25,872,953 | 116,166,600 | |||||||||||
Building Products (1.54%) | ||||||||||||
| 500,000 | Advanced Drainage Systems, Inc. | 15,141,744 | 14,720,000 | |||||||||
| 400,000 | Trex Company, Inc.1 | 30,505,504 | 32,056,000 | |||||||||
|
|
|
| |||||||||
| 45,647,248 | 46,776,000 | |||||||||||
Electrical Components & Equipment (2.00%) | ||||||||||||
| 7,000,000 | Vertiv Holdings LLC (formerly GS Acquisition Holdings Corp. Cl A)1 | 69,871,612 | 60,550,000 | |||||||||
Environmental & Facilities Services (2.37%) | ||||||||||||
| 925,000 | Waste Connections, Inc.2 | 40,391,667 | 71,687,500 | |||||||||
Human Resource & Employment Services (2.04%) | ||||||||||||
| 1,750,000 | ASGN, Inc.1 | 45,317,074 | 61,810,000 | |||||||||
Industrial Conglomerates (0.35%) | ||||||||||||
| 500,000 | Raven Industries, Inc. | 17,361,651 | 10,615,000 | |||||||||
Industrial Machinery (3.29%) | ||||||||||||
| 611,612 | Helios Technologies, Inc. | 28,660,786 | 23,192,327 | |||||||||
| 725,000 | John Bean Technologies Corp. | 62,999,777 | 53,845,750 | |||||||||
| 200,000 | RBC Bearings, Incorporated1 | 12,713,721 | 22,558,000 | |||||||||
|
|
|
| |||||||||
| 104,374,284 | 99,596,077 | |||||||||||
Research & Consulting Services (2.74%) | ||||||||||||
| 4,000,000 | Clarivate Analytics Plc1,2 | 44,078,833 | 83,000,000 | |||||||||
| 20 | See Notes to Financial Statements. |
| March 31, 2020 | Baron Small Cap Fund |
STATEMENT OF NET ASSETS (Unaudited) (Continued)
MARCH 31, 2020
|
| Shares | Cost | Value | ||||||||||
| Common Stocks (continued) | ||||||||||||
| Industrials (continued) | ||||||||||||
Trading Companies & Distributors (2.67%) | ||||||||||||
| 1,100,000 | SiteOne Landscape Supply, Inc.1 | $ | 32,331,782 | $ | 80,982,000 | |||||||
|
|
|
| |||||||||
Total Industrials | 425,247,104 | 631,183,177 | ||||||||||
|
|
|
| |||||||||
| Information Technology (22.54%) | ||||||||||||
Application Software (10.87%) | ||||||||||||
| 1,000,000 | Altair Engineering, Inc., Cl A1 | 16,264,110 | 26,500,000 | |||||||||
| 800,000 | Aspen Technology, Inc.1 | 29,983,938 | 76,056,000 | |||||||||
| 850,000 | Ceridian HCM Holding, Inc.1 | 23,711,721 | 42,559,500 | |||||||||
| 1,500,000 | Guidewire Software, Inc.1 | 40,880,643 | 118,965,000 | |||||||||
| 300,000 | The Trade Desk, Inc., Cl A1 | 10,650,000 | 57,900,000 | |||||||||
| 719,116 | Yext, Inc.1 | 8,871,363 | 7,327,792 | |||||||||
|
|
|
| |||||||||
| 130,361,775 | 329,308,292 | |||||||||||
Data Processing & Outsourced Services (3.04%) | ||||||||||||
| 3,500,000 | Repay Holdings Corporation, Cl A1,3 | 35,000,000 | 50,225,000 | |||||||||
| 400,000 | WEX, Inc.1 | 16,802,435 | 41,820,000 | |||||||||
|
|
|
| |||||||||
| 51,802,435 | 92,045,000 | |||||||||||
Electronic Equipment & Instruments (1.99%) | ||||||||||||
| 1,425,000 | Cognex Corp. | 11,282,960 | 60,163,500 | |||||||||
Internet Services & Infrastructure (1.67%) | ||||||||||||
| 500,000 | Wix.com Ltd.1,2 | 27,175,966 | 50,410,000 | |||||||||
IT Consulting & Other Services (4.97%) | ||||||||||||
| 600,000 | Endava plc, ADR1,2 | 16,610,349 | 21,096,000 | |||||||||
| 1,000,000 | Gartner, Inc.1 | 14,988,362 | 99,570,000 | |||||||||
| 2,100,000 | Grid Dynamics Holdings, Inc. (formerly, Chaserg Technology Acquisition Corp., Cl A)1 | 21,637,915 | 16,800,000 | |||||||||
| 400,000 | LiveRamp Holdings, Inc.1 | 8,433,994 | 13,168,000 | |||||||||
|
|
|
| |||||||||
| 61,670,620 | 150,634,000 | |||||||||||
|
|
|
| |||||||||
Total Information Technology | 282,293,756 | 682,560,792 | ||||||||||
|
|
|
| |||||||||
| Materials (3.62%) | ||||||||||||
Construction Materials (0.79%) | ||||||||||||
| 1,600,000 | Summit Materials, Inc., Cl A1 | 29,176,146 | 24,000,000 | |||||||||
Metal & Glass Containers (0.89%) | ||||||||||||
| 800,000 | Berry Global Group, Inc.1 | 12,652,147 | 26,968,000 | |||||||||
Specialty Chemicals (1.94%) | ||||||||||||
| 500,000 | Ingevity Corp.1 | 42,892,222 | 17,600,000 | |||||||||
| 1,500,000 | PolyOne Corp. | 51,016,302 | 28,455,000 | |||||||||
| 100,000 | Quaker Chemical Corp. | 15,148,385 | 12,628,000 | |||||||||
|
|
|
| |||||||||
| 109,056,909 | 58,683,000 | |||||||||||
|
|
|
| |||||||||
Total Materials | 150,885,202 | 109,651,000 | ||||||||||
|
|
|
| |||||||||
| Real Estate (7.39%) | ||||||||||||
Specialized REITs (7.39%) | ||||||||||||
| 2,600,000 | Americold Realty Trust4 | 57,674,635 | 88,504,000 | |||||||||
| 250,000 | Gaming and Leisure Properties, Inc. | 2,408,364 | 6,927,500 | |||||||||
| 475,000 | SBA Communications Corp. | 1,913,720 | 128,235,750 | |||||||||
|
|
|
| |||||||||
Total Real Estate | 61,996,719 | 223,667,250 | ||||||||||
|
|
|
| |||||||||
| Shares | Cost | Value | ||||||||||
| Common Stocks (continued) | ||||||||||||
| Unclassified (0.35%) | ||||||||||||
Unclassified (0.35%) | ||||||||||||
| 850,000 | Diamond Eagle | $ | 11,094,483 | $ | 10,489,000 | |||||||
|
|
|
| |||||||||
Total Common Stocks | 1,680,160,577 | 2,896,725,184 | ||||||||||
|
|
|
| |||||||||
| Warrants (0.16%) | ||||||||||||
| Consumer Discretionary (0.01%) | ||||||||||||
Hotels, Resorts & Cruise Lines (0.01%) | ||||||||||||
| 260,850 | OneSpaWorld Holdings Ltd. Warrants, Exp 3/19/20241,2,4,5 | 0 | 307,803 | |||||||||
|
|
|
| |||||||||
| Information Technology (0.15%) | ||||||||||||
Data Processing & Outsourced Services (0.15%) | ||||||||||||
| 3,500,000 | Repay Holdings Corporation Warrants Exp 7/11/20241,3 | 0 | 4,585,000 | |||||||||
|
|
|
| |||||||||
Total Warrants | 0 | 4,892,803 | ||||||||||
|
|
|
| |||||||||
| Principal Amount | ||||||||||||
| Short Term Investments (4.06%) | ||||||||||||
| $122,934,366 | Repurchase Agreement with Fixed Income Clearing Corp., dated 3/31/2020, 0.00% due 4/1/2020; Proceeds at maturity - $122,934,366; (Fully collateralized by $120,850,000 U.S. Treasury Note, 1.125% due 2/28/2025; Market value - $125,396,256)5 | 122,934,366 | 122,934,366 | |||||||||
|
|
|
| |||||||||
Total Investments (99.87%) | $ | 1,803,094,943 | 3,024,552,353 | |||||||||
|
| |||||||||||
Cash and Other Assets Less Liabilities (0.13%) | 4,018,044 | |||||||||||
|
| |||||||||||
Net Assets | $ | 3,028,570,397 | ||||||||||
|
| |||||||||||
| | Retail Shares (Equivalent to $22.50 per share | | $ | 1,073,518,506 | ||||||||
|
| |||||||||||
| | Institutional Shares (Equivalent to $23.62 per share | | $ | 1,819,592,288 | ||||||||
|
| |||||||||||
| | R6 Shares (Equivalent to $23.61 per share | | $ | 135,459,603 | ||||||||
|
| |||||||||||
| % | Represents percentage of net assets. |
| 1 | Non-income producing securities. |
| 2 | Foreign corporation. |
| 3 | See Note 10 regarding “Affiliated” companies. |
| 4 | The Adviser has reclassified/classified certain securities in or out of thissub-industry. Such reclassifications/classifications are not supported by S&P or MSCI (unaudited). |
| 5 | Level 2 security. See Note 7 regarding Fair Value Measurements. |
| ADR | American Depositary Receipt. |
All securities are Level 1, unless otherwise noted.
| See Notes to Financial Statements. | 21 |
| Baron Opportunity Fund | March 31, 2020 |
STATEMENT OF NET ASSETS (Unaudited)
MARCH 31, 2020
|
| Shares | Cost | Value | ||||||||||
| Common Stocks (92.49%) | ||||||||||||
| Communication Services (10.68%) | ||||||||||||
Interactive Home Entertainment (2.45%) | ||||||||||||
| 62,700 | Electronic Arts, Inc.1 | $ | 6,067,100 | $ | 6,280,659 | |||||||
| 42,000 | Take-Two Interactive Software, Inc.1 | 4,454,639 | 4,981,620 | |||||||||
|
|
|
| |||||||||
| 10,521,739 | 11,262,279 | |||||||||||
Interactive Media & Services (6.39%) | ||||||||||||
| 16,450 | Alphabet, Inc., Cl C1 | 13,015,659 | 19,128,225 | |||||||||
| 35,200 | Facebook, Inc., Cl A1 | 7,319,736 | 5,871,360 | |||||||||
| 366,000 | Snap, Inc., Cl A1 | 5,626,740 | 4,351,740 | |||||||||
|
|
|
| |||||||||
| 25,962,135 | 29,351,325 | |||||||||||
Movies & Entertainment (1.84%) | ||||||||||||
| 122,614 | Manchester United plc, Cl A2 | 1,867,993 | 1,845,341 | |||||||||
| 17,525 | Netflix, Inc.1 | 902,756 | 6,580,637 | |||||||||
|
|
|
| |||||||||
| 2,770,749 | 8,425,978 | |||||||||||
|
|
|
| |||||||||
Total Communication Services | 39,254,623 | 49,039,582 | ||||||||||
|
|
|
| |||||||||
| Consumer Discretionary (16.94%) | ||||||||||||
Automobile Manufacturers (4.87%) | ||||||||||||
| 42,700 | Tesla, Inc.1 | 9,302,003 | 22,374,800 | |||||||||
Education Services (0.71%) | ||||||||||||
| 77,236 | Arco Platform Limited, Cl A1,2 | 1,351,630 | 3,263,994 | |||||||||
Internet & Direct Marketing Retail (11.36%) | ||||||||||||
| 54,600 | Alibaba Group Holding Limited, ADR1,2 | 6,165,043 | 10,618,608 | |||||||||
| 15,675 | Amazon.com, Inc.1 | 6,142,645 | 30,561,861 | |||||||||
| 8,529 | MercadoLibre, Inc.1 | 4,838,488 | 4,167,099 | |||||||||
| 1,644,126 | Trainline Plc, 144A (United Kingdom)1,2,4 | 7,333,460 | 6,825,975 | |||||||||
|
|
|
| |||||||||
| 24,479,636 | 52,173,543 | |||||||||||
|
|
|
| |||||||||
Total Consumer Discretionary | 35,133,269 | 77,812,337 | ||||||||||
|
|
|
| |||||||||
| Financials (1.88%) | ||||||||||||
Asset Management & Custody Banks (1.11%) | ||||||||||||
| 115,500 | Brookfield Asset Management, Inc., Cl A2 | 6,374,239 | 5,110,875 | |||||||||
Financial Exchanges & Data (0.77%) | ||||||||||||
| 10,600 | MarketAxess Holdings, Inc. | 1,129,413 | 3,525,242 | |||||||||
|
|
|
| |||||||||
Total Financials | 7,503,652 | 8,636,117 | ||||||||||
|
|
|
| |||||||||
| Health Care (12.91%) | ||||||||||||
Biotechnology (7.07%) | ||||||||||||
| 99,300 | Acceleron Pharma, Inc.1 | 3,661,857 | 8,924,091 | |||||||||
| 69,702 | argenx SE, ADR1,2 | 2,103,334 | 9,181,845 | |||||||||
| 104,100 | Arrowhead Pharmaceuticals, Inc.1 | 1,891,413 | 2,994,957 | |||||||||
| 40,200 | Neurocrine Biosciences, Inc.1 | 3,482,733 | 3,479,310 | |||||||||
| 33,100 | Vertex Pharmaceuticals Incorporated1 | 5,438,788 | 7,876,145 | |||||||||
|
|
|
| |||||||||
| 16,578,125 | 32,456,348 | |||||||||||
Health Care Equipment (1.95%) | ||||||||||||
| 22,300 | Edwards Lifesciences Corp.1 | 2,081,030 | 4,206,226 | |||||||||
| 9,635 | Intuitive Surgical, Inc.1 | 2,226,388 | 4,771,348 | |||||||||
|
|
|
| |||||||||
| 4,307,418 | 8,977,574 | |||||||||||
Health Care Technology (1.60%) | ||||||||||||
| 106,374 | Schrödinger, Inc.1 | 1,808,358 | 4,586,847 | |||||||||
| 17,800 | Veeva Systems, Inc., Cl A1 | 2,595,016 | 2,783,386 | |||||||||
|
|
|
| |||||||||
| 4,403,374 | 7,370,233 | |||||||||||
| Shares | Cost | Value | ||||||||||
| Common Stocks (continued) | ||||||||||||
| Health Care (continued) | ||||||||||||
Life Sciences Tools & Services (2.29%) | ||||||||||||
| 43,419 | 10X Genomics, Inc., Cl A1 | $ | 2,433,686 | $ | 2,705,872 | |||||||
| 34,837 | Guardant Health, Inc.1,3 | 2,315,007 | 2,424,655 | |||||||||
| 19,715 | Illumina, Inc.1 | 1,881,779 | 5,384,561 | |||||||||
|
|
|
| |||||||||
| 6,630,472 | 10,515,088 | |||||||||||
|
|
|
| |||||||||
Total Health Care | 31,919,389 | 59,319,243 | ||||||||||
|
|
|
| |||||||||
| Industrials (3.06%) | ||||||||||||
Research & Consulting Services (3.06%) | ||||||||||||
| 17,933 | CoStar Group, Inc.1 | 606,009 | 10,530,437 | |||||||||
| 25,390 | Verisk Analytics, Inc. | 1,183,699 | 3,538,858 | |||||||||
|
|
|
| |||||||||
Total Industrials | 1,789,708 | 14,069,295 | ||||||||||
|
|
|
| |||||||||
| Information Technology (42.84%) | ||||||||||||
Application Software (15.56%) | ||||||||||||
| 30,600 | Adobe, Inc.1 | 6,067,072 | 9,738,144 | |||||||||
| 16,975 | ANSYS, Inc.1 | 1,416,670 | 3,946,178 | |||||||||
| 112,170 | Ceridian HCM Holding, Inc.1 | 3,714,170 | 5,616,352 | |||||||||
| 10,600 | Coupa Software, Inc.1 | 1,109,769 | 1,481,138 | |||||||||
| 157,100 | Guidewire Software, Inc.1 | 3,949,773 | 12,459,601 | |||||||||
| 42,700 | RingCentral, Inc., Cl A1 | 3,277,189 | 9,048,557 | |||||||||
| 31,480 | salesforce.com, Inc.1 | 2,286,515 | 4,532,490 | |||||||||
| 22,800 | ServiceNow, Inc.1,3 | 1,658,026 | 6,534,024 | |||||||||
| 57,200 | Splunk, Inc.1 | 5,427,957 | 7,220,356 | |||||||||
| 19,500 | The Trade Desk, Inc., Cl A1 | 646,518 | 3,763,500 | |||||||||
| 393,000 | Yext, Inc.1 | 5,425,537 | 4,004,670 | |||||||||
| 21,207 | Zoom Video Communications, Inc., Cl A1 | 1,346,057 | 3,098,767 | |||||||||
|
|
|
| |||||||||
| 36,325,253 | 71,443,777 | |||||||||||
Data Processing & Outsourced Services (5.14%) | ||||||||||||
| 1,900 | Adyen N.V., 144A (Netherlands)1,2 | 1,491,661 | 1,614,799 | |||||||||
| 33,100 | MasterCard Incorporated, Cl A | 2,713,455 | 7,995,636 | |||||||||
| 60,000 | PayPal Holdings, Inc.1 | 6,076,523 | 5,744,400 | |||||||||
| 51,300 | Visa, Inc., Cl A | 4,019,237 | 8,265,456 | |||||||||
|
|
|
| |||||||||
| 14,300,876 | 23,620,291 | |||||||||||
Internet Services & Infrastructure (4.24%) | ||||||||||||
| 159,677 | GDS Holdings Limited, ADR1,2 | 6,236,172 | 9,256,476 | |||||||||
| 38,741 | Twilio, Inc., Cl A1 | 4,836,911 | 3,466,932 | |||||||||
| 67,043 | Wix.com Ltd.1,2 | 3,803,923 | 6,759,275 | |||||||||
|
|
|
| |||||||||
| 14,877,006 | 19,482,683 | |||||||||||
IT Consulting & Other Services (3.28%) | ||||||||||||
| 161,676 | Endava plc, ADR1,2 | 4,825,855 | 5,684,528 | |||||||||
| 94,187 | Gartner, Inc.1 | 1,517,861 | 9,378,200 | |||||||||
|
|
|
| |||||||||
| 6,343,716 | 15,062,728 | |||||||||||
Semiconductors (4.36%) | ||||||||||||
| 100,200 | Mellanox Technologies Ltd.1,2 | 6,872,939 | 12,156,264 | |||||||||
| 29,800 | NVIDIA Corp. | 6,014,158 | 7,855,280 | |||||||||
|
|
|
| |||||||||
| 12,887,097 | 20,011,544 | |||||||||||
Systems Software (10.26%) | ||||||||||||
| 110,020 | Datadog, Inc., Cl A1,3 | 3,447,759 | 3,958,519 | |||||||||
| 85,723 | Crowdstrike Holdings, Inc., Cl A1 | 4,145,057 | 4,773,057 | |||||||||
| 220,900 | Microsoft Corp. | 21,063,007 | 34,838,139 | |||||||||
| 34,800 | Proofpoint, Inc.1 | 2,989,402 | 3,570,132 | |||||||||
|
|
|
| |||||||||
| 31,645,225 | 47,139,847 | |||||||||||
|
|
|
| |||||||||
Total Information Technology | 116,379,173 | 196,760,870 | ||||||||||
|
|
|
| |||||||||
| 22 | See Notes to Financial Statements. |
| March 31, 2020 | Baron Opportunity Fund |
STATEMENT OF NET ASSETS (Unaudited) (Continued)
MARCH 31, 2020
|
| Shares | Cost | Value | ||||||||||
| Common Stocks (continued) | ||||||||||||
| Real Estate (4.18%) | ||||||||||||
Specialized REITs (4.18%) | ||||||||||||
| 32,000 | Alexandria Real Estate Equities, Inc.3 | $ | 4,494,838 | $ | 4,385,920 | |||||||
| 108,500 | Americold Realty Trust3 | 3,319,507 | 3,693,340 | |||||||||
| 14,225 | Equinix, Inc. | 2,122,124 | 8,884,508 | |||||||||
| 8,300 | SBA Communications Corp. | 27,760 | 2,240,751 | |||||||||
|
|
|
| |||||||||
Total Real Estate | 9,964,229 | 19,204,519 | ||||||||||
|
|
|
| |||||||||
Total Common Stocks | 241,944,043 | 424,841,963 | ||||||||||
|
|
|
| |||||||||
| Principal Amount | ||||||||||||
| Short Term Investments (6.85%) | ||||||||||||
| $31,479,903 | Repurchase Agreement with Fixed Income Clearing Corp., dated 3/31/2020, 0.00% due 4/1/2020; Proceeds at maturity - $31,479,903; (Fully collateralized by $30,950,000 U.S. Treasury Note, 1.125% due 2/28/2025; Market value - $32,114,308)4 | 31,479,903 | 31,479,903 | |||||||||
|
|
|
| |||||||||
Total Investments (99.34%) | $ | 273,423,946 | 456,321,866 | |||||||||
|
| |||||||||||
Cash and Other Assets Less Liabilities (0.66%) | 3,036,042 | |||||||||||
|
| |||||||||||
Net Assets | $ | 459,357,908 | ||||||||||
|
| |||||||||||
| | Retail Shares (Equivalent to $21.33 per share | | $ | 308,601,119 | ||||||||
|
| |||||||||||
| | Institutional Shares (Equivalent to $22.32 per share | | $ | 135,236,639 | ||||||||
|
| |||||||||||
| | R6 Shares (Equivalent to $22.35 per share | | $ | 15,520,150 | ||||||||
|
| |||||||||||
| % | Represents percentage of net assets. |
| 1 | Non-income producing securities. |
| 2 | Foreign corporation. |
| 3 | The Adviser has reclassified/classified certain securities in or out of thissub-industry. Such reclassifications/classifications are not supported by S&P or MSCI (unaudited). |
| 4 | Level 2 security. See Note 7 regarding Fair Value Measurements. |
| ADR | American Depositary Receipt. |
| 144A | Security is exempt from registration pursuant to Rule 144A under the Securities Act of 1933. This security may be resold in transactions that are exempt from registration, normally to qualified institutional buyers. At March 31, 2020, the market value of Rule 144A securities amounted to $8,440,774 or 1.84% of net assets. |
All securities are Level 1, unless otherwise noted.
| See Notes to Financial Statements. | 23 |
| Baron Fifth Avenue Growth Fund | March 31, 2020 |
STATEMENT OF NET ASSETS (Unaudited)
MARCH 31, 2020
|
| Shares | Cost | Value | ||||||||||
| Common Stocks (96.83%) | ||||||||||||
| Communication Services (8.49%) | ||||||||||||
Interactive Media & Services (8.49%) | ||||||||||||
| 1,948 | Alphabet, Inc., Cl A1 | $ | 280,365 | $ | 2,263,479 | |||||||
| 10,283 | Alphabet, Inc., Cl C1 | 4,420,382 | 11,957,175 | |||||||||
| 64,665 | Facebook, Inc., Cl A1 | 2,342,792 | 10,786,122 | |||||||||
|
|
|
| |||||||||
Total Communication Services | 7,043,539 | 25,006,776 | ||||||||||
|
|
|
| |||||||||
| Consumer Discretionary (19.56%) | ||||||||||||
Internet & Direct Marketing Retail (19.56%) | ||||||||||||
| 92,830 | Alibaba Group Holding Limited, ADR1,2 | 7,959,441 | 18,053,578 | |||||||||
| 17,716 | Amazon.com, Inc.1 | 3,748,327 | 34,541,239 | |||||||||
| 10,320 | MercadoLibre, Inc.1 | 5,390,091 | 5,042,146 | |||||||||
|
|
|
| |||||||||
Total Consumer Discretionary | 17,097,859 | 57,636,963 | ||||||||||
|
|
|
| |||||||||
| Financials (5.81%) | ||||||||||||
Financial Exchanges & Data (5.81%) | ||||||||||||
| 54,208 | CME Group, Inc. | 5,248,889 | 9,373,105 | |||||||||
| 31,598 | S&P Global, Inc. | 6,333,165 | 7,743,090 | |||||||||
|
|
|
| |||||||||
Total Financials | 11,582,054 | 17,116,195 | ||||||||||
|
|
|
| |||||||||
| Health Care (16.94%) | ||||||||||||
Biotechnology (3.07%) | ||||||||||||
| 37,971 | Vertex Pharmaceuticals Incorporated1 | 5,909,493 | 9,035,199 | |||||||||
Health Care Equipment (4.10%) | ||||||||||||
| 24,371 | Intuitive Surgical, Inc.1 | 8,390,754 | 12,068,763 | |||||||||
Health Care Technology (5.33%) | ||||||||||||
| 100,453 | Veeva Systems, Inc., Cl A1 | 7,493,347 | 15,707,836 | |||||||||
Life Sciences Tools & Services (4.44%) | ||||||||||||
| 13,525 | 10X Genomics, Inc., Cl A1 | 776,280 | 842,878 | |||||||||
| 44,814 | Illumina, Inc.1 | 5,436,613 | 12,239,600 | |||||||||
|
|
|
| |||||||||
| 6,212,893 | 13,082,478 | |||||||||||
|
|
|
| |||||||||
Total Health Care | 28,006,487 | 49,894,276 | ||||||||||
|
|
|
| |||||||||
| Information Technology (41.88%) | ||||||||||||
Application Software (10.61%) | ||||||||||||
| 39,609 | RingCentral, Inc., Cl A1 | 4,042,927 | 8,393,543 | |||||||||
| 30,531 | ServiceNow, Inc.1,3 | 8,805,434 | 8,749,574 | |||||||||
| 190,189 | Slack Technologies, Inc., Cl A1 | 4,165,279 | 5,104,673 | |||||||||
| 71,388 | Splunk, Inc.1 | 8,677,083 | 9,011,307 | |||||||||
|
|
|
| |||||||||
| 25,690,723 | 31,259,097 | |||||||||||
Data Processing & Outsourced Services (17.42%) | ||||||||||||
| 6,218 | Adyen N.V., 144A (Netherlands)1,2 | 4,711,862 | 5,284,643 | |||||||||
| 89,358 | Fidelity National Information | 7,601,621 | 10,869,507 | |||||||||
| 66,851 | MasterCard Incorporated, Cl A | 3,750,511 | 16,148,528 | |||||||||
| 142,080 | PagSeguro Digital Ltd., Cl A1,2 | 3,453,229 | 2,746,406 | |||||||||
| 114,585 | StoneCo Ltd., Cl A1,2 | 4,316,950 | 2,494,515 | |||||||||
| 85,434 | Visa, Inc., Cl A | 2,870,563 | 13,765,126 | |||||||||
|
|
|
| |||||||||
| 26,704,736 | 51,308,725 | |||||||||||
Internet Services & Infrastructure (3.90%) | ||||||||||||
| 73,862 | Twilio Inc., Cl A1 | 8,837,984 | 6,609,911 | |||||||||
| 48,522 | Wix.com Ltd.1,2 | 4,233,003 | 4,891,988 | |||||||||
|
|
|
| |||||||||
| 13,070,987 | 11,501,899 | |||||||||||
| Shares | Cost | Value | ||||||||||
| Common Stocks (continued) | ||||||||||||
| Information Technology (continued) | ||||||||||||
IT Consulting & Other Services (3.22%) | ||||||||||||
| 51,126 | EPAM Systems, Inc.1 | $ | 4,736,195 | $ | 9,492,053 | |||||||
Semiconductor Equipment (3.48%) | ||||||||||||
| 39,157 | ASML Holding N.V.2 | 4,042,938 | 10,245,038 | |||||||||
Systems Software (3.25%) | ||||||||||||
| 81,184 | Crowdstrike Holdings, Inc., Cl A1 | 3,934,559 | 4,520,325 | |||||||||
| 140,287 | Datadog, Inc., Cl A1,3 | 3,787,749 | 5,047,526 | |||||||||
|
|
|
| |||||||||
| 7,722,308 | 9,567,851 | |||||||||||
|
|
|
| |||||||||
Total Information Technology | 81,967,887 | 123,374,663 | ||||||||||
|
|
|
| |||||||||
| Real Estate (4.15%) | ||||||||||||
Specialized REITs (4.15%) | ||||||||||||
| 19,555 | Equinix, Inc. | 3,178,515 | 12,213,466 | |||||||||
|
|
|
| |||||||||
Total Common Stocks | 148,876,341 | 285,242,339 | ||||||||||
|
|
|
| |||||||||
| Principal Amount | ||||||||||||
| Short Term Investments (2.09%) | ||||||||||||
| $6,168,996 | Repurchase Agreement with Fixed Income Clearing Corp., dated 3/31/2020, 0.00% due 4/1/2020; Proceeds at maturity - $6,168,996; (Fully collateralized by $6,065,000 U.S. Treasury Note, 1.125% due 2/28/2025; Marketvalue - $6,293,159)4 | 6,168,996 | 6,168,996 | |||||||||
|
|
|
| |||||||||
Total Investments (98.92%) | $ | 155,045,337 | 291,411,335 | |||||||||
|
| |||||||||||
Cash and Other Assets Less Liabilities (1.08%) | 3,168,279 | |||||||||||
|
| |||||||||||
Net Assets | $ | 294,579,614 | ||||||||||
|
| |||||||||||
| | Retail Shares (Equivalent to $30.30 per share | | $ | 106,009,571 | ||||||||
|
| |||||||||||
| | Institutional Shares (Equivalent to $31.02 per share | | $ | 166,671,050 | ||||||||
|
| |||||||||||
| | R6 Shares (Equivalent to $31.03 per share | | $ | 21,898,993 | ||||||||
|
| |||||||||||
| % | Represents percentage of net assets. |
| 1 | Non-income producing securities. |
| 2 | Foreign corporation. |
| 3 | The Adviser has reclassified/classified certain securities in or out of thissub-industry. Such reclassifications/classifications are not supported by S&P or MSCI (unaudited). |
| 4 | Level 2 security. See Note 7 regarding Fair Value Measurements. |
| ADR | American Depositary Receipt. |
| 144A | Security is exempt from registration pursuant to Rule 144A under the Securities Act of 1933. This security may be resold in transactions that are exempt from registration, normally to qualified institutional buyers. At March 31, 2020, the market value of Rule 144A securities amounted to $5,284,643 or 1.79% of net assets. |
All securities are Level 1, unless otherwise noted.
| 24 | See Notes to Financial Statements. |
| March 31, 2020 | Baron Discovery Fund |
STATEMENT OF NET ASSETS (Unaudited)
MARCH 31, 2020
|
| Shares | Cost | Value | ||||||||||
| Common Stocks (89.99%) | ||||||||||||
| Communication Services (3.34%) | ||||||||||||
Advertising (1.18%) | ||||||||||||
| 3,000,000 | S4 Capital PLC (United Kingdom)1,2 | $ | 7,449,217 | $ | 5,663,977 | |||||||
Movies & Entertainment (1.00%) | ||||||||||||
| 185,000 | Liberty Media Corporation-Liberty Formula One, Cl A1 | 5,634,811 | 4,776,700 | |||||||||
Publishing (1.16%) | ||||||||||||
| 450,000 | Future PLC (United Kingdom)2,4 | 6,568,962 | 5,588,372 | |||||||||
|
|
|
| |||||||||
Total Communication Services | 19,652,990 | 16,029,049 | ||||||||||
|
|
|
| |||||||||
| Consumer Discretionary (6.16%) | ||||||||||||
Casinos & Gaming (1.77%) | ||||||||||||
| 300,000 | Penn National Gaming, Inc.1 | 9,471,482 | 3,795,000 | |||||||||
| 550,000 | Red Rock Resorts, Inc., Cl A | 8,823,816 | 4,702,500 | |||||||||
|
|
|
| |||||||||
| 18,295,298 | 8,497,500 | |||||||||||
General Merchandise Stores (1.30%) | ||||||||||||
| 135,000 | Ollie’s Bargain Outlet Holdings, Inc.1 | 7,782,991 | 6,255,900 | |||||||||
Home Improvement Retail (2.51%) | ||||||||||||
| 375,000 | Floor & Decor Holdings, Inc., Cl A1 | 12,204,764 | 12,033,750 | |||||||||
Internet & Direct Marketing Retail (0.41%) | ||||||||||||
| 280,970 | The RealReal, Inc.1 | 4,813,529 | 1,969,600 | |||||||||
Restaurants (0.17%) | ||||||||||||
| 10,000 | Wingstop, Inc. | 874,199 | 797,000 | |||||||||
|
|
|
| |||||||||
Total Consumer Discretionary | 43,970,781 | 29,553,750 | ||||||||||
|
|
|
| |||||||||
| Consumer Staples (0.24%) | ||||||||||||
Agricultural Products (0.15%) | ||||||||||||
| 56,609 | Limoneira Co. | 1,239,189 | 741,578 | |||||||||
Packaged Foods & Meats (0.09%) | ||||||||||||
| 1,050,000 | Barfresh Food Group, Inc.1 | 597,200 | 420,000 | |||||||||
|
|
|
| |||||||||
Total Consumer Staples | 1,836,389 | 1,161,578 | ||||||||||
|
|
|
| |||||||||
| Financials (5.29%) | ||||||||||||
Insurance Brokers (1.26%) | ||||||||||||
| 575,000 | BRP Group, Inc., Cl A1 | 9,363,917 | 6,066,250 | |||||||||
Property & Casualty Insurance (4.03%) | ||||||||||||
| 185,000 | Kinsale Capital Group, Inc. | 8,344,077 | 19,338,050 | |||||||||
|
|
|
| |||||||||
Total Financials | 17,707,994 | 25,404,300 | ||||||||||
|
|
|
| |||||||||
| Health Care (29.46%) | ||||||||||||
Biotechnology (6.35%) | ||||||||||||
| 85,000 | Applied Therapeutics, Inc.1 | 4,465,158 | 2,778,650 | |||||||||
| 146,000 | Biohaven Pharmaceutical Holding Co. Ltd.1,2 | 6,453,537 | 4,968,380 | |||||||||
| 290,000 | Emergent BioSolutions, Inc.1 | 13,932,817 | 16,779,400 | |||||||||
| 188,500 | Esperion Therapeutics, Inc.1 | 8,975,675 | 5,943,405 | |||||||||
|
|
|
| |||||||||
| 33,827,187 | 30,469,835 | |||||||||||
Health Care Equipment (10.67%) | ||||||||||||
| 505,084 | AxoGen, Inc.1 | 8,267,052 | 5,252,873 | |||||||||
| 256,000 | Axonics Modulation Technologies, Inc.1 | 8,388,639 | 6,504,960 | |||||||||
| 285,000 | Inogen, Inc.1 | 13,497,438 | 14,723,100 | |||||||||
| 50,000 | Inspire Medical Systems, Inc.1,3 | 2,923,748 | 3,014,000 | |||||||||
| 350,208 | Silk Road Medical, Inc.1,3 | 12,015,855 | 11,024,548 | |||||||||
| Shares | Cost | Value | ||||||||||
| Common Stocks (continued) | ||||||||||||
| Health Care (continued) | ||||||||||||
Health Care Equipment (continued) | ||||||||||||
| 142,000 | Tactile Systems Technology, Inc.1 | $ | 7,062,477 | $ | 5,702,720 | |||||||
| 1,985,000 | ViewRay, Inc.1 | 9,544,839 | 4,962,500 | |||||||||
|
|
|
| |||||||||
| 61,700,048 | 51,184,701 | |||||||||||
Health Care Supplies (2.23%) | ||||||||||||
| 1,529,967 | Cerus Corp.1 | 7,100,382 | 7,114,347 | |||||||||
| 1,815,363 | Sientra, Inc.1 | 14,032,382 | 3,612,572 | |||||||||
|
|
|
| |||||||||
| 21,132,764 | 10,726,919 | |||||||||||
Health Care Technology (1.42%) | ||||||||||||
| 44,000 | Teladoc Health, Inc.1 | 1,071,245 | 6,820,440 | |||||||||
Life Sciences Tools & Services (5.22%) | ||||||||||||
| 164,900 | Accelerate Diagnostics, Inc.1 | 2,520,363 | 1,373,617 | |||||||||
| 507,036 | CareDx, Inc.1,3 | 9,858,043 | 11,068,596 | |||||||||
| 519,190 | Veracyte, Inc.1,3 | 12,884,315 | 12,621,509 | |||||||||
|
|
|
| |||||||||
| 25,262,721 | 25,063,722 | |||||||||||
Managed Health Care (1.16%) | ||||||||||||
| 262,873 | Progyny, Inc.1 | 3,417,349 | 5,570,279 | |||||||||
Pharmaceuticals (2.41%) | ||||||||||||
| 506,732 | Revance Therapeutics, Inc.1 | 7,372,477 | 7,499,634 | |||||||||
| 3,831,500 | TherapeuticsMD, Inc.1 | 16,199,094 | 4,061,390 | |||||||||
|
|
|
| |||||||||
| 23,571,571 | 11,561,024 | |||||||||||
|
|
|
| |||||||||
Total Health Care | 169,982,885 | 141,396,920 | ||||||||||
|
|
|
| |||||||||
| Industrials (17.30%) | ||||||||||||
Aerospace & Defense (5.23%) | ||||||||||||
| 625,000 | Kratos Defense & Security Solutions, Inc.1 | 10,710,110 | 8,650,000 | |||||||||
| 230,600 | Mercury Systems, Inc.1 | 7,155,937 | 16,451,004 | |||||||||
|
|
|
| |||||||||
| 17,866,047 | 25,101,004 | |||||||||||
Building Products (1.84%) | ||||||||||||
| 110,000 | Trex Company, Inc.1 | 7,416,878 | 8,815,400 | |||||||||
Heavy Electrical Equipment (2.18%) | ||||||||||||
| 707,000 | TPI Composites, Inc.1 | 15,134,505 | 10,449,460 | |||||||||
Industrial Conglomerates (0.77%) | ||||||||||||
| 175,000 | Raven Industries, Inc. | 5,866,730 | 3,715,250 | |||||||||
Industrial Machinery (4.42%) | ||||||||||||
| 86,600 | ESCO Technologies, Inc. | 4,658,024 | 6,573,806 | |||||||||
| 230,000 | Helios Technologies, Inc. | 9,893,077 | 8,721,600 | |||||||||
| 237,500 | Kornit Digital Ltd.1,2 | 3,984,915 | 5,911,375 | |||||||||
|
|
|
| |||||||||
| 18,536,016 | 21,206,781 | |||||||||||
Trading Companies & Distributors (2.86%) | ||||||||||||
| 186,500 | SiteOne Landscape Supply, Inc.1 | 10,148,112 | 13,730,130 | |||||||||
|
|
|
| |||||||||
Total Industrials | 74,968,288 | 83,018,025 | ||||||||||
|
|
|
| |||||||||
| Information Technology (21.78%) | ||||||||||||
Application Software (5.02%) | ||||||||||||
| 65,000 | Bill.Com Holdings, Inc.1 | 2,637,565 | 2,223,000 | |||||||||
| 125,000 | Everbridge, Inc.1 | 11,937,603 | 13,295,000 | |||||||||
| 250,000 | Medallia, Inc.1 | 6,797,416 | 5,010,000 | |||||||||
| 350,000 | Yext, Inc.1 | 4,883,046 | 3,566,500 | |||||||||
|
|
|
| |||||||||
| 26,255,630 | 24,094,500 | |||||||||||
| See Notes to Financial Statements. | 25 |
| Baron Discovery Fund | March 31, 2020 |
STATEMENT OF NET ASSETS (Unaudited) (Continued)
MARCH 31, 2020
|
| Shares | Cost | Value | ||||||||||
| Common Stocks (continued) | ||||||||||||
| Information Technology (continued) | ||||||||||||
Data Processing & Outsourced Services (1.79%) | ||||||||||||
| 600,000 | Repay Holdings Corporation, Cl A1 | $ | 8,426,350 | $ | 8,610,000 | |||||||
Electronic Equipment & Instruments (0.71%) | ||||||||||||
| 10,431 | Novanta, Inc.1,2 | 272,590 | 833,228 | |||||||||
| 200,000 | PAR Technology Corp.1 | 3,758,437 | 2,572,000 | |||||||||
|
|
|
| |||||||||
| 4,031,027 | 3,405,228 | |||||||||||
IT Consulting & Other Services (2.67%) | ||||||||||||
| 365,000 | Endava plc, ADR1,2 | 9,089,482 | 12,833,400 | |||||||||
Semiconductor Equipment (3.17%) | ||||||||||||
| 90,000 | Advanced Energy Industries, Inc.1 | 6,510,017 | 4,364,100 | |||||||||
| 190,000 | Ichor Holdings Ltd.1,2 | 3,054,847 | 3,640,400 | |||||||||
| 220,000 | Nova Measuring Instruments Ltd.1,2 | 5,201,368 | 7,183,000 | |||||||||
|
|
|
| |||||||||
| 14,766,232 | 15,187,500 | |||||||||||
Systems Software (8.42%) | ||||||||||||
| 266,675 | Dynatrace, Inc.1,3 | 4,811,732 | 6,357,532 | |||||||||
| 472,131 | Ping Identity Holding Corp.1 | 7,764,344 | 9,452,063 | |||||||||
| 175,000 | Qualys, Inc.1 | 10,424,382 | 15,223,250 | |||||||||
| 147,000 | Varonis Systems, Inc.1 | 9,207,436 | 9,359,490 | |||||||||
|
|
|
| |||||||||
| 32,207,894 | 40,392,335 | |||||||||||
|
|
|
| |||||||||
Total Information Technology | 94,776,615 | 104,522,963 | ||||||||||
|
|
|
| |||||||||
| Real Estate (5.90%) | ||||||||||||
Industrial REITs (2.56%) | ||||||||||||
| 300,000 | Rexford Industrial Realty, Inc. | 10,330,498 | 12,303,000 | |||||||||
Specialized REITs (3.34%) | ||||||||||||
| 470,000 | Americold Realty Trust3 | 9,905,736 | 15,998,800 | |||||||||
|
|
|
| |||||||||
Total Real Estate | 20,236,234 | 28,301,800 | ||||||||||
|
|
|
| |||||||||
| Unclassified (0.52%) | ||||||||||||
Unclassified (0.52%) | ||||||||||||
| 200,000 | Diamond Eagle | 2,495,795 | 2,468,000 | |||||||||
|
|
|
| |||||||||
Total Common Stocks | 445,627,971 | 431,856,385 | ||||||||||
|
|
|
| |||||||||
| Principal Amount | Cost | Value | ||||||||||
| Short Term Investments (9.58%) | ||||||||||||
| $45,968,047 | Repurchase Agreement with Fixed Income Clearing Corp., dated 3/31/2020, 0.00% due 4/1/2020; Proceeds atmaturity - $45,968,047; (Fully collateralized by $45,190,000 U.S. Treasury Note, 1.125% due 2/28/2025;Market value - $46,890,003)4 | $ | 45,968,047 | $ | 45,968,047 | |||||||
|
|
|
| |||||||||
Total Investments (99.57%) | $ | 491,596,018 | 477,824,432 | |||||||||
|
| |||||||||||
Cash and Other Assets Less Liabilities (0.43%) | 2,056,230 | |||||||||||
|
| |||||||||||
Net Assets | $ | 479,880,662 | ||||||||||
|
| |||||||||||
| | Retail Shares (Equivalent to $17.07 per share | | $ | 94,173,146 | ||||||||
|
| |||||||||||
| | Institutional Shares (Equivalent to $17.33 per share | | $ | 378,896,098 | ||||||||
|
| |||||||||||
| | R6 Shares (Equivalent to $17.33 per share | | $ | 6,811,418 | ||||||||
|
| |||||||||||
| % | Represents percentage of net assets. |
| 1 | Non-income producing securities. |
| 2 | Foreign corporation. |
| 3 | The Adviser has reclassified/classified certain securities in or out of thissub-industry. Such reclassifications/classifications are not supported by S&P or MSCI (unaudited). |
| 4 | Level 2 security. See Note 7 regarding Fair Value Measurements. |
| ADR | American Depositary Receipt. |
All securities are Level 1, unless otherwise noted.
| 26 | See Notes to Financial Statements. |
| March 31, 2020 | Baron Durable Advantage Fund |
STATEMENT OF NET ASSETS (Unaudited)
MARCH 31, 2020
|
| Shares | Cost | Value | ||||||||||
| Common Stocks (93.75%) | ||||||||||||
| Communication Services (8.31%) | ||||||||||||
Cable & Satellite (1.69%) | ||||||||||||
| 320 | Charter Communications, Inc., Cl A1 | $ | 104,254 | $ | 139,619 | |||||||
Interactive Media & Services (6.62%) | ||||||||||||
| 298 | Alphabet, Inc., Cl C1 | 368,190 | 346,517 | |||||||||
| 1,191 | Facebook, Inc., Cl A1 | 237,365 | 198,659 | |||||||||
|
|
|
| |||||||||
| 605,555 | 545,176 | |||||||||||
|
|
|
| |||||||||
Total Communication Services | 709,809 | 684,795 | ||||||||||
|
|
|
| |||||||||
| Consumer Staples (5.30%) | ||||||||||||
Distillers & Vintners (2.39%) | ||||||||||||
| 1,374 | Constellation Brands, Inc., Cl A | 277,817 | 196,977 | |||||||||
Hypermarkets & Super Centers (1.59%) | ||||||||||||
| 460 | Costco Wholesale Corp. | 104,945 | 131,160 | |||||||||
Personal Products (1.32%) | ||||||||||||
| 681 | The Estée Lauder Companies, Inc., Cl A | 109,587 | 108,510 | |||||||||
|
|
|
| |||||||||
Total Consumer Staples | 492,349 | 436,647 | ||||||||||
|
|
|
| |||||||||
| Financials (15.73%) | ||||||||||||
Asset Management & Custody Banks (2.64%) | ||||||||||||
| 328 | BlackRock, Inc. | 160,532 | 144,310 | |||||||||
| 1,660 | Brookfield Asset Management, Inc., Cl A2 | 103,739 | 73,455 | |||||||||
|
|
|
| |||||||||
| 264,271 | 217,765 | |||||||||||
Financial Exchanges & Data (13.09%) | ||||||||||||
| 808 | CME Group, Inc. | 125,886 | 139,711 | |||||||||
| 1,928 | Moody’s Corp. | 365,675 | 407,772 | |||||||||
| 400 | MSCI, Inc. | 122,526 | 115,584 | |||||||||
| 1,695 | S&P Global, Inc. | 369,916 | 415,360 | |||||||||
|
|
|
| |||||||||
| 984,003 | 1,078,427 | |||||||||||
|
|
|
| |||||||||
Total Financials | 1,248,274 | 1,296,192 | ||||||||||
|
|
|
| |||||||||
| Health Care (19.08%) | ||||||||||||
Health Care Equipment (4.06%) | ||||||||||||
| 2,419 | Danaher Corp. | 301,392 | 334,814 | |||||||||
Life Sciences Tools & Services (8.86%) | ||||||||||||
| 1,550 | Agilent Technologies, Inc. | 107,517 | 111,011 | |||||||||
| 1,819 | IQVIA Holdings, Inc.1 | 264,679 | 196,197 | |||||||||
| 189 | Mettler-Toledo International, Inc.1 | 121,919 | 130,507 | |||||||||
| 1,030 | Thermo Fisher Scientific, Inc. | 308,720 | 292,108 | |||||||||
|
|
|
| |||||||||
| 802,835 | 729,823 | |||||||||||
Managed Health Care (3.29%) | ||||||||||||
| 1,086 | UnitedHealth Group, Incorporated | 249,999 | 270,826 | |||||||||
Pharmaceuticals (2.87%) | ||||||||||||
| 5,303 | AstraZeneca PLC, ADR2 | 223,155 | 236,832 | |||||||||
|
|
|
| |||||||||
Total Health Care | 1,577,381 | 1,572,295 | ||||||||||
|
|
|
| |||||||||
| Industrials (5.90%) | ||||||||||||
Aerospace & Defense (2.11%) | ||||||||||||
| 2,725 | HEICO Corp., Cl A | 258,043 | 174,128 | |||||||||
Research & Consulting Services (3.79%) | ||||||||||||
| 5,202 | IHS Markit Ltd.2 | 304,760 | 312,120 | |||||||||
|
|
|
| |||||||||
Total Industrials | 562,803 | 486,248 | ||||||||||
|
|
|
| |||||||||
| Information Technology (33.96%) | ||||||||||||
Application Software (7.57%) | ||||||||||||
| 1,384 | Adobe, Inc.1 | 413,436 | 440,444 | |||||||||
| 4,181 | SS&C Technologies Holdings, Inc. | 226,869 | 183,211 | |||||||||
|
|
|
| |||||||||
| 640,305 | 623,655 | |||||||||||
| Shares | Cost | Value | ||||||||||
| Common Stocks (continued) | ||||||||||||
| Information Technology (continued) | ||||||||||||
Data Processing & Outsourced Services (10.19%) | ||||||||||||
| 2,500 | Fidelity National Information Services, Inc. | $ | 345,662 | $ | 304,100 | |||||||
| 1,494 | MasterCard Incorporated, Cl A | 311,429 | 360,891 | |||||||||
| 1,086 | Visa, Inc., Cl A | 224,841 | 174,976 | |||||||||
|
|
|
| |||||||||
| 881,932 | 839,967 | |||||||||||
Electronic Manufacturing Services (1.50%) | ||||||||||||
| 1,958 | TE Connectivity Ltd.2 | 186,028 | 123,315 | |||||||||
IT Consulting & Other Services (4.24%) | ||||||||||||
| 2,141 | Accenture plc, Cl A2 | 389,568 | 349,540 | |||||||||
Semiconductor Equipment (1.66%) | ||||||||||||
| 522 | ASML Holding N.V.2 | 103,004 | 136,576 | |||||||||
Semiconductors (1.63%) | ||||||||||||
| 1,347 | Texas Instruments, Inc. | 157,714 | 134,606 | |||||||||
Systems Software (5.97%) | ||||||||||||
| 3,120 | Microsoft Corp. | 356,710 | 492,055 | |||||||||
Technology Hardware, Storage & Peripherals (1.20%) | ||||||||||||
| 390 | Apple, Inc. | 75,379 | 99,173 | |||||||||
|
|
|
| |||||||||
Total Information Technology | 2,790,640 | 2,798,887 | ||||||||||
|
|
|
| |||||||||
| Real Estate (5.47%) | ||||||||||||
Specialized REITs (5.47%) | ||||||||||||
| 1,501 | Alexandria Real Estate Equities, Inc.3 | 225,486 | 205,727 | |||||||||
| 392 | Equinix, Inc. | 200,217 | 244,832 | |||||||||
|
|
|
| |||||||||
Total Real Estate | 425,703 | 450,559 | ||||||||||
|
|
|
| |||||||||
Total Common Stocks | 7,806,959 | 7,725,623 | ||||||||||
|
|
|
| |||||||||
| Principal Amount | ||||||||||||
| Short Term Investments (5.82%) | ||||||||||||
| $479,590 | Repurchase Agreement with Fixed Income Clearing Corp., dated 3/31/2020, 0.00% due 4/1/2020; Proceeds atmaturity - $479,590; (Fully collateralized by $230,000 U.S. Treasury Inflation-Indexed Bond, 3.875% due 4/15/2029; Market value - $494,283)4 | 479,590 | 479,590 | |||||||||
|
|
|
| |||||||||
Total Investments (99.57%) | $ | 8,286,549 | 8,205,213 | |||||||||
|
| |||||||||||
Cash and Other Assets Less Liabilities (0.43%) | 35,775 | |||||||||||
|
| |||||||||||
Net Assets | $ | 8,240,988 | ||||||||||
|
| |||||||||||
| | Retail Shares (Equivalent to $10.90 per share | $ | 3,005,524 | |||||||||
|
| |||||||||||
| | Institutional Shares (Equivalent to $10.96 per share | $ | 3,387,730 | |||||||||
|
| |||||||||||
| | R6 Shares (Equivalent to $10.96 per share | $ | 1,847,734 | |||||||||
|
| |||||||||||
| % | Represents percentage of net assets. |
| 1 | Non-income producing securities. |
| 2 | Foreign corporation. |
| 3 | The Adviser has reclassified/classified certain securities in or out of thissub-industry. Such reclassifications/classifications are not supported by S&P or MSCI (unaudited). |
| 4 | Level 2 security. See Note 7 regarding Fair Value Measurements. |
| ADR | American Depositary Receipt. |
All securities are Level 1, unless otherwise noted.
| See Notes to Financial Statements. | 27 |
| Baron Funds | March 31, 2020 |
STATEMENTS OF ASSETS AND LIABILITIES (Unaudited)
MARCH 31, 2020
|
| Baron Asset Fund | Baron Growth Fund | Baron Small Cap Fund | Baron Opportunity Fund | |||||||||||||
Assets: | ||||||||||||||||
Investments in securities, at value* | ||||||||||||||||
Unaffiliated investments | $ | 3,698,521,537 | $ | 4,742,615,534 | $ | 2,903,956,853 | $ | 456,321,866 | ||||||||
“Affiliated” investments | — | 682,980,437 | 120,595,500 | — | ||||||||||||
|
|
|
|
|
|
|
| |||||||||
Total investments, at value | 3,698,521,537 | 5,425,595,971 | 3,024,552,353 | 456,321,866 | ||||||||||||
Foreign currency, at value† | — | — | — | — | ||||||||||||
Cash | — | 84,807 | — | 432,400 | ||||||||||||
Receivable for shares sold | 5,113,604 | 7,084,390 | 7,973,204 | 5,347,336 | ||||||||||||
Receivable for securities sold | 3,628,082 | 12,352,669 | 1,462,350 | — | ||||||||||||
Dividends and interest receivable | 1,829,954 | 5,713,288 | 1,055,562 | 55,745 | ||||||||||||
Prepaid expenses | 41,014 | 65,014 | 34,712 | 4,177 | ||||||||||||
|
|
|
|
|
|
|
| |||||||||
| 3,709,134,191 | 5,450,896,139 | 3,035,078,181 | 462,161,524 | |||||||||||||
|
|
|
|
|
|
|
| |||||||||
Liabilities: | ||||||||||||||||
Payable for shares redeemed | 2,912,806 | 5,720,381 | 3,957,863 | 752,624 | ||||||||||||
Payable for securities purchased | 1,159,040 | — | 1,986,440 | 1,962,250 | ||||||||||||
Trustee fees payable (Note 4) | 66,756 | 104,312 | 61,773 | 6,955 | ||||||||||||
Distribution fees payable (Note 4) | 792 | 213 | 467 | 506 | ||||||||||||
Investment advisory fees payable (Note 4) | 517 | 101 | 476 | 818 | ||||||||||||
Due to custodian bank | — | — | — | — | ||||||||||||
Payable for borrowings against line of credit | — | 29,900,000 | — | — | ||||||||||||
Accrued expenses and other payables | 439,912 | 539,172 | 500,765 | 80,463 | ||||||||||||
|
|
|
|
|
|
|
| |||||||||
| 4,579,823 | 36,264,179 | 6,507,784 | 2,803,616 | |||||||||||||
|
|
|
|
|
|
|
| |||||||||
Net Assets | $ | 3,704,554,368 | $ | 5,414,631,960 | $ | 3,028,570,397 | $ | 459,357,908 | ||||||||
|
|
|
|
|
|
|
| |||||||||
Net Assets consist of: | ||||||||||||||||
Paid-in capital | $ | 1,579,240,344 | $ | 1,467,781,671 | $ | 1,610,843,131 | $ | 268,453,677 | ||||||||
Distributable earnings/(losses) | 2,125,314,024 | 3,946,850,289 | 1,417,727,266 | 190,904,231 | ||||||||||||
|
|
|
|
|
|
|
| |||||||||
Net Assets | $ | 3,704,554,368 | $ | 5,414,631,960 | $ | 3,028,570,397 | $ | 459,357,908 | ||||||||
|
|
|
|
|
|
|
| |||||||||
Retail Shares: | ||||||||||||||||
Net Assets | $ | 1,882,653,141 | $ | 1,942,644,821 | $ | 1,073,518,506 | $ | 308,601,119 | ||||||||
Shares Outstanding ($0.01 par value; indefinite shares authorized) | 26,194,718 | 30,267,259 | 47,715,207 | 14,466,529 | ||||||||||||
|
|
|
|
|
|
|
| |||||||||
Net Asset Value and Offering Price Per Share | $ | 71.87 | $ | 64.18 | $ | 22.50 | $ | 21.33 | ||||||||
|
|
|
|
|
|
|
| |||||||||
Institutional Shares: | ||||||||||||||||
Net Assets | $ | 1,721,593,378 | $ | 3,349,033,732 | $ | 1,819,592,288 | $ | 135,236,639 | ||||||||
Shares Outstanding ($0.01 par value; indefinite shares authorized) | 22,961,563 | 50,300,846 | 77,030,389 | 6,058,139 | ||||||||||||
|
|
|
|
|
|
|
| |||||||||
Net Asset Value and Offering Price Per Share | $ | 74.98 | $ | 66.58 | $ | 23.62 | $ | 22.32 | ||||||||
|
|
|
|
|
|
|
| |||||||||
R6 Shares: | ||||||||||||||||
Net Assets | $ | 100,307,849 | $ | 122,953,407 | $ | 135,459,603 | $ | 15,520,150 | ||||||||
Shares Outstanding ($0.01 par value; indefinite shares authorized) | �� | 1,338,071 | 1,846,475 | 5,736,246 | 694,554 | |||||||||||
|
|
|
|
|
|
|
| |||||||||
Net Asset Value and Offering Price Per Share | $ | 74.96 | $ | 66.59 | $ | 23.61 | $ | 22.35 | ||||||||
|
|
|
|
|
|
|
| |||||||||
*Investments in securities, at cost: | ||||||||||||||||
Unaffiliated investments | $ | 1,573,458,916 | $ | 1,429,778,797 | $ | 1,673,334,425 | $ | 273,423,946 | ||||||||
“Affiliated” investments | — | 186,928,859 | 129,760,518 | — | ||||||||||||
|
|
|
|
|
|
|
| |||||||||
Total investments, at cost | $ | 1,573,458,916 | $ | 1,616,707,656 | $ | 1,803,094,943 | $ | 273,423,946 | ||||||||
|
|
|
|
|
|
|
| |||||||||
†Foreign currency, at cost: | $ | — | $ | — | $ | — | $ | — | ||||||||
|
|
|
|
|
|
|
| |||||||||
| 28 | See Notes to Financial Statements. |
| March 31, 2020 | Baron Funds |
STATEMENTS OF ASSETS AND LIABILITIES (Unaudited) (Continued)
MARCH 31, 2020
|
| Baron Fifth Avenue Growth Fund | Baron Discovery Fund | Baron Durable Advantage Fund | ||||||||||
Assets: | ||||||||||||
Investments in securities, at value* | ||||||||||||
Unaffiliated investments | $ | 291,411,335 | $ | 477,824,432 | $ | 8,205,213 | ||||||
“Affiliated” investments | — | — | — | |||||||||
|
|
|
|
|
| |||||||
Total investments, at value | 291,411,335 | 477,824,432 | 8,205,213 | |||||||||
Foreign currency, at value† | 2,406,741 | — | — | |||||||||
Cash | — | — | 9,311 | |||||||||
Receivable for shares sold | 813,395 | 5,177,848 | 71,060 | |||||||||
Receivable for securities sold | 1,058,157 | 773,501 | — | |||||||||
Dividends and interest receivable | — | 181,648 | 2,613 | |||||||||
Prepaid expenses | 3,073 | 10,181 | 85 | |||||||||
|
|
|
|
|
| |||||||
| 295,692,701 | 483,967,610 | 8,288,282 | ||||||||||
|
|
|
|
|
| |||||||
Liabilities: | ||||||||||||
Payable for shares redeemed | 611,267 | 1,046,270 | — | |||||||||
Payable for securities purchased | — | 2,495,795 | — | |||||||||
Trustee fees payable (Note 4) | 4,649 | 8,380 | 88 | |||||||||
Distribution fees payable (Note 4) | 553 | 270 | 259 | |||||||||
Investment advisory fees payable (Note 4) | 249 | 273 | — | |||||||||
Due to custodian bank | 434,844 | 432,400 | — | |||||||||
Payable for borrowings against line of credit | — | — | — | |||||||||
Accrued expenses and other payables | 61,525 | 103,560 | 46,947 | |||||||||
|
|
|
|
|
| |||||||
| 1,113,087 | 4,086,948 | 47,294 | ||||||||||
|
|
|
|
|
| |||||||
Net Assets | $ | 294,579,614 | $ | 479,880,662 | $ | 8,240,988 | ||||||
|
|
|
|
|
| |||||||
Net Assets consist of: | ||||||||||||
Paid-in capital | $ | 154,610,804 | $ | 499,510,731 | $ | 8,403,494 | ||||||
Distributable earnings/(losses) | 139,968,810 | (19,630,069 | ) | (162,506 | ) | |||||||
|
|
|
|
|
| |||||||
Net Assets | $ | 294,579,614 | $ | 479,880,662 | $ | 8,240,988 | ||||||
|
|
|
|
|
| |||||||
Retail Shares: | ||||||||||||
Net Assets | $ | 106,009,571 | $ | 94,173,146 | $ | 3,005,524 | ||||||
Shares Outstanding ($0.01 par value; indefinite shares authorized) | 3,498,402 | 5,517,474 | 275,636 | |||||||||
|
|
|
|
|
| |||||||
Net Asset Value and Offering Price Per Share | $ | 30.30 | $ | 17.07 | $ | 10.90 | ||||||
|
|
|
|
|
| |||||||
Institutional Shares: | ||||||||||||
Net Assets | $ | 166,671,050 | $ | 378,896,098 | $ | 3,387,730 | ||||||
Shares Outstanding ($0.01 par value; indefinite shares authorized) | 5,372,632 | 21,858,772 | 309,101 | |||||||||
|
|
|
|
|
| |||||||
Net Asset Value and Offering Price Per Share | $ | 31.02 | $ | 17.33 | $ | 10.96 | ||||||
|
|
|
|
|
| |||||||
R6 Shares: | ||||||||||||
Net Assets | $ | 21,898,993 | $ | 6,811,418 | $ | 1,847,734 | ||||||
Shares Outstanding ($0.01 par value; indefinite shares authorized) | 705,663 | 392,938 | 168,591 | |||||||||
|
|
|
|
|
| |||||||
Net Asset Value and Offering Price Per Share | $ | 31.03 | $ | 17.33 | $ | 10.96 | ||||||
|
|
|
|
|
| |||||||
*Investments in securities, at cost: | ||||||||||||
Unaffiliated investments | $ | 155,045,337 | $ | 491,596,018 | $ | 8,286,549 | ||||||
“Affiliated” investments | — | — | — | |||||||||
|
|
|
|
|
| |||||||
Total investments, at cost | $ | 155,045,337 | $ | 491,596,018 | $ | 8,286,549 | ||||||
|
|
|
|
|
| |||||||
†Foreign currency, at cost: | $ | 2,398,853 | $ | — | $ | — | ||||||
|
|
|
|
|
| |||||||
| See Notes to Financial Statements. | 29 |
| Baron Funds | March 31, 2020 |
STATEMENTS OF OPERATIONS (Unaudited)
FOR THE SIX MONTHS ENDED MARCH 31, 2020
|
| Baron Asset Fund | Baron Growth Fund | Baron Small Cap Fund | Baron Opportunity Fund | |||||||||||||
Investment income: | ||||||||||||||||
Income: | ||||||||||||||||
Dividends — Unaffiliated investments | $ | 13,197,890 | $ | 32,691,934 | $ | 12,636,541 | $ | 501,670 | ||||||||
Dividends — “Affiliated” investments | — | 12,267,200 | — | — | ||||||||||||
Interest | 197,148 | 7,158 | 251,362 | 37,135 | ||||||||||||
Securities lending income, net | — | — | 165,655 | — | ||||||||||||
Foreign taxes withheld on dividends | — | (39,686 | ) | (59,750 | ) | — | ||||||||||
|
|
|
|
|
|
|
| |||||||||
Total income | 13,395,038 | 44,926,606 | 12,993,808 | 538,805 | ||||||||||||
|
|
|
|
|
|
|
| |||||||||
Expenses: | ||||||||||||||||
Investment advisory fees (Note 4) | 22,174,901 | 35,012,117 | 19,622,694 | 2,234,711 | ||||||||||||
Distribution fees — Retail Shares (Note 4) | 2,835,494 | 3,184,504 | 1,798,236 | 387,783 | ||||||||||||
Shareholder servicing agent fees and expenses — Retail Shares | 142,140 | 112,065 | 83,130 | 32,170 | ||||||||||||
Shareholder servicing agent fees and expenses — Institutional Shares | 38,485 | 70,360 | 40,070 | 7,330 | ||||||||||||
Shareholder servicing agent fees and expenses — R6 Shares | 2,581 | 3,418 | 3,831 | 366 | ||||||||||||
Reports to shareholders | 536,200 | 497,700 | 523,300 | 41,480 | ||||||||||||
Trustee fees and expenses (Note 4) | 154,677 | 236,552 | 134,017 | 14,984 | ||||||||||||
Registration and filing fees | 106,320 | 120,660 | 85,580 | 72,000 | ||||||||||||
Custodian and fund accounting fees | 78,010 | 121,865 | 71,095 | 12,840 | ||||||||||||
Professional fees | 56,550 | 118,000 | 67,485 | 20,258 | ||||||||||||
Administration fees | 30,110 | 33,547 | 29,217 | 23,000 | ||||||||||||
Insurance expense | 19,395 | 34,395 | 22,035 | 2,334 | ||||||||||||
Line of credit fees | 18,500 | 28,615 | 16,960 | 1,852 | ||||||||||||
Miscellaneous expenses | 2,156 | 3,743 | 2,271 | 2,157 | ||||||||||||
|
|
|
|
|
|
|
| |||||||||
Total operating expenses | 26,195,519 | 39,577,541 | 22,499,921 | 2,853,265 | ||||||||||||
Interest expense on borrowings | — | 152,148 | — | 7,474 | ||||||||||||
|
|
|
|
|
|
|
| |||||||||
Total expenses | 26,195,519 | 39,729,689 | 22,499,921 | 2,860,739 | ||||||||||||
|
|
|
|
|
|
|
| |||||||||
Net investment income (loss) | (12,800,481 | ) | 5,196,917 | (9,506,113 | ) | (2,321,934 | ) | |||||||||
|
|
|
|
|
|
|
| |||||||||
Realized and unrealized gain (loss) on investments: | ||||||||||||||||
Net realized gain (loss) on investments sold — Unaffiliated investments | 40,125,684 | 213,313,572 | 227,276,358 | 19,749,422 | ||||||||||||
Net realized gain (loss) on investments sold — “Affiliated” investments | — | (48,679,457 | ) | — | — | |||||||||||
Net realized gain (loss) on foreign currency transactions | — | 477 | 11,152 | 3,472 | ||||||||||||
Change in net unrealized appreciation (depreciation) of: | ||||||||||||||||
Investments — Unaffiliated investments | (488,351,675 | ) | (952,381,561 | ) | (769,358,172 | ) | 650,559 | |||||||||
Investments — “Affiliated” investments | — | (212,600,557 | ) | (20,412,664 | ) | — | ||||||||||
Foreign currency translations | — | 5,559 | (5,351 | ) | — | |||||||||||
|
|
|
|
|
|
|
| |||||||||
Net gain (loss) on investments | (448,225,991 | ) | (1,000,341,967 | ) | (562,488,677 | ) | 20,403,453 | |||||||||
|
|
|
|
|
|
|
| |||||||||
Net increase (decrease) in net assets resulting from operations | $ | (461,026,472 | ) | $ | (995,145,050 | ) | $ | (571,994,790 | ) | $ | 18,081,519 | |||||
|
|
|
|
|
|
|
| |||||||||
| 30 | See Notes to Financial Statements. |
| March 31, 2020 | Baron Funds |
STATEMENTS OF OPERATIONS (Unaudited)
FOR THE SIX MONTHS ENDED MARCH 31, 2020
|
| Baron Fifth Avenue Growth Fund | Baron Discovery Fund | Baron Durable Advantage Fund | ||||||||||
Investment income: | ||||||||||||
Income: | ||||||||||||
Dividends — Unaffiliated investments | $ | 594,006 | $ | 747,615 | $ | 46,075 | ||||||
Dividends — Affiliated investments | — | — | — | |||||||||
Interest | 21,942 | 94,112 | 985 | |||||||||
Securities lending income, net | — | 21,371 | — | |||||||||
Foreign taxes withheld on dividends | (6,870 | ) | — | (256 | ) | |||||||
|
|
|
|
|
| |||||||
Total income | 609,078 | 863,098 | 46,804 | |||||||||
|
|
|
|
|
| |||||||
Expenses: | ||||||||||||
Investment advisory fees (Note 4) | 1,137,222 | 2,848,175 | 27,396 | |||||||||
Distribution fees — Retail Shares (Note 4) | 149,376 | 151,390 | 3,620 | |||||||||
Shareholder servicing agent fees and expenses — Retail Shares | 15,396 | 14,208 | 6,461 | |||||||||
Shareholder servicing agent fees and expenses — Institutional Shares | 8,382 | 18,120 | 4,973 | |||||||||
Shareholder servicing agent fees and expenses — R6 Shares | 535 | 176 | 20 | |||||||||
Reports to shareholders | 18,200 | 71,330 | 215 | |||||||||
Trustee fees and expenses (Note 4) | 10,694 | 19,392 | 218 | |||||||||
Registration and filing fees | 47,040 | 56,240 | 48,960 | |||||||||
Custodian and fund accounting fees | 11,662 | 17,448 | 4,323 | |||||||||
Professional fees | 19,275 | 27,938 | 17,564 | |||||||||
Administration fees | 22,842 | 23,254 | 22,129 | |||||||||
Insurance expense | 1,452 | 2,535 | 27 | |||||||||
Line of credit fees | 1,338 | 2,326 | 28 | |||||||||
Miscellaneous expenses | 2,157 | 2,156 | 3,088 | |||||||||
|
|
|
|
|
| |||||||
Total operating expenses | 1,445,571 | 3,254,688 | 139,022 | |||||||||
Reimbursement of expenses by Adviser — Retail Shares (Note 4) | (34,933 | ) | (19 | ) | (38,007 | ) | ||||||
Reimbursement of expenses by Adviser — Institutional Shares (Note 4) | (38,336 | ) | — | (58,826 | ) | |||||||
Reimbursement of expenses by Adviser — R6 Shares (Note 4) | (4,474 | ) | — | (9,066 | ) | |||||||
|
|
|
|
|
| |||||||
Net expenses | 1,367,828 | 3,254,669 | 33,123 | |||||||||
|
|
|
|
|
| |||||||
Net investment income (loss) | (758,750 | ) | (2,391,571 | ) | 13,681 | |||||||
|
|
|
|
|
| |||||||
Realized and unrealized gain (loss) on investments: | ||||||||||||
Net realized gain (loss) on investments sold — Unaffiliated investments | 4,308,381 | 4,182,699 | 22,707 | |||||||||
Net realized gain (loss) on investments sold — “Affiliated” investments | — | — | — | |||||||||
Net realized gain (loss) on foreign currency transactions | (44,876 | ) | (4,283 | ) | (47 | ) | ||||||
Change in net unrealized appreciation (depreciation) of: | ||||||||||||
Investments — Unaffiliated investments | (11,920,670 | ) | (70,530,720 | ) | (829,708 | ) | ||||||
Foreign currency translations | 7,888 | 217 | 1 | |||||||||
|
|
|
|
|
| |||||||
Net gain (loss) on investments | (7,649,277 | ) | (66,352,087 | ) | (807,047 | ) | ||||||
|
|
|
|
|
| |||||||
Net increase (decrease) in net assets resulting from operations | $ | (8,408,027 | ) | $ | (68,743,658 | ) | $ | (793,366 | ) | |||
|
|
|
|
|
| |||||||
| See Notes to Financial Statements. | 31 |
| Baron Funds | March 31, 2020 |
STATEMENTS OF CHANGES IN NET ASSETS (Unaudited)
|
| Baron Asset Fund | Baron Growth Fund | Baron Small Cap Fund | ||||||||||||||||||||||
| For the Six Months Ended March 31, 2020 | For the Year Ended September 30, 2019 | For the Six Months Ended March 31, 2020 | For the Year Ended September 30, 2019 | For the Six Months Ended March 31, 2020 | For the Year Ended September 30, 2019 | |||||||||||||||||||
Increase (Decrease) in Net Assets: | ||||||||||||||||||||||||
Operations: | ||||||||||||||||||||||||
Net investment income (loss) | $ | (12,800,481 | ) | $ | (23,738,366 | ) | $ | 5,196,917 | $ | (3,869,128 | ) | $ | (9,506,113 | ) | $ | (31,607,420 | ) | |||||||
Net realized gain (loss) | 40,125,684 | 77,477,454 | 164,634,592 | 286,439,573 | 227,287,510 | 428,357,054 | ||||||||||||||||||
Change in net unrealized appreciation (depreciation) | (488,351,675 | ) | 267,286,723 | (1,164,976,559 | ) | 22,671,707 | (789,776,187 | ) | (625,949,915 | ) | ||||||||||||||
|
|
|
|
|
|
|
|
|
|
|
| |||||||||||||
Increase (decrease) in net assets resulting from operations | (461,026,472 | ) | 321,025,811 | (995,145,050 | ) | 305,242,152 | (571,994,790 | ) | (229,200,281 | ) | ||||||||||||||
|
|
|
|
|
|
|
|
|
|
|
| |||||||||||||
Distributions to shareholders from: | ||||||||||||||||||||||||
Distributable earnings — Retail Shares | (40,552,872 | ) | (130,380,628 | ) | (94,740,238 | ) | (169,748,607 | ) | (135,343,515 | ) | (139,200,153 | ) | ||||||||||||
Distributable earnings — Institutional Shares | (35,026,357 | ) | (76,943,077 | ) | (154,792,579 | ) | (253,497,504 | ) | (205,916,210 | ) | (200,198,138 | ) | ||||||||||||
Distributable earnings — R6 Shares | (1,921,115 | ) | (4,155,669 | ) | (5,468,144 | ) | (6,757,066 | ) | (14,741,046 | ) | (11,607,108 | ) | ||||||||||||
|
|
|
|
|
|
|
|
|
|
|
| |||||||||||||
Decrease in net assets from distributions to shareholders | (77,500,344 | ) | (211,479,374 | ) | (255,000,961 | ) | (430,003,177 | ) | (356,000,771 | ) | (351,005,399 | ) | ||||||||||||
|
|
|
|
|
|
|
|
|
|
|
| |||||||||||||
Capital share transactions: | ||||||||||||||||||||||||
Proceeds from the sale of shares — Retail Shares | 71,661,069 | 139,761,881 | 111,654,170 | 184,857,908 | 45,233,226 | 117,344,513 | ||||||||||||||||||
Proceeds from the sale of shares — Institutional Shares | 233,177,831 | 784,662,813 | 405,684,570 | 684,000,375 | 224,140,727 | 345,558,212 | ||||||||||||||||||
Proceeds from the sale of shares — R6 Shares | 11,404,466 | 33,278,592 | 31,756,934 | 31,434,617 | 23,838,662 | 36,598,906 | ||||||||||||||||||
Net asset value of shares issued in reinvestment of distributions — Retail Shares | 39,326,659 | 126,966,908 | 92,664,059 | 166,152,109 | 132,348,628 | 136,479,004 | ||||||||||||||||||
Net asset value of shares issued in reinvestment of distributions — Institutional Shares | 33,774,345 | 74,160,022 | 148,813,744 | 244,717,993 | 194,127,046 | 189,732,531 | ||||||||||||||||||
Net asset value of shares issues in reinvestment of distribution — R6 Shares | 1,921,115 | 4,155,668 | 5,468,144 | 6,757,066 | 14,741,046 | 11,607,108 | ||||||||||||||||||
Cost of shares redeemed — Retail Shares | (194,165,855 | ) | (313,093,759 | ) | (309,029,133 | ) | (525,413,424 | ) | (218,292,392 | ) | (401,321,540 | ) | ||||||||||||
Cost of shares redeemed — Institutional Shares | (277,699,142 | ) | (273,943,356 | ) | (594,975,175 | ) | (854,055,168 | ) | (316,852,868 | ) | (632,543,578 | ) | ||||||||||||
Cost of shares redeemed — R6 Shares | (6,997,005 | ) | (3,720,596 | ) | (16,765,086 | ) | (13,616,954 | ) | (23,855,844 | ) | (25,262,003 | ) | ||||||||||||
|
|
|
|
|
|
|
|
|
|
|
| |||||||||||||
Increase (decrease) in net assets derived from capital share transactions | (87,596,517 | ) | 572,228,173 | (124,727,773 | ) | (75,165,478 | ) | 75,428,231 | (221,806,847 | ) | ||||||||||||||
|
|
|
|
|
|
|
|
|
|
|
| |||||||||||||
Net increase (decrease) in net assets | (626,123,333 | ) | 681,774,610 | (1,374,873,784 | ) | (199,926,503 | ) | (852,567,330 | ) | (802,012,527 | ) | |||||||||||||
|
|
|
|
|
|
|
|
|
|
|
| |||||||||||||
Net Assets: | ||||||||||||||||||||||||
Beginning of period | 4,330,677,701 | 3,648,903,091 | 6,789,505,744 | 6,989,432,247 | 3,881,137,727 | 4,683,150,254 | ||||||||||||||||||
|
|
|
|
|
|
|
|
|
|
|
| |||||||||||||
End of period | $ | 3,704,554,368 | $ | 4,330,677,701 | $ | 5,414,631,960 | $ | 6,789,505,744 | $ | 3,028,570,397 | $ | 3,881,137,727 | ||||||||||||
|
|
|
|
|
|
|
|
|
|
|
| |||||||||||||
Capital share transactions — Retail Shares | ||||||||||||||||||||||||
Shares sold | 867,660 | 1,814,155 | 1,405,074 | 2,480,330 | 1,611,499 | 4,083,207 | ||||||||||||||||||
Shares issued in reinvestment of distributions | 458,513 | 1,787,091 | 1,128,681 | 2,395,503 | 4,538,705 | 5,032,412 | ||||||||||||||||||
Shares redeemed | (2,379,408 | ) | (4,103,726 | ) | (4,020,083 | ) | (7,178,486 | ) | (7,757,419 | ) | (14,172,315 | ) | ||||||||||||
|
|
|
|
|
|
|
|
|
|
|
| |||||||||||||
Net increase (decrease) | (1,053,235 | ) | (502,480 | ) | (1,486,328 | ) | (2,302,653 | ) | (1,607,215 | ) | (5,056,696 | ) | ||||||||||||
|
|
|
|
|
|
|
|
|
|
|
| |||||||||||||
Capital share transactions — Institutional Shares | ||||||||||||||||||||||||
Shares sold | 2,729,733 | 9,947,466 | 5,090,042 | 9,249,961 | 7,811,976 | 11,564,148 | ||||||||||||||||||
Shares issued in reinvestment of distributions | 377,789 | 1,004,292 | 1,748,898 | 3,417,372 | 6,346,095 | 6,713,819 | ||||||||||||||||||
Shares redeemed | (3,255,945 | ) | (3,437,876 | ) | (7,350,738 | ) | (11,611,446 | ) | (10,888,571 | ) | (21,685,076 | ) | ||||||||||||
|
|
|
|
|
|
|
|
|
|
|
| |||||||||||||
Net increase (decrease) | (148,423 | ) | 7,513,882 | (511,798 | ) | 1,055,887 | 3,269,500 | (3,407,109 | ) | |||||||||||||||
|
|
|
|
|
|
|
|
|
|
|
| |||||||||||||
Capital share transactions — R6 Shares | ||||||||||||||||||||||||
Shares sold | 127,782 | 391,414 | 378,372 | 398,540 | 823,030 | 1,258,690 | ||||||||||||||||||
Shares issued in reinvestment of distributions | 21,493 | 56,305 | 64,255 | 94,346 | 482,049 | 410,871 | ||||||||||||||||||
Shares redeemed | (83,364 | ) | (46,562 | ) | (207,495 | ) | (174,647 | ) | (838,529 | ) | (841,402 | ) | ||||||||||||
|
|
|
|
|
|
|
|
|
|
|
| |||||||||||||
Net increase (decrease) | 65,911 | 401,157 | 235,132 | 318,239 | 466,550 | 828,159 | ||||||||||||||||||
|
|
|
|
|
|
|
|
|
|
|
| |||||||||||||
| 32 | See Notes to Financial Statements. |
| March 31, 2020 | Baron Funds |
STATEMENTS OF CHANGES IN NET ASSETS (Unaudited) (Continued)
|
| Baron Opportunity Fund | Baron Fifth Avenue Growth Fund | |||||||||||||||
| For the Six Months Ended March 31, 2020 | For the Year Ended September 30, 2019 | For the Six Months Ended March 31, 2020 | For the Year Ended September 30, 2019 | |||||||||||||
Increase (Decrease) in Net Assets: | ||||||||||||||||
Operations: | ||||||||||||||||
Net investment income (loss) | $ | (2,321,934 | ) | $ | (4,457,339 | ) | $ | (758,750 | ) | $ | 1,238,359 | |||||
Net realized gain (loss) | 19,752,894 | 30,936,563 | 4,263,505 | 10,634,559 | ||||||||||||
Change in net unrealized appreciation (depreciation) | 650,559 | (19,284,942 | ) | (11,912,782 | ) | (3,703,325 | ) | |||||||||
|
|
|
|
|
|
|
| |||||||||
Increase (decrease) in net assets resulting from operations | 18,081,519 | 7,194,282 | (8,408,027 | ) | 8,169,593 | |||||||||||
|
|
|
|
|
|
|
| |||||||||
Distributions to shareholders from: | ||||||||||||||||
Distributable earnings — Retail Shares | (21,327,179 | ) | (15,007,464 | ) | (3,490,662 | ) | — | |||||||||
Distributable earnings — Institutional Shares | (7,094,221 | ) | (3,825,457 | ) | (5,181,400 | ) | — | |||||||||
Distributable earnings — R6 Shares | (1,079,435 | ) | (568,972 | ) | (678,269 | ) | — | |||||||||
|
|
|
|
|
|
|
| |||||||||
Decrease in net assets from distributions to shareholders | (29,500,835 | ) | (19,401,893 | ) | (9,350,331 | ) | — | |||||||||
|
|
|
|
|
|
|
| |||||||||
Capital share transactions: | ||||||||||||||||
Proceeds from the sale of shares — Retail Shares | 64,411,328 | 60,083,597 | 11,763,899 | 22,290,459 | ||||||||||||
Proceeds from the sale of shares — Institutional Shares | 70,580,346 | 33,710,032 | 21,760,009 | 45,794,664 | ||||||||||||
Proceeds from the sale of shares — R6 Shares | 174,753 | 168,932 | 27,757 | 575,354 | ||||||||||||
Net asset value of shares issued in reinvestment of distributions — Retail Shares | 20,703,884 | 14,672,714 | 3,365,849 | — | ||||||||||||
Net asset value of shares issued in reinvestment of distributions — Institutional Shares | 6,811,664 | 3,594,064 | 5,016,688 | — | ||||||||||||
Net asset value of shares issues in reinvestment of distribution — R6 Shares | 1,079,435 | 568,972 | 678,269 | — | ||||||||||||
Cost of shares redeemed — Retail Shares | (73,350,248 | ) | (125,706,274 | ) | (18,043,136 | ) | (41,302,711 | ) | ||||||||
Cost of shares redeemed — Institutional Shares | (31,088,315 | ) | (37,190,698 | ) | (20,522,572 | ) | (32,721,299 | ) | ||||||||
Cost of shares redeemed — R6 Shares | (60,015 | ) | (145,524 | ) | (62,386 | ) | (268,565 | ) | ||||||||
|
|
|
|
|
|
|
| |||||||||
Increase (decrease) in net assets derived from capital share transactions | 59,262,832 | (50,244,185 | ) | 3,984,377 | (5,632,098 | ) | ||||||||||
|
|
|
|
|
|
|
| |||||||||
Net increase (decrease) in net assets | 47,843,516 | (62,451,796 | ) | (13,773,981 | ) | 2,537,495 | ||||||||||
|
|
|
|
|
|
|
| |||||||||
Net Assets: | ||||||||||||||||
Beginning of period | 411,514,392 | 473,966,188 | 308,353,595 | 305,816,100 | ||||||||||||
|
|
|
|
|
|
|
| |||||||||
End of period | $ | 459,357,908 | $ | 411,514,392 | $ | 294,579,614 | $ | 308,353,595 | ||||||||
|
|
|
|
|
|
|
| |||||||||
Capital share transactions — Retail Shares | ||||||||||||||||
Shares sold | 2,805,265 | 2,921,912 | 358,713 | 742,314 | ||||||||||||
Shares issued in reinvestment of distributions | 922,633 | 768,205 | 101,381 | — | ||||||||||||
Shares redeemed | (3,319,183 | ) | (6,145,594 | ) | (559,519 | ) | (1,406,171 | ) | ||||||||
|
|
|
|
|
|
|
| |||||||||
Net increase (decrease) | 408,715 | (2,455,477 | ) | (99,425 | ) | (663,857 | ) | |||||||||
|
|
|
|
|
|
|
| |||||||||
Capital share transactions — Institutional Shares | ||||||||||||||||
Shares sold | 2,903,367 | 1,587,636 | 649,089 | 1,498,812 | ||||||||||||
Shares issued in reinvestment of distributions | 290,352 | 181,061 | 147,724 | — | ||||||||||||
Shares redeemed | (1,348,199 | ) | (1,776,413 | ) | (618,196 | ) | (1,117,427 | ) | ||||||||
|
|
|
|
|
|
|
| |||||||||
Net increase (decrease) | 1,845,520 | (7,716 | ) | 178,617 | 381,385 | |||||||||||
|
|
|
|
|
|
|
| |||||||||
Capital share transactions — R6 Shares | ||||||||||||||||
Shares sold | 7,104 | 7,484 | 925 | 16,693 | ||||||||||||
Shares issued in reinvestment of distributions | 45,953 | 28,634 | 19,966 | — | ||||||||||||
Shares redeemed | (2,557 | ) | (6,414 | ) | (1,746 | ) | (8,558 | ) | ||||||||
|
|
|
|
|
|
|
| |||||||||
Net increase (decrease) | 50,500 | 29,704 | 19,145 | 8,135 | ||||||||||||
|
|
|
|
|
|
|
| |||||||||
| See Notes to Financial Statements. | 33 |
| Baron Funds | March 31, 2020 |
STATEMENTS OF CHANGES IN NET ASSETS (Unaudited) (Continued)
|
| Baron Discovery Fund | Baron Durable Advantage Fund | |||||||||||||||
| For the Six Months Ended March 31, 2020 | For the Year Ended September 30, 2019 | For the Six Months Ended March 31, 2020 | For the Year Ended September 30, 2019 | |||||||||||||
Increase (Decrease) in Net Assets: | ||||||||||||||||
Operations: | ||||||||||||||||
Net investment income (loss) | $ | (2,391,571 | ) | $ | (4,413,443 | ) | $ | 13,681 | $ | 20,244 | ||||||
Net realized gain (loss) | 4,178,416 | 946,037 | 22,660 | (108,643 | ) | |||||||||||
Change in net unrealized appreciation (depreciation) | (70,530,503 | ) | (42,043,105 | ) | (829,707 | ) | 521,110 | |||||||||
|
|
|
|
|
|
|
| |||||||||
Increase (decrease) in net assets resulting from operations | (68,743,658 | ) | (45,510,511 | ) | (793,366 | ) | 432,711 | |||||||||
|
|
|
|
|
|
|
| |||||||||
Distributions to shareholders from: | ||||||||||||||||
Distributable earnings — Retail Shares | (171,734 | ) | (7,715,143 | ) | — | (1,989 | ) | |||||||||
Distributable earnings — Institutional Shares | (593,926 | ) | (18,229,890 | ) | — | (9,620 | ) | |||||||||
Distributable earnings — R6 Shares | (10,037 | ) | (356,349 | ) | — | (1,393 | ) | |||||||||
|
|
|
|
|
|
|
| |||||||||
Decrease in net assets from distributions to shareholders | (775,697 | ) | (26,301,382 | ) | — | (13,002 | ) | |||||||||
|
|
|
|
|
|
|
| |||||||||
Capital share transactions: | ||||||||||||||||
Proceeds from the sale of shares — Retail Shares | 17,879,528 | 105,144,464 | 2,681,850 | 1,480,843 | ||||||||||||
Proceeds from the sale of shares — Institutional Shares | 98,932,676 | 279,070,683 | 639,498 | 1,608,216 | ||||||||||||
Proceeds from the sale of shares — R6 Shares | 1,853,757 | 2,815,364 | 1,682,352 | 51,965 | ||||||||||||
Net asset value of shares issued in reinvestment of distributions — Retail Shares | 170,515 | 7,658,228 | — | 1,905 | ||||||||||||
Net asset value of shares issued in reinvestment of distributions — Institutional Shares | 560,845 | 17,151,065 | — | 9,620 | ||||||||||||
Net asset value of shares issues in reinvestment of distribution — R6 Shares | 10,037 | 356,349 | — | 1,393 | ||||||||||||
Cost of shares redeemed — Retail Shares | (33,932,318 | ) | (78,740,567 | ) | (1,179,450 | ) | (233,841 | ) | ||||||||
Cost of shares redeemed — Institutional Shares | (74,078,622 | ) | (115,824,380 | ) | (1,819,862 | ) | (279,432 | ) | ||||||||
Cost of shares redeemed — R6 Shares | (904,318 | ) | (929,826 | ) | (35,406 | ) | (28,842 | ) | ||||||||
|
|
|
|
|
|
|
| |||||||||
Increase (decrease) in net assets derived from capital share transactions | 10,492,100 | 216,701,380 | 1,968,982 | 2,611,827 | ||||||||||||
|
|
|
|
|
|
|
| |||||||||
Net increase (decrease) in net assets | (59,027,255 | ) | 144,889,487 | 1,175,616 | 3,031,536 | |||||||||||
|
|
|
|
|
|
|
| |||||||||
Net Assets: | ||||||||||||||||
Beginning of period | 538,907,917 | 394,018,430 | 7,065,372 | 4,033,836 | ||||||||||||
|
|
|
|
|
|
|
| |||||||||
End of period | $ | 479,880,662 | $ | 538,907,917 | $ | 8,240,988 | $ | 7,065,372 | ||||||||
|
|
|
|
|
|
|
| |||||||||
Capital share transactions — Retail Shares | ||||||||||||||||
Shares sold | 911,140 | 5,416,591 | 211,917 | 129,313 | ||||||||||||
Shares issued in reinvestment of distributions | 8,077 | 400,954 | — | 193 | ||||||||||||
Shares redeemed | (1,726,536 | ) | (4,044,554 | ) | (99,606 | ) | (20,379 | ) | ||||||||
|
|
|
|
|
|
|
| |||||||||
Net increase (decrease) | (807,319 | ) | 1,772,991 | 112,311 | 109,127 | |||||||||||
|
|
|
|
|
|
|
| |||||||||
Capital share transactions — Institutional Shares | ||||||||||||||||
Shares sold | 4,928,223 | 14,122,841 | 51,273 | 137,943 | ||||||||||||
Shares issued in reinvestment of distributions | 26,183 | 887,277 | — | 971 | ||||||||||||
Shares redeemed | (3,895,092 | ) | (5,869,417 | ) | (134,373 | ) | (26,404 | ) | ||||||||
|
|
|
|
|
|
|
| |||||||||
Net increase (decrease) | 1,059,314 | 9,140,701 | (83,100 | ) | 112,510 | |||||||||||
|
|
|
|
|
|
|
| |||||||||
Capital share transactions — R6 Shares | ||||||||||||||||
Shares sold | 92,028 | 139,152 | 128,433 | 4,445 | ||||||||||||
Shares issued in reinvestment of distributions | 469 | 18,435 | — | 141 | ||||||||||||
Shares redeemed | (43,196 | ) | (48,698 | ) | (2,780 | ) | (2,907 | ) | ||||||||
|
|
|
|
|
|
|
| |||||||||
Net increase (decrease) | 49,301 | 108,889 | 125,653 | 1,679 | ||||||||||||
|
|
|
|
|
|
|
| |||||||||
| 34 | See Notes to Financial Statements. |
| March 31, 2020 | Baron Funds |
NOTES TO FINANCIAL STATEMENTS (Unaudited)
1. ORGANIZATION
Baron Investment Funds Trust (the “Trust”) is registered under the Investment Company Act of 1940, as amended (the “1940 Act”), as anopen-end management investment company established as a Massachusetts business trust on February 19, 1987, and accordingly follows the investment company accounting and reporting guidance of the Financial Accounting Standards Board (“FASB”) Accounting Standard Codification Topic 946 Financial Services — Investment Companies. The Trust currently offers seven series (individually, a “Fund” and collectively, the “Funds”): Baron Asset Fund, Baron Growth Fund, Baron Small Cap Fund, Baron Opportunity Fund, Baron Fifth Avenue Growth Fund, Baron Discovery Fund, and Baron Durable Advantage Fund.
Each Fund offers Retail Shares, Institutional Shares, and R6 Shares. Each class of shares differs only in its ongoing fees, expenses and eligibility requirements. Retail Shares are offered to all investors. Institutional Shares are for investments in the amount of $1 million or more per Fund. Institutional Shares are intended for certain financial intermediaries that offer shares of Baron Funds throughfee-based platforms, retirement platforms, or other platforms. R6 Shares are for investments in the amount of $5 million or more per Fund. R6 Shares are available only to qualified 401(a) plans (including 401(k) plans, Keogh plans, profit sharing plans, money purchase pension plans, target benefit plans, defined benefit pension plans, and Taft-Hartley multi-employer pension plans), endowment funds and foundations, any state, county or city, or its instrumentality, department, authority, or agency, 457 plans, including 457(a) governmental entity plans andtax-exempt plans, accounts registered to insurance companies, trust companies and bank trust departments, investment companies, both affiliated and not affiliated with BAMCO, Inc. (the “Adviser”), and any entity that is considered a corporation for tax purposes, including corporatenon-qualified deferred compensation plans of such corporations. Each class of shares has equal rights to earnings and assets, except that each class bears different expenses for distribution and shareholder servicing. Each Fund’s investment income, realized and unrealized gains or losses on investments and foreign currency, and expenses other than those attributable to a specific class are allocated to each class based on its relative net assets. Each class of shares has exclusive voting rights with respect to matters that affect just that class. The investment goals of the Funds are as follows:
Baron Asset Fund seeks capital appreciation through long-term investments primarily in securities ofmedium-sized companies with undervalued assets or favorable growth prospects.
Baron Growth Fund seeks capital appreciation through long-term investments primarily in securities ofsmall-sized growth companies.
Baron Small Cap Fund seeks capital appreciation through investments primarily in securities ofsmall-sized growth companies.
Baron Opportunity Fund seeks capital appreciation through investments primarily in growth companies that benefit from technology advances.
Baron Fifth Avenue Growth Fund seeks capital appreciation through investments primarily in securities oflarge-sized growth companies.
Baron Discovery Fund seeks capital appreciation through investments primarily in securities ofsmall-sized growth companies.
Baron Durable Advantage Fund seeks capital appreciation through long-term investments primarily in securities oflarge-sized companies.
2. SIGNIFICANT ACCOUNTING POLICIES
The following is a summary of significant accounting policies followed by the Funds. The policies are in conformity with accounting principles generally accepted in the United States of America (“GAAP”). The preparation of financial statements in accordance with GAAP requires management to make estimates and assumptions that affect the reported amounts of assets and liabilities at the date of the financial statements and the amounts of income and expenses during the period. Actual results could differ from those estimates. Events occurring subsequent to the date of the Statements of Assets and Liabilities and through the date of issuance of the financial statements have been evaluated for adjustment to or disclosure in the financial statements.
a) Security Valuation. The Funds’ share prices or net asset values (“NAV”) are calculated as of the scheduled close of the regular trading session (usually 4 p.m. E.T. or such other time as of which the Funds’ NAVs are calculated (the “NAV Calculation Time”)) on the New York Stock Exchange (the “Exchange”) on any day the Exchange is scheduled to be open. Portfolio securities traded on any national stock exchange are valued based on the last sale price on the exchange where such shares are principally traded. For securities traded on NASDAQ, the Funds use the NASDAQ Official Closing Price. If there are no sales on a given day, the value of the security may be the average of the most recent bid and asked quotations on such exchange or the last sale price from a prior day. Where market quotations are not readily available, or, if in the Adviser’s judgment, they do not accurately reflect the fair value of a security, or an event occurs after the market close but before the Funds are priced that materially affects the value of a security, the security will be valued by the Adviser using policies and procedures approved by the Board of Trustees (the “Board”). Some of the more common reasons that may necessitate that a security be valued using “fair value” pricing may include, but are not limited to: trading of the security has been halted or suspended; or the security has not been traded for an extended period of time. The Adviser has a Fair Valuation Committee (the “Committee”) comprised of senior management representatives and the Committee reports to the Board every quarter. Factors the Committee may consider when valuing a security include whether a current price is stale, there is recent news, the security is thinly traded, transactions are infrequent or quotations are genuine. There can be no guarantee, however, that a fair valuation used by the Funds on any given day will more accurately reflect the market value of an investment than the closing price of such investment in its market. U.S. Government obligations, money market instruments, and other debt instruments held by the Funds with a remaining maturity of 60 days or less are generally valued at amortized cost, which approximates fair value. Debt instruments having a greater remaining maturity will be valued on the basis of prices obtained from a pricing service approved by the Board or at the mean of the bid and ask prices from the dealer maintaining an active market in that security. The value of the Funds’ investments in convertible bonds/convertible preferred stocks is determined primarily by obtaining valuations from independent pricing services based on readily available bid quotations or, if quotations are not available, by methods which include various considerations such as yields or prices of securities of comparable quality, coupon, maturity and type; indications as to values from dealers; and general market conditions. Other inputs used by an independent pricing service to value convertible bonds/convertible preferred stocks generally include underlying stock data, conversion premiums, listed bond and preferred stock prices and other market information which may include benchmark curves, trade execution data, sensitivity analysis, when available, or an estimated value calculated based on the price of the underlying common share on the valuation date adjusted for accrued and unpaid dividends.Open-end investment companies, including securities lending collateral invested in registered investment company money market funds, are valued at their NAV each day.
35
| Baron Funds | March 31, 2020 |
NOTES TO FINANCIAL STATEMENTS (Unaudited) (Continued)
2. SIGNIFICANT ACCOUNTING POLICIES (Continued)
Non-U.S. equity securities traded on foreign securities exchanges are generally valued using an independent pricing vendor that provides daily fair value adjustment factors based on information such as local closing price, relevant general and sector indexes, currency fluctuations, and depositary receipts, as applicable. Securities valued using such adjustment factors are classified as Level 2 in the fair value hierarchy. The models of the independent pricing vendor generate an adjustment factor for each security, which is applied to the local closing price to adjust it for post-closing market movements up to the time the Funds are valued and translated into U.S. dollars. If the vendor does not provide an adjustment factor for a security, the security is valued based on its most recent local closing price and translated into U. S. dollars. The Adviser may also fair value securities in other situations, for example, when a particular foreign market is closed but the Funds are open. Other mutual funds may adjust the prices of their securities by different amounts.
b) Securities Transactions, Investment Income and Expense Allocation. Securities transactions are recorded on a trade date basis. Realized gain and loss from securities transactions are recorded on an identified cost basis for financial reporting and federal income tax purposes. Dividend income is recognized on theex-dividend date and interest income is recognized on an accrual basis, which includes the accretion of discounts and amortization of premiums.Non-cash dividends received in the form of stock, if any, are recognized on theex-dividend date and recorded asnon-cash dividend income at fair value. Certain dividends from foreign securities will be recorded as soon as the Funds are informed of the dividend if such information is obtained subsequent to theex-dividend date. Distributions received from certain investments held by the Funds may be comprised of dividends, realized gains and returns of capital. The Funds originally estimate the expected classification of such payments. The amounts may subsequently be reclassified upon receipt of information from the issuer. The Funds are charged for those expenses of the Trust that are directly attributable to each Fund, such as advisory and custodian fees. Expenses that are not directly attributable to a Fund are typically allocated among the Funds in proportion to their respective net assets.
c) Foreign Currency Translations. Values of assets and liabilities denominated in foreign currencies are translated into U.S. dollars using the price of such currencies at the NAV Calculation Time. Purchases and sales of investments and dividend income are converted at the prevailing rate of exchange on the respective dates of such transactions. Net realized gain (loss) on foreign currency transactions includes gain (loss) arising from the fluctuation in the exchange rates between trade and settlement dates on security transactions and currency gain (loss) between the accrual and payment dates on dividends and foreign withholding taxes. The Funds do not isolate that portion of the results of operations resulting from changes in foreign exchange rates on investments from the fluctuations arising from changes in market prices of securities held. Such fluctuations are included with the net realized and unrealized gain or loss from investments and foreign currency transactions on the Statements of Operations. The Funds may invest in foreign securities and foreign currency transactions that may involve risks not associated with domestic investments as a result of the level of governmental supervision and regulation of foreign securities markets and the possibility of political or economic instability, among others.
Pursuant to U.S. federal income tax regulations, gains and losses from certain foreign currency transactions and the foreign currency portion of gains and losses realized on sales and maturities of foreign denominated debt securities are generally treated as ordinary income for U.S. federal income tax purposes.
d) Securities Lending. The Funds may lend securities to certain brokers under the terms of a master netting agreement. Upon such loans, the Funds receive collateral which is maintained by the custodian. The Funds may pay fees to the custodian for administering the securities lending program. The Funds earn interest on such collateral and earn income in the form of negotiated lenders’ fees, both of which are included in securities lending income in the Statements of Operations. Securities loaned are required to be secured at all times by collateral equal to at least 102% of the market value of the securities loaned. Risks may arise upon entering into securities lending to the extent that the value of the collateral is less than the value of the securities loaned due to the changes in the value of collateral or the loaned securities. The collateral ismarked-to-market daily and settled on the next business day. The Funds may receive collateral in the form of cash or other eligible securities, such as a letter of credit issued by a U.S. bank or securities issued or guaranteed by the U.S. government. Securities purchased with cash collateral are subject to the risks inherent in investing in these securities.
Baron Small Cap Fund and Baron Discovery Fund participated in securities lending activities during the six months ended March 31, 2020. There were no securities on loan at March 31, 2020.
e) Repurchase Agreements. The Funds may invest in repurchase agreements, which are short term investments whereby the Funds acquire ownership of a debt security and the seller agrees to repurchase the security at a future date at a specified price. When entering into repurchase agreements, it is the Funds’ policy that their custodian take possession of the underlying collateral securities, the market value of which, at all times, equals at least 102% of the principal amount of the repurchase transaction. To the extent that any repurchase transaction exceeds one business day, the value of the collateral ismarked-to-market to ensure the adequacy of the collateral. If the seller defaults and the market value of the collateral declines or if bankruptcy proceedings are commenced with respect to the seller of the security, realization of the collateral by the Funds may be delayed or limited. The information required to be disclosed by FASB Accounting Standards UpdateNo. 2011-11 for the Funds’ investments in repurchase agreements at March 31, 2020, including the fair value of the repurchase agreement and the amount of collateral, can be found in each respective Fund’s Statement of Net Assets.
f) Master Limited Partnerships. The Funds may invest in master limited partnerships (“MLPs”). MLPs are limited partnerships or limited liability companies, whose partnership units or limited liability interests are listed and traded on a U.S. securities exchange, and are treated as publicly traded partnerships for federal income tax purposes. To qualify to be treated as a partnership for tax purposes, an MLP must receive at least 90% of its income from qualifying sources as set forth in Section 7704(d) of the Internal Revenue Code of 1986, as amended. These qualifying sources include interest, dividend, real property rent, gain from sale or other disposition of real property and income from activities such as the exploration, development, mining, production, processing, refining, transportation, storage and marketing of mineral or natural resources.
36
| March 31, 2020 | Baron Funds |
NOTES TO FINANCIAL STATEMENTS (Unaudited) (Continued)
2. SIGNIFICANT ACCOUNTING POLICIES (Continued)
g) Federal and Foreign Income Taxes. The Trust treats each Fund as a separate entity for federal income tax purposes. Each Fund intends to meet the requirements of the Internal Revenue Code of 1986, as amended, applicable to regulated investment companies, and to distribute to its shareholders substantially all of its net investment income and any net realized capital gains at least annually. None of the Funds will be subject to federal or state income taxes to the extent that they qualify as regulated investment companies and substantially all of their income is distributed.
The Funds may be subject to foreign taxes on income and gains on investments that are accrued based upon the Funds’ understanding of the tax rules and regulations that exist in the countries in which the Funds invest. Foreign governments may also impose taxes or other payments on investments with respect to foreign securities. Such taxes are accrued as applicable.
h) Restricted Securities. The Funds may invest in securities that are restricted as to public sale in accordance with the Securities Act of 1933. Such assets are valued by the Adviser pursuant to policies and procedures approved by the Board.
i) Distributions to Shareholders. Income and capital gain distributions to shareholders are determined in accordance with income tax regulations which may differ from GAAP. These differences are primarily due to differing treatments for net investment loss, foreign currency gains and losses,non-deductible interest expense, reclassification of distributions, partnership basis adjustments, income from passive foreign investment companies, late-year loss deferral, post-October loss deferral, and wash sale loss deferral.
j) Commitments and Contingencies. In the normal course of business, the Funds may enter into contracts and agreements that contain a variety of representations and warranties, which provide general indemnification. The maximum exposure to the Funds under these agreements is unknown, as this would involve future claims that may be made against the Funds that have not yet occurred. However, based on experience, the Funds expect the risk of loss to be remote.
k) Cash and Cash Equivalents.The Funds consider all short term liquid investments with a maturity of three months or less when purchased to be cash equivalents.
3. PURCHASES AND SALES OF SECURITIES
Purchases and sales of securities, other than short term securities, for the six months ended March 31, 2020 were as follows:
| Fund | Purchases | Sales | ||||||
Baron Asset Fund | $ | 137,331,397 | $ | 266,921,071 | ||||
Baron Growth Fund | 24,429,088 | 360,140,145 | ||||||
Baron Small Cap Fund | 244,136,609 | 538,404,102 | ||||||
Baron Opportunity Fund | 96,667,171 | 119,229,239 | ||||||
Baron Fifth Avenue Growth Fund | 28,443,577 | 35,981,923 | ||||||
Baron Discovery Fund | 180,132,158 | 179,099,999 | ||||||
Baron Durable Advantage Fund | 3,121,362 | 1,415,803 | ||||||
4. INVESTMENT ADVISORY FEES AND OTHER TRANSACTIONS WITH AFFILIATES
a) Investment Advisory Fees. The Adviser, a wholly owned subsidiary of Baron Capital Group, Inc. (“BCG”), serves as investment adviser to the Funds. As compensation for services rendered, the Adviser receives a fee payable monthly from Baron Asset Fund, Baron Growth Fund, Baron Small Cap Fund, Baron Opportunity Fund, and Baron Discovery Fund equal to 1% per annum of the average daily net assets of the respective Funds. The Adviser receives a fee payable monthly equal to 0.70% per annum of Baron Fifth Avenue Growth Fund’s average daily net assets and 0.65% per annum of Baron Durable Advantage Fund’s average daily net assets.
For Baron Opportunity Fund, Baron Fifth Avenue Growth Fund, Baron Discovery Fund, and Baron Durable Advantage Fund, the Adviser has contractually agreed to reduce its fee, to the extent required to limit the net annual operating expense ratio (excluding portfolio transaction costs, interest, dividend and extraordinary expenses), as follows:
| Annual Operating Expense Ratio Cap | ||||||||||||
| Fund | Retail Shares | Institutional Shares | R6 Shares | |||||||||
Baron Opportunity Fund | 1.50 | % | 1.25 | % | 1.24 | % | ||||||
Baron Fifth Avenue Growth Fund | 1.00 | % | 0.75 | % | 0.75 | % | ||||||
Baron Discovery Fund | 1.35 | % | 1.10 | % | 1.09 | % | ||||||
Baron Durable Advantage Fund | 0.95 | % | 0.70 | % | 0.70 | % | ||||||
b) Distribution Fees. Baron Capital, Inc. (“BCI”), a wholly owned subsidiary of BCG, is a registered limited purpose broker-dealer and the distributor of the Funds’ shares. The Funds are authorized to pay BCI a distribution fee payable monthly pursuant to a distribution plan under Rule12b-1 of the 1940 Act equal to 0.25% per annum of the Retail Shares’ average daily net assets of the respective Funds.
c) Trustee Fees. Certain Trustees of the Trust are interested persons (as defined by the 1940 Act) of the Trust. None of these Trustees received compensation for his or her services as a Trustee of the Trust. None of the Funds’ officers received compensation from the Funds for their services as an officer.
37
| Baron Funds | March 31, 2020 |
NOTES TO FINANCIAL STATEMENTS (Unaudited) (Continued)
4. INVESTMENT ADVISORY FEES AND OTHER TRANSACTIONS WITH AFFILIATES (Continued)
d) Fund Accounting and Administration Fees. The Funds have entered into an agreement with State Street Bank and Trust Company (“State Street”) to perform accounting and certain administrative services. State Street is compensated for fund accounting services based on a percentage of the Funds’ net assets and fixed annual fees for the administrative services.
e) Cross Trades. The Funds are permitted to purchase securities from, or sell securities to, other Funds within the Trust, the funds in Baron Select Funds, and other entities advised or subadvised by the Adviser, pursuant to “Cross-Trading Procedures” adopted by the Board. These procedures have been designed to ensure that any cross-trade of securities by the respective Baron Fund from or to another fund/other entity that is or could be considered an affiliate of a Fund under certain limited circumstances by virtue of having a common investment adviser, common officers, or common trustees complies with Rule17a-7 under the 1940 Act. Further, as defined under these procedures, each cross-trade is effected at the current market price and with no commissions. Pursuant to these procedures, for the six months ended March 31, 2020, the Funds engaged in the following cross-trades:
| Purchases | Sales | Net Realized Gains (Losses) | ||||||||||
Baron Opportunity Fund | $ | 432,400 | $ | — | $ | — | ||||||
Baron Discovery Fund | — | 432,400 | (141,528 | ) | ||||||||
5. LINE OF CREDIT
The Funds together with other funds in Baron Select Funds, (except Baron Partners Fund), participate in a committed line of credit agreement with State Street to be used for temporary purposes, primarily for financing redemptions. Each fund may borrow up to the lesser of $100 million or the maximum amount each fund may borrow under the 1940 Act, the limitations included in each fund’s prospectus, or any limit or restriction under any law or regulation to which each fund is subject or any agreement to which each fund is a party; provided that the aggregate outstanding principal amount of all loans to any of the funds may not exceed $100 million. Interest is charged to each fund, based on its borrowings, at a rate per annum equal to the higher of the effective federal funds rate or the one month LIBOR rate plus a margin of 1.00%. An upfront fee of 0.05% is incurred on the commitment amount and a commitment fee of 0.20% per annum is incurred on the unused portion of the line of credit. Both fees are allocated to the participating funds based on their relative net assets. During the six months ended March 31, 2020, Baron Growth Fund and Baron Opportunity Fund had borrowings under the line of credit and incurred interest expense of $152,148 and $7,474, respectively. For the 129 days during which there were borrowings, Baron Growth Fund had an average daily balance on the line of credit of $17.2 million at a weighted average interest rate of 2.51%. For the 20 days during which there were borrowings, Baron Opportunity Fund had an average daily balance on the line of credit of $4.5 million at a weighted average interest rate of 3.03%. At March 31, 2020, Baron Growth Fund had an outstanding balance in the amount of $29,900,000.
6. RESTRICTED SECURITIES
At March 31, 2020, investments in securities included securities that are restricted and/or illiquid. Restricted securities are often purchased in private placement transactions, are not registered under the Securities Act of 1933, may have contractual restrictions on resale and are valued pursuant to the policies and procedures for fair value pricing approved by the Board. A security may be considered illiquid if it lacks a readily available market or if its valuation has not changed for a certain period of time. The Funds may receive more or less than this valuation in an actual sale and that difference could be material. At March 31, 2020, the Funds held investments in restricted and/or illiquid securities that were valued pursuant to policies and procedures for fair value pricing as follows:
| Baron Asset Fund | ||||||||
| Name of Issuer | Acquisition Date(s) | Value | ||||||
Private Partnerships | ||||||||
Windy City Investments Holdings, L.L.C. | 10/13/2007-1/27/2011 | $ | 180,639 | |||||
|
| |||||||
(Cost $0) (0.00% of Net Assets) | ||||||||
| Baron Growth Fund | ||||||||
| Name of Issuer | Acquisition Date(s) | Value | ||||||
Private Preferred Stocks | ||||||||
Schrödinger, Inc. Series E | 11/9/2018 | $ | 18,087,984 | |||||
Private Partnerships | ||||||||
Windy City Investments Holdings, L.L.C. | 11/13/2007-1/27/2011 | 60,804 | ||||||
|
| |||||||
Total Restricted Securities | $ | 18,148,788 | ||||||
|
| |||||||
(Cost $4,999,999)†(0.33 % of Net Assets) | ||||||||
| † | See Statements of Net Assets for cost of individual securities. |
38
| March 31, 2020 | Baron Funds |
NOTES TO FINANCIAL STATEMENTS (Unaudited) (Continued)
7. FAIR VALUE MEASUREMENTS
Fair value is defined by GAAP as the price that the Funds would receive upon selling an investment in a timely transaction to an independent buyer in the principal or most advantageous market for the investment. GAAP provides a three-tier hierarchy to maximize the use of observable market data and minimize the use of unobservable inputs and to establish classification of fair value measurements for disclosure purposes. Inputs refer broadly to the assumptions that market participants would use in pricing the asset or liability. Inputs may be observable or unobservable. Observable inputs are based on market data obtained from sources independent of the Funds. Unobservable inputs are inputs that reflect the Funds’ own assumptions based on the best information available in the circumstances. The three-tier hierarchy of inputs is summarized in the three broad Levels listed below.
| • | Level 1 — quoted prices in active markets for identical assets or liabilities; |
| • | Level 2 — prices determined using other inputs that are observable either directly or indirectly through corroboration with observable market data (which could include quoted prices for similar assets or liabilities, interest rates, credit risk, etc.); |
| • | Level 3 — prices determined using unobservable inputs when quoted prices or observable inputs are unavailable, such as when there is little or no market activity for an asset or liability (unobservable inputs reflect each Fund’s own assumptions in determining the fair value of assets or liabilities and would be based on the best information available). |
The inputs or methodology used for valuing securities are not necessarily an indication of the risk or liquidity associated with investing in those securities. For example,non-U.S. securities, with markets that close hours before the Funds value their holdings, may require revised valuations to more accurately reflect their fair value. Since these values obtained from quoted prices in an active market are adjusted, such securities are reflected as Level 2.
The Funds have procedures to determine the fair value of securities and other financial instruments for which market prices are not readily available or which may not be reliably priced. Under these procedures, the Funds primarily employ a market-based approach that may use related or comparable assets or liabilities, recent transactions, market multiples, book values, and other relevant information for the investment to determine its fair value. The Funds may also use an income-based valuation approach in which the anticipated future cash flows of the investment are discounted to calculate fair value. Discounts may also be applied due to the nature or duration of any restrictions on the disposition of the investments. Due to the inherent uncertainty of valuations of such investments, the fair values may differ significantly from the values that would have been used had an active market existed.
The following is a summary of the inputs used as of March 31, 2020 in valuing the Funds’ investments carried at fair value:
| Baron Asset Fund | ||||||||||||||||
| Description | Quoted Prices in Active Markets for Identical Assets (Level 1) | Other Observable Inputs (Level 2) | Unobservable Inputs (Level 3) | Total | ||||||||||||
Common Stocks† | $ | 3,653,365,584 | $ | — | $ | — | $ | 3,653,365,584 | ||||||||
Private Partnerships | — | — | 180,639 | 180,639 | ||||||||||||
Short Term Investments | — | 44,975,314 | — | 44,975,314 | ||||||||||||
|
|
|
|
|
|
|
| |||||||||
Total Investments | $ | 3,653,365,584 | $ | 44,975,314 | $ | 180,639 | $ | 3,698,521,537 | ||||||||
|
|
|
|
|
|
|
| |||||||||
| Baron Growth Fund | ||||||||||||||||
| Description | Quoted Prices in Active Markets for Identical Assets (Level 1) | Other Observable Inputs (Level 2) | Unobservable Inputs (Level 3) | Total | ||||||||||||
Common Stocks† | $ | 5,382,075,054 | $ | 25,258,241 | $ | — | $ | 5,407,333,295 | ||||||||
Private Preferred Stocks | — | 18,087,984 | — | 18,087,984 | ||||||||||||
Private Partnerships | — | — | 60,804 | 60,804 | ||||||||||||
Warrants | — | 113,888 | — | 113,888 | ||||||||||||
|
|
|
|
|
|
|
| |||||||||
Total Investments | $ | 5,382,075,054 | $ | 43,460,113 | $ | 60,804 | $ | 5,425,595,971 | ||||||||
|
|
|
|
|
|
|
| |||||||||
| Baron Small Cap Fund | ||||||||||||||||
| Description | Quoted Prices in Active Markets for Identical Assets (Level 1) | Other Observable Inputs (Level 2) | Unobservable Inputs (Level 3) | Total | ||||||||||||
Common Stocks† | $ | 2,867,887,763 | $ | 28,837,421 | $ | — | $ | 2,896,725,184 | ||||||||
Warrants† | 4,585,000 | 307,803 | — | 4,892,803 | ||||||||||||
Short Term Investments | — | 122,934,366 | — | 122,934,366 | ||||||||||||
|
|
|
|
|
|
|
| |||||||||
Total Investments | $ | 2,872,472,763 | $ | 152,079,590 | $ | $ | 3,024,552,353 | |||||||||
|
|
|
|
|
|
|
| |||||||||
| † | See Statements of Net Assets for additional detailed categorizations. |
39
| Baron Funds | March 31, 2020 |
NOTES TO FINANCIAL STATEMENTS (Unaudited) (Continued)
7. FAIR VALUE MEASUREMENTS (Continued)
| Baron Opportunity Fund | ||||||||||||||||
| Description | Quoted Prices in Active Markets for Identical Assets (Level 1) | Other Observable Inputs (Level 2) | Unobservable Inputs (Level 3) | Total | ||||||||||||
Common Stocks† | $ | 418,015,988 | $ | 6,825,975 | $ | — | $ | 424,841,963 | ||||||||
Short Term Investments | — | 31,479,903 | — | 31,479,903 | ||||||||||||
|
|
|
|
|
|
|
| |||||||||
Total Investments | $ | 418,015,988 | $ | 38,305,878 | $ | — | $ | 456,321,866 | ||||||||
|
|
|
|
|
|
|
| |||||||||
| Baron Fifth Avenue Growth Fund | ||||||||||||||||
| Description | Quoted Prices in Active Markets for Identical Assets (Level 1) | Other Observable Inputs (Level 2) | Unobservable Inputs (Level 3) | Total | ||||||||||||
Common Stocks† | $ | 285,242,339 | $ | — | $ | — | $ | 285,242,339 | ||||||||
Short Term Investments | — | 6,168,996 | — | 6,168,996 | ||||||||||||
|
|
|
|
|
|
|
| |||||||||
Total Investments | $ | 285,242,339 | $ | 6,168,996 | $ | — | $ | 291,411,335 | ||||||||
|
|
|
|
|
|
|
| |||||||||
| Baron Discovery Fund | ||||||||||||||||
| Description | Quoted Prices in Active Markets for Identical Assets (Level 1) | Other Observable Inputs (Level 2) | Unobservable Inputs (Level 3) | Total | ||||||||||||
Common Stocks† | $ | 426,268,013 | $ | 5,588,372 | $ | — | $ | 431,856,385 | ||||||||
Short Term Investments | — | 45,968,047 | — | 45,968,047 | ||||||||||||
|
|
|
|
|
|
|
| |||||||||
Total Investments | $ | 426,268,013 | $ | 51,556,419 | $ | $ | 477,824,432 | |||||||||
|
|
|
|
|
|
|
| |||||||||
| Baron Durable Advantage Fund | ||||||||||||||||
| Description | Quoted Prices in Active Markets for Identical Assets (Level 1) | Other Observable Inputs (Level 2) | Unobservable Inputs (Level 3) | Total | ||||||||||||
Common Stocks† | $ | 7,725,623 | $ | — | $ | — | $ | 7,725,623 | ||||||||
Short Term Investments | — | 479,590 | — | 479,590 | ||||||||||||
|
|
|
|
|
|
|
| |||||||||
Total Investments | $ | 7,725,623 | $ | 479,590 | $ | — | $ | 8,205,213 | ||||||||
|
|
|
|
|
|
|
| |||||||||
| † | See Statements of Net Assets for additional detailed categorizations. |
40
| March 31, 2020 | Baron Funds |
NOTES TO FINANCIAL STATEMENTS (Unaudited) (Continued)
7. FAIR VALUE MEASUREMENTS (Continued)
The following is a reconciliation of investments in which unobservable inputs (Level 3) were used in determining fair value:
| Baron Asset Fund | ||||||||||||||||||||||||||||||||||||||||
| Investments in Securities | Balance as of September 30, 2019 | Accrued Premiums/ Discounts | Net Realized Gain (Loss) | Change in Net Unrealized Appreciation (Depreciation) | Purchases | Sales/ Distributions | Transfers Into Level 3 | Transfers Out of Level 3 | Balance as of March 31, 2020 | Change in Net Unrealized Appreciation (Depreciation) from Investments still held at March 31, 2020 | ||||||||||||||||||||||||||||||
Private Equity Investments | ||||||||||||||||||||||||||||||||||||||||
Financials | $ | 179,228 | $ | — | $ | — | $ | 1,411 | $ | — | $ | — | $ | — | $ | — | $ | 180,639 | $ | 1,411 | ||||||||||||||||||||
|
|
|
|
|
|
|
|
|
|
|
|
|
|
|
|
|
|
|
| |||||||||||||||||||||
| Baron Growth Fund | ||||||||||||||||||||||||||||||||||||||||
| Investments in Securities | Balance as of September 31, 2019 | Accrued Premiums/ Discounts | Net Realized Gain (Loss) | Change in Net Unrealized Appreciation (Depreciation) | Purchases | Sales/ Distributions | Transfers Into Level 3 | Transfers Out of Level 3 | Balance as of March 31, 2020 | Change in Net Unrealized Appreciation (Depreciation) from Investments still held at March 31, 2020 | ||||||||||||||||||||||||||||||
Private Preferred Stocks | ||||||||||||||||||||||||||||||||||||||||
Health Care1 | $ | 5,870,118 | $ | — | $ | — | $ | 12,217,866 | $ | — | $ | — | $ | — | $ | (18,087,984 | ) | $ | — | $ | — | |||||||||||||||||||
Private Partnerships | ||||||||||||||||||||||||||||||||||||||||
Financials | 60,329 | — | — | 475 | — | — | — | — | 60,804 | 475 | ||||||||||||||||||||||||||||||
|
|
|
|
|
|
|
|
|
|
|
|
|
|
|
|
|
|
|
| |||||||||||||||||||||
Total | $ | 5,930,447 | $ | — | $ | $ | 12,218,341 | $ | $ | — | $ | — | $ | (18,087,984 | ) | $ | 60,804 | $ | 475 | |||||||||||||||||||||
|
|
|
|
|
|
|
|
|
|
|
|
|
|
|
|
|
|
|
| |||||||||||||||||||||
| 1 | Schrödinger, Inc. Series E transferred out of Level 3 due to stock’s initial public offering on February 6, 2020. |
8. INCOME TAXES AND DISTRIBUTIONS TO SHAREHOLDERS
Federal income tax regulations differ from GAAP. Therefore, distributions determined in accordance with tax regulations may differ in amount or character from net investment income and net realized gain for financial reporting purposes. Net investment income (loss) and net realized and unrealized gain (loss) differ for financial statement and tax purposes due to differing treatments of net investment loss, foreign currency gains and losses,non-deductible interest expense, reclassification of distributions, partnership basis adjustments, income from passive foreign investment companies, late year loss deferral, post-October loss deferral and wash sale loss deferral. Financial reporting records are adjusted for permanent book/tax differences to reflect tax character. Financial records are not adjusted for temporary differences.
As of March 31, 2020, the components of net assets on a tax basis were as follows:
| Baron Asset Fund | Baron Growth Fund | Baron Small Cap Fund | Baron Fund | Baron Fifth Avenue Growth Fund | Baron Fund | Baron Durable Advantage Fund | ||||||||||||||||||||||
Cost of investments | $ | 1,573,458,916 | $ | 1,616,707,656 | $ | 1,803,094,943 | $ | 273,423,946 | $ | 155,045,337 | $ | 491,596,018 | $ | 8,286,549 | ||||||||||||||
|
|
|
|
|
|
|
|
|
|
|
|
|
| |||||||||||||||
Gross tax unrealized appreciation | 2,149,097,887 | 3,879,511,199 | 1,481,393,187 | 191,321,494 | 141,527,134 | 67,190,912 | 564,109 | |||||||||||||||||||||
Gross tax unrealized depreciation | (24,035,266 | ) | (70,622,884 | ) | (259,935,777 | ) | (8,423,574 | ) | (5,161,136 | ) | (80,962,498 | ) | (645,445 | ) | ||||||||||||||
|
|
|
|
|
|
|
|
|
|
|
|
|
| |||||||||||||||
Net tax unrealized appreciation (depreciation) | 2,125,062,621 | 3,808,888,315 | 1,221,457,410 | 182,897,920 | 136,365,998 | (13,771,586 | ) | (81,336 | ) | |||||||||||||||||||
Net tax unrealized currency appreciation (depreciation) | — | 5,548 | (5,351 | ) | — | 7,888 | (446 | ) | (4 | ) | ||||||||||||||||||
Undistributed (accumulated) net investment income (loss) | (32,547,232 | ) | 13,904,277 | (27,881,577 | ) | (5,710,053 | ) | (519,240 | ) | (5,400,655 | ) | 31,279 | ||||||||||||||||
Undistributed (accumulated) net realized gain (loss) | 32,798,635 | 124,052,149 | 224,156,784 | 13,716,364 | 4,114,164 | (457,382 | ) | (112,445 | ) | |||||||||||||||||||
Paid-in capital | 1,579,240,344 | 1,467,781,671 | 1,610,843,131 | 268,453,677 | 154,610,804 | 499,510,731 | 8,403,494 | |||||||||||||||||||||
|
|
|
|
|
|
|
|
|
|
|
|
|
| |||||||||||||||
Net Assets | $ | 3,704,554,368 | $ | 5,414,631,960 | $ | 3,028,570,397 | $ | 459,357,908 | $ | 294,579,614 | $ | 479,880,662 | $ | 8,240,988 | ||||||||||||||
|
|
|
|
|
|
|
|
|
|
|
|
|
| |||||||||||||||
41
| Baron Funds | March 31, 2020 |
NOTES TO FINANCIAL STATEMENTS (Unaudited) (Continued)
8. INCOME TAXES AND DISTRIBUTIONS TO SHAREHOLDERS (Continued)
As of September 30, 2019, the Funds had capital loss carryforwards expiring as follows:
| Baron Asset Fund | Baron Growth Fund | Baron Small Cap Fund | Baron Fund | Baron Fifth Avenue Growth Fund | Baron Fund | Baron Durable Advantage Fund | ||||||||||||||||||||||
Short term capital loss carryforwards: | ||||||||||||||||||||||||||||
No expiration date | $ | — | $ | — | $ | — | $ | — | $ | — | $ | — | $ | 71,640 | ||||||||||||||
|
|
|
|
|
|
|
|
|
|
|
|
|
| |||||||||||||||
The tax character of distributions paid during the six months ended March 31, 2020 and for the year ended September 30, 2019 was as follows:
| Six Months Ended March 31, 2020 | Year Ended September 30, 2019 | |||||||||||||||
| Fund | Ordinary1 | Long Term Capital Gain | Ordinary1 | Long Term Capital Gain | ||||||||||||
Baron Asset Fund | $ | — | $ | 77,500,344 | $ | — | $ | 211,479,374 | ||||||||
Baron Growth Fund | — | 255,000,961 | — | 430,003,177 | ||||||||||||
Baron Small Cap Fund | — | 356,000,771 | — | 351,005,399 | ||||||||||||
Baron Opportunity Fund | — | 29,500,835 | — | 19,401,893 | ||||||||||||
Baron Fifth Avenue Growth Fund | — | 9,350,331 | — | — | ||||||||||||
Baron Discovery Fund | — | 775,697 | 370,619 | 25,930,763 | ||||||||||||
Baron Durable Advantage Fund | — | — | 13,002 | — | ||||||||||||
| 1 | For tax purposes, short-term capital gains are considered ordinary income distributions. |
The Funds follow the provisions of FASB Codification Section 740 (“ASC Section 740”) “Accounting for Uncertainty in Income Taxes” which clarifies the accounting for uncertainty in tax positions taken or expected to be taken on a tax return. ASC Section 740 sets forth a threshold for financial statement recognition, measurement and disclosure of tax positions taken or expected to be taken on a tax return. The Funds are required to recognize the tax effects of certain tax positions under a “more likely than not” standard, that based on their technical merits, have more than 50 percent likelihood of being sustained upon examination. Management has analyzed the tax positions taken on the Funds’ federal income tax returns for all open years (current and prior three years), and has concluded that no provision for federal income tax is required in the Funds’ financial statements. At March 31, 2020, the Funds did not have any uncertain tax benefits that require recognition,de-recognition or disclosure. The Funds’ federal, state and local income and federal excise tax returns for which the applicable statutes of limitations have not expired (current and prior three years) are subject to examination by the Internal Revenue Service and state departments of revenue.
9. OWNERSHIP CONCENTRATION
As of March 31, 2020, the officers, trustees, and portfolio managers owned, directly or indirectly,14.02% of Baron Fifth Avenue Growth Fund and 25.83% of Baron Durable Advantage Fund. As a result of their ownership, these investors may be able to materially affect the outcome of matters presented to Baron Fifth Avenue Growth Fund, and Baron Durable Advantage Fund shareholders.
42
| March 31, 2020 | Baron Funds |
NOTES TO FINANCIAL STATEMENTS (Unaudited) (Continued)
10. TRANSACTIONS IN “AFFILIATED” COMPANIES1
BARON GROWTH FUND
| Name of Issuer | Value at September 30, 2019 | Purchase Cost | Sales Return of | Change in Net Unrealized Appreciation (Depreciation) | Realized (Losses) | Dividend Income | Shares Held at March 31, 2020 | Value at March 31, 2020 | % of Net Assets at March 31, 2020 | |||||||||||||||||||||||||||
“Affiliated” Company as of March 31, 2020: |
| |||||||||||||||||||||||||||||||||||
Choice Hotels International, Inc. | $ | 266,880,000 | $ | — | $ | — | $ | (83,130,000 | ) | $ | — | $ | 1,320,000 | 3,000,000 | $ | 183,750,000 | 3.39 | % | ||||||||||||||||||
Iridium Communications, Inc. | 188,596,298 | — | — | 9,305,739 | — | — | 8,862,608 | 197,902,037 | 3.65 | % | ||||||||||||||||||||||||||
Vail Resorts, Inc. | 477,876,000 | — | 13,640,235 | (169,627,867 | ) | 6,720,502 | 10,947,200 | 2,040,000 | 301,328,400 | 5.57 | % | |||||||||||||||||||||||||
|
|
|
|
|
|
|
|
|
|
|
|
|
| |||||||||||||||||||||||
| $ | 933,352,298 | $ | — | $ | 13,640,235 | $ | (243,452,128 | ) | $ | 6,720,502 | $ | 12,267,200 | $ | 682,980,437 | ||||||||||||||||||||||
|
|
|
|
|
|
|
|
|
|
|
|
|
| |||||||||||||||||||||||
No longer an “Affiliated” Company as of March 31, 2020: |
| |||||||||||||||||||||||||||||||||||
Benefitfocus, Inc. | $ | 52,382,000 | $ | — | $ | 27,833,612 | $ | 30,851,571 | $ | (55,399,959 | ) | $ | — | — | $ | — | 0.00 | % | ||||||||||||||||||
|
|
|
|
|
|
|
|
|
|
|
|
|
| |||||||||||||||||||||||
BARON SMALL CAP FUND
| Name of Issuer | Value at September 30, 2019 | Purchase Cost | Sales Return of | Change in Net Unrealized Appreciation (Depreciation) | Realized (Losses) | Dividend Income | Shares Held at March 31, 2020 | Value at March 31, 2020 | % of Net Assets at March 31, 2020 | |||||||||||||||||||||||||||
“Affiliated” Company as of March 31, 2020: |
| |||||||||||||||||||||||||||||||||||
Installed Building Products, Inc. | $ | 86,010,000 | $ | 6,453,164 | $ | — | (26,677,664 | ) | $ | — | $ | — | 1.650,000 | $ | 65,785,500 | 2.17 | % | |||||||||||||||||||
Repay Holdings Corporation | 45,535,000 | — | — | 4,690,000 | — | — | 3,500,000 | 50,225,000 | 1.66 | % | ||||||||||||||||||||||||||
Repay Holdings Corporation Warrants Exp 7/11/2024 | 3,010,000 | — | — | 1,575,000 | — | — | 3,500,000 | 4,585,000 | 0.15 | % | ||||||||||||||||||||||||||
|
|
|
|
|
|
|
|
|
|
|
|
|
| |||||||||||||||||||||||
| $ | 134,555,000 | $ | 6,453,164 | $ | — | $ | (20,412,664 | ) | $ | — | $ | — | $ | 120,595,500 | ||||||||||||||||||||||
|
|
|
|
|
|
|
|
|
|
|
|
|
| |||||||||||||||||||||||
No longer an “Affiliated” Company as of March 31, 2020: |
| |||||||||||||||||||||||||||||||||||
Grid Dynamics Holdings, Inc. (formerly, Chaserg Technology Acquisition Corp.)2 | $ | — | $ | 21,637,915 | $ | — | $ | (4,837,915 | ) | $ | — | $ | — | 2,100,000 | $ | 16,800,000 | 0.55 | % | ||||||||||||||||||
|
|
|
|
|
|
|
|
|
|
|
|
|
| |||||||||||||||||||||||
| 1 | An “Affiliated” company (“affiliated person” as defined in the 1940 Act), is a company in which a Fund held 5% or more of the company’s outstanding voting securities at any time during the six months ended March 31, 2020. |
| 2 | No longer an “Affiliated” company due to merger with Grid Dynamics Holdings Inc. on March 6, 2020. |
11. SUBSEQUENT EVENT
The coronavirus disease 2019 (COVID-19) global pandemic and the aggressive responses taken by many governments or voluntarily imposed by private parties, including closing borders, restricting travel and imposing prolonged quarantines or similar restrictions, as well as the closure of, or operational changes to, many retail and other businesses, have had negative impacts, and in many cases severe negative impacts, on markets worldwide. It is not known how long such impacts, or any future impacts of other significant events described above, will or would last, but there could be a prolonged period of global economic slowdown, which may impact your Fund investment.
43
| Baron Funds | March 31, 2020 |
FINANCIAL HIGHLIGHTS (Unaudited)
BARON ASSET FUND
Selected data for a share outstanding throughout each period:
| Income (loss) from investment operations: | Less distributions to shareholders from: | Ratios to Average Net Assets: | Supplemental Data: | |||||||||||||||||||||||||||||||||||||||||||||||||
| Net asset value, beginning of period ($) | Net investment income (loss) ($) | Net realized and unrealized gain (loss) on investments ($) | Total from investment operations ($) | Net investment income ($) | Net realized gain on investments ($) | Total distributions ($) | Net asset value, end of period ($) | Total return (%) | Operating expenses (%) | Net investment income (loss) (%) | Net assets (in millions), end of period ($) | Portfolio turnover rate (%) | ||||||||||||||||||||||||||||||||||||||||
RETAIL SHARES |
| |||||||||||||||||||||||||||||||||||||||||||||||||||
Six Months Ended March 31, |
| |||||||||||||||||||||||||||||||||||||||||||||||||||
2020 | 82.28 | (0.30 | )1 | (8.61 | ) | (8.91 | ) | 0.00 | (1.50 | ) | (1.50 | ) | 71.87 | (11.12 | )2 | 1.31 | 3 | (0.70 | )3 | 1,882.7 | 3.20 | 2 | ||||||||||||||||||||||||||||||
Year Ended September 30, |
| |||||||||||||||||||||||||||||||||||||||||||||||||||
2019 | 81.43 | (0.56 | )1 | 6.17 | 5.61 | 0.00 | (4.76 | ) | (4.76 | ) | 82.28 | 7.82 | 1.30 | (0.73 | ) | 2,242.0 | 11.83 | |||||||||||||||||||||||||||||||||||
2018 | 70.87 | (0.59 | )1 | 16.09 | 15.50 | 0.00 | (4.94 | ) | (4.94 | ) | 81.43 | 23.11 | 1.30 | (0.79 | ) | 2,259.7 | 9.87 | |||||||||||||||||||||||||||||||||||
2017 | 60.67 | (0.48 | )1 | 13.48 | 13.00 | 0.00 | (2.80 | ) | (2.80 | ) | 70.87 | 22.41 | 1.31 | (0.75 | ) | 1,979.1 | 10.35 | |||||||||||||||||||||||||||||||||||
2016 | 60.88 | (0.25 | )1 | 6.63 | 6.38 | 0.00 | (6.59 | ) | (6.59 | ) | 60.67 | 11.14 | 1.31 | (0.43 | ) | 1,802.6 | 12.54 | |||||||||||||||||||||||||||||||||||
2015 | 63.75 | (0.41 | )1 | 1.71 | 1.30 | 0.00 | (4.17 | ) | (4.17 | ) | 60.88 | 1.81 | 1.31 | (0.62 | ) | 1,804.3 | 13.53 | |||||||||||||||||||||||||||||||||||
2014 | 61.37 | (0.44 | )1 | 8.42 | 7.98 | 0.00 | (5.60 | ) | (5.60 | ) | 63.75 | 13.59 | 1.31 | (0.70 | ) | 2,000.5 | 11.26 | |||||||||||||||||||||||||||||||||||
2013 | 52.03 | (0.34 | )1 | 13.44 | 13.10 | 0.00 | (3.76 | ) | (3.76 | ) | 61.37 | 27.17 | 1.32 | (0.62 | ) | 2,024.2 | 12.04 | |||||||||||||||||||||||||||||||||||
2012 | 49.00 | (0.14 | )1 | 10.94 | 10.80 | 0.00 | (7.77 | ) | (7.77 | ) | 52.03 | 24.65 | 1.33 | (0.28 | ) | 1,845.6 | 13.11 | |||||||||||||||||||||||||||||||||||
2011 | 49.27 | (0.23 | )1 | 0.73 | 0.50 | 0.00 | (0.77 | ) | (0.77 | ) | 49.00 | 0.85 | 1.33 | (0.41 | ) | 1,924.9 | 23.89 | |||||||||||||||||||||||||||||||||||
INSTITUTIONAL SHARES |
| |||||||||||||||||||||||||||||||||||||||||||||||||||
Six Months Ended March 31, |
| |||||||||||||||||||||||||||||||||||||||||||||||||||
2020 | 85.67 | (0.20 | )1 | (8.99 | ) | (9.19 | ) | 0.00 | (1.50 | ) | (1.50 | ) | 74.98 | (11.01 | )2 | 1.05 | 3 | (0.45 | )3 | 1,721.6 | 3.20 | 2 | ||||||||||||||||||||||||||||||
Year Ended September 30, |
| |||||||||||||||||||||||||||||||||||||||||||||||||||
2019 | 84.36 | (0.38 | )1 | 6.45 | 6.07 | 0.00 | (4.76 | ) | (4.76 | ) | 85.67 | 8.11 | 1.05 | (0.48 | ) | 1,979.7 | 11.83 | |||||||||||||||||||||||||||||||||||
2018 | 73.07 | (0.41 | )1 | 16.64 | 16.23 | 0.00 | (4.94 | ) | (4.94 | ) | 84.36 | 23.43 | 1.04 | (0.53 | ) | 1,315.7 | 9.87 | |||||||||||||||||||||||||||||||||||
2017 | 62.30 | (0.33 | )1 | 13.90 | 13.57 | 0.00 | (2.80 | ) | (2.80 | ) | 73.07 | 22.76 | 1.04 | (0.50 | ) | 1,021.0 | 10.35 | |||||||||||||||||||||||||||||||||||
2016 | 62.19 | (0.10 | )1 | 6.80 | 6.70 | 0.00 | (6.59 | ) | (6.59 | ) | 62.30 | 11.44 | 1.04 | (0.17 | ) | 723.3 | 12.54 | |||||||||||||||||||||||||||||||||||
2015 | 64.87 | (0.24 | )1 | 1.73 | 1.49 | 0.00 | (4.17 | ) | (4.17 | ) | 62.19 | 2.09 | 1.04 | (0.36 | ) | 719.1 | 13.53 | |||||||||||||||||||||||||||||||||||
2014 | 62.20 | (0.28 | )1 | 8.55 | 8.27 | 0.00 | (5.60 | ) | (5.60 | ) | 64.87 | 13.90 | 1.04 | (0.43 | ) | 689.8 | 11.26 | |||||||||||||||||||||||||||||||||||
2013 | 52.55 | (0.21 | )1 | 13.62 | 13.41 | 0.00 | (3.76 | ) | (3.76 | ) | 62.20 | 27.51 | 1.05 | (0.38 | ) | 506.1 | 12.04 | |||||||||||||||||||||||||||||||||||
2012 | 49.30 | 0.01 | 1 | 11.01 | 11.02 | 0.00 | (7.77 | ) | (7.77 | ) | 52.55 | 24.99 | 1.06 | 0.02 | 386.7 | 13.11 | ||||||||||||||||||||||||||||||||||||
2011 | 49.43 | (0.10 | )1 | 0.74 | 0.64 | 0.00 | (0.77 | ) | (0.77 | ) | 49.30 | 1.14 | 1.06 | (0.18 | ) | 288.9 | 23.89 | |||||||||||||||||||||||||||||||||||
R6 SHARES |
| |||||||||||||||||||||||||||||||||||||||||||||||||||
Six Months Ended March 31, |
| |||||||||||||||||||||||||||||||||||||||||||||||||||
2020 | 85.65 | (0.19 | )1 | (9.00 | ) | (9.19 | ) | 0.00 | (1.50 | ) | (1.50 | ) | 74.96 | (11.01 | )2 | 1.05 | 3 | (0.44 | )3 | 100.3 | 3.20 | 2 | ||||||||||||||||||||||||||||||
Year Ended September 30, |
| |||||||||||||||||||||||||||||||||||||||||||||||||||
2019 | 84.35 | (0.38 | )1 | 6.44 | 6.06 | 0.00 | (4.76 | ) | (4.76 | ) | 85.65 | 8.09 | 1.05 | (0.47 | ) | 109.0 | 11.83 | |||||||||||||||||||||||||||||||||||
2018 | 73.06 | (0.41 | )1 | 16.64 | 16.23 | 0.00 | (4.94 | ) | (4.94 | ) | 84.35 | 23.43 | 1.04 | (0.54 | ) | 73.5 | 9.87 | |||||||||||||||||||||||||||||||||||
2017 | 62.30 | (0.34 | )1 | 13.90 | 13.56 | 0.00 | (2.80 | ) | (2.80 | ) | 73.06 | 22.74 | 1.04 | (0.51 | ) | 22.5 | 10.35 | |||||||||||||||||||||||||||||||||||
20164 | 53.85 | (0.21 | )1 | 8.68 | 8.47 | 0.00 | (0.02 | ) | (0.02 | ) | 62.30 | 15.73 | 2 | 1.04 | 3 | (0.52 | )3 | 7.8 | 12.54 | |||||||||||||||||||||||||||||||||
| 1 | Based on average shares outstanding. |
| 2 | Not Annualized. |
| 3 | Annualized. |
| 4 | For the period January 29, 2016 (initial offering of R6 Shares) to September 30, 2016. |
| 44 | See Notes to Financial Statements. |
| March 31, 2020 | Baron Funds |
FINANCIAL HIGHLIGHTS (Unaudited) (Continued)
BARON GROWTH FUND
Selected data for a share outstanding throughout each period:
| Income (loss) from investment operations: | Less distributions to shareholders from: | Ratios to Average Net Assets: | Supplemental Data: | |||||||||||||||||||||||||||||||||||||||||||||||||
| Net asset value, beginning of period ($) | Net investment income (loss) ($) | Net realized and unrealized gain (loss) on investments ($) | Total from investment operations ($) | Net investment income ($) | Net realized gain on investments ($) | Total distributions ($) | Net asset value, end of period ($) | Total return (%) | Operating expenses (%) | Net investment income (loss) (%) | Net assets (in millions), end of period ($) | Portfolio turnover rate (%) | ||||||||||||||||||||||||||||||||||||||||
RETAIL SHARES |
| |||||||||||||||||||||||||||||||||||||||||||||||||||
Six Months Ended March 31, |
| |||||||||||||||||||||||||||||||||||||||||||||||||||
2020 | 78.95 | (0.01 | )1 | (11.71 | ) | (11.72 | ) | 0.00 | (3.05 | ) | (3.05 | ) | 64.18 | (15.69 | )3 | 1.30 | 2,4 | (0.01 | )4 | 1,942.6 | 0.36 | 3 | ||||||||||||||||||||||||||||||
Year Ended September 30, |
| |||||||||||||||||||||||||||||||||||||||||||||||||||
2019 | 80.68 | (0.16 | )1 | 3.56 | 3.40 | 0.00 | (5.13 | ) | (5.13 | ) | 78.95 | 5.09 | 1.29 | 2 | (0.21 | ) | 2,507.0 | 1.93 | ||||||||||||||||||||||||||||||||||
2018 | 71.77 | (0.17 | )1 | 16.98 | 16.81 | 0.00 | (7.90 | ) | (7.90 | ) | 80.68 | 25.55 | 1.29 | 2 | (0.24 | ) | 2,747.8 | 2.92 | ||||||||||||||||||||||||||||||||||
2017 | 67.13 | (0.16 | )1 | 12.44 | 12.28 | 0.00 | (7.64 | ) | (7.64 | ) | 71.77 | 20.47 | 1.30 | 2 | (0.25 | ) | 2,666.6 | 3.32 | ||||||||||||||||||||||||||||||||||
2016 | 68.25 | 0.08 | 1 | 4.83 | 4.91 | 0.00 | (6.03 | ) | (6.03 | ) | 67.13 | 7.60 | 1.30 | 2 | 0.12 | 2,917.2 | 4.68 | |||||||||||||||||||||||||||||||||||
2015 | 70.46 | (0.27 | )1 | 1.28 | 1.01 | 0.00 | (3.22 | ) | (3.22 | ) | 68.25 | 1.27 | 1.29 | 2 | (0.37 | ) | 3,511.2 | 6.95 | ||||||||||||||||||||||||||||||||||
2014 | 68.67 | 0.06 | 1 | 3.45 | 3.51 | (0.03 | ) | (1.69 | ) | (1.72 | ) | 70.46 | 5.11 | 1.29 | 2 | 0.08 | 4,076.1 | 13.15 | ||||||||||||||||||||||||||||||||||
2013 | 58.19 | (0.12 | )1 | 16.37 | 16.25 | (0.18 | ) | (5.59 | ) | (5.77 | ) | 68.67 | 30.76 | 1.30 | (0.20 | ) | 4,644.2 | 9.63 | ||||||||||||||||||||||||||||||||||
2012 | 46.18 | 0.20 | 1 | 12.64 | 12.84 | 0.00 | (0.83 | ) | (0.83 | ) | 58.19 | 28.12 | 1.32 | 0.38 | 4,073.5 | 13.70 | ||||||||||||||||||||||||||||||||||||
2011 | 44.37 | (0.29 | )1 | 2.10 | 1.81 | 0.00 | 0.00 | 0.00 | 46.18 | 4.08 | 1.32 | (0.56 | ) | 4,110.8 | 13.51 | |||||||||||||||||||||||||||||||||||||
INSTITUTIONAL SHARES |
| |||||||||||||||||||||||||||||||||||||||||||||||||||
Six Months Ended March 31, |
| |||||||||||||||||||||||||||||||||||||||||||||||||||
2020 | 81.69 | 0.10 | (12.16 | ) | (12.06 | ) | 0.00 | (3.05 | ) | (3.05 | ) | 66.58 | (15.58 | )3 | 1.04 | 2,4 | 0.24 | 4 | 3,349.0 | 0.36 | 3 | |||||||||||||||||||||||||||||||
Year Ended September 30, |
| |||||||||||||||||||||||||||||||||||||||||||||||||||
2019 | 83.09 | 0.03 | 1 | 3.70 | 3.73 | 0.00 | (5.13 | ) | (5.13 | ) | 81.69 | 5.36 | 1.04 | 2 | 0.03 | 4,150.9 | 1.93 | |||||||||||||||||||||||||||||||||||
2018 | 73.52 | 0.01 | 1 | 17.46 | 17.47 | 0.00 | (7.90 | ) | (7.90 | ) | 83.09 | 25.86 | 1.03 | 2 | 0.01 | 4,134.2 | 2.92 | |||||||||||||||||||||||||||||||||||
2017 | 68.42 | 0.00 | 1,5 | 12.74 | 12.74 | 0.00 | (7.64 | ) | (7.64 | ) | 73.52 | 20.79 | 1.04 | 2 | 0.00 | 6 | 3,433.5 | 3.32 | ||||||||||||||||||||||||||||||||||
2016 | 69.28 | 0.24 | 1 | 4.93 | 5.17 | 0.00 | (6.03 | ) | (6.03 | ) | 68.42 | 7.88 | 1.05 | 2 | 0.37 | 3,043.3 | 4.68 | |||||||||||||||||||||||||||||||||||
2015 | 71.33 | (0.09 | )1 | 1.28 | 1.19 | (0.02 | ) | (3.22 | ) | (3.24 | ) | 69.28 | 1.51 | 1.04 | 2 | (0.12 | ) | 3,440.4 | 6.95 | |||||||||||||||||||||||||||||||||
2014 | 69.32 | 0.20 | 1 | 3.53 | 3.73 | (0.03 | ) | (1.69 | ) | (1.72 | ) | 71.33 | 5.39 | 1.04 | 2 | 0.28 | 3,694.5 | 13.15 | ||||||||||||||||||||||||||||||||||
2013 | 58.70 | 0.02 | 1 | 16.52 | 16.54 | (0.33 | ) | (5.59 | ) | (5.92 | ) | 69.32 | 31.10 | 1.05 | 0.04 | 2,976.7 | 9.63 | |||||||||||||||||||||||||||||||||||
2012 | 46.46 | 0.45 | 1 | 12.62 | 13.07 | 0.00 | (0.83 | ) | (0.83 | ) | 58.70 | 28.45 | 1.06 | 0.83 | 1,747.3 | 13.70 | ||||||||||||||||||||||||||||||||||||
2011 | 44.52 | (0.17 | )1 | 2.11 | 1.94 | 0.00 | 0.00 | 0.00 | 46.46 | 4.36 | 1.06 | (0.33 | ) | 1,261.8 | 13.51 | |||||||||||||||||||||||||||||||||||||
R6 SHARES |
| |||||||||||||||||||||||||||||||||||||||||||||||||||
Six Months Ended March 31, |
| |||||||||||||||||||||||||||||||||||||||||||||||||||
2020 | 81.70 | 0.10 | (12.16 | ) | (12.06 | ) | 0.00 | (3.05 | ) | (3.05 | ) | 66.59 | (15.58 | )3 | 1.04 | 2,4 | 0.24 | 4 | 123.0 | 0.36 | 3 | |||||||||||||||||||||||||||||||
Year Ended September 30, |
| |||||||||||||||||||||||||||||||||||||||||||||||||||
2019 | 83.10 | 0.00 | 1,5 | 3.73 | 3.73 | 0.00 | (5.13 | ) | (5.13 | ) | 81.70 | 5.36 | 1.04 | 2 | 0.00 | 6 | 131.6 | 1.93 | ||||||||||||||||||||||||||||||||||
2018 | 73.52 | (0.00 | )1,5 | 17.48 | 17.48 | 0.00 | (7.90 | ) | (7.90 | ) | 83.10 | 25.88 | 1.04 | 2 | (0.00 | )6 | 107.4 | 2.92 | ||||||||||||||||||||||||||||||||||
2017 | 68.42 | (0.11 | )1 | 12.85 | 12.74 | 0.00 | (7.64 | ) | (7.64 | ) | 73.52 | 20.79 | 1.05 | 2 | (0.15 | ) | 12.5 | 3.32 | ||||||||||||||||||||||||||||||||||
20167 | 60.02 | (0.15 | )1 | 8.55 | 8.40 | 0.00 | 0.00 | 0.00 | 68.42 | 14.00 | 3 | 1.05 | 2,4 | (0.33 | )4 | 2.3 | 4.68 | |||||||||||||||||||||||||||||||||||
| 1 | Based on average shares outstanding. |
| 2 | Interest expense rounds to less than 0.01%. |
| 3 | Not Annualized. |
| 4 | Annualized. |
| 5 | Less than $0.01 per share. |
| 6 | Less than 0.01%. |
| 7 | For the period January 29, 2016 (initial offering of R6 Shares) to September 30, 2016. |
| See Notes to Financial Statements. | 45 |
| Baron Funds | March 31, 2020 |
FINANCIAL HIGHLIGHTS (Unaudited) (Continued)
BARON SMALL CAP FUND
Selected data for a share outstanding throughout each period:
| Income (loss) from investment operations: | Less distributions to shareholders from: | Ratios to Average Net Assets: | Supplemental Data: | |||||||||||||||||||||||||||||||||||||||||||||||||
| Net asset value, beginning of period ($) | Net investment income (loss) ($) | Net realized and unrealized gain (loss) on Investment ($) | Total from investment operations ($) | Net investment income ($) | Net realized gain on investments ($) | Total distributions ($) | Net asset value, end of period ($) | Total return (%) | Operating expenses (%) | Net investment income (loss) (%) | Net assets (in millions), end of period ($) | Portfolio turnover rate (%) | ||||||||||||||||||||||||||||||||||||||||
RETAIL SHARES |
| |||||||||||||||||||||||||||||||||||||||||||||||||||
Six Months Ended March 31, |
| |||||||||||||||||||||||||||||||||||||||||||||||||||
2020 | 29.44 | (0.09 | )1 | (4.03 | ) | (4.12 | ) | 0.00 | (2.82 | ) | (2.82 | ) | 22.50 | (16.18 | )3 | 1.31 | 4 | (0.65 | )4 | 1,073.5 | 6.51 | 3 | ||||||||||||||||||||||||||||||
Year Ended September 30, |
| |||||||||||||||||||||||||||||||||||||||||||||||||||
2019 | 33.68 | (0.27 | )1 | (1.36 | ) | (1.63 | ) | 0.00 | (2.61 | ) | (2.61 | ) | 29.44 | (4.17 | ) | 1.31 | (0.95 | ) | 1,451.9 | 13.44 | ||||||||||||||||||||||||||||||||
2018 | 30.64 | (0.32 | )1 | 7.21 | 6.89 | 0.00 | (3.85 | ) | (3.85 | ) | 33.68 | 25.00 | 1.30 | (1.05 | ) | 1,831.3 | 14.19 | |||||||||||||||||||||||||||||||||||
2017 | 30.59 | (0.04 | )1 | 5.77 | 5.73 | 0.00 | (5.68 | ) | (5.68 | ) | 30.64 | 22.45 | 1.31 | 5 | (0.15 | ) | 1,730.3 | 28.95 | ||||||||||||||||||||||||||||||||||
2016 | 30.34 | (0.18 | )1 | 3.84 | 3.66 | 0.00 | (3.41 | ) | (3.41 | ) | 30.59 | 12.89 | 1.32 | 5 | (0.64 | ) | 1,826.3 | 10.25 | ||||||||||||||||||||||||||||||||||
2015 | 33.68 | (0.21 | )1 | (1.10 | ) | (1.31 | ) | 0.00 | (2.03 | ) | (2.03 | ) | 30.34 | (4.32 | )�� | 1.30 | (0.61 | ) | 2,601.4 | 14.66 | ||||||||||||||||||||||||||||||||
2014 | 32.83 | (0.01 | )1 | 2.14 | 2.13 | 0.00 | (1.28 | ) | (1.28 | ) | 33.68 | 6.52 | 1.30 | (0.04 | ) | 3,192.8 | 16.41 | |||||||||||||||||||||||||||||||||||
2013 | 26.14 | (0.12 | )1 | 7.61 | 7.49 | 0.00 | (0.80 | ) | (0.80 | ) | 32.83 | 29.51 | 1.31 | (0.42 | ) | 3,626.1 | 20.35 | |||||||||||||||||||||||||||||||||||
2012 | 20.84 | (0.19 | )1 | 5.96 | 5.77 | 0.00 | (0.47 | ) | (0.47 | ) | 26.14 | 28.09 | 1.31 | (0.76 | ) | 3,081.8 | 28.02 | |||||||||||||||||||||||||||||||||||
2011 | 20.90 | (0.15 | )1 | 0.09 | 2 | (0.06 | ) | 0.00 | 0.00 | 0.00 | 20.84 | (0.29 | ) | 1.31 | (0.63 | ) | 2,842.0 | 32.81 | ||||||||||||||||||||||||||||||||||
INSTITUTIONAL SHARES |
| |||||||||||||||||||||||||||||||||||||||||||||||||||
Six Months Ended March 31, |
| |||||||||||||||||||||||||||||||||||||||||||||||||||
2020 | 30.74 | (0.06 | )1 | (4.24 | ) | (4.30 | ) | 0.00 | (2.82 | ) | (2.82 | ) | 23.62 | (16.08 | )3 | 1.05 | 4 | (0.39 | )4 | 1,819.6 | 6.51 | 3 | ||||||||||||||||||||||||||||||
Year Ended September 30, |
| |||||||||||||||||||||||||||||||||||||||||||||||||||
2019 | 34.95 | (0.21 | )1 | (1.39 | ) | (1.60 | ) | 0.00 | (2.61 | ) | (2.61 | ) | 30.74 | (3.91 | ) | 1.05 | (0.69 | ) | 2,267.3 | 13.44 | ||||||||||||||||||||||||||||||||
2018 | 31.58 | (0.25 | )1 | 7.47 | 7.22 | 0.00 | (3.85 | ) | (3.85 | ) | 34.95 | 25.33 | 1.04 | (0.79 | ) | 2,696.7 | 14.19 | |||||||||||||||||||||||||||||||||||
2017 | 31.29 | 0.02 | 1 | 5.95 | 5.97 | 0.00 | (5.68 | ) | (5.68 | ) | 31.58 | 22.76 | 1.05 | 5 | 0.06 | 2,404.6 | 28.95 | |||||||||||||||||||||||||||||||||||
2016 | 30.88 | (0.12 | )1 | 3.94 | 3.82 | 0.00 | (3.41 | ) | (3.41 | ) | 31.29 | 13.21 | 1.06 | 5 | (0.41 | ) | 1,680.7 | 10.25 | ||||||||||||||||||||||||||||||||||
2015 | 34.16 | (0.13 | )1 | (1.12 | ) | (1.25 | ) | 0.00 | (2.03 | ) | (2.03 | ) | 30.88 | (4.08 | ) | 1.04 | (0.37 | ) | 1,923.2 | 14.66 | ||||||||||||||||||||||||||||||||
2014 | 33.20 | 0.06 | 1 | 2.18 | 2.24 | 0.00 | (1.28 | ) | (1.28 | ) | 34.16 | 6.79 | 1.04 | 0.18 | 2,057.4 | 16.41 | ||||||||||||||||||||||||||||||||||||
2013 | 26.36 | (0.05 | )1 | 7.69 | 7.64 | 0.00 | (0.80 | ) | (0.80 | ) | 33.20 | 29.85 | 1.05 | (0.16 | ) | 1,775.7 | 20.35 | |||||||||||||||||||||||||||||||||||
2012 | 20.96 | (0.13 | )1 | 6.00 | 5.87 | 0.00 | (0.47 | ) | (0.47 | ) | 26.36 | 28.41 | 1.05 | (0.53 | ) | 1,111.0 | 28.02 | |||||||||||||||||||||||||||||||||||
2011 | 20.97 | (0.10 | )1 | 0.09 | 2 | (0.01 | ) | 0.00 | 0.00 | 0.00 | 20.96 | (0.05 | ) | 1.06 | (0.42 | ) | 518.6 | 32.81 | ||||||||||||||||||||||||||||||||||
R6 SHARES |
| |||||||||||||||||||||||||||||||||||||||||||||||||||
Six Months Ended March 31, |
| |||||||||||||||||||||||||||||||||||||||||||||||||||
2020 | 30.73 | (0.06 | )1 | (4.24 | ) | (4.30 | ) | 0.00 | (2.82 | ) | (2.82 | ) | 23.61 | (16.09 | )3 | 1.05 | 4 | (0.39 | )4 | 135.5 | 6.51 | 3 | ||||||||||||||||||||||||||||||
Year Ended September 30, |
| |||||||||||||||||||||||||||||||||||||||||||||||||||
2019 | 34.94 | (0.21 | )1 | (1.39 | ) | (1.60 | ) | 0.00 | (2.61 | ) | (2.61 | ) | 30.73 | (3.91 | ) | 1.05 | (0.70 | ) | 161.9 | 13.44 | ||||||||||||||||||||||||||||||||
2018 | 31.57 | (0.26 | )1 | 7.48 | 7.22 | 0.00 | (3.85 | ) | (3.85 | ) | 34.94 | 25.34 | 1.05 | (0.82 | ) | 155.2 | 14.19 | |||||||||||||||||||||||||||||||||||
2017 | 31.29 | (0.08 | )1 | 6.04 | 5.96 | 0.00 | (5.68 | ) | (5.68 | ) | 31.57 | 22.72 | 1.06 | 5 | (0.28 | ) | 101.8 | 28.95 | ||||||||||||||||||||||||||||||||||
20166 | 26.06 | (0.17 | )1 | 5.40 | 5.23 | 0.00 | 0.00 | 0.00 | 31.29 | 20.07 | 3 | 1.06 | 4,5 | (0.85 | )4 | 3.7 | 10.25 | |||||||||||||||||||||||||||||||||||
| 1 | Based on average shares outstanding. |
| 2 | The amount shown for a share outstanding does not correspond with the aggregate realized and unrealized gain (loss) on investments for the period due to the timing of sales and redemptions of Fund shares in relation to fluctuating market values of investments of the Fund. |
| 3 | Not Annualized. |
| 4 | Annualized. |
| 5 | Interest expense rounds to less than 0.01%. |
| 6 | For the period January 29, 2016 (initial offering of R6 Shares) to September 30, 2016. |
| 46 | See Notes to Financial Statements. |
| March 31, 2020 | Baron Funds |
FINANCIAL HIGHLIGHTS (Unaudited) (Continued)
BARON OPPORTUNITY FUND
Selected data for a share outstanding throughout each period:
| Income (loss) from investment operations: | Less distributions to shareholders from: | Ratios to Average Net Assets: | Supplemental Data: | |||||||||||||||||||||||||||||||||||||||||||||||||
| Net asset value, beginning of period ($) | Net investment income (loss) ($) | Net realized and unrealized gain (loss) on investments ($) | Total from investment operations ($) | Net investment income ($) | Net realized gain on investments ($) | Total distributions ($) | Net asset value, end of period ($) | Total return (%) | Operating expenses (%) | Net investment income (loss) (%) | Net assets (in millions), end of period ($) | Portfolio turnover rate (%) | ||||||||||||||||||||||||||||||||||||||||
RETAIL SHARES |
| |||||||||||||||||||||||||||||||||||||||||||||||||||
Six Months Ended March 31, |
| |||||||||||||||||||||||||||||||||||||||||||||||||||
2020 | 21.53 | (0.13 | )1 | 1.61 | 1.48 | 0.00 | (1.68 | ) | (1.68 | ) | 21.33 | 6.47 | 4 | 1.36 | 3,5 | (1.12 | )5 | 308.6 | 22.26 | 4 | ||||||||||||||||||||||||||||||||
Year Ended September 30, |
| |||||||||||||||||||||||||||||||||||||||||||||||||||
2019 | 22.02 | (0.22 | )1 | 0.66 | 0.44 | 0.00 | (0.93 | ) | (0.93 | ) | 21.53 | 2.51 | 1.34 | 3 | (1.07 | ) | 302.6 | 37.10 | ||||||||||||||||||||||||||||||||||
2018 | 18.53 | (0.22 | )1 | 6.36 | 6.14 | 0.00 | (2.65 | ) | (2.65 | ) | 22.02 | 37.41 | 1.37 | 3 | (1.13 | ) | 363.6 | 23.97 | ||||||||||||||||||||||||||||||||||
2017 | 16.87 | (0.20 | )1 | 3.75 | 3.55 | 0.00 | (1.89 | ) | (1.89 | ) | 18.53 | 24.32 | 1.41 | 3 | (1.18 | ) | 201.4 | 32.62 | ||||||||||||||||||||||||||||||||||
2016 | 17.12 | (0.13 | )1 | 1.70 | 1.57 | 0.00 | (1.82 | ) | (1.82 | ) | 16.87 | 9.19 | 1.41 | 3 | (0.83 | ) | 207.0 | 32.38 | ||||||||||||||||||||||||||||||||||
2015 | 18.61 | (0.21 | )1 | (0.25 | ) | (0.46 | ) | 0.00 | (1.03 | ) | (1.03 | ) | 17.12 | (2.70 | ) | 1.38 | 3 | (1.10 | ) | 232.2 | 41.87 | |||||||||||||||||||||||||||||||
2014 | 19.26 | (0.24 | )1 | 0.79 | 0.55 | 0.00 | (1.20 | ) | (1.20 | ) | 18.61 | 2.87 | 2 | 1.35 | (1.24 | ) | 331.2 | 63.40 | ||||||||||||||||||||||||||||||||||
2013 | 15.61 | (0.17 | )1 | 4.06 | 3.89 | 0.00 | (0.24 | ) | (0.24 | ) | 19.26 | 25.39 | 1.37 | (1.02 | ) | 359.9 | 70.44 | |||||||||||||||||||||||||||||||||||
2012 | 12.83 | (0.17 | )1 | 2.95 | 2.78 | 0.00 | 0.00 | 0.00 | 15.61 | 21.67 | 1.39 | (1.16 | ) | 332.4 | 88.56 | |||||||||||||||||||||||||||||||||||||
2011 | 12.76 | (0.16 | )1 | 0.23 | 0.07 | 0.00 | 0.00 | 0.00 | 12.83 | 0.55 | 1.41 | (1.11 | ) | 240.4 | 65.43 | |||||||||||||||||||||||||||||||||||||
INSTITUTIONAL SHARES |
| |||||||||||||||||||||||||||||||||||||||||||||||||||
Six Months Ended March 31, |
| |||||||||||||||||||||||||||||||||||||||||||||||||||
2020 | 22.42 | (0.10 | )1 | 1.68 | 1.58 | 0.00 | (1.68 | ) | (1.68 | ) | 22.32 | 6.67 | 4 | 1.10 | 3,5 | (0.86 | )5 | 135.3 | 22.26 | 4 | ||||||||||||||||||||||||||||||||
Year Ended September 30, |
| |||||||||||||||||||||||||||||||||||||||||||||||||||
2019 | 22.83 | (0.18 | )1 | 0.70 | 0.52 | 0.00 | (0.93 | ) | (0.93 | ) | 22.42 | 2.78 | 1.09 | 3 | (0.82 | ) | 94.4 | 37.10 | ||||||||||||||||||||||||||||||||||
2018 | 19.08 | (0.18 | )1 | 6.58 | 6.40 | 0.00 | (2.65 | ) | (2.65 | ) | 22.83 | 37.73 | 1.11 | 3 | (0.88 | ) | 96.4 | 23.97 | ||||||||||||||||||||||||||||||||||
2017 | 17.27 | (0.16 | )1 | 3.86 | 3.70 | 0.00 | (1.89 | ) | (1.89 | ) | 19.08 | 24.65 | 1.14 | 3 | (0.92 | ) | 51.7 | 32.62 | ||||||||||||||||||||||||||||||||||
2016 | 17.45 | (0.08 | )1 | 1.72 | 1.64 | 0.00 | (1.82 | ) | (1.82 | ) | 17.27 | 9.44 | 1.13 | 3 | (0.46 | ) | 43.3 | 32.38 | ||||||||||||||||||||||||||||||||||
2015 | 18.89 | (0.16 | )1 | (0.25 | ) | (0.41 | ) | 0.00 | (1.03 | ) | (1.03 | ) | 17.45 | (2.38 | ) | 1.10 | 3 | (0.84 | ) | 91.7 | 41.87 | |||||||||||||||||||||||||||||||
2014 | 19.49 | (0.19 | )1 | 0.79 | 0.60 | 0.00 | (1.20 | ) | (1.20 | ) | 18.89 | 3.10 | 2 | 1.08 | (0.97 | ) | 109.4 | 63.40 | ||||||||||||||||||||||||||||||||||
2013 | 15.75 | (0.13 | )1 | 4.11 | 3.98 | 0.00 | (0.24 | ) | (0.24 | ) | 19.49 | 25.74 | 1.11 | (0.79 | ) | 101.3 | 70.44 | |||||||||||||||||||||||||||||||||||
2012 | 12.91 | (0.13 | )1 | 2.97 | 2.84 | 0.00 | 0.00 | 0.00 | 15.75 | 22.00 | 1.13 | (0.90 | ) | 62.5 | 88.56 | |||||||||||||||||||||||||||||||||||||
2011 | 12.80 | (0.12 | )1 | 0.23 | 0.11 | 0.00 | 0.00 | 0.00 | 12.91 | 0.86 | 1.14 | (0.84 | ) | 35.5 | 65.43 | |||||||||||||||||||||||||||||||||||||
R6 SHARES |
| |||||||||||||||||||||||||||||||||||||||||||||||||||
Six Months Ended March 31, |
| |||||||||||||||||||||||||||||||||||||||||||||||||||
2020 | 22.45 | (0.10 | )1 | 1.68 | 1.58 | 0.00 | (1.68 | ) | (1.68 | ) | 22.35 | 6.66 | 4 | 1.09 | 3,5 | (0.85 | )5 | 15.5 | 22.26 | 4 | ||||||||||||||||||||||||||||||||
Year Ended September 30, |
| |||||||||||||||||||||||||||||||||||||||||||||||||||
2019 | 22.86 | (0.18 | )1 | 0.70 | 0.52 | 0.00 | (0.93 | ) | (0.93 | ) | 22.45 | 2.78 | 1.08 | 3 | (0.81 | ) | 14.5 | 37.10 | ||||||||||||||||||||||||||||||||||
2018 | 19.09 | (0.17 | )1 | 6.59 | 6.42 | 0.00 | (2.65 | ) | (2.65 | ) | 22.86 | 37.83 | 1.09 | 3 | (0.82 | ) | 14.0 | 23.97 | ||||||||||||||||||||||||||||||||||
2017 | 17.28 | (0.16 | )1 | 3.86 | 3.70 | 0.00 | (1.89 | ) | (1.89 | ) | 19.09 | 24.64 | 1.12 | 3 | (0.89 | ) | 1.0 | 32.62 | ||||||||||||||||||||||||||||||||||
20166 | 16.88 | (0.02 | )1 | 0.42 | 0.40 | 0.00 | 0.00 | 0.00 | 17.28 | 2.37 | 4 | 1.12 | 3,5 | (1.25 | )5 | 0.5 | 32.38 | |||||||||||||||||||||||||||||||||||
| 1 | Based on average shares outstanding. |
| 2 | The Adviser made a voluntary payment to the Fund in the amount of $140,762 to compensate the Fund for a loss incurred due to a trade processing error. The impact of this payment increased the Fund’s total return by 0.03%. |
| 3 | Interest expense rounds to less than 0.01%. |
| 4 | Not Annualized. |
| 5 | Annualized. |
| 6 | For the period August 31, 2016 (initial offering of R6 Shares) to September 30, 2016. |
| See Notes to Financial Statements. | 47 |
| Baron Funds | March 31, 2020 |
FINANCIAL HIGHLIGHTS (Unaudited) (Continued)
BARON FIFTH AVENUE GROWTH FUND
Selected data for a share outstanding throughout each period:
| Income (loss) from investment operations: | Less distributions to shareholders from: | Ratios to Average Net Assets: | Supplemental Data: | |||||||||||||||||||||||||||||||||||||||||||||||||||||||||
| Net asset value, beginning of period ($) | Net investment income (loss) ($) | Net realized and unrealized gain (loss) ($) | Total from investment operations ($) | Net investment income ($) | Net realized gain on investments ($) | Total distributions ($) | Net asset value, end of period ($) | Total return (%) | Operating expenses (%) | Less: Reimbursement of expenses by Adviser (%) | Net operating expenses (%) | Net investment income (loss) (%) | Net assets (in millions), end of period ($) | Portfolio turnover rate (%) | ||||||||||||||||||||||||||||||||||||||||||||||
RETAIL SHARES |
| |||||||||||||||||||||||||||||||||||||||||||||||||||||||||||
Six Months Ended March 31, |
| |||||||||||||||||||||||||||||||||||||||||||||||||||||||||||
2020 | 32.10 | (0.10 | )1 | (0.71 | ) | (0.81 | ) | 0.00 | (0.99 | ) | (0.99 | ) | 30.30 | (2.80 | )2,4 | 1.06 | 5 | (0.06 | )5 | 1.00 | 5 | (0.62 | )5 | 106.0 | 9.09 | 4 | ||||||||||||||||||||||||||||||||||
Year Ended September 30, |
| |||||||||||||||||||||||||||||||||||||||||||||||||||||||||||
2019 | 31.02 | 0.07 | 1 | 1.01 | 1.08 | 0.00 | 0.00 | 0.00 | 32.10 | 3.48 | 2 | 1.06 | (0.06 | ) | 1.00 | 0.23 | 115.5 | 21.24 | ||||||||||||||||||||||||||||||||||||||||||
2018 | 24.04 | (0.17 | )1 | 7.15 | 6.98 | 0.00 | 0.00 | 0.00 | 31.02 | 29.03 | 2 | 1.09 | (0.08 | ) | 1.01 | (0.61 | ) | 132.2 | 8.81 | |||||||||||||||||||||||||||||||||||||||||
2017 | 19.35 | (0.11 | )1 | 4.80 | 4.69 | 0.00 | 0.00 | 0.00 | 24.04 | 24.24 | 2 | 1.12 | 3 | (0.02 | ) | 1.10 | (0.50 | ) | 87.5 | 13.94 | ||||||||||||||||||||||||||||||||||||||||
2016 | 16.91 | (0.08 | )1 | 2.52 | 2.44 | 0.00 | 0.00 | 0.00 | 19.35 | 14.43 | 2 | 1.26 | (0.04 | ) | 1.22 | (0.43 | ) | 73.5 | 19.30 | |||||||||||||||||||||||||||||||||||||||||
2015 | 16.83 | (0.09 | )1 | 0.17 | 6 | 0.08 | 0.00 | 0.00 | 0.00 | 16.91 | 0.48 | 2 | 1.32 | (0.02 | ) | 1.30 | (0.49 | ) | 71.5 | 14.54 | ||||||||||||||||||||||||||||||||||||||||
2014 | 14.42 | (0.05 | )1 | 2.46 | 2.41 | 0.00 | 0.00 | 0.00 | 16.83 | 16.71 | 2 | 1.37 | (0.07 | ) | 1.30 | (0.29 | ) | 53.2 | 16.84 | |||||||||||||||||||||||||||||||||||||||||
2013 | 11.83 | 0.02 | 1 | 2.57 | 2.59 | 0.00 | 0.00 | 0.00 | 14.42 | 21.89 | 2 | 1.47 | (0.17 | ) | 1.30 | 0.14 | 47.8 | 22.91 | ||||||||||||||||||||||||||||||||||||||||||
2012 | 8.98 | (0.03 | )1 | 2.88 | 2.85 | 0.00 | 0.00 | 0.00 | 11.83 | 31.74 | 2 | 1.55 | (0.25 | ) | 1.30 | (0.30 | ) | 34.8 | 79.07 | |||||||||||||||||||||||||||||||||||||||||
2011 | 9.21 | (0.06 | )1 | (0.17 | ) | (0.23 | ) | 0.00 | 0.00 | 0.00 | 8.98 | (2.50 | )2 | 1.59 | (0.29 | ) | 1.30 | (0.55 | ) | 23.4 | 75.36 | |||||||||||||||||||||||||||||||||||||||
INSTITUTIONAL SHARES |
| |||||||||||||||||||||||||||||||||||||||||||||||||||||||||||
Six Months Ended March 31, |
| |||||||||||||||||||||||||||||||||||||||||||||||||||||||||||
2020 | 32.80 | (0.06 | )1 | (0.73 | ) | (0.79 | ) | 0.00 | (0.99 | ) | (0.99 | ) | 31.02 | (2.68 | )2,4 | 0.79 | 5 | (0.04 | )5 | 0.75 | 5 | (0.38 | )5 | 166.7 | 9.09 | 4 | ||||||||||||||||||||||||||||||||||
Year Ended September 30, |
| |||||||||||||||||||||||||||||||||||||||||||||||||||||||||||
2019 | 31.62 | 0.17 | 1 | 1.01 | 1.18 | 0.00 | 0.00 | 0.00 | 32.80 | 3.73 | 2 | 0.80 | (0.05 | ) | 0.75 | 0.56 | 170.4 | 21.24 | ||||||||||||||||||||||||||||||||||||||||||
2018 | 24.44 | (0.10 | )1 | 7.28 | 7.18 | 0.00 | 0.00 | 0.00 | 31.62 | 29.38 | 2 | 0.82 | (0.06 | ) | 0.76 | (0.36 | ) | 152.2 | 8.81 | |||||||||||||||||||||||||||||||||||||||||
2017 | 19.62 | (0.05 | )1 | 4.87 | 4.82 | 0.00 | 0.00 | 0.00 | 24.44 | 24.57 | 0.84 | 3 | 0.00 | 0.84 | (0.24 | ) | 89.5 | 13.94 | ||||||||||||||||||||||||||||||||||||||||||
2016 | 17.10 | (0.03 | )1 | 2.55 | 2.52 | 0.00 | 0.00 | 0.00 | 19.62 | 14.74 | 2 | 0.98 | (0.01 | ) | 0.97 | (0.19 | ) | 81.9 | 19.30 | |||||||||||||||||||||||||||||||||||||||||
2015 | 17.00 | (0.04 | )1 | 0.16 | 6 | 0.12 | (0.02 | ) | 0.00 | (0.02 | ) | 17.10 | 0.72 | 1.04 | 0.00 | 1.04 | (0.23 | ) | 74.7 | 14.54 | ||||||||||||||||||||||||||||||||||||||||
2014 | 14.53 | (0.01 | )1 | 2.48 | 2.47 | 0.00 | 0.00 | 0.00 | 17.00 | 17.00 | 2 | 1.08 | (0.03 | ) | 1.05 | (0.08 | ) | 56.0 | 16.84 | |||||||||||||||||||||||||||||||||||||||||
2013 | 11.89 | 0.05 | 1 | 2.59 | 2.64 | 0.00 | 0.00 | 0.00 | 14.53 | 22.20 | 2 | 1.18 | (0.13 | ) | 1.05 | 0.36 | 33.8 | 22.91 | ||||||||||||||||||||||||||||||||||||||||||
2012 | 9.00 | (0.01 | )1 | 2.90 | 2.89 | 0.00 | 0.00 | 0.00 | 11.89 | 32.11 | 2 | 1.26 | (0.21 | ) | 1.05 | (0.05 | ) | 18.9 | 79.07 | |||||||||||||||||||||||||||||||||||||||||
2011 | 9.21 | (0.03 | )1 | (0.18 | ) | (0.21 | ) | 0.00 | 0.00 | 0.00 | 9.00 | (2.28 | )2 | 1.31 | (0.26 | ) | 1.05 | (0.30 | ) | 10.2 | 75.36 | |||||||||||||||||||||||||||||||||||||||
R6 SHARES |
| |||||||||||||||||||||||||||||||||||||||||||||||||||||||||||
Six Months Ended March 31, |
| |||||||||||||||||||||||||||||||||||||||||||||||||||||||||||
2020 | 32.81 | (0.06 | )1 | (0.73 | ) | (0.79 | ) | 0.00 | (0.99 | ) | (0.99 | ) | 31.03 | (2.67 | )2,4 | 0.79 | 5 | (0.04 | )5 | 0.75 | 5 | (0.38 | )5 | 21.9 | 9.09 | 4 | ||||||||||||||||||||||||||||||||||
Year Ended September 30, |
| |||||||||||||||||||||||||||||||||||||||||||||||||||||||||||
2019 | 31.63 | 0.17 | 1 | 1.01 | 1.18 | 0.00 | 0.00 | 0.00 | 32.81 | 3.73 | 2 | 0.79 | (0.04 | ) | 0.75 | 0.54 | 22.5 | 21.24 | ||||||||||||||||||||||||||||||||||||||||||
2018 | 24.45 | (0.11 | )1 | 7.29 | 7.18 | 0.00 | 0.00 | 0.00 | 31.63 | 29.37 | 2 | 0.80 | (0.05 | ) | 0.75 | (0.37 | ) | 21.4 | 8.81 | |||||||||||||||||||||||||||||||||||||||||
2017 | 19.63 | (0.06 | )1 | 4.88 | 4.82 | 0.00 | 0.00 | 0.00 | 24.45 | 24.55 | 0.84 | 3 | 0.00 | 0.84 | (0.27 | ) | 4.7 | 13.94 | ||||||||||||||||||||||||||||||||||||||||||
20167 | 17.03 | (0.05 | )1 | 2.65 | 2.60 | 0.00 | 0.00 | 0.00 | 19.63 | 15.27 | 2,4 | 0.85 | 5 | (0.01 | )5 | 0.84 | 5 | (0.37 | )5 | 1.4 | 19.30 | |||||||||||||||||||||||||||||||||||||||
| 1 | Based on average shares outstanding. |
| 2 | The total returns would have been lower had certain expenses not been reduced during the period shown. |
| 3 | Interest expense rounds to less than 0.01%. |
| 4 | Not Annualized. |
| 5 | Annualized. |
| 6 | The amount shown for a share outstanding does not correspond with the aggregate realized and unrealized gain (loss) on investments for the period due to the timing of sales and redemptions of Fund shares in relation to fluctuating market values of investments of the Fund. |
| 7 | For the period January 29, 2016 (initial offering of R6 Shares) to September 30, 2016. |
| 48 | See Notes to Financial Statements. |
| March 31, 2020 | Baron Funds |
FINANCIAL HIGHLIGHTS (Unaudited) (Continued)
BARON DISCOVERY FUND
Selected data for a share outstanding throughout each period:
| Income (loss) from investment operations: | Less distributions to shareholders from: | Ratios to Average Net Assets: | Supplemental Data: | |||||||||||||||||||||||||||||||||||||||||||||||||||||||||
| Net asset value, beginning of period ($) | Net investment income (loss) ($) | Net realized and unrealized gain (loss) on investments ($) | Total from investment operations ($) | Net investment income ($) | Net realized gain on investments ($) | Total distributions ($) | Net asset value, end of period ($) | Total return (%) | Operating expenses (%) | Less: Reimbursement of expenses by Adviser (%) | Net operating expenses (%) | Net investment income (loss) (%) | Net assets (in millions), end of period ($) | Portfolio turnover rate (%) | ||||||||||||||||||||||||||||||||||||||||||||||
RETAIL SHARES |
| |||||||||||||||||||||||||||||||||||||||||||||||||||||||||||
Six Months Ended March 31, |
| |||||||||||||||||||||||||||||||||||||||||||||||||||||||||||
2020 | 19.41 | (0.11 | )1 | (2.20 | ) | (2.31 | ) | 0.00 | (0.03 | ) | (0.03 | ) | 17.07 | (11.94 | )3,6 | 1.35 | 7 | (0.00 | )7,9 | 1.35 | 7 | (1.05 | )7 | 94.2 | 33.99 | 6 | ||||||||||||||||||||||||||||||||||
Year Ended September 30, |
| |||||||||||||||||||||||||||||||||||||||||||||||||||||||||||
2019 | 23.77 | (0.22 | )1 | (2.64 | ) | (2.86 | ) | 0.00 | (1.50 | ) | (1.50 | ) | 19.41 | (11.93 | )3 | 1.36 | (0.01 | ) | 1.35 | (1.10 | ) | 122.7 | 55.94 | |||||||||||||||||||||||||||||||||||||
2018 | 17.56 | 0.09 | 1 | 6.13 | 6.22 | (0.01 | ) | 0.00 | (0.01 | ) | 23.77 | 35.41 | 3 | 1.40 | 8 | (0.05 | ) | 1.35 | 0.45 | 108.2 | 72.25 | |||||||||||||||||||||||||||||||||||||||
2017 | 13.40 | (0.17 | )1 | 4.33 | 4.16 | 0.00 | 0.00 | 0.00 | 17.56 | 31.04 | 3 | 1.47 | (0.12 | ) | 1.35 | (1.11 | ) | 131.2 | 40.97 | |||||||||||||||||||||||||||||||||||||||||
2016 | 11.13 | 0.16 | 1 | 2.38 | 2.54 | 0.00 | (0.27 | ) | (0.27 | ) | 13.40 | 23.24 | 3 | 1.88 | (0.53 | ) | 1.35 | 1.38 | 18.6 | 90.74 | ||||||||||||||||||||||||||||||||||||||||
2015 | 11.68 | (0.13 | )1 | (0.42 | ) | (0.55 | ) | 0.00 | 0.00 | 0.00 | 11.13 | (4.71 | )3,4 | 1.57 | (0.22 | ) | 1.35 | (0.97 | ) | 19.9 | 114.82 | |||||||||||||||||||||||||||||||||||||||
2014 | 10.00 | (0.10 | )1 | 1.78 | 2 | 1.68 | 0.00 | 0.00 | 0.00 | 11.68 | 16.80 | 3 | 2.16 | (0.81 | ) | 1.35 | (0.85 | ) | 16.6 | 109.40 | ||||||||||||||||||||||||||||||||||||||||
INSTITUTIONAL SHARES |
| |||||||||||||||||||||||||||||||||||||||||||||||||||||||||||
Six Months Ended March 31, |
| |||||||||||||||||||||||||||||||||||||||||||||||||||||||||||
2020 | 19.68 | (0.08 | )1 | (2.24 | ) | (2.32 | ) | 0.00 | (0.03 | ) | (0.03 | ) | 17.33 | (11.82 | )6 | 1.09 | 7 | 0.00 | 1.09 | 7 | (0.78 | )7 | 378.9 | 33.99 | 6 | |||||||||||||||||||||||||||||||||||
Year Ended September 30, |
| |||||||||||||||||||||||||||||||||||||||||||||||||||||||||||
2019 | 24.03 | (0.18 | )1 | (2.67 | ) | (2.85 | ) | 0.00 | (1.50 | ) | (1.50 | ) | 19.68 | (11.75 | ) | 1.10 | 0.00 | 1.10 | (0.88 | ) | 409.4 | 55.94 | ||||||||||||||||||||||||||||||||||||||
2018 | 17.74 | 0.01 | 1 | 6.32 | 6.33 | (0.04 | ) | 0.00 | (0.04 | ) | 24.03 | 35.74 | 3 | 1.12 | 8 | (0.02 | ) | 1.10 | 0.05 | 280.2 | 72.25 | |||||||||||||||||||||||||||||||||||||||
2017 | 13.50 | (0.13 | )1 | 4.37 | 4.24 | 0.00 | 0.00 | 0.00 | 17.74 | 31.41 | 3 | 1.23 | (0.13 | ) | 1.10 | (0.85 | ) | 113.6 | 40.97 | |||||||||||||||||||||||||||||||||||||||||
2016 | 11.19 | 0.12 | 1 | 2.46 | 2.58 | 0.00 | (0.27 | ) | (0.27 | ) | 13.50 | 23.47 | 3 | 1.49 | (0.39 | ) | 1.10 | 1.06 | 22.8 | 90.74 | ||||||||||||||||||||||||||||||||||||||||
2015 | 11.71 | (0.10 | )1 | (0.42 | ) | (0.52 | ) | 0.00 | 0.00 | 0.00 | 11.19 | (4.44 | )3,4 | 1.25 | (0.15 | ) | 1.10 | (0.72 | ) | 53.9 | 114.82 | |||||||||||||||||||||||||||||||||||||||
2014 | 10.00 | (0.08 | )1 | 1.79 | 2 | 1.71 | 0.00 | 0.00 | 0.00 | 11.71 | 17.10 | 3 | 1.91 | (0.81 | ) | 1.10 | (0.64 | ) | 48.7 | 109.40 | ||||||||||||||||||||||||||||||||||||||||
R6 SHARES |
| |||||||||||||||||||||||||||||||||||||||||||||||||||||||||||
Six Months Ended March 31, |
| |||||||||||||||||||||||||||||||||||||||||||||||||||||||||||
2020 | 19.68 | (0.08 | )1 | (2.24 | ) | (2.32 | ) | 0.00 | (0.03 | ) | (0.03 | ) | 17.33 | (11.82 | )6 | 1.09 | 7 | 0.00 | 1.09 | 7 | (0.78 | )7 | 6.8 | 33.99 | 6 | |||||||||||||||||||||||||||||||||||
Year Ended September 30, |
| |||||||||||||||||||||||||||||||||||||||||||||||||||||||||||
2019 | 24.03 | (0.18 | )1 | (2.67 | ) | (2.85 | ) | 0.00 | (1.50 | ) | (1.50 | ) | 19.68 | (11.75 | ) | 1.09 | 0.00 | 1.09 | (0.88 | ) | 6.8 | 55.94 | ||||||||||||||||||||||||||||||||||||||
2018 | 17.74 | 0.03 | 1 | 6.30 | 6.33 | (0.04 | ) | 0.00 | (0.04 | ) | 24.03 | 35.75 | 3 | 1.10 | 8 | (0.01 | ) | 1.09 | 0.15 | 5.6 | 72.25 | |||||||||||||||||||||||||||||||||||||||
2017 | 13.50 | (0.12 | )1 | 4.36 | 4.24 | 0.00 | 0.00 | 0.00 | 17.74 | 31.41 | 3 | 1.22 | (0.13 | ) | 1.09 | (0.79 | ) | 3.2 | 40.97 | |||||||||||||||||||||||||||||||||||||||||
20165 | 12.89 | (0.01 | )1 | 0.62 | 0.61 | 0.00 | 0.00 | 0.00 | 13.50 | 4.73 | 3,6 | 1.48 | 7 | (0.39 | )7 | 1.09 | 7 | (0.66 | )7 | 2.0 | 90.74 | |||||||||||||||||||||||||||||||||||||||
| 1 | Based on average shares outstanding. |
| 2 | The amount shown for a share outstanding does not correspond with the aggregate realized and unrealized gain (loss) on investments for the period due to the timing of sales and redemptions of Fund shares in relation to fluctuating market values of investments of the Fund. |
| 3 | The total returns would have been lower had certain expenses not been reduced during the period shown. |
| 4 | The Adviser made a voluntary payment to the Fund in the amount of $1,000 to compensate the Fund for a loss incurred due to a trade processing error. The impact of this payment increased the Fund’s total return by less than 0.01%. |
| 5 | For the period August 31, 2016 (initial offering of R6 Shares) to September 30, 2016. |
| 6 | Not Annualized. |
| 7 | Annualized. |
| 8 | Interest expense rounds to less than 0.01%. |
| 9 | Less than 0.01%. |
| See Notes to Financial Statements. | 49 |
| Baron Funds | March 31, 2020 |
FINANCIAL HIGHLIGHTS (Unaudited) (Continued)
BARON DURABLE ADVANTAGE FUND
Selected data for a share outstanding throughout each period:
| Income (loss) from investment operations: | Less distributions to shareholders from: | Ratios to Average Net Assets: | Supplemental Data: | |||||||||||||||||||||||||||||||||||||||||||||||||||||||||
| Net asset value, beginning of period ($) | Net investment income ($) | Net realized and unrealized gain (loss) on investments ($) | Total from investment operations ($) | Net investment income ($) | Net realized gain on investments ($) | Total distributions ($) | Net asset value, end of period ($) | Total return (%) | Operating expenses (%) | Less: Reimbursement of expenses by Adviser (%) | Net operating expenses (%) | Net investment income (%) | Net assets (in millions), end of period ($) | Portfolio turnover rate (%) | ||||||||||||||||||||||||||||||||||||||||||||||
RETAIL SHARES |
| |||||||||||||||||||||||||||||||||||||||||||||||||||||||||||
Six Months Ended March 31, |
| |||||||||||||||||||||||||||||||||||||||||||||||||||||||||||
2020 | 11.77 | 0.01 | 1 | (0.88 | ) | (0.87 | ) | 0.00 | 0.00 | 0.00 | 10.90 | (7.39 | )2,3 | 3.57 | 4 | (2.62 | )4 | 0.95 | 4 | 0.18 | 4 | 3.0 | 17.59 | 3 | ||||||||||||||||||||||||||||||||||||
Year Ended September 30, |
| |||||||||||||||||||||||||||||||||||||||||||||||||||||||||||
2019 | 10.74 | 0.03 | 1 | 1.03 | 1.06 | (0.03 | ) | 0.00 | (0.03 | ) | 11.77 | 9.97 | 2 | 6.22 | (5.27 | ) | 0.95 | 0.25 | 1.9 | 13.23 | ||||||||||||||||||||||||||||||||||||||||
Period Ended September 30, |
| |||||||||||||||||||||||||||||||||||||||||||||||||||||||||||
20185 | 10.00 | 0.01 | 1 | 0.73 | 0.74 | 0.00 | 0.00 | 0.00 | 10.74 | 7.40 | 2,3 | 7.45 | 4 | (6.50 | )4 | 0.95 | 4 | 0.19 | 4 | 0.6 | 5.85 | 3 | ||||||||||||||||||||||||||||||||||||||
INSTITUTIONAL SHARES |
| |||||||||||||||||||||||||||||||||||||||||||||||||||||||||||
Six Months Ended March 31, |
| |||||||||||||||||||||||||||||||||||||||||||||||||||||||||||
2020 | 11.82 | 0.02 | 1 | (0.88 | ) | (0.86 | ) | 0.00 | 0.00 | 0.00 | 10.96 | (7.28 | )2,3 | 3.24 | 4 | (2.54 | )4 | 0.70 | 4 | 0.37 | 4 | 3.4 | 17.59 | 3 | ||||||||||||||||||||||||||||||||||||
Year Ended September 30, |
| |||||||||||||||||||||||||||||||||||||||||||||||||||||||||||
2019 | 10.76 | 0.06 | 1 | 1.03 | 1.09 | (0.03 | ) | 0.00 | (0.03 | ) | 11.82 | 10.23 | 2 | 4.91 | (4.21 | ) | 0.70 | 0.52 | 4.7 | 13.23 | ||||||||||||||||||||||||||||||||||||||||
Period Ended September 30, |
| |||||||||||||||||||||||||||||||||||||||||||||||||||||||||||
20185 | 10.00 | 0.04 | 1 | 0.72 | 0.76 | 0.00 | 0.00 | 0.00 | 10.76 | 7.60 | 2,3 | 5.71 | 4 | (5.01 | )4 | 0.70 | 4 | 0.46 | 4 | 3.0 | 5.85 | 3 | ||||||||||||||||||||||||||||||||||||||
R6 SHARES |
| |||||||||||||||||||||||||||||||||||||||||||||||||||||||||||
Six Months Ended March 31, |
| |||||||||||||||||||||||||||||||||||||||||||||||||||||||||||
2020 | 11.82 | 0.03 | 1 | (0.89 | ) | (0.86 | ) | 0.00 | 0.00 | 0.00 | 10.96 | (7.28 | )2,3 | 2.70 | 4 | (2.00 | )4 | 0.70 | 4 | 0.57 | 4 | 1.8 | 17.59 | 3 | ||||||||||||||||||||||||||||||||||||
Year Ended September 30, |
| |||||||||||||||||||||||||||||||||||||||||||||||||||||||||||
2019 | 10.75 | 0.06 | 1 | 1.04 | 1.10 | (0.03 | ) | 0.00 | (0.03 | ) | 11.82 | 10.34 | 2 | 4.65 | (3.95 | ) | 0.70 | 0.53 | 0.5 | 13.23 | ||||||||||||||||||||||||||||||||||||||||
Period Ended September 30, |
| |||||||||||||||||||||||||||||||||||||||||||||||||||||||||||
20185 | 10.00 | 0.04 | 1 | 0.71 | 0.75 | 0.00 | 0.00 | 0.00 | 10.75 | 7.50 | 2,3 | 5.24 | 4 | (4.54 | )4 | 0.70 | 4 | 0.46 | 4 | 0.4 | 5.85 | 3 | ||||||||||||||||||||||||||||||||||||||
| 1 | Based on average shares outstanding. |
| 2 | The total returns would have been lower had certain expenses not been reduced during the period shown. |
| 3 | Not Annualized. |
| 4 | Annualized. |
| 5 | For the period January 2, 2018 (commencement of operations) to September 30, 2018. |
| 50 | See Notes to Financial Statements. |
| March 31, 2020 | Baron Funds |
As a shareholder of the Funds, you may incur two types of costs: ongoing expenses and transaction costs. Ongoing expenses include advisory fees, distribution and service(12b-1) fees and other Fund expenses. Due to the payment of Rule12b-1 fees, long-term shareholders may indirectly pay more than the maximum permittedfront-end sales charge. The information on this page is intended to help you understand your ongoing costs of investing in the Funds and to compare these costs with the ongoing costs of investing in other mutual funds.
The information in the following table is based on an investment of $1,000 invested on October 1, 2019 and held for the six months ended March 31, 2020.
ACTUAL EXPENSES
The table below titled “Based on Actual Total Return” provides information about actual account values and actual expenses. You may use the information provided in this table, together with the amount you invested, to estimate the expenses that you paid over the period. To estimate the expenses you paid on your account, divide your ending account value by $1,000 (for example, an $8,600 ending account value divided by $1,000 = 8.6), then multiply the result by the number under the heading titled “Expenses Paid During the Period”.
BASED ON ACTUAL TOTAL RETURN FOR THE SIX MONTHS ENDED MARCH 31, 20201
Actual Total Return | Beginning Account Value October 1, 2019 | Ending Account Value March 31, 2020 | Annualized Expense Ratio | Expenses Paid During the Period2 | ||||||||||||||||
Baron Asset Fund — Retail Shares | (11.12 | )% | $ | 1,000.00 | $ | 888.80 | 1.31 | % | $ | 6.19 | ||||||||||
Baron Asset Fund — Institutional Shares | (11.01 | )% | $ | 1,000.00 | $ | 889.90 | 1.05 | % | $ | 4.96 | ||||||||||
Baron Asset Fund — R6 Shares | (11.01 | )% | $ | 1,000.00 | $ | 889.90 | 1.05 | % | $ | 4.96 | ||||||||||
Baron Growth Fund — Retail Shares | (15.69 | )% | $ | 1,000.00 | $ | 843.10 | 1.30 | % | $ | 5.99 | ||||||||||
Baron Growth Fund — Institutional Shares | (15.58 | )% | $ | 1,000.00 | $ | 844.20 | 1.04 | % | $ | 4.79 | ||||||||||
Baron Growth Fund — R6 Shares | (15.58 | )% | $ | 1,000.00 | $ | 844.20 | 1.04 | % | $ | 4.79 | ||||||||||
Baron Small Cap Fund — Retail Shares | (16.18 | )% | $ | 1,000.00 | $ | 838.20 | 1.31 | % | $ | 6.02 | ||||||||||
Baron Small Cap Fund — Institutional Shares | (16.08 | )% | $ | 1,000.00 | $ | 839.20 | 1.05 | % | $ | 4.83 | ||||||||||
Baron Small Cap Fund — R6 Shares | (16.09 | )% | $ | 1,000.00 | $ | 839.10 | 1.05 | % | $ | 4.83 | ||||||||||
Baron Opportunity Fund — Retail Shares | 6.47 | % | $ | 1,000.00 | $ | 1,064.70 | 1.36 | % | $ | 7.02 | ||||||||||
Baron Opportunity Fund — Institutional Shares | 6.67 | % | $ | 1,000.00 | $ | 1,066.70 | 1.10 | % | $ | 5.68 | ||||||||||
Baron Opportunity Fund — R6 Shares | 6.66 | % | $ | 1,000.00 | $ | 1,066.60 | 1.09 | % | $ | 5.63 | ||||||||||
Baron Fifth Avenue Growth Fund — Retail Shares | (2.80 | )% | $ | 1,000.00 | $ | 972.00 | 3 | 1.00 | %4 | $ | 4.93 | |||||||||
Baron Fifth Avenue Growth Fund — Institutional Shares | (2.68 | )% | $ | 1,000.00 | $ | 973.20 | 3 | 0.75 | %4 | $ | 3.70 | |||||||||
Baron Fifth Avenue Growth Fund — R6 Shares | (2.67 | )% | $ | 1,000.00 | $ | 973.30 | 3 | 0.75 | %4 | $ | 3.70 | |||||||||
Baron Discovery Fund — Retail Shares | (11.94 | )% | $ | 1,000.00 | $ | 880.60 | 3 | 1.35 | %4 | $ | 6.35 | |||||||||
Baron Discovery Fund — Institutional Shares | (11.82 | )% | $ | 1,000.00 | $ | 881.80 | 1.09 | % | $ | 5.13 | ||||||||||
Baron Discovery Fund — R6 Shares | (11.82 | )% | $ | 1,000.00 | $ | 881.80 | 1.09 | % | $ | 5.13 | ||||||||||
Baron Durable Advantage Fund — Retail Shares | (7.39 | )% | $ | 1,000.00 | $ | 926.10 | 3 | 0.95 | %4 | $ | 4.57 | |||||||||
Baron Durable Advantage Fund — Institutional Shares | (7.28 | )% | $ | 1,000.00 | $ | 927.20 | 3 | 0.70 | %4 | $ | 3.37 | |||||||||
Baron Durable Advantage Fund — R6 Shares | (7.28 | )% | $ | 1,000.00 | $ | 927.20 | 3 | 0.70 | %4 | $ | 3.37 | |||||||||
| 1 | Assumes reinvestment of all dividends and capital gain distributions, if any. |
| 2 | Expenses are equal to each share class’ respective annualized expense ratio multiplied by the average account value over the period, multiplied by the number of days in the most recent fiscal half-year, then divided by 366. |
| 3 | Ending account value assumes the return earned after waiver and would have been lower if a portion of the expenses had not been waived. |
| 4 | Annualized expense ratios are adjusted to reflect fee waiver. |
51
| Baron Funds | March 31, 2020 |
HYPOTHETICAL EXAMPLE FOR COMPARISON PURPOSES
The table below titled “Based on Hypothetical Total Return” provides information about hypothetical account values and hypothetical expenses based on the actual expense ratio and an assumed rate of return of 5% per year before expenses, which is not the Funds’ actual return. The hypothetical account values and expenses may not be used to estimate the actual ending account values and expenses you paid for the period. You may use the information provided in this table to compare the ongoing costs of investing in the Funds and other funds. To do so, compare the 5% hypothetical example relating to the Funds with the 5% hypothetical examples that appear in the shareholder reports of other funds.
Please note that expenses shown in the table below are meant to highlight your ongoing costs and do not reflect any transactional costs, such as redemption fees, if any. Therefore, the table is useful in comparing ongoing costs only and will not help you determine your relative total costs of owning different mutual funds. In addition, if these transactional costs were included, your costs would have been higher.
BASED ON HYPOTHETICAL TOTAL RETURN FOR THE SIX MONTHS ENDED MARCH 31, 2020
Hypothetical Annualized Total Return | Beginning Account Value October 1, 2019 | Ending Account Value March 31, 2020 | Annualized Expense Ratio | Expenses Paid the Period2 | ||||||||||||||||
Baron Asset Fund — Retail Shares | 5.00 | % | $ | 1,000.00 | $ | 1,018.45 | 1.31 | % | $ | 6.61 | ||||||||||
Baron Asset Fund — Institutional Shares | 5.00 | % | $ | 1,000.00 | $ | 1,019.75 | 1.05 | % | $ | 5.30 | ||||||||||
Baron Asset Fund — R6 Shares | 5.00 | % | $ | 1,000.00 | $ | 1,019.75 | 1.05 | % | $ | 5.30 | ||||||||||
Baron Growth Fund — Retail Shares | 5.00 | % | $ | 1,000.00 | $ | 1,018.50 | 1.30 | % | $ | 6.56 | ||||||||||
Baron Growth Fund — Institutional Shares | 5.00 | % | $ | 1,000.00 | $ | 1,019.80 | 1.04 | % | $ | 5.25 | ||||||||||
Baron Growth Fund — R6 Shares | 5.00 | % | $ | 1,000.00 | $ | 1,019.80 | 1.04 | % | $ | 5.25 | ||||||||||
Baron Small Cap Fund — Retail Shares | 5.00 | % | $ | 1,000.00 | $ | 1,018.45 | 1.31 | % | $ | 6.61 | ||||||||||
Baron Small Cap Fund — Institutional Shares | 5.00 | % | $ | 1,000.00 | $ | 1,019.75 | 1.05 | % | $ | 5.30 | ||||||||||
Baron Small Cap Fund — R6 Shares | 5.00 | % | $ | 1,000.00 | $ | 1,019.75 | 1.05 | % | $ | 5.30 | ||||||||||
Baron Opportunity Fund — Retail Shares | 5.00 | % | $ | 1,000.00 | $ | 1,018.20 | 1.36 | % | $ | 6.86 | ||||||||||
Baron Opportunity Fund — Institutional Shares | 5.00 | % | $ | 1,000.00 | $ | 1,019.50 | 1.10 | % | $ | 5.55 | ||||||||||
Baron Opportunity Fund — R6 Shares | 5.00 | % | $ | 1,000.00 | $ | 1,019.55 | 1.09 | % | $ | 5.50 | ||||||||||
Baron Fifth Avenue Growth Fund — Retail Shares | 5.00 | % | $ | 1,000.00 | $ | 1,020.00 | 3 | 1.00 | %4 | $ | 5.05 | |||||||||
Baron Fifth Avenue Growth Fund — Institutional Shares | 5.00 | % | $ | 1,000.00 | $ | 1,021.25 | 3 | 0.75 | %4 | $ | 3.79 | |||||||||
Baron Fifth Avenue Growth Fund — R6 Shares | 5.00 | % | $ | 1,000.00 | $ | 1,021.25 | 3 | 0.75 | %4 | $ | 3.79 | |||||||||
Baron Discovery Fund — Retail Shares | 5.00 | % | $ | 1,000.00 | $ | 1,018.25 | 3 | 1.35 | %4 | $ | 6.81 | |||||||||
Baron Discovery Fund — Institutional Shares | 5.00 | % | $ | 1,000.00 | $ | 1,019.55 | 1.09 | % | $ | 5.50 | ||||||||||
Baron Discovery Fund — R6 Shares | 5.00 | % | $ | 1,000.00 | $ | 1,019.55 | 1.09 | % | $ | 5.50 | ||||||||||
Baron Durable Advantage Fund — Retail Shares | 5.00 | % | $ | 1,000.00 | $ | 1,020.25 | 3 | 0.95 | %4 | $ | 4.80 | |||||||||
Baron Durable Advantage Fund — Institutional Shares | 5.00 | % | $ | 1,000.00 | $ | 1,021.50 | 3 | 0.70 | %4 | $ | 3.54 | |||||||||
Baron Durable Advantage Fund — R6 Shares | 5.00 | % | $ | 1,000.00 | $ | 1,021.50 | 3 | 0.70 | %4 | $ | 3.54 | |||||||||
| 1 | Assumes reinvestment of all dividends and capital gain distributions, if any. |
| 2 | Expenses are equal to each share class’ respective annualized expense ratio multiplied by the average account value over the period, multiplied by the number of days in the most recent fiscal half-year, then divided by 366. |
| 3 | Ending account value assumes the return earned after waiver and would have been lower if a portion of the expenses had not been waived. |
| 4 | Annualized expense ratios are adjusted to reflect fee waiver. |
52
Privacy Notice
The Funds collect nonpublic personal information about you from the following sources:
| ∎ | Information we receive from you on applications or other forms; |
| ∎ | Information about your transactions with us, our Adviser or others; and |
| ∎ | Information we receive from third parties, such as credit reporting agencies. |
“Nonpublic personal information” is private information about you that we obtain in connection with providing a financial product or service to you.
We may share your name and address with other Baron Funds and the Adviser and its affiliates for the purpose of sending you information about our products that we believe may be of interest to you and informing you of our upcoming Baron Investment Conference and for sending required information.
We do not disclose any nonpublic personal information about our customers to anyone, except as permitted or required by law. Examples of permitted disclosures under the law include sharing with companies that work for us to provide you services, such as the Transfer Agent or mailing house. All such companies that act on our behalf are contractually obligated to keep the information that we provide to them confidential and to use the information only to provide the services that we have asked them to perform for you and us.
We restrict access to nonpublic information about you to those employees who need to know that information to provide products or services to you. We maintain physical, electronic and procedural safeguards to guard your nonpublic personal information.
This privacy notice is also available at all times on the Baron Funds® website, www.BaronFunds.com or by calling 1-800-99BARON.
Go Paperless!
It’s fast, simple and a smart way to help the environment.
Enjoy the speed and convenience of receiving Fund documents electronically.
For more information, and to enroll today, go to www.baronfunds.com/edelivery.
767 Fifth Avenue, 49th Fl.
New York, NY 10153
1.800.99.BARON
212-583-2000
www.BaronFunds.com
MARCH 31
| Item 2. | Code of Ethics. |
Not applicable.
| Item 3. | Audit Committee Financial Expert. |
Not applicable.
| Item 4. | Principal Accountant Fees and Services. |
Not applicable.
| Item 5. | Audit Committee of Listed Registrants. |
Not applicable.
| Item 6. | Schedule of Investments. |
Included herein under Item 1.
| Item 7. | Disclosure of Proxy Voting Policies and Procedures forClosed-End Management Investment Companies. |
Not applicable.
| Item 8. | Portfolio Managers ofClosed-End Management Investment Companies. |
Not applicable.
| Item 9. | Purchases of Equity Securities byClosed-End Management Investment Company and Affiliated Purchasers. |
Not applicable.
| Item 10. | Submission of Matters to a Vote of Security Holders. |
Not applicable.
| Item 11. | Controls and Procedures. |
(a) The Registrant’s principal executive officer and principal financial officer have concluded that the Registrant’s disclosure controls and procedures (as defined in Rule30a-3(c) under the Investment Company Act of 1940 (the “1940 Act”)) are effective based on their evaluation of these controls and procedures as of a date within 90 days of the filing date of this report.
(b) There were no changes in the Registrant’s internal control over financial reporting (as defined in Rule30a-3(d) under the 1940 Act) that occurred during the period covered by this report that have materially affected, or are reasonably likely to materially affect, the Registrant’s internal control over financial reporting.
| Item 12. | Disclosure of Securities Lending Activities forClosed-End Management Investment Companies. |
Not applicable.
| Item 13. | Exhibits. |
(a)(1) Not applicable.
SIGNATURES
Pursuant to the requirements of the Securities Exchange Act of 1934 and the Investment Company Act of 1940, the registrant has duly caused this report to be signed on its behalf by the undersigned, thereunto duly authorized.
| BARON INVESTMENT FUNDS TRUST | ||
| By: | /s/ Ronald Baron | |
| Ronald Baron | ||
| Chief Executive Officer | ||
| Date: May 28, 2020 | ||
Pursuant to the requirements of the Securities Exchange Act of 1934 and the Investment Company Act of 1940, this report has been signed below by the following persons on behalf of the registrant and in the capacities and on the dates indicated.
| By: | /s/ Ronald Baron | |
Ronald Baron | ||
Chief Executive Officer | ||
| Date: May 28, 2020 | ||
| By: | /s/ Peggy Wong | |
Peggy Wong | ||
Treasurer and Chief Financial Officer | ||
| Date: May 28, 2020 | ||