Exhibit 99.1
GOVERNMENT OF ALBERTA
Annual Report
Government of Alberta
2019-2020
| ● | Consolidated Financial Statements |

This is the report to Albertans on Budget 2019: A plan for jobs and the economy.
It is a permanent public record of the revenue, expense and results achieved by the Government of Alberta for the 2019 –20 fiscal year.
The Government of Alberta 2019 –20 Annual Report consists of three parts:
| | · | | Budget 2019 Key Results, which provide a description and variance analysis of government’s revenue, spending, assets and liabilities. |
| | · | | Consolidated Financial Statements, which provide an overall accounting of the government’s revenue and spending, and assets and liabilities. |
| | · | | Measuring Up, which reports on the progress that has been made towards achieving the government’s goals. |
Annual reports for each ministry have also been published, providing additional detailed information on performance and financial results.
Copyright © 2020
Government of Alberta 2019 –20 Annual Report
ISBN 978-1-4601-4812-9 (PDF)
ISSN 2291-6431 (online)
www.alberta.ca
Preface
The Public Accounts of Alberta are prepared in accordance with the Financial Administration Act and the Fiscal Planning and Transparency Act. The Public Accounts consist of the Annual Report of the Government of Alberta and the annual reports of each of the 20 ministries.
This Annual Report of the Government of Alberta contains Budget 2019 Key Results, the audited
Consolidated Financial Statements and Measuring Up, which compares actual performance results to desired results set out in the government’s strategic plan.
The annual reports of ministries are released concurrently with the Annual Report of the Government of Alberta. The ministry annual reports contain the financial information of the ministries and a comparison of actual performance results to desired results set out in the ministries’ business plans. Each ministry annual report also includes:
| | · | | Financial statements of entities making up the ministry which includes regulated funds, provincial agencies and Crown-controlled corporations for which the minister is responsible; |
| | · | | Other financial information as required by the Financial Administration Act and the Fiscal Planning and Transparency Act, as separate reports, to the extent that the ministry has anything to report; |
| | · | | Financial information relating to accountable organizations and trust funds. |
| | |
| Government of Alberta | Annual Report 2019 – 2020 | | 1 |
Table of Contents
| | | | | | | | |
| | |
Preface | | | 1 | | | |
| | |
Table of Contents | | | 2 | | | |
| | |
Budget 2019 Key Results | | | 5 | | | |
| | |
Financial Highlights | | | 7 | | | |
| | |
Fiscal Summary | | | 7 | | | |
| | |
Revenue Highlights | | | 8 | | | |
| | |
Expense Highlights | | | 9 | | | |
| | |
Statement of Financial Position | | | 10 | | | |
| | |
Financial Indicators and Risks | | | 11 | | | |
| | |
Historical Fiscal Summary 2008-09 to 2019-20 | | | 12 | | | |
| | |
Consolidated Financial Statements of the Province of Alberta | | | 13 | | | |
| | |
Table of Contents | | | 15 | | | |
| | |
Management’s Responsibility for the Consolidated Financial Statements | | | 17 | | | |
| | |
Independent Auditor’s Report | | | 18 | | | |
| | |
Consolidated Statement of Operations | | | 21 | | | |
| | |
Consolidated Statement of Financial Position | | | 22 | | | |
| | |
Consolidated Statement of Change in Net Debt | | | 23 | | | |
| | |
Consolidated Statement of Cash Flows | | | 24 | | | |
| | |
Notes to the Consolidated Financial Statements | | | 25 | | | |
1 | | Summary of Significant Accounting Policies and Reporting Practices | | | 25 | | | |
2 | | Valuation of Financial Assets and Liabilities | | | 33 | | | |
3 | | Financial Risk Management and Derivatives | | | 34 | | | |
4 | | Contractual Rights | | | 37 | | | |
5 | | Contingent Assets | | | 37 | | | |
6 | | Contractual Obligations and Commitments | | | 38 | | | |
7 | | Contingent Liabilities | | | 39 | | | |
8 | | Trust and Other Funds Under Administration | | | 41 | | | |
9 | | Subsequent Event | | | 42 | | | |
10 | | Comparative Figures | | | 42 | | | |
| | |
| | |
| 2 | | Government of Alberta | Annual Report 2019 – 2020 |
Table of Contents
| | | | | | | | |
Schedules to the Consolidated Financial Statements | | | 43 | | | |
1 | | Revenues | | | 43 | | | |
2 | | Revenues by Source by Ministry | | | 44 | | | |
3 | | Expenses by Object by Ministry | | | 45 | | | |
4 | | Cash and Cash Equivalents | | | 46 | | | |
5 | | Accounts Receivable | | | 46 | | | |
6 | | Portfolio Investments | | | 47 | | | |
7 | | Endowment Funds | | | 48 | | | |
8 | | Equity in Government Business Enterprises | | | 49 | | | |
9 | | Loans and Advances | | | 56 | | | |
10 | | Accounts Payable and Other Accrued Liabilities | | | 57 | | | |
11 | | Debt | | | 57 | | | |
12 | | Pension Plans and Other Defined Benefit Plans | | | 62 | | | |
13 | | Deferred Contributions | | | 68 | | | |
14 | | Tangible Capital Assets | | | 69 | | | |
15 | | Adjustments to Net Assets | | | 70 | | | |
16 | | Over-expenditure of Spending Authorities | | | 71 | | | |
17 | | Listing of Organizations | | | 72 | | | |
| | |
Glossary (Unaudited) | | | 77 | | | |
| | |
Measuring Up | | | 84 | | | |
| | |
Management’s Responsibility for Reporting | | | 84 | | | |
| | |
Executive Overview | | | 85 | | | |
| | |
Measuring Up 2020 Reader’s Guide | | | 87 | | | |
| | |
Priority One: Getting Alberta back to work | | | 89 | | | |
| | |
Priority Two: Making life better for Albertans | | | 105 | | | |
| | |
Priority Three: Standing up for Alberta | | | 120 | | | |
| | |
Performance Indicators – Sources and Notes | | | 127 | | | |
| | |
| Government of Alberta | Annual Report 2019 – 2020 | | 3 |
| | |
| | |
| 4 | | Government of Alberta | Annual Report 2019 – 2020 |
Budget 2019 Key Results
| | |
| Government of Alberta | Annual Report 2019 – 2020 | | 5 |
| | | | | | |
Table of Contents | | | | | | |
| | |
| Budget 2019 Key results | | | | | | |
| | |
Financial Highlights | | | 7 | | | |
| | |
Fiscal Summary | | | 7 | | | |
| | |
Revenue Highlights | | | 8 | | | |
| | |
Expense Highlights | | | 9 | | | |
| | |
Statement of Financial Position | | | 10 | | | |
| | |
Financial Indicators and Risks | | | 11 | | | |
| | |
Historical Fiscal Summary, 2008-09 to 2019-20 | | | 12 | | | |
| | |
| | |
| 6 | | Government of Alberta | Annual Report 2019 – 2020 |
Financial Highlights
A budget was not passed prior to Alberta’s general election, held April 16, 2020. Special warrants were used to continue operations. Following the election, a blue ribbon panel - the MacKinnon Panel - was commissioned to review the government’s finances, delaying Budget 2019 until October. An updated 2019-20 forecast was included in Budget 2020, which was tabled in February, 2020. On March 11, 2020 the World Health Organization declared a global pandemic. COVID-19 has significantly impacted Alberta and the 2019-20 results.
The deficit in 2019-20 was $12.2 billion. This was $5.4 billion higher than the 2018-19 deficit, and $3.4 billion more than estimated in Budget 2019.
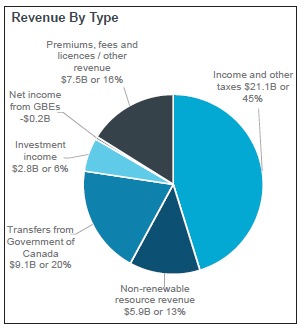
Total Revenue was $46.2 billion in 2019-20, a decrease of $3.3 billion from 2018-19, and down $3.7 billion from budget.
Change from 2018-19. Decreases of $2.8 billion from government business enterprise net income (GBEs) and $2.6 billion in taxes and other revenue, were partly offset by increases of $1.1 billion in federal government transfers, $0.5 billion in resource revenue and $0.5 billion in investment income.
Change from Budget. Decreases of $2.6 billion from GBEs, $0.8 billion in taxes, $0.6 billion in resource revenue and $0.1 billion in federal transfers were partly offset by $0.4 billion in increased investment income and other revenue.
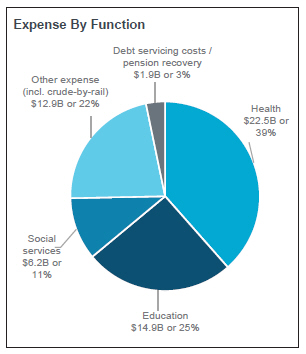
Total Expense was $58.4 billion, up $2.1 billion from 2018-19, but down $0.3 billion from budget.
Change from 2018-19. Increases of $0.6 billion in health expense, $0.4 billion in social services, $0.8 billion in crude-by-rail, and $0.4 billion in debt servicing costs and other expense, were partly offset by a $0.1 billion increase in pension recoveries.
Change from Budget. Increases of $0.3 billion in health, $0.3 billion in education, were partly offset by a decrease of $0.1 billion in social services, $0.6 billion in crude-by-rail and $0.2 billion other expense.
Net Financial Debt. At March 31, 2020, net financial debt was $40.1 billion, an increase of nearly $13 billion from March 31, 2019.
| | | | | | | | | | | | | | | | | | | | |
| Fiscal Summary | | | | | | | | | | |
| (millions of dollars) | | | | | | | | Change from |
| | | | | | | | | | | | | | | | |
| | | 2019-20 | | 2018-19 | | | | 2018-19 |
| | | | | | | | | | | | |
| | | Budget | | Actual | | Actual | | Budget | | Actual |
| |
Revenue | | | | | | | | | | | | | | | | | | | | |
| | | | | |
Income and other taxes | | | 21,933 | | | | 21,098 | | | | 23,578 | | | | (835 | ) | | | (2,480 | ) |
Non-renewable resource revenue | | | 6,527 | | | | 5,937 | | | | 5,429 | | | | (590 | ) | | | 508 | |
Transfers from Government of Canada | | | 9,200 | | | | 9,072 | | | | 8,013 | | | | (128 | ) | | | 1,059 | |
Investment income | | | 2,585 | | | | 2,828 | | | | 2,349 | | | | 243 | | | | 479 | |
Net income from government business enterprises | | | 2,417 | | | | (225 | ) | | | 2,585 | | | | (2,642 | ) | | | (2,810) | |
Other revenue (incl. premiums, fees and licences) | | | 7,308 | | | | 7,514 | | | | 7,618 | | | | 206 | | | | (104) | |
| | | | |
Total Revenue | | | 49,970 | | | | 46,224 | | | | 49,572 | | | | (3,746 | ) | | | (3,348 | ) |
| | | | |
Expense by Function | | | | | | | | | | | | | | | | | | | | |
Health | | | 22,153 | | | | 22,477 | | | | 21,921 | | | | 324 | | | | 556 | |
Education | | | 14,541 | | | | 14,879 | | | | 14,848 | | | | 338 | | | | 31 | |
Social Services | | | 6,304 | | | | 6,248 | | | | 5,867 | | | | (56 | ) | | | 381 | |
Other expense (includes contingency) 1 | | | 12,248 | | | | 12,005 | | | | 11,860 | | | | (243 | ) | | | 145 | |
| | | | |
Total Program Expense | | | 55,246 | | | | 55,609 | | | | 54,496 | | | | 363 | | | | 1,113 | |
| | | | |
Debt servicing costs | | | 2,265 | | | | 2,235 | | | | 1,971 | | | | (30 | ) | | | 264 | |
Pension provisions / (recovery) | | | (337 | ) | | | (334 | ) | | | (190 | ) | | | 3 | | | | (144) | |
Crude-by-rail | | | 1,500 | | | | 866 | | | | 6 | | | | (634 | ) | | | 860 | |
| | | | |
Total Expense | | | 58,674 | | | | 58,376 | | | | 56,283 | | | | (298 | ) | | | 2,093 | |
Surplus / (Deficit) | | | (8,703 | ) | | | (12,152 | ) | | | (6,711 | ) | | | (3,449 | ) | | | (5,441 | ) |
| | | | | |
Net Financial Debt | | | (36,626 | ) | | | (40,144 | ) | | | (27,477 | ) | | | (3,518 | ) | | | (12,667 | ) |
| 1 | Other expense by function are identified in the Statement of Operations on page 19 in the Consolidated Financial Statements. |
| | |
| Government of Alberta | Annual Report 2019 – 2020 | | 7 |
Revenue Highlights
| • | Total 2019-20 revenue was $46.2 billion, a decrease of $3.3 billion from 2018-19 and of $3.7 billion from Budget 2019. About 65 per cent of the decrease from budget was due to a provision required for Alberta Petroleum Marketing Commission related to the Sturgeon Refinery Processing Agreement. |
| • | Although the COVID-19 pandemic was not declared until March, it had a material impact on 2019-20 income taxes, as they are calculated on a calendar-year basis. This means 2019-20 revenue includes a quarter of 2020 estimated revenue, which has been significantly impacted by COVID-19 and the associated global economic deterioration. 2019-20 income tax revenue was $15.4 billion, comprising $11.2 billion in personal (PIT) and $4.1 billion in corporate income tax (CIT). PIT was down $0.7 billion from budget and $0.6 billion from 2018-19 mainly due to the impact that the COVID-19 pandemic has had on employment and household incomes in 2020. CIT was $0.8 billion lower than 2018-19 and $0.1 billion lower than budget mainly due to the impact on corporate profits of COVID-19 along with the collapse in oil prices. |
| • | Other tax revenue of $5.7 billion comprised: $2.5 billion in education property tax (2019 requisition mill rates were frozen at 2018 rates), $1.4 billion in fuel tax revenue and $1.9 billion in other taxes. Other tax revenue was close to budget, but $1.1 billion lower than 2018-19, primarily due to carbon tax elimination, which Albertans ceased paying on May 30, 2019. |
| • | Non-renewable resource revenue was $5.9 billion, a $0.5 billion increase from 2018-19, but a $0.6 billion decrease from budget. The decline from budget was primarily due to the global impact of COVID-19 on oil demand and prices, exacerbated by the temporary disagreement on oil supply management between Saudi Arabia and Russia. The West Texas Intermediate (WTI) oil price averaged US$54.85 per barrel (/bbl) in 2019-20, down $7.92 from 2018-19 and about $2 from budget. The light-heavy differential averaged US$14.82/bbl in 2019-20, US62¢ wider than budget and $8.49 narrower than in |
| | 2018-19, but the lower WTI oil price muted the positive impacts of the narrower differential. |
| • | Government of Canada transfers in 2019-20 were $9.1 billion, an increase of $1.1 billion from 2018-19, mainly due to a one-time Gas Tax Fund top-up of $230 million and a fiscal stabilization payment of $251 million related to 2016-17 revenue. The decrease of $0.1 billion from budget was primarily due to re-profiling federal infrastructure funding to future years. |
| • | Investment income was $2.8 billion, $0.5 billion more than 2018-19 and $0.2 billion higher than budget, due mainly to strong equity markets through the first 11 months of the fiscal year. |
| • | Government business enterprise net income was negative $0.2 billion, $2.8 billion lower than 2018-19, primarily due to a $2.5 billion provision for an onerous contract for the Sturgeon Refinery and a $0.2 billion loss in Alberta Petroleum Marketing Commission operations. Revenue from gaming and liquor, ATB Financial, and the Balancing Pool are also lower due to the economic impact of COVID-19 and lower electricity prices. |
| • | Other revenue totalled $7.5 billion in 2019-20, down $0.1 billion from 2018-19, primarily due to lower compliance payments to the Technology Innovation and Emissions Reduction Fund. |
| | |
| | |
| 8 | | Government of Alberta | Annual Report 2019 – 2020 |
Expense Highlights
| • | Total expense in 2019-20 was $58.4 billion, including $0.9 billion in costs of, and to divest the crude-by-rail program. |
| • | Health function expense was $22.5 billion in 2019-20, up $0.6 billion from 2018-19. Increases included $0.1 billion for the COVID-19 response (emergency self-isolation, shelters, not-for-profit organizations), $0.1 billion for drug costs, due to new cancer drugs and growth in number of seniors, $0.1 billion for physician compensation, reflecting higher service volumes, and $0.3 billion for information technology (e.g. connect care), community care and other health initiatives. Health function expense increased by $0.3 billion from budget primarily due to the $0.2 billion mentioned above for COVID-19 and drug costs, and another $0.1 billion for higher acute care demand and consequential staffing needs. Efforts to contain costs included replacing high cost drugs with biosimilars whenever possible and expanding some health professionals’ scope of practice. |
| • | Total 2019-20 education function expense was $14.9 billion, comprising $8.6 billion for the K-12 system and $6.3 billion for post-secondary education, including skills and training programs. This was up $0.3 billion from budget, but virtually unchanged from 2018-19. The increase from budget reflects higher post-secondary research activities and severance costs, the latter related to addressing the MacKinnon Panel’s recommendation to bring administrative costs in line with other comparator jurisdictions. Relative to 2018-19, the increases for severance in post-secondary institutions were more than offset by hiring restraint in the K-12 system. |
| • | Social services expense was $6.2 billion, an increase of $0.4 billion from 2018-19, but a decrease of $0.1 billion from budget. The increase from 2018-19 was due to caseload growth in programs for income support, child care, child intervention, seniors and disabled individuals. The $0.1 billion decrease from budget was primarily due to lower-than-expected demand for child care subsidies and Alberta Child Benefit. |
| • | Other expense was $12 billion, $224 million lower than budget. Increases for disaster assistance, which totaled $1.4 billion, and of $0.1 billion accrued for the payment to WCB for the COVID-related waiver of premiums for small and medium-sized businesses, were offset by lower capital grants and various savings initiatives. Other expense was $0.2 billion higher than 2018-19 mainly due to $0.8 billion in increased support for wildfires and agriculture disasters, and $0.1 billion for the WCB payment, partly offset by decreases of $0.7 billion from eliminating carbon tax rebates and various savings initiatives. |
| • | Expense related to crude-by-rail and divestment was $0.9 billion. This was a $0.6 billion decrease from budget as not all the crude-by-rail contracts were assigned as planned. |
| • | Debt servicing costs were $2.2 billion, an increase of $0.3 billion from 2018-19 but essentially unchanged from budget, reflecting higher borrowing, though much was undertaken in the last quarter of the fiscal year. |
| • | Public sector pension plan liabilities decreased by $0.3 billion to $8.9 billion, in line with the budget estimate. This liability reduction is reported as a negative expense. |
| | |
| Government of Alberta | Annual Report 2019 – 2020 | | 9 |
Statement of
Financial Position
| • | At March 31, 2020, financial and non-financial assets exceeded liabilities by $11.4 billion. This was $11.8 billion lower than 2019, mainly due to an increase in debt. |
| • | Financial assets were $76.4 billion, $0.6 billion higher than March 31, 2019, mainly due to debt issuance proceeds partly offset by a net GBE equity decrease of $2 billion from the $2.5 billion provision for an onerous contract for the Sturgeon Refinery. |
| • | Liabilities were $116.5 billion, up $13.3 billion from 2018-19 mainly due to an increase in debt. Total taxpayer-supported debt was $74.1 billion, up $11.5 billion from 2018-19. The remaining $18.1 billion in debt relates to the Alberta Capital Finance Authority and Agriculture Financial Services Corporation, which on-lend to local authorities and the agriculture sector, and report offsetting assets (loans receivable). |
| • | Capital / other non-financial assets net of deferred capital contributions was $51.6 billion, $0.8 billion above 2018-19, due to $3.9 billion in capital asset acquisition, a $0.3 billion decrease in pre-paid expense, less $2.7 billion in amortization and asset disposals. Major capital investment included: |
| • | $1.2 billion for Alberta’s highway network, inlcuding: $0.5 billion for Calgary’s ring road, with the final, southwest portion about 75 per cent complete; $0.2 billion for highway twinning, widening and expansion; and another $0.4 billion for highway rehabilitation. |
| • | $1.1 billion for health facilities and equipment. Completed projects included: Red Deer’s Secure Detoxification and Residential Treatment Facility for the Protection of Children Abusing Drugs; Northern Lights Regional Health Centre repairs; Stollery Children’s Hospital Critical Care Program phase two; 7 projects adding 438 affordable supportive living and long-term care spaces. |
| • | $0.5 billion for schools and other capital assets in the K-12 education system, including $0.4 billion for school construction and modernization and $0.1 billion for maintenance and renewal. Nineteen school projects were completed. |
| • | $0.6 billion for post-secondary projects, including funding of $177 million for expansion and upgrading, and $377 million in projects self-funded by institutions and donations. Major projects included University of Calgary MacKimmie Complex, University of Alberta Dentistry / Pharmacy, University of Lethbridge Destination project, and Northern Lakes College High Prairie consolidation. |
| | | | | | | | | | | | |
Summary Statement of Financial Position | | | | | | | | | | | | |
| (millions of dollars) | | at March 31 | |
| | 2020 Actual | | | 2019 Actual | | | Change from
2019 | |
Financial Assets | | | | | | | | | | | | |
Cash and cash equivalents | | | 15,325 | | | | 14,391 | | | | 934 | |
Portfolio investments | | | 31,014 | | | | 31,261 | | | | (247 | ) |
Equity in government business enterprises | | | 1,105 | | | | 3,062 | | | | (1,957 | ) |
Other | | | 28,937 | | | | 27,029 | | | | 1,908 | |
| | | 76,381 | | | | 75,743 | | | | 638 | |
Liabilities | | | | | | | | | | | | |
Debt | | | 92,438 | | | | 81,019 | | | | 11,419 | |
Pension liabilities | | | 8,918 | | | | 9,252 | | | | (334 | ) |
Other | | | 15,169 | | | | 12,949 | | | | 2,220 | |
| | | | 116,525 | | | | 103,220 | | | | 13,305 | |
Net Financial Debt | | | (40,144 | ) | | | (27,477 | ) | | | (12,667 | ) |
Capital / Other Non-financial Assets | | | 54,801 | | | | 53,908 | | | | 893 | |
Spent deferred capital contributions | | | (3,231 | ) | | | (3,164 | ) | | | (67 | ) |
Net Assets | | | 11,426 | | | | 23,267 | | | | (11,841 | ) |
Change in Net Assets | | | (11,841 | ) | | | (6,404 | ) | | | | |
| | |
| | |
| 10 | | Government of Alberta | Annual Report 2019 – 2020 |
Financial Indicators and Risks
| • | Net debt on March 31, 2020 was $40.1 billion, or $9,100 per person. This is a deterioration of $53.2 billion since March 31, 2015, when net financial assets were $13.1 billion. |
| • | Between 2014-15 and 2019-20, revenue has declined by a total of 6.6 per cent. Revenue has been quite volatile over this period, from a high of $49.6 billion in 2018-19 to a low of $42.3 billion in 2016-17. |
| • | Over the same period, expense has grown by a total of 20.7 per cent. Expense varies by program, with many demand-driven (e.g. enrolment growth, physician costs) and others driven by emergencies such as wildfires and floods. |
| • | Alberta relies heavily on revenue that is volatile and unpredictable, including non-renewable resources, corporate income tax and investment income. Since 2004-05, these have accounted for up to 55 per cent of total revenue, while over the last 5 years they have averaged 27 per cent. Revenue volatility is linked to numerous factors, some of which are described below. |
| • | Oil prices are impacted by global supply and demand. Factors influencing demand include economic growth, pipeline or refinery outages, and speculative market activities by traders. Supply is mainly impacted by production levels agreed upon by OPEC, and more recently, by changes in production from non-OPEC countries such as Russia and the US in response to price swings. Other factors include drilling and investment decisions, geopolitical events, economic sanctions, or weather related disruptions. The West Texas Intermediate (WTI) price averaged US$58 per barrel (/bbl) for the first ten months of 2019-20, before dropping to an average of $40/bbl in the last two months, due to the impact on the global economy of the COVID-19 shut-down and travel restrictions, and the temporary disagreement on oil supply management between Saudi Arabia and Russia. The differential hovered around US$12/bbl for the first eight months, due in part to government production curtailment, before widening to around $20 for the remaining four months with curtailment easing and TC Energy’s Keystone pipeline outage in November 2019. |
Oil and Natural Gas Prices 2015-20

| • | Weaker-than-forecast global and US growth harms Alberta’s revenue, as oil prices are lower. |
| • | Lower interest rates typically encourage business investment, which boosts tax revenue and decreases debt servicing costs. Ten-year Canada bonds were down ten basis points from budget. |
| • | A higher exchange rate decreases the value of exports and negatively impacts government revenue. The exchange rate was virtually unchanged from the budget estimate. |
| • | Equity markets are affected by a wide range of factors, such as global economic conditions, fluctuations in commodity prices, and interest rates. Investment income increased from 2018-19 and the budget estimate as markets were quite strong in 2019. |
| • | Deterioration in corporate profits decreases revenue, but the impact can be difficult to predict as taxable income can vary significantly from corporate profits due to various discretionary deductions, or the ability to carry prior-year losses forward or back. |
| • | To address revenue and expense uncertainty, Budget 2019 introduced a contingency and provided alternative revenue scenarios. The contingency included funding for emergencies and disasters at a higher rate than previous budgets, more in-line with historical averages. |
| • | These highlights should be read in conjunction with the budget and quarterly updates www.alberta.ca/budget-documents.aspx. |
| | |
| Government of Alberta | Annual Report 2019 – 2020 | | 11 |
Historical Fiscal Summary, 2008-09 to 2019-20 a
(millions of dollars)
| | | | | | | | | | | | | | | | | | | | | | | | | | | | | | | | | | | | | | | | | | | | | | | | | | |
| | | | | 2008-09 | | | 2009-10 | | | 2010-11 | | | 2011-12 | | | 2012-13 | | | 2013-14 | | | 2014-15 | | | 2015-16 | | | 2016-17 | | | 2017-18 | | | 2018-19 | | | 2019-20 | |
Income Statement | | | | | | | | | | | | | | | | | | | | | | | | | | | | | | | | | | | | |
| | Revenue | | | | | | | | | | | | | | | | | | | | | | | | | | | | | | | | | | | | | | | | | | | | | | | | |
| 1 | | Personal income tax | | | 8,708 | | | | 7,877 | | | | 7,631 | | | | 8,563 | | | | 9,621 | | | | 10,537 | | | | 11,042 | | | | 11,357 | | | | 10,763 | | | | 10,775 | | | | 11,874 | | | | 11,244 | |
| 2 | | Corporate income tax | | | 4,252 | | | | 4,754 | | | | 3,334 | | | | 3,678 | | | | 4,756 | | | | 5,488 | | | | 5,796 | | | | 4,195 | | | | 3,769 | | | | 3,448 | | | | 4,871 | | | | 4,107 | |
| 3 | | Other tax revenue | | | 3,817 | | | | 3,746 | | | | 3,820 | | | | 4,099 | | | | 4,333 | | | | 4,500 | | | | 4,598 | | | | 5,168 | | | | 5,649 | | | | 6,538 | | | | 6,833 | | | | 5,747 | |
| 4 | | Resource revenue | | | 11,915 | | | | 6,768 | | | | 8,428 | | | | 11,636 | | | | 7,779 | | | | 9,578 | | | | 8,948 | | | | 2,789 | | | | 3,097 | | | | 4,980 | | | | 5,429 | | | | 5,937 | |
| 5 | | Investment income | | | (1,888 | ) | | | 3,541 | | | | 2,486 | | | | 2,168 | | | | 2,595 | | | | 3,423 | | | | 3,113 | | | | 2,544 | | | | 3,698 | | | | 3,126 | | | | 2,349 | | | | 2,828 | |
| 6 | | Premiums, fees and licences | | | 3,356 | | | | 2,857 | | | | 2,922 | | | | 2,931 | | | | 3,184 | | | | 3,437 | | | | 2,665 | | | | 3,574 | | | | 3,701 | | | | 3,839 | | | | 3,911 | | | | 3,929 | |
| 7 | | Other own-source revenue | | | 4,587 | | | | 4,627 | | | | 4,903 | | | | 5,128 | | | | 5,234 | | | | 5,412 | | | | 7,337 | | | | 5,850 | | | | 3,637 | | | | 6,982 | | | | 6,292 | | | | 3,360 | |
| 8 | | Total own-source revenue | | | 34,747 | | | | 34,170 | | | | 33,524 | | | | 38,203 | | | | 37,502 | | | | 42,375 | | | | 43,499 | | | | 35,477 | | | | 34,314 | | | | 39,688 | | | | 41,559 | | | | 37,152 | |
| 9 | | Federal transfers | | | 4,578 | | | | 5,342 | | | | 5,452 | | | | 5,192 | | | | 5,042 | | | | 7,059 | | | | 5,982 | | | | 7,142 | | | | 7,979 | | | | 7,606 | | | | 8,013 | | | | 9,072 | |
| 10 | | Total Revenue | | | 39,325 | | | | 39,512 | | | | 38,976 | | | | 43,395 | | | | 42,544 | | | | 49,434 | | | | 49,481 | | | | 42,619 | | | | 42,293 | | | | 47,295 | | | | 49,572 | | | | 46,224 | |
| | Expense by Function | | | | | | | | | | | | | | | | | | | | | | | | | | | | | | | | | | | | | | | | | | | | | | | | |
| 11 | | Health | | | 13,674 | | | | 14,636 | | | | 15,393 | | | | 16,284 | | | | 17,254 | | | | 17,967 | | | | 19,366 | | | | 20,115 | | | | 20,687 | | | | 21,239 | | | | 21,921 | | | | 22,477 | |
| 12 | | Basic / advanced education | | | 10,438 | | | | 11,067 | | | | 11,362 | | | | 11,951 | | | | 12,394 | | | | 12,782 | | | | 13,103 | | | | 13,673 | | | | 14,110 | | | | 14,471 | | | | 14,848 | | | | 14,879 | |
| 13 | | Social services | | | 3,417 | | | | 3,807 | | | | 4,129 | | | | 4,278 | | | | 4,641 | | | | 4,668 | | | | 4,548 | | | | 4,752 | | | | 5,198 | | | | 5,592 | | | | 5,867 | | | | 6,248 | |
| 14 | | Other program expense | | | 10,386 | | | | 9,834 | | | | 9,443 | | | | 9,853 | | | | 10,528 | | | | 12,970 | | | | 11,031 | | | | 10,375 | | | | 12,607 | | | | 13,189 | | | | 11,866 | | | | 12,891 | |
| 15 | | Total program expense | | | 37,915 | | | | 39,344 | | | | 40,327 | | | | 42,366 | | | | 44,817 | | | | 48,387 | | | | 48,048 | | | | 48,915 | | | | 52,602 | | | | 54,491 | | | | 54,502 | | | | 56,475 | |
| 16 | | Debt servicing costs | | | 208 | | | | 214 | | | | 472 | | | | 509 | | | | 530 | | | | 601 | | | | 722 | | | | 776 | | | | 1,018 | | | | 1,420 | | | | 1,971 | | | | 2,235 | |
| 17 | | Pension provisions | | | 2,133 | | | | 430 | | | | 439 | | | | 634 | | | | 296 | | | | 748 | | | | (404 | ) | | | (630 | ) | | | (543 | ) | | | (593 | ) | | | (190 | ) | | | (334 | ) |
| 18 | | Total Expense | | | 40,256 | | | | 39,988 | | | | 41,238 | | | | 43,509 | | | | 45,643 | | | | 49,736 | | | | 48,366 | | | | 49,061 | | | | 53,077 | | | | 55,318 | | | | 56,283 | | | | 58,376 | |
| 19 | | Surplus / (Deficit) | | | (931 | ) | | | (476 | ) | | | (2,262 | ) | | | (114 | ) | | | (3,099 | ) | | | (302 | ) | | | 1,115 | | | | (6,442 | ) | | | (10,784 | ) | | | (8,023 | ) | | | (6,711 | ) | | | (12,152 | ) |
| Capital Plan b | | | 7,943 | | | | 8,000 | | | | 7,544 | | | | 6,884 | | | | 6,062 | | | | 5,770 | | | | 6,181 | | | | 6,558 | | | | 6,578 | | | | 9,021 | | | | 6,180 | | | | 5,564 | |
| | | | | | | | | | | | |
| Balance Sheet (at March 31) | | | | | | | | | | | | | | | | | | | | | | | | | | | | | | | | | | | | | | | | | | | | | | | | |
| 20 | | Heritage / endowment funds | | | 16,900 | | | | 17,077 | | | | 17,500 | | | | 17,936 | | | | 18,176 | | | | 18,562 | | | | 18,860 | | | | 19,262 | | | | 19,836 | | | | 20,306 | | | | 20,716 | | | | 20,672 | |
| 21 | | Contingency Account | | | 16,822 | | | | 14,983 | | | | 11,192 | | | | 7,497 | | | | 3,326 | | | | 4,658 | | | | 6,529 | | | | 3,625 | | | | 2,399 | | | | 1,661 | | | | 6,342 | | | | - | |
| 22 | | Other financial assets | | | 28,868 | | | | 30,338 | | | | 30,799 | | | | 32,972 | | | | 34,734 | | | | 40,039 | | | | 40,688 | | | | 40,990 | | | | 44,052 | | | | 49,010 | | | | 48,685 | | | | 55,709 | |
| 23 | | Capital Plan liabilities | | | (880 | ) | | | (2,888 | ) | | | (3,199 | ) | | | (3,442 | ) | | | (4,594 | ) | | | (8,724 | ) | | | (11,922 | ) | | | (19,040 | ) | | | (23,769 | ) | | | (29,339 | ) | | | (33,597 | ) | | | (37,207 | ) |
| 24 | | Fiscal Plan liabilities (borrowing / pre-1992 TPP) | | | 0 | | | | (1,187 | ) | | | (1,187 | ) | | | (1,187 | ) | | | (1,187 | ) | | | (1,187 | ) | | | (943 | ) | | | (944 | ) | | | (9,529 | ) | | | (14,023 | ) | | | (26,374 | ) | | | (36,935 | ) |
| 25 | | Pension obligations | | | (10,239 | ) | | | (9,483 | ) | | | (9,922 | ) | | | (10,556 | ) | | | (10,852 | ) | | | (11,600 | ) | | | (11,196 | ) | | | (10,566 | ) | | | (10,023 | ) | | | (9,430 | ) | | | (9,240 | ) | | | (8,918 | ) |
| 26 | | Other liabilities | | | (19,770 | ) | | | (21,523 | ) | | | (23,530 | ) | | | (24,229 | ) | | | (25,148 | ) | | | (28,716 | ) | | | (28,962 | ) | | | (29,408 | ) | | | (31,867 | ) | | | (37,529 | ) | | | (34,009 | ) | | | (33,465 | ) |
| 27 | | Net Financial Assets / (Debt) | | | 31,701 | | | | 27,317 | | | | 21,653 | | | | 18,991 | | | | 14,455 | | | | 13,032 | | | | 13,054 | | | | 3,919 | | | | (8,901 | ) | | | (19,344 | ) | | | (27,477 | ) | | | (40,144 | ) |
| 28 | | Capital (net of defer. Contrib.) / non-fin. assets | | | 30,275 | | | | 34,217 | | | | 37,607 | | | | 40,122 | | | | 39,517 | | | | 40,839 | | | | 42,197 | | | | 44,623 | | | | 46,622 | | | | 49,015 | | | | 50,744 | | | | 51,570 | |
| 29 | | Net Assets c | | | 61,976 | | | | 61,534 | | | | 59,260 | | | | 59,113 | | | | 53,972 | | | | 53,871 | | | | 55,251 | | | | 48,542 | | | | 37,721 | | | | 29,671 | | | | 23,267 | | | | 11,426 | |
| a | Numbers are not strictly comparable due to numerous accounting policy changes over time. Examples include reporting certain items (transfers through the tax system, crude oil marketing and transportation costs, allowance for corporate income tax doubtful accounts) as expense, instead of netting the amounts from related revenue, increasing both revenue and expense, but not impacting the surplus / (deficit). 2018-19 revenue and expense have been decreased by $52 million to report revenue net of third party investment management costs, instead of reporting the costs in expense and grossing up revenue. There is no impact on the deficit or debt. |
| b | Reflects capital grants and other support included in expense, and capital investment in government-owned assets not included in expense. Capital investment adds to capital assets, which are depreciated over time through amortization expense. Numbers for 2008-09 to 2013-14 are estimates as details required to consolidate SUCH sector capital spending with full accuracy are not readily available. |
| c | The change in net assets / (debt) year over year does not match the surplus / (deficit) exactly in most years, due to various balance sheet adjustments, most of which are minor. A significant adjustment reducing net assets by $2 billion was made in 2012-13, to recognize the accumulated deferred capital contribution liability when the accounting standard was adopted. |
| | |
| | |
| 12 | | Government of Alberta | Annual Report 2019 – 2020 |
Consolidated Financial Statements
CONSOLIDATED FINANCIAL STATEMENTS
Table of Contents
| | | | | | | | | | |
| | |
CONSOLIDATED FINANCIAL STATEMENTS OF THE PROVINCE OF ALBERTA | | | | | | |
| | |
Table of Contents | | | | | | |
| | |
Management’s Responsibility for the Consolidated Financial Statements | | | 17 | | | |
| | |
Independent Auditor’s Report | | | 18 | | | |
| | |
Consolidated Statement of Operations | | | 21 | | | |
| | |
Consolidated Statement of Financial Position | | | 22 | | | |
| | |
Consolidated Statement of Change in Net Debt | | | 23 | | | |
| | |
Consolidated Statement of Cash Flows | | | 24 | | | |
| | |
Notes to the Consolidated Financial Statements | | | | | | |
| | | | |
| | 1 | | Summary of Significant Accounting Policies and Reporting Practices | | | 25 | | | |
| | | | |
| | 2 | | Valuation of Financial Assets and Liabilities | | | 33 | | | |
| | | | |
| | 3 | | Financial Risk Management and Derivatives | | | 34 | | | |
| | | | |
| | 4 | | Contractual Rights | | | 37 | | | |
| | | | |
| | 5 | | Contingent Assets | | | 37 | | | |
| | | | |
| | 6 | | Contractual Obligations and Commitments | | | 38 | | | |
| | | | |
| | 7 | | Contingent Liabilities | | | 39 | | | |
| | | | |
| | 8 | | Trust and Other Funds Under Administration | | | 41 | | | |
| | | | |
| | 9 | | Subsequent Event | | | 42 | | | |
| | | | |
| | 10 | | Comparative Figures | | | 42 | | | |
| | |
Schedules to the Consolidated Financial Statements | | | | | | |
| | | | |
| | 1 | | Revenues | | | 43 | | | |
| | | | |
| | 2 | | Revenues by Source by Ministry | | | 44 | | | |
| | | | |
| | 3 | | Expenses by Object by Ministry | | | 45 | | | |
| | | | |
| | 4 | | Cash and Cash Equivalents | | | 46 | | | |
| | | | |
| | 5 | | Accounts Receivable | | | 46 | | | |
| | | | |
| | 6 | | Portfolio Investments | | | 47 | | | |
| | | | |
| | 7 | | Endowment Funds | | | 48 | | | |
| | | | |
| | 8 | | Equity in Government Business Enterprises | | | 49 | | | |
| | | | |
| | 9 | | Loans and Advances | | | 56 | | | |
| | | | |
| | 10 | | Accounts Payable and Other Accrued Liabilities | | | 57 | | | |
| | | | |
| | 11 | | Debt | | | 57 | | | |
| | |
| Government of Alberta | Annual Report 2019 – 2020 | | 15 |
CONSOLIDATED FINANCIAL STATEMENTS
Table of Contents, continued
| | | | | | | | | | |
| | |
Schedules to the Consolidated Financial Statements (continued) | | | | | | |
| | | | |
| | 12 | | Pension Plans and Other Defined Benefit Plans | | | 61 | | | |
| | | | |
| | 13 | | Deferred Contributions | | | 68 | | | |
| | | | |
| | 14 | | Tangible Capital Assets | | | 69 | | | |
| | | | |
| | 15 | | Adjustments to Net Assets | | | 70 | | | |
| | | | |
| | 16 | | Over-expenditure of Spending Authorities | | | 71 | | | |
| | | | |
| | 17 | | Listing of Organizations | | | 72 | | | |
| | |
Glossary (Unaudited) | | | 77 | | | |
| | |
| | |
| 16 | | Government of Alberta | Annual Report 2019 – 2020 |
CONSOLIDATED FINANCIAL STATEMENTS
Management’s Responsibility
for the Consolidated Financial Statements
The consolidated financial statements are prepared by the Controller under the general direction of the Deputy Minister of Treasury Board and Finance as authorized by the President of Treasury Board and Minister of Finance pursuant to the Financial Administration Act. The consolidated financial statements are prepared in accordance with Canadian Public Sector Accounting Standards, and of necessity include some amounts that are based on estimates and judgments. As required by the Fiscal Planning and Transparency Act, the consolidated financial statements are included in the consolidated annual report of the Province of Alberta that forms part of the Public Accounts.
To fulfill its accounting and reporting responsibilities, management maintains systems of financial management and internal control which give consideration to costs, benefits and risks, and which are designed to:
| ● | Provide reasonable assurance that transactions are properly authorized, executed in accordance with prescribed legislation and regulations, and properly recorded so as to maintain accountability for public money, and |
| ● | Safeguard the assets and properties of the Province of Alberta under government administration. |
Under the Financial Administration Act, deputy heads are responsible for the collection of revenue payable to the Crown, and for making and controlling disbursements with respect to their departments. They are also responsible for prescribing the accounting systems to be used in their departments. In order to meet government accounting and reporting requirements, the Controller obtains information relating to departments, regulated funds, provincial agencies, Crown-controlled corporations, schools, universities, colleges, technical institutes, Alberta Health Services and other health entities from ministries as necessary.
The consolidated financial statements are reviewed by the Audit Committee established under the Auditor General Act. The Audit Committee advises the Lieutenant Governor in Council on the scope and results of the Auditor General’s audit of the consolidated financial statements of the Province.
The Auditor General of Alberta provides an independent opinion on the consolidated financial statements. The duties of the Auditor General in that respect are contained in the Auditor General Act.
Annually, the consolidated annual report is tabled in the Legislature as a part of the Public Accounts and is referred to the Standing Committee on Public Accounts of the Legislative Assembly.
Approved by:
Athana Mentzelopoulos
Deputy Minister of Treasury Board and Finance
Dan Stadlwieser, CPA, CA
Controller
Edmonton, Alberta
July 29, 2020
| | |
| | |
| Government of Alberta | Annual Report 2019 – 2020 | | 17 |
CONSOLIDATED FINANCIAL STATEMENTS
| | |
| Independent Auditor’s Report | |  |
To the Members of the Legislative Assembly
Report on the Consolidated Financial Statements
Opinion
I have audited the consolidated financial statements of the Province of Alberta, which comprise the consolidated statement of financial position as at March 31, 2020, and the consolidated statements of operations, change in net debt, and cash flows for the year then ended, and notes and schedules to the consolidated financial statements, including a summary of significant accounting policies.
In my opinion, the accompanying consolidated financial statements present fairly, in all material respects, the consolidated financial position of the Province of Alberta as at March 31, 2020, and the results of its operations, its changes in net debt, and its cash flows for the year then ended in accordance with Canadian public sector accounting standards.
Basis for opinion
I conducted my audit in accordance with Canadian generally accepted auditing standards. My responsibilities under those standards are further described in the Auditor’s Responsibilities for the Audit of the Consolidated Financial Statements section of my report. I am independent of the Province of Alberta in accordance with the ethical requirements that are relevant to my audit of the consolidated financial statements in Canada, and I have fulfilled my other ethical responsibilities in accordance with these requirements. I believe that the audit evidence I have obtained is sufficient and appropriate to provide a basis for my opinion.
Other information
Management is responsible for the other information. The other information comprises the information included in the 2019-20 Government of Alberta Annual Report (but does not include the consolidated financial statements and my auditor’s report thereon), and the 2019-20 Final Results Year-end Report.
My opinion on the consolidated financial statements does not cover the other information identified above and I do not and will not express any form of assurance conclusion thereon. In connection with my audit of the consolidated financial statements, my responsibility is to read the other information identified above and, in doing so, consider whether the other information is materially inconsistent with the consolidated financial statements or my knowledge obtained in the audit, or otherwise appears to be materially misstated.
I obtained the 2019-20 Government of Alberta Annual Report prior to the date of my auditor’s report. If, based on the work I have performed on this other information that I obtained prior to the date of
| | |
| | |
| 18 | | Government of Alberta | Annual Report 2019 – 2020 |
CONSOLIDATED FINANCIAL STATEMENTS
Independent Auditor’s Report, continued
my auditor’s report, I conclude that there is a material misstatement of this other information, I am required to report that fact. I have nothing to report in this regard.
The 2019-20 Final Results Year-end Report is expected to be made available to me after the date of my auditor’s report. If, based on the work I will perform on this other information, I conclude that there is a material misstatement of this other information, I am required to report that fact to those charged with governance.
Responsibilities of management and those charged with governance for the consolidated financial statements
Management is responsible for the preparation and fair presentation of the consolidated financial statements in accordance with Canadian public sector accounting standards, and for such internal control as management determines is necessary to enable the preparation of the consolidated financial statements that are free from material misstatement, whether due to fraud or error.
In preparing the consolidated financial statements, management is responsible for assessing the Province of Alberta’s ability to continue as a going concern, disclosing, as applicable, matters related to going concern, and using the going concern basis of accounting unless an intention exists to liquidate or to cease operations, or there is no realistic alternative but to do so.
Those charged with governance are responsible for overseeing the Province of Alberta’s financial reporting process.
Auditor’s responsibilities for the audit of the consolidated financial statements
My objectives are to obtain reasonable assurance about whether the consolidated financial statements as a whole are free from material misstatement, whether due to fraud or error, and to issue an auditor’s report that includes my opinion. Reasonable assurance is a high level of assurance, but is not a guarantee that an audit conducted in accordance with Canadian generally accepted auditing standards will always detect a material misstatement when it exists. Misstatements can arise from fraud or error and are considered material if, individually or in the aggregate, they could reasonably be expected to influence the economic decisions of users taken on the basis of these consolidated financial statements.
As part of an audit in accordance with Canadian generally accepted auditing standards, I exercise professional judgment and maintain professional skepticism throughout the audit. I also:
| · | | Identify and assess the risks of material misstatement of the consolidated financial statements, whether due to fraud or error, design and perform audit procedures responsive to those risks, and obtain audit evidence that is sufficient and appropriate to provide a basis for my opinion. The risk of not detecting a material misstatement resulting from fraud is higher than for one resulting from error, as fraud may involve collusion, forgery, intentional omissions, misrepresentations, or the override of internal control. |
| · | | Obtain an understanding of internal control relevant to the audit in order to design audit procedures that are appropriate in the circumstances, but not for the purpose of expressing an opinion on the effectiveness of the Province of Alberta’s internal control. |
| · | | Evaluate the appropriateness of accounting policies used and the reasonableness of accounting estimates and related disclosures made by management. |
| | |
| | |
| Government of Alberta | Annual Report 2019 – 2020 | | 19 |
CONSOLIDATED FINANCIAL STATEMENTS
Independent Auditor’s Report, continued
| · | | Conclude on the appropriateness of management’s use of the going concern basis of accounting and, based on the audit evidence obtained, whether a material uncertainty exists related to events or conditions that may cast significant doubt on the Province of Alberta’s ability to continue as a going concern. If I conclude that a material uncertainty exists, I am required to draw attention in my auditor’s report to the related disclosures in the consolidated financial statements or, if such disclosures are inadequate, to modify my opinion. My conclusions are based on the audit evidence obtained up to the date of my auditor’s report. However, future events or conditions may cause the Province of Alberta to cease to continue as a going concern. |
| · | | Evaluate the overall presentation, structure and content of the consolidated financial statements, including the disclosures, and whether the consolidated financial statements represent the underlying transactions and events in a manner that achieves fair presentation. |
| · | | Obtain sufficient appropriate audit evidence regarding the financial information of the entities and business activities within the consolidated financial statements, to express an opinion on the consolidated financial statements. I am responsible for the direction, supervision and performance of the group audit. I remain solely responsible for my audit opinion. |
I communicate with those charged with governance regarding, among other matters, the planned scope and timing of the audit and significant audit findings, including any significant deficiencies in internal control that I identify during my audit.
I also provide those charged with governance with a statement that I have complied with relevant ethical requirements regarding independence, and to communicate with them all relationships and other matters that may reasonably be thought to bear on my independence, and where applicable, related safeguards.
In accordance with the Auditor General Act, I am responsible to report the independent opinion on the consolidated financial statements of the Province of Alberta completed by my office.
[Original signed by W. Doug Wylie FCPA, FCMA, ICD.D]
Auditor General
July 29, 2020
Edmonton, Alberta
| | |
| | |
| 20 | | Government of Alberta | Annual Report 2019 – 2020 |
CONSOLIDATED FINANCIAL STATEMENTS
Consolidated Statement of Operations
| | | | | | | | | | | | |
| Year Ended March 31 | | | | | | |
| | | 2020 | | | 2019 | |
| | | Budget | | | | | | Actual | |
| | | Restated | | | Actual | | | Restated | |
| | | (Notes 1 (c), (e)) | | | | | | (Note 1 (e)) | |
| | | In millions | | | | |
| | | |
Revenues (Schedules 1 and 2) | | | | | | | | | | | | |
| | | |
Income taxes | | $ | 16,167 | | | $ | 15,351 | | | $ | 16,745 | |
| | | |
Other taxes | | | 5,766 | | | | 5,747 | | | | 6,833 | |
| | | |
Non-renewable resource revenue | | | 6,527 | | | | 5,937 | | | | 5,429 | |
| | | |
Transfers from Government of Canada | | | 9,200 | | | | 9,072 | | | | 8,013 | |
| | | |
Net income/(loss) from government business enterprises (Schedule 8) | | | 2,417 | | | | (225 | ) | | | 2,585 | |
| | | |
Investment income | | | 2,585 | | | | 2,828 | | | | 2,349 | |
| | | |
Premiums, fees and licences | | | 3,872 | | | | 3,929 | | | | 3,909 | |
| | | |
Other | | | 3,436 | | | | 3,585 | | | | 3,709 | |
| | | |
| | | 49,970 | | | | 46,224 | | | | 49,572 | |
| | | |
Expenses by function (Schedule 3) | | | | | | | | | | | | |
| | | |
Health | | | 22,153 | | | | 22,477 | | | | 21,921 | |
| | | |
Education | | | 14,541 | | | | 14,879 | | | | 14,848 | |
| | | |
Social services | | | 6,304 | | | | 6,248 | | | | 5,867 | |
| | | |
Agriculture, resource management and economic development | | | 1,986 | | | | 2,700 | | | | 2,313 | |
| | | |
Crude by Rail | | | 1,500 | | | | 866 | | | | 6 | |
| | | |
General government | | | 2,604 | | | | 2,659 | | | | 2,565 | |
| | | |
Protection of persons and property | | | 3,094 | | | | 2,337 | | | | 2,021 | |
| | | |
Transportation, communications and utilities | | | 1,690 | | | | 1,487 | | | | 1,696 | |
| | | |
Regional planning and development | | | 1,425 | | | | 1,384 | | | | 1,207 | |
| | | |
Environment | | | 884 | | | | 799 | | | | 1,299 | |
| | | |
Recreation and culture | | | 369 | | | | 387 | | | | 458 | |
| | | |
Housing | | | 196 | | | | 252 | | | | 301 | |
| | | |
Debt servicing costs | | | 2,265 | | | | 2,235 | | | | 1,971 | |
| | | |
Pension recovery (Schedule 12) | | | (337 | ) | | | (334 | ) | | | (190 | ) |
| | | |
| | | 58,674 | | | | 58,376 | | | | 56,283 | |
| | | |
Annual deficit | | | (8,704 | ) | | | (12,152 | ) | | | (6,711 | ) |
| | | |
Net assets at beginning of year – as previously reported | | | 23,267 | | | | 23,267 | | | | 29,671 | |
| | | |
Adjustments to net assets (Schedule 15) | | | - | | | | 311 | | | | 307 | |
| | | |
Net assets at end of year | | $ | 14,563 | | | $ | 11,426 | | | $ | 23,267 | |
The accompanying notes and schedules are part of these consolidated financial statements.
| | |
| | |
| Government of Alberta | Annual Report 2019 – 2020 | | 21 |
CONSOLIDATED FINANCIAL STATEMENTS
Consolidated Statement of Financial Position
| | | | | | | | |
| As at March 31 | | | | | | |
| | | 2020 | | | 2019 | |
| | | In | | | millions | |
| | |
Financial assets | | | | | | | | |
| | |
Cash and cash equivalents (Schedule 4) | | $ | 15,325 | | | | $ 14,391 | |
| | |
Accounts receivable (Schedule 5) | | | 8,730 | | | | 6,764 | |
| | |
Portfolio investments (Schedule 6) | | | | | | | | |
| | |
Operating | | | 28,403 | | | | 28,689 | |
| | |
Endowments (Schedule 7) | | | 2,611 | | | | 2,572 | |
| | |
Equity in government business enterprises (Schedule 8) | | | 1,105 | | | | 3,062 | |
| | |
Loans and advances (Schedule 9) | | | 20,174 | | | | 20,231 | |
| | |
Inventories for resale and other | | | 33 | | | | 34 | |
| | |
| | | 76,381 | | | | 75,743 | |
| | |
Liabilities | | | | | | | | |
| | |
Accounts payable and other accrued liabilities (Schedule 10) | | | 13,877 | | | | 11,574 | |
| | |
Debt (Schedule 11) | | | 92,438 | | | | 81,019 | |
| | |
Pension liabilities (Schedule 12) | | | 8,918 | | | | 9,252 | |
| | |
Unspent deferred contributions (Schedule 13) | | | 1,292 | | | | 1,375 | |
| | |
| | | 116,525 | | | | 103,220 | |
| | |
Net debt | | | (40,144 | ) | | | (27,477 | ) |
| | |
Non-financial assets | | | | | | | | |
| | |
Tangible capital assets (Schedule 14) | | | 54,066 | | | | 52,925 | |
| | |
Prepaid expenses | | | 358 | | | | 618 | |
| | |
Inventories of supplies and other | | | 377 | | | | 365 | |
| | |
| | | 54,801 | | | | 53,908 | |
| | |
Net assets before spent deferred capital contributions | | | 14,657 | | | | 26,431 | |
| | |
Spent deferred capital contributions (Schedule 13) | | | 3,231 | | | | 3,164 | |
| | |
Net assets | | $ | 11,426 | | | | $ 23,267 | |
Contractual rights and obligations (Notes 4 and 6)
Contingent assets and liabilities (Notes 5 and 7)
The accompanying notes and schedules are part of these consolidated financial statements.
| | |
| 22 | | Government of Alberta | Annual Report 2019 – 2020 |
CONSOLIDATED FINANCIAL STATEMENTS
Consolidated Statement of Change in Net Debt
| | | | | | | | | | | | |
| Year Ended March 31 | | | | | | | | | |
| | | 2020 | | | 2019 | |
| | | Budget | | | Actual | | | Actual | |
| | | | | | In millions | | | | |
| | | |
Annual deficit | | $ | (8,704 | ) | | $ | (12,152 | ) | | $ | (6,711 | ) |
| | | |
Acquisition of tangible capital assets | | | (4,006 | ) | | | (3,677 | ) | | | (3,837 | ) |
| | | |
Additions to public private partnerships, capital leases, donated capital assets and other | | | (113 | ) | | | (189 | ) | | | (268 | ) |
| | | |
Amortization of tangible capital assets | | | 2,556 | | | | 2,578 | | | | 2,472 | |
| | | |
Net loss/(gain) on disposal and adjustments of tangible capital assets | | | - | | | | 122 | | | | (13 | ) |
| | | |
Proceeds on sale of tangible capital assets | | | - | | | | 25 | | | | 120 | |
| | | |
Decrease/(increase) in inventory of supplies | | | 6 | | | | (12 | ) | | | (24 | ) |
| | | |
Decrease/(increase) in prepaid expenses | | | - | | | | 260 | | | | (334 | ) |
| | | |
(Decrease)/increase in spent deferred capital contributions | | | (60 | ) | | | 67 | | | | 155 | |
| | | |
Change in accumulated unrealized gains (Schedule 8) | | | - | | | | 349 | | | | 166 | |
| | | |
Other (Schedule 15) | | | - | | | | (38 | ) | | | 141 | |
| | | |
Increase in net debt | | | (10,321 | ) | | | (12,667 | ) | | | (8,133 | ) |
| | | |
Net debt at beginning of year | | | (27,477 | ) | | | (27,477 | ) | | | (19,344 | ) |
| | | |
Net debt at end of year | | $ | (37,798 | ) | | $ | (40,144 | ) | | $ | (27,477 | ) |
The accompanying notes and schedules are part of these consolidated financial statements.
| | |
| Government of Alberta | Annual Report 2019 – 2020 | | 23 |
CONSOLIDATED FINANCIAL STATEMENTS
Consolidated Statement of Cash Flows
| | | | | | | | |
| Year Ended March 31 | | | | | | |
| | | 2020 | | | 2019 | |
| | | In | | | millions | |
| | |
Operating transactions | | | | | | | | |
| | |
Annual deficit | | $ | (12,152 | ) | | | $ (6,711 | ) |
| | |
Non-cash items | | | | | | | | |
| | |
Amortization of tangible capital assets | | | 2,578 | | | | 2,472 | |
| | |
Deferred contributions recognized as revenue | | | (1,941 | ) | | | (1,652 | ) |
| | |
Pension recovery | | | (334 | ) | | | (190 | ) |
| | |
Net loss/(income) from government business enterprises | | | 225 | | | | (2,585 | ) |
| | |
Other non-cash items included in annual deficit | | | (291 | ) | | | (122 | ) |
| | |
| | | (11,915 | ) | | | (8,788 | ) |
| | |
Decrease/(increase) in accounts receivable, inventories, prepaids and other assets | | | 571 | | | | (1,219 | ) |
| | |
Increase/(decrease) in accounts payable and other accrued liabilities | | | 2,283 | | | | (1,544 | ) |
| | |
Distribution from government business enterprises | | | 2,129 | | | | 2,165 | |
| | |
Cash applied to operating transactions | | | (6,932 | ) | | | (9,386 | ) |
| | |
Capital transactions | | | | | | | | |
| | |
Acquisition of tangible capital assets | | | (3,677 | ) | | | (3,837 | ) |
| | |
Proceeds on sale of tangible capital assets | | | 25 | | | | 120 | |
| | |
Cash applied to capital transactions | | | (3,652 | ) | | | (3,717 | ) |
| | |
Investing transactions | | | | | | | | |
| | |
Purchases of portfolio investments | | | (9,463 | ) | | | (8,589 | ) |
| | |
Disposals of portfolio investments | | | 10,185 | | | | 8,638 | |
| | |
Loans made | | | (2,285 | ) | | | (2,482 | ) |
| | |
Repayment of loans | | | 2,245 | | | | 1,576 | |
| | |
Cash provided by/(applied to) investing transactions | | | 682 | | | | (857 | ) |
| | |
Financing transactions | | | | | | | | |
| | |
Retirement of direct borrowings | | | (33,513 | ) | | | (36,932 | ) |
| | |
Issuance of direct borrowings | | | 42,382 | | | | 51,036 | |
| | |
Contributions restricted for capital and operations | | | 2,032 | | | | 1,942 | |
| | |
Repayment of liabilities under capital leases and public private partnerships | | | (65 | ) | | | (86 | ) |
| | |
Cash provided by financing transactions | | | 10,836 | | | | 15,960 | |
| | |
Increase in cash and cash equivalents | | | 934 | | | | 2,000 | |
| | |
Cash and cash equivalents at beginning of year | | | 14,391 | | | | 12,391 | |
| | |
Cash and cash equivalents at end of year | | $ | 15,325 | | | | $ 14,391 | |
The accompanying notes and schedules are part of these consolidated financial statements.
| | |
| | |
| 24 | | Government of Alberta | Annual Report 2019 – 2020 |
CONSOLIDATED FINANCIAL STATEMENTS
Notes to the Consolidated Financial Statements
| | |
| NOTE 1 | | SUMMARY OF SIGNIFICANT ACCOUNTING POLICIES AND REPORTING PRACTICES |
These consolidated financial statements are prepared in accordance with Canadian Public Sector Accounting Standards (PSAS).
The consolidated financial statements of the Province of Alberta (Province) include the accounts of organizations that meet the criteria of control as established under PSAS. The consolidated financial statements also include the accounts of the Offices of the Legislative Assembly.
A list of organizations included in these consolidated financial statements can be found in Schedule 17.
| | (b) | METHOD OF CONSOLIDATION |
The accounts of government sector entities, except those designated as government business enterprises, are consolidated using the line-by-line method. Under this method, accounting policies of the consolidated entities are adjusted to conform to government accounting policies and the results of each line item in their financial statements (revenue, expense, assets and liabilities) are included in the Province’s results. Revenue, expense, capital, investing and financing transactions, as well as related asset and liability balances between consolidated entities have been eliminated.
Schools and some post-secondary institutions, government business enterprises and government organizations have year ends that are other than March 31. The significant transactions of these organizations that have occurred during the period between their year ends and the Province’s year end of March 31, 2020, have been recorded in these financial statements. Organizations that the Province controls for reporting purposes through its consolidated organizations, but that do not meet the materiality threshold of $6 million in assets, liabilities, revenues or expenses after eliminating inter-entity transactions and balances, are not consolidated in these financial statements. These organizations are reviewed annually to determine if they meet the materiality threshold and after two years of exceeding the threshold will be considered for consolidation.
The accounts of provincial agencies designated as government business enterprises (Schedule 8) are accounted for on the modified equity basis, with the equity being computed in accordance with International Financial Reporting Standards (IFRS). Under the modified equity method, the accounting policies of government business enterprises are not adjusted to conform to those of the government sector entities. Inter-entity revenue and expense transactions and related asset and liability balances are not eliminated except for inter-entity gains and losses, which are eliminated on assets and liabilities remaining within the government reporting entity at the financial statement date.
| | (c) | BUDGET AND LEGISLATIVE AUTHORITY |
PSAS require that financial statements contain a comparison of the actual and budgeted results for the year. The Province’s fiscal plan is prepared in accordance with the Fiscal Planning and Transparency Act consistent with the scope and accounting policies used in the Province’s consolidated financial statements. The Fiscal Plan documents, which describe the Province’s budget for the 2020 fiscal year, were tabled in the Legislature on October 24, 2019.
| | |
| Government of Alberta | Annual Report 2019 – 2020 | | 25 |
CONSOLIDATED FINANCIAL STATEMENTS
| | (d) | FUTURE CHANGES IN ACCOUNTING STANDARDS |
The Public Sector Accounting Board has extended the effective dates for the adoption of the accounting standards in response to the COVID-19 pandemic. The effective dates of PS 3450 Financial Instruments and PS 3280 Asset Retirement Obligations have been extended to April 1, 2022, and the effective date of PS 3400 Revenue has been extended to April 1, 2023. The Province has not yet adopted these standards. The Province is currently assessing the impact of these standards on the consolidated financial statements.
PS 3450 Financial Instruments
Adoption of this standard requires corresponding adoption of PS 2601 Foreign Currency Translation, PS 1201 Financial Statement Presentation and PS 3041 Portfolio Investments in the same fiscal period. These standards provide guidance on: recognition, measurement and disclosure of financial instruments; standards on how to account for and report transactions that are denominated in a foreign currency; general reporting principles and standards for the disclosure of information in financial statements; and how to account for and report portfolio investments. The Public Sector Accounting Board issued an exposure draft in January 2019 and proposed narrow scope amendments to this standard. The exposure draft was approved by the Board on December 13, 2019. The amendments include changes to the accounting treatment of bond repurchase transactions, transitional provisions, and other minor improvements.
The Province, including all government components, except for government organizations and some regulated funds that manage their investments on a fair value basis, have not yet adopted this standard.
Items within the scope of the financial instruments section are assigned to one of the following measurement categories: fair value, cost or amortized cost. Fair value measurement will apply to derivatives and portfolio investments in equity instruments that are quoted in an active market. Also, when groups of financial assets and financial liabilities are managed on a fair value basis, they may be reported on that basis. Other financial assets and financial liabilities will generally be measured at cost or amortized cost. Until an item is derecognized, gains and losses arising due to fair value remeasurement will be reported in the Consolidated Statement of Remeasurement Gains and Losses.
PS 3280 Asset Retirement Obligations
This standard provides guidance on how to account for and report liabilities for retirement of tangible capital assets.
PS 3400 Revenue
This standard provides guidance on how to account for and report revenue, and specifically, it differentiates between revenue arising from exchange and non-exchange transactions.
| | (e) | CHANGE IN ACCOUNTING POLICY |
The Province retroactively changed its accounting policy for reporting of third-party investment costs to align expense reporting with peers and better reflect costs associated with management of investments. This change had no impact to the annual deficit or net assets. Comparative figures have been restated to present actuals on the same basis with current year figures. As a result of this change, the Province’s planned results for total revenues and total expenses have been reduced by $46 million from that reported in the 2019-23 Fiscal Plan, with no overall impact to the annual deficit. The effect of these changes has been reported on the Consolidated Statement of Operations and Schedules 1, 2 and 3.
| | |
| | |
| 26 | | Government of Alberta | Annual Report 2019 – 2020 |
CONSOLIDATED FINANCIAL STATEMENTS
| | (f) | BASIS OF FINANCIAL REPORTING |
Revenues
All revenues are reported on the accrual basis of accounting. Cash received for which goods or services have not been provided by year end is recognized as unearned revenue and recorded in accounts payable and other accrued liabilities.
The provincial tax system is predicated on self-assessment where taxpayers are expected to understand the tax laws and comply with them. This has an impact on the completeness of tax revenues when taxpayers fail to comply with tax laws, for example, if they do not report all of their income. The Province has implemented systems and controls in order to detect and correct situations where taxpayers are not complying with the various Acts it administers. These systems and controls include performing audits of taxpayer records when determined necessary. However, such procedures cannot identify all sources of unreported income or other cases of non-compliance with tax laws. The Province does not estimate the amount of unreported tax.
Tax revenues are reported net of applicable tax concessions. Tax concessions are defined as tax credits that provide relief to taxpayers from taxes previously paid or currently owing.
Tax credits that provide a financial benefit through the tax system but do not change a taxpayer’s tax liability amount are defined as transfers through the tax system and reported as expenses.
Personal income tax is recognized on an accrual basis based on an economic estimate of the various components of personal income tax for the fiscal year. Gross personal income growth for the taxation year is a key component of the estimate for the fiscal year.
Corporate income tax revenue is recognized when installments are received from taxpayer corporations. A receivable is established for tax assessments that are outstanding. Revenue and tax receivables will be adjusted in the year in which any additional information becomes available from resulting audits, appeals and court decisions. Corporate income tax refunds payable are accrued based primarily on the prior year’s corporate income tax refunds paid on assessments. Corporate income tax receipts from corporations in anticipation of an upward reassessment of Alberta income tax payable are described as corporate income tax receipts in abeyance and recognized as accounts payable and other accrued liabilities.
The Province calculates an allowance for corporate income taxes based on the difference between the actual corporate income tax receivable and the estimate of the collectability. The adjustment to the allowance is recorded as an expense. The adjustment may increase or decrease the allowance as tax receivables are revalued in subsequent years based on resulting audits, appeals and court decisions.
Other taxes are recognized during the period in which the taxable event occurs and when authorized by legislation.
The provincial royalty system is predicated on self-reporting where the petroleum and natural gas industry is expected to understand the relevant energy legislation (statutes and regulations) and comply with them. This has an impact on the completeness of revenue when the petroleum and natural gas industry does not fully meet the legislative requirements, for example, by reporting inaccurate or incomplete production data. The Province has implemented systems and controls in order to detect and correct situations where the petroleum and natural gas industry has not complied with the various Acts and Regulations the Province administers. These systems and controls, based on areas of highest risk, include performing audits of the petroleum and natural gas industry records when determined necessary. The Province does not estimate the effect of misreported revenue. Any impacts on revenue of refiling by industry are recognized in the year of refiling.
| | |
| Government of Alberta | Annual Report 2019 – 2020 | | 27 |
CONSOLIDATED FINANCIAL STATEMENTS
Royalty revenues are reported net of expenses incurred by provincial oil and gas royalty reduction programs. These programs aim to encourage industry to produce from wells which otherwise would not be economically productive.
Bitumen royalty is determined based on revenues from production sold by projects less the costs of that production and costs of selling the Crown’s royalty share. Crude oil and natural gas royalties are determined based on monthly production. Revenue is recognized when the resource is produced by the mineral right holders. Revenue from bonuses and sales of Crown leases is recognized when the Crown leases are sold.
Transfers from the Government of Canada include grants and entitlements. Grants for capital purposes and donated assets with restrictions for their use are recognized as deferred capital contributions. Grants for operating purposes with stipulations for their use are recognized as deferred operating contributions. Entitlements relate to significant intergovernmental transfers where authorization and eligibility criteria have been met by March 31 and amounts can be reasonably estimated. Entitlements with restrictions for their use that create an obligation are recognized as deferred contributions. Deferred contributions are recognized as revenue in the Consolidated Statement of Operations based on relevant stipulations of the transfer taken together with the actions and communications of the Province. All other grants and entitlements, without stipulations for their use, are recognized as revenue in the Consolidated Statement of Operations when authorized and eligibility criteria, if any, are met.
Endowment contributions, matching contributions and associated investment income allocated for preservation of endowment capital purchasing power are recognized as other revenue in the Consolidated Statement of Operations in the period in which they are received.
Expenses
Expenses represent the cost of resources consumed during the year on government operations. Expenses include amortization of tangible capital assets, debt servicing costs and expenses incurred in accordance with the terms of approved grant programs. Grants are recognized as expenses when authorized, eligibility criteria, if any, are met and a reasonable estimate of the amounts can be made.
Pension expenses comprise the cost of pension benefits earned by employees during the year, interest on the Province’s share of the unfunded pension liabilities, and the amortization of deferred adjustments arising from experience gains and losses and changes in actuarial assumptions over the expected average remaining service life of employees. Pension recovery represents the change in pension liabilities. Schedule 12 provides additional information on the components of pension expenses and liabilities.
In the Consolidated Statement of Operations, pension costs of government sector entities which are funded are included in expenses by function and costs which have not been funded are recognized as pension provisions.
Costs arising from obligations under guarantees and indemnities are recognized as expenses when management determines that the Province will likely be called upon to make payment. The expense represents management’s best estimate of future payments less recoveries.
The estimated increase or decrease for the year in accrued employee vacation entitlements is recognized in the related expense function.
| | |
| | |
| 28 | | Government of Alberta | Annual Report 2019 – 2020 |
CONSOLIDATED FINANCIAL STATEMENTS
Financial Assets
Financial assets are the Province’s financial claims on external organizations and individuals, as well as cash and inventories for resale at year end.
Cash includes deposits in banks and cash-in-transit. Cash equivalents include directly held interest-bearing securities with terms to maturity of primarily less than three months.
Accounts receivable is recognized at the lower of cost or net recoverable value. A valuation allowance is recognized when recovery is uncertain.
Portfolio investments are recognized at cost. Cost includes the amortization of a discount or premium using the straight-line method over the life of the investments. Realized gains and losses on disposal of these investments are included in calculating the net operating results for the year. If an investment loses value that is other than a temporary decline, its recognized value is reduced to reflect the loss. The reduced value is deemed to be the new cost.
Portfolio investments restricted for endowments (Schedule 7) are from donors who have placed restrictions on their contributions to the endowment funds, for example, capital preservation. The principal restriction is that the original contribution should be maintained intact in perpetuity. Other restrictions may include spending investment income earned by endowments for specific operational or capital purposes, or capitalizing a certain amount of investment income to maintain and grow the real value of endowments.
Loans are recognized at cost less any discounts and allowance for credit loss. Where there is no longer reasonable assurance of timely collection of the full amount of principal and interest of a loan, a provision for credit loss is made and the carrying amount of the loan is reduced to its estimated realizable amount.
Inventories for resale representing the Province’s share of royalty oil in feeder and trunk pipelines are recognized at the lower of cost or net realizable value. Other inventories for resale are valued at the lower of cost, determined on a first-in, first-out basis, and estimated net realizable value.
Liabilities
Liabilities represent present obligations of the Province to external organizations and individuals arising from past transactions or events occurring before year end, the settlement of which is expected to result in the future sacrifice of economic benefits. They are recognized when there is an appropriate basis of measurement and management can reasonably estimate the amount.
Coal phase-out agreements liabilities are valued at the net present value of the future payments, discounted using the Province’s borrowing rate for long term debt at the time of signing the agreements.
Debentures included in debt are recognized at the face amount of the issue less unamortized discount, which includes issuance and hedging costs.
Income or expense on derivatives used to manage interest rate or foreign currency exposure is recognized as an adjustment to debt servicing costs.
Public private partnerships (P3) are legally-binding contracts between the Province and one or more public/private/not-for-profit partners for the provision of assets and the delivery of services that allocates responsibilities and business risks among various partners.
| | |
| Government of Alberta | Annual Report 2019 – 2020 | | 29 |
CONSOLIDATED FINANCIAL STATEMENTS
The Province accounts for P3 projects in accordance with the substance of the underlying agreements. These agreements are accounted for in the same way as capital leases as follows:
| | • | The capital asset is valued at the total of progress payments made during construction and net present value of the future payments, discounted using the Province’s estimated borrowing rate for long term debt at the time of signing the P3 agreement. |
| | • | The liability is valued at the net present value of the future payments, discounted using the Province’s borrowing rate for long term debt at the time of signing the P3 agreement. |
| | • | During construction, the capital asset (classified as work-in-progress) and the corresponding liability are recorded based on the estimated percentage complete or the term of the agreement. |
| | • | Amortization on a straight-line basis over the estimated useful life commences when the asset is put into service. |
The value of pension liabilities and associated changes during the year are based on an actuarial extrapolation of the most recent actuarial valuation. This valuation technique uses the projected benefit method pro-rated on service and management’s best estimate as at the extrapolation date of various economic and non-economic assumptions. Where the Province is a participating employer in the plan, experience gains and losses to the extent of the Province’s employer share are amortized over the estimated average remaining service life of employees. Where the Province has a liability for pre-1992 pension obligations, experience gains or losses are recognized in the year incurred.
Liabilities also include:
| | • | All financial claims payable by the Province at year end; |
| | • | Contingent liabilities where future liabilities are likely and the amount can be reasonably estimated; |
| | • | Estimates of the Province’s liabilities for contaminated sites; |
| | • | Accrued employee vacation entitlements; |
| | • | Asset retirement obligations recognized by some organizations based on their accounting policies or terms of contract; |
| | • | Unspent deferred contributions for capital and operating purposes; and |
| | • | Spent deferred capital contributions which are excluded from net debt. |
Non-financial Assets
Non-financial assets include tangible capital assets, prepaid expenses, inventories of supplies and other non-financial assets.
Tangible capital assets are valued at cost less accumulated amortization. Cost is the gross amount of consideration given up to acquire an asset and includes all costs directly attributable to acquisition, construction, development or betterment of the tangible capital asset. Amortization is provided on a straight-line basis over estimated useful lives of the assets (Schedule 14). The annual amortization costs are allocated to the functions of the Province that employ those assets and are reported on the Consolidated Statement of Operations.
Prepaid expenses are recorded at cost and amortized based on the terms of the agreement.
Inventories of supplies are valued at the lower of cost, determined on a weighted average or first-in, first-out basis, and replacement cost.
| | |
| | |
| 30 | | Government of Alberta | Annual Report 2019 – 2020 |
CONSOLIDATED FINANCIAL STATEMENTS
Other Assets
Intangible assets, collections of historical artifacts, provincial, national and international works of art and tangible capital assets acquired by right, such as Crown lands, forests, water and mineral resources, are not included in the Consolidated Statement of Financial Position as a reasonable estimate of the amounts involved cannot be made.
Derivative Contracts
Derivative contracts are held directly for hedging purposes to manage specific loan receivable and debt related risks, or indirectly through pooled funds included in portfolio investments. Types of derivative contracts and their classification in these financial statements are described further in Note 3.
Derivative contracts used for hedging purposes, where there is an underlying matching asset or liability, are recognized at cost plus accrued interest. The estimated amounts receivable or payable related to derivative contracts are included in accrued interest receivable or payable respectively. Derivative contracts without an underlying matching asset or liability are recognized at fair value and are included in portfolio investments. Gains and losses from derivative contracts are included in investment income or debt servicing costs, based on their intended purpose.
Foreign Currency
Unhedged monetary items denominated in a foreign currency are translated at the year end rate of exchange. Hedged assets and liabilities denominated in foreign currencies are translated at the rate of exchange established by the terms of the hedging agreement.
Foreign currency transactions are translated into Canadian dollars using the average exchange rate for the day, except for hedged foreign currency transactions, which are translated at exchange rates established by the terms of the hedging agreement.
Exchange gains and losses that arise on translation of fixed-term foreign currency denominated monetary items are deferred and amortized over the life of the contract.
Amortization of deferred exchange gains and losses and other exchange differences on unhedged transactions are included in the determination of the net operating results for the year.
Measurement Uncertainty
Estimates are used in accruing revenues, expenses, assets and liabilities in circumstances where the actual results are unknown at the time the financial statements are prepared. Uncertainty in the determination of the amount at which an item is recognized in financial statements is known as measurement uncertainty. Such uncertainty exists when there is a variance between the recognized amount and another reasonably possible amount, whenever estimates are used. Measurement uncertainty that is material to these financial statements exists in the accrual of personal and corporate income taxes; royalties derived from non-renewable resources; health transfers; private investments, inflation sensitive and alternative investments; loans receivable; and pension liabilities.
The impact of the COVID-19 pandemic, changes to oil prices and stock market add an additional level of uncertainty for the measurement of certain accrued revenues, expenses, assets and liabilities recorded in these financial statements. While estimates used for reporting reflects best available information, it is reasonably possible that changes of conditions, in the near term, could have a material impact on the amounts recognized or disclosed. These include uncertainties related to income taxes, other taxes, allowances recognized for loans receivable, the ability of the
| | |
| Government of Alberta | Annual Report 2019 – 2020 | | 31 |
CONSOLIDATED FINANCIAL STATEMENTS
counterparties to comply with the contractual requirements of the existing derivative contracts and their ability to manage the liquidity risk related to the contractual payments of principal and interest on existing debt and the calculation of the pension liability, which utilized the estimated fair value of pension plan assets as at March 31, 2020.
Personal income tax revenue (Schedule 1) of $11,244 million (2019: $11,874 million) is subject to measurement uncertainty due primarily to the use of economic estimates of personal income growth. Personal income growth is inherently difficult to estimate due to subsequent revisions to personal income data. The current fiscal year estimate of primary household income growth used in determining personal income tax is 3.1% for 2019 calendar year and negative 7% for 2020 calendar year (the 2019 estimate was 3.2% for 2019 calendar year and 3.3% for 2018 calendar year). Based on historical data, there is an uncertainty of plus or minus $566 million (2019: $586 million) in the personal income tax revenue estimate.
Corporate income tax revenue (Schedule 1) of $3,981 million (2019: $4,702 million), the related amount receivable (Schedule 5) of $1,216 million (2019: $1,048 million) and refunds payable (Schedule 10) of $744 million (2019: $500 million) are subject to measurement uncertainty due to estimates of amounts not yet assessed based on cash received as well as taxpayer objections to assessed taxes (Note 7). Estimates are based on cash received from tax installments, payments with a filed return, current year refunds paid, and amounts assessed where payment has not yet been received. The methodology of calculating the refund liability estimate is back tested and the estimate is revised as necessary. Final assessed taxes may differ from original estimates due to reassessments in subsequent years. The impact of future reassessments cannot reasonably be determined. The amounts included in the corporate income tax accounts receivable are evaluated for collectability annually. A valuation allowance of $122 million (2019: $119 million) is the reduction to receivables to determine the estimated net recoverable amount. The methodology to calculate the allowance is back tested and revised as required.
Bitumen royalty of $4,089 million (2019: $3,214 million) and natural gas and by-products revenue (Schedule 1) of $371 million (2019: $536 million) are subject to measurement uncertainty. For projects from which bitumen royalty is paid and the project has reached payout, the royalty rate used to determine the royalties is based on the average price of West Texas Intermediate (WTI) crude oil in Canadian dollars for the calendar year. Royalty rates will start at 25% of net profits when oil is priced at fifty-five dollars per barrel or less, and increase to a maximum of 40% of net profits when oil is priced at one hundred and twenty dollars or more. Payout is defined at the first date at which the cumulative revenue of a project first equals the cumulative cost of the project. Natural gas and by-products royalty is calculated based on allowable costs incurred by the royalty payers and production volumes that are reported to the Province by royalty payers. Industry may modify their royalty and gas cost allowance for non-statute barred years. The Province estimates what the costs, volumes and royalty rates for the fiscal year should be based on statistical analysis of industry data. Based on historical data, changes to natural gas and by-products revenues resulted in a $49 million increase (2019: $69 million increase).
The fair value of private equities, inflation sensitive and alternative investments (Schedule 6) of $9,234 million (2019: $10,160 million) are subject to measurement uncertainty as the fair value may differ significantly from the values that would have been used had a ready market for these investments existed.
| | |
| | |
| 32 | | Government of Alberta | Annual Report 2019 – 2020 |
CONSOLIDATED FINANCIAL STATEMENTS
Loans receivable (Schedule 9) relating to net student loans receivable of $3,192 million (2019: $2,884 million) made under the authority of the Student Loan Act are subject to measurement uncertainty. Allowances totaling $392 million (2019: $341 million) have been recognized for impaired loans, loan subsidies, and repayment assistance. The Province has made certain estimates in the following areas:
| | • | Recovery and default rates in the determination of the allowance for impaired loans; |
| | • | Blended student lending rate; the annual average provincial borrowing rate; the average repayment period, default rate, and repayment assistance rate in the determination of the allowance for loan subsidy; and |
| | • | Future loan amounts approved for repayment assistance and loan forgiveness rates in the determination of the allowance for repayment assistance. |
Pension liabilities (Schedule 12) of $8,918 million (2019: $9,252 million) are subject to measurement uncertainty because the actual experience of a plan may differ significantly from assumptions used in the calculation of the pension liabilities.
Estimates of contingent liabilities for contaminated sites are subject to measurement uncertainty because the existence and extent of contamination, the responsibility for clean-up, and the timing and cost of remediation cannot be reasonably estimated in all circumstances. The degree of measurement uncertainty cannot be reasonably determined.
Some of the government organizations have year ends that are other than March 31. The accounts of these organizations are consolidated based on the results of their latest financial year end. Estimation of transactions for the period between their year ends and March 31 is therefore subject to measurement uncertainty.
While best estimates have been used for reporting items subject to measurement uncertainty, management considers that it is possible, based on existing knowledge, that changes in future conditions in the near term could require a material change in the recognized amounts. Near term is defined as a period of time not to exceed one year from the date of the financial statements.
Segment Disclosure
A segment is defined as a distinguishable activity or group of activities for which it is appropriate to separately report financial information. Segment information reflects the existing accountability framework for government and the way in which operations are managed. Inter-segment transfers are measured at carrying value. Segment information is reported in Schedules 1, 2, 3, 8 and 14 and is based on accountability, budgetary practices and governance relationships within the Province. Additional information is provided in ministry and other entity annual reports.
| | |
| NOTE 2 | | VALUATION OF FINANCIAL ASSETS AND LIABILITIES |
Fair value is the amount of consideration agreed upon in an arm’s length transaction between knowledgeable, willing parties who are under no compulsion to act.
Due to their short-term nature, the fair values of cash and cash equivalents, accounts receivable and accounts payable and other accrued liabilities are estimated to approximate their carrying value.
| | |
| Government of Alberta | Annual Report 2019 – 2020 | | 33 |
CONSOLIDATED FINANCIAL STATEMENTS
The methods used to determine the fair values of portfolio investments are explained in the following paragraphs:
| | • | Public fixed-income securities and equities are valued at the year end closing sale price or the average of the latest bid and ask prices quoted by an independent securities valuation company. |
| | • | Mortgages and certain non-public provincial debentures are valued at the net present value of future cash flows. These cash flows are discounted using appropriate interest rate premiums over similar Government of Canada benchmark bonds trading in the market. |
| | • | The fair value of alternative investments, including absolute return strategy investments, investments in limited partnerships, private investment funds, private equities and securities with limited marketability, is estimated using methods such as cost, discounted cash flows, earnings multiples, prevailing market values for instruments with similar characteristics and other pricing models as appropriate. |
| | • | Real estate investments are reported at their most recent appraised value, net of any liabilities against the real property. Real estate properties are appraised annually by qualified external real estate appraisers using methods such as replacement cost, discounted cash flows, earnings multiples, prevailing market values for properties with similar characteristics and other pricing models as appropriate. |
| | • | As quoted market prices are not readily available for private and alternative investments and private real estate, estimated fair values may not reflect amounts that could be realized upon immediate sale, or amounts that may ultimately be realized. Accordingly, estimated fair values may differ significantly from the values that would have been used had a ready market existed for these investments. |
The fair value of derivative contracts relating to portfolio investments is disclosed in Note 3. The estimated amount receivable or payable from derivative contracts at the reporting date is determined by the following methods:
| | • | Equity and bond index swaps are valued based on changes in the appropriate market based index net of accrued floating rate interest. Equity index and interest rate future contracts are valued based on quoted market prices. Forward foreign exchange contracts are valued based on discounted cash flows using current market yields and current forward exchange rates. Interest rate swaps and cross currency interest rate swaps are valued based on discounted cash flows using current market yields and exchange rates. Credit default swaps are valued based on discounted cash flows using current market yields and calculated default probabilities. Options to enter into interest rate swap contracts are valued based on discounted cash flows using current market yields and volatility parameters which measure change in the underlying swap. Warrants and rights are valued at the year end closing sale price or the average of the latest bid and ask prices quoted by an independent securities valuation company. |
| | |
| NOTE 3 | | FINANCIAL RISK MANAGEMENT AND DERIVATIVES |
The investments that the Province holds are exposed to credit risk and market risk. Market risk is comprised of foreign currency risk, interest rate risk and price risk. In order to earn the best possible return at an acceptable level of risk, the Province has established policies for the asset mix of its investment portfolios.
| | |
| | |
| 34 | | Government of Alberta | Annual Report 2019 – 2020 |
CONSOLIDATED FINANCIAL STATEMENTS
The Province reduces its investment risk by holding many different types of assets, investing in securities from various governments and companies in different industries and countries, having quality constraints on fixed income instruments, and restricting amounts exposed to countries designated as emerging markets.
A large percentage of the Province’s investments are in the Alberta Heritage Savings Trust Fund (Heritage Fund). The objective is to invest in a diversified portfolio to maximize long-term returns at an acceptable level of risk.
Investments in the Alberta Heritage Foundation for Medical Research Endowment Fund, the Alberta Heritage Scholarship Fund and the Alberta Heritage Science and Engineering Research Endowment Fund are managed to provide income, which can be used by the funds to fulfill their respective mandates for the purpose of making grants to students and to researchers in the fields of medicine, science and engineering.
Cash and cash equivalents are used to repay debt as it matures, to provide funding for the capital and fiscal plans, and to help protect operating and capital spending from short-term declines in revenue and the costs of emergencies, disasters and other unforeseen cash requirements.
The objective of the Province’s debt management activity is to raise funding for the Province and its agencies in a cost-effective manner, while ensuring that borrowed funds can be serviced and repaid as scheduled.
The Province’s debt management goals include: ensuring sufficient liquidity to meet the Province’s financial commitments and withstand market disruptions, providing stable and low-cost funding for the Province, maintaining access to both domestic and global debt markets to provide financing and liquidity for the Province and strategically structuring the debt portfolio to allow for prudent management of maturities and refinancing.
In order to achieve this objective, the Province manages the following risks: interest rate risk, foreign currency risk, credit risk, liquidity risk, operational risk, settlement risk and refinancing risk. The Province manages these risks within approved policy guidelines. The management of these risks and the policy guidelines apply to the Province’s debt, excluding debt raised to fund requirements of provincial corporations. The debt of provincial corporations is managed separately in relation to their stated requirements and respective authorities.
The Province has decided that the most effective liability risk management strategy is to allow existing debt instruments to mature in accordance with their terms (Schedule 11).
The Province uses various types of derivative contracts held directly to manage exposure to interest rate risk, currency exchange risk and credit risk and indirectly through pooled investment funds to gain access to equity markets and enhance returns.
In order to mitigate credit risk, credit support annex (CSA) agreements have been signed with most counterparties to derivative contracts. The CSA agreements allow for the Province to receive collateral in the form of cash or securities when the net position with a counterparty is favourable, based on established thresholds. Conversely, if the net position with a counterparty is unfavourable, the Province is required to pay or post cash or securities with the counterparty. Collateral received is reported under accounts payable (Schedule 10) and collateral pledged is reported under accounts receivable (Schedule 5).
| | |
| Government of Alberta | Annual Report 2019 – 2020 | | 35 |
CONSOLIDATED FINANCIAL STATEMENTS
The following is a summary of the fair values of the Province’s derivative contracts by type:
| | | | | | |
| | | 2020 | | 2019 | |
| | | Fair | | Fair | |
| | | value (a) (b) (c) | | value (a) (b) (c) | |
| | In | | | millions | |
| | |
Interest rate derivatives (d) | | $ (992) | | $ | (552 | ) |
| | |
Equity-based derivatives (e) | | (727) | | | 74 | |
| | |
Foreign currency derivatives (f) | | 864 | | | (270 | ) |
| | |
Credit risk derivatives (g) | | - | | | 3 | |
| | |
Net fair value of derivative contracts (h) | | $ (855) | | $ | (745 | ) |
| | (a) | Current credit exposure is represented by the current replacement cost of all outstanding contracts in a favourable position (positive fair value). The Province monitors counterparty risk exposure and actively seeks to mitigate counterparty risk by requiring that counterparties collateralize mark-to-market gains. |
| | (b) | The method of determining the fair value of derivative contracts is described in Note 2. |
| | (c) | Includes interest rate derivatives of Alberta Capital Finance Authority with a net fair value of $(849) million (2019: $(544) million) of which 0.3% will mature in under one year, (14.0)% in one to three years and 113.7% in over three years. |
As at March 31, 2020, for directly held derivative contracts, $574 million (2019: $304 million) in cash collateral on net unfavourable positions has been pledged by the Province (see Schedule 5), and $1,357 million (2019: $nil) in cash collateral on net favourable derivative contract positions has been received by the Province (Schedule 10).
Portfolio investments reported include exposure to margin and collateral amounts held in pooled funds. At March 31, 2020, deposits in futures contracts margin accounts totalled $412 million (2019: $38 million). Cash and non-cash collateral for derivative contracts pledged and received, respectively totalled to $912 million (2019: $68 million) and $nil (2019: $nil).
| | (d) | Interest rate derivatives allow the Province to exchange interest rate cash flows (fixed, floating and bond index) based on a notional amount. Interest rate derivatives primarily include interest rate swaps, cross currency interest rate swaps, bond index swaps, futures contracts and options. |
| | (e) | Equity-based derivatives include equity swaps, volatility swaps and variance swaps. Equity swaps are contracts where one counterparty agrees to pay or receive from the other, cash flows based on changes in the value of an equity index, a basket of stocks, or a single stock in exchange for a return based on a fixed or floating interest rate or the return on another instrument. Volatility swaps are contracts where cash flows are based on the difference between implied volatility and realized volatility of a specified equity index, a basket of stocks, or a single stock applied to a notional amount. Variance swaps are contracts where cash flows are based on the difference between the variance of a specified equity index, a basket of stocks or a single stock and a fixed amount specified in the contract. Rights, warrants, futures and options are also included as equity-based derivatives. |
| | (f) | Foreign currency derivatives include contractual agreements to exchange specified currencies at an agreed upon exchange rate and on an agreed settlement date in the future. |
| | (g) | Credit risk derivatives include credit default swaps allowing the Province to buy and sell protection on credit risk inherent in a bond. A premium is paid or received, based on a notional amount, in exchange for a contingent payment should a defined credit event occur with respect to the underlying security. |
| | (h) | The fair value of derivative contracts represents the amount that the Province would receive (positive fair value) or pay (negative fair value) in the event contracts were terminated at year end. |
The derivatives of government business enterprises are disclosed in Schedule 8.
| | |
| | |
| 36 | | Government of Alberta | Annual Report 2019 – 2020 |
CONSOLIDATED FINANCIAL STATEMENTS
| | |
| NOTE 4 | | CONTRACTUAL RIGHTS |
Contractual rights are rights of the Province to economic resources arising from contracts or agreements that will result in both assets and revenues in the future when the terms of those contracts or agreements are met.
| | | | |
| | | 2020 | | 2019
Restated (a) |
| | | In | | millions |
| | |
Contractual rights from operating leases, contracts and programs | | $ 1,547 | | $ 1,620 |
Contractual rights from capital lease principal and interest payments | | 31 | | 23 |
| | | $ 1,578 | | $ 1,643 |
| | (a) | The 2018-19 amount was increased by $294 million due to reassessment of agreements. |
Estimated amounts that will be received or receivable for each of the next five years and thereafter are as follows:
| | | | | | | | | | | | |
| | | Operating leases, contracts | | | Capital lease principal and | | | Total | |
| | | and programs | | | interest payments | |
| | | | |
| | | In millions | |
2020-21 | | $ | 242 | | | $ | 1 | | | $ | 243 | |
2021-22 | | | 206 | | | | 1 | | | | 207 | |
2022-23 | | | 171 | | | | 1 | | | | 172 | |
2023-24 | | | 161 | | | | 1 | | | | 162 | |
2024-25 | | | 154 | | | | 1 | | | | 155 | |
Thereafter | | | 613 | | | | 26 | | | | 639 | |
| | | | |
| | | $ | 1,547 | | | $ | 31 | | | $ | 1,578 | |
The Province has contingent assets for fine revenues. Fine revenues are recognized at the point of conviction, which excludes certain outstanding federal statute and provincial statute fines that are satisfied by means other than cash payment. At March 31, 2020, the estimate of contingent assets for fines issued is $27 million (2019: $27 million).
| | |
| Government of Alberta | Annual Report 2019 – 2020 | | 37 |
CONSOLIDATED FINANCIAL STATEMENTS
| | |
| NOTE 6 | | CONTRACTUAL OBLIGATIONS AND COMMITMENTS |
Contractual obligations represent a legal obligation of the Province to others and will become liabilities in the future when the terms of the contract are met.
| | | | | | | | |
| | | 2020 | | | 2019 | |
| | | Restated (a) | |
| | | In | | | millions | |
| | |
Obligations under operating leases, contracts and programs (a) | | $ | 34,640 | | | $ | 36,089 | |
Obligations under capital leases and public private partnerships | | | | | | | | |
Operations and maintenance payments | | | 3,585 | | | | 4,058 | |
Capital payments | | | 230 | | | | 327 | |
Interest payments | | | 95 | | | | 193 | |
| | | $ | 38,550 | | | $ | 40,667 | |
| | (a) | In 2019-20, the Province reassessed for disclosure purposes, contracts in relation to long-term care, home-care services and other services provided by third-parties. The amounts related to these obligations are $15 billion (2019: $16 billion). |
Estimated payment requirements for each of the next five years and thereafter are as follows:
| | | | | | | | | | | | | | | | | | | | |
| | | Operating leases, | | | Operations and | | | | | | | | | | |
| | | contracts and | | | maintenance | | | Capital payments | | | Interest payments | | | Total | |
| | | programs | | | payments | | | | | | | | | | |
| | | | | | | | | In millions | | | | | | | |
2020-21 | | $ | 9,949 | | | $ | 81 | | | $ | 9 | | | $ | 2 | | | $ | 10,041 | |
2021-22 | | | 5,722 | | | | 101 | | | | 15 | | | | 4 | | | | 5,842 | |
2022-23 | | | 4,294 | | | | 114 | | | | 5 | | | | 5 | | | | 4,418 | |
2023-24 | | | 2,213 | | | | 121 | | | | 58 | | | | 5 | | | | 2,397 | |
2024-25 | | | 1,731 | | | | 126 | | | | 3 | | | | 5 | | | | 1,865 | |
Thereafter | | | 10,731 | | | | 3,042 | | | | 140 | | | | 74 | | | | 13,987 | |
| | | $ | 34,640 | | | $ | 3,585 | | | $ | 230 | | | $ | 95 | | | $ | 38,550 | |
Major commitments included in the above figures are commitments for capital construction contracts for health and education facilities and highways.
The Province has various commitments relating to the devolution of services or disposition of assets to the private sector. Those commitments include the performance of duties and obligations if the private sector organization fails to meet them.
The Province is encouraging companies to invest in the development of Alberta petrochemical facilities by providing a commitment of up to $1.6 billion in incentives through royalty credits, of which $650 million has been allocated to four projects.
The Province has outstanding approved undisbursed loan commitments of $234 million (2019: $216 million - restated).
The Province targets the development of renewable electricity generation capacity as part of its target of 30% renewable electricity by 2030. The Province has contracted with the Alberta Electric System Operator (AESO) to implement and administer the program. On December 17, 2018, the Province announced the results of rounds 2 and 3. Round 2 will deliver nearly 360 megawatts of wind generation at a weighted average bid price of approximately $38 per megawatt hour.
| | |
| | |
| 38 | | Government of Alberta | Annual Report 2019 – 2020 |
CONSOLIDATED FINANCIAL STATEMENTS
Round 3 will deliver nearly 400 megawatts of wind generation at a weighted average strike price of approximately $40 per megawatt hour.
On June 10, 2019, the Province advised the AESO that they will not be continuing with the Renewable Electricity Program (REP) and thus do not intend to proceed with additional competition rounds.
| | |
| NOTE 7 | | CONTINGENT LIABILITIES |
Set out below are details of contingent liabilities resulting from guarantees, indemnities and litigation, other than those reported as liabilities. Any losses arising from the settlement of contingent liabilities are treated as current year expenses.
| | (a) | GUARANTEES AND INDEMNITIES |
Guarantees are detailed below:
| | | | | | | | | | | | |
| | | 2020 | | | 2019 | | | Expiry date | |
| | | In | | | millions | | | | |
| | | |
Feeder Associations Guarantee Act | | $ | 81 | | | $ | 81 | | | | Ongoing | |
Agriculture Financial Services Act | | | 1 | | | | 6 | | | | Variable | |
| | | $ | 82 | | | $ | 87 | | | | | |
Authorized loan guarantee limits are shown below where applicable. Where authorized loan guarantee limits are not noted, the authorized limits decline as guaranteed or indemnified loans are repaid.
Guarantee programs under the following Acts are ongoing:
| | • | Feeder Associations Guarantee Act (authorized guarantee limit set by Order in Council is $100 million) and |
| | • | Agriculture Financial Services Act. |
The lender takes appropriate security prior to issuing a loan to the borrower, which is guaranteed by the Province. The security taken depends on the nature of the loan. Interest rates are negotiated with the lender by the borrower.
Included in the guarantees issued under the Agriculture Financial Services Act is $nil (2019: $3 million) guaranteed under the Alberta Flood Recovery Loan Guarantee Program (AFRLGP), which was established to assist Alberta businesses directly impacted by the June 2013 flood in Southern Alberta. Under the AFRLGP, the Province has entered into agreements with financial institutions guaranteeing repayment of up to 75% of loans issued under this program.
Through the Public Trustee Act, the Province also unconditionally guarantees the amount outstanding on a client’s guaranteed account as administered by the Office of the Public Guardian and Trustee. As at March 31, 2020, the potential liability of the Province based on the outstanding balance of the Client Guaranteed Accounts is $444 million (2019: $443 million).
The Province has an indemnity associated with the Canadian Blood Services (CBS). CBS has established two wholly-owned captive insurance corporations, CBS Insurance Company Limited (CBSI) and Canadian Blood Services Captive Insurance Company Limited (CBSE). CBSI provides insurance coverage up to $250 million with respect to risks associated with the operation of the
| | |
| | |
| Government of Alberta | Annual Report 2019 – 2020 | | 39 |
CONSOLIDATED FINANCIAL STATEMENTS
blood system. CBSE was capitalized in whole through funding from the provinces and territories (except Quebec), through a Captive Support Agreement (CSA) dated September 28, 2006, between the provinces, territories, and CBSE. Under the CSA, each of the provinces and territories provided their Pro Rata Share (as defined in the CSA) through an indemnity. Alberta’s Pro Rata Share is 13.1% of CBSE’s total capital amount, which amounts to $98 million. Authority for Alberta to provide the indemnity under the CSA is pursuant to section 5.05 of the Indemnity Authorization Regulation 22/1997, under the Financial Administration Act. The expense recognition criterion for the indemnity is notification from CBS that the indemnity is required. At March 31, 2020, no amount has been recognized for this indemnity.
The Province, through the Canadian Securities Administrators National Systems operations management and governance agreement, has committed to pay 25% of any shortfall from approved system operating costs that exceed revenues should there not be an accumulated operating surplus available to offset. As at March 31, 2020, the accumulated operating surplus is $184 million (2019: $173 million). Payments under guarantees are a statutory charge on the Province.
The Province has contingent liabilities with respect to various indemnities as permitted under the Financial Administration Act. The indemnified amount and corresponding liability cannot be reasonably estimated.
At March 31, 2020, the Province was involved in legal matters where damages are being sought. These matters give rise to contingent liabilities.
Accruals have been made in specific instances where it is likely that losses will be incurred based on a reasonable estimate. As at March 31, 2020, the total claimed amount for all likely claims is $263 million (2019: $231 million - restated), of which $248 million (2019: $218 million - restated) has been accrued as a liability. The resulting additional liability, if any, from likely claims in excess of the amounts accrued is not determinable.
The Province has been named in 763 (2019: 734 - restated) claims of which the outcome is not determinable. Of these claims, 543 (2019: 559 - restated) have specified amounts totaling $5.3 billion (2019: $4.1 billion - restated). The remaining 220 (2019: 175 - restated) claims have no amounts specified. The resolution of indeterminable claims may result in a liability, if any, that may be significantly lower than the claimed amount.
In addition, the Province has been named in 22 (2019: 22) claims in matters such as Aboriginal rights, Aboriginal title and treaty rights. In most cases, these claims have been filed jointly and severally against the Province and the Government of Canada and in some cases involve third parties. Of these claims, 10 (2019: 10) have specified amounts totaling $94 billion (2019: $94 billion) plus a provision for interest and other costs that are not determinable. The remaining 12 (2019: 12) claims have no amounts specified. In addition, there are four (2019: four) claims for treaty land entitlement for which the Province may have an obligation under the Natural Resources Transfer Agreement.
At March 31, 2020, 1,052 (2019: 958) corporate income tax files totaling $1,034 million (2019: $768 million) were under objection or dispute. The resulting loss, if any, cannot be reasonably estimated.
| | |
| | |
| 40 | | Government of Alberta | Annual Report 2019 – 2020 |
CONSOLIDATED FINANCIAL STATEMENTS
| | (d) | SURFACE RIGHTS BOARD CLAIMS |
The Surface Rights Board (Board) was established by the Surface Rights Act. The Province facilitates payments with “Direction to Pay” from the Board to the applicants for the rental recovery under Section 36 of the Act. As at March 31, 2020, $3 million (2019: $3 million) has been accrued as a liability. There is an estimated backlog of applications totaling $29 million. The outcome for all applications is not determinable.
| | (e) | ENVIRONMENTAL LIABILITIES |
The Province has identified various sites where contaminations exist and the level of contamination is either known or unknown at this time. As at March 31, 2020, $248 million (2019: $217 million - restated) has been recognized as environmental liabilities. No liability for remediation of other sites has been recognized as: the Province becoming responsible for these sites are not determinable; the Province does not expect to give up any future economic benefits; no reasonable estimate of the amount can be made; or a combination of the factors. The Province’s ongoing efforts to assess contaminated sites may result in additional environmental remediation liabilities related to newly identified sites, or changes in the assessments or intended use of existing sites. Any changes to the environmental liabilities will be accrued in the year in which they are assessed as likely and measurable.
| | |
| NOTE 8 | | TRUST AND OTHER FUNDS UNDER ADMINISTRATION |
Trust and other funds under administration are regulated and other funds consisting of public money over which the Legislature has no power of appropriation. They are not included in the consolidated financial statements because the Province has no equity in the funds and administers them for the purposes of various trusts. As at March 31, 2020, trust and other funds under administration are as follows:
| | | | | | | | |
| | | 2020 | | | 2019 Restated (b) |
| | | In | | | millions |
Public Sector Pension Plan Funds (a) | | $ | 8,528 | | | $ | 9,367 | |
The Workers’ Compensation Board Accident Fund | | | 413 | | | | 447 | |
Public Trustee | | | 602 | | | | 606 | |
Special Areas Trust Account | | | 314 | | | | 306 | |
Various Court Offices and Fines Distribution Trust | | | 154 | | | | 185 | |
Miscellaneous trust funds | | | 1,506 | | | | 1,958 | |
| | | $ | 11,517 | | | $ | 12,869 | |
| | (a) | Pursuant to the Joint Governance of Public Sector Pension Plans Act, plan funds for Local Authorities Pension Plan, Public Service Pension Plan and Special Forces Pension Plan were transitioned to each respective corporation (Schedule 12) as of March 1, 2019. The amounts for these plan funds are excluded. The assets of these plan funds are managed by Alberta Investment Management Corporation. |
| | (b) | The 2018-19 amount was increased by $42 million to reflect that the Province and a third-party trustee administer the Supplemental Employee Retirement Plan for Alberta Health Services ($32 million) and reassessment of the Health Benefit Trust of Alberta ($10 million). |
In addition to the above trust and other funds under administration, the Province holds cash and bank guarantees in the form of letters of credit and promissory notes in the amount of $2.2 billion (2019: $2.2 billion). The majority of these guarantees are held to assure satisfactory reclamation
| | |
| | |
| Government of Alberta | Annual Report 2019 – 2020 | | 41 |
CONSOLIDATED FINANCIAL STATEMENTS
of coal and oil sands operations, sand and gravel pits, landfills, hazardous waste management and hazardous recyclable facilities.
In response to the COVID-19 pandemic, the Province implemented various programs and publicly announced supports and financial relief to individuals, businesses and organizations. The Province has announced measures and initiatives to respond with public health measures and financial assistance as necessary.
The COVID-19 pandemic, combined with the collapse in global oil prices, resulted in severe reduction of economic activity and employment in Alberta. The Province implemented economic stimulus measures to support impacted businesses and individuals during this crisis.
The magnitude and duration of COVID-19 is uncertain, which makes it difficult to reliably measure the potential future impact on the Government’s financial position and operations. The Province continues to assess and monitor the impact of COVID-19 on its financial statements, including the likelihood of decreased revenues and increased expenses.
| | |
| Note 10 | | COMPARATIVE FIGURES |
Certain 2019 figures have been reclassified, where necessary, to conform to 2020 presentation.
| | |
| | |
| 42 | | Government of Alberta | Annual Report 2019 – 2020 |
CONSOLIDATED FINANCIAL STATEMENTS
Schedules to the Consolidated Financial Statements
| | | | | | | | | | | | |
| | | 2020 | | | 2019 | |
| | | Budget Restated (Notes 1 (c), (e)) | | | Actual | | | Actual Restated (Note 1 (e)) | |
| | | | | | In millions | | | | |
Income taxes | | | | | | | | | | | | |
Personal income tax | | $ | 11,990 | | | $ | 11,244 | | | $ | 11,874 | |
Corporate income tax | | | 4,177 | | | | 3,981 | | | | 4,702 | |
Interest and penalties on corporate income tax | | | - | | | | 126 | | | | 169 | |
| | | 16,167 | | | | 15,351 | | | | 16,745 | |
Other taxes | | | | | | | | | | | | |
Education property tax | | | 2,455 | | | | 2,475 | | | | 2,441 | |
Fuel tax | | | 1,397 | | | | 1,374 | | | | 1,394 | |
Tobacco tax and cannabis levy | | | 934 | | | | 881 | | | | 903 | |
Insurance taxes | | | 650 | | | | 660 | | | | 612 | |
Carbon levy | | | 175 | | | | 189 | | | | 1,324 | |
Tourism levy | | | 88 | | | | 88 | | | | 90 | |
Freehold mineral rights tax | | | 67 | | | | 75 | | | | 67 | |
Interest and penalties on other tax | | | - | | | | 5 | | | | 2 | |
| | | 5,766 | | | | 5,747 | | | | 6,833 | |
Non-renewable resource revenue | | | | | | | | | | | | |
Bitumen royalty | | | 4,682 | | | | 4,089 | | | | 3,214 | |
Crude oil royalty | | | 1,163 | | | | 1,175 | | | | 1,149 | |
Natural gas and by-products royalty | | | 362 | | | | 371 | | | | 536 | |
Bonuses and sales of Crown leases | | | 164 | | | | 120 | | | | 360 | |
Coal royalty, rentals and fees | | | 156 | | | | 182 | | | | 170 | |
| | | 6,527 | | | | 5,937 | | | | 5,429 | |
Transfers from Government of Canada | | | | | | | | | | | | |
Canada health transfers | | | 4,697 | | | | 4,678 | | | | 4,461 | |
Canada social transfers | | | 1,705 | | | | 1,694 | | | | 1,637 | |
Infrastructure Support | | | 912 | | | | 734 | | | | 447 | |
Agriculture support programs | | | 271 | | | | 362 | | | | 272 | |
Labour market agreements | | | 276 | | | | 277 | | | | 255 | |
Other | | | 1,339 | | | | 1,327 | | | | 941 | |
| | | 9,200 | | | | 9,072 | | | | 8,013 | |
Net income/(loss) from government business enterprises (Schedule 8) | | | | | | | | | | | | |
Alberta Gaming, Liquor and Cannabis Commission | | | 2,206 | | | | 2,162 | | | | 2,273 | |
ATB Financial | | | 153 | | | | 104 | | | | 139 | |
Balancing Pool | | | 210 | | | | 161 | | | | 361 | |
Alberta Petroleum Marketing Commission | | | (172 | ) | | | (2,678 | ) | | | (215 | ) |
Other | | | 20 | | | | 26 | | | | 27 | |
| | | 2,417 | | | | (225 | ) | | | 2,585 | |
| | | |
Investment income | | | 2,585 | | | | 2,828 | | | | 2,349 | |
| | | |
Premiums, fees and licences | | | | | | | | | | | | |
Tuition | | | 1,309 | | | | 1,311 | | | | 1,256 | |
Motor vehicle licences | | | 526 | | | | 535 | | | | 520 | |
Health fees and charges | | | 697 | | | | 529 | | | | 537 | |
Crop, hail and livestock insurance premiums | | | 310 | | | | 321 | | | | 323 | |
Energy Industry Levies | | | 320 | | | | 326 | | | | 330 | |
Other | | | 710 | | | | 907 | | | | 943 | |
| | | 3,872 | | | | 3,929 | | | | 3,909 | |
Other | | | | | | | | | | | | |
Sales, rentals and services | | | 1,007 | | | | 1,422 | | | | 1,315 | |
Fundraising, donations, gifts and contributions | | | 573 | | | | 745 | | | | 684 | |
Fines and penalties | | | 221 | | | | 200 | | | | 200 | |
Technology innovation and emissions reduction | | | 556 | | | | 403 | | | | 528 | |
Investment management charges | | | 360 | | | | 385 | | | | 406 | |
Endowment contributions and reinvested income | | | 113 | | | | 65 | | | | 155 | |
Other | | | 606 | | | | 365 | | | | 421 | |
| | | 3,436 | | | | 3,585 | | | | 3,709 | |
| | | |
| | | $ | 49,970 | | | $ | 46,224 | | | $ | 49,572 | |
| | |
| Government of Alberta | Annual Report 2019 – 2020 | | 43 |
CONSOLIDATED FINANCIAL STATEMENTS
| | |
| REVENUES BY SOURCE BY MINISTRY | | SCHEDULE 2 |
| | | | | | | | | | | | | | | | | | | | | | | | | | | | | | | | | | | | | | | | | | | | | | | | |
| | | Income
taxes | | | Other
taxes | | | Non-
renewable
resource
revenue (a) | | | Transfers
from
Government
of Canada | | | Net
Income/(loss)
from
government
business
enterprises
(Schedule 8) | | | Investment
income | | | Premiums,
fees and
licences | | | Other | | | Sub
total | | | Consolidation
adjustments | | | 2020
Total | | | 2019
Total
Restated (b)
(Note 1 (e)) | |
| | | | | | | | | | | | | | | | | | | | | | | In millions | | | | | | | | | | | | | | | | | | | | | |
Offices of the Legislative Assembly | | $ | - | | | $ | - | | | $ | - | | | $ | - | | | $ | - | | | $ | - | | | $ | - | | | $ | - | | | $ | - | | | $ | - | | | $ | - | | | $ | - | |
Ministries | | | | | | | | | | | | | | | | | | | | | | | | | | | | | | | | | | | | | | | | | | | | | | | | |
Advanced Education | | | - | | | | - | | | | - | | | | 548 | | | | 6 | | | | 239 | | | | 1,315 | | | | 1,483 | | | | 3,591 | | | | (421 | ) | | | 3,170 | | | | 3,182 | |
Agriculture and Forestry | | | - | | | | - | | | | - | | | | 371 | | | | - | | | | 158 | | | | 474 | | | | 19 | | | | 1,022 | | | | (2 | ) | | | 1,020 | | | | 892 | |
Children’s Services | | | - | | | | - | | | | - | | | | 117 | | | | - | | | | - | | | | - | | | | 9 | | | | 126 | | | | - | | | | 126 | | | | 119 | |
Community and Social Services | | | - | | | | - | | | | - | | | | 130 | | | | - | | | | - | | | | - | | | | 34 | | | | 164 | | | | (16 | ) | | | 148 | | | | 137 | |
Culture, Multiculturalism and Status of Women | | | - | | | | - | | | | - | | | | 3 | | | | - | | | | 1 | | | | 11 | | | | 18 | | | | 33 | | | | (2 | ) | | | 31 | | | | 37 | |
Economic Development, Trade and Tourism | | | - | | | | - | | | | - | | | | 6 | | | | - | | | | 4 | | | | - | | | | 147 | | | | 157 | | | | (96 | ) | | | 61 | | | | 60 | |
Education | | | - | | | | 2,475 | | | | - | | | | 112 | | | | - | | | | 24 | | | | 173 | | | | 666 | | | | 3,450 | | | | (378 | ) | | | 3,072 | | | | 2,995 | |
Energy | | | - | | | | 75 | | | | 5,937 | | | | - | | | | (2,517 | ) | | | 1 | | | | 331 | | | | 7 | | | | 3,834 | | | | - | | | | 3,834 | | | | 6,014 | |
Environment and Parks | | | - | | | | - | �� | | | - | | | | 38 | | | | - | | | | 2 | | | | 125 | | | | 518 | | | | 683 | | | | (42 | ) | | | 641 | | | | 761 | |
Executive Council | | | - | | | | - | | | | - | | | | - | | | | - | | | | - | | | | - | | | | - | | | | - | | | | - | | | | - | | | | - | |
Health | | | - | | | | - | | | | - | | | | 4,816 | | | | - | | | | 80 | | | | 573 | | | | 1,120 | | | | 6,589 | | | | (458 | ) | | | 6,131 | | | | 5,845 | |
Indigenous Relations | | | - | | | | - | | | | - | | | | 3 | | | | - | | | | - | | | | - | | | | 5 | | | | 8 | | | | - | | | | 8 | | | | 5 | |
Infrastructure | | | - | | | | - | | | | - | | | | 7 | | | | - | | | | - | | | | 2 | | | | 61 | | | | 70 | | | | (10 | ) | | | 60 | | | | 70 | |
Justice and Solicitor General | | | - | | | | - | | | | - | | | | 46 | | | | - | | | | 3 | | | | 56 | | | | 255 | | | | 360 | | | | (10 | ) | | | 350 | | | | 342 | |
Labour and Immigration | | | - | | | | - | | | | - | | | | 56 | | | | - | | | | - | | | | 4 | | | | 68 | | | | 128 | | | | (3 | ) | | | 125 | | | | 144 | |
Municipal Affairs | | | - | | | | - | | | | - | | | | 504 | | | | - | | | | 1 | | | | 39 | | | | 76 | | | | 620 | | | | - | | | | 620 | | | | 382 | |
Seniors and Housing | | | - | | | | - | | | | - | | | | 103 | | | | - | | | | 7 | | | | - | | | | 14 | | | | 124 | | | | - | | | | 124 | | | | 123 | |
Service Alberta | | | - | | | | - | | | | - | | | | 8 | | | | - | | | | - | | | | 635 | | | | 85 | | | | 728 | | | | (62 | ) | | | 666 | | | | 668 | |
Transportation | | | - | | | | - | | | | - | | | | 192 | | | | - | | | | - | | | | 43 | | | | 26 | | | | 261 | | | | - | | | | 261 | | | | 196 | |
Treasury Board and Finance | | | 15,351 | | | | 3,197 | | | | - | | | | 2,012 | | | | 2,286 | | | | 2,472 | | | | 153 | | | | 488 | | | | 25,959 | | | | (183 | ) | | | 25,776 | | | | 27,600 | |
Consolidation adjustments | | | - | | | | - | | | | - | | | | - | | | | - | | | | (164 | ) | | | (5 | ) | | | (1,514 | ) | | | (1,683 | ) | | | (1,683 | ) | | | | | | | | |
Total at March 31, 2020 | | $ | 15,351 | | | $ | 5,747 | | | $ | 5,937 | | | $ | 9,072 | | | $ | (225 | ) | | $ | 2,828 | | | $ | 3,929 | | | $ | 3,585 | | | | | | | | | | | $ | 46,224 | | | | | |
Total at March 31, 2019 | | $ | 16,745 | | | $ | 6,833 | | | $ | 5,429 | | | $ | 8,013 | | | $ | 2,585 | | | $ | 2,349 | | | $ | 3,909 | | | $ | 3,709 | | | | | | | | | | | | | | | $ | 49,572 | |
| (a) | Includes royalty revenues that were reduced by $466 million (2019: $941 million - restated) under provincial oil and gas royalty reduction programs. |
| (b) | In 2019-20, pursuant to Bill 20 and Bill 22, Access to the Future Fund, Alberta Cancer Prevention Legacy Fund, Alberta Historical Resources Foundation, Alberta Lottery Fund, Alberta Sport Connection, Environmental Protection and Enhancement Fund, Historic Resources Fund and Office of the Election Commissioner were dissolved on various dates. The activities and responsibilities of these entities were transferred to the appropriate departments, except for those related to the Office of the Election Commissioner, which were transferred to the Office of the Chief Electoral Officer. |
| | |
| | |
| 44 | | Government of Alberta | Annual Report 2019 – 2020 |
CONSOLIDATED FINANCIAL STATEMENTS
| | |
| EXPENSES BY OBJECT BY MINISTRY | | SCHEDULE 3 |
| | | | | | | | | | | | | | | | | | | | | | | | | | | | | | | | | | | | | | | | | | | | | | | | | | | | |
| | | Budget Restated (Notes 1 (c), (e)) | | | Salaries, wages,
employment
contracts and benefits | | | Grants | | | Supplies
and
services (a) | | | Amortization
of tangible
capital
assets | | | Consumption
of inventories
of supplies | | | Debt servicing costs (b) | | | Pension (recovery) provisions (Schedule 12) | | | Other | | | Sub
total | | | Consolidation adjustments | | | 2020 Total | | | 2019 Total Restated (c) (Note 1 (e)) | |
| | | | | | | | | | | | | | | | | | | | | | | In millions | | | | | | | | | | | | | | | | | | | | | | | | | | | | | |
Offices of the Legislative Assembly | | $ | 159 | | | $ | 74 | | | $ | - | | | $ | 51 | | | $ | 1 | | | $ | - | | | $ | - | | | $ | - | | | $ | 16 | | | $ | 142 | | | $ | - | | | $ | 142 | | | $ | 137 | |
Ministries | | | | | | | | | | | | | | | | | | | | | | | | | | | | | | | | | | | | | | | | | | | | | | | | | | | | |
Advanced Education | | | 5,845 | | | | 3,640 | | | | 593 | | | | 1,393 | | | | 558 | | | | - | | | | 42 | | | | 7 | | | | 102 | | | | 6,335 | | | | (104 | ) | | | 6,231 | | | | 6,054 | |
Agriculture and Forestry | | | 1,411 | | | | 247 | | | | 130 | | | | 1,715 | | | | 24 | | | | 1 | | | | 70 | | | | - | | | | 22 | | | | 2,209 | | | | (87 | ) | | | 2,122 | | | | 1,432 | |
Children’s Services | | | 1,586 | | | | 303 | | | | 599 | | | | 659 | | | | - | | | | - | | | | - | | | | - | | | | - | | | | 1,561 | | | | (14 | ) | | | 1,547 | | | | 1,492 | |
Community and Social Services | | | 3,910 | | | | 299 | | | | 2,768 | | | | 999 | | | | - | | | | - | | | | - | | | | - | | | | - | | | | 4,066 | | | | (41 | ) | | | 4,025 | | | | 3,635 | |
Culture, Multiculturalism and Status of Women | | | 277 | | | | 59 | | | | 163 | | | | 26 | | | | 8 | | | | - | | | | - | | | | - | | | | 1 | | | | 257 | | | | (4 | ) | | | 253 | | | | 327 | |
Economic Development, Trade and Tourism | | | 295 | | | | 133 | | | | 170 | | | | 74 | | | | 7 | | | | - | | | | - | | | | - | | | | - | | | | 384 | | | | (91 | ) | | | 293 | | | | 356 | |
Education | | | 8,504 | | | | 6,290 | | | | 361 | | | | 1,520 | | | | 434 | | | | - | | | | 44 | | | | (125 | ) | | | - | | | | 8,524 | | | | (42 | ) | | | 8,482 | | | | 8,567 | |
Energy (a) | | | 2,251 | | | | 270 | | | | 113 | | | | 1,095 | | | | 18 | | | | - | | | | - | | | | - | | | | 49 | | | | 1,545 | | | | (1 | ) | | | 1,544 | | | | 741 | |
Environment and Parks | | | 724 | | | | 241 | | | | 176 | | | | 197 | | | | 64 | | | | - | | | | - | | | | - | | | | - | | | | 678 | | | | (18 | ) | | | 660 | | | | 748 | |
Executive Council | | | 20 | | | | 15 | | | | - | | | | 3 | | | | - | | | | - | | | | - | | | | - | | | | - | | | | 18 | | | | - | | | | 18 | | | | 17 | |
Health | | | 22,105 | | | | 8,628 | | | | 6,694 | | | | 5,801 | | | | 557 | | | | 845 | | | | 15 | | | | 2 | | | | 78 | | | | 22,620 | | | | (276 | ) | | | 22,344 | | | | 21,920 | |
Indigenous Relations | | | 198 | | | | 22 | | | | 140 | | | | 3 | | | | - | | | | - | | | | - | | | | - | | | | - | | | | 165 | | | | - | | | | 165 | | | | 261 | |
Infrastructure | | | 613 | | | | 71 | | | | 1,060 | | | | 412 | | | | 123 | | | | 3 | | | | - | | | | - | | | | 13 | | | | 1,682 | | | | (1,076 | ) | | | 606 | | | | 639 | |
Justice and Solicitor General | | | 1,454 | | | | 767 | | | | 253 | | | | 417 | | | | 2 | | | | - | | | | - | | | | - | | | | 7 | | | | 1,446 | | | | (2 | ) | | | 1,444 | | | | 1,454 | |
Labour and Immigration | | | 220 | | | | 104 | | | | 165 | | | | 43 | | | | 1 | | | | - | | | | - | | | | - | | | | - | | | | 313 | | | | (3 | ) | | | 310 | | | | 209 | |
Municipal Affairs | | | 1,521 | | | | 78 | | | | 1,384 | | | | 39 | | | | 2 | | | | - | | | | - | | | | - | | | | 1 | | | | 1,504 | | | | (4 | ) | | | 1,500 | | | | 1,230 | |
Seniors and Housing | | | 709 | | | | 27 | | | | 613 | | | | 11 | | | | 39 | | | | - | | | | 2 | | | | - | | | | - | | | | 692 | | | | - | | | | 692 | | | | 732 | |
Service Alberta | | | 675 | | | | 218 | | | | - | | | | 356 | | | | 105 | | | | - | | | | - | | | | - | | | | 31 | | | | 710 | | | | (77 | ) | | | 633 | | | | 688 | |
Transportation | | | 1,793 | | | | 74 | | | | 376 | | | | 332 | | | | 611 | | | | 54 | | | | 90 | | | | - | | | | 58 | | | | 1,595 | | | | (40 | ) | | | 1,555 | | | | 1,676 | |
Treasury Board and Finance | | | 3,723 | | | | 322 | | | | 592 | | | | 541 | | | | 24 | | | | - | | | | 2,136 | | | | (218 | ) | | | 599 | | | | 3,996 | | | | (186 | ) | | | 3,810 | | | | 3,968 | |
Unallocated disaster expense | | | 681 | | | | - | | | | - | | | | - | | | | - | | | | - | | | | - | | | | - | | | | - | | | | - | | | | - | | | | - | | | | - | |
Consolidation adjustments | | | - | | | | (57 | ) | | | (1,382 | ) | | | (368 | ) | | | - | | | | - | | | | (164 | ) | | | - | | | | (94 | ) | | | | | | | (2,065 | ) | | | | | | | | |
Total at March 31, 2020 | | $ | 58,674 | | | $ | 21,825 | | | $ | 14,968 | | | $ | 15,319 | | | $ | 2,578 | | | $ | 903 | | | $ | 2,235 | | | $ | (334 | ) | | $ | 883 | | | | | | | | | | | $ | 58,376 | | | | | |
Total at March 31, 2019 | | $ | 56,181 | | | $ | 21,635 | | | $ | 15,070 | | | $ | 13,650 | | | $ | 2,472 | | | $ | 973 | | | $ | 1,971 | | | $ | (190 | ) | | $ | 702 | | | | | | | | | | | | | | | $ | 56,283 | |
| (a) | Includes expense for crude by rail of $866 million (2019: $6 million). |
| (b) | Debt servicing costs consist of interest paid on various forms of government debt. Interest on pension liabilities is included in pension expense, which is included in salaries, wages, employment contracts and benefits, pension recovery and pension liability funding reported under other expenses. |
| (c) | In 2019-20, pursuant to Bill 20 and Bill 22, Access to the Future Fund, Alberta Cancer Prevention Legacy Fund, Alberta Historical Resources Foundation, Alberta Lottery Fund, Alberta Sport Connection, Environmental Protection and Enhancement Fund, Historic Resources Fund and Office of the Election Commissioner were dissolved on various dates. The activities and responsibilities of these entities were transferred to the appropriate departments, except for those related to the Office of the Election Commissioner, which were transferred to the Office of the Chief Electoral Officer. |
| | |
| Government of Alberta | Annual Report 2019 – 2020 | | 45 |
CONSOLIDATED FINANCIAL STATEMENTS
| | | | |
| CASH AND CASH EQUIVALENTS | | | | SCHEDULE 4 |
| | | | | | | | |
| | | 2020 | | | 2019 | |
| | | In | | | millions | |
Cash | | $ | 5,695 | | | $ | 3,938 | |
Cash equivalents | | | 9,630 | | | | 10,453 | |
| | | $ | 15,325 | | | $ | 14,391 | |
Cash and cash equivalents includes deposits in the Consolidated Cash Investments Trust Fund (CCITF). At March 31, 2020, deposits in CCITF had a time-weighted return of 1.9% (2019: 1.8%) per annum, and securities had an average effective yield of 0.33% (2019: 1.7%) per annum.
| | | | |
| ACCOUNTS RECEIVABLE | | | | SCHEDULE 5 |
| | | | | | | | |
| | | 2020 | | | 2019 | |
| | | In | | | millions | |
Income taxes | | $ | 1,639 | | | $ | 1,733 | |
Due from Government of Canada | | | 1,154 | | | | 1,256 | |
Due from government business enterprises | | | 579 | | | | 703 | |
Other taxes | | | 539 | | | | 637 | |
Proceeds from issuance of direct borrowings | | | 2,309 | | | | - | |
Royalties | | | 289 | | | | 558 | |
Collateral pledged (a) | | | 574 | | | | 304 | |
Interest receivable | | | 187 | | | | 207 | |
Other receivables | | | 1,722 | | | | 1,604 | |
| | | 8,992 | | | | 7,002 | |
Less: allowance for doubtful accounts | | | (262 | ) | | | (238 | ) |
| | | $ | 8,730 | | | $ | 6,764 | |
| (a) | The Province paid cash collateral to counterparties under the terms of the CSA agreements as disclosed in Note 3. |
| | |
| | |
| 46 | | Government of Alberta | Annual Report 2019 – 2020 |
CONSOLIDATED FINANCIAL STATEMENTS
| | | | |
| PORTFOLIO INVESTMENTS | | | | SCHEDULE 6 |
| | | | | | | | | | | | | | | | |
| | | 2020 | | | 2019 | |
| | | Book | | | Fair | | | Book | | | Fair | |
| | | value | | | value | | | value | | | value | |
| | | | | | In | | | millions | | | | |
Interest-bearing securities | | | | | | | | | | | | | | | | |
| | | | |
Deposits and short-term securities | | $ | 973 | | | $ | 971 | | | $ | 1,223 | | | $ | 1,228 | |
| | | | |
Bonds and mortgages | | | 9,527 | | | | 9,658 | | | | 10,801 | | | | 10,844 | |
| | | | |
| | | 10,500 | | | 10,629 | | | 12,024 | | | 12,072 | |
| | | | |
Equities | | | | | | | | | | | | | | | | |
| | | | |
Canadian equities | | | 2,376 | | | | 2,084 | | | | 2,269 | | | | 2,537 | |
| | | | |
Global developed equities | | | 7,962 | | | | 6,919 | | | | 6,963 | | | | 7,358 | |
| | | | |
Emerging markets equities | | | 878 | | | | 745 | | | | 711 | | | | 775 | |
| | | | |
Private equities | | | 1,734 | | | | 1,845 | | | | 1,516 | | | | 1,703 | |
| | | | |
Pooled hedged funds | | | 266 | | | | 279 | | | | 130 | | | | 132 | |
| | | | |
Pooled investment funds | | | 1,125 | | | | 1,175 | | | | 1,187 | | | | 1,397 | |
| | | | |
| | | 14,341 | | | 13,047 | | | 12,776 | | | 13,902 | |
| | | | |
Inflation sensitive and alternative investments | | | | | | | | | | | | | | | | |
| | | | |
Private real estate | | | 3,444 | | | | 4,519 | | | | 3,820 | | | | 5,402 | |
| | | | |
Private infrastructure | | | 2,161 | | | | 2,330 | | | | 2,030 | | | | 2,410 | |
| | | | |
Timberland | | | 395 | | | | 526 | | | | 413 | | | | 633 | |
| | | | |
Other investments | | | 12 | | | | 14 | | | | 10 | | | | 12 | |
| | | | |
| | | 6,012 | | | 7,389 | | | 6,273 | | | 8,457 | |
| | | | |
Strategic, tactical and currency investments | | | 161 | | | | 167 | | | | 188 | | | | 221 | |
| | | | |
| | | $ | 31,014 | | | $ | 31,232 | | | $ | 31,261 | | | $ | 34,652 | |
The following is the breakdown of portfolio investments:
| | | | | | | | | | | | | | | | |
| | | 2020 | | | 2019 | |
| | | Book | | | Fair | | | Book | | | Fair | |
| | | value | | | value | | | value | | | value | |
| | | | | | In | | | millions | | | | |
Operating | | | | | | | | | | | | | | | | |
| | | | |
Internally designated assets (a) | | $ | 21,358 | | | $ | 21,325 | | | $ | 20,835 | | | $ | 23,564 | |
| | | | |
Other funds and agencies | | | 7,045 | | | | 7,171 | | | | 7,854 | | | | 8,122 | |
| | | | |
| | | 28,403 | | | 28,496 | | | 28,689 | | | 31,686 | |
| | | | |
Endowments (Schedule 7) | | | 2,611 | | | | 2,736 | | | | 2,572 | | | | 2,966 | |
| | | | |
Total portfolio investments | | $ | 31,014 | | | $ | 31,232 | | | $ | 31,261 | | | $ | 34,652 | |
| (a) | Internally designated assets are designated in legislation for specific purposes. Some of these assets are to provide stewardship of savings from the Province’s non-renewable resources revenues as is the case with the Alberta Heritage Savings Trust Fund assets of $16.5 billion (2019: $15.8 billion). They also support specific purposes such as medical research, science and engineering research, and post-secondary scholarships |
| | |
| Government of Alberta | Annual Report 2019 – 2020 | | 47 |
CONSOLIDATED FINANCIAL STATEMENTS
| | | | |
| ENDOWMENT FUNDS | | | | SCHEDULE 7 |
The endowment balance represents the principal that will be maintained intact in perpetuity. As at March 31, 2020, endowment funds are as follows:
| | | | | | | | |
| | | 2020 | | | 2019 | |
| | | In | | | millions | |
Balance beginning of year | | $ | 2,559 | | | $ | 2,403 | |
| | |
Endowment contributions | | | 57 | | | | 55 | |
| | |
Reinvested income | | | 8 | | | | 100 | |
| | |
Transfers from the accumulated surplus
of related government organizations | | | (27 | ) | | | 1 | |
| | |
Balance end of year (a) | | $ | 2,597 | | | $ | 2,559 | |
| (a) | Investment income earned by endowments for specific operational or capital purposes of $14 million (2019: $13 million) is excluded from the endowment balance but included in the portfolio investment restricted for endowments (Schedule 6). |
| | |
| | |
| 48 | | Government of Alberta | Annual Report 2019 – 2020 |
CONSOLIDATED FINANCIAL STATEMENTS
| | | | | | |
| EQUITY IN GOVERNMENT BUSINESS ENTERPRISES | | | | | SCHEDULE 8 | |
| | | | | | | | | | | | | | | | | | | | | | | | | | | | | | | | |
| | | Alberta Gaming,
Liquor and
Cannabis
Commission
(AGLC) | | | ATB
Financial | | | Balancing Pool (BP) | | | Alberta Petroleum
Marketing
Commission
(APMC) | | | Credit Union
Deposit
Guarantee
Corporation
(CUDGC) | | | Other | | | 2020
Total | | | 2019
Total | |
| | | | | | | | | | | | In millions | | | | | | | | | | | | | |
| | | | | | | | |
Accumulated (deficit)/surplus at beginning of year | | $ | (21 | ) | | $ | 3,644 | | | $ | (828 | ) | | $ | (110 | ) | | $ | 377 | | | $ | - | | | $ | 3,062 | | | $ | 2,527 | |
Adjustment | | | - | | | | (4 | ) | | | - | | | | - | | | | - | | | | 2 | | | | (2 | ) | | | 56 | |
Restated opening (deficit)/surplus | | | (21 | ) | | | 3,640 | | | | (828 | ) | | | (110 | ) | | | 377 | | | | 2 | | | | 3,060 | | | | 2,583 | |
Total revenue | | | 2,696 | | | | 1,727 | | | | 1,046 | | | | 80 | | | | 27 | | | | 19 | | | | 5,595 | | | | 5,791 | |
Total expense (a) | | | 534 | | | | 1,623 | | | | 885 | | | | 2,758 | | | | 7 | | | | 13 | | | | 5,820 | | | | 3,206 | |
Net income | | | 2,162 | | | | 104 | | | | 161 | | | | (2,678 | ) | | | 20 | | | | 6 | | | | (225 | ) | | | 2,585 | |
| | | | | | | | |
Change in accumulated unrealized gains (b) | | | 7 | | | | 337 | | | | - | | | | - | | | | 5 | | | | - | | | | 349 | | | | 166 | |
Transfers from government business enterprise | | | (2,079 | ) | | | - | | | | - | | | | - | | | | - | | | | - | | | | (2,079 | ) | | | (2,272 | ) |
Total equity | | $ | 69 | | | $ | 4,081 | | | $ | (667 | ) | | $ | (2,788 | ) | | $ | 402 | | | $ | 8 | | | $ | 1,105 | | | $ | 3,062 | |
| | | | | | | | |
Assets | | | | | | | | | | | | | | | | | | | | | | | | | | | | | | | | |
Loans | | $ | 7 | | | $ | 46,982 | | | $ | - | | | $ | 668 | | | $ | 2 | | | $ | - | | | $ | 47,659 | | | $ | 47,651 | |
Investments | | | 166 | | | | 4,631 | | | | 224 | | | | 127 | | | | 400 | | | | 18 | | | | 5,566 | | | | 5,181 | |
Other | | | 645 | | | | 4,188 | | | | 385 | | | | 24 | | | | 5 | | | | 58 | | | | 5,305 | | | | 4,432 | |
Total assets | | | 818 | | | | 55,801 | | | | 609 | | | | 819 | | | | 407 | | | | 76 | | | | 58,530 | | | | 57,264 | |
| | | | | | | | |
Liabilities | | | | | | | | | | | | | | | | | | | | | | | | | | | | | | | | |
Accounts payable | | | 749 | | | | 989 | | | | 235 | | | | 160 | | | | 5 | | | | 5 | | | | 2,143 | | | | 1,987 | |
Deposits (c) | | | - | | | | 39,775 | | | | - | | | | - | | | | - | | | | - | | | | 39,775 | | | | 39,541 | |
Debt (d) | | | - | | | | 8,545 | | | | 702 | | | | 925 | | | | - | | | | 31 | | | | 10,203 | | | | 10,554 | |
Sturgeon refinery processing agreement provision | | | - | | | | - | | | | - | | | | 2,522 | | | | - | | | | - | | | | 2,522 | | | | - | |
Reclamation and abandonment provision | | | - | | | | - | | | | 31 | | | | - | | | | - | | | | - | | | | 31 | | | | 23 | |
Power purchase arrangements | | | - | | | | - | | | | 308 | | | | - | | | | - | | | | - | | | | 308 | | | | 737 | |
Other | | | - | | | | 2,411 | | | | - | | | | - | | | | - | | | | 32 | | | | 2,443 | | | | 1,360 | |
Total liabilities | | | 749 | | | | 51,720 | | | | 1,276 | | | | 3,607 | | | | 5 | | | | 68 | | | | 57,425 | | | | 54,202 | |
Total equity | | $ | 69 | | | $ | 4,081 | | | $ | (667 | ) | | $ | (2,788 | ) | | $ | 402 | | | $ | 8 | | | $ | 1,105 | | | $ | 3,062 | |
| (a) | Included in the total expense is $31 million (2019: $41 million) of payment in lieu of taxes of ATB Financial that was paid to the Province. |
| (b) | The change in accumulated unrealized gains of $349 million (2019: gains of $166 million) is comprised of changes in other comprehensive income in government business enterprises. At March 31, 2020, the Province has $321 million in accumulated unrealized gains (2019: $28 million - restated) in accumulated unrealized losses). |
| (c) | The Province ensures the repayment of all deposits without limit, including accrued interest, for ATB Financial. The Province assesses an annual deposit guarantee fee of $54 million (2019: $54 million) payable by ATB Financial. Included in the deposits are ATB Financial wholesale borrowings that include amounts borrowed by the Province on |
| | |
| | |
| Government of Alberta | Annual Report 2019 – 2020 | | 49 |
CONSOLIDATED FINANCIAL STATEMENTS
| | |
| EQUITY IN GOVERNMENT BUSINESS ENTERPRISES | | SCHEDULE 8 (continued) |
| | behalf of ATB Financial totaling $4,402 million (2019: $3,619 million), to be repaid as follows: $2,256 million in 2020-21, $nil in 2021-22, $nil in 2022-23, $309 million in 2023-24, and $1,837 million thereafter. |
| (d) | In addition to the above amount borrowed by the Province on behalf of ATB for wholesale borrowings, included in debt are amounts borrowed by the Province on behalf of BP and APMC (Schedule 11). |
Contractual Obligations, Contingent Liabilities and Commitments
Contractual obligations belonging to AGLC, ATB, and CUDGC are $418 million (2019: $422 million - restated). These amounts include obligations under operating leases which expire on various dates.
AGLC
The AGLC amended a lease agreement with a tenant on May 15, 2018. Under the terms of the amended agreement, the AGLC has agreed to assume certain third-party premises leases for the remainder of the lease term, if a significant change in the terms of tenant’s appointment occurs before May 31, 2021. As at March 31, 2020, the AGLC’s potential liability is $9 million (2019: $21 million).
ATB Financial
At March 31, 2020, ATB Financial had a contingent liability under guarantees and letters of credit of $489 million (2019: $571 million) and outstanding loan commitments of $18 billion (2019: $19 billion).
BP
Retroactive Line Loss Adjustment
In December 2017, Alberta Utilities Commission (AUC) reached its decision on Proceeding 790. As a result, the BP will incur additional charges as a result of the retroactive adjustments to line loss factors in relation to the various PPAs. An estimated provision in the amount of $68 million (2019: $46 million) has been reported in trade payable and other accrued liabilities for the retroactive line loss adjustment. The estimate has been prepared using the Module B method based on Incremental Loss Factors with generation scaling.
Various matters approved by the AUC regarding the retroactive line loss adjustments are under appeal with the Court of Appeal, including the retroactive nature of the adjustments and prospective line loss factors used to calculate the adjustment. The quantum of any retroactive adjustment will be dependent upon the methodology finally adopted and approved. Given the uncertainty of the final methodology, the BP’s estimates may be higher or lower than the current estimates reflected in these financial statements.
Reclamation and Abandonment
TransAlta has submitted an application to the AUC to decommission Sundance A and is seeking $41 million in funding from the BP. The BP disagrees with several aspects of the application. The BP has a provision of $22 million to decommission Sundance A. The final amount due will be determined by the AUC.
CUDGC
The Province, through the CUDGC which operates under the authority of the Credit Union Act, has a potential liability under guarantees relating to deposits of credit unions. At March 31, 2020, credit unions in Alberta held deposits totaling $22.5 billion (2019: $22.1 billion). Substantial assets are available from credit unions to safeguard the Province from the risk of loss from its potential obligation under the Credit Union Act.
| | |
| | |
| 50 | | Government of Alberta | Annual Report 2019 – 2020 |
CONSOLIDATED FINANCIAL STATEMENTS
| | | | |
| EQUITY IN GOVERNMENT BUSINESS ENTERPRISES | | | SCHEDULE 8 (continued) | |
APMC
North West Redwater Partnership
On November 8, 2012, the North West Redwater Partnership (Partnership) announced the sanctioning of the construction of Phase 1 of the Sturgeon Refinery which it will build, own and operate. The Province via the APMC, has entered into agreements whereby the Partnership will process and market Crown royalty bitumen, or equivalent volumes, collected pursuant to the Bitumen Royalty in Kind initiative in order to capture additional value within Alberta. The Partnership will market the refined products (primarily ultra-low-sulphur diesel and low-sulphur vacuum gas oil) on behalf of the APMC. There is financial risk to the APMC under these agreements related to the difference in price between bitumen supplied as feedstock and marketed refined products, relative to the costs of the processing toll.
Under the processing agreement (PA), after the Commercial Operations Date (COD) is achieved, the APMC is obligated to pay a monthly toll comprised of: senior debt; operating costs; class A subordinated debt; equity; and incentive fees on 37,500 barrels per day of bitumen (75% of the project’s feedstock). The Sturgeon Refinery did not attain COD in 2019, and per the PA, the APMC and CNRL were required to start paying the debt toll at the Toll Commencement Date (June 1, 2018). The PA has a term of 30 years starting with the Toll Commencement Date. The toll includes both flow through costs as well as costs of facility construction, estimated to be $10.1 billion (2019: $9.9 billion). The APMC has very restricted rights to terminate the agreement, and if it is terminated, the APMC remains obligated to pay its share of the senior secured debt component of the toll incurred to date. During the fiscal year of 2020, $201 million (2019: $261 million) debt tolls have been paid and recorded as expenses.
The nominal tolls under the processing agreement, assuming $10.1 billion (2019: $9.9 billion) Facility Capital Cost (FCC), market interest rates and 2% operating cost inflation rate, are estimated below. The total estimated tolls have been increased by $283 million (2019: $690 million) relative to March 2019, due primarily to higher debt tolls related to higher FCC. As at March 31, 2020, the Partnership has issued $6.4 billion (2019: $6.4 billion) in bonds.
No value has been ascribed to the anticipated refining profits available to the APMC over the term of the agreement.
North West Redwater Partnership Monthly Toll Commitment
The APMC has used judgement to estimate the toll commitments. To calculate the toll, management has used estimates for factors including: future interest rates, operating costs, oil prices (WTI and light/heavy differentials), refined product prices, gas prices and foreign exchange.
The North West Redwater Partnership (Partnership) refinery came on stream to process bitumen feedstock on COD of June 1, 2020 (details in subsequent events). The future toll commitments are estimated to be:
| | | | |
| | | In millions | |
2020-21 | | $ | 669 | |
2021-22 | | | 1,008 | |
2022-23 | | | 1,024 | |
2023-24 | | | 1,028 | |
2024-25 | | | 998 | |
Thereafter | | | 21,705 | |
| | | $ | 26,432 | |
Term Loan Provided to North West Redwater Partnership
Under the agreements related to the FCC for the Sturgeon Refinery, the financing structure is required to be 80% senior debt and 20% equity/subordinated debt. The APMC is committed to provide 50% of the subordinated debt required to meet this test. This commitment relates to incremental FCC from April 7, 2014, until completion. A final reconciliation of the amount of subordinated debt required will be done six months after
| | |
| | |
| Government of Alberta | Annual Report 2019 – 2020 | | 51 |
CONSOLIDATED FINANCIAL STATEMENTS
| | | | |
| EQUITY IN GOVERNMENT BUSINESS ENTERPRISES | | | SCHEDULE 8 (continued) | |
COD. The calculation of the 80/20 ratio allows for the deduction of the cumulative debt servicing costs (accrued interest) at this time, while prior to this time, the calculation does not allow for the deduction of accumulated debt servicing costs, which could result in a temporary need for additional subordinated debt lending by the APMC.
As part of the Subordinated Debt Agreement with the Partnership, the APMC provided a $439 million loan (2019: $439 million). These amounts plus the accrued interest will be repaid on a straight-line basis over ten years by the Partnership beginning June 1, 2021. Upon initiation of commercial operations, the total amount of the term loan will be adjusted to reflect an agreed equity to debt ratio.
The APMC is forecasting to provide the Partnership no additional subordinated debt in 2020 (2019: $nil). In fiscal year 2021, the APMC anticipates the Partnership will repay $100 million (2019: $90 million) to the APMC as part of the final subordinated debt true-up six months after COD.
While loans to the Partnership are outstanding, the APMC is entitled to a 25% voting interest on the Executive Leadership Committee, which is charged with overseeing and making decisions on the construction and start-up of the Sturgeon Refinery. The APMC has significant influence over the Partnership because of the 25% voting interest. However, the APMC has no equity ownership interest in the Partnership and does not account for the Sturgeon Refinery or its operations in its financial statements.
North West Redwater Partnership Processing Agreement Assessment
The APMC uses a cash flow model to determine if the unavoidable costs of meeting the obligations under the Processing Agreement exceed the economic benefits expected to be received. The model uses a number of variables to calculate a discounted net cash flow for the APMC. Those variables include technical variables that arise from the design of the project such as catalyst volumes or energy consumption; pricing related variables such as crude oil prices (WTI), heavy-light differentials, ultra-low sulphur diesel-WTI premiums, exchange rates, capital costs, operating costs, interest rates, discount rates; and operating performance compared to capacity.
Technical inputs may be estimated with reasonable accuracy for a particular operating plan; however, revenues and costs that depend upon market prices are challenging to estimate, particularly over long future time periods. The Processing Agreement has a term of 30 years and may be renewed for successive five year periods at the APMC’s option. In order to perform the onerous contract analysis, the APMC’s management developed estimates for the key variables based on information from various sources including forecasts of global consultancies, reserve evaluation consultants, forward markets and the Province.
Based on the analysis, the APMC determined the agreement has a negative (2019: positive) net present value of future cash flows and a provision (2019: no provision) is required.
For each subsequent year end the APMC will perform this Processing Agreement assessment to determine the updated net present value. The balance sheet provision will be adjusted each year to the new present value (either higher or lower) with the offset being recorded through the income statement. If the net present value turns positive then the reversal of the provision on the balance sheet is to zero (i.e. the contract cannot become an asset).
Sturgeon Refinery Processing Agreement Provision
APMC uses a cash flow model to assess if the net present value of the unavoidable costs related to the Processing Agreement with the Partnership exceeds the economic benefits to be received. The model calculates the net present value of revenues from sales of refined products less feedstock costs and refinery tolls charged by the Partnership under the Processing Agreement.
The net present value is most significantly influenced by two variables, pricing and on-stream factor. The on-stream factor is the average percentage of time the refinery is operating. APMC uses the Province’s budget forecast values for WTI, WCS, condensate and foreign exchange to calculate the net present value. The single largest contributor to the decrease (81%) in the net present value of the contract year over year is due to lower forecasted future WTI prices for the life of the refinery and a significant narrowing of the Diesel-WCS spread for
| | |
| | |
| 52 | | Government of Alberta | Annual Report 2019 – 2020 |
CONSOLIDATED FINANCIAL STATEMENTS
| | | | |
| EQUITY IN GOVERNMENT BUSINESS ENTERPRISES | | | SCHEDULE 8 (continued) | |
2020 to 2022. Diesel prices are calculated as a premium to WTI. Feedstock prices are calculated as percentage discount to WTI. Therefore, with lower WTI prices the net present value will be less.
Also contributing to the decrease in net present value is a lower expected on-stream factor. The two most impactful pricing variables to the net present value of the contract are forecasted WTI prices and foreign exchange. The net present value of the contract has a sensitivity to changes in WTI of +/- $157 million for every dollar change from the WTI forecast.
The net present value of the contract has a sensitivity to changes in foreign exchange, for every $0.01 the Canadian dollar changes from the forecast there is a +/- $109 million change to the net present value of the contract. If the Canadian dollar weakens in relation to the US dollar, there is a positive impact to the net present value of the contract and conversely if the Canadian dollar strengthens in relation to the US dollar, there is a negative impact to the net present value.
As at December 31, 2019, APMC reported a Sturgeon Refinery Processing Agreement provision of $1.7 billion using an appropriately dated pricing forecast. Prices were volatile from December 31, 2019 to March 31, 2020, and the pricing forecast was updated, which resulted in a calculated provision of $2.5 billion for the inclusion in the Province’s financial statements.
Keystone XL Pipeline Project
An Investment Agreement between TC Energy and APMC was executed on March 31, 2020. APMC, through newly created subsidiaries, has agreed to provide financial support for the construction of the Keystone XL (KXL) Expansion pipeline. APMC will extend USD $5.3 billion of funding support beginning with an equity commitment of up to USD $1.06 billion in 2020. The balance of the support, commencing January 1, 2021, will be in the form of a debt guarantee to backstop TC Energy’s financing for the KXL Expansion pipeline.
APMC acquired its initial interest in the KXL Expansion pipeline effective March 31, 2020, in exchange for its agreement to make initial equity contributions of $102 million (USD $48 million and $34 million) by way of cash contributions of USD $29 million and $13 million, and through subsequent loans from TC Energy for the month of April 2020, of an additional USD $19 million and $21 million. From April to June, TC Energy lent APMC additional funds required to make APMC’s monthly funding contributions. APMC has executed non-interest bearing promissory notes to TC Energy in connection with this funding. APMC will repay these loans to TC Energy in six equal monthly installments, commencing July 2020, concurrent with APMC’s monthly contributions from July to December.
APMC will earn accretion on its equity contributions paid until March 31, 2026, at a rate of 6% per annum, increasing to 10% per annum on and after September 1, 2033, if the KXL pipeline is not in-service, with a minimum guaranteed rate of 4% per annum when APMC’s equity contributions are repurchased by TC Energy. In addition, APMC will earn a loan guarantee fee (0.5% of TC Energy’s debt outstanding, subject to escalation if the loan guarantee is outstanding 480 days following project completion) starting in 2021 when TC Energy obtains debt financing. Approximately one year after project completion, TC Energy will pay to APMC the value of the outstanding equity contributions and accretion earned thereon. TC Energy will pay the loan guarantee fee at the same time as APMC’s debt guarantees are released. This is also anticipated to occur approximately one year after project completion.
Legal Actions
At March 31, 2020, the government business enterprises were involved in various legal actions. Accruals have been made in specific instances where it is probable that losses will be incurred which can be reasonably estimated. The resulting loss, if any, from claims in excess of the amounts accrued cannot be determined.
Of the various legal actions, the government business enterprises are jointly or separately named as a defendant in 20 (2019: 21) legal claims of which the outcome is not determinable. Of the 20 claims, 17 (2019: 16) have
| | |
Government of Alberta | Annual Report 2019 – 2020 | | 53 |
CONSOLIDATED FINANCIAL STATEMENTS
| | | | |
EQUITY IN GOVERNMENT BUSINESS ENTERPRISES | | | SCHEDULE 8 (continued) | |
specified amounts totaling approximately $47 million (2019: $252 million) and three claims (2019: five) have no specified amount. The government business enterprises are also named in nil (2019: one) claims, the outcome of which is likely and has a specific amount of $nil (2019: $1 million). One (2019: one) claim totaling approximately $0.2 million (2019: $1 million) is covered by the Alberta Risk Management Fund.
BP
In addition to legal actions disclosed above, on June 12, 2019, the BP received a statement of claim from a power producer seeking $18 million in damages from the BP. The BP has filed a statement of defense and will vigorously defends its position. The BP is of the opinion the statement of claim is without merit. Furthermore, Section 92 of the Electric Utilities Act provides the BP with strong liability protection for such claims. As at March 31, 2020, no contingent liability has been recorded, as the BP does not expect a material outflow.
Measurement Uncertainty
APMC
The Province, through its agent APMC, is party to the Partnership. The APMC has used judgement to estimate the net present value of the processing agreement with the Partnership, as well as to estimate the monthly toll commitments in this disclosure.
BP
The estimates and assumptions made in BP’s audited financial statements and financial results from January 1 to March 31, 2020 are subject to measurement uncertainty. There is a significant risk of a material adjustment to the carrying amounts of assets and liabilities within the next financial year. In addition, the BP’s provisions for onerous contracts have been recorded at the lower of the present value of continuing the PPAs and the expected costs of terminating them.
| | |
| | |
| 54 | | Government of Alberta | Annual Report 2019 – 2020 |
CONSOLIDATED FINANCIAL STATEMENTS
| | |
| EQUITY IN GOVERNMENT BUSINESS ENTERPRISES | | SCHEDULE 8 (continued) |
Derivative Contracts
ATB Financial has the following derivatives:
| | | | | | | | |
| | | 2020 | | | 2019 | |
| | | Fair value | | | Fair value | |
| | | In | | | millions | |
| | |
Interest rate derivatives (a) | | $ | 348 | | | $ | 82 | |
Cross currency interest rate swaps | | | 122 | | | | 8 | |
Forward commodity contracts (b) | | | 21 | | | | 42 | |
Foreign currency derivatives | | | 57 | | | | 5 | |
Future contracts | | | 4 | | | | (1 | ) |
Embedded derivatives | | | (2 | ) | | | (1 | ) |
Net derivative-related investments | | $ | 550 | | | $ | 135 | |
| (a) | The exposure to credit risk on the fair value of derivatives of $1,540 million (2019: $642 million) is impacted by $576 million (2019: $335 million) resulting from entering into master netting agreements and is reduced by $637 million (2019: $158 million) in collateral agreements with counterparties resulting in a residual credit exposure of $327 million (2019: $149 million) of the derivative assets and $369 million (2019: $71 million) of the derivative liability. |
| (b) | Commodity price risk arises when ATB Financial offers deposit or derivative products where the value of the derivative instrument or rate of return on the deposit is linked to changes in the price of the underlying commodity. ATB Financial uses commodity-linked derivatives to fully hedge associated commodity risk exposure on these products and does not accept any net direct commodity price risk. |
Pension Liabilities
The government business enterprises have pension liabilities of $26 million (2019: $140 million) comprised of $72 million (2019: $132 million) for employees in the Public Service Pension Plan, the Management Employees Pension Plan, the Supplementary Retirement Plan for Public Service Managers and $46 million in pension assets (2019: $8 million pension liability) in other pension plans.
Subsequent Events
APMC
Subsequent to year end, the APMC borrowed $301 million from the Province at variable rates of interest and repayment terms.
Sturgeon Refinery
In April 2020, the Refinery successfully transitioned from primarily processing synthetic crude feedstock to bitumen feedstock and reached commercial operations in May 2020. As a result, the criteria to achieve a June 1, 2020, COD was achieved. COD is defined in the Processing Agreements as “the first Day of the Month immediately following the Month, in which, for the first time, the Facility has for 30 consecutive Days (which may span more than one Month) received and processed into the products intended to be produced therefrom a quantity of Bitumen that is not less than 50% of the Design Capacity.
COVID-19
The outbreak of Covid-19 pandemic has caused global economic uncertainty, which may affect prices and demand for Sturgeon Refinery’s refined products, temporarily disrupt supply chain and transportation services or result in a temporary loss of skilled labour. This may cause temporary operational reductions and higher costs. The duration and severity of these developments remain unknown but may have an impact on the financial results of APMC in future periods.
| | |
| Government of Alberta | Annual Report 2019 – 2020 | | 55 |
CONSOLIDATED FINANCIAL STATEMENTS
| | |
| EQUITY IN GOVERNMENT BUSINESS ENTERPRISES | | SCHEDULE 8 (continued) |
In addition, COVID-19 pandemic may affect the cost and timing of when the KXL Expansion pipeline comes into service. The duration and severity of these developments remain unknown but may have an impact on the financial results of APMC in future periods.
| | |
| LOANS AND ADVANCES | | SCHEDULE 9 |
| | | | | | | | |
| | | 2020 | | | 2019 | |
| | | In | | | millions | |
Loans and advances made under the authority of: | | | | | | | | |
Alberta Capital Finance Authority Act (a) | | $ | 14,324 | | | $ | 14,528 | |
Student Loan Act (b) | | | 3,584 | | | | 3,225 | |
Agriculture Financial Services Act (c) | | | 2,448 | | | | 2,305 | |
Oil and Gas Conservation Act (d) | | | 173 | | | | 129 | |
Seniors’ Property Tax Deferral Act | | | 31 | | | | 26 | |
Seniors’ Home Adaptation and Repair Act | | | 22 | | | | 18 | |
Alberta Housing Act | | | 21 | | | | 22 | |
Financial Administration Act | | | 5 | | | | 5 | |
Alberta Treasury Branches Act (e) | | | - | | | | 339 | |
| | | 20,608 | | | | 20,597 | |
Less allowance for doubtful accounts (b) | | | 434 | | | | 366 | |
| | | $ | 20,174 | | | $ | 20,231 | |
The loan repayment terms are as follows:
| | | | | | | | | | | | |
| | | Principal (f) | | | Interest | | | Total payments | |
| | | In millions | |
2020-21 | | $ | 1,123 | | | $ | 616 | | | $ | 1,739 | |
2021-22 | | | 1,211 | | | | 606 | | | | 1,817 | |
2022-23 | | | 1,141 | | | | 566 | | | | 1,707 | |
2023-24 | | | 1,106 | | | | 528 | | | | 1,634 | |
2024-25 | | | 1,108 | | | | 489 | | | | 1,597 | |
Thereafter | | | 12,915 | | | | 3,281 | | | | 16,196 | |
| | | $ | 18,604 | | | $ | 6,086 | | | $ | 24,690 | |
| (a) | Alberta Capital Finance Authority maintains a loan portfolio consisting of several different borrower categories, each with their own source of security to ensure repayment. Municipal loans on average yield 3.7% (2019: 3.8%) per annum. |
| (b) | Student loans become payable and interest is earned starting six months after students discontinue their studies or graduate. Loans are unsecured and repayable to a maximum term of 114 months. The interest rates on student loans are a floating rate of prime or a fixed rate of prime plus 2%. |
Allowance for doubtful accounts includes allowance for repayment assistance, impaired loans, and loan subsidy.
The allowance for repayment assistance is a provision that estimates the amount of loans receivable that will be forgiven through the repayment assistance program. The key assumptions used to determine the provision are future loan amounts approved for repayment assistance and loan forgiveness rates 11.3% (2019: 9.5%).
The allowance for impaired loans is a provision that estimates the amount of loans receivable that will be impaired. The key assumptions used to determine this provision are default rates of 5.3% (2019: 5.3%) and recovery rates of 24.2% (2019: 25.3%).
The allowance for loan subsidy is a provision that reflects the future benefit provided to students. The key assumptions used to determine this provision are a blended student lending rate of 3.4% (2019: 3.3%), the annual average provincial borrowing rate of 2.3% (2019: 2.9%) for similar maturities, the average repayment period of 10 years (2019: 10 years), default rate assumptions, and Repayment Assistance Plan rate assumptions.
| | |
| | |
| 56 | | Government of Alberta | Annual Report 2019 – 2020 |
CONSOLIDATED FINANCIAL STATEMENTS
| | |
| LOANS AND ADVANCES | | SCHEDULE 9 (continued) |
On March 19, 2020, the government announced that “Alberta Student Loan repayments will be paused for six months, beginning March 30, 2020. Interest will not accrue during this period.” To account for this, the loan subsidy provision expense and allowance was increased by $17 million this fiscal year.
| (c) | The weighted average annual interest rate of the Agricultural Financial Services loan portfolios is 4.0% (2019: 4.0%). |
Loans have fixed interest rates for the term of the loan or renewal period. Loans have blended repayments during the term and can be repaid in full or part during the term without penalty. The loans are secured by tangible assets consisting predominantly of land followed by buildings, equipment and other assets. The estimated values of such assets are $5.7 billion (2019: $5.2 billion).
| (d) | Pursuant to section 76.2 of the Oil and Gas Conservation Act, the Province entered into an agreement with Alberta Oil and Gas Orphan Abandonment and Reclamation Association (also known as Orphan Well Association or OWA) to provide OWA with a series of interest-free loan advances to clean up orphaned oil and gas wells. A discount of $22 million (2019: $15 million) for the present value of foregone interest will be amortized to revenue in subsequent periods over the remaining life of the loan. |
| (e) | Pursuant to the Alberta Treasury Branches Act, the Province assessed a charge to ATB Financial as prescribed by the Alberta Treasury Branches Regulation. The payment in lieu of tax was settled by issuing subordinated debentures calculated as 23% of net income. On December 18, 2019, ATB Financial repaid all of its subordinated debentures. |
| (f) | Some loans, such as loans under Student Loan Act, are excluded from the repayment schedule as no terms of repayment have been established |
| | |
| ACCOUNTS PAYABLE AND OTHER ACCRUED LIABILITIES | | SCHEDULE 10 |
| | | | | | | | |
| | | 2020 | | | 2019 | |
| | | In | | | millions | |
| | |
Salaries, wages, employment contracts and benefits | | $ | 2,917 | | | $ | 2,919 | |
Grants | | | 1,506 | | | | 1,345 | |
Corporate income tax receipts in abeyance and tax refunds payable | | | 1,423 | | | | 1,111 | |
Collateral received (a) | | | 1,357 | | | | - | |
Coal phase-out agreements | | | 914 | | | | 983 | |
Unearned revenue | | | 746 | | | | 711 | |
Accrued interest | | | 645 | | | | 611 | |
Other accounts payable and accrued liabilities | | | 4,369 | | | | 3,894 | |
| | | $ | 13,877 | | | $ | 11,574 | |
| (a) | The Province received cash collateral from counterparties under the terms of the CSA agreements as disclosed in Note 3. |
The debt for the Province is as follows:
| | | | | | | | |
| | | 2020 | | | 2019 | |
| | | In | | | millions | |
| | |
Direct borrowings | | $ | 89,170 | | | $ | 77,845 | |
Liabilities under public private partnerships | | | 3,038 | | | | 2,946 | |
Capital lease liabilities | | | 230 | | | | 228 | |
| | | $ | 92,438 | | | $ | 81,019 | |
| | |
| Government of Alberta | Annual Report 2019 – 2020 | | 57 |
CONSOLIDATED FINANCIAL STATEMENTS
| | |
| DEBT | | SCHEDULE 11 (continued) |
The consolidated gross debt of the Province totaling $98,467 million (2019: $86,168 million) is comprised of debt of the Province of $92,438 million (2019: $81,019 million) and debt issued on behalf of government business enterprises totaling $6,029 million (2019: $5,149 million).
The consolidated gross debt servicing cost of the Province totaling $2,345 million (2019: $2,097 million) is comprised of $2,235 million (2019: $1,971 million) on debt of the Province and $110 million (2019: $126 million) on debt issued on behalf of government business enterprises.
Direct Borrowings
The Province meets financing requirements set out in the Fiscal Plan by issuing bonds and promissory notes in the domestic and international capital markets. As at March 31, 2020, the maturity schedule for the Province’s outstanding borrowing are as follows:
| | | | | | | | | | | | | | | | | | | | | | | | |
| Fiscal Year of Maturity Ending March 31 | | Direct Borrowings (a) | |
| | | Effective | | | | | | (in Canadian dollars) | | | 2020 | | | 2019 | |
| | | interest
rate (b) | | | Canadian
dollar | | | US
dollar | | | Other
currencies | | | Total | | | Total | |
| | | | | | | | | In millions | | | | | | | |
Floating rate debt | | | | | | | | | | | | | | | | | | | | | | | | |
2021 | | | 1.46 | % | | $ | 480 | | | $ | - | | | $ | - | | | $ | 480 | | | $ | 480 | |
Fixed rate debt | | | | | | | | | | | | | | | | | | | | | | | | |
2020 | | | - | | | | - | | | | - | | | | - | | | | - | | | | 10,007 | |
2021 | | | 1.58 | % | | | 7,481 | | | | 7,296 | | | | - | | | | 14,777 | | | | 4,624 | |
2022 | | | 1.45 | % | | | 2,912 | | | | 702 | | | | 1,309 | | | | 4,923 | | | | 4,928 | |
2023 | | | 2.45 | % | | | 2,807 | | | | 1,891 | | | | 431 | | | | 5,129 | | | | 5,134 | |
2024 | | | 3.00 | % | | | 1,765 | | | | 5,006 | | | | 70 | | | | 6,841 | | | | 6,847 | |
2025 | | | 2.19 | % | | | 2,623 | | | | 2,965 | | | | - | | | | 5,588 | | | | - | |
2021 - 2025 (< 5 years) | | | 2.04 | % | | | 18,068 | | | | 17,860 | | | | 1,810 | | | | 37,738 | | | | 32,020 | |
2026-2030 (6-10 years) | | | 2.78 | % | | | 15,147 | | | | 2,932 | | | | 6,377 | | | | 24,456 | | | | 22,334 | |
2031-2040 (11-20 years) | | | 2.96 | % | | | 7,758 | | | | - | | | | 71 | | | | 7,829 | | | | 5,508 | |
2040-2121 (> 21 years) | | | 3.22 | % | | | 18,300 | | | | - | | | | 1,100 | | | | 19,400 | | | | 18,313 | |
Total direct borrowings issued at face value | | | 2.57 | % | | $ | 59,273 | | | $ | 20,792 | | | $ | 9,358 | | | $ | 89,423 | | | $ | 78,175 | |
Unamortized discount | | | | | | | | | | | | | | | | | | | (253 | ) | | | (330 | ) |
Total direct borrowings | | | | | | | | | | | | | | | | | | $ | 89,170 | | | $ | 77,845 | |
| (a) | Direct borrowings include the following foreign currency denominated debt that is fully hedged to Canadian dollars to eliminate exposure to future fluctuations in exchange rates. Fully hedged foreign currency debt is translated into Canadian dollars at the rate of exchange established by the hedging instrument. |
| | | | | | | | | | | | | | | | |
| | | Debt at par | | | Debt at cost (CAD$) | |
| Fully Hedged Foreign Currency | | 2020 | | | 2019 | | | 2020 | | | 2019 | |
US dollars | | $ | 15,786 | | | $ | 13,330 | | | $ | 20,771 | | | $ | 17,521 | |
Euros | | € | 3,507 | | | € | 3,387 | | | | 5,351 | | | | 5,164 | |
Swedish Kronor | | SEK | 2,500 | | | SEK | 2,500 | | | | 357 | | | | 357 | |
British pounds sterling | | £ | 1,050 | | | £ | 1,050 | | | | 1,740 | | | | 1,740 | |
Australian dollars | | $ | 1,050 | | | $ | 965 | | | | 1,019 | | | | 947 | |
South African Rand | | ZAR | 750 | | | ZAR | 750 | | | | 70 | | | | 70 | |
Swiss francs | | CHF | 585 | | | CHF | 325 | | | | 820 | | | | 436 | |
| (b) | The effective interest rate is based on the weighted average of debt issues. The effective rate is the rate that exactly discounts estimated future cash payments through the expected term of the debt to the net carrying amount and includes the effects of interest rate and currency swaps. |
| | |
| | |
| 58 | | Government of Alberta | Annual Report 2019 – 2020 |
CONSOLIDATED FINANCIAL STATEMENTS
| | |
| DEBT | | SCHEDULE 11 (continued) |
Liabilities under Public Private Partnerships
The Province has entered into 33 to 35 year contracts for the design, finance, build, operations and maintenance of ring road segments under the following P3: Anthony Henday - South East, North West and North East Edmonton Ring Road, and Stoney Trail - North East, South East and South West Calgary Ring Road. The Province has entered into 32-year contracts for the design, finance, build, and maintenance of schools under the Alberta Schools Alternative Procurement Phase 1, Phase 2 and Phase 3 projects. These contracts include a construction period followed by a 30-year operations period for the ring roads and a 30-year maintenance period for the schools. The Province has also entered into a 12-year contract for the design, finance, build and operation of the Evan Thomas Water & Wastewater Treatment Facilities which includes a construction period followed by a 10-year operations period.
The details of the contract under construction are as follows:
| | | | | | | | |
| | | Contractor | | Date contract entered into | | Scheduled
completion date | | Date capital
payments begin |
South West Calgary Ring Road | | Mountain View General Partners General Partnership | | September 2016 | | October 2021 | | October 2020 |
The details of the contracts for those projects that are already operational are as follows:
| | | | | | | | |
| | | Contractor | | Date contract entered into | | Completion date | | Date capital payments began |
| Anthony Henday – South | | Access Roads | | January 2005 | | October 2007 | | November 2007 |
East Edmonton Ring Road | | Edmonton Ltd. | | | | | | |
| Stoney Trail – North | | Stoney Trail Group | | February 2007 | | October 2009 | | November 2009 |
East Calgary Ring Road | | | | | | | | |
| Alberta Schools Alternative | | BBPP Alberta | | September 2008 | | June 2010 | | July 2010 |
Procurement Phase 1 | | Schools Ltd. | | | | | | |
| Anthony Henday – North | | NorthwestConnect | | July 2008 | | October 2011 | | November 2011 |
West Edmonton Ring Road | | General Partnership | | | | | | |
| Alberta Schools Alternative | | B2L Partnership | | April 2010 | | June 2012 | | August 2012 |
Procurement Phase 2 | | | | | | | | |
| Stoney Trail – South | | Chinook Roads | | March 2010 | | November 2013 | | November 2013 |
East Calgary Ring Road | | Partnership | | | | | | |
| Alberta Schools Alternative | | ABC Schools | | September 2012 | | June 2014 | | July 2014 |
Procurement Phase 3 | | Partnership | | | | | | |
| Evan Thomas Water & | | EPCOR Water | | October 2012 | | August 2014 | | August 2014 |
Wastewater Treatment Facilities | | Services Inc. | | | | | | |
| Anthony Henday – North East | | Capital City Link | | May 2012 | | September 2016 | | October 2016 |
Edmonton Ring Road | | General Partnership | | | | | | |
| | |
| Government of Alberta | Annual Report 2019 – 2020 | | 59 |
CONSOLIDATED FINANCIAL STATEMENTS
| | |
| DEBT | | SCHEDULE 11 (continued) |
The calculation of the P3 liabilities is as follows:
| | | | | | | | |
| | | 2020 | | | 2019 | |
| | | In | | | millions | |
| | |
Liabilities beginning of year | | $ | 2,946 | | | $ | 2,882 | |
Additions to liabilities during the year | | | 159 | | | | 128 | |
Principal payments | | | (67 | ) | | | (64 | ) |
Liabilities end of year | | $ | 3,038 | | | $ | 2,946 | |
Estimated payment requirements for each of the next five years and thereafter are as follows:
| | | | |
| Capital Payments | | | |
| | | In millions | |
| |
2020-21 | | $ | 193 | |
2021-22 | | | 205 | |
2022-23 | | | 210 | |
2023-24 | | | 209 | |
2024-25 | | | 209 | |
Thereafter | | | 3,809 | |
| | | 4,835 | |
Less net present value of interest | | | (1,797 | ) |
Total liabilities | | $ | 3,038 | |
The capital payments for P3 are fixed, equal monthly payments for the privately financed portion of the costs of building the infrastructure. The present value of these capital payments is recorded as a liability on the Consolidated Statement of Financial Position.
Capital Lease Liabilities
Capital lease liabilities consist of the present value of the minimum lease payments related to leased capital assets. The Province has lease agreements with terms up to 25 years with interest rates ranging between 1.8% and 4.7%.
The following is a breakdown of capital lease liabilities by major category:
| | | | | | | | |
| | | 2020 | | | 2019 | |
| | | In | | | millions | |
| | |
Building | | $ | 166 | | | $ | 152 | |
Equipment | | | 11 | | | | 11 | |
Other | | | 53 | | | | 65 | |
| | | $ | 230 | | | $ | 228 | |
Major leases include:
| | • | | Bentall Investment Management building administration for Calgary Board of Education of $103 million (2019: $109 million) with weighted average interest rate of 4.7% and maturing February 28, 2031. |
| | • | | EPIC Systems, Inc. of $47 million (2019: $65 million) for the perpetual license of a clinical information system with weighted average interest rate of 3.4% and maturing August 14, 2027. |
| | |
| | |
| 60 | | Government of Alberta | Annual Report 2019 – 2020 |
CONSOLIDATED FINANCIAL STATEMENTS
| | |
| DEBT | | SCHEDULE 11 (continued) |
| | • | | School buildings for eight (2019: six) school jurisdictions of $26 million (2019: $25 million) with weighted average interest rate of 4.0% and latest maturity on August 31, 2044. |
Aggregate lease payments for each of the next five years and thereafter are as follows:
| | | | |
| Lease Payments | | | |
| | | In millions | |
| |
2020-21 | | $ | 45 | |
2021-22 | | | 45 | |
2022-23 | | | 31 | |
2023-24 | | | 18 | |
2024-25 | | | 17 | |
Thereafter | | | 126 | |
Total lease payments | | | 282 | |
Less interest | | | (52 | ) |
Total capital lease liabilities | | $ | 230 | |
| | |
| PENSION PLANS AND OTHER DEFINED BENEFIT PLANS | | SCHEDULE 12 |
Pension Plans
The President of Treasury Board, Minister of Finance is the trustee for the following pension plans under the Public Sector Pension Plans Act: Management Employees Pension Plan (MEPP), and the Public Service Management (Closed Membership) Pension Plan (PSMC). The President of Treasury Board, Minister of Finance is also the trustee for the Provincial Judges and Masters in Chambers (Registered) Pension Plan (PJMCPP) under the Provincial Court Act and the Supplementary Retirement Plan for Public Service Managers (MSRP) under the Supplementary Retirement Plan – Retirement Compensation Arrangement Directive (Treasury Board Directive 01/06). All of these pension plans are open with the exception of PSMC.
On March 1, 2019, Local Authorities Pension Plan (LAPP), Public Service Pension Plan (PSPP) and Special Forces Pension Plan (SFPP) transitioned to a joint governance structure in accordance with the Joint Governance of Public Sector Pension Plans Act passed on December 5, 2018. On the transition date, ownership of the Plan fund transferred from the President of Treasury Board and Minister of Finance as the trustee to the newly established LAPP Corporation, PSPP Corporation and SFPP Corporation respectively. The corporation of each plan is the administrator and trustee of these plans. Under joint governance, a Sponsor Board comprising nominees from employee and employer sponsor organizations governs and is responsible for each plan.
Financial statements for MEPP, PSMC, PJMCPP and MSRP as of their December 31, 2019 year end or March 31, 2020 year end are included as supplementary information in the Ministry of Treasury Board and Finance Annual Report. Financial statements for LAPP, PSPP and SFPP are available on respective corporation’s website. All of the plans, except PJMCPP, are multi-employer plans.
The Teachers’ Pension Plan (Teachers’) and the Universities Academic Pension Plan (UAPP) are administered by their respective boards.
In addition to the aforementioned plans, there are several agencies which maintain their own plans to compensate senior staff members that do not participate in the regular government pension plans. These entities include the Alberta Innovates, Alberta Energy Regulator, Alberta Utilities Commission, Alberta Securities Commission and some SUCH sector entities. Summaries of these plans are included in these financial statements as Supplementary Executive Retirement Plans (SERP) and Supplementary Pension Plans (SPP). Additional information can be found in the entities’ financial statements.
| | |
| Government of Alberta | Annual Report 2019 – 2020 | | 61 |
CONSOLIDATED FINANCIAL STATEMENTS
| | |
| PENSION PLANS AND OTHER DEFINED BENEFIT PLANS | | SCHEDULE 12 (continued) |
The following is a summary of the plans for the year ended March 31, 2020:
| | | | | | | | | | | | | | | | | | | | | | | | | | | | |
Defined benefit pension plans | | Approximate
number of
active
employees | | | Average age
of active
employees | | | Approximate
number of former
employees entitled
to future benefits (b) | | | Approximate
number of
retirees
receiving
benefits | | | Employee
contributions | | | Employer
contributions | | | Benefit
payments | |
| | | | | | | | | | | | | | | In millions | |
| | | | | | | |
LAPP | | | 167,639 | | | | 46 | | | | 34,769 | | | | 72,756 | | | $ | 1,130 | | | $ | 1,212 | | | $ | 1,745 | |
PSPP | | | 41,497 | | | | 45 | | | | 15,703 | | | | 28,193 | | | | 336 | | | | 327 | | | | 627 | |
MEPP | | | 5,234 | | | | 49 | | | | 1,262 | | | | 5,860 | | | | 81 | | | | 101 | | | | 253 | |
MLAPP (a) | | | - | | | | - | | | | - | | | | 101 | | | | - | | | | - | | | | 3 | |
MSRP | | | 944 | | | | 53 | | | | 255 | | | | 1,222 | | | | 3 | | | | 3 | | | | 8 | |
PJMCPP (Unregistered) PP | | | 123 | | | | 62 | | | | 5 | | | | 164 | | | | 1 | | | | 1 | | | | 9 | |
PJMCPP (Registered) PP | | | 123 | | | | 62 | | | | 7 | | | | 176 | | | | 1 | | | | 4 | | | | 9 | |
PSMC (a) | | | - | | | | - | | | | 48 | | | | 1,539 | | | | - | | | | - | | | | 46 | |
SFPP (a) | | | 4,528 | | | | 41 | | | | 243 | | | | 2,732 | | | | 59 | | | | 63 | | | | 134 | |
Teachers’ Pre-1992 | | | 4,129 | | | | 56 | | | | 772 | | | | 26,499 | | | | - | | | | - | | | | 486 | |
Teachers’ Post-1992 | | | 40,775 | | | | 42 | | | | 9,981 | | | | 25,639 | | | | 420 | | | | 402 | | | | 584 | |
UAPP Pre-1992 (a) | | | 415 | | | | 63 | | | | N/A | | | | 3,783 | | | | - | | | | - | | | | 134 | |
UAPP | | | 8,150 | | | | 49 | | | | 2,363 | | | | 5,880 | | | | 135 | | | | 146 | | | | 285 | |
| (a) | During the year, these plans also received contributions, primarily related to pre-1992 commitments, from the Province as follows: PSMC $44 million, SFPP $6 million, UAPP Pre-1992 $12 million and MLAPP $4 million. |
| (b) | Includes vested former employees in the pension plan and non-vested former employees entitled to a refund of their contributions. |
The plans provide a defined benefit retirement income based on a formula for each plan that considers final average years of salary, length of service and a percentage ranging from 1.4% to 2.0% per year of service.
The Province accounts for the liabilities for pension obligations on a defined benefit basis as a participating employer for former and current employees in LAPP, MEPP, MSRP, PJMCPP, PSPP, Teachers’ and UAPP for the government’s consolidated reporting entities except for government business enterprises that are required to account directly for participation in the public service pension plans under IFRS.
In addition, the Province accounts for the specific commitments made for pre-1992 pension obligations to the Teachers’, PSMC, UAPP and SFPP. In 1992, there was pension plan reform resulting in pre-1992 and post-1992 arrangements for several pension plans.
The Province also accounts for the obligation to the Members of the Legislative Assembly Pension Plan (MLAPP).
| | |
| | |
| 62 | | Government of Alberta | Annual Report 2019 – 2020 |
CONSOLIDATED FINANCIAL STATEMENTS
| | |
| PENSION PLANS AND OTHER DEFINED BENEFIT PLANS | | SCHEDULE 12 (continued) |
The following table contains summary information on these specific pension plans. Complete financial reporting is available through each pension plan. Pension liabilities are as follows:
| | | | | | | | | | | | |
| | | 2020 | | | 2019 | |
| | | Pension
liabilities | | | Pension provision
(recovery)
(Schedule 3) | | | Pension
liabilities | |
| | | | | | In millions | | | | |
Liabilities for the Province’s employer share for former and current employees | | | | | | | | | | | | |
LAPP (a) | | $ | - | | | $ | - | | | $ | - | |
MEPP (b) | | | - | | | | - | | | | - | |
MSRP (c) | | | 67 | | | | (3 | ) | | | 70 | |
PJMCPP (d) | | | - | | | | - | | | | - | |
PSPP (e) | | | - | | | | - | | | | - | |
Teachers’ (f) | | | 215 | | | | (125 | ) | | | 340 | |
UAPP (g) | | | 167 | | | | 7 | | | | 160 | |
SERP and SPP (h) | | | 81 | | | | 3 | | | | 78 | |
| | | 530 | | | | (118 | ) | | | 648 | |
Liabilities for the Province’s commitment towards pre-1992 obligations | | | | | | | | | | | | |
Teachers’ (f) | | | 7,554 | | | | (185 | ) | | | 7,739 | |
PSMC (i) | | | 449 | | | | (24 | ) | | | 473 | |
UAPP (g) | | | 266 | | | | 7 | | | | 259 | |
SFPP (g) | | | 81 | | | | (12 | ) | | | 93 | |
| | | 8,350 | | | | (214 | ) | | | 8,564 | |
MLAPP (j) | | | 38 | | | | (2 | ) | | | 40 | |
| | | $ | 8,918 | | | $ | (334) | | | $ | 9,252 | |
The following is a description of each pension plan:
| (a) | The LAPP is a contributory defined benefit pension plan for eligible employees of local authorities and approved public bodies. These include cities, towns, villages, municipal districts, hospitals, Alberta Health Services, school divisions, school districts, colleges, technical institutes and certain commissions, foundations, agencies, libraries, corporations, associations and societies. In accordance with the Employment Pension Plans Act, as modified by the Joint Governance of Public Sector Pension Plans Act and the Exemption (Public Section Pension) Regulation (AR 3/2019) under the Employment Pension Plans Act, the actuarial deficiencies as determined by actuarial funding valuations are expected to be funded by special payments currently totaling 3.02% of pensionable earnings shared equally between employers and employees until December 31, 2034. Current services costs are funded by employers and employees. |
| (b) | The MEPP is a contributory defined benefit pension plan for eligible management employees of the Province and certain approved provincial agencies and public bodies. Members of the former Public Service Management Pension Plan who were active contributors at August 1, 1992, and have not withdrawn from the Plan since that date, continue as members of this Plan. In accordance with the Public Sector Pension Plans Act, the actuarial deficiencies as determined by the December 31, 2018 actuarial funding valuation was being funded by special payments totaling 4.96% of pensionable earnings shared between employees and employers until December 31, 2019 and 0.00% thereafter. |
| (c) | The MSRP is a contributory defined benefit pension plan for certain public service managers of designated employers who participate in the MEPP and whose annual salary exceeds the maximum pensionable salary limit under the Income Tax Act. The Plan is supplementary to the MEPP. The contribution rates in effect at December 31, 2019 were at 12.8% (2018: 12.8%) of pensionable salary in excess of the maximum pensionable salary limit for eligible employees and designated employers. |
| | |
| Government of Alberta | Annual Report 2019 – 2020 | | 63 |
CONSOLIDATED FINANCIAL STATEMENTS
| | |
| PENSION PLANS AND OTHER DEFINED BENEFIT PLANS | | SCHEDULE 12 (continued) |
| (d) | The Provincial Judges and Masters in Chambers Registered and Unregistered Pension Plans collectively are contributory defined benefit pension plans for Judges and Masters in Chambers of the Province. Current service costs in the Registered Plan are funded by the Province and plan members at rates which are expected to provide for all benefits payable under the Plan. The rates in effect at March 31, 2020 are 7% of capped salary for plan members and 19.56% of capped salary for the Province. The Unregistered Plan contribution rates in effect at March 31, 2020 are unchanged at 7% of pensionable salary in excess of capped salary for members and 7% of the excess for the Province. Benefits are payable by the Province if assets are insufficient to pay for all benefits under the plans. |
| (e) | The PSPP is a contributory defined benefit pension plan for eligible employees of the Province, approved provincial agencies and public bodies. In accordance with the Employment Pension Plans Act, as modified by the Joint Governance of Public Sector Pension Plans Act and the Exemption (Public Section Pension) Regulation (AR 3/2019) under the Employment Pension Plans Act, the actuarial deficiencies as determined by an actuarial funding valuation are expected to be funded by special payments currently totaling 3.42% of pensionable earnings shared equally between employees and employers until June 30, 2026. Current services costs are funded by employers and employees. |
| (f) | The Teachers’ Pension Plans Act requires all teachers under contract with jurisdictions in Alberta to contribute to the Teachers’ Pension Plan. The Province assumed responsibility for the entire unfunded pre-1992 pension obligation of the Teachers’ Pension Plan. In 2009-10 there was a repayment of $1,187 million towards the liability. As of September 1, 2009, the costs of all benefits under the Pre-1992 Plan are paid by the Province. |
| (g) | Under the Employment Pension Plans Act, as modified by the Joint Governance of Public Sector Pension Plans Act and the Exemption (Public Section Pension) Regulation (AR 3/2019) under the Employment Pension Plans Act, the Province has a liability for payment of additional contributions under defined benefit pension plans for certain employees of municipalities and post-secondary educational institutions. The plans are the Universities Academic and the Special Forces plans. |
For the UAPP, the unfunded liability for service credited prior to January 1, 1992 is being financed by additional contributions of 1.25% of pensionable salaries by the Province, and contributions by employers and employees to fund the remaining amount, as determined by the plan valuation, over the period ending on or before December 31, 2043. Employers and employees fund current service costs.
For the SFPP, the unfunded liability for service credited prior to January 1, 1992 is being financed by additional contributions in the ratio of 1.25% by the Province and 0.75% each by employers and employees, over the period ending on or before December 31, 2036. Current service costs are funded by employers and employees. The Act provides that payment of all benefits arising from pensionable service prior to 1994, excluding post-1991 cost of living adjustment benefits, is guaranteed by the Province.
| (h) | Certain consolidated entities provide defined supplementary executive retirement plans for certain management staff, and other benefit plans for all or specific groups of staff, depending on the plans. The cost of these benefits are actuarially determined on an annual basis using the projected benefit method pro-rated on services, a market interest rate, and management’s best estimate of expected costs and the period of benefit coverage. |
| (i) | The PSMC provides benefits to former members of the Public Service Management Pension Plan who were retired, were entitled to receive a deferred pension or had attained 35 years of service before August 1, 1992. The costs of all benefits under the Plan are paid by the Province. |
| (j) | The Province has a liability for payment of pension benefits under a defined benefit pension plan for Members of the Legislative Assembly. Active participation in this plan was terminated as of June 1993, and no benefits can be earned for service after this date. The costs of all benefits under the plan are paid by the Province. |
| | |
| | |
| 64 | | Government of Alberta | Annual Report 2019 – 2020 |
CONSOLIDATED FINANCIAL STATEMENTS
| | |
| PENSION PLANS AND OTHER DEFINED BENEFIT PLANS | | SCHEDULE 12 (continued) |
The liability for pension obligations as a participating employer is as follows:
As at March 31, 2020
| | | | | | | | | | | | | | | | | | | | | | | | | | | | | | | | |
| | | | | | | | | |
| | | | | | | | | | | | Teachers’ | | | | | | | | | 2020 | | | 2019 | |
| | | | | | | | | | | | Pension | | | | | | | | | | | | | |
| | | | | | | | | | | | Plan | | | | | | | | | | | | | |
| | | LAPP | | | MEPP | | | PSPP | | | Post-1992 | | | UAPP | | | Others (e) | | | Total | | | Total | |
| | | | | | | | | | | | In millions | | | | | | | | | | | | | |
| | | | | | | | |
Net assets available for benefits (a) | | $ | 50,520 | | | $ | 5,635 | | | $ | 15,418 | | | $ | 17,957 | | | $ | 4,819 | | | $ | 702 | | | | | | | | | |
Pension obligation (a) | | | 42,607 | | | | 4,627 | | | | 12,658 | | | | 17,065 | | | | 6,095 | | | | 829 | | | | | | | | | |
Pension plan (surplus)/deficit | | | (7,913 | ) | | | (1,008 | ) | | | (2,760 | ) | | | (892 | ) | | | 1,276 | | | | 127 | | | | | | | | | |
Unamortized gains/(losses) (b) | | | 3,034 | | | | (335 | ) | | | 737 | | | | 1,302 | | | | 618 | | | | (12 | ) | | | | | | | | |
Timing differences (c) | | | 3,129 | | | | 790 | | | | 1,793 | | | | - | | | | - | | | | 23 | | | | | | | | | |
(Accrued benefit asset)/Future benefit liability | | $ | (1,750 | ) | | $ | (553 | ) | | $ | (230 | ) | | $ | 410 | | | $ | 1,894 | | | $ | 138 | | | | | | | | | |
| | | | | | | | |
(Asset)/Liability for the Province’s share for former and current employees | | | (533 | ) | | | (305 | ) | | | (102 | ) | | | 214 | | | | 167 | | | | 137 | | | | (422 | ) | | | 39 | |
Valuation adjustment (d) | | | 533 | | | | 305 | | | | 102 | | | | - | | | | - | | | | 11 | | | | 951 | | | | 609 | |
Liability for the Province’s commitment towards pre-1992 obligation | | | | | | | | | | | | | | | | | | | | | | | | | | | 8,351 | | | | 8,564 | |
MLAPP | | | | | | | | | | | | | | | | | | | | | | | | | | | 38 | | | | 40 | |
Total pension liability of the Province | | | | | | | | | | | | | | | | | | | | | | | | | | $ | 8,918 | | | $ | 9,252 | |
| (a) | These numbers are as reported in the pension plan 2019 financial statements, except for the Teachers’ Post-1992 Pension Plan and the UAPP which use numbers as reported in actuarial reports. |
| (b) | Under PSAS, gains and losses are amortized over the employee average remaining service life of each plan, which range from eight to eleven years. |
| (c) | Accounting timing differences between the pension plan fiscal year ends and March 31 are for payments, interest expense and adjustment for the estimated decline in fair value of pension plan assets due to the economic crisis stemming from the COVID-19 pandemic. |
| (d) | The valuation adjustments reflect that the assets belong to the members and others entitled to benefits under these pension plans and the administrators/trustees have no claim to any of these assets. |
| (e) | Others include the MSRP, PJMCPP and SERP. |
| | |
| Government of Alberta | Annual Report 2019 – 2020 | | 65 |
CONSOLIDATED FINANCIAL STATEMENTS
| | |
| PENSION PLANS AND OTHER DEFINED BENEFIT PLANS | | SCHEDULE 12 (continued) |
The pension expense for the Province is as follows:
| | | | | | | | | | | | | | | | | | | | | | | | | | | | | | | | | | | | |
| | | | | | | | | | | | Teachers’ Pension Plan | | | | | | | | | 2020 | | | 2019 | |
| | | LAPP | | | MEPP | | | PSPP | | | Pre-1992 | | | Post-1992 | | | UAPP | | | Others(c) | | | Total | | | Total | |
| | | | | | | | | | | | In millions | | | | | | | | | | | | | | | | |
Pension expense | | | | | | | | | | | | | | | | | | | | | | | | | | | | | | | | | | | | |
Current period benefitcost (a) | | $ | 1,961 | | | $ | 136 | | | $ | 507 | | | $ | - | | | $ | 593 | | | $ | 99 | | | $ | 31 | | | $ | 3,327 | | | $ | 3,017 | |
Amortization of actuarial (gains)/losses (b) | | | (174 | ) | | | (47 | ) | | | (21 | ) | | | 31 | | | | 188 | | | | 20 | | | | (29 | ) | | | (32 | ) | | | 448 | |
Total | | $ | 1,787 | | | $ | 89 | | | $ | 486 | | | $ | 31 | | | $ | 781 | | | $ | 119 | | | $ | 2 | | | $ | 3,295 | | | $ | 3,465 | |
Province’s share of pension expense | | $ | 544 | | | $ | 49 | | | $ | 218 | | | $ | 31 | | | $ | 391 | | | $ | 119 | | | $ | 2 | | | $ | 1,354 | | | $ | 1,476 | |
Interest expense | | | | | | | | | | | | | | | | | | | | | | | | | | | | | | | | | | | | |
Interest on pension (asset)/liability (a) | | | (64 | ) | | | (23 | ) | | | (16 | ) | | | 270 | | | | (58 | ) | | | 22 | | | | 32 | | | | 163 | | | | 68 | |
Total pension expense of the Province | | $ | 480 | | | $ | 26 | | | $ | 202 | | | $ | 301 | | | $ | 333 | | | $ | 141 | | | $ | 34 | | | $ | 1,517 | | | $ | 1,544 | |
| (a) | As reported in pension plan financial statements or actuarial reports. Numbers in UAPP are net of employees’ share. |
| (b) | Except for SFPP, numbers are adjusted to March 31, 2020. |
| (c) | Others includes the MSRP, PJMCPP, SFPP, SERP, MLAPP and PSMC. |
Pension liabilities are based upon actuarial valuations performed at least triennially using the projected benefit method pro-rated on services and actuarial extrapolations performed at December 31, 2019 or March 31, 2020. The assumptions used in the valuations and extrapolations were adopted after consultation between the pension plan boards, the government and the actuaries, depending on the plan, and represent best estimates of future events. The non-economic assumptions include considerations such as mortality as well as withdrawal and retirement rates. The primary economic assumptions include salary escalation rate, discount rate and inflation rate. Each plan’s future experience will inevitably vary, perhaps significantly, from the assumptions. Any differences between the actuarial assumptions and future experience will emerge as gains or losses in future valuations. Gains and losses are amortized over the expected average remaining service lives of the related employee groups.
| | |
| | |
| 66 | | Government of Alberta | Annual Report 2019 – 2020 |
CONSOLIDATED FINANCIAL STATEMENTS
| | |
| PENSION PLANS AND OTHER DEFINED BENEFIT PLANS | | SCHEDULE 12 (continued) |
The date of actuarial extrapolation and primary economic assumptions used for accounting purposes were:
| | | | | | | | | | |
| Plan | | Latest
valuation
date | | Latest
extrapolation
date | | Salary
Escalation
rate
% | | Inflation
rate
% | | Discount
rate (a)
% |
| | | | | |
Teachers’ Pre-1992 Pension Plan | | 31-Aug-19 | | 31-Mar-20 | | - | | 2.00 | | 3.50 |
Teachers’ Post-1992 Pension Plan | | 31-Aug-19 | | 31-Mar-20 | | 3.00 | | 2.00 | | 5.70 |
PSMC | | 31-Dec-17 | | 31-Dec-19 | | - | | 2.00 | | 3.50 |
UAPP | | 31-Dec-18 | | 31-Mar-20 | | 3.00 | | 2.00 | | 5.60 |
LAPP | | 31-Dec-18 | | 31-Dec-19 | | 3.00 | | 2.00 | | 5.60 |
PSPP | | 31-Dec-17 | | 31-Dec-19 | | 3.00 | | 2.00 | | 6.00 |
MLAPP | | 31-Mar-20 | | 31-Mar-20 | | - | | 2.00 | | 3.50 |
MEPP | | 31-Dec-18 | | 31-Dec-19 | | 3.00 | | 2.00 | | 6.00 |
PJMCPP, Unregistered | | 31-Mar-17 | | 31-Mar-20 | | 3.00 | | 2.00 | | 4.40 |
PJMCPP, Registered | | 31-Mar-17 | | 31-Mar-20 | | 3.00 | | 2.00 | | 5.00 |
MSRP | | 31-Dec-18 | | 31-Dec-19 | | 3.00 | | 2.00 | | 5.60 |
SFPP | | 31-Dec-18 | | 31-Dec-19 | | 3.00 | | 2.00 | | 5.60 |
| (a) | The discount rate is the expected rate of return for plans with assets and is also the discount rate used to measure the actuarial liability. |
The actual return on major funded plans’ assets during the period ranges from 7.8% to 13.5%
(2019: (0.5)% to 9.6%). This range includes returns for LAPP, Teachers’ Post-1992 Plan, PSPP, MEPP, SFPP and UAPP.
A separate pension plan fund is maintained for each pension plan except for the Teachers’ Pre-1992 Pension Plan and the MLAPP. Each pension plan fund reports annually through financial statements.
Other Defined Benefit Plans
Long Term Disability Income Continuance Plans
The Province administers two long-term disability income continuance plans. As at March 31, 2020, the Bargaining Unit Plan reported an actuarial surplus of $64 million (2019: surplus of $110 million) and the Management, Opted Out, and Excluded Plan reported an actuarial surplus of $12 million
(2019: surplus of $25 million). At March 31, 2020, the Province did not recognize these accrued benefit assets.
Accumulating Non-Vesting Sick Leave Liability
Sick leave benefits are paid by the Province without employees’ contributions and no assets are set aside to fund the obligation. The sick leave liability is based on an actuarial valuation as at March 31, 2020. As at
March 31, 2020, the sick leave liability is $125 million (2019: $122 million). These liabilities are reported in accounts payable and other accrued liabilities (Schedule 10).
| | |
| Government of Alberta | Annual Report 2019 – 2020 | | 67 |
CONSOLIDATED FINANCIAL STATEMENTS
| | |
| DEFERRED CONTRIBUTIONS | | SCHEDULE 13 |
Deferred contributions represent funding or capital assets received from the Government of Canada or other sources with stipulations or external restrictions related to the use of the funding or capital assets. Operating contributions are recognized as revenue when the funding is spent for the restricted purposes. Capital contributions are recognized as revenue over the estimated useful life of the underlying capital assets once constructed or acquired.
| | | | | | | | |
| Unspent Deferred Contributions | | | | | | |
| | | 2020 | | | 2019 | |
| Deferred operating contributions | | In | | | millions | |
Deferred operating contributions beginning of year | | $ | 1,085 | | | $ | 1,020 | |
Adjustments from prior period | | | 1 | | | | - | |
Contributions received | | | 1,832 | | | | 1,583 | |
Transfers and adjustments | | | (63 | ) | | | (60 | ) |
Deferred operating contributions recognized as revenue | | | (1,738 | ) | | | (1,458 | ) |
Deferred operating contributions end of year | | | 1,117 | | | | 1,085 | |
Unspent deferred capital contributions | | | | | | | | |
Unspent deferred capital contributions beginning of year | | | 290 | | | | 224 | |
Adjustments from prior period (a) | | | (70 | ) | | | 3 | |
Contributions restricted for capital | | | 200 | | | | 359 | |
Transfers to spent deferred capital contributions | | | (241 | ) | | | (292 | ) |
Transfers from other accounts | | | 1 | | | | - | |
Deferred capital contributions recognized as revenue | | | (5 | ) | | | (4 | ) |
Unspent deferred capital contributions end of year | | | 175 | | | | 290 | |
Unspent deferred contributions end of year | | $ | 1,292 | | | $ | 1,375 | |
| | |
Spent Deferred Capital Contributions | | | | | | | | |
| | | 2020 | | | 2019 | |
| | | In | | | millions | |
Spent deferred capital contributions beginning of year | | $ | 3,164 | | | $ | 3,009 | |
Adjustments from prior period (b) | | | (44 | ) | | | (3 | ) |
Transfers from unspent deferred capital contributions | | | 241 | | | | 292 | |
Transfers from other accounts | | | 68 | | | | 56 | |
Deferred capital contributions recognized as revenue | | | (198 | ) | | | (190 | ) |
Spent deferred capital contributions end of year | | $ | 3,231 | | | $ | 3,164 | |
| (a) | The adjustment of $70 million from prior period is mainly related to the re-assessment of accrued amounts based on the eligibility requirements specified by donors. |
| (b) | The adjustment of $44 million from prior period is mainly related to the re-assessment of the opening balance based on the additional information available at the year end. |
| | |
| | |
| 68 | | Government of Alberta | Annual Report 2019 – 2020 |
CONSOLIDATED FINANCIAL STATEMENTS
| | |
| TANGIBLE CAPITAL ASSETS | | SCHEDULE 14 |
| | | | | | | | | | | | | | | | | | | | | | | | | | | | | | | | | | | | | | | | | | | | | | | | | | | | |
| | | | | | General Capital Assets | | | | | | | | | | | | Infrastructure Assets | | | | | | 2020 | | | 2019 | |
| | | | | | | | | | | | | | | | | | | | | | | | | | | | | | | | | | | | Total | | | Total | |
| | | | | | | | | | | | Computer | | | | | | | | | | | | Provincial | | | | | | Dams and | | | | | | | | | | |
| | | | | | | | | | | | hardware | | | | | | | | | | | | highways, | | | | | | water | | | | | | | | | | |
| | | | | | | | | | | | and | | | | | | Sub | | | Land | | | roads and | | | | | | management | | | Sub | | | | | | | |
| | | Land (a) | | | Buildings (b) | | | Equipment (c) | | | software | | | Other (d) | | | total | | | improvements (e) | | | airstrips (f) | | | Bridges | | | structures (g) | | | total | | | | | | | |
| Estimated Useful Life | | Indefinite | | | 10-50 yrs | | | 3-25 yrs | | | 3-10 yrs | | | 3-50 yrs | | | | | | 10-40 yrs | | | 20-50 yrs | | | 50 yrs | | | 25-80 yrs | | | | | | | | | | |
| | | | | | | | | | | | | | | | | | | | | In millions | | | | | | | | | | | | | | | | | | | |
Historical cost (h) | | | | | | | | | | | | | | | | | | | | | | | | | | | | | | | | | | | | | | | | | | | | | | | | | | | | |
Beginning of year | | $ | 2,807 | | | $ | 42,039 | | | $ | 6,956 | | | $ | 5,109 | | | $ | 1,323 | | | $ | 58,234 | | | $ | 670 | | | $ | 24,488 | | | $ | 2,394 | | | $ | 1,589 | | | $ | 29,141 | | | $ | 87,375 | | | $ | 83,725 | |
Additions | | | 41 | | | | 1,780 | | | | 356 | | | | 444 | | | | 77 | | | | 2,698 | | | | 24 | | | | 1,078 | | | | 54 | | | | 12 | | | | 1,168 | | | | 3,866 | | | | 4,105 | |
Transfers and adjustments (i) | | | 8 | | | | (23 | ) | | | (7 | ) | | | 1 | | | | 5 | | | | (16 | ) | | | (30 | ) | | | 7 | | | | - | | | | - | | | | (23 | ) | | | (39 | ) | | | 17 | |
Disposals including write-downs | | | (2 | ) | | | (105 | ) | | | (151 | ) | | | (128 | ) | | | (32 | ) | | | (418 | ) | | | (3 | ) | | | (6 | ) | | | - | | | | (5 | ) | | | (14 | ) | | | (432 | ) | | | (472 | ) |
| | | 2,854 | | | | 43,691 | | | | 7,154 | | | | 5,426 | | | | 1,373 | | | | 60,498 | | | | 661 | | | | 25,567 | | | | 2,448 | | | | 1,596 | | | | 30,272 | | | | 90,770 | | | | 87,375 | |
Accumulated amortization | | | | | | | | | | | | | | | | | | | | | | | | | | | | | | | | | | | | | | | | | | | | | | | | | | | | |
Beginning of year | | $ | - | | | $ | 16,171 | | | $ | 4,761 | | | $ | 3,889 | | | $ | 984 | | | $ | 25,805 | | | $ | 358 | | | $ | 7,024 | | | $ | 759 | | | $ | 504 | | | $ | 8,645 | | | $ | 34,450 | | | $ | 32,326 | |
Amortization expense | | | - | | | | 1,123 | | | | 444 | | | | 288 | | | | 63 | | | | 1,918 | | | | 18 | | | | 549 | | | | 60 | | | | 33 | | | | 660 | | | | 2,578 | | | | 2,472 | |
Transfers and adjustments (i) | | | - | | | | (19 | ) | | | 6 | | | | 4 | | | | 1 | | | | (8 | ) | | | 19 | | | | 1 | | | | - | | | | 19 | | | | 39 | | | | 31 | | | | 17 | |
Effect of disposals including write-downs | | | - | | | | (56 | ) | | | (145 | ) | | | (115 | ) | | | (32 | ) | | | (348 | ) | | | - | | | | (3 | ) | | | - | | | | (4 | ) | | | (7 | ) | | | (355 | ) | | | (365 | ) |
| | | - | | | | 17,219 | | | | 5,066 | | | | 4,066 | | | | 1,016 | | | | 27,367 | | | | 395 | | | | 7,571 | | | | 819 | | | | 552 | | | | 9,337 | | | | 36,704 | | | | 34,450 | |
Net book value at March 31, 2020 | | $ | 2,854 | | | $ | 26,472 | | | $ | 2,088 | | | $ | 1,360 | | | $ | 357 | | | $ | 33,131 | | | $ | 266 | | | $ | 17,996 | | | $ | 1,629 | | | $ | 1,044 | | | $ | 20,935 | | | $ | 54,066 | | | | | |
Net book value at March 31, 2019 | | $ | 2,807 | | | $ | 25,868 | | | $ | 2,195 | | | $ | 1,220 | | | $ | 339 | | | $ | 32,429 | | | $ | 312 | | | $ | 17,464 | | | $ | 1,635 | | | $ | 1,085 | | | $ | 20,496 | | | | | | | $ | 52,925 | |
| (a) | Land includes land acquired for parks and recreation, building sites, infrastructure and other program use. It does not include land held for resale or Crown lands acquired by right. |
| (b) | The cost of buildings under capital lease is $197 million (2019: $194 million). |
| (c) | Equipment includes SuperNet, vehicles, heavy equipment, fire protection equipment, office equipment and furniture, and other equipment. |
| (d) | Other tangible capital assets include leasehold improvements (amortized over the life of the lease). |
| (e) | Land improvements include parks development and grazing reserves. |
| (f) | Provincial highways and roads consist of original pavement, roadbed, drainage works and traffic control devices, and include secondary highways and bridges and some key arterial roadways within cities. Included in these numbers are $2,765 million (2019: $2,607 million) in historical cost and $337 million (2019: $291 million) in accumulated amortization for alternatively financed capital assets. |
| (g) | Dams and water management structures include dams, reservoirs, weirs, canals, dikes, ditches, channels, diversions, cut-offs, pump houses and erosion protection structures. Measurement uncertainty exists in the estimated useful life of dams and water management structures. |
| (h) | Historical costs include $5,807 million (2019: $5,428 million - restated) in construction in progress which will not be amortized until the tangible capital assets are completed and in use. |
| (i) | Transfers and adjustments relate to accounting policy alignments and reclassifications between capital asset categories. |
| | |
| Government of Alberta | Annual Report 2019 – 2020 | | 69 |
CONSOLIDATED FINANCIAL STATEMENTS
| | |
| TANGIBLE CAPITAL ASSETS | | SCHEDULE 14 (continued) |
The Province’s net book value of tangible capital assets by ministry is as follows:
| | | | | | | | |
| | | 2020 | | | 2019 | |
| | | In | | | millions | |
Ministries | | | | | | | | |
Transportation | | $ | 20,690 | | | $ | 20,168 | |
Health | | | 8,912 | | | | 8,432 | |
Advanced Education (a) | | | 8,747 | | | | 8,784 | |
Education | | | 8,415 | | | | 8,251 | |
Infrastructure | | | 3,279 | | | | 3,295 | |
Environment and Parks | | | 1,636 | | | | 1,657 | |
Seniors and Housing | | | 1,163 | | | | 1,038 | |
Service Alberta | | | 668 | | | | 700 | |
Other | | | 556 | | | | 600 | |
| | | $ | 54,066 | | | $ | 52,925 | |
| (a) | Amount includes policy adjustment of $13 million (2019: $13 million). |
| | |
| ADJUSTMENTS TO NET ASSETS | | SCHEDULE 15 |
| | | | | | | | |
| | | 2020 | | | 2019 | |
| | | In | | | millions | |
Change in accumulated unrealized gains (Schedule 8) | | $ | 349 | | | $ | 166 | |
Change in accounting policy (Schedule 8) | | | (4 | ) | | | 56 | |
Other | | | (34 | ) | | | 85 | |
| | | $ | 311 | | | $ | 307 | |
| | |
| | |
| 70 | | Government of Alberta | Annual Report 2019 – 2020 |
CONSOLIDATED FINANCIAL STATEMENTS
| | |
| OVER-EXPENDITURE OF SPENDING AUTHORITIES | | SCHEDULE 16 |
The authority of the Legislative Assembly is required before public monies from the General Revenue Fund can be used to fund the operations of the Government. The 2019-20 Government Estimates identifies the total requirements for public monies from the General Revenue Fund for the year. Approvals are provided in the form of annually approved limits through appropriations. Appropriations may be created by an appropriation act or other statute. Appropriations under an appropriation act must be created pursuant to a supply vote or set of supply votes. Supply votes are divided along departmental lines. During the year, expenditures were made under the four general types of supply votes: Expense, Capital Investment, Financial Transactions, and Contingency and Disaster and Emergency Assistance.
Details about the source and disposition of authorities and the details of departmental expenditures are provided in each Ministry’s Annual Report.
An encumbrance is incurred when, on a vote by vote basis, the total of actual disbursements in the 2019-20 fiscal year exceed the total estimate. As required by the Financial Administration Act, these amounts must be charged against the voted appropriation for the year ending March 31, 2021.
During the year, five departments exceeded their supply votes as follows:
| | | | | | | | |
| | | Adjusted
voted
estimate | | Voted
actuals | | Over
expended | | Explanation |
| Departments | | | | | | In millions | | |
| | | | |
Agriculture and Forestry | | | | | | | | |
| | | | |
Financial Transactions | | $ 1.3 | | $ 1.6 | | $ (0.3) | | Additional disbursements related to Wildfire Management program. |
| | | | |
Community and Social Services | | | | | | | | |
| | | | |
Expense | | 3,946.6 | | 4,066.7 | | (120.1) | | Expenses related to the Employment and Income Support, Assured Income for the Severely Handicapped and Disabilities Services programs. |
| | | | |
Labour and Immigration | | | | | | | | |
| | | | |
Expense | | 215.4 | | 269.0 | | (53.6) | | Liability for Workers’ Compensation Board premium support incurred for the period January 1, 2020 to March 31, 2020, as part of the COVID-19 response. |
| | | | |
Seniors and Housing | | | | | | | | |
| | | | |
Expense | | 454.1 | | 454.7 | | (0.6) | | Additional disbursements mainly related to Alberta Seniors Benefit Grants program. |
| | | | |
Transportation | | | | | | | | |
| | | | |
Capital Investment | | 1,010.0 | | 1,011.2 | | (1.2) | | Additional disbursements mainly related to Highway Rehabilitation Projects. |
| | | | |
Financial Transactions | | 99.9 | | 100.8 | | (0.9) | | Additional disbursements mainly related to Provincial Highway Maintenance and Preservation program. |
| | |
| Government of Alberta | Annual Report 2019 – 2020 | | 71 |
CONSOLIDATED FINANCIAL STATEMENTS
| | | | |
| LISTING OF ORGANIZATIONS | | | | SCHEDULE 17 |
The financial results of the following entities are included in these financial statements:
GOVERNMENT COMPONENTS
Offices of the Legislative Assembly
Support to the Legislative Assembly
Office of the Auditor General
Office of the Ombudsman
Office of the Chief Electoral Officer
Office of the Ethics Commissioner
Office of the Information and Privacy Commissioner
Office of the Child and Youth Advocate
Office of the Public Interest Commissioner
Departments
Advanced Education
Agriculture and Forestry
Children’s Services
Community and Social Services
Culture, Multiculturalism and Status of Women
Economic Development, Trade and Tourism
Education
Energy
Environment and Parks
Executive Council
Health
Indigenous Relations
Infrastructure
Justice and Solicitor General
Labour and Immigration
Municipal Affairs
Seniors and Housing
Service Alberta
Transportation
Treasury Board and Finance
REGULATED FUNDS
Alberta Heritage Foundation for Medical Research Endowment Fund
Alberta Heritage Savings Trust Fund
Alberta Heritage Scholarship Fund
Alberta Heritage Science and Engineering Research Endowment Fund
Alberta Risk Management Fund
Alberta School Foundation Fund
Human Rights Education and Multiculturalism Fund
| | |
| | |
| 72 | | Government of Alberta | Annual Report 2019 – 2020 |
CONSOLIDATED FINANCIAL STATEMENTS
| | | | |
| LISTING OF ORGANIZATIONS | | | | SCHEDULE 17 (continued) |
Regulated Funds (continued)
Land Stewardship Fund
Post-closure Stewardship Fund
Provincial Judges and Masters in Chambers Reserve Fund
Supplementary Retirement Plan Reserve Fund
Technology Innovation and Emissions Reduction Fund (a)
Victims of Crime Fund
GOVERNMENT ORGANIZATIONS (b)
Agriculture Financial Services Corporation
Alberta Capital Finance Authority
Alberta Energy Regulator
Alberta Enterprise Corporation
Alberta Foundation for the Arts
Alberta Indigenous Opportunities Corporation (c)
Alberta Innovates Corporation
Alberta Insurance Council
Alberta Investment Management Corporation
Alberta Pensions Services Corporation
Alberta Securities Commission
Alberta Social Housing Corporation
Alberta Transportation Safety Board
Alberta Utilities Commission
Canadian Energy Centre Ltd. (d)
Energy Efficiency Alberta
Gainers Inc.
Natural Resources Conservation Board
N. A. Properties (1994) Ltd.
Safety Codes Council
Travel Alberta Corporation
School Jurisdictions and Charter Schools
Almadina School Society
Aspen View School Division
Aurora School Ltd.
Battle River School Division
Black Gold School Division
Boyle Street Education Centre
Buffalo Trail School Division
Calgary Arts Academy Society
Calgary Girls’ School Society
Calgary Roman Catholic Separate School Division
Calgary School Division
| | |
| | |
| Government of Alberta | Annual Report 2019 – 2020 | | 73 |
CONSOLIDATED FINANCIAL STATEMENTS
| | | | |
| LISTING OF ORGANIZATIONS | | | | SCHEDULE 17 (continued) |
School Jurisdictions and Charter Schools (continued)
Canadian Rockies School Division
CAPE-Centre for Academic and Personal Excellence Institute
Chinook’s Edge School Division
Christ the Redeemer Catholic Separate School Division
Clearview School Division
Connect Charter School Society
East Central Alberta Catholic Separate School Division
East Central Francophone Education Region
Edmonton Catholic Separate School Division
Edmonton School Division
Elk Island Catholic Separate School Division
Elk Island School Division
Evergreen Catholic Separate School Division
Foothills School Division
Fort McMurray Roman Catholic Separate School Division
Fort McMurray School Division
Fort Vermilion School Division
Foundations for the Future Charter Academy Charter School Society
Golden Hills School Division
Grande Prairie Roman Catholic Separate School Division
Grande Prairie School Division
Grande Yellowhead School Division
Grasslands School Division
Greater North Central Francophone Education Region
Greater St. Albert Roman Catholic Separate School Division
High Prairie School Division
Holy Family Catholic Separate School Division
Holy Spirit Roman Catholic Separate School Division
Horizon School Division
Lakeland Roman Catholic Separate School Division
Lethbridge School Division
Living Waters Catholic Separate School Division
Livingstone Range School Division
Medicine Hat Roman Catholic Separate School Division
Medicine Hat School Division
Mother Earth’s Children’s Charter School Society
New Horizons Charter School Society
Northern Gateway School Division
Northern Lights School Division
Northland School Division
Northwest Francophone Education Region
Palliser School Division
| | |
| | |
| 74 | | Government of Alberta | Annual Report 2019 – 2020 |
CONSOLIDATED FINANCIAL STATEMENTS
| | | | |
| LISTING OF ORGANIZATIONS | | | | SCHEDULE 17 (continued) |
School Jurisdictions and Charter Schools (continued)
Parkland School Division
Peace River School Division
Peace Wapiti School Division
Pembina Hills School Division (including Alberta Distance Learning Centre)
Prairie Land School Division
Prairie Rose School Division
Red Deer Catholic Separate School Division
Red Deer School Division
Rocky View School Division
St. Albert School Division
St. Paul School Division
St. Thomas Aquinas Roman Catholic Separate School Division
Southern Francophone Education Region
Sturgeon School Division
Suzuki Charter School Society
Valhalla School Foundation
Westmount Charter School Society
Westwind School Division
Wetaskiwin School Division
Wild Rose School Division
Wolf Creek School Division
Post-secondary Institutions
Alberta University of Arts
Athabasca University
Banff Centre
Bow Valley College
Grande Prairie Regional College
Keyano College
Lakeland College
Lethbridge College
MacEwan University
Medicine Hat College
Mount Royal University
NorQuest College
Northern Alberta Institute of Technology
Northern Lakes College
Olds College
Portage College
Red Deer College
Southern Alberta Institute of Technology
| | |
| | |
| Government of Alberta | Annual Report 2019 – 2020 | | 75 |
CONSOLIDATED FINANCIAL STATEMENTS
| | | | |
| LISTING OF ORGANIZATIONS | | | | SCHEDULE 17 (continued) |
Post-secondary Institutions (continued)
University of Alberta
University of Calgary
University of Lethbridge
Alberta Health Services and Other Health Entities
Alberta Health Services
Health Quality Council of Alberta
The following organizations are accounted for on the modified equity basis in these financial statements:
GOVERNMENT BUSINESS ENTERPRISES (b)
Alberta Gaming, Liquor and Cannabis Commission
Alberta Petroleum Marketing Commission
ATB Financial
Balancing Pool
Credit Union Deposit Guarantee Corporation
Note
In 2019-20, pursuant to Bill 20 and Bill 22, Access to the Future Fund, Alberta Cancer Prevention Legacy Fund, Alberta Historical Resources Foundation, Alberta Lottery Fund, Alberta Sport Connection, Environmental Protection and Enhancement Fund, Historic Resources Fund and Office of the Election Commissioner were dissolved on various dates. The activities and responsibilities of these entities were transferred to the appropriate departments, except for those related to the Office of the Election Commissioner, which were transferred to the Office of the Chief Electoral Officer.
| | (a) | Effective January 1, 2020, the Climate Change and Emissions Management Fund is continued under the name Technology Innovation and Emissions Reduction Fund pursuant to Bill 19. |
| | (b) | Subsidiaries of government organizations and government business enterprises are not included in the list. |
| | (c) | The Alberta Indigenous Opportunities Corporation was created by the Alberta Indigenous Opportunities Corporation Act which was proclaimed and came into force on November 26, 2019. |
| | (d) | Effective October 9, 2019, the Canadian Energy Centre Ltd. was incorporated under the Business Corporations Act (Alberta). |
| | |
| | |
| 76 | | Government of Alberta | Annual Report 2019 – 2020 |
CONSOLIDATED FINANCIAL STATEMENTS
Glossary (Unaudited)
| | |
Absolute return strategies: Absolute return strategies (hedge funds) encompass a wide variety of investments with the objective of realizing positive returns regardless of the overall market direction. A common feature of many of these strategies is buying undervalued securities and selling short overvalued securities. Some of the major types of strategies include long/short equity, merger arbitrage, fixed income arbitrage, macroeconomic strategies, convertible arbitrage, distressed securities and short selling. Accrued interest: Interest income that has been earned but not paid in cash at the financial statement date. Alternative investments: Investments considered outside of the traditional asset class of stocks, bonds and cash. Examples include hedge funds, private equities, private income, timberland and asset-backed commercial paper. Amortized cost: Amortized cost is the amount at which a financial asset or a financial liability is measured at initial recognition minus principal repayments, plus or minus the cumulative amortization using the effective interest method of any difference between that initial amount and the maturity amount, and minus any reduction (directly or through the use of an allowance account) for impairment or uncollectability. Ask price: The price that a seller is willing to accept for a security, also known as the offer price. Asset mix: The percentage of an investment fund’s assets allocated to major asset classes (for example 50% equities, 30% interest-bearing securities and 20% inflation sensitive and alternative investments). Bid price: The price that a buyer is willing to pay for a security. Cash equivalents: Cash equivalents are short-term, highly liquid investments that are readily convertible to known amounts of cash and that are subject to insignificant risk of changes in value. Cash equivalents are held for the purpose of meeting short-term cash commitments rather than for investing or other purposes. Credit risk: The risk that one party to a financial instrument will cause a financial loss for the other party by failing to discharge an obligation. | | Currency risk: The risk that the fair value or future cash flows of a financial instrument will fluctuate because of changes in foreign exchange rates. Debenture: A financial instrument showing a debt where the issuer promises to pay interest and repay the principal by the maturity date. It is usually unsecured, meaning there are no liens or pledges on specific assets. Debt servicing cost: Debt servicing cost consists of interest paid on various forms of government debt. Defined benefit pension plan: A pension plan that specifies either the benefits to be received by an employee, or the method of determining those benefits, such as a pension benefit equal to two percent of the average of the five highest consecutive years’ salary times the total years of service. Derecognition: The removal of previously recognized financial assets or financial liabilities from a government’s statement of financial position. Derivative contract: Financial contracts, the value of which is derived from the value of underlying assets, indices, interest rates, or currency rates. They usually give rise to a financial asset of one party and a financial liability or equity instrument of another party, require no initial net investment and are settled at a future date. A derivative contract has the following three characteristics: • Its value changes in response to the change in a specified interest rate, equity index price, foreign exchange rate or credit rating, • It requires no initial net investment or the initial investment is smaller than required for exposure to a similar investment market, except for cross currency swaps. Cross currency swaps can have an exchange of notional amounts at the start of the contract, the end of the contract, or both, and • It is settled in the future. Discount: The difference between the price paid for a security and the security’s par or face value. Because price fluctuates with interest rates, price will differ from the face value. For example, if interest rates are higher than the coupon rate, then the security is sold at a discount. |
| | |
| | |
| Government of Alberta | Annual Report 2019 – 2020 | | 77 |
CONSOLIDATED FINANCIAL STATEMENTS
Glossary (continued)
| | |
Emerging market: An economy in the early stages of development, with markets of sufficient size and liquidity and receptive to foreign investment. Endowment funds: Endowment funds generally are established by donor gifts and bequests to provide a permanent endowment, which is to provide a permanent source of income, or a term endowment, which is to provide income for a specified period. The principal restriction is that the original contribution should be maintained intact in perpetuity. The income generated from the endowments may or may not be restricted in how they are used. Fair value: The amount of consideration agreed upon in an arm’s length transaction between knowledgeable, willing parties who are under no compulsion to act. Fair value is similar to market value. Financial asset: Assets that could be used to discharge existing liabilities or finance future operations and are not for consumption in the normal course of operations. A financial asset could be cash, a right to receive cash or another financial asset from another party, a right to exchange financial instruments with another party under conditions that are potentially favourable or equity of another entity. First in, first out: A method of valuing inventory where the cost of the first goods purchased or acquired is the cost assigned to the first goods sold. Therefore, the cost allocated to the inventory items on hand at the end of the period is the cost of those items most recently acquired. Fixed income instrument: Interest-bearing instrument that provides a return in the form of fixed periodic payments and eventual return of principal at maturity, or money market instrument such as treasury bills and discount notes. Floating rate: An interest rate that is reset periodically, usually every couple of months or sometimes daily. Government business enterprise: A government organization that is a separate legal entity with the power to contract in its own name and that can sue and be sued; has been delegated the financial and operational authority to carry on a business; sells goods and services to individuals and organizations outside of the government reporting entity as its principal activity; and can, in the normal course of its operations, maintain its operations and meet its liabilities from | | revenues received from sources outside of the government reporting entity. Hedging: An activity designed to manage exposure to one or more risks. When management designates a hedging relationship, it must identify the specific items included in the hedging relationship, the risk that is being hedged, and the period over which the hedging relationship is intended to be effective. The designation of the hedging relationship is documented formally in the entity’s records when designation occurs. Interest rate risk: The risk that the fair value or future cash flows of a financial instrument will fluctuate because of future changes in market interest rates. Liquidity: The ease with which an asset can be turned into cash and the certainty of the value it will obtain. Liquidity risk: The risk of insufficient cash to meet financial commitments. This refers to a disruption in which funds cannot be raised in capital markets due to external forces. Modified equity: Under the modified equity method, the equity method of accounting is modified only to the extent that the government business enterprise’s accounting policies are not adjusted to conform with those of the government. Thus, the government aggregates a government business enterprise’s net assets and net income by adjusting the investment shown in the government’s statement of financial position and by presenting the net income as a separate item on the government’s statement of operations. Net realizable value: The selling price less the estimated costs of completion and costs necessary to make the sale. Non-financial assets: Assets that are acquired, constructed or developed and do not normally provide resources to discharge existing liabilities, but instead are normally employed to deliver government services; may be consumed in the normal course of operations; and are not for sale in the normal course of operations. Onerous contract: A contract in which the unavoidable costs of meeting the obligations under the contract exceed the economic benefits expected to be received under it. |
| | |
| | |
| 78 | | Government of Alberta | Annual Report 2019 – 2020 |
CONSOLIDATED FINANCIAL STATEMENTS
Glossary (continued)
| | |
Operational risk: The risk that results from internal human and system errors or inadequate processes and controls. Other-than-temporary loss: A significant or prolonged decline in the fair value of an investment below its carrying value is evidence of an other-than-temporary loss in value of an investment. Par value: A value set as the face or principal amount of a security, typically expressed as multiples of $100 or $1,000. Bondholders receive par value for their bonds at maturity. Power Purchasing Arrangements (PPAs): One of the mechanisms used by the Province to introduce competition into the supply of thermal electric power from regulated generating units. The PPAs were intended to allow the facility Owners of the power generating facilities a reasonable opportunity to recover their fixed and variable costs of generation while transferring the right to offer the output of the plants into the power pool to intermediaries (PPA Buyers). The PPAs govern the relationship between the facility Owner and the PPA Buyer in a manner similar to a contract but are not negotiated contracts, they are statutory instruments imposed upon the parties by legislation. Prepaid expenses: An expenditure that is paid for in one accounting period, but which will not be entirely consumed until a future period. Consequently, it is carried on the government’s statement of financial position as an asset until it is consumed. Present value: Today’s value of one or more future cash payments, determined by discounting the future cash payments using interest rates. Price risk: The risk that the fair value or future cash flows of a financial instrument will fluctuate because of changes in market prices (other than those arising from interest rate risk or currency risk), whether those changes are caused by factors specific to the individual financial instrument or its issuer, or factors affecting all similar financial instruments traded in the market. Prior year expenditure refunds: When recoveries of overpayments occur in the current year that are related to an expenditure of prior years, the recovery is accounted for as revenue of the current year. | | Private equity: An ownership interest in a privately held company. Public private partnership (P3): A legally-binding contract between the Province and one or more public or private partners for the provision of assets and the delivery of services that allocates responsibilities and business risks among the various partners. Realized gains and losses: Gains or losses are realized when investments are sold at a price over or below its book value and selling costs. Refinancing risk: The risk that the fair value or future cash flows of a financial instrument will fluctuate due to refinancing. Segment: A distinguishable activity or group of activities of a government for which it is appropriate to separately report financial information to help users of the financial statements identify the resources allocated to support the major activities of the government. Settlement risk: The risk that arises from non-simultaneous payment exchanges (late or missed payments). Spent deferred capital contributions: Spent deferred capital contributions represent the total net book value of contributed tangible capital assets and the portion of capital funding that has been expended on acquisition of tangible capital assets. SUCH: It is an acronym for schools, universities, colleges and hospitals. Unspent deferred contributions: Unspent deferred contributions consist of two components: unspent deferred operating contributions and unspent deferred capital contributions. These unspent deferred contributions represent the funding received by the government and not yet used in accordance with relevant stipulations or restrictions. Yield curve: A graphic line chart that shows interest rates at a specific point for all securities having equal risk but different maturity dates. |
| | |
| | |
| Government of Alberta | Annual Report 2019 – 2020 | | 79 |
BLANK PAGE
Measuring Up
BLANK PAGE
| | |
| | |
| 82 | | Government of Alberta | Annual Report 2019 – 2020 |
MEASURING UP
Table of Contents
| | | | |
Management’s Responsibility for Reporting | | | 84 | |
| |
Executive Overview | | | 85 | |
| |
Priority One: Getting Alberta Back to Work | | | 88 | |
| |
Priority Two: Making Life Better for Albertans | | | 104 | |
| |
Priority Three: Standing Up for Alberta | | | 119 | |
| |
Performance Indicators – Sources and Notes | | | 127 | |
| | |
| Government of Alberta | Annual Report 2019 – 2020 | | 83 |
MEASURING UP
Management’s Responsibility for Reporting
Responsibility for the integrity and objectivity of the performance results reported in the province’s annual performance report Measuring Up, a component of the government’s Annual Report, rests with the Government of Alberta. Measuring Up is prepared by the Senior Assistant Deputy Minister of Corporate Planning and Red Tape Reduction under the general direction of the Deputy Minister of Treasury Board and Finance, as authorized by the President of Treasury Board and Minister of Finance pursuant to Section 8 of the Fiscal Planning and Transparency Act.
Under Section 8, the Government of Alberta is to prepare and make public on or before June 30 of each year an annual report for the Province of Alberta for the fiscal year ended on the preceding March 31. As a result of the current global pandemic conditions, a recommendation was made in late March, with the final decision being made in June, to amend this date to August 31 for the fiscal year 2019-20. The annual report must include a comparison of the actual performance results to the targets included in the Government of Alberta strategic plan and an explanation of any significant variances. Measuring Up is published with the consolidated annual report of the Government of Alberta that forms part of the Public Accounts.
In order to meet Government of Alberta reporting requirements, the Senior Assistant Deputy Minister of Corporate Planning and Red Tape Reduction obtains performance results relating to each ministry as necessary. Deputy heads in each ministry are responsible for maintaining management and internal control systems to ensure that the information provided by their ministry, for presentation in Measuring Up including performance measure reporting and results reporting for key initiatives and activities, is prepared in accordance with the following criteria:
Reliability – information used in applying performance measure methodologies agrees with underlying source data for the current and prior years’ results.
Understandability – the performance measure methodologies and results are presented clearly.
Comparability – the methodologies for performance measure preparation are applied consistently for the current and prior years’ results.
Completeness – outcomes, performance indicators and related targets match those included in Budget 2019.
Annually, Measuring Up is tabled in the Legislature as a part of the Public Accounts and is referred to the Standing Committee on Public Accounts of the Legislative Assembly.
[Original signed by]
Athana Mentzelopoulos
Deputy Minister of Treasury Board and Finance
July 29, 2020
| | |
| | |
| 84 | | Government of Alberta | Annual Report 2019 – 2020 |
MEASURING UP
Executive Overview
The Fiscal Planning and Transparency Act requires that the government publish a consolidated annual report for the Province of Alberta that includes a comparison of its performance results to desired results established in the three-year government strategic plan.
The 2019-20 Government of Alberta Annual Report is the report to Albertans on Budget 2019. It is the public record of the dollars spent and the results achieved by the Government of Alberta for the 2019-20 fiscal year.
Measuring Up 2020 provides performance results on government priorities and objectives as identified in Budget 2019, which focused on making life better for Albertans, getting Alberta back to work and standing up for Alberta’s economic priorities.
Measuring Up is a part of the Alberta government’s commitment to be open and accountable to the people of Alberta. It endeavours to go beyond reporting financial information by answering the questions: what did the government achieve with the dollars that it spent; did the government actually do what it said it was going to do; and did the government make progress toward achieving its priorities?
To answer these questions, Measuring Up reports on the progress toward achieving the three government priorities presented in the 2019-23 Government of Alberta Strategic Plan. This is accomplished by comparing the actual results against the targets published in the strategic plan and providing an explanation of results.
Overall, reporting the results of the objectives and indicators of each of the government priorities helps the reader to assess the social and economic impacts government policies, programs, services and strategies are having in progressing toward government desired outcomes.
Link to Ministries
Annual reports for each ministry are published at the same time and provide additional detailed information on the government’s performance and financial results.
Performance information presented in ministry annual reports provides information on the progress toward ministry business plan outcomes. Ministry business plans and annual reports are closely linked to, and support, the government strategic plan and annual report.
What’s New?
Measuring Up and the GOA annual report are typically published prior to the end of June each year. This year that deadline has moved back to the end of August. The decision was made to postpone the requirement of ministries to fulfil reporting obligations as resources were required for the front-line response to the pandemic.
This year’s Measuring Up 2020 reflects improved reporting in terms of better integration of financial and non-financial information and improved results analysis in annual reporting. This integration was also supported in Budget 2019 where ministry business plans included specific initiatives supporting key objectives, with associated budgeted dollars.
Ultimately, the purpose of integrating financial and non-financial results is to relate costs to the results achieved by explaining the links between spending and outcomes, objectives and initiatives, which complements the Consolidated Financial Statements and Key Results components of the GOA Annual Report. Measuring Up 2020 aims to link budget dollars directly to outcomes, allowing spending to be integrated into a comprehensive narrative that aligns with results.
| | |
| Government of Alberta | Annual Report 2019 – 2020 | | 85 |
MEASURING UP
One of the key differences between Measuring Up 2020 and 2019 relates to the use of performance indicators. Measuring Up 2019 contained 13 performance indicators, along with 20 performance measures, with limited narrative to support them.
Measuring Up 2020 reflects a more simplified approach, with nine high level performance indicators that better link to the outcomes and results analysis within the narrative, specific to the Government of Alberta’s three priorities. These indicators are intended to be more intuitively understandable and familiar to the public than those used in previous years.
These priorities are key themes that not only tie directly to the government’s platform, but act as clear, understandable drivers for the work of government over its four-year mandate, and the actions and results represented in Measuring Up 2020 reflect and demonstrate the progress made.
Measuring Up 2020
The Government of Alberta 2019-23 Strategic Plan, as part of Budget 2019, identified the following three priorities, associated objectives and performance indicators by which to assess the government’s performance over the 2019-20 fiscal year. Many of the recommendations of the MacKinnon Panel on Alberta’s Finances, which focused on ways to eliminate waste, duplication and non-essential spending to fund the Government of Alberta’s key priorities, were included in Budget 2019. The reader will see results of the recommendations reflected throughout the report. Below is a summary of the Government of Alberta’s achievements in the 2019-20 year:
Priority One
Getting Alberta back to work (pages 88-103)
While Measuring Up 2019 reflected a focus of the previous government on diversification and industry-specific tax credits to support economic growth, Measuring Up 2020 reflects actions and results designed to create better conditions for business to thrive and create jobs—such as lowering taxes, reducing red tape, and revitalizing and supporting the growth of Alberta’s key industries.
| | 1. | Changing the tax structure to stimulate growth and attract investment-achieved |
| | 2. | Making Alberta open for business-achieved |
| | 3. | Reducing red tape-achieved |
| | 4. | Building public infrastructure-in progress |
| | 5. | Revitalizing and sustaining key industries-in progress |
| | 6. | Making Alberta more dynamic, innovative and sustainable –achieved |
| | 1. | Corporate Tax Rate- improving |
| | 2. | Unemployment Rate-not improving |
| | 3. | Private Investment-improving |
| | |
| | |
| 86 | | Government of Alberta | Annual Report 2019 – 2020 |
MEASURING UP
Priority Two
Making Life Better for Albertans (pages 104-118)
Measuring Up 2020 reflects a more outcome-oriented approach to providing public services that ensure accountabilities to drive better results for budget dollars, including new funding models for physicians, schools and post-secondary institutions, improved service delivery for seniors and Alberta Income Support for the Severely Handicapped (AISH) recipients, measures to combat rural crime and protect property rights, and partnerships with Indigenous Peoples.
| | 1. | Getting Albertans the high-quality health care they deserve-achieved |
| | 2. | Strengthening quality education that delivers the best possible outcomes-achieved |
| | 3. | Protecting vulnerable Albertans-achieved |
| | 4. | Make the justice system fairer, faster and more effective-in progress |
| | 5. | Building better communities-in progress |
| | 6. | Partnering with Indigenous Peoples to pursue opportunities-achieved |
| | 1. | Hospital Readmissions-improving |
| | 2. | Student Achievement-maintaining |
| | 3. | Crime Severity Index-improving |
Priority Three
Standing Up for Alberta (pages 119-126)
Measuring Up 2020 reflects Alberta’s new proactive advocacy to support pipeline construction—including interprovincial coalitions to prevent damaging federal legislation—combat misinformation about Canadian energy, advocate for reforms to federal transfers, and bring per capita spending in line with comparator provinces.
| | 1. | Getting pipelines built-in progress |
| | 2. | Standing up to foreign influences on Alberta’s natural resources-in progress |
| | 3. | A fair deal for Alberta and a balanced budget-in progress |
| | 2. | Upstream Investment in the Alberta Oil and Gas Sector-not improving |
| | 3. | Government Program Spending-improving |
| | |
| Government of Alberta | Annual Report 2019 – 2020 | | 87 |
MEASURING UP
Priority One: Getting Alberta Back to Work
The Government of Alberta promised to help get Alberta back to work. The province is now the most tax-competitive jurisdiction for businesses in Canada and among the most attractive investment destinations in North America. Further, the Government of Alberta is committed to a smart approach to innovation, making Alberta a magnet for investment in new technologies and economic diversification. Alberta is also investing in key infrastructure that will support job creation during Alberta’s recovery and boost long-term economic growth. These initiatives will create a globally competitive business environment, stimulating investment and adding new private sector jobs in the province.
The following initiatives were undertaken in 2019-20:
Objective 1 | Changing the tax structure to stimulate growth and attract investment
Actions
| · | | Implement Bill 1, the Carbon Tax Repeal Act |
Results:
In 2019, the Government of Alberta quickly took action to implement Bill 1: the Carbon Tax Repeal Act, which eliminated Alberta’s provincial carbon tax and repealed the Climate Leadership Act to help reduce the financial burden on families and job creators.
| · | | Implement the Job Creation Tax Cut |
Results:
The Government of Alberta committed to returning to a low-rate, broad-based corporate tax regime with the implementation of the Job Creation Tax Cut, which reduced Alberta’s general corporate income tax rate from 12 per cent to 8 per cent, and allowed for the elimination of several targeted tax credits.
These tax cuts are a vital part of the Government of Alberta’s plan to reignite the economy by attracting investments, reducing the financial burden on businesses, and supporting job creators to get Albertans working again. By restoring Alberta’s investment competitiveness and business confidence, the Government of Alberta is creating the environment necessary to get Albertans back to work. Before the impacts of COVID-19 hit the economy, we were seeing job creators respond to the lower tax rates by investing more, creating jobs and generating more income in Alberta. While the COVID-19 pandemic and low oil price environment have changed the corporate income tax revenue outlook, Budget 2019 estimated that, after factoring in these positive economic impacts, the fiscal impact of the Job Creation Tax Cut was estimated to be an average of about $600 million per year from 2019-20 to 2022-23, an investment in Alberta’s long-term prosperity.
As of July 1, 2020, Alberta’s general corporate income tax rate has been reduced to eight per cent. Accelerating the tax cut provides Alberta businesses with confidence and certainty as they recover from the COVID-19 pandemic, freeing up resources to hire Albertans. Alberta’s combined federal-provincial business tax rate is now the lowest in Canada by far. Leading economists Bev Dahlby and Jack Mintz have estimated that the tax reductions will help create at least 55,000 additional jobs in the province.
| | |
| | |
| 88 | | Government of Alberta | Annual Report 2019 – 2020 |
MEASURING UP
Performance Indicator: Corporate Tax Rate
Alberta’s general corporate tax rate
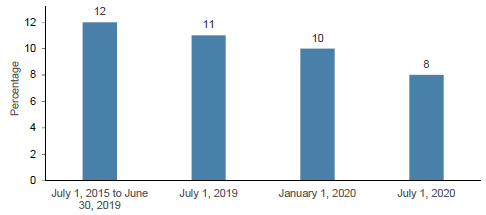
Source: Ministry of Treasury Board and Finance
For sources and notes see page 127.
The Government of Alberta is committed to returning to a low-rate, broad-based corporate tax regime, through the implementation of the Job Creation Tax Cut. As of July 1, 2020, the general corporate income tax rate in Alberta is eight per cent, four percentage points lower than in 2018.
The general corporate income tax rate was reduced to 11 per cent on July 1, 2019, and further reduced to 10 per cent on January 1, 2020, and eight per cent on July 1, 2020. Reductions were established through the implementation of the Job Creation Tax Cut (Alberta Corporate Tax Amendment) Act.
Objective 2 | Making Alberta open for business
Actions
| • | Develop a vision for Alberta’s economic future and a strategy to foster an economy that creates jobs while rebuilding Alberta’s reputation as the best and most responsible place to do business |
Results:
Alberta’s economic future is rooted in the province’s free enterprise economy, with competitive tax rates, private property rights and a streamlined regulatory environment, all of which assure job creators that Alberta is open for business. This attracts investment to the province that supports jobs and generates economic growth.
In 2019-20, an Investment and Growth Strategy was developed to guide an all-of-government approach to increasing private sector investment in targeted sectors that will support the province’s economic recovery efforts in response to the COVID-19 crisis. The strategy will focus the Government of Alberta’s investment attraction efforts in the principal sectors of energy, agriculture, and tourism, as well as sectors in the wider provincial economy – technology, aviation and aerospace, and financial services.
The strategy is complemented by other Government of Alberta programs and initiatives that also incentivize job creators to invest in Alberta. In 2019-20, these included various supports for small and medium-sized Alberta businesses, industries, communities and regions. Highlights of some of these programs and initiatives include:
| | |
| Government of Alberta | Annual Report 2019 – 2020 | | 89 |
MEASURING UP
| | - | The Film and Television Tax Credit (FTTC), which was launched in January 2020, has generated significant interest and uptake, including major international studios from the United States. Nineteen film and television productions were approved for $31 million in tax credits to leverage $121.8 million in production expenditures in the province. This new program demonstrates the Government of Alberta’s commitment to grow Alberta’s cultural industries and will translate to long-term growth in the sector. The FTTC remained open during the pandemic and continues to accept and review applications. |
| | - | The Alberta Export Expansion Program (AEEP) was relaunched as another step in the Government of Alberta’s commitment to reduce red tape by one-third, with a streamlined single program and application process that covers both outbound and inbound travel. With $65.51 in new exports generated from every dollar of AEEP funding disbursed, the program has proven to be an effective support for Alberta’s small and medium-sized enterprises, municipalities, industry associations and Indigenous communities in developing and promoting exports, and profiling Alberta internationally. $44.9 million in new export sales and 292 net new employees were reported as a result of AEEP support. Once COVID-19-related travel restrictions have been lifted, this program will help to kick-start Alberta’s economy from the impacts of the global pandemic. |
| | - | The Community and Regional Economic Support program awarded $4 million in funding for 53 projects. These projects leveraged $4 million from partners that include municipalities, not-for-profits, First Nations, and private industry, and enabled municipalities and communities to build capacity for local development and job creation. Examples of community-led projects supported through past intakes include a small business incubator in Grande Prairie, networking and mentorship programming for women entrepreneurs in Edmonton, industrial park development on the Samson Cree Nation, employment training for new Canadians in Red Deer, local business marketing supports in Cochrane, an economic development strategy for the International Avenue Business Revitalization Zone in Calgary, and an unmanned aerial systems project in Foremost. |
| | - | Through delivery of services to prospective investors, which included providing market intelligence; access to capital; identification of relevant business supports and incentive programs; facilitating supply chain and export connections; and connecting with government and business partners to navigate regulatory processes, Alberta attracted thirteen major investments representing an estimated $840 million in direct investment impact and over 950 jobs. |
| | - | Child care is an integral part in getting Albertans back to work. Reliable and affordable child care supports families to fully engage in their community including parents and caregivers to attend employment, train for better jobs or pursue further education. The Government of Alberta launched a new user-friendly online child care subsidy application, which parents and caregivers can access easily on any computer, tablet or smart phone (parents and caregivers are provided extra security during the application process by using their MyAlberta Digital ID, which also allows applicants to start and stop the application process without losing any data already stored). |
| | - | In addition, youths previously approved for the Advancing Futures post-secondary program were able to continue receiving psychosocial supports and monthly living allowance funding despite the closure of post-secondary institutions due to COVID-19. Under the Advancing Futures program, government provides a psychosocial educational bursary to support youths aged 18 to 24 who have been, or are, in care or receiving services under the Child, Youth and Family Enhancement Act in accessing post-secondary opportunities and securing a career. |
| | |
| | |
| 90 | | Government of Alberta | Annual Report 2019 – 2020 |
MEASURING UP
| · | | Incentivize the creation of youth employment and retain the minimum wage |
Results:
Job Creation Student Wage
Amendments to the Employment Standards Code made in May 2019 introduced a job creation student wage that gave employers the option of providing a lower wage for students who are under 18 years of age ($13 instead of $15 per hour). This encouraged job creators to hire young people allowing them to gain valuable work experience. The new job creation student wage took effect on June 26, 2019.
This new job creation student wage was implemented to encourage job creation and is one solution to increase employment opportunities for youth in Alberta. The change also responded to concerns raised by employers who cited the $15 per hour minimum wage as one of the reasons they have reduced opportunities for young workers.
Minimum Wage Expert Panel
A minimum wage expert panel was appointed in August 2019 to assess the province’s minimum wage. Part of the panel’s mandate was to review and publish all of the available provincial economic data on the labour market impacts of minimum wage changes in Alberta in recent years, such as issues related to the income and hours of work for minimum wage workers. The expert panel also examined the effect of the minimum wage on industries where gratuities – or tips – are paid. Public release of the findings of the panel is anticipated in 2020-21 and will inform the Government of Alberta’s minimum wage policy.
Performance Indicator: Unemployment Rate
The unemployment rate represents the number of unemployed persons expressed as a percentage of the total labour force
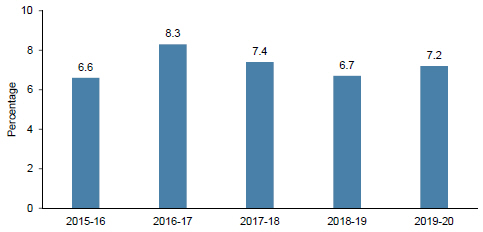
Source: Statistics Canada
For sources and notes see page 127.
The unemployment rate is a standard performance indicator to monitor the general health of the provincial economy.
In 2019-20, unemployment in Alberta averaged 7.2 per cent, representing a 0.4 percentage point increase from average unemployment in 2018-19. The unemployment rate in 2019-20 fluctuated from a low of 6.6 per cent in September 2019 to a high of 8.7 per cent in March 2020.
| | |
| Government of Alberta | Annual Report 2019 – 2020 | | 91 |
MEASURING UP
A number of economic factors contributed to the rate of unemployment, including negative economic growth with Statistics Canada reporting a -0.6 per cent decline in the real GDP when compared to 2018 and continued challenges in the energy sector, including low oil prices, market access, decline in drilling activity and lower private sector investment in energy projects.
However, a number of economic indicators early in 2020 showed an improvement in Alberta’s economy that likely would have contributed to a decrease in the unemployment rate, including increasing activity in the construction and energy sectors. In the first two months of the year, rig drilling grew 14 per cent and oil production grew 6 per cent compared to the same period last year. Instead, unemployment increased significantly to 8.7 per cent in March 2020 due to the impacts of business closures and social distancing measures as the province responded to the pandemic.
| · | | Bring balance back to Alberta’s labour laws and restore workplace democracy |
Results:
An Act to Make Alberta Open for Business
An Act to Make Alberta Open for Business received Royal Assent in July 2019 and resulted in a number of changes to employment standards and labour relations to reduce unfair burdens on businesses, give workers more rights in unionized workplaces and get Albertans back to work. Notable changes introduced in the Act included:
| | - | Reinstatement of the qualifying period for holiday pay, which results in an employee being eligible for general holiday pay only if the employee has worked for the same employer for 30 workdays or more in the 12 months preceding the general holiday; |
| | - | Reinstatement of the distinction between regular and irregular workdays in the calculation of general holiday pay by clarifying when an employer must pay an employee holiday pay; |
| | - | Restoration of the mandatory secret ballot process for all union certification votes; and |
| | - | A return to the 90-day period for unions to provide evidence of employee support for certification. |
The Government of Alberta also announced the creation of a new employee labour relations support program. The program supports and assists employees who are unionized or may soon become unionized to better understand and exercise their rights under labour legislation including the Labour Relations Code, the Police Officers Collective Bargaining Act, the Public Education Collective Bargaining Act and the Public Service Employee Relations Act. Employees are able to access information, resources and supports related to union matters, such as information on union certification and decertification.
| · | | Form a procurement council – a joint effort of government and business/industry to examine innovation and efficiency in the government’s procurement methods. Refresh policy on major procurement to achieve the best value for money |
Results:
Refresh of Procurement policy and practices
In January 2019, an Executive Procurement Steering Committee was formed with a mandate to increase consistency of procurement processes across the Government of Alberta and improve collaboration between ministries. The Committee began work to standardize agreements and templates used in procurement and will be reviewing and amending procurement processes to reduce red tape and make it easier for suppliers to do business with government.
| | |
| | |
| 92 | | Government of Alberta | Annual Report 2019 – 2020 |
MEASURING UP
The roll out of 1GX, a new government-wide Enterprise Resource Planning system, is expected to have a significant impact on Government of Alberta processes. 1GX will make it easier to do business with the Government of Alberta, automate business processes and functions, and reduce duplication and the need for manual data entry. In addition to faster and more transparent procurement processes across government, other benefits of the system will include: improved human resources management, such as efficient and accurate time tracking; improved financial tracking, reporting and analytics; and new information technology reporting capabilities.
The Executive Procurement Steering Committee has been tasked with ensuring that opportunities to improve procurement processes under 1GX, such as increased automation and the introduction of self-serve options, are realized across government. 1GX launched in three pilot ministries on July 1, 2020, and is expected to launch in the remaining ministries in late 2020.
Objective 3 | Reducing red tape
Actions
| · | | Enact the Red Tape Reduction Act |
Results:
To deliver the promise of getting Albertans back to work and to grow Alberta’s economy, the Government of Alberta established the office of the Associate Minister of Red Tape Reduction within the Ministry of Treasury Board and Finance to lead all areas of government on red tape reduction activities. Unnecessary red tape prevents businesses from growing and creating jobs, and generally makes life difficult for Albertans. The regulatory burdens associated with red tape are costing businesses and organizations money and time that could be better spent on improved economic growth and job expansion.
The mandate of the red tape office is to reduce red tape across government by one third between 2019 and 2022. In 2019-20, the Government of Alberta successfully met its first target of a five per cent reduction, and is now working toward the next interim target of 12 per cent (an additional seven per cent) in 2020-21.
The Red Tape Reduction Act, passed in summer 2019, set a legislative framework for the Government of Alberta’s efforts to reduce the regulatory and administrative burden. To implement the intent of the act, ministries developed their own action plans to reduce red tape. The Red Tape Reduction Implementation Act, 2019, developed in collaboration with all ministries across government, demonstrated the Government of Alberta’s progress on this commitment by amending or repealing 11 pieces of legislation to streamline burdensome processes and eliminate outdated rules and requirements.
There have been more than 200 red tape reduction initiatives completed in 2019-20. These initiatives have resulted in the removal of thousands of unnecessary regulatory requirements, and more requirements will be reduced or streamlined going forward.
As a result, the Canadian Federation of Independent Businesses raised Alberta’s grade from F to B- (the biggest improvement of any province) in its 2020 annual Red Tape Reduction Report Card. Alberta was commended for its strong political leadership, undertaking a baseline regulatory count, establishing a regulatory one-in-one-out rule, and public engagement on red tape issues. The baseline count was complete in February 2020, with the exception of ‘complex agencies’, which will be completed in May 2021. The results of the count will be formally released in an annual report by the Associate Minister of Red Tape Reduction, to be tabled in the Legislative Assembly in fall 2020.
| | |
| Government of Alberta | Annual Report 2019 – 2020 | | 93 |
MEASURING UP
| • | | Create a Red Tape Challenge Website at cutredtape.alberta.ca to crowdsource input for regulations that need to be improved, kept or eliminated |
Results:
Albertans and Alberta businesses have submitted nearly 6,000 ideas via the Cut Red Tape website and by email over the past year to help support and drive the focus of red tape reduction. There have also been nine red tape reduction focused industry panels engaged. These thousands of submissions and industry panel recommendations have helped drive and focus red tape reduction efforts and have contributed to the hundreds of completed initiatives.
| • | | Reduce interprovincial barriers to free trade |
Results:
Alberta announced the removal of 21 Canada Free Trade Agreement (CFTA) party-specific exceptions, representing an 80 per cent reduction. Twenty were removed in 2019-20 and one in 2020-21. Alberta now has the lowest number of exceptions of any of the parties to the agreement. The eliminated exceptions dealt with areas such as procurement, the energy sector, alcohol and the sale of public lands. CFTA exceptions shelter protectionist policies that may act as a barrier to trade. Removing these exceptions helps create a more open, transparent and competitive marketplace. Every action that removes trade barriers stands to improve the economy of Alberta and benefit Albertans.
Objective 4 | Building public infrastructure
Actions
| • | | Reform the legislative framework for capital funding to municipalities |
Results:
The Local Government Fiscal Framework Act, which received Royal Assent in December 2019, legislates the maintenance of current Municipal Sustainability Initiative funding until 2021-22, and implements a new funding framework for local governments in 2022-23. The framework delivers long-term, predictable funding linked to changes in provincial revenues, and although still very generous, moves into closer alignment with funding levels in other jurisdictions.
| • | | Redefine the government’s inventory of land assets to include the broader public sector and create a policy that will define surplus assets |
Results:
The MacKinnon Panel recommended that the Government of Alberta’s inventory of land assets be broadened and that policy be created to clearly define surplus assets and the process for their disposal. An increased ability for government to dispose of surplus assets can offset the capital cost of new investments and provide revenue for the province. The consolidation of the government’s real estate activities in Alberta Infrastructure is underway.
To address the recommendation, the Ministry of Infrastructure is leading a broader public sector working group to:
| | - | define the inventory of property assets; |
| | - | improve reporting on property assets; |
| | - | develop a consistent Surplus and Disposal Policy for implementation; and |
| | |
| 94 | | Government of Alberta | Annual Report 2019 – 2020 |
MEASURING UP
| | - | identify more opportunities to consolidate functions to improve efficiency and consistency and reduce red tape in this area. |
The draft Surplus and Disposal Policy is anticipated to be completed by spring 2021.
| • | | Stabilize and rationalize the allocation of Capital Maintenance and Renewal (CMR) spending |
Results:
The MacKinnon Panel recommended that the allocation of the Government of Alberta’s CMR spending be stabilized and rationalized, with priority given to areas of greatest need in future capital expenditure decisions.
To address this recommendation, the Ministries of Infrastructure and Treasury Board and Finance are developing a framework to create a consistent and coordinated approach to the prioritization and planning of CMR funding with a focus on ensuring that the highest priority investments are identified across the government’s asset base.
To support economic recovery in response to the COVID-19 pandemic, the Government of Alberta is doubling 2020-21 spending on capital maintenance and renewal from $937 million to $1.9 billion. The accelerated CMR Program will help stimulate local economies through the creation of more than 5000 jobs.
| • | | Bring Alberta’s net public capital stock in-line with the average per-capita stock in other provinces over the next 10 years |
Results:
The MacKinnon Panel recommended bringing Alberta’s net public capital stock in-line with the average per capita capital stock in the other provinces over the next 10 years. Budget 2019 outlined a capital plan that would see the net book value of the province’s capital assets start to fall, after reaching a peak in 2020-21 as major projects from prior plans are completed. Year-end results for the first year (2019-20) of the Budget 2019 Capital Plan show that capital plan spending was lower than forecast, further reducing the per capita net book value of capital assets.
It is important to note that it is expected that the per capita net book value of capital assets will increase in the near term. As Alberta faces the largest public health crisis in a century, the biggest global economic contraction since the 1930s and a collapse in energy prices, government is taking unprecedented actions to create immediate jobs in communities across the province and has boosted infrastructure spending, which is expected to reach $10 billion in 2020-21 to get Albertans back to work in key areas such as building facilities and repairing roads.
Objective 5 | Revitalizing and sustaining key industries
Actions
| • | | Support job creation in oil and gas by improving regulations and restoring Alberta’s reputation with investors as a global leader in the energy industry |
Results:
Trade and Investment
The Premier of Alberta undertook domestic and international trade missions to demonstrate to investors that Alberta is a responsible, global leader in the energy industry.
| | |
| Government of Alberta | Annual Report 2019 – 2020 | | 95 |
MEASURING UP
Mission highlights include:
| | - | New York, Ohio and New Brunswick in September 2019, to promote Alberta’s investment advantages, highlight Alberta’s responsible energy industry and build support for the safe operation of Enbridge Line 5, which transports crude oil and natural gas liquids from Athabasca in Canada to Michigan in the United States. |
| | - | Mexico City, Mexico in November 2019, to participate in the North American Regional Meeting of the Trilateral Commission, an event that brings together influential energy, trade and investment, and governance leaders to discuss global issues. |
| | - | Houston and Dallas, Texas in November 2019, to meet with investors and business leaders in the energy sector and underscore Alberta’s foundation for a reliable, safe and environmentally responsible energy supply. |
| | - | London, England and Munich, Germany to meet with key hedge fund investors, global banks and private equity firms to highlight Alberta’s environmental, social and governance standards and champion Alberta as a responsible supplier of liquefied natural gas. |
In 2019, the Alberta Government also led energy-focused trade and investment missions to the Global Petroleum Show in Calgary; the Australia Petroleum Production and Exploration Association conference in Brisbane, Australia; and to Gastech 2019 and the Offshore Technologies Show – the world’s largest oil and gas trade show—in Houston, Texas. Other missions include those to Japan, South Korea, Illinois, Minnesota, Vancouver, Quebec City and Montreal. All of these missions communicated to potential investors Alberta’s latest products, services, technologies and expertise in the oil and gas sector, and promoted the province as an attractive and competitive destination for investment.
Alberta has been active in the area of emissions reductions, which will raise Alberta’s reputation with investors as well. Highlights include:
| | - | Alberta’s investments in emissions-reducing clean technology projects in the province, which include support for cleaner oil and gas and methane emissions reduction projects worth approximately $79 million. Nearly 5.9 million tonnes of direct emissions reductions are expected by 2030 as a result of Alberta’s investments in emissions-reducing clean technology, and 91 per cent of those reductions are attributable to the oil, gas and methane emissions related projects. By the time these emissions-reducing clean technology projects are completed in 2022, they will have created more than 943 jobs in the province. |
| | - | Alberta finalized a partnership with the federal government on the collaborative Canadian Emissions Reduction Innovation Network (CERIN) program. The program supports infrastructure investments at existing facilities or sites within Canada and the creation of a consortium capable of connecting national expertise and facilities. CERIN aims to accelerate the development, validation and deployment of technologies that reduce oil and gas sector emissions. This will help position Alberta and Canada as a leader in developing exportable emissions management solutions and achieving cost-effective emissions reduction and regulatory compliance, an attractive feature for potential investors. |
| | |
| 96 | | Government of Alberta | Annual Report 2019 – 2020 |
MEASURING UP
Performance Indicator: Private Investment
Business investment in plant and equipment
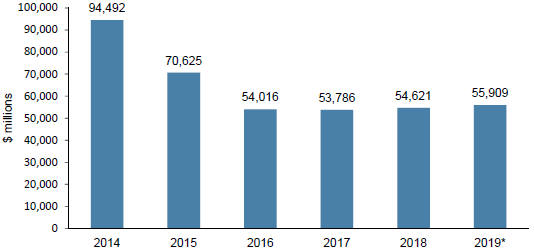
Source: Statistics Canada
| * | Updated 2019 estimate: $55,909 million business investment in plant and equipment. 2020 data is not available. |
For sources and notes see page 127.
Recent quarterly data on flows and stocks of fixed non-residential capital investment by Statistics Canada show that business investment in plant and equipment rose 2.4 percent to $55.9 billion in 2019. This is in contrast to the Budget 2020 estimate of a four per cent decline to $52.4 billion in 2019. Business investment is estimated to have been supported by a pick-up in investment outside oil and gas extraction, which grew because of capacity expansions in the petrochemical sector and an upturn in energy infrastructure projects. In contrast, investment in the oil and gas extraction likely remained weak due to market access challenges, production curtailment and competitiveness pressures. Measures to improve the business environment, such as the Job Creation Tax Cut and Red Tape Reduction, are expected to encourage investment and grow other sectors of the economy.
Reducing Red Tape in the Energy Sector
The Government of Alberta has taken significant steps to simplify and reduce the regulatory burden in the energy sector and completed a number of red tape reduction initiatives in 2019-20 while continuing to maintain and improve environmental protections and oversight, including:
| | - | repealing unnecessary and outdated regulations and legislation such as the Small Power Research and Development Act and regulations, removing unnecessary restrictions for oil well service rigs to make it easier to move equipment between job sites. The Commercial Vehicle Dimension and Weight Regulation was updated to eliminate the need for roughly 5,600 outdated and unnecessary oversize commercial vehicle permits in 2020-21. |
| | - | enabling the Orphan Well Association to better manage and accelerate the clean-up of wells or sites that do not have a responsible owner by advancing $68 million of the $235 million loan to address the growing inventory of orphaned sites; |
| | - | enhancing curtailment rules, reducing the regulatory and administrative burden on oil producers; |
| | - | clarifying rules around Crown mineral activity authorization and tenure disposition; |
| | - | reversing the capacity market; |
| | |
| Government of Alberta | Annual Report 2019 – 2020 | | 97 |
MEASURING UP
| | - | simplifying processes for electricity and natural gas utility advertising; |
| | - | eliminating the Transmission Facilities Cost Monitoring Committee to avoid duplication with the Alberta Utilities Commission; and |
| | - | removing the requirement for new legislation for small-scale and low-impact hydroelectric developments. |
Royalty Guarantee Act
To increase investor confidence and certainty around rules governing long-term oil and gas investments in Alberta, the Government of Alberta passed the Royalty Guarantee Act, which prescribes that the royalty structure in place when a well is drilled remains in place for at least 10 years. The existing royalty structure, rules and processes remain to allow government and industry to adjust to market changes and technology advancements, without the concern of potential royalty increases. These changes include such things as setting monthly prices and providing incentives, when appropriate.
Environmental Social Governance (ESG)
In 2019, the ESG Secretariat was established to lead the coordination of ESG work across the Government of Alberta. ESG criteria outline a set of standards for a company’s operations that socially conscious investors use to screen potential investments. The Secretariat, in conjunction with the ESG Working Group—which advises the Government of Alberta on industry priorities and ensures strategic alignment of policy and messaging—will be recommending approaches the province can take in order to restore investor confidence in Alberta’s ability to remain competitive in a carbon-constrained future, helping to enable the return of capital investment to the province.
| • | | Help farmers grow again by establishing an engagement process that will let them voice their opinions and provide feedback to shape future farm and ranch workplace legislation |
Results:
On December 5, 2019, the Farm Freedom and Safety Act received Royal Assent and took effect on January 1, 2020. The legislation was informed by consultation that included grassroots conversations, industry meetings, engagement sessions, and an online survey to gather input from Alberta’s farmers and ranchers to inform the development of practical farm and ranch workplace safety legislation.
The new legislation repeals and replaces the Enhanced Protection for Farm and Ranch Workers Act, and includes provisions for occupational health and safety, employment standards, labour relations, and workplace insurance requirements that address the unique needs of the Alberta farm and ranch sector. In addition, this legislation ensures basic safety standards on all farms, while enabling farm businesses to become more cost-competitive.
| • | | Sustain funding for tourism promotion and marketing through partnerships with the private sector |
Results:
A Tourism Partnership Investment Fund to attract and identify sources of private sector support for tourism marketing and promotion will be a component of Alberta’s 10 Year Tourism Strategy. The impact of the COVID-19 crisis on the province’s tourism sector required the Government of Alberta to shift its focus from the development of the Tourism Strategy to a Tourism Recovery Plan to rebuild Alberta’s tourism industry and ensure long-term growth. The Tourism Strategy will be revisited in the fall of 2020 and updated to incorporate economic recovery measures.
| | |
| 98 | | Government of Alberta | Annual Report 2019 – 2020 |
MEASURING UP
| • | | Protect, promote, and partner with Alberta’s forestry workers and companies to create economic opportunities in Alberta’s forestry sector |
Results:
In 2019-20, the Government of Alberta started work on a strategy to champion Alberta’s forest sector and support its continued economic success. As a result, the Forest Jobs Action Plan was announced in May 2020 to signify the Government of Alberta’s commitment to sustainable, long-term access for forest companies. Examples of actions include:
| | - | Ensuring the expedient return of wildfire burned areas to productive forests; |
| | - | Awarding unallocated portions of annual allowable cut through an open and competitive process; and |
| | - | Working with companies to ensure the best utilization of allocated timber in their forest management plans. |
To drive Alberta’s future prosperity and job growth, the Government of Alberta will continue to support projects aimed at increasing the profile of Alberta wood products domestically and internationally, promoting the use of wood in commercial, industrial, and institutional construction, and increasing awareness of non-traditional applications for Alberta’s wood.
Key initiatives in 2019-20 include:
| | - | In January 2020, the Government of Alberta became the first jurisdiction in Canada to permit 12-storey wood buildings province-wide. Tall wood construction in Alberta has the potential to utilize $40 million of locally produced lumber and create 400 production jobs. |
| | - | The Government of Alberta provided grants totaling $600,000 to forest industry associations to help Alberta-based wood product manufacturers improve their production efficiency, develop new wood products, and expand export markets to improve industry competitiveness and drive economic growth and performance. Significant achievements included: |
| | • | | Assisting Alberta wood products manufacturers export spruce, pine, and fir products to traditional and emerging overseas markets, including Europe, Japan, China, South Korea, and India; and |
| | • | | Conducting collaborative research on engineered composites such as cements, concretes and reinforced plastics with Alberta Innovates Technology Futures to develop new products for emerging markets. |
| | - | The Government of Alberta sponsored three Alberta-based secondary wood products manufacturers who exhibited at the 2019 International Builders Show – the largest annual light construction trade show in the world. The event provided an opportunity to highlight Alberta wood products through trade development services including market research, business matching, and network facilitation. |
| | |
| Government of Alberta | Annual Report 2019 – 2020 | | 99 |
MEASURING UP
Objective 6 | Making Alberta more dynamic, innovative and sustainable
Actions
| • | | Implement the Technology Innovation and Emissions Reduction (TIER) Fund |
Results:
Technology Innovation and Emissions Reduction (TIER)
The TIER Regulation came into force on January 1, 2020, replacing Alberta’s Carbon Competitiveness Incentive Regulation, and allowing large emitters (greater than 100,000 tonnes CO2e) and conventional oil and gas facilities the option of opting out of paying the federal fuel charge under the federal Greenhouse Gas Pollution Pricing Act (GGPPA). Indeed, in December 2019, the federal government recognized TIER as meeting the requirements set out in the GGPPA.
The regulation eliminates the need for eligible facilities to report to both the provincial and federal governments, and conventional oil and gas operators may aggregate two or more facilities to streamline reporting and compliance requirements.
TIER also supports industrial facilities in finding innovative ways to reduce emissions and invest in clean technology to stay competitive. It allows the Alberta Energy Regulator to support innovative technologies while ensuring industry remains in compliance and achieves the same emissions reductions as other provinces.
TIER Fund
As part of compliance, the TIER regulation allows facilities to purchase credits from the TIER Fund to reinvest in future emissions reductions. These investments increase Alberta’s Gross Domestic Product, support jobs in high technology sectors, decrease future greenhouse gas emissions, and increase resiliency for a changing climate.
In 2019-20, $180.2 million from the TIER Fund was used to support emissions reduction competition administered by Emissions Reduction Alberta, the Oil Sands Innovation Fund and Bioenergy Producer Program. Resulting initiatives supported investments in projects that accelerate the development and adoption of innovative technologies to reduce oil sands emissions, carbon capture and storage, and innovative bioenergy projects that contribute to reducing greenhouse gas emissions while utilizing local resources and creating jobs in rural areas.
| • | | Develop a plan to reduce power prices so Alberta’s electricity market is affordable for consumers and job creators, and produces market-driven green energy |
Results:
Electricity Market Structure
The Government of Alberta provided policy and regulatory certainty to investors and electricity project proponents in Alberta’s competitive electricity generation sector by halting the transition to a capacity market. Capacity market allows private power generators to be paid through a mix of competitively auctioned contracts which pay their capital costs, and revenue from the market. The Government of Alberta repealed the Capacity Market Regulation to enable continuation of Alberta’s existing energy-only market model, allowing generators to be paid for the electricity they produce based solely on the wholesale price of electricity, which fluctuates. An energy-only market is best for Alberta as it;
| | |
| 100 | | Government of Alberta | Annual Report 2019 – 2020 |
MEASURING UP
| | - | offers structural and administrative simplicity, |
| | - | has a proven track record of providing affordable electricity in Alberta, |
| | - | has a proven track record of providing a reliable supply of electricity in Alberta, |
| | - | is established and understood by investors, which offers them greater certainty regarding its future performance; and, |
| | - | is supported by the majority of electricity stakeholders, including consumer groups. |
Affirmation of Alberta’s energy-only electricity market provided investors the stability required to develop new generation projects, both natural gas-fired and renewable energy, resulting in several major wind project announcements and the acceleration of projects to reduce coal consumption through co-firing or converting to natural gas.
Renewable Electricity Generation
Since mid 2019, renewable electricity developers have demonstrated that they can compete in Alberta’s electricity market without subsidy, as proven by the many new project announcements. More than a billion dollars of new investment in wind and solar generation projects has been announced since August 2019, representing more than 1,110 megawatts of new renewable generation that would be connected to Alberta’s grid. When underway, these projects will result in approximately 70 permanent jobs and 1,200 temporary construction jobs. This demonstrates how Alberta’s energy-only market allows investors to choose technologies and lets market dynamics dictate the timing of investments.
The Government of Alberta discontinued new intake for the Renewable Electricity Program (REP) in early 2019 to focus on market-driven renewable electricity development. Prior REP contracts signed by private electricity developers remain in effect and are being closely monitored by the Alberta Electric System Operator for compliance. The status is reported annually as required by legislation. Three projects that have achieved, or are close to achieving commercial operation, have a combined capacity of 336 megawatts.
Regulated Rate Option (RRO) Rate Cap Program
The RRO rate cap introduced by the Government of Alberta in 2017 was designed to mitigate the regulated electricity price fluctuation expected during the change to a capacity market system. As the Government of Alberta was not proceeding with the capacity market system, the RRO rate cap was no longer necessary and cancelled effective December 2019.
In the two years that the program was operating, the cap cost the province $108 million. If the program had continued to its legislated completion date of May 31, 2021, the total estimated cost of the program was estimated to be $303 million. Cancelling the program saved Albertans an estimated $195 million.
Utility Payment Deferral Program
In March 2020, the Government of Alberta announced that residential, farm and small commercial utility ratepayers could defer utility payments until June 18—a period of 90 days—and that utility services would not be cut off or reduced during this period for non-payment. This ensured that Albertans in financial hardship as a result of the COVID-19 pandemic were protected from having their services cut off or reduced during this period.
The Government of Alberta and the Alberta Utilities Commission worked with utility companies to develop an approach for repayment that allows consumers to pay back their deferred utilities within a reasonable time period and ensures that electricity and natural gas providers have the cash flow to support Albertans that chose to defer their utility bill payments.
| | |
| Government of Alberta | Annual Report 2019 – 2020 | | 101 |
MEASURING UP
| • | | Implement the Alberta Advantage Immigration Strategy to attract newcomers who will start businesses, invest, and create jobs in the province |
Results:
Alberta Advantage Immigration Strategy
In 2019-20, the Government of Alberta began development of the Alberta Advantage Immigration Strategy (AAIS). The strategy focuses on economic immigration and is intended to cover the entire immigration continuum from pre-arrival to settlement and will guide the Government of Alberta’s immigration-related policy and programs. The initial focus will be on implementing the three entrepreneur streams: Rural Entrepreneur, International Student Entrepreneur and the Foreign Graduate Student Startup Visa. The strategy aims to speed up processing times, help grow businesses and reignite local economies by encouraging international entrepreneurs and graduates to immigrate to Alberta through proposed new streams for the Alberta Immigrant Nominee Program. The AAIS also includes a fourth stream, the Rural Renewal Stream, which has the intent of supporting, attracting and retaining immigrants to rural communities, to drive local economic development needs.
| • | | Adopt a smart approach to innovation and make Alberta the preferred choice of global high-tech investment |
Results:
In September 2019, Alberta signed a Memorandum of Understanding with the United Kingdom to explore opportunities to stimulate innovation and commercialization in new and emerging technologies. The agreement focuses on science, technology and innovation in these key sectors: artificial intelligence, health and life sciences, agri-tech and agri-food technologies, clean growth and smart cities. The agreement also includes participation on a joint innovation forum that will meet biannually to share updates and priorities with a view to converting advanced research into commercial applications leading to investment attraction, job creation and economic growth.
In December 2019, Alberta established an Innovation Capital Working Group to develop options on how to attract new investment in the province’s early-stage technology companies. The working group included representatives from Alberta’s tech, business, academic and financial communities. These experts provided the Government of Alberta with advice on how to enhance the attraction of investment capital to Alberta’s start-up and early stage technology sectors and support Alberta’s tech and innovation ecosystems. The final report of the working group was submitted in April 2020 and their advice is being considered in the context of the province’s economic recovery response to the COVID-19 crisis.
In addition, Alberta runs research and technology programming to attract and retain talent, high-tech investment and fuel innovation, including:
| | - | The Research Capacity Program (RCP), which helps Alberta’s post-secondary institutions attract and retain talent, build innovative capacity with world-class infrastructure, and attract investments. In 2019-20, the RCP awarded $8.7 million in research infrastructure funding for 43 projects, which leveraged $17 million from other sources including the federal Canada Foundation for Innovation, institutions, industry, and non-profit organizations. The competition supported projects in various areas of strategic importance such as clean resource and water management, artificial intelligence, and health innovation. |
| | |
| 102 | | Government of Alberta | Annual Report 2019 – 2020 |
MEASURING UP
| | - | Alberta’s Major Innovation Fund (MIF) provides financial supports to projects that secure and strengthen Alberta’s competitive position in research and technology development, while attracting talent and additional investment by highlighting unique-to-Alberta initiatives. In 2019-20, the University of Alberta held the first Autonomous System MIF symposium that attracted over 100 participants from across the province and Canada to build partnerships in automation and machine learning innovations. In addition, the University of Calgary-led Antimicrobial Resistance One Health MIF project contributed to research associated with stopping the replication mechanism of the virus that causes COVID-19. |
| | |
| Government of Alberta | Annual Report 2019 – 2020 | | 103 |
MEASURING UP
Priority Two: Making Life Better for Albertans
The Government of Alberta is committed to making life better for Albertans by providing quality health care, ensuring our children and young adults receive a high quality education, partnering with Indigenous Peoples, building our communities and keeping them safe, making our justice system more effective, and protecting the most vulnerable among us.
The following initiatives were undertaken in 2019-20:
Objective 1 | Getting Albertans the high-quality health care they deserve
Actions
| • | | Improve the current health system by comparing outcomes and results to other provinces and engaging health professionals and the public to establish better outcomes |
Results:
The MacKinnon Panel found that Alberta continues to spend more on health care on a per capita basis than the comparator provinces of Ontario, British Columbia and Quebec. However, Albertans have not seen the health outcomes they should expect from this level of investment. In fact, some results are worse than elsewhere in Canada. The Mackinnon Panel’s recommendations included making better use of health system resources, such as providing more health care in community settings rather than in hospitals; adjusting the mix of Alberta’s health professionals; and limiting the increasing cost of physician services by providing incentives for physicians to move to alternative compensation plans.
New Physician Funding Framework
In response to MacKinnon Panel recommendation four, the Government of Alberta began implementing a new physician funding framework on March 31, 2020 in order to avoid projected cost overruns while maintaining the budget for physicians at $5.4 billion. The new funding framework is being carefully monitored for impacts to physicians and health care delivery, and necessary adjustments are made in consultation with the Alberta Medical Association. A Physician Compensation Advisory Committee was formed on June 8, 2020 to examine all aspects of the physician services funding model and provide recommendations to the Government of Alberta, supporting the delivery of high quality, patient focused health services.
Service Delivery
In 2019, the Government of Alberta commissioned Ernst & Young LLP to examine the operations and organizational efficiency of Alberta Health Services (AHS). The review included significant engagement with Albertans, including patients, staff and physicians working in AHS, as well as from key stakeholder groups such as patient advocates, regulatory bodies and associations, municipalities and universities. Changes recommended by the review were focused on improving the efficiency and service delivery for Albertans and provided clear evidence and opportunities where the health system can do better in terms of costs and results. The Review also identified that AHS is well-positioned to achieve a greater level of system performance given that it is a centralized single health authority.
The Government of Alberta accepted the report, with two exceptions: there will be no hospital closures and no consolidation of urban trauma centres. To address the remainder of the recommendations, AHS will develop an implementation plan by August 2020 with a detailed analysis that will include timing and sequencing of changes to the system, clear linkages between expected savings and reallocation to priority areas, and performance measures that provide evidence that access and quality of care are being maintained
| | |
| 104 | | Government of Alberta | Annual Report 2019 – 2020 |
MEASURING UP
or improved during implementation. From March-June 2020, the Ministry of Health paused its RTR work to focus resources and efforts on the COVID-19 pandemic response.
| • | | Reduce surgical wait times |
Results:
The Alberta Surgical Initiative announced in December 2019, aims to reduce wait times for medically necessary, publicly funded surgical procedures to within clinically recommended timelines. This will be achieved through improvement and standardization of the entire surgical system from the time patients seek advice from their family doctor, through to when they are referred to a specialist and to their surgery and rehabilitation. The Government of Alberta has also committed $100 million to upgrade surgical suites in hospitals, which currently provide 85 per cent of the province’s publicly funded surgeries. These capital investments and dedicated operational funding will ensure existing operating rooms in hospitals are used more efficiently.
In response to the COVID-19 pandemic, to ensure sufficient health system capacity non-urgent surgical procedures undertaken in hospitals and chartered surgical facilities were paused in mid-March. Planning and design continued for large-scale renovations and new operating rooms in Edmonton, Calgary, Grande Prairie and Lethbridge.
Performance Indicator: Hospital Readmissions
Percent of Medical Patients with Unplanned Readmissions to Hospital within 30 Days of Discharge
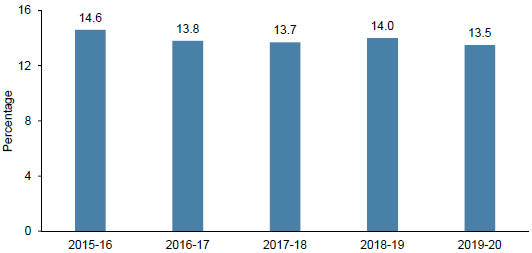
Source: Alberta Health
For sources and notes see page 127.
The percentage of unplanned readmissions of patients hospitalized because of a medical condition within 30 days after discharge has remained relatively stable over the past five years. The 2019-20 result of 13.5 percent is 1.1 percent lower than in 2015-16 and 0.5 per cent lower than in 2018-19.
Alberta Health Services strives to improve health outcomes by increasing capacity for evidence-informed practice. High rates of readmission act as a signal to hospitals to look more carefully at their practices, including discharge planning and continuity of services after discharge. Measuring hospital readmissions is one such indicator. Rates may also be impacted due to the nature of the population served by a hospital, such as elderly patients or patients with complex health needs, or by the accessibility of post-discharge health care services in the community.
| | |
| Government of Alberta | Annual Report 2019 – 2020 | | 105 |
MEASURING UP
Alberta Health Services undertakes specific initiatives to reduce hospital readmissions. For example, patients with multiple chronic conditions can now be linked to Community Health Navigators who assist them with locating community resources and supporting self management. In addition, coordination of care is improving because of enhancements to the health information system, which enables electronic notification of primary care doctors when their patient is admitted or discharged from hospital.
| • | | Deal with the growing opioid addiction crisis with a new Opioid Response Strategy |
Results:
Budget 2019 included $40 million to expand access to recovery-oriented services and supports for Albertans living with opioid use disorder. More Albertans are now able to access psychosocial supports via opioid dependency programs, expanded access to opioid dependency treatment, addiction counsellors and therapists, and peer support programs. To support people with opioid addictions moving into recovery, funding has been committed for the creation of more than 4,000 publicly funded mental health and addiction treatment spaces across the province, including medically supported detoxification over the next three years, with expanded spaces expected in the summer of 2020. By March 2020, 107 emergency departments across the province had implemented treatment and rapid follow-up in the community for clients with opioid use disorder. Sixty per cent of patients accessing this program were found to have continued with their treatment four months after treatment was initiated.
In addition, on November 1, 2019, the Government of Alberta implemented a requirement under the Mental Health Services Protection Act that all residential addiction treatment service providers have a licence to operate. Licensing enables the Government of Alberta to monitor and improve safety, quality, and consumer protections for Albertans who access live-in treatment programs on their recovery journey.
| • | | Invest $100 million over four years to implement a Mental Health and Addiction Strategy |
Results:
In November 2019, the Minister of Health appointed the Mental Health and Addictions Advisory Council to develop strategic recommendations to increase access to recovery oriented addiction and mental health services. The Council is to provide their Final Report with recommended strategic actions to the Minister of Health and the Associate Minister of Mental Health and Addictions in fall 2020, which will inform the development of a new provincial Mental Health and Addiction Strategy.
The province is expanding access to mental health services available through AHS for post-secondary students. Additional supports include text and chat platforms, and professional counselling by phone through a partnership between Alberta 211 and Kids Help Phone. Alberta 211 also provides referrals to mental health and addiction services across Alberta.
In response to the surge in demand resulting from the COVID-19 pandemic and pandemic response, the Government of Alberta announced an additional $53.4 million in April 2020 to improve access to mental health supports for Albertans. This includes $21.6 million for online supports, $6.8 million for more intensive phone and in-person supports. It also includes, $25 million for the Mental Health and Addiction COVID-19 Community Funding Grant Program for local community projects to improve mental health and addiction recovery.
| • | | A sensible, targeted and compassionate approach to the issue of supervised consumption sites |
Results:
In August 2019, the province commissioned a review of supervised consumption services (SCS) to evaluate the social and economic impacts of current and proposed SCS sites. The final report, Impact: A Socio-
| | |
| 106 | | Government of Alberta | Annual Report 2019 – 2020 |
MEASURING UP
Economic Review of Supervised Consumption Sites in Alberta, released in March 2020, was informed by public input and pre-existing, third party data and research.
Some key findings of the report included inadequate oversight and a lack of accountability mechanisms, lack of focus on referrals to recovery oriented services, a need for improved needle debris and needle distribution policies, issues with erratic behaviour near the sites and inadequate community consultation prior to sites opening. These findings are being used to inform the development of a comprehensive, long-term approach to protect communities and improve recovery oriented supports for Albertans dealing with addiction.
The Government of Alberta extended grant funding for existing SCS and Opioid Prevention Services sites until September 30, 2020, while determining the best way to move forward on a city-by-city basis and improve consistency across all sites in 2020-21. The additional funding for the six month extension was $8.2 million.
| • | | Increase access to palliative care to alleviate suffering |
Results:
Across Alberta, palliative and end-of-life care (PEOLC) is offered in a range of settings including, but not limited to, acute care hospitals, outpatient clinics, primary care provider settings, community hospice spaces, continuing care facilities (designated supportive living and long-term care), emergency medical services, and home care. Budget 2019 committed $20 million over four years to support enhancement of palliative and end-of-life care across the province, including expanding access to palliative home care services in rural areas.
A provincial PEOLC website through MyHealth.Alberta.ca has been established to provide information to patients, families/caregivers and health care providers. The website provides information on options for timely, appropriate, and quality care including advanced care planning discussions that enable reflection on personal values and preferences, establishing goals for care that spans the disease process from early diagnosis to end of-life, and bereavement support.
| | |
| Government of Alberta | Annual Report 2019–2020 | | 107 |
MEASURING UP
Objective 2 | Strengthening quality education that delivers the best possible outcomes
Performance Indicator: Student Achievement
Percent of Students Achieving Acceptable Standards on Grade Six and Nine Provincial Achievement Tests
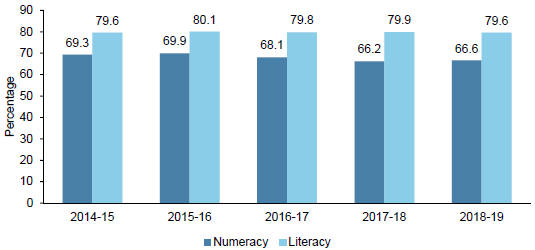
Source: Ministry of Education
For sources and notes see page 128.
In 2018-19, overall 79.6 per cent of students achieved the acceptable standard on grade six and nine provincial achievement tests in Language Arts (Literacy), maintaining Alberta’s previous strong results.
In 2018-19, overall 66.6 per cent of students achieved the acceptable standard on grade six and nine provincial achievement tests in Mathematics (Numeracy), showing a slight rebound from the previous year.
Student achievement on grade six to nine standardized tests is an indicator of educational success. Results indicate whether the province’s programs of study, implementation guides for teachers, and authorized learning materials, are successfully supporting learning.
Actions
| • | | Amend the Education Act to improve student success, strengthen parental rights, enhance local decision-making for school boards, increase education choice and improve accountability within the system |
Results:
The Education Amendment Act, 2019, which came into force on September 1, 2019, was informed by widespread consultation over a number of years and was designed to modernize Alberta’s education system and improve student success.
This act amended the Education Act that was passed in 2012 but not proclaimed. The Government of Alberta worked with education partners such as the Alberta School Boards Association, the College of Alberta School Superintendents, the Association of School Business Officials of Alberta, the Alberta Association of Public Charter Schools the Public School Boards Association of Alberta, Fédération des Conseils scolaires francophones de l’Alberta, and the Alberta Catholic School Trustees’ Association through 2019-20 to finalize the legislation, and supporting regulations and Ministerial Orders, to address the issues of student success, parental rights, decision making for boards and increased educational choice.
| | |
| 108 | | Government of Alberta | Annual Report 2019 – 2020 |
MEASURING UP
After the act came into force, the Government of Alberta continued working with school authorities to smooth the transition to the new legislative requirements.
| • | | Review and update the current K–12 education funding formula to ensure enrolment growth is addressed; and decrease the percentage of government funding going to administration and governance |
Results:
As the funding model for K-12 had not changed in over 15 years, in 2019 the Government of Alberta undertook a review to improve funding and accountability processes and ensure that the education system is meeting the needs of students. Following the review, the Government of Alberta announced a new funding model for the K–12 education system to streamline operations and direct more dollars to the classroom, which is set to take effect for the 2020-21 school year. The new model provides more predictability in funding by moving away from using one-year enrolment counts to calculate funding requirements for a school division to a three-year average enrollment number. This approach provides more year-over-year stability and predictability of funding levels for school divisions, which improves the planning process for significant considerations such as staffing and facilities. The new model reduces red tape and gives more flexibility to school divisions to determine how to best invest taxpayer dollars. A new system administration targeted grant has been created to increase transparency of costs and consistency between divisions. Transfer of funds from other grants to system administration is not permitted.
| • | | Set overall future direction, goals and appropriate governance modes for the post-secondary system |
Results:
In 2019-20, the Government of Alberta worked with the post-secondary system to help institutions realize their goals in a more fiscally responsible manner by reducing institutional reliance on government revenues and introducing a new funding model through the development of three year investment management agreements.
The new funding model consists of a series of metrics that each institution must meet and report on in their newly designed investment management agreements. Tying institutional funding amounts to outcomes will ensure the transition to a more sustainable investment framework does not come at the expense of the outcomes. Based on discussions with post-secondary institutions around the percentage of funding tied to outcomes, metrics, and performance-based funding, investment management agreements were to be implemented in the 2020-21 academic year. However, as a result of impacts of COVID-19 on post-secondary institution operations, performance-based funding and investment management agreements will be delayed until a future academic year.
In June 2019, Government of Alberta launched a comprehensive review of Alberta’s post-secondary system. The Alberta 2030 Initiative will renew the adult learning system’s focus on providing the education, skills and training the province needs to meet labour market demands and help Albertans get back to work. The review will assess global models and trends in post-secondary education in relation to Alberta’s existing post-secondary model and governance, and develop an implementation roadmap by early 2021.
In addition, the Skills for Jobs Task Force was appointed in September 2019 to find ways to expand and strengthen apprenticeship education and opportunities in skilled trades professions to meet labour market demands. The Task Force’s mandate is to work with industry, educators and trades professionals to make recommendations to strengthen enrolment in apprenticeship programs and expand the apprenticeship model to other careers and occupations. The Task Force began an engagement process in 2019, with a final report anticipated by the end of September 2020. It is expected that recommendations will align with and support the Alberta 2030 review.
| | |
| Government of Alberta | Annual Report 2019 – 2020 | | 109 |
MEASURING UP
Objective 3 | Protecting vulnerable Albertans
Actions
| • | | Implement an Alberta Action Plan to Combat Human Trafficking |
Results:
The Protecting Survivors of Human Trafficking Act was developed as a key part of the Action Plan to help address human trafficking and better protect survivors in Alberta, and is based on stakeholder engagement that included 70 participants representing 50 organizations, including police and victims’ services groups.
This new legislation allows the Government of Alberta to create:
| | - | an annual day (February 22) to bring awareness to the issue of human trafficking; |
| | - | a standard definition of human trafficking and a standard definition of sexual exploitation; |
| | - | a statutory tort allowing victims of trafficking to sue their traffickers; and |
| | - | a statutory remedy allowing victims to secure a protection order from their traffickers and, a warrant permitting a police officer entry. |
In addition, a Human Trafficking Task Force will begin work in 2020 to provide recommendations on how to best implement Alberta’s action plan to combat human trafficking. The Task Force will provide guidance and recommendations on supports for survivors, enhance collaboration among all stakeholders and organizations that work with survivors of human trafficking in order to prevent, protect and ensure their safety, and engage experts to identify what actions are needed to bring sustainable change. The Chair will provide quarterly reports of the Task Force’s progress to the Minister of Justice and Solicitor General.
| • | | Passing an Alberta version of ‘Clare’s Law’ to reduce domestic and partner violence |
Results:
In 2019-20, the Ministries of Community and Social Services, Justice and Solicitor General and Culture, Multiculturalism and Status of Women collaborated on the development of Alberta’s Disclosure to Protect Against Domestic Violence (Clare’s Law) Act, which received Royal Assent on October 31, 2019. The purpose of the act is to empower potential victims of domestic violence with information regarding their intimate partner’s history of domestic violence. Specifically, the act authorizes three elements: the “right to ask”, where applicants have a right to inquire if their partner has a history of domestic violence or other relevant offences; the “right to know”, which authorizes police to proactively inform a potential victim at risk of domestic violence; and the “right to privacy”, which ensures personal information is safeguarded.
The Government of Alberta engaged civil society organizations with direct service delivery and experience addressing domestic violence to continue to develop polices and regulations to support the act. The Ministry of Justice and Solicitor General established a protocol working group to develop the implementation plan for police services, which encompasses the necessary processes, training and systems required when the legislation comes into effect later in 2020-21. All of these efforts are supported by input from Alberta’s 11 police services, victim services agencies and civil society organizations that address domestic violence.
| | |
| 110 | | Government of Alberta | Annual Report 2019 – 2020 |
MEASURING UP
| • | | Make life better for seniors and their caregivers by maintaining low income benefits and through civil society partnerships |
Results:
In addition to providing financial assistance programs for Albertans aged 65 and older, the Government of Alberta supported local civil society organizations and other partners to provide seniors and their families the services and supports they need including:
| | - | The Aging Well in Community Grant Program supported projects in 28 community organizations focused on aging in communities, addressing ageism, social inclusion and engagement of diverse populations, and elder abuse prevention. The grant program, which provided over $1.6 million in funding in 2018-19, also included a further $350,884 in 2019-20. |
| | - | The Government of Alberta partnered with a number of civil society organizations in 2019-20, such as the Seniors Outreach Program Society in Medicine Hat, to celebrate and recognize seniors, reflect positive images of aging, and address ageism through initiatives such as annual Seniors’ Week celebrations held during the first week of June. |
| | - | In addition, the Government of Alberta hosted Minister’s Seniors Service Awards celebrations in the summer of 2019 to recognize Albertans who volunteer to support seniors and their communities, and conducted a Banner Raising Ceremony on October 1, 2019, to celebrate the Day of Older Persons in Alberta. |
| | - | To coincide with World Elder Abuse Awareness Day on June 15, 2019, government released Addressing Elder Abuse: A Toolkit for Developing a Coordinated Community Response to help communities, organizations, and individuals develop a local approach to elder abuse. |
| | - | In November 2019, government co-hosted Vision 2030 Seniors Services Symposium with the Alberta Association on Gerontology, bringing together experts and innovators across sectors to share findings and new solutions for Alberta’s aging population. Experts and innovators included speakers such as Dr. Carole Estabrooks, Professor and Canada Research Chair, Faculty of Nursing and School of Public Health, University of Alberta; Dr. Norah Keating, Professor and Co-director of Research on Ageing, Policies and Practice, University of Alberta; and Monica Morrison, President of the Alberta Association of Seniors Centres. |
| | - | A Caregiver Supports Working Group was established in 2018 to develop recommendations and actions to address and support the needs of caregivers over the next several years. Government has committed $3 million over three years to Caregivers Alberta to expand supports across the province, including for those caring for continuing care clients and residents. |
Through its Red Tape Reduction initiatives, the Government of Alberta has made navigation of and enrolment in benefits and programs easier. Seniors can now connect with the Seniors Financial Assistance Online Services using a MyAlberta Digital ID verified account online for document submission and online loan repayments.
In addition, on June 28, 2019 it was announced that recipients of the Assured Income for the Severely Handicapped (AISH) program would be automatically enrolled into Alberta’s senior’s financial assistance programs upon turning 65 years old. This change eliminated the application process so AISH recipients do not have to provide the same information to different the Government of Alberta programs. This change will also help to reduce the burden on caregivers, AISH recipients and senior-serving organizations, and ensures uninterrupted provincial benefits for AISH clients as they transition to seniors programs.
| | |
| Government of Alberta | Annual Report 2019 – 2020 | | 111 |
MEASURING UP
| • | | Enact policies that support the desires, dignity, and choices of Albertans with disabilities |
Results:
A number of key initiatives were undertaken or continued in 2019-20 to support Albertans with disabilities, including:
| | - | Annual funding was increased for the Residential Access Modification Program by $800,000, resulting in 30 per cent more Albertans with mobility challenges being able to modify their homes in order to remain living there safely. |
| | - | In Calgary and Edmonton, the Government of Alberta continues to support the low income subsidized transit pass programs helping AISH recipients and low income Albertans to move through their communities to access jobs, education, health care, community resources and government services. |
| | - | Interim policies were developed to allow flexibility for families accessing Family Supports for Children with Disabilities services to reallocate funding as required, which was able to address school closures due to COVID–19 that necessitated respite services being used during the time their child would normally be in school. |
| | - | Auto-enrollment for AISH recipients was implemented to the Alberta Seniors Benefit program (see the action item above, Make life better for seniors and their caregivers by maintaining low income benefits). |
| | - | The Premier’s Council on Charities and Civil Society (PCCCS) was established to provide independent advice to the Government of Alberta on how to assist the efforts of civil society organizations and how best to address critical social issues affecting Albertans. The Government of Alberta held three discussions with the PCCCS late March 2020, which helped to inform its response to the COVID-19. |
| | - | The Government of Alberta streamlined and simplified processes for accepting and processing AISH applications, and informing applicants about the status of their eligibility. The Assured Income for the Severely Handicapped Act and supporting policies for AISH acceptance were aligned to ensure that the date an Albertan is eligible to receive AISH benefits is coordinated with the date all the application documents were received, resulting in simplified and transparent AISH process for Albertans with disabilities. |
| | - | A Minister’s Disability Advisory Forum was created to facilitate an open dialogue with the disability community, including, self-advocates, families, service providers and community disability workers. Two sessions were held, giving participants the opportunity to share perspectives to help inform future policy decisions about disability policy, programs and services. |
| | |
| 112 | | Government of Alberta | Annual Report 2019 – 2020 |
MEASURING UP
Objective 4 | Make the justice system fairer, faster and more effective
Performance Indicator: Crime Severity Index
Index of all Criminal Code and federal statute offences
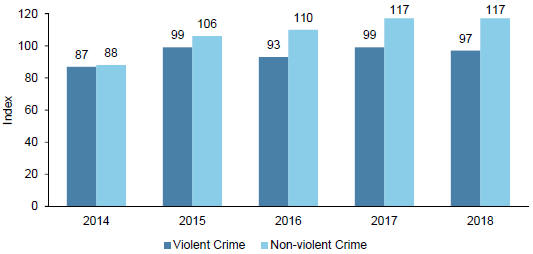
Source: Uniform Crime Reporting Survey, Canadian Centre for Justice and Community Safety Statistics (CCJCSS).
For sources and notes see page 128.
In 2018, Alberta’s violent CSI was 97 and Alberta’s non-violent CSI was 117. Between 2017 and 2018, seven of Canada’s 13 provinces and territories reported increases in their CSI, Alberta placing eighth with no change. This was attributable to an increase in fraud, offset by a decrease in homicide. The overall volume and severity of non-violent CSI was the same as the previous year, due to increase in fraud and shoplifting of $5,000 or under offset by a decrease in theft of $5,000 or under (non-shoplifting), possession of stolen property and motor vehicle theft.
The most recent urban-rural data breakdown (2017) for CSI shows the violent CSI decreased in both urban and rural Alberta between 2009 and 2017, by 11 percent and two percent respectively. Both areas experienced increases in non-violent CSI over the same time-period, up six percent in urban and 23 percent in rural Alberta.
Actions
| • | | Hire 50 new prosecutors and support staff |
Results:
As identified in Budget 2019, the Government of Alberta will be spending up to $10 million annually for four years to hire 50 new Crown prosecutors and support staff to enhance the functionality of Alberta’s criminal justice system and ensure that criminal matters are dealt with in a timely and appropriate manner. In 2019-20, Justice and Solicitor General began planning the accommodations for additional prosecutors and support staff and developed a strategy for the staged hiring of new prosecutors that will see 20 prosecutors hired in 2020-21, 20 prosecutors hired in 2021-22, and 10 prosecutors hired in 2022-23. Crown prosecutors will be assigned based on factors including workload, existing staffing patterns, geographical considerations and needs.
In addition to hiring support staff, the Government of Alberta is expanding its articling program, and in 2019-20 doubled the number of articling students hired from eight to 16 articling students. To fulfil
| | |
| Government of Alberta | Annual Report 2019 – 2020 | | 113 |
MEASURING UP
the Government of Alberta’s promise to ensure rural Albertans are better served by the justice system, articling students will be placed in a variety of locations including Fort McMurray, Grande Prairie, Slave Lake, Fort Saskatchewan, Wetaskiwin, Edmonton Rural and Regional Response Office, and Calgary Rural and Regional Response Office. Articling students will receive practical experience and will help Crown prosecutors focus on higher priority files, making the justice system faster and more efficient. In 2021, the articling program will be further expanded to 20 articling students, which will make the Government of Alberta the largest employer of articling students in the country.
| • | | Crack down on crime by enacting the Public’s Right-to-Know Act |
Results:
The introduction of a Public’s Right-to-Know Act is a government commitment to report annually on justice statistics. For the Government of Alberta to understand where there are issues in the system and where corrections are required, key statistics must be tracked. Based on data trends, government will be able to make evidence-based decisions that enhance the responsiveness of justice system functions, thereby creating a more effective system overall.
In 2019-20, work was undertaken to review similar-to-Alberta jurisdictions’ approaches and to identify potential statistics for public reporting. Over the coming year, the ministry will propose legislation, continue to confirm, collect and analyze data, develop a format for reporting, and report on data publicly and annually.
| • | | Fight rural crime with stronger laws, more prosecutors and more police |
Results:
The Government of Alberta is implementing focused and collaborative rural crime initiatives to ensure the justice system protects Albertans and their property. In fall 2019, the Minister of Justice and Solicitor General toured the province engaging with Albertans to hear their concerns around rural crime. A rural crime survey was also launched to gather Albertans’ feedback. In response, a rural crime plan has been developed that includes:
| | - | the integration of Alberta peace officers to respond to a wider range of calls and to assist the RCMP and other police services in response to rural crime beginning in fall 2020; |
| | - | increasing the budget for the Alberta Law Enforcement Response Teams by up to $50 million over the next four years to address organized and serious crime, including gang violence, drug trafficking, child pornography, stalking, and domestic violence; |
| | - | hiring 50 additional crown prosecutors and support staff to serve rural areas beginning in 2020-21; |
| | - | proclaiming the Scrap Metal Dealers and Recyclers Identification Act in 2019 to deter metal theft by making it more difficult for criminals to monetize stolen material by selling it for scrap; and, |
| | - | investing up to $20 million over four years to expand drug treatment courts to five additional sites across the province. |
In November 2019, the Government of Alberta announced the creation of the Rural Alberta Provincial Integrated Defence Force, which will be phased-in starting in fall 2020 to expand the roles and authorities of 400 peace officers to respond to crimes in rural areas. These changes will allow these officers to respond to a wider range of calls and to assist the RCMP and other police services in some emergencies. For fish and wildlife officers, these calls could include in-progress assaults and armed robberies, in-progress break and enters, and 911 hang-ups. For the Sheriff Highway Patrol, these calls could include complaints about erratic drivers, collisions and impaired driving.
| | |
| 114 | | Government of Alberta | Annual Report 2019 – 2020 |
MEASURING UP
Over 2019-20, the Government of Alberta also worked with municipalities to implement a new police funding model that is equitable, transparent and sustainable. Under the former Police Act, policing was provided at no direct cost to rural municipalities in Alberta. Under the new model, smaller communities will begin paying for a portion of their frontline policing costs, which will constitute an approximate increase in rural police funding of more than $286 million over five years. This investment places priority on adding uniformed patrol officers in rural RCMP detachments and will also add members to specialized RCMP units that dismantle organized crime and drug trafficking and investigate auto and scrap metal theft. Meanwhile, new civilian positions will assist with administrative tasks and investigative support to improve response times and help ensure officers have the support network they need to protect Albertans by spending more time in their communities.
| • | | Increase access to drug treatment courts |
Results:
To combat cycles of crime and addiction in rural communities, intensive court-supervised drug treatment programs –known as Drug Treatment Courts—have been established. Participants are supported in overcoming drug dependence, stopping criminal behaviour and reintegrating into the community. The Government of Alberta has committed to invest up to $20 million over four years to expand drug treatment courts to five additional sites across the province and increase the capacity of existing courts in Calgary and Edmonton. In March 2020, it was announced that Lethbridge would be the first location for a drug treatment court outside of Edmonton and Calgary. Further expanding these courts to other locations will help keep more Albertans safe by breaking the cycle of addiction-related crime.
Objective 5 | Building better communities
Actions
| • | | Give municipalities more autonomy and predictability while ensuring transparency for voters |
Results:
The Government of Alberta completed the first stage of a comprehensive review of the Municipal Government Act (MGA), focusing on the rules around inter-municipal collaboration frameworks (ICFs). In 2019-20, amendments were made to the MGA as part of the fall 2019 Red Tape Reduction Implementation Act that came into effect on December 5, 2019. As a result, municipal autonomy and predictability have been improved by eliminating the need for municipalities to report in to the province on ICFs and allowing municipalities more options in the adoption of ICFs, including determining the content of these agreements and determining how to resolve disputes. This streamlining made it easier for municipalities to save taxpayer dollars by working together on delivering services for their citizens.
| • | | Build more affordable houses for those in need including seniors requiring specialized housing |
Results:
In 2019-20, the Government of Alberta provided $181 million to increase and maintain the supply of affordable housing. Investments were in both existing and new housing for families, seniors and individuals with low income who cannot afford private sector accommodation, seniors’ lodges, and seniors’ self-contained living and housing projects that provide supportive social or health services. There were 44 active capital development projects committed to or under implementation in 2019-20. Nine projects were completed throughout the year, for a total of 532 new units. The completed units include 125 seniors housing units, 37 family and community housing units, and 370 affordable and specialized housing units. In total, the government supports about 60,000 affordable housing units.
| | |
| Government of Alberta | Annual Report 2019 – 2020 | | 115 |
MEASURING UP
In addition, the Government of Alberta continued working with the federal government on Alberta’s utilization of $25.4 million in federal funding for 2019-20 under the National Housing Strategy for provincial housing programs to ensure Alberta meets its cost-match obligations to maximize its share of available federal funding. The strategy’s bilateral agreement will make $339 million in federal funding available to Alberta between 2019-20 and 2027-28.
| • | | Develop arts and culture through facilitated collaboration with philanthropists and private businesses |
Results:
In 2019-20, in-depth policy research has been conducted on how governments support creative and cultural industries around the world. Alberta focused on the three areas of relationship brokering, capacity/ skills enhancement, and funding models. Local engagement was planned for early 2020 but was delayed due to the COVID-19 pandemic.
The majority of cultural industry businesses are small or micro enterprises or non-profits, of which many lack access to sufficient capital to grow their businesses. The Government of Alberta is exploring new ways to leverage philanthropic and private assets and advance innovative funding solutions for arts and cultural sector organizations. The Creative Partnerships Alberta program will help to build further resilience and adaptability of arts and cultural organizations in the years to come.
| • | | Protect Albertans’ property rights through a new Alberta Property Rights Protection Act and reviewing all existing legislation |
Results:
The Government of Alberta is committed to protecting Albertans’ right to own and enjoy property. On December 5, 2019, the Trespass Statutes (Protecting Law-abiding Property Owners) Amendment Act came into force to address liability concerns of property owners faced with trespassers who may be injured while committing or attempting to commit a criminal offence. Building on changes that occurred in 2019, work will continue to be done to assess further legislative and regulatory changes to ensure Albertans’ property rights are protected.
| • | | Review Alberta Environment and Parks legislation to modernize it for the 21st century |
Results:
Alberta’s approach to public lands management and improvement of legislation has been modernized to increase efficiency and clarity in the system, reduce red tape and better support the needs of Albertans.
Focus areas in 2019-20 included:
Technology Innovation and Emissions Reduction (TIER) Regulation Regulatory Approvals Enhancement - Stakeholders suggested that oil and gas sector reporting, verification and compliance processes be streamlined. In response, the Government of Alberta amended the TIER Regulation to allow multiple conventional oil and gas facilities to aggregate when submitting annual compliance reports, thereby reducing reporting expectations on industry and easing the administrative burden within government. Interim compliance reporting was eliminated under the new regulation and compliance deadlines were adjusted to align with other regulatory reporting requirements. Taken together, all of this eased the reporting and verification burden placed on regulated facilities under the former regulatory regime, and within government.
Public Land Liability and Reclamation Management - In 2019-20, the Government of Alberta asked for input from the public and industry about the Government of Alberta’s upstream oil and gas liability
| | |
| 116 | | Government of Alberta | Annual Report 2019 – 2020 |
MEASURING UP
management regime. This informed changes which resulted in an improved ability for the Alberta Energy Regulator and Orphan Well Association to more effectively manage orphan wells and associated infrastructure, such as pipelines. The Government of Alberta also consulted with the sand and gravel industry and starting in 2020-21 reclamation securities can be paid through demand forfeiture bonds thus improving industry liquidity.
Environmental Impact Assessment - In 2019-20, the Government of Alberta focused on providing regulatory certainty and supporting the competitiveness of industry through delivery of robust environmental impact assessments. Information gathered during the assessment process helps the appropriate regulatory board determine if the project is in the public interest.
Caribou Protection - Sub-regional and caribou range planning, and preliminary work on a Trails Act and fee framework has begun in 2019-20, which will continue into 2020-21 and include engagement with Albertans. Three caribou sub-regional task forces were established to provide recommendations to the Government of Alberta and ensure socio-economic assessments are considered in the sub-regional planning process for areas in northern and west central Alberta. Especially areas where woodland caribou live, a species designated as threatened under the federal Species at Risk Act.
Objective 6 | Partnering with Indigenous Peoples to pursue opportunities
Actions
| • | | Include Alberta’s Indigenous communities in our “Stand Up for Alberta” strategy to help energy projects and Indigenous communities both succeed and prosper |
Results:
In 2019-20, the Government of Alberta continued to work with all Indigenous ownership groups connected to the Trans-mountain Expansion Project to support engagement efforts and development of their modelling of structures. This support has allowed for valuable engagement with Indigenous communities along the right of way of the Trans-mountain Pipeline and the future Trans-mountain Expansion, sharing information about the project and the potential for jobs and business development.
| • | | Establish the Alberta Indigenous Opportunities Corporation to work towards Indigenous Peoples’ ownership in major resource projects |
Results:
Following eight engagement sessions with nearly 200 participants, including Indigenous leaders and stakeholders representing the financial sector and natural resource industry, a Ministerial Advisory Committee was formed to support the early stages of development of the Alberta Indigenous Opportunities Corporation (AIOC).
On November 26, 2019 the Alberta Indigenous Opportunities Corporation Act received Royal Assent, establishing the AIOC to assist Indigenous communities with access to capital and expertise as they seek to make medium-to-large scale investments in major resource projects. The AIOC is available to Indigenous groups for projects throughout Canada.
An approach to funding has been developed that allows the AIOC to set up and manage its operations, including the provision of capacity grants to Indigenous communities, while ensuring that the Government of Alberta provides effective oversight of the AIOC. This oversight requires regular reporting by the AIOC to ensure that its regulatory requirements are adhered to, that it exhibits prudent financial management and that it is carrying out its mandate to support Indigenous communities. Funding in the amount of two million dollars was provided to the AIOC for 2019-20.
| | |
| Government of Alberta | Annual Report 2019 – 2020 | | 117 |
MEASURING UP
| • | | Advocate for a federal Aboriginal consultation process that provides clear timelines and legal certainty for project proponents, consistent with the federal government’s constitutional obligations |
Results:
Over the past year, the Government of Alberta corresponded with federal and provincial ministers to advocate for a better consultation process. In 2019-20, Alberta’s advocacy focused on developing a consensus on a national economic corridor that would include streamlined consultation processes. Dialogue will continue in 2020-21.
| • | | Add promotion of economic development to the preamble of Alberta’s Indigenous consultation policies to explicitly consider support from Indigenous communities for projects that affect them |
Results:
The Government of Alberta is committed to reconciliation and supporting the ability of First Nations and Metis Settlements to participate in economic development opportunities. To reflect this commitment, the Government of Alberta amended the preamble of The Government of Alberta’s Policy on Consultation with First Nations on Land and Natural Resource Management, 2013, and The Government of Alberta’s Policy on Consultation with Metis Settlements on Land and Natural Resource Management, 2015.
Each policy’s preamble now includes the following:
“Additionally, the provincial government strives to ensure [First Nations/Metis Settlements] have the chance to benefit from economic development opportunities and to enjoy Alberta’s prosperity.”
| • | | Work to streamline how Indigenous Peoples access key services such as education and health care, including ensuring Indigenous students have access to a provincial education system (paid for with federal dollars) that enables students to succeed |
Results:
The Government of Alberta signed Protocol Agreements that provide a framework for continued collaboration between the Government of Alberta and Indigenous Peoples in Alberta. They function as a broad umbrella agreement, under which meaningful discussion and information sharing occurs. Through the Protocol sub-tables, work is ongoing in considering how to streamline services for Indigenous Peoples.
The sub-tables enable discussions on Indigenous community health needs and gaps. The Government of Alberta worked with First Nations to identify and remove barriers to the provisions of Persons with Developmental Disabilities programs on-reserve, helping to reduce barriers and increase access to the appropriate supports. This is an ongoing effort, and the Government of Alberta will continue to monitor the progress of the initiative through direct involvement, where needed, within communities across Alberta. The Government of Alberta will continue to monitor progress of the initiative through direct involvement and, where needed, within communities across Alberta.
In addition, work continues with First Nations governments to streamline how First Nations students access the provincial education system, and to strengthen future education services agreements that will help ensure First Nations students have access to provincial education on equitable terms, regardless of where they live in the province.
| | |
| 118 | | Government of Alberta | Annual Report 2019 – 2020 |
MEASURING UP
Priority Three: Standing Up for Alberta
Alberta has been a major contributor to the Canadian economy for decades. Alberta attracted nearly a quarter of the capital investment in the country last year and was responsible for over 20 per cent of the Canadian goods that are exported internationally. Alberta’s fiscal contribution to the Canadian federation has been and remains equally substantial. Over the past 25 years, Albertans have made a net contribution to Canada of more than $400 billion (in 2018 dollars).
Alberta’s ongoing economic and fiscal contributions to Canada play a vital role in driving and sustaining the national economy, as well as in funding the federal programs upon which all Canadians rely. Energy resource development in Alberta is a key provider of investment, jobs, business opportunities, taxes and royalty revenues that fund important government programs for Albertans. Provinces hold the right to control and develop their natural resources and compete freely and fairly in the national and international economies.
The following initiatives were undertaken by the Government of Alberta in 2019-20:
Performance Indicator: Oil Market
Alberta’s Oil Sands Supply Share of Global Consumption
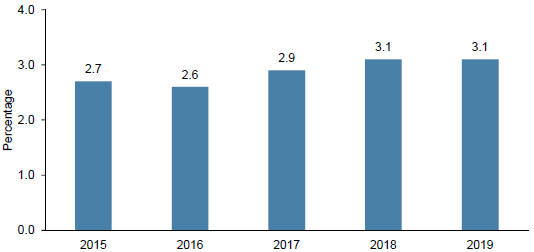
Source: Alberta Energy Regulator, International Energy Agency Oil Market Report
For sources and notes see page 129.
Total global oil consumption increased by 0.7 percent from 99.1 million bbl/d in 2018 to 99.8 million bbl/d in 2019. While the growth of Alberta’s total crude bitumen production from 2018 to 2019 was lower than the previous year, the growth of global oil consumption also slowed down during this time period. There has been a significant decrease in global and North American crude oil demand because of COVID-19. Crude oil production throughout North America (including Alberta) fell in response to a combination of reduced drilling activity and from voluntary production cuts made by several companies.
Overall, the significant slowdown in Alberta’s bitumen production rate of growth from 2017-18 to 2018-19 was due to the lack of advancement in additional access to markets. Pipelines and rail did increase in 2019 by 71,000 barrels per day, through debottlenecking projects and additional rail contracts in late 2019; by late 2019, production was at a record high and crude-by-rail was increasing. The Government of Alberta’s curtailment policy aligned to these increases to ensure that Alberta’s production and storage were managed throughout the year.
| | |
| Government of Alberta | Annual Report 2019 – 2020 | | 119 |
MEASURING UP
Objective 1 | Getting pipelines built
Actions
| • | | File a constitutional challenge to strike down Bill C-69 – An Act to Enact the Impact Assessment Act and the Canadian Energy Regulator Act, to amend the Navigation Protection Act and to make consequential amendments to other acts |
Results:
Federal Advocacy
The Government of Alberta continues to advocate against the Impact Assessment Act and the Oil Tanker Moratorium Act. These acts have had a significant impact on Alberta’s resource sector, notably the erosion of investor confidence in Canada’s regulatory framework and deterrence of investment in a country that has already been seen as a risky a place to invest.
In 2019-20, the Government of Alberta continued to advocate for Alberta’s interests and request clarity and amendments on many issues that exist with this legislation.
Impact Assessment Act
Introduced in 2017, the Impact Assessment Act, formerly Bill C-69, was proclaimed by the federal government in August 2019. The Government of Alberta sent letters and technical information to the federal parliament and the senate expressing concerns, and in May 2019, the premier and the Minister of Energy presented Alberta’s position to the senate committee studying the bill, urging the committee to accept Alberta’s amendments.
The concern is that the Impact Assessment Act will:
| | - | Exceed federal jurisdiction by granting federal powers to regulate provincial projects — including in situ oil sands developments — that are entirely within provincial borders and already subject to provincial regulation. This overreach is contrary to the Constitution Act and a 1992 Supreme Court ruling; and, |
| | - | Ignore exclusive provincial authority as per Section 92A of the Constitution, which was agreed to by Alberta and the federal government in 1982. |
In September 2019, the Government of Alberta launched its challenge against this Impact Assessment Act.
Oil Tanker Moratorium Act
In 2017, the federal government introduced the Oil Tanker Moratorium Act, formerly Bill C-48 and proclaimed it in June 2019. The act imposes an indefinite ban on tankers carrying more than 12,500 tonnes of crude oil or persistent oils – approximately 85,000 barrels – from stopping, loading and unloading along BC’s north coast; Banned products include crude oil, partially upgraded bitumen, diluted bitumen, marine diesel and bunker fuel, and synthetic crude, among others.
Organizations opposed to the act that testified in front of the Senate committee include: the Canadian Association of Petroleum Producers; Suncor; Cenovus; BC Chamber of Shipping; port authorities; business associations; Western Canada Marine Response Corporation; Canada West Foundation; Aboriginal Equity Partners; and the Indian Resource Council.
The Government of Alberta sent letters and technical input expressing concerns about the Oil Tanker Moratorium Act over the course of several years. Premier Kenney and Minister Savage testified before the senate committee in April 2019, and urged the committee to reject the bill and announced Alberta would challenge the bill if it became law.
| | |
| 120 | | Government of Alberta | Annual Report 2019 – 2020 |
MEASURING UP
In addition, Alberta’s advocacy for the Trans-Mountain Expansion Project contributed to the federal government reapproving the project in June 2019, the Federal Court of Appeal dismissing applications against the project in February 2020, and the Supreme Court rejecting challenges to the project in March 2020 and July 2020. Construction on the Alberta portion of this project began in December 2019. Construction resumed on the BC portion in June 2020.
Alberta’s $1.5 billion (CDN) equity investment in the Keystone XL pipeline was the key factor in breaking ground on construction this spring in a project that will support an estimated 17,000 Canadian jobs. A six billion dollar Alberta government loan guarantee will ensure continued construction next year with projected completion in spring 2023. Upon completion, this project will move as much as 830,000 barrels of Alberta crude to the US market.
| • | | Use the Preserving Canada’s Economic Prosperity legislation should provinces, including British Columbia, continue to obstruct the construction of pipelines |
Results:
The Government of Alberta proclaimed the Preserving Canada’s Economic Prosperity Act on April 30, 2019. The act gives Alberta the ability to halt or restrict the export of crude oil, natural gas and refined fuels to other jurisdictions, including provinces, if necessary.
| • | | Build an interprovincial coalition of provinces which support jobs, pipelines, and our energy industry, making it a top issue in federal-provincial relations |
Results:
The Government of Alberta hosted and participated in several intergovernmental meetings to bring issues that matter most to Albertans to the forefront of the national agenda:
| | - | In June 2019, Premier Kenney hosted the Western Premiers’ Conference in Edmonton, with the Premiers of British Columbia, Saskatchewan, Manitoba, Northwest Territories, Yukon, and Nunavut. The discussions at the conference led to shared support for economic corridors to facilitate oil and gas pipelines and to improve interprovincial trade. Premiers agreed that each jurisdiction would benefit from improved access to new markets. |
| | - | In advance of the Council of the Federation (COF) meeting, Premier Kenney hosted a meeting with the Premiers of Saskatchewan, Ontario, New Brunswick and Northwest Territories in Calgary on July 8, 2019. At that meeting, premiers discussed common priorities and built on conversations from the Western Premiers’ Conference, by discussing actions that can be taken to create good jobs, support responsible resource development, get Canadian energy to global markets, create economic corridors, and reduce barriers to interprovincial trade and labour mobility. |
| | - | On July 9-11 2019, all premiers met at the COF meeting in Saskatoon. During this meeting, Premier Kenney took the bold step of removing all of Alberta’s procurement exceptions to the 2017 Canadian Free Trade Agreement; announced a fast-track review of all remaining Alberta exceptions; achieved a commitment that all provinces and territories would conduct a full review of their respective trade exceptions; and, secured support to undertaken further work on economic corridors. Alberta is leading ongoing work on the concept of economic corridors. |
| | - | In June 2019, Alberta issued a joint premiers’ letter from Alberta, Saskatchewan, Manitoba, Ontario and New Brunswick expressing disappointment with the federal Impact Assessment Act and the Oil Tanker Moratorium Act, along with a joint ministerial statement and press conference by Alberta, Ontario and Saskatchewan in support of amendments to the federal Impact Assessment Act. |
| | |
| Government of Alberta | Annual Report 2019 – 2020 | | 121 |
MEASURING UP
| | - | In December 2019, the premier led a delegation of ministers on a mission to Ottawa to press for a fair deal for Alberta. The mission focused on a wide range of issues, including fiscal federalism, methane equivalency, pipelines, oil and gas well reclamation, Bill C-69, liquefied natural gas, and the Oil Tanker Moratorium Act. |
| | - | In February 2020, the premier promoted investment and pipelines through meetings held in Montreal and Washington DC. In Montreal, the premier spoke with a roundtable of top business leaders, and met with CEO’s of Canada’s largest corporations to discuss the benefit of a thriving energy sector. While in Washington DC, Premier Kenney met with senior cabinet members to discuss pipelines and Alberta energy exports, including meetings with Secretary of State Mike Pompeo, Secretary of Energy Dan Brouillette, Secretary of the Interior David Bernhardt and US Trade Representative Robert Lighthizer. Premier Kenney also discussed pipeline issues and new opportunities for expanding trade with the United States following the ratification of the Canada-United States-Mexico Agreement. |
| | - | Alberta continued to work with federal, provincial, and territorial counterparts on opportunities in minerals and mining, including providing input into the new Canadian Minerals and Metals Plan and Action Plan 2020. |
| | - | The Government of Alberta took part in Energy and Mines Ministers’ Conference meetings with their counterparts in summer 2020 to discuss strategies to ensure the competitiveness of Canada as an energy jurisdiction, including working together to develop common messaging for discussions with international audiences. |
Objective 2 | Standing up to foreign influences on Alberta’s natural resources
Performance Indicator: Upstream Investment in the Alberta Oil and Gas Sector
Total investment in the upstream energy sector by year ($ billions)
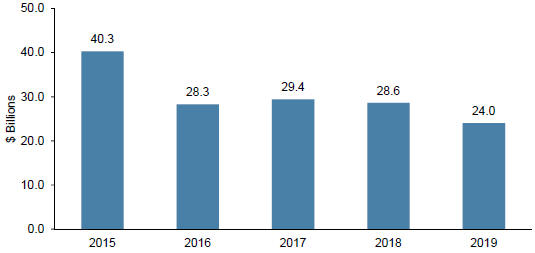
Source: Statistics Canada
For sources and notes see page 129.
Upstream energy investment in Alberta consists of mining, quarrying, conventional oil and gas investment, oil sands investment, as well as support activities. Alberta has to compete for investment with other oil and gas producing jurisdictions to ensure continuous development of its energy industry. This has been more of a challenge following the significant decline in oil prices that took place in late 2014, and investment in the sector has remained below 2014 levels in the years since.
| | |
| 122 | | Government of Alberta | Annual Report 2019 – 2020 |
MEASURING UP
Although the investment in the mining, quarrying, and oil and gas extraction industry in Alberta was down substantially from the 2014 high, Alberta still attracted more investment in this industry than all of the rest of Canada combined. In 2019, Alberta’s investment in the upstream energy industry was estimated to account for 54 per cent of the total Canadian investment in this industry.
Actions
| • | | Establish the Canadian Energy Centre to respond in real-time to misinformation about Alberta’s energy industry through paid, earned and social media |
Results:
The Government of Alberta established the Canadian Energy Centre (CEC) in October 2019 as an independent provincial corporation under the Financial Administration Act.
Its mandate is to promote Canada as the supplier of choice for the world’s growing demand for responsibly produced energy, elevate the general understanding of Canada’s energy sector, and respond to misinformation about Canadian oil and gas. It also centralizes and analyses data that targets investors, researchers and policy makers. The CEC incorporates this research into media campaigns and articles that deliver on this mandate through paid, earned and social media.
The CEC was established at a time when Alberta’s energy sector was under increased public scrutiny from both the investment community as well as a number of well-funded and well-organized anti-fossil fuel groups. To date, these groups have dominated the public discourse in this space; in response, the CEC raises awareness and understanding of Canada’s long-term position as a safe, clean, and responsible energy supplier.
| • | | Create a litigation fund to support pro-development First Nations in defending their right to be consulted on major energy projects |
Results:
In August 2019, the Government of Alberta created Alberta’s Indigenous Litigation Fund as a one-time commitment of $10 million to be distributed over two fiscal years (2019-20 and 2020-21). The Litigation Fund was created to provide financial support for Indigenous voices in legal actions that affect responsible resource development that balances economic and environmental priorities in Alberta and increased market access. The first Litigation Fund grant was awarded on February 26, 2020 to the Woodland Cree First Nation for $187,688. The grant supports the Woodland Cree First Nation’s intervention in the court challenge to the Impact Assessment Act (Bill C-69), which is a key part of the “Stand Up for Alberta” strategy.
The fund was created to address the unique needs of Indigenous communities in Alberta who might not have the financial means to litigate for responsible resource development. For these communities and the organizations that support them, responsible resource development provides benefits in various ways but especially in its ability to increase Indigenous participation in the economy.
| • | | Launch a public inquiry into the foreign sources of funds responsible for the campaign to land lock Alberta’s energy |
Results:
The Government of Alberta is concerned that foreign individuals or organizations have provided financial resources to Canadian organizations which have participated in an anti-Alberta energy campaign. It
| | |
| Government of Alberta | Annual Report 2019 – 2020 | | 123 |
MEASURING UP
appears this well-funded campaign has defamed Alberta’s energy industry and sought to land-lock its oil, resulting in reputational harm to the province’s energy sector, limited provincial and industry revenue – and cost thousands of jobs.
To address these allegations, in July 2019 the Government of Alberta announced an independent public inquiry, under the Public Inquiries Act, to inquire about these misinformation campaigns that have been allowed to defame Alberta’s energy sector for far too long. This inquiry will examine if, how and why foreign funding has contributed to land locking Alberta’s energy sector.
Phase One of the independent inquiry included information gathering through paper review, interviews and completing additional research. In September 2019, the inquiry also launched a public inquiry website, AlbertaInquiry.ca, to allow individuals and organizations to respond to the inquiry. An interim report was prepared and delivered by the commissioner on January 31, 2020. Phase Two of the inquiry will be based on the information gathered during Phase One.
Objective 3 | A fair deal for Alberta and a balanced budget Actions
| • | | Ensure taxpayers dollars are used responsibly and wisely |
Results:
Budget 2019 and Budget 2020 maintained strong funding support to priorities while moving closer to a level of per capita support that is more in line with other provinces, and with Alberta’s fiscal situation.
Due to a significant drop in non-renewable resource revenue in 2016-17, Alberta qualified under the Fiscal Stabilization Program for a one-time payment of $251.4 million, which was received during the 2019- 20 fiscal year. This payment amount was constrained by the program’s payment cap of $60 per provincial resident; without the cap, Alberta would have qualified for a Fiscal Stabilization payment of $1.16 billion.
Budget 2020 included a discussion about federal-provincial fiscal arrangements, A Fair Deal for Alberta. It outlined Alberta’s significant fiscal contribution to the Canadian federation as well as Alberta’s proposals for reforming the four major federal fiscal transfers: the Canada Health Transfer, Canada School Transfer, the Fiscal Stabilization Program and Equalization. Alberta’s proposals include removing the $60 per resident cap on Fiscal Stabilization payments (with a retroactive effect to 2015-16), and adjusting the Equalization Program to limit its growth, make it more reflective of changes to inter-provincial fiscal disparities (compensation for which is the intent of the program), and limit the extent to which the program discourages resource development.
| • | | Pursue federal and provincial agreements on resource corridors |
Results:
At the likeminded premiers’ meeting in Calgary in July 2019, premiers built on the conversations from the Western Premier’s Conference in June 2019, leading to shared support for economic corridors to facilitate oil and gas pipelines and to improve interprovincial trade.
At the July COF meeting, premiers met agreed to explore further work on economic corridors. In December 2019, the premier led a delegation of eight ministers on a mission to Ottawa to press for a fair deal for Alberta. The mission focused on a wide range of issues, including corridors, methane equivalency, pipelines, oil and gas well reclamation, and the Oil Tanker Moratorium Act.
| | |
| 124 | | Government of Alberta | Annual Report 2019 – 2020 |
MEASURING UP
| • | | Bring per capita expense in line with the average of comparator provinces |
According to the MacKinnon Report on Alberta’s Finances, Alberta’s expense per capita is the highest, compared to three comparable provinces – British Columbia (BC), Ontario (ON) and Quebec (QC). While the population in Alberta grew at around one per cent each year from 2015 to 2018, average government expense, excluding debt servicing costs, surpassed the population growth at a rate of five per cent every year.
Since 2019, the Government of Alberta has been working to reduce per capita spending while maintaining or improving outcomes. Several cost-saving measures were introduced in 2019-20, including:
| | - | Dissolving a number of dedicated funds saving debt servicing costs, and eliminated tax credits reducing costs to government; |
| | - | Pausing indexation of various programs such as Assured Income for the Severely Handicapped (AISH) and the Alberta Seniors Benefit, to remove automatic annual increases to payments, slowing the growth in program costs. These benefit levels of these and other programs, such as Income Support and Special Needs Assistance, were maintained and not rolled back or cut in 2019-20. Some of the benefit levels are highest among provinces, such as AISH for which recipients received $430 more than the next highest province per month; and |
| | - | Reducing duplication and non-essential spending by dissolving inactive and redundant agencies, boards and commissions. |
| | - | Reducing institutional reliance on government grants which moves spending per student closer to comparator averages. |
These measures all help to increase government revenue and reduce costs.
Performance Indicator: Government Program Spending
Per capita program spending in dollars
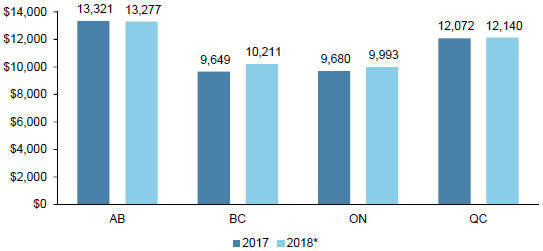
Source: Statistics Canada
| * | The 2018 data is preliminary |
For sources and notes see page 129.
Compared with three comparable provinces – British Columbia, Ontario and Quebec – Alberta had the highest government program spending per capita. Alberta will reduce cost per capita spending to be in line with other provinces over time while maintaining or improving outcomes for Alberta.
| | |
| Government of Alberta | Annual Report 2019 – 2020 | | 125 |
MEASURING UP
| • | | Enhance government’s fiscal planning, transparency and accountability |
Results:
In 2019-20, as a result of a decision made in 2018-19, to make ministry annual reports more understandable and accessible to all readers, the Government of Alberta replaced the financial statements in ministry annual reports with a financial information section which provides readers with improved discussion and analysis of the information contained in the financial statements. The Government of Alberta continues to prepare financial statements for ministries which, while not published, become part of the Consolidated Statements of the Government of Alberta which are reviewed by the Office of the Auditor General of Alberta (OAG).
The Government of Alberta was also reviewed in 2019-20 by the OAG on the quality of non-financial results analysis in ministry annual reports. This was a follow up audit on a 2014 OAG recommendation that the Government of Alberta should improve results analysis in ministry annual reports. The audit found that while the recommendation was mostly implemented, additional effort needed to further address training and compliance with the Government of Alberta’s Annual Report Standards. An implementation plan has been developed to complete this in 2020-21.
| | |
| 126 | | Government of Alberta | Annual Report 2019 – 2020 |
MEASURING UP
Performance Indicators – Sources and Notes
Priority One: Getting Alberta back to work
Corporate Tax Rate
Source:
Ministry of Treasury Board and Finance
Note(s):
The result was achieved by the implementation of the Job Creation Tax Cut (Alberta Corporate Tax Amendment) Act.
Unemployment Rate
Source:
Statistics Canada
Note(s):
Statistics Canada’s Labour Force Survey is the primary source of statistics on employment and unemployment in Canada and the provinces. The Labour Force Survey is conducted by Statistics Canada across the country. The survey sample size for Canada for the reporting period was 55,989. Alberta’s sample size corresponds to its share of the national population. An average of 5,690 Alberta households were surveyed each month. The coefficient of variation (the standard error as a percentage of the reported result) for the estimated 2,494,800 Albertans in the labour force is 1.0 per cent.
Private Investment
Source:
Statistics Canada
Note(s): The Annual Capital Expenditures Survey collects data on capital and repair expenditures in Canada. The information is used by federal and provincial government departments and agencies, trade associations, universities and international organizations for policy development and as a measure of regional economic activity.
Priority Two: Making life better for Albertans
Hospital Readmissions
Source:
Alberta Health
| | |
| Government of Alberta | Annual Report 2019 – 2020 | | 127 |
MEASURING UP
Note(s):
The indicator is similar to that of the Canadian Institute for Health Information (CIHI) which introduced it in 2010-11. Alberta slightly modifies the Canadian methodology to allow for timelier reporting; the national data report has an 18 month delay. The information is collected in the Morbidity and Ambulatory Care Abstract Reporting System. Processed data records are submitted to both Alberta Health’s Discharge Abstract Database and the national CIHI system. The discharge Alberta Abstract Database is updated monthly.
Student Achievement
Source:
Ministry of Education
Note(s):
Alberta students in grade six and nine write provincial achievement tests annually in Language Arts, Mathematics as well as in Science and Social Studies. Achievement tests are developed and administered by teachers and educators and are based on the provincial curriculum. Results are calculated and presented on the basis of the total number of students in each grade who demonstrated the acceptable standard and the standard of excellence. Results for Mathematics, Science and Social Studies include student results from both English and French versions of the tests.
Overall results in Language Arts (Literacy) are calculated as an average of the proportion of students achieving the acceptable standard in seven subjects [English Language Arts 6, French Language Arts 6, Français 6, English Language Arts 9, French Language Arts 9, Français 9, and English Language Arts 9 KAE (Knowledge and Employability)] weighted by the number of students that were enrolled.
Overall results in Mathematics (Numeracy) are calculated as an average of the proportion of students
achieving the acceptable standard in three subjects [Mathematics 6, Mathematics 9 and Mathematics 9 KAE (Knowledge and Employability)] weighted by the number of students that were enrolled.
Crime Severity Index
Source:
Uniform Crime Reporting Survey, Canadian Centre for Justice and Community Safety Statistics (CCJCSS).
Note(s):
The Crime Severity Index (CSI) measures both the volume and severity of crime, and includes all Criminal Code and other federal statute violations. Violent crime includes all police-report violent violations, which deal with the application or threat of force to a person. Non-violent crime involves all police reported property violations, other Criminal Code violations, Criminal Code traffic violations, and other federal statute violations. To determine the severity of a crime, all crimes are assigned a weight based on actual sentences handed down by the courts in all provinces and territories. More serious crimes are assigned higher weights, while less serious crimes are assigned lower weights. As a result, more serious offences have a greater impact on changes in the index.
| | |
| 128 | | Government of Alberta | Annual Report 2019 – 2020 |
MEASURING UP
Priority Three: Standing up for Alberta
Oil Market
Source:
Alberta Energy Regulator, International Energy Agency Oil Market Report
Note(s):
This measure is calculated as the annual ratio of the total number of barrels of Alberta oil sands production over the total number of barrels of world oil consumption. The total for annual barrels of Alberta oil sands production is the sum of total mined and in-situ bitumen production in any given calendar year. Bitumen production data is calculated from Alberta Energy Regulator’s reports. Global oil consumption data is based on the Oil Market Report, published by the International Energy Agency.
Upstream Investment in the Alberta Oil and Gas Sector
Source:
Statistics Canada
Note(s):
This indicator reports upstream investment in Alberta’s Mining, Quarrying, and Oil and Gas Extraction sector. It also puts Alberta in the national context, by reporting Alberta’s mining, quarrying, and oil and gas investment as a percentage of total Canadian investment in the sector. The data for the Indicator is taken from Statistics Canada. Data is reported on a calendar year basis. In addition to actual results, the present indicator also reports the most current preliminary actual result, to enhance the timeliness of data presentation. The preliminary results will be revised once the actual results become available.
Government Program Spending
Source:
Statistics Canada
Note(s):
Figures are based on Statistics Canada’s data table 10-10-0017-01 Canadian Government Finance Statistics for the Provincial and Territorial Governments and table 17-10-0009-01 Population Estimates. The per capita spending is calculated by dividing government program spending, excluding interest expenses, by the estimated population.
| | |
| Government of Alberta | Annual Report 2019 – 2020 | | 129 |