Exhibit 99.2
GOVERNMENT OF ALBERTA
2019-20 Final Results
Year-End Report
| | |
| August 2020 | |  |
Table of Contents
Note: Amounts presented in tables may not add to totals due to rounding.
Note on accounting policy restatements / presentation changes (no change to deficit or borrowing amounts):
| | ● | | 2018-19 Actual and 2019-20 Budget revenue and expense numbers for Treasury Board and Finance have been restated, decreasing by $52 million and $46 million each, respectively. Instead of reporting third party investment management administrative costs in government revenue and an equivalent amount in expense, revenue will be reported net of these third party adminstrative costs and the costs will no longer be reported in government expense. |
Treasury Board and Finance, Government of Alberta
2019–20 Final Results Year-End Report, August 2020
Additional copies of this report may be obtained by visiting our website at: www.alberta.ca/budget-documents.aspx
| | |
| |
| 2 | | 2019–20 Final Results | Year-End Report |
2019–20 Final Results
Fiscal Plan Highlights
The deficit in 2019-20 was $12.2 billion, an increase of $3.4 billion from budget and $5.4 billion more than the 2018-19 deficit. A global pandemic was declared by the World Health Organization on March 11, 2020, effectively closing economies, restricting travel and impacting financial markets and oil prices. COVID-19 has impacted the 2019-20 Alberta government fiscal position, particularly revenue, even though it occurred late in the fiscal year.
Total Revenue was $46.2 billion, $3.7 billion lower than the Budget 2019 estimate, and a decrease of $3.3 billion from 2018-19.
| ● | | Change from 2018-19. Decreases of $0.6 billion in personal income tax (PIT), $0.8 billion in corporate income tax (CIT), $1.1 billion in other taxes, $2.8 billion in net income of government business enterprises (GBE) and $0.1 billion |
in other revenue, were partly offset by increases of $0.5 billion in non-renewable resource revenue (NRR), $1.1 billion in federal transfers and $0.5 billion in investment income.
| ● | | Change from Budget. Decreases of $0.7 billion in PIT, $0.6 billion in NRR, $2.6 billion in GBE net income and $0.2 billion in other tax and federal transfer revenue, were partially offset by increases of $0.2 billion in investment income and $0.2 billion in premiums, fees and licences and other revenue. |
Total Expense was $58.4 billion, a $2.1 billion increase from 2018-19, but $0.3 billion lower than budget.
| ● | | Change from 2018-19. Comprises increases of $1.3 billion in operating expense, including $0.2 billion for COVID-19 initiatives, $0.8 billion in disaster assistance and $0.3 billion |
| | in higher debt servicing costs and other expense (mainly amortization), less a $0.3 billion decrease in capital grants and $0.1 billion related to the change in unfunded pension obligations. |
| ● | | Change from Budget. Increases of a net $0.3 billion for COVID-19 operating expense initiatives, disaster and other expense, are more than offset by decreases of $0.2 billion in other operating and $0.4 billion in capital grants expense. |
Capital Plan. Support for infrastructure in 2019-20 was $5.6 billion, $0.5 billion lower than in 2018-19 and $0.6 billion lower than estimated in Budget 2019.
Net Assets. At March 31, 2020, net assets were $11.4 billion, including net capital / non-financial assets of $51.6 billion. More details on assets and liabilities are provided on pages 10–11.
Fiscal Plan Summary
(millions of dollars)
| | | | | | | | | | | | | | | | | | | | | | | | |
| | | | | | | | | | Change from | |
| | | | | | | | | | | | | | | | | | | | |
| | | | | | 2019-20 | | | 2018-19 | | | | | | 2018-19 | |
| | | | | | | | | | | | | | | | |
| INCOME STATEMENT | | Budget | | | Actual | | | Actual | | | Budget | | | Actual | |
| | |
| | Revenue | | | | | | | | | | | | | | | | | | | | |
| | 1 | | | Personal income tax | | | 11,990 | | | | 11,244 | | | | 11,874 | | | | (746 | ) | | | (630) | |
| | 2 | | | Corporate income tax | | | 4,177 | | | | 4,107 | | | | 4,871 | | | | (70 | ) | | | (764) | |
| | 3 | | | Other taxes | | | 5,766 | | | | 5,747 | | | | 6,833 | | | | (19 | ) | | | (1,086) | |
| | 4 | | | Non-renewable resource revenue | | | 6,527 | | | | 5,937 | | | | 5,429 | | | | (590 | ) | | | 508 | |
| | 5 | | | Transfers from Government of Canada | | | 9,200 | | | | 9,072 | | | | 8,013 | | | | (128 | ) | | | 1,059 | |
| | 6 | | | Investment income | | | 2,585 | | | | 2,828 | | | | 2,349 | | | | 243 | | | | 479 | |
| | 7 | | | Net income from government business enterprises | | | 2,417 | | | | (225 | ) | | | 2,585 | | | | (2,642 | ) | | | (2,810) | |
| | 8 | | | Premiums, fees and licences | | | 3,872 | | | | 3,929 | | | | 3,911 | | | | 57 | | | | 18 | |
| | 9 | | | Other revenue | | | 3,436 | | | | 3,585 | | | | 3,707 | | | | 149 | | | | (122) | |
| | | | | | | | |
| | 10 | | | Total Revenue | | | 49,970 | | | | 46,224 | | | | 49,572 | | | | (3,746 | ) | | | (3,348) | |
| | | | | | | | |
| | Expense | | | | | | | | | | | | | | | | | | | | |
| | 11 | | | Operating expense | | | 49,653 | | | | 49,482 | | | | 48,388 | | | | (171 | ) | | | 1,094 | |
| | 12 | | | COVID-19 operating expense | | | - | | | | 218 | | | | - | | | | 218 | | | | 218 | |
| | 13 | | | Capital grants | | | 2,086 | | | | 1,696 | | | | 1,952 | | | | (390 | ) | | | (256) | |
| | 14 | | | Disaster assistance | | | 1,316 | | | | 1,356 | | | | 507 | | | | 40 | | | | 849 | |
| | 15 | | | Capital amortization / inventory consumption / asset disposal losses | | | 3,691 | | | | 3,720 | | | | 3,651 | | | | 29 | | | | 69 | |
| | 16 | | | Debt servicing costs - general | | | 1,246 | | | | 1,224 | | | | 1,074 | | | | (22 | ) | | | 150 | |
| | 17 | | | Debt servicing costs - Capital Plan | | | 1,019 | | | | 1,011 | | | | 897 | | | | (8 | ) | | | 114 | |
| | 18 | | | Pension provisions / (recovery) | | | (337 | ) | | | (334 | ) | | | (190 | ) | | | 3 | | | | (144) | |
| | | | | | | | |
| | 19 | | | Total Expense | | | 58,674 | | | | 58,376 | | | | 56,283 | | | | (298 | ) | | | 2,093 | |
| | | | | |
| | 20 | | | Surplus / (Deficit) | | | (8,704 | ) | | | (12,152 | ) | | | (6,711 | ) | | | (3,448 | ) | | | (5,441) | |
| | |
| | | | | |
| | CAPITAL PLAN | | | | | | | | | | | | | | | | | | | | |
| | |
| | 21 | | | Capital grants | | | 2,086 | | | | 1,696 | | | | 1,952 | | | | (390 | ) | | | (256) | |
| | 22 | | | Capital investment | | | 4,119 | | | | 3,868 | | | | 4,105 | | | | (251 | ) | | | (237) | |
| | | | | | | | |
| | 23 | | | Total Capital Plan | | | 6,206 | | | | 5,564 | | | | 6,057 | | | | (642 | ) | | | (493) | |
| | |
| | |
| |
| 2019–20 Final Results | Year-End Report | | 3 |
Revenue Highlights
Total Revenue
| ● | | Total revenue was $46.2 billion in 2019-20. This was a decrease of $3.3 billion from 2018-19, $3.7 billion from the Budget 2019 estimate, and $4.7 billion from the third quarter forecast in Budget 2020. Main variances include: |
| | - | In all three cases, personal income tax was $0.6 - $0.7 billion lower, primarily due to the impacts of the pandemic. Similarly, in all three cases net income from government business enterprises decreased $2.5 - $2.8 billion, primarily due to reporting a provision for an onerous contract in Alberta Petroleum Marketing Commission net income, related to the Sturgeon Refinery. |
| | - | Relative to 2018-19, corporate income tax decreased $0.8 billion mainly as 2018-19 revenue included adding $0.6 billion in year-end accounting adjustments (e.g. changes to refund liabilities or accounts receivable), while other tax revenue decreased by $1.1 billion as the carbon tax was eliminated in May 2019. There were minor variations in this revenue relative to budget and third quarter forecasts. |
| | - | Resource revenue was $0.5 billion higher than 2018-19, but declined $0.6 billion from budget and $0.7 billion from third quarter. |
| | - | Federal transfers were $1.1 billion more than in 2018-19, primarily due to a one-time bump to the gas tax fund, a fiscal stabilization payment and some late-year funding for COVID-19. Relative to budget, federal transfers were down $0.1 billion mainly from re-profiling municipal infrastructure support to future years. |
| | - | Investment income was $0.5 billion higher than in 2018-19 and was $0.2 billion more than budget, but declined $0.7 billion relative to third quarter as the pandemic’s impact on financial markets began. |
Non-Renewable Resource Revenue
| ● | | Non-renewable resource revenue was $5,937 million, an increase of $508 million from 2018-19, but $590 million lower than Budget 2019 and $734 million lower than the third quarter forecast. |
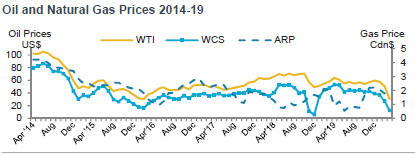
| ● | | The increase from 2018-19 was mainly due to a narrower average light-heavy oil price differential in 2019-20, and recovering production, partly offset by lower land lease sales and natural gas and by-products royalties. The West Texas Intermediate (WTI) price averaged US$54.85 per barrel (/bbl) in 2019-20, US$7.92 lower than it was in 2018-19, while the differential |
| | | averaged US$14.82/bbl, $8.49 narrower. The US-Canadian dollar exchange rate in 2019-20 averaged US¢75.2/Cdn$, 1.1 cents weaker than in 2018-19 (a weaker dollar increases royalty revenue). However, oil prices averaged almost US$3 higher for the first ten months of the fiscal year (April 2019 to January 2020) and the differential was about US$1 narrower over the same period, boosting royalties relative to 2018-19 and encouraging activity and easing of production curtailment. |
| ● | | The decrease from budget and third quarter were mainly due to the collapse in oil prices in February and March 2020, primarily from the COVID-19-caused global economic shock, but also from a temporary spat on oil supply management between Saudi Arabia and Russia. This led to significant production adjustments, reversing positive gains made earlier in the year. The exchange rate weakened in early 2020, which provided some offset. |
| ● | | Bitumen royalties were $875 million higher than they were in 2018-19, but were $593 million lower than budget and $618 million lower than the third quarter forecast. |
| ● | | Natural gas and by-product royalties were $165 million lower than in 2018-19, and $67 million lower than the third quarter forecast, mainly as by-product prices and royalties |
| | | | | | | | | | | | | | | | | | | | | | | | |
| Revenue | | | | | | | | | Change from | |
| | | | | | | | | | | | | | | | | | | | |
| (millions of dollars) | | 2019-20 | | | 2018-19 | | | | | | 2018-19 | |
| | | | | | | | | | | | | | | | |
| | | Budget | | | Actual | | | Actual | | | Budget | | | Actual | |
| | |
| | 1 | | | Personal income tax | | | 11,990 | | | | 11,244 | | | | 11,874 | | | | (746 | ) | | | (630) | |
| | 2 | | | Corporate income tax | | | 4,177 | | | | 4,107 | | | | 4,871 | | | | (70 | ) | | | (764) | |
| | 3 | | | Education property tax | | | 2,455 | | | | 2,475 | | | | 2,441 | | | | 20 | | | | 34 | |
| | 4 | | | Other taxes | | | 3,311 | | | | 3,272 | | | | 4,392 | | | | (39 | ) | | | (1,120) | |
| | 5 | | | Bitumen royalties | | | 4,682 | | | | 4,089 | | | | 3,214 | | | | (593 | ) | | | 875 | |
| | 6 | | | Other non-renewable resource revenue | | | 1,845 | | | | 1,848 | | | | 2,215 | | | | 3 | | | | (367) | |
| | 7 | | | Canada Social Transfer / Canada Health Transfer | | | 6,402 | | | | 6,372 | | | | 6,098 | | | | (30 | ) | | | 274 | |
| | 8 | | | Other transfers from Government of Canada | | | 2,798 | | | | 2,700 | | | | 1,915 | | | | (98 | ) | | | 785 | |
| | 9 | | | Heritage / endowment fund investment income | | | 1,555 | | | | 1,779 | | | | 1,305 | | | | 224 | | | | 474 | |
| | 10 | | | Other investment income | | | 1,030 | | | | 1,050 | | | | 1,044 | | | | 20 | | | | 6 | |
| | 11 | | | Net income from government business enterprises | | | 2,417 | | | | (225 | ) | | | 2,585 | | | | (2,642 | ) | | | (2,810) | |
| | 12 | | | Post-secondary institution tuition fees | | | 1,309 | | | | 1,311 | | | | 1,256 | | | | 2 | | | | 55 | |
| | 13 | | | Other premiums, fees and licences | | | 2,563 | | | | 2,618 | | | | 2,655 | | | | 55 | | | | (37) | |
| | 14 | | | SUCH sector sales, rentals / fundraising, donations | | | 1,739 | | | | 1,760 | | | | 1,777 | | | | 21 | | | | (17) | |
| | 15 | | | Other revenue | | | 1,697 | | | | 1,824 | | | | 1,930 | | | | 127 | | | | (106) | |
| | | | | | | | |
| | 16 | | | Total Revenue | | | 49,970 | | | | 46,224 | | | | 49,572 | | | | (3,746 | ) | | | (3,348) | |
| | |
| | |
| |
| 4 | | 2019–20 Final Results | Year-End Report |
| | |
 | | share of total Canadian population. The change from budget was from re-profiling $233 million in infrastructure funds, due mainly to slower municipal project progress, partly offset by the agriculture, disaster and COVID-19 bumps. Most of the infrastructure re-profiling was reported at third quarter, resulting in higher final revenue. |
| • | | The Alberta Reference Price (ARP) averaged Cdn$1.39 per gigajoule, 5 cents above 2018-19 and 9 cents above budget. |
| • | | Crown land lease sales revenue was $120 million, $240 million lower than 2018-19 and down $44 million from budget, primarily reflecting uncertainty about market access. |
Tax Revenue
| • | | Total tax revenue was $21.1 billion, $2,480 million lower than 2018-19, $835 million lower than Budget 2019 estimate, and $728 million lower than the third quarter forecast. |
| • | | Personal income tax (PIT) revenue was $11.2 billion, $630 million lower than 2018-19, and down $746 million from budget and $575 million from third quarter. The changes from budget and third quarter mainly reflect the severe impact on 2020 employment and household income from the pandemic, since 2019-20 PIT includes one quarter of estimated 2020 revenue. The change from 2018-19 included a $175 million reduction from the COVID impact, and a $455 million difference in prior-years’ adjustments (PYA). PIT in 2018-19 included a $432 million positive PYA (2017 PIT was higher, so revenue reported for 2016-17 and 2017-18 was too low). 2019-20 PIT includes a negative $23 million PYA from overestimated 2018-19 revenue. |
| • | | Corporate income tax revenue was $4.1 billion, $764 million less than 2018-19, $70 million less than budget, and down $138 million from third quarter. The changes from budget and third quarter primarily reflect the impact of lower corporate cash receipts due to the pandemic and oil price deterioration. The variance from 2018-19 includes these factors, and that 2018-19 revenue was elevated by $633 million due to year-end accounting adjustments. |
| • | | Other tax revenue was $5.7 billion, $1.1 billion lower than in 2018-19, and down $19 million from budget and $15 million from third quarter. The decrease from 2018-19 was mainly due to the elimination of the carbon tax on May 30, 2019. The changes from budget and third quarter mainly resulted from lower tobacco and fuel consumption. |
Transfers from Government of Canada
| • | | Total of $9.1 billion, $1.1 billion higher than 2018-19, $128 million lower than budget but $18 million higher than third quarter. |
| • | | The increase from 2018-19 was mainly due to $230 million top-up to the Gas Tax Fund, $251 million fiscal stabilization payment, support for agriculture, floods, wildfires and COVID-19, and $274 million in Canada health and social transfers due to growth in the national entitlement and Alberta’s higher |
Investment Income
| • | | Investment income was $2.8 billion, an increase of $479 million from 2018-19 and of $243 million from budget, but $697 million less than forecast at third quarter. The increases are primarily due to strong financial markets returns for the first three quarters of the fiscal year, while the third quarter demise was from drastic drops in asset valuations after COVID-19 caused market panic. |
Other Revenue
Other revenue was $7.3 billion, down $2.9 billion from 2018-19, $2.4 billion from budget, and $2.6 billion from third quarter.
| • | | Most of the decrease was from the Alberta Petroleum Marketing Commission net income of negative $2.7 billion, comprising a $2.5 billion provision for an onerous contract related to the Sturgeon Refinery and $156 million operating loss. Other reductions include gaming revenue, due mainly to temporary casino closures, ATB Financial net income, from higher credit losses, lower TIER Fund compliance payments and lower post-secondary institution revenue. |
| • | | These are partly offset by higher revenue from AIMCo investment management charges to external clients and reversals of prior-year reported expense accruals, particularly with respect to estimates for disaster assistance programs. |
Energy Prices and Exchange Rates
Fiscal year averages, 2005-06 to 2019-20
| | | | | | | | | | | | | | | | | | | | | | | | | | | | | | | | | | | | | | | | | | | | | | | | | | | | | | | | | | | | |
| | | 05-06 | | | | 06-07 | | | | 07-08 | | | | 08-09 | | | | 09-10 | | | | 10-11 | | | | 11-12 | | | | 12-13 | | | | 13-14 | | | | 14-15 | | | | 15-16 | | | | 16-17 | | | | 17-18 | | | | 18-19 | | | | 19-20 | |
Oil Price (WTI US$/bbl) | | | 59.94 | | | | 64.89 | | | | 82.25 | | | | 85.94 | | | | 70.71 | | | | 83.38 | | | | 97.33 | | | | 92.07 | | | | 99.05 | | | | 80.48 | | | | 45.00 | | | | 47.93 | | | | 53.69 | | | | 62.77 | | | | 54.85 | |
WCS @ Hardisty (Cdn$/bbl) | | | 44.35 | | | | 52.84 | | | | 59.30 | | | | 74.36 | | | | 66.08 | | | | 66.70 | | | | 80.72 | | | | 68.48 | | | | 80.11 | | | | 70.78 | | | | 40.86 | | | | 44.67 | | | | 50.38 | | | | 51.65 | | | | 53.14 | |
Natural Gas Price (Cdn$/GJ) | | | 8.29 | | | | 5.94 | | | | 5.92 | | | | 6.97 | | | | 3.58 | | | | 3.28 | | | | 2.98 | | | | 2.28 | | | | 3.28 | | | | 3.51 | | | | 2.21 | | | | 2.01 | | | | 1.82 | | | | 1.34 | | | | 1.39 | |
Exchange rate (US¢/Cdn$) | | | 83.9 | | | | 87.9 | | | | 97.1 | | | | 89.6 | | | | 91.9 | | | | 98.4 | | | | 100.7 | | | | 99.9 | | | | 95.0 | | | | 88.0 | | | | 76.5 | | | | 76.2 | | | | 78.0 | | | | 76.3 | | | | 75.2 | |
| | |
| |
| 2019-20 Final Results | Year-End Report | | 5 |
Expense Highlights
Total expense in 2019-20 was $58.4 billion. This comprised $49.7 billion in operating expense, including $218 million for COVID-19, $1.7 billion in capital grants, $1.4 billion in disaster assistance, $3.7 billion in amortization, inventory consumption and asset disposal losses, $2.2 billion in debt servicing costs, less $0.3 billion in reductions to pension liabilities.
Year-over-year comparison. 2019-20 expense was $2.1 billion higher than it was in 2018-19:
| • | | Operating expense. $1.1 billion increase (excluding COVID-19 initiatives) mainly for physician compensation, cancer drug use and continuing and home care services, post-secondary institution research and severance costs, caseloads and costs in income support, AISH, PDD, seniors’ and children’s programs, Alberta Energy Regulator restructuring, and crude-by-rail divestment costs, offset by a variety of savings initiatives, lower consumer rebates from carbon tax elimination, and reductions related to COVID-19, such as casino closures. |
| • | | COVID-19 operating expense. Addition of $218 million, including $60 million for homeless, women’s shelters and community-based organisations, $70 million for waiver of WCB premiums, $44 million for emergency isolation, $16 million for waiver of student loan interest, and $28 million for physician compensation and other expense. |
| • | | Capital grants. $256 million decrease due primarily to delays in federally-funded municipal projects and carbon capture and storage projects, reduced climate-related grants, partially offset by the one-time top-up to the Gas Tax Fund. |
| • | | Disaster assistance. $849 million increase due primarily to agriculture support and wildfire fighting costs. |
| • | | Other expense. $189 million increase, comprising increases of $264 million in debt servicing costs, $106 million in amortization and |
| | | $48 million in disposal losses, partly offset by reductions of $85 million in inventory consumption and $144 million in pension liabilities. |
Budget-to-actual changes. Total expense was $298 million lower than estimated in Budget 2019:
| • | | Operating expense. $47 million net increase, with the $218 million in COVID-19 support partly offset by $171 million in other net decreases. This consists of: increases for post-secondary institution research and severance costs, social program caseload and cost growth, cancer drug and acute care costs, and external investment management fees, more than offset by decreases of $634 million for crude-by-rail divestment costs, a variety of savings initiatives, and reductions related to COVID-19, such as child care subsidies and casino closures. |
| • | | Capital grants. $390 million decrease due mainly to re-profiled federal infrastructure program and carbon capture and storage grants. |
| • | | Disaster assistance. $40 million increase due to $748 million in agriculture support, a $28 million reduction in forecast wildfire-fighting and flood assistance costs, less the budgeted $680 million contingency. |
| • | | Other expense. $3 million increase, comprising increases of $22 million in amortization, $63 million in disposal losses and a $3 million smaller decline in pension liabilities, offset by decreases of $55 million in inventory consumption and $30 million in debt servicing costs. |
Health
Total expense was $22.3 billion, including $20.9 billion in operating expense and $1.4 billion in amortization and inventory consumption. This was $424 million or 1.9 per cent higher than 2018-19, and $239 million above budget.
| • | | Increases from 2018-19 include: $134 million for Drugs and Supplemental Health Benefits, primarily for high-cost cancer drugs; |
| | | $123 million for continuing, home and community care programs; $81 million for physician services, reflecting service demand; and a net $86 million in other programs. |
| • | | Increases from Budget 2019 include: $110 million for acute care from higher demand; $86 million for new cancer drugs and more seniors accessing benefits; $40 million for increased access to MRI and CT scans, and launching Connect Care; and $3 million in other programs. |
Education
Total expense was $8.5 billion, down $82 million from 2018-19 and a decrease of $23 million from budget.
| • | | The change from 2018-19 includes decreases of $87 million in operating expense, primarily from lower school board spending, and $15 million for a larger reduction in pension liabilities (reported as negative expense), partly offset by an increase of $21 million in amortization and debt servicing costs. |
| • | | The decrease from budget comprises $89 million lower operating expense, $12 million in a larger-than-expected decrease in pension liabilities, partly offset by increases of $79 million in amortization and debt servicing costs. |
Advanced Education
Total expense was $6.2 billion, an increase of $176 million from 2018-19 and $386 million higher than budget.
| • | | The increase from 2018-19 includes $134 million by post-secondary institutions (PSI), $6 million for student loan costs, $47 million lower decrease to pension liabilities, partly offset by a net $11 million in savings. |
| • | | The increase from budget primarily reflects $391 million in PSI own-source research and severance costs. |
Community and Social Services
Expense was $4.0 billion in 2019-20, $391 million or 10.7 per cent higher
| | |
| |
| 6 | | 2019-20 Final Results | Year-End Report |
Total Expense
| | | | | | | | | | | | | | | | | | | | |
| (millions of dollars) | | | | | | | | | | | Change from | |
| | | 2019-20 | | | 2018-19 | | | | | | 2018-19 | |
| Operating Expense by Ministry | | Budget | | | Actual | | | Actual | | | Budget | | | Actual | |
Advanced Education | | | 5,117 | | | | 5,477 | | | | 5,392 | | | | 360 | | | | 85 | |
Agriculture and Forestry | | | 879 | | | | 868 | | | | 967 | | | | (11 | ) | | | (99 | ) |
Children’s Services | | | 1,586 | | | | 1,548 | | | | 1,492 | | | | (38 | ) | | | 56 | |
Community and Social Services | | | 3,910 | | | | 3,965 | | | | 3,634 | | | | 55 | | | | 331 | |
Culture, Multiculturalism and Status of Women | | | 218 | | | | 205 | | | | 236 | | | | (13 | ) | | | (31 | ) |
Economic Development, Trade and Tourism | | | 286 | | | | 282 | | | | 349 | | | | (4 | ) | | | (67 | ) |
Education | | | 8,223 | | | | 8,134 | | | | 8,221 | | | | (89 | ) | | | (87 | ) |
Energy | | | 601 | | | | 600 | | | | 552 | | | | (1 | ) | | | 48 | |
Environment and Parks | | | 610 | | | | 558 | | | | 574 | | | | (52 | ) | | | (16 | ) |
Executive Council | | | 20 | | | | 18 | | | | 17 | | | | (2 | ) | | | 1 | |
Health | | | 20,610 | | | | 20,870 | | | | 20,409 | | | | 260 | | | | 461 | |
Indigenous Relations | | | 190 | | | | 162 | | | | 213 | | | | (28 | ) | | | (51 | ) |
Infrastructure | | | 460 | | | | 457 | | | | 488 | | | | (3 | ) | | | (31 | ) |
Justice and Solicitor General | | | 1,449 | | | | 1,442 | | | | 1,452 | | | | (7 | ) | | | (10 | ) |
Labour and Immigration | | | 219 | | | | 196 | | | | 208 | | | | (23 | ) | | | (12 | ) |
Municipal Affairs | | | 240 | | | | 244 | | | | 263 | | | | 4 | | | | (19 | ) |
Seniors and Housing | | | 638 | | | | 634 | | | | 630 | | | | (4 | ) | | | 4 | |
Service Alberta | | | 538 | | | | 494 | | | | 554 | | | | (44 | ) | | | (60 | ) |
Transportation | | | 411 | | | | 425 | | | | 443 | | | | 14 | | | | (18 | ) |
Treasury Board and Finance | | | 1,791 | | | | 1,900 | | | | 2,147 | | | | 109 | | | | (247 | ) |
Legislative Assembly | | | 157 | | | | 140 | | | | 136 | | | | (17 | ) | | | 4 | |
Crude-by-rail | | | 1,500 | | | | 866 | | | | 6 | | | | (634 | ) | | | 860 | |
Total Operating Expense | | | 49,653 | | | | 49,482 | | | | 48,388 | | | | (171 | ) | | | 1,094 | |
| | | | | |
COVID-19 Operating Expense | | | | | | | | | | | | | | | | | | | | |
Community and Social Services | | | - | | | | 60 | | | | - | | | | 60 | | | | 60 | |
Labour and Immigration | | | - | | | | 114 | | | | - | | | | 114 | | | | 114 | |
Other (Health / Adv. Ed. / Educ. / Treas. Bd and Fin.) | | | - | | | | 44 | | | | - | | | | 44 | | | | 44 | |
Total COVID-19 Operating Expense | | | - | | | | 218 | | | | - | | | | 218 | | | | 218 | |
| | | | | |
Capital Grants | | | | | | | | | | | | | | | | | | | | |
Energy | | | 136 | | | | 60 | | | | 165 | | | | (76 | ) | | | (105 | ) |
Environment and Parks | | | 38 | | | | 36 | | | | 114 | | | | (2 | ) | | | (78 | ) |
Municipal Affairs | | | 1,127 | | | | 1,124 | | | | 884 | | | | (3 | ) | | | 240 | |
Transportation | | | 627 | | | | 374 | | | | 510 | | | | (253 | ) | | | (136 | ) |
Other | | | 158 | | | | 102 | | | | 279 | | | | (56 | ) | | | (177 | ) |
Total Capital Grants | | | 2,086 | | | | 1,696 | | | | 1,952 | | | | (390 | ) | | | (256 | ) |
Disaster / Emergency Assistance | | | | | | | | | | | | | | | | | | | | |
Agriculture and Forestry (agriculture support / wildfire fighting) | | | 485 | | | | 1,209 | | | | 426 | | | | 724 | | | | 783 | |
Municipal Affairs (flood support) | | | 151 | | | | 147 | | | | 80 | | | | (4 | ) | | | 67 | |
Contingency | | | 680 | | | | - | | | | - | | | | (680 | ) | | | - | |
Total Disaster / Emergency Assistance | | | 1,316 | | | | 1,356 | | | | 507 | | | | 40 | | | | 849 | |
Amortization / Inventory Consumption / Loss on Asset Disposals | | | | | | | | | | | | | | | | | | | | |
Advanced Education amortization / inventory consumption | | | 725 | | | | 729 | | | | 702 | | | | 4 | | | | 27 | |
Education amortization | | | 356 | | | | 433 | | | | 413 | | | | 77 | | | | 20 | |
Health amortization / inventory consumption | | | 1,467 | | | | 1,443 | | | | 1,465 | | | | (24 | ) | | | (22 | ) |
Infrastructure amortization / inventory consumption | | | 130 | | | | 135 | | | | 122 | | | | 5 | | | | 13 | |
Transportation amortization / inventory consumption | | | 665 | | | | 665 | | | | 631 | | | | - | | | | 34 | |
Other amortization / inventory consumption / loss on disposals | | | 347 | | | | 315 | | | | 318 | | | | (32 | ) | | | (3 | ) |
Total Amortization / Invent. Consump. / Loss on Disposals | | | 3,690 | | | | 3,720 | | | | 3,651 | | | | 30 | | | | 69 | |
| | | | | |
Taxpayer-supported Debt Servicing Costs - General | | | | | | | | | | | | | | | | | | | | |
Education (Sch. Bds.) / Seniors and Housing (Ab. Soc. Hous. Corp.) | | | 14 | | | | 13 | | | | 15 | | | | (1 | ) | | | (2 | ) |
Treasury Board and Finance | | | 804 | | | | 759 | | | | 615 | | | | (45 | ) | | | 144 | |
Total Taxpayer-supported General Debt Servicing Costs | | | 818 | | | | 772 | | | | 630 | | | | (46 | ) | | | 142 | |
| | | | | |
Taxpayer-supported Debt Servicing Costs - Capital Plan | | | | | | | | | | | | | | | | | | | | |
Education (school P3s) / Transportation (ring road P3s) | | | 118 | | | | 118 | | | | 120 | | | | - | | | | (2 | ) |
Treasury Board and Finance – direct borrowing | | | 901 | | | | 893 | | | | 777 | | | | (8 | ) | | | 116 | |
Total Taxpayer-supported Capital Plan Debt Servicing Costs | | | 1,019 | | | | 1,011 | | | | 897 | | | | (8 | ) | | | 114 | |
Total Taxpayer-supported Debt Servicing Costs | | | 1,837 | | | | 1,783 | | | | 1,527 | | | | (54 | ) | | | 256 | |
Self-supported Debt Servicing Costs | | | | | | | | | | | | | | | | | | | | |
Treasury Board and Finance – Ab. Capital Financing Authority | | | 358 | | | | 384 | | | | 373 | | | | 26 | | | | 11 | |
Treasury Board and Finance – Ag Financial Services Corp | | | 70 | | | | 68 | | | | 71 | | | | (2 | ) | | | (3 | ) |
Total Self-supported Debt Servicing Costs | | | 428 | | | | 452 | | | | 444 | | | | 24 | | | | 8 | |
Total Debt Servicing Costs | | | 2,265 | | | | 2,235 | | | | 1,971 | | | | (30 | ) | | | 264 | |
Pension Provisions / (Recovery) | | | (337 | ) | | | (334 | ) | | | (190 | ) | | | 3 | | | | (144 | ) |
Total Expense | | | 58,674 | | | | 58,376 | | | | 56,283 | | | | (298 | ) | | | 2,093 | |
| | |
| |
| 2019-20 Final Results | Year-End Report | | 7 |
than in 2018-19, and $115 million above budget. The increase from 2018-19 was primarily due to higher caseloads and costs-per-case in programs for disabled and unemployed Albertans. The increase from budget was mainly from higher caseloads and $60 million for COVID-19 provided to homeless and women’s emergency shelters, and comunity-based organisations.
Children’s Services
Total expense was $1.5 billion, $56 million or 3.8 per cent higher than 2018-19, but $38 million lower than budget. The increase from 2018-19 was primarily for higher caseloads and complexities in Child Intervention, while the decrease from budget was mainly due to lower child care grants, Alberta Child Benefit demand, child intervention costs per case, and Early Intervention Services grants.
Justice and Solicitor General
Expense was $1.4 billion, $10 million decreases from 2018-19 and from budget. The decreases primarily reflect reduced grants to Legal Aid Alberta, offset by Alberta Law Foundation contributions, and to the Alberta Law Enforcement Response Teams, offset by the use of their accumulated surplus.
Municipal Affairs
Total expense was $1.5 billion, an increase from 2018-19 of $270 million, but $21 million less than budget. The increase from 2018-19 reflects higher municipal capital grants of $240 million (mainly the $230 million bump to the federal Gas Tax Fund) and $67 million in flood disaster support, partly offset by $36 million in lower operating expense. Decreases from budget include $13 million in operating expense, $4 million in disaster support and $4 million in capital grants and amortization.
Other Ministries
Total expense for other ministries was $12.8 billion in 2019-20, $858 million higher than 2018-19 but $948 million lower than estimated in Budget 2019.
Changes from 2018-19 include:
| | • | | Agriculture and Forestry expense was $682 million higher: $268 million in wildfire-fighting costs, $515 million in agriculture disaster support, less a $99 million decrease in operating due primarily to $35 million in savings and eliminating small brewers and liquor manufacturers subsidies and other programs. |
| | • | | Energy expense was $804 million more: $860 million for crude-by-rail divestment, $49 million mainly for higher doubtful account provisions and orphan well abandonment costs, less $105 million in carbon capture and storage capital grants. |
| | • | | Labour and Immigration increased $100 million: $70 million for waiver of WCB premiums for small and medium-sized business, $44 million for emergency isolation payments, partly offset by $12 million in operating expense savings. |
| | • | | Transportation expense decreased $122 million: increases in amortization and inventory consumption of $34 million were offset by reductions of $18 million in operating, $2 million in P3 debt servicing costs and $136 million in re-profiled capital grants. |
| | • | | Treasury Board and Finance down $153 million: operating expense was $247 million lower primarily from reduced household rebates due to carbon tax elimination, partly offset by higher investment management fees; pension liabilities decreased by $177 million more (reported as negative expense); these were partly offset by increases of $268 million in debt servicing costs and a net $3 million in other expense. |
| | • | | Expense in other ministries was a net $453 million lower mainly from savings, reductions in climate programs, one-time expense items in 2018-19, delays in establishing funds and entities and re-profiling of infrastructure projects. |
Changes from budget include:
| | • | | A decrease of $680 million from the budgeted disaster contingency. |
| | • | | Agriculture and Forestry expense was $711 million higher: disaster |
| | assistance was up $724 million, while other expense, primarily operating and amortization, was down a net $13 million. |
| | • | | Energy expense was $707 million lower: $634 million reduced crude-by-rail divestment and $76 million in carbon capture and storage grants. |
| | • | | Labour and Immigration increased $91 million: $114 million for waiver of WCB premiums and emergency isolation payments, less $23 million in operating expense savings. |
| | • | | Transportation expense was down $239 million mainly due to re-profiling municipal capital grants. |
| | • | | Treasury Board and Finance up $88 million: operating expense was $109 million higher, due mainly to external investment fees, the decrease in pension liabilities was $8 million lower, partly offset by $29 million lower debt servicing costs. |
| | • | | Expense in other ministries was a net $210 million lower than budget. |
Pension Provisions/Recovery
| | • | | Public sector pension plan liabilities decreased by $334 million, to $8.9 billion at March 31, 2020. This decrease was larger than in 2018-19, but slightly lower than the budget estimate of $337 million. |
| | • | | Liabilities for pre-1992 and other closed plan obligations account for 94% (2018: 93%) of the government obligation, with the pre-1992 TPP unfunded liability accounting for 85% (2018: 84%). |
Pension Liabilities
Government obligations for pension plan liabilities
(millions of dollars)
| | | | | | | | |
| (at March 31) | | 2020 | | | 2019 | |
Teachers’ Pension Plans | | | | | | | | |
– Pre-1992 | | | 7,554 | | | | 7,739 | |
– Post-1992 | | | 215 | | | | 340 | |
PS Mgmt. (pre-1992) | | | 449 | | | | 473 | |
Univ. Acad. (pre-1992) | | | 266 | | | | 259 | |
Universities Academic | | | 167 | | | | 160 | |
Spec. Forces (pre-1992) | | | 81 | | | | 93 | |
Supp. Exec. Retir. Plans | | | 81 | | | | 78 | |
MLA (Closed) | | | 38 | | | | 40 | |
PS Mgmt. (Supp.) | | | 67 | | | | 70 | |
Total Pension Liab. | | | 8,918 | | | | 9,252 | |
| | |
| |
| 8 | | 2019-20 Final Results | Year-End Report |
Cash Adjustments / Borrowing Requirements
General Revenue Fund cash balance. The year-end GRF cash balance was $9.4 billion on March 31, 2020, an increase of $3.1 billion from the prior year, comprising: a net $6 billion reduction, due to the deficit plus various net cash adjustments; the addition of $8.2 billion in borrowing; plus cash of $0.9 billion deposited in 2019-20 after final 2018-19 results were determined. The $9.4 billion cash balance reflects advance borrowing for 2020-21 as cash management risks were severely elevated due to COVID-19.
Cash adjustments such as differences between accrued revenue and cash receipts, non-cash revenue or expense, SUCH sector entity results, and transfers not reported on the income statement, are necessary to determine the cash balance.
| • | | Net income of, or retained by, other entities. |
| | - | Positive adjustments include: $1.3 billion of the $12.2 billion deficit was due to SUCH sector / Alberta Innovates net results, while $2.7 billion was due to Alberta Petroleum Marketing |
| | Commission’s negative net income. A number of funds were also dissolved, re-allocating about $0.8 billion in cash balances to general revenue, while Agriculture Financial Services Corporation and Alberta Social Housing Corporation provided $0.4 billion in cash for agriculture insurance indemnities and housing programs. |
| | - | Negative adjustments include: $0.4 billion in surpluses of entities like Alberta Treasury Branches and the Balancing Pool are retained by the entities; $0.3 billion is retained by the Heritage Fund for inflation-proofing, and another $0.1 billion in net income is kept by the endowment funds. |
| • | | Non-cash expense. $1.2 billion of amortization, inventory consumption and loss on disposal expense requires no cash; a $334 million decrease in pension liabilities is reported as non- cash negative expense. |
| • | | Cash requirements not in expense. $308 million for |
| | student loans, net of repayments; $130 million for short-term inventory assets; a net $84 million was required for 2013 flood assistance and 2016 Wood Buffalo wildfire spending, after adjusting for revised expense and revenue. |
| • | | Revenue and other cash adjustments. Cash received for non-renewable resource royalties exceeded reported resource revenue by $254 million, while cash received for personal income taxes exceeded reported revenue by $261 million; various other differences between revenue / expense and cash amounted to a net positive $262 million. Cash transfers for capital, reported in revenue over the related asset’s life, exceeded non-cash reported revenue by $129 million. |
Capital Plan cash. Cash for capital investment and P3 principal repayments of $3,151 million was offset by $3,781 million in cash from borrowing and P3 partners, and $123 million from the Capital Plan financing account. The account contained cash borrowed in prior years that was not required in those years. Its balance is now $0.
Cash Adjustments / Borrowing Requirements
(millions of dollars)
| | | | | | | | | | | | | | | | | | | | | | |
| | | | | | | | | | | | Change from | |
| | | | | | | | | | | | | | | | | | |
| | | | | 2019-20 | | | 2018-19 | | | | | | 2018-19 | |
| | | At March 31, 2020 | | Budget | | | Actual | | | Actual | | | Budget | | | Actual | |
| 1 | | Balance at Start of Year (April 1) | | | 6,342 | | | | 6,342 | | | | 1,661 | | | | - | | | | 4,681 | |
| 2 | | Surplus / (Deficit) | | | (8,704 | ) | | | (12,152 | ) | | | (6,711 | ) | | | (3,448 | ) | | | (5,441 | ) |
| | Cash Adjustments – Sources / (Requirements) | | | | | | | | | | | | | | | | | | | | |
| 3 | | SUCH / Alberta Innovates own-source revenue / expense | | | 342 | | | | 1,335 | | | | 728 | | | | 993 | | | | 607 | |
| 4 | | Income retained by funds and agencies / Heritage Fund | | | (42 | ) | | | 3,015 | | | | (1,191 | ) | | | 3,057 | | | | 4,206 | |
| 5 | | Pension provisions (non-cash expense) | | | (337 | ) | | | (334 | ) | | | (190 | ) | | | 3 | | | | (144 | ) |
| 6 | | Amort. / invent. cons. / book value disp. (ex. SUCH; non-cash exp.) | | | 1,232 | | | | 1,151 | | | | 1,135 | | | | (81 | ) | | | 16 | |
| 7 | | Student loans / inventory acquisition (excluding SUCH) | | | (503 | ) | | | (438 | ) | | | (469 | ) | | | 65 | | | | 31 | |
| 8 | | 2016 Wood Buffalo fire / 2013 flood assistance revenue / expense | | | (21 | ) | | | (84 | ) | | | (154 | ) | | | (63 | ) | | | 70 | |
| 9 | | Energy royalties / personal income tax / other cash adjustments | | | (269 | ) | | | 777 | | | | (945 | ) | | | 1,046 | | | | 1,722 | |
| 10 | | Net deferred capital contribution adjustment (excluding SUCH) | | | 144 | | | | 129 | | | | 75 | | | | (15 | ) | | | 54 | |
| 11 | | Capital investment (excluding SUCH; cash requirement not in expense) | | | (2,812 | ) | | | (3,085 | ) | | | (3,280 | ) | | | (273 | ) | | | 195 | |
| 12 | | Withdrawal / (deposit) from / (to) Capital Plan account | | | 123 | | | | 123 | | | | (68 | ) | | | - | | | | 191 | |
| 13 | | Direct borrowing for Capital Plan | | | 3,320 | | | | 3,499 | | | | 4,177 | | | | 179 | | | | (678 | ) |
| 14 | | Alternative financing for Capital Plan (P3s – public-private partnerships) | | | 113 | | | | 159 | | | | 128 | | | | 46 | | | | 31 | |
| 15 | | Current principal repayments (P3s) | | | (66 | ) | | | (66 | ) | | | (64 | ) | | | - | | | | (2 | ) |
| 16 | | Surplus / (deficit) plus net cash adjustments | | | (7,479 | ) | | | (5,971 | ) | | | (6,830 | ) | | | 1,508 | | | | 859 | |
| 17 | | Cash transferred from / (due to) prior-year final results | | | 854 | | | | 854 | | | | - | | | | - | | | | 854 | |
| 18 | | Cash from final results to be withdrawn / (deposited) next year | | | - | | | | - | | | | (854 | ) | | | - | | | | 854 | |
| 19 | | Direct borrowing for Fiscal Plan | | | 3,783 | | | | 8,180 | | | | 12,367 | | | | 4,397 | | | | (4,187 | ) |
| 20 | | Balance at End of Year (March 31) | | | 3,500 | | | | 9,405 | | | | 6,342 | | | | 5,905 | | | | 3,063 | |
| | |
| |
| 2019-20 Final Results | Year-End Report | | 9 |
Net Financial and Capital Assets
At March 31, 2020, government of Alberta financial and capital assets exceeded liabilities by $11.4 billion.
This was $11.8 billion lower than March 31, 2019, due to a reduction of $12.7 billion in net financial assets, partly offset by a net $0.9 billion increase in capital / non-financial assets. The decrease in net financial assets was mainly due to:
| • | | $0.6 billion increase in assets, mainly comprising: $3.1 billion increase in year-end cash, due to pre-borrowing for 2020-21 operations; a decrease of $2.0 billion in government business enterprise equity (mainly from the provision for an onerous contract in Alberta Petroleum Marketing Commission - APMC); a net increase of $0.3 billion in student loans; an increase of $0.4 billion in the Heritage Fund and endowment funds; these are partly offset by a net $0.7 billion in withdrawals from various funds and agencies and a decrease of $0.5 billion in other financial assets. |
| • | | $13.3 billion increase in liabilities consisting mainly of $11.4 billion borrowed for the Fiscal Plan, Capital Plan and self-supporting lending organizations, $2.3 billion increase is other liabilities, partly offset by reductions of $0.4 billion in pension plan and coal phase-out liabilities. |
Financial assets
$76.4 billion at March 31, 2020.
Heritage Fund. $16.2 billion book value. This was a $287 million increase from March 31, 2019, from inflation-proofing of 1.8 per cent (2019 Alberta CPI).
Endowment and other funds. $4.4 billion, a $315 million decrease from March 31, 2019. This comprises $451 million reduction from winding up the Cancer Prevention Legacy Fund, partly offset by $136 million in net investment income of the three endowment funds and Alberta Enterprise Corporation.
General Revenue Fund cash for operations. Balance of $9.4 billion. This
is an increase from March 31, 2019 of $3.1 billion, due to additional borrowing undertaken in 2019-20 for 2020-21 operations to manage cash risk, which was greatly increased with the onset of the COVID-19 pandemic.
Self-supporting lending organizations. $22.1 billion in financial assets of Alberta Capital Finance Authority (ACFA) and Agriculture Financial Services Corporation (AFSC). These assets more than offset their liabilities.
Equity in commercial enterprises. $1.1 billion, primarily $4.1 billion in ATB Financial and $0.5 billion in Credit Union Deposit Guarantee Corporation and Alberta Gaming, Liquor and Cannabis Commission equity, less a net $3.5 billion deficiency of the Balancing Pool and APMC.
Student loans. $3.2 billion, an increase of $308 million from March 31, 2019. $649 million in loans were provided, $275 million in loans were repaid, while loss provisions and amortization of loan subsidies amounted to a net $66 million.
Climate change funds and accounts. $0.6 billion, a decrease of $310 million from March 31, 2019. The carbon tax and associated account were eliminated in 2019-20, providing $282 million in cash, while the Technology Innovation and Emission Reduction Fund allocations exceeded revenue by $27 million. The balance in Energy Efficiency Alberta remained at $8 million on March 31, 2020.
Other financial assets. $19.4 billion. These assets include financial assets of school boards, universities and colleges and the health authority, the cash reserve of $4 billion added last year, and accounts and interest receivable, natural gas royalty deposits and cash associated with future liabilities such as corporate income tax refunds.
Liabilities
$116.5 billion at March 31, 2020, including debt of $89.2 billion, alternative financing (public-private parternships) of $3 billion, coal phase-out liabilities of $0.9 billion, pension
liabilities of $8.9 billion and other liabilities of $14.5 billion.
Liabilities for capital projects. $37.2 billion, a $3.6 billion increase from March 31, 2019: $3,499 million in borrowing, $18 million in amortization of issue discounts, and the addition of $159 million in P3 project liabilities, less $66 million in repayments.
Fiscal plan borrowing. $36.9 billion, an increase of $7.9 billion. This includes $8.2 billion borrowed in 2019-20, less debt repayments of $350 million relating to the debt incurred for the financial restructuring of the pre-1992 Teachers’ Pension Plan, and of $50 million for Alberta Social Housing Corporation.
Self-supporting lending organizations. $18.1 billion. This consists of $15.6 billion in ACFA and $2.4 billion in AFSC, and is more than offset by financial assets of $22.1 billion.
Coal phase-out liabilities. $0.9 billion, $69 million lower than 2018-19, reflecting the net present value of $97 million in annual payments to be made to generators for phasing-out coal use by 2030.
Pension liabilities. $8.9 billion, a decrease of $0.3 billion.
Other liabilities. $14.5 billion. Includes liabilities of school boards, universities and colleges and the health authority, natural gas royalty and security deposits, unearned revenue, estimated corporate income tax refunds, trade payables and other liabilities of ACFA, AFSC and Alberta Social Housing Corporation.
Capital / Non-financial Assets
$54.8 billion at March 31, 2020. $54.1 billion in capital assets include land, land improvements, buildings, computer hardware and software, equipment, provincial highways, bridges, dams and other water management infrastructure.
Capital assets increased $1.1 billion: $3.9 billion in capital investment less $2.8 billion amortization and disposals.
| | |
| |
| 10 | | 2019-20 Final Results | Year-End Report |
Total Capital Plan spending in 2019-20 of $5.6 billion ($3.9 billion investment plus $1.7 billion in grants) was financed from a variety of sources: $0.8 billion in federal funding, donations and other sources; $0.8 billion provided by school boards, post-secondary institutions and Alberta Health Services; $0.2 billion from cash of agencies and funds (e.g. ASHC and TIER); $0.1 billion from previous borrowing set aside in the capital plan financing account;
borrowing and contributions from public-private partnerships provided $3.7 billion.
Other non-financial assets include $377 million in inventory assets and $358 million in prepaid expenses. Inventory consumption / write-downs exceeded acquisition by $12 million, while prepaid expenses decreased by $260 million primarily as 2018-19 included $308 million in crude-by-rail set up costs.
Spent Deferred Capital Contributions
$3.2 billion at March 31, 2020.
Spent deferred capital contributions (DCC) increased by $67 million. This reflects the use of $0.3 billion in cash received for capital purposes that has not yet been reported in revenue (increasing DCC), less $0.2 billion previously received and spent, and now being recognized in 2019-20 revenue (decreasing DCC).
Balance Sheet
(millions of dollars)
| | | | | | | | | | | | |
| | | at March 31 | |
| | | 2020 | | | 2019 | | | Change from | |
| | | Actual | | | Actual | | | 2019 | |
Financial Assets | | | | | | | | | | | | |
Alberta Heritage Savings Trust Fund | | | 16,243 | | | | 15,956 | | | | 287 | |
Endowment funds: | | | | | | | | | | | | |
Alberta Heritage Foundation for Medical Research | | | 1,849 | | | | 1,778 | | | | 71 | |
Alberta Heritage Science and Engineering Research | | | 1,111 | | | | 1,076 | | | | 35 | |
Alberta Heritage Scholarship | | | 1,308 | | | | 1,281 | | | | 27 | |
Other funds (Ab. Cancer Prevention Legacy / Ab. Enterprise Corporation) | | | 159 | | | | 609 | | | | (450 | ) |
General Revenue Fund cash pre-borrowing / reserve | | | 9,405 | | | | 6,342 | | | | 3,063 | |
Self-supporting lending organizations: | | | | | | | | | | | | |
Alberta Capital Finance Authority (includes loans to the SUCH sector) | | | 16,328 | | | | 16,478 | | | | (150 | ) |
Agriculture Financial Services Corporation | | | 5,747 | | | | 5,507 | | | | 240 | |
Equity in commercial enterprises (ATB / AGLC / APMC / CUDGCo / Bal. Pool) | | | 1,105 | | | | 3,062 | | | | (1,957 | ) |
Student loans | | | 3,192 | | | | 2,884 | | | | 308 | |
Climate change (TIER / carbon tax account / Energy Efficiency Ab) | | | 569 | | | | 879 | | | | (310 | ) |
Other financial assets (including SUCH sector) | | | 19,365 | | | | 19,891 | | | | (526 | ) |
Total Financial Assets | | | 76,381 | | | | 75,743 | | | | 638 | |
Liabilities | | | | | | | | | | | | |
Taxpayer-supported debt: | | | | | | | | | | | | |
Direct borrowing for the Capital Plan | | | 34,169 | | | | 30,651 | | | | 3,518 | |
Alternative financing (Public-private partnerships {P3s} - Capital Plan) | | | 3,038 | | | | 2,946 | | | | 92 | |
Debt issued to reduce pre-1992 TPP unfunded liability | | | 594 | | | | 944 | | | | (350 | ) |
Direct borrowing for the Fiscal Plan | | | 33,610 | | | | 25,430 | | | | 8,180 | |
Other debt (short-term; ASHC; reserve) | | | 2,731 | | | | 2,686 | | | | 45 | |
Total taxpayer-supported debt | | | 74,142 | | | | 62,657 | | | | 11,485 | |
Self-supporting lending organizations / activities debt: | | | | | | | | | | | | |
Alberta Capital Finance Authority | | | 15,640 | | | | 15,902 | | | | (262 | ) |
Agriculture Financial Services Corporation | | | 2,426 | | | | 2,232 | | | | 194 | |
Total debta | | | 92,208 | | | | 80,791 | | | | 11,417 | |
Coal phase-out liabilities | | | 914 | | | | 983 | | | | (69 | ) |
Pension liabilities | | | 8,918 | | | | 9,252 | | | | (334 | ) |
Other liabilities (including SUCH sector) | | | 14,485 | | | | 12,194 | | | | 2,291 | |
Total Liabilities | | | 116,525 | | | | 103,220 | | | | 13,305 | |
Net Financial Assets (total financial assets less total liabilities) | | | (40,144 | ) | | | (27,477 | ) | | | (12,667 | ) |
Capital / Other Non-financial Assets | | | 54,801 | | | | 53,908 | | | | 893 | |
Spent deferred capital contributions | | | (3,231 | ) | | | (3,164 | ) | | | (67 | ) |
Net Assets (net financial assets + capital assets - deferred capital contributions) | | | 11,426 | | | | 23,267 | | | | (11,841 | ) |
Change in Net Assetsb | | | (11,841 | ) | | | (6,404 | ) | | | | |
| a | Does not include term debt of $6,029 million (2019: $5,149 million) issued on behalf of government business enterprises which is included on a net basis in financial assets (“Equity in commercial enterprises” = assets minus debt and other liabilities), nor does it include liabilities for capital leases. |
| b | Change in Net Assets differ from the surplus / (deficit) numbers due to net asset adjustments of positive $311 million in 2019-20, and positive $307 million in 2018-19. More information is provided in Schedule 15, page 70 of the Consolidated Financial Statements in the 2019-20 Government of Alberta Annual Report. |
| | |
| |
| 2019-20 Final Results | Year-End Report | | 11 |
Economic and Tax Highlights
Economic highlights
(Calendar Year Basis)
The Alberta economy struggled to advance in 2019. While some sectors fared well, the gains were overshadowed by challenges in the energy sector from transportation bottlenecks and a slowing global economy. Real Gross Domestic Product stagnated, falling an estimated 0.6 per cent, down from 1.6 per cent growth in 2018.
Business output slowed in 2019, as weaker global growth and industrial production weighed on manufacturing. Transportation bottlenecks and unprecedented discounts for Alberta crude in late 2018 led to government-mandated oil production limits, which helped shrink inventories and the price discounts, but reduced output especially in the first half of 2019. Easing production limits and increased takeaway capacity supported a rebound in oil production and exports later in the year, but while oil production grew 1 per cent, exports and manufacturing shipments declined slightly.
While business output slowed in 2019, investment did improve marginally. Plant and equipment spending grew by a modest 2.4 per cent with capacity expansions in the petrochemical sector, progress on the TransMountain pipeline expansion, and other midstream energy
projects. Investment was held back by declines in oil and gas extraction though, as market access uncertainty prompted producers to reduce spending. Rigs drilling fell by more than 30 per cent. In addition, commercial non-residential construction spending remained weak.
Alberta’s labour market failed to gain momentum in 2019. Employment growth slowed to 0.5 per cent, down from 1.9 per cent in 2018. While private sector employment led the increase, the gains were concentrated in the service sector. Goods sector employment fell, amid weakness in drilling and construction activity. With slower job growth and continued labour force expansion, the unemployment rate worsened in 2019, averaging 6.9 per cent. Continued weakness in higher-paid goods sector jobs held back growth in average weekly earnings to 1.4 per cent. Despite the labour market weakness, population growth continued to pick up. 2019 census year population grew by 1.6 per cent, the highest rate since 2014.
Many challenges that weighed on growth in 2019 were receding as 2020 approached. However in March, the world was hit with the COVID-19 pandemic, a deep global recession and collapse in oil prices. This resulted in a sharp pullback in
business activity, widespread job losses and lower government revenue in the final quarter of the 2019-20 fiscal year.
Tax highlights
The government introduced several measures to reduce the tax burden, make Alberta one of the most competitive places in North America for investment, and support diversification and jobs:
| • | | The carbon tax was eliminated, effective May 30, 2019. |
| • | | The Job Creation Tax Cut reduced the general corporate income tax rate to 11 per cent on July 1, 2019, and to 10 per cent on January 1, 2020. The rate was subsequently reduced to 8 per cent on July 1, 2020, a year and a half ahead of schedule. |
Other tax changes included:
| • | | Eliminating several corporate-focused tax credits, the tuition and education tax credits, and pausing indexation of the personal income tax system. |
| • | | Increasing tobacco tax $5 per carton of 200 cigarettes on October 25, 2019 (with proportional increases for other tobacco products). |
| • | | Consolidating the Alberta Family Employment Tax Credit and the Alberta Child Benefit into the new Alberta Child and Family Benefit, effective July 2020, providing more benefits to lower income Albertans. |
In response to COVID-19 and the economic consequences, government permitted deferrals of corporate income tax and tourism levy payments.
Key Economic Indicators
Calendar year, % change unless otherwise noted, 2010 to 2019
| | | | | | | | | | | | | | | | | | | | | | | | | | | | | | | | | | | | | | | | |
| | | 2010 | | | 2011 | | | 2012 | | | 2013 | | | 2014 | | | 2015 | | | 2016 | | | 2017 | | | 2018 | | | 2019 | |
Nominal GDP growth a | | | 9.9 | | | | 10.9 | | | | 4.3 | | | | 9.6 | | | | 10.0 | | | | (14.0 | ) | | | (6.1 | ) | | | 9.2 | | | | 3.8 | | | | 1.7 | |
| | | | | | | | | | |
Real GDP growth | | | 5.0 | | | | 6.5 | | | | 3.9 | | | | 5.7 | | | | 5.9 | | | | (3.7 | ) | | | (3.5 | ) | | | 4.8 | | | | 1.6 | | | | (0.6 | ) |
| | | | | | | | | | |
Employment (thousands) | | | 2,024 | | | | 2,100 | | | | 2,173 | | | | 2,226 | | | | 2,275 | | | | 2,301 | | | | 2,264 | | | | 2,287 | | | | 2,331 | | | | 2,343 | |
| | | | | | | | | | |
Employment growth | | | (0.3 | ) | | | 3.7 | | | | 3.5 | | | | 2.5 | | | | 2.2 | | | | 1.2 | | | | (1.6 | ) | | | 1.0 | | | | 1.9 | | | | 0.5 | |
| | | | | | | | | | |
Unemployment rate | | | 6.6 | | | | 5.4 | | | | 4.6 | | | | 4.6 | | | | 4.7 | | | | 6.0 | | | | 8.1 | | | | 7.8 | | | | 6.6 | | | | 6.9 | |
| | | | | | | | | | |
Average weekly earnings ($ / week) | | | 990 | | | | 1,034 | | | | 1,070 | | | | 1,107 | | | | 1,149 | | | | 1,145 | | | | 1,118 | | | | 1,130 | | | | 1,149 | | | | 1,165 | |
| | | | | | | | | | |
Primary household income a | | | 3.7 | | | | 8.5 | | | | 8.7 | | | | 6.8 | | | | 6.4 | | | | 3.3 | | | | (10.9 | ) | | | 4.1 | | | | 2.5 | | | | 3.1 | |
| | | | | | | | | | |
Net corporate operating surplus a | | | 63.3 | | | | 27.1 | | | | (11.6 | ) | | | 19.2 | | | | 23.2 | | | | (74.0 | ) | | | (22.9 | ) | | | 165.1 | | | | 10.3 | | | | (3.9 | ) |
| | | | | | | | | | |
Housing starts (number of units) | | | 27,088 | | | | 25,704 | | | | 33,396 | | | | 36,011 | | | | 40,590 | | | | 37,282 | | | | 24,533 | | | | 29,457 | | | | 26,085 | | | | 27,325 | |
| | | | | | | | | | |
Alberta consumer price index | | | 1.0 | | | | 2.4 | | | | 1.1 | | | | 1.4 | | | | 2.6 | | | | 1.1 | | | | 1.1 | | | | 1.6 | | | | 2.4 | | | | 1.8 | |
| | | | | | | | | | |
Population (July 1, thousands) | | | 3,679 | | | | 3,789 | | | | 3,875 | | | | 3,981 | | | | 4,084 | | | | 4,145 | | | | 4,196 | | | | 4,244 | | | | 4,301 | | | | 4,371 | |
| | | | | | | | | | |
Population growth | | | 2.3 | | | | 1.4 | | | | 2.3 | | | | 2.7 | | | | 2.6 | | | | 1.5 | | | | 1.2 | | | | 1.1 | | | | 1.3 | | | | 1.6 | |
a 2019 is an estimate as of June 29, 2020
| | |
| |
| 12 | | 2019-20 Final Results | Year-End Report |
Historical Fiscal Summary, 2008-09 to 2019-20 a
(millions of dollars)
| | | | | | | | | | | | | | | | | | | | | | | | | | | | | | | | | | | | | | | | | | | | | | | | | | |
| | | | | 2008-09 | | | 2009-10 | | | 2010-11 | | | 2011-12 | | | 2012-13 | | | 2013-14 | | | 2014-15 | | | 2015-16 | | | 2016-17 | | | 2017-18 | | | 2018-19 | | | 2019-20 | |
Income Statement | | | | | | | | | | | | | | | | | | | | | | | | | | | | | | | | | | | | | | | | | | | | | | | Actual | |
| | Revenue | | | | | | | | | | | | | | | | | | | | | | | | | | | | | | | | | | | | | | | | | | | | | | | | |
| 1 | | Personal income tax | | | 8,708 | | | | 7,877 | | | | 7,631 | | | | 8,563 | | | | 9,621 | | | | 10,537 | | | | 11,042 | | | | 11,357 | | | | 10,763 | | | | 10,775 | | | | 11,874 | | | | 11,244 | |
| 2 | | Corporate income tax | | | 4,252 | | | | 4,754 | | | | 3,334 | | | | 3,678 | | | | 4,756 | | | | 5,488 | | | | 5,796 | | | | 4,195 | | | | 3,769 | | | | 3,448 | | | | 4,871 | | | | 4,107 | |
| 3 | | Other tax revenue | | | 3,817 | | | | 3,746 | | | | 3,820 | | | | 4,099 | | | | 4,333 | | | | 4,500 | | | | 4,598 | | | | 5,168 | | | | 5,649 | | | | 6,538 | | | | 6,833 | | | | 5,747 | |
| 4 | | Resource revenue | | | 11,915 | | | | 6,768 | | | | 8,428 | | | | 11,636 | | | | 7,779 | | | | 9,578 | | | | 8,948 | | | | 2,789 | | | | 3,097 | | | | 4,980 | | | | 5,429 | | | | 5,937 | |
| 5 | | Investment income | | | (1,888 | ) | | | 3,541 | | | | 2,486 | | | | 2,168 | | | | 2,595 | | | | 3,423 | | | | 3,113 | | | | 2,544 | | | | 3,698 | | | | 3,126 | | | | 2,349 | | | | 2,828 | |
| 6 | | Premiums, fees and licences | | | 3,356 | | | | 2,857 | | | | 2,922 | | | | 2,931 | | | | 3,184 | | | | 3,437 | | | | 2,665 | | | | 3,574 | | | | 3,701 | | | | 3,839 | | | | 3,911 | | | | 3,929 | |
| 7 | | Other own-source revenue | | | 4,587 | | | | 4,627 | | | | 4,903 | | | | 5,128 | | | | 5,234 | | | | 5,412 | | | | 7,337 | | | | 5,850 | | | | 3,637 | | | | 6,982 | | | | 6,292 | | | | 3,360 | |
| 8 | | Total own-source revenue | | | 34,747 | | | | 34,170 | | | | 33,524 | | | | 38,203 | | | | 37,502 | | | | 42,375 | | | | 43,499 | | | | 35,477 | | | | 34,314 | | | | 39,688 | | | | 41,559 | | | | 37,152 | |
| 9 | | Federal transfers | | | 4,578 | | | | 5,342 | | | | 5,452 | | | | 5,192 | | | | 5,042 | | | | 7,059 | | | | 5,982 | | | | 7,142 | | | | 7,979 | | | | 7,606 | | | | 8,013 | | | | 9,072 | |
| 10 | | Total Revenue | | | 39,325 | | | | 39,512 | | | | 38,976 | | | | 43,395 | | | | 42,544 | | | | 49,434 | | | | 49,481 | | | | 42,619 | | | | 42,293 | | | | 47,295 | | | | 49,572 | | | | 46,224 | |
| | Expense by Function | | | | | | | | | | | | | | | | | | | | | | | | | | | | | | | | | | | | | | | | | | | | | | | | |
| 11 | | Health | | | 13,674 | | | | 14,636 | | | | 15,393 | | | | 16,284 | | | | 17,254 | | | | 17,967 | | | | 19,366 | | | | 20,115 | | | | 20,687 | | | | 21,239 | | | | 21,921 | | | | 22,477 | |
| 12 | | Basic / advanced education | | | 10,438 | | | | 11,067 | | | | 11,362 | | | | 11,951 | | | | 12,394 | | | | 12,782 | | | | 13,103 | | | | 13,673 | | | | 14,110 | | | | 14,471 | | | | 14,848 | | | | 14,879 | |
| 13 | | Social services | | | 3,417 | | | | 3,807 | | | | 4,129 | | | | 4,278 | | | | 4,641 | | | | 4,668 | | | | 4,548 | | | | 4,752 | | | | 5,198 | | | | 5,592 | | | | 5,867 | | | | 6,248 | |
| 14 | | Other program expense | | | 10,386 | | | | 9,834 | | | | 9,443 | | | | 9,853 | | | | 10,528 | | | | 12,970 | | | | 11,031 | | | | 10,375 | | | | 12,607 | | | | 13,189 | | | | 11,866 | | | | 12,891 | |
| 15 | | Total program expense | | | 37,915 | | | | 39,344 | | | | 40,327 | | | | 42,366 | | | | 44,817 | | | | 48,387 | | | | 48,048 | | | | 48,915 | | | | 52,602 | | | | 54,491 | | | | 54,502 | | | | 56,475 | |
| 16 | | Debt servicing costs | | | 208 | | | | 214 | | | | 472 | | | | 509 | | | | 530 | | | | 601 | | | | 722 | | | | 776 | | | | 1,018 | | | | 1,420 | | | | 1,971 | | | | 2,235 | |
| 17 | | Pension provisions | | | 2,133 | | | | 430 | | | | 439 | | | | 634 | | | | 296 | | | | 748 | | | | (404 | ) | | | (630 | ) | | | (543 | ) | | | (593 | ) | | | (190 | ) | | | (334 | ) |
| 18 | | Total Expense | | | 40,256 | | | | 39,988 | | | | 41,238 | | | | 43,509 | | | | 45,643 | | | | 49,736 | | | | 48,366 | | | | 49,061 | | | | 53,077 | | | | 55,318 | | | | 56,283 | | | | 58,376 | |
| 19 | | Surplus / (Deficit) | | | (931 | ) | | | (476 | ) | | | (2,262 | ) | | | (114 | ) | | | (3,099 | ) | | | (302 | ) | | | 1,115 | | | | (6,442 | ) | | | (10,784 | ) | | | (8,023 | ) | | | (6,711 | ) | | | (12,152 | ) |
Capital Plan b | | | 7,943 | | | | 8,000 | | | | 7,544 | | | | 6,884 | | | | 6,062 | | | | 5,770 | | | | 6,181 | | | | 6,558 | | | | 6,578 | | | | 9,021 | | | | 6,180 | | | | 5,564 | |
| | | | | | | | | | | | |
Balance Sheet (at March 31) | | | | | | | | | | | | | | | | | | | | | | | | | | | | | | | | | | | | | | | | | | | | | | | | |
| 20 | | Heritage / endowment funds | | | 16,900 | | | | 17,077 | | | | 17,500 | | | | 17,936 | | | | 18,176 | | | | 18,562 | | | | 18,860 | | | | 19,262 | | | | 19,836 | | | | 20,306 | | | | 20,716 | | | | 20,672 | |
| 21 | | Contingency Account | | | 16,822 | | | | 14,983 | | | | 11,192 | | | | 7,497 | | | | 3,326 | | | | 4,658 | | | | 6,529 | | | | 3,625 | | | | 2,399 | | | | 1,661 | | | | 6,342 | | | | - | |
| 22 | | Other financial assets | | | 28,868 | | | | 30,338 | | | | 30,799 | | | | 32,972 | | | | 34,734 | | | | 40,039 | | | | 40,688 | | | | 40,990 | | | | 44,052 | | | | 49,010 | | | | 48,685 | | | | 55,709 | |
| 23 | | Capital Plan liabilities | | | (880 | ) | | | (2,888 | ) | | | (3,199 | ) | | | (3,442 | ) | | | (4,594 | ) | | | (8,724 | ) | | | (11,922 | ) | | | (19,040 | ) | | | (23,769 | ) | | | (29,339 | ) | | | (33,597 | ) | | | (37,207 | ) |
| 24 | | Fiscal Plan liabilities (borrowing / pre-1992 TPP) | | | 0 | | | | (1,187 | ) | | | (1,187 | ) | | | (1,187 | ) | | | (1,187 | ) | | | (1,187 | ) | | | (943 | ) | | | (944 | ) | | | (9,529 | ) | | | (14,023 | ) | | | (26,374 | ) | | | (36,935 | ) |
| 25 | | Pension obligations | | | (10,239 | ) | | | (9,483 | ) | | | (9,922 | ) | | | (10,556 | ) | | | (10,852 | ) | | | (11,600 | ) | | | (11,196 | ) | | | (10,566 | ) | | | (10,023 | ) | | | (9,430 | ) | | | (9,252 | ) | | | (8,918 | ) |
| 26 | | Other liabilities | | | (19,770 | ) | | | (21,523 | ) | | | (23,530 | ) | | | (24,229 | ) | | | (25,148 | ) | | | (28,716 | ) | | | (28,962 | ) | | | (29,408 | ) | | | (31,867 | ) | | | (37,529 | ) | | | (33,997 | ) | | | (33,465 | ) |
| 27 | | Net Financial Assets / (Debt) | | | 31,701 | | | | 27,317 | | | | 21,653 | | | | 18,991 | | | | 14,455 | | | | 13,032 | | | | 13,054 | | | | 3,919 | | | | (8,901 | ) | | | (19,344 | ) | | | (27,477 | ) | | | (40,144 | ) |
| 28 | | Capital (net of defer. Contrib.) / non-fin. assets | | | 30,275 | | | | 34,217 | | | | 37,607 | | | | 40,122 | | | | 39,517 | | | | 40,839 | | | | 42,197 | | | | 44,623 | | | | 46,622 | | | | 49,015 | | | | 50,744 | | | | 51,570 | |
| 29 | | Net Assets c | | | 61,976 | | | | 61,534 | | | | 59,260 | | | | 59,113 | | | | 53,972 | | | | 53,871 | | | | 55,251 | | | | 48,542 | | | | 37,721 | | | | 29,671 | | | | 23,267 | | | | 11,426 | |
a Numbers are not strictly comparable due to numerous accounting policy changes over time. Examples include reporting certain items (transfers through the tax system, crude oil marketing and transportation costs, allowance for corporate income tax doubtful accounts) as expense, instead of netting the amounts from related revenue, increasing both revenue and expense, but not impacting the surplus / (deficit). 2018-19 revenue and expense have been decreased by $52 million to report revenue net of third party investment management costs, instead of reporting the costs in expense and grossing up revenue. There is no impact on the deficit or debt.
b Reflects capital grants and other support included in expense, and capital investment in government-owned assets not included in expense. Capital investment adds to capital assets, which are depreciated over time through amortization expense. Numbers for 2008-09 to 2013-14 are estimates as details required to consolidate SUCH sector capital spending with full accuracy are not readily available.
c The change in net assets / (debt) year over year does not match the surplus / (deficit) exactly in most years, due to various balance sheet adjustments, most of which are minor. A significant adjustment reducing net assets by $2 billion was made in 2012-13, to recognize the accumulated deferred capital contribution liability when the accounting standard was adopted.
| | |
| |
| 2019-20 Final Results | Year-End Report | | 13 |
Annual Infrastructure Report
The Annual Infrastructure Report was created with the purpose of informing Albertans of the year end accomplishments achieved with regard to infrastructure projects as set out in the Capital Plan. The Capital Plan is a multi-year plan which sets out the investments for infrastructure projects that support government priorities. This Report captures the achievements made and highlights the progress of Capital Plan projects in the 2019-20 fiscal year.
Every year, significant investment is committed to build, maintain and renew infrastructure in Alberta. The 2019 Capital Plan spending was $5.6 billion in 2019-20. This investment allowed for the development of new and existing key public infrastructure projects such as hospitals, schools and road projects.
Projects listed in the Capital Plan are under various stages of progress from in-depth planning and design to the opening stage for public use. Updates as of March 31, 2020, on the progress of select 2019 capital projects throughout the province will be highlighted in this Report.
Over the course of 2019-20, many new and existing projects were underway in the province, while other projects were in the process of completion. Projects in 2019-20 included the completion of 19 major school projects and over 135 completed road and bridge projects.
Ten new capital projects were announced as of Budget 2019. The 2019 Capital Plan also included investment in programs such as the Land Trust Grant Program, Local Government Fiscal Framework, Aboriginal Business Investment Fund, and the Strategic Transportation Infrastructure Program (STIP).
Other continuing major projects include the Calgary Cancer Centre, a new Edmonton hospital, the Grande Prairie Regional Hospital, province-wide school projects and Edmonton and Calgary light rail transit (LRT).
Capital Plan Initiatives Update
During Budget 2019, work was underway on important Capital Plan initiatives:
| | - | The Act is under development by Alberta Infrastructure with the support of Treasury Board and Finance. Upon completion, it will provide more transparency around the capital planning process for all stakeholders. |
| • | 20-Year Strategic Capital Plan |
| | - | The 20-Year Strategic Capital Plan is under development. Stakeholder engagement has been completed and information is presently being analyzed and integrated into the Plan. |
Budget 2019 Capital Plan Analysis
Budget 2019 Grant and Investment Spending
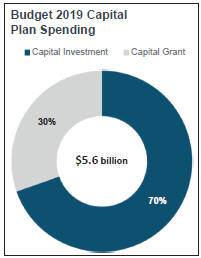
The Capital Plan includes:
| • | Capital Investment - the investment in the Government of Alberta’s capital assets. This includes funding to develop hospitals, schools, provincial highways and information management systems. |
| • | Capital Grants - expenses primarily to support entities outside of the Government of Alberta for the development of their capital assets. This includes the Municipal Sustainability Initiative (MSI), STIP, and Municipal Water and Wastewater Program. |
In Budget 2019, $3.9 billion was spent on Capital Investment and $1.7 billion on Capital Grants for a total spending of $5.6 billion, supporting 31,000 jobs in Alberta.
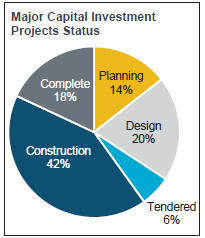
Status of Capital Investment Projects over $5 million as of March 31, 2020
The pie graph below illustrates the status of capital investment projects (excluding capital maintenance and renewal projects) that have a total project cost of $5 million and above.
| | |
| |
| 14 | | 2019-20 Final Results | Year-End Report |
Capital Plan
(millions of dollars)
| | | | | | | | | | | | | | | | | | | | |
| | | | | | | | | | | | Change from | |
| | | 2019-20 | | | 2018-19 | | | | | | 2018-19 | |
| BY MINISTRY | | Budget | | | Actual | | | Actual | | | Budget | | | Actual | |
Advanced Education | | | 572 | | | | 554 | | | | 694 | | | | (18 | ) | | | (140) | |
Agriculture and Forestry | | | 41 | | | | 28 | | | | 37 | | | | (12 | ) | | | (9) | |
Community and Social Services | | | 1 | | | | 0 | | | | 2 | | | | (0 | ) | | | (2) | |
Culture, Multiculturalism, and Status of Women | | | 52 | | | | 40 | | | | 88 | | | | (11 | ) | | | (48) | |
Economic Development, Trade and Tourism | | | 16 | | | | 10 | | | | 7 | | | | (6 | ) | | | 3 | |
Education | | | 740 | | | | 600 | | | | 678 | | | | (140 | ) | | | (78) | |
Energy | | | 150 | | | | 73 | | | | 185 | | | | (77 | ) | | | (112) | |
Environment and Parks | | | 111 | | | | 68 | | | | 172 | | | | (43 | ) | | | (104) | |
Health | | | 1,067 | | | | 1,083 | | | | 925 | | | | 15 | | | | 158 | |
Indigenous Relations | | | 8 | | | | 3 | | | | 48 | | | | (5 | ) | | | (45) | |
Infrastructure | | | 229 | | | | 125 | | | | 269 | | | | (104 | ) | | | (144) | |
Justice and Solicitor General | | | 9 | | | | 5 | | | | 8 | | | | (5 | ) | | | (4) | |
Labour and Immigration | | | 1 | | | | 1 | | | | 3 | | | | (0 | ) | | | (2) | |
Municipal Affairs | | | 1,132 | | | | 1,124 | | | | 889 | | | | (7 | ) | | | 235 | |
Seniors and Housing | | | 151 | | | | 182 | | | | 170 | | | | 31 | | | | 12 | |
Service Alberta | | | 110 | | | | 92 | | | | 109 | | | | (18 | ) | | | (17) | |
Transportation | | | 1,790 | | | | 1,551 | | | | 1,757 | | | | (239 | ) | | | (206) | |
Treasury Board and Finance | | | 24 | | | | 23 | | | | 14 | | | | (1 | ) | | | 9 | |
Legislative Assembly | | | 2 | | | | 1 | | | | 2 | | | | (1 | ) | | | (1) | |
| | | | | |
| Total Capital Plan | | | 6,206 | | | | 5,564 | | | | 6,057 | | | | (642 | ) | | | (494) | |
The 2019-20 Capital Plan supported $5.6 billion in projects, $0.5 billion lower than 2018-19 and $0.6 billion lower than the Budget 2019 estimate.
| • | The decrease from the Budget 2019 estimate was mainly due to re-profiling of transportation grant programs, school capital projects, carbon capture and storage programs, and other projects to future years due to slower than anticipated progress. |
| • | Progress was affected by: adverse weather, pace of project identification, approval and construction under federal programs, private sector and municipal partner delays, land conditions and timing related to planning and permitting. |
Budget 2019 spending is a combination of the following Capital Plan envelopes:
| • | $1.5 billion in Municipal Support: |
| | - | $295 million in MSI grants and $347 million in Basic Municipal Transportation Grants to municipalities to support municipal development. |
| | - | $474 million from the federally funded Gas Tax Fund. |
| | - | $87 million in Green TRIP grant for transit and $32 million for Strategic Transportation Infrastructure Program. |
| | - | Grants of $167 million from Federal Public Transit Infrastructure Fund and Clean Water and Wastewater Fund. |
| | - | $72 million for water supply, treatment, wastewater treatment and disposal systems. |
| • | $1.0 billion for Protecting Quality Health Care including: |
| | - | Continued work on projects in Calgary, Edmonton, Fort McMurray, Grande Prairie, Lloydminster, Medicine Hat and Red Deer. |
| | - | Planning continues for the Edmonton hospital, and construction continues on the Calgary Cancer Centre. |
| • | $0.8 billion for Roads and Bridges including: |
- $529 million for the Edmonton and Calgary ring roads, with
| | the final portion of Calgary’s southwest ring road about 75% complete. |
| | - | $225 million for highway twinning, widening and expansion, including Highway 63, Peace River Bridge twinning, the Grande Prairie Highway 43X bypass and other road and bridges projects. |
| • | $0.8 billion for Capital Maintenance and Renewal: |
| | - | $413 million for bridge construction, highway rehabilitation and major maintenance. |
| | - | $107 million for school facilities. |
| | - | $95 million for health facilities. |
| | - | $38 million for family, social support, and housing capital maintenance and renewal. |
| | - | $78 million for parks, government facilities preservation, and information technology for health systems development, One Information Management and Technology (IMT) Enterprise priorities and other general capital and information and technology. |
| | |
| |
| 2019-20 Final Results | Year-End Report | | 15 |
| | |
• $0.6 billion for Skills for Jobs: - $177 million for post-secondary projects including funding of $95 million for University of Calgary MacKimmie Complex and $48 million for University of Alberta Dentistry Pharmacy Functional Building Renewal. - $377 million in self-funded post-secondary institution projects. • $0.5 billion for Renewing Education Infrastructure: - School construction projects for various ongoing projects including $32 million for modular classrooms to accelerate meeting demand for educational space. • $0.2 billion for Family, Social Supports and Housing. • $0.4 billion for Agriculture and Natural Resources, Public Safety and Emergency Services, Streamlining Service Delivery and Sports and Recreation. | | 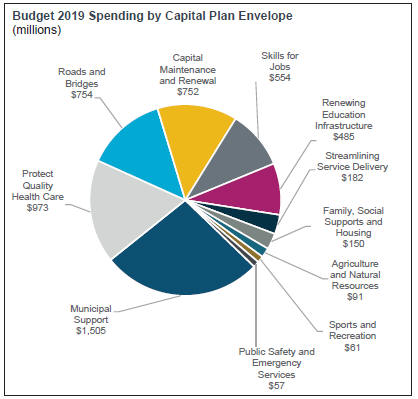 |
| | |
| |
| 16 | | 2019-20 Final Results | Year-End Report |
Budget 2019 Select Ongoing and Completed Projects
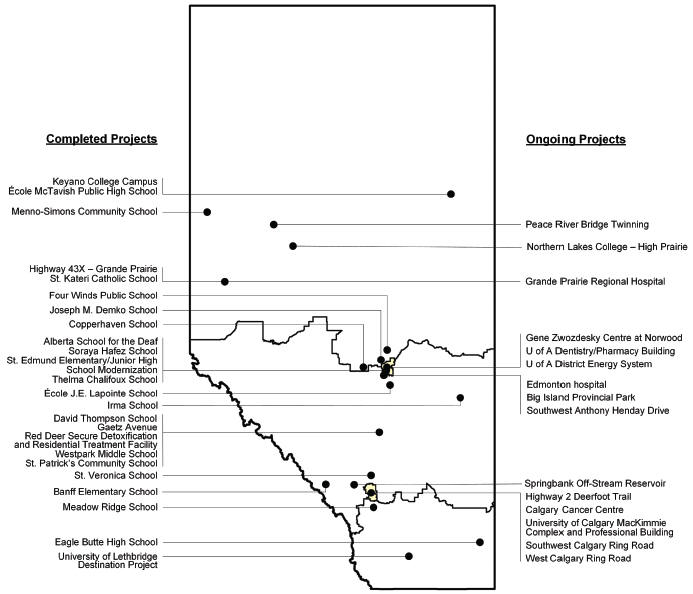
Year-End Highlights
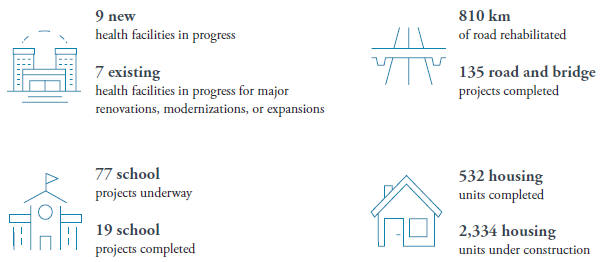
| | |
| | |
| 2019-20 Final Results | Year-End Report | | 17 |
Select Ongoing and Completed Projects - Status as of March 31, 2020
Planning and Design
Total project costs in planning and design are estimates and subject to change upon finalizing project scope.
Big Island Provincial Park Planning
Total Project Cost: $10 million Expected Completion: Spring 2024
| • | | This project will determine the condition and appropriate future use of the Big Island Provincial Park. |
Highway 2 Deerfoot Trail
Total Project Cost: $210 million Expected Completion: Fall 2024
| • | | The Government of Alberta and the City of Calgary continue to work on a long-term study of Deerfoot Trail that started in 2016 and will be finalized in 2020. The City of Calgary is managing the study, which will identify and prioritize the areas most in need of improvement. |
Misericordia Community Hospital Modernization
Total Project Cost: $85 million Expected Completion: Spring 2024
| • | | Design and construction of a new emergency department. |
Red Deer Justice Centre
Total Project Cost: $207 million Expected Completion: Spring 2023
| • | | The project will address space shortages in the community and ensure vital justice services are delivered effectively to residents of central Alberta. |
Highway 40 Twinning, South of Grande Prairie
Total Project Cost: $106 million Expected Completion: Fall 2023
| • | | This twinning project will enhance the economic development of the region that is being held back by bottlenecks and inadequate highway infrastructure. |
Edmonton Hospital
Committed as of Budget 2019: $238 million Expected Completion: Fall 2030
| • | | Construction of a new hospital in southwest Edmonton. |
Construction in Progress
Grande Prairie Regional Hospital
Total Project Cost: $817 million Expected Completion: Spring 2020
| • | | Construction of a new regional hospital to accommodate acute care, operating rooms and intensive care services. |
Gene Zwozdesky Centre at Norwood
Total Project Cost: $379 million Expected Completion: Winter 2024
| • | | The project will accommodate 350 enhanced long-term care beds. |
Southwest Anthony Henday Drive Edmonton Expansion
Total Project Cost: $100 million Expected Completion: Fall 2022 Construction on widening 18 kilometres of Southwest Anthony Henday Drive from four to six lanes began in November 2019.
Peace River Bridge Twinning
Total Project Cost: $162 million Expected Completion: Fall 2020
| • | | Construction of a second bridge north of the existing bridge over the Peace River. |
University of Calgary MacKimmie Complex and Professional Building
Total Project Cost: $262 million Expected Completion: Fall 2022
| • | | The MacKimmie Complex will renew the building’s vacated space and increase student capacity. |
Calgary Cancer Centre
Total Project Cost: $1.57 billion Expected Completion: Fall 2022
| • | | Construction of a new facility to accommodate comprehensive cancer care services for southern Alberta. |
| | |
| The province has committed a combined $3 billion for LRT projects in Edmonton and Calgary: |
| |

| | Edmonton - $1.47 billion for the Metro Line LRT Extension, West Valley Line LRT, and Capital Line South LRT Extension. |
| | Calgary - $1.53 billion for the Green Line LRT. |
| | |
| | |
| 18 | | 2019-20 Final Results | Year-End Report |
Construction in Progress Continued
Motor Vehicles System (MOVES) Upgrade
Total Project Cost: $22.1 million Expected Completion: Spring 2021
| • | | A major upgrade to the province’s motor vehicle system, MOVES, is underway. MOVES is a critical system used by Service Alberta and Alberta Transportation that also interfaces to systems used in many other departments. |
Completed Projects
Highway 2/Gaetz Avenue Interchange
Total Project Cost: $80 million
| • | | A multi-year project to construct a new interchange south of Red Deer at Highway 2, Gaetz Avenue and Taylor Drive. |
Highway 43X - Grande Prairie Bypass
Total Project Cost: $48 million
| • | | This project involved construction of 12 km on a four-lane highway and a roundabout at Highway 43 and Range Road 63 – the first one built on a divided highway in Alberta. |
Keyano College, Campus Upgrades
Total Project Cost: $15.6 million
| • | | This project addressed deterioration and safety issues impacting campus facilities. |
University of Lethbridge Destination Project
Total Project Cost: $247.7 million
| • | | Completed January 2020, this project involved replacing the outdated and over-crowded science building on campus. |
Red Deer Secure Detoxification and Residential Treatment Facility
Total Project Cost: $9.1 million
| • | | Creation of an eight-bed program to provide comprehensive assessment, detoxification, addictions counselling, health services, and 24-hour care. |
Flood Recovery - Provincial Park Infrastructure Restoration
Total Project Cost: $15.3 million
| • | | These funds addressed flood damage from the 2013 flooding in Southern Alberta. |
Schools
The following 19 school projects were completed in 2019-20 with total provincial support of $406.8 million:
| • | | Alberta School for the Deaf redevelopment. |
| • | | Banff Elementary School replacement. |
| • | | Copperhaven School construction. |
| • | | David Thompson School design. |
| • | | Eagle Butte High School modernization. |
| • | | École J.E. Lapointe School modernization. |
| • | | École McTavish Public High School addition. |
| • | | Four Winds Public School construction. |
| • | | Irma School replacement. |
| • | | Joseph M. Demko School construction. |
| • | | Meadow Ridge School construction. |
| • | | Menno-Simons Community School gymnasium addition and modernization. |
| • | | Soraya Hafez School construction. |
| • | | St. Edmund Elementary/Junior High School modernization. |
| • | | St. Kateri Catholic School modernization. |
| • | | St. Patrick’s Community School modernization. |
| • | | St. Veronica School construction. |
| • | | Thelma Chalifoux School construction. |
| • | | Westpark Middle School replacement. |
| | |
| | |
| 2019-20 Final Results | Year-End Report | | 19 |