Exhibit 99.5
GOVERNMENT OF ALBERTA
2020-21 First Quarter
Fiscal Update and
Economic Statement
| | |
| August 2020 | |  |
Table of Contents
| | | | |
| |
2020-21 First Quarter Fiscal Plan Highlights | | | 3 | |
| |
Revenue and Expense Highlights | | | 4 | |
| |
Assets and Liabilities | | | 6 | |
| |
Balance Sheet Summary | | | 6 | |
| |
Revenue | | | 7 | |
| |
Operating Expense by Ministry | | | 8 | |
| |
Debt Servicing Costs | | | 8 | |
| |
Contingency / Disaster and Emergency Assistance Expense | | | 9 | |
| |
Capital Amortization Expense | | | 9 | |
| |
Borrowing Requirements / Borrowing Sources | | | 9 | |
| |
Cash Adjustments / Borrowing Requirements | | | 10 | |
| |
Inventory Consumption Expense / Inventory Acquisition | | | 10 | |
| |
Capital Plan Highlights | | | 11 | |
| |
Capital Plan Summary | | | 11 | |
| |
Economic Update | | | 12 | |
| |
Key Energy and Economic Assumptions | | | 15 | |
| |
Fiscal Stabilization Program | | | 16 | |
| |
Alberta’s Tax Advantage | | | 17 | |
| |
Reporting Methodology and Legislative Compliance | | | 18 | |
(Note: Amounts presented in tables may not add to totals due to rounding.)
Treasury Board and Finance, Government of Alberta
August, 2020
2020–21 First Quarter Fiscal Update and Economic Statement
Additional copies of this report may be obtained by visiting our website at:
www.alberta.ca/budget-documents.aspx
| | |
2 | | 2020–21 First Quarter Fiscal Update and Economic Statement |
2020-21 First Quarter Fiscal Plan Highlights
Alberta’s Budget 2020 was presented on February 27, 2020, just prior to the March 11 World Health Organization declaration of a global pandemic. The government took swift action by adding $500 million to the budget and the Appropriation Act, 2020 for Ministry of Health voted expense. The impact of COVID-19 has been significant globally, shuttering economies, preventing travel and reducing energy demand. The cumulative impacts have seriously affected the government’s fiscal situation.
A deficit of $24.2 billion is forecast for 2020-21, $16.8 billion higher than estimated in Budget 2020. This is due to a severe decline in revenue, coupled with increased expense, mainly from temporary initiatives to address
COVID-19, and support Albertans, Alberta businesses and the economy.
Total revenue of $38.4 billion is forecast, down $11.5 billion from budget. Almost 80 per cent of the drop is from lower income taxes, resource revenue and net income from gaming.
Total expense of $62.6 billion is forecast, an increase of $5.3 billion from budget. Operating expense is $2.6 billion higher, primarily from $2.5 billion in COVID-19 / Recovery Plan initiatives. Capital grants are $716 million higher, with $638 million for municipal and other economic stimulus. Inventory consumption is $672 million higher, of which $632 million is for COVID-19-related personal protective equipment. A $1,250 million provision for divestment of crude-by-rail contracts
is being added to expense in 2020-21, as not all of the contracts were assigned last year as was planned.
The Capital Plan in 2020-21 is forecast at $8.4 billion, $1.4 billion more than budget, mainly reflecting capital maintenance and renewal investment accelerated from future years, and increased grants to municipalities. Both increases were undertaken for economic stimulus purposes. A $1.5 billion investment in the Keystone XL pipeline egress infrastructure brings total support to almost $10 billion.
Taxpayer-supported debt is forecast at $99.6 billion on March 31, 2021, an increase of $25.4 billion from 2020, with $19.8 billion for the Fiscal Plan and another $5.6 billion for the Capital Plan.
| | | | | | | | | | | | | | | | |
| Fiscal Plan Summary | | Fiscal Year | | Change | |
(millions of dollars) | | | 2019-20 | | | | 2020-21 | | | | from | |
| Income Statement | | Actual | | Budgeta | | | Forecast | | | Budget | |
Revenue | | | | | | | | | | | | | | | | |
Income tax revenue | | | 15,351 | | | | 17,105 | | | | 12,858 | | | | (4,247 | ) |
Other tax revenue | | | 5,747 | | | | 5,782 | | | | 5,242 | | | | (540 | ) |
Non-renewable resource revenue | | | 5,937 | | | | 5,090 | | | | 1,224 | | | | (3,866 | ) |
Other revenue | | | 19,189 | | | | 22,019 | | | | 19,125 | | | | (2,894) | |
Total Revenue | | | 46,224 | | | | 49,996 | | | | 38,449 | | | | (11,547) | |
Expense | | | | | | | | | | | | | | | | |
Operating expense | | | 48,616 | | | | 47,809 | | | | 47,896 | | | | 87 | |
Capital grants | | | 1,696 | | | | 2,302 | | | | 2,380 | | | | 78 | |
Amortization / inventory consumption / loss on disposals | | | 3,720 | | | | 3,857 | | | | 3,904 | | | | 47 | |
Taxpayer-supported debt servicing costs | | | 1,783 | | | | 2,066 | | | | 2,220 | | | | 154 | |
Self-supported debt servicing costs | | | 452 | | | | 439 | | | | 306 | | | | (133 | ) |
Pension provisions | | | (334) | | | | (415) | | | | (389) | | | | 26 | |
Expense (excl. COVID-19 / Recov. Plan, contingency, crude-by-rail) | | | 55,936 | | | | 56,056 | | | | 56,317 | | | | 261 | |
COVID-19 / Recovery Plan: | | | | | | | | | | | | | | | | |
Operating expense | | | 218 | | | | 500 | | | | 3,021 | | | | 2,521 | |
Capital grants (municipal) | | | - | | | | - | | | | 638 | | | | 638 | |
Inventory consumption (PPE) | | | - | | | | - | | | | 632 | | | | 632 | |
Disaster and emergency assistance - allocated | | | 1,356 | | | | - | | | | 491 | | | | 491 | |
Contingency / disaster and emergency assistance - unallocated | | | - | | | | 750 | | | | 259 | | | | (491 | ) |
Crude-by-rail provision | | | 866 | | | | - | | | | 1,250 | | | | 1,250 | |
Total Expense | | | 58,376 | | | | 57,306 | | | | 62,608 | | | | 5,302 | |
Surplus / (Deficit) | | | (12,152 | ) | | | (7,310 | ) | | | (24,159 | ) | | | (16,849 | ) |
| Capital Plan | | | | | | | | | | | | | | | | |
Capital grants | | | 1,696 | | | | 2,302 | | | | 3,018 | | | | 716 | |
Capital investment | | | 3,868 | | | | 4,687 | | | | 5,401 | | | | 714 | |
Total Capital Plan | | | 5,564 | | | | 6,989 | | | | 8,420 | | | | 1,431 | |
| a | Budget 2020-21 numbers have been restated to reverse reporting C-FER Technologies as a government business enterprise (GBE), adding $17 million to expense ($16 million operating, $1 million amortization) and $17 million to revenue ($16 million miscellaneous, $1 million GBE) of Economic Development, Trade and Tourism. Budget 2020 was also adjusted to add $500 million to Health Ministry voted expense, prior to Royal Assent, for the COVID-19 pandemic. |
| | |
| 2020–21 First Quarter Fiscal Update and Economic Statement | | 3 |
Revenue and Expense Highlights
Total Revenue is forecast to be $38.4 billion, $11.5 billion lower than estimated in Budget 2020.
| • | | Resource revenue has dropped drastically to $1.2 billion, a level not seen since the early 1970s and $3.9 billion lower than budget. The global shut-down has cratered oil demand and prices, even as global producers have continued to constrain production to re-balance supply and demand. Alberta’s production was already limited due to the lack of egress capacity, and the impact of COVID-19 on world energy demand has further pummeled Alberta’s oil patch. Many oilsands projects are generating minimum or no positive returns this year, reducing significantly any royalty payable under the revenue minus cost royalty regime. Royalty rates also decrease with lower oil prices. |
| • | | The West Texas Intermediate (WTI) oil price forecast is US$35.60 per barrel (/ bbl) for 2020-21. This is down more than $22/bbl from budget. While prices have averaged US$31 for the first four months April 1 to July 31, significant uncertainty continues. The light-heavy oil price differential has been very volatile, and is forecast to average US$12.50/bbl for the fiscal year, US$6.60 narrower than budget. A US-Canadian dollar exchange rate of 73 US¢/Cdn$ is forecast, 3.5 cents below budget. |
| • | | Bitumen royalties of $686 million are forecast, $2.5 billion lower than budget, while crude oil royalties are forecast to be $316 million, down $819 million. In addition to the price decline, overall oil production is expected to drop by about 13 per cent. Natural gas and by-products royalties of $77 million are forecast, $352 million less than budget. The forecast for the Alberta Reference Price has increased 20 cents from budget, and while the lower exchange rate also supports natural gas revenue, royalties from natural gas by-products follow oil prices, and are therefore materially lower. Production is also estimated to be 6 per cent lower than budget. |
| • | | Personal income tax revenue is forecast at $10.7 billion, a $1.9 billion decrease from budget, while corporate income tax of $2.1 billion is $2.4 billion lower. |
| | | Household incomes and corporate profits have deteriorated due to the COVID-19 pandemic. |
| • | | Other tax revenue is forecast at $5.2 billion, a $540 million decline from budget. Lower consumption has resulted in decreases of $296 million to fuel tax, and $125 million to the tobacco tax and tourism levy. Reversing the budgeted education property tax increase reduces revenue by a further $87 million. |
| • | | Federal transfers of $10 billion are forecast, $846 million higher than estimated in Budget 2020. Increases include $420 million for the Site Rehabilitation Program, a $303 million portion of the Safe Restart Agreement and $102 million from the Low Carbon Economy Leadership Fund. Municipal infrastructure transfers have been re-profiled from 2019-20, and agriculture assistance has increased. |
| • | | Investment income is forecast at $1.5 billion, $1.1 billion lower than budget, primarily due to the initial shock to global financial markets of COVID-19. Losses from 2019-20 and early 2020-21 are expected to be realized this year. The asset base on which to earn income has also declined. |
| • | | Total revenue from other sources is forecast at $7.6 billion, $2.7 billion lower than budget. Significant declines include: a $0.9 billion drop in gaming revenue as casinos closed temporarily; $0.5 billion in ATB Financial net income, primarily due to increased loan loss provisions; $150 million higher losses from Alberta Petroleum Marketing Commission; $111 million in post-secondary tuition; $113 million from waiving energy industry levies for six months; $348 million decrease in SUCH sector sales and donations; $168 million lower AIMCo investment management fees from delays in adding assets; a drop of $123 million in TIER compliance payments. |
Total Expense of $62.6 billion is forecast, $5.3 billion higher than budget.
| • | | Operating expense (excluding COVID-19 / Recovery Plan) is $47.9 billion, $87 million higher than Budget 2020. Increases include $301 million in Health, mainly due to delaying implementation of budgeted |
| | | Alberta Health Services savings and increased seniors’ drug costs, and another $180 million in post-secondary institution expense. These are largely offset by various reductions, including $152 million in Treasury Board and Finance primarily from investment management fees, $132 million in Education as K-12 in-person classes were cancelled due to COVID-19, and $99 million in Indigenous Relations from First Nation casino closures. |
| • | | COVID-19 / Recovery Plan operating expense of $3 billion is forecast. More details are below. |
| • | | Budget 2020 included a disaster contingency of $750 million, of which $491 million has been allocated as follows: $230 million for wildfire fighting, $103 million in agriculture support and $158 million for municipal disaster recovery programs. |
| • | | Capital grants of $3 billion are forecast, up $716 million from budget, due primarily to re-profiling federal funds from 2019-20, and to the $500 million for municipal economic stimulus. |
| • | | Inventory consumption expense has increased $672 million, reflecting the use of personal protective equipment and provision of seniors’ drugs. |
| • | | Debt servicing costs (DSC) have increased by $21 million. Self-supported debt DSC has decreased by $133 million, almost entirely from Alberta Capital Finance Authority. |
| • | | DSC on taxpayer-supported debt is a net $154 million higher. While borrowing requirements for 2020-21 have increased by about $23 billion relative to Budget 2020, a substantial amount of borrowing undertaken late in 2019-20 and so far this year has been executed at significantly lower rates than was estimated in the budget. |
| • | | Unfunded pension liabilities (deficiency between net present value of plan assets, income and contributions and NPV of expected payments, over the life of the plan) are forecast to decrease by $389 million, $26 million less than estimated. A decrease in liabilities is reported as negative expense. |
| • | | A $1.5 billion provision was estimated in Budget 2019 for divestment of crude-by-rail (CBR) contracts in |
| | |
| 4 | | 2020–21 First Quarter Fiscal Update and Economic Statement |
2019-20. Not all of the contracts were assigned, and some costs continue, therefore $866 million was reported in expense for 2019-20.
| • | | The CBR was a gamble by the previous government that saw taxpayers buying 120 thousand barrels of oil a day, leasing rail cars and paying for space on lines, setting up terminals and storage facilities, and hopefully selling the oil in various North American destinations for a price that exceeded all of these costs. The only way this made money was if there was an uplift to royalty and tax revenue that would not have otherwise occurred. It originally cost a net $1.8 billion: $3.7 billion cost for rail contracts plus $6.8 billion to buy oil, less hoped-for revenue from selling the oil of $8.8 billion. However, under actual market conditions, revenue would have declined. |
| • | | Since rail transportation costs about US$8-10/bbl more than pipelines, CBR required the light-heavy oil price differential to remain wide for the 3-year term of the program. The differentials were expected to average over US$20/bbl, but the differential ended up just under US$15/bbl in 2019-20 and is now estimated at $12.50 for 2020-21. |
| • | | Current estimates are that CBR revenue would be $0.4-$0.7 billion lower, and the net cost $2.3-$2.7 billion instead of $1.8 billion. This is what the government is working to extricate Albertans from, at a revised estimated cost of $2.1 billion. This results in a $1,250 million provision in 2020-21. |
COVID-19 / Alberta’s Recovery Plan Initiatives
Since March 2020, Alberta has been hit by the largest public health crisis in a century, the biggest global economic crisis since the 1930s and a collapse in oil prices. This was on top of the ongoing economic weakness since 2015, and struggles from insufficient pipeline capacity and the associated impacts on prices Alberta oil producers receive.
The Alberta government responded by amending Budget 2020 to provide an additional $500 million in health care funding, and closed schools, universities,
colleges and some businesses. However, a wide-scale shutdown was averted. At the height of the pandemic, 85 per cent of Alberta’s businesses representing 96 per cent of the economy remained open.
An Economic Recovery Council of prominent business, labour and public service leaders was formed to help guide development of Alberta’s Recovery Plan. The Plan was released on June 29.
Protecting Albertans from the health and financial impacts of COVID-19 continues to be a priority for the government. Various measures to protect jobs, support individuals, families and businesses, and support economic recovery and diversification have been announced. Not all of these directly impact the government’s fiscal situation, as many are temporary, are funded from cash reserves or federal transfers, or accelerate already-planned spending.
Direct revenue measures total approximately $0.8 billion, while spending initiatives total $6.8 billion. Of the spending initiatives, $1.4 billion is funded from federal transfer revenue, $0.5 billion is funded by cash reserves (primarily from the TIER Fund balance), and $0.9 billion is from accelerating already-budgeted Capital Maintenance and Renewal projects from future years.
Operating expense COVID-19 initatives total $3.9 billion, with over $0.2 billion in 2019-20, $3 billion in 2020-21 and another $0.6 billion in 2021-22 (primarily site rehabilitation work):
| • | | $0.8 billion for health care, including support for long-term care homes and those working there, mental health support for those in need, and the COVID-19 testing program. |
| • | | $0.2 billion for emergency isolation payments, supports to community organizations, protecting vulnerable seniors, school nutrition, caregivers’ supports and food banks. |
| • | | $1.7 billion in supports to businesses, including waiving WCB premiums and providing re-launch grants to small and medium-sized business, rent relief, helping daycare operators re-open, support to the agriculture sector, and |
| | site rehabilitation funding from the federal government. |
| • | | $0.7 billion in municipal support for emergency operations centers and Safe Restart Agreement federal funding. |
| • | | $0.5 billion to accelerate environmental programs under the TIER Fund and federal Low Carbon Economy Leadership Fund. |
Revenue initiatives total $0.8 billion, with $0.6 billion in 2020-21 and the remaining $0.2 billion in 2021-22.
| • | | Accelerating the final two years of the Job Creation Tax Cut, moving to 8 per cent on July 1, 2020 instead of one percentage point reductions in each January of 2021 and 2022, makes Alberta one of the most tax competitive jurisdictions in North America for businesses. Acceleration of the corporate income tax rate reduction reduces government revenue by approximately $0.2-$0.3 billion. |
| • | | Other measures include reversing the education property tax requisition increase, waiving Alberta Energy Regulator levies for six months, providing tourism levy relief and suspending hospital parking fees. |
Purchasing personal protective equipment for health care workers and the public has required $0.6 billion (inventory acquisition / consumption).
Capital Plan support of $2.3 billion:
| • | | $0.9 billion in Capital Maintenance and Renewal accelerated from future years. |
| • | | $0.7 billion in municipal support. |
| • | | $0.7 billion in strategic projects aimed at boosting economic prosperity. |
Other support totals $5.3 billion, primarily with no direct immediate impact on the fiscal plan. This includes deferrals of revenue or receivables (e.g. education property tax, registry fees, student loans, corporate income tax, Workers’ Compensation Board premiums, utility payments, timber royalties), loans to the Orphan Well Association, an additional $175 million investment in the Alberta Enterprise Corporation, and a $1.5 billion investment in the Keystone XL pipeline.
| | |
| 2020–21 First Quarter Fiscal Update and Economic Statement | | 5 |
Assets and Liabilities
Financial Assets of $75.2 billion are forecast for March 31, 2021, a decrease of $1.2 billion from 2020.
| • | | Heritage Fund, endowment and other funds are up a net $207 million. Heritage Fund inflation-proofing is $195 million based on 1.2 per cent Alberta CPI, while Alberta Enterprise Corporation is receiving $75 million. These are offset by endowment fund decreases of $63 million, as income is less than what is being withdrawn. |
| • | | Assets of the Agriculture Financial Services Corporation (AFSC) and Alberta Capital Finance Authority (ACFA) are increasing $221 million: estimated cash (equity) of $200 million is being recovered from ACFA as it is being dissolved this year, while AFSC assets are increasing by $421 million. |
| • | | Equity in commercial enterprises is a net $586 million lower, due mainly to the ATB Financial loss of $250 million and the $414 million loss of Alberta Petroleum Marketing Commission (APMC). The $1.5 billion Keystone XL pipeline investment in APMC |
| | assets is offset by an equivalent increase in APMC liabilities. |
| • | | Other financial assets are decreasing a net $1.1 billion. |
Liabilities are forecast at $142 billion on March 31, 2021, $25.5 billion higher than on March 31, 2020.
Taxpayer-supported debt is estimated at $99.6 billion, $25.4 billion higher than 2020 and $23 billion more than anticipated in Budget 2020.
| • | | Liabilities for capital projects are up $5.6 billion from March 31, 2020, due to $5.5 billion in direct borrowing, $107 million in alternative financing, less $74 million in principal repayments on completed private-public partnership projects. |
| • | | Direct borrowing for the Fiscal Plan and other operational needs is now forecast to be $19.9 billion in 2020-21. |
| • | | AFSC and ACFA liabilities are increasing a net $221million, mirroring the changes to their assets. |
| • | | Other liabilities are $0.2 billion higher, while government obligations for |
| | pension plan liabilities have decreased by $0.4 billion. |
Net financial debt (financial assets less liabilities) on March 31, 2021 is estimated at $66.9 billion, an increase of $26.7 billion, reflecting the greater borrowing required to deal with the economic and fiscal consequences of the COVID-19 pandemic. The net debt to GDP (2020 forecast) ratio is 22 per cent.
Capital and other non-financial assets of $54.1 billion are forecast for March 31, 2021, a $2.6 billion net increase from March 31, 2020. This comprises $5.4 billion in added capital assets less $2.7 billion in amortization; addition of $1.8 billion in inventory assets (e.g. personal protective equipment, vaccines, drugs) less consumption of $1.8 billion; and a net decrease of $0.1 billion in deferred capital contributions.
Net Assets of negative $12.7 billion are forecast for March 31, 2021, a $24.2 billion decrease from 2020, reflecting the 2020-21 deficit.
| | | | | | | | | | | | | | | | |
| Balance Sheet Summary | | At March 31 | | | Change | |
| (millions of dollars) | | 2020 | | | 2021 | | | from | |
| | | Actual | | | Budgeta | | | Forecast | | | 2020 | |
Financial Assets | | | | | | | | | | | | | | | | |
Heritage Fund, endowment and other funds | | | 20,670 | | | | 21,118 | | | | 20,877 | | | | 207 | |
Self-supporting lending organizations | | | 22,075 | | | | 23,046 | | | | 22,296 | | | | 221 | |
Equity in commercial enterprises | | | 1,105 | | | | 1,258 | | | | 519 | | | | (586 | ) |
Other financial assets (includes SUCH sector / cash reserves) | | | 32,531 | | | | 32,258 | | | | 31,466 | | | | (1,065 | ) |
Total Financial Assets | | | 76,381 | | | | 77,680 | | | | 75,158 | | | | (1,223 | ) |
Liabilities | | | | | | | | | | | | | | | | |
Taxpayer-supported debt: | | | | | | | | | | | | | | | | |
Liabilities for capital projects (direct borrowing / public-private partnerships - P3s) | | | 37,207 | | | | 41,461 | | | | 42,785 | | | | 5,578 | |
Debt issued to reduce pre-1992 Teachers’ Pension Plan unfunded liabiity | | | 594 | | | | 594 | | | | 594 | | | | - | |
Direct borrowing for the Fiscal Plan | | | 33,608 | | | | 38,884 | | | | 52,201 | | | | 18,593 | |
Other debt | | | 2,733 | | | | 2,733 | | | | 4,000 | | | | 1,267 | |
Total taxpayer-supported debt | | | 74,142 | | | | 83,672 | | | | 99,580 | | | | 25,438 | |
Self-supporting lending organization debt: | | | | | | | | | | | | | | | | |
Alberta Capital Finance Authority | | | 15,640 | | | | 15,829 | | | | 15,440 | | | | (200 | ) |
Agriculture Financial Services Corporation | | | 2,426 | | | | 2,776 | | | | 2,847 | | | | 421 | |
Total taxpayer and self-supported debt | | | 92,208 | | | | 102,277 | | | | 117,867 | | | | 25,659 | |
Other liabilities (includes SUCH sector) | | | 15,399 | | | | 15,492 | | | | 15,637 | | | | 238 | |
Pension liabilities | | | 8,918 | | | | 8,503 | | | | 8,529 | | | | (389 | ) |
Total Liabilities | | | 116,525 | | | | 126,272 | | | | 142,033 | | | | 25,508 | |
Net Financial Assets / (Debt) | | | (40,144 | ) | | | (48,592 | ) | | | (66,875 | ) | | | (26,731 | ) |
Capital / other non-financial assets | | | 54,801 | | | | 56,068 | | | | 57,477 | | | | 2,676 | |
Spent deferred capital contributions | | | (3,231 | ) | | | (3,360 | ) | | | (3,335 | ) | | | (104 | ) |
Net Assets | | | 11,426 | | | | 4,116 | | | | (12,733 | ) | | | (24,159 | ) |
Change in Net Assets (before adjustments) | | | (12,152 | ) | | | (7,310 | ) | | | (24,159 | ) | | | | |
a Budget numbers have been restated to reflect 2019-20 Actual results. | | | | | | | | | | | | | | | | |
| | |
| 6 | | 2020–21 First Quarter Fiscal Update and Economic Statement |
| | | | | | | | | | | | | | | | |
Revenue | | | | | | | | | | | | | | | | |
| (millions of dollars) | | Fiscal Year | | | Change | |
| | | 2019-20 | | | 2020-21 | | | from | |
| | | Actual | | | Budget | | | Forecast | | | Budget | |
Income Taxes | | | | | | | | | | | | | | | | |
Personal income tax | | | 11,244 | | | | 12,566 | | | | 10,712 | | | | (1,854 | ) |
Corporate income tax | | | 4,107 | | | | 4,539 | | | | 2,146 | | | | (2,393 | ) |
| | | 15,351 | | | | 17,105 | | | | 12,858 | | | | (4,247 | ) |
Other Taxes | | | | | | | | | | | | | | | | |
Education property tax | | | 2,475 | | | | 2,559 | | | | 2,472 | | | | (87 | ) |
Fuel tax | | | 1,376 | | | | 1,423 | | | | 1,127 | | | | (296 | ) |
Tobacco / vaping tax | | | 805 | | | | 864 | | | | 796 | | | | (68 | ) |
Cannabis tax | | | 76 | | | | 74 | | | | 79 | | | | 5 | |
Insurance taxes | | | 662 | | | | 703 | | | | 683 | | | | (20 | ) |
Carbon tax | | | 189 | | | | - | | | | - | | | | - | |
Tourism levy | | | 89 | | | | 92 | | | | 35 | | | | (57 | ) |
Freehold mineral rights tax | | | 75 | | | | 67 | | | | 50 | | | | (17 | ) |
| | | 5,747 | | | | 5,782 | | | | 5,242 | | | | (540 | ) |
Non-Renewable Resource Revenue | | | | | | | | | | | | | | | | |
Bitumen royalty | | | 4,089 | | | | 3,211 | | | | 686 | | | | (2,525 | ) |
Crude oil royalty | | | 1,175 | | | | 1,135 | | | | 316 | | | | (819 | ) |
Natural gas and by-products royalty | | | 371 | | | | 429 | | | | 77 | | | | (352 | ) |
Bonuses and sales of Crown leases | | | 120 | | | | 177 | | | | 22 | | | | (155 | ) |
Rentals and fees / coal royalty | | | 182 | | | | 137 | | | | 123 | | | | (14 | ) |
| | | 5,937 | | | | 5,090 | | | | 1,224 | | | | (3,866 | ) |
Transfers from Government of Canada | | | | | | | | | | | | | | | | |
Canada Health Transfer | | | 4,678 | | | | 4,857 | | | | 4,841 | | | | (16 | ) |
Canada Social Transfer | | | 1,694 | | | | 1,755 | | | | 1,753 | | | | (2 | ) |
Direct transfers to SUCH sector / Alberta Innovates Corp. | | | 510 | | | | 590 | | | | 560 | | | | (30 | ) |
Agriculture support programs | | | 362 | | | | 286 | | | | 312 | | | | 26 | |
Infrastructure support | | | 679 | | | | 828 | | | | 862 | | | | 34 | |
Labour market agreements | | | 277 | | | | 299 | | | | 299 | | | | - | |
Other | | | 872 | | | | 495 | | | | 1,329 | | | | 834 | |
| | | 9,072 | | | | 9,110 | | | | 9,956 | | | | 846 | |
Investment Income | | | | | | | | | | | | | | | | |
Alberta Heritage Savings Trust Fund | | | 1,471 | | | | 1,177 | | | | 682 | | | | (495 | ) |
Endowment funds | | | 308 | | | | 286 | | | | 107 | | | | (179 | ) |
Alberta Capital Finance Authority | | | 366 | | | | 485 | | | | 208 | | | | (277 | ) |
Agriculture Financial Services Corporation | | | 158 | | | | 157 | | | | 157 | | | | - | |
Other (includes SUCH sector) | | | 526 | | | | 525 | | | | 390 | | | | (135 | ) |
| | | 2,828 | | | | 2,630 | | | | 1,544 | | | | (1,086 | ) |
Net Income from Government Business Enterprises | | | | | | | | | | | | | | | | |
AGLC – Gaming / lottery | | | 1,331 | | | | 1,396 | | | | 496 | | | | (900 | ) |
AGLC – Liquor | | | 845 | | | | 844 | | | | 842 | | | | (2 | ) |
AGLC – Cannabis | | | (14 | ) | | | (36 | ) | | | (30 | ) | | | 6 | |
ATB Financial | | | 104 | | | | 260 | | | | (250 | ) | | | (510 | ) |
Balancing Pool | | | 161 | | | | 135 | | | | 62 | | | | (73 | ) |
Other – CUDGCo / APMC | | | (2,652 | ) | | | (241 | ) | | | (400 | ) | | | (159 | ) |
| | | (225 | ) | | | 2,358 | | | | 720 | | | | (1,638 | ) |
Premiums, Fees and Licences | | | | | | | | | | | | | | | | |
Post-secondary institution tuition fees | | | 1,311 | | | | 1,460 | | | | 1,349 | | | | (111 | ) |
Health / school board fees and charges | | | 703 | | | | 717 | | | | 702 | | | | (15 | ) |
Motor vehicle licences | | | 518 | | | | 546 | | | | 510 | | | | (36 | ) |
Crop, hail and livestock insurance premiums | | | 321 | | | | 339 | | | | 339 | | | | - | |
Energy industry levies | | | 325 | | | | 328 | | | | 215 | | | | (113 | ) |
Other (includes land titles, land and grazing, health benefits premiums) | | | 751 | | | | 804 | | | | 754 | | | | (50 | ) |
| | | 3,929 | | | | 4,194 | | | | 3,869 | | | | (325 | ) |
Other | | | | | | | | | | | | | | | | |
SUCH sector sales, rentals and services | | | 1,036 | | | | 1,088 | | | | 841 | | | | (247 | ) |
SUCH sector fundraising, donations and gifts | | | 724 | | | | 748 | | | | 646 | | | | (102 | ) |
AIMCo investment management charges | | | 385 | | | | 536 | | | | 368 | | | | (168 | ) |
Fines and penalties | | | 200 | | | | 267 | | | | 242 | | | | (25 | ) |
Refunds of expense | | | 359 | | | | 195 | | | | 195 | | | | - | |
Technology Innovation and Emissions Reduction Fund | | | 403 | | | | 421 | | | | 298 | | | | (123 | ) |
Miscellaneous | | | 477 | | | | 472 | | | | 446 | | | | (26 | ) |
| | | 3,585 | | | | 3,727 | | | | 3,036 | | | | (691 | ) |
Total Revenue | | | 46,224 | | | | 49,996 | | | | 38,449 | | | | (11,547 | ) |
| | |
| 2020–21 First Quarter Fiscal Update and Economic Statement | | 7 |
| | | | | | | | | | | | | | | | |
Operating Expense by Ministry | | | | | | | | | | | | | | | | |
| (millions of dollars) | | Fiscal Year | | | Change | |
| | | 2019-20 | | | 2020-21 | | | from | |
| | | Actual | | | Budget | | | Forecast | | | Budget | |
Advanced Education | | | 5,478 | | | | 5,126 | | | | 5,305 | | | | 179 | |
Agriculture and Forestry | | | 868 | | | | 833 | | | | 827 | | | | (6 | ) |
Children’s Services | | | 1,548 | | | | 1,636 | | | | 1,636 | | | | - | |
Community and Social Services | | | 3,965 | | | | 3,910 | | | | 3,909 | | | | (1 | ) |
Culture, Multiculturalism and Status of Women | | | 205 | | | | 185 | | | | 173 | | | | (12 | ) |
Economic Development, Trade and Tourism | | | 282 | | | | 298 | | | | 296 | | | | (2 | ) |
Education | | | 8,134 | | | | 8,322 | | | | 8,190 | | | | (132 | ) |
Energy | | | 597 | | | | 506 | | | | 506 | | | | - | |
Environment and Parks | | | 558 | | | | 532 | | | | 508 | | | | (24 | ) |
Executive Council | | | 18 | | | | 17 | | | | 17 | | | | - | |
Health | | | 20,870 | | | | 20,616 | | | | 20,917 | | | | 301 | |
Indigenous Relations | | | 162 | | | | 203 | | | | 104 | | | | (99 | ) |
Infrastructure | | | 457 | | | | 472 | | | | 470 | | | | (2 | ) |
Justice and Solicitor General | | | 1,442 | | | | 1,443 | | | | 1,443 | | | | - | |
Labour and Immigration | | | 196 | | | | 209 | | | | 204 | | | | (5 | ) |
Municipal Affairs | | | 244 | | | | 241 | | | | 241 | | | | - | |
Seniors and Housing | | | 634 | | | | 637 | | | | 637 | | | | - | |
Service Alberta | | | 494 | | | | 482 | | | | 479 | | | | (3 | ) |
Transportation | | | 425 | | | | 384 | | | | 387 | | | | 3 | |
Treasury Board and Finance | | | 1,903 | | | | 1,693 | | | | 1,541 | | | | (152 | ) |
Legislative Assembly | | | 140 | | | | 126 | | | | 126 | | | | - | |
In-year savings | | | - | | | | (59 | ) | | | (18 | ) | | | 41 | |
Operating expense before COVID-19 / Recovery Plan operating expense | | | 48,616 | | | | 47,809 | | | | 47,896 | | | | 87 | |
COVID-19 / Recovery Plan operating expense | | | | | | | | | | | | | | | | |
Community and Social Services | | | 60 | | | | - | | | | 48 | | | | 48 | |
Economic Development, Trade and Tourism | | | - | | | | - | | | | 316 | | | | 316 | |
Energy | | | - | | | | - | | | | 420 | | | | 420 | |
Environment and Parks | | | - | | | | - | | | | 367 | | | | 367 | |
Health | | | 25 | | | | 500 | | | | 769 | | | | 269 | |
Labour and Immigration | | | 114 | | | | - | | | | 273 | | | | 273 | |
Municipal Affairs | | | - | | | | - | | | | 658 | | | | 658 | |
Othera | | | 19 | | | | - | | | | 170 | | | | 170 | |
Total COVID-19 / Recovery Plan operating expense | | | 218 | | | | 500 | | | | 3,021 | | | | 2,521 | |
Total Operating Expense | | | 48,834 | | | | 48,309 | | | | 50,917 | | | | 2,608 | |
|
a Includes Advanced Ed.; Agric. & Forestry; Culture, Multiculturalism & Status of Women; Education; Seniors & Housing; Transportation; Treas. Bd. & Finance. | |
| | | | |
Debt Servicing Costs | | | | | | | | | | | | | | | | |
| (millions of dollars) | | Fiscal Year | | | Change | |
| | | 2019-20 | | | 2020-21 | | | from | |
| | | Actual | | | Budget | | | Forecast | | | Budget | |
Taxpayer-supported general debt servicing costs | | | | | | | | | | | | | | | | |
Education – school boards | | | 11 | | | | 9 | | | | 9 | | | | - | |
Seniors and Housing – Alberta Social Housing Corporation | | | 2 | | | | - | | | | - | | | | - | |
Treasury Board and Finance | | | 799 | | | | 710 | | | | 1,035 | | | | 325 | |
Total | | | 812 | | | | 719 | | | | 1,044 | | | | 325 | |
Taxpayer-supported Capital Plan debt servicing costs | | | | | | | | | | | | | | | | |
Education – Alberta Schools Alternative Procurement P3s | | | 28 | | | | 27 | | | | 27 | | | | - | |
Transportation – ring road P3s | | | 90 | | | | 95 | | | | 95 | | | | - | |
Treasury Board and Finance – direct borrowing | | | 853 | | | | 1,225 | | | | 1,054 | | | | (171 | ) |
Total | | | 971 | | | | 1,347 | | | | 1,176 | | | | (171 | ) |
Total taxpayer-supported debt servicing costs | | | 1,783 | | | | 2,066 | | | | 2,220 | | | | 154 | |
Self-supported debt servicing costs | | | | | | | | | | | | | | | | |
Treasury Board and Finance – Ab. Capital Finance Authority | | | 384 | | | | 367 | | | | 236 | | | | (131 | ) |
Treasury Board and Finance – Ag. Financial Services Corp. | | | 68 | | | | 72 | | | | 70 | | | | (2 | ) |
Total self-supported debt servicing costs | | | 452 | | | | 439 | | | | 306 | | | | (133 | ) |
Total Debt Servicing Costs | | | 2,235 | | | | 2,505 | | | | 2,526 | | | | 21 | |
| | |
| 8 | | 2020–21 First Quarter Fiscal Update and Economic Statement |
Contingency / Disaster and Emergency Assistance Expense
| | | | | | | | | | | | | | | | |
(millions of dollars) | | | | | | | | | | | | | | | | |
| | | Fiscal Year | | | Change | |
| | | 2019-20 | | | 2020-21 | | | from | |
| | | Actual | | | Budget | | | Forecast | | | Budget | |
Agriculture and Forestry – wildfires | | | 461 | | | | - | | | | 230 | | | | 230 | |
Agriculture and Forestry – agriculture indemnities / income support | | | 748 | | | | - | | | | 103 | | | | 103 | |
Municipal Affairs – floods | | | 147 | | | | - | | | | 158 | | | | 158 | |
Unallocated | | | - | | | | 750 | | | | 259 | | | | (491 | ) |
Total Disaster / Emergency Assistance | | | 1,356 | | | | 750 | | | | 750 | | | | - | |
| | | | | | | | | | | | | | | | |
| Capital Amortization Expense | | Fiscal Year | | | Change | |
(millions of dollars) | | | 2019-20 | | | | 2020-21 | | | | from | |
| | | Actual | | | Budget | | | Forecast | | | Budget | |
Advanced Education | | | 558 | | | | 555 | | | | 555 | | | | - | |
Agriculture and Forestry | | | 23 | | | | 25 | | | | 25 | | | | - | |
Culture, Multiculturalism and Status of Women | | | 8 | | | | 7 | | | | 7 | | | | - | |
Economic Development, Trade and Toursim | | | 7 | | | | 8 | | | | 8 | | | | - | |
Education | | | 433 | | | | 431 | | | | 431 | | | | - | |
Energy | | | 18 | | | | 18 | | | | 18 | | | | - | |
Environment and Parks | | | 64 | | | | 85 | | | | 85 | | | | - | |
Health | | | 557 | | | | 605 | | | | 605 | | | | - | |
Infrastructure | | | 123 | | | | 135 | | | | 135 | | | | - | |
Justice and Solicitor General | | | 2 | | | | 6 | | | | 6 | | | | - | |
Municipal Affairs | | | 27 | | | | 30 | | | | 30 | | | | - | |
Seniors and Housing | | | 39 | | | | 44 | | | | 44 | | | | - | |
Service Alberta | | | 80 | | | | 95 | | | | 95 | | | | - | |
Transportation | | | 611 | | | | 638 | | | | 646 | | | | 8 | |
Treasury Board and Finance | | | 24 | | | | 29 | | | | 26 | | | | (3 | ) |
Other a | | | 2 | | | | 5 | | | | 5 | | | | - | |
Total Amortization Expense | | | 2,578 | | | | 2,716 | | | | 2,721 | | | | 5 | |
| a | Includes Community and Social Services; Labour and Immigration; Legislative Assembly. |
| | | | | | | | | | | | | | | | |
Borrowing Requirements | | | | | | | | | | | | | | | | |
(millions of dollars) | | | | | | | | | | | | | | | | |
| | | Fiscal Year | | | Change | |
| | | 2019-20 | | | 2020-21 | | | from | |
| | | Actual | | | Budget | | | Forecast | | | Budget | |
Government | | | 13,555 | | | | 12,098 | | | | 24,003 | | | | 11,905 | |
Provincial corporations | | | 495 | | | | 2,616 | | | | 3,075 | | | | 459 | |
Government business enterprises | | | 990 | | | | 1,077 | | | | 1,475 | | | | 398 | |
Total borrowing requirements | | | 15,040 | | | | 15,791 | | | | 28,553 | | | | 12,762 | |
| | | | |
Borrowing Sources | | | | | | | | | | | | | | | | |
(millions of dollars) | | | | | | | | | | | | | | | | |
| | | Fiscal Year | | | Change | |
| | | 2019-20 | | | 2020-21 | | | from | |
| | | Actual | | | Budget | | | Forecast | | | Budget | |
Money market (net change) | | | 5,711 | | | | (1,500 | ) | | | (1,500 | ) | | | - | |
Public-private partnerships (P3s) | | | 159 | | | | 151 | | | | 107 | | | | (44 | ) |
Term debt | | | 9,170 | | | | 17,140 | | | | 29,946 | | | | 12,806 | |
Total borrowing sources | | | 15,040 | | | | 15,791 | | | | 28,553 | | | | 12,762 | |
| | |
| 2020–21 First Quarter Fiscal Update and Economic Statement | | 9 |
| | | | | | | | | | | | | | | | |
Cash Adjustments / Borrowing Requirements | | | | | | | | | | | | | | | | |
| (millions of dollars) | | Fiscal Year | | | Change | |
| | | 2019-20 | | | 2020-21 | | | from | |
| | | Actual | | | Budget | | | Forecast | | | Budget | |
| | | | |
Balance at Start of Year | | | 6,342 | | | | 2,500 | | | | 9,405 | | | | 6,905 | |
| | | | |
Surplus / (Deficit) | | | (12,152 | ) | | | (7,310 | ) | | | (24,159 | ) | | | (16,849 | ) |
| | | | |
Cash Adjustments (negative = cash requirement; positive = cash source) | | | | | | | | | | | | | | | | |
SUCH / Alberta Innovates own-source revenue / expense | | | 1,335 | | | | 813 | | | | 2,244 | | | | 1,431 | |
Pension provisions (non-cash expense) | | | (334 | ) | | | (415 | ) | | | (389 | ) | | | 26 | |
Net deferred capital contribution adjustment (excluding SUCH) | | | 129 | | | | 70 | | | | 45 | | | | (25 | ) |
Retained income of funds, agencies and accounts: | | | | | | | | | | | | | | | | |
Alberta Heritage Savings Trust Fund inflation-proofing | | | (287 | ) | | | (325 | ) | | | (195 | ) | | | 130 | |
Alberta Treasury Branches | | | (104 | ) | | | (260 | ) | | | 250 | | | | 510 | |
Agriculture Financial Services Corporation | | | 152 | | | | (430 | ) | | | (421 | ) | | | 9 | |
Endowment funds | | | (135 | ) | | | (124 | ) | | | 63 | | | | 187 | |
Alberta Social Housing Corporation | | | 197 | | | | 184 | | | | 214 | | | | 30 | |
Alberta Capital Finance Authority | | | (15 | ) | | | 513 | | | | 200 | | | | (313 | ) |
Tech. Innov. and Emiss. Reduction Fund / carbon tax acct. / Energy Effic. Ab. | | | 310 | | | | 116 | | | | 516 | | | | 400 | |
Balancing Pool | | | (161 | ) | | | (135 | ) | | | (62 | ) | | | 73 | |
Other | | | 3,057 | | | | 157 | | | | 288 | | | | 131 | |
Energy royalties (difference between accrued revenue and cash) | | | 254 | | | | (48 | ) | | | (731 | ) | | | (683 | ) |
Student loans | | | (308 | ) | | | (352 | ) | | | (510 | ) | | | (158 | ) |
Other cash adjustments | | | 524 | | | | (41 | ) | | | (605 | ) | | | (564 | ) |
2016 Wood Bufffalo fire / 2013 Alberta flood assistance revenue / expense | | | (84 | ) | | | 209 | | | | 183 | | | | (26 | ) |
Inventory acquisition | | | (131 | ) | | | (139 | ) | | | (217 | ) | | | (78 | ) |
Inventory consumption (non-cash expense) | | | 130 | | | | 137 | | | | 214 | | | | 77 | |
Capital Plan (excluding SUCH sector) cash sources / (requirements): | | | | | | | | | | | | | | | | |
Capital investment (excluding SUCH self-financed and 10% contingency) | | | (3,085 | ) | | | (3,213 | ) | | | (3,899 | ) | | | (686 | ) |
Amortization / book value of disposals | | | 1,021 | | | | 1,139 | | | | 1,145 | | | | 6 | |
Withdrawal from / (deposit to) Capital Plan financing account | | | 123 | | | | - | | | | - | | | | - | |
Direct borrowing for the Capital Plan | | | 3,499 | | | | 4,100 | | | | 5,522 | | | | 1,422 | |
Alternative financing (P3s – public-private partnerships) | | | 159 | | | | 151 | | | | 107 | | | | (44 | ) |
Current principal repayments (P3s) | | | (66 | ) | | | (74 | ) | | | (74 | ) | | | - | |
Surplus / (Deficit) plus net cash adjustments | | | (5,973 | ) | | | (5,276 | ) | | | (20,272 | ) | | | (14,996 | ) |
Cash from prior-year final results | | | 854 | | | | - | | | | - | | | | - | |
Direct borrowing for the Fiscal Plan | | | - | | | | 2,776 | | | | 10,867 | | | | 8,091 | |
Pre-borrowing for cash management purposes | | | 8,182 | | | | 2,500 | | | | 9,000 | | | | 6,500 | |
Balance at End of Year | | | 9,405 | | | | 2,500 | | | | 9,000 | | | | 6,500 | |
| | | | | | | | | | | | | | | | |
| Inventory Consumption Expense | | Fiscal Year | | | Change | |
(millions of dollars) | | | 2019-20 | | | | 2020-21 | | | | from | |
| | | Actual | | | Budget | | | Forecast | | | Budget | |
Advanced Education | | | 160 | | | | 178 | | | | 178 | | | | - | |
Health | | | 846 | | | | 894 | | | | 1,489 | | | | 595 | |
Municipal Affairs | | | - | | | | - | | | | 77 | | | | 77 | |
Service Alberta | | | 13 | | | | 14 | | | | 14 | | | | - | |
Transportation | | | 54 | | | | 50 | | | | 50 | | | | - | |
Other (Agriculture and Forestry / Culture / Infrastructure) | | | 5 | | | | 4 | | | | 5 | | | | 1 | |
Total Inventory Consumption Expense | | | 1,078 | | | | 1,140 | | | | 1,813 | | | | 673 | |
| | |
| Inventory Acquisition | | Fiscal Year | | | Change | |
(millions of dollars) | | | 2019-20 | | | | 2020-21 | | | | from | |
| | | Actual | | | Budget | | | Forecast | | | Budget | |
Advanced Education | | | 160 | | | | 178 | | | | 178 | | | | - | |
Health | | | 869 | | | | 888 | | | | 1,484 | | | | 596 | |
Municipal Affairs | | | - | | | | - | | | | 77 | | | | 77 | |
Service Alberta | | | 14 | | | | 14 | | | | 14 | | | | - | |
Transportation | | | 51 | | | | 50 | | | | 50 | | | | - | |
Other (Agriculture and Forestry / Culture / Infrastructure) | | | 6 | | | | 5 | | | | 5 | | | | - | |
Total Inventory Acquisition | | | 1,100 | | | | 1,135 | | | | 1,808 | | | | 673 | |
| | |
| 10 | | 2020–21 First Quarter Fiscal Update and Economic Statement |
Capital Plan Highlights
The 2020-21 Capital Plan has increased to $8.4 billion, up $1.4 billion from Budget 2020. With the addition of the $1.5 billion investment in the Keystone XL pipeline, which will add egress infrastructure for Alberta’s oil production, the total commitment to infrastructure in 2020-21 is $10 billion.
The $1.4 billion increase to the 2020-21 Capital Plan includes $716 million in capital grants primarily to municipalities, and $714 million in capital investment. Most of this reflects economic stimulus.
The $716 million increase to capital grants comprises: a $500 million boost to municipalities; $106 million in other municipal grants, including federally-funded transportation grants
re-profiled from 2019-20 and water and other stimulus projects; $49 million in environmental projects funded from TIER assets; $61 million in other projects, such as the Lethbridge Exhibition Centre Expansion and MacKenzie County Gas Supply Line.
Of the $714 million capital investment added, $684 million consists of Capital Maintenance and Renewal (CMR) funding accelerated from future years (another $60 million in CMR is included in Transportation operating expense). Other increases of $30 million for strategic economic recovery plan projects, $66 million in re-profiled health facility projects, $27 million funded by Alberta Health Services and
$20 million in projects carried-over from 2019-20, are largely offset by decreases of $69 million in re-profiled school projects and $44 million for the South West Calgary Ring Road reflecting faster progress by the private sector partner.
Factors impacting project progress include the pace of construction, project scope, land conditions, timing related to tendering, permitting and planning and rate of project identification, approval and construction under federal programs.
Direct borrowing of $5.5 billion is forecast, an increase of $1.4 billion from budget due to the increased Capital Plan, primarily for economic stimulus.
| | | | | | | | | | | | | | | | |
| Capital Plan Summary | | | | | | | | | | | | |
| (millions of dollars) | | Fiscal Year | | | Change | |
| | | 2019-20 | | | 2020-21 | | | from | |
| By Ministry | | Actual | | | Budget | | | Forecast | | | Budget | |
Advanced Education | | | 554 | | | | 654 | | | | 752 | | | | 98 | |
Agriculture and Forestry | | | 28 | | | | 39 | | | | 88 | | | | 49 | |
Community and Social Services | | | - | | | | 1 | | | | 1 | | | | - | |
Culture, Multiculturalism and Status of Women | | | 40 | | | | 61 | | | | 60 | | | | (1 | ) |
Economic Development, Trade and Tourism | | | 10 | | | | 12 | | | | 12 | | | | - | |
Education | | | 600 | | | | 842 | | | | 1,023 | | | | 181 | |
Energy | | | 73 | | | | 163 | | | | 163 | | | | - | |
Environment and Parks | | | 68 | | | | 123 | | | | 194 | | | | 71 | |
Health | | | 1,083 | | | | 1,288 | | | | 1,381 | | | | 93 | |
Indigenous Relations | | | 3 | | | | 19 | | | | 19 | | | | - | |
Infrastructure | | | 125 | | | | 270 | | | | 348 | | | | 78 | |
Justice and Solicitor General | | | 5 | | | | 10 | | | | 25 | | | | 15 | |
Labour and Immigration | | | 1 | | | | 1 | | | | 1 | | | | - | |
Municipal Affairs | | | 1,128 | | | | 1,236 | | | | 1,739 | | | | 503 | |
Seniors and Housing | | | 182 | | | | 216 | | | | 235 | | | | 19 | |
Service Alberta | | | 88 | | | | 94 | | | | 94 | | | | - | |
Transportation | | | 1,551 | | | | 1,941 | | | | 2,263 | | | | 322 | |
Treasury Board and Finance | | | 23 | | | | 19 | | | | 19 | | | | - | |
Legislative Assembly | | | 1 | | | | 3 | | | | 3 | | | | - | |
Total Capital Plan | | | 5,564 | | | | 6,989 | | | | 8,420 | | | | 1,431 | |
Capital Plan Financing | | | | | | | | | | | | | | | | |
Capital Plan 10% contingency | | | - | | | | (700 | ) | | | (700 | ) | | | - | |
Funding required | | | 5,564 | | | | 6,289 | | | | 7,720 | | | | 1,431 | |
Cash received / assets donated for capital purposes / book value of disposals | | | 840 | | | | 918 | | | | 924 | | | | 6 | |
Retained income of funds and agencies | | | 100 | | | | 200 | | | | 172 | | | | (28 | ) |
SUCH sector self-financed | | | 783 | | | | 774 | | | | 802 | | | | 28 | |
Technology Innovation and Emissions Reduction Fund | | | 60 | | | | 146 | | | | 194 | | | | 48 | |
Alternative financing (P3s) | | | 159 | | | | 151 | | | | 107 | | | | (44 | ) |
Capital Plan financing account withdrawal / (deposit) | | | 123 | | | | - | | | | - | | | | - | |
Direct borrowing | | | 3,499 | | | | 4,100 | | | | 5,522 | | | | 1,422 | |
Total Capital Plan Financing | | | 5,564 | | | | 6,289 | | | | 7,720 | | | | 1,431 | |
| | |
| 2020–21 First Quarter Fiscal Update and Economic Statement | | 11 |
Economic Update
Overview
The world has changed dramatically since Budget. Prior to March, global economic growth was expected to pick up amid easing trade tensions and an upturn in global trade and manufacturing activity. Against this backdrop, there were encouraging signs of a solid turnaround in the Alberta economy. The Alberta Activity Index (AAX), a measure of economic activity, grew 2% year-over-year in February. This changed abruptly in March, when the province confronted an unprecedented crisis from the dual impact of the COVID-19 pandemic and collapse in oil prices.
Although Alberta was able to keep a significant portion of its economy open at the height of the pandemic compared with other provinces, COVID-19 has dealt a severe blow to the economy. Global, national, provincial, and local public health measures to contain and mitigate the spread of the virus have reduced economic activity and resulted in permanent and temporary business shutdowns and historic job losses, in Alberta and across the globe. These factors resulted in a sharp drop in demand for goods and services in March and April in Alberta and globally, hurting Alberta’s exports. The downturn in the labour market, along with increased uncertainty about the economy, have dented consumer spending. Adding to these challenges is the plunge in oil prices, which has derailed prospects of a recovery in Alberta’s energy sector this year.
health measures like physical distancing and limits on mass gatherings are likely to remain in place until a vaccine and therapies are developed. Until then, some businesses will need to modify their practices to ensure the safety of employees and patrons. Consumers may be slow to resume activities due to lingering concerns about the virus and their finances. The negative impacts of extremely low prices in the second quarter of this year are also expected to linger in the energy sector. Against this backdrop, real GDP is expected to see a partial rebound of 4.6% next year, while employment is set to grow 4.3%. Both are not forecast to fully recover until after 2021.
Service sector downturn
The service sector, which is typically resilient and has acted as a buffer to the economy in prior recessions, has been hit particularly hard during the pandemic. This sector accounts for nearly 75% of employment in the province. Travel restrictions and economic weakness in the U.S., Canada and elsewhere have pummeled activity in tourism-related industries such as accommodation and food services, entertainment, and air travel. Ongoing social distancing and restrictions on large gatherings also continue to limit the ability of businesses in some service industries to operate at full capacity. At the same time, weakness in the energy and non-energy sectors is weighing on business services. As a result, domestic and export demand for services
are expected to contract sharply this year before seeing a partial recovery next year.
Lower demand hits exports
Business disruptions, along with the economic downturn in Canada and globally, are weighing on Alberta exports. While manufacturing shipments and goods exports stabilized in June, they have retreated over 20% since February, led by a decline in energy products. Non-energy exports are also down more than 10% from a year ago. Overall, real exports are expected to fall nearly 13% this year, compared with the Budget forecast of 3.5% growth. Exports are anticipated to pick up next year in tandem with the modest recovery in the global economy.
Oil production declines
A rebound in oil production was expected to spearhead exports and drive this year’s growth at Budget. However, this changed in March, when the sharp decline in demand prompted producers to drastically cut output. Oil production is estimated to have retreated by over 700,000 barrels per day (bpd) between February and May, representing about a fifth of total production in the province. While it is expected to slowly ramp up in the near term as demand improves, production is forecast to average nearly 3.3 million bpd this year, about 260,000 bpd lower than in 2019. It is not expected to return to pre-pandemic levels until after 2021.
| | |
Given Alberta’s success in mitigating the initial spread of COVID-19, the province began to take steps in mid-May to ease public health measures. Recent indicators suggest that activity is beginning to recover in some sectors. Significant government support measures, which have mitigated the impact of the pandemic on incomes and employment, are supporting the economy (See pages 5 and13). Nonetheless, the province will see a severe contraction in economic activity this year. Real Gross Domestic Product (GDP) is forecast to contract 8.8%, the largest annual decline in modern day history. Employment is forecast to fall a record 7.0% and the unemployment rate to average 11.6% (Chart 1). As the economy continues to re-open, activity will recover, but the pace is expected to be gradual. Some public | | Chart 1: Outlook has changed dramatically since Budget 2020 Selected Key Economic Indicators, 2020 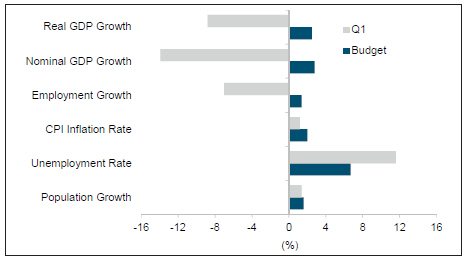
Source: Alberta Treasury Board and Finance |
| | |
| 12 | | 2020–21 First Quarter Fiscal Update and Economic Statement |
Oil prices pull back
Global oil prices have fallen sharply since Budget as the pandemic led to a dramatic retrenchment in global economic activity and oil demand. West Texas Intermediate (WTI) briefly touched negative prices in late April, but has since recovered to above US$40 per barrel in recent weeks. Oil demand has picked up as many countries around the world are slowly reopening their economies. An ongoing commitment by the Organization of Petroleum Exporting Countries and its allies (OPEC+) to restrain output is also providing some support to prices. Despite the rebound, abundant supply and high inventory levels are expected to keep a lid on prices in the near term. WTI is forecast to average US$35.60/ bbl in 2020-21, more than US$22/bbl below Budget expectations of US$58/bbl. The differential between WTI and Western Canadian Select (WCS) has remained close to US$10/bbl since April amid a gradual demand recovery in the U.S., ongoing production restraint and sufficient pipeline capacity in Alberta. As production slowly ramps up to meet growing petroleum demand in the U.S., the differential is expected to widen in the near term to reflect pipeline transportation costs. It is forecast to average US$12.50/bbl in 2020-21, US$6.6/bbl lower than Budget expectations of US$19.10/bbl.
Energy investment plunges
In response to the collapse in the global oil market and liquidity concerns, Canadian producers have significantly reduced capital spending. After a solid start to the year, rigs drilling slowed sharply in March and was down nearly 80% year-over-year in the second quarter. While the decline in drilling activity appears to have bottomed out, producers are expected to remain disciplined with capital spending. Investment in oil and gas extraction is forecast to fall by over $8 billion (or more than 30%) this year, with the decline more pronounced in the conventional sector. This was a dramatic turnaround from Budget when increased takeaway capacity and easing production constraints were expected to lift oil and gas investment in the province by almost $1.5 billion (or 5.8%) in 2020. Oil and gas investment is expected to see a modest improvement next year in tandem with the slow recovery in oil prices.
Non-energy spending slows
Business investment outside oil and gas extraction is also expected to slow this year, albeit at a more modest pace than in the energy sector. While Alberta has allowed construction activity to continue during the pandemic, many companies have shelved or put expansion plans on hold in the face of weaker demand and elevated uncertainty. In particular, the pandemic is the latest
blow to the commercial real estate sector already struggling with high vacancies. Moreover, some projects already underway have experienced delays due to supply chain disruptions and lower productivity in worksites arising from public health measures. As a result, business investment outside oil and gas extraction is forecast to fall about 9% after growing over the last two years. It is expected to improve slowly next year. Weakness in commercial construction will be partly offset by a ramp-up in infastructure spending by the provincial government.
Labour market on the mend
While the labour market is recovering, it has a long way to go. With the economy gradually reopening, employment rebounded by 187,000 jobs in the last three months. This was led by the service-sector industries that were most impacted by the COVID-19 disruptions. However, with health measures remaining in place for travel and large gatherings, employment in some service industries remains well below pre-COVID levels (Chart 2). Overall, employment remains more than 170,000 below February’s level and the unemployment rate is still elevated at nearly 13%.
Many Albertans who are still employed have been working fewer hours, and many unemployed are not looking for work. This slack in the labour
Government measures cushion COVID blow
Unprecedented stimulus by both the federal and provincial governments is helping to mitigate COVID-19 impacts. Albertans are being supported through the provincial COVID-19 emergency income support program (over $100 million), the federal Canada Emergency Response Benefit (about $10 billion in Alberta), and a multitude of other programs. Programs like the Small and Medium Enterprise Relaunch Grant ($200 million), the Canada Emergency Wage Subsidy (around $11 billion in Alberta), energy sector supports, and programs improving access to credit or reducing or deferring costs, have given support to businesses struggling during COVID.
In the absence of government programs, the impact of the pandemic on incomes and activity in the province would have been much more severe. As it stands, Alberta’s nominal GDP, a broad measure of income, is forecast to decline almost 14% in 2020. Transfers to individuals are partially offsetting the declines in household income due to employment losses and propping up consumer spending and the housing market. Business supports are limiting employment losses and keeping businesses functioning.
Incomes are not expected to post a speedy recovery out of this downturn, especially with the limited improvement in oil prices in 2021. Given that most COVID-19 support programs are set to end this year, Alberta’s transition will be supported by the province’s commitment to create a competitive business environment and increase capital spending. Fully implementing the Job Creation Tax Cut on July 1, 2020, 1.5 years sooner than planned, will encourage business to invest in Alberta sooner. This, along with the government’s commitment to $10 billion in infrastructure projects (see p. 11 for more details), will help offset some of the weakness in private sector investment and construction created by the uncertainty of COVID-19.
| | |
| 2020–21 First Quarter Fiscal Update and Economic Statement | | 13 |
force will result in a slow recovery. Employment is forecast to decline 7.0% and the unemployment rate to average 11.6% this year. While COVID-related impacts are expected to dissipate in 2021, weak investment will continue to weigh on the labour market. Employment is forecast to grow 4.3% and the unemployment rate to average 9.5% next year.
Population growth to slow
After picking up in the last two years, Alberta’s population growth is set to slow in the near term. It is forecast to decelerate from 1.6% in the 2019 census year to 1.4% in 2020 and below 1.0% in the following year. International migration is expected to remain positive but fall from previous levels as a result of travel restrictions, immigration processing delays, and policy changes to the provincial nominee program. At the same time, relatively high unemployment in Alberta will result in net outflows of interprovincial migrants.
Shutdowns hit spending
Consumer spending plunged during the pandemic as public health measures forced many non-essential businesses to shut doors or operate at limited capacity. While spending has rebounded sharply (Chart 3), much of the consumption will not be recouped and real consumer spending is forecast to decline by 6.9% this year. The economic uncertainty and continued weakness in the labour market will keep consumer cautious into 2021. Although government income supports boosted spending this year, the winding down of these programs will keep spending growth contained next year.
Housing market improving
After nearly seizing up during the height of the pandemic, the housing market has found some momentum. Home sales have rebounded strongly in the last three months and are back to pre-pandemic levels. Housing starts have also rebounded after plunging to the lowest level since mid-2009. With the Bank of Canada cutting rates aggressively, declining mortgage rates and pent-up demand have aided the rebound in the housing market. Housing starts are forecast to average around
21,000 units in 2020 compared to Budget expectations of 28,000. While low mortgage rates are expected to support demand, the weak employment recovery and slower population growth will keep a lid on growth. Housing starts are forecast to increase only modestly in 2021 to around 24,000.
Risks to outlook
The economic outlook is extraordinarily uncertain. While activity is expected to improve as public health measures are gradually lifted and confidence is restored, the pace of recovery will largely depend on how the pandemic unfolds. A severe second wave of infections in the
province may require additional public health measures. Moreover, some sectors of the economy may undergo structural changes amid ongoing restrictions, which could lead to permanent business closures and layoffs. A resurgence in COVID-19 cases around the world, along with escalating trade tensions, could also derail the recovery in the global economy and oil prices. On the upside, a stronger-than-expected recovery in the global economy and oil prices would hasten the recovery.
Chart 2: Strong rebound in hardest hit industries
Change in employment
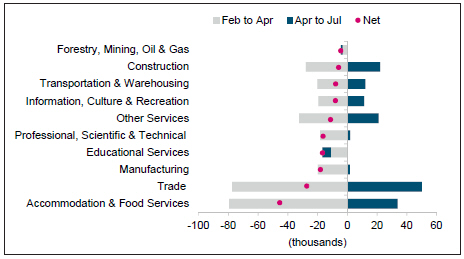
Source: Statistics Canada
Chart 3: Household indicators rebound from pandemic lows
Number of home sales and value of retail trade
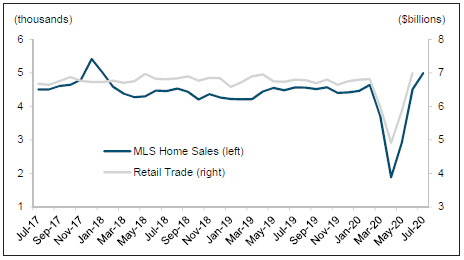
Sources: Statistics Canada and Canadian Real Estate Association
| | |
| 14 | | 2020–21 First Quarter Fiscal Update and Economic Statement |
Key Energy and Economic Assumptions
| | | | | | | | | | | | | | | | | | | | |
| | | | |
| | | | | 2020-21 | | 2020-21 Fiscal Year |
| Fiscal Year Assumptions | | 2019-20 Actual | | 3 Month Actual | | Budget | | 1st Quarter |
Prices | | | | | | | | | | | | | | | | | | | | |
Crude Oil Price | | | | | | | | | | | | | | | | | | | | |
WTI (US$/bbl) | | | | 54.85 | | | | | 27.85 | | | | | 58.00 | | | | | 35.60 | |
Light-Heavy Differential (US$/bbl) | | | | 14.82 | | | | | 11.47 | | | | | 19.10 | | | | | 12.50 | |
WCS @ Hardisty (Cdn$/bbl) | | | | 53.14 | | | | | 22.42 | | | | | 51.20 | | | | | 31.40 | |
Natural Gas Price | | | | | | | | | | | | | | | | | | | | |
Alberta Reference Price (Cdn$/GJ) | | | | 1.39 | | | | | 1.62 | | | | | 1.70 | | | | | 1.90 | |
Production | | | | | | | | | | | | | | | | | | | | |
Conventional Crude Oil (000s barrels/day) | | | | 487 | | | | | N/A | | | | | 488 | | | | | 412 | |
Raw Bitumen (000s barrels/day) | | | | 3,085 | | | | | N/A | | | | | 3,249 | | | | | 2,830 | |
Natural Gas (billions of cubic feet) | | | | 4,045 | | | | | N/A | | | | | 4,144 | | | | | 3,897 | |
Interest rates | | | | | | | | | | | | | | | | | | | | |
3-month Canada Treasury Bills (per cent) | | | | 1.56 | | | | | 0.22 | | | | | 1.70 | | | | | 0.20 | |
10-year Canada Bonds (per cent) | | | | 1.42 | | | | | 0.59 | | | | | 2.00 | | | | | 0.60 | |
Exchange Rate (US¢/Cdn$) | | | | 75.2 | | | | | 72.2 | | | | | 76.5 | | | | | 73.0 | |
| | | | | | | | | | | | | | | | | | | | | | | | |
| | | 2019 Calendar Year | | | 2020 Calendar Year | | | 2021 Calendar Year | |
| Calendar Year Assumptions | | Budget | | | Actual | | | Budget | | | 1st Quarter | | | Budget | | | 1st Quarter | |
Gross Domestic Product | | | | | | | | | | | | | | | | | | | | | | | | |
Nominal (millions of dollars) | | | 350,538 | | | | 347,035* | | | | 360,275 | | | | 298,856 | | | | 381,666 | | | | 317,748 | |
per cent change | | | 1.7 | | | | 0.6* | | | | 2.8 | | | | -13.9 | | | | 5.9 | | | | 6.3 | |
Real (millions of 2012 dollars) | | | 347,673 | | | | 344,394* | | | | 356,485 | | | | 314,112 | | | | 366,415 | | | | 328,604 | |
per cent change | | | 0.3 | | | | -0.6* | | | | 2.5 | | | | -8.8 | | | | 2.8 | | | | 4.6 | |
Other Indicators | | | | | | | | | | | | | | | | | | | | | | | | |
Employment (thousands) | | | 2,343 | | | | 2,343 | | | | 2,375 | | | | 2,178 | | | | 2,426 | | | | 2,272 | |
per cent change | | | 0.5 | | | | 0.5 | | | | 1.4 | | | | -7.0 | | | | 2.1 | | | | 4.3 | |
Unemployment Rate (per cent) | | | 6.9 | | | | 6.9 | | | | 6.7 | | | | 11.6 | | | | 6.0 | | | | 9.5 | |
Average Weekly Earnings | | | 1.6 | | | | 1.4 | | | | 2.8 | | | | 2.5 | | | | 3.3 | | | | 1.7 | |
(per cent change) | | | | | | | | | | | | | | | | | | | | | | | | |
Primary Household Income | | | 3.1 | | | | 2.1* | | | | 4.4 | | | | -5.2 | | | | 5.2 | | | | 5.1 | |
(per cent change | | | | | | | | | | | | | | | | | | | | | | | | |
Net Corporate Operating Surplus | | | -3.9 | | | | -10.7* | | | | -2.7 | | | | -72.8 | | | | 18.4 | | | | 46.2 | |
(per cent change) | | | | | | | | | | | | | | | | | | | | | | | | |
Housing Starts (thousands of units) | | | 27.3 | | | | 27.3 | | | | 28.0 | | | | 21.4 | | | | 28.8 | | | | 23.9 | |
Alberta Consumer Price Index | | | 1.8 | | | | 1.8 | | | | 2.0 | | | | 1.2 | | | | 2.0 | | | | 1.7 | |
(per cent change) | | | | | | | | | | | | | | | | | | | | | | | | |
Population (July 1st, thousands) | | | 4,371 | | | | 4,371 | | | | 4,439 | | | | 4,434 | | | | 4,514 | | | | 4,464 | |
per cent change | | | 1.6 | | | | 1.6 | | | | 1.6 | | | | 1.4 | | | | 1.7 | | | | 0.7 | |
| * | Alberta Treasury Board and Finance estimate |
| | |
| 2020–21 First Quarter Fiscal Update and Economic Statement | | 15 |
Fiscal Stabilization Program
Alberta is a key contributor to Canada
Alberta has been a major contributor to the Canadian economy for decades. Alberta attracted nearly a quarter of the capital investment in the country last year, and was responsible for over 20 per cent of the Canadian goods exported internationally.
Alberta’s fiscal contribution to the Canadian federation has been equally substantial. Over the past 25 years, Albertans have made a net contribution to Canada of more than $400 billion (in 2018 dollars).
Over the most recent five-year period (2014-2018), Alberta’s contribution of almost $4,800 per person was more than triple that of the second-highest contributing province.
Alberta’s economic and fiscal contributions to Canada play a vital role in driving and sustaining the national economy, as well as in funding the federal programs upon which all Canadians rely. Pipeline delays and federal legislation, such as Bill C-69 and Bill C-48, have damaged conditions for investment and national economic growth. Further impediments to Alberta’s prosperity will slow Canada’s recovery from COVID-19.
Inadequacy of the
Fiscal Stabilization Program
Due to the collapse in global oil prices beginning in the second half of 2014, government of Alberta revenue fell by nearly $7 billion – or 14 per cent – in 2015-16. Despite this massive decline in revenue, Alberta only received a payment of $251 million under the federal Fiscal Stabilization Program. This payment covered less than four per cent of Alberta’s revenue decline in 2015-16, and represented just one per cent of Alberta’s net fiscal contribution to Canada in 2015.
Alberta also submitted a fiscal stabilization claim in respect of the 2016-17 fiscal year, and received a capped payment of $251 million.
The main reason for Alberta’s relatively small fiscal stabilization payment for 2015-16 and 2016-17 was the $60 per resident cap on payments. Without the cap, Alberta would have qualified for a fiscal stabilization payment of $1.7 billion for 2015-16 and $1.2 billion for 2016-17.
In short, the arbitrary cap cost Alberta over $2.4 billion in foregone fiscal stabilization entitlements.
This arbitrary cap was put in place in 1987, twenty years after the program began, and has not been changed since. The cap is exceptionally small when compared to the per capita allocations of other major fiscal transfers today. Moreover, fiscal stabilization payments to provinces are already constrained through eligibility thresholds, which act as a large deductible for revenue declines. For a program that has relatively small and infrequent payments and is only required under dire provincial circumstances, the existence of a hard cap is unwarranted.
There is a strong policy rationale for the Fiscal Stabilization Program as a revenue stabilization tool. Through the program, the federal government can risk share to help mitigate the effects on provinces, who are more exposed individually to adverse events. The program’s original intent and effectiveness has eroded substantially over the past several decades, and it no longer achieves its original purpose nor addresses the current needs of provinces. Recent research by economists Bev Dahlby and Trevor Tombe has also highlighted the need for fundamental program reforms to the Fiscal Stabilization Program, including the removal of the $60 per capita cap.
Removal of the $60 Per Capita Cap
The Fiscal Stabilization Program’s failure to adequately address Alberta’s severe revenue losses during the recent recession, while the rest of the country continued to benefit from Alberta’s large net fiscal contributions, constitutes
a serious failure of Canadian fiscal federalism.
Alberta continues to advocate for changes to the Fiscal Stabilization Program, including the removal of the cap, and has received unanimous support from all provinces.
Provinces continue to await a formal federal review of the program.
2020-21 Fiscal Stabilization Claim
The economic impact of COVID-19 combined with the collapse in oil prices has highlighted the need for a well functioning Fiscal Stabilization Program across the country. There have been significant impacts on Alberta’s revenue in 2020-21, which will likely result in Alberta being eligible for another payment under the Fiscal Stabilization Program.
Based on current revenue projections, Alberta would be expected to receive a fiscal stabilization payment of nearly $4 billion for this year, if not for the cap (which could limit our claim to just under $270 million).
It is critical that the Federal Government take immediate steps to address these serious deficiencies in the Fiscal Stabilization Program.
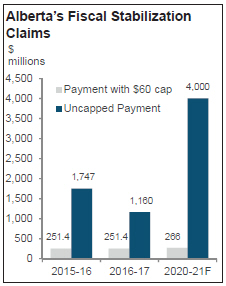
| Source: | Department of Finance Canada and Alberta Treasury Board and Finance |
| | |
| 16 | | 2020–21 First Quarter Fiscal Update and Economic Statement |
Alberta’s Tax Advantage
The Alberta government remains committed to creating the most competitive business and tax climate for investment and jobs.
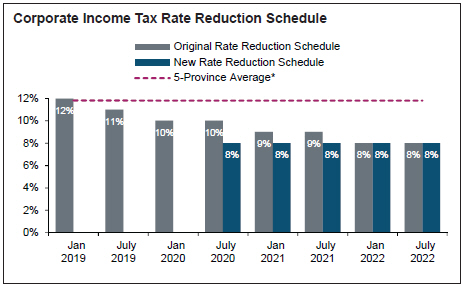
Prior to COVID-19, Alberta was well positioned to bring back investment and jobs. The province’s business competitiveness was bolstered by the government’s Job Creation Tax Cut (JCTC) and red tape reduction efforts. The JCTC lowered the general corporate income tax rate from 12% to 10% on January 1, 2020, reversing the damaging tax increases on job creators introduced by the previous government. The legislated rate was scheduled to fall further to 8% by January 1, 2022.
In recognition of the impacts of COVID-19 and the new lower oil price environment, the JCTC was accelerated as part of Alberta’s Recovery Plan. With the 8% corporate tax rate in effect as of July 1, 2020, Alberta’s corporate tax rate is now 30% lower than the next lowest province and the combined federal-provincial / state business tax rate of 44 US states. With one of the most competitive general corporate tax rates in North America, Alberta’s tax system is better positioned than that of other jurisdictions to support economic recovery and job creation. Albertans and their families will benefit from the JCTC, as research has shown that workers ultimately bear most of the burden of corporate tax increases through lower overall wages.
Alberta’s Recovery Plan also includes the new Innovation Employment Grant (IEG). This grant dovetails with the JCTC and will encourage economic growth and job creation by supporting small and medium-sized businesses that invest in research and development in the early stages of their operations. Together, the IEG and the JCTC will reward job creation and support companies of all sizes and at all stages of their business life cycle.
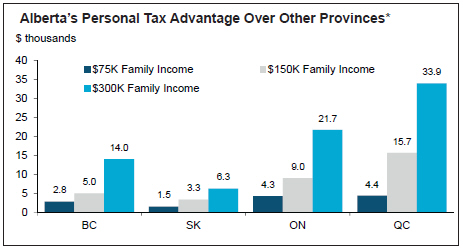
In addition to low corporate taxes, Alberta generally has the lowest provincial taxes for households. A family with two children earning $75,000 would pay $2,800 more in provincial tax in BC and $4,300 more in Ontario. A similar family earning $150,000 would pay $5,000 more in BC and $9,000 more in Ontario.
As the economy recovers from the devastating impacts of COVID-19, the government is focused on addressing its fiscal situation through spending restraint and following the advice of the Mackinnon Panel to align Alberta’s per capita spending with other jurisdictions. The government will be responsible stewards of taxpayer dollars while creating the conditions to get the province back to work.
| * | The five provinces included in the average include British Columbia, Saskatchewan, Manitoba, Ontario and Quebec. |
| Source: | Treasury Board and Finance |
| * | Additional taxes paid in other provinces relative to Alberta. Assumes single income family with two children. Includes personal income tax, sales tax, health premium, payroll tax, fuel tax and net provincial carbon tax. |
| | |
2020–21 First Quarter Fiscal Update and Economic Statement 17 |
Reporting Methodology and Legislative Compliance
Method of Consolidation
The 2020-21 First Quarter Fiscal Update and Economic Statement reports on the same scope, using the same method of consolidation, as presented in Budget 2020. This is also the same scope and consolidation approach used in the Consolidated Financial Statements in the Government of Alberta Annual Report.
The results of all government departments, funds and agencies, except those designated as government business enterprises, are consolidated on a line-by-line basis. Revenue and expense transactions between consolidated entities have been eliminated.
The accounts of provincial agencies designated as government business enterprises are included on the modified equity basis, computed in accordance with International Financial Reporting Standards applicable to those entities.
Basis of Financial Reporting
The consolidated fiscal summary reports revenue (including gains from disposal of tangible capital assets), expense (including amortization, inventory consumption, loss on disposal and write-down of tangible capital assets), and surplus / (deficit).
Revenue and expense are recorded using the accrual basis of accounting. Cash received for goods or services which have not been provided by period end is recorded as unearned revenue.
Transfers received for capital purposes, and donated capital assets, are recorded as “deferred capital contributions” when the cash or asset is received, and recognized in revenue over the related asset’s useful life (in effect matching the asset’s amortization expense).
Expense includes the province’s cash payments towards the unfunded pension liabilities, and the non-cash change in unfunded pension liabilities.
Debt servicing costs include interest payable, and amortization of issue costs and discounts / premiums on debt issues.
Compliance with Legislation
The Fiscal Planning and Transparency Act (FPTA) requires a public report on the accuracy of the Fiscal Plan for a fiscal year on or before August 31. The FPTA gives the President of Treasury Board and Minister of Finance discretion over the form of the report.
The 2020-21 First Quarter Fiscal Update and Economic Statement includes comparisons between the Budget 2020 estimates and first quarter forecasts for revenue and expense (including details and categories of each); the surplus / (deficit); cash adjustments and balance; a summary balance sheet; the Capital Plan; and borrowing requirements and sources. An updated Alberta economic outlook, with associated assumptions, is also provided.
The forecast provided in this report is in compliance with the requirements of the FPTA.
| | |
| 18 | | 2020–21 First Quarter Fiscal Update and Economic Statement |
| | |
| 2020–21 First Quarter Fiscal Update and Economic Statement | | 19 |