UNITED STATES
SECURITIES AND EXCHANGE COMMISSION
Washington, D.C. 20549
FORM N-CSR
CERTIFIED SHAREHOLDER REPORT OF REGISTERED
MANAGEMENT INVESTMENT COMPANIES
Investment Company Act file number | 811-05041 | |||||||
| ||||||||
CREDIT SUISSE LARGE CAP GROWTH FUND | ||||||||
(Exact name of registrant as specified in charter) | ||||||||
| ||||||||
Eleven Madison Avenue, New York, New York |
| 10010 | ||||||
(Address of principal executive offices) |
| (Zip code) | ||||||
| ||||||||
J. Kevin Gao, Esq. | ||||||||
(Name and address of agent for service) | ||||||||
| ||||||||
Registrant’s telephone number, including area code: | (212) 325-2000 |
| ||||||
| ||||||||
Date of fiscal year end: | October 31 |
| ||||||
| ||||||||
Date of reporting period: | November 1, 2006 to April 30, 2007 |
| ||||||
Item 1. Reports to Stockholders.

CREDIT SUISSE FUNDS
Semiannual Report
April 30, 2007
(unaudited)
n CREDIT SUISSE
LARGE CAP GROWTH FUND
n CREDIT SUISSE
MID-CAP CORE FUND
The Funds' investment objectives, risks, charges and expenses (which should be considered carefully before investing), and more complete information about the Funds, are provided in the Prospectus, which should be read carefully before investing. You may obtain additional copies by calling 800-927-2874 or by writing to Credit Suisse Funds, P.O. Box 55030, Boston, MA 02205-5030.
Credit Suisse Asset Management Securities, Inc., Distributor, is located at Eleven Madison Avenue, New York, NY 10010. Credit Suisse Funds are advised by Credit Suisse Asset Management, LLC.
Investors in the Credit Suisse Funds should be aware that they may be eligible to purchase Common Class and/or Advisor Class shares (where offered) directly or through certain intermediaries. Such shares are not subject to a sales charge but may be subject to an ongoing service and distribution fee of up to 0.50% of average daily net assets. Investors in the Credit Suisse Funds should also be aware that they may be eligible for a reduction or waiver of the sales charge with respect to Class A, B or C shares (where offered). For more information, please review the relevant prospectuses or consult your financial representative.
The views of the Funds' management are as of the date of the letter and Fund holdings described in this document are as of April 30, 2007; these views and Fund holdings may have changed subsequent to these dates. Nothing in this document is a recommendation to purchase or sell securities.
Fund shares are not deposits or other obligations of Credit Suisse Asset Management, LLC ("Credit Suisse") or any affiliate, are not FDIC-insured and are not guaranteed by Credit Suisse or any affiliate. Fund investments are subject to investment risks, including loss of your investment.
Credit Suisse Large Cap Growth Fund
Semiannual Investment Adviser's Report
April 30, 2007 (unaudited)
May 15, 2007
Dear Shareholder:
Performance Summary
11/01/06 – 04/30/07
| Fund & Benchmark | Performance | ||||||
| Common Class1 | 8.56 | % | |||||
| Advisor Class1 | 8.27 | % | |||||
| Class A1,2 | 8.43 | % | |||||
| Class B1,2 | 8.02 | % | |||||
| Class C1,2 | 7.96 | % | |||||
| Russell 1000® Growth Index3 | 8.42 | % | |||||
Performance for the Fund's Class A, Class B and Class C Shares is without the maximum sales charge of 5.75%, 4.00% and 1.00%, respectively.2
Market Review: Consumer confidence out of synch with the market
The semiannual period ended April 30, 2007, was a strong one for U.S. equities. Encouraged by a record flow of mergers and acquisitions and healthy corporate earnings, the U.S. equity market gained during the final two months of 2006. Over the same period, investor expectations of near-term market volatility — as measured by the Chicago Board Options Exchange Volatility Index ("VIX Index"), which incepted in 1993 — hovered at near-record lows of 10.89%. Additionally, most S&P 500 companies' first-quarter 2007 earnings reports have exceeded investor expectations.
The market, despite a sudden sell-off in February that drove the S&P 500 down by 1.96% for the month, continued its strong performance during the quarter. The S&P 500 finished April up by more than 5% year-to-date.
Overall, the first quarter of 2007 marked the slowest U.S. economic growth in four years. This was mainly due to the ongoing drop in residential investments (down by 17%) and the increased trade deficit. Together, these factors also contributed to a 0.52% drop in the overall GDP growth rate for the quarter. Additionally, consumer spending, which accounts for about 70% of the U.S. economy, grew at an average rate of 3.8%, down from 4.2% during the previous quarter. Further, U.S. inflation — excluding volatile food and energy costs — jumped to 2.2% on an annual basis, up from a 1.8% fourth-quarter gain. At the same time, the U.S. Federal Funds rate remained unchanged at 5.25% over the period. These issues combined to cause U.S. consumer confidence to drop to its lowest level since October 2006, despite the fact that business investments,
1
Credit Suisse Large Cap Growth Fund
Semiannual Investment Adviser's Report (continued)
April 30, 2007 (unaudited)
including spending on commercial construction as well as equipment and software, managed to rise at an annual rate of 2%.
From a global perspective, the European economy has sustained its strong momentum of growth during the first quarter of 2007.
Strategic review and outlook: Expect moderate growth
The largest contributors to performance were the producer durables, materials and processing, and consumer discretionary sectors. Stock selection in health care, technology, and financial services detracted from performance.
For the next quarter, we expect the growth of the U.S. economy to continue at a moderate rate. However, contradicting readings from major U.S. economic indicators point to a slim chance of a Federal Funds rate increase or decrease over this time. Additionally, merger and acquisition activity is expected to remain at high levels over the quarter.
Throughout 2007, we expect a further weakening in the housing market in general (and sub-prime loan performance in particular). Additionally, while the U.S. dollar is expected to weaken relative to the Euro in the coming year, European equities are expected to outperform their U.S. counterparts. We also anticipate that stock market volatility, as measured by the VIX Index, will reach higher levels than those recorded during the first quarter of 2007.
Credit Suisse Quantitative Strategies Team
Joseph Cherian
William Weng
Todd Jablonski
The value of investments generally will fluctuate in response to market movements.
In addition to historical information, this report contains forward-looking statements that may concern, among other things, domestic and foreign market, industry and economic trends and developments and government regulation and their potential impact on the Fund's investments. These statements are subject to risks and uncertainties and actual trends, developments and regulations in the future, and their impact on the Fund could be materially different from those projected, anticipated or implied. The Fund has no obligation to update or revise forward-looking statements.
The Fund adopted new investment strategies effective December 1, 2006 so that its holdings are selected using quantitative stock selection models rather than a more traditional fundamental analysis approach. Investors should be aware that performance information for periods prior to December 1, 2006 does not reflect the current investment strategies.
2
Credit Suisse Large Cap Growth Fund
Semiannual Investment Adviser's Report (continued)
April 30, 2007 (unaudited)
Average Annual Returns as of March 31, 20071
| 1 Year | 5 Years | 10 Years | Since Inception | Inception Date | |||||||||||||||||||
| Common Class | 1.58 | % | 1.45 | % | 5.75 | % | 8.97 | % | 08/17/87 | ||||||||||||||
| Advisor Class | 1.01 | % | 0.93 | % | 5.22 | % | 8.54 | % | 04/04/91 | ||||||||||||||
| Class A Without Sales Charge | 1.32 | % | 1.19 | % | — | (0.03 | )% | 11/30/01 | |||||||||||||||
| Class A With Maximum Sales Charge | (4.53 | )% | 0.00 | % | — | (1.13 | )% | 11/30/01 | |||||||||||||||
| Class B Without CDSC | 0.53 | % | 0.44 | % | — | (0.77 | )% | 11/30/01 | |||||||||||||||
| Class B With CDSC | (3.47 | )% | 0.44 | % | — | (0.77 | )% | 11/30/01 | |||||||||||||||
| Class C Without CDSC | 0.53 | % | 0.43 | % | — | (0.78 | )% | 11/30/01 | |||||||||||||||
| Class C With CDSC | (0.47 | )% | 0.43 | % | — | (0.78 | )% | 11/30/01 | |||||||||||||||
Average Annual Returns as of April 30, 20071
| 1 Year | 5 Years | 10 Years | Since Inception | Inception Date | |||||||||||||||||||
| Common Class | 7.21 | % | 4.19 | % | 5.81 | % | 9.21 | % | 08/17/87 | ||||||||||||||
| Advisor Class | 6.66 | % | 3.66 | % | 5.29 | % | 8.84 | % | 04/04/91 | ||||||||||||||
| Class A Without Sales Charge | 6.94 | % | 3.93 | % | — | 0.92 | % | 11/30/01 | |||||||||||||||
| Class A With Maximum Sales Charge | 0.81 | % | 2.71 | % | — | (0.18 | )% | 11/30/01 | |||||||||||||||
| Class B Without CDSC | 6.16 | % | 3.16 | % | — | 0.17 | % | 11/30/01 | |||||||||||||||
| Class B With CDSC | 2.16 | % | 3.16 | % | — | 0.17 | % | 11/30/01 | |||||||||||||||
| Class C Without CDSC | 6.11 | % | 3.15 | % | — | 0.16 | % | 11/30/01 | |||||||||||||||
| Class C With CDSC | 5.11 | % | 3.15 | % | — | 0.16 | % | 11/30/01 | |||||||||||||||
Returns represent past performance and include change in share price and reinvestment of dividends and capital gains. Past performance cannot guarantee future results. The current performance of the Fund may be lower or higher than the figures shown. Returns and share price will fluctuate, and redemption value may be more or less than original cost. The performance results do not reflect the deduction of taxes that a shareholder would pay on fund distributions or the redemption of fund shares. Performance information current to the most recent month-end is available at www.credit-suisse.com/us.
1 Fee waivers and/or expense reimbursements may reduce expenses for the Fund, without which performance would be lower. Waivers may be discontinued at any time.
2 Total return for the Fund's Class A Shares for the reporting period, based on offering price (with maximum sales charge of 5.75%), was 2.19%. Total return for the Fund's Class B Shares for the reporting period, based on redemption value (including maximum contingent deferred sales charge of 4%), was 4.02%. Total return for the Fund's Class C Shares for the reporting period, based on redemption value (including maximum contingent deferred sales charge of 1%), was 6.96%.
3 The Russell 1000®Growth Index measures the performance of those companies in the Russell 1000® Index with higher price-to-book ratios and higher forecasted growth values. It is an unmanaged index of common stocks that includes reinvestment of dividends and is compiled by Frank Russell Company. Investors cannot invest directly in an index.
3
Credit Suisse Large Cap Growth Fund
Semiannual Investment Adviser's Report (continued)
April 30, 2007 (unaudited)
Information About Your Fund's Expenses
As an investor of the Fund, you incur two types of costs: ongoing expenses and transaction costs. Ongoing expenses include management fees, distribution and service (12b-1) fees and other Fund expenses. Examples of transaction costs include sales charges (loads), redemption fees and account maintenance fees, which are not shown in this section and which would result in higher total expenses. The following table is intended to help you understand your ongoing expenses of investing in the Fund and to help you compare these expenses with the ongoing expenses of investing in other mutual funds. The table is based on an investment of $1,000 made at the beginning of the six month period ended April 30, 2007.
The table illustrates your Fund's expenses in two ways:
• Actual Fund Return. This helps you estimate the actual dollar amount of ongoing expenses paid on a $1,000 investment in the Fund using the Fund's actual return during the period. To estimate the expenses you paid over the period, simply divide your account value by $1,000 (for example, an $8,600 account value divided by $1,000 = 8.6), then multiply the result by the number in the "Expenses Paid per $1,000" line under the share class you hold.
• Hypothetical 5% Fund Return. This helps you to compare your Fund's ongoing expenses with those of other mutual funds using the Fund's actual expense ratio and a hypothetical rate of return of 5% per year before expenses. Examples using a 5% hypothetical fund return may be found in the shareholder reports of other mutual funds. The hypothetical account values and expenses may not be used to estimate the actual ending account balance or expenses you paid for the period.
Please note that the expenses shown in these tables are meant to highlight your ongoing expenses only and do not reflect any transaction costs, such as sales charges (loads) or redemption fees. If these transaction costs had been included, your costs would have been higher. The "Expenses Paid per $1,000" line of the tables is useful in comparing ongoing expenses only and will not help you determine the relative total expenses of owning different funds.
4
Credit Suisse Large Cap Growth Fund
Semiannual Investment Adviser's Report (continued)
April 30, 2007 (unaudited)
Expenses and Value of a $1,000 Investment
for the six month period ended April 30, 2007
| Actual Fund Return | Common Class | Advisor Class | Class A | Class B | Class C | ||||||||||||||||||
| Beginning Account Value 11/1/06 | $ | 1,000.00 | $ | 1,000.00 | $ | 1,000.00 | $ | 1,000.00 | $ | 1,000.00 | |||||||||||||
| Ending Account Value 4/30/07 | $ | 1,085.60 | $ | 1,082.70 | $ | 1,084.30 | $ | 1,080.20 | $ | 1,079.60 | |||||||||||||
| Expenses Paid per $1,000* | $ | 6.46 | $ | 9.04 | $ | 7.75 | $ | 11.60 | $ | 11.60 | |||||||||||||
| Hypothetical 5% Fund Return | |||||||||||||||||||||||
| Beginning Account Value 11/1/06 | $ | 1,000.00 | $ | 1,000.00 | $ | 1,000.00 | $ | 1,000.00 | $ | 1,000.00 | |||||||||||||
| Ending Account Value 4/30/07 | $ | 1,018.60 | $ | 1,016.12 | $ | 1,017.36 | $ | 1,013.64 | $ | 1,013.64 | |||||||||||||
| Expenses Paid per $1,000* | $ | 6.26 | $ | 8.75 | $ | 7.50 | $ | 11.23 | $ | 11.23 | |||||||||||||
| Common Class | Advisor Class | Class A | Class B | Class C | |||||||||||||||||||
| Annualized Expense Ratios* | 1.25 | % | 1.75 | % | 1.50 | % | 2.25 | % | 2.25 | % | |||||||||||||
* Expenses are equal to the Fund's annualized expense ratio for each share class, multiplied by the average account value over the period, multiplied by the number of days in the most recent fiscal half year period, then divided by 365.
The "Expenses Paid per $1,000" and the "Annualized Expense Ratios" in the tables are based on actual expenses paid by the Fund during the period, net of fee waivers and/or expense reimbursements. If those fee waivers and/or expense reimbursements had not been in effect, the Fund's actual expenses would have been higher.
For more information, please refer to the Fund's prospectus.
5
Credit Suisse Large Cap Growth Fund
Semiannual Investment Adviser's Report (continued)
April 30, 2007 (unaudited)
SECTOR BREAKDOWN*
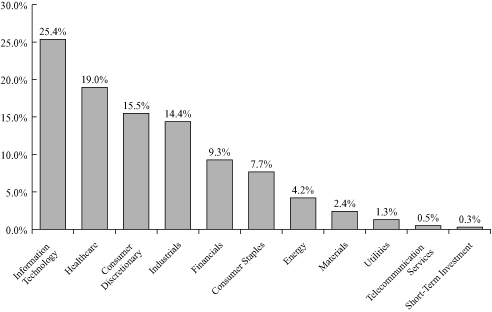
* Expressed as a percentage of total investments (excluding security lending collateral) and may vary over time.
6
Credit Suisse Mid-Cap Core Fund
Semiannual Investment Adviser's Report
April 30, 2007 (unaudited)
May 15, 2007
Dear Shareholder:
Performance Summary
11/01/06 – 04/30/07
| Fund & Benchmark | Performance | ||||||
| Common Class1 | 10.27 | % | |||||
| Advisor Class1 | 10.00 | % | |||||
| Class A1,2 | 10.11 | % | |||||
| Class B1,2 | 9.69 | % | |||||
| Class C1,2 | 9.75 | % | |||||
| S&P MidCap 400® Index3 | 11.98 | % | |||||
| Russell 2500(TM) Growth Index3 | 10.62 | % | |||||
| Russell Midcap® Growth Index4 | 11.77 | % | |||||
Performance for the Fund's Class A, Class B and Class C Shares is without the maximum sales charge of 5.75%, 4.00% and 1.00%, respectively.2
Market Review: Consumer confidence out of synch with the market
The semiannual period ended April 30, 2007, was a strong one for U.S. equities. Encouraged by a record flow of mergers and acquisitions and healthy corporate earnings, the U.S. equity market gained during the final two months of 2006. Over the same period, investor expectations of near-term market volatility — as measured by the Chicago Board Options Exchange Volatility Index ("VIX Index"), which incepted in 1993 — hovered at near-record lows of 10.89%. Additionally, most S&P 500 companies' first-quarter 2007 earnings reports have exceeded investor expectations.
The market, despite a sudden sell-off in February that drove the S&P 500 down by 1.96% for the month, continued its strong performance during the quarter. The S&P 500 finished April up by more than 5% year-to-date.
Overall, the first quarter of 2007 marked the slowest U.S. economic growth in four years. This was mainly due to the ongoing drop in residential investments (down by 17%) and the increased trade deficit. Together, these factors also contributed to a 0.52% drop in the overall GDP growth rate for the quarter. Additionally, consumer spending, which accounts for about 70% of the U.S. economy, grew at an average rate of 3.8%, down from 4.2% during the previous quarter. Further, U.S. inflation — excluding volatile food and energy costs — jumped to 2.2% on an annual basis, up from a 1.8% fourth-quarter gain. At the same time, the U.S. Federal Funds rate remained unchanged at 5.25% over the period. These issues combined to cause U.S. consumer confidence to drop to its
7
Credit Suisse Mid-Cap Core Fund
Semiannual Investment Adviser's Report (continued)
April 30, 2007 (unaudited)
lowest level since October 2006, despite the fact that business investments, including spending on commercial construction as well as equipment and software, managed to rise at an annual rate of 2%.
From a global perspective, the European economy has sustained its strong momentum of growth during the first quarter of 2007.
Strategic review and outlook: Expect moderate growth
The largest contributor to performance came primarily from stock selection in consumer discretionary, utilities and materials sectors. Stock selection in financials was the largest detractor to performance. Additionally, health care and telecommunication services further contributed to underperformance.
For the next quarter, we expect the growth of the U.S. economy to continue at a moderate rate. However, contradicting readings from major U.S. economic indicators point to a slim chance of a Federal Funds rate increase or decrease over this time. Additionally, merger and acquisition activity is expected to remain at high levels over the quarter.
Throughout 2007, we expect a further weakening in the housing market in general (and sub-prime loan performance in particular). Additionally, while the U.S. dollar is expected to weaken relative to the Euro in the coming year, European equities are expected to outperform their U.S. counterparts. We also anticipate that stock market volatility, as measured by the VIX Index, will reach higher levels than those recorded during the first quarter of 2007.
Credit Suisse Quantitative Strategies Team
Joseph Cherian
William Weng
Todd Jablonski
Investing in small to medium-sized companies may be more volatile and less liquid than investments in larger companies.
In addition to historical information, this report contains forward-looking statements that may concern, among other things, domestic and foreign market, industry and economic trends and developments and government regulation and their potential impact on the Fund's investments. These statements are subject to risks and uncertainties and actual trends, developments and regulations in the future, and their impact on the Fund could be materially different from those projected, anticipated or implied. The Fund has no obligation to update or revise forward-looking statements.
The Fund adopted new investment strategies effective December 1, 2006 so that its holdings are selected using quantitative stock selection models rather than a more traditional fundamental analysis approach. Investors should be aware that performance information for periods prior to December 1, 2006 does not reflect the current investment strategies.
8
Credit Suisse Mid-Cap Core Fund
Semiannual Investment Adviser's Report (continued)
April 30, 2007 (unaudited)
Average Annual Returns as of March 31, 20071
| 1 Year | 5 Years | 10 Years | Since Inception | Inception Date | |||||||||||||||||||
| Common Class | 0.11 | % | 6.53 | % | 5.37 | % | 10.35 | % | 01/21/88 | ||||||||||||||
| Advisor Class | (0.37 | )% | 5.99 | % | 4.86 | % | 8.63 | % | 04/04/91 | ||||||||||||||
| Class A Without Sales Charge | (0.11 | )% | 6.24 | % | — | 5.65 | % | 11/30/01 | |||||||||||||||
| Class A With Maximum Sales Charge | (5.85 | )% | 4.98 | % | — | 4.49 | % | 11/30/01 | |||||||||||||||
| Class B Without CDSC | (0.88 | )% | — | — | 5.13 | % | 02/27/04 | ||||||||||||||||
| Class B With CDSC | (4.84 | )% | — | — | 4.84 | % | 02/27/04 | ||||||||||||||||
| Class C Without CDSC | (0.88 | )% | — | — | 5.13 | % | 02/27/04 | ||||||||||||||||
| Class C With CDSC | (1.87 | )% | — | — | 5.13 | % | 02/27/04 | ||||||||||||||||
Average Annual Returns as of April 30, 20071
| 1 Year | 5 Years | 10 Years | Since Inception | Inception Date | |||||||||||||||||||
| Common Class | 4.15 | % | 7.64 | % | 5.73 | % | 10.51 | % | 01/21/88 | ||||||||||||||
| Advisor Class | 3.62 | % | 7.10 | % | 5.22 | % | 8.83 | % | 04/04/91 | ||||||||||||||
| Class A Without Sales Charge | 3.86 | % | 7.34 | % | — | 6.28 | % | 11/30/01 | |||||||||||||||
| Class A With Maximum Sales Charge | (2.12 | )% | 6.08 | % | — | 5.12 | % | 11/30/01 | |||||||||||||||
| Class B Without CDSC | 3.07 | % | — | — | 6.19 | % | 02/27/04 | ||||||||||||||||
| Class B With CDSC | (0.93 | )% | — | — | 5.91 | % | 02/27/04 | ||||||||||||||||
| Class C Without CDSC | 3.13 | % | — | — | 6.21 | % | 02/27/04 | ||||||||||||||||
| Class C With CDSC | 2.13 | % | — | — | 6.21 | % | 02/27/04 | ||||||||||||||||
Returns represent past performance and include change in share price and reinvestment of dividends and capital gains. Past performance cannot guarantee future results. The current performance of the Fund may be lower or higher than the figures shown. Returns and share price will fluctuate, and redemption value may be more or less than original cost. The performance results do not reflect the deduction of taxes that a shareholder would pay on fund distributions or the redemption of fund shares. Performance information current to the most recent month-end is available at www.credit-suisse.com/us.
1 Fee waivers and/or expense reimbursements may reduce expenses for the Fund, without which performance would be lower. Waivers may be discontinued at any time.
2 Total return for the Fund's Class A Shares for the reporting period, based on offering price (with maximum sales charge of 5.75%), was 3.77%. Total return for the Fund's Class B Shares for the reporting period, based on redemption value (including maximum contingent deferred sales charge of 4%), was 5.69%. Total return for the Fund's Class C Shares for the reporting period, based on redemption value (including maximum contingent deferred sales charge of 1%), was 8.75%.
9
Credit Suisse Mid-Cap Core Fund
Semiannual Investment Adviser's Report (continued)
April 30, 2007 (unaudited)
3 The Standard & Poor's MidCap 400® Index is an unmanaged market weighted index of 400 U.S. stocks selected on the basis of capitalization, liquidity, and industry group representation. It is a registered trademark of McGraw-Hill Co., Inc. It became the Fund's benchmark index on December 1, 2006 in connection with the change in the Fund's investment strategy. The Russell 2500TM Growth Index measures the performance of those companies in the Russell 2500TM Index with higher price-to-book ratios and higher forecasted growth values. Investors cannot invest directly in an index.
4 The Russell Midcap® Growth Index measures the performance of those companies in the Russell Midcap® Index with higher price-to-book ratios and higher forecasted growth values. The stocks are also members of the Russell 1000® Growth Index.
The Russell 2500® Growth Index and Russell Midcap® Growth Index are unmanaged indices of common stocks that include reinvestment of dividends and are compiled by Frank Russell Company. Investors cannot invest directly in an index.
10
Credit Suisse Mid-Cap Core Fund
Semiannual Investment Adviser's Report (continued)
April 30, 2007 (unaudited)
Information About Your Fund's Expenses
As an investor of the Fund, you incur two types of costs: ongoing expenses and transaction costs. Ongoing expenses include management fees, distribution and service (12b-1) fees and other Fund expenses. Examples of transaction costs include sales charges (loads), redemption fees and account maintenance fees, which are not shown in this section and which would result in higher total expenses. The following table is intended to help you understand your ongoing expenses of investing in the Fund and to help you compare these expenses with the ongoing expenses of investing in other mutual funds. The table is based on an investment of $1,000 made at the beginning of the six month period ended April 30, 2007.
The table illustrates your Fund's expenses in two ways:
• Actual Fund Return. This helps you estimate the actual dollar amount of ongoing expenses paid on a $1,000 investment in the Fund using the Fund's actual return during the period. To estimate the expenses you paid over the period, simply divide your account value by $1,000 (for example, an $8,600 account value divided by $1,000 = 8.6), then multiply the result by the number in the "Expenses Paid per $1,000" line under the share class you hold.
• Hypothetical 5% Fund Return. This helps you to compare your Fund's ongoing expenses with those of other mutual funds using the Fund's actual expense ratio and a hypothetical rate of return of 5% per year before expenses. Examples using a 5% hypothetical fund return may be found in the shareholder reports of other mutual funds. The hypothetical account values and expenses may not be used to estimate the actual ending account balance or expenses you paid for the period.
Please note that the expenses shown in these tables are meant to highlight your ongoing expenses only and do not reflect any transaction costs, such as sales charges (loads) or redemption fees. If these transaction costs had been included, your costs would have been higher. The "Expenses Paid per $1,000" line of the tables is useful in comparing ongoing expenses only and will not help you determine the relative total expenses of owning different funds.
11
Credit Suisse Mid-Cap Core Fund
Semiannual Investment Adviser's Report (continued)
April 30, 2007 (unaudited)
Expenses and Value of a $1,000 Investment
for the six month period ended April 30, 2007
| Actual Fund Return | Common Class | Advisor Class | Class A | Class B | Class C | ||||||||||||||||||
| Beginning Account Value 11/1/06 | $ | 1,000.00 | $ | 1,000.00 | $ | 1,000.00 | $ | 1,000.00 | $ | 1,000.00 | |||||||||||||
| Ending Account Value 4/30/07 | $ | 1,102.70 | $ | 1,100.00 | $ | 1,101.10 | $ | 1,096.90 | $ | 1,097.50 | |||||||||||||
| Expenses Paid per $1,000* | $ | 6.46 | $ | 9.06 | $ | 7.76 | $ | 11.65 | $ | 11.65 | |||||||||||||
| Hypothetical 5% Fund Return | |||||||||||||||||||||||
| Beginning Account Value 11/1/06 | $ | 1,000.00 | $ | 1,000.00 | $ | 1,000.00 | $ | 1,000.00 | $ | 1,000.00 | |||||||||||||
| Ending Account Value 4/30/07 | $ | 1,018.65 | $ | 1,016.17 | $ | 1,017.41 | $ | 1,013.69 | $ | 1,013.69 | |||||||||||||
| Expenses Paid per $1,000* | $ | 6.21 | $ | 8.70 | $ | 7.45 | $ | 11.18 | $ | 11.18 | |||||||||||||
| Common Class | Advisor Class | Class A | Class B | Class C | |||||||||||||||||||
| Annualized Expense Ratios* | 1.24 | % | 1.74 | % | 1.49 | % | 2.24 | % | 2.24 | % | |||||||||||||
* Expenses are equal to the Fund's annualized expense ratio for each share class, multiplied by the average account value over the period, multiplied by the number of days in the most recent fiscal half year period, then divided by 365.
The "Expenses Paid per $1,000" and the "Annualized Expense Ratios" in the tables are based on actual expenses paid by the Fund during the period, net of fee waivers and/or expense reimbursements. If those fee waivers and/or expense reimbursements had not been in effect, the Fund's actual expenses would have been higher.
For more information, please refer to the Fund's prospectus.
12
Credit Suisse Mid-Cap Core Fund
Semiannual Investment Adviser's Report (continued)
April 30, 2007 (unaudited)
SECTOR BREAKDOWN*
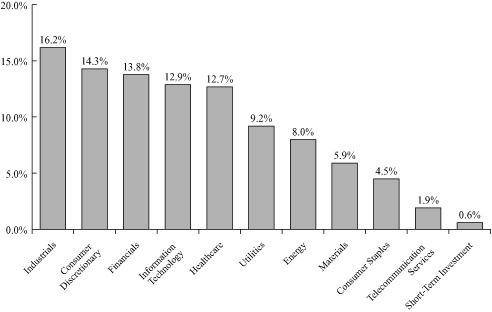
* Expressed as a percentage of total investments (excluding security lending collateral) and may vary over time.
13
Credit Suisse Large Cap Growth Fund
Schedule of Investments
April 30, 2007 (unaudited)
| Number of Shares | Value | ||||||||||
| COMMON STOCKS (100.0%) | |||||||||||
| Aerospace & Defense (3.8%) | |||||||||||
| Boeing Co. | 19,800 | $ | 1,841,400 | ||||||||
| L-3 Communications Holdings, Inc. | 8,300 | 746,419 | |||||||||
| Lockheed Martin Corp. | 7,700 | 740,278 | |||||||||
| Raytheon Co. | 15,800 | 845,932 | |||||||||
| United Technologies Corp. | 4,600 | 308,798 | |||||||||
| 4,482,827 | |||||||||||
| Air Freight & Couriers (1.0%) | |||||||||||
| FedEx Corp. | 11,000 | 1,159,840 | |||||||||
| Airlines (0.8%) | |||||||||||
| AMR Corp.*§ | 15,600 | 407,004 | |||||||||
| Continental Airlines, Inc. Class B*§ | 11,500 | 420,440 | |||||||||
| Southwest Airlines Co. | 7,600 | 109,060 | |||||||||
| 936,504 | |||||||||||
| Auto Components (0.9%) | |||||||||||
| BorgWarner, Inc. | 9,400 | 732,354 | |||||||||
| Johnson Controls, Inc. | 1,900 | 194,427 | |||||||||
| TRW Automotive Holdings Corp.* | 3,200 | 118,592 | |||||||||
| 1,045,373 | |||||||||||
| Automobiles (0.8%) | |||||||||||
| Avis Budget Group, Inc.* | 20,000 | 562,600 | |||||||||
| Harley-Davidson, Inc.§ | 5,000 | 316,600 | |||||||||
| 879,200 | |||||||||||
| Banks (0.8%) | |||||||||||
| Wells Fargo & Co. | 26,300 | 943,907 | |||||||||
| Beverages (3.3%) | |||||||||||
| Coca-Cola Co. | 8,300 | 433,177 | |||||||||
| Molson Coors Brewing Co. Class B | 7,100 | 669,388 | |||||||||
| Pepsi Bottling Group, Inc. | 24,900 | 816,969 | |||||||||
| PepsiCo, Inc. | 30,000 | 1,982,700 | |||||||||
| 3,902,234 | |||||||||||
| Biotechnology (2.9%) | |||||||||||
| Amgen, Inc.* | 29,800 | 1,911,372 | |||||||||
| Biogen Idec, Inc.* | 6,300 | 297,423 | |||||||||
| Cephalon, Inc.*§ | 6,000 | 477,660 | |||||||||
| Genentech, Inc.* | 3,100 | 247,969 | |||||||||
| Genzyme Corp.* | 5,600 | 365,736 | |||||||||
| Invitrogen Corp.* | 1,800 | 117,846 | |||||||||
| 3,418,006 | |||||||||||
| Chemicals (1.0%) | |||||||||||
| Ashland, Inc. | 5,900 | 353,705 | |||||||||
| PPG Industries, Inc. | 6,300 | 463,554 | |||||||||
| Rohm and Haas Co. | 7,400 | 378,658 | |||||||||
| 1,195,917 | |||||||||||
See Accompanying Notes to Financial Statements.
14
Credit Suisse Large Cap Growth Fund
Schedule of Investments (continued)
April 30, 2007 (unaudited)
| Number of Shares | Value | ||||||||||
| COMMON STOCKS | |||||||||||
| Commercial Services & Supplies (1.1%) | |||||||||||
| Checkfree Corp*§ | 3,300 | $ | 111,078 | ||||||||
| Con-way, Inc. | 2,400 | 131,112 | |||||||||
| Kelly Services, Inc. Class A | 3,500 | 100,450 | |||||||||
| Manpower, Inc. | 2,400 | 192,600 | |||||||||
| Steelcase, Inc. Class A§ | 39,000 | 761,280 | |||||||||
| 1,296,520 | |||||||||||
| Communications Equipment (3.7%) | |||||||||||
| Cisco Systems, Inc.* | 83,100 | 2,222,094 | |||||||||
| Corning, Inc.* | 16,300 | 386,636 | |||||||||
| Harris Corp. | 14,400 | 739,440 | |||||||||
| Motorola, Inc. | 31,000 | 537,230 | |||||||||
| Qualcomm, Inc. | 9,700 | 424,860 | |||||||||
| 4,310,260 | |||||||||||
| Computers & Peripherals (6.8%) | |||||||||||
| Apple Computer, Inc.* | 10,200 | 1,017,960 | |||||||||
| Dell, Inc.* | 56,200 | 1,416,802 | |||||||||
| Hewlett-Packard Co. | 43,000 | 1,812,020 | |||||||||
| International Business Machines Corp. | 29,400 | 3,004,974 | |||||||||
| Western Digital Corp.* | 42,900 | 758,472 | |||||||||
| 8,010,228 | |||||||||||
| Diversified Financials (5.3%) | |||||||||||
| American Express Co. | 4,300 | 260,881 | |||||||||
| Eaton Vance Corp. | 8,400 | 321,048 | |||||||||
| Franklin Resources, Inc. | 7,500 | 984,825 | |||||||||
| Goldman Sachs Group, Inc. | 7,700 | 1,683,297 | |||||||||
| Merrill Lynch & Company, Inc. | 10,900 | 983,507 | |||||||||
| Moody's Corp. | 3,900 | 257,868 | |||||||||
| Morgan Stanley | 10,700 | 898,907 | |||||||||
| Nuveen Investments, Inc. Class A§ | 2,900 | 154,570 | |||||||||
| State Street Corp. | 5,200 | 358,124 | |||||||||
| Western Union Co. | 12,400 | 261,020 | |||||||||
| 6,164,047 | |||||||||||
| Diversified Telecommunication Services (0.3%) | |||||||||||
| AT&T, Inc. | 4,700 | 181,984 | |||||||||
| Qwest Communications International, Inc.*§ | 13,100 | 116,328 | |||||||||
| 298,312 | |||||||||||
| Electric Utilities (1.3%) | |||||||||||
| Allegheny Energy, Inc.* | 2,700 | 144,342 | |||||||||
| Constellation Energy Group | 8,000 | 712,960 | |||||||||
| Exelon Corp. | 4,500 | 339,345 | |||||||||
| FPL Group, Inc. | 5,400 | 347,598 | |||||||||
| 1,544,245 | |||||||||||
See Accompanying Notes to Financial Statements.
15
Credit Suisse Large Cap Growth Fund
Schedule of Investments (continued)
April 30, 2007 (unaudited)
| Number of Shares | Value | ||||||||||
| COMMON STOCKS | |||||||||||
| Electrical Equipment (0.3%) | |||||||||||
| Thomas & Betts Corp.* | 6,800 | $ | 370,464 | ||||||||
| Electronic Equipment & Instruments (0.5%) | |||||||||||
| Jabil Circuit, Inc.§ | 17,900 | 417,070 | |||||||||
| Thermo Fisher Scientific, Inc.* | 2,400 | 124,944 | |||||||||
| 542,014 | |||||||||||
| Energy Equipment & Services (1.9%) | |||||||||||
| Bonneville Pacific Corp.*^ | 16,883 | 127 | |||||||||
| ENSCO International, Inc.§ | 13,200 | 744,216 | |||||||||
| Halliburton Co. | 7,600 | 241,452 | |||||||||
| Helmerich & Payne, Inc.§ | 3,900 | 125,931 | |||||||||
| Tidewater, Inc.§ | 6,200 | 391,902 | |||||||||
| Unit Corp.* | 12,800 | 731,520 | |||||||||
| 2,235,148 | |||||||||||
| Food & Drug Retailing (0.6%) | |||||||||||
| CVS Corp. | 3,400 | 123,216 | |||||||||
| Kroger Co. | 13,800 | 407,238 | |||||||||
| Walgreen Co.§ | 3,000 | 131,700 | |||||||||
| 662,154 | |||||||||||
| Food Products (0.6%) | |||||||||||
| Corn Products International, Inc. | 9,300 | 370,326 | |||||||||
| H. J. Heinz Co. | 7,700 | 362,747 | |||||||||
| 733,073 | |||||||||||
| Healthcare Equipment & Supplies (3.6%) | |||||||||||
| Baxter International, Inc. | 16,500 | 934,395 | |||||||||
| Becton Dickinson & Co. | 13,500 | 1,062,315 | |||||||||
| C. R. Bard, Inc. | 5,300 | 440,589 | |||||||||
| Edwards Lifesciences Corp.*§ | 14,900 | 730,100 | |||||||||
| IMS Health, Inc. | 14,100 | 413,553 | |||||||||
| Kinetic Concepts, Inc.*§ | 3,500 | 175,000 | |||||||||
| Medtronic, Inc. | 5,000 | 264,650 | |||||||||
| Stryker Corp. | 3,900 | 253,266 | |||||||||
| 4,273,868 | |||||||||||
| Healthcare Providers & Services (5.0%) | |||||||||||
| Aetna, Inc. | 17,000 | 796,960 | |||||||||
| Coventry Health Care, Inc.* | 10,300 | 595,649 | |||||||||
| Express Scripts, Inc.* | 2,500 | 238,875 | |||||||||
| Humana, Inc.* | 11,600 | 733,584 | |||||||||
| Laboratory Corporation of America Holdings* | 4,600 | 363,124 | |||||||||
| Lincare Holdings, Inc.* | 3,200 | 126,208 | |||||||||
| McKesson Corp. | 14,900 | 876,567 | |||||||||
| United Health Group, Inc. | 33,700 | 1,788,122 | |||||||||
| WellCare Health Plans, Inc.*§ | 2,600 | 209,534 | |||||||||
| WellPoint, Inc.* | 1,900 | 150,043 | |||||||||
| 5,878,666 | |||||||||||
See Accompanying Notes to Financial Statements.
16
Credit Suisse Large Cap Growth Fund
Schedule of Investments (continued)
April 30, 2007 (unaudited)
| Number of Shares | Value | ||||||||||
| COMMON STOCKS | |||||||||||
| Hotels, Restaurants & Leisure (0.9%) | |||||||||||
| Brinker International, Inc.§ | 23,000 | $ | 715,300 | ||||||||
| Choice Hotels International, Inc.§ | 8,300 | 312,412 | |||||||||
| 1,027,712 | |||||||||||
| Household Durables (1.5%) | |||||||||||
| American Greetings Corp. Class A§ | 7,700 | 195,965 | |||||||||
| Harman International Industries, Inc. | 5,900 | 719,151 | |||||||||
| NVR, Inc.*§ | 400 | 329,600 | |||||||||
| Whirlpool Corp.§ | 5,300 | 561,959 | |||||||||
| 1,806,675 | |||||||||||
| Household Products (1.6%) | |||||||||||
| Colgate-Palmolive Co. | 7,200 | 487,728 | |||||||||
| Procter & Gamble Co. | 21,800 | 1,401,958 | |||||||||
| 1,889,686 | |||||||||||
| Industrial Conglomerates (2.7%) | |||||||||||
| 3M Co. | 2,700 | 223,479 | |||||||||
| General Electric Co. | 58,500 | 2,156,310 | |||||||||
| Honeywell International, Inc. | 14,800 | 801,864 | |||||||||
| 3,181,653 | |||||||||||
| Insurance (2.7%) | |||||||||||
| Arthur J. Gallagher & Co.§ | 9,700 | 271,212 | |||||||||
| Axis Capital Holdings, Ltd. | 18,500 | 686,350 | |||||||||
| Brown & Brown, Inc. | 14,600 | 375,950 | |||||||||
| HCC Insurance Holdings, Inc. | 6,400 | 196,224 | |||||||||
| Prudential Financial, Inc. | 9,100 | 864,500 | |||||||||
| W.R. Berkley Corp. | 22,300 | 724,527 | |||||||||
| 3,118,763 | |||||||||||
| Internet & Catalog Retail (0.1%) | |||||||||||
| Nutri/System, Inc.*§ | 2,500 | 155,000 | |||||||||
| Internet Software & Services (1.8%) | |||||||||||
| eBay, Inc.* | 4,200 | 142,548 | |||||||||
| Google, Inc. Class A* | 2,900 | 1,367,002 | |||||||||
| IAC/InterActiveCorp.*§ | 9,700 | 369,764 | |||||||||
| VeriSign, Inc.*§ | 10,500 | 287,175 | |||||||||
| 2,166,489 | |||||||||||
| IT Consulting & Services (1.4%) | |||||||||||
| Accenture, Ltd. Class A | 20,800 | 813,280 | |||||||||
| Electronic Data Systems Corp. | 27,700 | 809,948 | |||||||||
| 1,623,228 | |||||||||||
| Leisure Equipment & Products (0.3%) | |||||||||||
| Eastman Kodak Co.§ | 12,700 | 316,357 | |||||||||
See Accompanying Notes to Financial Statements.
17
Credit Suisse Large Cap Growth Fund
Schedule of Investments (continued)
April 30, 2007 (unaudited)
| Number of Shares | Value | ||||||||||
| COMMON STOCKS | |||||||||||
| Machinery (3.3%) | |||||||||||
| Caterpillar, Inc. | 3,400 | $ | 246,908 | ||||||||
| Cummins, Inc. | 10,400 | 958,464 | |||||||||
| Dover Corp. | 17,600 | 846,912 | |||||||||
| Gardner Denver, Inc.* | 4,500 | 170,100 | |||||||||
| Lincoln Electric Holdings, Inc. | 9,100 | 579,943 | |||||||||
| Manitowoc Company, Inc. | 5,300 | 361,619 | |||||||||
| Parker Hannifin Corp. | 8,200 | 755,548 | |||||||||
| 3,919,494 | |||||||||||
| Media (2.5%) | |||||||||||
| DirecTV Group, Inc.* | 41,300 | 984,592 | |||||||||
| EchoStar Communications Corp. Class A* | 18,000 | 837,540 | |||||||||
| McGraw-Hill Companies, Inc. | 3,600 | 235,908 | |||||||||
| News Corp. Class A | 25,800 | 577,662 | |||||||||
| Walt Disney Co. | 9,200 | 321,816 | |||||||||
| 2,957,518 | |||||||||||
| Metals & Mining (1.1%) | |||||||||||
| Carpenter Technology Corp. | 3,600 | 436,932 | |||||||||
| Freeport-McMoRan Copper & Gold, Inc. Class B§ | 12,470 | 837,485 | |||||||||
| 1,274,417 | |||||||||||
| Multiline Retail (3.8%) | |||||||||||
| Dollar Tree Stores, Inc.* | 14,300 | 562,276 | |||||||||
| Federated Department Stores, Inc. | 15,600 | 685,152 | |||||||||
| J.C. Penney Company, Inc. | 1,700 | 134,453 | |||||||||
| Kohl's Corp.* | 14,000 | 1,036,560 | |||||||||
| Target Corp. | 2,000 | 118,740 | |||||||||
| Wal-Mart Stores, Inc. | 39,100 | 1,873,672 | |||||||||
| 4,410,853 | |||||||||||
| Oil & Gas (2.3%) | |||||||||||
| Exxon Mobil Corp. | 14,300 | 1,135,134 | |||||||||
| Marathon Oil Corp. | 6,500 | 660,075 | |||||||||
| Todco*§ | 19,900 | 904,654 | |||||||||
| 2,699,863 | |||||||||||
| Paper & Forest Products (0.3%) | |||||||||||
| International Paper Co. | 8,200 | 309,304 | |||||||||
| Personal Products (0.5%) | |||||||||||
| Avon Products, Inc. | 6,400 | 254,720 | |||||||||
| Estee Lauder Companies, Inc. Class A | 6,900 | 354,798 | |||||||||
| 609,518 | |||||||||||
| Pharmaceuticals (7.5%) | |||||||||||
| Abbott Laboratories | 7,900 | 447,298 | |||||||||
| Endo Pharmaceuticals Holdings, Inc.* | 8,300 | 256,802 | |||||||||
| Forest Laboratories, Inc.* | 17,800 | 947,138 | |||||||||
| Johnson & Johnson | 52,500 | 3,371,550 | |||||||||
See Accompanying Notes to Financial Statements.
18
Credit Suisse Large Cap Growth Fund
Schedule of Investments (continued)
April 30, 2007 (unaudited)
| Number of Shares | Value | ||||||||||
| COMMON STOCKS | |||||||||||
| Pharmaceuticals | |||||||||||
| Merck & Company, Inc. | 22,400 | $ | 1,152,256 | ||||||||
| Mylan Laboratories, Inc.§ | 36,200 | 793,866 | |||||||||
| Pfizer, Inc. | 9,500 | 251,370 | |||||||||
| Schering-Plough Corp. | 50,200 | 1,592,846 | |||||||||
| 8,813,126 | |||||||||||
| Real Estate (0.6%) | |||||||||||
| CB Richard Ellis Group, Inc. Class A* | 19,900 | 673,615 | |||||||||
| Road & Rail (1.4%) | |||||||||||
| CSX Corp. | 17,900 | 772,743 | |||||||||
| Union Pacific Corp. | 7,100 | 811,175 | |||||||||
| 1,583,918 | |||||||||||
| Semiconductor Equipment & Products (5.8%) | |||||||||||
| Applied Materials, Inc. | 56,600 | 1,087,852 | |||||||||
| Intel Corp. | 127,900 | 2,749,850 | |||||||||
| Lam Research Corp.* | 9,100 | 489,398 | |||||||||
| MEMC Electronic Materials, Inc.* | 2,100 | 115,248 | |||||||||
| Novellus Systems, Inc.* | 14,500 | 469,365 | |||||||||
| Teradyne, Inc.* | 19,100 | 333,295 | |||||||||
| Texas Instruments, Inc. | 46,800 | 1,608,516 | |||||||||
| 6,853,524 | |||||||||||
| Software (5.5%) | |||||||||||
| Autodesk, Inc.* | 4,400 | 181,588 | |||||||||
| Intuit, Inc.* | 4,300 | 122,335 | |||||||||
| Microsoft Corp. | 165,600 | 4,958,064 | |||||||||
| Oracle Corp.* | 24,100 | 453,080 | |||||||||
| Synopsys, Inc.* | 28,400 | 785,544 | |||||||||
| 6,500,611 | |||||||||||
| Specialty Retail (4.4%) | |||||||||||
| Abercrombie & Fitch Co. Class A | 4,500 | 367,470 | |||||||||
| American Eagle Outfitters, Inc. | 11,600 | 341,852 | |||||||||
| AnnTaylor Stores Corp.* | 3,600 | 138,528 | |||||||||
| AutoZone, Inc.* | 1,200 | 159,648 | |||||||||
| Best Buy Company, Inc. | 10,000 | 466,500 | |||||||||
| Circuit City Stores, Inc. | 19,600 | 342,020 | |||||||||
| Dick's Sporting Goods, Inc.*§ | 2,600 | 145,834 | |||||||||
| Home Depot, Inc. | 12,000 | 454,440 | |||||||||
| Lowe's Companies, Inc. | 11,400 | 348,384 | |||||||||
| Office Depot, Inc.* | 25,300 | 850,586 | |||||||||
| Rent-A-Center, Inc.*§ | 8,900 | 247,776 | |||||||||
| Ross Stores, Inc. | 11,400 | 377,910 | |||||||||
| Sherwin-Williams Co. | 2,000 | 127,540 | |||||||||
| Staples, Inc. | 5,400 | 133,920 | |||||||||
| TJX Companies, Inc. | 24,400 | 680,516 | |||||||||
| 5,182,924 | |||||||||||
See Accompanying Notes to Financial Statements.
19
Credit Suisse Large Cap Growth Fund
Schedule of Investments (continued)
April 30, 2007 (unaudited)
| Number of Shares | Value | ||||||||||
| COMMON STOCKS | |||||||||||
| Textiles & Apparel (0.4%) | |||||||||||
| Nike, Inc. Class B | 9,000 | $ | 484,740 | ||||||||
| Tobacco (1.1%) | |||||||||||
| Altria Group, Inc. | 16,100 | 1,109,612 | |||||||||
| Loews Corp. - Carolina Group | 2,200 | 168,366 | |||||||||
| 1,277,978 | |||||||||||
| Wireless Telecommunication Services (0.2%) | |||||||||||
| United States Cellular Corp.* | 4,000 | 290,000 | |||||||||
| TOTAL COMMON STOCKS (Cost $107,480,700) | 117,409,773 | ||||||||||
| SHORT-TERM INVESTMENTS (9.0%) | |||||||||||
| State Street Navigator Prime Portfolio§§ | 10,187,224 | 10,187,224 | |||||||||
| Par (000) | |||||||||||
| State Street Bank and Trust Co. Euro Time Deposit, 4.100%, 05/01/07 | $ | 363 | 363,000 | ||||||||
| TOTAL SHORT-TERM INVESTMENTS (Cost $10,550,224) | 10,550,224 | ||||||||||
| TOTAL INVESTMENTS AT VALUE (109.0%) (Cost $118,030,924) | 127,959,997 | ||||||||||
| LIABILITIES IN EXCESS OF OTHER ASSETS (-9.0%) | (10,532,596 | ) | |||||||||
| NET ASSETS (100.0%) | $ | 117,427,401 | |||||||||
* Non-income producing security.
^ Not readily marketable security; security is valued at fair value as determined in good faith by, or under the direction of, the Board of Trustees.
§ Security or a portion thereof is on loan.
§§ Represents security purchased with cash collateral received for securities on loan.
See Accompanying Notes to Financial Statements.
20
Credit Suisse Mid-Cap Core Fund
Schedule of Investments
April 30, 2007 (unaudited)
| Number of Shares | Value | ||||||||||
| COMMON STOCKS (100.3%) | |||||||||||
| Aerospace & Defense (1.3%) | |||||||||||
| Armor Holdings, Inc.* | 4,000 | $ | 286,000 | ||||||||
| L-3 Communications Holdings, Inc. | 12,500 | 1,124,125 | |||||||||
| Precision Castparts Corp. | 10,500 | 1,093,155 | |||||||||
| 2,503,280 | |||||||||||
| Air Freight & Couriers (0.2%) | |||||||||||
| Expeditors International of Washington, Inc. | 9,700 | 405,460 | |||||||||
| Airlines (0.8%) | |||||||||||
| Alaska Air Group, Inc.* | 42,800 | 1,266,880 | |||||||||
| AMR Corp.*§ | 6,100 | 159,149 | |||||||||
| Continental Airlines, Inc. Class B*§ | 5,500 | 201,080 | |||||||||
| 1,627,109 | |||||||||||
| Auto Components (1.4%) | |||||||||||
| ArvinMeritor, Inc.§ | 13,300 | 274,645 | |||||||||
| Autoliv, Inc. | 14,300 | 831,545 | |||||||||
| BorgWarner, Inc. | 21,800 | 1,698,438 | |||||||||
| 2,804,628 | |||||||||||
| Automobiles (0.9%) | |||||||||||
| Avis Budget Group, Inc.* | 62,400 | 1,755,312 | |||||||||
| Banks (2.1%) | |||||||||||
| Bank of Hawaii Corp. | 24,700 | 1,306,630 | |||||||||
| Cullen/Frost Bankers, Inc. | 28,800 | 1,473,696 | |||||||||
| Northern Trust Corp. | 6,700 | 421,765 | |||||||||
| SVB Financial Group*§ | 18,700 | 957,814 | |||||||||
| 4,159,905 | |||||||||||
| Beverages (1.0%) | |||||||||||
| Molson Coors Brewing Co. Class B | 14,500 | 1,367,060 | |||||||||
| Pepsi Bottling Group, Inc. | 15,900 | 521,679 | |||||||||
| 1,888,739 | |||||||||||
| Biotechnology (1.6%) | |||||||||||
| Cephalon, Inc.*§ | 26,800 | �� | 2,133,548 | ||||||||
| Invitrogen Corp.* | 15,500 | 1,014,785 | |||||||||
| 3,148,333 | |||||||||||
| Building Products (0.2%) | |||||||||||
| Lennox International, Inc. | 11,300 | 382,053 | |||||||||
| Chemicals (3.9%) | |||||||||||
| Albemarle Corp. | 38,700 | 1,642,815 | |||||||||
| Cabot Corp. | 4,800 | 217,440 | |||||||||
| FMC Corp. | 19,700 | 1,515,521 | |||||||||
| Huntsman Corp. | 21,000 | 411,600 | |||||||||
| Lubrizol Corp. | 35,000 | 2,097,900 | |||||||||
| Lyondell Chemical Co. | 28,300 | 880,696 | |||||||||
| PPG Industries, Inc. | 5,800 | 426,764 | |||||||||
| Rohm and Haas Co. | 11,600 | 593,572 | |||||||||
| 7,786,308 | |||||||||||
See Accompanying Notes to Financial Statements.
21
Credit Suisse Mid-Cap Core Fund
Schedule of Investments (continued)
April 30, 2007 (unaudited)
| Number of Shares | Value | ||||||||||
| COMMON STOCKS | |||||||||||
| Commercial Services & Supplies (5.7%) | |||||||||||
| Alliance Data Systems Corp.* | 3,700 | $ | 235,542 | ||||||||
| Con-way, Inc. | 9,400 | 513,522 | |||||||||
| Deluxe Corp. | 9,800 | 370,930 | |||||||||
| DeVry, Inc. | 14,600 | 481,654 | |||||||||
| FactSet Research Systems, Inc. | 7,500 | 461,325 | |||||||||
| Fiserv, Inc.* | 7,800 | 414,726 | |||||||||
| Global Payments, Inc. | 51,800 | 1,967,364 | |||||||||
| Herman Miller, Inc. | 47,500 | 1,634,475 | |||||||||
| Kelly Services, Inc. Class A§ | 37,500 | 1,076,250 | |||||||||
| Korn/Ferry International*§ | 42,700 | 1,006,439 | |||||||||
| Manpower, Inc. | 21,400 | 1,717,350 | |||||||||
| Navigant Consulting, Inc.*§ | 23,700 | 454,566 | |||||||||
| Steelcase, Inc. Class A§ | 45,500 | 888,160 | |||||||||
| 11,222,303 | |||||||||||
| Commingled Fund (0.5%) | |||||||||||
| iShares S&P MidCap 400 Index Fund§ | 11,500 | 1,000,270 | |||||||||
| Communications Equipment (1.4%) | |||||||||||
| Harris Corp. | 43,500 | 2,233,725 | |||||||||
| Polycom, Inc.* | 14,100 | 469,530 | |||||||||
| 2,703,255 | |||||||||||
| Computers & Peripherals (0.7%) | |||||||||||
| Western Digital Corp.* | 76,800 | 1,357,824 | |||||||||
| Construction & Engineering (0.9%) | |||||||||||
| Granite Construction, Inc. | 24,500 | 1,475,880 | |||||||||
| Jacobs Engineering Group, Inc.* | 6,800 | 342,924 | |||||||||
| 1,818,804 | |||||||||||
| Containers & Packaging (0.3%) | |||||||||||
| Sonoco Products Co. | 15,700 | 669,448 | |||||||||
| Diversified Financials (3.7%) | |||||||||||
| A.G. Edwards, Inc. | 29,600 | 2,144,520 | |||||||||
| Eaton Vance Corp. | 25,000 | 955,500 | |||||||||
| IndyMac Bancorp, Inc.§ | 100 | 3,024 | |||||||||
| Investment Technology Group, Inc.* | 12,800 | 484,352 | |||||||||
| Jefferies Group, Inc. | 24,200 | 767,140 | |||||||||
| Nasdaq Stock Market, Inc.* | 20,500 | 667,480 | |||||||||
| Nuveen Investments, Inc. Class A§ | 26,200 | 1,396,460 | |||||||||
| NYSE Euronext*§ | 4,700 | 396,351 | |||||||||
| Waddell & Reed Financial, Inc. Class A | 16,500 | 399,630 | |||||||||
| 7,214,457 | |||||||||||
| Diversified Telecommunication Services (1.0%) | |||||||||||
| CenturyTel, Inc. | 13,300 | 612,465 | |||||||||
| Cincinnati Bell, Inc.* | 133,900 | 678,873 | |||||||||
| Embarq Corp. | 10,700 | 642,428 | |||||||||
| 1,933,766 | |||||||||||
See Accompanying Notes to Financial Statements.
22
Credit Suisse Mid-Cap Core Fund
Schedule of Investments (continued)
April 30, 2007 (unaudited)
| Number of Shares | Value | ||||||||||
| COMMON STOCKS | |||||||||||
| Electric Utilities (6.4%) | |||||||||||
| Allegheny Energy, Inc.* | 10,600 | $ | 566,676 | ||||||||
| Alliant Energy Corp. | 32,400 | 1,419,120 | |||||||||
| Constellation Energy Group | 5,100 | 454,512 | |||||||||
| Edison International | 12,500 | 654,375 | |||||||||
| Mirant Corp.* | 26,500 | 1,189,055 | |||||||||
| NSTAR | 61,800 | 2,218,620 | |||||||||
| OGE Energy Corp. | 44,600 | 1,714,424 | |||||||||
| Pepco Holdings, Inc. | 88,300 | 2,606,616 | |||||||||
| PNM Resources, Inc. | 13,700 | 445,935 | |||||||||
| Puget Energy, Inc. | 52,900 | 1,365,878 | |||||||||
| 12,635,211 | |||||||||||
| Electrical Equipment (1.4%) | |||||||||||
| Acuity Brands, Inc. | 5,500 | 325,160 | |||||||||
| Energizer Holdings, Inc.*§ | 5,400 | 524,772 | |||||||||
| Genlyte Group, Inc.* | 4,400 | 343,244 | |||||||||
| Thomas & Betts Corp.* | 27,800 | 1,514,544 | |||||||||
| 2,707,720 | |||||||||||
| Electronic Equipment & Instruments (1.7%) | |||||||||||
| Amphenol Corp. Class A | 12,400 | 435,364 | |||||||||
| Avnet, Inc.* | 26,500 | 1,083,850 | |||||||||
| Plexus Corp.* | 34,500 | 723,120 | |||||||||
| Vishay Intertechnology, Inc.* | 40,000 | 666,000 | |||||||||
| Waters Corp.* | 7,500 | 445,725 | |||||||||
| 3,354,059 | |||||||||||
| Energy Equipment & Services (4.4%) | |||||||||||
| Cameron International Corp.* | 9,100 | 587,587 | |||||||||
| Grant Prideco, Inc.* | 14,200 | 731,868 | |||||||||
| Helmerich & Payne, Inc. | 52,900 | 1,708,141 | |||||||||
| Patterson-UTI Energy, Inc.§ | 20,700 | 504,873 | |||||||||
| Pride International, Inc.* | 62,600 | 2,053,906 | |||||||||
| Tidewater, Inc.§ | 37,500 | 2,370,375 | |||||||||
| Unit Corp.* | 11,300 | 645,795 | |||||||||
| 8,602,545 | |||||||||||
| Food & Drug Retailing (0.7%) | |||||||||||
| Rite Aid Corp.*§ | 70,200 | 431,028 | |||||||||
| Safeway, Inc. | 23,700 | 860,310 | |||||||||
| 1,291,338 | |||||||||||
| Food Products (1.2%) | |||||||||||
| Corn Products International, Inc. | 19,200 | 764,544 | |||||||||
| Hormel Foods Corp. | 13,600 | 518,024 | |||||||||
| J.M. Smucker Co. | 11,800 | 658,676 | |||||||||
| McCormick & Co., Inc. | 10,600 | 393,472 | |||||||||
| 2,334,716 | |||||||||||
See Accompanying Notes to Financial Statements.
23
Credit Suisse Mid-Cap Core Fund
Schedule of Investments (continued)
April 30, 2007 (unaudited)
| Number of Shares | Value | ||||||||||
| COMMON STOCKS | |||||||||||
| Gas Utilities (2.5%) | |||||||||||
| Energen Corp. | 18,900 | $ | 1,059,345 | ||||||||
| MDU Resources Group, Inc. | 65,600 | 1,987,680 | |||||||||
| ONEOK, Inc. | 11,800 | 571,238 | |||||||||
| UGI Corp. | 48,400 | 1,372,624 | |||||||||
| 4,990,887 | |||||||||||
| Healthcare Equipment & Supplies (3.5%) | |||||||||||
| Advanced Medical Optics, Inc.*§ | 24,700 | 998,621 | |||||||||
| Applera Corp. - Applied Biosystems Group | 27,100 | 846,604 | |||||||||
| C. R. Bard, Inc. | 7,600 | 631,788 | |||||||||
| Cytyc Corp.* | 25,500 | 898,365 | |||||||||
| Edwards Lifesciences Corp.* | 25,600 | 1,254,400 | |||||||||
| IMS Health, Inc. | 20,800 | 610,064 | |||||||||
| Kinetic Concepts, Inc.* | 10,300 | 515,000 | |||||||||
| Mentor Corp.§ | 6,300 | 245,133 | |||||||||
| Varian Medical Systems, Inc.* | 14,900 | 628,929 | |||||||||
| Ventana Medical Systems, Inc.*§ | 5,100 | 247,809 | |||||||||
| 6,876,713 | |||||||||||
| Healthcare Providers & Services (5.3%) | |||||||||||
| AmerisourceBergen Corp. | 11,500 | 574,885 | |||||||||
| Apria Healthcare Group, Inc.* | 13,000 | 412,620 | |||||||||
| Community Health Systems, Inc.* | 6,900 | 253,920 | |||||||||
| Covance, Inc.* | 17,700 | 1,070,850 | |||||||||
| Coventry Health Care, Inc.* | 7,200 | 416,376 | |||||||||
| DaVita, Inc.* | 7,400 | 404,114 | |||||||||
| Express Scripts, Inc.* | 5,400 | 515,970 | |||||||||
| Health Net, Inc.* | 7,900 | 427,074 | |||||||||
| Henry Schein, Inc.* | 7,700 | 401,401 | |||||||||
| Humana, Inc.* | 26,900 | 1,701,156 | |||||||||
| Laboratory Corporation of America Holdings*§ | 7,000 | 552,580 | |||||||||
| Lincare Holdings, Inc.* | 54,800 | 2,161,312 | |||||||||
| Universal Health Services, Inc. Class B | 10,100 | 613,272 | |||||||||
| WellCare Health Plans, Inc.*§ | 12,600 | 1,015,434 | |||||||||
| 10,520,964 | |||||||||||
| Hotels, Restaurants & Leisure (1.0%) | |||||||||||
| Brinker International, Inc. | 60,900 | 1,893,990 | |||||||||
| Household Durables (1.8%) | |||||||||||
| American Greetings Corp. Class A§ | 59,400 | 1,511,730 | |||||||||
| Dolby Laboratories, Inc. Class A* | 12,700 | 449,834 | |||||||||
| Mohawk Industries, Inc.*§ | 4,600 | 414,736 | |||||||||
| NVR, Inc.*§ | 600 | 494,400 | |||||||||
| Whirlpool Corp.§ | 6,900 | 731,607 | |||||||||
| 3,602,307 | |||||||||||
| Household Products (0.2%) | |||||||||||
| Clorox Co. | 6,300 | 422,604 | |||||||||
See Accompanying Notes to Financial Statements.
24
Credit Suisse Mid-Cap Core Fund
Schedule of Investments (continued)
April 30, 2007 (unaudited)
| Number of Shares | Value | ||||||||||
| COMMON STOCKS | |||||||||||
| Industrial Conglomerates (0.8%) | |||||||||||
| Teleflex, Inc. | 22,900 | $ | 1,644,907 | ||||||||
| Insurance (7.3%) | |||||||||||
| American Financial Group, Inc.§ | 39,950 | 1,409,037 | |||||||||
| Arthur J. Gallagher & Co.§ | 14,100 | 394,236 | |||||||||
| Brown & Brown, Inc. | 29,500 | 759,625 | |||||||||
| Delphi Financial Group, Inc. Class A | 10,100 | 431,270 | |||||||||
| Everest Re Group, Ltd. | 12,200 | 1,227,808 | |||||||||
| First American Corp. | 19,000 | 978,500 | |||||||||
| Hanover Insurance Group, Inc. | 24,400 | 1,121,424 | |||||||||
| HCC Insurance Holdings, Inc. | 67,100 | 2,057,286 | |||||||||
| Ohio Casualty Corp. | 11,300 | 357,532 | |||||||||
| Protective Life Corp. | 4,500 | 211,050 | |||||||||
| Reinsurance Group of America, Inc. | 10,200 | 635,562 | |||||||||
| StanCorp Financial Group, Inc. | 40,400 | 1,923,040 | |||||||||
| Torchmark Corp. | 6,100 | 416,630 | |||||||||
| W.R. Berkley Corp. | 75,950 | 2,467,615 | |||||||||
| 14,390,615 | |||||||||||
| Internet Software & Services (0.5%) | |||||||||||
| McAfee, Inc.* | 31,400 | 1,020,186 | |||||||||
| IT Consulting & Services (0.3%) | |||||||||||
| Electronic Data Systems Corp. | 18,200 | 532,168 | |||||||||
| Machinery (3.6%) | |||||||||||
| AGCO Corp.* | 21,900 | 913,887 | |||||||||
| Cummins, Inc. | 5,800 | 534,528 | |||||||||
| Eaton Corp. | 6,000 | 535,260 | |||||||||
| Harsco Corp. | 8,900 | 453,900 | |||||||||
| Lincoln Electric Holdings, Inc. | 26,700 | 1,701,591 | |||||||||
| Manitowoc Company, Inc. | 7,100 | 484,433 | |||||||||
| Parker Hannifin Corp. | 5,800 | 534,412 | |||||||||
| Terex Corp.* | 9,200 | 716,220 | |||||||||
| Timken Co. | 39,300 | 1,296,114 | |||||||||
| 7,170,345 | |||||||||||
| Marine (0.8%) | |||||||||||
| American Commercial Lines, Inc.*§ | 16,500 | 486,255 | |||||||||
| Overseas Shipholding Group, Inc. | 14,000 | 991,200 | |||||||||
| 1,477,455 | |||||||||||
| Media (1.0%) | |||||||||||
| CTC Media, Inc.*§ | 19,600 | 511,168 | |||||||||
| EchoStar Communications Corp. Class A* | 9,200 | 428,076 | |||||||||
| Scholastic Corp.* | 36,500 | 1,126,755 | |||||||||
| 2,065,999 | |||||||||||
| Metals & Mining (1.6%) | |||||||||||
| Carpenter Technology Corp. | 5,200 | 631,124 | |||||||||
| Freeport-McMoRan Copper & Gold, Inc. Class B | 9,100 | 611,156 | |||||||||
| Steel Dynamics, Inc. | 33,400 | 1,479,954 | |||||||||
| United States Steel Corp. | 4,500 | 456,930 | |||||||||
| 3,179,164 | |||||||||||
See Accompanying Notes to Financial Statements.
25
Credit Suisse Mid-Cap Core Fund
Schedule of Investments (continued)
April 30, 2007 (unaudited)
| Number of Shares | Value | ||||||||||
| COMMON STOCKS | |||||||||||
| Multi-Utilities (0.4%) | |||||||||||
| Questar Corp. | 7,200 | $ | 699,336 | ||||||||
| Multiline Retail (1.0%) | |||||||||||
| Dollar Tree Stores, Inc.* | 34,600 | 1,360,472 | |||||||||
| Nordstrom, Inc. | 9,400 | 516,248 | |||||||||
| 1,876,720 | |||||||||||
| Oil & Gas (3.7%) | |||||||||||
| Cimarex Energy Co. | 20,600 | 811,640 | |||||||||
| Forest Oil Corp.*§ | 17,500 | 616,700 | |||||||||
| Frontier Oil Corp. | 17,500 | 618,275 | |||||||||
| Newfield Exploration Co.* | 51,700 | 2,261,875 | |||||||||
| Noble Energy, Inc. | 17,100 | 1,005,651 | |||||||||
| Pioneer Natural Resources Co. | 17,600 | 883,520 | |||||||||
| Sunoco, Inc. | 5,700 | 430,521 | |||||||||
| Todco* | 14,400 | 654,624 | |||||||||
| 7,282,806 | |||||||||||
| Personal Products (0.8%) | |||||||||||
| Alberto-Culver Co.* | 17,500 | 425,075 | |||||||||
| Avon Products, Inc. | 10,600 | 421,880 | |||||||||
| Estee Lauder Companies, Inc. Class A§ | 8,100 | 416,502 | |||||||||
| NBTY, Inc.* | 6,200 | 306,342 | |||||||||
| 1,569,799 | |||||||||||
| Pharmaceuticals (2.4%) | |||||||||||
| Endo Pharmaceuticals Holdings, Inc.* | 10,000 | 309,400 | |||||||||
| Forest Laboratories, Inc.* | 11,500 | 611,915 | |||||||||
| Medicis Pharmaceutical Corp. Class A§ | 50,200 | 1,526,080 | |||||||||
| Mylan Laboratories, Inc.§ | 10,500 | 230,265 | |||||||||
| Sepracor, Inc.*§ | 28,800 | 1,545,984 | |||||||||
| Valeant Pharmaceuticals International§ | 25,000 | 450,500 | |||||||||
| 4,674,144 | |||||||||||
| Real Estate (0.3%) | |||||||||||
| Macerich Co. | 6,500 | 618,280 | |||||||||
| Road & Rail (0.7%) | |||||||||||
| YRC Worldwide, Inc.*§ | 36,900 | 1,468,251 | |||||||||
| Semiconductor Equipment & Products (6.1%) | |||||||||||
| Analog Devices, Inc. | 8,700 | 335,994 | |||||||||
| Atmel Corp.* | 140,600 | 747,992 | |||||||||
| Lam Research Corp.* | 58,400 | 3,140,752 | |||||||||
| Linear Technology Corp.§ | 18,800 | 703,496 | |||||||||
| MEMC Electronic Materials, Inc.* | 38,600 | 2,118,368 | |||||||||
| Micrel, Inc.*§ | 47,600 | 597,380 | |||||||||
| Microchip Technology, Inc. | 23,100 | 931,854 | |||||||||
| Micron Technology, Inc.* | 37,400 | 428,978 | |||||||||
| MPS Group, Inc.* | 67,500 | 924,075 | |||||||||
| Novellus Systems, Inc.* | 16,600 | 537,342 | |||||||||
See Accompanying Notes to Financial Statements.
26
Credit Suisse Mid-Cap Core Fund
Schedule of Investments (continued)
April 30, 2007 (unaudited)
| Number of Shares | Value | ||||||||||
| COMMON STOCKS | |||||||||||
| Semiconductor Equipment & Products | |||||||||||
| ON Semiconductor Corp.*§ | 72,400 | $ | 775,404 | ||||||||
| RF Micro Devices, Inc.*§ | 48,400 | 302,500 | |||||||||
| Teradyne, Inc.* | 30,200 | 526,990 | |||||||||
| 12,071,125 | |||||||||||
| Software (2.4%) | |||||||||||
| BMC Software , Inc.* | 13,200 | 427,284 | |||||||||
| Cadence Design Systems, Inc.* | 12,100 | 268,620 | |||||||||
| Mentor Graphics Corp.*§ | 77,100 | 1,247,478 | |||||||||
| National Instruments Corp. | 7,700 | 214,522 | |||||||||
| Sybase, Inc.* | 32,600 | 788,594 | |||||||||
| Synopsys, Inc.* | 63,500 | 1,756,410 | |||||||||
| 4,702,908 | |||||||||||
| Specialty Retail (7.1%) | |||||||||||
| Abercrombie & Fitch Co. Class A | 9,700 | 792,102 | |||||||||
| American Eagle Outfitters, Inc. | 35,100 | 1,034,397 | |||||||||
| AnnTaylor Stores Corp.* | 26,900 | 1,035,112 | |||||||||
| Charming Shoppes, Inc.*§ | 128,500 | 1,606,250 | |||||||||
| Circuit City Stores, Inc. | 20,300 | 354,235 | |||||||||
| Dick's Sporting Goods, Inc.*§ | 16,200 | 908,658 | |||||||||
| GameStop Corp. Class A* | 19,500 | 646,815 | |||||||||
| Office Depot, Inc.* | 12,000 | 403,440 | |||||||||
| PetSmart, Inc.§ | 24,800 | 823,112 | |||||||||
| Regis Corp. | 12,400 | 474,052 | |||||||||
| Rent-A-Center, Inc.*§ | 57,800 | 1,609,152 | |||||||||
| Ross Stores, Inc. | 37,400 | 1,239,810 | |||||||||
| Sherwin-Williams Co. | 5,900 | 376,243 | |||||||||
| TJX Companies, Inc. | 26,100 | 727,929 | |||||||||
| United Rentals, Inc.* | 57,100 | 1,912,850 | |||||||||
| 13,944,157 | |||||||||||
| Textiles & Apparel (0.2%) | |||||||||||
| Phillips-Van Heusen Corp. | 7,500 | 419,250 | |||||||||
| Tobacco (0.7%) | |||||||||||
| Loews Corp. - Carolina Group | 7,300 | 558,669 | |||||||||
| Universal Corp.§ | 7,900 | 495,172 | |||||||||
| UST, Inc.§ | 7,100 | 402,428 | |||||||||
| 1,456,269 | |||||||||||
| Wireless Telecommunication Services (0.9%) | |||||||||||
| Telephone & Data Systems, Inc. | 28,900 | 1,645,855 | |||||||||
| United States Cellular Corp.* | 2,800 | 203,000 | |||||||||
| 1,848,855 | |||||||||||
| TOTAL COMMON STOCKS (Cost $183,792,437) | 197,727,047 | ||||||||||
See Accompanying Notes to Financial Statements.
27
Credit Suisse Mid-Cap Core Fund
Schedule of Investments (continued)
April 30, 2007 (unaudited)
| Number of Shares | Value | ||||||||||
| PREFERRED STOCK (0.0%) | |||||||||||
| Telecommunications (0.0%) | |||||||||||
| Celletra, Ltd. Series C*†† (Cost $7,000,000) | 1,102,524 | $ | 0 | ||||||||
| SHORT-TERM INVESTMENTS (18.1%) | |||||||||||
| State Street Navigator Prime Portfolio§§ | 34,562,574 | 34,562,574 | |||||||||
| Par (000) | |||||||||||
| State Street Bank and Trust Co. Euro Time Deposit, 4.100%, 05/01/07 | $ | 1,157 | 1,157,000 | ||||||||
| TOTAL SHORT-TERM INVESTMENTS (Cost $35,719,574) | 35,719,574 | ||||||||||
| TOTAL INVESTMENTS AT VALUE (118.4%) (Cost $226,512,011) | 233,446,621 | ||||||||||
| LIABILITIES IN EXCESS OF OTHER ASSETS (-18.4%) | (36,243,382 | ) | |||||||||
| NET ASSETS (100.0%) | $ | 197,203,239 | |||||||||
* Non-income producing security.
†† Restricted security, not readily marketable; security is valued at fair value as determined in good faith, by or under the direction of, the Board of Directors.
§ Security or a portion thereof is on loan.
§§ Represents security purchased with cash collateral received for securities on loan.
See Accompanying Notes to Financial Statements.
28
Credit Suisse Funds
Statements of Assets and Liabilities
April 30, 2007 (unaudited)
| Large Cap Growth Fund | Mid-Cap Core Fund | ||||||||||
| Assets | |||||||||||
| Investments at value, including collateral for securities on loan of $10,187,224 and $34,562,574, respectively (Cost $118,030,924 and $226,512,011, respectively) (Note 2) | $ | 127,959,9971 | $ | 233,446,6212 | |||||||
| Cash | 246 | 912 | |||||||||
| Dividend and interest receivable | 38,996 | 84,877 | |||||||||
| Receivable for fund shares sold | 38,693 | 27,940 | |||||||||
| Prepaid expenses and other assets | 38,699 | 50,571 | |||||||||
| Total Assets | 128,076,631 | 233,610,921 | |||||||||
| Liabilities | |||||||||||
| Advisory fee payable (Note 3) | 85,645 | 114,827 | |||||||||
| Administrative services fee payable (Note 3) | 17,385 | 28,696 | |||||||||
| Shareholder servicing/Distribution fee payable (Note 3) | 17,893 | 48,204 | |||||||||
| Payable upon return of securities loaned (Note 2) | 10,187,224 | 34,562,574 | |||||||||
| Payable for fund shares redeemed | 120,101 | 1,490,985 | |||||||||
| Trustees'/Directors' fee payable | 6,906 | 6,906 | |||||||||
| Other accrued expenses payable | 214,076 | 155,490 | |||||||||
| Total Liabilities | 10,649,230 | 36,407,682 | |||||||||
| Net Assets | |||||||||||
| Capital stock, $0.001 par value (Note 7) | 6,230 | 5,413 | |||||||||
| Paid-in capital (Note 7) | 400,146,815 | 300,614,934 | |||||||||
| Accumulated net investment loss | (77,693 | ) | (128,655 | ) | |||||||
| Accumulated net realized loss on investments and futures contracts | (292,577,024 | ) | (110,223,063 | ) | |||||||
| Net unrealized appreciation from investments | 9,929,073 | 6,934,610 | |||||||||
| Net Assets | $ | 117,427,401 | $ | 197,203,239 | |||||||
| Common Shares | |||||||||||
| Net assets | $ | 112,088,556 | $ | 185,166,175 | |||||||
| Shares outstanding | 5,934,406 | 5,057,002 | |||||||||
| Net asset value, offering price, and redemption price per share | $ | 18.89 | $ | 36.62 | |||||||
| Advisor Shares | |||||||||||
| Net assets | $ | 3,314,548 | $ | 11,589,654 | |||||||
| Shares outstanding | 184,859 | 343,234 | |||||||||
| Net asset value, offering price, and redemption price per share | $ | 17.93 | $ | 33.77 | |||||||
See Accompanying Notes to Financial Statements.
29
Credit Suisse Funds
Statements of Assets and Liabilities (continued)
April 30, 2007 (unaudited)
| Large Cap Growth Fund | Mid-Cap Core Fund | ||||||||||
| A Shares | |||||||||||
| Net assets | $ | 1,235,722 | $ | 376,522 | |||||||
| Shares outstanding | 66,268 | 10,447 | |||||||||
| Net asset value and redemption price per share | $ | 18.65 | $ | 36.04 | |||||||
| Maximum offering price per share (net asset value/(1-5.75%)) | $ | 19.79 | $ | 38.24 | |||||||
| B Shares | |||||||||||
| Net assets | $ | 429,359 | $ | 69,677 | |||||||
| Shares outstanding | 23,977 | 1,979 | |||||||||
| Net asset value and offering price per share | $ | 17.91 | $ | 35.21 | |||||||
| C Shares | |||||||||||
| Net assets | $ | 359,216 | $ | 1,211 | |||||||
| Shares outstanding | 20,064 | 34 | |||||||||
| Net asset value and offering price per share | $ | 17.90 | $ | 35.23 | |||||||
1 Including $9,957,106 of securities on loan.
2 Including $33,760,814 of securities on loan.
See Accompanying Notes to Financial Statements.
30
Credit Suisse Funds
Statements of Operations
For the Six Months Ended April 30, 2007 (unaudited)
| Large Cap Growth Fund | Mid-Cap Core Fund | ||||||||||
| Investment Income (Note 2) | |||||||||||
| Dividends | $ | 726,369 | $ | 1,093,347 | |||||||
| Interest | 40,063 | 128,402 | |||||||||
| Securities lending | 4,691 | 21,338 | |||||||||
| Total investment income | 771,123 | 1,243,087 | |||||||||
| Expenses | |||||||||||
| Investment advisory fees (Note 3) | 365,095 | 793,264 | |||||||||
| Administrative services fees (Note 3) | 89,186 | 140,123 | |||||||||
| Shareholder servicing/Distribution fees (Note 3) | |||||||||||
| Advisor Class | 8,425 | 34,577 | |||||||||
| Class A | 1,548 | 601 | |||||||||
| Class B | 2,372 | 355 | |||||||||
| Class C | 1,797 | 6 | |||||||||
| Transfer agent fees (Note 3) | 244,579 | 276,170 | |||||||||
| Registration fees | 34,324 | 27,592 | |||||||||
| Printing fees (Note 3) | 23,473 | 22,476 | |||||||||
| Audit and tax fees | 18,588 | 19,157 | |||||||||
| Legal fees | 14,446 | 15,061 | |||||||||
| Custodian fees | 13,998 | 11,943 | |||||||||
| Insurance expense | 12,969 | 14,129 | |||||||||
| Trustees'/Directors' fees | 11,467 | 11,467 | |||||||||
| Interest expense (Note 4) | 8,816 | 4,718 | |||||||||
| Commitment fees (Note 4) | 2,973 | 3,410 | |||||||||
| Miscellaneous expense | 6,790 | 6,748 | |||||||||
| Total expenses | 860,846 | 1,381,797 | |||||||||
| Less: fees waived (Note 3) | (12,030 | ) | (10,055 | ) | |||||||
| Net expenses | 848,816 | 1,371,742 | |||||||||
| Net investment loss | (77,693 | ) | (128,655 | ) | |||||||
| Net Realized and Unrealized Gain (Loss) from Investments and Futures Contracts | |||||||||||
| Net realized gain from investments | 28,292,133 | 44,485,556 | |||||||||
| Net realized loss from futures contracts | — | (213,640 | ) | ||||||||
| Net change in unrealized appreciation (depreciation) from investments | (17,498,610 | ) | (23,129,035 | ) | |||||||
| Net realized and unrealized gain from investments and futures contracts | 10,793,523 | 21,142,881 | |||||||||
| Net increase in net assets resulting from operations | $ | 10,715,830 | $ | 21,014,226 | |||||||
See Accompanying Notes to Financial Statements.
31
Credit Suisse Funds
Statements of Changes in Net Assets
| Large Cap Growth Fund | |||||||||||
| For the Six Months | Ended April 30, 2007 (unaudited) | For the Six Months For the Year Ended October 31, 2006 | |||||||||
| From Operations | |||||||||||
| Net investment loss | $ | (77,693 | ) | $ | (662,681 | ) | |||||
| Net realized gain from investments and futures contracts | 28,292,133 | 34,717,437 | |||||||||
| Net change in unrealized appreciation (depreciation) from investments | (17,498,610 | ) | (18,858,217 | ) | |||||||
| Net increase in net assets resulting from operations | 10,715,830 | 15,196,539 | |||||||||
| From Dividends | |||||||||||
| Dividends from net investment income Common Class shares | — | (277,859 | ) | ||||||||
| From Capital Share Transactions (Note 7) | |||||||||||
| Proceeds from sale of shares | 3,174,922 | 26,580,970 | |||||||||
| Reinvestment of dividends | — | 273,440 | |||||||||
| Net asset value of shares redeemed | (83,482,080 | ) | (153,917,412 | ) | |||||||
| Net decrease in net assets from capital share transactions | (80,307,158 | ) | (127,063,002 | ) | |||||||
| Net decrease in net assets | (69,591,328 | ) | (112,144,322 | ) | |||||||
| Net Assets | |||||||||||
| Beginning of period | 187,018,729 | 299,163,051 | |||||||||
| End of period | $ | 117,427,401 | $ | 187,018,729 | |||||||
| Accumulated net investment loss | $ | (77,693 | ) | $ | — | ||||||
See Accompanying Notes to Financial Statements.
32
| Mid-Cap Core Fund | |||||||||||
| For the Six Months | Ended April 30, 2007 (unaudited) | For the Year Ended October 31, 2006 | |||||||||
| From Operations | |||||||||||
| Net investment loss | $ | (128,655 | ) | $ | (1,755,269 | ) | |||||
| Net realized gain from investments and futures contracts | 44,271,916 | 26,226,282 | |||||||||
| Net change in unrealized appreciation (depreciation) from investments | (23,129,035 | ) | (8,486,600 | ) | |||||||
| Net increase in net assets resulting from operations | 21,014,226 | 15,984,413 | |||||||||
| From Dividends | |||||||||||
| Dividends from net investment income Common Class shares | — | — | |||||||||
| From Capital Share Transactions (Note 7) | |||||||||||
| Proceeds from sale of shares | 5,658,554 | 20,673,538 | |||||||||
| Reinvestment of dividends | — | — | |||||||||
| Net asset value of shares redeemed | (75,154,025 | ) | (107,079,045 | ) | |||||||
| Net decrease in net assets from capital share transactions | (69,495,471 | ) | (86,405,507 | ) | |||||||
| Net decrease in net assets | (48,481,245 | ) | (70,421,094 | ) | |||||||
| Net Assets | |||||||||||
| Beginning of period | 245,684,484 | 316,105,578 | |||||||||
| End of period | $ | 197,203,239 | $ | 245,684,484 | |||||||
| Accumulated net investment loss | $ | (128,655 | ) | $ | — | ||||||
See Accompanying Notes to Financial Statements.
33
Credit Suisse Large Cap Growth Fund
Financial Highlights
(For a Common Class Share of the Fund Outstanding Throughout Each Period)
| For the Six Months Ended April 30, 2007 | For the Year Ended October 31, | ||||||||||||||||||||||||||
| (unaudited) | 2006 | 2005 | 2004 | 2003 | 2002 | ||||||||||||||||||||||
| Per share data | |||||||||||||||||||||||||||
| Net asset value, beginning of period | $ | 17.40 | $ | 16.49 | $ | 15.26 | $ | 14.75 | $ | 12.53 | $ | 16.23 | |||||||||||||||
| INVESTMENT OPERATIONS | |||||||||||||||||||||||||||
| Net investment income (loss)1 | (0.01 | ) | (0.04 | ) | 0.01 | (0.09 | ) | (0.05 | ) | (0.07 | ) | ||||||||||||||||
| Net gain (loss) on investments (both realized and unrealized) | 1.50 | 0.97 | 1.22 | 0.60 | 2.27 | (3.63 | ) | ||||||||||||||||||||
| Total from investment operations | 1.49 | 0.93 | 1.23 | 0.51 | 2.22 | (3.70 | ) | ||||||||||||||||||||
| LESS DIVIDENDS AND DISTRIBUTIONS | |||||||||||||||||||||||||||
| Dividends from net investment income | — | (0.02 | ) | — | — | — | — | ||||||||||||||||||||
| Distributions from net realized gains | — | — | — | — | — | (0.00 | )2 | ||||||||||||||||||||
| Total dividends and distributions | — | (0.02 | ) | — | — | — | — | ||||||||||||||||||||
| Net asset value, end of period | $ | 18.89 | $ | 17.40 | $ | 16.49 | $ | 15.26 | $ | 14.75 | $ | 12.53 | |||||||||||||||
| Total return3 | 8.56 | % | 5.62 | % | 8.06 | % | 3.46 | % | 17.72 | % | (22.79 | )% | |||||||||||||||
| RATIOS AND SUPPLEMENTAL DATA | |||||||||||||||||||||||||||
| Net assets, end of period (000s omitted) | $ | 112,089 | $ | 181,077 | $ | 291,148 | $ | 433,681 | $ | 514,668 | $ | 566,064 | |||||||||||||||
| Ratio of expenses to average net assets | 1.25 | %4 | 1.20 | % | 1.17 | % | 1.16 | % | 1.15 | % | 1.11 | % | |||||||||||||||
| Ratio of net investment income (loss) to average net assets | (0.09 | )%4 | (0.24 | )% | 0.09 | % | (0.57 | )% | (0.39 | )% | (0.45 | )% | |||||||||||||||
| Decrease reflected in above operating expense ratios due to waivers/reimbursements | 0.02 | %4 | — | — | — | — | — | ||||||||||||||||||||
| Portfolio turnover rate | 104 | % | 94 | % | 97 | % | 70 | % | 97 | % | 50 | % | |||||||||||||||
1 Per share information is calculated using the average shares outstanding method.
2 This represents less than $0.01 per share.
3 Total returns are historical and assume changes in share price and reinvestment of all dividends and distributions. Had certain expenses not been reduced during the period shown, total returns would have been lower. Total returns for periods less than one year are not annualized.
4 Annualized.
See Accompanying Notes to Financial Statements.
34
Credit Suisse Large Cap Growth Fund
Financial Highlights
(For an Advisor Class Share of the Fund Outstanding Throughout Each Period)
| For the Six Months Ended April 30, 2007 | For the Year Ended October 31, | ||||||||||||||||||||||||||
| (unaudited) | 2006 | 2005 | 2004 | 2003 | 2002 | ||||||||||||||||||||||
| Per share data | |||||||||||||||||||||||||||
| Net asset value, beginning of period | $ | 16.56 | $ | 15.76 | $ | 14.65 | $ | 14.24 | $ | 12.16 | $ | 15.82 | |||||||||||||||
| INVESTMENT OPERATIONS | |||||||||||||||||||||||||||
| Net investment loss1 | (0.05 | ) | (0.12 | ) | (0.04 | ) | (0.16 | ) | (0.11 | ) | (0.14 | ) | |||||||||||||||
| Net gain (loss) on investments (both realized and unrealized) | 1.42 | 0.92 | 1.15 | 0.57 | 2.19 | (3.52 | ) | ||||||||||||||||||||
| Total from investment operations | 1.37 | 0.80 | 1.11 | 0.41 | 2.08 | (3.66 | ) | ||||||||||||||||||||
| LESS DISTRIBUTIONS | |||||||||||||||||||||||||||
| Distributions from net realized gains | — | — | — | — | — | (0.00 | )2 | ||||||||||||||||||||
| Net asset value, end of period | $ | 17.93 | $ | 16.56 | $ | 15.76 | $ | 14.65 | $ | 14.24 | $ | 12.16 | |||||||||||||||
| Total return3 | 8.27 | % | 5.08 | % | 7.58 | % | 2.88 | % | 17.11 | % | (23.13 | )% | |||||||||||||||
| RATIOS AND SUPPLEMENTAL DATA | |||||||||||||||||||||||||||
| Net assets, end of period (000s omitted) | $ | 3,315 | $ | 3,729 | $ | 5,334 | $ | 14,723 | $ | 17,380 | $ | 16,693 | |||||||||||||||
| Ratio of expenses to average net assets | 1.75 | %4 | 1.70 | % | 1.67 | % | 1.66 | % | 1.65 | % | 1.61 | % | |||||||||||||||
| Ratio of net investment loss to average net assets | (0.59 | )%4 | (0.74 | )% | (0.41 | )% | (1.07 | )% | (0.90 | )% | (0.96 | )% | |||||||||||||||
| Decrease reflected in above operating expense ratios due to waivers/reimbursements | 0.02 | %4 | — | — | — | — | — | ||||||||||||||||||||
| Portfolio turnover rate | 104 | % | 94 | % | 97 | % | 70 | % | 97 | % | 50 | % | |||||||||||||||
1 Per share information is calculated using the average shares outstanding method.
2 This represents less than $0.01 per share.
3 Total returns are historical and assume changes in share price and reinvestment of all dividends and distributions. Had certain expenses not been reduced during the period shown, total returns would have been lower. Total returns for periods less than one year are not annualized.
4 Annualized.
See Accompanying Notes to Financial Statements.
35
Credit Suisse Large Cap Growth Fund
Financial Highlights
(For a Class A Share of the Fund Outstanding Throughout Each Period)
| For the Six Months Ended April 30, 2007 | For the Year Ended October 31, | ||||||||||||||||||||||||||
| (unaudited) | 2006 | 2005 | 2004 | 2003 | 20021 | ||||||||||||||||||||||
| Per share data | |||||||||||||||||||||||||||
| Net asset value, beginning of period | $ | 17.20 | $ | 16.33 | $ | 15.14 | $ | 14.68 | $ | 12.50 | $ | 17.75 | |||||||||||||||
| INVESTMENT OPERATIONS | |||||||||||||||||||||||||||
| Net investment loss2 | (0.03 | ) | (0.08 | ) | (0.00 | )3 | (0.12 | ) | (0.09 | ) | (0.09 | ) | |||||||||||||||
| Net gain (loss) on investments (both realized and unrealized) | 1.48 | 0.95 | 1.19 | 0.58 | 2.27 | (5.16 | ) | ||||||||||||||||||||
| Total from investment operations | 1.45 | 0.87 | 1.19 | 0.46 | 2.18 | (5.25 | ) | ||||||||||||||||||||
| LESS DISTRIBUTIONS | |||||||||||||||||||||||||||
| Distributions from net realized gains | — | — | — | — | — | (0.00 | )3 | ||||||||||||||||||||
| Net asset value, end of period | $ | 18.65 | $ | 17.20 | $ | 16.33 | $ | 15.14 | $ | 14.68 | $ | 12.50 | |||||||||||||||
| Total return4 | 8.43 | % | 5.33 | % | 7.86 | % | 3.13 | % | 17.44 | % | (29.57 | )% | |||||||||||||||
| RATIOS AND SUPPLEMENTAL DATA | |||||||||||||||||||||||||||
| Net assets, end of period (000s omitted) | $ | 1,236 | $ | 1,329 | $ | 1,585 | $ | 2,490 | $ | 1,152 | $ | 450 | |||||||||||||||
| Ratio of expenses to average net assets | 1.50 | %5 | 1.45 | % | 1.42 | % | 1.41 | % | 1.40 | % | 1.40 | %5 | |||||||||||||||
| Ratio of net investment loss to average net assets | (0.34 | )%5 | (0.49 | )% | (0.16 | )% | (0.82 | )% | (0.69 | )% | (0.77 | )%5 | |||||||||||||||
| Decrease reflected in above operating expense ratios due to waivers/reimbursements | 0.02 | %5 | — | — | — | — | — | ||||||||||||||||||||
| Portfolio turnover rate | 104 | % | 94 | % | 97 | % | 70 | % | 97 | % | 50 | % | |||||||||||||||
1 For the period November 30, 2001 (inception date) through October 31, 2002.
2 Per share information is calculated using the average shares outstanding method.
3 This represents less than $0.01 per share.
4 Total returns are historical and assume changes in share price, reinvestment of all dividends and distributions and no sales charge. Had certain expenses not been reduced during the period shown, total returns would have been lower. Total returns for periods less than one year are not annualized.
5 Annualized.
See Accompanying Notes to Financial Statements.
36
Credit Suisse Large Cap Growth Fund
Financial Highlights
(For a Class B Share of the Fund Outstanding Throughout Each Period)
| For the Six Months Ended April 30, 2007 | For the Year Ended October 31, | ||||||||||||||||||||||||||
| (unaudited) | 2006 | 2005 | 2004 | 2003 | 20021 | ||||||||||||||||||||||
| Per share data | |||||||||||||||||||||||||||
| Net asset value, beginning of period | $ | 16.58 | $ | 15.85 | $ | 14.82 | $ | 14.47 | $ | 12.41 | $ | 17.75 | |||||||||||||||
| INVESTMENT OPERATIONS | |||||||||||||||||||||||||||
| Net investment loss2 | (0.09 | ) | (0.20 | ) | (0.16 | ) | (0.23 | ) | (0.19 | ) | (0.18 | ) | |||||||||||||||
| Net gain (loss) on investments (both realized and unrealized) | 1.42 | 0.93 | 1.19 | 0.58 | 2.25 | (5.16 | ) | ||||||||||||||||||||
| Total from investment operations | 1.33 | 0.73 | 1.03 | 0.35 | 2.06 | (5.34 | ) | ||||||||||||||||||||
| LESS DISTRIBUTIONS | |||||||||||||||||||||||||||
| Distributions from net realized gains | — | — | — | — | — | (0.00 | )3 | ||||||||||||||||||||
| Net asset value, end of period | $ | 17.91 | $ | 16.58 | $ | 15.85 | $ | 14.82 | $ | 14.47 | $ | 12.41 | |||||||||||||||
| Total return4 | 8.02 | % | 4.61 | % | 6.95 | % | 2.42 | % | 16.60 | % | (30.08 | )% | |||||||||||||||
| RATIOS AND SUPPLEMENTAL DATA | |||||||||||||||||||||||||||
| Net assets, end of period (000s omitted) | $ | 429 | $ | 498 | $ | 625 | $ | 543 | $ | 545 | $ | 206 | |||||||||||||||
| Ratio of expenses to average net assets | 2.25 | %5 | 2.20 | % | 2.17 | % | 2.16 | % | 2.15 | % | 2.15 | %5 | |||||||||||||||
| Ratio of net investment loss to average net assets | (1.09 | )%5 | (1.24 | )% | (0.91 | )% | (1.57 | )% | (1.44 | )% | (1.51 | )%5 | |||||||||||||||
| Decrease reflected in above operating expense ratios due to waivers/reimbursements | 0.02 | %5 | — | — | — | — | — | ||||||||||||||||||||
| Portfolio turnover rate | 104 | % | 94 | % | 97 | % | 70 | % | 97 | % | 50 | % | |||||||||||||||
1 For the period November 30, 2001 (inception date) through October 31, 2002.
2 Per share information is calculated using the average shares outstanding method.
3 This represents less than $0.01 per share.
4 Total returns are historical and assume changes in share price, reinvestment of all dividends and distributions and no sales charge. Had certain expenses not been reduced during the period shown, total returns would have been lower. Total returns for periods less than one year are not annualized.
5 Annualized.
See Accompanying Notes to Financial Statements.
37
Credit Suisse Large Cap Growth Fund
Financial Highlights
(For a Class C Share of the Fund Outstanding Throughout Each Period)
| For the Six Months Ended April 30, 2007 | For the Year Ended October 31, | ||||||||||||||||||||||||||
| (unaudited) | 2006 | 2005 | 2004 | 2003 | 20021 | ||||||||||||||||||||||
| Per share data | |||||||||||||||||||||||||||
| Net asset value, beginning of period | $ | 16.58 | $ | 15.85 | $ | 14.81 | $ | 14.47 | $ | 12.41 | $ | 17.75 | |||||||||||||||
| INVESTMENT OPERATIONS | |||||||||||||||||||||||||||
| Net investment loss2 | (0.10 | ) | (0.20 | ) | (0.14 | ) | (0.23 | ) | (0.19 | ) | (0.18 | ) | |||||||||||||||
| Net gain (loss) on investments (both realized and unrealized) | 1.42 | 0.93 | 1.18 | 0.57 | 2.25 | (5.16 | ) | ||||||||||||||||||||
| Total from investment operations | 1.32 | 0.73 | 1.04 | 0.34 | 2.06 | (5.34 | ) | ||||||||||||||||||||
| LESS DISTRIBUTIONS | |||||||||||||||||||||||||||
| Distributions from net realized gains | — | — | — | — | — | (0.00 | )3 | ||||||||||||||||||||
| Net asset value, end of period | $ | 17.90 | $ | 16.58 | $ | 15.85 | $ | 14.81 | $ | 14.47 | $ | 12.41 | |||||||||||||||
| Total return4 | 7.96 | % | 4.61 | % | 7.02 | % | 2.35 | % | 16.60 | % | (30.08 | )% | |||||||||||||||
| RATIOS AND SUPPLEMENTAL DATA | |||||||||||||||||||||||||||
| Net assets, end of period (000s omitted) | $ | 359 | $ | 385 | $ | 471 | $ | 849 | $ | 223 | $ | 93 | |||||||||||||||
| Ratio of expenses to average net assets | 2.25 | %5 | 2.20 | % | 2.17 | % | 2.16 | % | 2.15 | % | 2.14 | %5 | |||||||||||||||
| Ratio of net investment loss to average net assets | (1.09 | )%5 | (1.24 | )% | (0.91 | )% | (1.57 | )% | (1.44 | )% | (1.49 | )%5 | |||||||||||||||
| Decrease reflected in above operating expense ratios due to waivers/reimbursements | 0.02 | %5 | — | — | — | — | — | ||||||||||||||||||||
| Portfolio turnover rate | 104 | % | 94 | % | 97 | % | 70 | % | 97 | % | 50 | % | |||||||||||||||
1 For the period November 30, 2001 (inception date) through October 31, 2002.
2 Per share information is calculated using the average shares outstanding method.
3 This represents less than $0.01 per share.
4 Total returns are historical and assume changes in share price, reinvestment of all dividends and distributions and no sales charge. Had certain expenses not been reduced during the period shown, total returns would have been lower. Total returns for periods less than one year are not annualized.
5 Annualized.
See Accompanying Notes to Financial Statements.
38
Credit Suisse Mid-Cap Core Fund
Financial Highlights
(For a Common Class Share of the Fund Outstanding Throughout Each Period)
| For the Six Months Ended April 30, 2007 | For the Year Ended October 31, | ||||||||||||||||||||||||||
| (unaudited) | 2006 | 2005 | 2004 | 2003 | 2002 | ||||||||||||||||||||||
| Per share data | |||||||||||||||||||||||||||
| Net asset value, beginning of period | $ | 33.21 | $ | 31.67 | $ | 28.04 | $ | 26.79 | $ | 18.98 | $ | 23.60 | |||||||||||||||
| INVESTMENT OPERATIONS | |||||||||||||||||||||||||||
| Net investment loss1 | (0.01 | ) | (0.19 | ) | (0.27 | ) | (0.30 | ) | (0.22 | ) | (0.23 | ) | |||||||||||||||
| Net gain (loss) on investments and futures contracts (both realized and unrealized) | 3.42 | 1.73 | 3.90 | 1.55 | 8.03 | (4.39 | ) | ||||||||||||||||||||
| Total from investment operations | 3.41 | 1.54 | 3.63 | 1.25 | 7.81 | (4.62 | ) | ||||||||||||||||||||
| LESS DISTRIBUTIONS | |||||||||||||||||||||||||||
| Distributions from net realized gains | — | — | — | — | — | (0.00 | )2 | ||||||||||||||||||||
| Net asset value, end of period | $ | 36.62 | $ | 33.21 | $ | 31.67 | $ | 28.04 | $ | 26.79 | $ | 18.98 | |||||||||||||||
| Total return3 | 10.27 | % | 4.86 | % | 12.95 | % | 4.67 | % | 41.15 | % | (19.57 | )% | |||||||||||||||
| RATIOS AND SUPPLEMENTAL DATA | |||||||||||||||||||||||||||
| Net assets, end of period (000s omitted) | $ | 185,166 | $ | 228,798 | $ | 290,509 | $ | 364,298 | $ | 407,262 | $ | 357,872 | |||||||||||||||
| Ratio of expenses to average net assets | 1.24 | %4 | 1.35 | % | 1.39 | % | 1.40 | % | 1.38 | % | 1.35 | % | |||||||||||||||
| Ratio of net investment loss to average net assets | (0.09 | )%4 | (0.56 | )% | (0.87 | )% | (1.08 | )% | (1.04 | )% | (0.98 | )% | |||||||||||||||
| Decrease reflected in above operating expense ratios due to waivers/reimbursements | 0.01 | %4 | 0.03 | % | — | — | — | — | |||||||||||||||||||
| Portfolio turnover rate | 143 | % | 69 | % | 79 | % | 106 | % | 68 | % | 67 | % | |||||||||||||||
1 Per share information is calculated using the average shares outstanding method.
2 This represents less than $0.01 per share.
3 Total returns are historical and assume changes in share price and reinvestment of all dividends and distributions. Had certain expenses not been reduced during the periods shown, total returns would have been lower. Total returns for periods less than one year are not annualized.
4 Annualized.
See Accompanying Notes to Financial Statements.
39
Credit Suisse Mid-Cap Core Fund
Financial Highlights
(For an Advisor Class Share of the Fund Outstanding Throughout Each Period)
| For the Six Months Ended April 30, 2007 | For the Year Ended October 31, | ||||||||||||||||||||||||||
| (unaudited) | 2006 | 2005 | 2004 | 2003 | 2002 | ||||||||||||||||||||||
| Per share data | |||||||||||||||||||||||||||
| Net asset value, beginning of period | $ | 30.70 | $ | 29.42 | $ | 26.18 | $ | 25.14 | $ | 17.90 | $ | 22.38 | |||||||||||||||
| INVESTMENT OPERATIONS | |||||||||||||||||||||||||||
| Net investment loss1 | (0.09 | ) | (0.33 | ) | (0.40 | ) | (0.41 | ) | (0.31 | ) | (0.33 | ) | |||||||||||||||
| Net gain (loss) on investments and futures contracts (both realized and unrealized) | 3.16 | 1.61 | 3.64 | 1.45 | 7.55 | (4.15 | ) | ||||||||||||||||||||
| Total from investment operations | 3.07 | 1.28 | 3.24 | 1.04 | 7.24 | (4.48 | ) | ||||||||||||||||||||
| LESS DISTRIBUTIONS | |||||||||||||||||||||||||||
| Distributions from net realized gains | — | — | — | — | — | (0.00 | )2 | ||||||||||||||||||||
| Net asset value, end of period | $ | 33.77 | $ | 30.70 | $ | 29.42 | $ | 26.18 | $ | 25.14 | $ | 17.90 | |||||||||||||||
| Total return3 | 10.00 | % | 4.35 | % | 12.38 | % | 4.14 | % | 40.45 | % | (20.01 | )% | |||||||||||||||
| RATIOS AND SUPPLEMENTAL DATA | |||||||||||||||||||||||||||
| Net assets, end of period (000s omitted) | $ | 11,590 | $ | 16,250 | $ | 24,851 | $ | 26,474 | $ | 40,322 | $ | 42,906 | |||||||||||||||
| Ratio of expenses to average net assets | 1.74 | %4 | 1.85 | % | 1.89 | % | 1.90 | % | 1.88 | % | 1.85 | % | |||||||||||||||
| Ratio of net investment loss to average net assets | (0.59 | )%4 | (1.06 | )% | (1.37 | )% | (1.58 | )% | (1.53 | )% | (1.49 | )% | |||||||||||||||
| Decrease reflected in above operating expense ratios due to waivers/reimbursements | 0.01 | %4 | 0.03 | % | — | — | — | — | |||||||||||||||||||
| Portfolio turnover rate | 143 | % | 69 | % | 79 | % | 106 | % | 68 | % | 67 | % | |||||||||||||||
1 Per share information is calculated using the average shares outstanding method.
2 This represents less than $0.01 per share.
3 Total returns are historical and assume changes in share price and reinvestment of all dividends and distributions. Had certain expenses not been reduced during the periods shown, total returns would have been lower. Total returns for periods less than one year are not annualized.
4 Annualized.
See Accompanying Notes to Financial Statements.
40
Credit Suisse Mid-Cap Core Fund
Financial Highlights
(For a Class A Share of the Fund Outstanding Throughout Each Period)
| For the Six Months Ended April 30, 2007 | For the Year Ended October 31, | ||||||||||||||||||||||||||
| (unaudited) | 2006 | 2005 | 2004 | 2003 | 20021 | ||||||||||||||||||||||
| Per share data | |||||||||||||||||||||||||||
| Net asset value, beginning of period | $ | 32.73 | $ | 31.29 | $ | 27.77 | $ | 26.60 | $ | 18.90 | $ | 25.92 | |||||||||||||||
| INVESTMENT OPERATIONS | |||||||||||||||||||||||||||
| Net investment loss2 | (0.05 | ) | (0.27 | ) | (0.34 | ) | (0.38 | ) | (0.33 | ) | (0.28 | ) | |||||||||||||||
| Net gain (loss) on investments and futures contracts (both realized and unrealized) | 3.36 | 1.71 | 3.86 | 1.55 | 8.03 | (6.74 | ) | ||||||||||||||||||||
| Total from investment operations | 3.31 | 1.44 | 3.52 | 1.17 | 7.70 | (7.02 | ) | ||||||||||||||||||||
| LESS DISTRIBUTIONS | |||||||||||||||||||||||||||
| Distributions from net realized gains | — | — | — | — | — | (0.00 | )3 | ||||||||||||||||||||
| Net asset value, end of period | $ | 36.04 | $ | 32.73 | $ | 31.29 | $ | 27.77 | $ | 26.60 | $ | 18.90 | |||||||||||||||
| Total return4 | 10.11 | % | 4.60 | % | 12.68 | % | 4.40 | % | 40.74 | % | (27.08 | )% | |||||||||||||||
| RATIOS AND SUPPLEMENTAL DATA | |||||||||||||||||||||||||||
| Net assets, end of period (000s omitted) | $ | 377 | $ | 555 | $ | 688 | $ | 567 | $ | 75 | $ | 1 | |||||||||||||||
| Ratio of expenses to average net assets | 1.49 | %5 | 1.60 | % | 1.64 | % | 1.65 | % | 1.63 | % | 1.71 | %5 | |||||||||||||||
| Ratio of net investment loss to average net assets | (0.33 | )%5 | (0.81 | )% | (1.12 | )% | (1.33 | )% | (1.36 | )% | (1.35 | )%5 | |||||||||||||||
| Decrease reflected in above operating expense ratios due to waivers/reimbursements | 0.01 | %5 | 0.03 | % | — | — | — | — | |||||||||||||||||||
| Portfolio turnover rate | 143 | % | 69 | % | 79 | % | 106 | % | 68 | % | 67 | % | |||||||||||||||
1 For the period November 30, 2001 (inception date) through October 31, 2002.
2 Per share information is calculated using the average shares outstanding method.
3 This represents less than $0.01 per share.
4 Total returns are historical and assume changes in share price, reinvestment of all dividends and distributions and no sales charge. Had certain expenses not been reduced during the periods shown, total returns would have been lower. Total returns for periods less than one year are not annualized.
5 Annualized.
See Accompanying Notes to Financial Statements.
41
Credit Suisse Mid-Cap Core Fund
Financial Highlights
(For a Class B Share of the Fund Outstanding Throughout Each Period)
| For the Six Months Ended April 30, 2007 | For the Year Ended October 31, | ||||||||||||||||||
| (unaudited) | 2006 | 2005 | 20041 | ||||||||||||||||
| Per share data | |||||||||||||||||||
| Net asset value, beginning of period | $ | 32.10 | $ | 30.91 | $ | 27.64 | $ | 29.10 | |||||||||||
| INVESTMENT OPERATIONS | |||||||||||||||||||
| Net investment loss2 | (0.18 | ) | (0.50 | ) | (0.58 | ) | (0.38 | ) | |||||||||||
| Net gain (loss) on investments and futures contracts (both realized and unrealized) | 3.29 | 1.69 | 3.85 | (1.08 | ) | ||||||||||||||
| Total from investment operations | 3.11 | 1.19 | 3.27 | (1.46 | ) | ||||||||||||||
| Net asset value, end of period | $ | 35.21 | $ | 32.10 | $ | 30.91 | $ | 27.64 | |||||||||||
| Total return3 | 9.69 | % | 3.85 | % | 11.83 | % | (5.02 | )% | |||||||||||
| RATIOS AND SUPPLEMENTAL DATA | |||||||||||||||||||
| Net assets, end of period (000s omitted) | $ | 70 | $ | 80 | $ | 55 | $ | 7 | |||||||||||
| Ratio of expenses to average net assets | 2.24 | %4 | 2.35 | % | 2.39 | % | 2.40 | %4 | |||||||||||
| Ratio of net investment loss to average net assets | (1.08 | )%4 | (1.56 | )% | (1.87 | )% | (2.08 | )%4 | |||||||||||
| Decrease reflected in above operating expense ratios due to waivers/reimbursements | 0.01 | %4 | 0.03 | % | — | — | |||||||||||||
| Portfolio turnover rate | 143 | % | 69 | % | 79 | % | 106 | % | |||||||||||
1 For the period February 27, 2004 (inception date) through October 31, 2004.
2 Per share information is calculated using the average shares outstanding method.
3 Total returns are historical and assume changes in share price, reinvestment of all dividends and distributions and no sales charge. Had certain expenses not been reduced during the periods shown, total returns would have been lower. Total returns for periods less than one year are not annualized.
4 Annualized.
See Accompanying Notes to Financial Statements.
42
Credit Suisse Mid-Cap Core Fund
Financial Highlights
(For a Class C Share of the Fund Outstanding Throughout Each Period)
| For the Six Months Ended April 30, 2007 | For the Year Ended October 31, | ||||||||||||||||||
| (unaudited) | 2006 | 2005 | 20041 | ||||||||||||||||
| Per share data | |||||||||||||||||||
| Net asset value, beginning of period | $ | 32.10 | $ | 30.91 | $ | 27.67 | $ | 29.10 | |||||||||||
| INVESTMENT OPERATIONS | |||||||||||||||||||
| Net investment loss2 | (0.18 | ) | (0.51 | ) | (0.62 | ) | (0.38 | ) | |||||||||||
| Net gain (loss) on investments and futures contracts (both realized and unrealized) | 3.31 | 1.70 | 3.86 | (1.05 | ) | ||||||||||||||
| Total from investment operations | 3.13 | 1.19 | 3.24 | (1.43 | ) | ||||||||||||||
| Net asset value, end of period | $ | 35.23 | $ | 32.10 | $ | 30.91 | $ | 27.67 | |||||||||||
| Total return3 | 9.75 | % | 3.85 | % | 11.71 | % | (4.91 | )% | |||||||||||
| RATIOS AND SUPPLEMENTAL DATA | |||||||||||||||||||
| Net assets, end of period (000s omitted) | $ | 1 | $ | 1 | $ | 1 | $ | 1 | |||||||||||
| Ratio of expenses to average net assets | 2.24 | %4 | 2.35 | % | 2.39 | % | 2.40 | %4 | |||||||||||
| Ratio of net investment loss to average net assets | (1.08 | )%4 | (1.56 | )% | (1.87 | )% | (2.08 | )%4 | |||||||||||
| Decrease reflected in above operating expense ratios due to waivers/reimbursements | 0.01 | %4 | 0.03 | % | — | — | |||||||||||||
| Portfolio turnover rate | 143 | % | 69 | % | 79 | % | 106 | % | |||||||||||
1 For the period February 27, 2004 (inception date) through October 31, 2004.
2 Per share information is calculated using the average shares outstanding method.
3 Total returns are historical and assume changes in share price, reinvestment of all dividends and distributions and no sales charge. Had certain expenses not been reduced during the periods shown, total returns would have been lower. Total returns for periods less than one year are not annualized.
4 Annualized.
See Accompanying Notes to Financial Statements.
43
Credit Suisse Funds
Notes to Financial Statements
April 30, 2007 (unaudited)
Note 1. Organization
The Credit Suisse Funds covered in this report are Credit Suisse Large Cap Growth Fund ("Large Cap Growth") and Credit Suisse Mid-Cap Core Fund ("Mid-Cap Core"), each of which is registered under the Investment Company Act of 1940, as amended (the "1940 Act"), as a diversified open-end management investment company. Large Cap Growth was organized under the laws of the Commonwealth of Massachusetts as a business trust on January 20, 1987. Mid-Cap Core was incorporated under the laws of the State of Maryland on November 12, 1987. Effective December 1, 2006, the name of Large Cap Growth and Mid-Cap Core was changed from Credit Suisse Capital Appreciation Fund and Credit Suisse Mid-Cap Growth Fund, Inc., respectively.
Investment objectives for each Fund are as follows: Large Cap Growth seeks long-term capital appreciation and Mid-Cap Core seeks maximum capital appreciation.
Large Cap Growth and Mid-Cap Core each offer five classes of shares: Common Class, Advisor Class, Class A, Class B, and Class C shares. The Funds' Common Class shares are closed to new investors, with certain exceptions as set forth in the prospectus. Each class of shares in each Fund represents an equal pro rata interest in each Fund, except that they bear different expenses, which reflect the difference in the range of services provided to them. Class A shares of each Fund are sold subject to a maximum front-end sales charge of 5.75%. Class B shares are sold subject to a contingent deferred sales charge which declines from 4.00% to zero depending on the period of time the shares are held. Class C shares are sold subject to a contingent deferred sales charge of 1.00% if the shares are redeemed within the first year of purchase.
Note 2. Significant Accounting Policies
A) SECURITY VALUATION — The net asset value of each Fund is determined daily as of the close of regular trading on the New York Stock Exchange, Inc. (the "Exchange") on each day the Exchange is open for business. Equity investments are valued at market value, which is generally determined using the closing price on the exchange or market on which the security is primarily traded at the time of valuation (the "Valuation Time"). If no sales are reported, equity investments are generally valued at the most recent bid quotation as of the Valuation Time or at the lowest asked quotation in the case of a short sale of securities. Debt securities with a remaining maturity greater than 60 days are valued in accordance with the price supplied by a pricing service, which may use a matrix, formula or other objective method that takes into consideration market indices, yield curves and other specific adjustments.
44
Credit Suisse Funds
Notes to Financial Statements (continued)
April 30, 2007 (unaudited)
Note 2. Significant Accounting Policies
Debt obligations that will mature in 60 days or less are valued on the basis of amortized cost, which approximates market value, unless it is determined that using this method would not represent fair value. Investments in mutual funds are valued at the mutual fund's closing net asset value per share on the day of valuation. Securities and other assets for which market quotations are not readily available, or whose values have been materially affected by events occurring before each Fund's Valuation Time but after the close of the securities' primary markets, are valued at fair value as determined in good faith by, or under the direction of, the Board of Trustees/Directors under procedures established by the Board of Trustees/Directors. The Funds may utilize a service provided by an independent third party which has been approved by the Board of Trustees/Directors to fair value certain securities. When fair-value pricing is employed, the pri ces of securities used by the funds to calculate its net asset value may differ from quoted or published prices for the same securities.
B) FOREIGN CURRENCY TRANSACTIONS — The books and records of the Funds are maintained in U.S. dollars. Transactions denominated in foreign currencies are recorded at the current prevailing exchange rates. All assets and liabilities denominated in foreign currencies are translated into U.S. dollar amounts at the current exchange rate at the end of the period. Translation gains or losses resulting from changes in the exchange rate during the reporting period and realized gains and losses on the settlement of foreign currency transactions are reported in the results of operations for the current period. The Funds do not isolate that portion of realized gains and losses on investments in equity securities which is due to changes in the foreign exchange rate from that which is due to changes in market prices of equity securities. The Funds isolate that portion of realized gains and losses on investments in debt securities which is due to changes in the foreign exchange rate from that which is due to changes in market prices of debt securities.
C) SECURITY TRANSACTIONS AND INVESTMENT INCOME — Security transactions are accounted for on a trade date basis. Interest income is recorded on the accrual basis. Dividends are recorded on the ex-dividend date. Certain expenses are class-specific expenses and vary by class. Income, expenses (excluding class-specific expenses) and realized/unrealized gains/losses are allocated proportionately to each class of shares based upon the relative net asset value of the outstanding shares of that class. The cost of investments sold is determined by use of the specific identification method for both financial reporting and income tax purposes.
D) DIVIDENDS AND DISTRIBUTIONS TO SHAREHOLDERS — Dividends from net investment income and distributions of net realized capital gains, if
45
Credit Suisse Funds
Notes to Financial Statements (continued)
April 30, 2007 (unaudited)
Note 2. Significant Accounting Policies
any, are declared and paid at least annually. However, to the extent that a net realized capital gain can be reduced by a capital loss carryforward, such gain will not be distributed. Income and capital gain distributions are determined in accordance with federal income tax regulations which may differ from accounting principles generally accepted in the United States of America ("GAAP").
E) FEDERAL INCOME TAXES — No provision is made for federal taxes, as it is each Fund's intention to continue to qualify for and elect the tax treatment applicable to regulated investment companies under the Internal Revenue Code of 1986, as amended, and to make the requisite distributions to its shareholders, which will be sufficient to relieve it from federal income and excise taxes.
F) USE OF ESTIMATES — The preparation of financial statements in conformity with GAAP requires management to make estimates and assumptions that affect the reported amounts of assets and liabilities and disclosure of contingent assets and liabilities at the date of the financial statements and the reported amounts of income and expenses during the reporting period. Actual results could differ from these estimates.
G) SHORT-TERM INVESTMENTS — The Funds, together with other funds/portfolios advised by Credit Suisse Asset Management, LLC ("Credit Suisse"), an indirect, wholly-owned subsidiary of Credit Suisse Group, pool available cash into a short-term variable rate time deposit issued by State Street Bank and Trust Company ("SSB"), the Funds' custodian, or a money market fund advised by Credit Suisse. The short-term time deposit issued by SSB is a variable rate account classified as a short-term investment.
H) FUTURES — The Funds may enter into futures contracts to the extent permitted by their investment policies and objectives. Upon entering into a futures contract, the Funds are required to deposit cash or pledge U.S. Government securities as initial margin. Subsequent payments, which are dependent on the daily fluctuations in the value of the underlying instrument, are made or received by each Fund each day (daily variation margin) and are recorded as unrealized gains or losses until the contracts are closed.
When the contracts are closed, the Funds record a realized gain or loss equal to the difference between the proceeds from (or cost of) the closing transactions and the Fund's basis in the contract. Risks of entering into futures contracts for hedging purposes include the possibility that a change in the value of the contract may not correlate with the changes in the value of the underlying instruments. In addition, the purchase of a futures contract involves the risk
46
Credit Suisse Funds
Notes to Financial Statements (continued)
April 30, 2007 (unaudited)
Note 2. Significant Accounting Policies
that the Funds could lose more than the original margin deposit and subsequent payments may be required for a futures transaction. At April 30, 2007, the Funds had no open futures contracts.
I) SECURITIES LENDING — Loans of securities are required at all times to be secured by collateral at least equal to 102% of the market value of domestic securities on loan (including any accrued interest thereon) and 105% of the market value of foreign securities on loan (including any accrued interest thereon). Cash collateral received by the Funds in connection with securities lending activity may be pooled together with cash collateral for other funds/portfolios advised by Credit Suisse and may be invested in a variety of investments, including certain Credit Suisse-advised funds, funds advised by SSB, the Funds' securities lending agent or money market instruments. However, in the event of default or bankruptcy by the other party to the agreement, realization and/or retention of the collateral may be subject to legal proceedings.
SSB has been engaged by the Funds to act as the Funds' securities lending agent. The Funds' securities lending arrangement provides that the Funds and SSB will share the net income earned from securities lending activities. During the six months ended April 30, 2007, total earnings from the Fund's investments in cash collateral received in connection with Large Cap Growth and Mid-Cap Core's securities lending arrangements were $259,501, and $874,711, respectively of which $253,530, and $847,502, respectively, were rebated to borrowers (brokers). The Funds retained $4,691 and $21,338 in income, respectively, from the cash collateral investment and SSB, as lending agent, was paid $1,280 and $5,871, respectively. The Funds may also be entitled to certain minimum amounts of income from their securities lending activities. Securities lending income is accrued as earned.
J) OTHER — The Funds may invest in securities of foreign countries and governments which involve certain risks in addition to those inherent in domestic investments. Such risks generally include, among others, currency risks (fluctuations in currency exchange rates), information risk (key information may be inaccurate or unavailable) and political risk (expropriation, nationalization or the imposition of capital or currency controls or punitive taxes). Other risks of investing in foreign securities include liquidity and valuation risks.
The Funds may be subject to taxes imposed by countries in which they invest, with respect to their investments in issuers existing or operating in such countries. Such taxes are generally based on income earned or repatriated and
47
Credit Suisse Funds
Notes to Financial Statements (continued)
April 30, 2007 (unaudited)
Note 2. Significant Accounting Policies
capital gains realized on the sale of such investments. These Funds accrue such taxes when the related income is earned or gains are realized.
The Funds may each invest up to 10% of their total assets in non-publicly traded securities. Non-publicly traded securities may be less liquid than publicly traded securities. Although these securities may be resold in privately negotiated transactions, the prices realized from such sales could differ from the price originally paid by such Fund or the current carrying values, and the difference could be material.
Note 3. Transactions with Affiliates and Related Parties
Credit Suisse serves as investment adviser to each Fund. For its investment advisory services, effective December 1, 2006, Credit Suisse agreed to change the investment advisory fee of Large Cap Growth from 0.70% to 0.50%, and Mid-Cap Core from 0.90% to 0.70%.
For the six months ended April 30, 2007, investment advisory fees earned and voluntarily waived for the Funds were as follows:
| Fund | Gross Advisory Fee | Waiver | Net Advisory Fee | ||||||||||||
| Large Cap Growth | $ | 365,095 | $ | (12,030 | ) | $ | 353,065 | ||||||||
| Mid-Cap Core | 793,264 | (10,055 | ) | 783,209 | |||||||||||
Fee waivers and reimbursements are voluntary and may be discontinued by Credit Suisse at any time.
Credit Suisse Asset Management Securities, Inc. ("CSAMSI"), an affiliate of Credit Suisse, and SSB serve as each Fund's co-administrators. For co-administrative services, CSAMSI currently receives a fee calculated at an annual rate of 0.09% of each Fund's average daily net assets. For the six months ended April 30, 2007, co-administrative services fees earned by CSAMSI were as follows:
| Fund | Co-Administration Fee | ||||||
| Large Cap Growth | $ | 61,766 | |||||
| Mid-Cap Core | 98,831 | ||||||
Effective December 1, 2006, the co-administration fee was reduced from an annual rate of 0.10% to 0.09%.
For its co-administrative services, SSB receives a fee, exclusive of out-of-pocket expenses, calculated in total for all the Credit Suisse funds/portfolios co-administered by SSB and allocated based upon relative average net assets of
48
Credit Suisse Funds
Notes to Financial Statements (continued)
April 30, 2007 (unaudited)
Note 3. Transactions with Affiliates and Related Parties
each fund/portfolio, subject to an annual minimum fee. For the six months ended April 30, 2007, co-administrative services fees earned by SSB (including out-of-pocket fees) were as follows:
| Fund | Co-Administration Fee | ||||||
| Large Cap Growth | $ | 27,420 | |||||
| Mid-Cap Core | 41,292 | ||||||
In addition to serving as each Fund's co-administrator, CSAMSI currently serves as distributor of each Fund's shares. Pursuant to distribution plans adopted by each Fund pursuant to Rule 12b-1 under the 1940 Act, CSAMSI receives fees for its distribution services. For the Advisor Class shares of each Fund, the shareholder servicing fee is calculated at an annual rate of 0.50% of the average daily net assets. For the Class A shares of each Fund, the fee is calculated at an annual rate of 0.25% of average daily net assets. For the Class B and Class C shares of each Fund, the fee is calculated at an annual rate of 1.00% of average daily net assets.
Certain brokers, dealers and financial representatives provide transfer agent related services to the Funds, and receive compensation for these services from Credit Suisse. Credit Suisse is then reimbursed by the Funds. For the six months ended April 30, 2007, the Funds reimbursed Credit Suisse the following amounts, which are included in each Fund's transfer agent expense as follows:
| Fund | Amount | ||||||
| Large Cap Growth | $ | 94,434 | |||||
| Mid-Cap Core | 193,225 | ||||||
For the six months ended April 30, 2007, CSAMSI and its affiliates advised the Funds that they retained the following amounts from commissions earned on the sale of the Funds' Class A shares were as follows:
| Fund | Amount | ||||||
| Large Cap Growth | $ | 12 | |||||
| Mid-Cap Core | 577 | ||||||
Merrill Corporation ("Merrill"), an affiliate of Credit Suisse, has been engaged by the Funds to provide certain financial printing and fulfillment services. For the six months ended April 30, 2007, Merrill was paid for its services by the Funds as follows:
| Fund | Amount | ||||||
| Large Cap Growth | $ | 12,727 | |||||
| Mid-Cap Core | 13,345 | ||||||
49
Credit Suisse Funds
Notes to Financial Statements (continued)
April 30, 2007 (unaudited)
Note 4. Line of Credit
The Funds, together with other funds/portfolios advised by Credit Suisse (collectively, the "Participating Funds"), participate in a $75 million committed, unsecured line of credit facility ("Credit Facility") for temporary or emergency purposes with Deutsche Bank, A.G. as administrative agent and syndication agent and SSB as operations agent. Under the terms of the Credit Facility, the Participating Funds pay an aggregate commitment fee at a rate of 0.10% per annum on the average unused amount of the Credit Facility, which is allocated among the Participating Funds in such manner as is determined by the governing Boards of the Participating Funds. In addition, the Participating Funds pay interest on borrowings at the Federal Funds rate plus 0.50%. At April 30, 2007, the Funds had no loans outstanding under the Credit Facility. During the six months ended April 30, 2007, the Funds had borrowings under the Credit Facility as follows:
| Fund | Average Daily Loan Balance | Weighted Average Interest Rate% | Maximum Daily Loan Outstanding | ||||||||||||
| Large Cap Growth | $ | 2,885,737 | 5.788 | % | $ | 17,262,000 | |||||||||
| Mid-Cap Core | 2,258,385 | 5.786 | % | 3,672,000 | |||||||||||
Note 5. Purchases and Sales of Securities
For the six months ended April 30, 2007, purchases and sales of investment securities (excluding short-term investments) were as follows:
| Fund | Purchases | Sales | |||||||||
| Large Cap Growth | $ | 141,982,800 | $ | 213,546,762 | |||||||
| Mid-Cap Core | 303,795,497 | 359,149,087 | |||||||||
As of April 30, 2007, the identified cost for federal income tax purposes, as well as the gross unrealized appreciation from investments for those securities having an excess of value over cost, gross unrealized depreciation from investments for those securities having an excess of cost over value and the net unrealized appreciation from investments were as follows:
| Fund | Identified Cost | Gross Unrealized Appreciation | Gross Unrealized Depreciation | Net Unrealized Appreciation | |||||||||||||||
| Large Cap Growth | $ | 118,030,924 | $ | 11,341,527 | $ | (1,412,454 | ) | $ | 9,929,073 | ||||||||||
| Mid-Cap Growth | 226,512,011 | 17,289,886 | (10,355,276 | ) | 6,934,610 | ||||||||||||||
Note 6. Restricted Securities
Certain investments of Mid-Cap Core are restricted as to resale and are valued at fair value as determined in good faith by, or under the direction of,
50
Credit Suisse Funds
Notes to Financial Statements (continued)
April 30, 2007 (unaudited)
Note 6. Restricted Securities
the Board of Directors under procedures established by the Board of Directors. The Fund does not have the right to demand that such securities be registered.
| Security Description | Number of Shares | Acquisition Date | Cost | Fair Value | Value per Share | Percentage of Net Asset Value | |||||||||||||||||||||
| Celletra Ltd., Series C | 1,102,524 | 4/5/2000 | $ | 7,000,000 | $ | — | $ | — | 0.00 | % | |||||||||||||||||
Note 7. Capital Share Transactions
Large Cap Growth is authorized to issue an unlimited number of full and fractional shares of beneficial interest. Mid-Cap Core has four billion full and fractional shares of capital stock authorized and classified as follows: one billion as Common Class shares, one billion as Advisor Class shares, one billion as Class A shares, 500 million as Class B shares and 500 million as Class C shares. Each Fund has a par value of $.001 per share. Transactions in classes of each Fund were as follows:
| Large Cap Growth | |||||||||||||||||||
| Common Class | |||||||||||||||||||
| For the Six Months Ended April 30, 2007 (unaudited) | For the Year Ended October 31, 2006 | ||||||||||||||||||
| Shares | Value | Shares | Value | ||||||||||||||||
| Shares sold | 162,857 | $ | 2,920,612 | 1,468,210 | $ | 25,296,214 | |||||||||||||
| Shares issued in reinvestment of dividends | — | — | 15,679 | 273,440 | |||||||||||||||
| Shares redeemed | (4,632,676 | ) | (82,193,480 | ) | (8,737,598 | ) | (150,202,889 | ) | |||||||||||
| Net decrease | (4,469,819 | ) | $ | (79,272,868 | ) | (7,253,709 | ) | $ | (124,633,235 | ) | |||||||||
| Advisor Class | |||||||||||||||||||
| For the Six Months Ended April 30, 2007 (unaudited) | For the Year Ended October 31, 2006 | ||||||||||||||||||
| Shares | Value | Shares | Value | ||||||||||||||||
| Shares sold | 10,113 | $ | 173,281 | 47,052 | $ | 776,035 | |||||||||||||
| Shares redeemed | (50,394 | ) | (856,350 | ) | (160,414 | ) | (2,630,878 | ) | |||||||||||
| Net decrease | (40,281 | ) | $ | (683,069 | ) | (113,362 | ) | $ | (1,854,843 | ) | |||||||||
| Class A | |||||||||||||||||||
| For the Six Months Ended April 30, 2007 (unaudited) | For the Year Ended October 31, 2006 | ||||||||||||||||||
| Shares | Value | Shares | Value | ||||||||||||||||
| Shares sold | 2,923 | $ | 51,792 | 19,876 | $ | 345,049 | |||||||||||||
| Shares redeemed | (13,876 | ) | (245,315 | ) | (39,749 | ) | (673,168 | ) | |||||||||||
| Net decrease | (10,953 | ) | $ | (193,523 | ) | (19,873 | ) | $ | (328,119 | ) | |||||||||
51
Credit Suisse Funds
Notes to Financial Statements (continued)
April 30, 2007 (unaudited)
Note 7. Capital Share Transactions
| Class B | |||||||||||||||||||
| For the Six Months Ended April 30, 2007 (unaudited) | For the Year Ended October 31, 2006 | ||||||||||||||||||
| Shares | Value | Shares | Value | ||||||||||||||||
| Shares sold | 1,647 | $ | 27,642 | 7,306 | $ | 124,023 | |||||||||||||
| Shares redeemed | (7,714 | ) | (131,423 | ) | (16,657 | ) | (263,106 | ) | |||||||||||
| Net decrease | (6,067 | ) | $ | (103,781 | ) | (9,351 | ) | $ | (139,083 | ) | |||||||||
| Class C | |||||||||||||||||||
| For the Six Months Ended April 30, 2007 (unaudited) | For the Year Ended October 31, 2006 | ||||||||||||||||||
| Shares | Value | Shares | �� | Value | |||||||||||||||
| Shares sold | 94 | $ | 1,595 | 2,445 | $ | 39,649 | |||||||||||||
| Shares redeemed | (3,270 | ) | (55,512 | ) | (8,917 | ) | (147,371 | ) | |||||||||||
| Net decrease | (3,176 | ) | $ | (53,917 | ) | (6,472 | ) | $ | (107,722 | ) | |||||||||
| Mid-Cap Core | |||||||||||||||||||
| Common Class | |||||||||||||||||||
| For the Six Months Ended April 30, 2007 (unaudited) | For the Year Ended October 31, 2006 | ||||||||||||||||||
| Shares | Value | Shares | Value | ||||||||||||||||
| Shares sold | 117,490 | $ | 4,083,127 | 539,432 | $ | 18,141,030 | |||||||||||||
| Shares redeemed | (1,949,946 | ) | (67,347,104 | ) | (2,824,066 | ) | (94,597,711 | ) | |||||||||||
| Net decrease | (1,832,456 | ) | $ | (63,263,977 | ) | (2,284,634 | ) | $ | (76,456,681 | ) | |||||||||
| Advisor Class | |||||||||||||||||||
| For the Six Months Ended April 30, 2007 (unaudited) | For the Year Ended October 31, 2006 | ||||||||||||||||||
| Shares | Value | Shares | Value | ||||||||||||||||
| Shares sold | 46,666 | $ | 1,520,655 | 74,305 | $ | 2,313,885 | |||||||||||||
| Shares redeemed | (232,731 | ) | (7,512,906 | ) | (389,670 | ) | (12,129,400 | ) | |||||||||||
| Net decrease | (186,065 | ) | $ | (5,992,251 | ) | (315,365 | ) | $ | (9,815,515 | ) | |||||||||
| Class A | |||||||||||||||||||
| For the Six Months Ended April 30, 2007 (unaudited) | For the Year Ended October 31, 2006 | ||||||||||||||||||
| Shares | Value | Shares | Value | ||||||||||||||||
| Shares sold | 1,392 | $ | 48,230 | 4,742 | $ | 163,111 | |||||||||||||
| Shares redeemed | (7,901 | ) | (270,884 | ) | (9,792 | ) | (319,967 | ) | |||||||||||
| Net decrease | (6,509 | ) | $ | (222,654 | ) | (5,050 | ) | $ | (156,856 | ) | |||||||||
| Class B | |||||||||||||||||||
| For the Six Months Ended April 30, 2007 (unaudited) | For the Year Ended October 31, 2006 | ||||||||||||||||||
| Shares | Value | Shares | Value | ||||||||||||||||
| Shares sold | 194 | $ | 6,542 | 1,686 | $ | 55,512 | |||||||||||||
| Shares redeemed | (697 | ) | (23,131 | ) | (998 | ) | (31,967 | ) | |||||||||||
| Net increase (decrease) | (503 | ) | $ | (16,589 | ) | 688 | $ | 23,545 | |||||||||||
52
Credit Suisse Funds
Notes to Financial Statements (continued)
April 30, 2007 (unaudited)
Note 7. Capital Share Transactions
| Class C | |||||||||||||||||||
| For the Six Months Ended April 30, 2007 (unaudited) | For the Year Ended October 31, 2006 | ||||||||||||||||||
| Shares | Value | Shares | Value | ||||||||||||||||
| Net increase (decrease) | — | $ | — | — | $ | — | |||||||||||||
On April 30, 2007, the number of shareholders that held 5% or more of the outstanding shares of each Fund were as follows:
| Fund | Number of Shareholders | Approximate Percentage of Outstanding Shares | |||||||||
| Large Cap Growth | |||||||||||
| Common | 3 | 40 | % | ||||||||
| Advisor | 5 | 83 | % | ||||||||
| Class A | 4 | 72 | % | ||||||||
| Class B | 3 | 60 | % | ||||||||
| Class C | 4 | 89 | % | ||||||||
| Mid-Cap Core | |||||||||||
| Common | 5 | 64 | % | ||||||||
| Advisor | 1 | 85 | % | ||||||||
| Class A | 4 | 71 | % | ||||||||
| Class B | 7 | 97 | % | ||||||||
| Class C | 1 | 100 | % | ||||||||
Some of the shareholders are omnibus accounts, which hold shares on behalf of individual shareholders.
Note 8. Contingencies
In the normal course of business, the Funds may provide general indemnifications pursuant to certain contracts and organizational documents. The Funds' maximum exposure under these arrangements is dependent on future claims that may be made against the Funds and, therefore, cannot be estimated; however, based on experience, the risk of loss from such claims is considered remote.
53
Credit Suisse Funds
Notes to Financial Statements (continued)
April 30, 2007 (unaudited)
Note 9. Recent Accounting Pronouncements
During June 2006, the Financial Accounting Standards Board ("FASB") issued FASB Interpretation 48 ("FIN 48" or the "Interpretation"), Accounting for Uncertainty in Income Taxes — an interpretation of FASB statement 109. FIN 48 supplements FASB Statement 109, Accounting for Income Taxes, by defining the confidence level that a tax position must meet in order to be recognized in the financial statements. FIN 48 prescribes a comprehensive model for how a fund should recognize, measure, present, and disclose in its financial statements uncertain tax positions that the fund has taken or expects to take on a tax return. FIN 48 requires that the t ax effects of a position be recognized only if it is "more likely than not" to be sustained based solely on its technical merits. Management must be able to conclude that the tax law, regulations, case law, and other objective information regarding the technical merits sufficiently support the position's sustainability with a likelihood of more than 50 percent. FIN 48 is effective for fiscal periods beginning after December 15, 2006. At adoption, the financial statements must be adjusted to reflect only those tax positions that are more likely than not to be sustained as of the adoption date.
On September 20, 2006, the FASB released Statement of Financial Accounting Standards No. 157 "Fair Value Measurements" ("FAS 157"). FAS 157 establishes an authoritative definition of fair value, sets out a framework for measuring fair value, and requires additional disclosures about fair-value measurements. The application of FAS 157 is required for fiscal years, beginning after November 15, 2007 and interim periods within those fiscal years.
At this time, management is evaluating the implications of FIN 48 and FAS 157 and their impact on the financial statements has not yet been determined.
54
Credit Suisse Large Cap Growth Fund
Board Approval of Advisory Agreement (unaudited)
In approving the renewal of the current Advisory Agreement, the Board of Trustees, including the Independent Trustees, at a meeting held on November 14-15, 2006, considered the following factors with respect to the Credit Suisse Large Cap Growth Fund (formerly Credit Suisse Capital Appreciation Fund) (the "Fund"):
Investment Advisory Fee Rates
The Board reviewed and considered the contractual advisory fee rate of 0.50% ("Contractual Advisory Fee") that will become effective on December 1, 2006 in connection with the Fund's change in investment strategy also effective on that date, in light of the extent and quality of the advisory services provided by Credit Suisse Asset Management, LLC ("Credit Suisse").
Additionally, the Board received and considered information comparing the Fund's Contractual Advisory Fee and the Fund's overall expenses with those of funds in both the relevant expense group ("Expense Group") and universe of funds (the "Expense Universe") provided by Lipper Inc., an independent provider of investment company data.
Nature, Extent and Quality of the Services under the Advisory Agreement
The Board received and considered information regarding the nature, extent and quality of services provided to the Fund by Credit Suisse under the Advisory Agreement. The Board also noted information received at regular meetings throughout the year related to the services rendered by Credit Suisse. The Board reviewed background information about Credit Suisse, including its Form ADV. The Board considered the background and experience of Credit Suisse's senior management and the expertise of, and the amount of attention given to the Fund by, senior personnel of Credit Suisse. In addition, the Board reviewed the qualifications, backgrounds and responsibilities of the portfolio management team primarily responsible for the day-to-day portfolio management of the Fund and the extent of the resources devoted to research and analysis of actual and potential investments. The Board also received and considered information about the nature, extent and quality of services and fee rates offered to other Credit Suisse clients for comparable services.
Fund Performance
The Board received and considered the performance results of the Fund over time, along with comparisons both to the relevant performance group ("Performance Group") and universe of funds ("Performance Universe") for
55
Credit Suisse Large Cap Growth Fund
Board Approval of Advisory Agreement (unaudited) (continued)
the Fund. The Board was provided with a description of the methodology used to arrive at the funds included in the Performance Group and the Performance Universe.
Credit Suisse Profitability
The Board received and considered a profitability analysis of Credit Suisse based on the fees payable under the Advisory Agreement for the Fund, including other relationships between the Fund on the one hand and Credit Suisse affiliates on the other. The Board received profitability information for the other funds in the Credit Suisse family of funds.
Economies of Scale
The Board considered whether economies of scale in the provision of services to the Fund were being passed along to the shareholders. Accordingly, the Board considered whether alternative fee structures (such as breakpoint fee structures) would be more appropriate or reasonable taking into consideration economies of scale or other efficiencies that might accrue from increases in the Fund's asset levels.
Other Benefits to Credit Suisse
The Board considered other benefits received by Credit Suisse and its affiliates as a result of their relationship with the Fund. Such benefits include, among others, research arrangements with brokers who execute transactions on behalf of the Fund, administrative and brokerage relationships with affiliates of Credit Suisse and benefits potentially derived from an increase in Credit Suisse's businesses as a result of its relationship with the Fund (such as the ability to market to shareholders other financial products offered by Credit Suisse and its affiliates).
The Board considered the standards applied in seeking best execution, whether and to what extent soft dollar credits are sought and how any such credits are utilized, any benefits that may be achieved by using an affiliated broker and the existence of quality controls applicable to brokerage allocation procedures. The Board also reviewed Credit Suisse's method for allocating portfolio investment opportunities among its advisory clients.
56
Credit Suisse Large Cap Growth Fund
Board Approval of Advisory Agreement (unaudited) (continued)
Conclusions
In selecting Credit Suisse, and approving the Advisory Agreement and the investment advisory fee under such agreement, the Board concluded that:
• The Contractual Advisory Fee was the lowest in the Fund's Expense Group and the Board considered the fee to be reasonable.
• The Fund's performance was below most of its peers in the Performance Group and Performance Universe for most periods. As a result of continued underperformance, and in view of the organizational realignment of Credit Suisse's asset management business and the potential impact of those changes on the Fund, the Board had approved changes in the investment strategies and portfolio management of the Fund to a quantitative strategies approach to be implemented by the Credit Suisse Quantitative Strategies Group. The quantitative strategies and Contractual Advisory Fee went into effect on December 1, 2006. The Board would continue to monitor steps taken by Credit Suisse to improve performance.
• Aside from performance (as discussed above), the Board was satisfied with the nature and extent of the investment advisory services provided to the Fund by Credit Suisse and that, based on dialogue with management and counsel, the services provided by Credit Suisse under the Advisory Agreement are typical of, and consistent with, those provided to similar mutual funds by other investment advisers.
• In light of the costs of providing investment management and other services to the Fund and Credit Suisse's ongoing commitment to the Fund, the profits and other ancillary benefits that Credit Suisse and its affiliates received were considered reasonable.
• Credit Suisse's profitability based on fees payable under the Advisory Agreement was reasonable in light of the nature, extent and quality of the services provided to the Fund thereunder.
• In light of the amount of the Contractual Advisory Fee, the Fund's current fee structure (without breakpoints) was considered reasonable.
No single factor reviewed by the Board was identified by the Board as the principal factor in determining whether to approve the Advisory Agreement. The Independent Trustees were advised by separate independent legal counsel throughout the process.
57
Credit Suisse Mid-Cap Core Fund
Board Approval of Advisory Agreement (unaudited)
In approving the renewal of the current Advisory Agreement, the Board of Directors, including the Independent Directors, considered the following factors with respect to the Credit Suisse Mid-Cap Core Fund (formerly Credit Suisse Mid-Cap Growth Fund) (the "Fund"):
Investment Advisory Fee Rates
The Board reviewed and considered the contractual advisory fee rate of 0.70% ("Contractual Advisory Fee") that will become effective on December 1, 2006 in connection with the Fund's change in investment strategy also effective on that date, in light of the extent and quality of the advisory services provided by Credit Suisse Asset Management, LLC ("Credit Suisse").
Additionally, the Board received and considered information comparing the Fund's Contractual Advisory Fee and the Fund's overall expenses with those of funds in both the relevant expense group ("Expense Group") and universe of funds ("Expense Universe") provided by Lipper Inc., an independent provider of investment company data.
Nature, Extent and Quality of the Services under the Advisory Agreement
The Board received and considered information regarding the nature, extent and quality of services provided to the Fund by Credit Suisse under the Advisory Agreement. The Board also noted information received at regular meetings throughout the year related to the services rendered by Credit Suisse. The Board reviewed background information about Credit Suisse, including its Form ADV. The Board considered the background and experience of Credit Suisse's senior management and the expertise of, and the amount of attention given to the Fund by, senior personnel of Credit Suisse. In addition, the Board reviewed the qualifications, backgrounds and responsibilities of the portfolio management team primarily responsible for the day-to-day portfolio management of the Fund and the extent of the resources devoted to research and analysis of actual and potential investments. The Board also received and considered information about the nature, extent and quality of services and fee rates offered to other Credit Suisse clients for comparable services.
Fund Performance
The Board received and considered the performance results of the Fund over time, along with comparisons both to the relevant performance group ("Performance Group") and universe of funds ("Performance Universe") for
58
Credit Suisse Mid-Cap Core Fund
Board Approval of Advisory Agreement (unaudited) (continued)
the Fund. The Board was provided with a description of the methodology used to arrive at the funds included in the Performance Group and the Performance Universe.
Credit Suisse Profitability
The Board received and considered a profitability analysis of Credit Suisse based on the fees payable under the Advisory Agreement for the Fund, including any fee waivers or expense caps, as well as other relationships between the Fund on the one hand and Credit Suisse affiliates on the other. The Board received profitability information for the other funds in the Credit Suisse family of funds.
Economies of Scale
The Board considered whether economies of scale in the provision of services to the Fund were being passed along to the shareholders. Accordingly, the Board considered whether alternative fee structures (such as breakpoint fee structures) would be more appropriate or reasonable taking into consideration economies of scale or other efficiencies that might accrue from increases in the Fund's asset levels.
Other Benefits to Credit Suisse
The Board considered other benefits received by Credit Suisse and its affiliates as a result of their relationship with the Fund. Such benefits include, among others, research arrangements with brokers who execute transactions on behalf of the Fund, administrative and brokerage relationships with affiliates of Credit Suisse and benefits potentially derived from an increase in Credit Suisse's businesses as a result of its relationship with the Fund (such as the ability to market to shareholders other financial products offered by Credit Suisse and its affiliates).
The Board considered the standards applied in seeking best execution, whether and to what extent soft dollar credits are sought and how any such credits are utilized, any benefits that may be achieved by using an affiliated broker and the existence of quality controls applicable to brokerage allocation procedures. The Board also reviewed Credit Suisse's method for allocating portfolio investment opportunities among its advisory clients.
59
Credit Suisse Mid-Cap Core Fund
Board Approval of Advisory Agreement (unaudited) (continued)
Conclusions
In selecting Credit Suisse, and approving the Advisory Agreement and the investment advisory fee under such agreement, the Board concluded that:
• The Contractual Advisory Fee was among the lowest in the Fund's Expense Group and was considered reasonable.
• The Fund's performance for most periods reviewed was below most funds in the Performance Group and Performance Universe. As a result of continued underperformance, and in view of the organizational realignment of Credit Suisse's asset management business and the potential impact of those changes on the Fund, the Board had approved changes in the investment strategies and portfolio management of the Fund to a quantitative strategies approach to be implemented by the Credit Suisse Quantitative Strategies Group. The quantitative strategies and Contractual Advisory Fee went into effect on December 1, 2006. The Board would continue to monitor steps taken by Credit Suisse to improve performance.
• Aside from performance (as described above), the Board was satisfied with the nature and extent of the investment advisory services provided to the Fund by Credit Suisse and that, based on dialogue with management and counsel, the services provided by Credit Suisse under the Advisory Agreement are typical of, and consistent with, those provided to similar mutual funds by other investment advisers.
• In light of the costs of providing investment management and other services to the Fund and Credit Suisse's ongoing commitment to the Fund and willingness to cap fees and expenses, the profits and other ancillary benefits that Credit Suisse and its affiliates received were considered reasonable.
• Credit Suisse's profitability based on fees payable under the Advisory Agreement was reasonable in light of the nature, extent and quality of the services provided to the Fund thereunder.
• Based on the Contractual Advisory Fee, the Fund's current fee structure (without breakpoints) was considered reasonable.
No single factor reviewed by the Board was identified by the Board as the principal factor in determining whether to approve the Advisory Agreement. The Independent Directors were advised by separate independent legal counsel throughout the process.
60
Credit Suisse Funds
Privacy Policy Notice (unaudited)
Important Privacy Choices for Consumers
We are committed to maintaining the privacy of every current and prospective customer. We recognize that you entrust important personal information to us, and we wish to assure you that we take seriously our responsibilities in protecting and safeguarding this information.
In connection with making available investment products and services to current and potential customers, we may obtain nonpublic personal information about you. This information may include your name, address, e-mail address, social security number, account number, assets, income, financial situation, transaction history and other personal information.
We may collect nonpublic information about you from the following sources:
• Information we receive on applications, forms, questionnaires, web sites, agreements or in the course of establishing or maintaining a customer relationship; and
• Information about your transactions with us, our affiliates, or others.
We do not disclose any nonpublic personal information about our customers or former customers to anyone, except with your consent or as otherwise permitted by law.
In cases where we believe that additional products and services may be of interest to you, we may share the information described above with our affiliates.
We may also disclose this information to firms that perform services on our behalf. These agents and service providers are required to treat the information confidentially and use it only for the purpose for which it is provided.
We restrict access to nonpublic personal information about you to those employees, agents or other parties who need to know that information to provide products or services to you or in connection with your investments with or through us. We maintain physical, electronic and procedural safeguards that comply with federal standards to guard your nonpublic personal information.
Note: This Notice is provided to clients and prospective clients of Credit Suisse Asset Management, LLC ("Credit Suisse"), and Credit Suisse Asset Management Securities, Inc., and shareholders and prospective shareholders in Credit Suisse-sponsored and-advised investment companies, including Credit Suisse Funds, and other consumers and customers, as applicable. This Notice is not intended to be incorporated in any offering materials but is merely a statement of our current Privacy Policy, and may be amended from time to time upon notice to you. This Notice is dated as of June 5, 2007.
61
Credit Suisse Funds
Proxy Voting and Portfolio Holdings Information (unaudited)
Information regarding how each Fund voted proxies related to its portfolio securities during the 12 month period ended June 30 of each year, as well as the policies and procedures that each Fund uses to determine how to vote proxies relating to its portfolio securities are available:
• By calling 1-800-927-2874
• On the Funds' website, www.credit-suisse.com/us
• On the website of the Securities and Exchange Commission, www.sec.gov.
Each Fund files a complete schedule of its portfolio holdings for the first and third quarters of its fiscal year with the SEC on Form N-Q. Each Fund's Forms N-Q are available on the SEC's website at www.sec.gov and may be reviewed and copied at the SEC's Public Reference Room in Washington, DC. Information on the operation of the SEC's Public Reference Room may be obtained by calling 1-202-551-8090.
62
This page intentionally left blank
This page intentionally left blank

P.O. BOX 55030, BOSTON, MA 02205-5030
800-927-2874 n www.credit-suisse.com/us
CREDIT SUISSE ASSET MANAGEMENT SECURITIES, INC., DISTRIBUTOR. USEQGTH-SAR-0407
Item 2. Code of Ethics.
This item is inapplicable to a semi-annual report on Form N-CSR.
Item 3. Audit Committee Financial Expert.
This item is inapplicable to a semi-annual report on Form N-CSR.
Item 4. Principal Accountant Fees and Services.
This item is inapplicable to a semi-annual report on Form N-CSR.
Item 5. Audit Committee of Listed Registrants.
This item is not applicable to the registrant.
Item 6. Schedule of Investments.
Included as part of the report to shareholders filed under Item 1 of this Form.
Item 7. Disclosure of Proxy Voting Policies and Procedures for Closed-End Management Investment Companies.
This item is not applicable to the registrant.
Item 8. Portfolio Managers of Closed-End Management Investment Companies.
This item is not applicable to the registrant.
Item 9. Purchases of Equity Securities by Closed-End Management Investment Company and Affiliated Purchasers.
This item is not applicable to the registrant.
Item 10. Submission of Matters to a Vote of Security Holders.
The Nominating Committee recommends Board member candidates. Shareholders of the registrant may also submit nominees that will be considered by the Committee. Recommendations should be mailed to the registrant’s Secretary, c/o Credit Suisse Asset Management, LLC, Eleven Madison Avenue, New York, NY 10010. Any submission should include at a minimum the following information: the name, age, business address, residence address and principal occupation or employment of such individual; the class, series and number of shares of the registrant that are beneficially owned by such individual; the date such shares were acquired and the investment intent of such acquisition; whether such shareholder believes such individual is, or is not, an “interested person” of the registrant (as defined in the Investment Company Act of 1940) and information regarding such individual that is sufficient, in the Committee’s discretion, to make such determination; and all other information relating to such individual that is required to be disclosed in solicitation of proxies for election of directors in an election contest (even if an election contest is not involved) or is otherwise required pursuant to the rules for proxy materials under the Securities Exchange Act of 1934.
Item 11. Controls and Procedures.
(a) As of a date within 90 days from the filing date of this report, the principal executive officer and principal financial officer concluded that the registrant’s disclosure controls and procedures (as defined in Rule 30a-3(c) under the Investment Company Act of 1940 (the “Act”)) were effective
based on their evaluation of the disclosure controls and procedures required by Rule 30a-3(b) under the Act and Rules 13a-15(b) or 15d-15(b) under the Securities Exchange Act of 1934.
(b) There were no changes in registrant’s internal control over financial reporting (as defined in Rule 30a-3(d) under the Act) that occurred during the registrant’s last fiscal half-year that have materially affected, or are reasonably likely to materially affect, the registrant’s internal control over financial reporting.
Item 12. Exhibits.
(a)(1) |
| Not applicable. |
|
|
|
(a)(2) |
| The certifications of the registrant as required by Rule 30a-2(a) under the Act are exhibits to this report. |
|
|
|
(a)(3) |
| Not applicable. |
|
|
|
(b) |
| The certifications of the registrant as required by Rule 30a-2(b) under the Act are an exhibit to this report. |
SIGNATURES
Pursuant to the requirements of the Securities Exchange Act of 1934 and the Investment Company Act of 1940, the registrant has duly caused this report to be signed on its behalf by the undersigned, thereunto duly authorized.
CREDIT SUISSE LARGE CAP GROWTH FUND | |||
|
| ||
| /s/ Keith M. Schappert |
| |
| Name: | Keith M. Schappert | |
| Title: | Chief Executive Officer | |
| Date: | July 5, 2007 | |
Pursuant to the requirements of the Securities Exchange Act of 1934 and the Investment Company Act of 1940, this report has been signed below by the following persons on behalf of the registrant and in the capacities and on the dates indicated.
/s/ Keith M. Schappert |
| ||
| Name: | Keith M. Schappert | |
| Title: | Chief Executive Officer | |
| Date: | July 5, 2007 | |
/s/ Michael A. Pignataro |
| ||
| Name: | Michael A. Pignataro | |
| Title: | Chief Financial Officer | |
| Date: | July 5, 2007 | |