UNITED STATES
SECURITIES AND EXCHANGE COMMISSION
Washington, D.C. 20549
FORM N-CSR
CERTIFIED SHAREHOLDER REPORT OF REGISTERED
MANAGEMENT INVESTMENT COMPANIES
Investment Company Act file number | 811-05041 | ||||||||
| |||||||||
CREDIT SUISSE LARGE CAP GROWTH FUND | |||||||||
(Exact name of registrant as specified in charter) | |||||||||
| |||||||||
Eleven Madison Avenue, New York, New York |
| 10010 | |||||||
(Address of principal executive offices) |
| (Zip code) | |||||||
| |||||||||
J. Kevin Gao, Esq. | |||||||||
(Name and address of agent for service) | |||||||||
| |||||||||
Registrant’s telephone number, including area code: | (212) 325-2000 |
| |||||||
| |||||||||
Date of fiscal year end: | October 31 |
| |||||||
| |||||||||
Date of reporting period: | November 1, 2007 to April 30, 2008 |
| |||||||
Item 1. Reports to Stockholders.

CREDIT SUISSE FUNDS
Semiannual Report
April 30, 2008
(unaudited)
n CREDIT SUISSE
LARGE CAP GROWTH FUND
n CREDIT SUISSE
MID-CAP CORE FUND
The Funds' investment objectives, risks, charges and expenses (which should be considered carefully before investing), and more complete information about the Funds, are provided in the Prospectus, which should be read carefully before investing. You may obtain additional copies by calling 800-927-2874 or by writing to Credit Suisse Funds, P.O. Box 55030, Boston, MA 02205-5030.
Credit Suisse Asset Management Securities, Inc., Distributor, is located at Eleven Madison Avenue, New York, NY 10010. Credit Suisse Funds are advised by Credit Suisse Asset Management, LLC.
Investors in the Credit Suisse Funds should be aware that they may be eligible to purchase Common Class and/or Advisor Class shares (where offered) directly or through certain intermediaries. Such shares are not subject to a sales charge but may be subject to an ongoing service and distribution fee of up to 0.50% of average daily net assets. Investors in the Credit Suisse Funds should also be aware that they may be eligible for a reduction or waiver of the sales charge with respect to Class A, B or C shares (where offered). For more information, please review the relevant prospectuses or consult your financial representative.
The views of the Fund's management are as of the date of the letter and the Fund holdings described in this document are as of April 30, 2008; these views and Fund holdings may have changed subsequent to these dates. Nothing in this document is a recommendation to purchase or sell securities.
Fund shares are not deposits or other obligations of Credit Suisse Asset Management, LLC ("Credit Suisse") or any affiliate, are not FDIC-insured and are not guaranteed by Credit Suisse or any affiliate. Fund investments are subject to investment risks, including loss of your investment.
Credit Suisse Large Cap Growth Fund
Semiannual Investment Adviser's Report
April 30, 2008 (unaudited)
June 9, 2008
Dear Shareholder:
Performance Summary
11/01/07 – 04/30/08
| Fund & Benchmark | Performance | ||||||
| Common Class1 | (12.14 | )% | |||||
| Advisor Class1 | (12.32 | )% | |||||
| Class A1,2 | (12.23 | )% | |||||
| Class B1,2 | (12.53 | )% | |||||
| Class C1,2 | (12.53 | )% | |||||
| Russell 1000® Growth Index3 | (9.28 | )% | |||||
Performance for the Fund's Class A, Class B and Class C Shares is without the maximum sales charge of 5.75%, 4.00% and 1.00%, respectively.2
Market Review: Housing and the dollar continue to weaken
The six-month period ended April 30, 2008 was a volatile one for U.S. equities, with the benchmark Russell 1000 Growth Index losing –9.28% and the bellwether S&P 500 Index dropping –9.64% in total return. In fact, nine out of the ten economic sectors in the large-cap S&P 500 Index fell during the period.
The weak dollar and elevated commodity prices buoyed the energy sector, which was up 5.6%. And, as the credit crunch intensified in the first quarter of 2008, the greatest laggards in the large-cap space were the financial (-21.3%) and information technology (-15.6%) sectors.
During the period, the U.S. Federal Reserve cut the Federal Funds rate five times, for a total of 250 basis points. The last cut of 25 basis points, on April 30, 2008, brought the rate down to the 2% level. At that time, the Fed said "substantial" easing should promote growth, but to date, economic activity "remains weak."
The U.S. housing sector has continued to weaken in 2008. In fact, since January 2007, the S&P/Case Shiller U.S. Home Price Index (a measure of home prices in 20 U.S. metropolitan areas) has fallen every month. Additionally, the number of homes entering foreclosure jumped more than 100% in the first three months of the year as compared to the same quarter in 2007. According to RealtyTrac, one in every 194 homes received a foreclosure filing. In fact, foreclosure activity rose in 46 of the 50 states and in 90 of the 100 largest metropolitan areas.
1
Credit Suisse Large Cap Growth Fund
Semiannual Investment Adviser's Report (continued)
April 30, 2008 (unaudited)
Gross Domestic Product rose only a scant 0.6% in both Q4'07 and Q1'08, compared to being up 4.9% in Q3'07, as housing and the credit crunch put the breaks on economic growth. Inflation appears to be well contained.
The labor market has weakened considerably in 2008. Non-farm payrolls fell by 260,000 in the first four months of 2008, as compared to an increase of 374,000 in the same period of 2007. Additionally, the household unemployment rate measured 5.0% in April, up from 4.7% in November of 2007.
Additionally, while the U.S. dollar falls, crude oil continues to rise. During the six-month period, crude rose from $88 to $113 per barrel.
Strategic Review and Outlook: Expect the market to remain volatile over the short term
Stock selection in two sectors produced positive performance, while eight sectors underperformed during the six-month period. The largest contributors to performance relative to the benchmark came primarily from stock selection within the information technology and materials sectors. Conversely, stock selection in financials, healthcare and consumer staples was the largest detractor to performance.
As of April 30, 2008, the Fund's largest overweights against the Russell 1000 Growth Index were in the healthcare (+1.12%) and information technology (+0.83%) sectors, while the largest underweights were in the consumer discretionary (-1.96%) and materials (-0.33%) sectors.
The Federal Reserve believes that the substantial easing thus far, in combination with ongoing measures to foster market liquidity, should help to promote moderate growth over time while mitigating the risks to economic activity. In addition, though the outlook is uncertain, inflation is expected to moderate in coming quarters, but will need to be carefully monitored.
The Federal Open Market Committee's next interest rate meeting is scheduled for June 25, 2008. Based on interest-rate futures as of May 6, 2008, traders are expecting the Fed to leave its target rate at the current level of 2.00%.
The near-term outlook for the U.S. housing market remains bleak. In fact, Federal Reserve Chairman Ben Bernanke urged the government and mortgage lenders to intensify their efforts to avoid home foreclosures in a speech given in New York on May 5, 2008. Additionally, the outlook for merger and acquisition activity is unlikely to improve in upcoming quarters as the Federal Reserve said the proportion of U.S. banks making it tougher for companies to borrow approached a record high in the past three months as the credit crunch deepened. Further, expectations for U.S. stock market volatility remain high on a historical
2
Credit Suisse Large Cap Growth Fund
Semiannual Investment Adviser's Report (continued)
April 30, 2008 (unaudited)
basis, though they have been significantly reduced since hitting a multi-year high in mid-March.
Now that the Fed appears to be done easing, we expect our Valuation and Capital Use factors — and the companies we choose based on them — to rebound as contributing factors to performance. From a sector perspective, we are favorable toward tech, basic materials, and industrials, while we are currently underweight healthcare, consumer services, and energy.
Jordan Low
Portfolio Manager
In addition to historical information, this report contains forward-looking statements that may concern, among other things, domestic and foreign market, industry and economic trends and developments and government regulation and their potential impact on the Fund's investments. These statements are subject to risks and uncertainties and actual trends, developments and regulations in the future, and their impact on the Fund could be materially different from those projected, anticipated or implied. The Fund has no obligation to update or revise forward-looking statements.
The Fund adopted new investment strategies effective December 1, 2006 so that its holdings are selected using quantitative stock selection models rather than a more traditional fundamental analysis approach. Investors should be aware that performance information for periods prior to December 1, 2006 does not reflect the current investment strategies.
3
Credit Suisse Large Cap Growth Fund
Semiannual Investment Adviser's Report (continued)
April 30, 2008 (unaudited)
Average Annual Returns as of March 31, 20081
| 1 Year | 5 Years | 10 Years | Since Inception | Inception Date | |||||||||||||||||||
| Common Class | (4.39 | )% | 7.49 | % | 1.45 | % | 8.28 | % | 08/17/87 | ||||||||||||||
| Advisor Class | (4.81 | )% | 6.93 | % | 0.95 | % | 7.70 | % | 04/04/91 | ||||||||||||||
| Class A Without Sales Charge | (4.57 | )% | 7.23 | % | — | (0.76 | )% | 11/30/01 | |||||||||||||||
| Class A With Maximum Sales Charge | (10.05 | )% | 5.96 | % | — | (1.68 | )% | 11/30/01 | |||||||||||||||
| Class B Without CDSC | (5.34 | )% | 6.40 | % | — | (1.51 | )% | 11/30/01 | |||||||||||||||
| Class B With CDSC | (9.13 | )% | 6.40 | % | — | (1.51 | )% | 11/30/01 | |||||||||||||||
| Class C Without CDSC | (5.29 | )% | 6.42 | % | — | (1.51 | )% | 11/30/01 | |||||||||||||||
| Class C With CDSC | (6.24 | )% | 6.42 | % | — | (1.51 | )% | 11/30/01 | |||||||||||||||
Average Annual Returns as of April 30, 20081
| 1 Year | 5 Years | 10 Years | Since Inception | Inception Date | |||||||||||||||||||
| Common Class | (5.49 | )% | 7.02 | % | 1.61 | % | 8.45 | % | 08/17/87 | ||||||||||||||
| Advisor Class | (5.91 | )% | 6.49 | % | 1.11 | % | 7.91 | % | 04/04/91 | ||||||||||||||
| Class A Without Sales Charge | (5.74 | )% | 6.74 | % | — | (0.15 | )% | 11/30/01 | |||||||||||||||
| Class A With Maximum Sales Charge | (11.17 | )% | 5.49 | % | — | (1.06 | )% | 11/30/01 | |||||||||||||||
| Class B Without CDSC | (6.42 | )% | 5.96 | % | — | (0.89 | )% | 11/30/01 | |||||||||||||||
| Class B With CDSC | (10.16 | )% | 5.96 | % | — | (0.89 | )% | 11/30/01 | |||||||||||||||
| Class C Without CDSC | (6.37 | )% | 5.96 | % | — | (0.89 | )% | 11/30/01 | |||||||||||||||
| Class C With CDSC | (7.31 | )% | 5.96 | % | — | (0.89 | )% | 11/30/01 | |||||||||||||||
Returns represent past performance and include change in share price and reinvestment of dividends and capital gains. Past performance cannot guarantee future results. The current performance of the Fund may be lower or higher than the figures shown. Returns and share price will fluctuate, and redemption value may be more or less than original cost. The performance results do not reflect the deduction of taxes that a shareholder would pay on fund distributions or the redemption of fund shares. Performance information current to the most recent month-end is available at www.credit-suisse.com/us.
1 Fee waivers and/or expense reimbursements may reduce expenses for the Fund, without which performance would be lower. Waivers and/or reimbursements may be discontinued at any time.
2 Total return for the Fund's Class A Shares for the reporting period, based on offering price (with maximum sales charge of 5.75%), was -17.27%. Total return for the Fund's Class B Shares for the reporting period, based on redemption value (including maximum contingent deferred sales charge of 4%), was -16.03%. Total return for the Fund's Class C Shares for the reporting period, based on redemption value (including maximum contingent deferred sales charge of 1%), was -13.40%.
3 The Russell 1000® Growth Index measures the performance of those companies in the Russell 1000® Index with higher price-to-book ratios and higher forecasted growth values. It is an unmanaged index of common stocks that includes reinvestment of dividends and is compiled by Frank Russell Company. Investors cannot invest directly in an index.
4
Credit Suisse Large Cap Growth Fund
Semiannual Investment Adviser's Report (continued)
April 30, 2008 (unaudited)
Information About Your Fund's Expenses
As an investor of the Fund, you incur two types of costs: ongoing expenses and transaction costs. Ongoing expenses include management fees, distribution and service (12b-1) fees and other Fund expenses. Examples of transaction costs include sales charges (loads), redemption fees and account maintenance fees, which are not shown in this section and which would result in higher total expenses. The following table is intended to help you understand your ongoing expenses of investing in the Fund and to help you compare these expenses with the ongoing expenses of investing in other mutual funds. The table is based on an investment of $1,000 made at the beginning of the six month period ended April 30, 2008.
The table illustrates your Fund's expenses in two ways:
• Actual Fund Return. This helps you estimate the actual dollar amount of ongoing expenses paid on a $1,000 investment in the Fund using the Fund's actual return during the period. To estimate the expenses you paid over the period, simply divide your account value by $1,000 (for example, an $8,600 account value divided by $1,000 = 8.6), then multiply the result by the number in the "Expenses Paid per $1,000" line under the share class you hold.
• Hypothetical 5% Fund Return. This helps you to compare your Fund's ongoing expenses with those of other mutual funds using the Fund's actual expense ratio and a hypothetical rate of return of 5% per year before expenses. Examples using a 5% hypothetical fund return may be found in the shareholder reports of other mutual funds. The hypothetical account values and expenses may not be used to estimate the actual ending account balance or expenses you paid for the period.
Please note that the expenses shown in these tables are meant to highlight your ongoing expenses only and do not reflect any transaction costs, such as sales charges (loads) or redemption fees. If these transaction costs had been included, your costs would have been higher. The "Expenses Paid per $1,000" line of the tables is useful in comparing ongoing expenses only and will not help you determine the relative total expenses of owning different funds.
5
Credit Suisse Large Cap Growth Fund
Semiannual Investment Adviser's Report (continued)
April 30, 2008 (unaudited)
Expenses and Value of a $1,000 Investment
for the six month period ended April 30, 2008
| Actual Fund Return | Common Class | Advisor Class | Class A | Class B | Class C | ||||||||||||||||||
| Beginning Account Value 11/1/07 | $ | 1,000.00 | $ | 1,000.00 | $ | 1,000.00 | $ | 1,000.00 | $ | 1,000.00 | |||||||||||||
| Ending Account Value 4/30/08 | $ | 878.60 | $ | 876.80 | $ | 877.70 | $ | 874.70 | $ | 874.70 | |||||||||||||
| Expenses Paid per $1,000* | $ | 4.90 | $ | 7.19 | $ | 6.07 | $ | 9.65 | $ | 9.60 | |||||||||||||
| Hypothetical 5% Fund Return | |||||||||||||||||||||||
| Beginning Account Value 11/1/07 | $ | 1,000.00 | $ | 1,000.00 | $ | 1,000.00 | $ | 1,000.00 | $ | 1,000.00 | |||||||||||||
| Ending Account Value 4/30/08 | $ | 1,019.64 | $ | 1,017.21 | $ | 1,018.40 | $ | 1,014.57 | $ | 1,014.62 | |||||||||||||
| Expenses Paid per $1,000* | $ | 5.27 | $ | 7.72 | $ | 6.52 | $ | 10.37 | $ | 10.32 | |||||||||||||
| Common Class | Advisor Class | Class A | Class B | Class C | |||||||||||||||||||
| Annualized Expense Ratios* | 1.05 | % | 1.54 | % | 1.30 | % | 2.07 | % | 2.06 | % | |||||||||||||
* Expenses are equal to the Fund's annualized expense ratio for each share class, multiplied by the average account value over the period, multiplied by the number of days in the most recent fiscal half year period, then divided by 366.
The "Expenses Paid per $1,000" and the "Annualized Expense Ratios" in the tables are based on actual expenses paid by the Fund during the period, net of fee waivers and/or expense reimbursements. If those fee waivers and/or expense reimbursements had not been in effect, the Fund's actual expenses would have been higher.
For more information, please refer to the Fund's prospectus.
6
Credit Suisse Large Cap Growth Fund
Semiannual Investment Adviser's Report (continued)
April 30, 2008 (unaudited)
SECTOR BREAKDOWN*
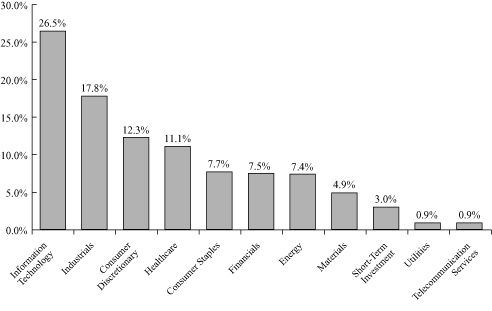
* Expressed as a percentage of total investments (excluding security lending collateral) and may vary over time.
7
Credit Suisse Mid-Cap Core Fund
Semiannual Investment Adviser's Report
April 30, 2008 (unaudited)
June 10, 2008
Dear Shareholder:
Performance Summary
11/01/07 – 04/30/08
| Fund and Benchmark | Performance | ||||||
| Common Class1 | (8.08 | )% | |||||
| Advisor Class1 | (8.31 | )% | |||||
| Class A1,2 | (8.21 | )% | |||||
| Class B1,2 | (8.55 | )% | |||||
| Class C1,2 | (8.57 | )% | |||||
| Standard & Poor's MidCap 400® Index3 | (6.95 | )% | |||||
Performance for the Fund's Class A, Class B and Class C Shares is without the maximum sales charge of 5.75%, 4.00% and 1.00%, respectively.2
Market Review: Housing and the dollar continue to weaken
The six-month period ended April 30, 2008 was a volatile one for U.S. equities, with the benchmark S&P MidCap 400 Index dropping -6.95%, with the broadcasting & cable tv sector leading the way down at -49.6%. Other laggards were commercial printing (-47.3%) and oil & gas refining & marketing (-45.7%). The best performing sectors were coal and consumable fuel (+39.9%) and oil & gas drilling (+35.6%).
During the period, the U.S. Federal Reserve cut the Federal Funds rate five times, for a total of 250 basis points. The last cut of 25 basis points, on April 30, 2008, brought the rate down to the 2% level. At that time, the Fed said "substantial" easing should promote growth, but to date, economic activity "remains weak."
The U.S. housing sector has continued to weaken in 2008. In fact, since January 2007, the S&P/Case Shiller U.S. Home Price Index (a measure of home prices in 20 U.S. metropolitan areas) has fallen every month. Additionally, the number of homes entering foreclosure jumped more than 100% in the first three months of the year as compared to the same quarter in 2007. According to RealtyTrac, one in every 194 homes received a foreclosure filing. In fact, foreclosure activity rose in 46 of the 50 states and in 90 of the 100 largest metropolitan areas.
Gross Domestic Product rose only a scant 0.6% in both Q4'07 and Q1'08, compared to being up 4.9% in Q3'07, as housing and the credit crunch put the breaks on economic growth. Inflation appears to be well contained.
8
Credit Suisse Mid-Cap Core Fund
Semiannual Investment Adviser's Report (continued)
April 30, 2008 (unaudited)
The labor market has weakened considerably in 2008. Non-farm payrolls fell by 260,000 in the first 4 months of 2008, as compared to an increase of 374,000 in the same period of 2007. Additionally, the household unemployment rate measured 5.0% in April, up from 4.7% in November of 2007.
Additionally, while the U.S. dollar falls, crude oil continues to rise. During the six-month period ended April 30, 2008, crude rose from $88 to $113 per barrel.
Strategic Review and Outlook: Expect the market to remain volatile over the short term
Stock selection in two sectors produced positive performance, while eight sectors underperformed during the six-month period. The largest contributors to performance relative to the benchmark came primarily from stock selection within the energy, materials and utilities sectors. Conversely, stock selection in telecomm services, financials, and information technology was the largest detractor to performance.
As of April 30, 2008, the Fund's largest overweights against the MidCap 400 Index were in the energy (+3.38%) and healthcare (+2.68%) sectors, while the largest underweights were in the information technology (-2.84%) and consumer discretionary (-2.29%) sectors.
The Federal Reserve believes that the substantial easing thus far, in combination with ongoing measures to foster market liquidity, should help to promote moderate growth over time while mitigating the risks to economic activity. In addition, though the outlook is uncertain, inflation is expected to moderate in coming quarters, but will need to be carefully monitored.
The Federal Open Market Committee's next interest rate meeting is scheduled for June 25, 2008. Based on interest-rate futures as of May 6, 2008, traders are expecting the Fed to leave its target rate at the current level of 2.00%.
The near-term outlook for the U.S. housing market remains bleak. In fact, Federal Reserve Chairman Ben Bernanke urged the government and mortgage lenders to intensify their efforts to avoid home foreclosures in a speech given in New York on May 5, 2008. Additionally, the outlook for mergers and acquisitions activity is unlikely to improve in upcoming quarters as the Federal Reserve said the proportion of U.S. banks making it tougher for companies to borrow approached a record high in the past three months as the credit crunch deepened. Further, expectations for U.S. stock market volatility remain high on a historical basis, though they have been significantly reduced since hitting a multi-year high in mid-March.
Now that the Fed appears to be done easing, we expect our Valuation and Capital Use factors — and the companies we choose based on them — to
9
Credit Suisse Mid-Cap Core Fund
Semiannual Investment Adviser's Report (continued)
April 30, 2008 (unaudited)
rebound as contributing factors to performance. Rising oil and gas prices lead us to be favorable toward energy and basic materials, while the continuing credit and housing issues, plus the tightening of consumer belts lead us to be currently underweight in financials, tech and consumer cyclicals.
Jordan Low
Portfolio Manager
Investing in small to medium-sized companies may be more volatile and less liquid than investments in larger companies.
In addition to historical information, this report contains forward-looking statements that may concern, among other things, domestic and foreign market, industry and economic trends and developments and government regulation and their potential impact on the Fund's investments. These statements are subject to risks and uncertainties and actual trends, developments and regulations in the future, and their impact on the Fund could be materially different from those projected, anticipated or implied. The Fund has no obligation to update or revise forward-looking statements.
The Fund adopted new investment strategies effective December 1, 2006 so that its holdings are selected using quantitative stock selection models rather than a more traditional fundamental analysis approach. Investors should be aware that performance information for periods prior to December 1, 2006 does not reflect the current investment strategies.
10
Credit Suisse Mid-Cap Core Fund
Semiannual Investment Adviser's Report (continued)
April 30, 2008 (unaudited)
Average Annual Returns as of March 31, 20081
| 1 Year | 5 Years | 10 Years | Since Inception | Inception Date | |||||||||||||||||||
| Common Class | (4.73 | )% | 12.17 | % | 0.97 | % | 9.54 | % | 01/21/88 | ||||||||||||||
| Advisor Class | (5.22 | )% | 11.61 | % | 0.46 | % | 7.76 | % | 04/04/91 | ||||||||||||||
| Class A Without Sales Charge | (4.95 | )% | 11.91 | % | — | 3.90 | % | 11/30/01 | |||||||||||||||
| Class A With Maximum Sales Charge | (10.41 | )% | 10.59 | % | — | 2.94 | % | 11/30/01 | |||||||||||||||
| Class B Without CDSC | (5.71 | )% | — | — | 2.37 | % | 02/27/04 | ||||||||||||||||
| Class B With CDSC | (9.48 | )% | — | — | 2.37 | % | 02/27/04 | ||||||||||||||||
| Class C Without CDSC | (5.59 | )% | — | — | 2.40 | % | 02/27/04 | ||||||||||||||||
| Class C With CDSC | (6.54 | )% | — | — | 2.40 | % | 02/27/04 | ||||||||||||||||
Average Annual Returns as of April 30, 20081
| 1 Year | 5 Years | 10 Years | Since Inception | Inception Date | |||||||||||||||||||
| Common Class | (1.50 | )% | 12.18 | % | 1.59 | % | 9.88 | % | 01/21/88 | ||||||||||||||
| Advisor Class | (2.01 | )% | 11.62 | % | 1.08 | % | 8.16 | % | 04/04/91 | ||||||||||||||
| Class A Without Sales Charge | (1.72 | )% | 11.91 | % | — | 4.99 | % | 11/30/01 | |||||||||||||||
| Class A With Maximum Sales Charge | (7.37 | )% | 10.59 | % | — | 4.02 | % | 11/30/01 | |||||||||||||||
| Class B Without CDSC | (2.50 | )% | — | — | 4.04 | % | 02/27/04 | ||||||||||||||||
| Class B With CDSC | (6.40 | )% | — | — | 4.04 | % | 02/27/04 | ||||||||||||||||
| Class C Without CDSC | (2.44 | )% | — | — | 4.07 | % | 02/27/04 | ||||||||||||||||
| Class C With CDSC | (3.42 | )% | — | — | 4.07 | % | 02/27/04 | ||||||||||||||||
Returns represent past performance and include change in share price and reinvestment of dividends and capital gains. Past performance cannot guarantee future results. The current performance of the Fund may be lower or higher than the figures shown. Returns and share price will fluctuate, and redemption value may be more or less than original cost. The performance results do not reflect the deduction of taxes that a shareholder would pay on fund distributions or the redemption of fund shares. Performance information current to the most recent month-end is available at www.credit-suisse.com/us.
1 Fee waivers and/or expense reimbursements may reduce expenses for the Fund, without which performance would be lower. Waivers and/or reimbursements may be discontinued at any time.
2 Total return for the Fund's Class A Shares for the reporting period, based on offering price (with maximum sales charge of 5.75%), was -13.48%. Total return for the Fund's Class B Shares for the reporting period, based on redemption value (including maximum contingent deferred sales charge of 4%), was -12.21%. Total return for the Fund's Class C Shares for the reporting period, based on redemption value (including maximum contingent deferred sales charge of 1%), was -9.48%.
3 The Standard & Poor's MidCap 400 Index is an unmanaged market weighted index of 400 U.S. stocks selected on the basis of capitalization, liquidity, and industry group representation. It is a registered trademark of McGraw-Hill Co., Inc. Investors cannot invest directly in an index.
11
Credit Suisse Mid-Cap Core Fund
Semiannual Investment Adviser's Report (continued)
April 30, 2008 (unaudited)
Information About Your Fund's Expenses
As an investor of the Fund, you incur two types of costs: ongoing expenses and transaction costs. Ongoing expenses include management fees, distribution and service (12b-1) fees and other Fund expenses. Examples of transaction costs include sales charges (loads), redemption fees and account maintenance fees, which are not shown in this section and which would result in higher total expenses. The following table is intended to help you understand your ongoing expenses of investing in the Fund and to help you compare these expenses with the ongoing expenses of investing in other mutual funds. The table is based on an investment of $1,000 made at the beginning of the six month period ended April 30, 2008.
The table illustrates your Fund's expenses in two ways:
• Actual Fund Return. This helps you estimate the actual dollar amount of ongoing expenses paid on a $1,000 investment in the Fund using the Fund's actual return during the period. To estimate the expenses you paid over the period, simply divide your account value by $1,000 (for example, an $8,600 account value divided by $1,000 = 8.6), then multiply the result by the number in the "Expenses Paid per $1,000" line under the share class you hold.
• Hypothetical 5% Fund Return. This helps you to compare your Fund's ongoing expenses with those of other mutual funds using the Fund's actual expense ratio and a hypothetical rate of return of 5% per year before expenses. Examples using a 5% hypothetical fund return may be found in the shareholder reports of other mutual funds. The hypothetical account values and expenses may not be used to estimate the actual ending account balance or expenses you paid for the period.
Please note that the expenses shown in these tables are meant to highlight your ongoing expenses only and do not reflect any transaction costs, such as sales charges (loads) or redemption fees. If these transaction costs had been included, your costs would have been higher. The "Expenses Paid per $1,000" line of the tables is useful in comparing ongoing expenses only and will not help you determine the relative total expenses of owning different funds.
12
Credit Suisse Mid-Cap Core Fund
Semiannual Investment Adviser's Report (continued)
April 30, 2008 (unaudited)
Expenses and Value of a $1,000 Investment
for the six month period ended April 30, 2008
| Actual Fund Return | Common Class | Advisor Class | Class A | Class B | Class C | ||||||||||||||||||
| Beginning Account Value 11/1/07 | $ | 1,000.00 | $ | 1,000.00 | $ | 1,000.00 | $ | 1,000.00 | $ | 1,000.00 | |||||||||||||
| Ending Account Value 4/30/08 | $ | 919.20 | $ | 916.90 | $ | 917.90 | $ | 914.50 | $ | 914.30 | |||||||||||||
| Expenses Paid per $1,000* | $ | 6.78 | $ | 9.15 | $ | 8.01 | $ | 11.52 | $ | 11.85 | |||||||||||||
| Hypothetical 5% Fund Return | |||||||||||||||||||||||
| Beginning Account Value 11/1/07 | $ | 1,000.00 | $ | 1,000.00 | $ | 1,000.00 | $ | 1,000.00 | $ | 1,000.00 | |||||||||||||
| Ending Account Value 4/30/08 | $ | 1,017.80 | $ | 1,015.32 | $ | 1,016.51 | $ | 1,012.83 | $ | 1,012.48 | |||||||||||||
| Expenses Paid per $1,000* | $ | 7.12 | $ | 9.62 | $ | 8.42 | $ | 12.11 | $ | 12.46 | |||||||||||||
| Common Class | Advisor Class | Class A | Class B | Class C | |||||||||||||||||||
| Annualized Expense Ratios* | 1.42 | % | 1.92 | % | 1.68 | % | 2.42 | % | 2.49 | % | |||||||||||||
* Expenses are equal to the Fund's annualized expense ratio for each share class, multiplied by the average account value over the period, multiplied by the number of days in the most recent fiscal half year period, then divided by 366.
The "Expenses Paid per $1,000" and the "Annualized Expense Ratios" in the tables are based on actual expenses paid by the Fund during the period, net of fee waivers and/or expense reimbursements. If those fee waivers and/or expense reimbursements had not been in effect, the Fund's actual expenses would have been higher.
For more information, please refer to the Fund's prospectus.
13
Credit Suisse Mid-Cap Core Fund
Semiannual Investment Adviser's Report (continued)
April 30, 2008 (unaudited)
SECTOR BREAKDOWN*
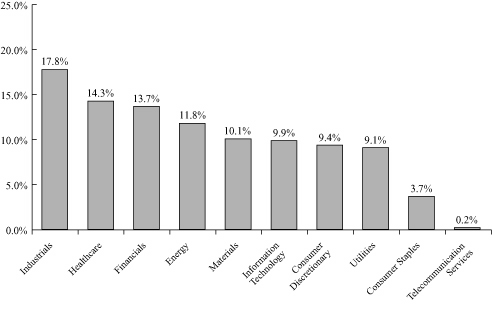
* Expressed as a percentage of total investments (excluding security lending collateral) and may vary over time.
14
Credit Suisse Large Cap Growth Fund
Schedule of Investments
April 30, 2008 (unaudited)
| Number of Shares | Value | ||||||||||
| COMMON STOCKS (97.0%) | |||||||||||
| Aerospace & Defense (4.4%) | |||||||||||
| Boeing Co. | 16,400 | $ | 1,391,704 | ||||||||
| L-3 Communications Holdings, Inc. | 1,100 | 122,595 | |||||||||
| Lockheed Martin Corp. | 4,600 | 487,784 | |||||||||
| Northrop Grumman Corp. | 200 | 14,714 | |||||||||
| Raytheon Co. | 2,000 | 127,940 | |||||||||
| Rockwell Collins, Inc. | 10,800 | 681,588 | |||||||||
| United Technologies Corp. | 13,700 | 992,839 | |||||||||
| 3,819,164 | |||||||||||
| Air Freight & Couriers (0.7%) | |||||||||||
| FedEx Corp.§ | 4,000 | 383,480 | |||||||||
| United Parcel Service, Inc. Class B | 2,500 | 181,025 | |||||||||
| 564,505 | |||||||||||
| Airlines (0.2%) | |||||||||||
| Southwest Airlines Co. | 10,700 | 141,668 | |||||||||
| Auto Components (1.2%) | |||||||||||
| Autoliv, Inc.§ | 10,700 | 655,268 | |||||||||
| BorgWarner, Inc.§ | 6,400 | 314,560 | |||||||||
| Johnson Controls, Inc. | 1,800 | 63,468 | |||||||||
| 1,033,296 | |||||||||||
| Banks (1.2%) | |||||||||||
| Bank of America Corp. | 11,700 | 439,218 | |||||||||
| Northern Trust Corp. | 3,200 | 237,152 | |||||||||
| PNC Financial Services Group, Inc.§ | 5,200 | 360,620 | |||||||||
| 1,036,990 | |||||||||||
| Beverages (2.9%) | |||||||||||
| Coca-Cola Co. | 11,900 | 700,553 | |||||||||
| Hansen Natural Corp.*§ | 800 | 28,312 | |||||||||
| Molson Coors Brewing Co. Class B | 1,800 | 98,712 | |||||||||
| Pepsi Bottling Group, Inc. | 15,200 | 512,392 | |||||||||
| PepsiAmericas, Inc. | 3,000 | 77,100 | |||||||||
| PepsiCo, Inc. | 15,400 | 1,055,362 | |||||||||
| 2,472,431 | |||||||||||
| Biotechnology (1.4%) | |||||||||||
| Celgene Corp.* | 700 | 43,498 | |||||||||
| Cephalon, Inc.*§ | 800 | 49,928 | |||||||||
| Genentech, Inc.* | 4,900 | 334,180 | |||||||||
| Genzyme Corp.* | 5,600 | 393,960 | |||||||||
| Gilead Sciences, Inc.* | 6,000 | 310,560 | |||||||||
| IDEXX Laboratories, Inc.*§ | 700 | 37,240 | |||||||||
| 1,169,366 | |||||||||||
See Accompanying Notes to Financial Statements.
15
Credit Suisse Large Cap Growth Fund
Schedule of Investments (continued)
April 30, 2008 (unaudited)
| Number of Shares | Value | ||||||||||
| COMMON STOCKS | |||||||||||
| Chemicals (2.2%) | |||||||||||
| Air Products and Chemicals, Inc. | 1,200 | $ | 118,116 | ||||||||
| CF Industries Holdings, Inc.§ | 1,200 | 160,440 | |||||||||
| Lubrizol Corp. | 4,800 | 279,936 | |||||||||
| Monsanto Co. | 9,700 | 1,105,994 | |||||||||
| Praxair, Inc. | 2,000 | 182,620 | |||||||||
| The Mosaic Co.* | 600 | 73,506 | |||||||||
| 1,920,612 | |||||||||||
| Commercial Services & Supplies (1.2%) | |||||||||||
| DST Systems, Inc.*§ | 4,600 | 275,264 | |||||||||
| Hewitt Associates, Inc. Class A* | 5,600 | 229,600 | |||||||||
| MasterCard, Inc. Class A§ | 1,500 | 417,240 | |||||||||
| Sotheby's§ | 2,200 | 60,940 | |||||||||
| The Corporate Executive Board Co. | 400 | 17,428 | |||||||||
| 1,000,472 | |||||||||||
| Communications Equipment (3.6%) | |||||||||||
| Cisco Systems, Inc.* | 74,500 | 1,910,180 | |||||||||
| Corning, Inc. | 20,800 | 555,568 | |||||||||
| QUALCOMM, Inc. | 13,700 | 591,703 | |||||||||
| 3,057,451 | |||||||||||
| Computers & Peripherals (6.9%) | |||||||||||
| Apple Computer, Inc.* | 10,700 | 1,861,265 | |||||||||
| Dell, Inc.* | 29,400 | 547,722 | |||||||||
| Hewlett-Packard Co. | 35,900 | 1,663,965 | |||||||||
| International Business Machines Corp. | 12,300 | 1,484,610 | |||||||||
| NVIDIA Corp.* | 2,000 | 41,100 | |||||||||
| Western Digital Corp.*§ | 10,200 | 295,698 | |||||||||
| 5,894,360 | |||||||||||
| Construction & Engineering (0.5%) | |||||||||||
| Fluor Corp.§ | 1,700 | 259,879 | |||||||||
| Jacobs Engineering Group, Inc.*§ | 1,400 | 120,862 | |||||||||
| Quanta Services, Inc.*§ | 1,900 | 50,426 | |||||||||
| 431,167 | |||||||||||
| Containers & Packaging (0.7%) | |||||||||||
| Ball Corp.§ | 11,000 | 591,580 | |||||||||
| Sealed Air Corp.§ | 200 | 5,058 | |||||||||
| 596,638 | |||||||||||
| Diversified Financials (4.6%) | |||||||||||
| American Express Co. | 2,600 | 124,852 | |||||||||
| Charles Schwab Corp. | 13,100 | 282,960 | |||||||||
| Federated Investors, Inc. Class B§ | 2,600 | 87,048 | |||||||||
| Franklin Resources, Inc. | 5,600 | 532,840 | |||||||||
| Goldman Sachs Group, Inc. | 2,400 | 459,288 | |||||||||
| JPMorgan Chase & Co. | 1,400 | 66,710 | |||||||||
| Merrill Lynch & Co., Inc. | 2,966 | 147,796 | |||||||||
See Accompanying Notes to Financial Statements.
16
Credit Suisse Large Cap Growth Fund
Schedule of Investments (continued)
April 30, 2008 (unaudited)
| Number of Shares | Value | ||||||||||
| COMMON STOCKS | |||||||||||
| Diversified Financials | |||||||||||
| Nasdaq OMX Group, Inc.*§ | 14,300 | $ | 521,235 | ||||||||
| Nymex Holdings, Inc.§ | 5,900 | 546,340 | |||||||||
| SEI Investments Co. | 11,400 | 265,278 | |||||||||
| State Street Corp. | 9,600 | 692,544 | |||||||||
| Waddell & Reed Financial, Inc. Class A | 4,800 | 162,528 | |||||||||
| Western Union Co. | 3,000 | 69,000 | |||||||||
| 3,958,419 | |||||||||||
| Diversified Telecommunication Services (0.6%) | |||||||||||
| FairPoint Communications, Inc.§ | 177 | 1,630 | |||||||||
| Time Warner Cable, Inc. Class A* | 2,500 | 70,000 | |||||||||
| Verizon Communications, Inc. | 9,400 | 361,712 | |||||||||
| Windstream Corp.§ | 8,800 | 103,312 | |||||||||
| 536,654 | |||||||||||
| Electric Utilities (0.7%) | |||||||||||
| Constellation Energy Group§ | 4,100 | 347,065 | |||||||||
| Public Service Enterprise Group, Inc. | 5,000 | 219,550 | |||||||||
| 566,615 | |||||||||||
| Electrical Equipment (1.1%) | |||||||||||
| Energizer Holdings, Inc.*§ | 4,900 | 387,394 | |||||||||
| Rockwell Automation, Inc. | 10,700 | 580,261 | |||||||||
| 967,655 | |||||||||||
| Electronic Equipment & Instruments (0.6%) | |||||||||||
| Avnet, Inc.* | 4,700 | 123,093 | |||||||||
| Intersil Corp. Class A§ | 800 | 21,376 | |||||||||
| Thermo Fisher Scientific, Inc.* | 3,300 | 190,971 | |||||||||
| Waters Corp.* | 3,000 | 184,380 | |||||||||
| 519,820 | |||||||||||
| Energy Equipment & Services (3.4%) | |||||||||||
| Baker Hughes, Inc. | 3,800 | 307,344 | |||||||||
| Bonneville Pacific Corp.*^ | 16,883 | 127 | |||||||||
| ENSCO International, Inc.§ | 1,617 | 103,051 | |||||||||
| Halliburton Co. | 20,600 | 945,746 | |||||||||
| National-Oilwell Varco, Inc.* | 1,100 | 75,295 | |||||||||
| Noble Corp.§ | 3,174 | 178,633 | |||||||||
| Schlumberger, Ltd. | 12,900 | 1,297,095 | |||||||||
| 2,907,291 | |||||||||||
| Food & Drug Retailing (0.9%) | |||||||||||
| Kroger Co. | 18,900 | 515,025 | |||||||||
| Safeway, Inc. | 3,000 | 94,800 | |||||||||
| Terra Industries, Inc.* | 2,100 | 79,506 | |||||||||
| Walgreen Co.§ | 1,200 | 41,820 | |||||||||
| 731,151 | |||||||||||
See Accompanying Notes to Financial Statements.
17
Credit Suisse Large Cap Growth Fund
Schedule of Investments (continued)
April 30, 2008 (unaudited)
| Number of Shares | Value | ||||||||||
| COMMON STOCKS | |||||||||||
| Food Products (0.6%) | |||||||||||
| Kellogg Co. | 4,700 | $ | 240,499 | ||||||||
| Kraft Foods, Inc. Class A | 3,400 | 107,542 | |||||||||
| Sara Lee Corp. | 2,000 | 29,020 | |||||||||
| Wm. Wrigley Jr. Co.§ | 2,000 | 152,320 | |||||||||
| 529,381 | |||||||||||
| Gas Utilities (0.2%) | |||||||||||
| UGI Corp. | 6,700 | 174,200 | |||||||||
| Healthcare Equipment & Supplies (2.7%) | |||||||||||
| Applera Corp.§ | 15,600 | 497,796 | |||||||||
| Baxter International, Inc. | 10,000 | 623,200 | |||||||||
| Becton Dickinson & Co. | 6,900 | 616,860 | |||||||||
| Boston Scientific Corp.* | 4,900 | 65,317 | |||||||||
| Edwards Lifesciences Corp.* | 1,500 | 83,130 | |||||||||
| Hlth Corp.*§ | 2,183 | 24,275 | |||||||||
| Kinetic Concepts, Inc.* | 10,800 | 428,328 | |||||||||
| 2,338,906 | |||||||||||
| Healthcare Providers & Services (2.3%) | |||||||||||
| Aetna, Inc. | 15,100 | 658,360 | |||||||||
| CIGNA Corp. | 3,000 | 128,130 | |||||||||
| Express Scripts, Inc.* | 2,800 | 196,056 | |||||||||
| Humana, Inc.* | 6,800 | 324,972 | |||||||||
| Quest Diagnostics, Inc. | 3,700 | 185,666 | |||||||||
| UnitedHealth Group, Inc. | 12,386 | 404,155 | |||||||||
| WellPoint, Inc.* | 1,900 | 94,525 | |||||||||
| 1,991,864 | |||||||||||
| Hotels, Restaurants & Leisure (1.1%) | |||||||||||
| Burger King Holdings, Inc. | 700 | 19,530 | |||||||||
| Carnival Corp.§ | 1,500 | 60,255 | |||||||||
| International Game Technology | 5,000 | 173,700 | |||||||||
| Starwood Hotels & Resorts Worldwide, Inc. | 10,900 | 569,089 | |||||||||
| Yum! Brands, Inc.§ | 2,000 | 81,360 | |||||||||
| 903,934 | |||||||||||
| Household Durables (0.7%) | |||||||||||
| American Greetings Corp. Class A§ | 10,200 | 182,580 | |||||||||
| Whirlpool Corp.§ | 5,700 | 414,846 | |||||||||
| 597,426 | |||||||||||
| Household Products (1.9%) | |||||||||||
| Clorox Co. | 8,300 | 439,900 | |||||||||
| Colgate-Palmolive Co. | 500 | 35,350 | |||||||||
| Procter & Gamble Co. | 17,500 | 1,173,375 | |||||||||
| 1,648,625 | |||||||||||
See Accompanying Notes to Financial Statements.
18
Credit Suisse Large Cap Growth Fund
Schedule of Investments (continued)
April 30, 2008 (unaudited)
| Number of Shares | Value | ||||||||||
| COMMON STOCKS | |||||||||||
| Industrial Conglomerates (3.5%) | |||||||||||
| 3M Co. | 11,100 | $ | 853,590 | ||||||||
| General Electric Co. | 27,200 | 889,440 | |||||||||
| Honeywell International, Inc. | 5,400 | 320,760 | |||||||||
| KBR, Inc. | 3,900 | 112,476 | |||||||||
| Reynolds American, Inc. | 6,700 | 360,795 | |||||||||
| Tyco International, Ltd. | 10,200 | 477,258 | |||||||||
| 3,014,319 | |||||||||||
| Insurance (1.2%) | |||||||||||
| Aflac, Inc. | 3,000 | 200,010 | |||||||||
| Endurance Specialty Holdings, Ltd.§ | 5,800 | 215,354 | |||||||||
| MetLife, Inc. | 1,000 | 60,850 | |||||||||
| Prudential Financial, Inc. | 5,400 | 408,834 | |||||||||
| Transatlantic Holdings, Inc.§ | 2,500 | 162,125 | |||||||||
| 1,047,173 | |||||||||||
| Internet & Catalog Retail (0.5%) | |||||||||||
| Amazon.com, Inc.*§ | 5,700 | 448,191 | |||||||||
| Internet Software & Services (2.3%) | |||||||||||
| eBay, Inc.* | 17,700 | 553,833 | |||||||||
| Google, Inc. Class A* | 2,300 | 1,320,867 | |||||||||
| Yahoo!, Inc.* | 3,700 | 101,417 | |||||||||
| 1,976,117 | |||||||||||
| IT Consulting & Services (1.3%) | |||||||||||
| Accenture, Ltd. Class A | 22,400 | 841,120 | |||||||||
| Acxiom Corp. | 700 | 8,281 | |||||||||
| Cognizant Technology Solutions Corp. Class A* | 7,500 | 241,875 | |||||||||
| 1,091,276 | |||||||||||
| Machinery (4.1%) | |||||||||||
| Caterpillar, Inc.§ | 11,200 | 917,056 | |||||||||
| Cummins, Inc. | 12,226 | 765,959 | |||||||||
| Danaher Corp.§ | 8,900 | 694,378 | |||||||||
| Deere & Co. | 2,000 | 168,140 | |||||||||
| Dover Corp. | 4,800 | 237,456 | |||||||||
| Eaton Corp.§ | 5,300 | 465,552 | |||||||||
| Joy Global, Inc. | 1,300 | 96,525 | |||||||||
| Lincoln Electric Holdings, Inc.§ | 300 | 22,890 | |||||||||
| Manitowoc Company, Inc.§ | 4,800 | 181,536 | |||||||||
| 3,549,492 | |||||||||||
| Marine (0.0%) | |||||||||||
| Kirby Corp.* | 600 | 32,904 | |||||||||
| Media (2.7%) | |||||||||||
| Comcast Corp. Class A§ | 2,100 | 43,155 | |||||||||
| DIRECTV Group, Inc.*§ | 20,600 | 507,584 | |||||||||
| Liberty Media Corp. - Capital Series A* | 10,600 | 162,922 | |||||||||
| News Corp. Class A | 45,000 | 805,500 | |||||||||
See Accompanying Notes to Financial Statements.
19
Credit Suisse Large Cap Growth Fund
Schedule of Investments (continued)
April 30, 2008 (unaudited)
| Number of Shares | Value | ||||||||||
| COMMON STOCKS | |||||||||||
| Media | |||||||||||
| Regal Entertainment Group Class A§ | 27,200 | $ | 515,712 | ||||||||
| Scholastic Corp.*§ | 2,700 | 76,005 | |||||||||
| The E.W. Scripps Co. Class A | 2,100 | 94,311 | |||||||||
| Walt Disney Co. | 3,700 | 119,991 | |||||||||
| 2,325,180 | |||||||||||
| Metals & Mining (2.0%) | |||||||||||
| AK Steel Holding Corp. | 1,300 | 81,614 | |||||||||
| Alpha Natural Resources, Inc.* | 1,600 | 77,840 | |||||||||
| CONSOL Energy, Inc. | 2,000 | 161,920 | |||||||||
| Foundation Coal Holdings, Inc. | 500 | 29,990 | |||||||||
| Freeport-McMoRan Copper & Gold, Inc.§ | 5,770 | 656,338 | |||||||||
| Massey Energy Co. | 900 | 47,097 | |||||||||
| Nucor Corp. | 4,000 | 302,000 | |||||||||
| Southern Copper Corp.§ | 3,100 | 355,756 | |||||||||
| 1,712,555 | |||||||||||
| Multiline Retail (2.5%) | |||||||||||
| Target Corp. | 6,600 | 350,658 | |||||||||
| Wal-Mart Stores, Inc. | 30,400 | 1,762,592 | |||||||||
| 2,113,250 | |||||||||||
| Oil & Gas (4.0%) | |||||||||||
| Anadarko Petroleum Corp. | 1,000 | 66,560 | |||||||||
| Apache Corp. | 500 | 67,340 | |||||||||
| Cabot Oil & Gas Corp. | 1,100 | 62,667 | |||||||||
| Chesapeake Energy Corp.§ | 1,400 | 72,380 | |||||||||
| Chevron Corp. | 2,900 | 278,835 | |||||||||
| Devon Energy Corp. | 600 | 68,040 | |||||||||
| EOG Resources, Inc.§ | 500 | 65,240 | |||||||||
| Exxon Mobil Corp. | 20,200 | 1,880,014 | |||||||||
| Frontier Oil Corp. | 4,200 | 104,370 | |||||||||
| Occidental Petroleum Corp. | 7,300 | 607,433 | |||||||||
| Quicksilver Resources, Inc.§ | 1,200 | 49,788 | |||||||||
| The Williams Companies, Inc. | 1,900 | 67,450 | |||||||||
| XTO Energy, Inc. | 1,000 | 61,860 | |||||||||
| 3,451,977 | |||||||||||
| Pharmaceuticals (4.7%) | |||||||||||
| Abbott Laboratories | 10,900 | 574,975 | |||||||||
| Bristol-Myers Squibb Co. | 43,400 | 953,498 | |||||||||
| Eli Lilly and Co. | 2,100 | 101,094 | |||||||||
| Endo Pharmaceuticals Holdings, Inc.*§ | 5,000 | 124,150 | |||||||||
| Forest Laboratories, Inc.* | 7,500 | 260,325 | |||||||||
| Johnson & Johnson | 6,900 | 462,921 | |||||||||
| Medco Health Solutions, Inc.* | 6,262 | 310,219 | |||||||||
| Medicis Pharmaceutical Corp. Class A§ | 4,000 | 82,400 | |||||||||
See Accompanying Notes to Financial Statements.
20
Credit Suisse Large Cap Growth Fund
Schedule of Investments (continued)
April 30, 2008 (unaudited)
| Number of Shares | Value | ||||||||||
| COMMON STOCKS | |||||||||||
| Pharmaceuticals | |||||||||||
| Merck & Company, Inc. | 16,900 | $ | 642,876 | ||||||||
| Pfizer, Inc. | 18,800 | 378,068 | |||||||||
| Watson Pharmaceuticals, Inc.*§ | 5,900 | 183,136 | |||||||||
| 4,073,662 | |||||||||||
| Real Estate (0.5%) | |||||||||||
| Jones Lang LaSalle, Inc.§ | 4,900 | 380,289 | |||||||||
| The St. Joe Co.§ | 1,100 | 44,737 | |||||||||
| 425,026 | |||||||||||
| Road & Rail (2.1%) | |||||||||||
| Burlington Northern Santa Fe Corp. | 8,900 | 912,695 | |||||||||
| Union Pacific Corp.§ | 6,000 | 871,140 | |||||||||
| 1,783,835 | |||||||||||
| Semiconductor Equipment & Products (5.4%) | |||||||||||
| Analog Devices, Inc. | 14,500 | 467,045 | |||||||||
| Applied Materials, Inc.§ | 2,000 | 37,320 | |||||||||
| Cree, Inc.*§ | 200 | 5,200 | |||||||||
| First Solar, Inc.*§ | 700 | 204,393 | |||||||||
| Intel Corp. | 96,600 | 2,150,316 | |||||||||
| MEMC Electronic Materials, Inc.* | 8,400 | 528,948 | |||||||||
| Microchip Technology, Inc.§ | 6,200 | 227,850 | |||||||||
| Teradyne, Inc.* | 1,000 | 13,290 | |||||||||
| Texas Instruments, Inc. | 34,500 | 1,006,020 | |||||||||
| 4,640,382 | |||||||||||
| Software (6.4%) | |||||||||||
| Adobe Systems, Inc.* | 9,500 | 354,255 | |||||||||
| Autodesk, Inc.* | 2,600 | 98,800 | |||||||||
| BMC Software, Inc.*§ | 9,400 | 326,744 | |||||||||
| Compuware Corp.* | 2,000 | 15,080 | |||||||||
| Microsoft Corp. | 119,400 | 3,405,288 | |||||||||
| Oracle Corp.* | 60,400 | 1,259,340 | |||||||||
| Salesforce.com, Inc.*§ | 1,100 | 73,403 | |||||||||
| VeriFone Holdings, Inc.* | 700 | 7,833 | |||||||||
| 5,540,743 | |||||||||||
| Specialty Retail (2.6%) | |||||||||||
| Abercrombie & Fitch Co. Class A§ | 4,800 | 356,688 | |||||||||
| AutoZone, Inc.* | 1,700 | 205,275 | |||||||||
| Best Buy Company, Inc.§ | 13,400 | 576,468 | |||||||||
| RadioShack Corp.§ | 24,600 | 341,940 | |||||||||
| Staples, Inc. | 5,400 | 117,180 | |||||||||
| The Gap, Inc. | 12,200 | 227,164 | |||||||||
| The TJX Companies, Inc. | 3,900 | 125,658 | |||||||||
| Tiffany & Co.§ | 6,500 | 283,010 | |||||||||
| 2,233,383 | |||||||||||
See Accompanying Notes to Financial Statements.
21
Credit Suisse Large Cap Growth Fund
Schedule of Investments (continued)
April 30, 2008 (unaudited)
| Number of Shares | Value | ||||||||||
| COMMON STOCKS | |||||||||||
| Textiles & Apparel (1.0%) | |||||||||||
| Nike, Inc. Class B§ | 13,100 | $ | 875,080 | ||||||||
| Tobacco (1.4%) | |||||||||||
| Altria Group, Inc. | 9,400 | 188,000 | |||||||||
| Loews Corp. Carolina Group | 5,900 | 387,453 | |||||||||
| Philip Morris International, Inc.* | 9,400 | 479,682 | |||||||||
| UST, Inc.§ | 3,300 | 171,831 | |||||||||
| 1,226,966 | |||||||||||
| Wireless Telecommunication Services (0.3%) | |||||||||||
| Telephone and Data Systems, Inc. | 6,800 | 260,440 | |||||||||
| TOTAL COMMON STOCKS (Cost $78,421,095) | 83,332,012 | ||||||||||
| SHORT-TERM INVESTMENTS (23.0%) | |||||||||||
| State Street Navigator Prime Portfolio§§ | 17,199,146 | 17,199,146 | |||||||||
| Par (000) | |||||||||||
| State Street Bank and Trust Co. Euro Time Deposit, 1.100%, 05/01/08 | $ | 2,553 | 2,553,000 | ||||||||
| TOTAL SHORT-TERM INVESTMENTS (Cost $19,752,146) | 19,752,146 | ||||||||||
| TOTAL INVESTMENTS AT VALUE (120.0%) (Cost $98,173,241) | 103,084,158 | ||||||||||
| LIABILITIES IN EXCESS OF OTHER ASSETS (-20.0%) | (17,196,807 | ) | |||||||||
| NET ASSETS (100.0%) | $ | 85,887,351 | |||||||||
* Non-income producing security.
^ Not readily marketable security; security is valued at fair value as determined in good faith by, or under the direction of, the Board of Trustees.
§ Security or a portion thereof is on loan.
§§ Represents security purchased with cash collateral received for securities on loan.
See Accompanying Notes to Financial Statements.
22
Credit Suisse Mid-Cap Core Fund
Schedule of Investments
April 30, 2008 (unaudited)
| Number of Shares | Value | ||||||||||
| COMMON STOCKS (100.2%) | |||||||||||
| Aerospace & Defense (1.3%) | |||||||||||
| Alliant Techsystems, Inc.*§ | 8,700 | $ | 956,826 | ||||||||
| Goodrich Corp. | 4,800 | 327,120 | |||||||||
| L-3 Communications Holdings, Inc. | 2,800 | 312,060 | |||||||||
| Rockwell Collins, Inc. | 4,800 | 302,928 | |||||||||
| 1,898,934 | |||||||||||
| Airlines (0.2%) | |||||||||||
| AMR Corp.*§ | 10,500 | 92,085 | |||||||||
| Continental Airlines, Inc. Class B*§ | 5,100 | 91,698 | |||||||||
| Delta Air Lines, Inc.*§ | 8,600 | 73,186 | |||||||||
| SkyWest, Inc. | 5,800 | 110,374 | |||||||||
| 367,343 | |||||||||||
| Auto Components (0.4%) | |||||||||||
| ArvinMeritor, Inc.§ | 1,576 | 23,545 | |||||||||
| Autoliv, Inc.§ | 2,900 | 177,596 | |||||||||
| Lear Corp.* | 14,900 | 425,693 | |||||||||
| 626,834 | |||||||||||
| Banks (3.2%) | |||||||||||
| Associated Banc-Corp.§ | 3,410 | 96,401 | |||||||||
| Astoria Financial Corp.§ | 3,501 | 82,974 | |||||||||
| Bank of Hawaii Corp. | 7,600 | 416,708 | |||||||||
| Cathay General Bancorp§ | 7,200 | 122,760 | |||||||||
| Cullen/Frost Bankers, Inc.§ | 6,916 | 386,051 | |||||||||
| East West Bancorp, Inc.§ | 11,900 | 169,456 | |||||||||
| First Community Bancorp, Inc.§ | 5,600 | 120,344 | |||||||||
| First Niagara Financial Group, Inc. | 1,727 | 24,920 | |||||||||
| FirstMerit Corp. | 2,567 | 52,675 | |||||||||
| KeyCorp | 11,600 | 279,908 | |||||||||
| New York Community Bancorp, Inc.§ | 22,300 | 416,341 | |||||||||
| Northern Trust Corp. | 4,300 | 318,673 | |||||||||
| South Financial Group, Inc.§ | 17,900 | 108,116 | |||||||||
| Sovereign Bancorp, Inc.§ | 24,000 | 179,280 | |||||||||
| SVB Financial Group*§ | 7,600 | 369,816 | |||||||||
| Synovus Financial Corp.§ | 48,200 | 570,688 | |||||||||
| TCF Financial Corp.§ | 14,300 | 248,820 | |||||||||
| The Colonial BancGroup, Inc.§ | 40,700 | 331,298 | |||||||||
| Washington Federal, Inc. | 2,727 | 64,930 | |||||||||
| Webster Financial Corp. | 12,400 | 323,020 | |||||||||
| Wilmington Trust Corp.§ | 3,944 | 129,679 | |||||||||
| 4,812,858 | |||||||||||
| Beverages (0.4%) | |||||||||||
| Hansen Natural Corp.*§ | 4,900 | 173,411 | |||||||||
| Molson Coors Brewing Co. Class B | 5,000 | 274,200 | |||||||||
| PepsiAmericas, Inc. | 3,294 | 84,656 | |||||||||
| 532,267 | |||||||||||
See Accompanying Notes to Financial Statements.
23
Credit Suisse Mid-Cap Core Fund
Schedule of Investments (continued)
April 30, 2008 (unaudited)
| Number of Shares | Value | ||||||||||
| COMMON STOCKS | |||||||||||
| Biotechnology (3.0%) | |||||||||||
| Alexion Pharmaceuticals, Inc.* | 4,500 | $ | 316,710 | ||||||||
| BioMarin Pharmaceutical, Inc.*§ | 26,700 | 973,482 | |||||||||
| Cephalon, Inc.*§ | 9,100 | 567,931 | |||||||||
| Charles River Laboratories International, Inc.* | 10,400 | 603,720 | |||||||||
| Invitrogen Corp.* | 6,532 | 611,199 | |||||||||
| Millennium Pharmaceuticals, Inc.* | 48,700 | 1,211,169 | |||||||||
| OSI Pharmaceuticals, Inc.*§ | 7,200 | 249,480 | |||||||||
| 4,533,691 | |||||||||||
| Building Products (0.4%) | |||||||||||
| Crane Co. | 13,200 | 540,408 | |||||||||
| Chemicals (5.5%) | |||||||||||
| Celanese Corp. Class A | 17,500 | 783,125 | |||||||||
| CF Industries Holdings, Inc. | 16,923 | 2,262,605 | |||||||||
| Cytec Industries, Inc. | 7,349 | 433,665 | |||||||||
| FMC Corp. | 22,100 | 1,387,438 | |||||||||
| Lubrizol Corp. | 21,400 | 1,248,048 | |||||||||
| Minerals Technologies, Inc. | 5,100 | 345,474 | |||||||||
| Olin Corp. | 10,200 | 205,734 | |||||||||
| OM Group, Inc.* | 8,800 | 481,888 | |||||||||
| The Mosaic Co.* | 9,500 | 1,163,845 | |||||||||
| 8,311,822 | |||||||||||
| Commercial Services & Supplies (5.8%) | |||||||||||
| Alliance Data Systems Corp.* | 17,600 | 1,010,416 | |||||||||
| Bally Technologies, Inc.*§ | 9,500 | 320,055 | |||||||||
| Brink's Co. | 16,900 | 1,229,475 | |||||||||
| Con-way, Inc.§ | 6,300 | 291,375 | |||||||||
| CSG Systems International, Inc.* | 16,600 | 200,860 | |||||||||
| DeVry, Inc.§ | 8,800 | 501,600 | |||||||||
| DST Systems, Inc.*§ | 7,900 | 472,736 | |||||||||
| Dun & Bradstreet Corp. | 7,900 | 665,970 | |||||||||
| Herman Miller, Inc.§ | 11,400 | 265,962 | |||||||||
| ITT Educational Services, Inc.*§ | 3,800 | 291,308 | |||||||||
| Korn/Ferry International* | 13,200 | 246,312 | |||||||||
| Manpower, Inc. | 11,700 | 785,421 | |||||||||
| Republic Services, Inc. | 22,600 | 718,454 | |||||||||
| Rollins, Inc. | 2,200 | 35,046 | |||||||||
| Sotheby's§ | 9,900 | 274,230 | |||||||||
| Stericycle, Inc.* | 12,700 | 677,926 | |||||||||
| Strayer Education, Inc.§ | 2,200 | 408,518 | |||||||||
| The Corporate Executive Board Co. | 5,110 | 222,643 | |||||||||
| Valassis Communications, Inc.*§ | 6,958 | 98,803 | |||||||||
| 8,717,110 | |||||||||||
See Accompanying Notes to Financial Statements.
24
Credit Suisse Mid-Cap Core Fund
Schedule of Investments (continued)
April 30, 2008 (unaudited)
| Number of Shares | Value | ||||||||||
| COMMON STOCKS | |||||||||||
| Communications Equipment (1.4%) | |||||||||||
| ADC Telecommunications, Inc.* | 14,900 | $ | 208,898 | ||||||||
| CommScope, Inc.* | 9,574 | 455,244 | |||||||||
| Harris Corp. | 15,900 | 859,077 | |||||||||
| Juniper Networks, Inc.* | 11,500 | 317,630 | |||||||||
| Plantronics, Inc. | 13,400 | 333,794 | |||||||||
| Unity Wireless Corp.* | 712,201 | 12,107 | |||||||||
| 2,186,750 | |||||||||||
| Computers & Peripherals (1.6%) | |||||||||||
| Lexmark International, Inc. Class A*§ | 8,000 | 251,120 | |||||||||
| NCR Corp.* | 31,200 | 768,456 | |||||||||
| NVIDIA Corp.* | 12,400 | 254,820 | |||||||||
| Palm, Inc.§ | 700 | 4,032 | |||||||||
| Western Digital Corp.*§ | 38,500 | 1,116,115 | |||||||||
| 2,394,543 | |||||||||||
| Construction & Engineering (0.6%) | |||||||||||
| Fluor Corp. | 3,000 | 458,610 | |||||||||
| Quanta Services, Inc.*§ | 3,157 | 83,787 | |||||||||
| Shaw Group, Inc.* | 6,500 | 321,230 | |||||||||
| 863,627 | |||||||||||
| Containers & Packaging (0.3%) | |||||||||||
| Owens-Illinois, Inc.* | 7,400 | 408,110 | |||||||||
| Packaging Corp. of America | 2,700 | 59,346 | |||||||||
| 467,456 | |||||||||||
| Distributor (0.1%) | |||||||||||
| WESCO International, Inc.*§ | 3,900 | 145,119 | |||||||||
| Diversified Financials (2.3%) | |||||||||||
| Ameriprise Financial, Inc. | 5,400 | 256,446 | |||||||||
| BlackRock, Inc.§ | 2,400 | 484,296 | |||||||||
| Eaton Vance Corp.§ | 13,400 | 490,440 | |||||||||
| Federated Investors, Inc. Class B | 6,600 | 220,968 | |||||||||
| Greenhill & Company, Inc.§ | 2,400 | 156,120 | |||||||||
| IndyMac Bancorp, Inc.§ | 100 | 325 | |||||||||
| IntercontinentalExchange Inc.* | 900 | 139,635 | |||||||||
| Marshall & Ilsley Corp.§ | 5,300 | 132,394 | |||||||||
| Midcap SPDR Trust Series 1§ | 8,500 | 1,294,210 | |||||||||
| Raymond James Financial, Inc. | 2,974 | 85,562 | |||||||||
| The First Marblehead Corp.§ | 10,000 | 37,000 | |||||||||
| Waddell & Reed Financial, Inc. Class A | 4,190 | 141,873 | |||||||||
| 3,439,269 | |||||||||||
| Diversified Telecommunication Services (0.2%) | |||||||||||
| CenturyTel, Inc. | 3,300 | 107,085 | |||||||||
| Embarq Corp. | 3,200 | 133,024 | |||||||||
| NeuStar, Inc. Class A*§ | 3,500 | 96,285 | |||||||||
| 336,394 | |||||||||||
See Accompanying Notes to Financial Statements.
25
Credit Suisse Mid-Cap Core Fund
Schedule of Investments (continued)
April 30, 2008 (unaudited)
| Number of Shares | Value | ||||||||||
| COMMON STOCKS | |||||||||||
| Electric Utilities (4.2%) | |||||||||||
| Alliant Energy Corp. | 16,800 | $ | 632,856 | ||||||||
| Black Hills Corp.§ | 9,200 | 358,892 | |||||||||
| CenterPoint Energy, Inc.§ | 18,000 | 273,960 | |||||||||
| DPL, Inc.§ | 6,800 | 189,244 | |||||||||
| Edison International | 14,000 | 730,380 | |||||||||
| Energy East Corp.§ | 22,400 | 510,720 | |||||||||
| Entergy Corp. | 7,100 | 815,506 | |||||||||
| Mirant Corp.*§ | 19,600 | 805,756 | |||||||||
| NRG Energy, Inc.*§ | 14,900 | 654,855 | |||||||||
| NSTAR§ | 3,934 | 126,714 | |||||||||
| PPL Corp. | 5,800 | 278,516 | |||||||||
| Puget Energy, Inc. | 3,302 | 89,848 | |||||||||
| Reliant Energy, Inc.* | 31,400 | 808,236 | |||||||||
| 6,275,483 | |||||||||||
| Electrical Equipment (1.1%) | |||||||||||
| AMETEK, Inc. | 5,556 | 269,577 | |||||||||
| Energizer Holdings, Inc.* | 7,800 | 616,668 | |||||||||
| Hubbell, Inc. Class B§ | 9,000 | 402,570 | |||||||||
| Rockwell Automation, Inc. | 2,600 | 140,998 | |||||||||
| Thomas & Betts Corp.* | 7,212 | 270,162 | |||||||||
| 1,699,975 | |||||||||||
| Electronic Equipment & Instruments (1.9%) | |||||||||||
| Amphenol Corp. Class A | 8,700 | 401,766 | |||||||||
| Avnet, Inc.* | 25,100 | 657,369 | |||||||||
| Benchmark Electronics, Inc.* | 7,300 | 129,794 | |||||||||
| Ingram Micro, Inc.* | 18,800 | 319,788 | |||||||||
| Intersil Corp. Class A§ | 17,600 | 470,272 | |||||||||
| Molex, Inc. | 5,900 | 167,442 | |||||||||
| Varian, Inc.*§ | 14,500 | 738,485 | |||||||||
| 2,884,916 | |||||||||||
| Energy Equipment & Services (5.2%) | |||||||||||
| Cameron International Corp.* | 17,900 | 881,217 | |||||||||
| ENSCO International, Inc. | 4,800 | 305,904 | |||||||||
| FMC Technologies, Inc.* | 31,700 | 2,130,240 | |||||||||
| Helmerich & Payne, Inc. | 15,300 | 822,375 | |||||||||
| National-Oilwell Varco, Inc.* | 14,123 | 966,719 | |||||||||
| Patterson-UTI Energy, Inc.§ | 27,300 | 762,762 | |||||||||
| Pride International, Inc.* | 23,100 | 980,595 | |||||||||
| Tidewater, Inc.§ | 13,000 | 847,860 | |||||||||
| Unit Corp.* | 2,900 | 184,179 | |||||||||
| 7,881,851 | |||||||||||
| Food & Drug Retailing (0.9%) | |||||||||||
| Flowers Foods, Inc. | 5,700 | 147,573 | |||||||||
| Longs Drug Stores Corp. | 2,800 | 112,168 | |||||||||
| Terra Industries, Inc.* | 27,800 | 1,052,508 | |||||||||
| 1,312,249 | |||||||||||
See Accompanying Notes to Financial Statements.
26
Credit Suisse Mid-Cap Core Fund
Schedule of Investments (continued)
April 30, 2008 (unaudited)
| Number of Shares | Value | ||||||||||
| COMMON STOCKS | |||||||||||
| Food Products (1.2%) | |||||||||||
| Corn Products International, Inc. | 13,300 | $ | 616,854 | ||||||||
| Hormel Foods Corp. | 21,500 | 847,315 | |||||||||
| Sara Lee Corp. | 20,100 | 291,651 | |||||||||
| 1,755,820 | |||||||||||
| Gas Utilities (4.3%) | |||||||||||
| Energen Corp. | 21,800 | 1,487,632 | |||||||||
| MDU Resources Group, Inc. | 26,100 | 753,507 | |||||||||
| National Fuel Gas Co.§ | 20,000 | 1,023,600 | |||||||||
| ONEOK, Inc. | 14,900 | 716,988 | |||||||||
| Southwestern Energy Co.* | 58,200 | 2,462,442 | |||||||||
| 6,444,169 | |||||||||||
| Healthcare Equipment & Supplies (5.1%) | |||||||||||
| Applera Corp. | 7,600 | 242,516 | |||||||||
| Beckman Coulter, Inc. | 9,600 | 655,680 | |||||||||
| DENTSPLY International, Inc. | 21,500 | 835,705 | |||||||||
| Hologic, Inc.* | 35,600 | 1,039,164 | |||||||||
| IMS Health, Inc. | 5,700 | 141,075 | |||||||||
| Intuitive Surgical, Inc.* | 11,800 | 3,413,268 | |||||||||
| Kinetic Concepts, Inc.* | 22,300 | 884,418 | |||||||||
| STERIS Corp. | 3,384 | 93,771 | |||||||||
| Varian Medical Systems, Inc.* | 7,800 | 365,664 | |||||||||
| 7,671,261 | |||||||||||
| Healthcare Providers & Services (5.2%) | |||||||||||
| AmerisourceBergen Corp. | 6,600 | 267,630 | |||||||||
| Apria Healthcare Group, Inc.* | 6,100 | 107,482 | |||||||||
| Covance, Inc.* | 14,100 | 1,181,439 | |||||||||
| Express Scripts, Inc.* | 11,300 | 791,226 | |||||||||
| Health Net, Inc.* | 3,725 | 109,105 | |||||||||
| Henry Schein, Inc.*§ | 13,200 | 730,884 | |||||||||
| Humana, Inc.* | 10,500 | 501,795 | |||||||||
| Kindred Healthcare, Inc.* | 17,800 | 422,394 | |||||||||
| LifePoint Hospitals, Inc.*§ | 7,000 | 210,840 | |||||||||
| Lincare Holdings, Inc.*§ | 6,300 | 153,342 | |||||||||
| PARAXEL International Corp.* | 15,000 | 381,000 | |||||||||
| Pharmaceutical Product Development, Inc. | 27,200 | 1,126,624 | |||||||||
| WellCare Health Plans, Inc.*§ | 41,400 | 1,812,492 | |||||||||
| 7,796,253 | |||||||||||
| Hotels, Restaurants & Leisure (0.8%) | |||||||||||
| CBRL Group, Inc.§ | 6,500 | 240,110 | |||||||||
| Chipotle Mexican Grill, Inc. Class A*§ | 3,100 | 304,203 | |||||||||
| Choice Hotels International, Inc.§ | 3,600 | 124,164 | |||||||||
| WMS Industries, Inc.*§ | 6,800 | 246,092 | |||||||||
| Yum! Brands, Inc. | 8,800 | 357,984 | |||||||||
| 1,272,553 | |||||||||||
See Accompanying Notes to Financial Statements.
27
Credit Suisse Mid-Cap Core Fund
Schedule of Investments (continued)
April 30, 2008 (unaudited)
| Number of Shares | Value | ||||||||||
| COMMON STOCKS | |||||||||||
| Household Durables (1.6%) | |||||||||||
| Blyth, Inc. | 3,493 | $ | 58,822 | ||||||||
| D.R. Horton, Inc.§ | 13,700 | 212,213 | |||||||||
| Furniture Brands International, Inc.§ | 29,300 | 397,015 | |||||||||
| KB Home§ | 8,300 | 186,750 | |||||||||
| Mohawk Industries, Inc.*§ | 8,100 | 617,139 | |||||||||
| NVR, Inc.*§ | 700 | 429,450 | |||||||||
| The Ryland Group, Inc.§ | 6,036 | 193,031 | |||||||||
| Tupperware Brands Corp. | 9,100 | 358,540 | |||||||||
| 2,452,960 | |||||||||||
| Household Products (0.3%) | |||||||||||
| Church & Dwight Co, Inc.§ | 8,800 | 500,016 | |||||||||
| Industrial Conglomerates (1.0%) | |||||||||||
| Carlisle Companies, Inc.§ | 7,800 | 225,264 | |||||||||
| KBR, Inc. | 23,600 | 680,624 | |||||||||
| Teleflex, Inc. | 5,600 | 308,504 | |||||||||
| Walter Industries, Inc. | 4,700 | 325,992 | |||||||||
| 1,540,384 | |||||||||||
| Insurance (3.7%) | |||||||||||
| Ambac Financial Group, Inc.§ | 36,900 | 170,847 | |||||||||
| American Financial Group, Inc. | 11,650 | 319,443 | |||||||||
| Arthur J. Gallagher & Co.§ | 3,252 | 79,902 | |||||||||
| Assurant, Inc. | 5,300 | 344,500 | |||||||||
| CNA Financial Corp.§ | 9,400 | 252,014 | |||||||||
| Conseco, Inc.* | 11,100 | 129,315 | |||||||||
| Everest Re Group, Ltd. | 9,400 | 849,290 | |||||||||
| Fidelity National Financial, Inc. Class A§ | 45,200 | 722,748 | |||||||||
| Hanover Insurance Group, Inc. | 5,449 | 244,551 | |||||||||
| HCC Insurance Holdings, Inc. | 16,900 | 417,092 | |||||||||
| MGIC Investment Corp.§ | 8,400 | 109,452 | |||||||||
| Radian Group, Inc.§ | 27,700 | 149,580 | |||||||||
| StanCorp Financial Group, Inc. | 6,286 | 322,095 | |||||||||
| The PMI Group, Inc.§ | 25,800 | 145,254 | |||||||||
| Transatlantic Holdings, Inc. | 700 | 45,395 | |||||||||
| Unitrin, Inc.§ | 4,664 | 176,952 | |||||||||
| Unum Group | 11,900 | 276,199 | |||||||||
| W.R. Berkley Corp. | 27,250 | 700,052 | |||||||||
| XL Capital, Ltd. Class A | 3,500 | 122,115 | |||||||||
| 5,576,796 | |||||||||||
| Internet Software & Services (0.5%) | |||||||||||
| McAfee, Inc.* | 22,100 | 734,825 | |||||||||
| IT Consulting & Services (0.3%) | |||||||||||
| Acxiom Corp.§ | 9,400 | 111,202 | |||||||||
| Computer Sciences Corp.*§ | 6,600 | 287,694 | |||||||||
| 398,896 | |||||||||||
See Accompanying Notes to Financial Statements.
28
Credit Suisse Mid-Cap Core Fund
Schedule of Investments (continued)
April 30, 2008 (unaudited)
| Number of Shares | Value | ||||||||||
| COMMON STOCKS | |||||||||||
| Leisure Equipment & Products (0.4%) | |||||||||||
| Brunswick Corp.§ | 8,100 | $ | 135,108 | ||||||||
| Callaway Golf Co.§ | 11,500 | 158,010 | |||||||||
| Hasbro, Inc.§ | 4,900 | 174,244 | |||||||||
| Polaris Industries, Inc.§ | 3,200 | 148,960 | |||||||||
| 616,322 | |||||||||||
| Machinery (5.5%) | |||||||||||
| AGCO Corp.* | 23,800 | 1,431,094 | |||||||||
| Eaton Corp.§ | 3,200 | 281,088 | |||||||||
| Flowserve Corp. | 8,400 | 1,042,356 | |||||||||
| Gardner Denver, Inc.* | 6,700 | 311,215 | |||||||||
| Harsco Corp. | 7,200 | 427,176 | |||||||||
| Ingersoll-Rand Company, Ltd. Class A | 9,500 | 421,610 | |||||||||
| Joy Global, Inc. | 25,600 | 1,900,800 | |||||||||
| Kennametal, Inc. | 5,200 | 180,804 | |||||||||
| Lincoln Electric Holdings, Inc. | 5,000 | 381,500 | |||||||||
| Nordson Corp.§ | 5,000 | 295,150 | |||||||||
| Parker Hannifin Corp. | 4,100 | 327,385 | |||||||||
| Reliance Steel & Aluminum Co. | 5,000 | 303,900 | |||||||||
| SPX Corp. | 4,200 | 516,600 | |||||||||
| The Timken Co. | 8,200 | 296,430 | |||||||||
| Trinity Industries, Inc.§ | 3,300 | 100,320 | |||||||||
| 8,217,428 | |||||||||||
| Marine (0.2%) | |||||||||||
| Overseas Shipholding Group, Inc.§ | 3,754 | 282,526 | |||||||||
| Media (0.9%) | |||||||||||
| DISH Network Corp. Class A* | 3,900 | 116,376 | |||||||||
| Gannett Co., Inc.§ | 4,200 | 120,204 | |||||||||
| Harte-Hanks, Inc.§ | 7,400 | 101,084 | |||||||||
| Interactive Data Corp. | 10,800 | 291,384 | |||||||||
| Netflix, Inc.*§ | 6,100 | 195,078 | |||||||||
| Regal Entertainment Group Class A§ | 8,100 | 153,576 | |||||||||
| Scholastic Corp.*§ | 13,600 | 382,840 | |||||||||
| 1,360,542 | |||||||||||
| Metals & Mining (3.7%) | |||||||||||
| AK Steel Holding Corp. | 13,200 | 828,696 | |||||||||
| Arch Coal, Inc. | 19,300 | 1,107,048 | |||||||||
| Carpenter Technology Corp. | 8,995 | 461,264 | |||||||||
| Cleveland-Cliffs, Inc. | 6,489 | 1,040,836 | |||||||||
| Freeport-McMoRan Copper & Gold, Inc. | 8,300 | 944,125 | |||||||||
| Massey Energy Co. | 6,400 | 334,912 | |||||||||
| Steel Dynamics, Inc. | 25,300 | 881,705 | |||||||||
| Worthington Industries, Inc.§ | 2,146 | 38,649 | |||||||||
| 5,637,235 | |||||||||||
See Accompanying Notes to Financial Statements.
29
Credit Suisse Mid-Cap Core Fund
Schedule of Investments (continued)
April 30, 2008 (unaudited)
| Number of Shares | Value | ||||||||||
| COMMON STOCKS | |||||||||||
| Multi-Utilities (0.6%) | |||||||||||
| Questar Corp. | 12,300 | $ | 762,969 | ||||||||
| Vectren Corp.§ | 3,391 | 95,898 | |||||||||
| Westar Energy, Inc. | 2,927 | 67,877 | |||||||||
| 926,744 | |||||||||||
| Multiline Retail (1.1%) | |||||||||||
| Big Lots, Inc.*§ | 17,800 | 481,134 | |||||||||
| BJ's Wholesale Club, Inc.*§ | 13,600 | 518,432 | |||||||||
| Dollar Tree, Inc.* | 11,500 | 363,400 | |||||||||
| Nordstrom, Inc.§ | 6,900 | 243,294 | |||||||||
| 1,606,260 | |||||||||||
| Oil & Gas (6.6%) | |||||||||||
| Cimarex Energy Co. | 19,600 | 1,221,080 | |||||||||
| Continental Resources, Inc.*§ | 19,400 | 833,618 | |||||||||
| Denbury Resources, Inc.* | 35,200 | 1,075,712 | |||||||||
| Encore Acquisition Co.*§ | 6,900 | 314,847 | |||||||||
| Equitable Resources, Inc. | 18,000 | 1,194,660 | |||||||||
| Frontier Oil Corp. | 15,004 | 372,849 | |||||||||
| Hess Corp. | 3,000 | 318,600 | |||||||||
| Holly Corp. | 2,500 | 103,700 | |||||||||
| Murphy Oil Corp. | 3,700 | 334,258 | |||||||||
| Newfield Exploration Co.*§ | 18,600 | 1,130,136 | |||||||||
| Noble Energy, Inc. | 3,300 | 287,100 | |||||||||
| Plains Exploration & Production Co.* | 15,161 | 944,227 | |||||||||
| Quicksilver Resources, Inc. | 4,675 | 193,966 | |||||||||
| Stone Energy Corp.* | 13,900 | 847,066 | |||||||||
| W&T Offshore, Inc.§ | 19,400 | 793,460 | |||||||||
| 9,965,279 | |||||||||||
| Paper & Forest Products (0.5%) | |||||||||||
| Potlatch Corp.§ | 6,000 | 268,860 | |||||||||
| Rayonier, Inc.§ | 11,400 | 479,142 | |||||||||
| 748,002 | |||||||||||
| Personal Products (0.3%) | |||||||||||
| Alberto-Culver Co. | 10,800 | 271,836 | |||||||||
| NBTY, Inc.* | 7,500 | 211,125 | |||||||||
| 482,961 | |||||||||||
| Pharmaceuticals (1.0%) | |||||||||||
| Forest Laboratories, Inc.* | 3,700 | 128,427 | |||||||||
| Medicis Pharmaceutical Corp. Class A§ | 7,400 | 152,440 | |||||||||
| Par Pharmaceutical Cos, Inc.*§ | 18,100 | 308,605 | |||||||||
| Perrigo Co.§ | 11,600 | 475,484 | |||||||||
| Sepracor, Inc.*§ | 20,800 | 448,240 | |||||||||
| 1,513,196 | |||||||||||
See Accompanying Notes to Financial Statements.
30
Credit Suisse Mid-Cap Core Fund
Schedule of Investments (continued)
April 30, 2008 (unaudited)
| Number of Shares | Value | ||||||||||
| COMMON STOCKS | |||||||||||
| Real Estate (4.6%) | |||||||||||
| Apartment Investment & Management Co. Class A§ | 11,791 | $ | 436,031 | ||||||||
| Brandywine Realty Trust | 15,700 | 273,965 | |||||||||
| CBL & Associates Properties, Inc.§ | 8,900 | 217,961 | |||||||||
| Colonial Properties Trust | 11,000 | 266,530 | |||||||||
| Developers Diversified Realty Corp.§ | 5,300 | 227,635 | |||||||||
| Duke Realty Corp. | 27,000 | 659,340 | |||||||||
| First Industrial Realty Trust, Inc.§ | 4,600 | 138,966 | |||||||||
| Health Care REIT, Inc. | 6,100 | 295,545 | |||||||||
| Hospitality Properties Trust§ | 14,100 | 453,033 | |||||||||
| Host Hotels & Resorts, Inc. | 8,700 | 149,640 | |||||||||
| HRPT Properties Trust | 35,800 | 248,094 | |||||||||
| Jones Lang LaSalle, Inc.§ | 9,000 | 698,490 | |||||||||
| Liberty Property Trust | 12,800 | 448,384 | |||||||||
| Macerich Co. | 13,300 | 972,629 | |||||||||
| Mack-Cali Realty Corp. | 17,200 | 671,144 | |||||||||
| Mid-America Apartment Communities, Inc. | 2,700 | 141,750 | |||||||||
| Weingarten Realty Investors§ | 16,700 | 616,063 | |||||||||
| 6,915,200 | |||||||||||
| Road & Rail (1.1%) | |||||||||||
| CSX Corp. | 2,600 | 163,670 | |||||||||
| GATX Corp.§ | 6,900 | 303,600 | |||||||||
| J.B. Hunt Transport Services, Inc.§ | 12,300 | 417,831 | |||||||||
| Kansas City Southern*§ | 10,300 | 464,324 | |||||||||
| Werner Enterprises, Inc.§ | 13,500 | 262,575 | |||||||||
| 1,612,000 | |||||||||||
| Semiconductor Equipment & Products (2.1%) | |||||||||||
| Analog Devices, Inc. | 5,300 | 170,713 | |||||||||
| Cree, Inc.*§ | 12,100 | 314,600 | |||||||||
| Cypress Semiconductor Corp.*§ | 15,200 | 427,424 | |||||||||
| First Solar, Inc.* | 1,900 | 554,781 | |||||||||
| Integrated Device Technology, Inc.* | 21,800 | 233,042 | |||||||||
| Lam Research Corp.*§ | 17,000 | 694,280 | |||||||||
| MEMC Electronic Materials, Inc.* | 3,400 | 214,098 | |||||||||
| MPS Group, Inc.* | 13,000 | 139,490 | |||||||||
| Novellus Systems, Inc.*§ | 11,900 | 260,134 | |||||||||
| QLogic Corp.* | 10,400 | 165,984 | |||||||||
| Semtech Corp.* | 2,033 | 33,016 | |||||||||
| 3,207,562 | |||||||||||
| Software (2.1%) | |||||||||||
| ACI Worldwide, Inc.*§ | 2,600 | 57,460 | |||||||||
| Activision, Inc.* | 40,300 | 1,090,115 | |||||||||
| Advent Software, Inc.*§ | 5,000 | 199,300 | |||||||||
| Autodesk, Inc.* | 3,500 | 133,000 | |||||||||
| BMC Software, Inc.* | 9,600 | 333,696 | |||||||||
See Accompanying Notes to Financial Statements.
31
Credit Suisse Mid-Cap Core Fund
Schedule of Investments (continued)
April 30, 2008 (unaudited)
| Number of Shares | Value | ||||||||||
| COMMON STOCKS | |||||||||||
| Software | |||||||||||
| Cadence Design Systems, Inc.* | 36,700 | $ | 408,471 | ||||||||
| National Instruments Corp. | 3,500 | 102,970 | |||||||||
| Sybase, Inc.* | 13,000 | 382,460 | |||||||||
| Synopsys, Inc.* | 20,000 | 462,200 | |||||||||
| 3,169,672 | |||||||||||
| Specialty Retail (3.6%) | |||||||||||
| Abercrombie & Fitch Co. Class A | 4,600 | 341,826 | |||||||||
| Advance Auto Parts, Inc. | 13,200 | 457,776 | |||||||||
| Aeropostale, Inc.*§ | 14,350 | 456,186 | |||||||||
| American Eagle Outfitters, Inc. | 35,600 | 653,972 | |||||||||
| AnnTaylor Stores Corp.* | 9,700 | 245,410 | |||||||||
| AutoZone, Inc.* | 3,800 | 458,850 | |||||||||
| Barnes & Noble, Inc.§ | 6,000 | 193,680 | |||||||||
| GameStop Corp. Class A* | 13,000 | 715,520 | |||||||||
| Men's Wearhouse, Inc.§ | 8,300 | 221,029 | |||||||||
| Rent-A-Center, Inc.* | 24,700 | 531,791 | |||||||||
| The Gap, Inc. | 7,700 | 143,374 | |||||||||
| The TJX Companies, Inc. | 6,400 | 206,208 | |||||||||
| Tiffany & Co. | 3,500 | 152,390 | |||||||||
| United Rentals, Inc.*§ | 24,300 | 457,812 | |||||||||
| Urban Outfitters, Inc.*§ | 3,700 | 126,725 | |||||||||
| Williams-Sonoma, Inc.§ | 3,277 | 86,513 | |||||||||
| 5,449,062 | |||||||||||
| Textiles & Apparel (0.4%) | |||||||||||
| Fossil, Inc.*§ | 4,200 | 150,318 | |||||||||
| Warnaco Group, Inc.* | 11,300 | 521,382 | |||||||||
| 671,700 | |||||||||||
| Tobacco (0.7%) | |||||||||||
| Loews Corp. Carolina Group | 7,200 | 472,824 | |||||||||
| Universal Corp.§ | 8,100 | 519,939 | |||||||||
| 992,763 | |||||||||||
| Trading Companies & Distributors (0.8%) | |||||||||||
| Fastenal Co.§ | 24,200 | 1,181,202 | |||||||||
| TOTAL COMMON STOCKS (Cost $148,601,027) | 150,928,488 | ||||||||||
See Accompanying Notes to Financial Statements.
32
Credit Suisse Mid-Cap Core Fund
Schedule of Investments (continued)
April 30, 2008 (unaudited)
| Number of Shares | Value | ||||||||||
| WARRANTS (0.0%) | |||||||||||
| Wireless Telecommunication Services (0.0%) | |||||||||||
| Unity Wireless Corp., strike price $0.20, expires 08/17/09^ | 79,133 | $ | 0 | ||||||||
| Unity Wireless Corp., strike price $0.22, expires 08/17/09^ | 79,134 | 0 | |||||||||
| Unity Wireless Corp., strike price $0.27, expires 08/17/09^ | 79,133 | 0 | |||||||||
| Unity Wireless Corp., strike price $0.30, expires 08/17/09^ | 79,134 | 0 | |||||||||
| TOTAL WARRANTS (Cost $0) | 0 | ||||||||||
| SHORT-TERM INVESTMENT (25.2%) | |||||||||||
| State Street Navigator Prime Portfolio§§ (Cost $37,985,905) | 37,985,905 | 37,985,905 | |||||||||
| TOTAL INVESTMENTS AT VALUE (125.4%) (Cost $186,586,932) | 188,914,393 | ||||||||||
| LIABILITIES IN EXCESS OF OTHER ASSETS (-25.4%) | (38,318,713 | ) | |||||||||
| NET ASSETS (100.0%) | $ | 150,595,680 | |||||||||
* Non-income producing security.
^ Not readily marketable security; security is valued at fair value as determined in good faith by, or under the direction of, the Board of Directors.
§ Security or a portion thereof is on loan.
§§ Represents security purchased with cash collateral received for securities on loan.
See Accompanying Notes to Financial Statements.
33
Credit Suisse Funds
Statements of Assets and Liabilities
April 30, 2008 (unaudited)
| Large Cap Growth Fund | Mid-Cap Core Fund | ||||||||||
| Assets | |||||||||||
| Investments at value, including collateral for securities on loan of $17,199,146 and $37,985,905 (Cost $98,173,241, and $186,586,932, respectively) (Note 2) | $ | 103,084,1581 | $ | 188,914,3932 | |||||||
| Cash | 948 | — | |||||||||
| Receivable for investments sold | 2,956,391 | — | |||||||||
| Dividends receivable | 57,402 | 80,464 | |||||||||
| Receivable for fund shares sold | 45,379 | 60,066 | |||||||||
| Prepaid expenses and other assets | 31,516 | 48,811 | |||||||||
| Total Assets | 106,175,794 | 189,103,734 | |||||||||
| Liabilities | |||||||||||
| Advisory fee payable (Note 3) | 35,142 | 85,809 | |||||||||
| Administrative services fee payable (Note 3) | 1,262 | 2,535 | |||||||||
| Shareholder servicing/Distribution fee payable (Note 3) | 19,451 | 48,889 | |||||||||
| Payable upon return of securities loaned (Note 2) | 17,199,146 | 37,985,905 | |||||||||
| Due to custodian | — | 78,495 | |||||||||
| Payable for investments purchased | 2,937,819 | — | |||||||||
| Payable for fund shares redeemed | 43,213 | 63,875 | |||||||||
| Trustees'/Directors' fee payable | 8,544 | 8,544 | |||||||||
| Other accrued expenses payable | 43,866 | 234,002 | |||||||||
| Total Liabilities | 20,288,443 | 38,508,054 | |||||||||
| Net Assets | |||||||||||
| Capital stock, $.001 par value (Note 6) | 4,821 | 4,198 | |||||||||
| Paid-in capital (Note 6) | 373,526,517 | 255,701,440 | |||||||||
| Undistributed net investment income (loss) | 141,982 | (139,588 | ) | ||||||||
| Accumulated net realized loss on investments | (292,696,886 | ) | (107,297,831 | ) | |||||||
| Net unrealized appreciation from investments | 4,910,917 | 2,327,461 | |||||||||
| Net Assets | $ | 85,887,351 | $ | 150,595,680 | |||||||
| Common Shares | |||||||||||
| Net assets | $ | 82,114,989 | $ | 141,407,971 | |||||||
| Shares outstanding | 4,599,762 | 3,920,824 | |||||||||
| Net asset value, offering price, and redemption price per share | $ | 17.85 | $ | 36.07 | |||||||
| Advisor Shares | |||||||||||
| Net assets | $ | 1,995,039 | $ | 8,708,923 | |||||||
| Shares outstanding | 118,290 | 263,168 | |||||||||
| Net asset value, offering price, and redemption price per share | $ | 16.87 | $ | 33.09 | |||||||
See Accompanying Notes to Financial Statements.
34
Credit Suisse Funds
Statements of Assets and Liabilities (continued)
April 30, 2008 (unaudited)
| Large Cap Growth Fund | Mid-Cap Core Fund | ||||||||||
| A Shares | |||||||||||
| Net assets | $ | 1,063,136 | $ | 372,472 | |||||||
| Shares outstanding | 60,468 | 10,515 | |||||||||
| Net asset value and redemption price per share | $ | 17.58 | $ | 35.42 | |||||||
| Maximum offering price per share (net asset value/(1-5.75%)) | $ | 18.65 | $ | 37.58 | |||||||
| B Shares | |||||||||||
| Net assets | $ | 381,712 | $ | 105,133 | |||||||
| Shares outstanding | 22,781 | 3,062 | |||||||||
| Net asset value and offering price per share | $ | 16.76 | $ | 34.33 | |||||||
| C Shares | |||||||||||
| Net assets | $ | 332,475 | $ | 1,181 | |||||||
| Shares outstanding | 19,843 | 34 | |||||||||
| Net asset value and offering price per share | $ | 16.76 | $ | 34.37 | |||||||
1 Including $16,818,931 of securities on loan.
2 Including $37,088,845 of securities on loan.
See Accompanying Notes to Financial Statements.
35
Credit Suisse Funds
Statements of Operations
For the Six Months Ended April 30, 2008 (unaudited)
| Large Cap Growth Fund | Mid-Cap Core Fund | ||||||||||
| Investment Income (Note 2) | |||||||||||
| Dividends | $ | 591,299 | $ | 848,397 | |||||||
| Interest | 7,616 | 4,800 | |||||||||
| Securities lending | 43,239 | 138,526 | |||||||||
| Total investment income | 642,154 | 991,723 | |||||||||
| Expenses | |||||||||||
| Investment advisory fees (Note 3) | 232,887 | 545,212 | |||||||||
| Administrative services fees (Note 3) | 55,427 | 92,686 | |||||||||
| Shareholder servicing/Distribution fees (Note 3) | |||||||||||
| Advisor Class | 6,098 | 22,089 | |||||||||
| Class A | 1,369 | 429 | |||||||||
| Class B | 1,597 | 539 | |||||||||
| Class C | 1,676 | 6 | |||||||||
| Transfer agent fees (Note 3) | 55,100 | 243,239 | |||||||||
| Registration fees | 46,365 | 50,742 | |||||||||
| Printing fees (Note 3) | 34,290 | 79,446 | |||||||||
| Audit and tax fees | 21,705 | 22,364 | |||||||||
| Legal fees | 19,895 | 29,029 | |||||||||
| Trustees'/Directors' fees | 8,874 | 8,874 | |||||||||
| Custodian fees | 5,275 | 13,483 | |||||||||
| Insurance expense | 1,160 | 1,993 | |||||||||
| Interest expense (Note 4) | 956 | 858 | |||||||||
| Commitment fees (Note 4) | — | 384 | |||||||||
| Miscellaneous expense | 7,477 | 19,938 | |||||||||
| Total expenses | 500,151 | 1,131,311 | |||||||||
| Net investment income (loss) | 142,003 | (139,588 | ) | ||||||||
| Net Realized and Unrealized Gain (Loss) from Investments | |||||||||||
| Net realized loss from investments | (3,393,152 | ) | (1,336,491 | ) | |||||||
| Net change in unrealized appreciation (depreciation) from investments | (9,763,007 | ) | (13,543,855 | ) | |||||||
| Net realized and unrealized loss from investments | (13,156,159 | ) | (14,880,346 | ) | |||||||
| Net decrease in net assets resulting from operations | $ | (13,014,156 | ) | $ | (15,019,934 | ) | |||||
See Accompanying Notes to Financial Statements.
36
Credit Suisse Funds
Statements of Changes in Net Assets
| Large Cap Growth Fund | Mid-Cap Core Fund | ||||||||||||||||||
| For the Six Months Ended April 30, 2008 (unaudited) | For the Year Ended October 31, 2007 | For the Six Months Ended April 30, 2008 (unaudited) | For the Year Ended October 31, 2007 | ||||||||||||||||
| From Operations | |||||||||||||||||||
| Net investment income (loss) | $ | 142,003 | $ | 17,853 | $ | (139,588 | ) | $ | (439,718 | ) | |||||||||
| Net realized gain (loss) from investments | (3,393,152 | ) | 31,559,847 | (1,336,491 | ) | 48,496,910 | |||||||||||||
| Net change in unrealized appreciation (depreciation) from investments | (9,763,007 | ) | (12,753,759 | ) | (13,543,855 | ) | (14,192,329 | ) | |||||||||||
| Net increase (decrease) in net assets resulting from operations | (13,014,156 | ) | 18,823,941 | (15,019,934 | ) | 33,864,863 | |||||||||||||
| From Dividends | |||||||||||||||||||
| Dividends from net investment income Common Class shares | (12,298 | ) | — | — | — | ||||||||||||||
| From Capital Share Transactions (Note 6) | |||||||||||||||||||
| Proceeds from sale of shares | 1,988,332 | 5,906,280 | 4,045,631 | 11,062,292 | |||||||||||||||
| Reinvestment of dividends | 11,938 | — | — | — | |||||||||||||||
| Net asset value of shares redeemed | (13,968,604 | ) | (100,866,811 | ) | (23,118,998 | ) | (105,922,658 | ) | |||||||||||
| Net decrease in net assets from capital share transactions | (11,968,334 | ) | (94,960,531 | ) | (19,073,367 | ) | (94,860,366 | ) | |||||||||||
| Net decrease in net assets | (24,994,788 | ) | (76,136,590 | ) | (34,093,301 | ) | (60,995,503 | ) | |||||||||||
| Net Assets | |||||||||||||||||||
| Beginning of period | 110,882,139 | 187,018,729 | 184,688,981 | 245,684,484 | |||||||||||||||
| End of period | $ | 85,887,351 | $ | 110,882,139 | $ | 150,595,680 | $ | 184,688,981 | |||||||||||
| Undistributed net investment income (loss) | $ | 141,982 | $ | 12,277 | $ | (139,588 | ) | $ | — | ||||||||||
See Accompanying Notes to Financial Statements.
37
Credit Suisse Large Cap Growth Fund
Financial Highlights
(For a Common Class Share of the Fund Outstanding Throughout Each Period)
| For the Six Months Ended April 30, 2008 | For the Year Ended October 31, | ||||||||||||||||||||||||||
| (unaudited) | 2007 | 2006 | 2005 | 2004 | 2003 | ||||||||||||||||||||||
| Per share data | |||||||||||||||||||||||||||
| Net asset value, beginning of period | $ | 20.32 | $ | 17.40 | $ | 16.49 | $ | 15.26 | $ | 14.75 | $ | 12.53 | |||||||||||||||
| INVESTMENT OPERATIONS | |||||||||||||||||||||||||||
| Net investment income (loss)1 | 0.03 | 0.01 | (0.04 | ) | 0.01 | (0.09 | ) | (0.05 | ) | ||||||||||||||||||
| Net gain (loss) on investments (both realized and unrealized) | (2.50 | ) | 2.91 | 0.97 | 1.22 | 0.60 | 2.27 | ||||||||||||||||||||
| Total from investment operations | (2.47 | ) | 2.92 | 0.93 | 1.23 | 0.51 | 2.22 | ||||||||||||||||||||
| LESS DIVIDENDS | |||||||||||||||||||||||||||
| Dividends from net investment income | (0.00 | )2 | — | (0.02 | ) | — | — | — | |||||||||||||||||||
| Total dividends | — | — | (0.02 | ) | — | — | — | ||||||||||||||||||||
| Net asset value, end of period | $ | 17.85 | $ | 20.32 | $ | 17.40 | $ | 16.49 | $ | 15.26 | $ | 14.75 | |||||||||||||||
| Total return3 | (12.14 | )% | 16.78 | % | 5.62 | % | 8.06 | % | 3.46 | % | 17.72 | % | |||||||||||||||
| RATIOS AND SUPPLEMENTAL DATA | |||||||||||||||||||||||||||
| Net assets, end of period (000s omitted) | $ | 82,115 | $ | 105,404 | $ | 181,077 | $ | 291,148 | $ | 433,681 | $ | 514,668 | |||||||||||||||
| Ratio of expenses to average net assets | 1.05 | %4 | 1.10 | % | 1.20 | % | 1.17 | % | 1.16 | % | 1.15 | % | |||||||||||||||
| Ratio of net investment income (loss) to average net assets | 0.33 | %4 | 0.04 | % | (0.24 | )% | 0.09 | % | (0.57 | )% | (0.39 | )% | |||||||||||||||
| Portfolio turnover rate | �� | 53 | % | 161 | % | 94 | % | 97 | % | 70 | % | 97 | % | ||||||||||||||
1 Per share information is calculated using the average shares outstanding method.
2 This represents less than $(0.01) per share.
3 Total returns are historical and assume changes in share price and reinvestment of all dividends and distributions. Had certain expenses not been reduced during the periods shown, total returns would have been lower. Total returns for periods less than one year are not annualized.
4 Annualized.
See Accompanying Notes to Financial Statements.
38
Credit Suisse Large Cap Growth Fund
Financial Highlights
(For an Advisor Class Share of the Fund Outstanding Throughout Each Period)
| For the Six Months Ended April 30, 2008 | For the Year Ended October 31, | ||||||||||||||||||||||||||
| (unaudited) | 2007 | 2006 | 2005 | 2004 | 2003 | ||||||||||||||||||||||
| Per share data | |||||||||||||||||||||||||||
| Net asset value, beginning of period | $ | 19.24 | $ | 16.56 | $ | 15.76 | $ | 14.65 | $ | 14.24 | $ | 12.16 | |||||||||||||||
| INVESTMENT OPERATIONS | |||||||||||||||||||||||||||
| Net investment loss1 | (0.01 | ) | (0.08 | ) | (0.12 | ) | (0.04 | ) | (0.16 | ) | (0.11 | ) | |||||||||||||||
| Net gain (loss) on investments (both realized and unrealized) | (2.36 | ) | 2.76 | 0.92 | 1.15 | 0.57 | 2.19 | ||||||||||||||||||||
| Total from investment operations | (2.37 | ) | 2.68 | 0.80 | 1.11 | 0.41 | 2.08 | ||||||||||||||||||||
| Net asset value, end of period | $ | 16.87 | $ | 19.24 | $ | 16.56 | $ | 15.76 | $ | 14.65 | $ | 14.24 | |||||||||||||||
| Total return2 | (12.32 | )% | 16.18 | % | 5.08 | % | 7.58 | % | 2.88 | % | 17.11 | % | |||||||||||||||
| RATIOS AND SUPPLEMENTAL DATA | |||||||||||||||||||||||||||
| Net assets, end of period (000s omitted) | $ | 1,995 | $ | 3,541 | $ | 3,729 | $ | 5,334 | $ | 14,723 | $ | 17,380 | |||||||||||||||
| Ratio of expenses to average net assets | 1.54 | %3 | 1.60 | % | 1.70 | % | 1.67 | % | 1.66 | % | 1.65 | % | |||||||||||||||
| Ratio of net investment loss to average net assets | (0.16 | )%3 | (0.46 | )% | (0.74 | )% | (0.41 | )% | (1.07 | )% | (0.90 | )% | |||||||||||||||
| Portfolio turnover rate | 53 | % | 161 | % | 94 | % | 97 | % | 70 | % | 97 | % | |||||||||||||||
1 Per share information is calculated using the average shares outstanding method.
2 Total returns are historical and assume changes in share price and reinvestment of all dividends and distributions. Had certain expenses not been reduced during the periods shown, total returns would have been lower. Total returns for periods less than one year are not annualized.
3 Annualized.
See Accompanying Notes to Financial Statements.
39
Credit Suisse Large Cap Growth Fund
Financial Highlights
(For a Class A Share of the Fund Outstanding Throughout Each Period)
| For the Six Months Ended April 30, 2008 | For the Year Ended October 31, | ||||||||||||||||||||||||||
| (unaudited) | 2007 | 2006 | 2005 | 2004 | 2003 | ||||||||||||||||||||||
| Per share data | |||||||||||||||||||||||||||
| Net asset value, beginning of period | $ | 20.03 | $ | 17.20 | $ | 16.33 | $ | 15.14 | $ | 14.68 | $ | 12.50 | |||||||||||||||
| INVESTMENT OPERATIONS | |||||||||||||||||||||||||||
| Net investment income (loss)1 | 0.01 | (0.04 | ) | (0.08 | ) | (0.00 | )2 | (0.12 | ) | (0.09 | ) | ||||||||||||||||
| Net gain (loss)on investments (both realized and unrealized) | (2.46 | ) | 2.87 | 0.95 | 1.19 | 0.58 | 2.27 | ||||||||||||||||||||
| Total from investment operations | (2.45 | ) | 2.83 | 0.87 | 1.19 | 0.46 | 2.18 | ||||||||||||||||||||
| Net asset value, end of period | $ | 17.58 | $ | 20.03 | $ | 17.20 | $ | 16.33 | $ | 15.14 | $ | 14.68 | |||||||||||||||
| Total return3 | (12.23 | )% | 16.45 | % | 5.33 | % | 7.86 | % | 3.13 | % | 17.44 | % | |||||||||||||||
| RATIOS AND SUPPLEMENTAL DATA | |||||||||||||||||||||||||||
| Net assets, end of period (000s omitted) | $ | 1,063 | $ | 1,285 | $ | 1,329 | $ | 1,585 | $ | 2,490 | $ | 1,152 | |||||||||||||||
| Ratio of expenses to average net assets | 1.30 | %4 | 1.35 | % | 1.45 | % | 1.42 | % | 1.41 | % | 1.40 | % | |||||||||||||||
| Ratio of net investment income (loss) to average net assets | 0.08 | %4 | (0.21 | )% | (0.49 | )% | (0.16 | )% | (0.82 | )% | (0.69 | )% | |||||||||||||||
| Portfolio turnover rate | 53 | % | 161 | % | 94 | % | 97 | % | 70 | % | 97 | % | |||||||||||||||
1 Per share information is calculated using the average shares outstanding method.
2 This represents less than $(0.01) per share.
3 Total returns are historical and assume changes in share price, reinvestment of all dividends and distributions and no sales charge. Had certain expenses not been reduced during the periods shown, total returns would have been lower. Total returns for periods less than one year are not annualized.
4 Annualized.
See Accompanying Notes to Financial Statements.
40
Credit Suisse Large Cap Growth Fund
Financial Highlights
(For a Class B Share of the Fund Outstanding Throughout Each Period)
| For the Six Months Ended April 30, 2008 | For the Year Ended October 31, | ||||||||||||||||||||||||||
| (unaudited) | 2007 | 2006 | 2005 | 2004 | 2003 | ||||||||||||||||||||||
| Per share data | |||||||||||||||||||||||||||
| Net asset value, beginning of period | $ | 19.16 | $ | 16.58 | $ | 15.85 | $ | 14.82 | $ | 14.47 | $ | 12.41 | |||||||||||||||
| INVESTMENT OPERATIONS | |||||||||||||||||||||||||||
| Net investment loss1 | (0.06 | ) | (0.17 | ) | (0.20 | ) | (0.16 | ) | (0.23 | ) | (0.19 | ) | |||||||||||||||
| Net gain (loss) on investments (both realized and unrealized) | (2.34 | ) | 2.75 | 0.93 | 1.19 | 0.58 | 2.25 | ||||||||||||||||||||
| Total from investment operations | (2.40 | ) | 2.58 | 0.73 | 1.03 | 0.35 | 2.06 | ||||||||||||||||||||
| Net asset value, end of period | $ | 16.76 | $ | 19.16 | $ | 16.58 | $ | 15.85 | $ | 14.82 | $ | 14.47 | |||||||||||||||
| Total return2 | (12.53 | )% | 15.56 | % | 4.61 | % | 6.95 | % | 2.42 | % | 16.60 | % | |||||||||||||||
| RATIOS AND SUPPLEMENTAL DATA | |||||||||||||||||||||||||||
| Net assets, end of period (000s omitted) | $ | 382 | $ | 285 | $ | 498 | $ | 625 | $ | 543 | $ | 545 | |||||||||||||||
| Ratio of expenses to average net assets | 2.07 | %3 | 2.10 | % | 2.20 | % | 2.17 | % | 2.16 | % | 2.15 | % | |||||||||||||||
| Ratio of net investment loss to average net assets | (0.69 | )%3 | (0.97 | )% | (1.24 | )% | (0.91 | )% | (1.57 | )% | (1.44 | )% | |||||||||||||||
| Portfolio turnover rate | 53 | % | 161 | % | 94 | % | 97 | % | 70 | % | 97 | % | |||||||||||||||
1 Per share information is calculated using the average shares outstanding method.
2 Total returns are historical and assume changes in share price, reinvestment of all dividends and distributions and no sales charge. Had certain expenses not been reduced during the periods shown, total returns would have been lower. Total returns for periods less than one year are not annualized.
3 Annualized.
See Accompanying Notes to Financial Statements.
41
Credit Suisse Large Cap Growth Fund
Financial Highlights
(For a Class C Share of the Fund Outstanding Throughout Each Period)
| For the Six Months Ended April 30, 2008 | For the Year Ended October 31, | ||||||||||||||||||||||||||
| (unaudited) | 2007 | 2006 | 2005 | 2004 | 2003 | ||||||||||||||||||||||
| Per share data | |||||||||||||||||||||||||||
| Net asset value, beginning of period | $ | 19.16 | $ | 16.58 | $ | 15.85 | $ | 14.81 | $ | 14.47 | $ | 12.41 | |||||||||||||||
| INVESTMENT OPERATIONS | |||||||||||||||||||||||||||
| Net investment loss1 | (0.06 | ) | (0.17 | ) | (0.20 | ) | (0.14 | ) | (0.23 | ) | (0.19 | ) | |||||||||||||||
| Net gain (loss) on investments (both realized and unrealized) | (2.34 | ) | 2.75 | 0.93 | 1.18 | 0.57 | 2.25 | ||||||||||||||||||||
| Total from investment operations | (2.40 | ) | 2.58 | 0.73 | 1.04 | 0.34 | 2.06 | ||||||||||||||||||||
| Net asset value, end of period | $ | 16.76 | $ | 19.16 | $ | 16.58 | $ | 15.85 | $ | 14.81 | $ | 14.47 | |||||||||||||||
| Total return2 | (12.53 | )% | 15.56 | % | 4.61 | % | 7.02 | % | 2.35 | % | 16.60 | % | |||||||||||||||
| RATIOS AND SUPPLEMENTAL DATA | |||||||||||||||||||||||||||
| Net assets, end of period (000s omitted) | $ | 332 | $ | 367 | $ | 385 | $ | 471 | $ | 849 | $ | 223 | |||||||||||||||
| Ratio of expenses to average net assets | 2.06 | %3 | 2.10 | % | 2.20 | % | 2.17 | % | 2.16 | % | 2.15 | % | |||||||||||||||
| Ratio of net investment loss to average net assets | (0.69 | )%3 | (0.96 | )% | (1.24 | )% | (0.91 | )% | (1.57 | )% | (1.44 | )% | |||||||||||||||
| Portfolio turnover rate | 53 | % | 161 | % | 94 | % | 97 | % | 70 | % | 97 | % | |||||||||||||||
1 Per share information is calculated using the average shares outstanding method.
2 Total returns are historical and assume changes in share price, reinvestment of all dividends and distributions and no sales charge. Had certain expenses not been reduced during the periods shown, total returns would have been lower. Total returns for periods less than one year are not annualized.
3 Annualized.
See Accompanying Notes to Financial Statements.
42
Credit Suisse Mid-Cap Core Fund
Financial Highlights
(For a Common Class Share of the Fund Outstanding Throughout Each Period)
| For the Six Months Ended April 30,2008 | For the Year Ended October 31, | ||||||||||||||||||||||||||
| (unaudited) | 2007 | 2006 | 2005 | 2004 | 2003 | ||||||||||||||||||||||
| Per share data | |||||||||||||||||||||||||||
| Net asset value, beginning of period | $ | 39.24 | $ | 33.21 | $ | 31.67 | $ | 28.04 | $ | 26.79 | $ | 18.98 | |||||||||||||||
| INVESTMENT OPERATIONS | |||||||||||||||||||||||||||
| Net investment loss1 | (0.03 | ) | (0.07 | ) | (0.19 | ) | (0.27 | ) | (0.30 | ) | (0.22 | ) | |||||||||||||||
| Net gain (loss) on investments (both realized and unrealized) | (3.14 | ) | 6.10 | 1.73 | 3.90 | 1.55 | 8.03 | ||||||||||||||||||||
| Total from investment operations | (3.17 | ) | 6.03 | 1.54 | 3.63 | 1.25 | 7.81 | ||||||||||||||||||||
| Net asset value, end of period | $ | 36.07 | $ | 39.24 | $ | 33.21 | $ | 31.67 | $ | 28.04 | $ | 26.79 | |||||||||||||||
| Total return2 | (8.08 | )% | 18.16 | % | 4.86 | % | 12.95 | % | 4.67 | % | 41.15 | % | |||||||||||||||
| RATIOS AND SUPPLEMENTAL DATA | |||||||||||||||||||||||||||
| Net assets, end of period (000s omitted) | $ | 141,408 | $ | 173,327 | $ | 228,798 | $ | 290,509 | $ | 364,298 | $ | 407,262 | |||||||||||||||
| Ratio of expenses to average net assets | 1.42 | %4 | 1.25 | % | 1.35 | % | 1.39 | % | 1.40 | % | 1.38 | % | |||||||||||||||
| Ratio of net investment loss to average net assets | (0.15 | )%4 | (0.19 | )% | (0.56 | )% | (0.87 | )% | (1.08 | )% | (1.04 | )% | |||||||||||||||
| Decrease reflected in above operating expense ratios due to waivers/reimbursements | — | 0.00 | %3 | 0.03 | % | — | — | — | |||||||||||||||||||
| Portfolio turnover rate | 81 | % | 278 | % | 69 | % | 79 | % | 106 | % | 68 | % | |||||||||||||||
1 Per share information is calculated using the average shares outstanding method.
2 Total returns are historical and assume changes in share price and reinvestment of all dividends and distributions. Had certain expenses not been reduced during the periods shown, total returns would have been lower. Total returns for periods less than one year are not annualized.
3 This amount represents less than 0.01% per share.
4 Annualized.
See Accompanying Notes to Financial Statements.
43
Credit Suisse Mid-Cap Core Fund
Financial Highlights
(For an Advisor Class Share of the Fund Outstanding Throughout Each Period)
| For the Six Months Ended April 30, 2008 | For the Year Ended October 31, | ||||||||||||||||||||||||||
| (unaudited) | 2007 | 2006 | 2005 | 2004 | 2003 | ||||||||||||||||||||||
| Per share data | |||||||||||||||||||||||||||
| Net asset value, beginning of period | $ | 36.09 | $ | 30.70 | $ | 29.42 | $ | 26.18 | $ | 25.14 | $ | 17.90 | |||||||||||||||
| INVESTMENT OPERATIONS | |||||||||||||||||||||||||||
| Net investment loss1 | (0.11 | ) | (0.23 | ) | (0.33 | ) | (0.40 | ) | (0.41 | ) | (0.31 | ) | |||||||||||||||
| Net gain (loss) on investments (both realized and unrealized) | (2.89 | ) | 5.62 | 1.61 | 3.64 | 1.45 | 7.55 | ||||||||||||||||||||
| Total from investment operations | (3.00 | ) | 5.39 | 1.28 | 3.24 | 1.04 | 7.24 | ||||||||||||||||||||
| Net asset value, end of period | $ | 33.09 | $ | 36.09 | $ | 30.70 | $ | 29.42 | $ | 26.18 | $ | 25.14 | |||||||||||||||
| Total return2 | (8.31 | )% | 17.56 | % | 4.35 | % | 12.38 | % | 4.14 | % | 40.45 | % | |||||||||||||||
| RATIOS AND SUPPLEMENTAL DATA | |||||||||||||||||||||||||||
| Net assets, end of period (000s omitted) | $ | 8,709 | $ | 10,892 | $ | 16,250 | $ | 24,851 | $ | 26,474 | $ | 40,322 | |||||||||||||||
| Ratio of expenses to average net assets | 1.92 | %3 | 1.75 | % | 1.85 | % | 1.89 | % | 1.90 | % | 1.88 | % | |||||||||||||||
| Ratio of net investment loss to average net assets | (0.65 | )%3 | (0.68 | )% | (1.06 | )% | (1.37 | )% | (1.58 | )% | (1.53 | )% | |||||||||||||||
| Decrease reflected in above operating expense ratio due to waivers/reimbursements | — | 0.01 | % | 0.03 | % | — | — | — | |||||||||||||||||||
| Portfolio turnover rate | 81 | % | 278 | % | 69 | % | 79 | % | 106 | % | 68 | % | |||||||||||||||
1 Per share information is calculated using the average shares outstanding method.
2 Total returns are historical and assume changes in share price and reinvestment of all dividends and distributions. Had certain expenses not been reduced during the periods shown, total returns would have been lower. Total returns for periods less than one year are not annualized.
3 Annualized.
See Accompanying Notes to Financial Statements.
44
Credit Suisse Mid-Cap Core Fund
Financial Highlights
(For a Class A Share of the Fund Outstanding Throughout Each Period)
| For the Six Months Ended April 30, 2008 | For the Year Ended October 31, | ||||||||||||||||||||||||||
| (unaudited) | 2007 | 2006 | 2005 | 2004 | 2003 | ||||||||||||||||||||||
| Per share data | |||||||||||||||||||||||||||
| Net asset value, beginning of period | $ | 38.59 | $ | 32.73 | $ | 31.29 | $ | 27.77 | $ | 26.60 | $ | 18.90 | |||||||||||||||
| INVESTMENT OPERATIONS | |||||||||||||||||||||||||||
| Net investment loss1 | (0.07 | ) | (0.15 | ) | (0.27 | ) | (0.34 | ) | (0.38 | ) | (0.33 | ) | |||||||||||||||
| Net gain (loss) on investments (both realized and unrealized) | (3.10 | ) | 6.01 | 1.71 | 3.86 | 1.55 | 8.03 | ||||||||||||||||||||
| Total from investment operations | (3.17 | ) | 5.86 | 1.44 | 3.52 | 1.17 | 7.70 | ||||||||||||||||||||
| Net asset value, end of period | $ | 35.42 | $ | 38.59 | $ | 32.73 | $ | 31.29 | $ | 27.77 | $ | 26.60 | |||||||||||||||
| Total return2 | (8.21 | )% | 17.90 | % | 4.60 | % | 12.68 | % | 4.40 | % | 40.74 | % | |||||||||||||||
| RATIOS AND SUPPLEMENTAL DATA | |||||||||||||||||||||||||||
| Net assets, end of period (000s omitted) | $ | 372 | $ | 345 | $ | 555 | $ | 688 | $ | 567 | $ | 75 | |||||||||||||||
| Ratio of expenses to average net assets | 1.68 | %3 | 1.50 | % | 1.60 | % | 1.64 | % | 1.65 | % | 1.63 | % | |||||||||||||||
| Ratio of net investment loss to average net assets | (0.40 | )%3 | (0.42 | )% | (0.81 | )% | (1.12 | )% | (1.33 | )% | (1.36 | )% | |||||||||||||||
| Decrease reflected in above operating expense ratios due to waivers/reimbursements | — | 0.01 | % | 0.03 | % | — | — | — | |||||||||||||||||||
| Portfolio turnover rate | 81 | % | 278 | % | 69 | % | 79 | % | 106 | % | 68 | % | |||||||||||||||
1 Per share information is calculated using the average shares outstanding method.
2 Total returns are historical and assume changes in share price, reinvestment of all dividends and distributions and no sales charge. Had certain expenses not been reduced during the periods shown, total returns would have been lower. Total returns for periods less than one year are not annualized.
3 Annualized.
See Accompanying Notes to Financial Statements.
45
Credit Suisse Mid-Cap Core Fund
Financial Highlights
(For a Class B Share of the Fund Outstanding Throughout Each Period)
| For the Six Months Ended April 30, 2008 | For the Year Ended October 31, | ||||||||||||||||||||||
| (unaudited) | 2007 | 2006 | 2005 | 20041 | |||||||||||||||||||
| Per share data | |||||||||||||||||||||||
| Net asset value, beginning of period | $ | 37.54 | $ | 32.10 | $ | 30.91 | $ | 27.64 | $ | 29.10 | |||||||||||||
| INVESTMENT OPERATIONS | |||||||||||||||||||||||
| Net investment loss2 | (0.19 | ) | (0.43 | ) | (0.50 | ) | (0.58 | ) | (0.38 | ) | |||||||||||||
| Net gain (loss) on investments (both realized and unrealized) | (3.02 | ) | 5.87 | 1.69 | 3.85 | (1.08 | ) | ||||||||||||||||
| Total from investment operations | (3.21 | ) | 5.44 | 1.19 | 3.27 | (1.46 | ) | ||||||||||||||||
| Net asset value, end of period | $ | 34.33 | $ | 37.54 | $ | 32.10 | $ | 30.91 | $ | 27.64 | |||||||||||||
| Total return3 | (8.55 | )% | 16.95 | % | 3.85 | % | 11.83 | % | (5.02 | )% | |||||||||||||
| RATIOS AND SUPPLEMENTAL DATA | |||||||||||||||||||||||
| Net assets, end of period (000s omitted) | $ | 105 | $ | 124 | $ | 80 | $ | 55 | $ | 7 | |||||||||||||
| Ratio of expenses to average net assets | 2.42 | %4 | 2.25 | % | 2.35 | % | 2.39 | % | 2.40 | %4 | |||||||||||||
| Ratio of net investment loss to average net assets | (1.15 | )%4 | (1.22 | )% | (1.56 | )% | (1.87 | )% | (2.08 | )%4 | |||||||||||||
| Decrease reflected in above operating expense ratios due to waivers/reimbursements | — | 0.00 | %5 | 0.03 | % | — | — | ||||||||||||||||
| Portfolio turnover rate | 81 | % | 278 | % | 69 | % | 79 | % | 106 | % | |||||||||||||
1 For the period February 27, 2004 (inception date) through October 31, 2004.
2 Per share information is calculated using the average shares outstanding method.
3 Total returns are historical and assume changes in share price, reinvestment of all dividends and distributions and no sales charge. Had certain expenses not been reduced during the periods shown, total returns would have been lower. Total returns for periods less than one year are not annualized.
4 Annualized.
5 This amount represents less than 0.01% per share.
See Accompanying Notes to Financial Statements.
46
Credit Suisse Mid-Cap Core Fund
Financial Highlights
(For a Class C Share of the Fund Outstanding Throughout Each Period)
| For the Six Months Ended April 30, 2008 | For the Year Ended October 31, | ||||||||||||||||||||||
| (unaudited) | 2007 | 2006 | 2005 | 20041 | |||||||||||||||||||
| Per share data | |||||||||||||||||||||||
| Net asset value, beginning of period | $ | 37.59 | $ | 32.10 | $ | 30.91 | $ | 27.67 | $ | 29.10 | |||||||||||||
| INVESTMENT OPERATIONS | |||||||||||||||||||||||
| Net investment loss2 | (0.21 | ) | (0.40 | ) | (0.51 | ) | (0.62 | ) | (0.38 | ) | |||||||||||||
| Net gain (loss) on investments (both realized and unrealized) | (3.01 | ) | 5.89 | 1.70 | 3.86 | (1.05 | ) | ||||||||||||||||
| Total from investment operations | (3.22 | ) | 5.49 | 1.19 | 3.24 | (1.43 | ) | ||||||||||||||||
| Net asset value, end of period | $ | 34.37 | $ | 37.59 | $ | 32.10 | $ | 30.91 | $ | 27.67 | |||||||||||||
| Total return3 | (8.57 | )% | 17.10 | % | 3.85 | % | 11.71 | % | (4.91 | )% | |||||||||||||
| RATIOS AND SUPPLEMENTAL DATA | |||||||||||||||||||||||
| Net assets, end of period (000s omitted) | $ | 1 | $ | 1 | $ | 1 | $ | 1 | $ | 1 | |||||||||||||
| Ratio of expenses to average net assets | 2.49 | %4 | 2.16 | % | 2.35 | % | 2.39 | % | 2.40 | %4 | |||||||||||||
| Ratio of net investment loss to average net assets | (1.22 | )%4 | (1.15 | )% | (1.56 | )% | (1.87 | )% | (2.08 | )%4 | |||||||||||||
| Decrease reflected in above operating expense ratios due to waivers/reimbursements | — | 0.00 | %5 | 0.03 | % | — | — | ||||||||||||||||
| Portfolio turnover rate | 81 | % | 278 | % | 69 | % | 79 | % | 106 | % | |||||||||||||
1 For the period February 27, 2004 (inception date) through October 31, 2004.
2 Per share information is calculated using the average shares outstanding method.
3 Total returns are historical and assume changes in share price, reinvestment of all dividends and distributions and no sales charge. Had certain expenses not been reduced during the periods shown, total returns would have been lower. Total returns for periods less than one year are not annualized.
4 Annualized.
5 This amount represents less than 0.01% per share.
See Accompanying Notes to Financial Statements.
47
Credit Suisse Funds
Notes to Financial Statements
April 30, 2008 (unaudited)
Note 1. Organization
The Credit Suisse Funds covered in this report are Credit Suisse Large Cap Growth Fund ("Large Cap Growth") and Credit Suisse Mid-Cap Core Fund ("Mid-Cap Core"), each of which is registered under the Investment Company Act of 1940, as amended (the "1940 Act"), as a diversified open-end management investment company. Large Cap Growth was organized under the laws of the Commonwealth of Massachusetts as a business trust on January 20, 1987. Mid-Cap Core was incorporated under the laws of the State of Maryland on November 12, 1987. Investment objectives for each Fund are as follows: Large Cap Growth seeks long-term capital appreciation and Mid-Cap Core seeks maximum capital appreciation.
Large Cap Growth and Mid-Cap Core each offer five classes of shares: Common Class, Advisor Class, Class A, Class B, and Class C shares. The Funds' Common Class shares are closed to new investors, with certain exceptions as set forth in the prospectus. Each class of shares in each Fund represents an equal pro rata interest in each Fund, except that they bear different expenses, which reflect the difference in the range of services provided to them. Class A shares of each Fund are sold subject to a maximum front-end sales charge of 5.75%. Class B shares are sold subject to a contingent deferred sales charge which declines from 4.00% to zero depending on the period of time the shares are held. Class C shares are sold subject to a contingent deferred sales charge of 1.00% if the shares are redeemed within the first year of purchase.
Note 2. Significant Accounting Policies
A) SECURITY VALUATION — The net asset value of each Fund is determined daily as of the close of regular trading on the New York Stock Exchange, Inc. (the "Exchange") on each day the Exchange is open for business. Equity investments are valued at market value, which is generally determined using the closing price on the exchange or market on which the security is primarily traded at the time of valuation (the "Valuation Time"). If no sales are reported, equity investments are generally valued at the most recent bid quotation as of the Valuation Time or at the lowest asked quotation in the case of a short sale of securities. Debt securities with a remaining maturity greater than 60 days are valued in accordance with the price supplied by a pricing service, which may use a matrix, formula or other objective method that takes into consideration market indices, yield curves and other specific adjustments. Debt obligations that will mature in 60 days or less are valued on the basis of amortized cost, which approximates market value, unless it is determined that using this method would not represent fair value. Investments in mutual funds
48
Credit Suisse Funds
Notes to Financial Statements (continued)
April 30, 2008 (unaudited)
Note 2. Significant Accounting Policies
are valued at the mutual fund's closing net asset value per share on the day of valuation. Securities and other assets for which market quotations are not readily available, or whose values have been materially affected by events occurring before each Fund's Valuation Time but after the close of the securities' primary markets, are valued at fair value as determined in good faith by, or under the direction of, the Board of Trustees/Directors under procedures established by the Board of Trustees/Directors. The Funds may utilize a service provided by an independent third party which has been approved by the Board of Trustees/Directors to fair value certain securities. When fair-value pricing is employed, the prices of securities used by the funds to calculate its net asset value may differ from quoted or published prices for the same securities.
B) FOREIGN CURRENCY TRANSACTIONS — The books and records of the Funds are maintained in U.S. dollars. Transactions denominated in foreign currencies are recorded at the current prevailing exchange rates. All assets and liabilities denominated in foreign currencies are translated into U.S. dollar amounts at the current exchange rate at the end of the period. Translation gains or losses resulting from changes in the exchange rate during the reporting period and realized gains and losses on the settlement of foreign currency transactions are reported in the results of operations for the current period. The Funds do not isolate that portion of realized gains and losses on investments in equity securities which is due to changes in the foreign exchange rate from that which is due to changes in market prices of equity securities. The Funds isolate that portion of realized gains and losses on investments in debt securities which is due to changes in the foreign exchange rate from that which is due to changes in market prices of debt securities.
C) SECURITY TRANSACTIONS AND INVESTMENT INCOME — Security transactions are accounted for on a trade date basis. Interest income is recorded on the accrual basis. Dividends are recorded on the ex-dividend date. Certain expenses are class-specific expenses and vary by class. Income, expenses (excluding class-specific expenses) and realized/unrealized gains/losses are allocated proportionately to each class of shares based upon the relative net asset value of the outstanding shares of that class. The cost of investments sold is determined by use of the specific identification method for both financial reporting and income tax purposes.
D) DIVIDENDS AND DISTRIBUTIONS TO SHAREHOLDERS — Dividends from net investment income and distributions of net realized capital gains, if any, are declared and paid at least annually. However, to the extent that a net realized capital gain can be reduced by a capital loss carryforward, such gain will not be distributed. Income and capital gain distributions are determined
49
Credit Suisse Funds
Notes to Financial Statements (continued)
April 30, 2008 (unaudited)
Note 2. Significant Accounting Policies
in accordance with federal income tax regulations which may differ from accounting principles generally accepted in the United States of America ("GAAP").
E) FEDERAL INCOME TAXES — No provision is made for federal taxes, as it is each Fund's intention to continue to qualify for and elect the tax treatment applicable to regulated investment companies under the Internal Revenue Code of 1986, as amended, and to make the requisite distributions to its shareholders, which will be sufficient to relieve it from federal income and excise taxes.
F) USE OF ESTIMATES — The preparation of financial statements in conformity with GAAP requires management to make estimates and assumptions that affect the reported amounts of assets and liabilities and disclosure of contingent assets and liabilities at the date of the financial statements and the reported amounts of income and expenses during the reporting period. Actual results could differ from these estimates.
G) SHORT-TERM INVESTMENTS — The Funds, together with other funds/portfolios advised by Credit Suisse Asset Management, LLC ("Credit Suisse"), an indirect, wholly-owned subsidiary of Credit Suisse Group, pool available cash into a short-term variable rate time deposit issued by State Street Bank and Trust Company ("SSB"), the Funds' custodian, or a money market fund advised by Credit Suisse. The short-term time deposit issued by SSB is a variable rate account classified as a short-term investment.
H) SECURITIES LENDING — Loans of securities are required at all times to be secured by collateral at least equal to 102% of the market value of domestic securities on loan (including any accrued interest thereon) and 105% of the market value of foreign securities on loan (including any accrued interest thereon). Cash collateral received by the Funds in connection with securities lending activity may be pooled together with cash collateral for other funds/portfolios advised by Credit Suisse and may be invested in a variety of investments, including certain Credit Suisse-advised funds, funds advised by SSB, the Funds' securities lending agent or money market instruments. However, in the event of default or bankruptcy by the other party to the agreement, realization and/or retention of the collateral may be subject to legal proceedings.
SSB has been engaged by the Funds to act as the Funds' securities lending agent. The Funds' securities lending arrangement provides that the Funds and SSB will share the net income earned from securities lending activities. During the six months ended April 30, 2008, total earnings from the Fund's
50
Credit Suisse Funds
Notes to Financial Statements (continued)
April 30, 2008 (unaudited)
Note 2. Significant Accounting Policies
investments in cash collateral received in connection with Large Cap Growth and Mid-Cap Core's securities lending arrangements were $332,207, and $817,234, respectively of which $278,149, and $643,610, respectively, were rebated to borrowers (brokers). The Funds retained $43,239 and $138,526 in income, respectively, from the cash collateral investment and SSB, as lending agent, was paid $10,819 and $35,098, respectively. The Funds may also be entitled to certain minimum amounts of income from their securities lending activities. Securities lending income is accrued as earned.
Note 3. Transactions with Affiliates and Related Parties
Credit Suisse serves as investment adviser to each Fund. For its investment advisory services, Credit Suisse is entitled to receive a fee from Large Cap Growth of 0.50%, and from Mid-Cap Core of 0.70%.
For the six months ended April 30, 2008, investment advisory fees earned for each Fund was as follows:
| Fund | Investment Advisory Fee | ||||||
| Large Cap Growth | $ | 232,887 | |||||
| Mid-Cap Core | 545,212 | ||||||
Credit Suisse Asset Management Securities, Inc. ("CSAMSI"), an affiliate of Credit Suisse, and SSB serve as co-administrators to the Funds. For its co-administrative services, CSAMSI currently receives a fee calculated at an annual rate of 0.09% of each Fund's average daily net assets. For the six months ended April 30, 2008, co-administrative services fees earned by CSAMSI were as follows:
| Fund | Co-Administration Fee | ||||||
| Large Cap Growth | $ | 41,920 | |||||
| Mid-Cap Core | 70,099 | ||||||
For its co-administrative services, SSB receives a fee, exclusive of out-of-pocket expenses, calculated in total for all the Credit Suisse funds/portfolios co-administered by SSB and allocated based upon relative average net assets of each fund/portfolio, subject to an annual minimum fee. For the six months ended April 30, 2008, co-administrative services fees earned by SSB (including out-of-pocket fees) were as follows:
| Fund | Co-Administration Fee | ||||||
| Large Cap Growth | $ | 13,507 | |||||
| Mid-Cap Core | 22,587 | ||||||
51
Credit Suisse Funds
Notes to Financial Statements (continued)
April 30, 2008 (unaudited)
Note 3. Transactions with Affiliates and Related Parties
In addition to serving as each Fund's co-administrator, CSAMSI currently serves as distributor of each Fund's shares. Pursuant to distribution plans adopted by each Fund pursuant to Rule 12b-1 under the 1940 Act, CSAMSI receives fees for its distribution services. For the Advisor Class shares of each Fund, the shareholder servicing fee is calculated at an annual rate of 0.50% of the average daily net assets. For the Class A shares of each Fund, the fee is calculated at an annual rate of 0.25% of average daily net assets. For the Class B and Class C shares of each Fund, the fee is calculated at an annual rate of 1.00% of average daily net assets.
Certain brokers, dealers and financial representatives provide transfer agent related services to the Funds, and receive compensation for these services from Credit Suisse. Credit Suisse is then reimbursed by the Funds. For the six months ended April 30, 2008, the Funds reimbursed Credit Suisse the following amounts, which are included in each Fund's transfer agent expense as follows:
| Fund | Amount | ||||||
| Large Cap Growth | $ | 52,424 | |||||
| Mid-Cap Core | 155,160 | ||||||
For the six months ended April 30, 2008, CSAMSI and its affiliates advised the Funds that they retained the following amounts from commissions earned on the sale of the Funds' Class A shares were as follows:
| Fund | Amount | ||||||
| Large Cap Growth | $ | 61 | |||||
| Mid-Cap Core | 18 | ||||||
Merrill Corporation ("Merrill"), an affiliate of Credit Suisse, has been engaged by the Funds to provide certain financial printing and fulfillment services. For the six months ended April 30, 2008, Merrill was paid for its services by the Funds as follows:
| Fund | Amount | ||||||
| Large Cap Growth | $ | 10,285 | |||||
| Mid-Cap Core | 9,944 | ||||||
52
Credit Suisse Funds
Notes to Financial Statements (continued)
April 30, 2008 (unaudited)
Note 4. Line of Credit
The Funds, together with other funds/portfolios advised by Credit Suisse (collectively, the "Participating Funds"), participate in a $50 million committed, unsecured line of credit facility ("Credit Facility") for temporary or emergency purposes with Deutsche Bank, A.G. as administrative agent and syndication agent and SSB as operations agent. Under the terms of the Credit Facility, the Participating Funds pay an aggregate commitment fee at a rate of 0.10% per annum on the average unused amount of the Credit Facility, which is allocated among the Participating Funds in such manner as is determined by the governing Boards of the Participating Funds. In addition, the Participating Funds pay interest on borrowings at the Federal Funds rate plus 0.50%. Effective June 2008, Deutsche Bank, A.G. will no longer serve as administrative agent and syndication agent to the credit facility. At April 30, 2008, the Funds had no loans outstanding under the Credit Facility. During the six months ended April 30, 2008, the Funds had borrowings under the Credit Facility as follows:
| Fund | Average Daily Loan Balance | Weighted Average Interest Rate% | Maximum Daily Loan Outstanding | ||||||||||||
| Large Cap Growth | $ | 1,378,286 | 3.569 | % | $ | 1,581,000 | |||||||||
| Mid-Cap Core | 1,224,400 | 5.049 | % | 1,873,000 | |||||||||||
Note 5. Purchases and Sales of Securities
For the six months ended April 30, 2008, purchases and sales of investment securities (excluding short-term investments) were as follows:
| Fund | Purchases | Sales | |||||||||
| Large Cap Growth | $ | 49,537,905 | $ | 66,026,778 | |||||||
| Mid-Cap Core | 128,627,555 | 144,847,961 | |||||||||
At April 30, 2008, the identified cost for federal income tax purposes, as well as the gross unrealized appreciation from investments for those securities having an excess of value over cost, gross unrealized depreciation from investments for those securities having an excess of cost over value and the net unrealized appreciation from investments were as follows:
| Fund | Identified Cost | Gross Unrealized Appreciation | Gross Unrealized Depreciation | Net Unrealized Appreciation | |||||||||||||||
| Large Cap Growth | $ | 98,173,241 | $ | 9,144,342 | $ | (4,233,425 | ) | $ | 4,910,917 | ||||||||||
| Mid-Cap Core | 186,586,932 | 19,646,674 | (17,319,213 | ) | 2,327,461 | ||||||||||||||
53
Credit Suisse Funds
Notes to Financial Statements (continued)
April 30, 2008 (unaudited)
Note 6. Capital Share Transactions
Large Cap Growth is authorized to issue an unlimited number of full and fractional shares of beneficial interest. Mid-Cap Core has four billion full and fractional shares of capital stock authorized and classified as follows: one billion as Common Class shares, one billion as Advisor Class shares, one billion as Class A shares, 500 million as Class B shares and 500 million as Class C shares. Each Fund has a par value of $.001 per share. Transactions in classes of each Fund were as follows:
| Large Cap Growth | |||||||||||||||||||
| Common Class | |||||||||||||||||||
| For the Six Months Ended April 30, 2008 (unaudited) | For the Year Ended October 31, 2007 | ||||||||||||||||||
| Shares | Value | Shares | Value | ||||||||||||||||
| Shares sold | 90,849 | $ | 1,649,423 | 282,143 | $ | 5,214,306 | |||||||||||||
| Shares issued in reinvestment of dividends | 605 | 11,938 | — | — | |||||||||||||||
| Shares redeemed | (679,886 | ) | (12,502,965 | ) | (5,498,174 | ) | (98,903,891 | ) | |||||||||||
| Net decrease | (588,432 | ) | $ | (10,841,604 | ) | (5,216,031 | ) | $ | (93,689,585 | ) | |||||||||
| Advisor Class | |||||||||||||||||||
| For the Six Months Ended April 30, 2008 (unaudited) | For the Year Ended October 31, 2007 | ||||||||||||||||||
| Shares | Value | Shares | Value | ||||||||||||||||
| Shares sold | 4,139 | $ | 72,738 | 22,088 | $ | 390,930 | |||||||||||||
| Shares redeemed | (69,883 | ) | (1,271,361 | ) | (63,194 | ) | (1,090,649 | ) | |||||||||||
| Net decrease | (65,744 | ) | $ | (1,198,623 | ) | (41,106 | ) | $ | (699,719 | ) | |||||||||
| Class A | |||||||||||||||||||
| For the Six Months Ended April 30, 2008 (unaudited) | For the Year Ended October 31, 2007 | ||||||||||||||||||
| Shares | Value | Shares | Value | ||||||||||||||||
| Shares sold | 2,480 | $ | 44,173 | 11,869 | $ | 224,926 | |||||||||||||
| Shares redeemed | (6,159 | ) | (119,737 | ) | (24,943 | ) | (457,716 | ) | |||||||||||
| Net decrease | (3,679 | ) | $ | (75,564 | ) | (13,074 | ) | $ | (232,790 | ) | |||||||||
| Class B | |||||||||||||||||||
| For the Six Months Ended April 30, 2008 (unaudited) | For the Year Ended October 31, 2007 | ||||||||||||||||||
| Shares | Value | Shares | Value | ||||||||||||||||
| Shares sold | 12,145 | $ | 209,998 | 4,217 | $ | 74,429 | |||||||||||||
| Shares redeemed | (4,253 | ) | (74,541 | ) | (19,372 | ) | (342,551 | ) | |||||||||||
| Net increase (decrease) | 7,892 | $ | 135,457 | (15,155 | ) | $ | (268,122 | ) | |||||||||||
54
Credit Suisse Funds
Notes to Financial Statements (continued)
April 30, 2008 (unaudited)
Note 6. Capital Share Transactions
| Class C | |||||||||||||||||||
| For the Six Months Ended April 30, 2008 (unaudited) | For the Year Ended October 31, 2007 | ||||||||||||||||||
| Shares | Value | Shares | Value | ||||||||||||||||
| Shares sold | 680 | $ | 12,000 | 100 | $ | 1,689 | |||||||||||||
| Shares redeemed | — | — | (4,177 | ) | (72,004 | ) | |||||||||||||
| Net increase (decrease) | 680 | $ | 12,000 | (4,077 | ) | $ | (70,315 | ) | |||||||||||
| Mid-Cap Core | |||||||||||||||||||
| Common Class | |||||||||||||||||||
| For the Six Months Ended April 30, 2008 (unaudited) | For the Year Ended October 31, 2007 | ||||||||||||||||||
| Shares | Value | Shares | Value | ||||||||||||||||
| Shares sold | 86,843 | $ | 3,044,506 | 232,585 | $ | 8,402,238 | |||||||||||||
| Shares redeemed | (583,300 | ) | (20,896,022 | ) | (2,704,762 | ) | (95,575,240 | ) | |||||||||||
| Net decrease | (496,457 | ) | $ | (17,851,516 | ) | (2,472,177 | ) | $ | (87,173,002 | ) | |||||||||
| Advisor Class | |||||||||||||||||||
| For the Six Months Ended April 30, 2008 (unaudited) | For the Year Ended October 31, 2007 | ||||||||||||||||||
| Shares | Value | Shares | Value | ||||||||||||||||
| Shares sold | 25,806 | $ | 864,800 | 75,932 | $ | 2,519,639 | |||||||||||||
| Shares redeemed | (64,403 | ) | (2,137,838 | ) | (303,466 | ) | (9,956,296 | ) | |||||||||||
| Net decrease | (38,597 | ) | $ | (1,273,038 | ) | (227,534 | ) | $ | (7,436,657 | ) | |||||||||
| Class A | |||||||||||||||||||
| For the Six Months Ended April 30, 2008 (unaudited) | For the Year Ended October 31, 2007 | ||||||||||||||||||
| Shares | Value | Shares | Value | ||||||||||||||||
| Shares sold | 3,182 | $ | 112,770 | 2,198 | $ | 77,462 | |||||||||||||
| Shares redeemed | (1,604 | ) | (53,826 | ) | (10,217 | ) | (356,499 | ) | |||||||||||
| Net increase (decrease) | 1,578 | $ | 58,944 | (8,019 | ) | $ | (279,037 | ) | |||||||||||
| Class B | |||||||||||||||||||
| For the Six Months Ended April 30, 2008 (unaudited) | For the Year Ended October 31, 2007 | ||||||||||||||||||
| Shares | Value | Shares | Value | ||||||||||||||||
| Shares sold | 737 | $ | 23,555 | 1,759 | $ | 59,953 | |||||||||||||
| Shares redeemed | (989 | ) | (31,312 | ) | (927 | ) | (31,714 | ) | |||||||||||
| Net increase (decrease) | (252 | ) | $ | (7,757 | ) | 832 | $ | 28,239 | |||||||||||
55
Credit Suisse Funds
Notes to Financial Statements (continued)
April 30, 2008 (unaudited)
Note 6. Capital Share Transactions
| Class C | |||||||||||||||||||
| For the Six Months Ended April 30, 2008 (unaudited) | For the Year Ended October 31, 2007 | ||||||||||||||||||
| Shares | Value | Shares | Value | ||||||||||||||||
| Shares Sold | — | $ | — | 84 | $ | 3,000 | |||||||||||||
| Shares redeemed | — | — | (84 | ) | (2,909 | ) | |||||||||||||
| Net increase | — | $ | — | — | $ | 91 | |||||||||||||
On April 30, 2008, the number of shareholders that held 5% or more of the outstanding shares of each class of the Funds were as follows:
| Fund | Number of Shareholders | Approximate Percentage of Outstanding Shares | |||||||||
| Large Cap Growth | |||||||||||
| Common | 4 | 39 | % | ||||||||
| Advisor | 4 | 81 | % | ||||||||
| Class A | 5 | 78 | % | ||||||||
| Class B | 4 | 48 | % | ||||||||
| Class C | 4 | 85 | % | ||||||||
| Mid-Cap Core | |||||||||||
| Common | 4 | 55 | % | ||||||||
| Advisor | 1 | 89 | % | ||||||||
| Class A | 4 | 74 | % | ||||||||
| Class B | 4 | 90 | % | ||||||||
| Class C | 1 | 94 | % | ||||||||
Some of the shareholders are omnibus accounts, which hold shares on behalf of individual shareholders.
Note 7. Contingencies
In the normal course of business, the Funds may provide general indemnifications pursuant to certain contracts and organizational documents. The Funds' maximum exposure under these arrangements is dependent on future claims that may be made against the Funds and, therefore, cannot be estimated; however, based on experience, the risk of loss from such claims is considered remote.
Note 8. Recent Accounting Pronouncements
During June 2006, the Financial Accounting Standards Board ("FASB") issued FASB Interpretation 48 ("FIN 48" or the "Interpretation"), Accounting for Uncertainty in Income Taxes — an interpretation of FASB statement 109.
56
Credit Suisse Funds
Notes to Financial Statements (continued)
April 30, 2008 (unaudited)
Note 8. Recent Accounting Pronouncements
FIN 48 supplements FASB Statement 109, Accounting for Income Taxes, by defining the confidence level that a tax position must meet in order to be recognized in the financial statements. FIN 48 prescribes a comprehensive model for how a fund should recognize, measure, present, and disclose in its financial statements uncertain tax positions that the fund has taken or expects to take on a tax return. FIN 48 requires that the tax effects of a position be recognized only if it is "more likely than not" to be sustained based solely on its technical merits. Management must be able to conclude that the tax law, regulations, case law, and other objective information regarding the technical merits sufficiently support the position's sustainability with a likelihood of more than 50 percent. During the p eriod ended April 30, 2008, Management has adopted FIN 48. There was no material impact to the financial statements or disclosures thereto as a result of the adoption of this pronouncement.
On September 20, 2006, the FASB released Statement of Financial Accounting Standards No. 157 "Fair Value Measurements" ("FAS 157"). FAS 157 establishes an authoritative definition of fair value, sets out a framework for measuring fair value, and requires additional disclosures about fair-value measurements. The application of FAS 157 is required for fiscal years, beginning after November 15, 2007 and interim periods within those fiscal years. As of April 30, 2008, management does not believe the adoption of FAS 157 will impact the amounts reported in the financial statements, however, additional disclosures will be required in subsequent reports.
In March 2008, FASB issued Statement of Financial Accounting Standards No. 161, Disclosures about Derivative Instruments and Hedging Activities ("FAS 161"), an amendment of FASB Statement No. 133. FAS 161 requires enhanced disclosures about (a) how and why an entity uses derivative instruments, (b) how derivative instruments and hedging activities are accounted for, and (c) how derivative instruments and related hedging activities affect a fund's financial position, financial performance, and cash flows. Management of the Funds does not believe the adoption of FAS 161 will materially impact the financial statement amounts, but will require additional disclosures. This will include qualitative and quantitative disclosures on derivative positions existing at period end and the effect of using de rivatives during the reporting period. FAS 161 is effective for financial statements issued for fiscal years and interim periods beginning after November 15, 2008.
57
Credit Suisse Large Cap Growth Fund
Board Approval of Advisory Agreement (unaudited)
In approving the renewal of the current Advisory Agreement, the Board of Trustees, including the Independent Trustees, at a meeting held on November 13 and 14, 2007, considered the following factors with respect to the Credit Suisse Large Cap Growth Fund (the "Fund"):
Investment Advisory Fee Rates
The Board reviewed and considered the contractual advisory fee rate of 0.50% ("Contractual Advisory Fee") in light of the extent and quality of the advisory services provided by Credit Suisse Asset Management, LLC ("Credit Suisse").
Additionally, the Board received and considered information comparing the Fund's Contractual Advisory Fee and the Fund's overall expenses with those of funds in both the relevant expense group ("Expense Group") and universe of funds ("Expense Universe") provided by Lipper Inc., an independent provider of investment company data.
Nature, Extent and Quality of the Services under the Advisory Agreement
The Board received and considered information regarding the nature, extent and quality of services provided to the Fund by Credit Suisse under the Advisory Agreement. The Board also noted information received at regular meetings throughout the year related to the services rendered by Credit Suisse. The Board reviewed background information about Credit Suisse, including its Form ADV. The Board considered the background and experience of Credit Suisse's senior management and the expertise of, and the amount of attention given to the Fund by, senior personnel of Credit Suisse. In addition, the Board reviewed the qualifications, backgrounds and responsibilities of the portfolio management team primarily responsible for the day-to-day portfolio management of the Fund and the extent of the resources devoted to research and analysis of actual and potential investments. The Board also received and considered information about the nature, extent and quality of services and fee rates offered to other Credit Suisse clients for comparable services.
Fund Performance
The Board received and considered the performance results of the Fund over time, along with comparisons both to the relevant performance group ("Performance Group") and universe of funds ("Performance Universe") for the Fund. The Board was provided with a description of the methodology used to arrive at the funds included in the Performance Group and the Performance Universe.
58
Credit Suisse Large Cap Growth Fund
Board Approval of Advisory Agreement (unaudited) (continued)
Credit Suisse Profitability
The Board received and considered a profitability analysis of Credit Suisse based on the fees payable under the Advisory Agreement for the Fund, including other relationships between the Fund on the one hand and Credit Suisse affiliates on the other. The Board received profitability information for the other funds in the Credit Suisse family of funds.
Economies of Scale
The Board considered whether economies of scale in the provision of services to the Fund were being passed along to the shareholders. Accordingly, the Board considered whether alternative fee structures (such as breakpoint fee structures) would be more appropriate or reasonable taking into consideration economies of scale or other efficiencies that might accrue from increases in the Fund's asset levels.
Other Benefits to Credit Suisse
The Board considered other benefits received by Credit Suisse and its affiliates as a result of their relationship with the Fund. Such benefits include, among others, research arrangements with brokers who execute transactions on behalf of the Fund, administrative and brokerage relationships with affiliates of Credit Suisse and benefits potentially derived from an increase in Credit Suisse's businesses as a result of its relationship with the Fund (such as the ability to market to shareholders other financial products offered by Credit Suisse and its affiliates).
The Board considered the standards applied in seeking best execution, whether and to what extent soft dollar credits are sought and how any such credits are utilized, any benefits that may be achieved by using an affiliated broker and the existence of quality controls applicable to brokerage allocation procedures. The Board also reviewed Credit Suisse's method for allocating portfolio investment opportunities among its advisory clients.
Conclusions
In selecting Credit Suisse, and approving the Advisory Agreement and the investment advisory fee under such agreement, the Board concluded that:
• The Contractual Advisory Fee was the lowest in the Fund's Expense Group and the Board considered the fee to be reasonable.
59
Credit Suisse Large Cap Growth Fund
Board Approval of Advisory Agreement (unaudited) (continued)
• The Fund's performance was below most of its peers in the Performance Group and Performance Universe for all of the periods reviewed. The Board noted that new investment strategies and portfolio management had gone into effect in December 2006 and that it would continue to monitor steps taken by Credit Suisse to improve performance.
• Aside from performance (as discussed above), the Board was satisfied with the nature and extent of the investment advisory services provided to the Fund by Credit Suisse and that, based on dialogue with management and counsel, the services provided by Credit Suisse under the Advisory Agreement are typical of, and consistent with, those provided to similar mutual funds by other investment advisers.
• In light of the costs of providing investment management and other services to the Fund and Credit Suisse's ongoing commitment to the Fund, the profits and other ancillary benefits that Credit Suisse and its affiliates received were considered reasonable.
• Credit Suisse's profitability based on fees payable under the Advisory Agreement was reasonable in light of the nature, extent and quality of the services provided to the Fund thereunder.
• In light of the amount of the Contractual Advisory Fee, the Fund's current fee structure (without breakpoints) was considered reasonable.
No single factor reviewed by the Board was identified by the Board as the principal factor in determining whether to approve the Advisory Agreement. The Independent Trustees were advised by separate independent legal counsel throughout the process.
60
Credit Suisse Mid-Cap Core Fund
Board Approval of Advisory Agreement (unaudited)
In approving the renewal of the current Advisory Agreement, the Board of Directors, including the Independent Directors, at a meeting held on November 13 and 14, 2007, considered the following factors with respect to the Credit Suisse Mid-Cap Core Fund (the "Fund"):
Investment Advisory Fee Rates
The Board reviewed and considered the contractual advisory fee rate of 0.70% ("Contractual Advisory Fee") in light of the extent and quality of the advisory services provided by Credit Suisse Asset Management, LLC ("Credit Suisse").
Additionally, the Board received and considered information comparing the Fund's Contractual Advisory Fee and the Fund's overall expenses with those of funds in both the relevant expense group ("Expense Group") and universe of funds ("Expense Universe") provided by Lipper Inc., an independent provider of investment company data.
Nature, Extent and Quality of the Services under the Advisory Agreement
The Board received and considered information regarding the nature, extent and quality of services provided to the Fund by Credit Suisse under the Advisory Agreement. The Board also noted information received at regular meetings throughout the year related to the services rendered by Credit Suisse. The Board reviewed background information about Credit Suisse, including its Form ADV. The Board considered the background and experience of Credit Suisse's senior management and the expertise of, and the amount of attention given to the Fund by, senior personnel of Credit Suisse. In addition, the Board reviewed the qualifications, backgrounds and responsibilities of the portfolio management team primarily responsible for the day-to-day portfolio management of the Fund and the extent of the resources devoted to research and analysis of actual and potential investments. The Board also received and considered information about the nature, extent and quality of services and fee rates offered to other Credit Suisse clients for comparable services.
Fund Performance
The Board received and considered the performance results of the Fund over time, along with comparisons both to the relevant performance group ("Performance Group") and universe of funds ("Performance Universe") for the Fund. The Board was provided with a description of the methodology used to arrive at the funds included in the Performance Group and the Performance Universe.
61
Credit Suisse Mid-Cap Core Fund
Board Approval of Advisory Agreement (unaudited) (continued)
Credit Suisse Profitability
The Board received and considered a profitability analysis of Credit Suisse based on the fees payable under the Advisory Agreement for the Fund, including other relationships between the Fund on the one hand and Credit Suisse affiliates on the other. The Board received profitability information for the other funds in the Credit Suisse family of funds.
Economies of Scale
The Board considered whether economies of scale in the provision of services to the Fund were being passed along to the shareholders. Accordingly, the Board considered whether alternative fee structures (such as breakpoint fee structures) would be more appropriate or reasonable taking into consideration economies of scale or other efficiencies that might accrue from increases in the Fund's asset levels.
Other Benefits to Credit Suisse
The Board considered other benefits received by Credit Suisse and its affiliates as a result of their relationship with the Fund. Such benefits include, among others, research arrangements with brokers who execute transactions on behalf of the Fund, administrative and brokerage relationships with affiliates of Credit Suisse and benefits potentially derived from an increase in Credit Suisse's businesses as a result of its relationship with the Fund (such as the ability to market to shareholders other financial products offered by Credit Suisse and its affiliates).
The Board considered the standards applied in seeking best execution, whether and to what extent soft dollar credits are sought and how any such credits are utilized, any benefits that may be achieved by using an affiliated broker and the existence of quality controls applicable to brokerage allocation procedures. The Board also reviewed Credit Suisse's method for allocating portfolio investment opportunities among its advisory clients.
Conclusions
In selecting Credit Suisse, and approving the Advisory Agreement and the investment advisory fee under such agreement, the Board concluded that:
• The Contractual Advisory Fee was among the lowest in the Fund's Expense Group and was considered reasonable.
62
Credit Suisse Mid-Cap Core Fund
Board Approval of Advisory Agreement (unaudited) (continued)
• The Fund's performance for all of the periods reviewed was below most funds in the Performance Group and Performance Universe. The Board noted that changes in the Fund's investment strategies and portfolio management had gone into effect in December 2006 and that it would continue to monitor steps undertaken by Credit Suisse to improve performance.
• Aside from performance (as described above), the Board was satisfied with the nature and extent of the investment advisory services provided to the Fund by Credit Suisse and that, based on dialogue with management and counsel, the services provided by Credit Suisse under the Advisory Agreement are typical of, and consistent with, those provided to similar mutual funds by other investment advisers.
• In light of the costs of providing investment management and other services to the Fund and Credit Suisse's ongoing commitment to the Fund, the profits and other ancillary benefits that Credit Suisse and its affiliates received were considered reasonable.
• Credit Suisse's profitability based on fees payable under the Advisory Agreement was reasonable in light of the nature, extent and quality of the services provided to the Fund thereunder.
• Based on the Contractual Advisory Fee, the Fund's current fee structure (without breakpoints) was considered reasonable.
No single factor reviewed by the Board was identified by the Board as the principal factor in determining whether to approve the Advisory Agreement. The Independent Directors were advised by separate independent legal counsel throughout the process.
63
Credit Suisse Funds
Privacy Policy Notice (unaudited)
Important Privacy Choices for Consumers
We are committed to maintaining the privacy of every current and prospective customer. We recognize that you entrust important personal information to us, and we wish to assure you that we take seriously our responsibilities in protecting and safeguarding this information.
In connection with making available investment products and services to current and potential customers, we may obtain nonpublic personal information about you. This information may include your name, address, e-mail address, social security number, account number, assets, income, financial situation, transaction history and other personal information.
We may collect nonpublic information about you from the following sources:
• Information we receive on applications, forms, questionnaires, web sites, agreements or in the course of establishing or maintaining a customer relationship; and
• Information about your transactions with us, our affiliates, or others.
We do not disclose any nonpublic personal information about our customers or former customers to anyone, except with your consent or as otherwise permitted by law.
In cases where we believe that additional products and services may be of interest to you, we may share the information described above with our affiliates.
We may also disclose this information to firms that perform services on our behalf. These agents and service providers are required to treat the information confidentially and use it only for the purpose for which it is provided.
We restrict access to nonpublic personal information about you to those employees, agents or other parties who need to know that information to provide products or services to you or in connection with your investments with or through us. We maintain physical, electronic and procedural safeguards that comply with federal standards to guard your nonpublic personal information.
Note: This Notice is provided to clients and prospective clients of Credit Suisse Asset Management, LLC ("Credit Suisse"), and Credit Suisse Asset Management Securities, Inc., and shareholders and prospective shareholders in Credit Suisse sponsored and advised investment companies, including Credit Suisse Funds, and other consumers and customers, as applicable. This Notice is not intended to be incorporated in any offering materials but is merely a statement of our current Privacy Policy, and may be amended from time to time upon notice to you. This Notice is dated as of May 13, 2008.
64
Credit Suisse Funds
Proxy Voting and Portfolio Holdings Information (unaudited)
Information regarding how each Fund voted proxies related to its portfolio securities during the 12 month period ended June 30 of each year, as well as the policies and procedures that each Fund uses to determine how to vote proxies relating to its portfolio securities are available:
• By calling 1-800-927-2874
• On the Funds' website, www.credit-suisse.com/us
• On the website of the Securities and Exchange Commission, www.sec.gov.
Each fund files a complete schedule of its portfolio holdings for the first and third quarters of its fiscal year with the SEC on Form N-Q. Each Fund's Forms N-Q are available on the SEC's website at www.sec.gov and may be reviewed and copied at the SEC's Public Reference Room in Washington, DC. Information on the operation of the SEC's Public Reference Room may be obtained by calling 1-202-551-8090.
65

P.O. BOX 55030, BOSTON, MA 02205-5030
800-927-2874 n www.credit-suisse.com/us
CREDIT SUISSE ASSET MANAGEMENT SECURITIES, INC., DISTRIBUTOR. USEQGTH-SAR-0408
Item 2. Code of Ethics.
This item is inapplicable to a semi-annual report on Form N-CSR.
Item 3. Audit Committee Financial Expert.
This item is inapplicable to a semi-annual report on Form N-CSR.
Item 4. Principal Accountant Fees and Services.
This item is inapplicable to a semi-annual report on Form N-CSR.
Item 5. Audit Committee of Listed Registrants.
This item is not applicable to the registrant.
Item 6. Schedule of Investments.
Included as part of the report to shareholders filed under Item 1 of this Form.
Item 7. Disclosure of Proxy Voting Policies and Procedures for Closed-End Management Investment Companies.
This item is not applicable to the registrant.
Item 8. Portfolio Managers of Closed-End Management Investment Companies.
This item is not applicable to the registrant.
Item 9. Purchases of Equity Securities by Closed-End Management Investment Company and Affiliated Purchasers.
This item is not applicable to the registrant.
Item 10. Submission of Matters to a Vote of Security Holders.
The Nominating Committee recommends Board member candidates. Shareholders of the registrant may also submit nominees that will be considered by the Committee. Recommendations should be mailed to the registrant’s Secretary, c/o Credit Suisse Asset Management, LLC, Eleven Madison Avenue, New York, NY 10010. Any submission should include at a minimum the following information: the name, age, business address, residence address and principal occupation or employment of such individual; the class, series and number of shares of the registrant that are beneficially owned by such individual; the date such shares were acquired and the investment intent of such acquisition; whether such shareholder believes such individual is, or is not, an “interested person” of the registrant (as defined in the Investment Company Act of 1940) and information regarding such individual that is sufficient, in the Committee’s discretion, to make such determination; and all other information relating to such individual that is required to be disclosed in solicitation of proxies for election of directors in an election contest (even if an election contest is not involved) or is otherwise required pursuant to the rules for proxy materials under the Securities Exchange Act of 1934.
Item 11. Controls and Procedures.
(a) As of a date within 90 days from the filing date of this report, the principal executive officer and principal financial officer concluded that the registrant’s disclosure controls and procedures (as defined in Rule 30a-3(c) under the Investment Company Act of 1940 (the “Act”)) were effective
based on their evaluation of the disclosure controls and procedures required by Rule 30a-3(b) under the Act and Rules 13a-15(b) or 15d-15(b) under the Securities Exchange Act of 1934.
(b) There were no changes in registrant’s internal control over financial reporting (as defined in Rule 30a-3(d) under the Act) that occurred during the registrant’s last fiscal half-year that have materially affected, or are reasonably likely to materially affect, the registrant’s internal control over financial reporting.
Item 12. Exhibits.
(a)(1) Not applicable.
(a)(2) The certifications of the registrant as required by Rule 30a-2(a) under the Act are exhibits to this report.
(a)(3) Not applicable.
(b) The certifications of the registrant as required by Rule 30a-2(b) under the Act are an exhibit to this report.
SIGNATURES
Pursuant to the requirements of the Securities Exchange Act of 1934 and the Investment Company Act of 1940, the registrant has duly caused this report to be signed on its behalf by the undersigned, thereunto duly authorized.
CREDIT SUISSE LARGE CAP GROWTH FUND | ||
| ||
/s/George R. Hornig |
| |
Name: | George R. Hornig | |
Title: Chief Executive Officer | ||
Date: July 8, 2008 | ||
Pursuant to the requirements of the Securities Exchange Act of 1934 and the Investment Company Act of 1940, this report has been signed below by the following persons on behalf of the registrant and in the capacities and on the dates indicated.
/s/ George R. Hornig |
| |
Name: | George R. Hornig | |
Title: Chief Executive Officer | ||
Date: July 8, 2008 | ||
/s/Michael A. Pignataro |
| |
Name: | Michael A. Pignataro | |
Title: Chief Financial Officer | ||
Date: July 8, 2008 | ||