UNITED STATES
SECURITIES AND EXCHANGE COMMISSION
Washington, D.C. 20549
CERTIFIED SHAREHOLDER REPORT OF REGISTERED
MANAGEMENT INVESTMENT COMPANIES
Investment Company Act file number | 811-05041 | |||||||
| ||||||||
CREDIT SUISSE LARGE CAP GROWTH FUND | ||||||||
(Exact name of registrant as specified in charter) | ||||||||
| ||||||||
Eleven Madison Avenue, New York, New York |
| 10010 | ||||||
(Address of principal executive offices) |
| (Zip code) | ||||||
| ||||||||
J. Kevin Gao, Esq. Credit Suisse Large Cap Growth Fund Eleven Madison Avenue New York, New York 10010 | ||||||||
(Name and address of agent for service) | ||||||||
| ||||||||
Registrant’s telephone number, including area code: | (212) 325-2000 |
| ||||||
| ||||||||
Date of fiscal year end: | October 31 |
| ||||||
| ||||||||
Date of reporting period: | November 1, 2008 to April 30, 2009 |
| ||||||
Item 1. Reports to Stockholders.

CREDIT SUISSE FUNDS
Semiannual Report
April 30, 2009
(unaudited)
n CREDIT SUISSE
LARGE CAP GROWTH FUND
n CREDIT SUISSE
MID-CAP CORE FUND
The Funds' investment objectives, risks, charges and expenses (which should be considered carefully before investing), and more complete information about the Funds, are provided in the Prospectus, which should be read carefully before investing. You may obtain additional copies by calling 877-870-2874 or by writing to Credit Suisse Funds, P.O. Box 55030, Boston, MA 02205-5030.
Credit Suisse Asset Management Securities, Inc., Distributor, is located at Eleven Madison Avenue, New York, NY 10010. Credit Suisse Funds are advised by Credit Suisse Asset Management, LLC.
Investors in the Credit Suisse Funds should be aware that they may be eligible to purchase Common Class and/or Advisor Class shares (where offered) directly or through certain intermediaries. Such shares are not subject to a sales charge but may be subject to an ongoing service and distribution fee of up to 0.50% of average daily net assets. Investors in the Credit Suisse Funds should also be aware that they may be eligible for a reduction or waiver of the sales charge with respect to Class A, B or C shares (where offered). For more information, please review the relevant prospectuses or consult your financial representative.
The views of the Funds' management are as of the date of the letter and the Fund holdings described in this document are as of April 30, 2009; these views and Fund holdings may have changed subsequent to these dates. Nothing in this document is a recommendation to purchase or sell securities.
Fund shares are not deposits or other obligations of Credit Suisse Asset Management, LLC ("Credit Suisse") or any affiliate, are not FDIC-insured and are not guaranteed by Credit Suisse or any affiliate. Fund investments are subject to investment risks, including loss of your investment.
Credit Suisse Large Cap Growth Fund
Semiannual Investment Adviser's Report
April 30, 2009 (unaudited)
June 2, 2009
Dear Shareholder:
Performance Summary
11/1/08 – 04/30/09
| Fund and Benchmark | Performance | ||||||
| Common Class1 | (2.14 | )% | |||||
| Advisor Class1 | (2.43 | )% | |||||
| Class A1,2 | (2.25 | )% | |||||
| Class B1,2 | (2.63 | )% | |||||
| Class C1,2 | (2.63 | )% | |||||
| Russell 1000® Growth Index3 | (1.52 | )% | |||||
Performance shown for the Fund's Class A, Class B and Class C Shares does not reflect sales charges, which are a maximum of 5.75%, 4.00% and 1.00%, respectively.2
Market Review: Signs of a beginning recovery
The six-month period ended April 30, 2009, was a hopeful one for equities. April saw an overall rally in the performance of markets across the globe. For instance, the S&P 500 Total Return Index increased by 9.57%, bringing the six month performance to –8.53%.
The Dow Jones Industrial Average increased by 7.56% in April, ending the six-month period at –10.78%. Looking at large caps, the Russell 1000 Growth Index gained 9.60% to return –1.52% for the period.
As of month end, the target Federal Funds rate was being maintained at 0.00% - 0.25%, while the discount rate stood at 0.50%. Additionally, the Consumer Confidence Index was at 39.2 as of April 28, up from 26.9 in March. Further, the labor market continued to weaken, with non-farm payrolls falling by 539,000 jobs in April across nearly all major private-sector industries, while the household unemployment rate rose to 8.9%. Nine out of ten sectors within the S&P 500 posted positive returns, with financials as the biggest winner, gaining 22.17%. In contrast, the health care sector was down 0.89%.
On May 5, 2009, Federal Reserve Chairman Ben S. Bernanke provided a guardedly optimistic assessment of the state of the economy and advised a joint congressional economic committee that the economy appears to be on track for a recovery. On the other hand, this recovery is expected to be slow and unemployment is expected to continue to rise in the near term.
1
Credit Suisse Large Cap Growth Fund
Semiannual Investment Adviser's Report (continued)
April 30, 2009 (unaudited)
Strategic Review and Outlook: We are maintaining a long-term approach
For the semiannual period ending April 30, 2009, the Fund's shares underperformed the Russell 1000 Growth Index. Sector weightings in consumer staples, consumer cyclicals and transportation contributed positively to performance. Conversely, the main detractors from performance included financials, industrials and basic materials — also all due to sector weightings.
Although we expect the market to remain difficult in the near term, we are comfortable with our proactive, long-term investment strategy going forward.
Jordan Low
Portfolio Manager
In addition to historical information, this report contains forward-looking statements, which may concern, among other things, domestic and foreign market, industry and economic trends and developments and government regulation and their potential impact on the Fund's investments. These statements are subject to risks and uncertainties and actual trends, developments and regulations in the future, and their impact on the Fund could be materially different from those projected, anticipated or implied. The Fund has no obligation to update or revise forward-looking statements.
The Fund adopted new investment strategies effective December 1, 2006 so that its holdings are selected using quantitative stock selection models rather than a more traditional fundamental analysis approach. Investors should be aware that performance information for periods prior to December 1, 2006 does not reflect the current investment strategies.
2
Credit Suisse Large Cap Growth Fund
Semiannual Investment Adviser's Report (continued)
April 30, 2009 (unaudited)
Average Annual Returns as of March 31, 20091
| 1 Year | 5 Years | 10 Years | Since Inception | Inception Date | |||||||||||||||||||
| Common Class | (35.05 | )% | (6.35 | )% | (4.69 | )% | 5.75 | % | 08/17/87 | ||||||||||||||
| Advisor Class | (35.35 | )% | (6.81 | )% | (5.16 | )% | 4.69 | % | 04/04/91 | ||||||||||||||
| Class A Without Sales Charge | (35.21 | )% | (6.58 | )% | — | (6.37 | )% | 11/30/01 | |||||||||||||||
| Class A With Maximum Sales Charge | (38.93 | )% | (7.68 | )% | — | (7.12 | )% | 11/30/01 | |||||||||||||||
| Class B Without CDSC | (35.70 | )% | (7.29 | )% | — | (7.07 | )% | 11/30/01 | |||||||||||||||
| Class B With CDSC | (38.26 | )% | (7.29 | )% | — | (7.07 | )% | 11/30/01 | |||||||||||||||
| Class C Without CDSC | (35.70 | )% | (7.29 | )% | — | (7.07 | )% | 11/30/01 | |||||||||||||||
| Class C With CDSC | (36.34 | )% | (7.29 | )% | — | (7.07 | )% | 11/30/01 | |||||||||||||||
Average Annual Returns as of April 30, 20091
| 1 Year | 5 Years | 10 Years | Since Inception | Inception Date | |||||||||||||||||||
| Common Class | (31.03 | )% | (4.26 | )% | (3.83 | )% | 6.21 | % | 08/17/87 | ||||||||||||||
| Advisor Class | (31.41 | )% | (4.74 | )% | (4.32 | )% | 5.24 | % | 04/04/91 | ||||||||||||||
| Class A Without Sales Charge | (31.16 | )% | (4.49 | )% | — | (5.03 | )% | 11/30/01 | |||||||||||||||
| Class A With Maximum Sales Charge | (35.11 | )% | (5.62 | )% | — | (5.79 | )% | 11/30/01 | |||||||||||||||
| Class B Without CDSC | (31.74 | )% | (5.21 | )% | — | (5.75 | )% | 11/30/01 | |||||||||||||||
| Class B With CDSC | (34.45 | )% | (5.21 | )% | — | (5.75 | )% | 11/30/01 | |||||||||||||||
| Class C Without CDSC | (31.74 | )% | (5.21 | )% | — | (5.75 | )% | 11/30/01 | |||||||||||||||
| Class C With CDSC | (32.41 | )% | (5.21 | )% | — | (5.75 | )% | 11/30/01 | |||||||||||||||
Returns represent past performance and include change in share price and reinvestment of dividends and capital gains. Past performance cannot guarantee future results. The current performance of the Fund may be lower or higher than the figures shown. Returns and share price will fluctuate, and redemption value may be more or less than original cost. The performance results do not reflect the deduction of taxes that a shareholder would pay on fund distributions or the redemption of fund shares. Performance information current to the most recent month-end is available at www.credit-suisse.com/us.
The annualized gross expense ratios are 2.06% for Common Class shares, 2.56% for Advisor Class shares, 2.31% for Class A shares, 3.06% for Class B shares and 3.06% for Class C shares. The annualized net expense ratios after fee waivers and/or expense reimbursements are 1.25% for Common Class shares, 1.75% for Advisor Class shares, 1.50% for Class A shares, 2.25% for Class B shares and 2.25% for Class C shares.
1 Fee waivers and/or expense reimbursements may reduce expenses for the Fund, without which performance would be lower. Waivers and/or reimbursements may be discontinued at any time.
2 Total return for the Fund's Class A shares for the reporting period, based on offering price (including maximum sales charge of 5.75%), was (7.90)%. Total return for the Fund's Class B shares for the reporting period, based on redemption value (including maximum contingent deferred sales charge of 4.00%), was (6.50)%. Total return for the Fund's Class C shares for the reporting period, based on redemption value (including maximum contingent deferred sales charge of 1.00%), was (3.60)%.
3 The Russell 1000® Growth Index measures the performance of those companies in the Russell 1000® Index with higher price-to-book ratios and higher forecasted growth values. It is an unmanaged index of common stocks that includes reinvestment of dividends and is compiled by Frank Russell Company. Investors cannot invest directly in an index.
3
Credit Suisse Large Cap Growth Fund
Semiannual Investment Adviser's Report (continued)
April 30, 2009 (unaudited)
Information About Your Fund's Expenses
As an investor of the Fund, you incur two types of costs: ongoing expenses and transaction costs. Ongoing expenses include management fees, distribution and service (12b-1) fees and other Fund expenses. Examples of transaction costs include sales charges (loads), redemption fees and account maintenance fees, which are not shown in this section and which would result in higher total expenses. The following table is intended to help you understand your ongoing expenses of investing in the Fund and to help you compare these expenses with the ongoing expenses of investing in other mutual funds. The table is based on an investment of $1,000 made at the beginning of the six month period ended April 30, 2009.
The table illustrates your Fund's expenses in two ways:
• Actual Fund Return. This helps you estimate the actual dollar amount of ongoing expenses paid on a $1,000 investment in the Fund using the Fund's actual return during the period. To estimate the expenses you paid over the period, simply divide your account value by $1,000 (for example, an $8,600 account value divided by $1,000 = 8.6), then multiply the result by the number in the "Expenses Paid per $1,000" line under the share class you hold.
• Hypothetical 5% Fund Return. This helps you to compare your Fund's ongoing expenses with those of other mutual funds using the Fund's actual expense ratio and a hypothetical rate of return of 5% per year before expenses. Examples using a 5% hypothetical fund return may be found in the shareholder reports of other mutual funds. The hypothetical account values and expenses may not be used to estimate the actual ending account balance or expenses you paid for the period.
Please note that the expenses shown in these tables are meant to highlight your ongoing expenses only and do not reflect any transaction costs, such as sales charges (loads) or redemption fees. If these transaction costs had been included, your costs would have been higher. The "Expenses Paid per $1,000" line of the tables is useful in comparing ongoing expenses only and will not help you determine the relative total expenses of owning different funds.
4
Credit Suisse Large Cap Growth Fund
Semiannual Investment Adviser's Report (continued)
April 30, 2009 (unaudited)
Expenses and Value for a $1,000 Investment
for the six month period ended April 30, 2009
| Actual Fund Return | Common Class | Advisor Class | Class A | Class B | Class C | ||||||||||||||||||
| Beginning Account Value 11/1/08 | $ | 1,000.00 | $ | 1,000.00 | $ | 1,000.00 | $ | 1,000.00 | $ | 1,000.00 | |||||||||||||
| Ending Account Value 4/30/09 | $ | 978.60 | $ | 975.70 | $ | 977.50 | $ | 973.70 | $ | 973.70 | |||||||||||||
| Expenses Paid per $1,000* | $ | 6.13 | $ | 8.57 | $ | 7.35 | $ | 11.01 | $ | 11.01 | |||||||||||||
| Hypothetical 5% Fund Return | |||||||||||||||||||||||
| Beginning Account Value 11/1/08 | $ | 1,000.00 | $ | 1,000.00 | $ | 1,000.00 | $ | 1,000.00 | $ | 1,000.00 | |||||||||||||
| Ending Account Value 4/30/09 | $ | 1,018.60 | $ | 1,016.12 | $ | 1,017.36 | $ | 1,013.64 | $ | 1,013.64 | |||||||||||||
| Expenses Paid per $1,000* | $ | 6.26 | $ | 8.75 | $ | 7.50 | $ | 11.23 | $ | 11.23 | |||||||||||||
| Common Class | Advisor Class | Class A | Class B | Class C | |||||||||||||||||||
| Annualized Expense Ratios* | 1.25 | % | 1.75 | % | 1.50 | % | 2.25 | % | 2.25 | % | |||||||||||||
* Expenses are equal to the Fund's annualized expense ratio for each share class, multiplied by the average account value over the period, multiplied by the number of days in the most recent fiscal half year period, then divided by 365.
The "Expenses Paid per $1,000" and the "Annualized Expense Ratios" in the tables are based on actual expenses paid by the Fund during the period, net of fee waivers and/or expense reimbursements. If those fee waivers and/or expense reimbursements had not been in effect, the Fund's actual expenses would have been higher.
For more information, please refer to the Fund's prospectus.
5
Credit Suisse Large Cap Growth Fund
Semiannual Investment Adviser's Report (continued)
April 30, 2009 (unaudited)
SECTOR BREAKDOWN*
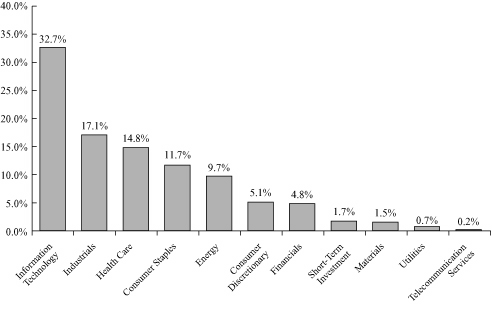
* Expressed as a percentage of total investments (excluding securities lending collateral if applicable) and may vary over time.
6
Credit Suisse Mid-Cap Core Fund
Semiannual Investment Adviser's Report
April 30, 2009 (unaudited)
June 2, 2009
Dear Shareholder:
Performance Summary
11/1/08 – 04/30/09
| Fund and Benchmark | Performance | ||||||
| Common Class1 | (1.90 | )% | |||||
| Advisor Class1 | (2.15 | )% | |||||
| Class A1,2 | (2.00 | )% | |||||
| Class B1,2 | (2.33 | )% | |||||
| Class C1,2 | (2.37 | )% | |||||
| Standard & Poor's MidCap 400 Index3 | (0.19 | )% | |||||
Performance shown for the Fund's Class A, Class B and Class C Shares does not reflect sales charges, which are a maximum of 5.75%, 4.00% and 1.00%, respectively.2
Market Review: Signs of a beginning recovery
The six-month period ended April 30, 2009, was a hopeful one for equities. April saw an overall rally in the performance of markets across the globe. For instance, the S&P 500 Total Return Index increased by 9.57%, bringing the six month performance to –8.53%.
The Dow Jones Industrial Average increased by 7.56% in April, ending the six-month period at –10.78%. Looking at mid caps, the S&P 400 Midcap Index gained 14.87%, bringing the six month return to –0.19%.
As of month end, the target Federal Funds rate was being maintained at 0.00% - 0.25%, while the discount rate stood at 0.50%. Additionally, the Consumer Confidence Index was at 39.2 as of April 28, up from 26.9 in March. Further, the labor market continued to weaken, with non-farm payrolls falling by 539,000 jobs in April across nearly all major private-sector industries, while the household unemployment rate rose to 8.9%. Nine out of ten sectors within the S&P 500 posted positive returns, with financials as the biggest winner, gaining 22.17%. In contrast, the health care sector was down 0.89%.
On May 5, 2009, Federal Reserve Chairman Ben S. Bernanke provided a guardedly optimistic assessment of the state of the economy and advised a joint congressional economic committee that the economy appears to be on track for a recovery. On the other hand, this recovery is expected to be slow and unemployment is expected to continue to rise in the near term.
7
Credit Suisse Mid-Cap Core Fund
Semiannual Investment Adviser's Report (continued)
April 30, 2009 (unaudited)
Strategic Review and Outlook: We are maintaining a long-term approach
For the semiannual period ending April 30, 2009, the Fund's shares slightly underperformed the Standard & Poor's MidCap 400 Index. The main positive contributors to performance included consumer discretionary (due to stock selection and sector weighting), industrials (due to stock selection, and consumer staples (due to stock selection and sector weighting). Conversely, materials and health care both detracted from performance (both due to stock selection and sector weighting). Stock selection in energy also detracted from performance.
Although we expect the market to remain difficult in the near term, we are comfortable with our proactive, long-term investment strategy going forward.
Jordan Low
Portfolio Manager
Investing in small to medium-sized companies may be more volatile and less liquid than investments in larger companies.
In addition to historical information, this report contains forward-looking statements, which may concern, among other things, domestic and foreign market, industry and economic trends and developments and government regulation and their potential impact on the Fund's investments. These statements are subject to risks and uncertainties and actual trends, developments and regulations in the future, and their impact on the Fund could be materially different from those projected, anticipated or implied. The Fund has no obligation to update or revise forward-looking statements.
The Fund adopted new investment strategies effective December 1, 2006 so that its holdings are selected using quantitative stock selection models rather than a more traditional fundamental analysis approach. Investors should be aware that performance information for periods prior to December 1, 2006 does not reflect the current investment strategies.
8
Credit Suisse Mid-Cap Core Fund
Semiannual Investment Adviser's Report (continued)
April 30, 2009 (unaudited)
Average Annual Returns as of March 31, 20091
| 1 Year | 5 Years | 10 Years | Since Inception | Inception Date | |||||||||||||||||||
| Common Class | (36.38 | )% | (6.42 | )% | (2.55 | )% | 6.77 | % | 01/21/88 | ||||||||||||||
| Advisor Class | (36.69 | )% | (6.88 | )% | (3.04 | )% | 4.62 | % | 04/04/91 | ||||||||||||||
| Class A Without Sales Charge | (36.53 | )% | (6.64 | )% | — | (2.85 | )% | 11/30/01 | |||||||||||||||
| Class A With Maximum Sales Charge | (40.19 | )% | (7.74 | )% | — | (3.63 | )% | 11/30/01 | |||||||||||||||
| Class B Without CDSC | (37.00 | )% | (7.35 | )% | — | (6.94 | )% | 02/27/04 | |||||||||||||||
| Class B With CDSC | (39.51 | )% | (7.35 | )% | — | (6.94 | )% | 02/27/04 | |||||||||||||||
| Class C Without CDSC | (37.11 | )% | (7.36 | )% | �� | — | (6.95 | )% | 02/27/04 | ||||||||||||||
| Class C With CDSC | (37.74 | )% | (7.36 | )% | — | (6.95 | )% | 02/27/04 | |||||||||||||||
Average Annual Returns as of April 30, 20091
| 1 Year | 5 Years | 10 Years | Since Inception | Inception Date | |||||||||||||||||||
| Common Class | (32.14 | )% | (2.80 | )% | (1.23 | )% | 7.42 | % | 01/21/88 | ||||||||||||||
| Advisor Class | (32.46 | )% | (3.28 | )% | (1.72 | )% | 5.38 | % | 04/04/91 | ||||||||||||||
| Class A Without Sales Charge | (32.27 | )% | (3.03 | )% | — | (1.04 | )% | 11/30/01 | |||||||||||||||
| Class A With Maximum Sales Charge | (36.16 | )% | (4.17 | )% | — | (1.82 | )% | 11/30/01 | |||||||||||||||
| Class B Without CDSC | (32.77 | )% | (3.76 | )% | — | (4.38 | )% | 02/27/04 | |||||||||||||||
| Class B With CDSC | (35.45 | )% | (3.76 | )% | — | (4.38 | )% | 02/27/04 | |||||||||||||||
| Class C Without CDSC | (32.76 | )% | (3.75 | )% | — | (4.36 | )% | 02/27/04 | |||||||||||||||
| Class C With CDSC | (33.43 | )% | (3.75 | )% | — | (4.36 | )% | 02/27/04 | |||||||||||||||
Returns represent past performance and include change in share price and reinvestment of dividends and capital gains. Past performance cannot guarantee future results. The current performance of the Fund may be lower or higher than the figures shown. Returns and share price will fluctuate, and redemption value may be more or less than original cost. The performance results do not reflect the deduction of taxes that a shareholder would pay on fund distributions or the redemption of fund shares. Performance information current to the most recent month-end is available at www.credit-suisse.com/us.
The annualized gross expense ratios are 1.94% for Common Class shares, 2.44% for Advisor Class shares, 2.20% for Class A shares, 2.94% for Class B shares and 2.89% for Class C shares. The annualized net expense ratios after fee waivers and/or expense reimbursements are 1.45% for Common Class shares, 1.95% for Advisor Class shares, 1.70% for Class A shares, 2.45% for Class B shares and 2.45% for Class C shares.
1 Fee waivers and/or expense reimbursements may reduce expenses for the Fund, without which performance would be lower. Waivers and/or reimbursements may be discontinued at any time.
2 Total return for the Fund's Class A shares for the reporting period, based on offering price (including maximum sales charge of 5.75%), was (7.63)%. Total return for the Fund's Class B shares for the reporting period, based on redemption value (including maximum contingent deferred sales charge of 4.00%), was (6.22)%. Total return for the Fund's Class C shares for the reporting period, based on redemption value (including maximum contingent deferred sales charge of 1.00%), was (3.34)%.
3 The Standard & Poor's MidCap 400 Index is an unmanaged market weighted index of 400 U.S. stocks selected on the basis of capitalization, liquidity, and industry group representation. It is a registered trademark of McGraw-Hill Co., Inc. Investors cannot invest directly in an index.
9
Credit Suisse Mid-Cap Core Fund
Semiannual Investment Adviser's Report (continued)
April 30, 2009 (unaudited)
Information About Your Fund's Expenses
As an investor of the Fund, you incur two types of costs: ongoing expenses and transaction costs. Ongoing expenses include management fees, distribution and service (12b-1) fees and other Fund expenses. Examples of transaction costs include sales charges (loads), redemption fees and account maintenance fees, which are not shown in this section and which would result in higher total expenses. The following table is intended to help you understand your ongoing expenses of investing in the Fund and to help you compare these expenses with the ongoing expenses of investing in other mutual funds. The table is based on an investment of $1,000 made at the beginning of the six month period ended April 30, 2009.
The table illustrates your Fund's expenses in two ways:
• Actual Fund Return. This helps you estimate the actual dollar amount of ongoing expenses paid on a $1,000 investment in the Fund using the Fund's actual return during the period. To estimate the expenses you paid over the period, simply divide your account value by $1,000 (for example, an $8,600 account value divided by $1,000 = 8.6), then multiply the result by the number in the "Expenses Paid per $1,000" line under the share class you hold.
• Hypothetical 5% Fund Return. This helps you to compare your Fund's ongoing expenses with those of other mutual funds using the Fund's actual expense ratio and a hypothetical rate of return of 5% per year before expenses. Examples using a 5% hypothetical fund return may be found in the shareholder reports of other mutual funds. The hypothetical account values and expenses may not be used to estimate the actual ending account balance or expenses you paid for the period.
Please note that the expenses shown in these tables are meant to highlight your ongoing expenses only and do not reflect any transaction costs, such as sales charges (loads) or redemption fees. If these transaction costs had been included, your costs would have been higher. The "Expenses Paid per $1,000" line of the tables is useful in comparing ongoing expenses only and will not help you determine the relative total expenses of owning different funds.
10
Credit Suisse Mid-Cap Core Fund
Semiannual Investment Adviser's Report (continued)
April 30, 2009 (unaudited)
Expenses and Value for a $1,000 Investment
for the six month period ended April 30, 2009
| Actual Fund Return | Common Class | Advisor Class | Class A | Class B | Class C | ||||||||||||||||||
| Beginning Account Value 11/1/08 | $ | 1,000.00 | $ | 1,000.00 | $ | 1,000.00 | $ | 1,000.00 | $ | 1,000.00 | |||||||||||||
| Ending Account Value 4/30/09 | $ | 981.00 | $ | 978.50 | $ | 980.00 | $ | 976.70 | $ | 976.30 | |||||||||||||
| Expenses Paid per $1,000* | $ | 7.12 | $ | 9.57 | $ | 8.35 | $ | 12.01 | $ | 12.01 | |||||||||||||
| Hypothetical 5% Fund Return | |||||||||||||||||||||||
| Beginning Account Value 11/1/08 | $ | 1,000.00 | $ | 1,000.00 | $ | 1,000.00 | $ | 1,000.00 | $ | 1,000.00 | |||||||||||||
| Ending Account Value 4/30/09 | $ | 1,017.60 | $ | 1,015.12 | $ | 1,016.36 | $ | 1,012.65 | $ | 1,012.65 | |||||||||||||
| Expenses Paid per $1,000* | $ | 7.25 | $ | 9.74 | $ | 8.50 | $ | 12.23 | $ | 12.23 | |||||||||||||
| Common Class | Advisor Class | Class A | Class B | Class C | |||||||||||||||||||
| Annualized Expense Ratios* | 1.45 | % | 1.95 | % | 1.70 | % | 2.45 | % | 2.45 | % | |||||||||||||
* Expenses are equal to the Fund's annualized expense ratio for each share class, multiplied by the average account value over the period, multiplied by the number of days in the most recent fiscal half year period, then divided by 365.
The "Expenses Paid per $1,000" and the "Annualized Expense Ratios" in the tables are based on actual expenses paid by the Fund during the period, net of fee waivers and/or expense reimbursements. If those fee waivers and/or expense reimbursements had not been in effect, the Fund's actual expenses would have been higher.
For more information, please refer to the Fund's prospectus.
11
Credit Suisse Mid-Cap Core Fund
Semiannual Investment Adviser's Report (continued)
April 30, 2009 (unaudited)
SECTOR BREAKDOWN*
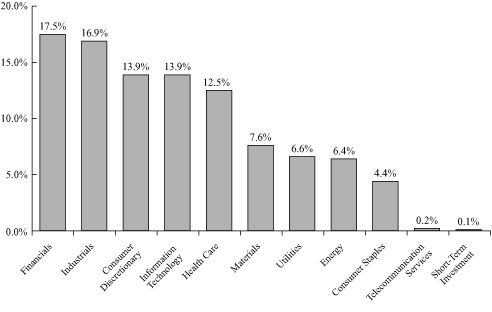
* Expressed as a percentage of total investments (excluding securities lending collateral if applicable) and may vary over time.
12
Credit Suisse Large Cap Growth Fund
Schedule of Investments
April 30, 2009 (unaudited)
| Number of Shares | Value | ||||||||||
| COMMON STOCKS (98.5%) | |||||||||||
| Aerospace & Defense (9.1%) | |||||||||||
| Alliant Techsystems, Inc.* | 100 | $ | 7,965 | ||||||||
| BE Aerospace, Inc.* | 900 | 9,711 | |||||||||
| General Dynamics Corp. | 34,000 | 1,756,780 | |||||||||
| Goodrich Corp. | 1,200 | 53,136 | |||||||||
| Honeywell International, Inc. | 9,100 | 284,011 | |||||||||
| ITT Corp. | 200 | 8,202 | |||||||||
| Lockheed Martin Corp. | 4,000 | 314,120 | |||||||||
| Northrop Grumman Corp. | 900 | 43,515 | |||||||||
| Raytheon Co. | 22,500 | 1,017,675 | |||||||||
| Rockwell Collins, Inc. | 200 | 7,670 | |||||||||
| The Boeing Co. | 7,600 | 304,380 | |||||||||
| United Technologies Corp. | 6,800 | 332,112 | |||||||||
| 4,139,277 | |||||||||||
| Air Freight & Logistics (1.3%) | |||||||||||
| C.H. Robinson Worldwide, Inc. | 1,700 | 90,372 | |||||||||
| Expeditors International of Washington, Inc. | 2,100 | 72,891 | |||||||||
| FedEx Corp. | 1,000 | 55,960 | |||||||||
| United Parcel Service, Inc. Class B | 6,900 | 361,146 | |||||||||
| UTI Worldwide, Inc.* | 900 | 12,114 | |||||||||
| 592,483 | |||||||||||
| Airlines (0.0%) | |||||||||||
| AMR Corp.* | 500 | 2,380 | |||||||||
| Copa Holdings SA Class A | 100 | 3,065 | |||||||||
| Delta Air Lines, Inc.* | 450 | 2,776 | |||||||||
| 8,221 | |||||||||||
| Auto Components (0.3%) | |||||||||||
| BorgWarner, Inc. | 1,000 | 28,950 | |||||||||
| Gentex Corp. | 1,400 | 18,718 | |||||||||
| Johnson Controls, Inc. | 200 | 3,802 | |||||||||
| The Goodyear Tire & Rubber Co.* | 500 | 5,495 | |||||||||
| WABCO Holdings, Inc. | 3,900 | 62,361 | |||||||||
| 119,326 | |||||||||||
| Automobiles (0.0%) | |||||||||||
| Harley-Davidson, Inc. | 100 | 2,216 | |||||||||
| Thor Industries, Inc. | 100 | 2,299 | |||||||||
| 4,515 | |||||||||||
| Beverages (3.3%) | |||||||||||
| Central European Distribution Corp.* | 300 | 6,720 | |||||||||
| Hansen Natural Corp.* | 700 | 28,532 | |||||||||
| PepsiCo, Inc. | 15,100 | 751,376 | |||||||||
| The Coca-Cola Co. | 16,600 | 714,630 | |||||||||
| 1,501,258 | |||||||||||
See Accompanying Notes to Financial Statements.
13
Credit Suisse Large Cap Growth Fund
Schedule of Investments (continued)
April 30, 2009 (unaudited)
| Number of Shares | Value | ||||||||||
| COMMON STOCKS | |||||||||||
| Biotechnology (2.4%) | |||||||||||
| Amgen, Inc.* | 100 | $ | 4,847 | ||||||||
| Biogen Idec, Inc.* | 3,500 | 169,190 | |||||||||
| BioMarin Pharmaceutical, Inc.* | 300 | 3,858 | |||||||||
| Celgene Corp.* | 5,600 | 239,232 | |||||||||
| Genzyme Corp.* | 3,200 | 170,656 | |||||||||
| Gilead Sciences, Inc.* | 11,200 | 512,960 | |||||||||
| 1,100,743 | |||||||||||
| Building Products (0.0%) | |||||||||||
| Lennox International, Inc. | 200 | 6,378 | |||||||||
| USG Corp.* | 100 | 1,486 | |||||||||
| 7,864 | |||||||||||
| Capital Markets (2.3%) | |||||||||||
| Bank of New York Mellon Corp. | 100 | 2,548 | |||||||||
| BlackRock, Inc. | 200 | 29,304 | |||||||||
| E*TRADE Financial Corp.* | 300 | 429 | |||||||||
| Eaton Vance Corp. | 1,000 | 27,370 | |||||||||
| Federated Investors, Inc. Class B | 800 | 18,304 | |||||||||
| Franklin Resources, Inc. | 3,300 | 199,584 | |||||||||
| GLG Partners, Inc. | 100 | 239 | |||||||||
| Invesco, Ltd. | 7,700 | 113,344 | |||||||||
| Investment Technology Group, Inc.* | 2,800 | 63,784 | |||||||||
| Janus Capital Group, Inc. | 1,500 | 15,045 | |||||||||
| MF Global, Ltd.* | 100 | 610 | |||||||||
| Morgan Stanley | 600 | 14,184 | |||||||||
| Northern Trust Corp. | 2,000 | 108,720 | |||||||||
| SEI Investments Co. | 1,300 | 18,239 | |||||||||
| State Street Corp. | 1,200 | 40,956 | |||||||||
| T. Rowe Price Group, Inc. | 2,600 | 100,152 | |||||||||
| TD Ameritrade Holding Corp.* | 2,400 | 38,184 | |||||||||
| The Charles Schwab Corp. | 9,500 | 175,560 | |||||||||
| The Goldman Sachs Group, Inc. | 500 | 64,250 | |||||||||
| Waddell & Reed Financial, Inc. Class A | 800 | 17,928 | |||||||||
| 1,048,734 | |||||||||||
| Chemicals (0.8%) | |||||||||||
| Air Products & Chemicals, Inc. | 100 | 6,590 | |||||||||
| Airgas, Inc. | 200 | 8,624 | |||||||||
| Albemarle Corp. | 300 | 8,046 | |||||||||
| Celanese Corp. Series A | 100 | 2,084 | |||||||||
| CF Industries Holdings, Inc. | 1,500 | 108,075 | |||||||||
| FMC Corp. | 200 | 9,746 | |||||||||
| International Flavors & Fragrances, Inc. | 300 | 9,360 | |||||||||
| Intrepid Potash, Inc.* | 4,100 | 101,229 | |||||||||
| Monsanto Co. | 100 | 8,489 | |||||||||
| Nalco Holding Co. | 400 | 6,528 | |||||||||
| PPG Industries, Inc. | 100 | 4,405 | |||||||||
| Praxair, Inc. | 100 | 7,461 | |||||||||
See Accompanying Notes to Financial Statements.
14
Credit Suisse Large Cap Growth Fund
Schedule of Investments (continued)
April 30, 2009 (unaudited)
| Number of Shares | Value | ||||||||||
| COMMON STOCKS | |||||||||||
| Chemicals | |||||||||||
| Terra Industries, Inc. | 1,100 | $ | 29,150 | ||||||||
| The Mosaic Co. | 1,800 | 72,810 | |||||||||
| 382,597 | |||||||||||
| Commercial Banks (0.0%) | |||||||||||
| Wells Fargo & Co. | 100 | 2,001 | |||||||||
| Commercial Services & Supplies (0.2%) | |||||||||||
| Copart, Inc.* | 200 | 6,278 | |||||||||
| Corrections Corp. of America* | 300 | 4,239 | |||||||||
| Republic Services, Inc. | 1,400 | 29,400 | |||||||||
| The Brink's Co. | 400 | 11,340 | |||||||||
| Waste Management, Inc. | 1,700 | 45,339 | |||||||||
| 96,596 | |||||||||||
| Communications Equipment (5.2%) | |||||||||||
| Ciena Corp.* | 300 | 3,585 | |||||||||
| Cisco Systems, Inc.* | 59,600 | 1,151,472 | |||||||||
| CommScope, Inc.* | 600 | 15,060 | |||||||||
| Corning, Inc. | 18,100 | 264,622 | |||||||||
| F5 Networks, Inc.* | 800 | 21,816 | |||||||||
| Harris Corp. | 200 | 6,116 | |||||||||
| JDS Uniphase Corp.* | 400 | 1,844 | |||||||||
| Juniper Networks, Inc.* | 5,300 | 114,745 | |||||||||
| QUALCOMM, Inc. | 18,700 | 791,384 | |||||||||
| 2,370,644 | |||||||||||
| Computers & Peripherals (8.4%) | |||||||||||
| Apple Computer, Inc.* | 8,900 | 1,119,887 | |||||||||
| Dell, Inc.* | 18,300 | 212,646 | |||||||||
| Diebold, Inc. | 500 | 13,215 | |||||||||
| EMC Corp.* | 17,100 | 214,263 | |||||||||
| Hewlett-Packard Co. | 8,300 | 298,634 | |||||||||
| International Business Machines Corp. | 13,900 | 1,434,619 | |||||||||
| NCR Corp.* | 1,400 | 14,210 | |||||||||
| NetApp, Inc.* | 3,400 | 62,220 | |||||||||
| Seagate Technology | 300 | 2,448 | |||||||||
| Teradata Corp.* | 900 | 15,048 | |||||||||
| Western Digital Corp.* | 17,500 | 411,600 | |||||||||
| 3,798,790 | |||||||||||
| Construction & Engineering (1.7%) | |||||||||||
| Aecom Technology Corp.* | 400 | 10,292 | |||||||||
| Fluor Corp. | 18,500 | 700,595 | |||||||||
| Jacobs Engineering Group, Inc.* | 400 | 15,216 | |||||||||
| KBR, Inc. | 1,400 | 21,868 | |||||||||
| Quanta Services, Inc.* | 300 | 6,819 | |||||||||
| The Shaw Group, Inc.* | 800 | 26,824 | |||||||||
| 781,614 | |||||||||||
See Accompanying Notes to Financial Statements.
15
Credit Suisse Large Cap Growth Fund
Schedule of Investments (continued)
April 30, 2009 (unaudited)
| Number of Shares | Value | ||||||||||
| COMMON STOCKS | |||||||||||
| Construction Materials (0.1%) | |||||||||||
| Eagle Materials, Inc. | 300 | $ | 8,340 | ||||||||
| Martin Marietta Materials, Inc. | 300 | 25,209 | |||||||||
| 33,549 | |||||||||||
| Consumer Finance (0.1%) | |||||||||||
| American Express Co. | 100 | 2,522 | |||||||||
| SLM Corp.* | 4,200 | 20,286 | |||||||||
| 22,808 | |||||||||||
| Containers & Packaging (0.1%) | |||||||||||
| AptarGroup, Inc. | 100 | 3,103 | |||||||||
| Ball Corp. | 100 | 3,772 | |||||||||
| Crown Holdings, Inc.* | 100 | 2,205 | |||||||||
| Greif, Inc. Class A | 200 | 9,054 | |||||||||
| Owens-Illinois, Inc.* | 100 | 2,439 | |||||||||
| Packaging Corp. of America | 200 | 3,174 | |||||||||
| 23,747 | |||||||||||
| Distributors (0.1%) | |||||||||||
| LKQ Corp.* | 1,300 | 22,074 | |||||||||
| Diversified Consumer Services (0.1%) | |||||||||||
| Brink's Home Security Holdings, Inc.* | 400 | 10,632 | |||||||||
| H&R Block, Inc. | 2,500 | 37,850 | |||||||||
| Hillenbrand, Inc. | 600 | 10,908 | |||||||||
| Weight Watchers International, Inc. | 100 | 2,488 | |||||||||
| 61,878 | |||||||||||
| Diversified Financial Services (0.1%) | |||||||||||
| MSCI, Inc. Class A* | 500 | 10,495 | |||||||||
| NYSE Euronext | 200 | 4,634 | |||||||||
| The NASDAQ OMX Group, Inc.* | 900 | 17,307 | |||||||||
| 32,436 | |||||||||||
| Diversified Telecommunication Services (0.2%) | |||||||||||
| AT&T, Inc. | 100 | 2,562 | |||||||||
| CenturyTel, Inc. | 1,900 | 51,585 | |||||||||
| Embarq Corp. | 300 | 10,968 | |||||||||
| FairPoint Communications, Inc. | 77 | 80 | |||||||||
| Verizon Communications, Inc. | 100 | 3,034 | |||||||||
| Windstream Corp. | 300 | 2,490 | |||||||||
| 70,719 | |||||||||||
| Electric Utilities (0.3%) | |||||||||||
| Duke Energy Corp. | 100 | 1,381 | |||||||||
| PPL Corp. | 4,500 | 134,595 | |||||||||
| 135,976 | |||||||||||
See Accompanying Notes to Financial Statements.
16
Credit Suisse Large Cap Growth Fund
Schedule of Investments (continued)
April 30, 2009 (unaudited)
| Number of Shares | Value | ||||||||||
| COMMON STOCKS | |||||||||||
| Electrical Equipment (0.5%) | |||||||||||
| AMETEK, Inc. | 200 | $ | 6,442 | ||||||||
| Cooper Industries, Ltd. Class A | 1,300 | 42,627 | |||||||||
| Emerson Electric Co. | 100 | 3,404 | |||||||||
| First Solar, Inc.* | 100 | 18,729 | |||||||||
| General Cable Corp.* | 300 | 8,142 | |||||||||
| Rockwell Automation, Inc. | 1,300 | 41,067 | |||||||||
| Roper Industries, Inc. | 200 | 9,118 | |||||||||
| SunPower Corp. Class A* | 4,000 | 109,520 | |||||||||
| 239,049 | |||||||||||
| Electronic Equipment, Instruments & Components (0.4%) | |||||||||||
| Amphenol Corp. Class A | 100 | 3,384 | |||||||||
| Avnet, Inc.* | 500 | 10,945 | |||||||||
| Dolby Laboratories, Inc. Class A* | 1,900 | 76,247 | |||||||||
| FLIR Systems, Inc.* | 1,400 | 31,052 | |||||||||
| Jabil Circuit, Inc. | 400 | 3,240 | |||||||||
| Molex, Inc. | 300 | 5,001 | |||||||||
| National Instruments Corp. | 500 | 11,020 | |||||||||
| Trimble Navigation, Ltd.* | 1,200 | 25,728 | |||||||||
| 166,617 | |||||||||||
| Energy Equipment & Services (1.9%) | |||||||||||
| Atwood Oceanics, Inc.* | 500 | 11,160 | |||||||||
| Baker Hughes, Inc. | 300 | 10,674 | |||||||||
| Cameron International Corp.* | 300 | 7,674 | |||||||||
| Dresser-Rand Group, Inc.* | 800 | 19,704 | |||||||||
| ENSCO International, Inc. | 15,717 | 444,477 | |||||||||
| FMC Technologies, Inc.* | 300 | 10,269 | |||||||||
| Global Industries, Ltd.* | 300 | 1,941 | |||||||||
| Halliburton Co. | 100 | 2,022 | |||||||||
| Key Energy Services, Inc.* | 100 | 439 | |||||||||
| Nabors Industries, Ltd.* | 400 | 6,084 | |||||||||
| National-Oilwell Varco, Inc.* | 4,200 | 127,176 | |||||||||
| Oceaneering International, Inc.* | 500 | 22,785 | |||||||||
| Oil States International, Inc.* | 300 | 5,670 | |||||||||
| Patterson-UTI Energy, Inc. | 900 | 11,439 | |||||||||
| Pride International, Inc.* | 1,200 | 27,240 | |||||||||
| Rowan Cos., Inc. | 1,000 | 15,610 | |||||||||
| Schlumberger, Ltd. | 100 | 4,899 | |||||||||
| Smith International, Inc. | 300 | 7,755 | |||||||||
| Superior Energy Services, Inc.* | 800 | 15,368 | |||||||||
| TETRA Technologies, Inc.* | 300 | 1,716 | |||||||||
| Tidewater, Inc. | 2,400 | 103,800 | |||||||||
| Unit Corp.* | 300 | 8,187 | |||||||||
| 866,089 | |||||||||||
| Food & Staples Retailing (2.8%) | |||||||||||
| Costco Wholesale Corp. | 100 | 4,860 | |||||||||
| CVS Caremark Corp. | 2,300 | 73,094 | |||||||||
See Accompanying Notes to Financial Statements.
17
Credit Suisse Large Cap Growth Fund
Schedule of Investments (continued)
April 30, 2009 (unaudited)
| Number of Shares | Value | ||||||||||
| COMMON STOCKS | |||||||||||
| Food & Staples Retailing | |||||||||||
| Safeway, Inc. | 300 | $ | 5,925 | ||||||||
| Sysco Corp. | 6,700 | 156,311 | |||||||||
| The Kroger Co. | 3,500 | 75,670 | |||||||||
| Wal-Mart Stores, Inc. | 18,300 | 922,320 | |||||||||
| Walgreen Co. | 100 | 3,143 | |||||||||
| Whole Foods Market, Inc. | 1,400 | 29,022 | |||||||||
| 1,270,345 | |||||||||||
| Food Products (2.8%) | |||||||||||
| Archer-Daniels-Midland Co. | 48,900 | 1,203,918 | |||||||||
| Campbell Soup Co. | 100 | 2,572 | |||||||||
| Dean Foods Co.* | 1,000 | 20,700 | |||||||||
| Del Monte Foods Co. | 5 | 38 | |||||||||
| General Mills, Inc. | 100 | 5,069 | |||||||||
| H.J. Heinz Co. | 100 | 3,442 | |||||||||
| Kellogg Co. | 100 | 4,211 | |||||||||
| Kraft Foods, Inc. Class A | 100 | 2,340 | |||||||||
| McCormick & Co., Inc. | 400 | 11,780 | |||||||||
| The Hershey Co. | 700 | 25,298 | |||||||||
| The J.M. Smucker Co. | 100 | 3,940 | |||||||||
| Tyson Foods, Inc. Class A | 100 | 1,054 | |||||||||
| 1,284,362 | |||||||||||
| Gas Utilities (0.0%) | |||||||||||
| Energen Corp. | 100 | 3,612 | |||||||||
| Health Care Equipment & Supplies (3.6%) | |||||||||||
| Baxter International, Inc. | 6,400 | 310,400 | |||||||||
| Becton, Dickinson & Co. | 2,900 | 175,392 | |||||||||
| Boston Scientific Corp.* | 300 | 2,523 | |||||||||
| DENTSPLY International, Inc. | 200 | 5,724 | |||||||||
| Edwards Lifesciences Corp.* | 500 | 31,690 | |||||||||
| Hologic, Inc.* | 1,200 | 17,832 | |||||||||
| Hospira, Inc.* | 200 | 6,574 | |||||||||
| IDEXX Laboratories, Inc.* | 600 | 23,580 | |||||||||
| Inverness Medical Innovations, Inc.* | 300 | 9,687 | |||||||||
| Kinetic Concepts, Inc.* | 500 | 12,380 | |||||||||
| Medtronic, Inc. | 26,000 | 832,000 | |||||||||
| ResMed, Inc.* | 700 | 26,915 | |||||||||
| St. Jude Medical, Inc.* | 3,500 | 117,320 | |||||||||
| Stryker Corp. | 300 | 11,613 | |||||||||
| Varian Medical Systems, Inc.* | 1,200 | 40,044 | |||||||||
| Zimmer Holdings, Inc.* | 200 | 8,798 | |||||||||
| 1,632,472 | |||||||||||
| Health Care Providers & Services (2.8%) | |||||||||||
| Aetna, Inc. | 33,600 | 739,536 | |||||||||
| CIGNA Corp. | 300 | 5,913 | |||||||||
| Community Health Systems, Inc.* | 100 | 2,284 | |||||||||
See Accompanying Notes to Financial Statements.
18
Credit Suisse Large Cap Growth Fund
Schedule of Investments (continued)
April 30, 2009 (unaudited)
| Number of Shares | Value | ||||||||||
| COMMON STOCKS | |||||||||||
| Health Care Providers & Services | |||||||||||
| Coventry Health Care, Inc.* | 100 | $ | 1,591 | ||||||||
| Express Scripts, Inc.* | 2,600 | 166,322 | |||||||||
| Health Management Associates, Inc. Class A* | 500 | 2,335 | |||||||||
| Henry Schein, Inc.* | 100 | 4,104 | |||||||||
| Humana, Inc.* | 900 | 25,902 | |||||||||
| Lincare Holdings, Inc.* | 577 | 13,923 | |||||||||
| McKesson Corp. | 2,000 | 74,000 | |||||||||
| MEDNAX, Inc.* | 100 | 3,590 | |||||||||
| Omnicare, Inc. | 200 | 5,142 | |||||||||
| Patterson Cos., Inc.* | 300 | 6,138 | |||||||||
| Quest Diagnostics, Inc. | 1,300 | 66,729 | |||||||||
| UnitedHealth Group, Inc. | 5,400 | 127,008 | |||||||||
| VCA Antech, Inc.* | 600 | 15,012 | |||||||||
| WellPoint, Inc.* | 500 | 21,380 | |||||||||
| 1,280,909 | |||||||||||
| Health Care Technology (0.3%) | |||||||||||
| Cerner Corp.* | 2,400 | 129,120 | |||||||||
| Hlth Corp.* | 54 | 594 | |||||||||
| IMS Health, Inc. | 100 | 1,256 | |||||||||
| 130,970 | |||||||||||
| Hotels, Restaurants & Leisure (0.3%) | |||||||||||
| Brinker International, Inc. | 1,000 | 17,720 | |||||||||
| Burger King Holdings, Inc. | 100 | 1,634 | |||||||||
| Carnival Corp. | 400 | 10,752 | |||||||||
| Chipotle Mexican Grill, Inc. Class A* | 100 | 8,109 | |||||||||
| Darden Restaurants, Inc. | 500 | 18,485 | |||||||||
| International Game Technology | 100 | 1,235 | |||||||||
| Las Vegas Sands Corp.* | 400 | 3,128 | |||||||||
| McDonald's Corp. | 100 | 5,329 | |||||||||
| Orient-Express Hotels, Ltd. Class A | 100 | 647 | |||||||||
| Panera Bread Co. Class A* | 200 | 11,202 | |||||||||
| Penn National Gaming, Inc.* | 200 | 6,804 | |||||||||
| Scientific Games Corp. Class A* | 600 | 10,494 | |||||||||
| Starbucks Corp.* | 300 | 4,338 | |||||||||
| Starwood Hotels & Resorts Worldwide, Inc. | 100 | 2,086 | |||||||||
| Tim Hortons, Inc. | 300 | 7,287 | |||||||||
| Wynn Resorts, Ltd.* | 200 | 7,846 | |||||||||
| Yum! Brands, Inc. | 100 | 3,335 | |||||||||
| 120,431 | |||||||||||
| Household Durables (0.1%) | |||||||||||
| Garmin, Ltd. | 1,600 | 40,304 | |||||||||
| Harman International Industries, Inc. | 200 | 3,638 | |||||||||
| 43,942 | |||||||||||
See Accompanying Notes to Financial Statements.
19
Credit Suisse Large Cap Growth Fund
Schedule of Investments (continued)
April 30, 2009 (unaudited)
| Number of Shares | Value | ||||||||||
| COMMON STOCKS | |||||||||||
| Household Products (0.1%) | |||||||||||
| Church & Dwight Co., Inc. | 100 | $ | 5,441 | ||||||||
| Clorox Co. | 300 | 16,815 | |||||||||
| Colgate-Palmolive Co. | 100 | 5,900 | |||||||||
| Energizer Holdings, Inc.* | 100 | 5,730 | |||||||||
| Kimberly-Clark Corp. | 100 | 4,914 | |||||||||
| The Procter & Gamble Co. | 100 | 4,944 | |||||||||
| 43,744 | |||||||||||
| Independent Power Producers & Energy Traders (0.1%) | |||||||||||
| Calpine Corp.* | 1,100 | 8,921 | |||||||||
| Constellation Energy Group, Inc. | 300 | 7,224 | |||||||||
| Mirant Corp.* | 900 | 11,457 | |||||||||
| 27,602 | |||||||||||
| Industrial Conglomerates (1.2%) | |||||||||||
| 3M Co. | 8,600 | 495,360 | |||||||||
| Carlisle Cos., Inc. | 200 | 4,550 | |||||||||
| McDermott International, Inc.* | 1,300 | 20,982 | |||||||||
| Textron, Inc. | 800 | 8,584 | |||||||||
| 529,476 | |||||||||||
| Insurance (2.3%) | |||||||||||
| Aflac, Inc. | 17,200 | 496,908 | |||||||||
| Aon Corp. | 8,600 | 362,920 | |||||||||
| Axis Capital Holdings, Ltd. | 2,400 | 59,136 | |||||||||
| Brown & Brown, Inc. | 300 | 5,838 | |||||||||
| Marsh & McLennan Cos., Inc. | 100 | 2,109 | |||||||||
| MetLife, Inc. | 100 | 2,975 | |||||||||
| Prudential Financial, Inc. | 500 | 14,440 | |||||||||
| The Progressive Corp.* | 100 | 1,528 | |||||||||
| Transatlantic Holdings, Inc. | 100 | 3,793 | |||||||||
| Unum Group | 6,200 | 101,308 | |||||||||
| W.R. Berkley Corp. | 200 | 4,782 | |||||||||
| 1,055,737 | |||||||||||
| Internet & Catalog Retail (0.8%) | |||||||||||
| Amazon.com, Inc.* | 3,800 | 305,976 | |||||||||
| Priceline.com, Inc.* | 400 | 38,836 | |||||||||
| 344,812 | |||||||||||
| Internet Software & Services (2.9%) | |||||||||||
| Akamai Technologies, Inc.* | 1,600 | 35,232 | |||||||||
| eBay, Inc.* | 500 | 8,235 | |||||||||
| Google, Inc. Class A* | 2,400 | 950,328 | |||||||||
| Sohu.com, Inc.* | 2,200 | 114,730 | |||||||||
| Yahoo!, Inc.* | 14,100 | 201,489 | |||||||||
| 1,310,014 | |||||||||||
See Accompanying Notes to Financial Statements.
20
Credit Suisse Large Cap Growth Fund
Schedule of Investments (continued)
April 30, 2009 (unaudited)
| Number of Shares | Value | ||||||||||
| COMMON STOCKS | |||||||||||
| IT Services (6.2%) | |||||||||||
| Accenture, Ltd. Class A | 61,800 | $ | 1,818,774 | ||||||||
| Alliance Data Systems Corp.* | 200 | 8,374 | |||||||||
| Automatic Data Processing, Inc. | 5,300 | 186,560 | |||||||||
| Broadridge Financial Solutions, Inc. | 16,612 | 321,442 | |||||||||
| Cognizant Technology Solutions Corp. Class A* | 1,700 | 42,143 | |||||||||
| DST Systems, Inc.* | 100 | 3,617 | |||||||||
| Genpact, Ltd.* | 200 | 1,792 | |||||||||
| Global Payments, Inc. | 400 | 12,824 | |||||||||
| Hewitt Associates, Inc. Class A* | 900 | 28,224 | |||||||||
| Lender Processing Services, Inc. | 200 | 5,732 | |||||||||
| Metavante Technologies, Inc.* | 200 | 4,718 | |||||||||
| NeuStar, Inc. Class A* | 700 | 13,307 | |||||||||
| Paychex, Inc. | 3,800 | 102,638 | |||||||||
| SAIC, Inc.* | 300 | 5,430 | |||||||||
| Total System Services, Inc. | 1,600 | 19,952 | |||||||||
| Visa, Inc. Class A | 1,500 | 97,440 | |||||||||
| Western Union Co. | 8,900 | 149,075 | |||||||||
| 2,822,042 | |||||||||||
| Leisure Equipment & Products (0.0%) | |||||||||||
| Hasbro, Inc. | 500 | 13,330 | |||||||||
| Life Sciences Tools & Services (0.3%) | |||||||||||
| Charles River Laboratories International, Inc.* | 300 | 8,295 | |||||||||
| Covance, Inc.* | 100 | 3,928 | |||||||||
| Life Technologies Corp.* | 1,060 | 39,538 | |||||||||
| PerkinElmer, Inc. | 500 | 7,285 | |||||||||
| Pharmaceutical Product Development, Inc. | 1,000 | 19,610 | |||||||||
| Thermo Fisher Scientific, Inc.* | 1,400 | 49,112 | |||||||||
| Waters Corp.* | 100 | 4,417 | |||||||||
| 132,185 | |||||||||||
| Machinery (1.8%) | |||||||||||
| AGCO Corp.* | 600 | 14,580 | |||||||||
| Bucyrus International, Inc. | 700 | 15,197 | |||||||||
| Caterpillar, Inc. | 100 | 3,558 | |||||||||
| Cummins, Inc. | 2,026 | 68,884 | |||||||||
| Danaher Corp. | 2,200 | 128,568 | |||||||||
| Deere & Co. | 100 | 4,126 | |||||||||
| Donaldson Co., Inc. | 200 | 6,598 | |||||||||
| Dover Corp. | 1,600 | 49,248 | |||||||||
| Eaton Corp. | 100 | 4,380 | |||||||||
| Flowserve Corp. | 3,600 | 244,440 | |||||||||
| Graco, Inc. | 600 | 14,154 | |||||||||
| Harsco Corp. | 755 | 20,800 | |||||||||
| IDEX Corp. | 100 | 2,525 | |||||||||
| Illinois Tool Works, Inc. | 100 | 3,280 | |||||||||
| Ingersoll-Rand Co., Ltd. Class A | 407 | 8,861 | |||||||||
| John Bean Technologies Corp. | 100 | 1,102 | |||||||||
See Accompanying Notes to Financial Statements.
21
Credit Suisse Large Cap Growth Fund
Schedule of Investments (continued)
April 30, 2009 (unaudited)
| Number of Shares | Value | ||||||||||
| COMMON STOCKS | |||||||||||
| Machinery | |||||||||||
| Joy Global, Inc. | 1,000 | $ | 25,500 | ||||||||
| Kennametal, Inc. | 100 | 2,045 | |||||||||
| Lincoln Electric Holdings, Inc. | 200 | 8,906 | |||||||||
| Oshkosh Corp. | 500 | 4,800 | |||||||||
| Pall Corp. | 600 | 15,846 | |||||||||
| Parker Hannifin Corp. | 700 | 31,745 | |||||||||
| The Manitowoc Co., Inc. | 3,000 | 17,850 | |||||||||
| The Timken Co. | 6,300 | 101,304 | |||||||||
| The Toro Co. | 200 | 6,076 | |||||||||
| 804,373 | |||||||||||
| Marine (0.0%) | |||||||||||
| Kirby Corp.* | 500 | 15,430 | |||||||||
| Media (1.2%) | |||||||||||
| Clear Channel Outdoor Holdings, Inc. Class A* | 100 | 384 | |||||||||
| Comcast Corp. Class A | 9,900 | 153,054 | |||||||||
| CTC Media, Inc.* | 500 | 3,920 | |||||||||
| DIRECTV Group, Inc.* | 6,700 | 165,691 | |||||||||
| DISH Network Corp. Class A* | 700 | 9,275 | |||||||||
| DreamWorks Animation SKG, Inc. Class A* | 800 | 19,208 | |||||||||
| Lamar Advertising Co. Class A* | 300 | 5,070 | |||||||||
| Liberty Global, Inc. Class A* | 400 | 6,596 | |||||||||
| Liberty Media Corp. - Entertainment Series A* | 5,200 | 126,620 | |||||||||
| Morningstar, Inc.* | 100 | 3,967 | |||||||||
| Omnicom Group, Inc. | 300 | 9,441 | |||||||||
| The Interpublic Group of Cos., Inc.* | 1,200 | 7,512 | |||||||||
| The McGraw-Hill Cos., Inc. | 100 | 3,015 | |||||||||
| The Walt Disney Co. | 2,300 | 50,370 | |||||||||
| Warner Music Group Corp.* | 100 | 538 | |||||||||
| 564,661 | |||||||||||
| Metals & Mining (0.5%) | |||||||||||
| AK Steel Holding Corp. | 100 | 1,301 | |||||||||
| Allegheny Technologies, Inc. | 1,000 | 32,730 | |||||||||
| Cliffs Natural Resources, Inc. | 3,600 | 83,016 | |||||||||
| Newmont Mining Corp. | 1,500 | 60,360 | |||||||||
| Nucor Corp. | 200 | 8,138 | |||||||||
| Southern Copper Corp. | 100 | 1,857 | |||||||||
| Steel Dynamics, Inc. | 400 | 4,980 | |||||||||
| Titanium Metals Corp. | 100 | 679 | |||||||||
| United States Steel Corp. | 1,100 | 29,205 | |||||||||
| 222,266 | |||||||||||
| Multi-Utilities (0.4%) | |||||||||||
| CenterPoint Energy, Inc. | 600 | 6,384 | |||||||||
| Public Service Enterprise Group, Inc. | 5,200 | 155,168 | |||||||||
| 161,552 | |||||||||||
See Accompanying Notes to Financial Statements.
22
Credit Suisse Large Cap Growth Fund
Schedule of Investments (continued)
April 30, 2009 (unaudited)
| Number of Shares | Value | ||||||||||
| COMMON STOCKS | |||||||||||
| Multiline Retail (0.2%) | |||||||||||
| Big Lots, Inc.* | 800 | $ | 22,112 | ||||||||
| Dollar Tree, Inc.* | 900 | 38,106 | |||||||||
| Family Dollar Stores, Inc. | 100 | 3,319 | |||||||||
| Nordstrom, Inc. | 1,100 | 24,893 | |||||||||
| Target Corp. | 100 | 4,126 | |||||||||
| 92,556 | |||||||||||
| Office Electronics (0.0%) | |||||||||||
| Zebra Technologies Corp. Class A* | 500 | 10,625 | |||||||||
| Oil, Gas & Consumable Fuels (7.8%) | |||||||||||
| Alpha Natural Resources, Inc.* | 3,900 | 79,872 | |||||||||
| Arch Coal, Inc. | 1,400 | 19,558 | |||||||||
| Cabot Oil & Gas Corp. | 200 | 6,038 | |||||||||
| Chevron Corp. | 27,200 | 1,797,920 | |||||||||
| CNX Gas Corp.* | 200 | 5,150 | |||||||||
| CONSOL Energy, Inc. | 100 | 3,128 | |||||||||
| Denbury Resources, Inc.* | 200 | 3,256 | |||||||||
| El Paso Corp. | 100 | 690 | |||||||||
| Enbridge, Inc. | 100 | 3,085 | |||||||||
| EnCana Corp. | 100 | 4,573 | |||||||||
| Encore Acquisition Co.* | 100 | 2,919 | |||||||||
| Exxon Mobil Corp. | 11,200 | 746,704 | |||||||||
| Foundation Coal Holdings, Inc. | 400 | 6,496 | |||||||||
| Frontier Oil Corp. | 1,000 | 12,710 | |||||||||
| Frontline, Ltd. | 100 | 2,013 | |||||||||
| Holly Corp. | 100 | 2,096 | |||||||||
| Mariner Energy, Inc.* | 600 | 6,828 | |||||||||
| Massey Energy Co. | 800 | 12,728 | |||||||||
| Murphy Oil Corp. | 3,200 | 152,672 | |||||||||
| Nexen, Inc. | 100 | 1,910 | |||||||||
| Noble Energy | 100 | 5,675 | |||||||||
| Occidental Petroleum Corp. | 8,200 | 461,578 | |||||||||
| Patriot Coal Corp.* | 300 | 1,890 | |||||||||
| Peabody Energy Corp. | 100 | 2,639 | |||||||||
| Petro-Canada | 300 | 9,459 | |||||||||
| Quicksilver Resources, Inc.* | 300 | 2,439 | |||||||||
| Royal Dutch Shell PLC ADR | 3,400 | 155,312 | |||||||||
| St. Mary Land & Exploration Co. | 200 | 3,574 | |||||||||
| Sunoco, Inc. | 100 | 2,651 | |||||||||
| Tesoro Corp. | 500 | 7,625 | |||||||||
| The Williams Cos., Inc. | 300 | 4,230 | |||||||||
| TransCanada Corp. | 100 | 2,497 | |||||||||
| W&T Offshore, Inc. | 300 | 2,784 | |||||||||
| Walter Industries, Inc. | 100 | 2,280 | |||||||||
| Whiting Petroleum Corp.* | 100 | 3,276 | |||||||||
| XTO Energy, Inc. | 100 | 3,466 | |||||||||
| 3,541,721 | |||||||||||
See Accompanying Notes to Financial Statements.
23
Credit Suisse Large Cap Growth Fund
Schedule of Investments (continued)
April 30, 2009 (unaudited)
| Number of Shares | Value | ||||||||||
| COMMON STOCKS | |||||||||||
| Personal Products (0.3%) | |||||||||||
| Avon Products, Inc. | 100 | $ | 2,276 | ||||||||
| Bare Escentuals, Inc.* | 200 | 1,852 | |||||||||
| Herbalife, Ltd. | 5,973 | 118,385 | |||||||||
| NBTY, Inc.* | 200 | 5,182 | |||||||||
| The Estee Lauder Cos., Inc. Class A | 900 | 26,910 | |||||||||
| 154,605 | |||||||||||
| Pharmaceuticals (5.4%) | |||||||||||
| Abbott Laboratories | 15,600 | 652,860 | |||||||||
| Allergan, Inc. | 100 | 4,666 | |||||||||
| Bristol-Myers Squibb Co. | 18,200 | 349,440 | |||||||||
| Eli Lilly & Co. | 100 | 3,292 | |||||||||
| Endo Pharmaceuticals Holdings, Inc.* | 14,499 | 239,813 | |||||||||
| Forest Laboratories, Inc.* | 200 | 4,338 | |||||||||
| Johnson & Johnson | 8,500 | 445,060 | |||||||||
| Merck & Co., Inc. | 6,200 | 150,288 | |||||||||
| Mylan, Inc.* | 100 | 1,325 | |||||||||
| Perrigo Co. | 700 | 18,144 | |||||||||
| Schering-Plough Corp. | 20,000 | 460,400 | |||||||||
| Sepracor, Inc.* | 400 | 5,684 | |||||||||
| Warner Chilcott, Ltd. Class A* | 300 | 2,937 | |||||||||
| Watson Pharmaceuticals, Inc.* | 4,000 | 123,760 | |||||||||
| 2,462,007 | |||||||||||
| Professional Services (0.2%) | |||||||||||
| Equifax, Inc. | 100 | 2,916 | |||||||||
| FTI Consulting, Inc.* | 300 | 16,464 | |||||||||
| IHS, Inc. Class A* | 400 | 16,544 | |||||||||
| Monster Worldwide, Inc.* | 1,200 | 16,560 | |||||||||
| Robert Half International, Inc. | 700 | 16,814 | |||||||||
| The Corporate Executive Board Co. | 300 | 5,184 | |||||||||
| 74,482 | |||||||||||
| Real Estate Management & Development (0.0%) | |||||||||||
| CB Richard Ellis Group, Inc. Class A* | 200 | 1,500 | |||||||||
| The St. Joe Co.* | 300 | 7,464 | |||||||||
| 8,964 | |||||||||||
| Road & Rail (0.9%) | |||||||||||
| Burlington Northern Santa Fe Corp. | 200 | 13,496 | |||||||||
| CSX Corp. | 4,600 | 136,114 | |||||||||
| Hertz Global Holdings, Inc.* | 100 | 680 | |||||||||
| Landstar System, Inc. | 100 | 3,561 | |||||||||
| Ryder System, Inc. | 100 | 2,769 | |||||||||
| Union Pacific Corp. | 5,300 | 260,442 | |||||||||
| 417,062 | |||||||||||
See Accompanying Notes to Financial Statements.
24
Credit Suisse Large Cap Growth Fund
Schedule of Investments (continued)
April 30, 2009 (unaudited)
| Number of Shares | Value | ||||||||||
| COMMON STOCKS | |||||||||||
| Semiconductors & Semiconductor Equipment (2.9%) | |||||||||||
| Advanced Micro Devices, Inc.* | 300 | $ | 1,083 | ||||||||
| Altera Corp. | 300 | 4,893 | |||||||||
| Analog Devices, Inc. | 300 | 6,384 | |||||||||
| Applied Materials, Inc. | 100 | 1,221 | |||||||||
| Atmel Corp.* | 900 | 3,456 | |||||||||
| Broadcom Corp. Class A* | 5,200 | 120,588 | |||||||||
| Cree, Inc.* | 200 | 5,478 | |||||||||
| Integrated Device Technology, Inc.* | 700 | 3,801 | |||||||||
| Intel Corp. | 49,900 | 787,422 | |||||||||
| Intersil Corp. Class A | 400 | 4,640 | |||||||||
| Lam Research Corp.* | 500 | 13,940 | |||||||||
| LSI Corp.* | 1,400 | 5,376 | |||||||||
| Marvell Technology Group, Ltd.* | 4,900 | 53,802 | |||||||||
| MEMC Electronic Materials, Inc.* | 1,000 | 16,200 | |||||||||
| Microchip Technology, Inc. | 100 | 2,300 | |||||||||
| Micron Technology, Inc.* | 300 | 1,464 | |||||||||
| National Semiconductor Corp. | 100 | 1,237 | |||||||||
| Novellus Systems, Inc.* | 300 | 5,418 | |||||||||
| NVIDIA Corp.* | 100 | 1,148 | |||||||||
| Silicon Laboratories, Inc.* | 400 | 13,304 | |||||||||
| Teradyne, Inc.* | 400 | 2,376 | |||||||||
| Texas Instruments, Inc. | 13,400 | 242,004 | |||||||||
| Varian Semiconductor Equipment Associates, Inc.* | 700 | 17,913 | |||||||||
| Xilinx, Inc. | 300 | 6,132 | |||||||||
| 1,321,580 | |||||||||||
| Software (6.8%) | |||||||||||
| Activision Blizzard, Inc.* | 500 | 5,385 | |||||||||
| Adobe Systems, Inc.* | 6,300 | 172,305 | |||||||||
| Amdocs, Ltd.* | 800 | 16,744 | |||||||||
| Autodesk, Inc.* | 2,200 | 43,868 | |||||||||
| BMC Software, Inc.* | 1,100 | 38,137 | |||||||||
| Citrix Systems, Inc.* | 1,800 | 51,354 | |||||||||
| Compuware Corp.* | 500 | 3,740 | |||||||||
| Electronic Arts, Inc.* | 100 | 2,035 | |||||||||
| Intuit, Inc.* | 3,900 | 90,207 | |||||||||
| McAfee, Inc.* | 200 | 7,508 | |||||||||
| Microsoft Corp. | 80,900 | 1,639,034 | |||||||||
| Novell, Inc.* | 500 | 1,880 | |||||||||
| Oracle Corp. | 39,300 | 760,062 | |||||||||
| Red Hat, Inc.* | 1,900 | 32,813 | |||||||||
| Salesforce.com, Inc.* | 500 | 21,405 | |||||||||
| Synopsys, Inc.* | 7,000 | 152,460 | |||||||||
| VMware, Inc. Class A* | 2,200 | 57,376 | |||||||||
| 3,096,313 | |||||||||||
See Accompanying Notes to Financial Statements.
25
Credit Suisse Large Cap Growth Fund
Schedule of Investments (continued)
April 30, 2009 (unaudited)
| Number of Shares | Value | ||||||||||
| COMMON STOCKS | |||||||||||
| Specialty Retail (2.0%) | |||||||||||
| Abercrombie & Fitch Co. Class A | 700 | $ | 18,942 | ||||||||
| Advance Auto Parts, Inc. | 900 | 39,375 | |||||||||
| American Eagle Outfitters, Inc. | 400 | 5,928 | |||||||||
| AnnTaylor Stores Corp.* | 100 | 739 | |||||||||
| AutoZone, Inc.* | 400 | 66,556 | |||||||||
| Bed Bath & Beyond, Inc.* | 100 | 3,042 | |||||||||
| Best Buy Co., Inc. | 4,000 | 153,520 | |||||||||
| CarMax, Inc.* | 2,200 | 28,072 | |||||||||
| Dick's Sporting Goods, Inc.* | 400 | 7,600 | |||||||||
| GameStop Corp. Class A* | 1,600 | 48,256 | |||||||||
| Guess?, Inc. | 4,600 | 119,784 | |||||||||
| Limited Brands, Inc. | 1,800 | 20,556 | |||||||||
| Lowe's Cos., Inc. | 100 | 2,150 | |||||||||
| O'Reilly Automotive, Inc.* | 400 | 15,540 | |||||||||
| PetSmart, Inc. | 500 | 11,440 | |||||||||
| Ross Stores, Inc. | 1,333 | 50,574 | |||||||||
| Staples, Inc. | 6,000 | 123,720 | |||||||||
| The Gap, Inc. | 2,600 | 40,404 | |||||||||
| The Home Depot, Inc. | 100 | 2,632 | |||||||||
| The TJX Cos., Inc. | 4,300 | 120,271 | |||||||||
| Tiffany & Co. | 300 | 8,682 | |||||||||
| Urban Outfitters, Inc.* | 1,100 | 21,439 | |||||||||
| 909,222 | |||||||||||
| Textiles, Apparel & Luxury Goods (0.1%) | |||||||||||
| Coach, Inc.* | 200 | 4,900 | |||||||||
| NIKE, Inc. Class B | 100 | 5,247 | |||||||||
| Phillips-Van Heusen Corp. | 400 | 11,612 | |||||||||
| Polo Ralph Lauren Corp. | 500 | 26,920 | |||||||||
| 48,679 | |||||||||||
| Thrifts & Mortgage Finance (0.0%) | |||||||||||
| Hudson City Bancorp, Inc. | 1,200 | 15,072 | |||||||||
| Tobacco (2.4%) | |||||||||||
| Altria Group, Inc. | 15,800 | 258,014 | |||||||||
| Lorillard, Inc. | 900 | 56,817 | |||||||||
| Philip Morris International, Inc. | 21,200 | 767,440 | |||||||||
| 1,082,271 | |||||||||||
| Trading Companies & Distributors (0.1%) | |||||||||||
| Fastenal Co. | 1,100 | 42,196 | |||||||||
| MSC Industrial Direct Co., Inc. Class A | 400 | 16,340 | |||||||||
| 58,536 | |||||||||||
See Accompanying Notes to Financial Statements.
26
Credit Suisse Large Cap Growth Fund
Schedule of Investments (continued)
April 30, 2009 (unaudited)
| Number of Shares | Value | ||||||||||
| COMMON STOCKS | |||||||||||
| Wireless Telecommunication Services (0.0%) | |||||||||||
| Clearwire Corp.* | 200 | $ | 1,108 | ||||||||
| NII Holdings, Inc.* | 600 | 9,696 | |||||||||
| 10,804 | |||||||||||
| TOTAL COMMON STOCKS (Cost $43,588,117) | 44,748,371 | ||||||||||
| Par (000) | |||||||||||
| SHORT-TERM INVESTMENT (1.6%) | |||||||||||
| State Street Bank and Trust Co. Euro Time Deposit, 0.010%, 05/01/09 (Cost $757,000) | $ | 757 | 757,000 | ||||||||
| TOTAL INVESTMENTS AT VALUE (100.1%) (Cost $44,345,117) | 45,505,371 | ||||||||||
| LIABILITIES IN EXCESS OF OTHER ASSETS (-0.1%) | (59,831 | ) | |||||||||
| NET ASSETS (100.0%) | $ | 45,445,540 | |||||||||
INVESTMENT ABBREVIATION
ADR = American Depositary Receipt
* Non-income producing security.
See Accompanying Notes to Financial Statements.
27
Credit Suisse Mid-Cap Core Fund
Schedule of Investments
April 30, 2009 (unaudited)
| Number of Shares | Value | ||||||||||
| COMMON STOCKS (99.9%) | |||||||||||
| Aerospace & Defense (0.4%) | |||||||||||
| Alliant Techsystems, Inc.* | 1,200 | $ | 95,580 | ||||||||
| BE Aerospace, Inc.* | 23,400 | 252,486 | |||||||||
| Herley Industries, Inc.* | 500 | 5,170 | |||||||||
| 353,236 | |||||||||||
| Airlines (0.1%) | |||||||||||
| Alaska Air Group, Inc.* | 1,433 | 24,046 | |||||||||
| JetBlue Airways Corp.* | 6,500 | 32,045 | |||||||||
| 56,091 | |||||||||||
| Auto Components (0.9%) | |||||||||||
| ArvinMeritor, Inc. | 3,876 | 4,806 | |||||||||
| BorgWarner, Inc. | 11,900 | 344,505 | |||||||||
| Gentex Corp. | 20,200 | 270,074 | |||||||||
| Lear Corp.* | 2,800 | 2,240 | |||||||||
| TRW Automotive Holdings Corp.* | 8,400 | 72,408 | |||||||||
| 694,033 | |||||||||||
| Automobiles (0.4%) | |||||||||||
| Thor Industries, Inc. | 11,700 | 268,983 | |||||||||
| Winnebago Industries, Inc. | 1,000 | 8,810 | |||||||||
| 277,793 | |||||||||||
| Beverages (0.7%) | |||||||||||
| Coca-Cola Bottling Co. Consolidated | 100 | 5,212 | |||||||||
| Hansen Natural Corp.* | 8,000 | 326,080 | |||||||||
| National Beverage Corp.* | 400 | 4,212 | |||||||||
| PepsiAmericas, Inc. | 10,100 | 248,157 | |||||||||
| 583,661 | |||||||||||
| Biotechnology (0.6%) | |||||||||||
| Affymax, Inc.* | 200 | 3,548 | |||||||||
| Facet Biotech Corp.* | 18,260 | 170,731 | |||||||||
| Metabolix, Inc.* | 800 | 6,320 | |||||||||
| OSI Pharmaceuticals, Inc.* | 2,100 | 70,497 | |||||||||
| United Therapeutics Corp.* | 900 | 56,529 | |||||||||
| Vertex Pharmaceuticals, Inc.* | 6,600 | 203,412 | |||||||||
| 511,037 | |||||||||||
| Building Products (0.3%) | |||||||||||
| Lennox International, Inc. | 8,300 | 264,687 | |||||||||
| Capital Markets (1.9%) | |||||||||||
| Affiliated Managers Group, Inc.* | 1,500 | 85,275 | |||||||||
| Apollo Investment Corp. | 47,700 | 228,960 | |||||||||
| Eaton Vance Corp. | 4,400 | 120,428 | |||||||||
| Epoch Holding Corp. | 400 | 2,948 | |||||||||
| Jefferies Group, Inc. | 14,900 | 291,593 | |||||||||
| Penson Worldwide, Inc.* | 700 | 7,098 | |||||||||
| Raymond James Financial, Inc. | 11,100 | 174,159 | |||||||||
See Accompanying Notes to Financial Statements.
28
Credit Suisse Mid-Cap Core Fund
Schedule of Investments (continued)
April 30, 2009 (unaudited)
| Number of Shares | Value | ||||||||||
| COMMON STOCKS | |||||||||||
| Capital Markets | |||||||||||
| SEI Investments Co. | 19,200 | $ | 269,376 | ||||||||
| SWS Group, Inc. | 1,700 | 21,743 | |||||||||
| Waddell & Reed Financial, Inc. Class A | 12,290 | 275,419 | |||||||||
| 1,476,999 | |||||||||||
| Chemicals (4.3%) | |||||||||||
| Airgas, Inc. | 8,000 | 344,960 | |||||||||
| Albemarle Corp. | 10,100 | 270,882 | |||||||||
| Ashland, Inc. | 2,500 | 54,900 | |||||||||
| Cabot Corp. | 15,800 | 230,680 | |||||||||
| Chemtura Corp. | 29,700 | 2,213 | |||||||||
| Cytec Industries, Inc. | 12,249 | 243,265 | |||||||||
| FMC Corp. | 6,900 | 336,237 | |||||||||
| LSB Industries, Inc.* | 400 | 4,792 | |||||||||
| Minerals Technologies, Inc. | 5,800 | 215,702 | |||||||||
| NL Industries, Inc. | 1,800 | 21,798 | |||||||||
| Olin Corp. | 17,100 | 215,460 | |||||||||
| RPM International, Inc. | 18,800 | 259,816 | |||||||||
| Sensient Technologies Corp. | 9,600 | 224,448 | |||||||||
| Terra Industries, Inc. | 10,300 | 272,950 | |||||||||
| The Lubrizol Corp. | 7,700 | 332,794 | |||||||||
| The Scotts Miracle-Gro Co. Class A | 1,600 | 54,032 | |||||||||
| The Valspar Corp. | 12,200 | 292,800 | |||||||||
| 3,377,729 | |||||||||||
| Commercial Banks (5.0%) | |||||||||||
| 1st Source Corp. | 300 | 5,892 | |||||||||
| Ames National Corp. | 200 | 4,336 | |||||||||
| Arrow Financial Corp. | 200 | 5,296 | |||||||||
| Associated Banc-Corp. | 18,810 | 290,991 | |||||||||
| BancorpSouth, Inc. | 11,700 | 272,025 | |||||||||
| Bank of Hawaii Corp. | 7,300 | 256,522 | |||||||||
| Camden National Corp. | 200 | 5,800 | |||||||||
| Cathay General Bancorp | 10,700 | 120,054 | |||||||||
| City National Corp. | 7,000 | 256,200 | |||||||||
| Commerce Bancshares, Inc. | 8,195 | 271,255 | |||||||||
| Cullen/Frost Bankers, Inc. | 4,700 | 221,323 | |||||||||
| First Bancorp, Inc. | 200 | 3,490 | |||||||||
| FirstMerit Corp. | 12,867 | 249,749 | |||||||||
| Fulton Financial Corp. | 25,200 | 166,572 | |||||||||
| International Bancshares Corp. | 10,100 | 136,451 | |||||||||
| Lakeland Bancorp, Inc. | 500 | 4,255 | |||||||||
| Lakeland Financial Corp. | 300 | 5,631 | |||||||||
| MainSource Financial Group, Inc. | 800 | 6,928 | |||||||||
| PacWest Bancorp | 2,100 | 30,597 | |||||||||
| Renasant Corp. | 400 | 5,640 | |||||||||
| Sandy Spring Bancorp, Inc. | 400 | 6,500 | |||||||||
| Santander BanCorp | 700 | 4,690 | |||||||||
| SCBT Financial Corp. | 300 | 6,921 | |||||||||
See Accompanying Notes to Financial Statements.
29
Credit Suisse Mid-Cap Core Fund
Schedule of Investments (continued)
April 30, 2009 (unaudited)
| Number of Shares | Value | ||||||||||
| COMMON STOCKS | |||||||||||
| Commercial Banks | |||||||||||
| Simmons First National Corp. Class A | 200 | $ | 5,186 | ||||||||
| Southside Bancshares, Inc. | 210 | 4,473 | |||||||||
| StellarOne Corp. | 400 | 5,148 | |||||||||
| Sterling Bancorp | 600 | 6,864 | |||||||||
| Suffolk Bancorp | 200 | 5,120 | |||||||||
| SVB Financial Group* | 10,900 | 226,284 | |||||||||
| Synovus Financial Corp. | 75,200 | 242,896 | |||||||||
| TCF Financial Corp. | 4,200 | 58,422 | |||||||||
| The Colonial BancGroup, Inc. | 20,400 | 15,504 | |||||||||
| Trustmark Corp. | 11,800 | 256,532 | |||||||||
| Union Bankshares Corp. | 200 | 3,418 | |||||||||
| Univest Corp. of Pennsylvania | 200 | 4,174 | |||||||||
| Valley National Bancorp | 19,500 | 282,165 | |||||||||
| Webster Financial Corp. | 100 | 523 | |||||||||
| Westamerica BanCorporation | 4,700 | 252,061 | |||||||||
| Wilmington Trust Corp. | 16,644 | 241,504 | |||||||||
| 3,947,392 | |||||||||||
| Commercial Services & Supplies (2.2%) | |||||||||||
| Clean Harbors, Inc.* | 4,900 | 245,490 | |||||||||
| Copart, Inc.* | 8,600 | 269,954 | |||||||||
| Corrections Corp. of America* | 17,700 | 250,101 | |||||||||
| Courier Corp. | 200 | 3,136 | |||||||||
| HNI Corp. | 1,600 | 24,800 | |||||||||
| Mine Safety Appliances Co. | 9,400 | 231,710 | |||||||||
| Rollins, Inc. | 12,100 | 217,800 | |||||||||
| Schawk, Inc. | 900 | 6,471 | |||||||||
| Standard Parking Corp.* | 400 | 6,096 | |||||||||
| The Brink's Co. | 8,000 | 226,800 | |||||||||
| Waste Connections, Inc.* | 10,000 | 257,800 | |||||||||
| 1,740,158 | |||||||||||
| Communications Equipment (1.6%) | |||||||||||
| 3Com Corp.* | 13,300 | 53,865 | |||||||||
| ADTRAN, Inc. | 11,500 | 243,225 | |||||||||
| Anaren, Inc.* | 400 | 5,204 | |||||||||
| Avocent Corp.* | 100 | 1,444 | |||||||||
| CommScope, Inc.* | 12,000 | 301,200 | |||||||||
| F5 Networks, Inc.* | 10,500 | 286,335 | |||||||||
| Hughes Communications, Inc.* | 400 | 7,668 | |||||||||
| Ixia* | 1,200 | 6,912 | |||||||||
| Loral Space & Communications, Inc.* | 100 | 2,335 | |||||||||
| Oplink Communications, Inc.* | 700 | 7,728 | |||||||||
| Palm, Inc.* | 5,000 | 52,450 | |||||||||
| Polycom, Inc.* | 14,500 | 270,280 | |||||||||
| Unity Wireless Corp.* | 712,201 | 221 | |||||||||
| 1,238,867 | |||||||||||
See Accompanying Notes to Financial Statements.
30
Credit Suisse Mid-Cap Core Fund
Schedule of Investments (continued)
April 30, 2009 (unaudited)
| Number of Shares | Value | ||||||||||
| COMMON STOCKS | |||||||||||
| Computers & Peripherals (1.2%) | |||||||||||
| Diebold, Inc. | 10,100 | $ | 266,943 | ||||||||
| NCR Corp.* | 28,400 | 288,260 | |||||||||
| Western Digital Corp.* | 17,600 | 413,952 | |||||||||
| 969,155 | |||||||||||
| Construction & Engineering (2.3%) | |||||||||||
| Aecom Technology Corp.* | 11,100 | 285,603 | |||||||||
| Dycom Industries, Inc.* | 700 | 5,894 | |||||||||
| Granite Construction, Inc. | 6,300 | 248,535 | |||||||||
| KBR, Inc. | 18,400 | 287,408 | |||||||||
| Quanta Services, Inc.* | 15,700 | 356,861 | |||||||||
| The Shaw Group, Inc.* | 10,000 | 335,300 | |||||||||
| URS Corp.* | 7,800 | 343,668 | |||||||||
| 1,863,269 | |||||||||||
| Construction Materials (0.2%) | |||||||||||
| Martin Marietta Materials, Inc. | 1,500 | 126,045 | |||||||||
| Consumer Finance (0.1%) | |||||||||||
| AmeriCredit Corp.* | 5,000 | 50,850 | |||||||||
| Containers & Packaging (1.4%) | |||||||||||
| AptarGroup, Inc. | 9,000 | 279,270 | |||||||||
| Greif, Inc. Class A | 6,000 | 271,620 | |||||||||
| Packaging Corp. of America | 16,500 | 261,855 | |||||||||
| Sonoco Products Co. | 11,600 | 283,156 | |||||||||
| 1,095,901 | |||||||||||
| Distributors (0.4%) | |||||||||||
| Core-Mark Holding Co., Inc.* | 300 | 5,751 | |||||||||
| LKQ Corp.* | 17,300 | 293,754 | |||||||||
| 299,505 | |||||||||||
| Diversified Consumer Services (2.6%) | |||||||||||
| Brink's Home Security Holdings, Inc.* | 8,800 | 233,904 | |||||||||
| Career Education Corp.* | 11,300 | 249,052 | |||||||||
| Corinthian Colleges, Inc.* | 15,700 | 241,780 | |||||||||
| DeVry, Inc. | 7,000 | 297,920 | |||||||||
| ITT Educational Services, Inc.* | 1,200 | 120,924 | |||||||||
| Matthews International Corp. Class A | 7,300 | 228,636 | |||||||||
| Regis Corp. | 16,100 | 308,154 | |||||||||
| Service Corporation International | 9,900 | 44,847 | |||||||||
| Strayer Education, Inc. | 1,700 | 321,997 | |||||||||
| 2,047,214 | |||||||||||
| Diversified Financial Services (0.0%) | |||||||||||
| Asset Acceptance Capital Corp.* | 600 | 4,974 | |||||||||
| Compass Diversified Holdings | 700 | 6,258 | |||||||||
| MarketAxess Holdings, Inc.* | 700 | 6,713 | |||||||||
| 17,945 | |||||||||||
See Accompanying Notes to Financial Statements.
31
Credit Suisse Mid-Cap Core Fund
Schedule of Investments (continued)
April 30, 2009 (unaudited)
| Number of Shares | Value | ||||||||||
| COMMON STOCKS | |||||||||||
| Diversified Telecommunication Services (0.0%) | |||||||||||
| Cincinnati Bell, Inc.* | 9,300 | $ | 25,947 | ||||||||
| General Communication, Inc. Class A* | 900 | 6,894 | |||||||||
| Global Crossing, Ltd.* | 800 | 5,808 | |||||||||
| 38,649 | |||||||||||
| Electric Utilities (2.0%) | |||||||||||
| Cleco Corp. | 11,100 | 234,099 | |||||||||
| DPL, Inc. | 12,900 | 289,347 | |||||||||
| Great Plains Energy, Inc. | 17,700 | 256,119 | |||||||||
| Hawaiian Electric Industries, Inc. | 15,457 | 240,202 | |||||||||
| IDACORP, Inc. | 9,900 | 237,303 | |||||||||
| NV Energy, Inc. | 8,600 | 88,150 | |||||||||
| Westar Energy, Inc. | 15,200 | 266,456 | |||||||||
| 1,611,676 | |||||||||||
| Electrical Equipment (1.6%) | |||||||||||
| AMETEK, Inc. | 9,800 | 315,658 | |||||||||
| Hubbell, Inc. Class B | 2,100 | 69,720 | |||||||||
| Roper Industries, Inc. | 7,600 | 346,484 | |||||||||
| SunPower Corp. Class B* | 1,042 | 26,425 | |||||||||
| Thomas & Betts Corp.* | 8,600 | 267,632 | |||||||||
| Vicor Corp. | 700 | 3,759 | |||||||||
| Woodward Governor Co. | 12,600 | 251,496 | |||||||||
| 1,281,174 | |||||||||||
| Electronic Equipment, Instruments & Components (2.4%) | |||||||||||
| Arrow Electronics, Inc.* | 13,700 | 311,538 | |||||||||
| Avnet, Inc.* | 15,700 | 343,673 | |||||||||
| Echelon Corp.* | 203 | 1,616 | |||||||||
| Electro Scientific Industries, Inc.* | 700 | 6,020 | |||||||||
| Ingram Micro, Inc. Class A* | 20,100 | 291,852 | |||||||||
| Itron, Inc.* | 1,300 | 59,800 | |||||||||
| KEMET Corp.* | 10,700 | 8,560 | |||||||||
| National Instruments Corp. | 11,300 | 249,052 | |||||||||
| Tech Data Corp.* | 9,400 | 270,626 | |||||||||
| Trimble Navigation, Ltd.* | 13,600 | 291,584 | |||||||||
| Vishay Intertechnology, Inc.* | 7,000 | 41,090 | |||||||||
| 1,875,411 | |||||||||||
| Energy Equipment & Services (3.0%) | |||||||||||
| Exterran Holdings, Inc.* | 2,300 | 47,495 | |||||||||
| FMC Technologies, Inc.* | 10,100 | 345,723 | |||||||||
| Helmerich & Payne, Inc. | 10,100 | 311,282 | |||||||||
| Oceaneering International, Inc.* | 6,700 | 305,319 | |||||||||
| Patterson-UTI Energy, Inc. | 20,500 | 260,555 | |||||||||
| Pride International, Inc.* | 15,100 | 342,770 | |||||||||
| Superior Energy Services, Inc.* | 14,700 | 282,387 | |||||||||
| Tidewater, Inc. | 6,600 | 285,450 | |||||||||
| Unit Corp.* | 8,800 | 240,152 | |||||||||
| 2,421,133 | |||||||||||
See Accompanying Notes to Financial Statements.
32
Credit Suisse Mid-Cap Core Fund
Schedule of Investments (continued)
April 30, 2009 (unaudited)
| Number of Shares | Value | ||||||||||
| COMMON STOCKS | |||||||||||
| Food & Staples Retailing (0.7%) | |||||||||||
| BJ's Wholesale Club, Inc.* | 8,300 | $ | 276,722 | ||||||||
| Ruddick Corp. | 9,700 | 248,902 | |||||||||
| Susser Holdings Corp.* | 300 | 4,335 | |||||||||
| Village Super Market, Inc. Class A | 100 | 3,098 | |||||||||
| 533,057 | |||||||||||
| Food Products (1.5%) | |||||||||||
| B&G Foods, Inc. Class A | 1,100 | 6,732 | |||||||||
| Calavo Growers, Inc. | 300 | 4,263 | |||||||||
| Corn Products International, Inc. | 12,100 | 289,190 | |||||||||
| Farmer Brothers Co. | 200 | 3,950 | |||||||||
| Flowers Foods, Inc. | 11,200 | 258,720 | |||||||||
| Lancaster Colony Corp. | 5,200 | 227,760 | |||||||||
| Ralcorp Holdings, Inc.* | 2,100 | 120,036 | |||||||||
| Smithfield Foods, Inc.* | 4,400 | 38,016 | |||||||||
| Tootsie Roll Industries, Inc. | 9,000 | 219,150 | |||||||||
| 1,167,817 | |||||||||||
| Gas Utilities (2.0%) | |||||||||||
| AGL Resources, Inc. | 10,000 | 311,700 | |||||||||
| Energen Corp. | 8,734 | 315,472 | |||||||||
| National Fuel Gas Co. | 9,100 | 297,661 | |||||||||
| ONEOK, Inc. | 3,900 | 102,063 | |||||||||
| UGI Corp. | 12,800 | 293,632 | |||||||||
| WGL Holdings, Inc. | 8,100 | 252,234 | |||||||||
| 1,572,762 | |||||||||||
| Health Care Equipment & Supplies (4.7%) | |||||||||||
| Beckman Coulter, Inc. | 6,000 | 315,360 | |||||||||
| Cyberonics, Inc.* | 13,700 | 181,388 | |||||||||
| Edwards Lifesciences Corp.* | 5,400 | 342,252 | |||||||||
| Gen-Probe, Inc.* | 5,800 | 279,328 | |||||||||
| Hill-Rom Holdings, Inc. | 7,200 | 93,456 | |||||||||
| Hologic, Inc.* | 23,400 | 347,724 | |||||||||
| IDEXX Laboratories, Inc.* | 7,400 | 290,820 | |||||||||
| Immucor, Inc.* | 14,600 | 237,834 | |||||||||
| IRIS International, Inc.* | 500 | 5,585 | |||||||||
| Kinetic Concepts, Inc.* | 10,500 | 259,980 | |||||||||
| Masimo Corp.* | 9,100 | 262,990 | |||||||||
| ResMed, Inc.* | 8,000 | 307,600 | |||||||||
| STERIS Corp. | 10,800 | 260,280 | |||||||||
| Synovis Life Technologies, Inc.* | 400 | 6,072 | |||||||||
| Teleflex, Inc. | 6,300 | 270,774 | |||||||||
| Thoratec Corp.* | 9,400 | 273,164 | |||||||||
| 3,734,607 | |||||||||||
See Accompanying Notes to Financial Statements.
33
Credit Suisse Mid-Cap Core Fund
Schedule of Investments (continued)
April 30, 2009 (unaudited)
| Number of Shares | Value | ||||||||||
| COMMON STOCKS | |||||||||||
| Health Care Providers & Services (2.8%) | |||||||||||
| Community Health Systems, Inc.* | 3,400 | $ | 77,656 | ||||||||
| Cross Country Healthcare, Inc.* | 1,000 | 8,810 | |||||||||
| Health Management Associates, Inc. Class A* | 9,600 | 44,832 | |||||||||
| Health Net, Inc.* | 3,800 | 54,872 | |||||||||
| Henry Schein, Inc.* | 8,100 | 332,424 | |||||||||
| LifePoint Hospitals, Inc.* | 10,700 | 276,595 | |||||||||
| Lincare Holdings, Inc.* | 10,982 | 264,996 | |||||||||
| National Research Corp. | 100 | 2,521 | |||||||||
| Omnicare, Inc. | 10,800 | 277,668 | |||||||||
| Owens & Minor, Inc. | 6,800 | 235,824 | |||||||||
| Psychiatric Solutions, Inc.* | 2,100 | 40,719 | |||||||||
| Universal Health Services, Inc. Class B | 6,100 | 307,440 | |||||||||
| VCA Antech, Inc.* | 11,600 | 290,232 | |||||||||
| 2,214,589 | |||||||||||
| Health Care Technology (0.5%) | |||||||||||
| Cerner Corp.* | 6,800 | 365,840 | |||||||||
| Vital Images, Inc.* | 400 | 4,052 | |||||||||
| 369,892 | |||||||||||
| Hotels, Restaurants & Leisure (1.4%) | |||||||||||
| Bob Evans Farms, Inc. | 1,100 | 26,675 | |||||||||
| Brinker International, Inc. | 3,800 | 67,336 | |||||||||
| Chipotle Mexican Grill, Inc. Class A* | 3,700 | 300,033 | |||||||||
| Churchill Downs, Inc. | 200 | 6,962 | |||||||||
| Gaylord Entertainment Co.* | 200 | 2,788 | |||||||||
| International Speedway Corp. Class A | 10,000 | 236,800 | |||||||||
| Life Time Fitness, Inc.* | 1,300 | 24,388 | |||||||||
| Panera Bread Co. Class A* | 4,400 | 246,444 | |||||||||
| Scientific Games Corp. Class A* | 2,400 | 41,976 | |||||||||
| Sonic Corp.* | 300 | 3,276 | |||||||||
| The Cheesecake Factory, Inc.* | 2,200 | 38,214 | |||||||||
| The Steak n Shake Co.* | 2,800 | 32,368 | |||||||||
| Wendy's/Arby's Group, Inc. Class A | 15,600 | 78,000 | |||||||||
| 1,105,260 | |||||||||||
| Household Durables (1.1%) | |||||||||||
| American Greetings Corp. Class A | 1,700 | 13,345 | |||||||||
| Cavco Industries, Inc.* | 200 | 4,688 | |||||||||
| M.D.C. Holdings, Inc. | 1,300 | 44,434 | |||||||||
| Mohawk Industries, Inc.* | 6,200 | 293,322 | |||||||||
| NVR, Inc.* | 300 | 151,611 | |||||||||
| The Ryland Group, Inc. | 1,600 | 33,136 | |||||||||
| Toll Brothers, Inc.* | 4,900 | 99,274 | |||||||||
| Tupperware Brands Corp. | 10,300 | 257,809 | |||||||||
| 897,619 | |||||||||||
See Accompanying Notes to Financial Statements.
34
Credit Suisse Mid-Cap Core Fund
Schedule of Investments (continued)
April 30, 2009 (unaudited)
| Number of Shares | Value | ||||||||||
| COMMON STOCKS | |||||||||||
| Household Products (0.6%) | |||||||||||
| Church & Dwight Co., Inc. | 2,600 | $ | 141,466 | ||||||||
| Energizer Holdings, Inc.* | 5,600 | 320,880 | |||||||||
| 462,346 | |||||||||||
| Independent Power Producers & Energy Traders (0.0%) | |||||||||||
| NRG Energy, Inc.* | 1,600 | 28,768 | |||||||||
| Industrial Conglomerates (0.3%) | |||||||||||
| Carlisle Cos., Inc. | 11,500 | 261,625 | |||||||||
| Insurance (5.3%) | |||||||||||
| Ambac Financial Group, Inc. | 9,000 | 8,190 | |||||||||
| American Financial Group, Inc. | 13,350 | 234,693 | |||||||||
| Arthur J. Gallagher & Co. | 12,700 | 285,496 | |||||||||
| Baldwin & Lyons, Inc. Class B | 200 | 4,010 | |||||||||
| Brown & Brown, Inc. | 14,800 | 288,008 | |||||||||
| Crawford & Co. Class B* | 1,000 | 5,950 | |||||||||
| Donegal Group, Inc. Class A | 300 | 4,392 | |||||||||
| Everest Re Group, Ltd. | 4,900 | 365,736 | |||||||||
| Fidelity National Financial, Inc. Class A | 18,600 | 337,218 | |||||||||
| First American Corp. | 10,700 | 300,456 | |||||||||
| Hanover Insurance Group, Inc. | 8,049 | 241,309 | |||||||||
| HCC Insurance Holdings, Inc. | 12,000 | 287,040 | |||||||||
| Horace Mann Educators Corp. | 20,900 | 183,502 | |||||||||
| Mercury General Corp. | 7,000 | 236,460 | |||||||||
| National Interstate Corp. | 300 | 4,845 | |||||||||
| Old Republic International Corp. | 30,000 | 281,100 | |||||||||
| Protective Life Corp. | 2,800 | 23,996 | |||||||||
| Reinsurance Group of America, Inc. | 9,300 | 295,647 | |||||||||
| StanCorp Financial Group, Inc. | 8,986 | 246,486 | |||||||||
| Unitrin, Inc. | 13,764 | 233,988 | |||||||||
| W.R. Berkley Corp. | 13,800 | 329,958 | |||||||||
| 4,198,480 | |||||||||||
| Internet & Catalog Retail (0.5%) | |||||||||||
| Netflix, Inc.* | 5,700 | 258,267 | |||||||||
| Priceline.com, Inc.* | 1,500 | 145,635 | |||||||||
| Stamps.com, Inc.* | 700 | 6,552 | |||||||||
| 410,454 | |||||||||||
| Internet Software & Services (0.4%) | |||||||||||
| Digital River, Inc.* | 7,000 | 268,940 | |||||||||
| DivX, Inc.* | 1,200 | 6,156 | |||||||||
| Internet Brands, Inc. Class A* | 700 | 4,291 | |||||||||
| Liquidity Services, Inc.* | 700 | 5,271 | |||||||||
| The Knot, Inc.* | 800 | 7,256 | |||||||||
| ValueClick, Inc.* | 3,300 | 34,980 | |||||||||
| Vignette Corp.* | 900 | 7,434 | |||||||||
| 334,328 | |||||||||||
See Accompanying Notes to Financial Statements.
35
Credit Suisse Mid-Cap Core Fund
Schedule of Investments (continued)
April 30, 2009 (unaudited)
| Number of Shares | Value | ||||||||||
| COMMON STOCKS | |||||||||||
| IT Services (3.6%) | |||||||||||
| Acxiom Corp. | 2,500 | $ | 24,125 | ||||||||
| Alliance Data Systems Corp.* | 6,800 | 284,716 | |||||||||
| Broadridge Financial Solutions, Inc. | 29,312 | 567,187 | |||||||||
| Cass Information Systems, Inc. | 100 | 3,373 | |||||||||
| DST Systems, Inc.* | 6,800 | 245,956 | |||||||||
| Gartner, Inc.* | 2,300 | 31,073 | |||||||||
| Global Payments, Inc. | 9,000 | 288,540 | |||||||||
| Hewitt Associates, Inc. Class A* | 3,100 | 97,216 | |||||||||
| Lender Processing Services, Inc. | 9,800 | 280,868 | |||||||||
| ManTech International Corp. Class A* | 5,500 | 199,045 | |||||||||
| NeuStar, Inc. Class A* | 13,100 | 249,031 | |||||||||
| RightNow Technologies, Inc.* | 900 | 6,795 | |||||||||
| SAIC, Inc.* | 18,100 | 327,610 | |||||||||
| SRA International, Inc. Class A* | 14,400 | 221,616 | |||||||||
| 2,827,151 | |||||||||||
| Life Sciences Tools & Services (2.5%) | |||||||||||
| Affymetrix, Inc.* | 2,600 | 12,194 | |||||||||
| Bio-Rad Laboratories, Inc. Class A* | 3,600 | 250,884 | |||||||||
| Charles River Laboratories International, Inc.* | 10,200 | 282,030 | |||||||||
| Covance, Inc.* | 7,300 | 286,744 | |||||||||
| Mettler-Toledo International, Inc.* | 4,700 | 289,661 | |||||||||
| Pharmaceutical Product Development, Inc. | 14,800 | 290,228 | |||||||||
| Techne Corp. | 4,900 | 280,378 | |||||||||
| Varian, Inc.* | 7,900 | 260,858 | |||||||||
| 1,952,977 | |||||||||||
| Machinery (6.3%) | |||||||||||
| AGCO Corp.* | 12,300 | 298,890 | |||||||||
| American Railcar Industries, Inc. | 600 | 5,472 | |||||||||
| Bucyrus International, Inc. | 12,900 | 280,059 | |||||||||
| Crane Co. | 11,600 | 267,844 | |||||||||
| Donaldson Co., Inc. | 9,200 | 303,508 | |||||||||
| Federal Signal Corp. | 1,813 | 14,087 | |||||||||
| Graco, Inc. | 10,900 | 257,131 | |||||||||
| Graham Corp. | 3,900 | 48,750 | |||||||||
| Harsco Corp. | 10,355 | 285,280 | |||||||||
| IDEX Corp. | 11,200 | 282,800 | |||||||||
| Joy Global, Inc. | 12,100 | 308,550 | |||||||||
| Kennametal, Inc. | 12,200 | 249,490 | |||||||||
| Lincoln Electric Holdings, Inc. | 6,700 | 298,351 | |||||||||
| NACCO Industries, Inc. Class A | 200 | 7,650 | |||||||||
| Nordson Corp. | 7,000 | 253,960 | |||||||||
| Omega Flex, Inc. | 100 | 1,546 | |||||||||
| Oshkosh Corp. | 4,400 | 42,240 | |||||||||
| Pentair, Inc. | 11,400 | 303,696 | |||||||||
| SPX Corp. | 6,400 | 295,488 | |||||||||
| Terex Corp.* | 19,500 | 269,100 | |||||||||
| The Gorman-Rupp Co. | 7,300 | 155,490 | |||||||||
See Accompanying Notes to Financial Statements.
36
Credit Suisse Mid-Cap Core Fund
Schedule of Investments (continued)
April 30, 2009 (unaudited)
| Number of Shares | Value | ||||||||||
| COMMON STOCKS | |||||||||||
| Machinery | |||||||||||
| The Timken Co. | 15,100 | $ | 242,808 | ||||||||
| Trinity Industries, Inc. | 18,600 | 271,746 | |||||||||
| Wabtec Corp. | 7,100 | 270,794 | |||||||||
| 5,014,730 | |||||||||||
| Marine (0.3%) | |||||||||||
| Alexander & Baldwin, Inc. | 9,100 | 242,424 | |||||||||
| Media (0.8%) | |||||||||||
| Belo Corp. Class A | 6,000 | 10,200 | |||||||||
| DreamWorks Animation SKG, Inc. Class A* | 11,400 | 273,714 | |||||||||
| Entercom Communications Corp. Class A | 1,000 | 1,660 | |||||||||
| John Wiley & Sons, Inc. Class A | 1,500 | 50,850 | |||||||||
| Lamar Advertising Co. Class A* | 2,800 | 47,320 | |||||||||
| Lee Enterprises, Inc. | 3,000 | 1,140 | |||||||||
| Marvel Entertainment, Inc.* | 8,900 | 265,576 | |||||||||
| Outdoor Channel Holdings, Inc.* | 600 | 4,488 | |||||||||
| 654,948 | |||||||||||
| Metals & Mining (1.7%) | |||||||||||
| Carpenter Technology Corp. | 100 | 2,067 | |||||||||
| Cliffs Natural Resources, Inc. | 13,400 | 309,004 | |||||||||
| Commercial Metals Co. | 18,100 | 269,328 | |||||||||
| Reliance Steel & Aluminum Co. | 8,000 | 281,840 | |||||||||
| Steel Dynamics, Inc. | 22,400 | 278,880 | |||||||||
| Worthington Industries, Inc. | 16,346 | 243,555 | |||||||||
| 1,384,674 | |||||||||||
| Multi-Utilities (2.1%) | |||||||||||
| Alliant Energy Corp. | 12,700 | 283,972 | |||||||||
| Black Hills Corp. | 11,400 | 226,632 | |||||||||
| MDU Resources Group, Inc. | 18,200 | 319,774 | |||||||||
| NSTAR | 10,000 | 314,100 | |||||||||
| OGE Energy Corp. | 10,800 | 277,668 | |||||||||
| PNM Resources, Inc. | 700 | 5,964 | |||||||||
| Vectren Corp. | 12,591 | 279,142 | |||||||||
| 1,707,252 | |||||||||||
| Multiline Retail (0.7%) | |||||||||||
| 99 Cents Only Stores* | 19,400 | 208,356 | |||||||||
| Dollar Tree, Inc.* | 7,900 | 334,486 | |||||||||
| Saks, Inc.* | 5,300 | 27,613 | |||||||||
| 570,455 | |||||||||||
| Office Electronics (0.3%) | |||||||||||
| Zebra Technologies Corp. Class A* | 12,000 | 255,000 | |||||||||
See Accompanying Notes to Financial Statements.
37
Credit Suisse Mid-Cap Core Fund
Schedule of Investments (continued)
April 30, 2009 (unaudited)
| Number of Shares | Value | ||||||||||
| COMMON STOCKS | |||||||||||
| Oil, Gas & Consumable Fuels (3.4%) | |||||||||||
| APCO Argentina, Inc. | 200 | $ | 3,814 | ||||||||
| Arch Coal, Inc. | 19,500 | 272,415 | |||||||||
| Bill Barrett Corp.* | 9,721 | 252,551 | |||||||||
| Cimarex Energy Co. | 10,200 | 274,380 | |||||||||
| Comstock Resources, Inc.* | 7,500 | 258,450 | |||||||||
| Encore Acquisition Co.* | 9,100 | 265,629 | |||||||||
| Encore Energy Partners LP | 400 | 6,680 | |||||||||
| Forest Oil Corp.* | 15,500 | 248,000 | |||||||||
| Frontier Oil Corp. | 17,900 | 227,509 | |||||||||
| Mariner Energy, Inc.* | 20,600 | 234,428 | |||||||||
| Newfield Exploration Co.* | 11,200 | 349,216 | |||||||||
| Quicksilver Resources, Inc.* | 4,200 | 34,146 | |||||||||
| Southern Union Co. | 16,800 | 267,288 | |||||||||
| VAALCO Energy, Inc.* | 19 | 91 | |||||||||
| 2,694,597 | |||||||||||
| Paper & Forest Products (0.0%) | |||||||||||
| Louisiana-Pacific Corp. | 3,600 | 14,652 | |||||||||
| Schweitzer-Mauduit International, Inc. | 94 | 2,159 | |||||||||
| 16,811 | |||||||||||
| Personal Products (0.7%) | |||||||||||
| Alberto-Culver Co. | 11,700 | 260,793 | |||||||||
| Elizabeth Arden, Inc.* | 1,100 | 9,526 | |||||||||
| NBTY, Inc.* | 10,300 | 266,873 | |||||||||
| 537,192 | |||||||||||
| Pharmaceuticals (1.5%) | |||||||||||
| Endo Pharmaceuticals Holdings, Inc.* | 58,303 | 964,331 | |||||||||
| Medicis Pharmaceutical Corp. Class A | 2,200 | 35,354 | |||||||||
| Perrigo Co. | 2,900 | 75,168 | |||||||||
| Sepracor, Inc.* | 4,100 | 58,261 | |||||||||
| Valeant Pharmaceuticals International* | 3,184 | 53,364 | |||||||||
| 1,186,478 | |||||||||||
| Professional Services (1.2%) | |||||||||||
| FTI Consulting, Inc.* | 5,900 | 323,792 | |||||||||
| Kforce, Inc.* | 700 | 7,637 | |||||||||
| Manpower, Inc. | 7,700 | 331,793 | |||||||||
| Navigant Consulting, Inc.* | 100 | 1,471 | |||||||||
| Watson Wyatt Worldwide, Inc. Class A | 5,400 | 286,470 | |||||||||
| 951,163 | |||||||||||
| Real Estate Investment Trusts (3.8%) | |||||||||||
| Alexandria Real Estate Equities, Inc. | 1,500 | 54,720 | |||||||||
| AMB Property Corp. | 5,500 | 104,995 | |||||||||
| Apartment Investment & Management Co. Class A | 16 | 117 | |||||||||
| BRE Properties, Inc. | 2,000 | 49,140 | |||||||||
| Camden Property Trust | 2,100 | 56,973 | |||||||||
See Accompanying Notes to Financial Statements.
38
Credit Suisse Mid-Cap Core Fund
Schedule of Investments (continued)
April 30, 2009 (unaudited)
| Number of Shares | Value | ||||||||||
| COMMON STOCKS | |||||||||||
| Real Estate Investment Trusts | |||||||||||
| Corporate Office Properties Trust | 2,000 | $ | 61,120 | ||||||||
| Cousins Properties, Inc. | 1,600 | 13,520 | |||||||||
| Duke Realty Corp. | 8,000 | 78,160 | |||||||||
| Equity One, Inc. | 14,300 | 212,784 | |||||||||
| Essex Property Trust, Inc. | 1,000 | 63,490 | |||||||||
| Federal Realty Investment Trust | 2,400 | 132,480 | |||||||||
| Highwoods Properties, Inc. | 2,400 | 57,576 | |||||||||
| Hospitality Properties Trust | 20,900 | 255,816 | |||||||||
| Liberty Property Trust | 11,900 | 289,646 | |||||||||
| Mack-Cali Realty Corp. | 10,600 | 284,716 | |||||||||
| Nationwide Health Properties, Inc. | 3,800 | 93,822 | |||||||||
| OMEGA Healthcare Investors, Inc. | 3,100 | 48,732 | |||||||||
| Potlatch Corp. | 8,500 | 249,985 | |||||||||
| Rayonier, Inc. | 8,300 | 320,546 | |||||||||
| Realty Income Corp. | 12,900 | 288,057 | |||||||||
| Regency Centers Corp. | 2,800 | 104,860 | |||||||||
| SL Green Realty Corp. | 2,300 | 40,618 | |||||||||
| The Macerich Co. | 3,000 | 52,590 | |||||||||
| UDR, Inc. | 5,412 | 54,499 | |||||||||
| Weingarten Realty Investors | 3,900 | 60,606 | |||||||||
| 3,029,568 | |||||||||||
| Real Estate Management & Development (0.3%) | |||||||||||
| Consolidated-Tomoka Land Co. | 400 | 13,916 | |||||||||
| Jones Lang LaSalle, Inc. | 7,000 | 225,890 | |||||||||
| 239,806 | |||||||||||
| Road & Rail (1.0%) | |||||||||||
| Con-way, Inc. | 10,200 | 252,756 | |||||||||
| Kansas City Southern* | 3,200 | 48,800 | |||||||||
| Landstar System, Inc. | 7,300 | 259,953 | |||||||||
| Universal Truckload Services, Inc. | 200 | 2,464 | |||||||||
| Werner Enterprises, Inc. | 14,000 | 228,900 | |||||||||
| YRC Worldwide, Inc.* | 2,200 | 6,666 | |||||||||
| 799,539 | |||||||||||
| Semiconductors & Semiconductor Equipment (2.0%) | |||||||||||
| Actel Corp.* | 600 | 7,422 | |||||||||
| Atmel Corp.* | 16,900 | 64,896 | |||||||||
| Cohu, Inc. | 800 | 7,808 | |||||||||
| Cree, Inc.* | 10,600 | 290,334 | |||||||||
| Fairchild Semiconductor International, Inc.* | 4,800 | 29,568 | |||||||||
| Integrated Device Technology, Inc.* | 6,500 | 35,295 | |||||||||
| International Rectifier Corp.* | 14,789 | 249,638 | |||||||||
| Intersil Corp. Class A | 21,000 | 243,600 | |||||||||
| Lam Research Corp.* | 12,400 | 345,712 | |||||||||
| Pericom Semiconductor Corp.* | 800 | 7,128 | |||||||||
| RF Micro Devices, Inc.* | 10,000 | 21,100 | |||||||||
See Accompanying Notes to Financial Statements.
39
Credit Suisse Mid-Cap Core Fund
Schedule of Investments (continued)
April 30, 2009 (unaudited)
| Number of Shares | Value | ||||||||||
| COMMON STOCKS | |||||||||||
| Semiconductors & Semiconductor Equipment | |||||||||||
| Semtech Corp.* | 2,233 | $ | 32,200 | ||||||||
| Silicon Laboratories, Inc.* | 7,800 | 259,428 | |||||||||
| 1,594,129 | |||||||||||
| Software (2.4%) | |||||||||||
| ACI Worldwide, Inc.* | 1,400 | 24,178 | |||||||||
| Advent Software, Inc.* | 600 | 19,944 | |||||||||
| Bottomline Technologies, Inc.* | 700 | 5,495 | |||||||||
| Cadence Design Systems, Inc.* | 10,900 | 60,822 | |||||||||
| DemandTec, Inc.* | 800 | 5,776 | |||||||||
| FactSet Research Systems, Inc. | 5,400 | 289,386 | |||||||||
| Fair Isaac Corp. | 1,800 | 30,276 | |||||||||
| Jack Henry & Associates, Inc. | 14,100 | 254,082 | |||||||||
| Macrovision Solutions Corp.* | 12,700 | 256,794 | |||||||||
| MSC.Software Corp.* | 800 | 4,912 | |||||||||
| OPNET Technologies, Inc.* | 1,000 | 8,600 | |||||||||
| Parametric Technology Corp.* | 21,300 | 237,495 | |||||||||
| Renaissance Learning, Inc. | 400 | 3,840 | |||||||||
| Smith Micro Software, Inc.* | 900 | 7,740 | |||||||||
| Sybase, Inc.* | 9,400 | 319,224 | |||||||||
| Synopsys, Inc.* | 15,500 | 337,590 | |||||||||
| Wind River Systems, Inc.* | 8,900 | 65,237 | |||||||||
| 1,931,391 | |||||||||||
| Specialty Retail (4.1%) | |||||||||||
| Advance Auto Parts, Inc. | 8,200 | 358,750 | |||||||||
| Aeropostale, Inc.* | 9,000 | 305,730 | |||||||||
| American Eagle Outfitters, Inc. | 20,100 | 297,882 | |||||||||
| AnnTaylor Stores Corp.* | 700 | 5,173 | |||||||||
| Barnes & Noble, Inc. | 9,800 | 255,976 | |||||||||
| CarMax, Inc.* | 8,300 | 105,908 | |||||||||
| Chico's FAS, Inc.* | 6,600 | 50,424 | |||||||||
| Coldwater Creek, Inc.* | 1,800 | 6,210 | |||||||||
| Dick's Sporting Goods, Inc.* | 13,300 | 252,700 | |||||||||
| Foot Locker, Inc. | 6,000 | 71,340 | |||||||||
| Guess?, Inc. | 10,300 | 268,212 | |||||||||
| J. Crew Group, Inc.* | 1,900 | 32,699 | |||||||||
| PetSmart, Inc. | 13,100 | 299,728 | |||||||||
| Rent-A-Center, Inc.* | 12,800 | 246,400 | |||||||||
| Ross Stores, Inc. | 9,706 | 368,246 | |||||||||
| Urban Outfitters, Inc.* | 15,900 | 309,891 | |||||||||
| Williams-Sonoma, Inc. | 3,200 | 44,800 | |||||||||
| 3,280,069 | |||||||||||
| Textiles, Apparel & Luxury Goods (1.0%) | |||||||||||
| FGX International Holdings Ltd.* | 500 | 5,760 | |||||||||
| Hanesbrands, Inc.* | 3,500 | 57,610 | |||||||||
| Phillips-Van Heusen Corp. | 8,700 | 252,561 | |||||||||
| The Timberland Co. Class A* | 1,800 | 29,232 | |||||||||
See Accompanying Notes to Financial Statements.
40
Credit Suisse Mid-Cap Core Fund
Schedule of Investments (continued)
April 30, 2009 (unaudited)
| Number of Shares | Value | ||||||||||
| COMMON STOCKS | |||||||||||
| Textiles, Apparel & Luxury Goods | |||||||||||
| The Warnaco Group, Inc.* | 9,000 | $ | 259,560 | ||||||||
| Under Armour, Inc. Class A* | 9,483 | 223,230 | |||||||||
| Weyco Group, Inc. | 200 | 5,490 | |||||||||
| 833,443 | |||||||||||
| Thrifts & Mortgage Finance (1.2%) | |||||||||||
| Abington Bancorp, Inc. | 600 | 5,274 | |||||||||
| Astoria Financial Corp. | 101 | 834 | |||||||||
| BankFinancial Corp. | 500 | 5,350 | |||||||||
| Berkshire Hills Bancorp, Inc. | 200 | 4,512 | |||||||||
| Clifton Savings Bancorp, Inc. | 300 | 3,294 | |||||||||
| ESSA Bancorp, Inc. | 400 | 5,456 | |||||||||
| First Niagara Financial Group, Inc. | 20,027 | 271,166 | |||||||||
| Home Federal Bancorp, Inc. | 400 | 4,036 | |||||||||
| IndyMac Bancorp, Inc.* | 100 | 7 | |||||||||
| New York Community Bancorp, Inc. | 13,100 | 148,161 | |||||||||
| NewAlliance Bancshares, Inc. | 19,500 | 251,745 | |||||||||
| Roma Financial Corp. | 300 | 3,903 | |||||||||
| The PMI Group, Inc. | 3,500 | 2,205 | |||||||||
| ViewPoint Financial Group | 300 | 4,668 | |||||||||
| Washington Federal, Inc. | 18,727 | 243,076 | |||||||||
| 953,687 | |||||||||||
| Tobacco (0.3%) | |||||||||||
| Universal Corp. | 7,200 | 217,152 | |||||||||
| Trading Companies & Distributors (0.7%) | |||||||||||
| GATX Corp. | 8,900 | 267,979 | |||||||||
| H&E Equipment Services, Inc.* | 800 | 6,024 | |||||||||
| MSC Industrial Direct Co., Inc. Class A | 6,900 | 281,865 | |||||||||
| Rush Enterprises, Inc. Class A* | 100 | 1,316 | |||||||||
| Textainer Group Holdings Ltd. | 700 | 6,202 | |||||||||
| United Rentals, Inc.* | 2,300 | 13,938 | |||||||||
| 577,324 | |||||||||||
| Water Utilities (0.4%) | |||||||||||
| Aqua America, Inc. | 15,300 | 280,755 | |||||||||
| Connecticut Water Service, Inc. | 200 | 4,148 | |||||||||
| Consolidated Water Co., Ltd. | 400 | 5,364 | |||||||||
| Middlesex Water Co. | 300 | 4,230 | |||||||||
| 294,497 | |||||||||||
| Wireless Telecommunication Services (0.2%) | |||||||||||
| Syniverse Holdings, Inc.* | 2,000 | 25,200 | |||||||||
| Telephone & Data Systems, Inc. | 3,700 | 106,079 | |||||||||
| 131,279 | |||||||||||
| TOTAL COMMON STOCKS (Cost $82,278,872) | 79,388,950 | ||||||||||
See Accompanying Notes to Financial Statements.
41
Credit Suisse Mid-Cap Core Fund
Schedule of Investments (continued)
April 30, 2009 (unaudited)
| Number of Shares | Value | ||||||||||
| WARRANTS (0.0%) | |||||||||||
| Communications Equipment (0.0%) | |||||||||||
| Unity Wireless Corp., strike price $0.20, expires 08/17/09*^ | 79,133 | $ | 0 | ||||||||
| Unity Wireless Corp., strike price $0.22, expires 08/17/09*^ | 79,134 | 0 | |||||||||
| Unity Wireless Corp., strike price $0.27, expires 08/17/09*^ | 79,133 | 0 | |||||||||
| Unity Wireless Corp., strike price $0.30, expires 08/17/09*^ | 79,134 | 0 | |||||||||
| TOTAL WARRANTS (Cost $0) | 0 | ||||||||||
| Par (000) | |||||||||||
| SHORT-TERM INVESTMENT (0.1%) | |||||||||||
| State Street Bank and Trust Co. Euro Time Deposit, 0.010%, 05/01/09 (Cost $100,000) | $ | 100 | 100,000 | ||||||||
| TOTAL INVESTMENTS AT VALUE (100.0%) (Cost $82,378,872) | 79,488,950 | ||||||||||
| LIABILITIES IN EXCESS OF OTHER ASSETS (0.0%) | (20,094 | ) | |||||||||
| NET ASSETS (100.0%) | $ | 79,468,856 | |||||||||
* Non-income producing security.
^ Not readily marketable security; security is valued at fair value as determined in good faith by, or under the direction of, the Board of Directors.
See Accompanying Notes to Financial Statements.
42
Credit Suisse Funds
Statements of Assets and Liabilities
April 30, 2009 (unaudited)
| Large Cap Growth Fund | Mid-Cap Core Fund | ||||||||||
| Assets | |||||||||||
| Investments at value, (Cost $44,345,117 and $82,378,872, respectively) (Note 2) | $ | 45,505,371 | $ | 79,488,950 | |||||||
| Cash | 806 | 270 | |||||||||
| Receivable for investments sold | 4,659,562 | 1,891,269 | |||||||||
| Dividend receivable | 19,142 | 52,143 | |||||||||
| Receivable for fund shares sold | 1,368 | 18,936 | |||||||||
| Receivable from investment adviser (Note 3) | 9,173 | — | |||||||||
| Prepaid expenses | 28,164 | 30,807 | |||||||||
| Total Assets | 50,223,586 | 81,482,375 | |||||||||
| Liabilities | |||||||||||
| Advisory fee payable (Note 3) | — | 19,321 | |||||||||
| Administrative services fee payable (Note 3) | 11,297 | 25,281 | |||||||||
| Shareholder servicing/Distribution fee payable (Note 3) | 1,239 | 2,024 | |||||||||
| Payable for investments purchased | 4,632,492 | 1,710,957 | |||||||||
| Payable for fund shares redeemed | 2,884 | 69,057 | |||||||||
| Trustees'/Directors' fee payable | 6,262 | 6,262 | |||||||||
| Other accrued expenses payable | 123,872 | 180,617 | |||||||||
| Total Liabilities | 4,778,046 | 2,013,519 | |||||||||
| Net Assets | |||||||||||
| Capital stock, $.001 par value (Note 6) | 3,717 | 3,302 | |||||||||
| Paid-in capital (Note 6) | 357,996,018 | �� | 229,197,164 | ||||||||
| Undistributed net investment income | 254,550 | 8,322 | |||||||||
| Accumulated net realized loss on investments, foreign currency transactions and futures contracts | (313,969,000 | ) | (146,850,010 | ) | |||||||
| Net unrealized appreciation (depreciation) from investments and foreign currency translations | 1,160,255 | (2,889,922 | ) | ||||||||
| Net Assets | $ | 45,445,540 | $ | 79,468,856 | |||||||
| Common Shares | |||||||||||
| Net assets | $ | 43,742,093 | $ | 74,722,118 | |||||||
| Shares outstanding | 3,570,753 | 3,089,844 | |||||||||
| Net asset value, offering price and redemption price per share | $ | 12.25 | $ | 24.18 | |||||||
| Advisor Shares | |||||||||||
| Net assets | $ | 837,549 | $ | 4,215,375 | |||||||
| Shares outstanding | 72,751 | 189,355 | |||||||||
| Net asset value, offering price and redemption price per share | $ | 11.51 | $ | 22.26 | |||||||
See Accompanying Notes to Financial Statements.
43
Credit Suisse Funds
Statements of Assets and Liabilities (continued)
April 30, 2009 (unaudited)
| Large Cap Growth Fund | Mid-Cap Core Fund | ||||||||||
| A Shares | |||||||||||
| Net assets | $ | 526,402 | $ | 460,921 | |||||||
| Shares outstanding | 43,736 | 19,316 | |||||||||
| Net asset value and redemption price per share | $ | 12.04 | $ | 23.86 | |||||||
| Maximum offering price per share (net asset value/(1-5.75%)) | $ | 12.77 | $ | 25.32 | |||||||
| B Shares | |||||||||||
| Net assets | $ | 198,819 | $ | 69,651 | |||||||
| Shares outstanding | 17,472 | 3,030 | |||||||||
| Net asset value and offering price per share | $ | 11.38 | $ | 22.99 | |||||||
| C Shares | |||||||||||
| Net assets | $ | 140,677 | $ | 791 | |||||||
| Shares outstanding | 12,361 | 34 | |||||||||
| Net asset value and offering price per share | $ | 11.38 | $ | 23.02 | |||||||
See Accompanying Notes to Financial Statements.
44
Credit Suisse Funds
Statements of Operations
For the Six Months Ended April 30, 2009 (unaudited)
| Large Cap Growth Fund | Mid-Cap Core Fund | ||||||||||
| Investment Income (Note 2) | |||||||||||
| Dividends | $ | 536,300 | $ | 1,165,646 | |||||||
| Interest | 5 | 10 | |||||||||
| Securities lending | 37 | 284 | |||||||||
| Foreign taxes withheld | (8,423 | ) | (13 | ) | |||||||
| Total investment income | 527,919 | 1,165,927 | |||||||||
| Expenses | |||||||||||
| Investment advisory fees (Note 3) | 107,599 | 255,214 | |||||||||
| Administrative services fees (Note 3) | 48,229 | 69,039 | |||||||||
| Shareholder servicing/Distribution fees (Note 3) | |||||||||||
| Advisor Class | 1,984 | 9,861 | |||||||||
| Class A | 627 | 467 | |||||||||
| Class B | 1,014 | 270 | |||||||||
| Class C | 719 | 3 | |||||||||
| Transfer agent fees (Note 3) | 97,534 | 183,351 | |||||||||
| Custodian fees | 74,200 | 89,060 | |||||||||
| Registration fees | 46,437 | 44,206 | |||||||||
| Printing fees (Note 3) | 25,213 | 23,366 | |||||||||
| Legal fees | 19,283 | 15,544 | |||||||||
| Audit and tax fees | 12,135 | 14,898 | |||||||||
| Trustees'/Directors' fees | 8,168 | 8,168 | |||||||||
| Insurance expense | 1,420 | 2,500 | |||||||||
| Commitment fees (Note 4) | 493 | 927 | |||||||||
| Interest expense (Note 4) | 220 | — | |||||||||
| Miscellaneous expense | 2,824 | 2,774 | |||||||||
| Total expenses | 448,099 | 719,648 | |||||||||
| Less: fees waived and expenses reimbursed (Note 3) | (174,758 | ) | (180,389 | ) | |||||||
| Net expenses | 273,341 | 539,259 | |||||||||
| Net investment income | 254,578 | 626,668 | |||||||||
| Net Realized and Unrealized Gain (Loss) from Investments and Foreign Currency Related Items | |||||||||||
| Net realized loss from investments | (17,232,209 | ) | (32,394,677 | ) | |||||||
| Net realized gain from foreign currency transactions | 10 | — | |||||||||
| Net change in unrealized appreciation (depreciation) from investments | 15,295,213 | 28,998,138 | |||||||||
| Net change in unrealized appreciation (depreciation) from foreign currency translations | 1 | — | |||||||||
| Net realized and unrealized loss from investments and foreign currency related items | (1,936,985 | ) | (3,396,539 | ) | |||||||
| Net decrease in net assets resulting from operations | $ | (1,682,407 | ) | $ | (2,769,871 | ) | |||||
See Accompanying Notes to Financial Statements.
45
Credit Suisse Funds
Statements of Changes in Net Assets
| Large Cap Growth Fund | Mid-Cap Core Fund | ||||||||||||||||||
| For the Six Months Ended April 30, 2009 (unaudited) | For the Year Ended October 31, 2008 | For the Six Months Ended April 30, 2009 (unaudited) | For the Year Ended October 31, 2008 | ||||||||||||||||
| From Operations | |||||||||||||||||||
| Net investment income | $ | 254,578 | $ | 223,002 | $ | 626,668 | $ | 313,122 | |||||||||||
| Net realized loss from investments and foreign currency transactions | (17,232,199 | ) | (7,438,891 | ) | (32,394,677 | ) | (8,579,946 | ) | |||||||||||
| Net change in unrealized appreciation (depreciation) from investments and foreign currency translations | 15,295,214 | (28,808,883 | ) | 28,998,138 | (47,759,376 | ) | |||||||||||||
| Net decrease in net assets resulting from operations | (1,682,407 | ) | (36,024,772 | ) | (2,769,871 | ) | (56,026,200 | ) | |||||||||||
| From Dividends | |||||||||||||||||||
| Dividends from net investment income Common Class shares | (208,055 | ) | (12,298 | ) | (882,625 | ) | — | ||||||||||||
| Advisor Class shares | (4,669 | ) | — | (17,209 | ) | — | |||||||||||||
| Class A shares | (2,558 | ) | — | (1,919 | ) | — | |||||||||||||
| Class B shares | (1,143 | ) | — | (149 | ) | — | |||||||||||||
| Class C shares | (760 | ) | — | (3 | ) | — | |||||||||||||
| Net decrease in net assets resulting from dividends | (217,185 | ) | (12,298 | ) | (901,905 | ) | — | ||||||||||||
| From Capital Share Transactions (Note 6) | |||||||||||||||||||
| Proceeds from sale of shares | 934,506 | 3,339,078 | 3,162,412 | 8,104,375 | |||||||||||||||
| Reinvestment of dividends | 207,751 | 11,938 | 889,594 | — | |||||||||||||||
| Net asset value of shares redeemed | (6,152,206 | ) | (25,841,004 | ) | (9,960,367 | ) | (47,718,163 | ) | |||||||||||
| Net decrease in net assets from capital share transactions | (5,009,949 | ) | (22,489,988 | ) | (5,908,361 | ) | (39,613,788 | ) | |||||||||||
| Net decrease in net assets | (6,909,541 | ) | (58,527,058 | ) | (9,580,137 | ) | (95,639,988 | ) | |||||||||||
| Net Assets | |||||||||||||||||||
| Beginning of period | 52,355,081 | 110,882,139 | 89,048,993 | 184,688,981 | |||||||||||||||
| End of period | $ | 45,445,540 | $ | 52,355,081 | $ | 79,468,856 | $ | 89,048,993 | |||||||||||
| Undistributed net investment income | $ | 254,550 | $ | 217,157 | $ | 8,322 | $ | 283,559 | |||||||||||
See Accompanying Notes to Financial Statements.
46
Credit Suisse Large Cap Growth Fund
Financial Highlights
(For a Common Class Share of the Fund Outstanding Throughout Each Period)
| For the Six Months Ended April 30, 2009 | For the Year Ended October 31, | ||||||||||||||||||||||||||
| (unaudited) | 2008 | 2007 | 2006 | 2005 | 2004 | ||||||||||||||||||||||
| Per share data | |||||||||||||||||||||||||||
| Net asset value, beginning of period | $ | 12.58 | $ | 20.32 | $ | 17.40 | $ | 16.49 | $ | 15.26 | $ | 14.75 | |||||||||||||||
| INVESTMENT OPERATIONS | |||||||||||||||||||||||||||
| Net investment income (loss)1 | 0.07 | 0.05 | 0.01 | (0.04 | ) | 0.01 | (0.09 | ) | |||||||||||||||||||
| Net gain (loss) on investments and foreign currency related items (both realized and unrealized) | (0.34 | ) | (7.79 | ) | 2.91 | 0.97 | 1.22 | 0.60 | |||||||||||||||||||
| Total from investment operations | (0.27 | ) | (7.74 | ) | 2.92 | 0.93 | 1.23 | 0.51 | |||||||||||||||||||
| LESS DIVIDENDS | |||||||||||||||||||||||||||
| Dividends from net investment income | (0.06 | ) | (0.00 | )2 | — | (0.02 | ) | — | — | ||||||||||||||||||
| Net asset value, end of period | $ | 12.25 | $ | 12.58 | $ | 20.32 | $ | 17.40 | $ | 16.49 | $ | 15.26 | |||||||||||||||
| Total return3 | (2.14 | )% | (38.08 | )% | 16.78 | % | 5.62 | % | 8.06 | % | 3.46 | % | |||||||||||||||
| RATIOS AND SUPPLEMENTAL DATA | |||||||||||||||||||||||||||
| Net assets, end of period (000s omitted) | $ | 43,742 | $ | 50,314 | $ | 105,404 | $ | 181,077 | $ | 291,148 | $ | 433,681 | |||||||||||||||
| Ratio of expenses to average net assets | 1.25 | %4 | 1.24 | % | 1.10 | % | 1.20 | % | 1.17 | % | 1.16 | % | |||||||||||||||
| Ratio of net investment income (loss) to average net assets | 1.20 | %4 | 0.29 | % | 0.04 | % | (0.24 | )% | 0.09 | % | (0.57 | )% | |||||||||||||||
| Decrease reflected in above operating expense ratios due to waivers/reimbursements | 0.81 | %4 | — | — | — | — | — | ||||||||||||||||||||
| Portfolio turnover rate | 215 | % | 171 | % | 161 | % | 94 | % | 97 | % | 70 | % | |||||||||||||||
1 Per share information is calculated using the average shares outstanding method.
2 This amount represents less than $(0.01) per share.
3 Total returns are historical and assume changes in share price and reinvestment of all dividends and distributions. Had certain expenses not been reduced during the periods shown, total returns would have been lower. Total returns for periods less than one year are not annualized.
4 Annualized.
See Accompanying Notes to Financial Statements.
47
Credit Suisse Large Cap Growth Fund
Financial Highlights
(For an Advisor Class Share of the Fund Outstanding Throughout Each Period)
| For the Six Months Ended April 30, 2009 | For the Year Ended October 31, | ||||||||||||||||||||||||||
| (unaudited) | 2008 | 2007 | 2006 | 2005 | 2004 | ||||||||||||||||||||||
| Per share data | |||||||||||||||||||||||||||
| Net asset value, beginning of period | $ | 11.86 | $ | 19.24 | $ | 16.56 | $ | 15.76 | $ | 14.65 | $ | 14.24 | |||||||||||||||
| INVESTMENT OPERATIONS | |||||||||||||||||||||||||||
| Net investment income (loss)1 | 0.04 | (0.03 | ) | (0.08 | ) | (0.12 | ) | (0.04 | ) | (0.16 | ) | ||||||||||||||||
| Net gain (loss) on investments and foreign currency related items (both realized and unrealized) | (0.33 | ) | (7.35 | ) | 2.76 | 0.92 | 1.15 | 0.57 | |||||||||||||||||||
| Total from investment operations | (0.29 | ) | (7.38 | ) | 2.68 | 0.80 | 1.11 | 0.41 | |||||||||||||||||||
| LESS DIVIDENDS | |||||||||||||||||||||||||||
| Dividends from net investment income | (0.06 | ) | — | — | — | — | — | ||||||||||||||||||||
| Net asset value, end of period | $ | 11.51 | $ | 11.86 | $ | 19.24 | $ | 16.56 | $ | 15.76 | $ | 14.65 | |||||||||||||||
| Total return2 | (2.43 | )% | (38.36 | )% | 16.18 | % | 5.08 | % | 7.58 | % | 2.88 | % | |||||||||||||||
| RATIOS AND SUPPLEMENTAL DATA | |||||||||||||||||||||||||||
| Net assets, end of period (000s omitted) | $ | 838 | $ | 988 | $ | 3,541 | $ | 3,729 | $ | 5,334 | $ | 14,723 | |||||||||||||||
| Ratio of expenses to average net assets | 1.75 | %3 | 1.71 | % | 1.60 | % | 1.70 | % | 1.67 | % | 1.66 | % | |||||||||||||||
| Ratio of net investment income (loss) to average net assets | 0.73 | %3 | (0.19 | )% | (0.46 | )% | (0.74 | )% | (0.41 | )% | (1.07 | )% | |||||||||||||||
| Decrease reflected in above operating expense ratios due to waivers/reimbursements | 0.81 | %3 | — | — | — | — | — | ||||||||||||||||||||
| Portfolio turnover rate | 215 | % | 171 | % | 161 | % | 94 | % | 97 | % | 70 | % | |||||||||||||||
1 Per share information is calculated using the average shares outstanding method.
2 Total returns are historical and assume changes in share price and reinvestment of all dividends and distributions. Had certain expenses not been reduced during the periods shown, total returns would have been lower. Total returns for periods less than one year are not annualized.
3 Annualized.
See Accompanying Notes to Financial Statements.
48
Credit Suisse Large Cap Growth Fund
Financial Highlights
(For a Class A Share of the Fund Outstanding Throughout Each Period)
| For the Six Months Ended April 30, 2009 | For the Year Ended October 31, | ||||||||||||||||||||||||||
| (unaudited) | 2008 | 2007 | 2006 | 2005 | 2004 | ||||||||||||||||||||||
| Per share data | |||||||||||||||||||||||||||
| Net asset value, beginning of period | $ | 12.38 | $ | 20.03 | $ | 17.20 | $ | 16.33 | $ | 15.14 | $ | 14.68 | |||||||||||||||
| INVESTMENT OPERATIONS | |||||||||||||||||||||||||||
| Net investment income (loss)1 | 0.05 | 0.01 | (0.04 | ) | (0.08 | ) | (0.00 | )2 | (0.12 | ) | |||||||||||||||||
| Net gain (loss) on investments and foreign currency related items (both realized and unrealized) | (0.33 | ) | (7.66 | ) | 2.87 | 0.95 | 1.19 | 0.58 | |||||||||||||||||||
| Total from investment operations | (0.28 | ) | (7.65 | ) | 2.83 | 0.87 | 1.19 | 0.46 | |||||||||||||||||||
| LESS DIVIDENDS | |||||||||||||||||||||||||||
| Dividends from net investment income | (0.06 | ) | — | — | — | — | — | ||||||||||||||||||||
| Net asset value, end of period | $ | 12.04 | $ | 12.38 | $ | 20.03 | $ | 17.20 | $ | 16.33 | $ | 15.14 | |||||||||||||||
| Total return3 | (2.25 | )% | (38.19 | )% | 16.45 | % | 5.33 | % | 7.86 | % | 3.13 | % | |||||||||||||||
| RATIOS AND SUPPLEMENTAL DATA | |||||||||||||||||||||||||||
| Net assets, end of period (000s omitted) | $ | 526 | $ | 606 | $ | 1,285 | $ | 1,329 | $ | 1,585 | $ | 2,490 | |||||||||||||||
| Ratio of expenses to average net assets | 1.50 | %4 | 1.50 | % | 1.35 | % | 1.45 | % | 1.42 | % | 1.41 | % | |||||||||||||||
| Ratio of net investment income (loss) to average net assets | 0.96 | %4 | 0.05 | % | (0.21 | )% | (0.49 | )% | (0.16 | )% | (0.82 | )% | |||||||||||||||
| Decrease reflected in above operating expense ratios due to waivers/reimbursements | 0.81 | %4 | — | — | — | — | — | ||||||||||||||||||||
| Portfolio turnover rate | 215 | % | 171 | % | 161 | % | 94 | % | 97 | % | 70 | % | |||||||||||||||
1 Per share information is calculated using the average shares outstanding method.
2 This amount represents less than $(0.01) per share.
3 Total returns are historical and assume changes in share price, reinvestment of all dividends and distributions and no sales charge. Had certain expenses not been reduced during the periods shown, total returns would have been lower. Total returns for periods less than one year are not annualized.
4 Annualized.
See Accompanying Notes to Financial Statements.
49
Credit Suisse Large Cap Growth Fund
Financial Highlights
(For a Class B Share of the Fund Outstanding Throughout Each Period)
| For the Six Months Ended April 30, 2009 | For the Year Ended October 31, | ||||||||||||||||||||||||||
| (unaudited) | 2008 | 2007 | 2006 | 2005 | 2004 | ||||||||||||||||||||||
| Per share data | |||||||||||||||||||||||||||
| Net asset value, beginning of period | $ | 11.75 | $ | 19.16 | $ | 16.58 | $ | 15.85 | $ | 14.82 | $ | 14.47 | |||||||||||||||
| INVESTMENT OPERATIONS | |||||||||||||||||||||||||||
| Net investment income (loss)1 | 0.01 | (0.12 | ) | (0.17 | ) | (0.20 | ) | (0.16 | ) | (0.23 | ) | ||||||||||||||||
| Net gain (loss) on investments and foreign currency related items (both realized and unrealized) | (0.32 | ) | (7.29 | ) | 2.75 | 0.93 | 1.19 | 0.58 | |||||||||||||||||||
| Total from investment operations | (0.31 | ) | (7.41 | ) | 2.58 | 0.73 | 1.03 | 0.35 | |||||||||||||||||||
| LESS DIVIDENDS | |||||||||||||||||||||||||||
| Dividends from net investment income | (0.06 | ) | — | — | — | — | — | ||||||||||||||||||||
| Net asset value, end of period | $ | 11.38 | $ | 11.75 | $ | 19.16 | $ | 16.58 | $ | 15.85 | $ | 14.82 | |||||||||||||||
| Total return2 | (2.63 | )% | (38.67 | )% | 15.56 | % | 4.61 | % | 6.95 | % | 2.42 | % | |||||||||||||||
| RATIOS AND SUPPLEMENTAL DATA | |||||||||||||||||||||||||||
| Net assets, end of period (000s omitted) | $ | 199 | $ | 244 | $ | 285 | $ | 498 | $ | 625 | $ | 543 | |||||||||||||||
| Ratio of expenses to average net assets | 2.25 | %3 | 2.28 | % | 2.10 | % | 2.20 | % | 2.17 | % | 2.16 | % | |||||||||||||||
| Ratio of net investment income (loss) to average net assets | 0.21 | %3 | (0.73 | )% | (0.97 | )% | (1.24 | )% | (0.91 | )% | (1.57 | )% | |||||||||||||||
| Decrease reflected in above operating expense ratios due to waivers/reimbursements | 0.81 | %3 | — | — | — | — | — | ||||||||||||||||||||
| Portfolio turnover rate | 215 | % | 171 | % | 161 | % | 94 | % | 97 | % | 70 | % | |||||||||||||||
1 Per share information is calculated using the average shares outstanding method.
2 Total returns are historical and assume changes in share price, reinvestment of all dividends and distributions and no sales charge. Had certain expenses not been reduced during the periods shown, total returns would have been lower. Total returns for periods less than one year are not annualized.
3 Annualized.
See Accompanying Notes to Financial Statements.
50
Credit Suisse Large Cap Growth Fund
Financial Highlights
(For a Class C Share of the Fund Outstanding Throughout Each Period)
| For the Six Months Ended April 30, 2009 | For the Year Ended October 31, | ||||||||||||||||||||||||||
| (unaudited) | 2008 | 2007 | 2006 | 2005 | 2004 | ||||||||||||||||||||||
| Per share data | |||||||||||||||||||||||||||
| Net asset value, beginning of period | $ | 11.75 | $ | 19.16 | $ | 16.58 | $ | 15.85 | $ | 14.81 | $ | 14.47 | |||||||||||||||
| INVESTMENT OPERATIONS | |||||||||||||||||||||||||||
| Net investment income (loss)1 | 0.01 | (0.12 | ) | (0.17 | ) | (0.20 | ) | (0.14 | ) | (0.23 | ) | ||||||||||||||||
| Net gain (loss) on investments and foreign currency related items (both realized and unrealized) | (0.32 | ) | (7.29 | ) | 2.75 | 0.93 | 1.18 | 0.57 | |||||||||||||||||||
| Total from investment operations | (0.31 | ) | (7.41 | ) | 2.58 | 0.73 | 1.04 | 0.34 | |||||||||||||||||||
| LESS DIVIDENDS | |||||||||||||||||||||||||||
| Dividends from net investment income | (0.06 | ) | — | — | — | — | — | ||||||||||||||||||||
| Net asset value, end of period | $ | 11.38 | $ | 11.75 | $ | 19.16 | $ | 16.58 | $ | 15.85 | $ | 14.81 | |||||||||||||||
| Total return2 | (2.63 | )% | (38.67 | )% | 15.56 | % | 4.61 | % | 7.02 | % | 2.35 | % | |||||||||||||||
| RATIOS AND SUPPLEMENTAL DATA | |||||||||||||||||||||||||||
| Net assets, end of period (000s omitted) | $ | 141 | $ | 203 | $ | 367 | $ | 385 | $ | 471 | $ | 849 | |||||||||||||||
| Ratio of expenses to average net assets | 2.25 | %3 | 2.26 | % | 2.10 | % | 2.20 | % | 2.17 | % | 2.16 | % | |||||||||||||||
| Ratio of net investment income (loss) to average net assets | 0.27 | %3 | (0.72 | )% | (0.96 | )% | (1.24 | )% | (0.91 | )% | (1.57 | )% | |||||||||||||||
| Decrease reflected in above operating expense ratios due to waivers/reimbursements | 0.81 | %3 | — | — | — | — | — | ||||||||||||||||||||
| Portfolio turnover rate | 215 | % | 171 | % | 161 | % | 94 | % | 97 | % | 70 | % | |||||||||||||||
1 Per share information is calculated using the average shares outstanding method.
2 Total returns are historical and assume changes in share price, reinvestment of all dividends and distributions and no sales charge. Had certain expenses not been reduced during the periods shown, total returns would have been lower. Total returns for periods less than one year are not annualized.
3 Annualized.
See Accompanying Notes to Financial Statements.
51
Credit Suisse Mid-Cap Core Fund
Financial Highlights
(For a Common Class Share of the Fund Outstanding Throughout Each Period)
| For the Six Months Ended April 30, 2009 | For the Year Ended October 31, | ||||||||||||||||||||||||||
| (unaudited) | 2008 | 2007 | 2006 | 2005 | 2004 | ||||||||||||||||||||||
| Per share data | |||||||||||||||||||||||||||
| Net asset value, beginning of period | $ | 24.95 | $ | 39.24 | $ | 33.21 | $ | 31.67 | $ | 28.04 | $ | 26.79 | |||||||||||||||
| INVESTMENT OPERATIONS | |||||||||||||||||||||||||||
| Net investment income (loss)1 | 0.19 | 0.09 | (0.07 | ) | (0.19 | ) | (0.27 | ) | (0.30 | ) | |||||||||||||||||
| Net gain (loss) on investments and futures contracts (both realized and unrealized) | (0.78 | ) | (14.38 | ) | 6.10 | 1.73 | 3.90 | 1.55 | |||||||||||||||||||
| Total from investment operations | (0.59 | ) | (14.29 | ) | 6.03 | 1.54 | 3.63 | 1.25 | |||||||||||||||||||
| LESS DIVIDENDS | |||||||||||||||||||||||||||
| Dividends from net investment income | (0.18 | ) | — | — | — | — | — | ||||||||||||||||||||
| Net asset value, end of period | $ | 24.18 | $ | 24.95 | $ | 39.24 | $ | 33.21 | $ | 31.67 | $ | 28.04 | |||||||||||||||
| Total return2 | (1.90 | )% | (36.42 | )% | 18.16 | % | 4.86 | % | 12.95 | % | 4.67 | % | |||||||||||||||
| RATIOS AND SUPPLEMENTAL DATA | |||||||||||||||||||||||||||
| Net assets, end of period (000s omitted) | $ | 74,722 | $ | 83,760 | $ | 173,327 | $ | 228,798 | $ | 290,509 | $ | 364,298 | |||||||||||||||
| Ratio of expenses to average net assets | 1.45 | %3 | 1.32 | % | 1.25 | % | 1.35 | % | 1.39 | % | 1.40 | % | |||||||||||||||
| Ratio of net investment income (loss) to average net assets | 1.75 | %3 | 0.25 | % | (0.19 | )% | (0.56 | )% | (0.87 | )% | (1.08 | )% | |||||||||||||||
| Decrease reflected in above operating expense ratios due to waivers/reimbursements | 0.49 | %3 | — | 0.00 | %4 | 0.03 | % | — | — | ||||||||||||||||||
| Portfolio turnover rate | 249 | % | 208 | % | 278 | % | 69 | % | 79 | % | 106 | % | |||||||||||||||
1 Per share information is calculated using the average shares outstanding method.
2 Total returns are historical and assume changes in share price and reinvestment of all dividends and distributions. Had certain expenses not been reduced during the periods shown, total returns would have been lower. Total returns for periods less than one year are not annualized.
3 Annualized.
4 This amount represents less than 0.01%.
See Accompanying Notes to Financial Statements.
52
Credit Suisse Mid-Cap Core Fund
Financial Highlights
(For an Advisor Class Share of the Fund Outstanding Throughout Each Period)
| For the Six Months Ended April 30, 2009 | For the Year Ended October 31, | ||||||||||||||||||||||||||
| (unaudited) | 2008 | 2007 | 2006 | 2005 | 2004 | ||||||||||||||||||||||
| Per share data | |||||||||||||||||||||||||||
| Net asset value, beginning of period | $ | 22.84 | $ | 36.09 | $ | 30.70 | $ | 29.42 | $ | 26.18 | $ | 25.14 | |||||||||||||||
| INVESTMENT OPERATIONS | |||||||||||||||||||||||||||
| Net investment income (loss)1 | 0.13 | (0.08 | ) | (0.23 | ) | (0.33 | ) | (0.40 | ) | (0.41 | ) | ||||||||||||||||
| Net gain (loss) on investments and futures contracts (both realized and unrealized) | (0.63 | ) | (13.17 | ) | 5.62 | 1.61 | 3.64 | 1.45 | |||||||||||||||||||
| Total from investment operations | (0.50 | ) | (13.25 | ) | 5.39 | 1.28 | 3.24 | 1.04 | |||||||||||||||||||
| LESS DIVIDENDS | |||||||||||||||||||||||||||
| Dividends from net investment income | (0.08 | ) | — | — | — | — | — | ||||||||||||||||||||
| Net asset value, end of period | $ | 22.26 | $ | 22.84 | $ | 36.09 | $ | 30.70 | $ | 29.42 | $ | 26.18 | |||||||||||||||
| Total return2 | (2.15 | )% | (36.71 | )% | 17.56 | % | 4.35 | % | 12.38 | % | 4.14 | % | |||||||||||||||
| RATIOS AND SUPPLEMENTAL DATA | |||||||||||||||||||||||||||
| Net assets, end of period (000s omitted) | $ | 4,215 | $ | 4,844 | $ | 10,892 | $ | 16,250 | $ | 24,851 | $ | 26,474 | |||||||||||||||
| Ratio of expenses to average net assets | 1.95 | %3 | 1.82 | % | 1.75 | % | 1.85 | % | 1.89 | % | 1.90 | % | |||||||||||||||
| Ratio of net investment income (loss) to average net assets | 1.28 | %3 | (0.25 | )% | (0.68 | )% | (1.06 | )% | (1.37 | )% | (1.58 | )% | |||||||||||||||
| Decrease reflected in above operating expense ratios due to waivers/reimbursements | 0.49 | %3 | — | 0.01 | % | 0.03 | % | — | — | ||||||||||||||||||
| Portfolio turnover rate | 249 | % | 208 | % | 278 | % | 69 | % | 79 | % | 106 | % | |||||||||||||||
1 Per share information is calculated using the average shares outstanding method.
2 Total returns are historical and assume changes in share price and reinvestment of all dividends and distributions. Had certain expenses not been reduced during the periods shown, total returns would have been lower. Total returns for periods less than one year are not annualized.
3 Annualized.
See Accompanying Notes to Financial Statements.
53
Credit Suisse Mid-Cap Core Fund
Financial Highlights
(For a Class A Share of the Fund Outstanding Throughout Each Period)
| For the Six Months Ended April 30, 2009 | For the Year Ended October 31, | ||||||||||||||||||||||||||
| (unaudited) | 2008 | 2007 | 2006 | 2005 | 2004 | ||||||||||||||||||||||
| Per share data | |||||||||||||||||||||||||||
| Net asset value, beginning of period | $ | 24.48 | $ | 38.59 | $ | 32.73 | $ | 31.29 | $ | 27.77 | $ | 26.60 | |||||||||||||||
| INVESTMENT OPERATIONS | |||||||||||||||||||||||||||
| Net investment income (loss)1 | 0.14 | 0.04 | (0.15 | ) | (0.27 | ) | (0.34 | ) | (0.38 | ) | |||||||||||||||||
| Net gain (loss) on investments and futures contracts (both realized and unrealized) | (0.64 | ) | (14.15 | ) | 6.01 | 1.71 | 3.86 | 1.55 | |||||||||||||||||||
| Total from investment operations | (0.50 | ) | (14.11 | ) | 5.86 | 1.44 | 3.52 | 1.17 | |||||||||||||||||||
| LESS DIVIDENDS | |||||||||||||||||||||||||||
| Dividends from net investment income | (0.12 | ) | — | — | — | — | — | ||||||||||||||||||||
| Net asset value, end of period | $ | 23.86 | $ | 24.48 | $ | 38.59 | $ | 32.73 | $ | 31.29 | $ | 27.77 | |||||||||||||||
| Total return2 | (2.00 | )% | (36.56 | )% | 17.90 | % | 4.60 | % | 12.68 | % | 4.40 | % | |||||||||||||||
| RATIOS AND SUPPLEMENTAL DATA | |||||||||||||||||||||||||||
| Net assets, end of period (000s omitted) | $ | 461 | $ | 399 | $ | 345 | $ | 555 | $ | 688 | $ | 567 | |||||||||||||||
| Ratio of expenses to average net assets | 1.70 | %3 | 1.54 | % | 1.50 | % | 1.60 | % | 1.64 | % | 1.65 | % | |||||||||||||||
| Ratio of net investment income (loss) to average net assets | 1.36 | %3 | 0.11 | % | (0.42 | )% | (0.81 | )% | (1.12 | )% | (1.33 | )% | |||||||||||||||
| Decrease reflected in above operating expense ratios due to waivers/reimbursements | 0.50 | %3 | — | 0.01 | % | 0.03 | % | — | — | ||||||||||||||||||
| Portfolio turnover rate | 249 | % | 208 | % | 278 | % | 69 | % | 79 | % | 106 | % | |||||||||||||||
1 Per share information is calculated using the average shares outstanding method.
2 Total returns are historical and assume changes in share price, reinvestment of all dividends and distributions and no sales charge. Had certain expenses not been reduced during the periods shown, total returns would have been lower. Total returns for periods less than one year are not annualized.
3 Annualized.
See Accompanying Notes to Financial Statements.
54
Credit Suisse Mid-Cap Core Fund
Financial Highlights
(For a Class B Share of the Fund Outstanding Throughout Each Period)
| For the Six Months Ended April 30, 2009 | For the Year Ended October 31, | For the Period Ended October 31, | |||||||||||||||||||||||||
| (unaudited) | 2008 | 2007 | 2006 | 2005 | 20041 | ||||||||||||||||||||||
| Per share data | |||||||||||||||||||||||||||
| Net asset value, beginning of period | $ | 23.63 | $ | 37.54 | $ | 32.10 | $ | 30.91 | $ | 27.64 | $ | 29.10 | |||||||||||||||
| INVESTMENT OPERATIONS | |||||||||||||||||||||||||||
| Net investment income (loss)2 | 0.03 | (0.27 | ) | (0.43 | ) | (0.50 | ) | (0.58 | ) | (0.38 | ) | ||||||||||||||||
| Net gain (loss) on investments and futures contracts (both realized and unrealized) | (0.59 | ) | (13.64 | ) | 5.87 | 1.69 | 3.85 | (1.08 | ) | ||||||||||||||||||
| Total from investment operations | (0.56 | ) | (13.91 | ) | 5.44 | 1.19 | 3.27 | (1.46 | ) | ||||||||||||||||||
| LESS DIVIDENDS | |||||||||||||||||||||||||||
| Dividends from net investment income | (0.08 | ) | — | — | — | — | — | ||||||||||||||||||||
| Net asset value, end of period | $ | 22.99 | $ | 23.63 | $ | 37.54 | $ | 32.10 | $ | 30.91 | $ | 27.64 | |||||||||||||||
| Total return3 | (2.33 | )% | (37.05 | )% | 16.95 | % | 3.85 | % | 11.83 | % | (5.02 | )% | |||||||||||||||
| RATIOS AND SUPPLEMENTAL DATA | |||||||||||||||||||||||||||
| Net assets, end of period (000s omitted) | $ | 70 | $ | 45 | $ | 124 | $ | 80 | $ | 55 | $ | 7 | |||||||||||||||
| Ratio of expenses to average net assets | 2.45 | %4 | 2.35 | % | 2.25 | % | 2.35 | % | 2.39 | % | 2.40 | %4 | |||||||||||||||
| Ratio of net investment income (loss) to average net assets | 0.31 | %4 | (0.82 | )% | (1.22 | )% | (1.56 | )% | (1.87 | )% | (2.08 | )%4 | |||||||||||||||
| Decrease reflected in above operating expense ratios due to waivers/reimbursements | 0.49 | %4 | — | 0.00 | %5 | 0.03 | % | — | — | ||||||||||||||||||
| Portfolio turnover rate | 249 | % | 208 | % | 278 | % | 69 | % | 79 | % | 106 | % | |||||||||||||||
1 For the period February 27, 2004 (inception date) through October 31, 2004.
2 Per share information is calculated using the average shares outstanding method.
3 Total returns are historical and assume changes in share price, reinvestment of all dividends and distributions and no sales charge. Had certain expenses not been reduced during the periods shown, total returns would have been lower. Total returns for periods less than one year are not annualized.
4 Annualized.
5 This amount represents less than 0.01%.
See Accompanying Notes to Financial Statements.
55
Credit Suisse Mid-Cap Core Fund
Financial Highlights
(For a Class C Share of the Fund Outstanding Throughout Each Period)
| For the Six Months Ended April 30, 2009 | For the Year Ended October 31, | For the Period Ended October 31, | |||||||||||||||||||||||||
| (unaudited) | 2008 | 2007 | 2006 | 2005 | 20041 | ||||||||||||||||||||||
| Per share data | |||||||||||||||||||||||||||
| Net asset value, beginning of period | $ | 23.67 | $ | 37.59 | $ | 32.10 | $ | 30.91 | $ | 27.67 | $ | 29.10 | |||||||||||||||
| INVESTMENT OPERATIONS | |||||||||||||||||||||||||||
| Net investment income (loss)2 | 0.08 | (0.22 | ) | (0.40 | ) | (0.51 | ) | (0.62 | ) | (0.38 | ) | ||||||||||||||||
| Net gain (loss) on investments and futures contracts (both realized and unrealized) | (0.65 | ) | (13.70 | ) | 5.89 | 1.70 | 3.86 | (1.05 | ) | ||||||||||||||||||
| Total from investment operations | (0.57 | ) | (13.92 | ) | 5.49 | 1.19 | 3.24 | (1.43 | ) | ||||||||||||||||||
| LESS DIVIDENDS | |||||||||||||||||||||||||||
| Dividends from net investment income | (0.08 | ) | — | — | — | — | — | ||||||||||||||||||||
| Net asset value, end of period | $ | 23.02 | $ | 23.67 | $ | 37.59 | $ | 32.10 | $ | 30.91 | $ | 27.67 | |||||||||||||||
| Total return3 | (2.37 | )% | (37.03 | )% | 17.10 | % | 3.85 | % | 11.71 | % | (4.91 | )% | |||||||||||||||
| RATIOS AND SUPPLEMENTAL DATA | |||||||||||||||||||||||||||
| Net assets, end of period (000s omitted) | $ | 1 | $ | 1 | $ | 1 | $ | 1 | $ | 1 | $ | 1 | |||||||||||||||
| Ratio of expenses to average net assets | 2.45 | %4 | 2.28 | % | 2.16 | % | 2.35 | % | 2.39 | % | 2.40 | %4 | |||||||||||||||
| Ratio of net investment income (loss) to average net assets | 0.76 | %4 | (0.68 | )% | (1.15 | )% | (1.56 | )% | (1.87 | )% | (2.08 | )%4 | |||||||||||||||
| Decrease reflected in above operating expense ratios due to waivers/reimbursements | 0.44 | %4 | — | 0.00 | %5 | 0.03 | % | — | — | ||||||||||||||||||
| Portfolio turnover rate | 249 | % | 208 | % | 278 | % | 69 | % | 79 | % | 106 | % | |||||||||||||||
1 For the period February 27, 2004 (inception date) through October 31, 2004.
2 Per share information is calculated using the average shares outstanding method.
3 Total returns are historical and assume changes in share price, reinvestment of all dividends and distributions and no sales charge. Had certain expenses not been reduced during the periods shown, total returns would have been lower. Total returns for periods less than one year are not annualized.
4 Annualized.
5 This amount represents less than 0.01%.
See Accompanying Notes to Financial Statements.
56
Credit Suisse Funds
Notes to Financial Statements
April 30, 2009 (unaudited)
Note 1. Organization
The Credit Suisse Funds covered in this report are Credit Suisse Large Cap Growth Fund ("Large Cap Growth") and Credit Suisse Mid-Cap Core Fund ("Mid-Cap Core"), each of which is registered under the Investment Company Act of 1940, as amended (the "1940 Act"), as a diversified open-end management investment company. Large Cap Growth was organized under the laws of the Commonwealth of Massachusetts as a business trust on January 20, 1987. Mid-Cap Core was incorporated under the laws of the State of Maryland on November 12, 1987. Investment objectives for each Fund are as follows: Large Cap Growth seeks long-term capital appreciation and Mid-Cap Core seeks maximum capital appreciation.
Large Cap Growth and Mid-Cap Core each offer five classes of shares: Common Class, Advisor Class, Class A, Class B, and Class C shares. The Funds' Common Class shares are closed to new investors, with certain exceptions as set forth in the prospectus. Each class of shares in each Fund represents an equal pro rata interest in each Fund, except that they bear different expenses, which reflect the difference in the range of services provided to them. Class A shares are sold subject to a maximum front-end sales charge of 5.75%. Class B shares are sold subject to a contingent deferred sales charge which declines from 4.00% to zero depending on the period of time the shares are held. Class C shares are sold subject to a contingent deferred sales charge of 1.00% if the shares are redeemed within the first year of purchase.
Note 2. Significant Accounting Policies
A) SECURITY VALUATION — The net asset value of each Fund is determined daily as of the close of regular trading on the New York Stock Exchange, Inc. (the "Exchange") on each day the Exchange is open for business. Equity investments are valued at market value, which is generally determined using the closing price on the exchange or market on which the security is primarily traded at the time of valuation (the "Valuation Time"). If no sales are reported, equity investments are generally valued at the most recent bid quotation as of the Valuation Time or at the lowest asked quotation in the case of a short sale of securities. Debt securities with a remaining maturity greater than 60 days are valued in accordance with the price supplied by a pricing service, which may use a matrix, formula or other objective method that takes into consideration market indices, yield curves and other specific adjustments. Debt obligations that will mature in 60 days or less are valued on the basis of amortized cost, which approximates market value, unless it is determined that using this method would not represent fair value. Investments in mutual funds are valued at the mutual fund's closing net asset value per share on the day of
57
Credit Suisse Funds
Notes to Financial Statements (continued)
April 30, 2009 (unaudited)
Note 2. Significant Accounting Policies
valuation. Securities and other assets for which market quotations are not readily available, or whose values have been materially affected by events occurring before the Fund's Valuation Time but after the close of the securities' primary markets, are valued at fair value as determined in good faith by, or under the direction of, the Board of Trustees/Directors under procedures established by the Board of Trustees/Directors. The Funds may utilize a service provided by an independent third party which has been approved by the Board of Trustees/Directors to fair value certain securities. When fair-value pricing is employed, the prices of securities used by the Funds to calculate its net asset value may differ from quoted or published prices for the same securities.
Each Fund adopted Financial Accounting Standards Board Statement of Financial Accounting Standards No. 157, Fair Value Measurements ("FAS 157"), effective November 1, 2008. In accordance with FAS 157, fair value is defined as the price that a Fund would receive upon selling an investment in a timely transaction to an independent buyer in the principal or most advantageous market of the investment. FAS 157 established a three-tier hierarchy to maximize the use of observable market data and minimize the use of unobservable inputs and to establish classification of fair value measurements for disclosure purposes. Inputs refer broadly to the assumptions that market participants would use in pricing the asset or liability, including assumptions about risk, for example, the risk inherent in a particular valuation technique used to measure fair value including such a pricing model and/or the risk inherent in the inputs to the valuation technique. I nputs may be observable or unobservable. Observable inputs are inputs that reflect the assumptions market participants would use in pricing the asset or liability developed based on market data obtained from sources independent of the reporting entity. Unobservable inputs are inputs that reflect the reporting entity's own assumptions about the assumptions market participants would use in pricing the asset or liability developed based on the best information available in the circumstances. The three-tier hierarchy of inputs is summarized in the three broad Levels listed below.
• Level 1 – quoted prices in active markets for identical investments
• Level 2 – other significant observable inputs (including quoted prices for similar investments, interest rates, prepayment speeds, credit risk, etc.)
• Level 3 – significant unobservable inputs (including a Fund's own assumptions in determining the fair value of investments)
The inputs or methodology used for valuing securities are not necessarily an indication of the risk associated with investing in those securities.
58
Credit Suisse Funds
Notes to Financial Statements (continued)
April 30, 2009 (unaudited)
Note 2. Significant Accounting Policies
The following is a summary of the inputs used as of April 30, 2009 in valuing each Fund's investments carried at value:
| Large Cap Growth | |||||||||||
| Valuation Inputs | Investments in Securities | Other Financial Instruments* | |||||||||
| Level 1 – Quoted Prices | $ | 44,748,371 | $ | — | |||||||
| Level 2 – Other Significant Observable Inputs | 757,000 | — | |||||||||
| Level 3 – Significant Unobservable Inputs | — | — | |||||||||
| Total | $ | 45,505,371 | $ | — | |||||||
| Mid-Cap Core | |||||||||||
| Valuation Inputs | Investments in Securities | Other Financial Instruments* | |||||||||
| Level 1 – Quoted Prices | $ | 79,388,950 | $ | — | |||||||
| Level 2 – Other Significant Observable Inputs | 100,000 | — | |||||||||
| Level 3 – Significant Unobservable Inputs | — | — | |||||||||
| Total | $ | 79,488,950 | $ | — | |||||||
*Other financial instruments include futures, forwards and swap contracts.
B) FOREIGN CURRENCY TRANSACTIONS — The books and records of the Funds are maintained in U.S. dollars. Transactions denominated in foreign currencies are recorded at the current prevailing exchange rates. All assets and liabilities denominated in foreign currencies are translated into U.S. dollar amounts at the current exchange rate at the end of the period. Translation gains or losses resulting from changes in the exchange rate during the reporting period and realized gains and losses on the settlement of foreign currency transactions are reported in the results of operations for the current period. The Funds do not isolate that portion of realized gains and losses on investments in equity securities which is due to changes in the foreign exchange rate from that which is due to changes in market prices of equity securities. The Funds isolate that portion of realized gains and losses on investments in debt securities which is due to changes in the foreign exchange rate from that which is due to changes in market prices of debt securities.
C) SECURITY TRANSACTIONS AND INVESTMENT INCOME — Security transactions are accounted for on a trade date basis. Interest income is recorded on the accrual basis. Dividends are recorded on the ex-dividend date. Certain expenses are class-specific expenses and vary by class. Income, expenses (excluding class-specific expenses) and realized/unrealized gains/losses are allocated proportionately to each class of shares based upon the relative net asset value of the outstanding shares of that class. The cost of investments sold is determined by use of the specific identification method for both financial reporting and income tax purposes.
59
Credit Suisse Funds
Notes to Financial Statements (continued)
April 30, 2009 (unaudited)
Note 2. Significant Accounting Policies
D) DIVIDENDS AND DISTRIBUTIONS TO SHAREHOLDERS — Dividends from net investment income and distributions of net realized capital gains, if any, are declared and paid at least annually. However, to the extent that a net realized capital gain can be reduced by a capital loss carryforward, such gain will not be distributed. Income and capital gain distributions are determined in accordance with federal income tax regulations, which may differ from accounting principles generally accepted in the United States of America ("GAAP").
E) FEDERAL INCOME TAXES — No provision is made for federal taxes as it is each Fund's intention to continue to qualify for and elect the tax treatment applicable to regulated investment companies under the Internal Revenue Code of 1986, as amended, and to make the requisite distributions to its shareholders, which will be sufficient to relieve it from federal income and excise taxes.
During June 2006, the Financial Accounting Standards Board ("FASB") issued FASB Interpretation 48 ("FIN 48" or the "Interpretation"), Accounting for Uncertainty in Income Taxes — an interpretation of FASB statement 109. The Funds have reviewed their current tax positions and have determined that no provision for income tax is required in the Funds' financial statements. The Funds' federal tax returns for the prior three fiscal years remain subject to examination by the Internal Revenue Service.
F) USE OF ESTIMATES — The preparation of financial statements in conformity with GAAP requires management to make estimates and assumptions that affect the reported amounts of assets and liabilities and disclosure of contingent assets and liabilities at the date of the financial statements and the reported amounts of income and expenses during the reporting period. Actual results could differ from these estimates.
G) SHORT-TERM INVESTMENTS — The Funds, together with other funds/portfolios advised by Credit Suisse Asset Management, LLC ("Credit Suisse"), an indirect, wholly-owned subsidiary of Credit Suisse Group AG, pool available cash into either a short-term variable rate time deposit issued by State Street Bank and Trust Company ("SSB"), the Funds' custodian, or a money market fund advised by Credit Suisse. The short-term time deposit issued by SSB is a variable rate account classified as a short-term investment.
H) FUTURES — The Funds may enter into futures contracts to the extent permitted by its investment policies and objectives. Upon entering into a futures contract, the Funds are required to deposit cash or pledge U.S. Government securities as initial margin. Subsequent payments, which are dependent on the daily fluctuations in the value of the underlying instrument, are made or received
60
Credit Suisse Funds
Notes to Financial Statements (continued)
April 30, 2009 (unaudited)
Note 2. Significant Accounting Policies
by each Fund each day (daily variation margin) and are recorded as unrealized gains or losses until the contracts are closed.
When the contracts are closed, the Funds record a realized gain or loss equal to the difference between the proceeds from (or cost of) the closing transactions and the Fund's basis in the contract. Risks of entering into futures contracts for hedging purposes include the possibility that a change in the value of the contract may not correlate with the changes in the value of the underlying instruments. In addition, the purchase of a futures contract involves the risk that the Funds could lose more than the original margin deposit and subsequent payments may be required for a futures transaction. At April 30, 2009, the Funds had no open futures contracts.
I) SECURITIES LENDING — Loans of securities are required at all times to be secured by collateral at least equal to 102% of the market value of domestic securities on loan (including any accrued interest thereon) and 105% of the market value of foreign securities on loan (including any accrued interest thereon). Cash collateral received by the Funds in connection with securities lending activity may be pooled together with cash collateral for other funds/portfolios advised by Credit Suisse and may be invested in a variety of investments, including certain Credit Suisse-advised funds, funds advised by SSB, the Funds' securities lending agent, or money market instruments. However, in the event of default or bankruptcy by the other party to the agreement, realization and/or retention of the collateral may be subject to legal proceedings.
SSB has been engaged by the Funds to act as the Funds' securities lending agent. The Funds' securities lending arrangement provides that the Funds and SSB will share the net income earned from securities lending activities. During the six months ended April 30, 2009, total earnings from the Funds' investment in cash collateral received in connection with Large Cap Growth and Mid-Cap Core's securities lending arrangements were $49 and $357, respectively, of which $2 and $2, respectively, were rebated to borrowers (brokers). The Funds retained $37 and $284 in income, respectively, from the cash collateral investment, and SSB, as lending agent, was paid $10 and $71, respectively. The Funds may also be entitled to certain minimum amounts of income from its securities lending activities. Securities lending income is accrued as earned.
61
Credit Suisse Funds
Notes to Financial Statements (continued)
April 30, 2009 (unaudited)
Note 3. Transactions with Affiliates and Related Parties
Credit Suisse serves as investment adviser to each Fund. For its investment advisory services, Credit Suisse is entitled to receive a fee from Large Cap Growth of 0.50%, and from Mid-Cap Core of 0.70%.
For the six months ended April 30, 2009, investment advisory fees earned, voluntarily waived and expenses reimbursed were as follows:
| Fund | Gross Advisory Fee | Waiver | Net Advisory Fee | Expense Reimbursement | |||||||||||||||
| Large Cap Growth | $ | 107,599 | $ | (107,599 | ) | $ | — | $ | (67,159 | ) | |||||||||
| Mid-Cap Core | 255,214 | (180,389 | ) | 74,825 | — | ||||||||||||||
Fee waivers and reimbursements are voluntary and may be discontinued by Credit Suisse at any time.
Credit Suisse Asset Management Securities, Inc. ("CSAMSI"), an affiliate of Credit Suisse, and SSB serve as co-administrators to the Funds. For its co-administrative services, CSAMSI currently receives a fee calculated at an annual rate of 0.09% of each Fund's average daily net assets. For the six months ended April 30, 2009, co-administrative services fees earned by CSAMSI were as follows:
| Fund | Co-Administration Fee | ||||||
| Large Cap Growth | $ | 19,368 | |||||
| Mid-Cap Core | 32,813 | ||||||
For its co-administrative services, SSB receives a fee, exclusive of out-of-pocket expenses, calculated in total for all the Credit Suisse funds/portfolios co-administered by SSB and allocated based upon the relative average net assets of each fund/portfolio, subject to an annual minimum fee. For the six months ended April 30, 2009, co-administrative services fees earned by SSB (including out-of-pocket expenses) were as follows:
| Fund | Co-Administration Fee | ||||||
| Large Cap Growth | $ | 28,861 | |||||
| Mid-Cap Core | 36,226 | ||||||
In addition to serving as each Fund's co-administrator, CSAMSI currently serves as distributor of each Fund's shares. Pursuant to distribution plans adopted by each Fund pursuant to Rule 12b-1 under the 1940 Act, CSAMSI receives fees for its distribution services. For the Advisor class shares of each Fund, the shareholder servicing fee is calculated at an annual rate of 0.50% of the average daily net assets. For the Class A shares of each Fund, the fee is
62
Credit Suisse Funds
Notes to Financial Statements (continued)
April 30, 2009 (unaudited)
Note 3. Transactions with Affiliates and Related Parties
calculated at an annual rate of 0.25% of the average daily net assets. For Class B and Class C shares of each Fund, the fee is calculated at an annual rate of 1.00% of average daily net assets. Common Class shares of each Fund do not bear distribution fees.
Certain brokers, dealers and financial representatives provide transfer agent related services to the Funds and receive compensation from Credit Suisse. Credit Suisse is then reimbursed by the Funds. For the six months ended April 30, 2009, the Funds reimbursed Credit Suisse the following amounts, which are included in each Fund's transfer agent expense as follows:
| Fund | Amount | ||||||
| Large Cap Growth | $ | 28,736 | |||||
| Mid-Cap Core | 91,401 | ||||||
For the six months ended April 30, 2009, CSAMSI and its affiliates advised the Funds that they retained the following amounts from commissions earned on the sale of the Funds' Class A shares:
| Fund | Amount | ||||||
| Large Cap Growth | $ | 589 | |||||
| Mid-Cap Core | 2,750 | ||||||
Merrill Corporation ("Merrill"), an affiliate of Credit Suisse, has been engaged by the Funds to provide certain financial printing and fulfillment services. For the six months ended April 30, 2009, Merrill was paid for its services by the Funds as follows:
| Fund | Amount | ||||||
| Large Cap Growth | $ | 11,155 | |||||
| Mid-Cap Core | 11,205 | ||||||
Note 4. Line of Credit
The Funds, together with other funds/portfolios advised by Credit Suisse (collectively, the "Participating Funds"), participates in a $50 million committed, unsecured line of credit facility ("Credit Facility") for temporary or emergency purposes with SSB. Under the terms of the Credit Facility, the Participating Funds pay an aggregate commitment fee on the average unused amount of the Credit Facility, which is allocated among the Participating Funds in such manner as is determined by the governing Boards of the Participating Funds. In addition, the Participating Funds pay interest on borrowings at either the Overnight Federal Funds rate or the Overnight LIBOR rate plus a spread.
63
Credit Suisse Funds
Notes to Financial Statements (continued)
April 30, 2009 (unaudited)
Note 4. Line of Credit
At April 30, 2009, and during the six months ended April 30, 2009, Mid-Cap Core Fund had no borrowings under the Credit Facility. At April 30, 2009, Large Cap Growth Fund had no borrowings under the Credit Facility. During the six months ended April 30, 2009, Large Cap Growth Fund had borrowings under the Credit Facility as follows:
| Average Daily Loan Balance | Weighted Average Interest Rate % | Maximum Daily Loan Outstanding | |||||||||
| $ | 1,020,833 | 0.646 | % | $ | 2,299,000 | ||||||
Note 5. Purchases and Sales of Securities
For the six months ended April 30, 2009, purchases and sales of investment securities (excluding short-term investments) were as follows:
| Fund | Purchases | Sales | |||||||||
| Large Cap Growth | $ | 95,240,069 | $ | 100,461,339 | |||||||
| Mid-Cap Core | 189,334,623 | 195,074,173 | |||||||||
At April 30, 2009, the identified cost for federal income tax purposes, as well as the gross unrealized appreciation from investments for those securities having an excess of value over cost, gross unrealized depreciation from investments for those securities having an excess of cost over value and the net unrealized appreciation/(depreciation) from investments were as follows:
| Fund | Identified Cost | Gross Unrealized Appreciation | Gross Unrealized Depreciation | Net Unrealized Appreciation/ (Depreciation) | |||||||||||||||
| Large Cap Growth | $ | 44,345,117 | $ | 2,601,900 | $ | (1,441,646 | ) | $ | 1,160,254 | ||||||||||
| Mid-Cap Core | 82,378,872 | 7,595,168 | (10,485,090 | ) | (2,889,922 | ) | |||||||||||||
Note 6. Capital Share Transactions
Large Cap Growth is authorized to issue an unlimited number of full and fractional shares of beneficial interest. Mid-Cap Core has four billion full and fractional shares of capital stock authorized and classified as follows: one billion as Common Class shares, one billion as Advisor Class shares, one billion
64
Credit Suisse Funds
Notes to Financial Statements (continued)
April 30, 2009 (unaudited)
Note 6. Capital Share Transactions
as Class A shares, 500 million as Class B shares and 500 million as Class C shares. Each Fund has a par value of $.001 per share. Transactions in classes of each Fund were as follows:
| Large Cap Growth | |||||||||||||||||||
| Common Class | |||||||||||||||||||
| For the Six Months Ended April 30, 2009 (unaudited) | For the Year Ended October 31, 2008 | ||||||||||||||||||
| Shares | Value | Shares | Value | ||||||||||||||||
| Shares sold | 78,471 | $ | 861,101 | 159,396 | $ | 2,774,022 | |||||||||||||
| Shares issued in reinvestment of dividends | 17,810 | 200,186 | 605 | 11,938 | |||||||||||||||
| Shares redeemed | (524,397 | ) | (5,816,135 | ) | (1,349,326 | ) | (23,359,642 | ) | |||||||||||
| Net decrease | (428,116 | ) | $ | (4,754,848 | ) | (1,189,325 | ) | $ | (20,573,682 | ) | |||||||||
| Advisor Class | |||||||||||||||||||
| For the Six Months Ended April 30, 2009 (unaudited) | For the Year Ended October 31, 2008 | ||||||||||||||||||
| Shares | Value | Shares | Value | ||||||||||||||||
| Shares sold | 3,644 | $ | 38,531 | 8,227 | $ | 134,983 | |||||||||||||
| Shares issued in reinvestment of dividends | 440 | 4,653 | — | — | |||||||||||||||
| Shares redeemed | (14,693 | ) | (160,325 | ) | (108,901 | ) | (1,889,233 | ) | |||||||||||
| Net decrease | (10,609 | ) | $ | (117,141 | ) | (100,674 | ) | $ | (1,754,250 | ) | |||||||||
| Class A | |||||||||||||||||||
| For the Six Months Ended April 30, 2009 (unaudited) | For the Year Ended October 31, 2008 | ||||||||||||||||||
| Shares | Value | Shares | Value | ||||||||||||||||
| Shares sold | 1,484 | $ | 16,077 | 11,364 | $ | 193,335 | |||||||||||||
| Shares issued in reinvestment of dividends | 170 | 1,888 | — | — | |||||||||||||||
| Shares redeemed | (6,874 | ) | (75,616 | ) | (26,555 | ) | (439,504 | ) | |||||||||||
| Net decrease | (5,220 | ) | $ | (57,651 | ) | (15,191 | ) | $ | (246,169 | ) | |||||||||
| Class B | |||||||||||||||||||
| For the Six Months Ended April 30, 2009 (unaudited) | For the Year Ended October 31, 2008 | ||||||||||||||||||
| Shares | Value | Shares | Value | ||||||||||||||||
| Shares sold | 1,581 | $ | 15,315 | 12,883 | $ | 222,538 | |||||||||||||
| Shares issued in reinvestment of dividends | 61 | 644 | — | — | |||||||||||||||
| Shares redeemed | (4,940 | ) | (47,814 | ) | (7,002 | ) | (117,048 | ) | |||||||||||
| Net increase (decrease) | (3,298 | ) | $ | (31,855 | ) | 5,881 | $ | 105,490 | |||||||||||
65
Credit Suisse Funds
Notes to Financial Statements (continued)
April 30, 2009 (unaudited)
Note 6. Capital Share Transactions
| �� | Class C | ||||||||||||||||||
| For the Six Months Ended April 30, 2009 (unaudited) | For the Year Ended October 31, 2008 | ||||||||||||||||||
| Shares | Value | Shares | Value | ||||||||||||||||
| Shares sold | 341 | $ | 3,482 | 820 | $ | 14,200 | |||||||||||||
| Shares issued in reinvestment of dividends | 37 | 380 | — | — | |||||||||||||||
| Shares redeemed | (5,282 | ) | (52,316 | ) | (2,718 | ) | (35,577 | ) | |||||||||||
| Net decrease | (4,904 | ) | $ | (48,454 | ) | (1,898 | ) | $ | (21,377 | ) | |||||||||
| Mid-Cap Core | |||||||||||||||||||
| Common Class | |||||||||||||||||||
| For the Six Months Ended April 30, 2009 (unaudited) | For the Year Ended October 31, 2008 | ||||||||||||||||||
| Shares | Value | Shares | Value | ||||||||||||||||
| Shares sold | 107,638 | $ | 2,335,080 | 180,449 | $ | 6,174,956 | |||||||||||||
| Shares issued in reinvestment of dividends | 39,283 | 870,348 | — | — | |||||||||||||||
| Shares redeemed | (414,053 | ) | (8,751,914 | ) | (1,240,754 | ) | (43,198,492 | ) | |||||||||||
| Net decrease | (267,132 | ) | $ | (5,546,486 | ) | (1,060,305 | ) | $ | (37,023,536 | ) | |||||||||
| Advisor Class | |||||||||||||||||||
| For the Six Months Ended April 30, 2009 (unaudited) | For the Year Ended October 31, 2008 | ||||||||||||||||||
| Shares | Value | Shares | Value | ||||||||||||||||
| Shares sold | 35,443 | $ | 713,413 | 47,514 | $ | 1,537,515 | |||||||||||||
| Shares issued in reinvestment of dividends | 862 | 17,209 | — | — | |||||||||||||||
| Shares redeemed | (59,076 | ) | (1,182,734 | ) | (137,153 | ) | (4,337,076 | ) | |||||||||||
| Net decrease | (22,771 | ) | $ | (452,112 | ) | (89,639 | ) | $ | (2,799,561 | ) | |||||||||
| Class A | |||||||||||||||||||
| For the Six Months Ended April 30, 2009 (unaudited) | For the Year Ended October 31, 2008 | ||||||||||||||||||
| Shares | Value | Shares | Value | ||||||||||||||||
| Shares sold | 3,870 | $ | 83,919 | 10,767 | $ | 368,349 | |||||||||||||
| Shares issued in reinvestment of dividends | 89 | 1,915 | — | — | |||||||||||||||
| Shares redeemed | (958 | ) | (19,822 | ) | (3,389 | ) | (108,554 | ) | |||||||||||
| Net increase | 3,001 | $ | 66,012 | 7,378 | $ | 259,795 | |||||||||||||
66
Credit Suisse Funds
Notes to Financial Statements (continued)
April 30, 2009 (unaudited)
Note 6. Capital Share Transactions
| Class B | |||||||||||||||||||
| For the Six Months Ended April 30, 2009 (unaudited) | For the Year Ended October 31, 2008 | ||||||||||||||||||
| Shares | Value | Shares | Value | ||||||||||||||||
| Shares sold | 1,403 | $ | 30,000 | 737 | $ | 23,555 | |||||||||||||
| Shares issued in reinvestment of dividends | 6 | 122 | — | — | |||||||||||||||
| Shares redeemed | (262 | ) | (5,897 | ) | (2,168 | ) | (74,041 | ) | |||||||||||
| Net increase (decrease) | 1,147 | $ | 24,225 | (1,431 | ) | $ | (50,486 | ) | |||||||||||
| Class C | |||||||||||||||||||
| For the Six Months Ended April 30, 2009 (unaudited) | For the Year Ended October 31, 2008 | ||||||||||||||||||
| Shares | Value | Shares | Value | ||||||||||||||||
| Shares sold | — | $ | — | — | $ | — | |||||||||||||
| Shares issued in reinvestment of dividends | — | — | — | — | |||||||||||||||
| Shares redeemed | — | — | — | — | |||||||||||||||
| Net increase (decrease) | — | $ | — | — | $ | — | |||||||||||||
On April 30, 2009, the number of shareholders that held 5% or more of the outstanding shares of each Class of each Fund was as follows:
| Number of Shareholders | Approximate Percentage of Outstanding Shares | ||||||||||
| Large Cap Growth | |||||||||||
| Common Class | 4 | 39 | % | ||||||||
| Advisor Class | 5 | 80 | % | ||||||||
| Class A | 4 | 77 | % | ||||||||
| Class B | 5 | 54 | % | ||||||||
| Class C | 5 | 92 | % | ||||||||
| Mid-Cap Core | |||||||||||
| Common Class | 4 | 56 | % | ||||||||
| Advisor Class | 1 | 85 | % | ||||||||
| Class A | 3 | 36 | % | ||||||||
| Class B | 6 | 93 | % | ||||||||
| Class C | 1 | 100 | % | ||||||||
Some of the shareholders are omnibus accounts, which hold shares on behalf of individual shareholders.
Note 7. Contingencies
In the normal course of business, the Funds may provide general indemnifications pursuant to certain contracts and organizational documents.
67
Credit Suisse Funds
Notes to Financial Statements (continued)
April 30, 2009 (unaudited)
Note 7. Contingencies
The Funds' maximum exposure under these arrangements is dependent on future claims that may be made against the Funds and, therefore, cannot be estimated; however, based on experience, the risk of loss from such claims is considered remote.
Note 8. Recent Accounting Pronouncements
In March 2008, FASB issued Statement of Financial Accounting Standards No. 161, Disclosures about Derivative Instruments and Hedging Activities ("FAS 161"), an amendment of FASB Statement No. 133. FAS 161 requires enhanced disclosures about (a) how and why an entity uses derivative instruments, (b) how derivative instruments and hedging activities are accounted for, and (c) how derivative instruments and related hedging activities affect a fund's financial position, financial performance, and cash flows. Management of the Fund does not believe the adoption of FAS 161 will materially impact the financial statement amounts, but will require additional disclosures. This will include qualitative and quantitative disclosures on derivative positions existing at period end and the effect of using der ivatives during the reporting period. FAS 161 is effective for financial statements issued for fiscal years and interim periods beginning after November 15, 2008.
68
Credit Suisse Large Cap Growth Fund
Board Approval of Advisory Agreement (unaudited)
In approving the renewal of the current Advisory Agreement, the Board of Trustees, including the Independent Trustees, at a meeting held on November 18 and 19, 2008, considered the following factors with respect to the Credit Suisse Large Cap Growth Fund (the "Fund"):
Investment Advisory Fee Rates
The Board reviewed and considered the contractual advisory fee rate of 0.50% ("Contractual Advisory Fee") in light of the extent and quality of the advisory services provided by Credit Suisse Asset Management, LLC ("Credit Suisse").
Additionally, the Board received and considered information comparing the Fund's Contractual Advisory Fee and the Fund's overall expenses with those of funds in both the relevant expense group ("Expense Group") and universe of funds ("Expense Universe") provided by Lipper Inc., an independent provider of investment company data.
Nature, Extent and Quality of the Services under the Advisory Agreement
The Board received and considered information regarding the nature, extent and quality of services provided to the Fund by Credit Suisse under the Advisory Agreement. The Board also noted information received at regular meetings throughout the year related to the services rendered by Credit Suisse. The Board reviewed background information about Credit Suisse, including its Form ADV. The Board considered the background and experience of Credit Suisse's senior management and the expertise of, and the amount of attention given to the Fund by, senior personnel of Credit Suisse. In addition, the Board reviewed the qualifications, backgrounds and responsibilities of the portfolio management team primarily responsible for the day-to-day portfolio management of the Fund and the extent of the resources devoted to research and analysis of actual and potential investments. The Board also received and considered information about the nature, extent and quality of services and fee rates offered to other Credit Suisse clients for comparable services.
Fund Performance
The Board received and considered the performance results of the Fund over time, along with comparisons both to the relevant performance group ("Performance Group") and universe of funds ("Performance Universe") for the Fund. The Board was provided with a description of the methodology used to arrive at the funds included in the Performance Group and the Performance Universe.
69
Credit Suisse Large Cap Growth Fund
Board Approval of Advisory Agreement (unaudited) (continued)
Credit Suisse Profitability
The Board received and considered a profitability analysis of Credit Suisse based on the fees payable under the Advisory Agreement for the Fund, including other relationships between the Fund on the one hand and Credit Suisse affiliates on the other. The Board received profitability information for the other funds in the Credit Suisse family of funds.
Economies of Scale
The Board considered whether economies of scale in the provision of services to the Fund were being passed along to the shareholders. Accordingly, the Board considered whether alternative fee structures (such as breakpoint fee structures) would be more appropriate or reasonable taking into consideration economies of scale or other efficiencies that might accrue from increases in the Fund's asset levels.
Other Benefits to Credit Suisse
The Board considered other benefits received by Credit Suisse and its affiliates as a result of their relationship with the Fund. Such benefits include, among others, research arrangements with brokers who execute transactions on behalf of the Fund, administrative and brokerage relationships with affiliates of Credit Suisse and benefits potentially derived from an increase in Credit Suisse's businesses as a result of its relationship with the Fund (such as the ability to market to shareholders other financial products offered by Credit Suisse and its affiliates).
The Board considered the standards applied in seeking best execution, whether and to what extent soft dollar credits are sought and how any such credits are utilized, any benefits that may be achieved by using an affiliated broker and the existence of quality controls applicable to brokerage allocation procedures. The Board also reviewed Credit Suisse's method for allocating portfolio investment opportunities among its advisory clients.
Conclusions
In selecting Credit Suisse, and approving the Advisory Agreement and the investment advisory fee under such agreement, the Board concluded that:
• The Contractual Advisory Fee was the second lowest in the Fund's Expense Group and the Board considered the fee to be reasonable.
70
Credit Suisse Large Cap Growth Fund
Board Approval of Advisory Agreement (unaudited) (continued)
• The Fund's performance was below most of its peers in the Performance Group and Performance Universe for all of the periods reviewed. The Board noted that new investment strategies and portfolio management had gone into effect in December 2006 and that it would continue to monitor steps taken by Credit Suisse to improve performance.
• Aside from performance (as discussed above), the Board was satisfied with the nature and extent of the investment advisory services provided to the Fund by Credit Suisse and that, based on dialogue with management and counsel, the services provided by Credit Suisse under the Advisory Agreement are typical of, and consistent with, those provided to similar mutual funds by other investment advisers.
• In light of the costs of providing investment management and other services to the Fund and Credit Suisse's ongoing commitment to the Fund, the profits and other ancillary benefits that Credit Suisse and its affiliates received were considered reasonable.
• Credit Suisse's profitability based on fees payable under the Advisory Agreement was reasonable in light of the nature, extent and quality of the services provided to the Fund thereunder.
• In light of the amount of the Contractual Advisory Fee and the relatively small size of the Fund, the Fund's current fee structure (without breakpoints) was considered reasonable.
No single factor reviewed by the Board was identified by the Board as the principal factor in determining whether to approve the Advisory Agreement. The Independent Trustees were advised by separate independent legal counsel throughout the process.
71
Credit Suisse Mid-Cap Core Fund
Board Approval of Advisory Agreement (unaudited)
In approving the renewal of the current Advisory Agreement, the Board of Directors, including the Independent Directors, at a meeting held on November 18 and 19, 2008, considered the following factors with respect to the Credit Suisse Mid-Cap Core Fund (the "Fund"):
Investment Advisory Fee Rates
The Board reviewed and considered the contractual advisory fee rate of 0.70% ("Contractual Advisory Fee") in light of the extent and quality of the advisory services provided by Credit Suisse Asset Management, LLC ("Credit Suisse").
Additionally, the Board received and considered information comparing the Fund's Contractual Advisory Fee and the Fund's overall expenses with those of funds in both the relevant expense group ("Expense Group") and universe of funds ("Expense Universe") provided by Lipper Inc., an independent provider of investment company data.
Nature, Extent and Quality of the Services under the Advisory Agreement
The Board received and considered information regarding the nature, extent and quality of services provided to the Fund by Credit Suisse under the Advisory Agreement. The Board also noted information received at regular meetings throughout the year related to the services rendered by Credit Suisse. The Board reviewed background information about Credit Suisse, including its Form ADV. The Board considered the background and experience of Credit Suisse's senior management and the expertise of, and the amount of attention given to the Fund by, senior personnel of Credit Suisse. In addition, the Board reviewed the qualifications, backgrounds and responsibilities of the portfolio management team primarily responsible for the day-to-day portfolio management of the Fund and the extent of the resources devoted to research and analysis of actual and potential investments. The Board also received and considered information about the nature, extent and quality of services and fee rates offered to other Credit Suisse clients for comparable services.
Fund Performance
The Board received and considered the performance results of the Fund over time, along with comparisons both to the relevant performance group ("Performance Group") and universe of funds ("Performance Universe") for the Fund. The Board was provided with a description of the methodology used to arrive at the funds included in the Performance Group and the Performance Universe.
72
Credit Suisse Mid-Cap Core Fund
Board Approval of Advisory Agreement (unaudited) (continued)
Credit Suisse Profitability
The Board received and considered a profitability analysis of Credit Suisse based on the fees payable under the Advisory Agreement for the Fund, including other relationships between the Fund on the one hand and Credit Suisse affiliates on the other. The Board received profitability information for the other funds in the Credit Suisse family of funds.
Economies of Scale
The Board considered whether economies of scale in the provision of services to the Fund were being passed along to the shareholders. Accordingly, the Board considered whether alternative fee structures (such as breakpoint fee structures) would be more appropriate or reasonable taking into consideration economies of scale or other efficiencies that might accrue from increases in the Fund's asset levels.
Other Benefits to Credit Suisse
The Board considered other benefits received by Credit Suisse and its affiliates as a result of their relationship with the Fund. Such benefits include, among others, research arrangements with brokers who execute transactions on behalf of the Fund, administrative and brokerage relationships with affiliates of Credit Suisse and benefits potentially derived from an increase in Credit Suisse's businesses as a result of its relationship with the Fund (such as the ability to market to shareholders other financial products offered by Credit Suisse and its affiliates).
The Board considered the standards applied in seeking best execution, whether and to what extent soft dollar credits are sought and how any such credits are utilized, any benefits that may be achieved by using an affiliated broker and the existence of quality controls applicable to brokerage allocation procedures. The Board also reviewed Credit Suisse's method for allocating portfolio investment opportunities among its advisory clients.
Conclusions
In selecting Credit Suisse, and approving the Advisory Agreement and the investment advisory fee under such agreement, the Board concluded that:
• The Contractual Advisory Fee was lower than the median of the Fund's Expense Group and the Board considered the fee to be reasonable.
73
Credit Suisse Mid-Cap Core Fund
Board Approval of Advisory Agreement (unaudited) (continued)
• The Fund's performance was above the median of both the Performance Group and Performance Universe for the one and two year periods, but was below the median of both the Performance Group and Performance Universe for the three, four, five and ten year periods. The Board noted the recent improvement in performance and the changes in the Fund's investment strategies and portfolio management that had gone into effect on December 1, 2006. The Board determined it would monitor steps undertaken by Credit Suisse to improve performance.
• Aside from performance (as described above), the Board was satisfied with the nature and extent of the investment advisory services provided to the Fund by Credit Suisse and that, based on dialogue with management and counsel, the services provided by Credit Suisse under the Advisory Agreement are typical of, and consistent with, those provided to similar mutual funds by other investment advisers.
• In light of the costs of providing investment management and other services to the Fund and Credit Suisse's ongoing commitment to the Fund, the profits and other ancillary benefits that Credit Suisse and its affiliates received were considered reasonable.
• Credit Suisse's profitability based on fees payable under the Advisory Agreement was reasonable in light of the nature, extent and quality of the services provided to the Fund thereunder.
• Based on the Contractual Advisory Fee, the Fund's current fee structure (without breakpoints) was considered reasonable.
No single factor reviewed by the Board was identified by the Board as the principal factor in determining whether to approve the Advisory Agreement. The Independent Directors were advised by separate independent legal counsel throughout the process.
74
Credit Suisse Funds
Notice of Privacy and Information Practices (unaudited)
At Credit Suisse, we know that you are concerned with how we protect and handle nonpublic personal information that identifies you. This notice is designed to help you understand what nonpublic personal information we collect from you and from other sources, and how we use that information in connection with your investments and investment choices that may be available to you. Except where otherwise noted, this notice is applicable only to consumers who are current or former investors, meaning individual persons whose investments are primarily for household, family or personal use ("individual investors"). Specified sections of this notice, however, also apply to other types of investors (called "institutional investors"). Where the notice applies to institutional investors, the notice expressly states so. This notice is being provided by Credit Suisse Funds, Credit Suisse Institutional Funds, and Credit Suisse Closed-End Funds. This notice applies solely to U.S. registered investment companies advised by Credit Suisse Asset Management, LLC.
Categories of information we may collect:
We may collect information about you, including nonpublic personal information, such as
• Information we receive from you on applications, forms, agreements, questionnaires, Credit Suisse websites and other websites that are part of our investment program, or in the course of establishing or maintaining a customer relationship, such as your name, address, e-mail address, Social Security number, assets, income, financial situation; and
• Information we obtain from your transactions and experiences with us, our affiliates, or others, such as your account balances or other investment information assets purchased and sold, and other parties to a transaction, where applicable.
Categories of information we disclose and parties to whom we disclose it:
• We do not disclose nonpublic personal information about our individual investors, except as permitted or required by law or regulation. Whether you are an individual investor or institutional investor, we may share the information described above with our affiliates that perform services on our behalf, and with our asset management and private banking affiliates; as well as with unaffiliated third parties that perform services on our behalf, such as our accountants, auditors, attorneys, broker-dealers, fund administrators, and other service providers.
75
Credit Suisse Funds
Notice of Privacy and Information Practices (unaudited) (continued)
• We want our investors to be informed about additional products or services. Whether you are an individual investor or an institutional investor, we may disclose information, including nonpublic personal information, regarding our transactions and experiences with you to our affiliates.
• In addition, whether you are an individual investor or an institutional investor, we reserve the right to disclose information, including nonpublic personal information, about you to any person or entity, including without limitation any governmental agency, regulatory authority or self-regulatory organization having jurisdiction over us or our affiliates, if (i) we determine in our discretion that such disclosure is necessary or advisable pursuant to or in connection with any United States federal, state or local, or non-U.S., court order (or other legal process), law, rule, regulation, or executive order or policy, including without limitation any anti-money laundering law or the USA PATRIOT Act of 2001; and (ii) such disclosure is not otherwise prohibited by law, rule, regulation, or executive order or policy.
Confidentiality and security
• To protect nonpublic personal information about individual investors, we restrict access to those employees and agents who need to know that information to provide products or services to us and to our investors. We maintain physical, electronic, and procedural safeguards to protect nonpublic personal information.
Other Disclosures
This notice is not intended to be incorporated in any offering materials, but is a statement of our current Notice of Privacy and Information Practices and may be amended from time to time. This notice is current as of May 12, 2009.
76
Credit Suisse Funds
Proxy Voting and Portfolio Holdings Information (unaudited)
Information regarding how each Fund voted proxies related to its portfolio securities during the 12 month period ended June 30 of each year, as well as the policies and procedures that each Fund uses to determine how to vote proxies relating to its portfolio securities are available:
• By calling 1-877-870-2874
• On the Funds' website, www.credit-suisse.com/us
• On the website of the Securities and Exchange Commission, www.sec.gov.
Each Fund files a complete schedule of its portfolio holdings for the first and third quarters of its fiscal year with the SEC on Form N-Q. The Funds' Forms N-Q are available on the SEC's website at www.sec.gov and may be reviewed and copied at the SEC's Public Reference Room in Washington, DC. Information on the operation of the SEC's Public Reference Room may be obtained by calling 1-202-551-8090.
77

P.O. BOX 55030, BOSTON, MA 02205-5030
877-870-2874 n www.credit-suisse.com/us
CREDIT SUISSE ASSET MANAGEMENT SECURITIES, INC., DISTRIBUTOR. USEQGTH-SAR-0409
Item 2. Code of Ethics.
This item is inapplicable to a semi-annual report on Form N-CSR.
Item 3. Audit Committee Financial Expert.
This item is inapplicable to a semi-annual report on Form N-CSR.
Item 4. Principal Accountant Fees and Services.
This item is inapplicable to a semi-annual report on Form N-CSR.
Item 5. Audit Committee of Listed Registrants.
This item is not applicable to the registrant.
Item 6. Schedule of Investments.
Included as part of the report to shareholders filed under Item 1 of this Form.
Item 7. Disclosure of Proxy Voting Policies and Procedures for Closed-End Management Investment Companies.
This item is not applicable to the registrant.
Item 8. Portfolio Managers of Closed-End Management Investment Companies.
This item is not applicable to the registrant.
Item 9. Purchases of Equity Securities by Closed-End Management Investment Company and Affiliated Purchasers.
This item is not applicable to the registrant.
Item 10. Submission of Matters to a Vote of Security Holders.
The Nominating Committee recommends Board member candidates. Shareholders of the registrant may also submit nominees that will be considered by the Committee. Recommendations should be mailed to the registrant’s Secretary, c/o Credit Suisse Asset Management, LLC, Eleven Madison Avenue, New York, NY 10010. Any submission should include at a minimum the following information: the name, age, business address, residence address and principal occupation or employment of such individual; the class, series and number of shares of the registrant that are beneficially owned by such individual; the date such shares were acquired and the investment intent of such acquisition; whether such shareholder believes such individual is, or is not, an “interested person” of the registrant (as defined in the Investment Company Act of 1940) and information regarding such individual that is sufficient, in the Committee’s discretion, to make such determination; and all other information relating to such individual that is required to be disclosed in solicitation of proxies for election of directors in an election contest (even if an election contest is not involved) or is otherwise required pursuant to the rules for proxy materials under the Securities Exchange Act of 1934.
Item 11. Controls and Procedures.
(a) As of a date within 90 days from the filing date of this report, the principal executive officer and principal financial officer concluded that the registrant’s disclosure controls and procedures (as defined in Rule 30a-3(c) under the Investment Company Act of 1940 (the “Act”)) were effective based on their evaluation of the disclosure controls and procedures required by Rule 30a-3(b) under the Act and Rules 13a-15(b) or 15d-15(b) under the Securities Exchange Act of 1934.
(b) There were no changes in registrant’s internal control over financial reporting (as defined in Rule 30a-3(d) under the Act) that occurred during the registrant’s last fiscal half-year that have materially affected, or are reasonably likely to materially affect, the registrant’s internal control over financial reporting.
Item 12. Exhibits.
(a)(1) Not applicable.
(a)(2) The certifications of the registrant as required by Rule 30a-2(a) under the Act are exhibits to this report.
(a)(3) Not applicable.
(b) The certifications of the registrant as required by Rule 30a-2(b) under the Act are an exhibit to this report.
SIGNATURES
Pursuant to the requirements of the Securities Exchange Act of 1934 and the Investment Company Act of 1940, the registrant has duly caused this report to be signed on its behalf by the undersigned, thereunto duly authorized.
CREDIT SUISSE LARGE CAP GROWTH FUND | ||
|
| |
/s/ George R. Hornig |
| |
Name: | George R. Hornig |
|
Title: | Chief Executive Officer |
|
Date: | July 6, 2009 |
|
Pursuant to the requirements of the Securities Exchange Act of 1934 and the Investment Company Act of 1940, this report has been signed below by the following persons on behalf of the registrant and in the capacities and on the dates indicated.
/s/ George R. Hornig |
| |
Name: | George R. Hornig |
|
Title: | Chief Executive Officer |
|
Date: | July 6, 2009 |
|
|
| |
|
| |
/s/ Michael A. Pignataro |
| |
Name: | Michael A. Pignataro |
|
Title: | Chief Financial Officer |
|
Date: | July 6, 2009 |
|