UNITED STATES
SECURITIES AND EXCHANGE COMMISSION
Washington, D.C. 20549
FORM N-CSR
CERTIFIED SHAREHOLDER REPORT OF REGISTERED
MANAGEMENT INVESTMENT COMPANIES
Investment Company Act file number 33-12791 & 811-5069
EquiTrust Variable Insurance Series Fund
(Exact name of registrant as specified in charter)
| 5400 University Avenue, West Des Moines IA | 50266-5997 |
| (Address of principal executive offices) | (Zip code) |
Kristi Rojohn, 5400 University Avenue, West Des Moines IA 50266-5997
(Name and address of agent for service)
Registrant’s telephone number, including area code: 515/225-5400
Date of fiscal year end: December 31, 2005
Date of reporting period: December 31, 2005
Item 1. Reports to Stockholders.

EquiTrust Variable Insurance Series Fund
Annual Report
December 31, 2005
5400 University Avenue
West Des Moines, IA 50266
1-877-860-2904
1-515-225-5586
This report is not to be distributed unless preceded or accompanied by a current prospectus.
PRESIDENT’S LETTER
Dear Shareholder:
Following a weak first half, equities generally rebounded in the second half and finished the year ended December 31, 2005 with gains. The broad-market S&P 500 Stock Composite Index (the “S&P 500”) finished the year up 4.91% after trudging through a decline of about 1% in the first six months of the year. Both the Dow Jones Industrial Average and the NASDAQ Composite overcame their losses from the first half of 2005, finishing the year with gains of 1.72% and 2.12%, respectively.
Rising interest rates negatively impacted returns across the fixed-income universe in 2005. Because of the inverse relationship between interest rates and bond values, bond values fell as market interest rates rose during the year, offsetting a significant portion of investors’ return from coupon payments. The Lehman Brothers U.S. Aggregate Index (the “Aggregate Index”) returned 2.43% for 2005, and returns within the U.S. fixed-income universe were similar.
The economy motored along through 2005, with growth of the Gross Domestic Product for the year likely running close to 3.5%. Even with the year’s significant appreciation in energy prices, inflation in 2005 was comparable to the historical average of between 3.0% and 3.5%. This encouraged the Federal Reserve Board to continue to fight inflation with its rate-raising campaign through the end of the year, but long-term interest rates reacted little to the year’s inflation numbers. Short-term rates rose considerably during the year and, as a result, there is now little spread between short-term and long-term market interest rates.
Aggregate equity valuation has improved over the past several years, particularly among large-cap issues, but it remains above-average relative to historical measures. Meanwhile, interest rates — particularly long-term rates — are still low and below average. In this environment, we continue to emphasize the importance of maintaining an appropriate asset allocation plan. The EquiTrust portfolios provide a means for our investors to gain exposure to the domestic equity and fixed income markets.
Money Market: The interest rates offered by money market funds are closely related to the target rate set by the Federal Open Market Committee (“FOMC”). The FOMC meets several times throughout the year to determine the target Federal Funds rate (the overnight lending rate between banks). The Federal Funds rate has been raised from 1.00% to 4.25% over the last thirteen meetings. Inflation, consumer spending, and unemployment numbers have been key FOMC concerns throughout 2005. The FOMC will finish the tightening cycle when economic data suggests deterioration to a more sustainable level of growth. The hurricanes of 2005, once a major economic concern, are currently viewed by the committee as not material to the long-term health of the U.S. economy. The FOMC does believe, however, that a neutral rate level is in sight. The most recent FOMC statement implies the current economic data will be critical to the upcoming rate decisions. The Federal Funds target rate is expected to be 4.50% in the first half of 2006. On December 31, 2005, the Money Market Portfolio had a 7-day yield of 4.03%.
High Grade Bond: During a year when U.S. long term rates were expected to rise and the FOMC continued the “measured” campaign of hiking the Federal Funds Rate 25 basis points at every meeting, the Lehman Brothers U.S. Treasury Index was able to produce a 2.79% total return in 2005. During the year the Treasury curve continued to flatten with the two-year Treasury yield rising 133 basis points to 4.40% while the ten-year Treasury yield rose 17 basis points to 4.39% and the thirty-year Treasury yield fell 29 basis points to 4.54%. The Lehman Brothers U.S. Fixed Rate MBS Index (35% of the Aggregate Index) had a return of 2.61% during 2005. This Index finished the year as the second worst performing component of the Aggregate Index with –37 basis points of excess return compared to duration neutral Treasuries. This poor performance was driven mainly by increases in overall interest rates and the high negative convexity that this Index had at the start of the year. The Lehman Brothers U.S. Treasury Index (25% of the Aggregate Index) had a total return of 2.79% for the year. The Lehman Brothers U.S. Investment Grade Corporate Index (19% of the Aggregate Index) was the worst performing component of the Aggregate Index with a 1.68% total return and –115 basis points of excess return. Unlike the results in 2004, lower quality issues tended to underperform during the year with the Baa quality bucket producing an excess return of –233 basis points compared to 133, 69 and 3 basis points of negative excess return for the A, Aa, and Aaa rated buckets, respectively. The Investment Grade Corporate Index had an option-adjusted spread of 90 basis points as of December 30, 2005, which was only 9 basis points higher than year-end 2004. We feel that the overall solid credit quality and the strong technicals of the investment grade credit market are fully reflected in current spread levels. The Lehman Brothers U.S. Agency Index (12% of the Aggregate Index) had a total return of 2.33% and an excess return of 13 basis points.
Given our view that the FOMC is not done raising the Federal Funds rate and the narrow level of spreads we feel it is not an appropriate time to take on more interest rate risk than the Aggregate Index.
Strategic Yield: For the year ended December 31, 2005, the Lehman Brothers U.S. High Yield Index (the “High Yield Index”) had a return of 2.74% (47 basis points excess return relative to duration neutral Treasuries) which exceeded the return of
2
1.68% (–115 basis points excess return relative to duration neutral Treasuries) produced by the U.S. Investment Grade Corporate Index, but was less than the 4.91% total return of the S&P 500. On a fundamental basis, a continued low level of defaults and fairly stable credit trends helped the high yield market outperform the investment grade corporate market. The yield on the High Yield Index increased to 8.25% from 6.76% while the option-adjusted spread rose 69 basis points to 357 basis points over the course of 2005. But returns were mixed by credit rating within the High Yield Index in 2005. Caa rated bonds were the worst performer with a .64% return while single-B rated and Ba-rated issues returned 3.53% and 2.88%, respectively.
In general, we continue to feel that the investment grade and non-investment grade corporate markets are fully valued. Because of this we may add more Government Agency issues, as well as look for attractive issues in the corporate market.
Managed: As noted above, the S&P 500 returned 4.91% on a total return basis in 2005. The Managed Portfolio trailed that just modestly with a total return of 4.53% for the period.
The Managed Portfolio holds equities, high quality fixed income securities and cash-like instruments, so its returns will generally reflect this composition. For 2005, its equity exposure modestly trailed the S&P 500, primarily due to lagging performance by the Portfolio’s holdings in the financials and materials sectors. Similar to many segments in the domestic fixed income universe, the Portfolio’s fixed income holdings declined with the rise in interest rates. The Portfolio’s cash holdings recorded a positive return for the year but still trailed the gain of the S&P 500, further impacting its performance against the benchmark.
From a value standpoint, equities remain more attractive compared to high quality fixed income issues, and so we remain more inclined to add to the Portfolio’s equity exposure than to its fixed income allocation. That said, cash instruments will likely offer competitive returns in the near-term.
Value Growth: The Value Growth Portfolio modestly outperformed the S&P 500 for 2005, with a total return of 6.41% compared to 4.91% for the benchmark.
The Portfolio outperformed the S&P 500 primarily due to higher returns in the energy and consumer discretionary sectors, but its consumer staples and industrials holdings also contributed gains for the year. Lagging returns in the Portfolio’s financials and materials holdings, however, did offset some of the positive relative performance elsewhere.
The Portfolio has a notably large-cap tilt, as during the year we increased its weighting in this segment of the equity market considerably. Aggregate valuation for the market is fair, but large-cap stocks have become appealing in the past year as these issues receded to attractive valuations from lofty levels reached during the late 1990s/early 2000s.
Blue Chip: The Blue Chip Portfolio passively tracks the direction of the large capitalization equity market and so would be expected to offer performance similar to that of the largest stocks in the domestic large-cap segment. It produced a total return of 2.29% for the year, compared to 4.91% for the S&P 500. The Portfolio lagged the broad-market S&P 500 largely because the benchmark’s smaller capitalization names drove performance for the period. Otherwise, the Portfolio’s performance compared quite favorably to that of the benchmark’s largest components. The Portfolio remains substantially invested in common stocks of large companies and is designed for those investors who prefer substantial exposure to common stocks at all times or who wish to make their own market value judgments.

Craig A. Lang
President
January 23, 2006
An investment in the Money Market Portfolio is neither insured nor guaranteed by the Federal Deposit Insurance Corporation or any other government agency. Although the Portfolio seeks to preserve the net asset value of $1.00 per share, it is possible to lose money by investing in the Portfolio.
Past performance is not a guarantee of future results.
3
MANAGEMENT’S DISCUSSION OF FUND PERFORMANCE
Comparison of Change in Value of $10,000 Investment in
the High Grade Bond Portfolio and Lehman Brothers U.S. Aggregate Index
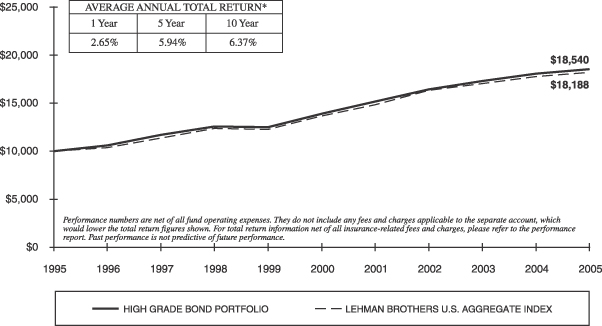
During the twelve-month period ended December 31, 2005, the High Grade Bond Portfolio outperformed the Lehman Brothers U.S. Aggregate Index (“Aggregate Index”), as reflected by the 2.65% total return produced by the Portfolio versus the 2.43% total return produced by the Index.
The total returns for the major components of the Aggregate Index for this period were as follows: U.S. Fixed Rate Mortgage Backed Securities (35% of the Index), 2.61%; U.S. Treasury Securities (25% of the Index), 2.79%; U.S. Investment Grade Corporate Securities (19% of the Index), 1.68%. In comparison, the Portfolio had approximately 41% of its assets invested in fixed rate mortgage-backed securities, 30% in corporate securities, 14% in cash equivalents, 9% in U.S. Agencies, and 6% in U.S. Treasuries. The Aggregate Index had an effective duration1 of 4.57 as of December 31, 2005. The effective duration of the Portfolio was 3.85. The Portfolio outperformed the Aggregate Index mainly because of the Portfolio’s overexposure to outperforming cash equivalents, as well as specific issues in the Portfolio which more than offset our higher exposure to underperforming fixed rate mortgage backed and corporate issues.
The composition of the Portfolio at the end of the reporting period was approximately similar to that at the start with a slight decrease in cash equivalents and a slight increase in U.S. Agencies. Going forward, we anticipate continuing to maintain a duration below that of the Index as we feel the risk of rising interest rates outweighs the possible upside from falling rates at the present time.
| 1 | Duration is a measure of interest rate risk for individual securities and portfolios. The lower the duration for a security or portfolio, the less sensitive it is to movements in interest rates. |
| * | Returns shown do not reflect the deduction of taxes that a shareholder may pay on fund distributions or the redemption of fund shares. |
4
Comparison of Change in Value of $10,000 Investment in
the Strategic Yield Portfolio and Lehman Brothers U.S. Credit/High Yield Index
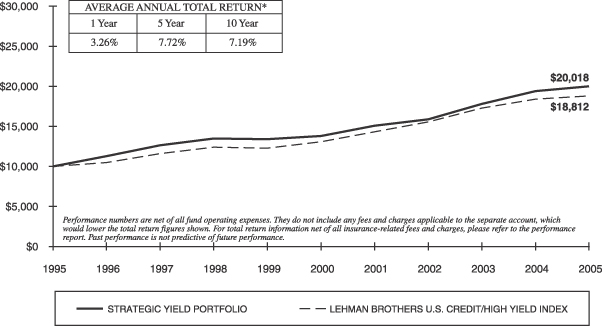
During the twelve-month period ended December 31, 2005, the 3.26% total return produced by the Strategic Yield Portfolio was greater than the 2.18% return produced by the Lehman Brothers U.S. Credit/High Yield Index. The total returns for the two components of the Lehman Brothers U.S. Credit/High Yield Index over this period were as follows: U.S. Investment Grade Credit (76% of the Index), 1.96%; and U.S. High Yield (24% of the Index), 2.74%. In comparison, the Portfolio had approximately 31% of its assets invested in corporate securities rated investment grade by both Moody’s and Standard & Poor’s, 38% of its assets invested in corporate securities rated as non-investment grade or high yield by Moody’s and/or Standard & Poor’s, 20% of its assets invested in cash equivalents and 11% in U.S. Government Agency issues. The Portfolio outperformed the overall Lehman Brothers U.S. Credit/High Yield Index due to its larger exposure to outperforming cash equivalents and the general outperformance of individual securities in the Portfolio which more than offset expenses.
The Portfolio has historically invested in a mix of high yield and investment grade issues attempting to find attractive issues in both markets.
| * | Returns shown do not reflect the deduction of taxes that a shareholder may pay on fund distributions or the redemption of fund shares. |
5
Comparison of Change in Value of $10,000 Investment in
the Managed Portfolio and S&P 500

The Managed Portfolio narrowly underperformed the S&P 500 for the twelve-month period ended December 31, 2005, with a total return of 4.53% compared to 4.91% for the Index. Given that the Portfolio holds not only equities but also fixed-income securities and cash instruments, its performance will generally differ from that of the S&P 500 from year to year. As such, the Portfolio modestly lagged the S&P 500 in 2005 primarily due to its fixed-income and cash allocations, both of which trailed the benchmark for the year; the Portfolio’s equities otherwise performed in line with the S&P 500.
Within the Portfolio’s equity allocation, we continue to emphasize high quality stocks and sectors, selecting names with a decidedly value or yield-oriented tilt. During the year, we were quite active in adding large- and mega-cap stocks such as Wal-Mart and Deere & Co., as well as adding to existing positions in Pfizer and Johnson & Johnson. We are finding that this segment of the equity market currently offers the most value, as many such stocks have traded down to historically attractive valuations from the lofty levels they reached in the late 1990s.
Because high quality fixed-income issues continue to trade near historically low yields, we remain more compelled to add to the Portfolio’s equity holdings than to its fixed-income allocation. At the same time, cash instruments will potentially offer competitive returns in the near-term.
| * | Returns shown do not reflect the deduction of taxes that a shareholder may pay on fund distributions or the redemption of fund shares. |
6
Comparison of Change in Value of $10,000 Investment in
the Value Growth Portfolio and S&P 500
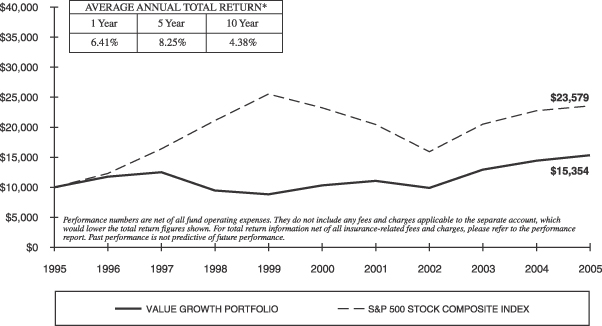
The Value Growth Portfolio outperformed the S&P 500 for the twelve-month period ended December 31, 2005; it produced a total return of 6.41% and the benchmark returned 4.91%. The Portfolio outperformed the S&P 500 primarily due to the positive relative performance of its energy and consumer discretionary holdings. Rising energy prices and energy company earnings drove energy stocks for the year and made that sector the S&P 500’s top performer. Relative to the S&P 500, the Portfolio was overweight in the energy sector much of the year, and its holdings outperformed the S&P 500’s energy constituents. The Portfolio remained underweight in the consumer discretionary sector for the year, and its holdings also performed better than did the S&P 500’s consumer discretionary stocks.
The Portfolio’s strong relative performance in these two sectors was partially offset by relative underperformance in the financials and materials sectors. It was underweight in the financials sector compared to the benchmark, and its financials holdings, in aggregate, lagged the S&P 500’s financials constituents. The Portfolio was overweight in the materials sector, and the performance of its holdings lagged that of the S&P 500’s materials sector constituents.
During 2005, we added new positions in stocks like Wal-Mart and Coca-Cola Enterprises, and also added to existing positions in Cisco and Microsoft. These and other stocks like them in the large- and mega-cap segment of the equity market currently appear to offer the most value across the aggregate equity market. Valuation has become attractive among such companies in the past five years because they have continued to grow earnings while their stock performance has actually been relatively flat. We continue to watch for opportunities to raise the Portfolio’s exposure to this segment of the equity market.
| * | Returns shown do not reflect the deduction of taxes that a shareholder may pay on fund distributions or the redemption of fund shares. |
7
Comparison of Change in Value of $10,000 Investment in
the Blue Chip Portfolio and S&P 500
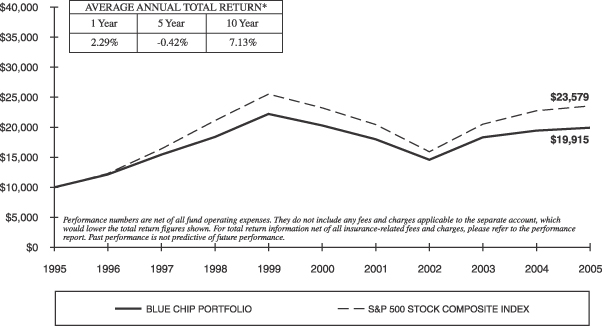
The Blue Chip Portfolio is designed to represent the large-capitalization sector of the domestic equity market, and remains substantially invested in approximately 50 such common stock issues. Given the Portfolio’s constitution, its performance will track with that of the broad-market S&P 500, but it will be most similar to that of the large-capitalization segment within the S&P 500.
The Portfolio posted a total return of 2.29% for the twelve-month period ended December 31, 2005, compared to 4.91% for the S&P 500. As has been common in the past several years, the benchmark’s smaller-capitalization components drove its overall performance for the year, while the returns from the benchmark’s largest members generally trailed those of the smaller members. Because the Portfolio holds only large-capitalization stocks, its gain approximated that of the S&P 500’s large-cap segment but trailed the S&P 500 overall.
| * | Returns shown do not reflect the deduction of taxes that a shareholder may pay on fund distributions or the redemption of fund shares. |
8
EQUITRUST VARIABLE INSURANCE SERIES FUND
December 31, 2005
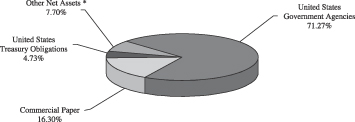
Money Market Portfolio
Portfolio Holdings by Asset Type
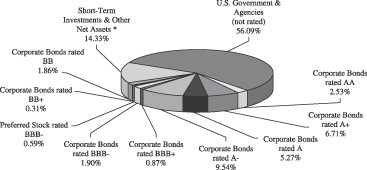
High Grade Bond Portfolio
Portfolio Holdings by Credit Quality and Type of Security**
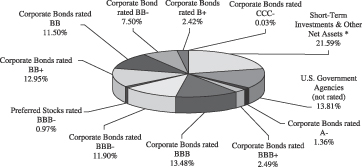
Strategic Yield Portfolio
Portfolio Holdings by Credit Quality and Type of Security**
| * | This category may include short-term investments in commercial paper, money market mutual funds and U.S. government agencies, along with cash, receivables, prepaid expenses and other assets, less liabilities. |
| ** | Credit quality as reported by Standard & Poor’s. |
9
EQUITRUST VARIABLE INSURANCE SERIES FUND
December 31, 2005
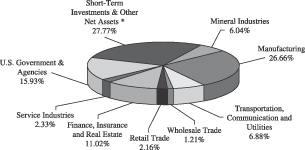
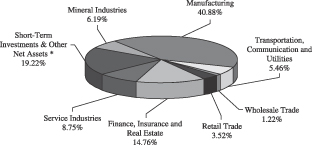
Managed Portfolio
Portfolio Holdings by Industry Sector
Value Growth Portfolio
Portfolio Holdings by Industry Sector
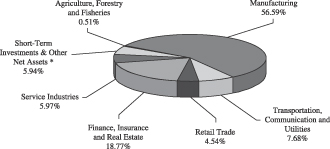
Blue Chip Portfolio
Portfolio Holdings by Industry Sector
| * | This category may include short-term investments in commercial paper, money market mutual funds and U.S. government agencies, along with cash, receivables, prepaid expenses and other assets, less liabilities. |
10
Expense Example:
As a shareholder of the Fund, you incur ongoing costs, including management fees and other Fund expenses. This Example is intended to help you understand your ongoing costs (in dollars) of investing in a given Portfolio of the Fund and to compare these costs with the ongoing costs of investing in other mutual funds. The Example is based on an investment of $1,000 invested on July 1, 2005 and held until December 31, 2005.
Actual Expenses –
The first line for each Portfolio in the table below provides information about actual account values and actual expenses for that Portfolio. You may use the information in this line, together with the amount you invested, to estimate the expenses that you paid over the period. Simply divide your account value by $1,000 (for example, an $8,600 account value divided by $1,000 = 8.6), then multiply the result by the number in the first line under the heading entitled “Expenses Paid During Period” for the same Portfolio to estimate the expenses you paid on your account during this period.
Hypothetical Example for Comparison Purposes –
The second line for each Portfolio in the table below provides information about hypothetical account values and hypothetical expenses based on the actual expense ratio of that Portfolio and an assumed rate of return of 5% per year before expenses, which is not the actual return of the Portfolio. The hypothetical account values and expenses may not be used to estimate the actual ending account balance or expenses you paid for the period. You may use this information to compare the ongoing costs of investing in a given Portfolio of the Fund with other funds. To do so, compare this 5% hypothetical example with the 5% hypothetical examples that appear in the shareholder reports of the other funds.
| Beginning Account Value 7/1/2005 | Ending Account Value 12/31/2005 | Expenses Paid During Period* 7/1/2005 - 12/31/2005 | Annualized Expense Ratio | |||||||||
Value Growth | 0.58 | % | ||||||||||
Actual | $ | 1,000 | $ | 1,034.90 | $ | 2.97 | ||||||
Hypothetical** | $ | 1,000 | $ | 1,022.08 | $ | 2.95 | ||||||
High Grade Bond | 0.45 | % | ||||||||||
Actual | $ | 1,000 | $ | 1,004.20 | $ | 2.27 | ||||||
Hypothetical** | $ | 1,000 | $ | 1,022.73 | $ | 2.29 | ||||||
Strategic Yield | 0.59 | % | ||||||||||
Actual | $ | 1,000 | $ | 1,003.70 | $ | 2.99 | ||||||
Hypothetical** | $ | 1,000 | $ | 1,022.02 | $ | 3.01 | ||||||
Managed | 0.56 | % | ||||||||||
Actual | $ | 1,000 | $ | 1,023.30 | $ | 2.85 | ||||||
Hypothetical** | $ | 1,000 | $ | 1,022.19 | $ | 2.84 | ||||||
Money Market | 0.64 | % | ||||||||||
Actual | $ | 1,000 | $ | 1,014.80 | $ | 3.26 | ||||||
Hypothetical** | $ | 1,000 | $ | 1,021.77 | $ | 3.27 | ||||||
Blue Chip | 0.31 | % | ||||||||||
Actual | $ | 1,000 | $ | 1,038.30 | $ | 1.57 | ||||||
Hypothetical** | $ | 1,000 | $ | 1,023.46 | $ | 1.55 | ||||||
| * | Expenses are equal to the Annualized Expense Ratio as shown in the table for each Portfolio, multiplied by the average account value over the period, multiplied by 183 days divided by 364 to reflect the one-half year period. |
| ** | Hypothetical examples are based on a 5% return before expenses. |
11
EQUITRUST VARIABLE INSURANCE SERIES FUND
STATEMENTS OF ASSETS AND LIABILITIES
December 31, 2005
| Value Growth Portfolio | High Grade Bond Portfolio | Strategic Yield Portfolio | Managed Portfolio | Money Market Portfolio | Blue Chip Portfolio | |||||||||||||||||
ASSETS | ||||||||||||||||||||||
Investments in securities, at value (cost — $55,221,500; $34,507,575; $35,885,521; $75,433,853; $5,803,761; and $67,314,291, respectively) | $ | 60,215,780 | $ | 34,737,480 | $ | 36,551,773 | $ | 83,302,397 | $ | 5,803,761 | $ | 82,472,065 | ||||||||||
Cash | — | — | — | — | 104,157 | — | ||||||||||||||||
Receivables: | ||||||||||||||||||||||
Accrued dividends and interest | 65,847 | 255,776 | 559,184 | 151,159 | 5,245 | 95,979 | ||||||||||||||||
Fund shares sold | 1,781 | 1,882 | 4,936 | 3,779 | 389,160 | 18,300 | ||||||||||||||||
Prepaid expense and other assets | 184 | 91 | 92 | 234 | 21 | 278 | ||||||||||||||||
Total Assets | 60,283,592 | 34,995,229 | 37,115,985 | 83,457,569 | 6,302,344 | 82,586,622 | ||||||||||||||||
LIABILITIES | ||||||||||||||||||||||
Payable for fund shares redeemed | 52,494 | 42,651 | 42,239 | 81,346 | 4,913 | 75,986 | ||||||||||||||||
Dividends payable | — | — | — | — | 3,928 | — | ||||||||||||||||
Accrued expenses | 7,727 | 6,736 | 6,404 | 8,121 | 5,873 | 9,231 | ||||||||||||||||
Total Liabilities | 60,221 | 49,387 | 48,643 | 89,467 | 14,714 | 85,217 | ||||||||||||||||
NET ASSETS | $ | 60,223,371 | $ | 34,945,842 | $ | 37,067,342 | $ | 83,368,102 | $ | 6,287,630 | $ | 82,501,405 | ||||||||||
ANALYSIS OF NET ASSETS | ||||||||||||||||||||||
Paid-in capital | $ | 55,178,471 | $ | 34,716,348 | $ | 38,660,863 | $ | 68,728,193 | $ | 6,287,630 | $ | 72,782,390 | ||||||||||
Accumulated undistributed net investment income | 836,213 | — | — | 1,836,551 | — | 1,635,261 | ||||||||||||||||
Accumulated undistributed net realized gain (loss) from investment transactions | (785,593 | ) | (411 | ) | (2,259,773 | ) | 4,934,814 | — | (7,074,020 | ) | ||||||||||||
Net unrealized appreciation of investments | 4,994,280 | 229,905 | 666,252 | 7,868,544 | — | 15,157,774 | ||||||||||||||||
NET ASSETS | $ | 60,223,371 | $ | 34,945,842 | $ | 37,067,342 | $ | 83,368,102 | $ | 6,287,630 | $ | 82,501,405 | ||||||||||
Shares issued and outstanding as of December 31, 2005 | 4,411,188 | 3,439,663 | 4,056,824 | 5,275,646 | 6,287,630 | 2,338,838 | ||||||||||||||||
NET ASSET VALUE PER SHARE | $ | 13.65 | $ | 10.16 | $ | 9.14 | $ | 15.80 | $ | 1.00 | $ | 35.27 | ||||||||||
See accompanying notes.
12
EQUITRUST VARIABLE INSURANCE SERIES FUND
STATEMENTS OF OPERATIONS
Year Ended December 31, 2005
| Value Growth Portfolio | High Grade Bond Portfolio | Strategic Yield Portfolio | Managed Portfolio | Money Market Portfolio | Blue Chip Portfolio | |||||||||||||||||
INVESTMENT INCOME | ||||||||||||||||||||||
Dividends | $ | 902,296 | $ | 15,900 | $ | 27,825 | $ | 1,080,557 | $ | — | $ | 1,705,746 | ||||||||||
Interest | 276,047 | 1,613,050 | 2,091,903 | 1,198,670 | 191,129 | 183,103 | ||||||||||||||||
Less foreign tax withholding | (1,947 | ) | — | — | (2,915 | ) | — | — | ||||||||||||||
Total Investment Income | 1,176,396 | 1,628,950 | 2,119,728 | 2,276,312 | 191,129 | 1,888,849 | ||||||||||||||||
EXPENSES | ||||||||||||||||||||||
Paid to EquiTrust Investment Management Services, Inc.: | ||||||||||||||||||||||
Investment advisory and management fees | 264,000 | 96,194 | 151,258 | 352,284 | 15,521 | 165,394 | ||||||||||||||||
Accounting fees | 29,337 | 16,032 | 16,806 | 30,000 | 3,104 | 30,000 | ||||||||||||||||
Custodial fees | 9,388 | 8,329 | 6,889 | 10,366 | 8,721 | 7,527 | ||||||||||||||||
Professional fees | 21,733 | 14,681 | 15,152 | 26,170 | 8,603 | 28,359 | ||||||||||||||||
Reports to shareholders | 6,233 | 3,375 | 3,510 | 8,208 | 722 | 8,906 | ||||||||||||||||
Trustees’ fees and expenses | 5,384 | 2,957 | 3,104 | 7,211 | 565 | 7,610 | ||||||||||||||||
Insurance and bonds | 1,392 | 727 | 744 | 1,793 | 130 | 2,043 | ||||||||||||||||
Miscellaneous | 2,716 | 1,541 | 1,630 | 3,729 | 259 | 3,749 | ||||||||||||||||
Total Expenses | 340,183 | 143,836 | 199,093 | 439,761 | 37,625 | 253,588 | ||||||||||||||||
Net Investment Income | 836,213 | 1,485,114 | 1,920,635 | 1,836,551 | 153,504 | 1,635,261 | ||||||||||||||||
NET REALIZED AND UNREALIZED GAIN (LOSS) ON INVESTMENTS | ||||||||||||||||||||||
Net realized gain (loss) from investment transactions | 5,643,255 | (411 | ) | 2,105 | 4,991,158 | — | 393 | |||||||||||||||
Change in unrealized appreciation (depreciation) of investments | (2,829,929 | ) | (636,795 | ) | (850,982 | ) | (3,285,381 | ) | — | 228,495 | ||||||||||||
Net Gain (Loss) on Investments | 2,813,326 | (637,206 | ) | (848,877 | ) | 1,705,777 | — | 228,888 | ||||||||||||||
Net Increase in Net Assets Resulting from Operations | $ | 3,649,539 | $ | 847,908 | $ | 1,071,758 | $ | 3,542,328 | $ | 153,504 | $ | 1,864,149 | ||||||||||
See accompanying notes.
13
EQUITRUST VARIABLE INSURANCE SERIES FUND
STATEMENTS OF CHANGES IN NET ASSETS
| Value Growth Portfolio | High Grade Bond Portfolio | Strategic Yield Portfolio | ||||||||||||||||||||||
| Year Ended December 31, | Year Ended December 31, | Year Ended December 31, | ||||||||||||||||||||||
| 2005 | 2004 | 2005 | 2004 | 2005 | 2004 | |||||||||||||||||||
OPERATIONS | ||||||||||||||||||||||||
Net investment income | $ | 836,213 | $ | 662,829 | $ | 1,485,114 | $ | 1,218,691 | $ | 1,920,635 | $ | 1,685,239 | ||||||||||||
Net realized gain (loss) from investment transactions | 5,643,255 | 2,173,686 | (411 | ) | 43,870 | 2,105 | 148,802 | |||||||||||||||||
Change in unrealized appreciation (depreciation) of investments | (2,829,929 | ) | 3,213,722 | (636,795 | ) | (51,531 | ) | (850,982 | ) | 581,354 | ||||||||||||||
Net Increase in Net Assets Resulting from Operations | 3,649,539 | 6,050,237 | 847,908 | 1,211,030 | 1,071,758 | 2,415,395 | ||||||||||||||||||
DIVIDENDS AND DISTRIBUTIONS TO | ||||||||||||||||||||||||
Net investment income | (665,116 | ) | (563,058 | ) | (1,485,114 | ) | (1,218,691 | ) | (1,920,635 | ) | (1,685,239 | ) | ||||||||||||
Net realized gain from investment transactions | — | — | (43,870 | ) | (70,428 | ) | — | — | ||||||||||||||||
Total Dividends and Distributions | (665,116 | ) | (563,058 | ) | (1,528,984 | ) | (1,289,119 | ) | (1,920,635 | ) | (1,685,239 | ) | ||||||||||||
CAPITAL SHARE TRANSACTIONS | (1,114,667 | ) | 54,029 | 5,647,061 | 3,398,714 | 7,278,727 | 4,408,930 | |||||||||||||||||
Total Increase (Decrease) in Net Assets | 1,869,756 | 5,541,208 | 4,965,985 | 3,320,625 | 6,429,850 | 5,139,086 | ||||||||||||||||||
NET ASSETS | ||||||||||||||||||||||||
Beginning of year | 58,353,615 | 52,812,407 | 29,979,857 | 26,659,232 | 30,637,492 | 25,498,406 | ||||||||||||||||||
End of year (including accumulated undistributed net investment income as set forth below) | $ | 60,223,371 | $ | 58,353,615 | $ | 34,945,842 | $ | 29,979,857 | $ | 37,067,342 | $ | 30,637,492 | ||||||||||||
Accumulated Undistributed Net Investment Income | $ | 836,213 | $ | 665,116 | $ | — | $ | — | $ | — | $ | — | ||||||||||||
See accompanying notes.
14
EQUITRUST VARIABLE INSURANCE SERIES FUND
STATEMENTS OF CHANGES IN NET ASSETS (continued)
| Managed Portfolio | Money Market Portfolio | Blue Chip Portfolio | ||||||||||||||||||||||
| Year Ended December 31, | Year Ended December 31, | Year Ended December 31, | ||||||||||||||||||||||
| 2005 | 2004 | 2005 | 2004 | 2005 | 2004 | |||||||||||||||||||
OPERATIONS | ||||||||||||||||||||||||
Net investment income | $ | 1,836,551 | $ | 1,297,777 | $ | 153,504 | $ | 45,967 | $ | 1,635,261 | $ | 1,621,030 | ||||||||||||
Net realized gain (loss) from investment transactions | 4,991,158 | 2,810,450 | — | — | 393 | (616,554 | ) | |||||||||||||||||
Change in unrealized appreciation (depreciation) of investments | (3,285,381 | ) | 1,790,691 | — | — | 228,495 | 3,865,719 | |||||||||||||||||
Net Increase in Net Assets Resulting from Operations | 3,542,328 | 5,898,918 | 153,504 | 45,967 | 1,864,149 | 4,870,195 | ||||||||||||||||||
DIVIDENDS AND DISTRIBUTIONS TO | ||||||||||||||||||||||||
Net investment income | (1,297,777 | ) | (1,367,844 | ) | (153,504 | ) | (45,967 | ) | (1,621,030 | ) | (1,194,008 | ) | ||||||||||||
Net realized gain from investment transactions | (1,299,691 | ) | — | — | — | — | — | |||||||||||||||||
Total Dividends and Distributions | (2,597,468 | ) | (1,367,844 | ) | (153,504 | ) | (45,967 | ) | (1,621,030 | ) | (1,194,008 | ) | ||||||||||||
CAPITAL SHARE TRANSACTIONS | 7,547,535 | 3,611,860 | (304,435 | ) | (135,487 | ) | (2,701,841 | ) | 1,451,850 | |||||||||||||||
Total Increase (Decrease) in Net Assets | 8,492,395 | 8,142,934 | (304,435 | ) | (135,487 | ) | (2,458,722 | ) | 5,128,037 | |||||||||||||||
NET ASSETS | ||||||||||||||||||||||||
Beginning of year | 74,875,707 | 66,732,773 | 6,592,065 | 6,727,552 | 84,960,127 | 79,832,090 | ||||||||||||||||||
End of year (including accumulated undistributed net investment income as set forth below) | $ | 83,368,102 | $ | 74,875,707 | $ | 6,287,630 | $ | 6,592,065 | $ | 82,501,405 | $ | 84,960,127 | ||||||||||||
Accumulated Undistributed Net Investment Income | $ | 1,836,551 | $ | 1,297,777 | $ | — | $ | — | $ | 1,635,261 | $ | 1,621,030 | ||||||||||||
See accompanying notes.
15
EQUITRUST VARIABLE INSURANCE SERIES FUND
SCHEDULE OF INVESTMENTS
VALUE GROWTH PORTFOLIO
December 31, 2005
| Shares Held | Value | ||||
COMMON STOCKS (80.78%) | |||||
APPAREL AND OTHER TEXTILE PRODUCTS (0.38%) | |||||
Jones Apparel Group, Inc. | 7,500 | $ | 230,400 | ||
AUTOMOTIVE REPAIR, SERVICES AND PARKING (0.69%) | |||||
Ryder System, Inc. | 10,100 | 414,302 | |||
BUSINESS SERVICES (4.48%) | |||||
Affiliated Computer Services, Inc.-Class A (1) | 11,400 | 674,652 | |||
Computer Associates International, Inc. | 12,174 | 343,185 | |||
Compuware Corp. (1) | 16,050 | 143,968 | |||
Electronic Data Systems Corp. | 5,745 | 138,110 | |||
First Data Corp. | 3,520 | 151,395 | |||
Microsoft Corp. | 23,105 | 604,196 | |||
Oracle Corp. (1) | 12,300 | 150,183 | |||
Symantec Corp. (1) | 28,002 | 490,035 | |||
| 2,695,724 | |||||
CHEMICALS AND ALLIED PRODUCTS (13.58%) | |||||
Abbott Laboratories | 8,000 | 315,440 | |||
Biogen Idec, Inc. (1) | 4,620 | 209,425 | |||
Bristol-Myers Squibb Co. | 18,220 | 418,696 | |||
Colgate-Palmolive Co. | 3,255 | 178,537 | |||
E.I. du Pont de Nemours & Co. | 12,555 | 533,587 | |||
GlaxoSmithKline PLC | 5,500 | 277,640 | |||
IVAX Corp. (1) | 17,000 | 532,610 | |||
Johnson & Johnson | 13,935 | 837,493 | |||
KV Pharmaceutical Co.-Class A (1) | 12,700 | 261,620 | |||
Merck & Co., Inc. | 9,764 | 310,593 | |||
Mylan Laboratories, Inc. | 20,925 | 417,663 | |||
Olin Corp. | 6,400 | 125,952 | |||
Perrigo Co. | 25,615 | 381,920 | |||
Pfizer, Inc. | 43,526 | 1,015,026 | |||
Schering-Plough Corp. | 23,200 | 483,720 | |||
Sensient Technologies Corp. | 52,575 | 941,093 | |||
SurModics, Inc. (1) | 3,637 | 134,533 | |||
Taro Pharmaceutical Industries, Ltd. (1) | 6,600 | 92,202 | |||
Teva Pharmaceutical Industries, Ltd. | 10,216 | 439,390 | |||
Wyeth | 5,835 | 268,818 | |||
| 8,175,958 | |||||
COMMUNICATIONS (2.47%) | |||||
BellSouth Corp. | 11,000 | 298,100 | |||
Comcast Corp.-Class A (1) | 12,510 | 324,760 | |||
Sprint Nextel Corp. | 25,603 | 598,086 | |||
Verizon Communications, Inc. | 8,800 | 265,056 | |||
| 1,486,002 | |||||
| Shares Held | Value | ||||
DEPOSITORY INSTITUTIONS (7.35%) | |||||
AmSouth Bancorp. | 11,630 | $ | 304,822 | ||
Bank of America Corp. | 12,204 | 563,215 | |||
Bank of New York Co., Inc. | 8,681 | 276,490 | |||
BOK Financial Corp. | 3,500 | 159,005 | |||
Citigroup, Inc. | 23,183 | 1,125,071 | |||
National City Corp. | 6,830 | 229,283 | |||
New York Community Bancorp., Inc. | 23,156 | 382,537 | |||
U. S. Bancorp. | 20,450 | 611,250 | |||
Wachovia Corp. | 7,650 | 404,379 | |||
Wilmington Trust Corp. | 9,500 | 369,645 | |||
| 4,425,697 | |||||
EATING AND DRINKING PLACES (0.38%) | |||||
Wendy’s International, Inc. | 4,200 | 232,092 | |||
ELECTRIC, GAS AND SANITARY SERVICES (2.70%) | |||||
Alliant Energy Corp. | 8,660 | 242,826 | |||
Atmos Energy Corp. | 11,267 | 294,745 | |||
Keyspan Corp. | 10,310 | 367,964 | |||
Pepco Holdings, Inc. | 16,200 | 362,394 | |||
Xcel Energy, Inc. | 19,405 | 358,216 | |||
| 1,626,145 | |||||
ELECTRONIC AND OTHER ELECTRICAL EQUIPMENT (3.04%) | |||||
Adaptec, Inc. (1) | 43,100 | 250,842 | |||
ADC Telecommunications, Inc. (1) | 18,205 | 406,700 | |||
Cisco Systems, Inc. (1) | 30,600 | 523,872 | |||
ECI Telecom, Ltd. (1) | 10,000 | 74,900 | |||
Emerson Electric Co. | 2,300 | 171,810 | |||
Helen of Troy, Ltd. (1) | 8,966 | 144,442 | |||
Intel Corp. | 8,900 | 222,144 | |||
JDS Uniphase Corp. (1) | 16,400 | 38,704 | |||
| 1,833,414 | |||||
FOOD AND KINDRED PRODUCTS (3.34%) | |||||
Anheuser-Busch Cos., Inc. | 6,395 | 274,729 | |||
Coca-Cola Co. | 6,680 | 269,271 | |||
Coca-Cola Enterprises, Inc. | 17,485 | 335,187 | |||
ConAgra Foods, Inc. | 24,000 | 486,720 | |||
General Mills, Inc. | 4,110 | 202,705 | |||
Sara Lee Corp. | 23,400 | 442,260 | |||
| 2,010,872 | |||||
FOOD STORES (0.61%) | |||||
Kroger Co. (1) | 19,526 | 368,651 | |||
GENERAL MERCHANDISE STORES (2.53%) | |||||
Federated Department Stores, Inc. | 3,008 | 199,521 | |||
Fred’s, Inc. | 35,165 | 572,135 | |||
Target Corp. | 5,300 | 291,341 | |||
Wal-Mart Stores, Inc. | 9,835 | 460,278 | |||
| 1,523,275 | |||||
16
EQUITRUST VARIABLE INSURANCE SERIES FUND
SCHEDULE OF INVESTMENTS
VALUE GROWTH PORTFOLIO (continued)
| Shares Held | Value | ||||
HEALTH SERVICES (2.86%) | |||||
Health Management Associates, Inc. | 12,800 | $ | 281,088 | ||
Laboratory Corp. of America Holdings (1) | 10,660 | 574,041 | |||
Lifepoint Hospitals, Inc. (1) | 11,463 | 429,863 | |||
Universal Health Services, Inc.-Class B | 9,420 | 440,291 | |||
| 1,725,283 | |||||
HOLDING AND OTHER INVESTMENT OFFICES (0.46%) | |||||
Highwoods Properties, Inc. | 9,750 | 277,387 | |||
INDUSTRIAL MACHINERY AND EQUIPMENT (4.11%) | |||||
3M Co. | 4,220 | 327,050 | |||
Deere & Co. | 3,990 | 271,759 | |||
EMC Corp. (1) | 22,500 | 306,450 | |||
Hewlett-Packard Co. | 6,000 | 171,780 | |||
Ingersoll-Rand Co., Ltd.-Class A | 19,900 | 803,363 | |||
Solectron Corp. (1) | 22,500 | 82,350 | |||
SPX Corp. | 6,373 | 291,692 | |||
Stanley Works (The) | 4,600 | 220,984 | |||
| 2,475,428 | |||||
INSTRUMENTS AND RELATED PRODUCTS (3.81%) | |||||
Agilent Technologies, Inc. (1) | 7,000 | 233,030 | |||
Becton Dickinson & Co. | 13,226 | 794,618 | |||
Boston Scientific Corp. (1) | 4,770 | 116,817 | |||
Fisher Scientific International, Inc. (1) | 8,176 | 505,767 | |||
Medtronic, Inc. | 6,300 | 362,691 | |||
Perkinelmer, Inc. | 11,900 | 280,364 | |||
| 2,293,287 | |||||
INSURANCE CARRIERS (4.62%) | |||||
Allstate Corp. | 8,095 | 437,697 | |||
American International Group, Inc. | 9,740 | 664,560 | |||
MBIA, Inc. | 6,640 | 399,462 | |||
MetLife, Inc. | 3,795 | 185,955 | |||
Protective Life Corp. | 9,300 | 407,061 | |||
Safeco Corp. | 6,240 | 352,560 | |||
WellPoint, Inc. (1) | 4,222 | 336,873 | |||
| 2,784,168 | |||||
METAL MINING (1.75%) | |||||
Barrick Gold Corp. | 20,000 | 557,400 | |||
Placer Dome, Inc. | 21,600 | 495,288 | |||
| 1,052,688 | |||||
MISCELLANEOUS MANUFACTURING INDUSTRIES (0.43%) | |||||
Hasbro, Inc. | 12,900 | 260,322 | |||
MOTION PICTURES (0.72%) | |||||
News Corp.-Class A | 17,040 | 264,972 | |||
Time Warner, Inc. | 9,600 | 167,424 | |||
| 432,396 | |||||
| Shares Held | Value | ||||
NONDEPOSITORY INSTITUTIONS (0.53%) | |||||
Federal Home Loan Mortgage Corp. | 4,900 | $ | 320,215 | ||
OIL AND GAS EXTRACTION (4.44%) | |||||
Apache Corp. | 5,200 | 356,304 | |||
Burlington Resources, Inc. | 15,480 | 1,334,376 | |||
Occidental Petroleum Co. | 4,750 | 379,430 | |||
Rowan Cos., Inc. | 16,900 | 602,316 | |||
| 2,672,426 | |||||
PAPER AND ALLIED PRODUCTS (2.14%) | |||||
Abitibi Consolidated, Inc. | 92,600 | 375,030 | |||
Bemis Co., Inc. | 10,865 | 302,699 | |||
International Paper Co. | 8,700 | 292,407 | |||
Kimberly-Clark Corp. | 2,610 | 155,687 | |||
Sonoco Products Co. | 5,500 | 161,700 | |||
| 1,287,523 | |||||
PETROLEUM AND COAL PRODUCTS (4.43%) | |||||
BP PLC | 6,000 | 385,320 | |||
Chevron Corp. | 14,100 | 800,457 | |||
ConocoPhillips | 25,466 | 1,481,612 | |||
| 2,667,389 | |||||
PRIMARY METAL INDUSTRIES (0.81%) | |||||
Northwest Pipe Co. (1) | 18,215 | 488,162 | |||
PRINTING AND PUBLISHING (1.26%) | |||||
Belo Corp.-Series A | 14,835 | 317,617 | |||
R.R. Donnelley & Sons Co. | 8,110 | 277,443 | |||
Tribune Co. | 5,450 | 164,917 | |||
| 759,977 | |||||
RAILROAD TRANSPORTATION (0.29%) | |||||
Union Pacific Corp. | 2,155 | 173,499 | |||
TOBACCO PRODUCTS (1.05%) | |||||
Altria Group, Inc. | 8,460 | 632,131 | |||
TRANSPORTATION EQUIPMENT (2.50%) | |||||
Federal Signal Corp. | 13,300 | 199,633 | |||
Honeywell International, Inc. | 23,500 | 875,375 | |||
ITT Industries, Inc. | 4,185 | 430,302 | |||
| 1,505,310 | |||||
WHOLESALE TRADE — NONDURABLE GOODS (1.22%) | |||||
Dean Foods Co. (1) | 7,701 | 290,020 | |||
Safeway, Inc. | 18,720 | 442,915 | |||
| 732,935 | |||||
MISCELLANEOUS EQUITIES (1.80%) | |||||
H & Q Life Sciences Investors | 27,671 | 433,324 | |||
NASDAQ-100 Trust | 16,100 | 650,762 | |||
| 1,084,086 | |||||
Total Common Stocks | 48,647,144 | ||||
17
EQUITRUST VARIABLE INSURANCE SERIES FUND
SCHEDULE OF INVESTMENTS
VALUE GROWTH PORTFOLIO (continued)
| Shares Held | Value | |||||
SHORT-TERM INVESTMENTS (19.21%) | ||||||
MONEY MARKET MUTUAL FUND (0.23%) | ||||||
JP Morgan U.S. Treasury Plus Money Market Fund | 138,615 | $ | 138,615 | |||
| Principal Amount | ||||||
COMMERCIAL PAPER (5.98%) | ||||||
DEPOSITORY INSTITUTIONS (1.83%) | ||||||
Citigroup CP, | $ | 1,100,000 | 1,100,000 | |||
NONDEPOSITORY INSTITUTIONS (4.15%) | ||||||
American Express Credit Corp., | 1,000,000 | 1,000,000 | ||||
American General Finance Corp., | 1,000,000 | 1,000,000 | ||||
General Electric Capital Corp., | 500,000 | 500,000 | ||||
| 2,500,000 | ||||||
Total Commercial Paper | 3,600,000 | |||||
UNITED STATES GOVERNMENT AGENCIES (13.00%) | ||||||
Federal Home Loan Bank, | 800,000 | 799,014 | ||||
Federal Home Loan Bank, | 1,100,000 | 1,098,387 | ||||
Federal Home Loan Bank, | 2,300,000 | 2,294,784 | ||||
Federal Home Loan Bank, | 600,000 | 598,276 | ||||
Federal Home Loan Bank, | 1,000,000 | 996,293 | ||||
Federal National Mortgage Assoc., | 950,000 | 948,137 | ||||
Federal National Mortgage Assoc., | 1,100,000 | 1,095,130 | ||||
Total United States | 7,830,021 | |||||
Total Short-Term Investments | 11,568,636 | |||||
Total Investments (99.99%) | 60,215,780 | |||||
| Principal Amount | Value | ||||
OTHER ASSETS LESS LIABILITIES (0.01%) | |||||
Cash, receivables, prepaid expense and other assets, less liabilities | $ | 7,591 | |||
Total Net Assets (100.00%) | $ | 60,223,371 | |||
| (1) | Non-income producing securities. |
See accompanying notes.
18
EQUITRUST VARIABLE INSURANCE SERIES FUND
SCHEDULE OF INVESTMENTS
HIGH GRADE BOND PORTFOLIO
December 31, 2005
| Shares Held | Value | |||||
PREFERRED STOCKS (0.59%) | ||||||
HOLDING AND OTHER INVESTMENT OFFICES | ||||||
New Plan Excel Realty | 4,000 | $ | 205,500 | |||
| Principal Amount | ||||||
CORPORATE BONDS (28.99%) | ||||||
DEPOSITORY INSTITUTIONS (2.18%) | ||||||
Washington Mutual Bank, | $ | 750,000 | 760,830 | |||
ELECTRIC, GAS AND SANITARY SERVICES (5.34%) | ||||||
Maritime & NE Pipeline, 144A, | 700,000 | 801,017 | ||||
Oglethorpe Power Corp., | 235,000 | 244,661 | ||||
PacifiCorp, 6.90%, due 11/15/11 | 750,000 | 820,065 | ||||
| 1,865,743 | ||||||
FOOD STORES (1.86%) | ||||||
Ahold Finance USA, Inc., | 600,000 | 648,750 | ||||
FOOD AND KINDRED PRODUCTS (2.80%) | ||||||
Diageo Capital PLC, | 1,000,000 | 977,630 | ||||
HOLDING AND OTHER INVESTMENT OFFICES (1.90%) | ||||||
Security Capital Pacific, | 275,000 | 302,893 | ||||
Washington REIT, | 350,000 | 363,097 | ||||
| 665,990 | ||||||
INSURANCE CARRIERS (2.53%) | ||||||
SunAmerica, 8.125%, due 04/28/23 | 700,000 | 885,388 | ||||
SECURITY AND COMMODITY BROKERS (6.07%) | ||||||
Goldman Sachs Group, Inc., | 900,000 | 892,944 | ||||
Morgan Stanley-Series MTNC, | 1,300,000 | 1,227,980 | ||||
| 2,120,924 | ||||||
TOBACCO PRODUCTS (2.28%) | ||||||
UST, Inc., 7.25%, due 06/01/09 | 750,000 | 797,483 | ||||
TRANSPORTATION — BY AIR (3.72%) | ||||||
Continental Airlines, Inc., | 411,530 | 411,509 | ||||
| Principal Amount | Value | |||||
Federal Express, 7.50%, due 01/15/18 | $ | 198,226 | $ | 222,764 | ||
Northwest Airlines-Series 1999-2A, 7.575%, due 03/01/19 (2) | 662,789 | 664,413 | ||||
| 1,298,686 | ||||||
TRANSPORTATION EQUIPMENT (0.31%) | ||||||
Ford Motor Co., | 150,000 | 109,125 | ||||
Total Corporate Bonds | 10,130,549 | |||||
MORTGAGE-BACKED SECURITIES (29.99%) | ||||||
FEDERAL NATIONAL MORTGAGE ASSOCIATION (FNMA) (0.00%) | ||||||
Pool # 50276, 9.50%, due 02/01/20 | 1,022 | 1,131 | ||||
GOVERNMENT NATIONAL MORTGAGE ASSOCIATION (GNMA) (29.99%) | ||||||
Pool # 1512, 7.50%, due 12/20/23 | 28,019 | 29,532 | ||||
Pool # 2631, 7.00%, due 08/01/28 | 33,656 | 35,150 | ||||
Pool # 2658, 6.50%, due 10/01/28 | 59,069 | 61,444 | ||||
Pool # 2701, 6.50%, due 01/20/29 | 69,626 | 72,381 | ||||
Pool # 2796, 7.00%, due 08/01/29 | 57,488 | 60,009 | ||||
Pool # 3039, 6.50%, due 02/01/31 | 24,675 | 25,621 | ||||
Pool # 3040, 7.00%, due 02/01/31 | 41,555 | 43,356 | ||||
Pool # 3188, 6.50%, due 02/20/32 | 144,228 | 149,717 | ||||
Pool # 3239, 6.50%, due 05/01/32 | 130,331 | 135,290 | ||||
Pool # 3261, 6.50%, due 07/20/32 | 254,565 | 264,253 | ||||
Pool # 3320, 5.50%, due 12/01/32 | 946,688 | 952,174 | ||||
Pool # 3333, 5.50%, due 01/01/33 | 777,887 | 782,300 | ||||
Pool # 3375, 5.50%, due 04/01/33 | 120,172 | 120,853 | ||||
Pool # 3390, 5.50%, due 05/01/33 | 532,347 | 535,368 | ||||
Pool # 3403, 5.50%, due 06/01/33 | 901,364 | 906,478 | ||||
Pool # 3458, 5.00%, due 10/01/33 | 720,844 | 709,705 | ||||
Pool # 3499, 5.00%, due 01/01/34 | 1,133,204 | 1,115,419 | ||||
Pool # 3556, 5.50%, due 05/01/34 | 1,191,062 | 1,196,641 | ||||
Pool # 3623, 5.00%, due 10/01/34 | 1,750,254 | 1,722,785 | ||||
Pool # 22630, 6.50%, due 08/01/28 | 32,310 | 33,610 | ||||
Pool # 276337, 10.00%, due 08/15/19 | 6,101 | 6,820 | ||||
Pool # 643816, 6.00%, due 07/01/25 | 1,483,094 | 1,522,189 | ||||
| 10,481,095 | ||||||
Total Mortgage-Backed Securities | 10,482,226 | |||||
UNITED STATES GOVERNMENT AGENCIES (20.42%) | ||||||
Federal Home Loan Bank, | 1,000,000 | 991,136 | ||||
Federal Home Loan Mortgage Corp., | 1,000,000 | 963,460 | ||||
Federal Home Loan Mortgage Corp., | 1,000,000 | 997,780 | ||||
19
EQUITRUST VARIABLE INSURANCE SERIES FUND
SCHEDULE OF INVESTMENTS
HIGH GRADE BOND PORTFOLIO (continued)
| Principal Amount | Value | |||||
UNITED STATES GOVERNMENT | ||||||
Federal Home Loan Mortgage Corp., | $ | 1,938,419 | $ | 1,916,862 | ||
Federal National Mortgage Assoc., | 1,000,000 | 993,165 | ||||
Federal National Mortgage Assoc., | 300,000 | 299,581 | ||||
Government National Mortgage Assoc., 5.00%, due 05/01/30 | 1,000,000 | 974,597 | ||||
Total United States | 7,136,581 | |||||
UNITED STATES TREASURY OBLIGATION (5.68%) | ||||||
U.S. Treasury Note, 2.50%, due 05/31/06 | 2,000,000 | 1,985,460 | ||||
SHORT-TERM INVESTMENTS (13.73%) | ||||||
COMMERCIAL PAPER (4.58%) | ||||||
NONDEPOSITORY INSTITUTIONS | ||||||
American Express Credit Corp., | 450,000 | 450,000 | ||||
American General Finance Corp., | 750,000 | 750,000 | ||||
General Electric Capital Corp., | 400,000 | 400,000 | ||||
Total Commercial Paper | 1,600,000 | |||||
UNITED STATES GOVERNMENT AGENCIES (8.34%) | ||||||
Federal Home Loan Mortgage Corp., | 625,000 | 622,671 | ||||
Federal National Mortgage Assoc., | 400,000 | 399,591 | ||||
Federal National Mortgage Assoc., | 350,000 | 349,323 | ||||
Federal National Mortgage Assoc., | 450,000 | 448,636 | ||||
Federal National Mortgage Assoc., | 1,100,000 | 1,095,129 | ||||
Total United States | 2,915,350 | |||||
| Shares Held | Value | ||||
MONEY MARKET MUTUAL FUND (0.81%) | |||||
JPMorgan U.S. Treasury Plus Money Market Fund | 281,814 | $ | 281,814 | ||
Total Short-Term Investments | 4,797,164 | ||||
Total Investments (99.40%) | 34,737,480 | ||||
OTHER ASSETS LESS LIABILITIES (0.60%) | |||||
Cash, receivables, prepaid expense and other assets, less liabilities | 208,362 | ||||
Total Net Assets (100.00%) | $ | 34,945,842 | |||
| (1) | Each unit was purchased at 104.481 on 04/20/01. As of 12/31/05, the carrying value of each unit was 114.431, representing $801,017 or 2.29% of total net assets. |
| (2) | The company filed for bankruptcy protection on 09/15/05. Interest payments are current at 12/31/05. |
See accompanying notes.
20
EQUITRUST VARIABLE INSURANCE SERIES FUND
SCHEDULE OF INVESTMENTS
STRATEGIC YIELD PORTFOLIO
December 31, 2005
| Shares Held | Value | |||||
PREFERRED STOCKS (0.97%) | ||||||
HOLDING AND OTHER INVESTMENT OFFICES | ||||||
New Plan Excel Realty Trust- | 7,000 | $ | 359,625 | |||
| Principal Amount | ||||||
CORPORATE BONDS (63.63%) | ||||||
APPAREL AND ACCESSORY STORES (4.02%) | ||||||
Woolworth (FW) Corp., | $ | 1,400,000 | 1,491,000 | |||
CHEMICALS AND ALLIED PRODUCTS (4.65%) | ||||||
Lyondell Chemical Co., | 900,000 | 943,875 | ||||
Nova Chemicals, Ltd., | 800,000 | 780,000 | ||||
| 1,723,875 | ||||||
COMMUNICATIONS (1.36%) | ||||||
Telephone & Data Systems, Inc., | 500,000 | 503,975 | ||||
ELECTRIC, GAS AND SANITARY SERVICES (9.29%) | ||||||
Alliant Energy Resources, Inc., | 1,000,000 | 1,253,690 | ||||
ESI Tractebel, 7.99%, due 12/30/11 | 285,000 | 300,546 | ||||
Indianapolis Power & Light Co., | 750,000 | 772,680 | ||||
Semco Energy, Inc., | 900,000 | 915,750 | ||||
Waterford 3 Nuclear Power Plant, | 193,776 | 201,085 | ||||
| 3,443,751 | ||||||
GENERAL MERCHANDISE STORES (0.03%) | ||||||
DR Structured Finance, | 115,462 | 11,546 | ||||
HOLDING AND OTHER INVESTMENT OFFICES (16.25%) | ||||||
Bradley Operating LP, | 450,000 | 463,194 | ||||
Federal Realty Investment Trust, | 600,000 | 634,723 | ||||
First Industrial LP, | 700,000 | 785,575 | ||||
First Industrial LP, | 500,000 | 574,450 | ||||
HRPT Properties, | 375,000 | 392,831 | ||||
| Principal Amount | Value | |||||
iStar Financial, Inc., | $ | 300,000 | $ | 311,730 | ||
iStar Financial, Inc.-Series B, | 1,171,000 | 1,160,766 | ||||
Price Development Co., | 337,500 | 344,507 | ||||
Spieker Properties LP, | 1,200,000 | 1,355,028 | ||||
| 6,022,804 | ||||||
INSURANCE CARRIERS (4.67%) | ||||||
Markel Capital Trust, | 1,000,000 | 1,065,180 | ||||
PXRE Capital Trust, | 670,000 | 664,975 | ||||
| 1,730,155 | ||||||
MOTION PICTURES (2.49%) | ||||||
Time Warner, Inc., | 800,000 | 922,536 | ||||
PAPER AND ALLIED PRODUCTS (7.81%) | ||||||
Bowater, Inc., 9.375%, due 12/15/21 | 900,000 | 895,500 | ||||
Cascades, Inc., 7.25%, due 02/15/13 | 1,000,000 | 920,000 | ||||
Potlatch Corp., 13.00%, due 12/01/09 | 900,000 | 1,077,750 | ||||
| 2,893,250 | ||||||
TRANSPORTATION — BY AIR (3.64%) | ||||||
Continental Airlines, Inc., | 1,234,985 | 1,154,217 | ||||
Northwest Airlines-Series 1999-2A, | 194,694 | 195,171 | ||||
| 1,349,388 | ||||||
WATER TRANSPORTATION (5.90%) | ||||||
Overseas Shipholding Group, Inc., 8.75%, due 12/01/13 | 1,100,000 | 1,210,000 | ||||
Windsor Petroleum Transportation, 144A, 7.84%, due 01/15/21 (3) | 1,000,000 | 976,680 | ||||
| 2,186,680 | ||||||
WHOLESALE TRADE — NONDURABLE GOODS (3.52%) | ||||||
Safeway, Inc., 7.45%, due 09/15/27 | 1,200,000 | 1,305,852 | ||||
Total Corporate Bonds | 23,584,812 | |||||
UNITED STATES GOVERNMENT AGENCIES (13.81%) | ||||||
Federal Home Loan Bank, | 1,000,000 | 991,136 | ||||
Federal Home Loan Mortgage Corp., | 1,000,000 | 997,780 | ||||
Federal Home Loan Mortgage Corp., | 1,453,814 | 1,437,646 | ||||
21
EQUITRUST VARIABLE INSURANCE SERIES FUND
SCHEDULE OF INVESTMENTS
STRATEGIC YIELD PORTFOLIO (continued)
| Principal Amount | Value | |||||
UNITED STATES GOVERNMENT | ||||||
Federal National Mortgage Assoc., | $ | 1,000,000 | $ | 993,165 | ||
Federal National Mortgage Assoc., | 700,000 | 699,022 | ||||
Total United States | 5,118,749 | |||||
SHORT-TERM INVESTMENTS (20.20%) | ||||||
COMMERCIAL PAPER (3.91%) | ||||||
DEPOSITORY INSTITUTIONS (3.24%) | ||||||
Citigroup CP, 4.26%, due 01/17/06 | 1,200,000 | 1,200,000 | ||||
NONDEPOSITORY INSTITUTIONS (0.67%) | ||||||
American General Finance Corp., | 250,000 | 250,000 | ||||
Total Commercial Paper | 1,450,000 | |||||
UNITED STATES GOVERNMENT AGENCIES (15.48%) | ||||||
Federal Home Loan Bank, | 700,000 | 699,106 | ||||
Federal Home Loan Bank, | 400,000 | 398,845 | ||||
Federal Home Loan Mortgage Corp., | 1,000,000 | 999,656 | ||||
Federal National Mortgage Assoc., | 1,850,000 | 1,848,123 | ||||
Federal National Mortgage Assoc., | 300,000 | 299,420 | ||||
Federal National Mortgage Assoc., | 400,000 | 398,505 | ||||
Federal National Mortgage Assoc., | 1,100,000 | 1,095,129 | ||||
Total United States | 5,738,784 | |||||
| Shares Held | Value | ||||
MONEY MARKET MUTUAL FUND (0.81%) | |||||
JPMorgan U.S. Treasury Plus Money Market Fund | 299,803 | $ | 299,803 | ||
Total Short-Term Investments | 7,488,587 | ||||
Total Investments (98.61%) | 36,551,773 | ||||
OTHER ASSETS LESS LIABILITIES (1.39%) | |||||
Cash, receivables, prepaid expense and other assets, less liabilities | 515,569 | ||||
Total Net Assets (100.00%) | $ | 37,067,342 | |||
| (1) | This security is past due. Partial or no interest was received from this security on its last scheduled interest payment date. |
| (2) | The company filed for bankruptcy protection on 09/15/05. Interest payments are current at 12/31/05. |
| (3) | Each unit was purchased at 80.500 on 08/26/99. As of 12/31/05, the carrying value of each unit was 97.668, representing $976,680 or 2.63% of net assets. |
See accompanying notes.
22
EQUITRUST VARIABLE INSURANCE SERIES FUND
SCHEDULE OF INVESTMENTS
MANAGED PORTFOLIO
December 31, 2005
| Shares Held | Value | ||||
COMMON STOCKS (56.30%) | |||||
APPAREL AND OTHER TEXTILE PRODUCTS (0.35%) | |||||
Jones Apparel Group, Inc. | 9,600 | $ | 294,912 | ||
AUTOMOTIVE REPAIR, SERVICES AND PARKING (0.65%) | |||||
Ryder System, Inc. | 13,300 | 545,566 | |||
BUSINESS SERVICES (0.49%) | |||||
Affiliated Computer Services, Inc. (1) | 3,800 | 224,884 | |||
Electronic Data Systems Corp. | 7,500 | 180,300 | |||
| 405,184 | |||||
CHEMICALS AND ALLIED PRODUCTS (9.59%) | |||||
Bristol-Myers Squibb Co. | 19,605 | 450,523 | |||
Colgate-Palmolive Co. | 4,230 | 232,015 | |||
E.I. du Pont de Nemours & Co. | 16,475 | 700,187 | |||
GlaxoSmithKline PLC | 4,700 | 237,256 | |||
IVAX Corp. (1) | 21,375 | 669,679 | |||
Johnson & Johnson | 18,997 | 1,141,720 | |||
KV Pharmaceutical Co.-Class A (1) | 12,600 | 259,560 | |||
Merck & Co., Inc. | 15,158 | 482,176 | |||
Mylan Laboratories, Inc. | 24,375 | 486,525 | |||
Olin Corp. | 17,100 | 336,528 | |||
Pfizer, Inc. | 57,854 | 1,349,155 | |||
Schering-Plough Corp. | 15,700 | 327,345 | |||
Sensient Technologies Corp. | 69,045 | 1,235,906 | |||
Taro Pharmaceutical Industries, Ltd. (1) | 6,030 | 84,239 | |||
| 7,992,814 | |||||
COMMUNICATIONS (2.03%) | |||||
BellSouth Corp. | 21,800 | 590,780 | |||
Comcast Corp.-Class A (1) | 9,060 | 235,198 | |||
Sprint Nextel Corp. | 21,801 | 509,271 | |||
Verizon Communications, Inc. | 11,800 | 355,416 | |||
| 1,690,665 | |||||
DEPOSITORY INSTITUTIONS (6.39%) | |||||
AmSouth Bancorp. | 17,525 | 459,330 | |||
Bank of America Corp. | 14,072 | 649,423 | |||
Bank of New York Co., Inc. | 11,229 | 357,644 | |||
BOK Financial Corp. | 4,600 | 208,978 | |||
Citigroup, Inc. | 19,822 | 961,962 | |||
National City Corp. | 8,695 | 291,891 | |||
New York Community Bancorp., Inc. | 44,834 | 740,658 | |||
U. S. Bancorp. | 24,470 | 731,408 | |||
Wachovia Corp. | 8,328 | 440,218 | |||
Wilmington Trust Corp. | 12,500 | 486,375 | |||
| 5,327,887 | |||||
ELECTRIC, GAS AND SANITARY SERVICES (4.59%) | |||||
Alliant Energy Corp. | 22,115 | 620,105 | |||
| Shares Held | Value | ||||
Atmos Energy Corp. | 38,252 | $ | 1,000,672 | ||
Keyspan Corp. | 23,660 | 844,425 | |||
Pepco Holdings, Inc. | 40,600 | 908,222 | |||
Xcel Energy, Inc. | 24,690 | 455,777 | |||
| 3,829,201 | |||||
ELECTRONIC AND OTHER ELECTRIC EQUIPMENT (0.72%) | |||||
Cisco Systems, Inc. (1) | 20,100 | 344,112 | |||
Emerson Electric Co. | 800 | 59,760 | |||
Helen of Troy, Ltd. (1) | 12,334 | 198,701 | |||
| 602,573 | |||||
FOOD AND KINDRED PRODUCTS (1.56%) | |||||
Anheuser-Busch Cos., Inc. | 7,910 | 339,814 | |||
ConAgra Foods, Inc. | 24,914 | 505,256 | |||
Sara Lee Corp. | 24,100 | 455,490 | |||
| 1,300,560 | |||||
FOOD STORES (0.57%) | |||||
Kroger Co. (1) | 25,186 | 475,512 | |||
GENERAL MERCHANDISE STORES (1.59%) | |||||
Federated Department Stores, Inc. | 3,831 | 254,110 | |||
Fred’s, Inc. | 27,440 | 446,449 | |||
Wal-Mart Stores, Inc. | 13,390 | 626,652 | |||
| 1,327,211 | |||||
HEALTH SERVICES (1.19%) | |||||
Health Management Associates, Inc. | 17,400 | 382,104 | |||
Lifepoint Hospitals, Inc. (1) | 8,429 | 316,088 | |||
Universal Health Services, | 6,350 | 296,799 | |||
| 994,991 | |||||
HOLDING AND OTHER INVESTMENT OFFICES (1.46%) | |||||
Highwoods Properties, Inc. | 12,960 | 368,712 | |||
Tortoise Energy Capital Corp. | 38,108 | 847,522 | |||
| 1,216,234 | |||||
INDUSTRIAL MACHINERY AND EQUIPMENT (2.43%) | |||||
Hewlett-Packard Co. | 6,900 | 197,547 | |||
Ingersoll-Rand Co., Ltd.-Class A | 20,444 | 825,324 | |||
SPX Corp. | 8,696 | 398,016 | |||
Stanley Works (The) | 12,500 | 600,500 | |||
| 2,021,387 | |||||
INSTRUMENTS AND RELATED PRODUCTS (1.29%) | |||||
Becton Dickinson & Co. | 13,835 | 831,207 | |||
Fisher Scientific International, Inc. (1) | 3,920 | 242,491 | |||
| 1,073,698 | |||||
INSURANCE CARRIERS (3.17%) | |||||
Allstate Corp. | 10,395 | 562,058 | |||
American International Group, Inc. | 6,170 | 420,979 | |||
23
EQUITRUST VARIABLE INSURANCE SERIES FUND
SCHEDULE OF INVESTMENTS
MANAGED PORTFOLIO (continued)
| Shares Held | Value | ||||
INSURANCE CARRIERS (3.17%) — continued | |||||
MBIA, Inc. | 4,551 | $ | 273,788 | ||
MetLife, Inc. | 4,855 | 237,895 | |||
Protective Life Corp. | 6,200 | 271,374 | |||
Safeco Corp. | 7,925 | 447,762 | |||
WellPoint, Inc. (1) | 5,328 | 425,121 | |||
| 2,638,977 | |||||
METAL MINING (2.77%) | |||||
Barrick Gold Corp. | 41,200 | 1,148,244 | |||
Placer Dome, Inc. | 50,500 | 1,157,965 | |||
| 2,306,209 | |||||
OIL AND GAS EXTRACTION (3.27%) | |||||
Apache Corp. | 6,700 | 459,084 | |||
Burlington Resources, Inc. | 9,075 | 782,265 | |||
Occidental Petroleum Co. | 11,125 | 888,665 | |||
Rowan Cos., Inc. | 16,700 | 595,188 | |||
| 2,725,202 | |||||
PAPER AND ALLIED PRODUCTS (3.46%) | |||||
Abitibi Consolidated, Inc. | 133,500 | 540,675 | |||
Bemis Co., Inc. | 21,670 | 603,726 | |||
International Paper Co. | 22,900 | 769,669 | |||
Kimberly-Clark Corp. | 3,600 | 214,740 | |||
P.H. Glatfelter Co. | 31,300 | 444,147 | |||
Sonoco Products Co. | 10,600 | 311,640 | |||
| 2,884,597 | |||||
PETROLEUM AND COAL PRODUCTS (2.80%) | |||||
BP PLC | 8,100 | 520,182 | |||
ConocoPhillips | 31,224 | 1,816,612 | |||
| 2,336,794 | |||||
PRIMARY METAL INDUSTRIES (0.07%) | |||||
Wolverine Tube, Inc. (1) | 11,400 | 57,684 | |||
PRINTING AND PUBLISHING (1.16%) | |||||
Belo Corp.-Series A | 17,370 | 371,892 | |||
R.R. Donnelley & Sons Co. | 10,925 | 373,744 | |||
Tribune Co. | 7,375 | 223,168 | |||
| 968,804 | |||||
RAILROAD TRANSPORTATION (0.26%) | |||||
Union Pacific Corp. | 2,710 | 218,182 | |||
TOBACCO PRODUCTS (0.72%) | |||||
Altria Group, Inc. | 8,045 | 601,122 | |||
TRANSPORTATION EQUIPMENT (2.51%) | |||||
Federal Signal Corp. | 36,400 | 546,364 | |||
Honeywell International, Inc. | 27,400 | 1,020,650 | |||
ITT Industries, Inc. | 5,095 | 523,868 | |||
| 2,090,882 | |||||
| Shares Held | Value | |||||
WHOLESALE TRADE — NONDURABLE GOODS (1.21%) | ||||||
Dean Foods Co. (1) | 10,579 | $ | 398,405 | |||
Safeway, Inc. | 25,755 | 609,363 | ||||
| 1,007,768 | ||||||
Total Common Stocks | 46,934,616 | |||||
| Principal Amount | ||||||
MORTGAGE-BACKED SECURITIES (3.54%) | ||||||
GOVERNMENT NATIONAL MORTGAGE ASSOCIATION (GNMA) | ||||||
Pool # 2796, 7.00%, due 08/01/29 | $ | 86,232 | 90,014 | |||
Pool # 3040, 7.00%, due 02/01/31 | 51,944 | 54,196 | ||||
Pool # 3188, 6.50%, due 02/20/32 | 144,228 | 149,717 | ||||
Pool # 3239, 6.50%, due 05/01/32 | 218,275 | 226,581 | ||||
Pool # 3333, 5.50%, due 01/01/33 | 340,326 | 342,256 | ||||
Pool # 3403, 5.50%, due 06/01/33 | 284,141 | 285,753 | ||||
Pool # 3442, 5.00%, due 09/01/33 | 1,075,020 | 1,058,408 | ||||
Pool # 3459, 5.50%, due 10/01/33 | 738,199 | 742,387 | ||||
Total Mortgage-Backed Securities | 2,949,312 | |||||
UNITED STATES GOVERNMENT AGENCIES (12.39%) | ||||||
Federal National Mortgage Assoc., 6.00%, due 11/09/15 | 975,000 | 973,638 | ||||
Government National Mortgage Assoc., 5.00%, due 09/01/23 | 700,000 | 689,136 | ||||
Government National Mortgage Assoc., 5.00%, due 09/01/29 | 600,000 | 588,456 | ||||
Government National Mortgage Assoc., 5.00%, due 05/01/30 | 1,560,000 | 1,520,371 | ||||
Government National Mortgage Assoc., 5.00%, due 04/01/31 | 1,500,000 | 1,475,584 | ||||
Government National Mortgage Assoc., 5.00%, due 06/01/31 | 1,300,000 | 1,284,062 | ||||
Government National Mortgage Assoc., 5.00%, due 05/01/33 | 780,000 | 745,192 | ||||
Government National Mortgage Assoc., 5.00%, due 06/01/33 | 1,693,200 | 1,666,949 | ||||
Government National Mortgage Assoc., 3.47%, due 04/01/34 | 534,846 | 515,080 | ||||
Government National Mortgage Assoc., 4.00%, due 10/01/34 | 904,660 | 869,396 | ||||
Total United States | 10,327,864 | |||||
24
EQUITRUST VARIABLE INSURANCE SERIES FUND
SCHEDULE OF INVESTMENTS
MANAGED PORTFOLIO (continued)
| Principal Amount | Value | |||||
SHORT-TERM INVESTMENTS (27.69%) | ||||||
COMMERCIAL PAPER (9.05%) | ||||||
DEPOSITORY INSTITUTIONS (1.92%) | ||||||
Citigroup CP, 4.23%, due 01/30/06 | $ | 1,600,000 | $ | 1,600,000 | ||
NONDEPOSITORY INSTITUTIONS (5.93%) | ||||||
American Express Credit Corp., | 500,000 | 500,000 | ||||
American Express Credit Corp., | 500,000 | 500,000 | ||||
American General Finance Corp., | 750,000 | 750,000 | ||||
American General Finance Corp., | 1,100,000 | 1,100,000 | ||||
General Electric Capital Corp., | 300,000 | 300,000 | ||||
General Electric Capital Corp., | 1,800,000 | 1,800,000 | ||||
| 4,950,000 | ||||||
PETROLEUM AND COAL PRODUCTS (1.20%) | ||||||
Chevron Corp., | 1,000,000 | 1,000,000 | ||||
Total Commercial Paper | 7,550,000 | |||||
UNITED STATES GOVERNMENT AGENCIES (18.46%) | ||||||
Federal Home Loan Bank, | 1,091,000 | 1,088,813 | ||||
Federal Home Loan Bank, | 2,000,000 | 1,994,377 | ||||
Federal Home Loan Bank, | 2,000,000 | 1,992,648 | ||||
Federal Home Loan Bank, | 3,000,000 | 2,988,095 | ||||
Federal Home Loan Bank, | 2,200,000 | 2,189,991 | ||||
Federal Home Loan Mortgage Corp., | 950,000 | 948,943 | ||||
Federal Home Loan Mortgage Corp., | 1,400,000 | 1,391,585 | ||||
Federal National Mortgage Assoc., | 1,700,000 | 1,699,426 | ||||
Federal National Mortgage Assoc., | 1,100,000 | 1,094,345 | ||||
Total United States | 15,388,223 | |||||
| Shares Held | Value | ||||
MONEY MARKET MUTUAL FUND (0.18%) | |||||
JPMorgan U.S. Treasury Plus Money Market Fund | 152,382 | $ | 152,382 | ||
Total Short-Term Investments | 23,090,605 | ||||
Total Investments (99.92%) | 83,302,397 | ||||
OTHER ASSETS LESS LIABILITIES (0.08%) | |||||
Cash, receivables, prepaid expense and other assets, less liabilities | 65,705 | ||||
Total Net Assets (100.00%) | $ | 83,368,102 | |||
| (1) | Non-income producing securities. |
See accompanying notes.
25
EQUITRUST VARIABLE INSURANCE SERIES FUND
SCHEDULE OF INVESTMENTS
MONEY MARKET PORTFOLIO
December 31, 2005
| Annualized Yield on Purchase Date | Principal Amount | Value | |||||||
SHORT-TERM INVESTMENTS (92.30%) | |||||||||
COMMERCIAL PAPER (16.30%) | |||||||||
NONDEPOSITORY INSTITUTIONS (12.32%) | |||||||||
American Express Credit Corp., 4.18%, due 02/13/06 | 4.184 | % | $ | 250,000 | $ | 250,000 | |||
American General Finance Corp., 4.18%, due 01/30/06 | 4.184 | 250,000 | 250,000 | ||||||
General Electric Capital Corp., 4.27%, due 01/13/06 | 4.271 | 275,000 | 275,000 | ||||||
| 775,000 | |||||||||
PETROLEUM AND COAL PRODUCTS (3.98%) | |||||||||
Chevron Corp., 4.08%, due 01/26/06 | 4.081 | 250,000 | 250,000 | ||||||
Total Commercial Paper (Cost $1,025,000) | 1,025,000 | ||||||||
UNITED STATES GOVERNMENT AGENCIES (71.27%) | |||||||||
Federal Farm Credit Bank, due 01/09/06 | 4.057 | 200,000 | 199,800 | ||||||
Federal Home Loan Bank, due 01/06/06 | 4.124 | 250,000 | 249,831 | ||||||
Federal Home Loan Bank, due 02/01/06 | 4.174 | 250,000 | 249,088 | ||||||
Federal Home Loan Bank, due 02/10/06 | 4.106 | 250,000 | 248,852 | ||||||
Federal Home Loan Bank, due 02/15/06 | 4.218 | 225,000 | 223,810 | ||||||
Federal Home Loan Bank, due 02/22/06 | 4.250 | 250,000 | 248,467 | ||||||
Federal Home Loan Bank, due 03/01/06 | 4.307 | 225,000 | 223,418 | ||||||
Federal Home Loan Bank, due 03/08/06 | 4.355 | 250,000 | 248,017 | ||||||
Federal Home Loan Mortgage Corp., due 01/03/06 | 3.967 | 300,000 | 299,902 | ||||||
Federal Home Loan Mortgage Corp., due 01/24/06 | 4.114 | 250,000 | 249,325 | ||||||
Federal Home Loan Mortgage Corp., due 02/07/06 | 4.160 | 250,000 | 248,922 | ||||||
Federal Home Loan Mortgage Corp., due 02/28/06 | 4.282 | 275,000 | 273,110 | ||||||
Federal Home Loan Mortgage Corp., due 03/07/06 | 4.359 | 300,000 | 297,654 | ||||||
Federal National Mortgage Assoc., due 01/04/06 | 3.969 | 250,000 | 249,891 | ||||||
Federal National Mortgage Assoc., due 01/11/06 | 3.988 | 225,000 | 224,730 | ||||||
Federal National Mortgage Assoc., due 01/17/06 | 4.227 | 250,000 | 249,509 | ||||||
Federal National Mortgage Assoc., due 01/23/06 | 4.170 | 250,000 | 249,345 | ||||||
Federal National Mortgage Assoc., due 03/15/06 | 4.374 | 250,000 | 247,803 | ||||||
Total United States Government Agencies (Cost $4,481,474) | 4,481,474 | ||||||||
UNITED STATES TREASURY OBLIGATION (4.73%) | |||||||||
U.S. Treasury Bill, due 03/23/06 (Cost $297,287) | 4.062 | 300,000 | 297,287 | ||||||
Total Short-Term Investments (Cost $5,803,761) | 5,803,761 | ||||||||
OTHER ASSETS LESS LIABILITIES (7.70%) | |||||||||
Cash, receivables, prepaid expense and other assets, less liabilities | 483,869 | ||||||||
Total Net Assets (100.00%) | $ | 6,287,630 | |||||||
See accompanying notes.
26
EQUITRUST VARIABLE INSURANCE SERIES FUND
SCHEDULE OF INVESTMENTS
BLUE CHIP PORTFOLIO
December 31, 2005
| Shares Held | Value | ||||
COMMON STOCKS (94.06%) | |||||
BUSINESS SERVICES (3.83%) | |||||
Microsoft Corp. | 93,758 | $ | 2,451,772 | ||
Oracle Corp. (1) | 58,314 | 712,014 | |||
| 3,163,786 | |||||
CHEMICALS AND ALLIED PRODUCTS (15.03%) | |||||
Abbott Laboratories | 25,260 | 996,002 | |||
Amgen, Inc. (1) | 18,200 | 1,435,252 | |||
Bristol-Myers Squibb Co. | 36,063 | 828,728 | |||
Dow Chemical Co. | 10,720 | 469,750 | |||
E.I. du Pont de Nemours & Co. | 16,081 | 683,442 | |||
Eli Lilly & Co. | 18,022 | 1,019,865 | |||
Johnson & Johnson | 43,580 | 2,619,158 | |||
Merck & Co., Inc. | 28,928 | 920,200 | |||
Pfizer, Inc. | 45,282 | 1,055,976 | |||
Procter & Gamble Co. | 41,042 | 2,375,511 | |||
| 12,403,884 | |||||
COMMUNICATIONS (4.10%) | |||||
AT&T, Inc. | 35,565 | 870,987 | |||
Comcast Corp.-Class A (1) | 22,486 | 583,736 | |||
Verizon Communications | 37,307 | 1,123,687 | |||
Viacom, Inc.-Class B | 24,668 | 804,177 | |||
| 3,382,587 | |||||
DEPOSITORY INSTITUTIONS (10.96%) | |||||
Bank of America Corp. | 46,596 | 2,150,405 | |||
Citigroup, Inc. | 49,326 | 2,393,791 | |||
J. P. Morgan Chase & Co. | 47,270 | 1,876,146 | |||
Wachovia Corp. | 25,980 | 1,373,303 | |||
Wells Fargo Co. | 19,900 | 1,250,317 | |||
| 9,043,962 | |||||
EATING AND DRINKING PLACES (2.12%) | |||||
McDonald’s Corp. | 51,752 | 1,745,077 | |||
ELECTRIC, GAS AND SANITARY SERVICES (3.58%) | |||||
Dominion Resources, Inc. | 11,600 | 895,520 | |||
Exelon Corp. | 24,600 | 1,307,244 | |||
Southern Co. | 21,650 | 747,574 | |||
| 2,950,338 | |||||
ELECTRONIC AND OTHER ELECTRIC EQUIPMENT (8.27%) | |||||
Cisco Systems, Inc. (1) | 62,268 | 1,066,028 | |||
General Electric Co. | 73,576 | 2,578,839 | |||
Intel Corp. | 58,206 | 1,452,822 | |||
Motorola, Inc. | 37,949 | 857,268 | |||
Texas Instruments, Inc. | 27,001 | 865,922 | |||
| 6,820,879 | |||||
FOOD AND KINDRED PRODUCTS (3.00%) | |||||
Anheuser Busch Cos., Inc. | 11,432 | 491,119 | |||
Coca-Cola Co. (The) | 26,389 | 1,063,741 | |||
PepsiCo, Inc. | 15,518 | 916,803 | |||
| 2,471,663 | |||||
| Shares Held | Value | ||||
FORESTRY (0.51%) | |||||
Weyerhaeuser Co. | 6,400 | $ | 424,576 | ||
GENERAL MERCHANDISE STORES (2.42%) | |||||
Wal-Mart Stores, Inc. | 42,623 | 1,994,756 | |||
INDUSTRIAL MACHINERY AND EQUIPMENT (8.87%) | |||||
3M Co. | 17,808 | 1,380,120 | |||
Applied Materials, Inc. | 24,000 | 430,560 | |||
Caterpillar, Inc. | 28,614 | 1,653,031 | |||
Dell, Inc. (1) | 31,210 | 935,988 | |||
EMC Corp. (1) | 38,068 | 518,486 | |||
Hewlett-Packard Co. | 41,279 | 1,181,818 | |||
International Business Machines Corp. | 14,821 | 1,218,286 | |||
| 7,318,289 | |||||
INSURANCE CARRIERS (3.14%) | |||||
American International Group, Inc. | 37,964 | 2,590,284 | |||
LUMBER AND WOOD PRODUCTS (1.27%) | |||||
Home Depot, Inc. | 25,913 | 1,048,958 | |||
MOTION PICTURES (2.14%) | |||||
Disney (Walt) Co. | 36,832 | 882,863 | |||
Time Warner, Inc. | 50,502 | 880,755 | |||
| 1,763,618 | |||||
NONDEPOSITORY INSTITUTIONS (4.15%) | |||||
American Express Co. | 52,797 | 2,716,934 | |||
Federal National Mortgage Assoc. | 14,400 | 702,864 | |||
| 3,419,798 | |||||
PETROLEUM AND COAL PRODUCTS (7.46%) | |||||
Chevron Corp. | 39,400 | 2,236,738 | |||
Exxon Mobil Corp. | 69,771 | 3,919,037 | |||
| 6,155,775 | |||||
PRIMARY METAL INDUSTRIES (1.11%) | |||||
Alcoa, Inc. | 30,898 | 913,654 | |||
SECURITY AND COMMODITY BROKERS (0.52%) | |||||
Ameriprise Financial, Inc. | 10,559 | 432,919 | |||
TOBACCO PRODUCTS (3.53%) | |||||
Altria Group, Inc. | 38,965 | 2,911,465 | |||
TRANSPORTATION EQUIPMENT (8.05%) | |||||
Boeing Co. (The) | 32,082 | 2,253,440 | |||
General Motors Corp. | 16,700 | 324,314 | |||
Honeywell International, Inc. | 38,024 | 1,416,394 | |||
United Technologies Corp. | 47,402 | 2,650,246 | |||
| 6,644,394 | |||||
Total Common Stocks | 77,600,662 | ||||
27
EQUITRUST VARIABLE INSURANCE SERIES FUND
SCHEDULE OF INVESTMENTS
BLUE CHIP PORTFOLIO (continued)
| Shares Held | Value | |||||
SHORT-TERM INVESTMENTS (5.90%) | ||||||
MONEY MARKET MUTUAL FUND (0.15%) | ||||||
JPMorgan U.S. Treasury Plus Money Market Fund | 125,253 | $ | 125,253 | |||
| Principal Amount | ||||||
COMMERCIAL PAPER (1.54%) | ||||||
NONDEPOSITORY INSTITUTIONS | ||||||
American Express Credit Corp., | $ | 350,000 | 350,000 | |||
General Electric Capital Corp., | 925,000 | 925,000 | ||||
Total Commercial Paper | 1,275,000 | |||||
UNITED STATES GOVERNMENT AGENCIES (4.21%) | ||||||
Federal National Mortgage Assoc., | 1,032,000 | 1,030,724 | ||||
Federal National Mortgage Assoc., | 1,000,000 | 996,960 | ||||
Federal National Mortgage Assoc., | 750,000 | 747,196 | ||||
Federal National Mortgage Assoc., | 700,000 | 696,270 | ||||
Total United States | 3,471,150 | |||||
Total Short-Term Investments | 4,871,403 | |||||
Total Investments (99.96%) | 82,472,065 | |||||
OTHER ASSETS LESS LIABILITIES (0.04%) | ||||||
Cash, receivables, prepaid expense and other assets, less liabilities | 29,340 | |||||
Total Net Assets (100.00%) | $ | 82,501,405 | ||||
| (1) | Non-income producing securities. |
See accompanying notes.
28
EQUITRUST VARIABLE INSURANCE SERIES FUND
NOTES TO FINANCIAL STATEMENTS
December 31, 2005
| 1. | Significant Accounting Policies |
Organization
EquiTrust Variable Insurance Series Fund (the “Fund”) is registered under the Investment Company Act of 1940, as amended, as a no-load, open-end diversified management investment company, or mutual fund. The Fund is authorized to issue an unlimited number of shares of beneficial interest with no par value. The Fund currently consists of six portfolios (known as the Value Growth, High Grade Bond, Strategic Yield, Managed, Money Market and Blue Chip Portfolios). Shares of the Fund are sold only to certain life insurance companies’ separate accounts to fund the benefits under variable insurance contracts issued by such life insurance companies, including Farm Bureau Life Insurance Company and EquiTrust Life Insurance Company (see Note 3).
Security Valuation
All portfolios, other than the Money Market Portfolio, value their investment securities that are traded on any national exchange at the last sale price on the day of valuation or, lacking any sales, at the mean between the closing bid and asked prices. Investments traded in the over-the-counter market are valued at the mean between the bid and asked prices or yield equivalent as obtained from one or more dealers that make markets in the securities. In situations where market quotations are not readily available or quoted market prices are not reliable, investments are valued at fair value in accordance with the procedures adopted by the Fund’s Board of Trustees. Short-term investments are valued at market value, except that obligations maturing in 90 days or less are valued using the amortized cost method of valuation described below with respect to the Money Market Portfolio, which approximates market value.
The Money Market Portfolio values investments at amortized cost, which approximates market value. Under the amortized cost method, a security is valued at its cost on the date of purchase and thereafter is adjusted to reflect a constant amortization to maturity of the difference between the principal amount due at maturity and the cost of the investment to the portfolio.
Income and Investment Transactions
For financial reporting purposes, investment transactions are recorded on the trade date. The identified cost basis has been used in determining the net realized gain or loss from investment transactions and unrealized appreciation or depreciation on investments. Dividend income is recorded on the ex-dividend date and interest is recognized on an accrual basis. Discounts and premiums on investments purchased are amortized over the life of the respective investments.
Dividends and Distributions to Shareholders
On each day that the net asset value per share is calculated in the High Grade Bond and Strategic Yield Portfolios, that Portfolio’s net investment income will be declared, as of the close of the New York Stock Exchange, as a dividend to shareholders of record prior to the declaration. With respect to the Money Market Portfolio, each day the net asset value per share is calculated, net investment income and any realized gains and losses from investment transactions will be declared, as of the close of the New York Stock Exchange, as a dividend to shareholders of record prior to the declaration. With respect to the High Grade Bond and Strategic Yield Portfolios, any net short-term and long-term gains will be declared and distributed periodically, but in no event less frequently than annually. Dividends and distributions of the other Portfolios are recorded on the ex-dividend date. Dividends and distributions from net investment income and net realized gain from investments are determined in accordance with federal tax regulations, which may differ from U.S. generally accepted accounting principles. These differences are primarily due to differing treatments for certain basis adjustments resulting from a taxable spin-off and taxable mergers. Permanent book and tax basis differences are reclassified within the capital accounts based on their federal tax-basis treatment; temporary differences do not require reclassification.
Dividends and distributions which exceed current and accumulated earnings and profits for federal income tax purposes are reported as return of capital distributions.
29
EQUITRUST VARIABLE INSURANCE SERIES FUND
NOTES TO FINANCIAL STATEMENTS (continued)
| 1. | Significant Accounting Policies (continued) |
Use of Estimates
The preparation of financial statements in conformity with U.S. generally accepted accounting principles requires management to make estimates and assumptions that affect the reported amounts of assets and liabilities and disclosure of contingent assets and liabilities at the date of the financial statements and the reported amounts of revenues and expenses during the reporting period. Actual results could differ from those estimates.
Indemnifications
Under the Fund’s organizational documents, its present and past officers and trustees are indemnified against certain liability arising out of the performance of their duties to the Fund. At the discretion of the Board of Trustees, employees and agents may also be indemnified. In addition, in the normal course of business the Fund enters into contracts that contain a variety of representations and warranties which provide general indemnifications. The Fund’s maximum exposure under these arrangements is unknown, as this would involve future claims that may be made against the Fund that have not yet occurred.
| 2. | Federal Income Taxes |
No provision for federal income taxes is considered necessary because the Fund is qualified as a “regulated investment company” under the Internal Revenue Code and intends to distribute each year substantially all of its net investment income and realized capital gains to shareholders.
As of December 31, 2005, the following Portfolios had approximate net capital loss carryforwards set forth below:
| Portfolio | |||||||||
Net Capital Loss Carryforwards Expire In: | Value Growth | Strategic Yield | Blue Chip | ||||||
2008 | $ | 977,000 | $ | — | $ | — | |||
2010 | — | 1,689,000 | 1,786,000 | ||||||
2011 | — | 571,000 | 4,672,000 | ||||||
2012 | — | — | 556,000 | ||||||
2013 | — | — | 60,000 | ||||||
| $ | 977,000 | $ | 2,260,000 | $ | 7,074,000 | ||||
During 2005, the Value Growth and Strategic Yield Portfolios utilized approximately $5,415,000 and $2,000 of capital loss carryforwards, respectively.
As of December 31, 2005, the Strategic Yield Portfolio had post-October capital losses of $98 that were deferred to the first day of the next fiscal year.
30
EQUITRUST VARIABLE INSURANCE SERIES FUND
NOTES TO FINANCIAL STATEMENTS (continued)
| 2. | Federal Income Taxes (continued) |
As of December 31, 2005, the components of accumulated earnings and capital gains (losses) on a tax basis were identical to those reported in the statements of assets and liabilities, except as follows:
| Portfolio | |||||||
| Value Growth | Managed | ||||||
Undistributed ordinary income | $ | 836,213 | $ | 1,977,143 | |||
Accumulated capital gains (losses) | (976,836 | ) | 4,643,149 | ||||
Net unrealized appreciation of investments | 5,185,523 | 8,019,617 | |||||
Total accumulated earnings | $ | 5,044,900 | $ | 14,639,909 | |||
Differences between book and tax amounts are primarily attributable to taxable spin-offs, mergers and corporate inversions.
| 3. | Management Contract and Transactions with Affiliates |
The Fund has entered into agreements with EquiTrust Investment Management Services, Inc. (“EquiTrust Investment”) relating to the management of the Portfolios and the investment of their assets. Pursuant to these agreements, fees paid to EquiTrust Investment are as follows: (1) annual investment advisory and management fees, which are based on each portfolio’s average daily net assets as follows: Value Growth Portfolio — 0.45%; High Grade Bond Portfolio — 0.30%; Strategic Yield Portfolio — 0.45%; Managed Portfolio — 0.45%; Money Market Portfolio — 0.25%; and Blue Chip Portfolio — 0.20%, and (2) accounting fees, which are based on each Portfolio’s daily net assets at an annual rate of 0.05%, with a maximum per Portfolio annual expense of $30,000.
The Fund entered into an agreement with EquiTrust Investment whereby EquiTrust Investment also serves as the Fund’s shareholder service, transfer and dividend disbursing agent. EquiTrust Marketing Services, LLC serves as the principal underwriter and distributor. There are no fees paid by the Fund associated with these services.
EquiTrust Investment has agreed to reimburse the Portfolios annually for total expenses (excluding brokerage, interest, taxes and extraordinary expenses) in excess of 1.50% of each Portfolio’s average daily net assets. The amount reimbursed, however, shall not exceed the amount of the investment advisory and management fee paid by the Portfolio for such period. During the year ended December 31, 2005, EquiTrust Investment further agreed to reimburse any Portfolio, to the extent that annual operating expenses, including the investment advisory fee, exceed 0.65%. For the year ended December 31, 2005, no expense reimbursements were made to the Fund by EquiTrust Investment.
Certain officers and trustees of the Fund are also officers of EquiTrust Investment, Farm Bureau Life Insurance Company and other affiliated entities. As of December 31, 2005, the total number of the shares of each Portfolio owned by Farm Bureau Life Insurance Company, EquiTrust Life Insurance Company and related separate accounts were as follows:
Portfolio | Shares | |
Value Growth | 4,335,512 | |
High Grade Bond | 3,218,091 | |
Strategic Yield | 3,685,454 | |
Managed | 5,101,212 | |
Money Market | 5,514,010 | |
Blue Chip | 2,286,272 |
31
EQUITRUST VARIABLE INSURANCE SERIES FUND
NOTES TO FINANCIAL STATEMENTS (continued)
| 4. | Capital Share Transactions |
Transactions in shares of beneficial interest for each Portfolio were as follows:
| Shares Sold | Shares Issued In Reinvestment of Dividends and Distributions | Shares Redeemed | Net Increase (Decrease) | |||||||||||||||||||
Portfolio | Shares | Amount | Shares | Amount | Shares | Amount | Shares | Amount | ||||||||||||||
Year ended December 31, 2005: | ||||||||||||||||||||||
Value Growth | 221,957 | $ | 2,908,508 | 53,423 | $ | 665,116 | 358,299 | $ | 4,688,291 | (82,919 | ) | $ | (1,114,667 | ) | ||||||||
High Grade Bond | 664,378 | 6,808,079 | 149,086 | 1,528,984 | 262,031 | 2,690,002 | 551,433 | 5,647,061 | ||||||||||||||
Strategic Yield | 833,599 | 7,731,637 | 206,966 | 1,920,635 | 254,892 | 2,373,545 | 785,673 | 7,278,727 | ||||||||||||||
Managed | 655,902 | 10,084,258 | 175,742 | 2,597,468 | 334,379 | 5,134,191 | 497,265 | 7,547,535 | ||||||||||||||
Money Market | 36,520,136 | 36,520,136 | 122,167 | 122,167 | 36,946,738 | 36,946,738 | (304,435 | ) | (304,435 | ) | ||||||||||||
Blue Chip | 116,352 | 4,011,812 | 48,130 | 1,621,030 | 241,530 | 8,334,683 | (77,048 | ) | (2,701,841 | ) | ||||||||||||
Year ended December 31, 2004: | ||||||||||||||||||||||
Value Growth | 272,309 | $ | 3,248,659 | 47,356 | $ | 563,058 | 314,657 | $ | 3,757,688 | 5,008 | $ | 54,029 | ||||||||||
High Grade Bond | 498,678 | 5,149,599 | 124,573 | 1,289,118 | 293,329 | 3,040,003 | 329,922 | 3,398,714 | ||||||||||||||
Strategic Yield | 547,463 | 5,049,478 | 181,300 | 1,675,145 | 250,424 | 2,315,693 | 478,339 | 4,408,930 | ||||||||||||||
Managed | 436,280 | 6,407,882 | 94,010 | 1,367,844 | 282,774 | 4,163,866 | 247,516 | 3,611,860 | ||||||||||||||
Money Market | 29,459,979 | 29,459,979 | 33,224 | 33,224 | 29,628,690 | 29,628,690 | (135,487 | ) | (135,487 | ) | ||||||||||||
Blue Chip | 174,207 | 5,808,441 | 35,399 | 1,194,008 | 166,223 | 5,550,599 | 43,383 | 1,451,850 | ||||||||||||||
| 5. | Investment Transactions |
For the year ended December 31, 2005, the cost of investment securities purchased and proceeds from investment securities sold (not including short-term investments and U.S. Government securities) by Portfolio, were as follows:
Portfolio | Purchases | Sales | ||||
Value Growth | $ | 8,907,956 | $ | 13,540,833 | ||
High Grade Bond | 1,893,282 | 191,161 | ||||
Strategic Yield | 588,610 | 239,992 | ||||
Managed | 9,979,378 | 12,986,831 | ||||
Blue Chip | — | — | ||||
The basis of the Fund’s investments in securities and the net unrealized appreciation of investments for U.S. federal income tax purposes as of December 31, 2005, by Portfolio, was composed of the following:
Portfolio | Tax Cost of Investments in Securities | Gross Unrealized | Net Unrealized Appreciation of Investments | |||||||||
| Appreciation | Depreciation | |||||||||||
Value Growth | $ | 55,030,258 | $ | 10,234,508 | $ | 5,048,985 | $ | 5,185,523 | ||||
High Grade Bond | 34,507,575 | 474,130 | 244,225 | 229,905 | ||||||||
Strategic Yield | 35,885,521 | 1,120,476 | 454,224 | 666,252 | ||||||||
Managed | 75,282,780 | 11,137,585 | 3,117,968 | 8,019,617 | ||||||||
Blue Chip | 67,314,291 | 24,533,063 | 9,375,289 | 15,157,774 | ||||||||
The basis for U.S. federal income tax purposes and financial reporting purposes for investments in the Money Market Portfolio is the same and is equal to the underlying investments’ carrying value.
32
EQUITRUST VARIABLE INSURANCE SERIES FUND
NOTES TO FINANCIAL STATEMENTS (continued)
| 6. | Dividends and Distributions to Shareholders |
Dividends from net investment income for the following Portfolios are declared daily and were payable on the last business day of the month as follows:
| Portfolio | |||||||||
Payable Date | High Grade Bond | Strategic Yield | Money Market | ||||||
January 31, 2005 | $ | 0.0378 | $ | 0.0430 | $ | 0.0014 | |||
February 28, 2005 | 0.0383 | 0.0475 | 0.0014 | ||||||
March 31, 2005 | 0.0395 | 0.0454 | 0.0016 | ||||||
April 29, 2005 | 0.0366 | 0.0412 | 0.0017 | ||||||
May 31, 2005 | 0.0398 | 0.0443 | 0.0020 | ||||||
June 30, 2005 | 0.0404 | 0.0454 | 0.0020 | ||||||
July 29, 2005 | 0.0367 | 0.0408 | 0.0021 | ||||||
August 31, 2005 | 0.0425 | 0.0463 | 0.0025 | ||||||
September 30, 2005 | 0.0416 | 0.0432 | 0.0023 | ||||||
October 31, 2005 | 0.0397 | 0.0433 | 0.0022 | ||||||
November 30, 2005 | 0.0403 | 0.0442 | 0.0025 | ||||||
December 30, 2005 | 0.0410 | 0.0456 | 0.0031 | ||||||
Total dividends per share | $ | 0.4742 | $ | 0.5302 | $ | 0.0248 | |||
None of the ordinary income dividends qualify for the dividends received deduction by corporate shareholders for the High Grade Bond, Strategic Yield and Money Market Portfolios.
In addition, dividends and distributions to shareholders from net investment income and net realized gain on investment transactions were paid during the year ended December 31, 2005 for the following Portfolios:
Ordinary Income Dividends:
Portfolio | Declaration Date | Record Date | Payable Date | Amount Per Share | Percent Qualifying for Deductions by Corporations | |||||||
Value Growth | 1/19/05 | 1/19/05 | 1/20/05 | $ | 0.1482 | 100 | % | |||||
Managed | 1/19/05 | 1/19/05 | 1/20/05 | 0.2711 | 77 | % | ||||||
Blue Chip | 1/19/05 | 1/19/05 | 1/20/05 | 0.6730 | 100 | % | ||||||
Capital Gains Distributions:
Portfolio | Declaration Date | Record Date | Payable Date | Amount Per Share | |||||
High Grade Bond | 1/19/05 | 1/19/05 | 1/20/05 | $ | 0.0151 | ||||
Managed | 1/19/05 | 1/19/05 | 1/20/05 | 0.2715 | |||||
The federal income tax character of dividends and distributions to shareholders during 2005 and 2004 was the same for financial reporting purposes.
33
EQUITRUST VARIABLE INSURANCE SERIES FUND
FINANCIAL HIGHLIGHTS
Years Ended December 31, 2005, 2004, 2003, 2002 and 2001
| Value Growth Portfolio | High Grade Bond Portfolio | Strategic Yield Portfolio | ||||||||||||||||||||||||||||||||||||||||||||||||||||||||||
| 2005 | 2004 | 2003 | 2002 | 2001 | 2005 | 2004 | 2003 | 2002 | 2001 | 2005 | 2004 | 2003 | 2002 | 2001 | ||||||||||||||||||||||||||||||||||||||||||||||
Net asset value, beginning of period | $ | 12.98 | $ | 11.76 | $ | 9.14 | $ | 10.39 | $ | 9.92 | $ | 10.38 | $ | 10.42 | $ | 10.39 | $ | 10.08 | $ | 9.82 | $ | 9.37 | $ | 9.13 | $ | 8.75 | $ | 8.90 | $ | 8.82 | ||||||||||||||||||||||||||||||
Income From Investment Operations | ||||||||||||||||||||||||||||||||||||||||||||||||||||||||||||
Net investment income | 0.19 | 0.15 | 0.12 | 0.14 | 0.18 | 0.47 | 0.45 | 0.47 | 0.50 | 0.62 | 0.53 | 0.55 | 0.63 | 0.62 | 0.73 | |||||||||||||||||||||||||||||||||||||||||||||
Net gains (losses) on securities (both realized and unrealized) | 0.63 | 1.20 | 2.64 | (1.20 | ) | 0.50 | (0.20 | ) | — | 0.08 | 0.32 | 0.26 | (0.23 | ) | 0.24 | 0.38 | (0.15 | ) | 0.08 | |||||||||||||||||||||||||||||||||||||||||
Total from investment operations | 0.82 | 1.35 | 2.76 | (1.06 | ) | 0.68 | 0.27 | 0.45 | 0.55 | 0.82 | 0.88 | 0.30 | 0.79 | 1.01 | 0.47 | 0.81 | ||||||||||||||||||||||||||||||||||||||||||||
Less Distributions | ||||||||||||||||||||||||||||||||||||||||||||||||||||||||||||
Dividends (from net investment income) | (0.15 | ) | (0.13 | ) | (0.14 | ) | (0.19 | ) | (0.21 | ) | (0.47 | ) | (0.45 | ) | (0.47 | ) | (0.50 | ) | (0.62 | ) | (0.53 | ) | (0.55 | ) | (0.63 | ) | (0.62 | ) | (0.73 | ) | ||||||||||||||||||||||||||||||
Distributions (from capital gains) | — | — | — | — | — | (0.02 | ) | (0.04 | ) | (0.05 | ) | (0.01 | ) | — | — | — | — | — | — | |||||||||||||||||||||||||||||||||||||||||
Total distributions | (0.15 | ) | (0.13 | ) | (0.14 | ) | (0.19 | ) | (0.21 | ) | (0.49 | ) | (0.49 | ) | (0.52 | ) | (0.51 | ) | (0.62 | ) | (0.53 | ) | (0.55 | ) | (0.63 | ) | (0.62 | ) | (0.73 | ) | ||||||||||||||||||||||||||||||
Net asset value, end of period | $ | 13.65 | $ | 12.98 | $ | 11.76 | $ | 9.14 | $ | 10.39 | $ | 10.16 | $ | 10.38 | $ | 10.42 | $ | 10.39 | $ | 10.08 | $ | 9.14 | $ | 9.37 | $ | 9.13 | $ | 8.75 | $ | 8.90 | ||||||||||||||||||||||||||||||
Total Return: | ||||||||||||||||||||||||||||||||||||||||||||||||||||||||||||
Total investment return based on net asset value (1) | 6.41 | % | 11.53 | % | 30.68 | % | (10.43 | )% | 6.98 | % | 2.65 | % | 4.30 | % | 5.43 | % | 8.37 | % | 9.10 | % | 3.26 | % | 8.94 | % | 11.97 | % | 5.43 | % | 9.22 | % | ||||||||||||||||||||||||||||||
Ratios/Supplemental Data: | ||||||||||||||||||||||||||||||||||||||||||||||||||||||||||||
Net assets, end of period (000’s omitted) | $ | 60,223 | $ | 58,354 | $ | 52,812 | $ | 40,953 | $ | 45,522 | $ | 34,946 | $ | 29,980 | $ | 26,659 | $ | 24,984 | $ | 18,908 | $ | 37,067 | $ | 30,637 | $ | 25,498 | $ | 22,395 | $ | 20,182 | ||||||||||||||||||||||||||||||
Ratio of total expenses to average net assets | 0.58 | % | 0.58 | % | 0.63 | % | 0.59 | % | 0.57 | % | 0.45 | % | 0.45 | % | 0.49 | % | 0.46 | % | 0.45 | % | 0.59 | % | 0.59 | % | 0.65 | % | 0.61 | % | 0.59 | % | ||||||||||||||||||||||||||||||
Ratio of net expenses to average net assets | 0.58 | % | 0.58 | % | 0.63 | % | 0.59 | % | 0.57 | % | 0.45 | % | 0.45 | % | 0.49 | % | 0.46 | % | 0.45 | % | 0.59 | % | 0.59 | % | 0.65 | % | 0.61 | % | 0.59 | % | ||||||||||||||||||||||||||||||
Ratio of net investment income to average net assets | 1.42 | % | 1.22 | % | 1.26 | % | 1.46 | % | 1.89 | % | 4.63 | % | 4.34 | % | 4.51 | % | 4.92 | % | 6.10 | % | 5.71 | % | 5.98 | % | 7.07 | % | 7.04 | % | 7.93 | % | ||||||||||||||||||||||||||||||
Portfolio turnover rate | 18 | % | 17 | % | 17 | % | 15 | % | 40 | % | 12 | % | 26 | % | 28 | % | 22 | % | 17 | % | 1 | % | 34 | % | 32 | % | 34 | % | 33 | % | ||||||||||||||||||||||||||||||
Note: Net investment income per share amounts have been calculated based on average shares outstanding for the period.
| (1) | Total investment return is calculated assuming an initial investment made at the net asset value at the beginning of the period, reinvestment of all dividends and distributions at net asset value during the period, and redemption on the last day of the period. |
See accompanying notes.
34
EQUITRUST VARIABLE INSURANCE SERIES FUND
FINANCIAL HIGHLIGHTS (continued)
| Managed Portfolio | Money Market Portfolio | Blue Chip Portfolio | ||||||||||||||||||||||||||||||||||||||||||||||||||||||||||
| 2005 | 2004 | 2003 | 2002 | 2001 | 2005 | 2004 | 2003 | 2002 | 2001 | 2005 | 2004 | 2003 | 2002 | 2001 | ||||||||||||||||||||||||||||||||||||||||||||||
Net asset value, beginning of period | $ | 15.67 | $ | 14.73 | $ | 12.34 | $ | 13.00 | $ | 12.58 | $ | 1.00 | $ | 1.00 | $ | 1.00 | $ | 1.00 | $ | 1.00 | $ | 35.17 | $ | 33.65 | $ | 27.22 | $ | 34.14 | $ | 39.29 | ||||||||||||||||||||||||||||||
Income From Investment Operations | ||||||||||||||||||||||||||||||||||||||||||||||||||||||||||||
Net investment income | 0.35 | 0.27 | 0.30 | 0.34 | 0.44 | 0.02 | 0.01 | 0.01 | 0.01 | 0.03 | 0.70 | 0.67 | 0.50 | 0.46 | 0.50 | |||||||||||||||||||||||||||||||||||||||||||||
Net gains (losses) on securities (both realized and unrealized) | 0.32 | 0.97 | 2.43 | (0.57 | ) | 0.55 | — | — | — | — | — | 0.07 | 1.35 | 6.38 | (6.88 | ) | (4.83 | ) | ||||||||||||||||||||||||||||||||||||||||||
Total from investment operations | 0.67 | 1.24 | 2.73 | (0.23 | ) | 0.99 | 0.02 | 0.01 | 0.01 | 0.01 | 0.03 | 0.77 | 2.02 | 6.88 | (6.42 | ) | (4.33 | ) | ||||||||||||||||||||||||||||||||||||||||||
Less Distributions | ||||||||||||||||||||||||||||||||||||||||||||||||||||||||||||
Dividends (from net investment income) | (0.27 | ) | (0.30 | ) | (0.34 | ) | (0.43 | ) | (0.57 | ) | (0.02 | ) | (0.01 | ) | (0.01 | ) | (0.01 | ) | (0.03 | ) | (0.67 | ) | (0.50 | ) | (0.45 | ) | (0.50 | ) | (0.56 | ) | ||||||||||||||||||||||||||||||
Distributions (from capital gains) | (0.27 | ) | — | — | — | — | — | — | — | — | — | — | — | — | — | (0.26 | ) | |||||||||||||||||||||||||||||||||||||||||||
Total distributions | (0.54 | ) | (0.30 | ) | (0.34 | ) | (0.43 | ) | (0.57 | ) | (0.02 | ) | (0.01 | ) | (0.01 | ) | (0.01 | ) | (0.03 | ) | (0.67 | ) | (0.50 | ) | (0.45 | ) | (0.50 | ) | (0.82 | ) | ||||||||||||||||||||||||||||||
Net asset value, end of period | $ | 15.80 | $ | 15.67 | $ | 14.73 | $ | 12.34 | $ | 13.00 | $ | 1.00 | $ | 1.00 | $ | 1.00 | $ | 1.00 | $ | 1.00 | $ | 35.27 | $ | 35.17 | $ | 33.65 | $ | 27.22 | $ | 34.14 | ||||||||||||||||||||||||||||||
Total Return: | ||||||||||||||||||||||||||||||||||||||||||||||||||||||||||||
Total investment return based on net asset value (1) | 4.53 | % | 8.58 | % | 22.72 | % | (1.80 | )% | 8.12 | % | 2.50 | % | 0.74 | % | 0.52 | % | 1.16 | % | 3.51 | % | 2.29 | % | 6.07 | % | 25.70 | % | (19.07 | )% | (11.28 | )% | ||||||||||||||||||||||||||||||
Ratios/Supplemental Data: | ||||||||||||||||||||||||||||||||||||||||||||||||||||||||||||
Net assets, end of period (000’s omitted) | $ | 83,368 | $ | 74,876 | $ | 66,733 | $ | 54,428 | $ | 53,795 | $ | 6,288 | $ | 6,592 | $ | 6,728 | $ | 8,150 | $ | 9,320 | $ | 82,501 | $ | 84,960 | $ | 79,832 | $ | 63,699 | $ | 79,124 | ||||||||||||||||||||||||||||||
Ratio of total expenses to average net assets | 0.56 | % | 0.56 | % | 0.62 | % | 0.58 | % | 0.56 | % | 0.61 | % | 0.56 | % | 0.59 | % | 0.52 | % | 0.50 | % | 0.31 | % | 0.30 | % | 0.36 | % | 0.31 | % | 0.28 | % | ||||||||||||||||||||||||||||||
Ratio of net expenses to average net assets | 0.56 | % | 0.56 | % | 0.62 | % | 0.58 | % | 0.56 | % | 0.61 | % | 0.56 | % | 0.59 | % | 0.52 | % | 0.48 | % | 0.31 | % | 0.30 | % | 0.36 | % | 0.31 | % | 0.28 | % | ||||||||||||||||||||||||||||||
Ratio of net investment income to average net assets | 2.34 | % | 1.87 | % | 2.35 | % | 2.73 | % | 3.47 | % | 2.47 | % | 0.72 | % | 0.53 | % | 1.16 | % | 3.41 | % | 1.98 | % | 2.00 | % | 1.72 | % | 1.50 | % | 1.42 | % | ||||||||||||||||||||||||||||||
Portfolio turnover rate | 24 | % | 26 | % | 24 | % | 18 | % | 40 | % | — | % | — | % | — | % | — | % | — | % | — | % | 1 | % | 17 | % | — | % | — | % | ||||||||||||||||||||||||||||||
Note: Net investment income per share amounts have been calculated based on average shares outstanding for the period.
| (1) | Total investment return is calculated assuming an initial investment made at the net asset value at the beginning of the period, reinvestment of all dividends and distributions at net asset value during the period, and redemption on the last day of the period. |
See accompanying notes.
35
REPORT OF INDEPENDENT REGISTERED PUBLIC ACCOUNTING FIRM
The Board of Trustees and Shareholders
EquiTrust Variable Insurance Series Fund
We have audited the accompanying statements of assets and liabilities, including the schedules of investments, of EquiTrust Variable Insurance Series Fund [comprised of the Value Growth, High Grade Bond, Strategic Yield, Managed, Money Market and Blue Chip Portfolios] as of December 31, 2005, and the related statements of operations for the year then ended, the statements of changes in net assets for each of the two years in the period then ended, and the financial highlights for each of the five years in the period then ended. These financial statements and financial highlights are the responsibility of the Fund’s management. Our responsibility is to express an opinion on these financial statements and financial highlights based on our audits.
We conducted our audits in accordance with the standards of the Public Company Accounting Oversight Board (United States). Those standards require that we plan and perform the audit to obtain reasonable assurance about whether the financial statements and financial highlights are free of material misstatement. We were not engaged to perform an audit of the Fund’s internal control over financial reporting. Our audits included consideration of internal control over financial reporting as a basis for designing audit procedures that are appropriate in the circumstances, but not for the purpose of expressing an opinion on the effectiveness of the Fund’s internal control over financial reporting. Accordingly, we express no such opinion. An audit also includes examining, on a test basis, evidence supporting the amounts and disclosures in the financial statements and financial highlights, assessing the accounting principles used and significant estimates made by management, and evaluating the overall financial statement presentation. Our procedures included confirmation of securities owned as of December 31, 2005, by correspondence with the custodian. We believe that our audits provide a reasonable basis for our opinion.
In our opinion, the financial statements and financial highlights referred to above present fairly, in all material respects, the financial position of each of the respective portfolios constituting the EquiTrust Variable Insurance Series Fund at December 31, 2005, and the results of their operations for the year then ended, the changes in their net assets for each of the two years in the period then ended, and the financial highlights for each of the five years in the period then ended, in conformity with U.S. generally accepted accounting principles.

Des Moines, Iowa
February 1, 2006
36
OFFICERS AND TRUSTEES
| Name, Address and Age | Position(s) Held with Fund | Term of Office & Length of Time Served(1) | Principal Occupation(s) During Past Five Years | Number of Portfolios in Fund Complex Overseen by Trustee | Other Directorships Held by Trustee | |||||
Interested Persons(2) | ||||||||||
Craig A. Lang (54) | President and Trustee | Since 2002 | Chairman and Director, FBL Financial Group, Inc.; President and Director, Iowa Farm Bureau Federation and other affiliates of the foregoing; Director, Western Agricultural Insurance Company and other affiliates of the foregoing; President and Director, EquiTrust Series Fund, Inc. and EquiTrust Money Market Fund, Inc.; Member, Growmark, Inc. Coordinating Committee and American Farm Bureau Federation Board of Directors; past member, Cattlemen’s Beef Board; Dairy Farmer. | 13 | Director, Farm Bureau Bank (San Antonio, Texas); Director, Iowa Telecommunications Services, Inc. (Newton, Iowa); Vice Chair, Iowa Economic Development Board (Des Moines, Iowa) | |||||
William J. Oddy (61) | Vice President and Trustee | Since 1981 | Chief Executive Officer and Management Director, FBL Financial Group, Inc.; Chief Executive Officer, Farm Bureau Life Insurance Company and other affiliates of the foregoing; Chief Executive Officer and Director, EquiTrust Life Insurance Company and other affiliates of the foregoing; Chief Executive Officer and Manager, EquiTrust Marketing Services, LLC; Chief Executive Officer and Director, EquiTrust Investment Management Services, Inc.; Vice President and Director, EquiTrust Series Fund, Inc. and EquiTrust Money Market Fund, Inc.; President and Director, FBL Real Estate Ventures, Ltd. | 13 | Director, American Equity Investment Life Insurance Company, Berthel Fisher & Company, Inc. and Berthel Fisher & Company Financial Services, Inc. | |||||
James W. Noyce (50) | Chief Financial Officer and Treasurer | Since 1996 | Chief Financial Officer and Chief Administrative Officer, FBL Financial Group, Inc. and other affiliates of the foregoing; Chief Administrative Officer, Treasurer and Manager, EquiTrust Marketing Services, LLC; Vice President, Treasurer and Director, EquiTrust Investment Management Services, Inc. and other affiliates of the foregoing; President, Treasurer and Director, FBL Leasing Services, Inc.; Chief Executive Officer, Chief Financial Officer and Chief Administrative Officer, Western Computer Services, Inc.; Chief Financial Officer and Treasurer, EquiTrust Series Fund, Inc. and EquiTrust Money Market Fund, Inc. | |||||||
Dennis M. Marker (54) | Chief Executive Officer | Since 1982 | Vice President-Investment Administration, FBL Financial Group, Inc. and other affiliates of the foregoing; President and Director, EquiTrust Investment Management Services, Inc.; Chief Compliance Officer, Vice President-Investment Administration and Manager, EquiTrust Marketing Services, LLC; Chief Executive Officer, EquiTrust Series Fund, Inc. and EquiTrust Money Market Fund, Inc.; Vice President and Director, FBL Leasing Services, Inc. | |||||||
Stephen M. Morain (60) | Senior Vice President and General Counsel | Since 1982 | General Counsel and Assistant Secretary, Iowa Farm Bureau Federation; General Counsel, Secretary and Director, Farm Bureau Management Corporation; Senior Vice President and General Counsel, FBL Financial Group, Inc. and other affiliates of the foregoing; Senior Vice President, General Counsel and Manager, EquiTrust Marketing Services, LLC; Senior Vice President, General Counsel and Director, EquiTrust Investment Management Services, Inc. | |||||||
JoAnn Rumelhart (52) | Executive Vice President | Since 2000 | Executive Vice President, Farm Bureau Life Insurance Company and other affiliates of the foregoing; Executive Vice President and Director, EquiTrust Investment Management Services, Inc.; Executive Vice President and Manager, EquiTrust Marketing Services, LLC.; Executive Vice President, EquiTrust Series Fund, Inc. and EquiTrust Money Market Fund, Inc.; Vice President, EquiTrust Life Insurance Company. | |||||||
John M. Paule (49) | Chief Marketing Officer | Since 2000 | Chief Marketing Officer, FBL Financial Group, Inc. and other affiliates of the foregoing; Executive Vice President, EquiTrust Life Insurance Company; Chief Marketing Officer and Director, EquiTrust Investment Management Services, Inc.; Chief Marketing Officer and Manager, EquiTrust Marketing Services, LLC. | |||||||
Lou Ann Sandburg (57) | Vice President-Investments and Assistant Treasurer | Since 1999 | Vice President-Investments and Assistant Treasurer, FBL Financial Group, Inc. and other affiliates of the foregoing; Chief Compliance Officer, Vice President-Investments, Assistant Treasurer and Director, EquiTrust Investment Management Services, Inc.; Vice President, Assistant Treasurer and Manager, EquiTrust Marketing Services, LLC; Vice President, FBL Financial Services, Inc. and other affiliates of the foregoing; Vice President and Director, FBL Leasing Services, Inc.; Vice President, Secretary and Director, FBL Real Estate Ventures, Ltd. | |||||||
37
| Name, Address and Age | Position(s) Held with Fund | Term of Office & Length of Time Served(1) | Principal Occupation(s) During Past Five Years | Number of Portfolios in Fund Complex Overseen by Trustee | Other Directorships Held by Trustee | |||||
Kristi Rojohn (42) | Chief Compliance Officer, Investment Compliance Vice President and Secretary | Since 1990 | Chief Compliance Officer, Investment Compliance Vice President and Secretary, EquiTrust Series Fund, Inc. and EquiTrust Money Market Fund, Inc.; Investment Compliance Vice President and Secretary, EquiTrust Investment Management Services, Inc. and other affiliates of the foregoing. | |||||||
Rob Ruisch (39) | Mutual Fund Accounting Director | Since 2005 | Mutual Fund Accounting Director, EquiTrust Investment Management Services, Inc. and other affiliates of the foregoing. | |||||||
Karen Garza (36) | Assistant Secretary | Since 2005 | Assistant Secretary, EquiTrust Investment Management Services, Inc. and other affiliates of the foregoing. | |||||||
Rebecca L. Howe (51) | Assistant Secretary | Since 2003 | Assistant Secretary, EquiTrust Investment Management Services, Inc. and other affiliates of the foregoing. | |||||||
Jennifer Morgan (35) | Assistant Secretary | Since 2005 | Assistant Secretary, EquiTrust Investment Management Services, Inc. and other affiliates of the foregoing. | |||||||
Jodi Winslow (30) | Assistant Secretary | Since 2004 | Assistant Secretary, EquiTrust Investment Management Services, Inc. and other affiliates of the foregoing. | |||||||
Non-Interested Persons | ||||||||||
Erwin H. Johnson (63) 1841 March Avenue Charles City, Iowa 50616-9115 | Trustee | Since 1989 | Farmer; Owner and Manager, Center View Farms, Co.; Farm Financial Planner; Iowa State University Cooperative Extension Service; Seed Sales, Syngenta. | 13 | Director, First Security Bank and Trust Co. (Charles City, Iowa) | |||||
Kenneth Kay (63) 51606 590th Street Atlantic, Iowa 50022-8233 | Trustee | Since 1996 | President, K-Ranch Inc. | 13 | Director, First Whitney Bank & Trust (Atlantic, Iowa) | |||||
Steven W. Plate (49) c/o Plate, Baker & Co. 1003 Main Street Grinnell, Iowa 50112 | Trustee | Since 2003 | CPA/Owner, Plate, Baker & Co., P.C., Certified Public Accountants. | 13 | ||||||
James D. Wallace (51) 1111 Ashworth Road West Des Moines, Iowa 50265 | Trustee | Since 2004 | President and CEO, GuideOne Insurance and various subsidiaries; former President and CEO, National Travelers Life Company and various subsidiaries. | 13 | ||||||
Erlin J. Weness (61) 1620 Pinewood Drive Worthington, Minnesota 56187 | Trustee | Since 2003 | Owner and Operator, Weness Consulting; Extension Educator — Farm Management, University of Minnesota. | 13 | Director, First State Bank Southwest (Worthington, Minnesota), First State Insurance Agency (Worthington, Minnesota) and First Rushmore Bancorporation (Worthington, Minnesota) | |||||
| 1 | Officers are elected annually by the Board of Trustees and their terms continue until they are replaced or resign. Each trustee shall serve as trustee until the next meeting of shareholders called for the purpose of conducting the election of such trustee or a successor to such trustee and until a successor is elected and qualified, or until such trustee sooner dies, resigns or is removed. |
| 2 | All interested persons maintain the same business address of 5400 University Avenue, West Des Moines, Iowa 50266. Messrs. Lang and Oddy are interested trustees of the Fund by virtue of their positions with the Adviser, Distributor and/or affiliated persons of the Adviser and Distributor. |
The Statement of Additional Information (“SAI”) includes additional information about Fund trustees and is available upon request without charge. To request a copy of the SAI, please call 1-877-860-2904 M-F 8:00 AM to 4:30 PM.
The officers and trustees of the Fund also serve in similar capacities as officers and directors of EquiTrust Series Fund, Inc. and EquiTrust Money Market Fund, Inc. All of the Fund’s officers and interested trustees are officers and directors of the Adviser and/or the Distributor or an affiliate thereof. Interested trustees serve without any compensation from the Fund. Each of the trustees not affiliated with the Adviser and/or the Distributor or an affiliate thereof is compensated by the Fund. Effective January 1, 2006, each unaffiliated trustee will receive an annual retainer of $8,000 for serving on the boards of all EquiTrust Mutual Funds, and a fee of $1,500 plus expenses for each trustees’ meeting of the EquiTrust Mutual Funds attended. A fee of $1,000 shall be paid for each committee meeting attended. The chairperson of a committee shall be paid $750 for each committee meeting attended. A fee of $250 shall be paid for each telephonic board meeting attended. For the fiscal year ended December 31, 2005, the Fund paid trustees’ fees totaling $25,583.
38
APPROVAL OF THE INVESTMENT ADVISORY CONTRACT
On November 17, 2005 the Board of Trustees, including a majority of the trustees who are not parties to or “interested persons” of either party to the investment advisory contract (the “independent trustees”), approved for continuance the Investment Advisory and Management Services Agreement dated April 6, 1987, as amended August 21, 1996, May 1, 1997 and May 21, 2003 (the “Agreement”) between EquiTrust Variable Insurance Series Fund (the “Fund”) and EquiTrust Investment Management Services, Inc. (the “Adviser”).
The Board of Trustees, including a majority of the independent trustees, determined that approval of the Agreement was in the best interests of the Fund. The independent trustees were assisted by independent legal counsel in making their determination.
The Board noted that the Adviser has managed each Portfolio since its inception. The Board recognizes that a long-term relationship with a capable, conscientious investment adviser is in the best interests of shareholders and that shareholders have invested in the Portfolios knowing that the Adviser managed the Portfolios and knowing the investment advisory fee schedule.
Nature, Quality and Extent of Services. With respect to the nature, quality and extent of the services provided by the Adviser to the Portfolios, the Board considered the functions performed by the Adviser and the personnel providing such services, the Adviser’s financial condition and the compliance regime created by the Adviser, including the fact that the Fund has had no material compliance issues.
The Board also reviewed and discussed reports prepared by the Adviser containing information on each Portfolio’s total returns and average annual total returns over various periods of time as compared to relevant market indices and a peer group of funds pursuing broadly similar strategies. The Board also considered for each Portfolio, with the exception of the Money Market Portfolio, the Portfolio’s Morningstar rating. The Board concluded that as to each Portfolio, the investment performance was satisfactory, and in some cases, good versus relevant market indices, and was in line with the other mutual funds included in the reports. Based on the information provided, the Board concluded that the nature and extent of services provided to each Portfolio were appropriate and that the quality was good.
Fees and Expenses. For each Portfolio, the Board compared the amounts paid to the Adviser for advisory services and each Portfolio’s expense ratio with other registered funds pursuing broadly similar strategies as included in reports prepared by the Adviser. This information showed that, with the exception of the High Grade Bond Portfolio, the advisory fee of each Portfolio was below average compared to other mutual funds pursuing broadly similar strategies. This information also showed that the expense ratio for each Portfolio was below average compared to similar mutual funds. In addition, the Board considered amounts paid to the Adviser by other EquiTrust funds. The Board received information from the Adviser regarding the Adviser’s standard advisory fee schedules for the Adviser’s other clients. With respect to the Adviser’s other clients, the Board considered that the mix of services provided and the level of responsibility required under the Agreement with the Fund were different than the Adviser’s obligations for similar client accounts and that the advisory fees of such accounts are less relevant to the Board’s consideration because they reflect different competitive forces than those in the mutual fund marketplace. With respect to other EquiTrust funds, the Board considered differences in fund and fee structures in light of the different distribution channels of the funds. Based on the information considered, the Board concluded that each Portfolio’s advisory fee was reasonable and appropriate in amount given the quality of services provided.
Profitability. With respect to the costs of services provided and profits realized by the Adviser, the Board considered the advisory fees received by the Adviser from each Portfolio, and requested and received from the Adviser information on each Portfolio’s net assets and expense ratios over a ten-year period. The Board also considered the fact that the Adviser continues to be subject to an expense reimbursement agreement and that the Adviser has kept expenses at a reasonable level. Based on this information, the Board concluded for each Portfolio that the Adviser’s profitability was not unreasonable.
Economies of Scale. The Board considered the extent to which economies of scale would be realized as each Portfolio grows and whether fee levels reflect economies of scale for the benefit of Portfolio shareholders. The Board reviewed each Portfolio’s net assets and expense ratios over a ten-year period. The Board noted that the High Grade Bond, Strategic Yield and Value Growth Portfolios have advisory fee breakpoints designed to share economies of scale with shareholders. The Board also considered that the current size of each Portfolio does not lend itself to economies of scale. The Board concluded with respect to each of the Portfolios, that the total expense ratios were reasonable.
39
Other Benefits to the Adviser and its Affiliates. The Board considered the character and amount of other incidental benefits received by the Adviser and its affiliates from their relationship with the Fund, including fees received by the Adviser for accounting services, shareholder services, dividend disbursing and transfer agent services and fees received by an affiliate of the Adviser for distribution services. The Board also considered that the Adviser does not engage in soft dollar arrangements in connection with brokerage transactions for the Portfolios. The Board concluded that, taking into account these benefits, the Portfolios’ advisory fees were reasonable.
Based on all of the information considered and the conclusions reached, the Board determined to approve the Agreement. The Board of Trustees, including the independent trustees, did not identify any single factor or group of factors as all important or controlling and considered all factors together.
INFORMATION ON PROXY VOTING:
EquiTrust Variable Insurance Series Fund (the “Fund”) has delegated the authority to vote proxies related to the Fund’s portfolio securities to the Fund’s investment adviser, EquiTrust Investment Management Services, Inc. (the “Adviser”). A description of the policies and procedures that the Adviser uses in fulfilling this responsibility is available, without charge, upon request by calling 1-877-860-2904. It also appears in the Fund’s Statement of Additional information, which can be found on the SEC’s website at http://www.sec.gov. The Fund’s proxy voting record for the most recent 12-month period ended June 30, 2005 is available without charge, by calling the toll-free number listed above or by accessing the SEC’s website.
FORM N-Q DISCLOSURE:
The Fund files a complete schedule of portfolio holdings for its first and third quarters of each fiscal year with the SEC on Form N-Q. The Fund’s Forms N-Q are available on the SEC’s website at http://www.sec.gov or may be reviewed and copied at the SEC’s Public Reference Room in Washington, D.C. Information regarding the operation of the Public Reference Room may be obtained by calling 1-800-SEC-0330. A copy of Form N-Q is also available, without charge, by calling the Fund at 1-877-860-2904.
40
Item 2. Code of Ethics.
| (a) | The registrant has adopted a code of ethics that applies to the registrant’s principal executive officer, principal financial officer, principal accounting officer or controller, or persons performing similar functions. A copy of the code of ethics may be obtained upon request, without charge, by contacting the registrant at its principal executive office. |
Item 3. Audit Committee Financial Expert.
| (a) | (1) The registrant’s board of directors has determined that the registrant has at least one audit committee financial expert serving on the audit committee. |
(2) The audit committee financial expert is James D. Wallace. Mr. Wallace is independent as defined in Form N-CSR Item 3(a)(2).
Item 4. Principal Accountant Fees and Services.
| (a) | Audit Fees: For the Fund’s fiscal years ended December 31, 2004 and December 31, 2005, the aggregate fees billed by the Fund’s principal accountant for the audit of the Fund’s financial statements were $49,000 and $54,900, respectively. |
| (b) | Audit-Related Fees: There were no audit-related fees billed to the Fund for the fiscal years ended December 31, 2004 and December 31, 2005. |
| (c) | Tax Fees: None. |
| (d) | All Other Fees: For the Fund’s fiscal years ended December 31, 2004 and December 31, 2005, the aggregate fees billed by the Fund’s principal accountant included fees related to the audits of EquiTrust Series Fund, Inc. and EquiTrust Money Market Fund, Inc.; as well as fees for services performed by the principal accountant for EquiTrust Investment Management Services, Inc. and EquiTrust Marketing Services, LLC, affiliates of the Fund that provide support for the operations of the Fund. The amounts of these fees are as follows: |
Fiscal Year Ended: | December 31, 2004 | December 31, 2005 | ||||
Fees related to audits of EquiTrust Series Fund, Inc. and EquiTrust Money Market Fund, Inc. and for research and consultation on miscellaneous accounting matters | $ | 69,250 | $ | 75,008 | ||
Services performed for EquiTrust Marketing Services, LLC and EquiTrust Investment Management Services, Inc. related to the audits of these entities and for research and consultation on miscellaneous accounting matters | $ | 35,300 | $ | 42,700 | ||
| (e) | (1) The Fund’s Audit Committee adopted the following pre-approval policies and procedures: |
| IV. | RESPONSIBILITIES AND DUTIES |
| To fulfill its responsibilities and duties the Audit Committee shall: |
. . .
| C. | Independent registered public accounting firm |
. . .
| 2. | Pre-approve any engagement of the independent registered public accounting firm to provide any services to the Fund, including the fees and other compensation to be paid to the independent registered public accounting firm. Notwithstanding the above, the independent registered public accounting firm shall not perform any of the following non-audit services for the Fund (“prohibited non-audit services”): |
| a. | bookkeeping or other services related to the accounting records or financial statements of the Fund; |
| b. | financial information systems design and implementation; |
| c. | appraisal or valuation services, fairness opinions, or contribution-in-kind reports; |
| d. | actuarial services; |
| e. | internal audit outsourcing services; |
| f. | management functions or human resources; |
| g. | broker or dealer, investment adviser, or investment banking services; |
| h. | legal services and expert services unrelated to the audit; and |
| i. | any other services that the Public Company Accounting Oversight Board determines are impermissible. |
| 3. | Pre-approve any engagement of the independent registered public accounting firm, including the fees and other compensation to be paid to the independent registered public accounting firm, to provide any non-audit services to the Adviser (or any “control affiliate”1 of the Adviser providing ongoing services to the Fund), if the engagement relates directly to the operations and financial reporting of the Fund. |
| 1 | “Control affiliate” means any entity controlling, controlled by, or under common control with the Adviser. |
| • | The Chairman of the Audit Committee (or in his absence, any member of the Audit Committee) may grant the pre-approval referenced in Sections IV.C. 2 and 3 above for non-prohibited services for engagements of less than $5000. Each member of the Audit Committee shall be notified in writing of the pre-approval promptly following the granting of such approval. In addition, all such delegated pre-approvals shall be presented to the Audit Committee no later than the next Audit Committee meeting. |
| • | Pre-approval of non-audit services for the Fund pursuant to Section IV.C. 2 above is not required, if: |
| (a) | the aggregate amount of all non-audit services provided to the Fund is less than 5% of the total fees paid by the Fund to the independent registered public accounting firm during the fiscal year in which the non-audit services are provided; |
| (b) | the services were not recognized by Fund management at the time of the engagement as non-audit services; and |
| (c) | such services are promptly brought to the attention of the Audit Committee by Fund management and the Audit Committee approves them (which may be by delegation) prior to the completion of the audit. |
| • | Pre-approval of non-audit services for the Adviser (or any affiliate of the Adviser providing ongoing services to the Fund) pursuant to Section IV.C.3 above is not required, if: |
| (a) | the aggregate amount of all non-audit services provided is less than 5% of the total fees paid by the Fund, the Adviser and any “control affiliate” of the Adviser providing ongoing services to the Fund to the independent registered public accounting firm during the fiscal year in which the non-audit services are provided; |
| (b) | the services were not recognized by Fund management at the time of the engagement as non-audit services; and |
| (c) | such services are promptly brought to the attention of the Audit Committee by Fund management and the Audit Committee approves them (which may be by delegation) prior to the completion of the audit. |
. . .
| (e) | (2) Not applicable. |
| (f) | Not applicable. |
| (g) | Aggregate Non-audit Fees: There were no non-audit fees billed by the Fund’s principal accountant for services rendered to the Fund, the Fund’s investment adviser or any entity controlling, controlled by, or under common control with the Fund’s investment adviser that provides ongoing services to the Fund for the fiscal years ended December 31, 2004 and December 31, 2005. |
| (h) | The Audit Committee of the Board of Trustees of the Fund has reviewed the statement of independence provided by Ernst & Young, the Fund’s principal accountant, considered whether the provision of non-audit services by the firm to the Fund’s investment adviser and any entity controlling, controlled by, or under common control with the adviser that provides ongoing services to the Fund is compatible with such firm’s independence with respect to the Fund, and concluded that the non-audit services provided by Ernst & Young does not compromise that firm’s independence with regard to the Fund. |
Item 5. Audit Committee of Listed Registrants.
Not applicable.
Item 6. Schedule of Investments.
See Item 1.
Item 7. Disclosure of Proxy Voting Policies and Procedures for Closed-End Management Investment Companies.
Not applicable.
Item 8. Portfolio Managers of Closed-End Management Investment Companies.
Not applicable.
Item 9. Purchases of Equity Securities by Closed-End Management Investment Companies and Affiliated Purchasers.
Not applicable.
Item 10. Submission of Matters to a Vote of Security Holders.
There have been no material changes to the procedures by which shareholders may recommend nominees to the registrant’s board of trustees since the registrant last provided disclosure in response to this Item.
Item 11. Controls and Procedures
| (a) | The registrant’s principal executive and principal financial officers, or persons performing similar functions, have concluded that the registrant’s disclosure controls and procedures (as defined in Rule 30a-3(c) under the Investment Company Act of 1940, as amended (the “1940 Act”) (17 CFR 270.30a-3(c))) are effective, as of a date within 90 days of the filing date of the report that includes the disclosure required by this paragraph, based on their evaluation of these controls and procedures required by Rule 30a-3(b) under the 1940 Act (17 CFR 270.30a-3(b)) and Rules 13a-15(b) or 15d-15(b) under the Exchange Act (17 CFR 240.13a-15(b) or 240.15d-15(b)). |
| (b) | There has been no change to the registrant’s internal control over financial reporting that occurred during the registrant’s most recent fiscal quarter that has materially affected, or is reasonably likely to materially affect, the registrant’s internal control over financial reporting. |
Item 12. Exhibits.
| (a)(1) | Not applicable. See Item 2(a). | |
| (a)(2) | Certifications pursuant to Section 302 of the Sarbanes-Oxley Act of 2002 are filed as exhibits hereto. | |
| (a)(3) | Not applicable. | |
| (b) | Certifications pursuant to Section 906 of the Sarbanes-Oxley Act of 2002 are filed as exhibits hereto. | |
SIGNATURES
Pursuant to the requirements of the Securities Exchange Act of 1934 and the Investment Company Act of 1940, the registrant has duly caused this report to be signed on its behalf by the undersigned, thereunto duly authorized.
(Registrant) | EquiTrust Variable Insurance Series Fund |
By: | /s/ Dennis M. Marker | |
Name: | Dennis M. Marker | |
Title: | Chief Executive Officer | |
Date: | February 24, 2006 |
Pursuant to the requirements of the Securities Exchange Act of 1934 and the Investment Company Act of 1940, this report has been signed below by the following persons on behalf of the registrant and in the capacities and on the dates indicated.
By: | /s/ Dennis M. Marker | |
Name: | Dennis M. Marker | |
Title: | Chief Executive Officer | |
Date: | February 24, 2006 |
By: | /s/ James W. Noyce | |
Name: | James W. Noyce | |
Title: | Chief Financial Officer | |
Date: | February 24, 2006 |