UNITED STATES
SECURITIES AND EXCHANGE COMMISSION
Washington, D.C. 20549
FORM N-CSR
CERTIFIED SHAREHOLDER REPORT OF REGISTERED
MANAGEMENT INVESTMENT COMPANIES
Investment Company Act file number 33-12791 & 811-5069
EquiTrust Variable Insurance Series Fund
(Exact name of registrant as specified in charter)
| 5400 University Avenue, West Des Moines IA | 50266-5997 | |
| (Address of principal executive offices) | (Zip code) |
Kristi Rojohn, 5400 University Avenue, West Des Moines IA 50266-5997
(Name and address of agent for service)
Registrant’s telephone number, including area code: 515/225-5400
Date of fiscal year end: December 31, 2008
Date of reporting period: December 31, 2008
| Item 1. | Reports to Stockholders. |
EquiTrust Variable Insurance Series Fund

ANNUAL REPORT
DECEMBER 31, 2008

5400 University Avenue
West Des Moines, IA 50266
1-877-860-2904
1-515-225-5586
This report is not to be distributed unless preceded or accompanied by a current prospectus.
February 5, 2009
PRESIDENT’S LETTER
Dear Shareholders:
In our last letter, we noted the apparent slowing in the U.S. economy. This descent started at the tail-end of 2007 but then picked up speed in the last three to four months of 2008. U.S. GDP was positive through the first half of 2008 and initially into the third quarter. The final revision to third quarter 2008 GDP, however, showed a decline, and analysts now expect the U.S. economy to continue contracting through the first half of 2009.
The deterioration in the overall economy reflects weakness in key contributors. Domestic industrial production has contracted at a pace at least equal to that of prior recessions, while slowing economies outside of the United States further implies leaner times for multinational U.S. companies. The U.S. unemployment rate continues to climb as companies trim workforces according to expectations for weakening demand. Ultimately, domestic sales are expected to decline as consumers consume less, pay down debt and save more.
The U.S. government has stepped in on numerous fronts, most recently in the form of a massive fiscal stimulus bill. You’re likely familiar with some of the other economic and financial intervention: capital injections for large U.S. banks; unlimited guarantees on bank deposits; the effective takeover of mortgage giants Fannie Mae and Freddie Mac; and the Fed cutting interest rates. Other, lesser-known programs have consisted of government guarantees on commercial paper and also on longer-term bank-issued debt. Governments and central banks around the world have engaged in similar programs to keep credit, goods and services flowing and, ultimately, to keep economies from shrinking.
This weak worldwide economic environment made 2008 a miserable year for financial assets. The S&P 500 Stock Composite Index (the “S&P 500”) declined 37.00% and, as measured by the Russell 2000 Index, domestic small cap stocks fell 33.79%. The MSCI EAFE Index, a measure of the stock markets of non-U.S. developed economies, tumbled 43.06%. The MSCI Emerging Markets Index, which measures the stock performance of developing world economies, returned (53.18)% for the year. Among fixed-income benchmarks, it was rare to find positive returns outside of those indices consisting of U.S. Treasury and/or high quality mortgage-backed securities (“MBS”). Gold was one of the few asset classes that provided a positive return in 2008.
The declines in the equity and even fixed-income markets were obviously disturbing, as investors withdrew billions from both stock and bond funds in 2008. Dislocations in the financial markets historically have provided opportunities for investors with long investment horizons. However, we would emphasize the importance of asset allocation and risk management for investors of all time horizons. Risk management is a crucial element in the investment strategies of our portfolio managers. Additionally, the EquiTrust Portfolios offer investors exposure to the domestic equity and fixed-income markets, generally important elements of an asset allocation strategy. Please read the proceeding “Management’s Discussion of Fund Performance” to see how the EquiTrust Variable Series Fund Portfolios performed in the latest 12-month period, which coincides with the calendar year ended December 31, 2008.
We appreciate your investment in the Fund and we take seriously our tasks of growing and protecting that investment. Thank you for continued support of the Fund.

Craig A. Lang
President
Past performance is not a guarantee of future results.
2
MANAGEMENT’S DISCUSSION OF FUND PERFORMANCE
PERFORMANCE GRAPH WORKSHEET
Comparison of Change in Value of $10,000 Investment in
the Value Growth Portfolio and S&P 500
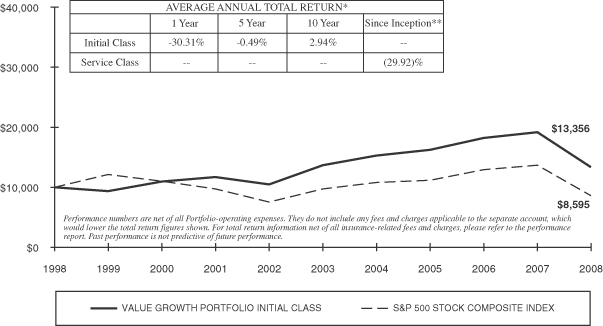
The Initial Class of the Value Growth Portfolio returned (30.31)% for the period, compared to (37.00)% for the S&P 500. The Portfolio’s Service Class was incepted June 1, 2008, but assuming the shares had been available for the entire 12-month period their return would have been (30.56)%.
All sectors in the S&P 500 (the “Index”) incurred losses for this 12-month period. The financials sector accounted for the largest part of the Index’s decline, but the technology, energy and industrials stocks were strongly negative, as well. Consumer staples was the S&P 500’s best performing sector, returning (16.47)% for the period.
The Value Growth Portfolio incurred a loss for the period because it holds equities which, in general, declined over this period. However, the Portfolio returned a smaller loss than the S&P 500. We have avoided a number of the financial companies in the S&P 500 that have accounted for the largest losses for the Index, while in the technology sector the Portfolio benefited from our emphasis on high quality, attractively valued companies. The Portfolio remains overweight health care stocks, and this led to positive relative performance within the sector. Finally, the Portfolio’s gold exposure contributed to its better performance in the materials sector. Partially offsetting these positive factors, the Portfolio’s energy and industrials exposures lagged the Index’s members within these two sectors.
We remain most attracted to the large company segment of the domestic equity markets. Valuation remains more attractive for large-caps than small-caps, while large-caps tend to perform better in the current environment of broad economic uncertainty and tight credit markets.
| * | Returns shown do not reflect the deduction of taxes that a shareholder may pay on Portfolio distributions or the redemption of Portfolio shares. |
| ** | Since Inception figures are calculated from June 1, 2008, the date Service Class Shares were first offered. |
3
PERFORMANCE GRAPH WORKSHEET
Comparison of Change in Value of $10,000 Investment in
the High Grade Bond Portfolio and Lehman Brothers U.S. Aggregate Index
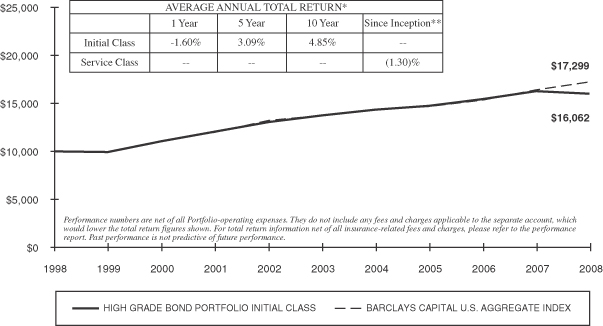
During the twelve-month period, the High Grade Bond Portfolio Initial Class underperformed the Barclays Capital U.S. Aggregate Index (the “Index”), as reflected by the (1.60)% total return produced by the Portfolio versus the 5.24% total return produced by the Index. The Portfolio’s Service Class was incepted June 1, 2008, but assuming the shares were available for the entire 12-month period they would have returned (1.85)%.
The total returns for the major components of the Index for this period were as follows: Mortgage Backed Securities (40% of the Index), 4.34%; Treasury Securities (25% of the Index), 13.74%; Investment Grade Corporate Securities (18% of the Index), (4.94)%. In comparison, the Portfolio had approximately 56% invested in government fixed rate mortgage-backed or agency securities, 32% of its assets invested in corporate securities, 11% in cash equivalents and 1% in commercial mortgage-backed securities. The Index had an effective duration1 of 3.71 as of December 31, 2008. The effective duration of the Portfolio was 3.44. The Portfolio underperformed the Index mainly because the Portfolio’s overexposure to underperforming corporate issues and underexposure to outperforming Treasuries, as well as, Portfolio expenses.
The composition of the Portfolio at the end of the reporting period changed slightly with a decrease in corporate issues and an increase in government fixed rate mortgage-backed securities. Going forward, we anticipate continuing to maintain a duration close to that of the Index but additional purchases will probably be focused on the corporate bond sector given the historically wide spreads available in that sector.
1 | Duration is a measure of interest rate risk for individual securities and portfolios. The lower the duration for a security or portfolio, the less sensitive it is to movements in interest rates. |
| * | Returns shown do not reflect the deduction of taxes that a shareholder may pay on Portfolio distributions or the redemption of Portfolio shares. |
| ** | Since Inception figures are calculated from June 1, 2008, the date Service Class Shares were first offered. |
4
PERFORMANCE GRAPH WORKSHEET
Comparison of Change in Value of $10,000 Investment in
the Strategic Yield Portfolio and Barclays Capital U.S. Credit/High Yield Index
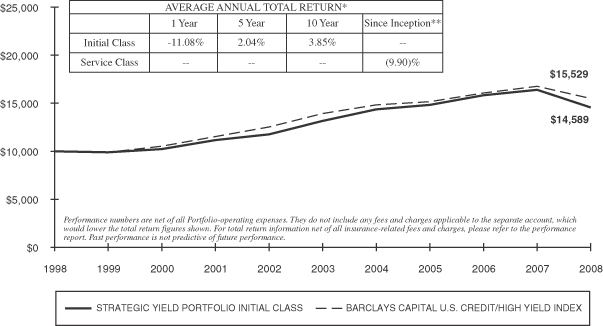
During the twelve-month period, the Initial Class of the Strategic Yield Portfolio produced a total return of (11.08)%. The Service Class was incepted June 1, 2008, but assuming the shares had been available for the entire 12-month period they would have returned (11.33)%. Both share classes trailed the (7.48)% return produced by the Barclays Capital U.S. Credit/High Yield Index (the “Index”).
The total returns for the two components of the Index over this period were as follows: Investment Grade Credit (86% of the Index), (3.08)%; and Corporate High Yield (14% of the Index), (17.88)%. In comparison, the Portfolio had approximately 44% of its assets invested in corporate securities rated investment grade by both Moody’s and Standard & Poor’s, 27% of its assets invested in corporate securities rated as non-investment grade or high yield by Moody’s and/or Standard & Poor’s, 22% of its assets invested in U.S. Government Agency issues, and 7% in cash equivalents. The Portfolio underperformed the overall Index mainly due to its larger exposure to underperforming high yield issues and fund expenses.
The Portfolio has historically invested in a mix of high yield and investment grade issues attempting to find attractive issues in both markets. Both the investment grade and high yield corporate bond markets are trading at historically wide levels and appear to already be discounting very difficult economic conditions.
| * | Returns shown do not reflect the deduction of taxes that a shareholder may pay on Portfolio distributions or the redemption of Portfolio shares. |
| ** | Since Inception figures are calculated from June 1, 2008, the date Service Class Shares were first offered. |
5
PERFORMANCE GRAPH WORKSHEET
Comparison of Change in Value of $10,000 Investment in
the Managed Portfolio and S&P 500
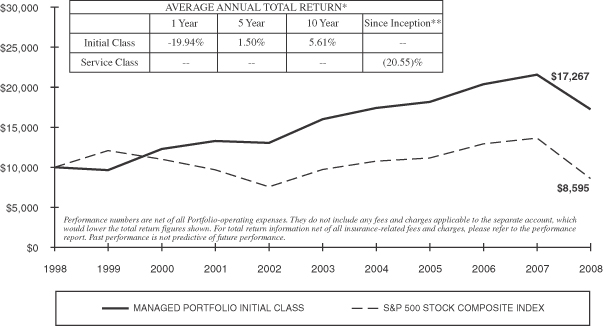
The Initial Class of the Managed Portfolio returned (19.94)% for the twelve-month period. The Service Class was incepted on June 1, 2008, but assuming it had been available for the entire 12-month period its return would have been (20.19)%. In comparison, the S&P 500 returned (37.00)% for the year. The Managed Portfolio is a tactical asset allocation portfolio, with an investment emphasis on securities producing income and the potential for capital appreciation. For this reason, neither its performance nor its constitution will likely mirror any one particular equity index over long periods of time.
The Portfolio outperformed the S&P 500 as a function of better performance in its equity allocation and positive returns in its cash and fixed-income allocations. The Portfolio’s stocks declined for the year but outperformed the S&P 500 in the financials, materials, technology and health care sectors. Additionally, the Portfolio’s cash and fixed-income allocations generated positive returns for the year. The combination of these factors contributed to the Portfolio’s substantial out-performance for the year.
Within the Portfolio’s equity allocation, we continue to focus on the stocks of large, dividend-paying high-quality companies. Given the low yields on high quality fixed-income issues, we see greater value in stocks. Consequently, we have even been shifting the Portfolio out of some of its fixed-income holdings in favor of adding more to the equity allocation.
| * | Returns shown do not reflect the deduction of taxes that a shareholder may pay on Portfolio distributions or the redemption of Portfolio shares. |
| ** | Since Inception figures are calculated from June 1, 2008, the date Service Class Shares were first offered. |
6
PERFORMANCE GRAPH WORKSHEET
Comparison of Change in Value of $10,000 Investment in
the Blue Chip Portfolio and S&P 500
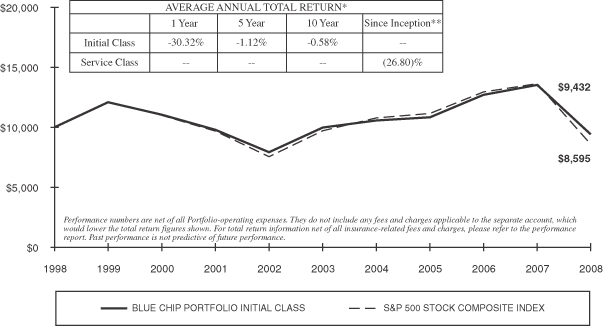
The Blue Chip Portfolio is designed to represent the large-capitalization sector of the domestic equity market, and remains substantially invested in approximately 50 such common stock issues. Given the Portfolio’s constitution, its performance will track the broad-market S&P 500, but will be most similar to that of the large-capitalization segment within the S&P 500.
The Portfolio’s Initial Class generated a return of (30.32)% for the period. The Service Class was incepted June 1, 2008, but assuming they had been available for all of the 12-month period the Service Class shares would have returned (30.57)%. In comparison, the S&P 500 returned (37.00)%. Over this period, the S&P 500’s largest members, sometimes referred to as “mega-caps” and consisting of companies such as GE, Procter & Gamble and Johnson & Johnson, generally performed better than its smaller members. The Blue Chip Portfolio, consequently, outperformed the S&P 500 because it is weighted most heavily in these domestic mega-caps.
Again, the Portfolio is most concentrated in the S&P 500’s largest companies; roughly 90% of its holdings fall in the Index’s top half by market capitalization. The Portfolio’s performance, therefore, should track that of the largest members in the S&P 500.
| * | Returns shown do not reflect the deduction of taxes that a shareholder may pay on Portfolio distributions or the redemption of Portfolio shares. |
| ** | Since Inception figures are calculated from June 1, 2008, the date Service Class Shares were first offered. |
7
EQUITRUST VARIABLE INSURANCE SERIES FUND
December 31, 2008
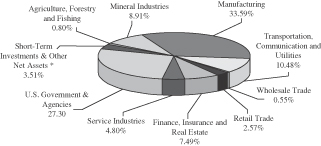
Value Growth Portfolio
Portfolio Holdings by Industry Sector
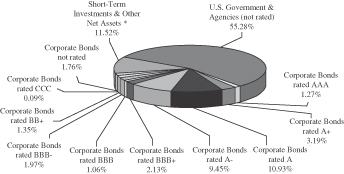
High Grade Bond Portfolio
Portfolio Holdings by Credit Quality and Type of Security**
Strategic Yield Portfolio
Portfolio Holdings by Credit Quality and Type of Security**
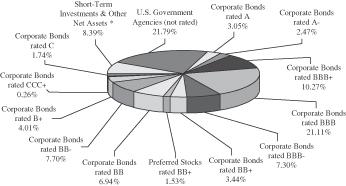
| * | This category may include short-term investments in commercial paper, money market mutual funds and U.S. government agencies, along with cash, receivables, prepaid expenses and other assets, less liabilities. |
| ** | Credit quality as reported by Standard & Poor’s. |
8
EQUITRUST VARIABLE INSURANCE SERIES FUND
December 31, 2008
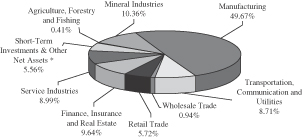
Managed Portfolio
Portfolio Holdings by Industry Sector
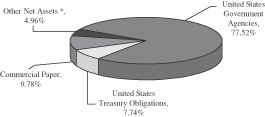
Money Market Portfolio
Portfolio Holdings by Asset Type
Blue Chip Portfolio
Portfolio Holdings by Industry Sector
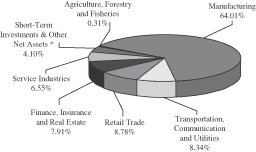
| * | This category may include short-term investments in commercial paper, money market mutual funds and U.S. government agencies, along with cash, receivables, prepaid expenses and other assets, less liabilities. |
9
Expense Example:
As a shareholder of the Fund, you may incur ongoing costs, including management fees and other Fund/class expenses. This Example is intended to help you understand your ongoing costs (in dollars) of investing in a given Portfolio and Share Class of the Fund and to compare these costs with the ongoing costs of investing in other mutual funds. The Example is based on an investment of $1,000 invested on July 1, 2008 and held until December 31, 2008.
Actual Expenses –
The first line for each Portfolio and Share Class in the following table provides information about actual account values and actual expenses for that Portfolio and Share Class. You may use the information in this line, together with the amount you invested, to estimate the expenses that you paid over the period. Simply divide your account value by $1,000 (for example, an $8,600 account value divided by $1,000 = 8.6), then multiply the result by the number in the first line under the heading entitled “Expenses Paid During Period” for the same Portfolio and Share Class to estimate the expenses you paid on your account during this period.
Hypothetical Example for Comparison Purposes –
The second line for each Portfolio and Share Class in the following table provides information about hypothetical account values and hypothetical expenses based on the actual expense ratio of that Portfolio and Share Class and an assumed rate of return of 5% per year before expenses, which is not the actual return of the Portfolio and Share Class. The hypothetical account values and expenses may not be used to estimate the actual ending account balance or expenses you paid for the period. You may use this information to compare the ongoing costs of investing in a given Portfolio and Share Class of the Fund with other funds. To do so, compare this 5% hypothetical example with the 5% hypothetical examples that appear in the shareholder reports of the other funds.
10
| Portfolio and Share Class | Beginning Account 7/1/2008 | Ending Account 12/31/2008 | Expenses Paid 7/1/2008 - 12/31/2008 | Annualized Expense Ratio (1) | ||||||||
Value Growth — IC | 0.59 | % | ||||||||||
Actual | $ | 1,000 | $ | 751.00 | $ | 2.60 | ||||||
Hypothetical (2) | $ | 1,000 | $ | 1,022.03 | $ | 3.00 | ||||||
Value Growth — SC | 0.85 | % | ||||||||||
Actual | $ | 1,000 | $ | 750.20 | $ | 3.74 | ||||||
Hypothetical (2) | $ | 1,000 | $ | 1,020.73 | $ | 4.31 | ||||||
High Grade Bond — IC | 0.43 | % | ||||||||||
Actual | $ | 1,000 | $ | 989.40 | $ | 2.17 | ||||||
Hypothetical (2) | $ | 1,000 | $ | 1,022.82 | $ | 2.21 | ||||||
High Grade Bond — SC | 0.68 | % | ||||||||||
Actual | $ | 1,000 | $ | 988.20 | $ | 3.41 | ||||||
Hypothetical (2) | $ | 1,000 | $ | 1,021.57 | $ | 3.47 | ||||||
Strategic Yield — IC | 0.59 | % | ||||||||||
Actual | $ | 1,000 | $ | 902.70 | $ | 2.80 | ||||||
Hypothetical (2) | $ | 1,000 | $ | 1,022.06 | $ | 2.98 | ||||||
Strategic Yield — SC | 0.84 | % | ||||||||||
Actual | $ | 1,000 | $ | 901.60 | $ | 3.99 | ||||||
Hypothetical (2) | $ | 1,000 | $ | 1,020.80 | $ | 4.24 | ||||||
Managed — IC | 0.56 | % | ||||||||||
Actual | $ | 1,000 | $ | 835.40 | $ | 2.59 | ||||||
Hypothetical (2) | $ | 1,000 | $ | 1,022.18 | $ | 2.85 | ||||||
Managed — SC | 0.81 | % | ||||||||||
Actual | $ | 1,000 | $ | 834.00 | $ | 3.75 | ||||||
Hypothetical (2) | $ | 1,000 | $ | 1,020.91 | $ | 4.13 | ||||||
Money Market — IC | 0.46 | % | ||||||||||
Actual | $ | 1,000 | $ | 1,007.00 | $ | 2.33 | ||||||
Hypothetical (2) | $ | 1,000 | $ | 1,022.68 | $ | 2.35 | ||||||
Money Market — SC | 0.69 | % | ||||||||||
Actual | $ | 1,000 | $ | 1,005.80 | $ | 3.50 | ||||||
Hypothetical (2) | $ | 1,000 | $ | 1,021.51 | $ | 3.53 | ||||||
Blue Chip — IC | 0.32 | % | ||||||||||
Actual | $ | 1,000 | $ | 805.10 | $ | 1.44 | ||||||
Hypothetical (2) | $ | 1,000 | $ | 1,023.40 | $ | 1.62 | ||||||
Blue Chip — SC | 0.57 | % | ||||||||||
Actual | $ | 1,000 | $ | 804.20 | $ | 2.60 | ||||||
Hypothetical (2) | $ | 1,000 | $ | 1,022.12 | $ | 2.91 | ||||||
| (1) | Expenses are equal to the Annualized Expense Ratio as shown in the table for each Portfolio and Class, multiplied by the average account value over the period, multiplied by 184 days, and divided by 366 to reflect the one-half year period. |
| (2) | Hypothetical examples are based on 5% return before expenses. |
11
EQUITRUST VARIABLE INSURANCE SERIES FUND
STATEMENTS OF ASSETS AND LIABILITIES
December 31, 2008
| Value Growth Portfolio | High Grade Bond Portfolio | Strategic Yield Portfolio | Managed Portfolio | Money Market Portfolio | Blue Chip Portfolio | ||||||||||||||||||
ASSETS | |||||||||||||||||||||||
Investments in securities, at value (cost—$58,188,144; $47,219,454; $44,019,992; $83,352,608; $14,091,767; and $62,355,572, respectively) | $ | 45,530,458 | $ | 44,067,159 | $ | 36,024,062 | $ | 72,597,491 | $ | 14,091,767 | $ | 62,767,957 | |||||||||||
Cash | — | — | — | — | 665,838 | — | |||||||||||||||||
Receivables: | |||||||||||||||||||||||
Accrued dividends and interest | 82,910 | 358,380 | 601,395 | 192,045 | 546 | 133,257 | |||||||||||||||||
Fund shares sold | 22,845 | 32,476 | 7,253 | 32,313 | 95,681 | 34,923 | |||||||||||||||||
Prepaid expense and other assets | 68,777 | 229 | 220 | 103,293 | 86 | 246 | |||||||||||||||||
Total Assets | 45,704,990 | 44,458,244 | 36,632,930 | 72,925,142 | 14,853,918 | 62,936,383 | |||||||||||||||||
LIABILITIES | |||||||||||||||||||||||
Payables: | |||||||||||||||||||||||
Fund shares redeemed | 43,286 | 48,705 | 43,185 | 72,561 | 17,164 | 62,519 | |||||||||||||||||
Investment securities purchased | 893,235 | — | — | 1,088,674 | — | — | |||||||||||||||||
Dividends | — | 22 | 28 | — | 560 | — | |||||||||||||||||
Accrued expenses | 10,355 | 8,191 | 8,253 | 11,287 | 7,663 | 12,176 | |||||||||||||||||
Total Liabilities | 946,876 | 56,918 | 51,466 | 1,172,522 | 25,387 | 74,695 | |||||||||||||||||
| NET ASSETS | $ | 44,758,114 | $ | 44,401,326 | $ | 36,581,464 | $ | 71,752,620 | $ | 14,828,531 | $ | 62,861,688 | |||||||||||
ANALYSIS OF NET ASSETS | |||||||||||||||||||||||
Paid-in capital | $ | 57,643,172 | $ | 47,395,987 | $ | 46,644,650 | $ | 80,126,465 | $ | 14,828,531 | $ | 66,966,757 | |||||||||||
Accumulated undistributed net investment income | 953,655 | — | — | 2,336,486 | — | 1,951,148 | |||||||||||||||||
Accumulated undistributed net realized gain (loss) from investment transactions | (1,181,027 | ) | 157,634 | (2,067,256 | ) | 44,786 | — | (6,468,582 | ) | ||||||||||||||
Net unrealized appreciation (depreciation) of investments | (12,657,686 | ) | (3,152,295 | ) | (7,995,930 | ) | (10,755,117 | ) | — | 412,385 | |||||||||||||
| NET ASSETS | $ | 44,758,114 | $ | 44,401,326 | $ | 36,581,464 | $ | 71,752,620 | $ | 14,828,531 | $ | 62,861,688 | |||||||||||
See accompanying notes.
12
EQUITRUST VARIABLE INSURANCE SERIES FUND
STATEMENTS OF ASSETS AND LIABILITIES (continued)
December 31, 2008
| Value Growth Portfolio | High Grade Bond Portfolio | Strategic Yield Portfolio | Managed Portfolio | Money Market Portfolio | Blue Chip Portfolio | |||||||||||||
NET ASSET VALUE PER SHARE | ||||||||||||||||||
Initial Class: Net Assets | $ | 44,595,454 | $ | 41,602,555 | $ | 36,344,913 | $ | 71,043,761 | $ | 14,631,440 | $ | 62,138,293 | ||||||
Shares issued and outstanding | 4,550,448 | 4,393,356 | 4,869,599 | 5,957,368 | 14,631,440 | 2,149,413 | ||||||||||||
Net asset value per share | $ | 9.80 | $ | 9.47 | $ | 7.46 | $ | 11.93 | $ | 1.00 | $ | 28.91 | ||||||
Service Class: Net Assets | $ | 162,660 | $ | 2,798,771 | $ | 236,551 | $ | 708,859 | $ | 197,091 | $ | 723,395 | ||||||
Shares issued and outstanding | 16,617 | 295,508 | 31,689 | 59,539 | 197,091 | 25,058 | ||||||||||||
Net asset value per share | $ | 9.79 | $ | 9.47 | $ | 7.46 | $ | 11.91 | $ | 1.00 | $ | 28.87 | ||||||
See accompanying notes.
13
EQUITRUST VARIABLE INSURANCE SERIES FUND
STATEMENTS OF OPERATIONS
Year Ended December 31, 2008
| Value Growth Portfolio | High Grade Bond Portfolio | Strategic Yield Portfolio | Managed Portfolio | Money Market Portfolio | Blue Chip Portfolio | |||||||||||||||||||
INVESTMENT INCOME | ||||||||||||||||||||||||
Dividends | $ | 1,196,707 | $ | — | $ | 54,587 | $ | 1,524,259 | $ | — | $ | 2,133,499 | ||||||||||||
Interest | 101,757 | 2,506,634 | 2,873,160 | 1,298,619 | 376,620 | 62,519 | ||||||||||||||||||
Less foreign tax withholding | (5,283 | ) | — | — | (7,315 | ) | — | — | ||||||||||||||||
Total Investment Income | 1,293,181 | 2,506,634 | 2,927,747 | 2,815,563 | 376,620 | 2,196,018 | ||||||||||||||||||
EXPENSES | ||||||||||||||||||||||||
| Paid to Affiliates: | ||||||||||||||||||||||||
Investment advisory and management fees | 265,124 | 138,451 | 192,206 | 390,258 | 39,647 | 159,092 | ||||||||||||||||||
Distribution fees | 127 | 1,961 | 150 | 330 | 116 | 538 | ||||||||||||||||||
Accounting fees | 29,458 | 23,075 | 21,356 | 30,000 | 7,929 | 30,000 | ||||||||||||||||||
Custodian fees | 7,114 | 7,101 | 5,697 | 7,832 | 9,108 | 5,586 | ||||||||||||||||||
Professional fees | 16,798 | 14,442 | 13,926 | 20,246 | 11,303 | 21,032 | ||||||||||||||||||
Trustees' fees and expenses | 5,570 | 4,426 | 4,028 | 8,221 | 1,529 | 7,545 | ||||||||||||||||||
Reports to shareholders | 6,099 | 4,398 | 4,209 | 8,792 | 1,526 | 8,295 | ||||||||||||||||||
Insurance and bonds | 2,534 | 1,795 | 1,739 | 3,674 | 612 | 3,614 | ||||||||||||||||||
Proxy expense | 3,471 | 2,512 | 2,419 | 5,086 | 928 | 4,774 | ||||||||||||||||||
Miscellaneous | 3,239 | 2,269 | 2,194 | 4,650 | 808 | 4,405 | ||||||||||||||||||
Total Expenses | 339,534 | 200,430 | 247,924 | 479,089 | 73,506 | 244,881 | ||||||||||||||||||
Waiver of fees | — | — | — | — | (1,329 | ) | — | |||||||||||||||||
Fees paid indirectly | (8 | ) | (6 | ) | (6 | ) | (12 | ) | (2 | ) | (11 | ) | ||||||||||||
Net Expenses | 339,526 | 200,424 | 247,918 | 479,077 | 72,175 | 244,870 | ||||||||||||||||||
Net Investment Income | 953,655 | 2,306,210 | 2,679,829 | 2,336,486 | 304,445 | 1,951,148 | ||||||||||||||||||
NET REALIZED AND UNREALIZED GAIN (LOSS) ON INVESTMENTS | ||||||||||||||||||||||||
Net realized gain (loss) from investment transactions | (1,090,582 | ) | 157,634 | (1,328 | ) | (70,648 | ) | — | (1,902,319 | ) | ||||||||||||||
Change in unrealized appreciation (depreciation) of investments | (19,897,585 | ) | (3,310,028 | ) | (7,497,534 | ) | (20,814,564 | ) | — | (28,094,020 | ) | |||||||||||||
Net Loss on Investments | (20,988,167 | ) | (3,152,394 | ) | (7,498,862 | ) | (20,885,212 | ) | — | (29,996,339 | ) | |||||||||||||
Net Increase (Decrease) in Net Assets Resulting from Operations | $ | (20,034,512 | ) | $ | (846,184 | ) | $ | (4,819,033 | ) | $ | (18,548,726 | ) | $ | 304,445 | $ | (28,045,191 | ) | |||||||
See accompanying notes.
14
EQUITRUST VARIABLE INSURANCE SERIES FUND
STATEMENTS OF CHANGES IN NET ASSETS
| Value Growth Portfolio | High Grade Bond Portfolio | Strategic Yield Portfolio | ||||||||||||||||||||||
| Year Ended December 31, | Year Ended December 31, | Year Ended December 31, | ||||||||||||||||||||||
| 2008 | 2007 | 2008 | 2007 | 2008 | 2007 | |||||||||||||||||||
OPERATIONS | ||||||||||||||||||||||||
Net investment income | $ | 953,655 | $ | 1,502,365 | $ | 2,306,210 | $ | 2,247,831 | $ | 2,679,829 | $ | 2,722,242 | ||||||||||||
Net realized gain (loss) from investment transactions | (1,090,582 | ) | 2,409,768 | 157,634 | 29,609 | (1,328 | ) | 1,755 | ||||||||||||||||
Change in unrealized appreciation (depreciation) of investments | (19,897,585 | ) | (453,003 | ) | (3,310,028 | ) | 45,176 | (7,497,534 | ) | (1,224,366 | ) | |||||||||||||
Net Increase (Decrease) in Net Assets Resulting from Operations | (20,034,512 | ) | 3,459,130 | (846,184 | ) | 2,322,616 | (4,819,033 | ) | 1,499,631 | |||||||||||||||
DIVIDENDS AND DISTRIBUTIONS TO SHAREHOLDERS FROM | ||||||||||||||||||||||||
| Net investment income: | ||||||||||||||||||||||||
Initial Class | (1,502,365 | ) | (1,163,459 | ) | (2,267,446 | ) | (2,247,831 | ) | (2,675,714 | ) | (2,722,242 | ) | ||||||||||||
Service Class | — | — | (38,764 | ) | — | (4,115 | ) | — | ||||||||||||||||
Net realized gain from investment transactions: | ||||||||||||||||||||||||
Initial Class | (2,736,188 | ) | (2,257,123 | ) | (19,907 | ) | (21,030 | ) | — | — | ||||||||||||||
Service Class . | — | — | — | — | — | — | ||||||||||||||||||
Total Dividends and Distributions | (4,238,553 | ) | (3,420,582 | ) | (2,326,117 | ) | (2,268,861 | ) | (2,679,829 | ) | (2,722,242 | ) | ||||||||||||
| CAPITAL SHARE TRANSACTIONS | 1,161,657 | 2,118,738 | 1,534,435 | 6,614,216 | (1,166,815 | ) | 4,988,713 | |||||||||||||||||
Total Increase (Decrease) in Net Assets | (23,111,408 | ) | 2,157,286 | (1,637,866 | ) | 6,667,971 | (8,665,677 | ) | 3,766,102 | |||||||||||||||
NET ASSETS | ||||||||||||||||||||||||
Beginning of year . | 67,869,522 | 65,712,236 | 46,039,192 | 39,371,221 | 45,247,141 | 41,481,039 | ||||||||||||||||||
End of year (including accumulated undistributed net investment income as set forth below) . | $ | 44,758,114 | $ | 67,869,522 | $ | 44,401,326 | $ | 46,039,192 | $ | 36,581,464 | $ | 45,247,141 | ||||||||||||
Accumulated Undistributed Net Investment Income. | $ | 953,655 | $ | 1,502,365 | $ | — | $ | — | $ | — | $ | — | ||||||||||||
See accompanying notes.
15
EQUITRUST VARIABLE INSURANCE SERIES FUND
STATEMENTS OF CHANGES IN NET ASSETS (continued)
| Managed Portfolio | Money Market Portfolio | Blue Chip Portfolio | ||||||||||||||||||||||
| Year Ended December 31, | Year Ended December 31, | Year Ended December 31, | ||||||||||||||||||||||
| 2008 | 2007 | 2008 | 2007 | 2008 | 2007 | |||||||||||||||||||
OPERATIONS | ||||||||||||||||||||||||
Net investment income | $ | 2,336,486 | $ | 3,357,314 | $ | 304,445 | $ | 670,368 | $ | 1,951,148 | $ | 1,916,168 | ||||||||||||
Net realized gain (loss) from investment transactions | (70,648 | ) | 3,101,563 | — | — | (1,902,319 | ) | 1,455,563 | ||||||||||||||||
Change in unrealized appreciation (depreciation) of investments | (20,814,564 | ) | (997,219 | ) | — | — | (28,094,020 | ) | 2,437,202 | |||||||||||||||
Net Increase (Decrease) in Net Assets Resulting from Operations | (18,548,726 | ) | 5,461,658 | 304,445 | 670,368 | (28,045,191 | ) | 5,808,933 | ||||||||||||||||
DIVIDENDS AND DISTRIBUTIONS TO SHAREHOLDERS FROM | ||||||||||||||||||||||||
Net investment income: | ||||||||||||||||||||||||
Initial Class | (3,357,314 | ) | (2,642,530 | ) | (304,030 | ) | (670,368 | ) | (1,916,168 | ) | (1,750,924 | ) | ||||||||||||
Service Class | — | — | (415 | ) | — | — | — | |||||||||||||||||
Net realized gain from investment transactions: | ||||||||||||||||||||||||
Initial Class | (3,363,319 | ) | (3,999,345 | ) | — | — | — | — | ||||||||||||||||
Service Class | — | — | — | — | — | — | ||||||||||||||||||
Total Dividends and Distributions | (6,720,633 | ) | (6,641,875 | ) | (304,445 | ) | (670,368 | ) | (1,916,168 | ) | (1,750,924 | ) | ||||||||||||
CAPITAL SHARE TRANSACTIONS | (50,789 | ) | 4,457,107 | (1,635,323 | ) | 7,906,872 | (1,943,081 | ) | 447,012 | |||||||||||||||
Total Increase (Decrease) in Net Assets | (25,320,148 | ) | 3,276,890 | (1,635,323 | ) | 7,906,872 | (31,904,440 | ) | 4,505,021 | |||||||||||||||
NET ASSETS | ||||||||||||||||||||||||
Beginning of year | 97,072,768 | 93,795,878 | 16,463,854 | 8,556,982 | 94,766,128 | 90,261,107 | ||||||||||||||||||
End of year (including accumulated undistributed net investment income as set forth below) | $ | 71,752,620 | $ | 97,072,768 | $ | 14,828,531 | $ | 16,463,854 | $ | 62,861,688 | $ | 94,766,128 | ||||||||||||
Accumulated Undistributed Net Investment Income | $ | 2,336,486 | $ | 3,357,314 | $ | — | $ | — | $ | 1,951,148 | $ | 1,916,168 | ||||||||||||
See accompanying notes.
16
EQUITRUST VARIABLE INSURANCE SERIES FUND
SCHEDULE OF INVESTMENTS
VALUE GROWTH PORTFOLIO
December 31, 2008
| Shares Held | Value | ||||
COMMON STOCKS (94.44%) | |||||
APPAREL AND OTHER TEXTILES (0.07%) | |||||
Quiksilver, Inc. (1) | 16,700 | $ | 30,728 | ||
AUTOMOTIVE DEALERS AND GASOLINE SERVICE STATIONS (0.01 %) | |||||
Sonic Automotive, Inc.-Class A | 1,600 | 6,368 | |||
BUSINESS SERVICES (6.79%) | |||||
Adobe Systems Inc. (1) | 11,700 | 249,093 | |||
Automatic Data Processing, Inc. | 6,700 | 263,578 | |||
eBay Inc. (1) | 13,135 | 183,365 | |||
Microsoft Corp. . | 55,255 | 1,074,157 | |||
Oracle Corp. (1) | 46,070 | 816,821 | |||
Symantec Corp. (1) | 28,002 | 378,587 | |||
Taleo Corp.-Class A (1) | 9,500 | 74,385 | |||
| 3,039,986 | |||||
CHEMICALS AND ALLIED PRODUCTS (16.85%) | |||||
Abbott Laboratories . | 10,400 | 555,048 | |||
Amgen Inc. (1) | 7,625 | 440,344 | |||
Biogen Idec Inc. (1) | 3,500 | 166,705 | |||
Colgate-Palmolive Co. | 5,355 | 367,032 | |||
Dow Chemical Co. (The) | 5,330 | 80,430 | |||
E. I. du Pont de Nemours and Co. | 16,005 | 404,926 | |||
Johnson & Johnson | 24,600 | 1,471,818 | |||
KV Pharmaceutical Co.-Class A (1) | 12,700 | 36,576 | |||
Mylan Inc. (1) | 24,650 | 243,788 | |||
Novartis AG | 5,700 | 283,632 | |||
Pfizer Inc. | 66,886 | 1,184,551 | |||
Procter & Gamble Co. (The) | 16,425 | 1,015,394 | |||
Schering-Plough Corp. | 14,980 | 255,109 | |||
Teva Pharmaceutical Industries Ltd. | 16,391 | 697,765 | |||
Wyeth | 8,985 | 337,027 | |||
| 7,540,145 | |||||
COMMUNICATIONS (3.95%) | |||||
AT&T Inc. | 17,660 | 503,310 | |||
Comcast Corp.-Class A | 35,265 | 595,273 | |||
Embarq Corp. | 3,450 | 124,062 | |||
Sprint Nextel Corp. (1) | 17,913 | 32,781 | |||
Verizon Communications Inc. | 15,065 | 510,704 | |||
| 1,766,130 | |||||
DEPOSITORY INSTITUTIONS (3.45%) | |||||
Bank of America Corp. | 16,089 | 226,533 | |||
Bank of New York Mellon Corp. (The) | 21,040 | 596,063 | |||
Citigroup Inc. | 22,363 | 150,056 | |||
National City Corp. | 6,830 | 12,362 | |||
New York Community Bancorp, Inc. | 23,156 | 276,946 | |||
U.S. Bancorp | 9,135 | 228,466 | |||
Wachovia Corp. | 9,950 | 55,123 | |||
| 1,545,549 | |||||
| Shares Held | Value | ||||
EATING AND DRINKING PLACES (0.53%) | |||||
Chipotle Mexican Grill, Inc. (1) | 2,300 | $ | 142,554 | ||
Ruby Tuesday, Inc. (1) | 60,000 | 93,600 | |||
| 236,154 | |||||
ELECTRIC, GAS AND SANITARY SERVICES (3.73%) | |||||
Atmos Energy Corp. | 11,267 | 267,028 | |||
CMS Energy Corp. | 28,300 | 285,830 | |||
Intergrys Energy Group, Inc. | 9,886 | 424,900 | |||
Pepco Holdings, Inc. | 12,335 | 219,070 | |||
Pinnacle West Capital Corp. | 9,200 | 295,596 | |||
Waste Management, Inc. | 5,300 | 175,642 | |||
| 1,668,066 | |||||
ELECTRONIC AND OTHER ELECTRICAL EQUIPMENT (6.53%) | |||||
Advanced Micro Devices, Inc. (1) | 41,000 | 88,560 | |||
Cisco Systems, Inc. (1) | 46,570 | 759,091 | |||
Diodes, Inc. (1) | 14,800 | 89,688 | |||
Emerson Electric Co. | 4,600 | 168,406 | |||
General Electric Co. | 66,480 | 1,076,976 | |||
Helen of Troy Ltd. (1) | 8,966 | 155,650 | |||
Intel Corp. | 17,500 | 256,550 | |||
Micron Technology, Inc. (1) | 33,400 | 88,176 | |||
QUALCOMM Inc. | 4,200 | 150,486 | |||
Technitrol, Inc. | 25,700 | 89,436 | |||
| 2,923,019 | |||||
FABRICATED METAL PRODUCTS (0.98%) | |||||
Illinois Tool Works Inc. | 12,580 | 440,929 | |||
FOOD AND KINDRED PRODUCTS (4.09%) | |||||
Coca-Cola Co. (The) | 6,870 | 311,005 | |||
Coca-Cola FEMSA, S.A.B. de C.V. | 3,700 | 160,987 | |||
Dr Pepper Snapple Group, Inc. (1) | 15,300 | 248,625 | |||
H.J. Heinz Co. | 6,100 | 229,360 | |||
Kraft Foods Inc. | 12,708 | 341,210 | |||
McCormick & Company, Inc.-Non-voting | 8,000 | 254,880 | |||
PepsiCo, Inc. | 5,180 | 283,709 | |||
| 1,829,776 | |||||
FOOD STORES (0.69%) | |||||
Kroger Co. (The) | 11,686 | 308,627 | |||
FORESTRY (0.41%) | |||||
Weyerhaeuser Co. | 5,965 | 182,589 | |||
GENERAL MERCHANDISE STORES (2.91%) | |||||
Target Corp. | 13,790 | 476,169 | |||
Wal-Mart Stores, Inc. | 14,735 | 826,044 | |||
| 1,302,213 | |||||
HOLDING AND OTHER INVESTMENT OFFICES (1.89%) | |||||
Adams Express Co. (The ) | 67,123 | 538,998 | |||
H&Q Life Sciences Investors | 35,302 | 305,009 | |||
| 844,007 | |||||
17
EQUITRUST VARIABLE INSURANCE SERIES FUND
SCHEDULE OF INVESTMENTS
VALUE GROWTH PORTFOLIO (continued)
| Shares Held | Value | ||||
COMMON STOCKS (continued) | |||||
INDUSTRIAL MACHINERY AND EQUIPMENT (5.68%) | |||||
3M Co. | 14,430 | $ | 830,302 | ||
Apple Inc. (1) | 4,160 | 355,056 | |||
EMC Corp. (1) | 62,025 | 649,402 | |||
Hewlett-Packard Co. | 5,270 | 191,248 | |||
Ingersoll-Rand Co. Ltd.-Class A | 19,260 | 334,161 | |||
Sigma Designs, Inc. (1) | 19,400 | 184,300 | |||
| 2,544,469 | |||||
INSTRUMENTS AND RELATED PRODUCTS (5.67%) | |||||
Agilent Technologies, Inc. (1) | 7,000 | 109,410 | |||
Becton Dickinson and Co. | 11,026 | 754,068 | |||
Danaher Corp. | 2,400 | 135,864 | |||
Medtronic, Inc. | 15,340 | 481,983 | |||
Stryker Corp. | 4,380 | 174,981 | |||
Thermo Fisher Scientific Inc. (1) | 19,552 | 666,137 | |||
Zimmer Holdings, Inc. (1) | 5,330 | 215,439 | |||
| 2,537,882 | |||||
INSURANCE AGENTS, BROKERS AND SERVICE (0.92%) | |||||
Arthur J. Gallagher & Co. | 12,365 | 320,377 | |||
National Financial Partners Corp. | 29,600 | 89,984 | |||
| 410,361 | |||||
INSURANCE CARRIERS (3.08%) | |||||
Allstate Corp. (The) | 4,910 | 160,852 | |||
American Equity Investment Life Holding Co. | 29,300 | 205,100 | |||
American International Group, Inc. | 12,765 | 20,041 | |||
EMC Insurance Group Inc. | 13,610 | 349,096 | |||
Lincoln National Corp. | 4,485 | 84,497 | |||
MBIA Inc. | 4,690 | 19,088 | |||
Metlife Inc. . | 8,705 | 303,456 | |||
Protective Life Corp. | 4,215 | 60,485 | |||
WellPoint, Inc. (1) | 4,222 | 177,873 | |||
| 1,380,488 | |||||
LUMBER AND WOOD PRODUCTS (0.13%) | |||||
Louisiana-Pacific Corp. | 37,500 | 58,500 | |||
METAL MINING (3.94%) | |||||
Barrick Gold Corp. | 24,946 | 917,264 | |||
Goldcorp Inc. | 11,400 | 359,442 | |||
Newmont Mining Corp. | 12,000 | 488,400 | |||
| 1,765,106 | |||||
MOTION PICTURES (1.01%) | |||||
News Corp.-Class A | 17,040 | 154,894 | |||
Time Warner Inc. | 29,390 | 295,663 | |||
| 450,557 | |||||
MOTOR FREIGHT TRANSPORTATION AND WAREHOUSING (0.70%) | |||||
United Parcel Service, Inc.- Class B | 5,675 | 313,033 | |||
NON-DEPOSITORY CREDIT INSTITUTIONS (0.08%) | |||||
SLM Corp. (1) | 4,275 | 38,047 | |||
| Shares Held | Value | ||||
OIL AND GAS EXTRACTION (6.42%) | |||||
Anadarko Petroleum Corp. | 10,200 | $ | 393,210 | ||
Apache Corp. | 5,200 | 387,556 | |||
Baker Hughes Inc. | 6,200 | 198,834 | |||
Devon Energy Corp. | 4,600 | 302,266 | |||
Exterran Holdings, Inc. (1) | 5,900 | 125,670 | |||
Helmerich & Payne, Inc. | 14,600 | 332,150 | |||
Noble Corp. | 8,600 | 189,716 | |||
Occidental Petroleum Corp. | 6,800 | 407,932 | |||
Rowan Companies, Inc. | 8,800 | 139,920 | |||
Transocean Ltd. (1) | 3,100 | 146,475 | |||
Weatherford International Ltd. (1) | 14,600 | 157,972 | |||
Whiting Petroleum Corp. (1) | 2,700 | 90,342 | |||
| 2,872,043 | |||||
PAPER AND ALLIED PRODUCTS (1.33%) | |||||
AbitibiBowater Inc. (1) | 66,897 | 31,442 | |||
Kimberly-Clark Corp. | 10,720 | 565,373 | |||
| 596,815 | |||||
PERSONAL SERVICES (0.35%) | |||||
Cintas Corp. | 6,770 | 157,267 | |||
PETROLEUM AND COAL PRODUCTS (4.00%) | |||||
Chevron Corp. | 10,300 | 761,891 | |||
ConocoPhillips | 10,257 | 531,313 | |||
Exxon Mobil Corp. | 4,500 | 359,235 | |||
Valero Energy Corp. | 6,300 | 136,332 | |||
| 1,788,771 | |||||
PRIMARY METAL INDUSTRIES (0.52%) | |||||
Corning Inc. | 15,200 | 144,856 | |||
Olympic Steel, Inc. | 4,400 | 89,628 | |||
| 234,484 | |||||
PRINTING AND PUBLISHING (0.27%) | |||||
E. W. Scripps Co. (The)-Class A | 4,000 | 8,840 | |||
R. R. Donnelley & Sons Co. | 8,110 | 110,134 | |||
| 118,974 | |||||
RAILROAD TRANSPORTATION (0.34%) | |||||
Union Pacific Corp. | 3,140 | 150,092 | |||
REAL ESTATE (0.22%) | |||||
CB Richard Ellis Group, Inc.-Class A (1) | 22,400 | 96,768 | |||
RETAIL-DRUG STORES AND PROPRIETARY STORES (0.62%) | |||||
Walgreen Co. | 11,245 | 277,414 | |||
RETAIL-HOME FURNITURE AND FURNISHINGS STORES (0.96%) | |||||
Bed Bath & Beyond Inc. (1) | 7,010 | 178,194 | |||
GameStop Corp. (1) | 11,700 | 253,422 | |||
| 431,616 | |||||
SERVICES-ENGINEERING, ACCOUNTING, RESEARCH & MANAGEMENT (0.84%) | |||||
Quest Diagnostics Inc. | 7,200 | 373,752 | |||
18
EQUITRUST VARIABLE INSURANCE SERIES FUND
SCHEDULE OF INVESTMENTS
VALUE GROWTH PORTFOLIO (continued)
| Shares Held | Value | ||||
COMMON STOCKS (continued) | |||||
TOBACCO PRODUCTS (0.58%) | |||||
Philip Morris International Inc. | 6,010 | $ | 261,495 | ||
TRANSPORTATION EQUIPMENT (2.96%) | |||||
Federal Signal Corp. | 13,300 | 109,193 | |||
Honeywell International Inc. | 18,835 | 618,353 | |||
ITT Corp. | 13,020 | 598,790 | |||
| 1,326,336 | |||||
WHOLESALE TRADE — NONDURABLE GOODS (0.94%) | |||||
SUPERVALU Inc. | 6,200 | 90,520 | |||
SYSCO Corp. | 14,390 | 330,107 | |||
| 420,627 | |||||
Total Common Stocks (Cost $54,926,869) | 42,269,183 | ||||
SHORT-TERM INVESTMENTS (7.29%) | |||||
MONEY MARKET MUTUAL FUND (4.05%) | |||||
JP Morgan U.S. Treasury Plus Money Market Fund | 1,811,320 | 1,811,320 | |||
| Principal Amount | Value | ||||||
COMMERCIAL PAPER (2.01%) |
| ||||||
NONDEPOSITORY INSTITUTIONS (1.12%) |
| ||||||
General Electric Capital Corp., 1.00%, due 01/12/09 | $ | 400,000 | $ | 400,000 | |||
PETROLEUM AND COAL PRODUCTS (0.89%) |
| ||||||
Chevron Corp., 0.15%, due 01/05/09 | 500,000 | 500,000 | |||||
Total Commercial Paper (Cost $900,000) | 900,000 | ||||||
UNITED STATES GOVERNMENT AGENCIES (1.23%) |
| ||||||
Federal Home Loan Bank due 01/05/09 | 300,000 | 299,978 | |||||
Federal Home Loan Bank due 01/07/09 | 250,000 | 249,977 | |||||
Total United States Government Agencies (Cost $549,955 ) | 549,955 | ||||||
Total Short-Term Investments (Cost $3,261,275) | 3,261,275 | ||||||
Total Investments (101.73%) (Cost $58,188,144) | 45,530,458 | ||||||
OTHER ASSETS LESS LIABILITIES (-1.73%) |
| ||||||
Cash, receivables, prepaid expense and other assets, less liabilities | (772,344 | ) | |||||
Total Net Assets (100.00%) | $ | 44,758,114 | |||||
| (1) | Non-income producing securities. |
See accompanying notes.
19
EQUITRUST VARIABLE INSURANCE SERIES FUND
SCHEDULE OF INVESTMENTS
HIGH GRADE BOND PORTFOLIO
December 31, 2008
| Principal Amount | Value | |||||
CORPORATE BONDS (31.93%) | ||||||
DEPOSITORY INSTITUTIONS (7.12%) | ||||||
Comerica Bank, 5.20%, due 08/22/17 | $ | 1,000,000 | $ | 745,560 | ||
Fifth Third Bancorp, 5.45%, due 01/15/17 | 1,000,000 | 779,300 | ||||
Huntington National Bank, 5.50%, due 02/15/16 | 700,000 | 521,164 | ||||
PNC Preferred FD, 144A, 6.517%, due 12/31/49 (1) | 1,500,000 | 1,116,330 | ||||
Washington Mutual Bank, FA, 5.65%, due 08/15/14 | 750,000 | 75 | ||||
| 3,162,429 | ||||||
ELECTRIC, GAS AND SANITARY SERVICES (8.46%) | ||||||
Oglethorpe Power Corp., 6.974%, due 06/30/11 | 366,000 | 396,707 | ||||
PacifiCorp, 6.90%, due 11/15/11 | 750,000 | 789,000 | ||||
South Carolina Electric & Gas Co., 6.50%, due 11/01/18 | 1,500,000 | 1,692,300 | ||||
Westar Energy, Inc., 5.15%, due 01/01/17 | 1,000,000 | 876,100 | ||||
| 3,754,107 | ||||||
FOOD AND KINDRED PRODUCTS (2.26%) | ||||||
Diageo Capital plc, 4.375%, due 05/03/10 | 1,000,000 | 1,004,350 | ||||
FOOD STORES (1.35%) | ||||||
Ahold Finance U.S.A., LLC, 8.25%, due 07/15/10 | 600,000 | 599,616 | ||||
FURNITURE AND FIXTURES (1.06%) | ||||||
Steelcase Inc., 6.50%, due 08/15/11 | 500,000 | 470,890 | ||||
HOLDING AND OTHER INVESTMENT OFFICES (0.95%) | ||||||
Washington REIT, 5.25%, due 01/15/14 | 700,000 | 422,506 | ||||
INSURANCE CARRIERS (3.73%) | ||||||
Prudential Financial, Inc., 6.10%, due 06/15/17 | 1,500,000 | 1,231,065 | ||||
SunAmerica Inc., 8.125%, due 04/28/23 | 700,000 | 423,325 | ||||
| 1,654,390 | ||||||
SECURITY AND COMMODITY BROKERS (4.15%) | ||||||
Goldman Sachs Group, Inc. (The), 5.12%, due 01/15/15 | 900,000 | 822,330 | ||||
Morgan Stanley-Series MTNC, MTNC, 5.125%, due 02/11/19 | 1,300,000 | 1,021,579 | ||||
| 1,843,909 | ||||||
| Principal Amount | Value | |||||
TOBACCO PRODUCTS (1.69%) | ||||||
UST, Inc., 7.25%, due 06/01/09 | $ | 750,000 | $ | 751,268 | ||
TRANSPORTATION — BY AIR (1.06%) | ||||||
Continental Airlines, Inc., Pass-Through Certificates 1991-1 Class A, 6.545%, due 08/02/20 | 372,511 | 286,744 | ||||
FedEx Corp. Pass-Through Certificates, 7.50%, due 01/15/18 . | 184,028 | 183,767 | ||||
| 470,511 | ||||||
TRANSPORTATION EQUIPMENT (0.10%) | ||||||
Ford Motor Co., 9.215%, due 09/15/21 | 150,000 | 41,742 | ||||
Total Corporate Bonds (Cost $17,188,578) . | 14,175,718 | |||||
COMMERCIAL MORTGAGE PASS-THROUGH CERTIFICATES (1.27%) | ||||||
TIAA Seasoned Commercial Mortgage Trust 2007-C4, 6.09%, due 08/01/39 (cost $1,483,390) . | 1,500,000 | 564,073 | ||||
MORTGAGE-BACKED SECURITIES (55.28%) | ||||||
FEDERAL HOME LOAN MORTGAGE CORPORATION (FHLMC) (19.20%) | ||||||
3023 Class TG, 5.50%, due 08/01/35 | 1,277,280 | 1,301,075 | ||||
3051 Class MY, 5.50%, due 10/01/25 | 1,000,000 | 1,009,160 | ||||
Pool # A53146, 5.50%, due 10/01/36 | 1,779,184 | 1,823,460 | ||||
Pool # A69436, 6.00%, due 12/01/37 | 848,754 | 874,700 | ||||
Pool # G02562, 6.00%, due 01/01/37 | 1,216,714 | 1,254,978 | ||||
Pool # G02648, 5.50%, due 12/01/36 | 1,256,584 | 1,287,855 | ||||
Pool # G03803, 5.50%, due 01/01/38 | 951,190 | 974,808 | ||||
| 8,526,036 | ||||||
FEDERAL NATIONAL MORTGAGE ASSOCIATION (FNMA) (16.53%) | ||||||
Pool # 50276, 9.50%, | 608 | 673 | ||||
Pool # 256103, 5.50%, due 02/01/26 | 697,552 | 717,036 | ||||
Pool # 257306, 5.50%, due 08/01/38 | 2,949,585 | 3,028,723 | ||||
Pool # 897144, 6.00%, due 09/01/36 | 767,772 | 791,438 | ||||
20
EQUITRUST VARIABLE INSURANCE SERIES FUND
SCHEDULE OF INVESTMENTS
HIGH GRADE BOND PORTFOLIO (continued)
| Principal Amount | Value | |||||
MORTGAGE-BACKED SECURITIES (continued) | ||||||
FEDERAL NATIONAL MORTGAGE ASSOCIATION (FNMA) (continued) | ||||||
Pool # 906224, 5.50%, due 01/01/37 | $ | 1,520,081 | $ | 1,560,286 | ||
Pool # 928570, 6.00%, due 08/01/37 | 1,203,688 | 1,240,723 | ||||
| 7,338,879 | ||||||
GOVERNMENT NATIONAL MORTGAGE ASSOCIATION (GNMA) (19.55%) | ||||||
2003-1 Class PE, 5.50%, due 07/01/32 | 1,000,000 | 1,033,770 | ||||
2003-116 Class JC, 5.00%, due 05/01/30 | 1,000,000 | 1,014,472 | ||||
Pool # 1512, 7.50%, | 11,884 | 12,552 | ||||
Pool # 2631, 7.00%, | 16,825 | 17,735 | ||||
Pool # 2658, 6.50%, | 30,818 | 32,449 | ||||
Pool # 2701, 6.50%, | 39,185 | 41,266 | ||||
Pool # 2796, 7.00%, | 30,237 | 31,857 | ||||
Pool # 3039, 6.50%, | 11,893 | 12,528 | ||||
Pool # 3040, 7.00%, | 19,345 | 20,366 | ||||
Pool # 3188, 6.50%, | 69,103 | 72,794 | ||||
Pool # 3239, 6.50%, | 67,438 | 71,039 | ||||
Pool # 3261, 6.50%, | 128,470 | 135,330 | ||||
Pool # 3320, 5.50%, | 561,102 | 578,739 | ||||
Pool # 3333, 5.50%, | 461,826 | 476,127 | ||||
Pool # 3375, 5.50%, | 69,408 | 71,558 | ||||
Pool # 3390, 5.50%, | 303,071 | 312,456 | ||||
Pool # 3403, 5.50%, | 515,900 | 531,876 | ||||
Pool # 3458, 5.00%, | 477,168 | 490,110 | ||||
Pool # 3499, 5.00%, | 726,896 | 746,479 | ||||
Pool # 3556, 5.50%, | 735,994 | 758,314 | ||||
Pool # 3623, 5.00%, | 1,206,976 | 1,239,494 | ||||
| Principal Amount | Value | |||||
Pool # 22630, 6.50%, | $ | 17,320 | $ | 18,237 | ||
Pool # 276337, 10.00%, due 08/01/19 | 4,953 | 5,496 | ||||
Pool # 643816, 6.00%, due 07/01/25 | 920,074 | 955,258 | ||||
| 8,680,302 | ||||||
Total Mortgage-Backed Securities (Cost $23,765,335) | 24,545,217 | |||||
SHORT-TERM INVESTMENTS (10.77%) | ||||||
COMMERCIAL PAPER (1.13%) | ||||||
PETROLEUM AND COAL PRODUCTS | ||||||
Chevron Corp., 0.15%, due 01/05/09 | 500,000 | 500,000 | ||||
Total Commercial Paper (Cost $500,000) | 500,000 | |||||
UNITED STATES GOVERNMENT AGENCIES (5.29%) | ||||||
Federal Home Loan Bank, due 01/05/09 | 900,000 | 899,965 | ||||
Federal Home Loan Bank, due 01/07/09 | 400,000 | 399,963 | ||||
Federal Home Loan Bank, due 01/12/09 | 300,000 | 299,964 | ||||
Federal National Mortgage Assoc., due 02/02/09 | 750,000 | 749,900 | ||||
Total United States Government Agencies (Cost $2,349,792) | 2,349,792 | |||||
| Shares Held | ||||||
MONEY MARKET MUTUAL FUND (4.35%) | ||||||
JPMorgan U.S. Treasury Plus Money Market Fund (Cost $1,932,359) | 1,932,359 | 1,932,359 | ||||
Total Short-Term Investments (Cost $4,782,151) | 4,782,151 | |||||
Total Investments (99.25%) (Cost $47,219,454) | 44,067,159 | |||||
OTHER ASSETS LESS LIABILITIES (0.75%) | ||||||
Cash, receivables, prepaid expense and other assets, less liabilities | 334,167 | |||||
Total Net Assets (100.00%) | $ | 44,401,326 | ||||
| (1) | Restricted Securities—securities exempt from registration under Rule 144A of the Securities Act of 1933: |
PNC Preferred FD, was purchased at 100.000 on 11/29/06. As of 12/31/08, the carrying value of each unit was 74.422, representing $1,116,330 or 2.51% of total net assets.
See accompanying notes.
21
EQUITRUST VARIABLE INSURANCE SERIES FUND
SCHEDULE OF INVESTMENTS
STRATEGIC YIELD PORTFOLIO
December 31, 2008
| Shares Held | Value | |||||
PREFERRED STOCKS (1.53%) | ||||||
DEPOSITORY INSTITUTIONS | ||||||
Sovereign Capital Trust V, 7.75% (Cost $800,000) | 32,000 | $ | 559,040 | |||
| Principal Amount | ||||||
CORPORATE BONDS (68.30%) | ||||||
APPAREL AND ACCESSORY STORES (3.27%) | ||||||
Woolworth (FW) Corp., 8.50%, due 01/15/22 | $ | 1,400,000 | 1,197,000 | |||
CHEMICALS AND ALLIED PRODUCTS (2.91%) | ||||||
Chemtura Corp., 6.875%, due 06/01/16 | 1,700,000 | 858,500 | ||||
Nova Chemicals, Ltd., 7.875%, due 09/15/25 | 800,000 | 206,936 | ||||
| 1,065,436 | ||||||
DEPOSITORY INSTITUTIONS (3.05%) | ||||||
PNC Preferred FD, 144A, 6.517%, due 12/31/49 (1) | 1,500,000 | 1,116,330 | ||||
ELECTRIC, GAS AND SANITARY SERVICES (17.97%) | ||||||
Avista Corp, 5.95%, due 06/01/18 | 1,400,000 | 1,515,836 | ||||
Bruce Mansfield Unit 1, 6.85%, due 06/01/34 | 1,500,000 | 1,597,290 | ||||
Entergy Corp., 6.18%, due 03/01/35 | 1,700,000 | 1,460,504 | ||||
ESI Tractebel Acquisition Corp., 7.99%, due 12/30/11 | 196,000 | 182,300 | ||||
Sabine Pass LNG, L.P., 7.50%, due 11/30/16 | 1,000,000 | 719,610 | ||||
South Carolina Electric & Gas Co., 6.50%, due 11/01/18 | 800,000 | 902,560 | ||||
Waterford 3 Nuclear Power Plant, 8.09%, due 01/02/17 | 181,300 | 196,133 | ||||
| 6,574,233 | ||||||
FOOD STORES (3.86%) | ||||||
Safeway Inc., 7.45%, | 1,200,000 | 1,412,664 | ||||
FURNITURE AND FIXTURES (3.35%) | ||||||
Steelcase Inc., 6.50%, | 1,300,000 | 1,224,314 | ||||
HOLDING AND OTHER INVESTMENT OFFICES (11.92%) | ||||||
First Industrial, L.P., 7.60%, due 07/15/28 | 700,000 | 499,373 | ||||
| Principal Amount | Value | |||||
First Industrial, L.P., 7.75%, due 04/15/32 | $ | 500,000 | $ | 356,320 | ||
Hospitality Properties Trust, 6.75%, due 02/15/13 | 1,300,000 | 802,087 | ||||
HRPT Properties, 6.25%, due 08/15/16 | 1,075,000 | 582,607 | ||||
iStar Financial Inc.-Series B, 5.70%, due 03/01/14 | 1,171,000 | 352,260 | ||||
Realty Income Corp., 6.75%, due 08/15/19 | 1,500,000 | 1,130,910 | ||||
Rouse Company LP (The), 5.375%, due 11/26/13 | 2,000,000 | 638,260 | ||||
| 4,361,817 | ||||||
INSURANCE CARRIERS (1.34%) | ||||||
PXRE Capital Trust, 8.85%, due 02/01/27 | 670,000 | 490,782 | ||||
MOTION PICTURES (2.13%) | ||||||
Time Warner Inc., 8.375%, due 03/15/23 | 800,000 | 779,176 | ||||
PAPER AND ALLIED PRODUCTS (6.50%) | ||||||
AbitibiBowater Inc., 9.375%, due 12/15/21 | 900,000 | 96,498 | ||||
Cascades Inc., 7.25%, due 02/15/13 | 1,000,000 | 538,730 | ||||
International Paper Co., 7.95%, due 06/15/18 | 1,000,000 | 778,030 | ||||
Potlatch Corp., 9.125%, due 12/01/09 | 900,000 | 962,640 | ||||
| 2,375,898 | ||||||
PIPELINES (4.00%) | ||||||
NuStar Logistics, L.P., 7.65%, due 04/15/18 | 1,600,000 | 1,461,376 | ||||
TRANSPORTATION — BY AIR (2.09%) | ||||||
Continental Airlines, Inc. Pass-Through Certificates 1997-1 Class 1A, 7.461%, due 10/01/16 | 1,087,656 | 762,740 | ||||
WATER TRANSPORTATION (5.91%) | ||||||
Overseas Shipholding Group, Inc., 8.75%, due 12/01/13 | 1,100,000 | 901,857 | ||||
Windsor Petroleum Transportation, 144A, 7.84%, due 01/15/21 (1) | 1,000,000 | 1,260,070 | ||||
| 2,161,927 | ||||||
Total Corporate Bonds (Cost $32,969,824) | 24,983,693 | |||||
22
EQUITRUST VARIABLE INSURANCE SERIES FUND
SCHEDULE OF INVESTMENTS
STRATEGIC YIELD PORTFOLIO (continued)
| Principal Amount | Value | |||||
MORTGAGE-BACKED SECURITIES (21.79%) | ||||||
FEDERAL HOME LOAN MORTGAGE CORPORATION (FHLMC) (14.28%) | ||||||
Pool # A53146, 5.50%, due 10/01/36 | $ | 622,713 | $ | 638,210 | ||
Pool # A69436, 6.00%, due 12/01/37 | 1,273,131 | 1,312,051 | ||||
Pool # G02648, 5.50%, due 12/01/36 | 1,256,584 | 1,287,855 | ||||
Pool # 3023, 5.50%, | 957,960 | 975,806 | ||||
Pool # 3051, 5.50%, | 1,000,000 | 1,009,160 | ||||
| 5,223,082 | ||||||
FEDERAL NATIONAL MORTGAGE ASSOCIATION (FNMA) (7.51%) | ||||||
Pool # 256103, 5.50%, due 02/01/26 | 697,552 | 717,036 | ||||
Pool # 897144, 6.00%, due 09/01/36 | 767,772 | 791,437 | ||||
Pool # 928570, 6.00%, due 08/01/37 | 1,203,688 | 1,240,723 | ||||
| 2,749,196 | ||||||
Total Mortgage-Backed Securities (Cost $7,741,117) | 7,972,278 | |||||
SHORT-TERM INVESTMENTS (6.86%) | ||||||
UNITED STATES GOVERNMENT AGENCIES (1.91%) | ||||||
Federal Home Loan Bank, due 01/12/09 | 700,000 | 699,917 | ||||
Total United States Government Agencies (Cost $699,917) | 699,917 | |||||
COMMERCIAL PAPER (1.37%) | ||||||
PETROLEUM AND COAL PRODUCTS (1.37%) | ||||||
Chevron Corp., 0.15%, due 01/05/09 | 500,000 | 500,000 | ||||
Total Commercial Paper (Cost $500,000) | 500,000 | |||||
| Shares Held | Value | ||||
MONEY MARKET MUTUAL FUND (3.58%) | |||||
JPMorgan U.S. Treasury Plus Money Market Fund (Cost $1,309,134) | 1,309,134 | $ | 1,309,134 | ||
Total Short-Term Investments (Cost $2,509,051) | 2,509,051 | ||||
Total Investments (98.48%) (Cost $44,019,992) | 36,024,062 | ||||
OTHER ASSETS LESS LIABILITIES (1.52%) | |||||
Cash, receivables, prepaid expense and other assets, less liabilities | 557,402 | ||||
Total Net Assets (100.00%) | $ | 36,581,464 | |||
| (1) | Restricted Securities—securities exempt from registration under Rule 144A of the Securities Act of 1933: |
PNC Preferred FD, was purchased at 100.000 on 11/29/2006. As of 12/31/08, the carrying value of each unit was 74.422, representing $1,116,330 or 3.05% of total net assets.
Windsor Petroleum Transportation was purchased at 80.500 on 08/26/99. As of 12/31/08, the carrying value of each unit was 126.007, representing $1,011,630 or 2.32% of total net assets. $1,260,070 or 3.44% of total net assets.
As of 12/31/08, the carrying value of all restricted securities was $2,376,400 or 6.49% of total net assets.
See accompanying notes.
23
EQUITRUST VARIABLE INSURANCE SERIES FUND
SCHEDULE OF INVESTMENTS
MANAGED PORTFOLIO
December 31, 2008
| Shares Held | Value | ||||
COMMON STOCKS (67.60%) | |||||
AUTOMOTIVE DEALERS AND GASOLINE SERVICE STATIONS (0.01%) | |||||
Sonic Automotive, Inc. | 2,510 | $ | 9,990 | ||
BUSINESS SERVICES (3.18%) | |||||
Automatic Data Processing, Inc. | 11,300 | 444,542 | |||
eBay Inc. (1) | 8,900 | 124,244 | |||
Microsoft Corp. | 59,400 | 1,154,736 | |||
Oracle Corp. (1) | 24,830 | 440,236 | |||
Taleo Corp. (1) | 15,200 | 119,016 | |||
| 2,282,774 | |||||
CHEMICALS AND ALLIED PRODUCTS (12.70%) | |||||
Abbott Laboratories | 21,600 | 1,152,792 | |||
Amgen Inc. (1) | 3,900 | 225,225 | |||
Colgate-Palmolive Co. | 7,430 | 509,252 | |||
Dow Chemical Co. (The) | 13,965 | 210,732 | |||
E. I. du Pont de Nemours and Co. | 22,875 | 578,738 | |||
Johnson & Johnson | 33,612 | 2,011,006 | |||
K-V Pharmaceutical Co.-Class A (1) | 12,600 | 36,288 | |||
Mylan Inc. (1) | 35,550 | 351,590 | |||
Novartis AG | 8,060 | 401,066 | |||
Pfizer Inc. | 90,184 | 1,597,159 | |||
Procter & Gamble Co. (The) | 13,605 | 841,061 | |||
Schering-Plough Corp. | 15,700 | 267,371 | |||
Teva Pharmaceutical Industries Ltd. | 11,399 | 485,255 | |||
Wyeth | 11,800 | 442,618 | |||
| 9,110,153 | |||||
COMMUNICATIONS (2.11%) | |||||
AT&T Inc. | 12,600 | 359,100 | |||
Comcast Corp.-Class A | 13,590 | 229,399 | |||
Embarq Corp. | 4,950 | 178,002 | |||
Sprint Nextel Corp. (1) | 25,771 | 47,161 | |||
Verizon Communications Inc. | 20,675 | 700,883 | |||
| 1,514,545 | |||||
DEPOSITORY INSTITUTIONS (2.31%) | |||||
Bank of America Corp. | 17,202 | 242,204 | |||
Bank of New York Mellon Corp. (The) | 12,683 | 359,309 | |||
Citigroup Inc. | 19,822 | 133,006 | |||
National City Corp. | 8,695 | 15,738 | |||
New York Community Bancorp, Inc. | 44,834 | 536,215 | |||
U.S. Bancorp | 12,895 | 322,504 | |||
Wachovia Corp. | 8,328 | 46,137 | |||
| 1,655,113 | |||||
EATING AND DRINKING PLACES (0.21%) | |||||
Ruby Tuesday, Inc. (1) | 96,000 | 149,760 | |||
ELECTRIC, GAS AND SANITARY SERVICES (4.69%) | |||||
Atmos Energy Corp. | 22,952 | 543,962 | |||
Integrys Energy Group, Inc. | 14,304 | 614,786 | |||
| Shares Held | Value | ||||
Pepco Holdings, Inc. | 17,790 | $ | 315,950 | ||
Pinnacle West Capital Corp. | 24,200 | 777,546 | |||
Tortoise Energy Capital Corp. | 47,912 | 606,087 | |||
Waste Management, Inc. | 15,400 | 510,356 | |||
| 3,368,687 | |||||
ELECTRONIC AND OTHER ELECTRICAL EQUIPMENT (4.97%) | |||||
Advanced Micro Devices, Inc. (1) | 65,000 | 140,400 | |||
Cisco Systems, Inc. (1) | 35,830 | 584,029 | |||
General Electric Co. | 106,965 | 1,732,833 | |||
Helen of Troy Ltd. (1) | 12,334 | 214,118 | |||
Intel Corp. | 42,000 | 615,720 | |||
Micron Technology, Inc. (1) | 53,100 | 140,184 | |||
Technitrol, Inc. | 40,700 | 141,636 | |||
| 3,568,920 | |||||
FABRICATED METAL PRODUCTS (0.50%) | |||||
Illinois Tool Works Inc. | 10,155 | 355,933 | |||
FOOD AND KINDRED PRODUCTS (2.77%) | |||||
Coca-Cola Co. (The) | 10,380 | 469,903 | |||
Diageo plc | 7,200 | 408,528 | |||
Kraft Foods Inc. | 15,399 | 413,463 | |||
PepsiCo, Inc. | 12,650 | 692,841 | |||
| 1,984,735 | |||||
FORESTRY (0.80%) | |||||
Weyerhaeuser Co. | 18,770 | 574,550 | |||
GENERAL MERCHANDISE STORES (1.81%) | |||||
Target Corp. | 4,760 | 164,363 | |||
Wal-Mart Stores, Inc. | 20,290 | 1,137,457 | |||
| 1,301,820 | |||||
HOLDING AND OTHER INVESTMENT OFFICES (0.69%) | |||||
H&Q Life Sciences Investors | 19,539 | 168,817 | |||
iShares MSCI Japan Index | 34,030 | 326,688 | |||
| 495,505 | |||||
INDUSTRIAL MACHINERY AND EQUIPMENT (3.46%) | |||||
3M Co. | 20,305 | 1,168,350 | |||
Apple Inc. (1) | 4,400 | 375,540 | |||
EMC Corp. (1) | 36,800 | 385,296 | |||
Hewlett-Packard Co. | 5,460 | 198,143 | |||
Ingersoll-Rand Co. Ltd.-Class A | 20,634 | 358,000 | |||
| 2,485,329 | |||||
INSTRUMENTS AND RELATED PRODUCTS (2.08%) | |||||
Becton, Dickinson and Co. | 6,235 | 426,412 | |||
Medtronic, Inc. | 10,150 | 318,913 | |||
Stryker Corp. | 5,140 | 205,343 | |||
Thermo Fisher Scientific Inc. (1) | 7,840 | 267,109 | |||
Zimmer Holdings, Inc. (1) | 6,750 | 272,835 | |||
| 1,490,612 | |||||
24
EQUITRUST VARIABLE INSURANCE SERIES FUND
SCHEDULE OF INVESTMENTS
MANAGED PORTFOLIO (continued)
| Shares Held | Value | ||||
COMMON STOCKS (continued) | |||||
INSURANCE AGENTS, BROKERS AND SERVICE (0.63%) | |||||
Arthur J. Gallagher & Co. | 17,455 | $ | 452,259 | ||
INSURANCE CARRIERS (3.58%) | |||||
Allstate Corp. (The) | 7,140 | 233,906 | |||
American International Group, Inc. | 8,375 | 13,149 | |||
EMC Insurance Group Inc. | 43,593 | 1,118,160 | |||
Lincoln National Corp. | 6,630 | 124,909 | |||
MetLife, Inc. | 11,370 | 396,358 | |||
Old Republic International Corp. | 31,100 | 370,712 | |||
Protective Life Corp. | 6,225 | 89,329 | |||
WellPoint, Inc. (1) | 5,328 | 224,469 | |||
| 2,570,992 | |||||
LUMBER AND WOOD PRODUCTS (0.13%) | |||||
Louisiana-Pacific Corp. | 59,379 | 92,631 | |||
METAL MINING (3.96%) | |||||
Barrick Gold Corp. | 57,916 | 2,129,571 | |||
Newmont Mining Corp. | 17,500 | 712,250 | |||
| 2,841,821 | |||||
MOTION PICTURES (0.39%) | |||||
News Corp. | 29,500 | 282,610 | |||
MOTOR FREIGHT TRANSPORTATION AND | |||||
United Parcel Service, Inc.- Class B | 6,720 | 370,675 | |||
NON-DEPOSITORY CREDIT INSTITUTIONS (0.06%) | |||||
SLM Corp. (1) | 5,095 | 45,345 | |||
OIL AND GAS EXTRACTION (4.95%) | |||||
Anadarko Petroleum Corp. | 13,700 | 528,135 | |||
Apache Corp. | 6,700 | 499,351 | |||
Baker Hughes Inc. | 8,700 | 279,009 | |||
Devon Energy Corp. | 6,400 | 420,544 | |||
Occidental Petroleum Corp. | 22,250 | 1,334,777 | |||
Rowan Companies, Inc. | 16,700 | 265,530 | |||
Weatherford International Ltd. (1) | 21,000 | 227,220 | |||
| 3,554,566 | |||||
PAPER AND ALLIED PRODUCTS (1.11%) | |||||
AbitibiBowater Inc. (1) | 8,358 | 3,928 | |||
Kimberly-Clark Corp. | 15,015 | 791,891 | |||
| 795,819 | |||||
PERSONAL SERVICES (0.31%) | |||||
Cintas Corp. | 9,615 | 223,356 | |||
PETROLEUM AND COAL PRODUCTS (2.25%) | |||||
ConocoPhillips | 17,170 | 889,406 | |||
| Shares Held | Value | ||||
Exxon Mobil Corp. | 6,100 | $ | 486,963 | ||
Valero Energy Corp. | 11,100 | 240,204 | |||
| 1,616,573 | |||||
PIPELINES (1.57%) | |||||
Kinder Morgan Management, | 28,172 | 1,126,317 | |||
PRIMARY METAL INDUSTRY (0.49%) | |||||
Corning Inc. | 21,900 | 208,707 | |||
Olympic Steel, Inc. | 7,000 | 142,590 | |||
| 351,297 | |||||
PRINTING AND PUBLISHING (0.23%) | |||||
E.W. Scripps Co. (The) | 6,400 | 14,144 | |||
R. R. Donnelley & Sons Co. | 10,925 | 148,362 | |||
| 162,506 | |||||
REAL ESTATE (0.22%) | |||||
CB Richard Ellis Group, Inc. (1) | 35,600 | 153,792 | |||
RETAIL-DRUG STORES AND PROPRIETARY | |||||
Walgreen Co. | 15,560 | 383,865 | |||
SERVICES-ENGINEERING, ACCOUNTING, RESEARCH & MANAGEMENT (0.91%) | |||||
Quest Diagnostics Inc. | 12,600 | 654,066 | |||
TOBACCO PRODUCTS (0.35%) | |||||
Philip Morris International Inc. | 5,735 | 249,530 | |||
TRANSPORTATION EQUIPMENT (2.56%) | |||||
Federal Signal Corp. | 36,400 | 298,844 | |||
Genuine Parts Co. | 13,600 | 514,896 | |||
Honeywell International Inc. | 16,905 | 554,991 | |||
ITT Corp. | 10,190 | 468,638 | |||
| 1,837,369 | |||||
WHOLESALE TRADE — NONDURABLE GOODS (0.55%) | |||||
SYSCO Corp. | 17,085 | 391,930 | |||
Total Common Stocks (Cost $59,602,205) | 48,505,745 | ||||
PUBLICLY-TRADED PARTNERSHIPS (1.59%) | |||||
PIPELINES | |||||
Buckeye Partners, L.P. | 12,500 | 403,125 | |||
Enbridge Energy Partners, L.P. | 12,200 | 311,100 | |||
Magellan Midstream Partners, L.P. | 14,100 | 425,961 | |||
Total Publicly-Traded Partnerships (Cost $1,655,613) | 1,140,186 | ||||
25
EQUITRUST VARIABLE INSURANCE SERIES FUND
SCHEDULE OF INVESTMENTS
MANAGED PORTFOLIO (continued)
| Principal Amount | Value | |||||
MORTGAGE-BACKED SECURITIES (27.30%) | ||||||
GOVERNMENT NATIONAL MORTGAGE | ||||||
2003-1 Class PE, 5.50%, due 07/01/32 | $ | 2,250,000 | $ | 2,325,982 | ||
2003-11 Class QC, 5.50%, due 02/01/33 | 2,500,000 | 2,560,050 | ||||
2003-71 Class AK, 5.00%, due 09/01/29 | 600,000 | 609,016 | ||||
2006-116 Class JC, 5.00%, due 05/01/30 | 1,560,000 | 1,582,576 | ||||
2004-22 Class BK, 3.47%, due 04/01/34 | 213,603 | 213,213 | ||||
2004-26 Class GC, 5.00%, due 06/01/31 | 1,300,000 | 1,329,106 | ||||
2004-72 Class DE, 5.00%, due 07/01/32 | 500,000 | 503,631 | ||||
2004-76 Class VG, 5.00%, due 09/01/23 | 700,000 | 713,350 | ||||
2004-89 Class KC, 4.00%, due 10/01/34 | 471,971 | 472,355 | ||||
2004-105 Class PB, 5.00%, due 06/01/33 | 1,693,200 | 1,741,734 | ||||
2004-105 Class VE, 5.50%, due 05/01/24 | 2,000,000 | 2,078,658 | ||||
2004-109 Class WE, 5.00%, due 05/01/33 | 780,000 | 806,564 | ||||
2005-44 Class KC, 5.00% due 04/01/31 | 1,500,000 | 1,523,398 | ||||
2005-80 Class VC, 5.00%, due 05/01/29 | 1,000,000 | 1,009,091 | ||||
2006-38 Class OG, 5.00%, due 06/01/36 | 1,448,667 | 1,479,653 | ||||
Pool #2796, 7.00%, | 45,355 | 47,785 | ||||
Pool #3040, 7.00%, | 24,182 | 25,457 | ||||
Pool #3188, 6.50%, | 69,103 | 72,794 | ||||
Pool #3239, 6.50%, | 112,943 | 118,974 | ||||
Pool #3333, 5.50%, | 202,049 | 208,306 | ||||
Pool #3403, 5.50%, | 162,630 | 167,666 | ||||
Total Mortgage-Backed Securities (Cost $18,732,589) | 19,589,359 | |||||
| Principal Amount | Value | ||||||
SHORT-TERM INVESTMENTS (4.69%) |
| ||||||
UNITED STATES GOVERNMENT AGENCIES (1.62%) |
| ||||||
Federal Home Loan Bank, due 01/12/09 | $ | 762,000 | $ | 761,909 | |||
Federal Home Loan Bank, due 01/15/09 | 400,000 | 399,922 | |||||
Total United States Short Term Government Agencies (Cost $1,161,831) | 1,161,831 | ||||||
| Shares Held | |||||||
MONEY MARKET MUTUAL FUND (3.07%) |
| ||||||
JPMorgan U.S. Treasury Plus Money Market Fund (Cost $2,200,370) | 2,200,370 | 2,200,370 | |||||
Total Short-Term Investments (Cost $3,362,201) | 3,362,201 | ||||||
Total Investments (101.18%) (Cost $83,352,608) | 72,597,491 | ||||||
OTHER ASSETS LESS LIABILITIES (-1.18%) |
| ||||||
Cash, receivables, prepaid expense and other assets, less liabilities | (844,871 | ) | |||||
Total Net Assets (100.00%) | $ | 71,752,620 | |||||
| (1) | Non-income producing securities. |
See accompanying notes.
26
EQUITRUST VARIABLE INSURANCE SERIES FUND
SCHEDULE OF INVESTMENTS
MONEY MARKET PORTFOLIO
December 31, 2008
| Annualized Yield on Purchase Date | Principal Amount | Value | |||||||
SHORT-TERM INVESTMENTS (95.03%) | |||||||||
COMMERCIAL PAPER (9.78%) | |||||||||
NONDEPOSITORY INSTITUTIONS (4.89%) | |||||||||
General Electric Capital Corp., due 01/08/09 | 0.751 | % | $ | 250,000 | $ | 250,000 | |||
General Electric Capital Corp., due 02/03/09 | 1.152 | 250,000 | 250,000 | ||||||
General Electric Capital Corp., due 02/06/09 | 0.701 | 225,000 | 225,000 | ||||||
| 725,000 | |||||||||
PETROLEUM AND COAL PRODUCTS (4.89%) | |||||||||
Chevron Corp., due 01/08/09 | 0.150 | 250,000 | 250,000 | ||||||
Chevron Corp., due 01/15/09 | 0.200 | 250,000 | 250,000 | ||||||
Chevron Corp., due 01/26/09 | 0.220 | 225,000 | 225,000 | ||||||
| 725,000 | |||||||||
Total Commercial Paper (Cost $1,450,000) | 1,450,000 | ||||||||
UNITED STATES GOVERNMENT AGENCIES (77.51%) | |||||||||
Federal Home Loan Bank, due 01/07/09 | 0.081 | 300,000 | 299,996 | ||||||
Federal Home Loan Bank, due 01/12/09 | 1.118 | 400,000 | 399,865 | ||||||
Federal Home Loan Bank, due 01/16/09 | 0.396 | 300,000 | 299,951 | ||||||
Federal Home Loan Bank, due 01/30/09 | 0.812 | 250,000 | 249,839 | ||||||
Federal Home Loan Bank, due 02/02/09 | 0.507 | 300,000 | 299,867 | ||||||
Federal Home Loan Bank, due 02/04/09 | 0.172 | 400,000 | 399,936 | ||||||
Federal Home Loan Bank, due 02/06/09 | 0.112 | 600,000 | 599,934 | ||||||
Federal Home Loan Bank, due 02/24/09 | 0.183 | 600,000 | 599,838 | ||||||
Federal Home Loan Bank, due 03/04/09 | 0.183 | 300,000 | 299,907 | ||||||
Federal Home Loan Bank, due 03/05/09 | 0.183 | 700,000 | 699,779 | ||||||
Federal Home Loan Bank, due 03/25/09 | 0.081 | 150,000 | 149,972 | ||||||
Federal Home Loan Mortgage Corp., due 01/02/09 | 0.456 | 250,000 | 249,997 | ||||||
Federal Home Loan Mortgage Corp., due 01/06/09 | 0.304 | 300,000 | 299,988 | ||||||
Federal Home Loan Mortgage Corp., due 01/12/09 | 2.139 | 400,000 | 399,742 | ||||||
Federal Home Loan Mortgage Corp., due 01/14/09 | 0.355 | 300,000 | 299,962 | ||||||
Federal Home Loan Mortgage Corp., due 01/21/09 | 2.242 | 300,000 | 299,632 | ||||||
Federal Home Loan Mortgage Corp., due 01/23/09 | 2.294 | 400,000 | 399,448 | ||||||
Federal Home Loan Mortgage Corp., due 02/17/09 | 0.101 | 500,000 | 499,935 | ||||||
Federal Home Loan Mortgage Corp., due 03/02/09 | 1.399 | 700,000 | 698,394 | ||||||
Federal National Mortgage Assoc., due 01/05/09 | 0.953 | 900,000 | 899,906 | ||||||
Federal National Mortgage Assoc., due 01/07/09 | 2.037 | 250,000 | 249,916 | ||||||
Federal National Mortgage Assoc., due 01/20/09 | 1.989 | 300,000 | 299,690 | ||||||
Federal National Mortgage Assoc., due 02/05/09 | 0.152 | 500,000 | 499,927 | ||||||
Federal National Mortgage Assoc., due 02/11/09 | 0.259 | 900,000 | 899,738 | ||||||
Federal National Mortgage Assoc., due 02/18/09 | 0.162 | 500,000 | 499,893 | ||||||
Federal National Mortgage Assoc., due 05/26/09 | 0.254 | 700,000 | 699,295 | ||||||
Total United States Government Agencies | 11,494,347 | ||||||||
27
EQUITRUST VARIABLE INSURANCE SERIES FUND
SCHEDULE OF INVESTMENTS
MONEY MARKET PORTFOLIO (continued)
| Annualized Yield on Purchase Date | Principal Amount | Value | |||||||
UNITED STATES TREASURY OBLIGATIONS (7.74%) | |||||||||
U.S. Treasury Bills, due 03/05/09 | 1.070 | % | $ | 400,000 | $ | 399,263 | |||
U.S. Treasury Bills, due 03/26/09 | 1.070 | 750,000 | 748,157 | ||||||
Total United States Treasury Obligations (Cost $1,147,420) | 1,147,420 | ||||||||
Total Short-Term Investments (Cost $14,091,767) | 14,091,767 | ||||||||
OTHER ASSETS LESS LIABILITIES (4.97%) | |||||||||
Cash, receivables, prepaid expense and other assets, less liabilities | 736,764 | ||||||||
Total Net Assets (100.00%) | $ | 14,828,531 | |||||||
See accompanying notes.
28
EQUITRUST VARIABLE INSURANCE SERIES FUND
SCHEDULE OF INVESTMENTS
BLUE CHIP PORTFOLIO
December 31, 2008
| Shares Held | Value | ||||
COMMON STOCKS (95.90%) | |||||
BUSINESS SERVICES (4.45%) | |||||
Microsoft Corp. | 91,883 | $ | 1,786,206 | ||
Oracle Corp. (1) | 57,149 | 1,013,252 | |||
| 2,799,458 | |||||
CHEMICALS AND ALLIED PRODUCTS (19.17%) | |||||
Abbott Laboratories | 24,755 | 1,321,174 | |||
Amgen Inc. (1) | 17,835 | 1,029,971 | |||
Bristol-Myers Squibb Co. | 41,053 | 954,482 | |||
Colgate-Palmolive Co. | 6,950 | 476,353 | |||
Dow Chemical Co. (The) | 10,505 | 158,520 | |||
E. I. du Pont de Nemours and Co. | 15,756 | 398,627 | |||
Eli Lilly and Co. | 17,662 | 711,249 | |||
Johnson & Johnson | 42,710 | 2,555,339 | |||
Merck & Co., Inc. | 31,708 | 963,923 | |||
Pfizer Inc. | 44,377 | 785,917 | |||
Procter & Gamble Co. (The) | 43,542 | 2,691,766 | |||
| 12,047,321 | |||||
COMMUNICATIONS (4.96%) | |||||
AT&T Inc. | 34,855 | 993,368 | |||
CBS Corp.-Class B | 12,084 | 98,968 | |||
Comcast Corp.-Class A | 33,054 | 557,952 | |||
Verizon Communications Inc. | 36,562 | 1,239,452 | |||
Viacom Inc.-Class B (1) | 12,084 | 230,321 | |||
| 3,120,061 | |||||
DEPOSITORY INSTITUTIONS (5.92%) | |||||
Bank of America Corp. | 45,666 | 642,977 | |||
Citigroup Inc. | 48,341 | 324,368 | |||
JPMorgan Chase & Co. | 46,325 | 1,460,627 | |||
Wachovia Corp. | 25,460 | 141,048 | |||
Wells Fargo & Co. | 39,005 | 1,149,867 | |||
| 3,718,887 | |||||
EATING AND DRINKING PLACES (4.40%) | |||||
McDonald’s Corp. | 44,467 | 2,765,403 | |||
ELECTRIC, GAS AND SANITARY SERVICES (3.38%) | |||||
Exelon Corp. | 24,105 | 1,340,479 | |||
Southern Co. (The) | 21,215 | 784,955 | |||
| 2,125,434 | |||||
ELECTRONIC AND OTHER ELECTRICAL EQUIPMENT (6.00%) | |||||
Cisco Systems, Inc. (1) | 61,023 | 994,675 | |||
General Electric Co. | 84,256 | 1,364,947 | |||
Intel Corp. | 57,041 | 836,221 | |||
Motorola, Inc. | 37,189 | 164,747 | |||
Texas Instruments Inc. | 26,461 | 410,675 | |||
| 3,771,265 | |||||
FOOD AND KINDRED PRODUCTS (4.69%) | |||||
Coca-Cola Co. (The) | 31,034 | 1,404,909 | |||
| Shares Held | Value | ||||
Kraft Foods Inc. | 26,424 | $ | 709,484 | ||
PepsiCo, Inc. | 15,208 | 832,942 | |||
| 2,947,335 | |||||
FORESTRY (0.31%) | |||||
Weyerhaeuser Co. | 6,270 | 191,925 | |||
GENERAL MERCHANDISE STORES (4.38%) | |||||
Target Corp. | 11,900 | 410,907 | |||
Wal-Mart Stores, Inc. | 41,773 | 2,341,794 | |||
| 2,752,701 | |||||
INDUSTRIAL MACHINERY AND EQUIPMENT (9.37%) | |||||
3M Co. | 17,453 | 1,004,246 | |||
Applied Materials, Inc. | 23,520 | 238,258 | |||
Caterpillar Inc. | 28,044 | 1,252,725 | |||
Dell Inc. (1) | 30,585 | 313,190 | |||
EMC Corp. (1) | 37,308 | 390,615 | |||
Hewlett-Packard Co. | 40,454 | 1,468,076 | |||
International Business Machines Corp. | 14,526 | 1,222,508 | |||
| 5,889,618 | |||||
MOTION PICTURES (2.09%) | |||||
Time Warner Inc. | 49,492 | 497,890 | |||
Walt Disney Co. (The) | 36,092 | 818,928 | |||
| 1,316,818 | |||||
NON-DEPOSITORY CREDIT INSTITUTIONS (1.61%) | |||||
American Express Co. | 54,692 | 1,014,537 | |||
PETROLEUM AND COAL PRODUCTS (13.42%) | |||||
Chevron Corp. | 38,610 | 2,855,982 | |||
Exxon Mobil Corp. | 69,936 | 5,582,991 | |||
| 8,438,973 | |||||
PRIMARY METAL INDUSTRIES (0.54%) | |||||
Alcoa Inc. | 30,278 | 340,930 | |||
SECURITY AND COMMODITY BROKERS (0.38%) | |||||
Ameriprise Financial, Inc. | 10,349 | 241,753 | |||
TOBACCO PRODUCTS (3.56%) | |||||
Altria Group, Inc. | 38,185 | 575,066 | |||
Philip Morris International Inc. | 38,185 | 1,661,429 | |||
| 2,236,495 | |||||
TRANSPORTATION EQUIPMENT (7.27%) | |||||
Boeing Co. (The) | 26,912 | 1,148,335 | |||
General Motors Corp. | 16,365 | 52,368 | |||
Honeywell International Inc. | 37,254 | 1,223,049 | |||
United Technologies Corp. | 40,007 | 2,144,375 | |||
| 4,568,127 | |||||
Total Common Stocks | 60,287,041 | ||||
29
EQUITRUST VARIABLE INSURANCE SERIES FUND
SCHEDULE OF INVESTMENTS
BLUE CHIP PORTFOLIO (continued)
| Shares Held | Value | |||||
SHORT-TERM INVESTMENTS (3.95%) | ||||||
MONEY MARKET MUTUAL FUND (2.99%) | ||||||
JPMorgan U.S. Treasury Plus Money Market Fund (Cost $1,881,005) | 1,881,005 | $ | 1,881,005 | |||
| Principal Amount | ||||||
UNITED STATES GOVERNMENT AGENCIES (0.96%) | ||||||
Federal Home Loan Bank, due 01/15/09 | $ | 400,000 | 399,922 | |||
Federal National Mortgage Assoc., due 01/05/09 | 200,000 | 199,989 | ||||
Total United States Government Agencies (Cost $599,911) | 599,911 | |||||
Total Short-Term Investments (Cost $2,480,916) | 2,480,916 | |||||
Total Investments (99.85%) (Cost $62,355,572) | 62,767,957 | |||||
OTHER ASSETS LESS LIABILITIES (0.15%) | ||||||
Cash, receivables, prepaid expense and other assets, less liabilities | 93,731 | |||||
Total Net Assets (100.00%) | $ | 62,861,688 | ||||
| (1) | Non-income producing securities. |
See accompanying notes.
30
EQUITRUST VARIABLE INSURANCE SERIES FUND
NOTES TO FINANCIAL STATEMENTS
December 31, 2008
| 1. | Significant Accounting Policies |
Organization
EquiTrust Variable Insurance Series Fund (the “Fund”) is registered under the Investment Company Act of 1940, as amended, as a no-load, open-end diversified management investment company, or mutual fund. The Fund is authorized to issue an unlimited number of shares of beneficial interest with no par value. The Fund currently consists of six portfolios (known as the Value Growth, High Grade Bond, Strategic Yield, Managed, Money Market and Blue Chip Portfolios). The Fund offers Initial Class (IC) and Service Class (SC) shares. The Fund began offering SC shares on June 1, 2008. Shares of the Fund are sold only to certain life insurance companies’ separate accounts to fund the benefits under variable insurance contracts issued by such life insurance companies, including Farm Bureau Life Insurance Company and EquiTrust Life Insurance Company (see Note 3).
SC shares are charged distribution fees while IC shares are not. The shares of each Portfolio have equal rights and privileges with all other shares of that Portfolio, except SC shares have separate and exclusive voting rights with respect to the Fund’s Rule 12b-1 Plan. Each share of a Portfolio represents an equal proportionate interest in that Portfolio with each other share, subject to any preferences (such as resulting from Rule 12b-1 distribution fees with respect to the SC shares). In addition, the Board of Trustees of the Fund declares separate dividends on each class of shares.
The Fund allocates daily all income, expenses (other than distribution fees which are only charged to SC shares), and realized and unrealized gains or losses to each class of shares based upon the relative proportion of the value of shares outstanding of each class. Expenses not directly attributed to a Portfolio are apportioned among each of the Portfolios based upon the relative value of each Portfolio. Expenses specifically attributable to a particular class are charged directly to such class.
Security Valuation
All Portfolios, other than the Money Market Portfolio, value their investment securities that are traded on any national exchange at the last sale price on the day of valuation or, lacking any sales, at the mean between the closing bid and asked prices. Investments traded in the over-the-counter market are valued at the mean between the bid and asked prices or yield equivalent. In situations where market quotations are not readily available or quoted market prices are not reliable, investments are valued at fair value in accordance with the procedures adopted by the Fund’s Board of Trustees. Short-term investments are valued at market value, except that obligations maturing in one year or less are valued using the amortized cost method of valuation described below with respect to the Money Market Portfolio, which approximates market value.
The Money Market Portfolio values investments at amortized cost, which approximates market value. Under the amortized cost method, a security is valued at its cost on the date of purchase and thereafter is adjusted to reflect a constant amortization to maturity of the difference between the principal amount due at maturity and the cost of the investment to the Portfolio.
Income and Investment Transactions
For financial reporting purposes, investment transactions are recorded on the trade date. The identified cost basis has been used in determining the net realized gain or loss from investment transactions and unrealized appreciation or depreciation on investments. Dividend income is recorded on the ex-dividend date and interest is recognized on an accrual basis. Discounts and premiums on investments purchased are amortized over the life of the respective investments.
Dividends and Distributions to Shareholders
On each day that the net asset value per share is calculated in the High Grade Bond and Strategic Yield Portfolios, that Portfolio’s net investment income will be declared, as of the close of the New York Stock Exchange, as a dividend to shareholders of record prior to the declaration. With respect to the Money Market Portfolio, each day the net asset value per share is calculated, net investment income and any realized gains and losses from investment transactions will be declared, as of the close of the New York Stock Exchange, as a dividend to shareholders of record prior to the declaration. With respect to the High Grade Bond and Strategic Yield Portfolios, any net short-term and long-term gains will be declared and distributed periodically, but in no event less frequently than annually. Dividends and distributions of the other Portfolios are recorded on the ex-dividend date. Dividends and distributions from net investment income and net realized gain from investments are determined in accordance with federal tax regulations, which may differ from U.S. generally accepted accounting principles. These differences are primarily due to differing treatments for certain basis adjustments resulting from taxable mergers. Permanent book and tax basis differences are reclassified within the capital accounts based on their federal tax-basis treatment; temporary differences do not require reclassification.
31
EQUITRUST VARIABLE INSURANCE SERIES FUND
NOTES TO FINANCIAL STATEMENTS (continued)
| 1. | Significant Accounting Policies (continued) |
Dividends and distributions which exceed current and accumulated earnings and profits for federal income tax purposes are reported as return of capital distributions.
Use of Estimates
The preparation of financial statements in conformity with U.S. generally accepted accounting principles requires management to make estimates and assumptions that affect the reported amounts of assets and liabilities and disclosure of contingent assets and liabilities at the date of the financial statements and the reported amounts of revenues and expenses during the reporting period. Actual results could differ from those estimates.
Indemnifications
Under the Fund’s organizational documents, its present and past officers and trustees are indemnified against certain liability arising out of the performance of their duties to the Fund. At the discretion of the Board of Trustees, employees and agents may also be indemnified. In addition, in the normal course of business the Fund enters into contracts that contain a variety of representations and warranties which provide general indemnifications. The Fund’s maximum exposure under these arrangements is unknown, as this would involve future claims that may be made against the Fund that have not yet occurred.
New Accounting Pronouncements
Effective January 1, 2008, the Fund adopted Statement on Financial Accounting Standards (Statement) No. 157 “Fair Value Measurements.” This standard establishes a single authoritative definition of fair value, sets out a framework for measuring fair value and requires additional disclosures about fair value measurements. See Note 4, “Fair Value”, for detailed information regarding fair value measurements.
| 2. | Federal Income Taxes |
No provision for federal income taxes is considered necessary because the Fund is qualified as a “regulated investment company” under Subchapter M of the Internal Revenue Code and intends to distribute each year substantially all of its net investment income and realized capital gains to shareholders. As of December 31, 2008, the Fund is not aware of any uncertain tax positions. The Fund is no longer subject to U.S. federal, state and local income tax examinations by tax authorities for tax years prior to 2005.
As of December 31, 2008, the following Portfolios had approximate net capital loss carryforwards set forth below:
| Portfolio | ||||||||||||
Net Capital Loss Carryforwards Expire In: | Value Growth | Strategic Yield | Managed | Blue Chip | ||||||||
2010 | $ | — | $ | 1,495,000 | $ | — | $ | — | ||||
2011 | — | 571,000 | — | 3,950,000 | ||||||||
2012 | — | — | — | 556,000 | ||||||||
2013 | — | — | — | 60,000 | ||||||||
2016 | 1,382,000 | 1,000 | 96,000 | 1,902,000 | ||||||||
| $ | 1,382,000 | $ | 2,067,000 | $ | 96,000 | $ | 6,468,000 | |||||
32
EQUITRUST VARIABLE INSURANCE SERIES FUND
NOTES TO FINANCIAL STATEMENTS (continued)
| 2. | Federal Income Taxes (continued) |
The tax character of distributions for the years indicated were as follows:
| Year Ended December 31, 2008 | Year Ended December 31, 2007 | |||||||||||
Portfolio | Ordinary Income | Long-Term Capital Gains | Ordinary Income | Long-Term Capital Gains | ||||||||
Value Growth | $ | 1,619,864 | $ | 2,618,689 | $ | 1,163,459 | $ | 2,257,123 | ||||
High Grade Bond | 2,306,210 | 19,907 | 2,247,831 | 21,030 | ||||||||
Strategic Yield | 2,679,829 | — | 2,722,242 | — | ||||||||
Managed | 3,407,968 | 3,312,665 | 3,009,167 | 3,632,708 | ||||||||
Money Market | 304,445 | — | 670,368 | — | ||||||||
Blue Chip | 1,916,168 | — | 1,750,924 | — | ||||||||
The Fund designates long-term capital gain dividends per Internal Revenue Code Section 852(b)(3)(C). Distributions of short-term capital gain are treated as ordinary income distributions for tax purposes.
As of December 31, 2008, the components of accumulated earnings (deficit) and capital gains (losses) on a tax basis were identical to those reported in the statements of assets and liabilities, except as follows:
| Portfolio | ||||||||||||
| Value Growth | Strategic Yield | Managed | ||||||||||
Undistributed ordinary income | $ | 953,655 | $ | 7,750 | $ | 2,336,486 | ||||||
Accumulated capital losses | (1,382,434 | ) | (2,067,256 | ) | (96,051 | ) | ||||||
Net unrealized depreciation of investments | (12,456,279 | ) | (7,995,930 | ) | (10,614,280 | ) | ||||||
Other timing differences | — | (7,750 | ) | — | ||||||||
Total accumulated deficit | $ | (12,885,058 | ) | $ | (10,063,186 | ) | $ | (8,373,845 | ) | |||
The primary differences between book-basis and tax-basis components of total accumulated deficit above in the Value Growth and Managed Portfolios are attributable to taxable spinoffs, mergers and corporate inversions. The Strategic Yield Portfolio held a trust preferred security which accrues income for tax purposes and not financial reporting purposes.
| 3. | Management Contract and Transactions with Affiliates |
The Fund has entered into agreements with EquiTrust Investment Management Services, Inc. (“EquiTrust Investment”) relating to the management of the Portfolios and the investment of their assets. Pursuant to these agreements, fees paid to EquiTrust Investment are as follows: (1) annual investment advisory and management fees, which are based on each Portfolio’s average daily net assets as follows: Value Growth Portfolio — 0.45%; High Grade Bond Portfolio — 0.30%; Strategic Yield Portfolio — 0.45%; Managed Portfolio — 0.45%; Money Market Portfolio — 0.25% ; and Blue Chip Portfolio — 0.20%, and (2) accounting fees, which are based on each Portfolio’s daily net assets at an annual rate of 0.05%, with a maximum per Portfolio annual expense of $30,000.
The Fund has entered into agreements with EquiTrust Investment whereby EquiTrust Investment also serves as the Fund’s shareholder service, transfer and dividend disbursing agent. EquiTrust Marketing Services, LLC serves as the principal underwriter and distributor. Pursuant to these agreements, SC pays a 12B-1 distribution fee at an annual rate of 0.25% of the average daily net asset value attributable to the class of shares. There are no other fees paid by the Fund associated with these services.
33
EQUITRUST VARIABLE INSURANCE SERIES FUND
NOTES TO FINANCIAL STATEMENTS (continued)
| 3. | Management Contract and Transactions with Affiliates (continued) |
Beginning December 19, 2008, EquiTrust Investment voluntarily waived management fees on the Money Market Portfolio. The fees waived totaled $1,311 for IC and $18 for SC, respectively, for the year ended December 31, 2008.
EquiTrust Investment has agreed to reimburse the Portfolios annually for total expenses (excluding brokerage, interest, taxes and extraordinary expenses) in excess of 1.50% of each Portfolio’s average daily net assets. The amount reimbursed, however, shall not exceed the amount of the investment advisory and management fee paid by the Portfolio for such period. During the year ended December 31, 2008, EquiTrust Investment further agreed to reimburse any IC Portfolio, to the extent that annual operating expenses, including the investment advisory fee, exceed 0.65%. For the year ended December 31, 2008, no expense reimbursements were made to the Fund by EquiTrust Investment.
Certain officers and trustees of the Fund are also officers of EquiTrust Investment, Farm Bureau Life Insurance Company and other affiliated entities. As of December 31, 2008, the total number of the shares of each Portfolio owned by Farm Bureau Life Insurance Company, EquiTrust Life Insurance Company and related separate accounts were as follows:
IC Portfolio | Shares | |
Value Growth | 4,435,127 | |
High Grade Bond | 3,768,743 | |
Strategic Yield | 4,108,828 | |
Managed | 5,582,322 | |
Money Market | 11,635,586 | |
Blue Chip | 2,069,214 |
SC Portfolio | Shares | |
Value Growth | 16,617 | |
High Grade Bond | 293,704 | |
Strategic Yield | 31,689 | |
Managed | 59,539 | |
Money Market | 110,141 | |
Blue Chip | 25,058 |
| 4. | Fair Value |
As discussed in Note 1, Statement No. 157, “Fair Value Measurements,” defines fair value, establishes a framework for measuring fair value and expands disclosures about fair value measurements. Various inputs are used in determining the value of the Portfolio’s investments. These inputs are summarized in three broad levels listed below:
| • | Level 1 — Quoted prices in active markets for identical securities on the measurement date |
| • | Level 2 — Other significant observable inputs (including quoted prices in active markets for similar securities, interest rates, prepayment speeds, credit risk, etc.) |
| • | Level 3 — Significant unobservable inputs (including the Portfolio’s own assumptions in determining the fair value of the investments) |
The inputs or methodology used for valuing securities are not necessarily an indication of the risk associated with investing in those securities. For example, money market securities are valued using amortized cost, in accordance with rules under the Investment Company Act of 1940. Generally, amortized cost approximates the current fair value of a security, but since the value is not obtained from a quoted price in an active market, such securities are reflected as Level 2.
At January 1, 2008 and December 31, 2008, there were no valuation inputs classified as level 3.
34
EQUITRUST VARIABLE INSURANCE SERIES FUND
NOTES TO FINANCIAL STATEMENTS (continued)
| 4. | Fair Value (continued) |
The following is a summary of the inputs used to value the Portfolio’s net assets as of December 31, 2008:
| Investments in Securities | ||||||||||||||||||
Valuation Inputs | Value Growth Portfolio | High Grade Bond Portfolio | Strategic Yield Portfolio | Managed Portfolio | Money Market Portfolio | Blue Chip Portfolio | ||||||||||||
Level 1—Quoted Prices | $ | 44,080,503 | $ | 1,932,359 | $ | 1,868,174 | $ | 51,846,301 | $ | — | $ | 62,168,046 | ||||||
Level 2—Other Significant Observable Inputs | 1,449,955 | 42,134,800 | 34,155,888 | 20,751,190 | 14,091,767 | 599,911 | ||||||||||||
Level 3—Significant Unobservable Inputs | — | — | — | — | — | — | ||||||||||||
Total | $ | 45,530,458 | $ | 44,067,159 | $ | 36,024,062 | $ | 72,597,491 | $ | 14,091,767 | $ | 62,767,957 | ||||||
| 5. | Expense Offset Arrangements |
The Fund and other mutual funds managed by EquiTrust Investment have an agreement with the custodian banks to indirectly pay a portion of the custodians’ fees through credits earned by the Funds’ cash on deposit with the bank. This deposit agreement is an alternative to overnight investments. Custodial fees have been adjusted to reflect amounts that would have been paid without this agreement, with a corresponding adjustment reflected as fees paid indirectly in the statements of operations.
| 6. | Capital Share Transactions |
Transactions in shares of beneficial interest for each Portfolio were as follows:
| Shares Sold | Shares Issued In Reinvestment of Dividends and Distributions | Shares Redeemed | Net Increase (Decrease) | |||||||||||||||||||
Portfolio | Shares | Amount | Shares | Amount | Shares | Amount | Shares | Amount | ||||||||||||||
| Year ended December 31, 2008: | ||||||||||||||||||||||
Value Growth IC | 224,215 | $ | 2,803,884 | 319,650 | $ | 4,238,553 | 500,351 | $ | 6,070,197 | 43,514 | $ | 972,240 | ||||||||||
Value Growth SC | 17,255 | 196,425 | — | — | 638 | 7,008 | 16,617 | 189,417 | ||||||||||||||
High Grade Bond IC | 522,199 | 5,182,828 | 235,136 | 2,287,353 | 911,310 | 8,753,835 | (153,975 | ) | (1,283,654 | ) | ||||||||||||
High Grade Bond SC | 331,619 | 3,163,028 | 4,114 | 38,626 | 40,225 | 383,565 | 295,508 | 2,818,089 | ||||||||||||||
Strategic Yield IC | 499,480 | 4,281,839 | 324,019 | 2,675,714 | 1,017,174 | 8,377,138 | (193,675 | ) | (1,419,585 | ) | ||||||||||||
Strategic Yield SC | 32,472 | 259,198 | 517 | 3,940 | 1,300 | 10,368 | 31,689 | 252,770 | ||||||||||||||
Managed IC | 216,726 | 3,069,388 | 462,853 | 6,720,633 | 770,904 | 10,584,433 | (91,325 | ) | (794,412 | ) | ||||||||||||
Managed SC | 63,223 | 793,850 | — | — | 3,684 | 50,227 | 59,539 | 743,623 | ||||||||||||||
Money Market IC | 28,454,476 | 28,454,476 | 280,319 | 280,319 | 30,567,209 | 30,567,209 | (1,832,414 | ) | (1,832,414 | ) | ||||||||||||
Money Market SC | 397,179 | 397,179 | 381 | 381 | 200,469 | 200,469 | 197,091 | 197,091 | ||||||||||||||
Blue Chip IC | 109,673 | 3,962,079 | 49,488 | 1,916,168 | 244,168 | 8,648,468 | (85,007 | ) | (2,770,221 | ) | ||||||||||||
Blue Chip SC | 27,401 | 906,330 | — | — | 2,343 | 79,190 | 25,058 | 827,140 | ||||||||||||||
| Year Ended December 31, 2007: | ||||||||||||||||||||||
Value Growth IC | 315,759 | $ | 4,743,978 | 238,534 | $ | 3,420,582 | 401,982 | $ | 6,045,822 | 152,311 | $ | 2,118,738 | ||||||||||
High Grade Bond IC | 823,371 | 8,291,582 | 225,005 | 2,268,861 | 391,457 | 3,946,227 | 656,919 | 6,614,216 | ||||||||||||||
Strategic Yield IC | 757,336 | 6,886,780 | 299,636 | 2,722,242 | 507,961 | 4,620,309 | 549,011 | 4,988,713 | ||||||||||||||
Managed IC | 364,695 | 5,762,999 | 438,408 | 6,641,875 | 501,851 | 7,947,767 | 301,252 | 4,457,107 | ||||||||||||||
Money Market IC | 59,151,850 | 59,151,850 | 611,918 | 611,918 | 51,856,896 | 51,856,896 | 7,906,872 | 7,906,872 | ||||||||||||||
Blue Chip IC | 162,130 | 6,821,860 | 43,697 | 1,750,924 | 194,153 | 8,125,772 | 11,674 | 447,012 | ||||||||||||||
35
EQUITRUST VARIABLE INSURANCE SERIES FUND
NOTES TO FINANCIAL STATEMENTS (continued)
| 7. | Investment Transactions |
For the year ended December 31, 2008, the cost of investment securities purchased and proceeds from investment securities sold (not including short-term investments and U.S. Government securities) by Portfolio, were as follows:
Portfolio | Purchases | Sales | ||||
Value Growth | $ | 17,946,454 | $ | 12,986,112 | ||
High Grade Bond | 1,495,695 | 1,422,512 | ||||
Strategic Yield | 6,342,656 | 1,114,037 | ||||
Managed | 18,655,410 | 5,526,504 | ||||
Blue Chip | 1,953,809 | 926,063 | ||||
The basis of the Fund’s investments in securities and the net unrealized appreciation (depreciation) of investments for U.S. federal income tax purposes as of December 31, 2008, by Portfolio, was composed of the following:
| Tax Cost of Investments in Securities | Gross Unrealized | Net Unrealized Appreciation (Depreciation) of Investments | |||||||||||
Portfolio | Appreciation | Depreciation | |||||||||||
Value Growth | $ | 57,986,737 | $ | 3,475,802 | $ | 15,932,081 | $ | (12,456,279 | ) | ||||
High Grade Bond | 47,219,454 | 1,050,367 | 4,202,662 | (3,152,295 | ) | ||||||||
Strategic Yield | 44,019,992 | 1,052,448 | 9,048,378 | (7,995,930 | ) | ||||||||
Managed | 83,211,771 | 5,985,003 | 16,599,283 | (10,614,280 | ) | ||||||||
Blue Chip | 62,355,572 | 18,021,143 | 17,608,758 | 412,385 | |||||||||
The basis for U.S. federal income tax purposes and financial reporting purposes for investments in the Money Market Portfolio is the same and is equal to the underlying investments’ carrying value.
| 8. | Dividends and Distributions to Shareholders |
Dividends from net investment income for the following Portfolios are declared daily and were payable on the last business day of the month as follows:
| Portfolio | ||||||||||||||||||
| High Grade Bond | Strategic Yield | Money Market | ||||||||||||||||
Payable Date | IC | SC | IC | SC | IC | SC | ||||||||||||
January 31, 2008 | $ | 0.0434 | $ | — | $ | 0.0429 | $ | — | $ | 0.0032 | $ | — | ||||||
February 29, 2008 | 0.0406 | — | 0.0432 | — | 0.0024 | — | ||||||||||||
March 31, 2008 | 0.0408 | — | 0.0411 | — | 0.0020 | — | ||||||||||||
April 30, 2008 | 0.0400 | — | 0.0415 | — | 0.0015 | — | ||||||||||||
May 30, 2008 | 0.0381 | — | 0.0436 | — | 0.0014 | — | ||||||||||||
June 30, 2008 | 0.0425 | 0.0413 | 0.0449 | 0.0434 | 0.0014 | 0.0013 | ||||||||||||
July 31, 2008 | 0.0410 | 0.0391 | 0.0432 | 0.0416 | 0.0015 | 0.0013 | ||||||||||||
August 29, 2008 | 0.0380 | 0.0361 | 0.0432 | 0.0417 | 0.0015 | 0.0013 | ||||||||||||
September 30, 2008 | 0.0419 | 0.0398 | 0.0456 | 0.0438 | 0.0016 | 0.0014 | ||||||||||||
October 31, 2008 | 0.0410 | 0.0391 | 0.0441 | 0.0425 | 0.0013 | 0.0011 | ||||||||||||
November 26, 2008 | 0.0327 | 0.0312 | 0.0421 | 0.0408 | 0.0007 | 0.0005 | ||||||||||||
December 31, 2008 | 0.0453 | 0.0431 | 0.0505 | 0.0487 | 0.0005 | 0.0002 | ||||||||||||
Total dividends per share | $ | 0.4853 | $ | 0.2697 | $ | 0.5259 | $ | 0.3025 | $ | 0.0190 | $ | 0.0071 | ||||||
None of the ordinary income dividends qualify for the dividends received deduction by corporate shareholders for the High Grade Bond, Strategic Yield and Money Market Portfolios.
36
EQUITRUST VARIABLE INSURANCE SERIES FUND
NOTES TO FINANCIAL STATEMENTS (continued)
| 8. | Dividends and Distributions to Shareholders (continued) |
In addition, dividends and distributions to shareholders from net investment income and net realized gain on investment transactions were paid during the year ended December 31, 2008 for the following Portfolios:
Ordinary Income Dividends:
| Declaration Date | Record Date | Payable Date | Amount Per Share | |||||||||
Portfolio | IC | SC | ||||||||||
Value Growth | 1/23/08 | 1/23/08 | 1/24/08 | $ | 0.3333 | $ | — | |||||
Managed | 1/23/08 | 1/23/08 | 1/24/08 | 0.5593 | — | |||||||
Blue Chip | 1/23/08 | 1/23/08 | 1/24/08 | 0.8613 | — | |||||||
The percentages of income dividends qualifying for the dividends received deduction by corporate shareholders for the Value Growth, Managed and Blue Chip Portfolios are 86%, 51% and 100%, respectively.
Short-Term Capital Gains Distributions:
| Declaration Date | Record Date | Payable Date | Amount Per Share | |||||||||
Portfolio | IC | SC | ||||||||||
Value Growth | 1/23/08 | 1/23/08 | 1/24/08 | $ | 0.0261 | $ | — | |||||
Managed | 1/23/08 | 1/23/08 | 1/24/08 | 0.0084 | — | |||||||
The character of the short-term capital gain distributions were treated as ordinary for tax purposes.
Long-Term Capital Gains Distributions:
| Declaration Date | Record Date | Payable Date | Amount Per Share | |||||||||
Portfolio | IC | SC | ||||||||||
Value Growth | 1/23/08 | 1/23/08 | 1/24/08 | $ | 0.5810 | $ | — | |||||
High Grade Bond | 1/23/08 | 1/23/08 | 1/24/08 | 0.0043 | — | |||||||
Managed | 1/23/08 | 1/23/08 | 1/24/08 | 0.5518 | — | |||||||
37
EQUITRUST VARIABLE INSURANCE SERIES FUND
FINANCIAL HIGHLIGHTS
Years Ended December 31, 2008, 2007, 2006, 2005 and 2004
| Income from Investment Operations | Less Distributions | ||||||||||||||||||||||||||
| Net Asset Value at Beginning of Period | Net Invest- ment Income | Net Realized and Unrealized Gain (Loss) on Investments | Total from Investment Operations | Dividends from Net Investment Income | Distributions from Capital Gains | Total Distributions | |||||||||||||||||||||
Value Growth Portfolio | |||||||||||||||||||||||||||
Initial Class: | |||||||||||||||||||||||||||
2008 | $ | 15.06 | $ | 0.21 | $ | (4.53 | ) | $ | (4.32 | ) | $ | (0.33 | ) | $ | (0.61 | ) | $ | (0.94 | ) | ||||||||
2007 | 15.09 | 0.33 | 0.43 | 0.76 | (0.27 | ) | (0.52 | ) | (0.79 | ) | |||||||||||||||||
2006 | 13.65 | 0.27 | 1.36 | 1.63 | (0.19 | ) | — | (0.19 | ) | ||||||||||||||||||
2005 | 12.98 | 0.19 | 0.63 | 0.82 | (0.15 | ) | — | (0.15 | ) | ||||||||||||||||||
2004 | 11.76 | 0.15 | 1.20 | 1.35 | (0.13 | ) | — | (0.13 | ) | ||||||||||||||||||
Service Class: | |||||||||||||||||||||||||||
2008(3) | $ | 13.97 | $ | 0.05 | $ | (4.23 | ) | $ | (4.18 | ) | $ | — | $ | — | $ | — | |||||||||||
High Grade Bond Portfolio | |||||||||||||||||||||||||||
Initial Class: | |||||||||||||||||||||||||||
2008 | $ | 10.12 | $ | 0.49 | $ | (0.65 | ) | $ | (0.16 | ) | $ | (0.49 | ) | $ | — | $ | (0.49 | ) | |||||||||
2007 | 10.12 | 0.53 | 0.01 | 0.54 | (0.53 | ) | (0.01 | ) | (0.54 | ) | |||||||||||||||||
2006 | 10.16 | 0.51 | (0.04 | ) | 0.47 | (0.51 | ) | — | (0.51 | ) | |||||||||||||||||
2005 | 10.38 | 0.47 | (0.20 | ) | 0.27 | (0.47 | ) | (0.02 | ) | (0.49 | ) | ||||||||||||||||
2004 | 10.42 | 0.45 | — | 0.45 | (0.45 | ) | (0.04 | ) | (0.49 | ) | |||||||||||||||||
Service Class: | |||||||||||||||||||||||||||
2008(3) | $ | 9.87 | $ | 0.27 | $ | (0.40 | ) | $ | (0.13 | ) | $ | (0.27 | ) | $ | — | $ | (0.27 | ) | |||||||||
Strategic Yield Portfolio | |||||||||||||||||||||||||||
Initial Class: | |||||||||||||||||||||||||||
2008 | $ | 8.94 | $ | 0.53 | $ | (1.48 | ) | $ | (0.95 | ) | $ | (0.53 | ) | $ | — | $ | (0.53 | ) | |||||||||
2007 | 9.19 | 0.57 | (0.25 | ) | 0.32 | (0.57 | ) | — | (0.57 | ) | |||||||||||||||||
2006 | 9.14 | 0.55 | 0.05 | 0.60 | (0.55 | ) | — | (0.55 | ) | ||||||||||||||||||
2005 | 9.37 | 0.53 | (0.23 | ) | 0.30 | (0.53 | ) | — | (0.53 | ) | |||||||||||||||||
2004 | 9.13 | 0.55 | 0.24 | 0.79 | (0.55 | ) | — | (0.55 | ) | ||||||||||||||||||
Service Class: | |||||||||||||||||||||||||||
2008(3) | $ | 8.60 | $ | 0.30 | $ | (1.14 | ) | $ | (0.84 | ) | $ | (0.30 | ) | $ | — | $ | (0.30 | ) | |||||||||
Managed Portfolio | |||||||||||||||||||||||||||
Initial Class: | |||||||||||||||||||||||||||
2008 | $ | 16.05 | $ | 0.40 | $ | (3.40 | ) | $ | (3.00 | ) | $ | (0.56 | ) | $ | (0.56 | ) | $ | (1.12 | ) | ||||||||
2007 | 16.32 | 0.56 | 0.33 | 0.89 | (0.46 | ) | (0.70 | ) | (1.16 | ) | |||||||||||||||||
2006 | 15.80 | 0.49 | 1.28 | 1.77 | (0.37 | ) | (0.88 | ) | (1.25 | ) | |||||||||||||||||
2005 | 15.67 | 0.35 | 0.32 | 0.67 | (0.27 | ) | (0.27 | ) | (0.54 | ) | |||||||||||||||||
2004 | 14.73 | 0.27 | 0.97 | 1.24 | (0.30 | ) | — | (0.30 | ) | ||||||||||||||||||
Service Class: | |||||||||||||||||||||||||||
2008(3) | $ | 14.99 | $ | 0.06 | $ | (3.14 | ) | $ | (3.08 | ) | $ | — | $ | — | $ | — | |||||||||||
Money Market Portfolio | |||||||||||||||||||||||||||
Initial Class: | |||||||||||||||||||||||||||
2008 | $ | 1.00 | $ | 0.02 | (2) | $ | — | $ | 0.02 | $ | (0.02 | ) | $ | — | $ | (0.02 | ) | ||||||||||
2007 | 1.00 | 0.05 | — | 0.05 | (0.05 | ) | — | (0.05 | ) | ||||||||||||||||||
2006 | 1.00 | 0.04 | — | 0.04 | (0.04 | ) | — | (0.04 | ) | ||||||||||||||||||
2005 | 1.00 | 0.02 | — | 0.02 | (0.02 | ) | — | (0.02 | ) | ||||||||||||||||||
2004 | 1.00 | 0.01 | — | 0.01 | (0.01 | ) | — | (0.01 | ) | ||||||||||||||||||
Service Class: | |||||||||||||||||||||||||||
2008(3) | $ | 1.00 | $ | 0.01 | (2) | $ | — | $ | 0.01 | $ | (0.01 | ) | $ | — | $ | (0.01 | ) | ||||||||||
Blue Chip Portfolio | |||||||||||||||||||||||||||
Initial Class: | |||||||||||||||||||||||||||
2008 | $ | 42.41 | $ | 0.91 | $ | (13.55 | ) | $ | (12.64 | ) | $ | (0.86 | ) | $ | — | $ | (0.86 | ) | |||||||||
2007 | 40.61 | 0.86 | 1.73 | 2.59 | (0.79 | ) | — | (0.79 | ) | ||||||||||||||||||
2006 | 35.27 | 0.79 | 5.25 | 6.04 | (0.70 | ) | — | (0.70 | ) | ||||||||||||||||||
2005 | 35.17 | 0.70 | 0.07 | 0.77 | (0.67 | ) | — | (0.67 | ) | ||||||||||||||||||
2004 | 33.65 | 0.67 | 1.35 | 2.02 | (0.50 | ) | — | (0.50 | ) | ||||||||||||||||||
Service Class: | |||||||||||||||||||||||||||
2008(3) | $ | 39.44 | $ | 0.23 | $ | (10.80 | ) | $ | (10.57 | ) | $ | — | $ | — | $ | — | |||||||||||
38
| Ratios/Supplemental Data | |||||||||||||||||||
| Net Asset Value at End of Period | Total Investment Return Based on Net Asset Value (1) | Net Assets at End of Period (in thousands) | Ratio of Total Expenses to Average Net Assets (3) | Ratio of Net Expenses to Average Net Assets (3) | Ratio of Net Investment Income to Average Net Assets (3) | Portfolio Turnover Rate | |||||||||||||
| $ | 9.80 | (30.31 | )% | $ | 44,595 | 0.58 | % | 0.58 | % | 1.62 | % | 24 | % | ||||||
| 15.06 | 5.27 | % | 67,870 | 0.55 | % | 0.55 | % | 2.20 | % | 17 | % | ||||||||
| 15.09 | 12.07 | % | 65,712 | 0.58 | % | 0.58 | % | 1.88 | % | 30 | % | ||||||||
| 13.65 | 6.41 | % | 60,223 | 0.58 | % | 0.58 | % | 1.42 | % | 18 | % | ||||||||
| 12.98 | 11.53 | % | 58,354 | 0.58 | % | 0.58 | % | 1.22 | % | 17 | % | ||||||||
| $ | 9.79 | (29.92 | )% | $ | 163 | 0.84 | % | 0.84 | % | 1.70 | % | 24 | % | ||||||
| $ | 9.47 | (1.60 | )% | $ | 41,603 | 0.43 | % | 0.43 | % | 5.00 | % | 17 | % | ||||||
| 10.12 | 5.48 | % | 46,039 | 0.42 | % | 0.42 | % | 5.30 | % | 11 | % | ||||||||
| 10.12 | 4.78 | % | 39,371 | 0.44 | % | 0.44 | % | 5.08 | % | 17 | % | ||||||||
| 10.16 | 2.65 | % | 34,946 | 0.45 | % | 0.45 | % | 4.63 | % | 12 | % | ||||||||
| 10.38 | 4.30 | % | 29,980 | 0.45 | % | 0.45 | % | 4.34 | % | 26 | % | ||||||||
| $ | 9.47 | (1.30 | )% | $ | 2,799 | 0.68 | % | 0.68 | % | 4.87 | % | 17 | % | ||||||
| $ | 7.46 | (11.08 | )% | $ | 36,345 | 0.58 | % | 0.58 | % | 6.28 | % | 11 | % | ||||||
| 8.94 | 3.56 | % | 45,247 | 0.57 | % | 0.57 | % | 6.26 | % | 17 | % | ||||||||
| 9.19 | 6.79 | % | 41,481 | 0.58 | % | 0.58 | % | 6.04 | % | 16 | % | ||||||||
| 9.14 | 3.26 | % | 37,067 | 0.59 | % | 0.59 | % | 5.71 | % | 1 | % | ||||||||
| 9.37 | 8.94 | % | 30,637 | 0.59 | % | 0.59 | % | 5.98 | % | 34 | % | ||||||||
| $ | 7.46 | (9.90 | )% | $ | 237 | 0.84 | % | 0.84 | % | 6.73 | % | 11 | % | ||||||
| $ | 11.93 | (19.94 | )% | $ | 71,044 | 0.55 | % | 0.55 | % | 2.70 | % | 19 | % | ||||||
| 16.05 | 5.87 | % | 97,073 | 0.54 | % | 0.54 | % | 3.47 | % | 14 | % | ||||||||
| 16.32 | 11.99 | % | 93,796 | 0.55 | % | 0.55 | % | 2.98 | % | 24 | % | ||||||||
| 15.80 | 4.53 | % | 83,368 | 0.56 | % | 0.56 | % | 2.34 | % | 24 | % | ||||||||
| 15.67 | 8.58 | % | 74,876 | 0.56 | % | 0.56 | % | 1.87 | % | 26 | % | ||||||||
| $ | 11.91 | (20.55 | )% | $ | 709 | 0.81 | % | 0.81 | % | 2.87 | % | 19 | % | ||||||
| $ | 1.00 | 1.91 | % | $ | 14,631 | 0.46 | % | 0.45 | % | 1.92 | % | 0 | % | ||||||
| 1.00 | 4.71 | % | 16,464 | 0.45 | % | 0.45 | % | 4.60 | % | 0 | % | ||||||||
| 1.00 | 4.43 | % | 8,557 | 0.54 | % | 0.54 | % | 4.37 | % | 0 | % | ||||||||
| 1.00 | 2.50 | % | 6,288 | 0.61 | % | 0.61 | % | 2.47 | % | 0 | % | ||||||||
| 1.00 | 0.74 | % | 6,592 | 0.56 | % | 0.56 | % | 0.72 | % | 0 | % | ||||||||
| $ | 1.00 | 0.71 | % | $ | 197 | 0.73 | % | 0.69 | % | 0.87 | % | 0 | % | ||||||
| $ | 28.91 | (30.32 | )% | $ | 62,138 | 0.31 | % | 0.31 | % | 2.46 | % | 1 | % | ||||||
| 42.41 | 6.49 | % | 94,766 | 0.29 | % | 0.29 | % | 2.04 | % | 2 | % | ||||||||
| 40.61 | 17.42 | % | 90,261 | 0.31 | % | 0.31 | % | 2.07 | % | 0 | % | ||||||||
| 35.27 | 2.29 | % | 82,501 | 0.31 | % | 0.31 | % | 1.98 | % | 0 | % | ||||||||
| 35.17 | 6.07 | % | 84,960 | 0.30 | % | 0.30 | % | 2.00 | % | 1 | % | ||||||||
| $ | 28.87 | (26.80 | )% | $ | 723 | 0.57 | % | 0.57 | % | 2.60 | % | 1 | % | ||||||
39
EQUITRUST VARIABLE INSURANCE SERIES FUND
NOTES TO FINANCIAL HIGHLIGHTS
(1) Total investment return is calculated assuming an initial investment made at the net asset value at the beginning of the period, reinvestment of all dividends and distributions at net asset value during the period, and redemption on the last day of the period and is not annualized for periods less than one year.
(2) Without a voluntary waiver/reimbursement of a portion of expenses (see Note 3 to the financial statements) for the periods indicated, the following Portfolio would have had per share net investment income as shown:
| Year | Per Share Net Investment Income | Amount Reimbursed | ||||||
Money Market Portfolio | ||||||||
Class IC | 2008 | $ | 0.02 | $ | 1,311 | |||
Class SC | 2008 | $ | 0.01 | $ | 18 | |||
(3) Service Class financial highlights are for the period June 1, 2008 to December 31, 2008. Respective ratios/supplemental data are computed on an annualized basis.
40
REPORT OF INDEPENDENT REGISTERED PUBLIC ACCOUNTING FIRM
The Board of Trustees and Shareholders
EquiTrust Variable Insurance Series Fund
We have audited the accompanying statements of assets and liabilities, including the schedules of investments, of EquiTrust Variable Insurance Series Fund [comprising, respectively, the Value Growth, High Grade Bond, Strategic Yield, Managed, Money Market and Blue Chip Portfolios] as of December 31, 2008, and the related statements of operations for the year then ended, the statements of changes in net assets for each of the two years in the period then ended, and the financial highlights for each of the five years in the period then ended. These financial statements and financial highlights are the responsibility of the Fund’s management. Our responsibility is to express an opinion on these financial statements and financial highlights based on our audits.
We conducted our audits in accordance with the standards of the Public Company Accounting Oversight Board (United States). Those standards require that we plan and perform the audit to obtain reasonable assurance about whether the financial statements and financial highlights are free of material misstatement. We were not engaged to perform an audit of the Fund’s internal control over financial reporting. Our audits included consideration of internal control over financial reporting as a basis for designing audit procedures that are appropriate in the circumstances, but not for the purpose of expressing an opinion on the effectiveness of the Fund’s internal control over financial reporting. Accordingly, we express no such opinion. An audit also includes examining, on a test basis, evidence supporting the amounts and disclosures in the financial statements and financial highlights, assessing the accounting principles used and significant estimates made by management, and evaluating the overall financial statement presentation. Our procedures included confirmation of securities owned as of December 31, 2008, by correspondence with the custodian and brokers. We believe that our audits provide a reasonable basis for our opinion.
In our opinion, the financial statements and financial highlights referred to above present fairly, in all material respects, the financial position of each of the respective portfolios constituting the EquiTrust Variable Insurance Series Fund at December 31, 2008, and the results of their operations for the year then ended, the changes in their net assets for each of the two years in the period then ended, and the financial highlights for each of the five years in the period then ended, in conformity with U.S. generally accepted accounting principles.

Des Moines, Iowa
February 6, 2009
41
APPROVAL OF THE INVESTMENT ADVISORY CONTRACT
On November 24, 2008 the Board of Trustees, including a majority of the trustees who are not parties to or “interested persons” of either party to the investment advisory contract (the “independent trustees”), approved for continuance the Investment Advisory and Management Services Agreement as amended and restated May 21, 2003 between all Portfolios of EquiTrust Variable Insurance Series Fund (the “Fund”) and EquiTrust Investment Management Services, Inc. (“Adviser”) (the “Agreement”).
The Board of Trustees, including a majority of the independent trustees, determined that approval of the Agreement was in the best interests of the Fund. The independent trustees were assisted by independent legal counsel in making their determination.
The Board noted that the Adviser has managed each Portfolio since its inception. The Board recognized that a long-term relationship with a capable, conscientious investment adviser is in the best interests of shareholders and that shareholders invested in the Portfolios are aware of the Adviser’s history as manager of the Portfolios and knowing the investment advisory fee schedule.
Nature, Quality and Extent of Services. With respect to the nature, quality and extent of the services provided by the Adviser to the Portfolios, the Board considered the functions performed by the Adviser and the personnel providing such services, the Adviser’s financial condition and the compliance regime created by the Adviser, including the fact that the Fund has had no material compliance issues.
The Board reviewed and discussed summaries and reports prepared by the Adviser containing information on each Portfolio’s total returns and average annual total returns over various periods of time, including reports that contained comparisons of Initial Class Share Portfolios to a peer group of funds pursuing broadly similar strategies and the Morningstar rating. The Board concluded that as to each Portfolio, the investment performance was satisfactory, and in some cases, good relative to the peer group of mutual funds included in the reports. Based on the information provided, the Board concluded that the nature and extent of services provided to each Portfolio were appropriate and that the quality was good.
Fees and Expenses. The Board reviewed the amounts paid to the Adviser for advisory services. The Board compared the Initial Class Share Portfolios’ management fees and expense ratios with other registered funds pursuing broadly similar strategies as included in reports prepared by the Adviser. The Board also reviewed a report management uses to review and evaluate expenses. This information showed that the advisory fee of each Initial Class Share Portfolio was below average compared to other mutual funds pursuing broadly similar strategies. This information also showed that the expense ratios of each Initial Class Share Portfolio were below average compared to similar mutual funds. The Board received information from the Adviser regarding the Adviser’s standard advisory fee schedules for the Adviser’s other clients. With respect to the Adviser’s other clients, the Board considered that the mix of services provided and the level of responsibility required under the Agreement with the Fund were different than the Adviser’s obligations for similar client accounts and that the advisory fees of such accounts are less relevant to the Board’s consideration because they reflect different competitive forces than those in the mutual fund marketplace. With respect to other EquiTrust funds, the Board considered differences in fund and fee structures in light of the different distribution channels of the funds. The Board also considered that the Adviser has reimbursed expenses for the Portfolios over various periods of times. Based on the information considered, the Board concluded that each Portfolio’s advisory fee was reasonable and appropriate in amount given the quality of services provided.
Profitability. With respect to the costs of services provided and profits realized by the Adviser, the Board considered the advisory fees received by the Adviser from each Portfolio and received from the Adviser information on each Portfolio’s net assets and expense ratios over a ten-year period. The Board also considered the fact that the Adviser continues to be subject to an expense reimbursement agreement and that the Adviser has kept expenses at a reasonable level. Based on this information, the Board concluded for each Portfolio that the Adviser’s profitability was not unreasonable.
Economies of Scale. The Board considered the extent to which economies of scale would be realized as each Portfolio grows and whether fee levels reflect economies of scale for the benefit of Portfolio shareholders. The Board noted that the High Grade Bond, Strategic Yield and Value Growth Portfolios have advisory fee breakpoints designed to share economies of scale with shareholders. The Board also considered that the current size of each Portfolio does not lend itself to economies of scale. The Board concluded, with respect to each of the Portfolios, that the total expense ratios were reasonable.
42
Other Benefits to the Adviser and its Affiliates. The Board considered the character and amount of other incidental benefits received by the Adviser and its affiliates from their relationship with the Fund, including fees received by the Adviser for accounting services, shareholder services, dividend disbursing and transfer agent services and fees received by an affiliate of the Adviser for distribution services. The Board also considered the Adviser’s placement of trades for the Fund’s portfolios with certain broker-dealers that provide research products and services, in addition to the execution of the securities transactions. In doing so, the Board considered the Adviser’s determination that the level and amount of such commissions were reasonable in relation to the value and type of research received, the benefit of the research to the portfolio managers in the performance of their investment decision-making responsibilities and, in turn, the Portfolios, the research is eligible research under the SEC’s guidelines and some of the research may not be available for purchase with hard dollars, and the use of traders and quality of execution and other brokerage services available through such broker-dealers. The Board concluded that, taking into account these benefits, the Portfolios’ advisory fees were reasonable.
Based on all of the information considered and the conclusions reached, the Board determined to approve the Agreement. The Board of Trustees, including the independent trustees, did not identify any single factor or group of factors as all important or controlling and considered all factors together.
Information on Proxy Voting:
The Fund has delegated the authority to vote proxies related to the its Portfolio securities to the Fund’s investment adviser, EquiTrust Investment Management Services, Inc.. A description of the policies and procedures that the Adviser uses in fulfilling this responsibility is available, without charge, upon request by calling 1-877-860-2904. It also appears in the Fund’s Statement of Additional Information, which can be found on the SEC’s website at http://www.sec.gov. The Fund’s proxy voting record for the most recent 12-month period ended June 30, 2008 is available without charge, by calling the toll-free number listed above or by accessing the SEC’s website.
Form N-Q Disclosure:
The Fund files a complete schedule of Portfolio holdings for its first and third quarters of each fiscal year with the SEC on Form N-Q. The Fund’s Forms N-Q are available on the SEC’s website at http://www.sec.gov or may be reviewed and copied at the SEC’s Public Reference Room in Washington, D.C. Information regarding the operation of the Public Reference Room may be obtained by calling 1-800-SEC-0330. A copy of Form N-Q is also available, without charge, by calling the Fund at 1-877-860-2904.
43
| Name, Address and Age | Position(s) Held with Fund | Term of Office & Length of Time Served(1) | Principal Occupation(s) During Past Five Years | Number of Portfolios in Fund Complex Overseen by Trustee | Other Directorships Held by Trustee | |||||
| Interested Persons(2) | ||||||||||
| Craig A. Lang (57) | President and Trustee | Since 2002 | Chairman and Director, FBL Financial Group, Inc.; Mr. Lang serves as an officer and/or director/trustee of various affiliates of the foregoing. Dairy Farmer; past Chairman, Grow Iowa Values Fund; past Director, Iowa Department of Economic Development, Cattlemen’s Beef Board and Growmark, Inc. | 13 | Director, Farm Bureau Bank (San Antonio, Texas), Iowa Telecommunications Services, Inc. (Newton, Iowa) Member, Iowa Boad of Regents. | |||||
| James W. Noyce (53) | Vice President and Trustee Chief Financial Officer and Treasurer | Since 2007
1996-2007 | Chief Executive Officer and Class A Director, FBL Financial Group, Inc. and other affiliates of the foregoing; Chief Executive Officer and Director/Manager, EquiTrust Investment Management Services, Inc. and EquiTrust Marketing Services, LLC; Vice President and Director/Trustee, EquiTrust Mutual Funds; President, Chief Executive Officer and Director, FBL Leasing Services, Inc.; Vice President, Western Computer Services, Inc.; Vice President and Director Crop1 Insurance Direct, Inc. | 13 | Director, Berthel Fisher & Company, Inc. and Berthel Fisher & Company Financial Services, Inc. | |||||
| Dennis M. Marker (57) | Chief Executive Officer | Since 1982 | Vice President-Investment Administration, FBL Financial Group, Inc. and other affiliates of the foregoing; Chief Compliance Officer, Vice President-Investment Administration and Director/Manager, EquiTrust Investment Services, Inc. and EquiTrust Marketing Services, LLC; Chief Executive Officer, EquiTrust Mutual Funds; Vice President and Director, FBL Leasing Services, Inc. | |||||||
| James P. Brannen (46) | Chief Financial Officer and Treasurer | Since 2007 | Chief Financial Officer and Chief Administrative Officer, Treasurer, FBL Financial Group, Inc. and other affiliates of the foregoing; Chief Financial Officer, Treasurer and Director/Manager, EquiTrust Investment Services, Inc. and EquiTrust Marketing Services, LLC; Chief Financial Officer and Treasurer, EquiTrust Mutual Funds; Chief Financial Officer, Chief Administrative Officer, Treasurer and Director, FBL Leasing Services, Inc.; Chief Administrative Officer, Treasurer, Crop1 Insurance Direct, Inc. | |||||||
| Richard J. Kypta (56) | Executive Vice President and General Counsel | Since 2007 | Executive Vice President – Farm Bureau Life, General Counsel and Secretary FBL Financial Group, Inc. and other affiliates of the foregoing; Executive Vice President, General Counsel and Director, EquiTrust Investment Management Services, Inc.; Executive Vice President and General Counsel, EquiTrust Marketing Services, LLC and EquiTrust Mutual Funds; Senior Vice President, General Counsel, Secretary and Director, FBL Leasing Services, Inc., Western Computer Services, Inc. and Crop1 Insurance Direct, Inc.; 2005 – 2007, Senior Vice President and Chief Operating Officer, Aviva USA Corporation; 2002 – 2005 Senior Vice President Structured Settlements, Aviva USA Corporation. | |||||||
| John M. Paule (52) | Vice President | Since 2000 | Executive Vice President – EquiTrust Life. FBL Financial Group, Inc. and other affiliates of the foregoing; Vice President, Farm Bureau Life Insurance Company; Executive Vice President, EquiTrust Life Insurance Company; Executive Vice President and Director/Manager, EquiTrust Investment Management Services, Inc. and EquiTrust Marketing Services, LLC.; Vice President, EquiTrust Mutual Funds, Western Computer Services, Inc. and Crop1 Insurance Direct, Inc. | |||||||
| Charles T. Happel (47) | Vice President-Investments | Since 2008 | Vice President – Investments, FBL Financial Group, Inc. and other affiliates of the foregoing; President and Director, EquiTrust Investment Management Services, Inc.; Vice President – Investments and Manager, EquiTrust Marketing Services, LLC; Vice President – Investments, EquiTrust Mutual Funds; Vice President and Director, FBL Leasing Services, Inc.; Vice President, Western Computer Services, Inc. | |||||||
| Kristi Rojohn (45) | Chief Compliance Officer, Investment Compliance Vice President and Secretary | Since 1990 | Chief Compliance Officer, Investment Compliance Vice President and Secretary, EquiTrust Mutual Funds; Investment Compliance Vice President and Secretary, EquiTrust Investment Management Services, Inc. and EquiTrust Marketing Services, LLC. | |||||||
44
| Name, Address and Age | Position(s) Held with Fund | Term of Office & Length of Time Served(1) | Principal Occupation(s) During Past Five Years | Number of Portfolios in Fund Complex Overseen by Trustee | Other Directorships Held by Trustee | |||||
| Rob Ruisch (42) | Mutual Fund Accounting Director | Since 2005 | Mutual Fund Accounting Director, EquiTrust Investment Management Services, Inc., EquiTrust Marketing Services, LLC and EquiTrust Mutual Funds. | |||||||
| Jennifer Morgan (38) | Assistant Secretary | Since 2005 | Assistant Secretary, EquiTrust Investment Management Services, Inc., EquiTrust Marketing Services, LLC and EquiTrust Mutual Funds. | |||||||
| Lillie Peshel (35) | Assistant Secretary | Since 2008 | Assistant Secretary, EquiTrust Investment Management Services, Inc., EquiTrust Marketing Services, LLC and EquiTrust Mutual Funds. | |||||||
| Sara Tamisiea (26) | Assistant Secretary | Since 2006 | Assistant Secretary, EquiTrust Investment Management Services, Inc., EquiTrust Marketing Services, LLC and EquiTrust Mutual Funds. | |||||||
| Jodi Winslow (33) | Assistant Secretary | Since 2005 | Assistant Secretary, EquiTrust Investment Management Services, Inc., EquiTrust Marketing Services, LLC and EquiTrust Mutual Funds. | |||||||
| Independent Persons | ||||||||||
Erwin H. Johnson (65) 1841 March Avenue Charles City, Iowa | Director | Since 1989 | Farmer; Owner and Manager, Center View Farms, Co.; Farm Financial Planner, Iowa State University Cooperative Extension Service. | 13 | Director, First Security Bank and Trust Co. (Charles City, Iowa) | |||||
Kenneth Kay (65) 590th Street Atlantic, Iowa 50022-8233 | Director | Since 1996 | President, K-Ranch Inc. | 13 | Director, First Whitney Bank & Trust (Atlantic, Iowa) | |||||
Steven W. Plate (52) 1003 Main Street Grinnell, Iowa 50112 | Director | Since 2003 | CPA/Owner, Plate, Baker & Co., P.C., Certified Public Accountants. | 13 | N/A | |||||
| James D. Wallace (53) 1111 Ashworth Road West Des Moines, IA 50265 | Director | Since 2004 | President and CEO, GuideOne Insurance and various subsidiaries. | 13 | Director, GuideOne Insurance and various subsidiaries | |||||
| Erlin J. Weness (64) 1620 Pinewood Drive Worthington, Minnesota 56187 | Director | Since 2003 | Owner and Operator, Weness Consulting; Extension Educator-Farm Management, University of Minnesota | 13 | Director, First State Bank Southwest (Worthington, Minnesota), First State Insurance Agency (Worthington, Minnesota), First Rushmore Bancorporation (Worthington, Minnesota), Pioneer Public Television and Community Wind South, LLP | |||||
(1) | Officers are elected annually by the Board of Directors and their terms continue until they are replaced or resign. Each director shall serve as a director of the Fund until the next meeting of shareholders called for the purpose of conducting the election of such director or a successor to such director, and until his successor is elected and qualified, or until such director sooner dies, resigns or is removed. |
(2) | All interested persons maintain the same business address of 5400 University Avenue, West Des Moines, Iowa 50266. |
The officers and directors of the Fund also serve in similar capacities as officers and directors of EquiTrust Money Market Fund, Inc. and as officers and trustees of EquiTrust Variable Insurance Series Fund. All, except one, of the Fund’s officers and interested directors are also officers and directors of the Adviser and/or the Distributor or an affiliate thereof. The Fund’s interested directors and officers serve without any compensation from the Fund. Each independent director receives an annual retainer of $10,000 for serving on the boards of all Funds in the EquiTrust Fund Complex, a fee of $1,500 plus expenses for each directors’ meeting of the EquiTrust Fund Complex attended and a fee of $1,000 ($1,250 for committee chairmen) plus expenses for each committee meeting attended. A fee of $250 is paid for each telephonic board or committee meeting attended. For the fiscal year ended July 31, 2008, the Fund paid directors’ fees totaling $28,500.
45
| Item 2. | Code of Ethics. |
| (a) | The registrant has adopted a code of ethics that applies to the registrant’s principal executive officer, principal financial officer, principal accounting officer or controller, or persons performing similar functions. A copy of the code of ethics may be obtained upon request, without charge, by contacting the registrant at its principal executive office. |
| Item 3. | Audit Committee Financial Expert. |
| (a) | (1) The registrant’s board of directors has determined that the registrant has at least one audit committee financial expert serving on the audit committee. |
| (2) | The audit committee financial expert is James D. Wallace. Mr. Wallace is independent as defined in Form N-CSR Item 3(a)(2). |
| Item 4. | Principal Accountant Fees and Services. |
| (a) | Audit Fees: For the Fund’s fiscal years ended December 31, 2007 and December 31, 2008, the aggregate fees billed by the Fund’s principal accountant for the audit of the Fund’s financial statements were $59,000 and $61,800, respectively. |
| (b) | Audit-Related Fees: There were no audit-related fees billed to the Fund for the fiscal years ended December 31, 2007 and December 31, 2008. |
| (c) | Tax Fees: None. |
| (d) | All Other Fees: For the Fund’s fiscal years ended December 31, 2007 and December 31, 2008, the aggregate fees billed by the Fund’s principal accountant included fees related to the audits of EquiTrust Series Fund, Inc. and EquiTrust Money Market Fund, Inc.; as well as fees for services performed by the principal accountant for EquiTrust Investment Management Services, Inc. and EquiTrust Marketing Services, LLC, affiliates of the Fund that provide support for the operations of the Fund. The amounts of these fees are as follows: |
Fiscal Year Ended: | December 31, 2007 | December 31, 2008 | ||||
Fees related to audits of EquiTrust Series Fund, Inc. and EquiTrust Money Market Fund, Inc. and for research and consultation on miscellaneous accounting matters | $ | 80,100 | $ | 83,200 | ||
Services performed for EquiTrust Marketing Services, LLC and EquiTrust Investment Management Services, Inc. related to the audits of these entities and for research and consultation on miscellaneous accounting matters | $ | 40,800 | $ | 42,800 | ||
| (e) | (1) The Fund’s Audit Committee adopted the following pre-approval policies and procedures: |
| IV. | RESPONSIBILITIES AND DUTIES |
To fulfill its responsibilities and duties the Audit Committee shall:
| C. | Independent registered public accounting firm |
| 2. | Pre-approve any engagement of the independent registered public accounting firm to provide any services to the Fund, including the fees and other compensation to be paid to the independent registered public accounting firm. Notwithstanding the above, the independent registered public accounting firm shall not perform any of the following non-audit services for the Fund (“prohibited non-audit services”): |
| a. | bookkeeping or other services related to the accounting records or financial statements of the Fund; |
| b. | financial information systems design and implementation; |
| c. | appraisal or valuation services, fairness opinions, or contribution-in-kind reports; |
| d. | actuarial services; |
| e. | internal audit outsourcing services; |
| f. | management functions or human resources; |
| g. | broker or dealer, investment adviser, or investment banking services; |
| h. | legal services and expert services unrelated to the audit; and |
| i. | any other services that the Public Company Accounting Oversight Board determines are impermissible. |
3. | Pre-approve any engagement of the independent registered public accounting firm, including the fees and other compensation to be paid to the independent registered public accounting firm, to provide any non-audit services to the Adviser (or any “control affiliate”1 of the Adviser providing ongoing services to the Fund), if the engagement relates directly to the operations and financial reporting of the Fund. |
1 | “Control affiliate” means any entity controlling, controlled by, or under common control with the Adviser. |
| • | The Chairman of the Audit Committee (or in his absence, any member of the Audit Committee) may grant the pre-approval referenced in Sections IV.C. 2 and 3 above for non-prohibited services for engagements of less than $5000. Each member of the Audit Committee shall be notified in writing of the pre-approval promptly following the granting of such approval. In addition, all such delegated pre-approvals shall be presented to the Audit Committee no later than the next Audit Committee meeting. |
| • | Pre-approval of non-audit services for the Fund pursuant to Section IV.C. 2 above is not required, if: |
| (a) | the aggregate amount of all non-audit services provided to the Fund is less than 5% of the total fees paid by the Fund to the independent registered public accounting firm during the fiscal year in which the non-audit services are provided; |
| (b) | the services were not recognized by Fund management at the time of the engagement as non-audit services; and |
| (c) | such services are promptly brought to the attention of the Audit Committee by Fund management and the Audit Committee approves them (which may be by delegation) prior to the completion of the audit. |
| • | Pre-approval of non-audit services for the Adviser (or any affiliate of the Adviser providing ongoing services to the Fund) pursuant to Section IV.C.3 above is not required, if: |
| (a) | the aggregate amount of all non-audit services provided is less than 5% of the total fees paid by the Fund, the Adviser and any “control affiliate” of the Adviser providing ongoing services to the Fund to the independent registered public accounting firm during the fiscal year in which the non-audit services are provided; |
| (b) | the services were not recognized by Fund management at the time of the engagement as non-audit services; and |
| (c) | such services are promptly brought to the attention of the Audit Committee by Fund management and the Audit Committee approves them (which may be by delegation) prior to the completion of the audit. |
| (e) | (2) Not applicable. |
| (f) | Not applicable. |
| (g) | Aggregate Non-audit Fees: There were no non-audit fees billed for the fiscal years ended December 31, 2007 and December 31, 2008. |
| (h) | The Audit Committee of the Board of Trustees of the Fund has reviewed the statement of independence provided by Ernst & Young, the Fund’s principal accountant, considered whether the provision of non-audit services by the firm to the Fund’s investment adviser and any entity controlling, controlled by, or under common control with the adviser is compatible with such firm’s independence with respect to the Fund, and concluded that the non-audit services provided by Ernst & Young does not compromise that firm’s independence with regard to the Fund. |
| Item 5. | Audit Committee of Listed Registrant. |
Not applicable.
| Item 6. | Schedule of Investments. |
See Item 1.
| Item 7. | Disclosure of Proxy Voting Policies and Procedures for Closed-End Management Investment Companies. |
Not applicable.
| Item 8. | Portfolio Managers of Closed-End Management Investment Companies. |
Not applicable.
| Item 9. | Purchases of Equity Securities by Closed-End Management Investment Companies and Affiliated Purchasers. |
Not applicable.
| Item 10. | Submission of Matters to a Vote of Security Holders. |
There have been no material changes to the procedures by which shareholders may recommend nominees to the registrant’s board of trustees since the registrant last provided disclosure in response to this Item.
| Item 11. | Controls and Procedures |
| (a) | The registrant’s principal executive and principal financial officers, or persons performing similar functions, have concluded that the registrant’s disclosure controls and procedures (as defined in Rule 30a-3(c) under the Investment Company Act of 1940, as amended (the “1940 Act”) (17 CFR 270.30a-3(c))) are effective, as of a date within 90 days of the filing date of the report that includes the disclosure required by this paragraph, based on their evaluation of these controls and procedures required by Rule 30a-3(b) under the 1940 Act (17 CFR 270.30a-3(b)) and Rules 13a-15(b) or 15d-15(b) under the Exchange Act (17 CFR 240.13a-15(b) or 240.15d-15(b)). |
| (b) | There has been no change to the registrant’s internal control over financial reporting that occurred during the registrant’s most recent fiscal quarter that has materially affected, or is reasonably likely to materially affect, the registrant’s internal control over financial reporting. |
| Item 12. | Exhibits. |
| (a)(1) | Not applicable. See Item 2(a). |
| (a)(2) | Certifications pursuant to Section 302 of the Sarbanes-Oxley Act of 2002 are filed as exhibits hereto. |
| (a)(3) | Not applicable. |
| (b) | Certifications pursuant to Section 906 of the Sarbanes-Oxley Act of 2002 are filed as exhibits hereto. |
SIGNATURES
Pursuant to the requirements of the Securities Exchange Act of 1934 and the Investment Company Act of 1940, the registrant has duly caused this report to be signed on its behalf by the undersigned, thereunto duly authorized.
(Registrant) EquiTrust Variable Insurance Series Fund
| By: | /s/ Kristi Rojohn | |
| Name: Kristi Rojohn | ||
| Title: Chief Executive Officer | ||
| Date: 2/16/2009 |
Pursuant to the requirements of the Securities Exchange Act of 1934 and the Investment Company Act of 1940, this report has been signed below by the following persons on behalf of the registrant and in the capacities and on the dates indicated.
| By: | /s/ Kristi Rojohn | |
| Name: Kristi Rojohn | ||
| Title: Chief Executive Officer | ||
| Date: 2/16/2009 | ||
| By: | /s/ James P. Brannen | |
| Name: James P. Brannen | ||
| Title: Chief Financial Officer | ||
| Date: 2/19/20009 | ||