UNITED STATES
SECURITIES AND EXCHANGE COMMISSION
Washington, D.C. 20549
FORM N-CSR
CERTIFIED SHAREHOLDER REPORT OF REGISTERED
MANAGEMENT INVESTMENT COMPANIES
Investment Company Act file number | 33-12791 & 811-5069 |
EquiTrust Variable Insurance Series Fund
| (Exact name of registrant as specified in charter) |
| 5400 University Avenue, West Des Moines IA | 50266-5997 | |
| (Address of principal executive offices) | (Zip code) |
Kristi Rojohn, 5400 University Avenue, West Des Moines IA 50266-5997
| (Name and address of agent for service) |
Registrant’s telephone number, including area code: 515/225-5400
Date of fiscal year end: December 31, 2006
Date of reporting period: December 31, 2006
| Item 1. | Reports to Stockholders. |
EquiTrust Variable Insurance Series Fund


5400 University Avenue
West Des Moines, IA 50266
1-877-860-2904
1-515-225-5586
This report is not to be distributed unless preceded or accompanied by a current prospectus.
ANNUAL REPORT
DECEMBER 31, 2006
January 29, 2007
PRESIDENT’S LETTER
Dear Shareholder:
Equities finished strong in 2006, with many market benchmarks posting double-digit gains for the year. International equity benchmarks generally outperformed domestic benchmarks. The internationally-developed markets’ MSCI EAFE Index, for example, topped the S&P 500 Stock Composite Index (“S&P 500” or the “Index”), with a total return of 26.86% versus 15.79%. Domestic large-caps and small-caps finished well, with the Dow Jones Industrial Average returning 19.03% and the Russell 2000 18.43%. The NASDAQ Composite returned a more modest — but still double-digit — gain of 10.38% for the year.
Aside from the high yield fixed-income market, fixed-income returns were generally more modest for the year. The Lehman Brothers U.S. Corporate High Yield Index (“High Yield Index”) returned 11.85%, but the broad Lehman Brothers U.S. Aggregate Index (“Aggressive Index”) returned just 4.33%. Returns on investment grade issues were similar, with the Lehman Brothers U.S. Investment Grade Corporate Index (“Corporate Index”) returning 4.30%. The Lehman Brothers U.S. Treasury Index (“Treasury Index”) returned only 3.08% for the year, reflecting a broad upward shift in the interest rate yield curve.
The Fed raised short-term interest rates four times in 2006, taking the Fed Funds rate from 4.25% at the beginning of 2006 to 5.25% just past mid-year. It held steady at each of its successive meetings while communicating a lingering concern over inflationary pressures. Indeed, throughout the year, investors pushed up yields on longer-term maturities following any news implying that the nation’s economic health might trigger inflation. As reflected in quarterly Gross Domestic Product numbers, economic growth slowed considerably through the first three quarters of 2006 but rebounded strongly in the December quarter. Expectations remain for a strong start to 2007 as well. The U.S. economy continues to show resilience overall in spite of weakness in key areas such as business investment and housing.
Most investors readily recognize that macro-economic events turn investment performance on a quarterly and even monthly basis. However, instead of suggesting that investors seek an advanced degree in economics, we recommend that our shareholders develop an investment plan that incorporates an appropriate asset allocation strategy. In that regard, the EquiTrust Variable Insurance Series Fund provides a means to gain exposure to both the domestic equity and fixed-income markets. Below is a summary of Portfolio and market performance for 2006.
Value Growth: The Value Growth Portfolio trailed the S&P 500 for the year, returning 12.07% compared to 15.79% for the Index. All but two of the S&P 500’s sectors posted double-digit gains for the year, with its telecommunication services’ constituents topping all other sectors with an industry consolidation-driven gain of over 37% for the year. On a weighted basis, the S&P 500’s financials sector contributed the most on strong stock performance from investment banking firms and large banking organizations. The Index’s performance was more modest in health care and information technology. Health care providers and health care benefit managers were down for the year, while software manufacturers and internet software providers recorded sharp declines.
Relative to the S&P 500, the Portfolio underperformed in the financials and energy sectors as a result of underweight and/or underperforming holdings. The Portfolio outperformed in its health care and utilities positions, however, partially offsetting the underperformance elsewhere.
The broad rise in the domestic equity markets from mid-year drove valuations to less-attractive levels than we encountered in the first half of the year. That said, we continue to find the most appealing opportunities in mega- and large-cap stocks.
High Grade Bond: Treasury yields rose modestly during 2006 with the two-year yield increasing 41 basis points (“bp”) to 4.81%, the ten-year increasing by 31 bp to 4.70% and the thirty-year increasing by 27 bp to 4.81%. Despite the uptick in interest rates, the Treasury Index (25% of the Aggregate Index) had a positive return of 3.08% but trailed all spread sectors within the Aggregate Index. The Lehman Brothers U.S. Fixed Rate MBS Index (35% of the Aggregate Index) was the best performing sector of the Aggregate Index with a nominal return of 5.22% and was the second best-performing sector based on excess return with 122 bp of excess return relative to duration-neutral Treasuries. The mortgage-backed securities sector was helped by a low level of volatility during the year. The Lehman Brothers U.S. Investment-Grade Credit Index (23% of the Aggregate Index) had a nominal return of 4.26% in 2006 and was the third best-performing component of the Aggregate Index relative to Treasuries with 119 bp of excess return, after being the worst-performing sector in 2005 with a negative 85 bp of excess return. Unlike the results in 2005, lower quality issues tended to outperform during the year with the Baa Credit Index (154 bp excess return) leading the Single-A (114 bp), Aa (108 bp) and Aaa (50 bp) Indices by 40 bp, 46 bp and 104 bp, respectively. The option-adjusted spread on the Investment-Grade Credit Index moved within an 11 bp range during the year and finished the year nine bp tighter at 81 bp. It
2
would appear that the current, generally strong credit condition of the investment grade market is fully reflected in the existing narrow spread level. The Lehman Brothers U.S. Agency Index (11% of the Aggregate Index) had a nominal return of 4.37% during the year but produced the lowest excess return (75 bp) of the major spread sectors in the Aggregate Index.
The High Grade Bond Portfolio had a total return of 4.78% which exceeded the total return of the Aggregate Index of 4.33%. The Portfolio had approximately 42% of its assets invested in corporate securities, 36% in fixed rate mortgage issues, 11% in Government Agency issues and 11% in cash equivalents. The effective duration of the Portfolio was 4.07 compared to 4.46 for the Aggregate Index, mainly because its overexposure to outperforming cash equivalents and underexposure to underperforming Treasuries more then offset Portfolio expenses.
Spread levels remain at fairly narrow levels but Treasury yields are now relatively attractive so we feel it is reasonable to keep our level of risk close to that of the Aggregate Index.
Strategic Yield: The High Yield Index had a nominal return of 11.85% during the year which outperformed the Corporate Index return of 4.30% but trailed the 15.79% return of the S&P 500. The High Yield Index produced 843 bp of excess return in 2006. A continued low level of defaults and fairly stable credit trends, as well as strong market technicals and liquidity, helped the high yield market outperform the Treasury market. The yield on the High Yield Index decreased to 7.70% from 8.17% while the option-adjusted spread fell 57 bp to 270 bp over the year. Lower rated bonds outperformed during the year with Caa-rated bonds returning 17.66%, followed by single-B rated (11.22%) and Ba rated (10.22%) bonds.
During the twelve-month reporting period ended December 31, 2006, the Strategic Yield Portfolio produced a total return of 6.79%, lagging that of the High Yield Index. Its performance was hindered by both its lower exposure to high yield issues than the High Yield Index and Portfolio expenses. At the end of the period, the Portfolio had approximately 40% of its assets invested in corporate securities rated high yield by Moody’s or S&P, 29% in corporate securities rated investment grade, 17% in Government Agency issues and 14% in cash equivalents. In general, the non-investment grade corporate market appears to be fully valued and does not appear very attractive given the decline in spread levels since the start of the year.
Managed: The Managed Portfolio returned 11.99% for the twelve-month period ended December 31, 2006, compared to a gain of 15.79% for the S&P 500. Its equity holdings outperformed the S&P 500, in particular due to better performing health care and utilities positions. Returns in the Portfolio’s fixed income and cash positions were more modest relative to the S&P 500, leading to the Portfolio’s relative underperformance overall.
Within the Portfolio’s equity allocation, we continue to focus on high-quality large-cap companies that generate dividend income. Fixed-income yields have gotten more interesting of late with the 10-year Treasury inching closer to 5%, but would likely have to push above 5% before we might consider adding to the Portfolio’s fixed-income position.
Money Market: The interest rates offered by money market funds are closely related to the target rates set by the Federal Open Market Committee (“FOMC”). The FOMC meets several times throughout the year to determine the target Federal Funds rate, or overnight lending rates between banks. The Federal Funds target rate has been held steady at 5.25% since the August 8, 2006 meeting. During the latter half of 2006, the U.S. economy shifted from robust expansion to showing signs of weakness and slowing growth. The housing market continued to weaken in the second half of 2006, however, unemployment data and consumer spending remained strong. Inflation continues to be the FOMC’s main concern as statements released imply that Committee members are uncomfortable with current core inflation figures. The FOMC has stated that their comfort zone for core inflation is 1-2% and at year end the core inflation indicator was above 2%. The FOMC is confident that the U.S. economy is headed for a soft landing despite the heightened inflation readings. Rate cuts are not expected in the first half of 2007 unless the economy takes a drastic turn for the worse. Stronger than expected growth, in turn, would provide stimulus for the FOMC to resume raising rates. On December 29, 2006, the Money Market Portfolio had a 7-day yield of 4.64%.
Blue Chip: The Blue Chip Portfolio passively tracks the direction of the large capitalization equity market. It remains substantially invested in common stocks of large companies and is designed for those investors who prefer substantial exposure to common stocks at all times or who wish to make their own market value judgments. The Portfolio outperformed the S&P 500 for the twelve-month period ended December 31, 2006, gaining 17.42% compared to 15.79% for the S&P 500. We attribute the Portfolio��s performance advantage to its heavier exposure to the S&P 500’s largest constituents, as these outperformed the Index’s weighting of smaller constituents for the period.
3
We appreciate your investment in the Fund and we take seriously our task of seeking to grow and protect that investment. Thank you for your continued support of the Fund.

Craig A. Lang
President
An investment in the Money Market Portfolio is neither insured nor guaranteed by the Federal Deposit Insurance Corporation or any other government agency. Although the Portfolio seeks to preserve the net asset value of $1.00 per share, it is possible to lose money by investing in the Portfolio.
Past performance is not a guarantee of future results.
4
MANAGEMENT’S DISCUSSION OF FUND PERFORMANCE
PERFORMANCE GRAPH WORKSHEET
Comparison of Change in Value of $10,000 Investment in
the Value Growth Portfolio and S&P 500
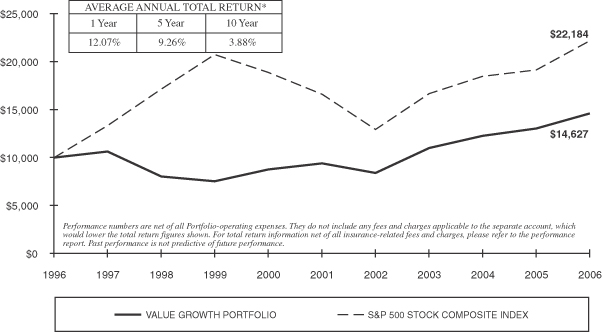
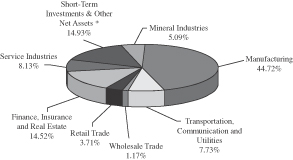
The Value Growth Portfolio trailed the S&P 500 for 2006, returning 12.07% versus 15.79% for the Index. The Portfolio underperformed in the financials sector primarily due to a significant underweight allocation in capital markets stocks, which had a strong run in the S&P 500 in 2006. The Portfolio’s telecommunications holdings also lagged the Index constituents, hindered mostly by missing out on the large gains contributed by the merger of AT&T and Bellsouth (the Portfolio held neither). The Portfolio underperformed in the energy sector despite an equal-weight exposure relative to the S&P 500, in part due to the omission of Exxon Mobil, the Index’s top energy stock for the year.
The Portfolio’s health care and utilities positions provided some upside to the Index, partially offsetting the underperformance elsewhere. Its holdings in orthopedics manufacturers Stryker Corp., Zimmer Holdings and Biomet Inc. contributed to strong relative health care performance, while above-average gains from CMS Energy Corp. and XCEL Energy Inc. led to outperformance among the Portfolio’s utilities exposure.
Following the dramatic run in stock prices since the middle of 2006, equity valuation is broadly not as attractive as it was in the first half of the year. Mega- and large-cap stocks appear to offer the most potential, but even the opportunities in this segment of the market have narrowed considerably.
| * | Returns shown do not reflect the deduction of taxes that a shareholder may pay on Portfolio distributions or the redemption of Portfolio shares. |
5
PERFORMANCE GRAPH WORKSHEET
Comparison of Change in Value of $10,000 Investment in
the High Grade Bond Portfolio and Lehman Brothers U.S. Aggregate Index

During the twelve-month period ended December 31, 2006, the High Grade Bond Portfolio outperformed the Lehman Brothers U.S. Aggregate Index, as reflected by the 4.78% total return produced by the Portfolio versus the 4.33% total return produced by the Index.
The total returns for the major components of the Index for this period were as follows:. Fixed Rate Mortgage Backed Securities (35% of the Index), 5.22%; Treasury Securities (25% of the Index), 3.08%; Investment Grade Corporate Securities (19% of the Index), 4.30%. In comparison, the Portfolio had approximately 42% of its assets invested in corporate securities, 36% invested in fixed rate mortgage-backed securities, 11% in cash equivalents, and 11% in U.S. Government Agencies. The Index had an effective duration1 of 4.46 as of December 31, 2006. The effective duration of the Portfolio was 4.07. The Portfolio outperformed the Index mainly because the Portfolio’s overexposure to outperforming cash equivalents and underexposure to underperforming Treasuries more than offset Portfolio expenses.
The composition of the Portfolio at the end of the reporting period saw a decrease in cash equivalents, Treasuries, and fixed-rate mortgage-backed securities and an increase in corporate issues. Going forward, we anticipate continuing to maintain a duration close to that of the Index as we feel that market risks are reasonably balanced and a major divergence from the Index is not warranted at this time.
1 | Duration is a measure of interest rate risk for individual securities and portfolios. The lower the duration for a security or portfolio, the less sensitive it is to movements in interest rates. |
| * | Returns shown do not reflect the deduction of taxes that a shareholder may pay on Portfolio distributions or the redemption of Portfolio shares. |
6
PERFORMANCE GRAPH WORKSHEET
Comparison of Change in Value of $10,000 Investment in
the Strategic Yield Portfolio and Lehman Brothers U.S. Credit/High Yield Index
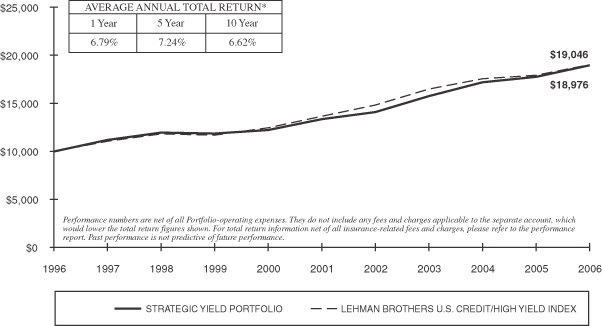
During the twelve-month period ended December 31, 2006, the 6.79% total return produced by the Strategic Yield Portfolio was greater than the 6.01% return produced by the Lehman Brothers U.S. Credit/High Yield Index. The total returns for the two components of the Index over this period were as follows:. Investment Grade Credit (76% of the Index), 4.26%; and Corporate High Yield (24% of the Index), 11.85%. In comparison, the Portfolio had approximately 40% of its assets invested in corporate securities rated as non-investment grade or high yield by Moody’s and/or Standard & Poor’s, 29% of its assets invested in corporate securities rated investment grade by both Moody’s and Standard & Poor’s, 17% of its assets invested in U.S. Government Agency issues, and 14% in cash equivalents. The Portfolio outperformed the overall Index due to its larger exposure to outperforming cash equivalents and high yield issues which more than offset expenses.
The Portfolio has historically invested in a mix of high yield and investment grade issues attempting to find attractive issues in both markets.
| * | Returns shown do not reflect the deduction of taxes that a shareholder may pay on Portfolio distributions or the redemption of Portfolio shares. |
7
PERFORMANCE GRAPH WORKSHEET
Comparison of Change in Value of $10,000 Investment in
the Managed Portfolio and S&P 500
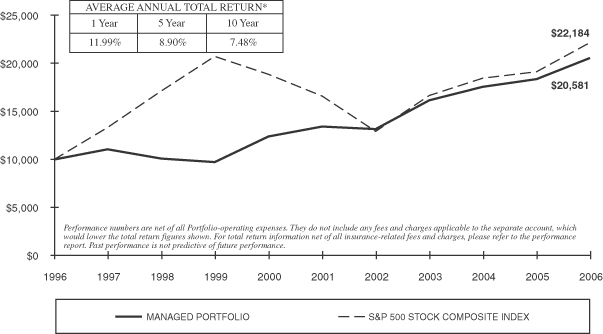
For the twelve-month period, the Managed Portfolio generated a return of 11.99%, compared to a total return of 15.79% for the S&P 500. This Portfolio is a tactical asset allocation portfolio, with an investment emphasis on securities producing income and the potential for capital appreciation. For this reason, neither its performance nor its constitution will likely mirror any one particular equity index over long periods of time.
The Portfolio’s equity holdings significantly outperformed the S&P 500, in particular due to better performing health care and utilities positions. Its consumer staples and industrials weightings additionally performed well relative to the Index, with individual stock selection accounting for much of the outperformance within these sectors. On average, the Portfolio had just over 57% of its assets in equities during the year, with the balance in cash and high-quality fixed-income securities. Returns in the fixed income and cash positions were more modest relative to the S&P 500, leading to the Portfolio’s relative underperformance overall.
Within the Portfolio’s equity allocation, we continue to focus on high-quality large-cap companies that generate dividend income. Fixed-income yields have gotten more interesting of late with the 10-year Treasury moving closer to 5%, but would likely have to push well-above 5% before we might consider adding to the Portfolio’s fixed-income position.
| * | Returns shown do not reflect the deduction of taxes that a shareholder may pay on Portfolio distributions or the redemption of Portfolio shares. |
8
PERFORMANCE GRAPH WORKSHEET
Comparison of Change in Value of $10,000 Investment in
the Blue Chip Portfolio and S&P 500
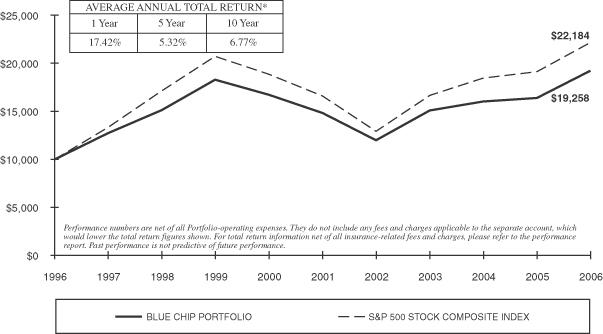
The Blue Chip Portfolio is designed to represent the large-capitalization sector of the domestic equity market, and remains substantially invested in approximately 50 such common stock issues. Given the Portfolio’s constitution, its performance will track with that of the broad-market S&P 500, but will be most similar to that of the large-capitalization segment within the S&P 500.
The Portfolio returned 17.42% for the twelve-month period, compared to 15.79% for the S&P 500. In recent years, the S&P 500’s smaller constituents have contributed the bulk of the Index’s total return. For the past year, though, the mega- and large-cap names contributed more of the Index’s gains and returns were more evenly distributed across the Index’s market capitalization spectrum.
Again, the Portfolio is most concentrated in the S&P 500’s largest companies; roughly 90% of its holdings fall in the Index’s top half by market capitalization. The Portfolio therefore outperformed the S&P 500 over the past twelve months because its holdings outperformed the mega-/large-cap segment of the Index.
| * | Returns shown do not reflect the deduction of taxes that a shareholder may pay on Portfolio distributions or the redemption of Portfolio shares. |
9
EQUITRUST VARIABLE INSURANCE SERIES FUND
December 31, 2006
Value Growth Portfolio
Portfolio Holdings by Industry Sector
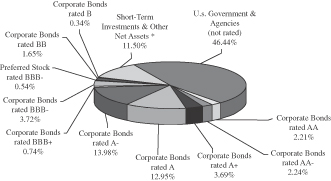
High Grade Bond Portfolio
Portfolio Holdings by Credit Quality and Type of Security**
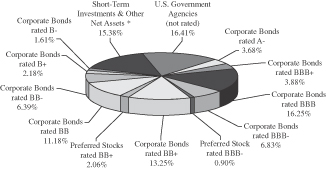
Strategic Yield Portfolio
Portfolio Holdings by Credit Quality and Type of Security**
| * | This category may include short-term investments in commercial paper, money market mutual funds and U.S. government agencies, along with cash, receivables, prepaid expenses and other assets, less liabilities. |
| ** | Credit quality as reported by Standard & Poor’s. |
10
EQUITRUST VARIABLE INSURANCE SERIES FUND
December 31, 2006
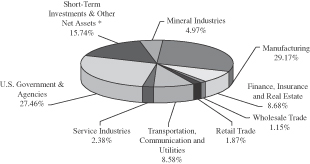
Managed Portfolio
Portfolio Holdings by Industry Sector
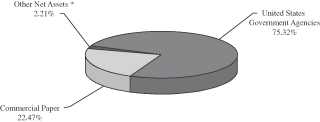
Money Market Portfolio
Portfolio Holdings by Asset Type
Blue Chip Portfolio
Portfolio Holdings by Industry Sector
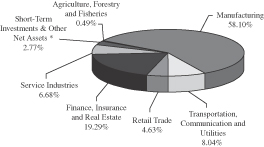
| * | This category may include short-term investments in commercial paper, money market mutual funds and U.S. government agencies, along with cash, receivables, prepaid expenses and other assets, less liabilities. |
11
Expense Example:
As a shareholder of the Fund, you incur ongoing costs, including management fees and other Fund expenses. This Example is intended to help you understand your ongoing costs (in dollars) of investing in a given Portfolio of the Fund and to compare these costs with the ongoing costs of investing in other mutual funds. The Example is based on an investment of $1,000 invested on July 1, 2006 and held until December 31, 2006.
Actual Expenses –
The first line for each Portfolio in the table below provides information about actual account values and actual expenses for that Portfolio. You may use the information in this line, together with the amount you invested, to estimate the expenses that you paid over the period. Simply divide your account value by $1,000 (for example, an $8,600 account value divided by $1,000 = 8.6), then multiply the result by the number in the first line under the heading entitled “Expenses Paid During Period” for the same Portfolio to estimate the expenses you paid on your account during this period.
Hypothetical Example for Comparison Purposes –
The second line for each Portfolio in the table below provides information about hypothetical account values and hypothetical expenses based on the actual expense ratio of that Portfolio and an assumed rate of return of 5% per year before expenses, which is not the actual return of the Portfolio. The hypothetical account values and expenses may not be used to estimate the actual ending account balance or expenses you paid for the period. You may use this information to compare the ongoing costs of investing in a given Portfolio of the Fund with other funds. To do so, compare this 5% hypothetical example with the 5% hypothetical examples that appear in the shareholder reports of the other funds.
| Beginning Account Value 7/1/2006 | Ending Account Value 12/31/2006 | Expenses Paid During Period* 7/1/2006 - 12/31/2006 | Annualized Expense Ratio | |||||||||
Value Growth | 0.57 | % | ||||||||||
Actual | $ | 1,000 | $ | 1,099.90 | $ | 3.01 | ||||||
Hypothetical** | $ | 1,000 | $ | 1,022.13 | $ | 2.90 | ||||||
High Grade Bond | 0.44 | % | ||||||||||
Actual | $ | 1,000 | $ | 1,050.90 | $ | 2.25 | ||||||
Hypothetical** | $ | 1,000 | $ | 1,022.81 | $ | 2.22 | ||||||
Strategic Yield | 0.59 | % | ||||||||||
Actual | $ | 1,000 | $ | 1,058.70 | $ | 3.02 | ||||||
Hypothetical** | $ | 1,000 | $ | 1,022.07 | $ | 2.96 | ||||||
Managed | 0.55 | % | ||||||||||
Actual | $ | 1,000 | $ | 1,083.70 | $ | 2.88 | ||||||
Hypothetical** | $ | 1,000 | $ | 1,022.23 | $ | 2.80 | ||||||
Money Market | 0.53 | % | ||||||||||
Actual | $ | 1,000 | $ | 1,023.50 | $ | 2.70 | ||||||
Hypothetical** | $ | 1,000 | $ | 1,022.33 | $ | 2.70 | ||||||
Blue Chip | 0.31 | % | ||||||||||
Actual | $ | 1,000 | $ | 1,136.90 | $ | 1.64 | ||||||
Hypothetical** | $ | 1,000 | $ | 1,023.47 | $ | 1.55 | ||||||
| * | Expenses are equal to the Annualized Expense Ratio as shown in the table for each Portfolio, multiplied by the average account value over the period, multiplied by 182 days divided by 364 to reflect the one-half year period. |
| ** | Hypothetical examples are based on a 5% return before expenses. |
12
EQUITRUST VARIABLE INSURANCE SERIES FUND
STATEMENTS OF ASSETS AND LIABILITIES
December 31, 2006
| Value Growth Portfolio | High Grade Bond | Strategic Yield Portfolio | Managed Portfolio | Money Market Portfolio | Blue Chip Portfolio | |||||||||||||||
ASSETS | ||||||||||||||||||||
Investments in securities, at value (cost — $57,973,000; $38,920,332; $40,222,049; $82,561,490; $8,367,704; and $64,142,034, respectively) | $ | 65,665,902 | $ | 39,032,889 | $ | 40,948,019 | $ | 93,618,156 | $ | 8,367,704 | $ | 90,211,237 | ||||||||
Cash | — | — | — | — | 26,263 | — | ||||||||||||||
Receivables: | ||||||||||||||||||||
Accrued dividends and interest | 84,098 | 362,670 | 573,059 | 223,426 | 4,872 | 100,756 | ||||||||||||||
Fund shares sold | 27,809 | 22,534 | 14,500 | 47,689 | 177,407 | 44,936 | ||||||||||||||
Prepaid expense and other assets | 216 | 115 | 121 | 298 | 32 | 318 | ||||||||||||||
Total Assets | 65,778,025 | 39,418,208 | 41,535,699 | 93,889,569 | 8,576,278 | 90,357,247 | ||||||||||||||
LIABILITIES | ||||||||||||||||||||
Payables: | ||||||||||||||||||||
Fund shares redeemed | 53,726 | 36,662 | 44,192 | 80,692 | 6,448 | 81,175 | ||||||||||||||
Dividends | — | — | — | — | 4,679 | — | ||||||||||||||
Accrued expenses | 12,063 | 10,325 | 10,468 | 12,999 | 8,169 | 14,965 | ||||||||||||||
Total Liabilities | 65,789 | 46,987 | 54,660 | 93,691 | 19,296 | 96,140 | ||||||||||||||
NET ASSETS | $ | 65,712,236 | $ | 39,371,221 | $ | 41,481,039 | $ | 93,795,878 | $ | 8,556,982 | $ | 90,261,107 | ||||||||
ANALYSIS OF NET ASSETS | ||||||||||||||||||||
Paid-in Capital | $ | 54,362,777 | $ | 39,247,336 | $ | 42,822,752 | $ | 75,720,147 | $ | 8,556,982 | $ | 68,462,806 | ||||||||
Accumulated undistibuted net investment income | 1,163,459 | — | — | 2,642,530 | — | 1,750,924 | ||||||||||||||
Accumulated undistibuted net realized gain (loss) from investment transactions | 2,493,098 | 11,328 | (2,067,683 | ) | 4,376,535 | — | (6,021,826 | ) | ||||||||||||
Net unrealized appreciation of investments | 7,692,902 | 112,557 | 725,970 | 11,056,666 | — | 26,069,203 | ||||||||||||||
NET ASSETS | $ | 65,712,236 | $ | 39,371,221 | $ | 41,481,039 | $ | 93,795,878 | $ | 8,556,982 | $ | 90,261,107 | ||||||||
Shares issued and outstanding as of December 31, 2006 | 4,354,623 | 3,890,412 | 4,514,263 | 5,747,441 | 8,556,982 | 2,222,746 | ||||||||||||||
NET ASSET VALUE PER SHARE | $ | 15.09 | $ | 10.12 | $ | 9.19 | $ | 16.32 | $ | 1.00 | $ | 40.61 | ||||||||
See accompanying notes.
13
EQUITRUST VARIABLE INSURANCE SERIES FUND
STATEMENTS OF OPERATIONS
Year Ended December 31, 2006
| Value Growth Portfolio | High Grade Bond Portfolio | Strategic Yield Portfolio | Managed Portfolio | Money Market Portfolio | Blue Chip Portfolio | ||||||||||||||||
INVESTMENT INCOME | |||||||||||||||||||||
Dividends | $ | 979,058 | $ | — | $ | 15,757 | $ | 1,179,049 | $ | — | $ | 1,878,215 | |||||||||
Interest | 543,990 | 2,033,816 | 2,556,530 | 1,956,946 | 372,805 | 131,163 | |||||||||||||||
Less foreign tax withholding | (2,690 | ) | — | — | (3,531 | ) | — | — | |||||||||||||
Total Investment Income | 1,520,358 | 2,033,816 | 2,572,287 | 3,132,464 | 372,805 | 2,009,378 | |||||||||||||||
EXPENSES | |||||||||||||||||||||
Paid to EquiTrust Investment Management Services, Inc.: | |||||||||||||||||||||
Investment advisory and management fees | 279,147 | 110,532 | 174,532 | 398,487 | 19,027 | 169,154 | |||||||||||||||
Accounting fees | 30,000 | 18,422 | 19,393 | 30,000 | 3,805 | 30,000 | |||||||||||||||
Custodial fees | 9,051 | 7,253 | 6,419 | 10,408 | 7,400 | 7,730 | |||||||||||||||
Professional fees | 23,123 | 16,176 | 16,957 | 28,935 | 8,824 | 31,361 | |||||||||||||||
Reports to shareholders | 5,681 | 3,298 | 3,461 | 8,035 | 718 | 6,662 | |||||||||||||||
Trustees’ fees and expenses | 5,484 | 3,261 | 3,426 | 7,847 | 698 | 7,487 | |||||||||||||||
Insurance and bonds | 1,550 | 885 | 946 | 2,144 | 155 | 2,128 | |||||||||||||||
Miscellaneous | 2,863 | 1,698 | 1,790 | 4,078 | 332 | 3,932 | |||||||||||||||
Total Expenses | 356,899 | 161,525 | 226,924 | 489,934 | 40,959 | 258,454 | |||||||||||||||
Net Investment Income | 1,163,459 | 1,872,291 | 2,345,363 | 2,642,530 | 331,846 | 1,750,924 | |||||||||||||||
NET REALIZED AND UNREALIZED GAIN (LOSS) ON INVESTMENTS | |||||||||||||||||||||
Net realized gain from investment transactions | 3,278,691 | 11,739 | 192,090 | 4,225,459 | — | 1,052,194 | |||||||||||||||
Change in unrealized appreciation (depreciation) of investments | 2,698,622 | (117,348 | ) | 59,718 | 3,188,122 | — | 10,911,429 | ||||||||||||||
Net Gain (Loss) on Investments | 5,977,313 | (105,609 | ) | 251,808 | 7,413,581 | — | 11,963,623 | ||||||||||||||
Net Increase in Net Assets Resulting from Operations | $ | 7,140,772 | $ | 1,766,682 | $ | 2,597,171 | $ | 10,056,111 | $ | 331,846 | $ | 13,714,547 | |||||||||
See accompanying notes.
14
EQUITRUST VARIABLE INSURANCE SERIES FUND
STATEMENTS OF CHANGES IN NET ASSETS
| Value Growth Portfolio | High Grade Bond Portfolio | Strategic Yield Portfolio | ||||||||||||||||||||||
| Year Ended December 31, 2006 | Year Ended December 31, 2005 | Year Ended December 31, 2006 | Year Ended December 31, 2005 | Year Ended December 31, 2006 | Year Ended December 31, 2005 | |||||||||||||||||||
OPERATIONS | ||||||||||||||||||||||||
Net investment income | $ | 1,163,459 | $ | 836,213 | $ | 1,872,291 | $ | 1,485,114 | $ | 2,345,363 | $ | 1,920,635 | ||||||||||||
Net realized gain (loss) from investment transactions | 3,278,691 | 5,643,255 | 11,739 | (411 | ) | 192,090 | 2,105 | |||||||||||||||||
Change in unrealized appreciation (depreciation) of investments | 2,698,622 | (2,829,929 | ) | (117,348 | ) | (636,795 | ) | 59,718 | (850,982 | ) | ||||||||||||||
Net Increase in Net Assets Resulting from Operations | 7,140,772 | 3,649,539 | 1,766,682 | 847,908 | 2,597,171 | 1,071,758 | ||||||||||||||||||
DIVIDENDS AND DISTRIBUTIONS TO | ||||||||||||||||||||||||
Net investment income | (836,213 | ) | (665,116 | ) | (1,872,291 | ) | (1,485,114 | ) | (2,345,363 | ) | (1,920,635 | ) | ||||||||||||
Net realized gain from investment transactions | — | — | — | (43,870 | ) | — | — | |||||||||||||||||
Total Dividends and Distributions | (836,213 | ) | (665,116 | ) | (1,872,291 | ) | (1,528,984 | ) | (2,345,363 | ) | (1,920,635 | ) | ||||||||||||
CAPITAL SHARE TRANSACTIONS | (815,694 | ) | (1,114,667 | ) | 4,530,988 | 5,647,061 | 4,161,889 | 7,278,727 | ||||||||||||||||
Total Increase (Decrease) in Net Assets | 5,488,865 | 1,869,756 | 4,425,379 | 4,965,985 | 4,413,697 | 6,429,850 | ||||||||||||||||||
NET ASSETS | ||||||||||||||||||||||||
Beginning of year | 60,223,371 | 58,353,615 | 34,945,842 | 29,979,857 | 37,067,342 | 30,637,492 | ||||||||||||||||||
End of year (including accumulated undistributed net investment income as set forth below) | $ | 65,712,236 | $ | 60,223,371 | $ | 39,371,221 | $ | 34,945,842 | $ | 41,481,039 | $ | 37,067,342 | ||||||||||||
Accumulated Undistributed Net Investment Income | $ | 1,163,459 | $ | 836,213 | $ | — | $ | — | $ | — | $ | — | ||||||||||||
See accompanying notes.
15
EQUITRUST VARIABLE INSURANCE SERIES FUND
STATEMENTS OF CHANGES IN NET ASSETS (continued)
| Managed Portfolio | Money Market Portfolio | Blue Chip Portfolio | ||||||||||||||||||||||
| Year Ended December 31, 2006 | Year Ended December 31, 2005 | Year Ended December 31, 2006 | Year Ended December 31, 2005 | Year Ended December 31, 2006 | Year Ended December 31, 2005 | |||||||||||||||||||
OPERATIONS | ||||||||||||||||||||||||
Net investment income | $ | 2,642,530 | $ | 1,836,551 | $ | 331,846 | $ | 153,504 | $ | 1,750,924 | $ | 1,635,261 | ||||||||||||
Net realized gain (loss) from investment transactions | 4,225,459 | 4,991,158 | — | — | 1,052,194 | 393 | ||||||||||||||||||
Change in unrealized appreciation (depreciation) of investments | 3,188,122 | (3,285,381 | ) | — | — | 10,911,429 | 228,495 | |||||||||||||||||
Net Increase in Net Assets Resulting from Operations | 10,056,111 | 3,542,328 | 331,846 | 153,504 | 13,714,547 | 1,864,149 | ||||||||||||||||||
DIVIDENDS AND DISTRIBUTIONS TO | ||||||||||||||||||||||||
Net investment income | (1,836,551 | ) | (1,297,777 | ) | (331,846 | ) | (153,504 | ) | (1,635,261 | ) | (1,621,030 | ) | ||||||||||||
Net realized gain from investment transactions | (4,783,738 | ) | (1,299,691 | ) | — | — | — | — | ||||||||||||||||
Total Dividends and Distributions | (6,620,289 | ) | (2,597,468 | ) | (331,846 | ) | (153,504 | ) | (1,635,261 | ) | (1,621,030 | ) | ||||||||||||
CAPITAL SHARE TRANSACTIONS | 6,991,954 | 7,547,535 | 2,269,352 | (304,435 | ) | (4,319,584 | ) | (2,701,841 | ) | |||||||||||||||
Total Increase (Decrease) in Net Assets | 10,427,776 | 8,492,395 | 2,269,352 | (304,435 | ) | 7,759,702 | (2,458,722 | ) | ||||||||||||||||
NET ASSETS | ||||||||||||||||||||||||
Beginning of year | 83,368,102 | 74,875,707 | 6,287,630 | 6,592,065 | 82,501,405 | 84,960,127 | ||||||||||||||||||
End of year (including accumulated undistributed net investment income as set forth below) | $ | 93,795,878 | $ | 83,368,102 | $ | 8,556,982 | $ | 6,287,630 | $ | 90,261,107 | $ | 82,501,405 | ||||||||||||
Accumulated Undistributed Net Investment Income | $ | 2,642,530 | $ | 1,836,551 | $ | — | $ | — | $ | 1,750,924 | $ | 1,635,261 | ||||||||||||
See accompanying notes.
16
EQUITRUST VARIABLE INSURANCE SERIES FUND
SCHEDULE OF INVESTMENTS
VALUE GROWTH PORTFOLIO
December 31, 2006
| Shares Held | Value | ||||
COMMON STOCKS (85.07%) | |||||
APPAREL AND OTHER TEXTILE PRODUCTS (0.38%) | |||||
Jones Apparel Group, Inc. | 7,500 | $ | 250,725 | ||
BUSINESS SERVICES (5.03%) | |||||
Affiliated Computer Services, Inc.-Class A (1) | 11,400 | 556,776 | |||
Compuware Corp. (1) | 16,050 | 133,697 | |||
eBay Inc. (1) | 5,535 | 166,438 | |||
Electronic Data Systems Corp. | 5,745 | 158,275 | |||
First Data Corp. | 3,520 | 89,830 | |||
Microsoft Corp. | 37,205 | 1,110,941 | |||
Oracle Corp. (1) | 25,000 | 428,500 | |||
Symantec Corp. (1) | 28,002 | 583,842 | |||
Western Union Co. (The) | 3,520 | 78,918 | |||
| 3,307,217 | |||||
CHEMICALS AND ALLIED PRODUCTS (10.09%) | |||||
Abbott Laboratories | 8,000 | 389,680 | |||
Amgen, Inc. (1) | 5,200 | 355,212 | |||
Bristol-Myers Squibb Co. | 7,125 | 187,530 | |||
Colgate-Palmolive Co. | 3,255 | 212,356 | |||
Dow Chemical Co. | 5,330 | 212,880 | |||
E.I. du Pont de Nemours & Co. | 14,655 | 713,845 | |||
GlaxoSmithKline PLC | 5,500 | 290,180 | |||
Johnson & Johnson | 16,020 | 1,057,640 | |||
KV Pharmaceutical Co.-Class A (1) | 12,700 | 302,006 | |||
Mylan Laboratories, Inc. | 10,205 | 203,692 | |||
Olin Corp. | 6,400 | 105,728 | |||
Pfizer, Inc. | 54,021 | 1,399,144 | |||
Schering-Plough Corp. | 14,980 | 354,127 | |||
Teva Pharmaceutical Industries, Ltd. | 17,691 | 549,836 | |||
Wyeth | 5,835 | 297,118 | |||
| 6,630,974 | |||||
COMMUNICATIONS (2.56%) | |||||
Alltel Corp. | 5,700 | 344,736 | |||
Comcast Corp.-Class A (1) | 12,510 | 529,548 | |||
Sprint Nextel Corp. | 25,603 | 483,641 | |||
Verizon Communications, Inc. | 8,800 | 327,712 | |||
| 1,685,637 | |||||
DEPOSITORY INSTITUTIONS (7.66%) | |||||
Bank of America Corp. | 12,204 | 651,572 | |||
Bank of New York Co., Inc. | 19,271 | 758,699 | |||
Citigroup, Inc. | 23,183 | 1,291,293 | |||
National City Corp. | 6,830 | 249,705 | |||
New York Community Bancorp., Inc. | 23,156 | 372,812 | |||
Regions Financial Corp. | 9,273 | 346,810 | |||
U. S. Bancorp. | 15,710 | 568,545 | |||
Wachovia Corp. | 9,950 | 566,653 | |||
Wells Fargo Master Trust | 6,420 | 228,295 | |||
| 5,034,384 | |||||
| Shares Held | Value | ||||
ELECTRIC, GAS AND SANITARY SERVICES (3.84%) | |||||
Atmos Energy Corp. | 11,267 | $ | 359,530 | ||
CMS Energy Corp. (1) | 28,300 | 472,610 | |||
Helmerich & Payne | 14,600 | 357,262 | |||
Pepco Holdings, Inc. | 16,200 | 421,362 | |||
Pinnacle West Capital Corp. | 9,200 | 465,888 | |||
Xcel Energy, Inc. | 19,405 | 447,479 | |||
| 2,524,131 | |||||
ELECTRONIC AND OTHER ELECTRICAL | |||||
Adaptec, Inc. (1) | 43,100 | 200,846 | |||
ADC Telecommunications, Inc. (1) | 18,205 | 264,519 | |||
Cisco Systems, Inc. (1) | 30,600 | 836,298 | |||
ECI Telecom, Ltd. (1) | 10,000 | 86,600 | |||
Emerson Electric Co. | 4,600 | 202,722 | |||
General Electric Co. | 56,110 | 2,087,853 | |||
Helen of Troy, Ltd. (1) | 8,966 | 217,515 | |||
Intel Corp. | 17,500 | 354,375 | |||
JDS Uniphase Corp. (1) | 2,050 | 34,153 | |||
Qualcomm, Inc. | 4,200 | 158,718 | |||
Verigy, Ltd. (1) | 857 | 15,212 | |||
| 4,458,811 | |||||
FABRICATED METAL PRODUCTS (0.79%) | |||||
Illinois Tool Works | 11,255 | 519,868 | |||
FOOD AND KINDRED PRODUCTS (4.37%) | |||||
Anheuser-Busch Cos., Inc. | 9,930 | 488,556 | |||
Coca-Cola Co. (The) | 16,170 | 780,203 | |||
Coca-Cola Enterprises, Inc. | 17,485 | 357,044 | |||
ConAgra Foods, Inc. | 12,970 | 350,190 | |||
General Mills, Inc. | 4,110 | 236,736 | |||
PepsiCo, Inc. | 10,510 | 657,401 | |||
| 2,870,130 | |||||
FOOD STORES (0.69%) | |||||
Kroger Co. | 19,526 | 450,465 | |||
GENERAL MERCHANDISE STORES (1.89%) | |||||
Target Corp. | 13,790 | 786,720 | |||
Wal-Mart Stores, Inc. | 9,835 | 454,180 | |||
| 1,240,900 | |||||
HEALTH SERVICES (1.33%) | |||||
Health Management Associates, Inc. | 30,000 | 633,300 | |||
Lifepoint Hospitals, Inc. (1) | 7,163 | 241,393 | |||
| 874,693 | |||||
INDUSTRIAL MACHINERY AND | |||||
3M Co. | 11,130 | 867,361 | |||
Deere & Co. | 3,990 | 379,329 | |||
EMC Corp. (1) | 53,600 | 707,520 | |||
Hewlett-Packard Co. | 6,000 | 247,140 | |||
17
EQUITRUST VARIABLE INSURANCE SERIES FUND
SCHEDULE OF INVESTMENTS
VALUE GROWTH PORTFOLIO (continued)
| Shares Held | Value | ||||
COMMON STOCKS (continued) | |||||
INDUSTRIAL MACHINERY AND | |||||
Ingersoll-Rand Co., Ltd.-Class A | 25,600 | $ | 1,001,728 | ||
Solectron Corp. (1) | 22,500 | 72,450 | |||
| 3,275,528 | |||||
INSTRUMENTS AND RELATED | |||||
Agilent Technologies, Inc. (1) | 7,000 | 243,950 | |||
Becton Dickinson & Co. | 8,826 | 619,144 | |||
Biomet, Inc. | 4,220 | 174,160 | |||
Boston Scientific Corp. (1) | 4,770 | 81,949 | |||
Medtronic, Inc. | 15,340 | 820,843 | |||
Perkinelmer, Inc. | 11,900 | 264,537 | |||
Stryker Corp. | 7,030 | 387,423 | |||
Thermo Fisher Scientific Inc. (1) | 16,352 | 740,582 | |||
Zimmer Holdings, Inc. (1) | 4,480 | 351,142 | |||
| 3,683,730 | |||||
INSURANCE CARRIERS (3.57%) | |||||
Allstate Corp. | 4,910 | 319,690 | |||
American International Group, Inc. | 9,740 | 697,969 | |||
MBIA, Inc. | 4,690 | 342,651 | |||
MetLife, Inc. | 7,595 | 448,181 | |||
Safeco Corp. | 3,223 | 201,599 | |||
WellPoint, Inc. (1) | 4,222 | 332,229 | |||
| 2,342,319 | |||||
METAL MINING (1.99%) | |||||
Barrick Gold Corp. | 24,946 | 765,842 | |||
Newmont Mining Corp. | 12,000 | 541,800 | |||
| 1,307,642 | |||||
MOTION PICTURES (1.53%) | |||||
News Corp.-Class A | 17,040 | 366,019 | |||
Time Warner, Inc. | 29,390 | 640,114 | |||
| 1,006,133 | |||||
NONDEPOSITORY INSTITUTIONS (1.14%) | |||||
Federal Home Loan Mortgage Corp. | 4,900 | 332,710 | |||
SLM Corp. | 8,555 | 417,227 | |||
| 749,937 | |||||
OIL AND GAS EXTRACTION (3.10%) | |||||
Apache Corp. | 5,200 | 345,852 | |||
BJ Services Co. | 11,500 | 337,180 | |||
Noble Corp. | 4,300 | 327,445 | |||
Occidental Petroleum Co. | 9,500 | 463,885 | |||
Rowan Cos., Inc. | 16,900 | 561,080 | |||
| 2,035,442 | |||||
PAPER AND ALLIED PRODUCTS (1.47%) | |||||
Abitibi Consolidated, Inc. | 92,600 | 237,056 | |||
Kimberly-Clark Corp. | 10,720 | 728,424 | |||
| 965,480 | |||||
| Shares Held | Value | ||||
PERSONAL SERVICES (0.24%) | |||||
Cintas Corp. | 3,910 | $ | 155,266 | ||
PETROLEUM AND COAL PRODUCTS (4.97%) | |||||
BP PLC | 6,000 | 402,600 | |||
Chevron Corp. | 14,100 | 1,036,773 | |||
ConocoPhillips | 25,357 | 1,824,436 | |||
| 3,263,809 | |||||
PRIMARY METAL INDUSTRIES (0.93%) | |||||
Northwest Pipe Co. (1) | 18,215 | 612,388 | |||
PRINTING AND PUBLISHING (1.11%) | |||||
Belo Corp.-Series A | 14,835 | 272,667 | |||
R.R. Donnelley & Sons Co. | 8,110 | 288,229 | |||
Tribune Co. | 5,450 | 167,751 | |||
| 728,647 | |||||
RAILROAD TRANSPORTATION (0.30%) | |||||
Union Pacific Corp. | 2,155 | 198,303 | |||
RETAIL-DRUG AND PROPRIETARY STORES (0.39%) | |||||
Walgreen Co. | 5,600 | 256,984 | |||
RETAIL-LUMBER & OTHER BUILDING MATERIALS DEALERS (0.74%) | |||||
Lowe’s Companies | 15,690 | 488,744 | |||
SECURITY AND COMMODITY | |||||
Adams Express Co. | 59,500 | 825,265 | |||
Ameriprise Financial, Inc. | 3,380 | 184,210 | |||
| 1,009,475 | |||||
TELEPHONE COMMUNICATIONS (0.13%) | |||||
Windstream Corp. | 5,893 | 83,799 | |||
TOBACCO PRODUCTS (0.56%) | |||||
Altria Group, Inc. | 4,260 | 365,593 | |||
TRANSPORTATION EQUIPMENT (2.67%) | |||||
Federal Signal Corp. | 13,300 | 213,332 | |||
Honeywell International, Inc. | 23,500 | 1,063,140 | |||
ITT Industries, Inc. | 8,370 | 475,583 | |||
| 1,752,055 | |||||
TRUCKING AND WAREHOUSING (0.90%) | |||||
United Parcel Service, Inc.-Class B | 2,275 | 170,580 | |||
YRCW Worldwide, Inc. (1) | 11,100 | 418,803 | |||
| 589,383 | |||||
WHOLESALE TRADE — NONDURABLE GOODS (1.17%) | |||||
Dean Foods Co. (1) | 7,701 | 325,598 | |||
SYSCO Corp. | 12,130 | 445,899 | |||
| 771,497 | |||||
18
EQUITRUST VARIABLE INSURANCE SERIES FUND
SCHEDULE OF INVESTMENTS
VALUE GROWTH PORTFOLIO (continued)
| Shares Held | Value | |||||
COMMON STOCKS (continued) | ||||||
MISCELLANEOUS EQUITIES (0.61%) | ||||||
H & Q Life Sciences Investors | 30,117 | $ | 405,978 | |||
Total Common Stocks | 55,896,067 | |||||
SHORT-TERM INVESTMENTS (14.86%) | ||||||
MONEY MARKET MUTUAL FUND (0.21%) | ||||||
JP Morgan U.S. Treasury Plus Money Market Fund | 139,983 | 139,983 | ||||
| Principal Amount | ||||||
COMMERCIAL PAPER (5.25%) | ||||||
NONDEPOSITORY INSTITUTIONS (3.12%) | ||||||
American General Finance Corp., | $ | 800,000 | 800,000 | |||
General Electric Capital Corp., | 550,000 | 550,000 | ||||
HSBC Finance Corp. | 700,000 | 700,000 | ||||
| 2,050,000 | ||||||
INSURANCE CARRIERS (0.61%) | ||||||
Prudential Funding, LLC, 5.25%, | 400,000 | 400,000 | ||||
DEPOSITORY INSTITUTIONS (1.52%) | ||||||
Citigroup, 5.29%, due 01/10/07 | 1,000,000 | 1,000,000 | ||||
Total Commercial Paper | 3,450,000 | |||||
UNITED STATES GOVERNMENT | ||||||
Federal Home Loan Bank, | 1,200,000 | 1,196,574 | ||||
Federal Home Loan Bank, | 700,000 | 697,500 | ||||
Federal Home Loan Mortgage Corp., | 1,100,000 | 1,099,371 | ||||
Federal National Mortgage Assoc., | 1,000,000 | 996,706 | ||||
| Principal Amount | Value | |||||
Federal National Mortgage Assoc., | $ | 1,100,000 | $ | 1,095,031 | ||
Federal National Mortgage Assoc., | 1,100,000 | 1,094,670 | ||||
Total United States | 6,179,852 | |||||
Total Short-Term Investments | 9,769,835 | |||||
Total Investments (99.93%) | 65,665,902 | |||||
OTHER ASSETS LESS LIABILITIES (0.07%) | ||||||
Cash, receivables, prepaid expense and other assets, less liabilities | 46,334 | |||||
Total Net Assets (100.00%) | $ | 65,712,236 | ||||
| (1) | Non-income producing securities. |
See accompanying notes.
19
EQUITRUST VARIABLE INSURANCE SERIES FUND
SCHEDULE OF INVESTMENTS
HIGH GRADE BOND PORTFOLIO
December 31, 2006
| Shares Held | Value | |||||
PREFERRED STOCKS (0.54%) | ||||||
HOLDING AND OTHER INVESTMENT OFFICES | ||||||
New Plan Excel Realty | 4,000 | $ | 214,000 | |||
Principal Amount | ||||||
CORPORATE BONDS (41.52%) | ||||||
DEPOSITORY INSTITUTIONS (12.49%) | ||||||
Comerica Bank, 5.20% due 08/22/17 | $ | 1,000,000 | 956,410 | |||
Fifth Third Bancorp, 5.45%, due 01/15/17 | 1,000,000 | 987,590 | ||||
Huntington National Bank, 5.50%, due 02/15/16 | 700,000 | 694,428 | ||||
PNC Preferred FD, 144A, 6.517%, due 12/31/49 (1) | 1,500,000 | 1,524,645 | ||||
Washington Mutual Bank, 5.65%, due 08/15/14 | 750,000 | 753,015 | ||||
| 4,916,088 | ||||||
ELECTRIC, GAS AND SANITARY | ||||||
Maritime & NE Pipeline, 144A, 7.70%, due 11/30/19 (1) | 700,000 | 784,973 | ||||
Oglethorpe Power Corp., 6.974%, due 06/30/11 | 866,000 | 891,408 | ||||
PacifiCorp, 6.90%, due 11/15/11 | 750,000 | 799,522 | ||||
Westar Energy, Inc., 5.15%, due 01/01/17 | 1,000,000 | 955,490 | ||||
| 3,431,393 | ||||||
FOOD STORES (1.65%) | ||||||
Ahold Finance USA, Inc., 8.25%, due 07/15/10 | 600,000 | 648,750 | ||||
FOOD AND KINDRED PRODUCTS (2.48%) | ||||||
Diageo Capital PLC, 4.375%, due 05/03/10 | 1,000,000 | 975,080 | ||||
FURNITURE AND FIXTURES (1.29%) | ||||||
Steelcase Inc., 6.50%, due 08/15/11 | 500,000 | 509,505 | ||||
HOLDING AND OTHER INVESTMENT | ||||||
Security Capital Pacific, 7.20%, due 03/01/13 | 275,000 | 291,967 | ||||
Washington REIT, 5.25%, due 01/15/14 | 700,000 | 681,513 | ||||
Washington REIT, 6.898%, due 02/25/18 | 350,000 | 355,537 | ||||
| 1,329,017 | ||||||
Principal Amount | Value | |||||
INSURANCE CARRIERS (2.21%) | ||||||
SunAmerica, 8.125%, due 04/28/23 | $ | 700,000 | $ | 872,564 | ||
SECURITY AND COMMODITY BROKERS (5.40%) | ||||||
Goldman Sachs Group, Inc., 5.125%, due 01/15/15 | 900,000 | 883,341 | ||||
Morgan Stanley-Series MTNC, 5.125%, due 02/11/19 | 1,300,000 | 1,241,747 | ||||
| 2,125,088 | ||||||
TOBACCO PRODUCTS (1.99%) | ||||||
UST, Inc., 7.25%, due 06/01/09 | 750,000 | 782,565 | ||||
TRANSPORTATION — BY AIR (1.59%) | ||||||
Continental Airlines, Inc., 6.545%, due 08/02/20 | 399,863 | 413,798 | ||||
Federal Express, 7.50%, due 01/15/18 | 193,493 | 210,792 | ||||
| 624,590 | ||||||
TRANSPORTATION EQUIPMENT (0.34%) | ||||||
Ford Motor Co., 9.215%, due 09/15/21 | 150,000 | 133,125 | ||||
Total Corporate Bonds | 16,347,765 | |||||
MORTGAGE-BACKED SECURITIES (30.69%) | ||||||
FEDERAL HOME LOAN MORTGAGE CORPORATION (FHLMC) (6.69%) | ||||||
Pool # 3023, 5.50%, due 08/01/35 | 1,691,771 | 1,652,454 | ||||
Pool # 3051, 5.50%, due 10/01/25 | 1,000,000 | 980,010 | ||||
| 2,632,464 | ||||||
FEDERAL NATIONAL MORTGAGE ASSOCIATION (FNMA) (2.33%) | ||||||
Pool # 50276, 9.50%, due 02/01/20 | 931 | 1,022 | ||||
Pool # 256103, 5.50%, due 02/01/26 | 919,880 | 914,553 | ||||
| 915,575 | ||||||
GOVERNMENT NATIONAL MORTGAGE ASSOCIATION (GNMA) (21.67%) | ||||||
Pool # 1512, 7.50%, due 12/01/23 | 18,993 | 19,752 | ||||
Pool # 2631, 7.00%, due 08/01/28 | 23,802 | 24,508 | ||||
Pool # 2658, 6.50%, due 10/01/28 | 44,615 | 45,755 | ||||
Pool # 2701, 6.50%, due 01/01/29 | 54,285 | 55,646 | ||||
Pool # 2796, 7.00%, due 08/01/29 | 44,000 | 45,316 | ||||
Pool # 3039, 6.50%, due 02/01/31 | 17,953 | 18,389 | ||||
Pool # 3040, 7.00%, due 02/01/31 | 29,278 | 30,147 | ||||
Pool # 3188, 6.50%, due 02/01/32 | 105,449 | 107,976 | ||||
Pool # 3239, 6.50%, due 05/01/32 | 96,832 | 99,152 | ||||
Pool # 3261, 6.50%, due 07/01/32 | 190,714 | 195,283 | ||||
Pool # 3320, 5.50%, due 12/01/32 | 763,984 | 759,924 | ||||
Pool # 3333, 5.50%, due 01/01/33 | 629,210 | 625,536 | ||||
Pool # 3375, 5.50%, due 04/01/33 | 94,930 | 94,376 | ||||
20
EQUITRUST VARIABLE INSURANCE SERIES FUND
SCHEDULE OF INVESTMENTS
HIGH GRADE BOND PORTFOLIO (continued)
Principal Amount | Value | |||||
GOVERNMENT NATIONAL MORTGAGE | ||||||
Pool # 3390, 5.50%, due 05/01/33 | $ | 421,287 | $ | 418,827 | ||
Pool # 3403, 5.50%, due 06/01/33 | 712,303 | 708,144 | ||||
Pool # 3458, 5.00%, due 10/01/33 | 608,992 | 590,717 | ||||
Pool # 3499, 5.00%, due 01/01/34 | 937,594 | 908,954 | ||||
Pool # 3556, 5.50%, due 05/01/34 | 976,822 | 970,596 | ||||
Pool # 3623, 5.00%, due 10/01/34 | 1,559,004 | 1,511,382 | ||||
Pool # 22630, 6.50%, due 08/01/28 | 24,874 | 25,509 | ||||
Pool # 276337, 10.00%, due 08/01/19 | 5,729 | 6,363 | ||||
Pool # 643816, 6.00%, due 07/01/25 | 1,250,842 | 1,270,887 | ||||
| 8,533,139 | ||||||
Total Mortgage-Backed Securities | 12,081,178 | |||||
UNITED STATES GOVERNMENT AGENCIES (15.75%) | ||||||
Federal Home Loan Bank, 5.50%, due 05/18/15 | 1,000,000 | 987,024 | ||||
Federal Home Loan Mortgage Corp., 4.65%, due 10/10/13 | 1,000,000 | 961,770 | ||||
Federal National Mortgage Assoc., 6.00%, due 08/22/13 | 1,000,000 | 999,409 | ||||
Federal National Mortgage Assoc., 5.55%, due 06/08/15 | 1,000,000 | 989,123 | ||||
Federal National Mortgage Assoc., 6.00%, due 11/09/15 | 300,000 | 298,329 | ||||
Government National Mortgage Assoc., 5.00%, due 05/01/30 | 1,000,000 | 983,328 | ||||
Government National Mortgage Assoc., 5.50%, due 07/01/32 | 1,000,000 | 982,916 | ||||
Total United States Government Agencies | 6,201,899 | |||||
SHORT-TERM INVESTMENTS (10.64%) | ||||||
COMMERCIAL PAPER (2.41%) | ||||||
NONDEPOSITORY INSTITUTIONS | ||||||
General Electric Capital Corp., 5.26%, due 01/25/07 | 500,000 | 500,000 | ||||
HSBC Finance Corp., 5.26%, due 01/25/07 | 450,000 | 450,000 | ||||
Total Commercial Paper | 950,000 | |||||
Principal Amount | Value | |||||
UNITED STATES GOVERNMENT AGENCIES (7.86%) | ||||||
Federal Home Loan Bank, due 01/03/07 | $ | 900,000 | $ | 899,483 | ||
Federal Home Loan Bank, due 01/22/07 | 1,200,000 | 1,196,074 | ||||
Federal National Mortgage Assoc., due 01/11/07 | 1,000,000 | 998,282 | ||||
Total United States | 3,093,839 | |||||
| Shares Held | ||||||
MONEY MARKET MUTUAL FUND (0.37%) | ||||||
JPMorgan U.S. Treasury | 144,208 | 144,208 | ||||
Total Short-Term Investments | 4,188,047 | |||||
Total Investments (99.14%) | 39,032,889 | |||||
OTHER ASSETS LESS LIABILITIES (0.86%) | ||||||
Cash, receivables, prepaid expense and other assets, less liabilities | 338,332 | |||||
Total Net Assets (100.00%) | $ | 39,371,221 | ||||
| (1) | Restricted Securities: |
| PNC Preferred FD, was purchased at 100.000 on 11/29/2006. As of 12/31/06, the carrying value of each unit was 101.643, representing $1,524,645 or 3.87% of total net assets. |
| Maritime & NE Pipeline was purchased at 104.481 on 04/20/01. As of 12/31/06, the carrying value of each unit was 112.139, representing $784,973 or 1.99% of total net assets. |
| As of 12/31/06, the carrying value of all restricted securities was $2,309,618 or 5.86% of total net assets. |
See accompanying notes.
21
EQUITRUST VARIABLE INSURANCE SERIES FUND
SCHEDULE OF INVESTMENTS
STRATEGIC YIELD PORTFOLIO
December 31, 2006
| Shares Held | Value | |||||
PREFERRED STOCKS (2.96%) | ||||||
DEPOSITORY INSTITUTIONS (2.06%) | ||||||
Sovereign Capital Trust V, 7.75% | 32,000 | $ | 856,000 | |||
HOLDING AND OTHER INVESTMENT OFFICES (0.90%) | ||||||
New Plan Excel Realty Trust, Series D, 7.80% | 7,000 | 374,500 | ||||
Total Preferred Stocks | 1,230,500 | |||||
| Principal Amount | ||||||
CORPORATE BONDS (65.25%) | ||||||
APPAREL AND ACCESSORY STORES (3.33%) | ||||||
Woolworth (FW) Corp., 8.50%, due 01/15/22 | $ | 1,400,000 | 1,382,500 | |||
CHEMICALS AND ALLIED PRODUCTS (5.78%) | ||||||
Chemtura Corp., 6.875%, due 06/01/16 | 1,700,000 | 1,657,500 | ||||
Nova Chemicals, Ltd., 7.875%, due 09/15/25 | 800,000 | 740,000 | ||||
| 2,397,500 | ||||||
DEPOSITORY INSTITUTIONS (3.68%) | ||||||
PNC Preferred FD, 144A, 6.517%, due 12/31/49 (1) | 1,500,000 | 1,524,645 | ||||
ELECTRIC, GAS AND SANITARY SERVICES (3.34%) | ||||||
ESI Tractebel, 7.99%, due 12/30/11 | 274,000 | 282,571 | ||||
Semco Energy, Inc., 7.125%, due 05/15/08 | 900,000 | 907,875 | ||||
Waterford 3 Nuclear Power Plant, 8.09%, due 01/02/17 | 190,749 | 193,096 | ||||
| 1,383,542 | ||||||
FURNITURE AND FIXTURES (3.19%) | ||||||
Steelcase Inc., 6.50%, due 08/15/11 | 1,300,000 | 1,324,713 | ||||
HOLDING AND OTHER INVESTMENT OFFICES (18.42%) | ||||||
Federal Realty Investment Trust, 7.48%, due 08/15/26 | 600,000 | 672,477 | ||||
First Industrial LP, 7.60%, due 07/15/28 | 700,000 | 789,572 | ||||
First Industrial LP, 7.75%, due 04/15/32 | 500,000 | 567,660 | ||||
HRPT Properties, 6.25%, due 08/15/16 | 1,075,000 | 1,112,313 | ||||
Hospitality Properties Trust, 6.75%, due 02/15/13 | 1,300,000 | 1,361,854 | ||||
Principal | Value | |||||
iStar Financial, Inc., 7.00%, due 03/15/08 | $ | 300,000 | $ | 306,924 | ||
iStar Financial, Inc.-Series B, 5.70%, due 03/01/14 | 1,171,000 | 1,161,983 | ||||
Price Development Co., 7.29%, due 03/11/08 | 225,000 | 226,283 | ||||
Spieker Properties LP, 7.35%, due 12/01/17 | 1,200,000 | 1,441,800 | ||||
| 7,640,866 | ||||||
INSURANCE CARRIERS (4.13%) | ||||||
Markel Capital Trust, 8.71%, due 01/01/46 | 1,000,000 | 1,043,610 | ||||
PXRE Capital Trust, 8.85%, due 02/01/27 | 670,000 | 668,325 | ||||
| 1,711,935 | ||||||
MOTION PICTURES (2.26%) | ||||||
Time Warner, Inc., 8.375%, due 03/15/23 | 800,000 | 938,184 | ||||
OIL & GAS FIELD EXPLORATION SERVICES (2.42%) | ||||||
Sabine Pass LNG, LP., 144A 7.50%, due 11/30/16 (1) | 1,000,000 | 1,002,500 | ||||
PAPER AND ALLIED PRODUCTS (7.15%) | ||||||
Bowater, Inc., 9.375%, due 12/15/21 | 900,000 | 903,375 | ||||
Cascades, Inc., 7.25%, due 02/15/13 | 1,000,000 | 1,002,500 | ||||
Potlatch Corp., 13.00%, due 12/01/09 | 900,000 | 1,058,625 | ||||
| 2,964,500 | ||||||
TRANSPORTATION — BY AIR (3.01%) | ||||||
Continental Airlines, Inc., 7.461%, due 10/01/16 | 1,199,790 | 1,250,181 | ||||
WATER TRANSPORTATION (5.37%) | ||||||
Overseas Shipholding Group, Inc., 8.75%, due 12/01/13 | 1,100,000 | 1,190,750 | ||||
Windsor Petroleum Transportation, 144A, 7.84%, due 01/15/21 (1) | 1,000,000 | 1,036,980 | ||||
| 2,227,730 | ||||||
WHOLESALE TRADE — NONDURABLE GOODS (3.17%) | ||||||
Safeway, Inc., 7.45%, due 09/15/27 | 1,200,000 | 1,315,788 | ||||
Total Corporate Bonds | 27,064,584 | |||||
MORTGAGE-BACKED SECURITIES (7.56%) | ||||||
FEDERAL HOME LOAN MORTGAGE CORPORATION (FHLMC) (5.35%) | ||||||
Pool # 3023, 5.50%, due 08/01/35 | 1,268,828 | 1,239,341 | ||||
Pool # 3051, 5.50%, due 10/01/25 | 1,000,000 | 980,010 | ||||
| 2,219,351 | ||||||
22
EQUITRUST VARIABLE INSURANCE SERIES FUND
SCHEDULE OF INVESTMENTS
STRATEGIC YIELD PORTFOLIO (continued)
Principal | Value | |||||
MORTGAGE-BACKED SECURITIES (continued) | ||||||
FEDERAL NATIONAL MORTGAGE ASSOCIATION (FNMA) (2.21%) | ||||||
Pool # 256103, 5.50%, due 02/01/26 | $ | 919,880 | $ | 914,552 | ||
Total Mortgage-Backed Securities | 3,133,903 | |||||
UNITED STATES GOVERNMENT AGENCIES (8.85%) | ||||||
Federal Home Loan Bank, | 1,000,000 | 987,024 | ||||
Federal National Mortgage Assoc., | 1,000,000 | 999,409 | ||||
Federal National Mortgage Assoc., | 1,000,000 | 989,123 | ||||
Federal National Mortgage Assoc., | 700,000 | 696,101 | ||||
Total United States Government Agencies | 3,671,657 | |||||
SHORT-TERM INVESTMENTS (14.09%) | ||||||
COMMERCIAL PAPER (2.65%) | ||||||
NONDEPOSITORY INSTITUTIONS | ||||||
American General Finance Corp., 5.28%, due 01/23/07 | 1,100,000 | 1,100,000 | ||||
| 1,100,000 | ||||||
UNITED STATES GOVERNMENT AGENCIES (11.01%) | ||||||
Federal Home Loan Bank, due 01/08/07 | 1,325,000 | 1,323,310 | ||||
Federal Home Loan Bank, due 01/12/07 | 1,100,000 | 1,097,955 | ||||
Federal Home Loan Bank, due 01/17/07 | 1,000,000 | 997,427 | ||||
Federal National Mortgage Assoc., due 01/02/07 | 1,150,000 | 1,149,508 | ||||
Total United States Government Agencies (Cost $4,568,200) | 4,568,200 | |||||
| Shares Held | Value | ||||
MONEY MARKET MUTUAL FUND (0.43%) | |||||
JPMorgan U.S. Treasury Plus | 179,175 | $ | 179,175 | ||
Total Short-Term Investments | 5,847,375 | ||||
Total Investments (98.71%) | 40,948,019 | ||||
OTHER ASSETS LESS LIABILITIES (1.29%) | |||||
Cash, receivables, prepaid expense and other assets, less liabilities | 533,020 | ||||
Total Net Assets (100.00%) | $ | 41,481,039 | |||
| (1) | Restricted Securities: |
| PNC Preferred FD, was purchased at 100.000 on 11/29/2006. As of 12/31/06, the carrying value of each unit was 101.643, representing $1,524,645 or 3.68% of total net assets. |
| Sabine Pass LNG, LP., was purchased at 100.000 on 11/01/2006. As of 12/31/06, the carrying value of each unit was 100.250, representing $1,002,500 or 2.42% of total net assets. |
| Windsor Petroleum Transportation was purchased at 80.500 on 08/26/99. As of 12/31/06, the carrying value of each unit was 103.698, representing $1,036,980 or 2.50% of total net assets. |
| As of 12/31/06, the carrying value of all restricted securities was $3,564,125 or 8.60% of total net assets. |
See accompanying notes.
23
EQUITRUST VARIABLE INSURANCE SERIES FUND
SCHEDULE OF INVESTMENTS
MANAGED PORTFOLIO
December 31, 2006
| Shares Held | Value | ||||
COMMON STOCKS (56.80%) | |||||
APPAREL AND OTHER TEXTILE PRODUCTS (0.34%) | |||||
Jones Apparel Group, Inc. | 9,600 | $ | 320,928 | ||
BUSINESS SERVICES (0.76%) | |||||
Affiliated Computer Services, Inc. (1) | 3,800 | 185,592 | |||
Electronic Data Systems Corp. | 7,500 | 206,625 | |||
Microsoft Corp. | 10,800 | 322,488 | |||
| 714,705 | |||||
CHEMICALS AND ALLIED PRODUCTS (8.33%) | |||||
Abbott Laboratories | 19,800 | 964,458 | |||
Bristol-Myers Squibb Co. | 9,545 | 251,224 | |||
Colgate-Palmolive Co. | 4,230 | 275,965 | |||
Dow Chemical Co. | 13,965 | 557,762 | |||
E.I. du Pont de Nemours & Co. | 16,475 | 802,497 | |||
GlaxoSmithKline PLC | 4,700 | 247,972 | |||
Johnson & Johnson | 22,622 | 1,493,504 | |||
KV Pharmaceutical Co.-Class A (1) | 12,600 | 299,628 | |||
Mylan Laboratories, Inc. | 11,890 | 237,324 | |||
Olin Corp. | 17,100 | 282,492 | |||
Pfizer, Inc. | 67,204 | 1,740,584 | |||
Schering-Plough Corp. | 15,700 | 371,148 | |||
Teva Pharmaceutical Industries, Ltd. | 9,399 | 292,121 | |||
| 7,816,679 | |||||
COMMUNICATIONS (1.32%) | |||||
Comcast Corp.-Class A (1) | 9,060 | 383,510 | |||
Sprint Nextel Corp. | 21,801 | 411,821 | |||
Verizon Communications, Inc. | 11,800 | 439,432 | |||
| 1,234,763 | |||||
DEPOSITORY INSTITUTIONS (5.81%) | |||||
Bank of America Corp. | 14,072 | 751,304 | |||
Bank of New York Co., Inc. | 11,229 | 442,086 | |||
Citigroup, Inc. | 19,822 | 1,104,085 | |||
National City Corp. | 8,695 | 317,889 | |||
New York Community Bancorp., Inc. | 44,834 | 721,827 | |||
Regions Financial Corp. | 13,974 | 522,628 | |||
U. S. Bancorp | 24,470 | 885,569 | |||
Wachovia Corp. | 8,328 | 474,280 | |||
Wells Fargo Master Trust | 6,560 | 233,274 | |||
| 5,452,942 | |||||
ELECTRIC, GAS AND SANITARY SERVICES (5.53%) | |||||
Atmos Energy Corp. | 38,252 | 1,220,621 | |||
Pepco Holdings, Inc. | 40,600 | 1,056,006 | |||
Pinnacle West Capital Corp. | 24,200 | 1,225,488 | |||
Tortoise Energy Capital Corp. | 40,562 | 1,118,294 | |||
Xcel Energy, Inc. | 24,690 | 569,351 | |||
| 5,189,760 | |||||
| Shares Held | Value | ||||
ELECTRONIC AND OTHER ELECTRICAL EQUIPMENT (4.07%) | |||||
Cisco Systems, Inc. (1) | 20,100 | $ | 549,333 | ||
Emerson Electric Co. | 1,600 | 70,512 | |||
General Electric Co. | 71,480 | 2,659,771 | |||
Helen of Troy, Ltd. (1) | 12,334 | 299,223 | |||
Intel Corp. | 11,900 | 240,975 | |||
| 3,819,814 | |||||
FABRICATED METAL PRODUCTS (0.50%) | |||||
Illinois Tool Works, Inc. | 10,155 | 469,059 | |||
FOOD AND KINDRED PRODUCTS (2.20%) | |||||
Anheuser-Busch Cos., Inc. | 11,995 | 590,154 | |||
Coca-Cola Co. (The) | 10,380 | 500,835 | |||
ConAgra Foods, Inc. | 18,839 | 508,653 | |||
PepsiCo, Inc. | 7,470 | 467,249 | |||
| 2,066,891 | |||||
FOOD STORES (0.62%) | |||||
Kroger Co. | 25,186 | 581,041 | |||
GENERAL MERCHANDISE STORES (0.95%) | |||||
Target Corp. | 4,760 | 271,558 | |||
Wal-Mart Stores, Inc. | 13,390 | 618,350 | |||
| 889,908 | |||||
HEALTH SERVICES (1.38%) | |||||
Health Management Associates, Inc. | 47,700 | 1,006,947 | |||
Lifepoint Hospitals, Inc. (1) | 8,429 | 284,057 | |||
| 1,291,004 | |||||
INDUSTRIAL MACHINERY AND EQUIPMENT (2.10%) | |||||
3M Co. | 11,405 | 888,792 | |||
Hewlett-Packard Co. | 6,900 | 284,211 | |||
Ingersoll-Rand Co., Ltd.-Class A | 20,444 | 799,974 | |||
| 1,972,977 | |||||
INSTRUMENTS AND RELATED PRODUCTS (2.52%) | |||||
Becton Dickinson & Co. | 10,635 | 746,045 | |||
Biomet, Inc. | 5,840 | 241,017 | |||
Stryker Corp. | 9,790 | 539,527 | |||
Thermo Fisher Scientific, Inc. (1) | 7,840 | 355,074 | |||
Zimmer Holdings, Inc. (1) | 6,200 | 485,956 | |||
| 2,367,619 | |||||
INSURANCE CARRIERS (2.34%) | |||||
Allstate Corp. | 7,140 | 464,885 | |||
American International Group, Inc. | 6,170 | 442,142 | |||
MetLife, Inc. | 9,755 | 575,643 | |||
Safeco Corp. | 4,693 | 293,547 | |||
WellPoint, Inc. (1) | 5,328 | 419,260 | |||
| 2,195,477 | |||||
24
EQUITRUST VARIABLE INSURANCE SERIES FUND
SCHEDULE OF INVESTMENTS
MANAGED PORTFOLIO (continued)
| Shares Held | Value | ||||
COMMON STOCKS (continued) | |||||
LUMBER AND WOOD PRODUCTS (0.25%) | |||||
Lowes Companies | 7,525 | $ | 234,404 | ||
METAL MINING (2.74%) | |||||
Barrick Gold Corp. | 57,916 | 1,778,021 | |||
Newmont Mining Corp. | 17,500 | 790,125 | |||
| 2,568,146 | |||||
NONDEPOSITORY CREDIT INSTITUTION (0.53%) | |||||
SLM Corp. | 10,195 | 497,210 | |||
OIL AND GAS EXTRACTION (2.23%) | |||||
Apache Corp. | 6,700 | 445,617 | |||
Occidental Petroleum Co. | 22,250 | 1,086,468 | |||
Rowan Cos., Inc. | 16,700 | 554,440 | |||
| 2,086,525 | |||||
PAPER AND ALLIED PRODUCTS (1.45%) | |||||
Abitibi Consolidated, Inc. | 133,500 | 341,760 | |||
Kimberly-Clark Corp. | 15,015 | 1,020,269 | |||
| 1,362,029 | |||||
PERSONAL SERVICES (0.24%) | |||||
Cintas Corp. | 5,650 | 224,361 | |||
PETROLEUM AND COAL PRODUCTS (3.48%) | |||||
BP PLC | 8,100 | 543,510 | |||
ConocoPhillips | 37,770 | 2,717,552 | |||
| 3,261,062 | |||||
PIPELINES, EXCEPT NATURAL GAS (1.19%) | |||||
Kinder Morgan Management LLC (1) | 24,501 | 1,119,206 | |||
PRINTING AND PUBLISHING (1.00%) | |||||
Belo Corp.-Series A | 17,370 | 319,261 | |||
R.R. Donnelley & Sons Co. | 10,925 | 388,275 | |||
Tribune Co. | 7,375 | 227,002 | |||
| 934,538 | |||||
RAILROAD TRANSPORTATION (0.27%) | |||||
Union Pacific Corp. | 2,710 | 249,374 | |||
RETAIL-DRUG AND PROPRIETARY STORES (0.30%) | |||||
Walgreen Co. | 6,100 | 279,929 | |||
TOBACCO PRODUCTS (0.37%) | |||||
Altria Group, Inc. | 4,045 | 347,142 | |||
TRANSPORTATION EQUIPMENT (2.56%) | |||||
Federal Signal Corp. | 36,400 | 583,856 | |||
Honeywell International, Inc. | 27,400 | 1,239,576 | |||
ITT Industries, Inc. | 10,190 | 578,996 | |||
| 2,402,428 | |||||
| Shares Held | Value | |||||
TRUCKING AND TRANSPORTATION (0.27%) | ||||||
United Parcel Service, Inc.-Class B | 3,320 | $ | 248,934 | |||
WHOLESALE TRADE — NONDURABLE GOODS (1.15%) | ||||||
Dean Foods Co. (1) | 10,579 | 447,280 | ||||
SYSCO Corp. | 17,085 | 628,045 | ||||
| 1,075,325 | ||||||
Total Common Stocks | 53,274,180 | |||||
| Principal Amount | ||||||
MORTGAGE-BACKED SECURITIES (2.53%) | ||||||
GOVERNMENT NATIONAL MORTGAGE ASSOCIATION (GNMA) | ||||||
Pool # 2796, 7.00%, due 08/01/29 | $ | 66,000 | 67,974 | |||
Pool # 3040, 7.00%, due 02/01/31 | 36,597 | 37,684 | ||||
Pool # 3188, 6.50%, due 02/01/32 | 105,449 | 107,976 | ||||
Pool # 3239, 6.50%, due 05/01/32 | 162,172 | 166,057 | ||||
Pool # 3333, 5.50%, due 01/01/33 | 275,280 | 273,672 | ||||
Pool # 3403, 5.50%, due 06/01/33 | 224,543 | 223,232 | ||||
Pool # 3442, 5.00%, due 09/01/33 | 914,645 | 887,197 | ||||
Pool # 3459, 5.50%, due 10/01/33 | 614,434 | 610,846 | ||||
Total Mortgage-Backed Securities | 2,374,638 | |||||
UNITED STATES GOVERNMENT AGENCIES (24.93%) | ||||||
Federal National Mortgage Assoc., | 975,000 | 969,569 | ||||
Government National Mortgage Assoc., 5.00%, due 09/01/23 | 700,000 | 691,886 | ||||
Government National Mortgage Assoc., 5.50%, due 05/01/24 | 2,000,000 | 1,967,464 | ||||
Government National Mortgage Assoc., 5.00%, due 05/01/29 | 1,000,000 | 955,278 | ||||
Government National Mortgage Assoc., 5.00%, due 09/01/29 | 600,000 | 591,068 | ||||
Government National Mortgage Assoc., 5.00%, due 05/01/30 | 1,560,000 | 1,533,992 | ||||
Government National Mortgage Assoc., 5.00%, due 04/01/31 | 1,500,000 | 1,479,541 | ||||
Government National Mortgage Assoc., 5.00%, due 06/01/31 | 1,300,000 | 1,272,628 | ||||
Government National Mortgage Assoc., 5.50%, due 02/01/32 | 1,300,000 | 1,293,139 | ||||
Government National Mortgage Assoc., 5.00%, due 07/01/32 | 500,000 | 481,484 | ||||
Government National Mortgage Assoc., 5.50%, due 07/01/32 | 2,250,000 | 2,211,561 | ||||
25
EQUITRUST VARIABLE INSURANCE SERIES FUND
SCHEDULE OF INVESTMENTS
MANAGED PORTFOLIO (continued)
| Principal Amount | Value | |||||
UNITED STATES GOVERNMENT AGENCIES (continued) | ||||||
Government National Mortgage Assoc., 5.50%, due 11/01/32 | $ | 2,000,000 | $ | 1,980,638 | ||
Government National Mortgage Assoc., 5.50%, due 02/01/33 | 2,500,000 | 2,455,992 | ||||
Government National Mortgage Assoc., 5.00%, due 05/01/33 | 780,000 | 744,000 | ||||
Government National Mortgage Assoc., 5.00%, due 06/01/33 | 1,693,200 | 1,649,757 | ||||
Government National Mortgage Assoc., 3.47%, due 04/01/34 | 418,893 | 404,065 | ||||
Government National Mortgage Assoc., 4.00%, due 10/01/34 | 766,843 | 744,401 | ||||
Government National Mortgage Assoc., 5.50%, due 12/01/34 | 2,000,000 | 1,952,148 | ||||
Total United States Government Agencies (Cost $23,285,583) | 23,378,611 | |||||
SHORT-TERM INVESTMENTS (15.55%) | ||||||
COMMERCIAL PAPER (5.81%) | ||||||
DEPOSITORY INSTITUTIONS (1.44%) | ||||||
Citigroup CP, 5.27%, due 01/05/07 | 1,350,000 | 1,350,000 | ||||
INSURANCE CARRIERS (1.49%) | ||||||
Prudential Funding LLC, 5.24%, due 01/12/07 | 1,400,000 | 1,400,000 | ||||
NONDEPOSITORY INSTITUTIONS (1.49%) | ||||||
American General Finance Corp., 5.28%, due 01/03/07 | 900,000 | 900,000 | ||||
General Electric Capital Corp., 5.27%, due 02/08/07 | 500,000 | 500,000 | ||||
| 1,400,000 | ||||||
PETROLEUM AND COAL PRODUCTS (1.39%) | ||||||
Chevron Corp., 5.26%, due 01/30/07 | 1,300,000 | 1,300,000 | ||||
Total Commercial Paper | 5,450,000 | |||||
UNITED STATES GOVERNMENT AGENCIES (9.56%) | ||||||
Federal Farm Credit Bank, due 02/05/07 | 1,200,000 | 1,193,658 | ||||
Federal Home Loan Bank, due 01/10/07 | 1,100,000 | 1,098,270 | ||||
Federal Home Loan Bank, due 01/17/07 | 1,300,000 | 1,296,657 | ||||
Federal Home Loan Bank, due 01/24/07 | 1,350,000 | 1,345,164 | ||||
| Principal Amount | Value | |||||
Federal Home Loan Mortgage Corp., due 02/08/07 | $ | 630,000 | $ | 626,418 | ||
Federal National Mortgage Assoc., due 01/19/07 | 1,200,000 | 1,196,563 | ||||
Federal National Mortgage Assoc., due 01/26/07 | 1,125,000 | 1,120,662 | ||||
Federal National Mortgage Assoc., due 02/14/07 | 1,100,000 | 1,092,789 | ||||
Total United States Government Agencies (Cost $8,970,181) | 8,970,181 | |||||
| Shares Held | ||||||
MONEY MARKET MUTUAL FUND (0.18%) | ||||||
JPMorgan U.S. Treasury | 170,546 | 170,546 | ||||
Total Short-Term Investments | 14,590,727 | |||||
Total Investments (99.81%) | 93,618,156 | |||||
OTHER ASSETS LESS LIABILITIES (0.19%) | ||||||
Cash, receivables, prepaid expense and other assets, less liabilities | 177,722 | |||||
Total Net Assets (100.00%) | $ | 93,795,878 | ||||
| (1) | Non-income producing securities. |
See accompanying notes.
26
EQUITRUST VARIABLE INSURANCE SERIES FUND
SCHEDULE OF INVESTMENTS
MONEY MARKET PORTFOLIO
December 31, 2006
| Annualized Yield on Purchase Date | Principal Amount | Value | |||||||
SHORT-TERM INVESTMENTS (97.79%) | |||||||||
COMMERCIAL PAPER (22.47%) | |||||||||
FOOD AND KINDRED PRODUCTS (3.48%) | |||||||||
Coca-Cola Enterprises, Inc., 144A due 02/12/07 (1) | 5.276 | % | $ | 300,000 | $ | 298,078 | |||
INSURANCE CARRIERS (2.92%) | |||||||||
Prudential Funding LLC, 5.25%, due 03/01/07 | 5.246 | 250,000 | 250,000 | ||||||
NONDEPOSITORY INSTITUTIONS (13.15%) | |||||||||
American Express Credit Corp., 5.17%, due 03/15/07 | 5.166 | 250,000 | 250,000 | ||||||
American General Finance Corp., 5.23%, due 01/02/07 | 5.233 | 150,000 | 150,000 | ||||||
American General Finance Corp., 5.29%, due 01/29/07 | 5.286 | 225,000 | 225,000 | ||||||
General Electric Capital Corp., 5.29%, due 03/12/07 | 5.299 | 250,000 | 250,000 | ||||||
HSBC Finance Corp., 5.25%, due 01/18/07 | 5.246 | 250,000 | 250,000 | ||||||
| 1,125,000 | |||||||||
PETROLEUM AND COAL PRODUCTS (2.92%) | |||||||||
Chevron Corp., 5.28%, due 02/23/07 | 5.277 | 250,000 | 250,000 | ||||||
Total Commercial Paper (Cost $1,923,078) | 1,923,078 | ||||||||
UNITED STATES GOVERNMENT AGENCIES (75.32%) | |||||||||
Federal Farm Credit Bank, due 01/02/07 | 5.144 | 225,000 | 224,905 | ||||||
Federal Farm Credit Bank, due 01/04/07 | 5.196 | 200,000 | 199,858 | ||||||
Federal Home Loan Bank, due 01/05/07 | 5.208 | 250,000 | 249,786 | ||||||
Federal Home Loan Bank, due 01/12/07 | 5.218 | 250,000 | 249,536 | ||||||
Federal Home Loan Bank, due 01/19/07 | 5.193 | 250,000 | 249,291 | ||||||
Federal Home Loan Bank, due 02/07/07 | 5.228 | 225,000 | 223,750 | ||||||
Federal Home Loan Bank, due 02/14/07 | 5.217 | 200,000 | 198,694 | ||||||
Federal Home Loan Bank, due 02/16/07 | 5.214 | 250,000 | 248,298 | ||||||
Federal Home Loan Bank, due 03/09/07 | 5.235 | 200,000 | 198,040 | ||||||
Federal Home Loan Bank, due 03/16/07 | 5.233 | 350,000 | 346,227 | ||||||
Federal Home Loan Mortgage Corp., due 01/09/07 | 5.248 | 250,000 | 249,641 | ||||||
Federal Home Loan Mortgage Corp., due 01/16/07 | 5.182 | 250,000 | 249,398 | ||||||
Federal Home Loan Mortgage Corp., due 01/23/07 | 5.262 | 250,000 | 249,138 | ||||||
Federal Home Loan Mortgage Corp., due 01/26/07 | 5.217 | 200,000 | 199,231 | ||||||
Federal Home Loan Mortgage Corp., due 01/31/07 | 5.216 | 300,000 | 298,677 | ||||||
Federal Home Loan Mortgage Corp., due 02/09/07 | 5.240 | 225,000 | 223,683 | ||||||
Federal Home Loan Mortgage Corp., due 03/13/07 | 5.231 | 400,000 | 395,859 | ||||||
Federal National Mortgage Assoc., due 01/03/07 | 5.218 | 200,000 | 199,886 | ||||||
Federal National Mortgage Assoc., due 01/08/07 | 5.222 | 200,000 | 199,743 | ||||||
Federal National Mortgage Assoc., due 01/10/07 | 5.170 | 225,000 | 224,650 | ||||||
Federal National Mortgage Assoc., due 01/11/07 | 5.235 | 250,000 | 249,570 | ||||||
Federal National Mortgage Assoc., due 01/17/07 | 5.193 | 250,000 | 249,361 | ||||||
Federal National Mortgage Assoc., due 01/24/07 | 5.266 | 250,000 | 249,102 | ||||||
Federal National Mortgage Assoc., due 01/31/07 | 5.227 | 300,000 | 298,631 | ||||||
Federal National Mortgage Assoc., due 03/07/07 | 5.269 | 200,000 | 198,084 | ||||||
Federal National Mortgage Assoc., due 03/14/07 | 5.235 | 325,000 | 321,587 | ||||||
Total United States Government Agencies (Cost $6,444,626) | 6,444,626 | ||||||||
Total Short-Term Investments (Cost $8,367,704) | 8,367,704 | ||||||||
27
EQUITRUST VARIABLE INSURANCE SERIES FUND
SCHEDULE OF INVESTMENTS
MONEY MARKET PORTFOLIO (continued)
December 31, 2006
| Annualized Yield on Purchase Date | Principal Amount | Value | |||||
OTHER ASSETS LESS LIABILITIES (2.21%) | |||||||
Cash, receivables, prepaid expense and other assets, less liabilities | $ | 189,278 | |||||
Total Net Assets (100.00%) | $ | 8,556,982 | |||||
| (1) | Restricted Security: |
| Coca-Cola Enterprises, Inc., was purchased at 99.128 on 12/14/2006. As of 12/31/06, the carrying value of each unit was 99.359, representing $298,078 or 3.48% of total net assets. |
28
EQUITRUST VARIABLE INSURANCE SERIES FUND
SCHEDULE OF INVESTMENTS
BLUE CHIP PORTFOLIO
December 31, 2006
| Shares Held | Value | ||||
COMMON STOCKS (97.23%) | |||||
BUSINESS SERVICES (4.12%) | |||||
Microsoft Corp. | 91,883 | $ | 2,743,626 | ||
Oracle Corp. (1) | 57,149 | 979,534 | |||
| 3,723,160 | |||||
CHEMICALS AND ALLIED PRODUCTS (14.68%) | |||||
Abbott Laboratories | 24,755 | 1,205,816 | |||
Amgen, Inc. (1) | 17,835 | 1,218,309 | |||
Bristol-Myers Squibb Co. | 35,343 | 930,228 | |||
Dow Chemical Co. | 10,505 | 419,570 | |||
E.I. du Pont de Nemours & Co. | 15,756 | 767,475 | |||
Eli Lilly & Co. | 17,662 | 920,190 | |||
Johnson & Johnson | 42,710 | 2,819,714 | |||
Merck & Co., Inc. | 28,348 | 1,235,973 | |||
Pfizer, Inc. | 44,377 | 1,149,364 | |||
Procter & Gamble Co. | 40,222 | 2,585,068 | |||
| 13,251,707 | |||||
COMMUNICATIONS (4.47%) | |||||
AT&T, Inc. | 34,855 | 1,246,066 | |||
Comcast Corp.-Class A (1) | 22,036 | 932,784 | |||
Verizon Communications | 36,562 | 1,361,569 | |||
Viacom, Inc.-Class B (1) | 12,084 | 495,807 | |||
| 4,036,226 | |||||
DEPOSITORY INSTITUTIONS (11.31%) | |||||
Bank of America Corp. | 45,666 | 2,438,108 | |||
Citigroup, Inc. | 48,341 | 2,692,594 | |||
J. P. Morgan Chase & Co. | 46,325 | 2,237,497 | |||
Wachovia Corp. | 25,460 | 1,449,947 | |||
Wells Fargo Co. | 39,005 | 1,387,018 | |||
| 10,205,164 | |||||
EATING AND DRINKING PLACES (2.49%) | |||||
McDonald’s Corp. | 50,717 | 2,248,285 | |||
ELECTRIC, GAS AND SANITARY SERVICES (3.57%) | |||||
Dominion Resources, Inc. | 11,370 | 953,261 | |||
Exelon Corp. | 24,105 | 1,491,858 | |||
Southern Co. | 21,215 | 781,985 | |||
| 3,227,104 | |||||
ELECTRONIC AND OTHER ELECTRICAL EQUIPMENT (7.79%) | |||||
Cisco Systems, Inc. (1) | 61,023 | 1,667,759 | |||
General Electric Co. | 72,106 | 2,683,064 | |||
Intel Corp. | 57,041 | 1,155,080 | |||
Motorola, Inc. | 37,189 | 764,606 | |||
Texas Instruments, Inc. | 26,461 | 762,077 | |||
| 7,032,586 | |||||
| Shares Held | Value | ||||
FOOD AND KINDRED PRODUCTS (3.05%) | |||||
Anheuser Busch Cos., Inc. | 11,202 | $ | 551,138 | ||
Coca-Cola Co. (The) | 25,859 | 1,247,697 | |||
PepsiCo, Inc. | 15,208 | 951,260 | |||
| 2,750,095 | |||||
FORESTRY (0.49%) | |||||
Weyerhaeuser Co. | 6,270 | 442,976 | |||
GENERAL MERCHANDISE STORES (2.14%) | |||||
Wal-Mart Stores, Inc. | 41,773 | 1,929,077 | |||
INDUSTRIAL MACHINERY AND | |||||
3M Co. | 17,453 | 1,360,112 | |||
Applied Materials, Inc. | 23,520 | 433,944 | |||
Caterpillar, Inc. | 28,044 | 1,719,938 | |||
Dell, Inc. (1) | 30,585 | 767,377 | |||
EMC Corp. (1) | 37,308 | 492,466 | |||
Hewlett-Packard Co. | 40,454 | 1,666,300 | |||
International Business Machines Corp. | 14,526 | 1,411,201 | |||
| 7,851,338 | |||||
INSURANCE CARRIERS (2.95%) | |||||
American International Group, Inc. | 37,204 | 2,666,038 | |||
LUMBER AND WOOD PRODUCTS (1.13%) | |||||
Home Depot, Inc. | 25,393 | 1,019,783 | |||
MOTION PICTURES (2.56%) | |||||
Disney (Walt) Co. | 36,092 | 1,236,873 | |||
Time Warner, Inc. | 49,492 | 1,077,936 | |||
| 2,314,809 | |||||
NONDEPOSITORY INSTITUTIONS (4.41%) | |||||
American Express Co. | 51,742 | 3,139,187 | |||
Federal National Mortgage Assoc. | 14,090 | 836,805 | |||
| 3,975,992 | |||||
PETROLEUM AND COAL PRODUCTS (8.95%) | |||||
Chevron Corp. | 38,610 | 2,838,993 | |||
Exxon Mobil Corp. | 68,376 | 5,239,653 | |||
| 8,078,646 | |||||
PRIMARY METAL INDUSTRIES (1.01%) | |||||
Alcoa, Inc. | 30,278 | 908,643 | |||
PRINTING AND PUBLISHING (0.42%) | |||||
CBS Corp.-Class B | 12,084 | 376,779 | |||
SECURITY AND COMMODITY BROKERS (0.62%) | |||||
Ameriprise Financial, Inc. | 10,349 | 564,020 | |||
29
EQUITRUST VARIABLE INSURANCE SERIES FUND
SCHEDULE OF INVESTMENTS
BLUE CHIP PORTFOLIO (continued)
| Shares Held | Value | |||||
COMMON STOCKS (continued) | ||||||
TOBACCO PRODUCTS (3.63%) | ||||||
Altria Group, Inc. | 38,185 | $ | 3,277,037 | |||
TRANSPORTATION EQUIPMENT (8.74%) | ||||||
Boeing Co. (The) | 31,442 | 2,793,307 | ||||
General Motors Corp. | 16,365 | 502,733 | ||||
Honeywell International, Inc. | 37,264 | 1,685,823 | ||||
United Technologies Corp. | 46,457 | 2,904,492 | ||||
| 7,886,355 | ||||||
Total Common Stocks | 87,765,820 | |||||
SHORT-TERM INVESTMENTS (2.71%) | ||||||
MONEY MARKET MUTUAL FUND (0.11%) | ||||||
JPMorgan U.S. Treasury Plus | 100,172 | 100,172 | ||||
| Principal Amount | ||||||
COMMERCIAL PAPER (1.05%) | ||||||
NONDEPOSITORY INSTITUTIONS (0.72%) | ||||||
General Electric Capital Corp., | $ | 350,000 | 350,000 | |||
HSBC Finance Corp., | 300,000 | 300,000 | ||||
| 650,000 | ||||||
PETROLEUM AND COAL PRODUCTS (0.33%) | ||||||
Chevron Corp., 5.22% due 01/03/07 | 300,000 | 300,000 | ||||
Total Commercial Paper | 950,000 | |||||
| Principal Amount | Value | |||||
UNITED STATES GOVERNMENT AGENCIES (1.55%) | ||||||
Federal Home Loan Bank, due 01/12/07 | $ | 300,000 | $ | 299,445 | ||
Federal Home Loan Bank, due 01/22/07 | 300,000 | 299,014 | ||||
Federal Home Loan Mortgage Corp., due 02/13/07 | 300,000 | 298,068 | ||||
Federal National Mortgage Assoc., due 01/17/007 | 500,000 | 498,718 | ||||
Total United States | 1,395,245 | |||||
Total Short-Term Investments | 2,445,417 | |||||
Total Investments (99.94%) | 90,211,237 | |||||
OTHER ASSETS LESS LIABILITIES (0.06%) | ||||||
Cash, receivables, prepaid expense and other assets, less liabilities | 49,870 | |||||
Total Net Assets (100.00%) | $ | 90,261,107 | ||||
| (1) | Non-income producing securities. |
See accompanying notes.
30
EQUITRUST VARIABLE INSURANCE SERIES FUND
NOTES TO FINANCIAL STATEMENTS
December 31, 2006
| 1. | Significant Accounting Policies |
Organization
EquiTrust Variable Insurance Series Fund (the “Fund”) is registered under the Investment Company Act of 1940, as amended, as a no-load, open-end diversified management investment company, or mutual fund. The Fund is authorized to issue an unlimited number of shares of beneficial interest with no par value. The Fund currently consists of six portfolios (known as the Value Growth, High Grade Bond, Strategic Yield, Managed, Money Market and Blue Chip Portfolios). Shares of the Fund are sold only to certain life insurance companies’ separate accounts to fund the benefits under variable insurance contracts issued by such life insurance companies, including Farm Bureau Life Insurance Company and EquiTrust Life Insurance Company (see Note 3).
Security Valuation
All Portfolios, other than the Money Market Portfolio, value their investment securities that are traded on any national exchange at the last sale price on the day of valuation or, lacking any sales, at the mean between the closing bid and asked prices. Investments traded in the over-the-counter market are valued at the mean between the bid and asked prices or yield equivalent as obtained from one or more dealers that make markets in the securities. In situations where market quotations are not readily available or quoted market prices are not reliable, investments are valued at fair value in accordance with the procedures adopted by the Fund’s Board of Trustees. Short-term investments are valued at market value, except that obligations maturing in 90 days or less are valued using the amortized cost method of valuation described below with respect to the Money Market Portfolio, which approximates market value.
The Money Market Portfolio values investments at amortized cost, which approximates market value. Under the amortized cost method, a security is valued at its cost on the date of purchase and thereafter is adjusted to reflect a constant amortization to maturity of the difference between the principal amount due at maturity and the cost of the investment to the Portfolio.
Income and Investment Transactions
For financial reporting purposes, investment transactions are recorded on the trade date. The identified cost basis has been used in determining the net realized gain or loss from investment transactions and unrealized appreciation or depreciation on investments. Dividend income is recorded on the ex-dividend date and interest is recognized on an accrual basis. Discounts and premiums on investments purchased are amortized over the life of the respective investments.
Dividends and Distributions to Shareholders
On each day that the net asset value per share is calculated in the High Grade Bond and Strategic Yield Portfolios, that Portfolio’s net investment income will be declared, as of the close of the New York Stock Exchange, as a dividend to shareholders of record prior to the declaration. With respect to the Money Market Portfolio, each day the net asset value per share is calculated, net investment income and any realized gains and losses from investment transactions will be declared, as of the close of the New York Stock Exchange, as a dividend to shareholders of record prior to the declaration. With respect to the High Grade Bond and Strategic Yield Portfolios, any net short-term and long-term gains will be declared and distributed periodically, but in no event less frequently than annually. Dividends and distributions of the other Portfolios are recorded on the ex-dividend date. Dividends and distributions from net investment income and net realized gain from investments are determined in accordance with federal tax regulations, which may differ from U.S. generally accepted accounting principles. These differences are primarily due to differing treatments for certain basis adjustments resulting from a taxable spin-off and taxable mergers. Permanent book and tax basis differences are reclassified within the capital accounts based on their federal tax-basis treatment; temporary differences do not require reclassification.
Dividends and distributions which exceed current and accumulated earnings and profits for federal income tax purposes are reported as return of capital distributions.
31
EQUITRUST VARIABLE INSURANCE SERIES FUND
NOTES TO FINANCIAL STATEMENTS (continued)
| 1. | Significant Accounting Policies (continued) |
Use of Estimates
The preparation of financial statements in conformity with U.S. generally accepted accounting principles requires management to make estimates and assumptions that affect the reported amounts of assets and liabilities and disclosure of contingent assets and liabilities at the date of the financial statements and the reported amounts of revenues and expenses during the reporting period. Actual results could differ from those estimates.
Indemnifications
Under the Fund’s organizational documents, its present and past officers and trustees are indemnified against certain liability arising out of the performance of their duties to the Fund. At the discretion of the Board of Trustees, employees and agents may also be indemnified. In addition, in the normal course of business the Fund enters into contracts that contain a variety of representations and warranties which provide general indemnifications. The Fund’s maximum exposure under these arrangements is unknown, as this would involve future claims that may be made against the Fund that have not yet occurred.
New Accounting Pronouncements
On July 13, 2006, the Financial Accounting Standards Board (FASB) issued FASB Interpretation No. 48 “Accounting for Uncertainty in Income Taxes” (FIN 48). FIN 48 provides guidance for how uncertain tax positions should be recognized, measured, presented and disclosed in the financial statements. FIN 48 requires the evaluation of tax positions taken or expected to be taken in the course of preparing the Fund’s tax returns to determine whether the tax positions are “more-likely-than-not” of being sustained by the applicable tax authority. Tax positions not determined to meet the more-likely-than-not threshold would be recorded as a benefit or expense in the current year. Adoption of FIN 48 is required for the first required financial statement reporting period for fiscal years beginning after December 15, 2006 and is to be applied to all open tax years as of the effective date. Management has evaluated the implications of FIN 48 and concluded that there is no expected impact to the financial statements.
In September 2006, the FASB issued Statement on Financial Accounting Standards No. 157 “Fair Value Measurements” (SFAS 157). This standard establishes a single authoritative definition of fair value, sets out a framework for measuring fair value and requires additional disclosures about fair value measurements. SFAS 157 is effective for financial statements issued for fiscal years beginning after November 15, 2007 and interim periods within those financial statements. As of December 31, 2006, the Fund does not believe the adoption of SFAS 157 will impact the financial statement amounts, however, additional disclosures may be required about the inputs used to develop the measurements and the effect of certain of the measurements on changes in net assets for the period.
| 2. | Federal Income Taxes |
No provision for federal income taxes is considered necessary because the Fund is qualified as a “regulated investment company” under the Internal Revenue Code and intends to distribute each year substantially all of its net investment income and realized capital gains to shareholders.
As of December 31, 2006, the following Portfolios had approximate net capital loss carryforwards set forth below:
| Portfolio | ||||||
Net Capital Loss Carryforwards Expire In: | Strategic Yield | Blue Chip | ||||
2010 | $ | 1,497,000 | $ | 728,000 | ||
2011 | 571,000 | 4,672,000 | ||||
2012 | — | 556,000 | ||||
2013 | — | 60,000 | ||||
| $ | 2,068,000 | $ | 6,016,000 | |||
32
EQUITRUST VARIABLE INSURANCE SERIES FUND
NOTES TO FINANCIAL STATEMENTS (continued)
| 2. | Federal Income Taxes (continued) |
For the year ended December 31, 2006, the Value Growth Portfolio utilized approximately $977,000 or all of its previous capital loss carryforwards and the Strategic Yield and Blue Chip Portfolios utilized approximately $192,000 and $1,058,000, respectively, of capital loss carryforwards.
As of December 31, 2006, the Value Growth, High Grade Bond, Managed and Blue Chip Portfolio have post-October capital losses of $14,664, $9,701, $94,497 and $6,408, respectively, that will be deferred to the first day of the next fiscal year.
As of December 31, 2006, the components of accumulated earnings and capital gains (losses) on a tax basis were identical to those reported in the statements of assets and liabilities, except as follows:
| Portfolio | ||||||||||||
| Value Growth | Strategic Yield | Managed | ||||||||||
Undistributed ordinary income | $ | 1,163,459 | $ | 7,750 | $ | 3,009,170 | ||||||
Undistributed capital gains | 2,257,122 | — | 3,632,708 | |||||||||
Accumulated capital losses | (14,664 | ) | (2,067,683 | ) | (94,497 | ) | ||||||
Net unrealized appreciation of investments | 7,943,542 | 725,970 | 11,528,350 | |||||||||
Other timing differences | — | (7,750 | ) | — | ||||||||
Total accumulated earnings | $ | 11,349,459 | $ | (1,341,713 | ) | $ | 18,075,731 | |||||
Differences between book and tax amounts are primarily attributable to taxable spin-offs, mergers and corporate inversions. Additionally, the Strategic Yield Portfolio held a trust preferred security which accrues income for tax purposes and not financial reporting purposes.
| 3. | Management Contract and Transactions with Affiliates |
The Fund has entered into agreements with EquiTrust Investment Management Services, Inc. (“EquiTrust Investment”) relating to the management of the Portfolios and the investment of their assets. Pursuant to these agreements, fees paid to EquiTrust Investment are as follows: (1) annual investment advisory and management fees, which are based on each Portfolio’s average daily net assets as follows: Value Growth Portfolio — 0.45%; High Grade Bond Portfolio — 0.30%; Strategic Yield Portfolio — 0.45%; Managed Portfolio — 0.45%; Money Market Portfolio — 0.25% ; and Blue Chip Portfolio — 0.20%, and (2) accounting fees, which are based on each Portfolio’s daily net assets at an annual rate of 0.05%, with a maximum per Portfolio annual expense of $30,000.
The Fund has entered into an agreement with EquiTrust Investment whereby EquiTrust Investment also serves as the Fund’s shareholder service, transfer and dividend disbursing agent. EquiTrust Marketing Services, LLC serves as the principal underwriter and distributor. There are no fees paid by the Fund associated with these services.
EquiTrust Investment has agreed to reimburse the Portfolios annually for total expenses (excluding brokerage, interest, taxes and extraordinary expenses) in excess of 1.50% of each Portfolio’s average daily net assets. The amount reimbursed, however, shall not exceed the amount of the investment advisory and management fee paid by the Portfolio for such period. During the year ended December 31, 2006, EquiTrust Investment further agreed to reimburse any Portfolio, to the extent that annual operating expenses, including the investment advisory fee, exceed 0.65%. For the year ended December 31, 2006, no expense reimbursements were made to the Fund by EquiTrust Investment.
33
EQUITRUST VARIABLE INSURANCE SERIES FUND
NOTES TO FINANCIAL STATEMENTS (continued)
| 3. | Management Contract and Transactions with Affiliates (continued) |
Certain officers and trustees of the Fund are also officers of EquiTrust Investment, Farm Bureau Life Insurance Company and other affiliated entities. As of December 31, 2006, the total number of the shares of each Portfolio owned by Farm Bureau Life Insurance Company, EquiTrust Life Insurance Company and related separate accounts were as follows:
Portfolio | Shares | |
Value Growth | 4,264,173 | |
High Grade Bond | 3,552,447 | |
Strategic Yield | 3,931,169 | |
Managed | 5,462,600 | |
Money Market | 6,794,262 | |
Blue Chip | 2,155,216 |
| 4. | Capital Share Transactions |
Transactions in shares of beneficial interest for each Portfolio were as follows:
| Shares Sold | Shares Issued In Reinvestment of Dividends and Distributions | Shares Redeemed | Net Increase (Decrease) | |||||||||||||||||||
Portfolio | Shares | Amount | Shares | Amount | Shares | Amount | Shares | Amount | ||||||||||||||
Year ended December 31, 2006: | ||||||||||||||||||||||
Value Growth | 255,896 | $ | 3,609,647 | 60,639 | $ | 836,213 | 373,100 | $ | 5,261,554 | (56,565 | ) | $ | (815,694 | ) | ||||||||
High Grade Bond | 596,516 | 5,992,257 | 186,353 | 1,872,291 | 332,120 | 3,333,560 | 450,749 | 4,530,988 | ||||||||||||||
Strategic Yield | 717,781 | 6,518,284 | 258,257 | 2,345,363 | 518,599 | 4,701,758 | 457,439 | 4,161,889 | ||||||||||||||
Managed | 468,970 | 7,173,849 | 445,511 | 6,620,289 | 442,686 | 6,802,184 | 471,795 | 6,991,954 | ||||||||||||||
Money Market | 36,344,869 | 36,344,869 | 276,847 | 276,847 | 34,352,364 | 34,352,364 | 2,269,352 | 2,269,352 | ||||||||||||||
Blue Chip | 101,702 | 3,765,368 | 46,259 | 1,635,261 | 264,053 | 9,720,213 | (116,092 | ) | (4,319,584 | ) | ||||||||||||
Year ended December 31, 2005: | ||||||||||||||||||||||
Value Growth | 221,957 | $ | 2,908,508 | 53,423 | $ | 665,116 | 358,299 | $ | 4,688,291 | (82,919 | ) | $ | (1,114,667 | ) | ||||||||
High Grade Bond | 664,378 | 6,808,079 | 149,086 | 1,528,984 | 262,031 | 2,690,002 | 551,433 | 5,647,061 | ||||||||||||||
Strategic Yield | 833,599 | 7,731,637 | 206,966 | 1,920,635 | 254,892 | 2,373,545 | 785,673 | 7,278,727 | ||||||||||||||
Managed | 655,902 | 10,084,258 | 175,742 | 2,597,468 | 334,379 | 5,134,191 | 497,265 | 7,547,535 | ||||||||||||||
Money Market | 36,520,136 | 36,520,136 | 122,167 | 122,167 | 36,946,738 | 36,946,738 | (304,435 | ) | (304,435 | ) | ||||||||||||
Blue Chip | 116,352 | 4,011,812 | 48,130 | 1,621,030 | 241,530 | 8,334,683 | (77,048 | ) | (2,701,841 | ) | ||||||||||||
| 5. | Investment Transactions |
For the year ended December 31, 2006, the cost of investment securities purchased and proceeds from investment securities sold (not including short-term investments and U.S. Government securities) by Portfolio, were as follows:
Portfolio | Purchases | Sales | ||||
Value Growth | $ | 16,877,651 | $ | 15,566,841 | ||
High Grade Bond | 7,486,498 | 1,269,131 | ||||
Strategic Yield | 9,033,596 | 4,912,916 | ||||
Managed | 15,383,952 | 16,170,676 | ||||
Blue Chip | — | 1,798,486 | ||||
34
EQUITRUST VARIABLE INSURANCE SERIES FUND
NOTES TO FINANCIAL STATEMENTS (continued)
| 5. | Investment Transactions (continued) |
The basis of the Fund’s investments in securities and the net unrealized appreciation of investments for U.S. federal income tax purposes as of December 31, 2006, by Portfolio, was composed of the following:
Portfolio | Tax Cost of Investments in Securities | Gross Unrealized | Net Unrealized Appreciation of Investments | |||||||||
| Appreciation | Depreciation | |||||||||||
Value Growth | $ | 57,722,360 | $ | 11,460,264 | $ | 3,516,722 | $ | 7,943,542 | ||||
High Grade Bond | 38,920,332 | 432,102 | 319,545 | 112,557 | ||||||||
Strategic Yield | 40,222,049 | 1,122,034 | 396,064 | 725,970 | ||||||||
Managed | 82,089,806 | 13,448,633 | 1,920,283 | 11,528,350 | ||||||||
Blue Chip | 64,142,034 | 32,982,171 | 6,912,968 | 26,069,203 | ||||||||
The basis for U.S. federal income tax purposes and financial reporting purposes for investments in the Money Market Portfolio is the same and is equal to the underlying investments’ carrying value.
| 6. | Dividends and Distributions to Shareholders |
Dividends from net investment income for the following Portfolios are declared daily and were payable on the last business day of the month as follows:
| Portfolio | |||||||||
Payable Date | High Grade Bond | Strategic Yield | Money Market | ||||||
January 31, 2006 | $ | 0.0431 | $ | 0.0462 | $ | 0.0032 | |||
February 28, 2006 | 0.0319 | 0.0388 | 0.0029 | ||||||
March 31, 2006 | 0.0479 | 0.0471 | 0.0034 | ||||||
April 28, 2006 | 0.0388 | 0.0418 | 0.0032 | ||||||
May 31, 2006 | 0.0452 | 0.0490 | 0.0038 | ||||||
June 30, 2006 | 0.0438 | 0.0459 | 0.0037 | ||||||
July 31, 2006 | 0.0437 | 0.0454 | 0.0039 | ||||||
August 31, 2006 | 0.0436 | 0.0488 | 0.0040 | ||||||
September 29, 2006 | 0.0423 | 0.0503 | 0.0037 | ||||||
October 31, 2006 | 0.0447 | 0.0454 | 0.0041 | ||||||
November 30, 2006 | 0.0434 | 0.0482 | 0.0038 | ||||||
December 29, 2006 | 0.0413 | 0.0416 | 0.0037 | ||||||
Total dividends per share | $ | 0.5097 | $ | 0.5485 | $ | 0.0434 | |||
None of the ordinary income dividends qualify for the dividends received deduction by corporate shareholders for the High Grade Bond, Strategic Yield and Money Market Portfolios.
35
EQUITRUST VARIABLE INSURANCE SERIES FUND
NOTES TO FINANCIAL STATEMENTS (continued)
| 6. | Dividends and Distributions to Shareholders (continued) |
In addition, dividends and distributions to shareholders from net investment income and net realized gain on investment transactions were paid during the year ended December 31, 2006 for the following Portfolios:
Ordinary Income Dividends:
Portfolio | Declaration Date | Record Date | Payable Date | Amount Per Share | Percent Qualifying for Deductions by Corporations | ||||||
Value Growth | 1/18/06 | 1/18/06 | 1/19/06 | 0.1899 | 100 | % | |||||
Managed | 1/18/06 | 1/18/06 | 1/19/06 | 0.3738 | 51 | % | |||||
Blue Chip | 1/18/06 | 1/18/06 | 1/19/06 | 0.7012 | 100 | % |
Capital Gains Distributions:
Portfolio | Declaration Date | Record Date | Payable Date | Amount Per Share | ||||||
Managed | 1/18/06 | 1/18/06 | 1/19/06 | 0.8778 |
The federal income tax character of dividends and distributions to shareholders during 2006 and 2005 was the same for financial reporting purposes.
36
EQUITRUST VARIABLE INSURANCE SERIES FUND
FINANCIAL HIGHLIGHTS
Years Ended December 31, 2006, 2005, 2004, 2003 and 2002
| Value Growth Portfolio | High Grade Bond Portfolio | |||||||||||||||||||||||||||||||||||||||
| 2006 | 2005 | 2004 | 2003 | 2002 | 2006 | 2005 | 2004 | 2003 | 2002 | |||||||||||||||||||||||||||||||
Net asset value, beginning of year | $ | 13.65 | $ | 12.98 | $ | 11.76 | $ | 9.14 | $ | 10.39 | $ | 10.16 | $ | 10.38 | $ | 10.42 | $ | 10.39 | $ | 10.08 | ||||||||||||||||||||
Income From Investment Operations | ||||||||||||||||||||||||||||||||||||||||
Net investment income | 0.27 | 0.19 | 0.15 | 0.12 | 0.14 | 0.51 | 0.47 | 0.45 | 0.47 | 0.50 | ||||||||||||||||||||||||||||||
Net gains (losses) on securities (both realized and unrealized) | 1.36 | 0.63 | 1.20 | 2.64 | (1.20 | ) | (0.04 | ) | (0.20 | ) | — | 0.08 | 0.32 | |||||||||||||||||||||||||||
Total from investment operations | 1.63 | 0.82 | 1.35 | 2.76 | (1.06 | ) | 0.47 | 0.27 | 0.45 | 0.55 | 0.82 | |||||||||||||||||||||||||||||
Less Distributions | ||||||||||||||||||||||||||||||||||||||||
Dividends (from net investment income) | (0.19 | ) | (0.15 | ) | (0.13 | ) | (0.14 | ) | (0.19 | ) | (0.51 | ) | (0.47 | ) | (0.45 | ) | (0.47 | ) | (0.50 | ) | ||||||||||||||||||||
Distributions (from capital gains) | — | — | — | — | — | — | (0.02 | ) | (0.04 | ) | (0.05 | ) | (0.01 | ) | ||||||||||||||||||||||||||
Total distributions | (0.19 | ) | (0.15 | ) | (0.13 | ) | (0.14 | ) | (0.19 | ) | (0.51 | ) | (0.49 | ) | (0.49 | ) | (0.52 | ) | (0.51 | ) | ||||||||||||||||||||
Net asset value, end of year | $ | 15.09 | $ | 13.65 | $ | 12.98 | $ | 11.76 | $ | 9.14 | $ | 10.12 | $ | 10.16 | $ | 10.38 | $ | 10.42 | $ | 10.39 | ||||||||||||||||||||
Total Return: | ||||||||||||||||||||||||||||||||||||||||
Total investment return based on net asset value (1) | 12.07 | % | 6.41 | % | 11.53 | % | 30.68 | % | (10.43 | )% | 4.78 | % | 2.65 | % | 4.30 | % | 5.43 | % | 8.37 | % | ||||||||||||||||||||
Ratios/Supplemental Data: | ||||||||||||||||||||||||||||||||||||||||
Net assets, end of year (000’s omitted) | $ | 65,712 | $ | 60,223 | $ | 58,354 | $ | 52,812 | $ | 40,953 | $ | 39,371 | $ | 34,946 | $ | 29,980 | $ | 26,659 | $ | 24,984 | ||||||||||||||||||||
Ratio of total expenses to average net assets | 0.58 | % | 0.58 | % | 0.58 | % | 0.63 | % | 0.59 | % | 0.44 | % | 0.45 | % | 0.45 | % | 0.49 | % | 0.46 | % | ||||||||||||||||||||
Ratio of net investment income to average net assets | 1.88 | % | 1.42 | % | 1.22 | % | 1.26 | % | 1.46 | % | 5.08 | % | 4.63 | % | 4.34 | % | 4.51 | % | 4.92 | % | ||||||||||||||||||||
Portfolio turnover rate | 30 | % | 18 | % | 17 | % | 17 | % | 15 | % | 17 | % | 12 | % | 26 | % | 28 | % | 22 | % | ||||||||||||||||||||
Note: Net investment income per share amounts have been calculated based on average shares outstanding for the year.
| (1) | Total investment return is calculated assuming an initial investment made at the net asset value at the beginning of the year, reinvestment of all dividends and distributions at net asset value during the year, and redemption on the last day of the year. |
See accompanying notes.
37
EQUITRUST VARIABLE INSURANCE SERIES FUND
FINANCIAL HIGHLIGHTS (continued)
| Strategic Yield Portfolio | Managed Portfolio | |||||||||||||||||||||||||||||||||||||||
| 2006 | 2005 | 2004 | 2003 | 2002 | 2006 | 2005 | 2004 | 2003 | 2002 | |||||||||||||||||||||||||||||||
Net asset value, beginning of year | $ | 9.14 | $ | 9.37 | $ | 9.13 | $ | 8.75 | $ | 8.90 | $ | 15.80 | $ | 15.67 | $ | 14.73 | $ | 12.34 | $ | 13.00 | ||||||||||||||||||||
Income From Investment Operations | ||||||||||||||||||||||||||||||||||||||||
Net investment income | 0.55 | 0.53 | 0.55 | 0.63 | 0.62 | 0.49 | 0.35 | 0.27 | 0.30 | 0.34 | ||||||||||||||||||||||||||||||
Net gains (losses) on securities (both realized and unrealized) | 0.05 | (0.23 | ) | 0.24 | 0.38 | (0.15 | ) | 1.28 | 0.32 | 0.97 | 2.43 | (0.57 | ) | |||||||||||||||||||||||||||
Total from investment operations | 0.60 | 0.30 | 0.79 | 1.01 | 0.47 | 1.77 | 0.67 | 1.24 | 2.73 | (0.23 | ) | |||||||||||||||||||||||||||||
Less Distributions | ||||||||||||||||||||||||||||||||||||||||
Dividends (from net investment income) | (0.55 | ) | (0.53 | ) | (0.55 | ) | (0.63 | ) | (0.62 | ) | (0.37 | ) | (0.27 | ) | (0.30 | ) | (0.34 | ) | (0.43 | ) | ||||||||||||||||||||
Distributions (from capital gains) | — | — | — | — | — | (0.88 | ) | (0.27 | ) | — | — | — | ||||||||||||||||||||||||||||
Total distributions | (0.55 | ) | (0.53 | ) | (0.55 | ) | (0.63 | ) | (0.62 | ) | (1.25 | ) | (0.54 | ) | (0.30 | ) | (0.34 | ) | (0.43 | ) | ||||||||||||||||||||
Net asset value, end of year | $ | 9.19 | $ | 9.14 | $ | 9.37 | $ | 9.13 | $ | 8.75 | $ | 16.32 | $ | 15.80 | $ | 15.67 | $ | 14.73 | $ | 12.34 | ||||||||||||||||||||
Total Return: | ||||||||||||||||||||||||||||||||||||||||
Total investment return based on net asset value (1) | 6.79 | % | 3.26 | % | 8.94 | % | 11.97 | % | 5.43 | % | 11.99 | % | 4.53 | % | 8.58 | % | 22.72 | % | (1.80 | )% | ||||||||||||||||||||
Ratios/Supplemental Data: | ||||||||||||||||||||||||||||||||||||||||
Net assets, end of year (000’s omitted) | $ | 41,481 | $ | 37,067 | $ | 30,637 | $ | 25,498 | $ | 22,395 | $ | 93,796 | $ | 83,368 | $ | 74,876 | $ | 66,733 | $ | 54,428 | ||||||||||||||||||||
Ratio of total expenses to average net assets | 0.58 | % | 0.59 | % | 0.59 | % | 0.65 | % | 0.61 | % | 0.55 | % | 0.56 | % | 0.56 | % | 0.62 | % | 0.58 | % | ||||||||||||||||||||
Ratio of net investment income to average net assets | 6.04 | % | 5.71 | % | 5.98 | % | 7.07 | % | 7.04 | % | 2.98 | % | 2.34 | % | 1.87 | % | 2.35 | % | 2.73 | % | ||||||||||||||||||||
Portfolio turnover rate | 16 | % | 1 | % | 34 | % | 32 | % | 34 | % | 24 | % | 24 | % | 26 | % | 24 | % | 18 | % | ||||||||||||||||||||
Note: Net investment income per share amounts have been calculated based on average shares outstanding for the year.
| (1) | Total investment return is calculated assuming an initial investment made at the net asset value at the beginning of the year, reinvestment of all dividends and distributions at net asset value during the year, and redemption on the last day of the year. |
See accompanying notes.
38
EQUITRUST VARIABLE INSURANCE SERIES FUND
FINANCIAL HIGHLIGHTS (continued)
| Money Market Portfolio | Blue Chip Portfolio | |||||||||||||||||||||||||||||||||||||||
| 2006 | 2005 | 2004 | 2003 | 2002 | 2006 | 2005 | 2004 | 2003 | 2002 | |||||||||||||||||||||||||||||||
Net asset value, beginning of year | $ | 1.00 | $ | 1.00 | $ | 1.00 | $ | 1.00 | $ | 1.00 | $ | 35.27 | $ | 35.17 | $ | 33.65 | $ | 27.22 | $ | 34.14 | ||||||||||||||||||||
Income From Investment Operations | ||||||||||||||||||||||||||||||||||||||||
Net investment income | 0.04 | 0.02 | 0.01 | 0.01 | 0.01 | 0.79 | 0.70 | 0.67 | 0.50 | 0.46 | ||||||||||||||||||||||||||||||
Net gains (losses) on securities (both realized and unrealized) | — | — | — | — | — | 5.25 | 0.07 | 1.35 | 6.38 | (6.88 | ) | |||||||||||||||||||||||||||||
Total from investment operations | 0.04 | 0.02 | 0.01 | 0.01 | 0.01 | 6.04 | 0.77 | 2.02 | 6.88 | (6.42 | ) | |||||||||||||||||||||||||||||
Less Distributions | ||||||||||||||||||||||||||||||||||||||||
Dividends (from net investment income) | (0.04 | ) | (0.02 | ) | (0.01 | ) | (0.01 | ) | (0.01 | ) | (0.70 | ) | (0.67 | ) | (0.50 | ) | (0.45 | ) | (0.50 | ) | ||||||||||||||||||||
Distributions (from capital gains) | — | — | — | — | — | — | — | — | — | — | ||||||||||||||||||||||||||||||
Total distributions | (0.04 | ) | (0.02 | ) | (0.01 | ) | (0.01 | ) | (0.01 | ) | (0.70 | ) | (0.67 | ) | (0.50 | ) | (0.45 | ) | (0.50 | ) | ||||||||||||||||||||
Net asset value, end of year | $ | 1.00 | $ | 1.00 | $ | 1.00 | $ | 1.00 | $ | 1.00 | $ | 40.61 | $ | 35.27 | $ | 35.17 | $ | 33.65 | $ | 27.22 | ||||||||||||||||||||
Total Return: | ||||||||||||||||||||||||||||||||||||||||
Total investment return based on net asset value (1) | 4.43 | % | 2.50 | % | 0.74 | % | 0.52 | % | 1.16 | % | 17.42 | % | 2.29 | % | 6.07 | % | 25.70 | % | (19.07 | )% | ||||||||||||||||||||
Ratios/Supplemental Data: | ||||||||||||||||||||||||||||||||||||||||
Net assets, end of year (000’s omitted) | $ | 8,557 | $ | 6,288 | $ | 6,592 | $ | 6,728 | $ | 8,150 | $ | 90,261 | $ | 82,501 | $ | 84,960 | $ | 79,832 | $ | 63,699 | ||||||||||||||||||||
Ratio of total expenses to average net assets | 0.54 | % | 0.61 | % | 0.56 | % | 0.59 | % | 0.52 | % | 0.31 | % | 0.31 | % | 0.30 | % | 0.36 | % | 0.31 | % | ||||||||||||||||||||
Ratio of net investment income to average net assets | 4.37 | % | 2.47 | % | 0.72 | % | 0.53 | % | 1.16 | % | 2.07 | % | 1.98 | % | 2.00 | % | 1.72 | % | 1.50 | % | ||||||||||||||||||||
Portfolio turnover rate | — | % | — | % | — | % | — | % | — | % | — | % | — | % | 1 | % | 17 | % | — | % | ||||||||||||||||||||
Note: Net investment income per share amounts have been calculated based on average shares outstanding for the year.
| (1) | Total investment return is calculated assuming an initial investment made at the net asset value at the beginning of the year, reinvestment of all dividends and distributions at net asset value during the year, and redemption on the last day of the year. |
See accompanying notes.
39
REPORT OF INDEPENDENT REGISTERED PUBLIC ACCOUNTING FIRM
The Board of Trustees and Shareholders
EquiTrust Variable Insurance Series Fund
We have audited the accompanying statements of assets and liabilities, including the schedules of investments, of EquiTrust Variable Insurance Series Fund [comprised of the Value Growth, High Grade Bond, Strategic Yield, Managed, Money Market and Blue Chip Portfolios] as of December 31, 2006, and the related statements of operations for the year then ended, the statements of changes in net assets for each of the two years in the period then ended, and the financial highlights for each of the five years in the period then ended. These financial statements and financial highlights are the responsibility of the Fund’s management. Our responsibility is to express an opinion on these financial statements and financial highlights based on our audits.
We conducted our audits in accordance with the standards of the Public Company Accounting Oversight Board (United States). Those standards require that we plan and perform the audit to obtain reasonable assurance about whether the financial statements and financial highlights are free of material misstatement. We were not engaged to perform an audit of the Fund’s internal control over financial reporting. Our audits included consideration of internal control over financial reporting as a basis for designing audit procedures that are appropriate in the circumstances, but not for the purpose of expressing an opinion on the effectiveness of the Fund’s internal control over financial reporting. Accordingly, we express no such opinion. An audit also includes examining, on a test basis, evidence supporting the amounts and disclosures in the financial statements and financial highlights, assessing the accounting principles used and significant estimates made by management, and evaluating the overall financial statement presentation. Our procedures included confirmation of securities owned as of December 31, 2006, by correspondence with the custodian. We believe that our audits provide a reasonable basis for our opinion.
In our opinion, the financial statements and financial highlights referred to above present fairly, in all material respects, the financial position of each of the respective portfolios constituting the EquiTrust Variable Insurance Series Fund at December 31, 2006, and the results of their operations for the year then ended, the changes in their net assets for each of the two years in the period then ended, and the financial highlights for each of the five years in the period then ended, in conformity with U.S. generally accepted accounting principles.

Des Moines, Iowa
January 31, 2007
40
OFFICERS AND TRUSTEES
| Name, Address and Age | Position(s) Held with Fund | Term of Office & Length of Time Served(1) | Principal Occupation(s) During Past Five Years | Number of Portfolios in Fund Complex Overseen by Trustee | Other Directorships Held by Trustee | |||||
| Interested Persons(2) | ||||||||||
| Craig A. Lang (55) | President and Trustee | Since 2002 | Chairman and Director, FBL Financial Group, Inc.; President and Director, Iowa Farm Bureau Federation and other affiliates of the foregoing; Director, Western Agricultural Insurance Company and other affiliates of the foregoing; President and Director, EquiTrust Series Fund, Inc. and EquiTrust Money Market Fund, Inc.; Member, Growmark, Inc. Coordinating Committee and American Farm Bureau Federation Board of Directors; past member, Cattlemen’s Beef Board; Dairy Farmer | 13 | Director, Farm Bureau Bank (San Antonio, Texas); Director, Iowa Telecommunications Services, Inc. (Newton, Iowa); Director, Iowa Economic Development Board (Des Moines, Iowa) | |||||
| William J. Oddy (62) | Vice President and Trustee | Since 1981 | Chief Executive Officer and Management Director, FBL Financial Group, Inc.; Chief Executive Officer, Farm Bureau Life Insurance Company and other affiliates of the foregoing; Chief Executive Officer and Director, EquiTrust Life Insurance Company and other affiliates of the foregoing; Chief Executive Officer and Manager, EquiTrust Marketing Services, LLC; Chief Executive Officer and Director, EquiTrust Investment Management Services, Inc.; Vice President and Director, EquiTrust Series Fund, Inc. and EquiTrust Money Market Fund, Inc.; President and Director, FBL Real Estate Ventures, Ltd. | 13 | Director, American Equity Investment Life Insurance Company, Berthel Fisher & Company, Inc. and Berthel Fisher & Company Financial Services, Inc. | |||||
| James W. Noyce (51) | Chief Financial Officer and Treasurer | Since 1996 | Chief Financial Officer and Chief Administrative Officer, FBL Financial Group, Inc. and other affiliates of the foregoing; Chief Administrative Officer, Treasurer and Manager, EquiTrust Marketing Services, LLC; Vice President, Treasurer and Director, EquiTrust Investment Management Services, Inc. Real Estate Ventures, LTD. and other affiliates of the foregoing; President, Treasurer and Director, FBL Leasing Services, Inc.; Chief Executive Officer, Chief Financial Officer and Chief Administrative Officer, Western Computer Services, Inc.; Chief Financial Officer and Treasurer, EquiTrust Series Fund, Inc. and EquiTrust Money Market Fund, Inc. | |||||||
| Dennis M. Marker (55) | Chief Executive Officer | Since 1982 | Vice President-Investment Administration, FBL Financial Group, Inc. and other affiliates of the foregoing; President and Director, EquiTrust Investment Management Services, Inc.; Chief Compliance Officer, Vice President-Investment Administration and Manager, EquiTrust Marketing Services, LLC; Chief Executive Officer, EquiTrust Series Fund, Inc. and EquiTrust Money Market Fund, Inc.; Vice President and Director, FBL Leasing Services, Inc. | |||||||
| Stephen M. Morain (61) | Senior Vice President and General Counsel | Since 1982 | General Counsel and Assistant Secretary, Iowa Farm Bureau Federation; General Counsel, Secretary and Director, Farm Bureau Management Corporation; Senior Vice President and General Counsel, FBL Financial Group, Inc. and other affiliates of the foregoing; Senior Vice President, General Counsel and Manager, EquiTrust Marketing Services, LLC; Senior Vice President, General Counsel and Director, EquiTrust Investment Management Services, Inc. | |||||||
| JoAnn Rumelhart (53) | Executive Vice President | Since 2000 | Executive Vice President, Farm Bureau Life Insurance Company and other affiliates of the foregoing; Executive Vice President and Director, EquiTrust Investment Management Services, Inc.; Executive Vice President and Manager, EquiTrust Marketing Services, LLC.; Executive Vice President, EquiTrust Series Fund, Inc. and EquiTrust Money Market Fund, Inc.; Vice President, EquiTrust Life Insurance Company. | |||||||
| John M. Paule (50) | Chief Marketing Officer | Since 2000 | Chief Marketing Officer, FBL Financial Group, Inc. and other affiliates of the foregoing; Executive Vice President, EquiTrust Life Insurance Company; Chief Marketing Officer and Director, EquiTrust Investment Management Services, Inc.; Chief Marketing Officer and Manager, EquiTrust Marketing Services, LLC. | |||||||
41
| Name, Address and Age | Position(s) Held with Fund | Term of Office & Length of Time Served(1) | Principal Occupation(s) During Past Five Years | Number of Portfolios in Fund Complex Overseen by Trustee | Other Directorships Held by Trustee | |||||
| Lou Ann Sandburg (58) | Vice President- Investments and Assistant Treasurer | Since 1999 | Vice President-Investments and Assistant Treasurer, FBL Financial Group, Inc. and other affiliates of the foregoing; Chief Compliance Officer, Vice President-Investments, Assistant Treasurer and Director, EquiTrust Investment Management Services, Inc.; Vice President, Assistant Treasurer and Manager, EquiTrust Marketing Services, LLC; Vice President, FBL Financial Services, Inc. and other affiliates of the foregoing; Vice President and Director, FBL Leasing Services, Inc.; Vice President, Secretary and Director, FBL Real Estate Ventures, Ltd. | |||||||
| Kristi Rojohn (43) | Chief Compliance Officer, Investment Compliance Vice President and Secretary | Since 1990 | Chief Compliance Officer, Investment Compliance Vice President and Secretary, EquiTrust Series Fund, Inc. and EquiTrust Money Market Fund, Inc.; Investment Compliance Vice President and Secretary, EquiTrust Investment Management Services, Inc. and other affiliates of the foregoing. | |||||||
| Rob Ruisch (40) | Mutual Fund Accounting Director | Since 2005 | Mutual Fund Accounting Director, EquiTrust Investment Management Services, Inc. and other affiliates of the foregoing. | |||||||
| Karen Garza (37) | Assistant Secretary | Since 2005 | Assistant Secretary, EquiTrust Investment Management Services, Inc. and other affiliates of the foregoing. | |||||||
| Jennifer Morgan (36) | Assistant Secretary | Since 2005 | Assistant Secretary, EquiTrust Investment Management Services, Inc. and other affiliates of the foregoing. | |||||||
| Sara Welp (24) | Assistant Secretary | Since 2006 | Assistant Secretary, EquiTrust Investment Management Services, Inc. and other affiliates of the foregoing. | |||||||
| Jodi Winslow (31) | Assistant Secretary | Since 2004 | Assistant Secretary, EquiTrust Investment Management Services, Inc. and other affiliates of the foregoing. | |||||||
| Non-Interested Persons | ||||||||||
| Erwin H. Johnson (64) 1841 March Avenue Charles City, Iowa 50616-9115 | Trustee | Since 1989 | Farmer; Owner and Manager, Center View Farms, Co.; Farm Financial Planner; Iowa State University Cooperative Extension Service; Seed Sales, Syngenta; | 13 | Director, First Security Bank and Trust Co. (Charles City, Iowa) | |||||
| Kenneth Kay (64) 51606 590th Street Atlantic, Iowa 50022-8233 | Trustee | Since 1996 | President, K-Ranch Inc. | 13 | Director, First Whitney Bank & Trust (Atlantic, Iowa) | |||||
| Steven W. Plate (50) c/o Plate, Baker & Co. 1003 Main Street Grinnell, Iowa 50112 | Trustee | Since 2003 | CPA/Owner, Plate, Baker & Co., P.C., Certified Public Accountants | 13 | ||||||
| James D. Wallace (52) 1111 Ashworth Road West Des Moines IA 50265 | Trustee | Since 2004 | President and CEO, GuideOne Insurance and various subsidiaries; former President and CEO, National Travelers Life Company and various subsidiaries | 13 | ||||||
| Erlin J. Weness (62) 1620 Pinewood Drive Worthington, Minnesota 56187 | Trustee | Since 2003 | Owner and Operator, Weness Consulting; Extension Educator—Farm Management, University of Minnesota | 13 | Director, First State Bank Southwest (Worthington, Minnesota), First State Insurance Agency (Worthington, Minnesota) and First Rushmore Bancorporation (Worthington, Minnesota) | |||||
1 | Officers are elected annually by the Board of Trustees and their terms continue until they are replaced or resign. Each trustee shall serve as trustee until the next meeting of shareholders called for the purpose of conducting the election of such trustee or a successor to such trustee and until a successor is elected and qualified, or until such trustee sooner dies, resigns or is removed. |
2 | All interested persons maintain the same business address of 5400 University Avenue, West Des Moines, Iowa 50266. Messrs. Lang and Oddy are interested trustees of the Fund by virtue of their positions with the Adviser, Distributor and/or affiliated persons of the Adviser and Distributor. |
The Statement of Additional Information (“SAI”) includes additional information about Fund trustees and is available upon request without charge. To request a copy of the SAI, please call 1-877-860-2904 M-F 8:00 AM to 4:30 PM CT.
42
The officers and trustees of the Fund also serve in similar capacities as officers and directors of EquiTrust Series Fund, Inc. and EquiTrust Money Market Fund, Inc. All, except one, of the Fund’s officers and interested trustees are officers and directors of the Adviser and/or the Distributor or an affiliate thereof. Interested trustees serve without any compensation from the Fund. Each of the trustees not affiliated with the Adviser and/or the Distributor or an affiliate thereof will be compensated by the Fund. Each unaffiliated trustee will receive an annual retainer of $8,000 for serving on the boards of all EquiTrust Mutual Funds, and a fee of $1,500 plus expenses for each trustees’ meeting of the EquiTrust Mutual Funds attended. A fee of $1,000 shall be paid for each committee meeting attended. The chairperson of a committee shall be paid $1,250 for each committee meeting attended. A fee of $250 shall be paid for each telephonic board meeting attended. For the fiscal year ended December 31, 2006, the Fund paid trustees’ fees totaling $26,833.
APPROVAL OF THE INVESTMENT ADVISORY CONTRACT
On November 16, 2006, the Board of Trustees, including a majority of the trustees who are not parties to or “interested persons” of either party to the investment advisory contract (the “independent trustees”), approved for continuance the Investment Advisory and Management Services Agreement dated April 6, 1987, as amended August 21, 1990, May 1, 1997 and May 21, 2003 (the “Agreement”) between EquiTrust Variable Insurance Series Fund (the “Fund”) and EquiTrust Investment Management Services, Inc. (the “Adviser”).
The Board of Trustees, including a majority of the independent trustees, determined that approval of the Agreement was in the best interests of the Fund. The independent trustees were assisted by independent legal counsel in making their determination.
The Board noted that the Adviser has managed each Portfolio since its inception. The Board recognizes that a long-term relationship with a capable, conscientious investment adviser is in the best interests of shareholders and that shareholders have invested in the Portfolios knowing that the Adviser managed the Portfolios and knowing the investment advisory fee schedule.
Nature, Quality and Extent of Services. With respect to the nature, quality and extent of the services provided by the Adviser to the Portfolios, the Board considered the functions performed by the Adviser and the personnel providing such services, the Adviser’s financial condition and the compliance regime created by the Adviser, including the fact that the Fund has had no material compliance issues.
The Board also reviewed and discussed reports prepared by the Adviser containing information on each Portfolio’s total returns and average annual total returns over various periods of time as compared to relevant market indices and a peer group of funds pursuing broadly similar strategies. The Board also considered for each Portfolio, with the exception of the Money Market Portfolio, the Portfolio’s Morningstar rating. The Board concluded that as to each Portfolio, the investment performance was satisfactory, versus relevant market indices, and was generally in line with the other mutual funds included in the reports. Based on the information provided, the Board concluded that the nature and extent of services provided to each Portfolio were appropriate and that the quality was good.
Fees and Expenses. For each Portfolio, the Board compared the amounts paid to the Adviser for advisory services and each Portfolio’s expense ratio with other registered funds pursuing broadly similar strategies as included in reports prepared by the Adviser. This information showed that, with the exception of the High Grade Bond Portfolio, the advisory fee of each Portfolio was below average compared to other mutual funds pursuing broadly similar strategies. This information also showed that the expense ratio for each Portfolio was below average compared to similar mutual funds. In addition, the Board considered amounts paid to the Adviser by other EquiTrust funds. The Board received information from the Adviser regarding the Adviser’s standard advisory fee schedules for the Adviser’s other clients. With respect to the Adviser’s other clients, the Board considered that the mix of services provided and the level of responsibility required under the Agreement with the Fund were different than the Adviser’s obligations for similar client accounts and that the advisory fees of such accounts are less relevant to the Board’s consideration because they reflect different competitive forces than those in the mutual fund marketplace. With respect to other EquiTrust funds, the Board considered differences in fund and fee structures in light of the different distribution channels of the funds. Based on the information considered, the Board concluded that each Portfolio’s advisory fee was reasonable and appropriate in amount given the quality of services provided.
Profitability. With respect to the costs of services provided and profits realized by the Adviser, the Board considered the advisory fees received by the Adviser from each Portfolio, and requested and received from the Adviser information on each Portfolio’s net assets and expense ratios over a ten-year period. The Board also considered the fact that the Adviser continues to be subject to an expense reimbursement agreement and that the Adviser has kept expenses at a reasonable level. Based on this information, the Board concluded for each Portfolio that the Adviser’s profitability was not unreasonable.
43
Economies of Scale. The Board considered the extent to which economies of scale would be realized as each Portfolio grows and whether fee levels reflect economies of scale for the benefit of Portfolio shareholders. The Board reviewed each Portfolio’s net assets and expense ratios over a ten-year period. The Board noted that the High Grade Bond, Strategic Yield and Value Growth Portfolios have advisory fee breakpoints designed to share economies of scale with shareholders. The Board also considered that the current size of each Portfolio does not lend itself to economies of scale. The Board concluded with respect to each of the Portfolios, that the total expense ratios were reasonable.
Other Benefits to the Adviser and its Affiliates. The Board considered the character and amount of other incidental benefits received by the Adviser and its affiliates from their relationship with the Fund, including fees received by the Adviser for accounting services, shareholder services, dividend disbursing and transfer agent services and fees received by an affiliate of the Adviser for distribution services. The Board also considered the Adviser’s placement of trades for certain of the Fund’s portfolios with broker-dealers that provide research products and services, in addition to the execution of the securities transactions. In doing so, the Board considered the Adviser’s determination that, among other things, the level and amount of such commissions were reasonable in relation to the value and type of research and services received, including the benefit of the research to the portfolio managers in the performance of their investment decision-making responsibilities. The Board concluded that, taking into account these benefits, the Portfolios’ advisory fees were reasonable.
Based on all of the information considered and the conclusions reached, the Board determined to approve the Agreement. The Board of Trustees, including the independent trustees, did not identify any single factor or group of factors as all important or controlling and considered all factors together.
Information on Proxy Voting:
EquiTrust Variable Insurance Series Fund, Inc. (the “Fund”) has delegated the authority to vote proxies related to the Fund’s portfolio securities to the Fund’s investment adviser, EquiTrust Investment Management Services, Inc. (the “Adviser”). A description of the policies and procedures that the Adviser uses in fulfilling this responsibility is available, without charge, upon request by calling 1-877-860-2904. It also appears in the Fund’s Statement of Additional Information, which can be found on the SEC’s website at http://www.sec.gov. The Fund’s proxy voting record for the most recent 12-month period ended June 30, 2006 is available without charge, by calling the toll-free number listed above or by accessing the SEC’s website.
Form N-Q Disclosure:
The Fund files a complete schedule of portfolio holdings for its first and third quarters of each fiscal year with the SEC on Form N-Q. The Fund’s Forms N-Q are available on the SEC’s website at http://www.sec.gov or may be reviewed and copied at the SEC’s Public Reference Room in Washington, D.C. Information regarding the operation of the Public Reference Room may be obtained by calling 1-800-SEC-0330. A copy of Form N-Q is also available, without charge, by calling the Fund at 1-877-860-2904.
44
| Item 2. | Code of Ethics. |
| (a) | The registrant has adopted a code of ethics that applies to the registrant’s principal executive officer, principal financial officer, principal accounting officer or controller, or persons performing similar functions. A copy of the code of ethics may be obtained upon request, without charge, by contacting the registrant at its principal executive office. |
| Item 3. | Audit Committee Financial Expert. |
| (a) | (1) The registrant’s board of directors has determined that the registrant has at least one audit committee financial expert serving on the audit committee. |
(2) The audit committee financial expert is James D. Wallace. Mr. Wallace is independent as defined in Form N-CSR Item 3(a)(2).
| Item 4. | Principal Accountant Fees and Services. |
| (a) | Audit Fees: For the Fund’s fiscal years ended December 31, 2005 and December 31, 2006, the aggregate fees billed by the Fund’s principal accountant for the audit of the Fund’s financial statements were $54,900 and $56,200, respectively. |
| (b) | Audit-Related Fees: There were no audit-related fees billed to the Fund for the fiscal years ended December 31, 2005 and December 31, 2006. |
| (c) | Tax Fees: None. |
| (d) | All Other Fees: For the Fund’s fiscal years ended December 31, 2005 and December 31, 2006, the aggregate fees billed by the Fund’s principal accountant included fees related to the audits of EquiTrust Series Fund, Inc. and EquiTrust Money Market Fund, Inc.; as well as fees for services performed by the principal accountant for EquiTrust Investment Management Services, Inc. and EquiTrust Marketing Services, LLC, affiliates of the Fund that provide support for the operations of the Fund. The amounts of these fees are as follows: |
Fiscal Year Ended: | December 31, 2005 | December 31, 2006 | ||||
Fees related to audits of EquiTrust Series Fund, Inc. and EquiTrust Money Market Fund, Inc. and for research and consultation on miscellaneous accounting matters | $ | 75,008 | $ | 79,800 | ||
Services performed for EquiTrust Marketing Services, LLC and EquiTrust Investment Management Services, Inc. related to the audits of these entities and for research and consultation on miscellaneous accounting matters | $ | 42,700 | $ | 43,200 | ||
| (e) | (1) The Fund’s Audit Committee adopted the following pre-approval policies and procedures: |
| IV. | RESPONSIBILITIES AND DUTIES |
To fulfill its responsibilities and duties the Audit Committee shall:
…
| C. | Independent registered public accounting firm |
…
| 2. | Pre-approve any engagement of the independent registered public accounting firm to provide any services to the Fund, including the fees and other compensation to be paid to the independent registered public accounting firm. Notwithstanding the above, the independent registered public accounting firm shall not perform any of the following non-audit services for the Fund (“prohibited non-audit services”): |
| a. | bookkeeping or other services related to the accounting records or financial statements of the Fund; |
| b. | financial information systems design and implementation; |
| c. | appraisal or valuation services, fairness opinions, or contribution-in-kind reports; |
| d. | actuarial services; |
| e. | internal audit outsourcing services; |
| f. | management functions or human resources; |
| g. | broker or dealer, investment adviser, or investment banking services; |
| h. | legal services and expert services unrelated to the audit; and |
| i. | any other services that the Public Company Accounting Oversight Board determines are impermissible. |
3. | Pre-approve any engagement of the independent registered public accounting firm, including the fees and other compensation to be paid to the independent registered public accounting firm, to provide any non-audit services to the Adviser (or any “control affiliate”1 of the Adviser providing ongoing services to the Fund), if the engagement relates directly to the operations and financial reporting of the Fund. |
1 | “Control affiliate” means any entity controlling, controlled by, or under common control with the Adviser. |
| • | The Chairman of the Audit Committee (or in his absence, any member of the Audit Committee) may grant the pre-approval referenced in Sections IV.C. 2 and 3 above for non-prohibited services for engagements of less than $5000. Each member of the Audit Committee shall be notified in writing of the pre-approval promptly following the granting of such approval. In addition, all such delegated pre-approvals shall be presented to the Audit Committee no later than the next Audit Committee meeting. |
| • | Pre-approval of non-audit services for the Fund pursuant to Section IV.C. 2 above is not required, if: |
| (a) | the aggregate amount of all non-audit services provided to the Fund is less than 5% of the total fees paid by the Fund to the independent registered public accounting firm during the fiscal year in which the non-audit services are provided; |
| (b) | the services were not recognized by Fund management at the time of the engagement as non-audit services; and |
| (c) | such services are promptly brought to the attention of the Audit Committee by Fund management and the Audit Committee approves them (which may be by delegation) prior to the completion of the audit. |
| • | Pre-approval of non-audit services for the Adviser (or any affiliate of the Adviser providing ongoing services to the Fund) pursuant to Section IV.C.3 above is not required, if: |
| (a) | the aggregate amount of all non-audit services provided is less than 5% of the total fees paid by the Fund, the Adviser and any “control affiliate” of the Adviser providing ongoing services to the Fund to the independent registered public accounting firm during the fiscal year in which the non-audit services are provided; |
| (b) | the services were not recognized by Fund management at the time of the engagement as non-audit services; and |
| (c) | such services are promptly brought to the attention of the Audit Committee by Fund management and the Audit Committee approves them (which may be by delegation) prior to the completion of the audit. |
| … |
| (e) | (2) Not applicable. |
| (f) | Not applicable. |
| (g) | Aggregate Non-audit Fees: There were no non-audit fees billed for the fiscal years ended December 31, 2005 and December 31, 2006. |
| (h) | The Audit Committee of the Board of Trustees of the Fund has reviewed the statement of independence provided by Ernst & Young, the Fund’s principal accountant, considered whether the provision of non-audit services by the firm to the Fund’s investment adviser and any entity controlling, controlled by, or under common control with the adviser is compatible with such firm’s independence with respect to the Fund, and concluded that the non-audit services provided by Ernst & Young does not compromise that firm’s independence with regard to the Fund. |
| Item 5. | Audit Committee of Listed Registrant. |
Not applicable.
| Item 6. | Schedule of Investments. |
See Item 1.
| Item 7. | Disclosure of Proxy Voting Policies and Procedures for Closed-End Management Investment Companies. |
Not applicable.
| Item 8. | Portfolio Managers of Closed-End Management Investment Companies. |
Not applicable.
| Item 9. | Purchases of Equity Securities by Closed-End Management Investment Companies and Affiliated Purchasers. |
Not applicable.
| Item 10. | Submission of Matters to a Vote of Security Holders. |
There have been no material changes to the procedures by which shareholders may recommend nominees to the registrant’s board of trustees since the registrant last provided disclosure in response to this Item.
| Item 11. | Controls and Procedures |
| (a) | The registrant’s principal executive and principal financial officers, or persons performing similar functions, have concluded that the registrant’s disclosure controls and procedures (as defined in Rule 30a-3(c) under the Investment Company Act of 1940, as amended (the “1940 Act”) (17 CFR 270.30a-3(c))) are effective, as of a date within 90 days of the filing date of the report that includes the disclosure required by this paragraph, based on their evaluation of these controls and procedures required by Rule 30a-3(b) under the 1940 Act (17 CFR 270.30a-3(b)) and Rules 13a-15(b) or 15d-15(b) under the Exchange Act (17 CFR 240.13a-15(b) or 240.15d-15(b)). |
| (b) | There has been no change to the registrant’s internal control over financial reporting that occurred during the registrant’s most recent fiscal quarter that has materially affected, or is reasonably likely to materially affect, the registrant’s internal control over financial reporting. |
| Item 12. | Exhibits. |
| (a)(1) | Not applicable. See Item 2(a). |
| (a)(2) | Certifications pursuant to Section 302 of the Sarbanes-Oxley Act of 2002 are filed as exhibits hereto. |
| (a)(3) | Not applicable. |
| (b) | Certifications pursuant to Section 906 of the Sarbanes-Oxley Act of 2002 are filed as exhibits hereto. |
SIGNATURES
Pursuant to the requirements of the Securities Exchange Act of 1934 and the Investment Company Act of 1940, the registrant has duly caused this report to be signed on its behalf by the undersigned, thereunto duly authorized.
(Registrant) EquiTrust Variable Insurance Series Fund
| By: | /s/ Dennis M. Marker | |||
| Name: | Dennis M. Marker | |||
| Title: | Chief Executive Officer | |||
| Date: | 2/19/07 | |||
Pursuant to the requirements of the Securities Exchange Act of 1934 and the Investment Company Act of 1940, this report has been signed below by the following persons on behalf of the registrant and in the capacities and on the dates indicated.
| By: | /s/ Dennis M. Marker | |||
| Name: | Dennis M. Marker | |||
| Title: | Chief Executive Officer | |||
| Date: | 2/19/07 | |||
| By: | /s/ James P. Brannen | |||
| Name: | James P. Brannen | |||
| Title: | Chief Financial Officer | |||
| Date: | 2/19/07 | |||