SECURITIES AND EXCHANGE COMMISSION
WASHINGTON, DC 20549
FORM N-CSR
CERTIFIED SHAREHOLDER REPORT OF REGISTERED
MANAGEMENT INVESTMENT COMPANIES
Investment Company Act file number: 811-05071 or 33-13247
SATURNA INVESTMENT TRUST
(Exact Name of Registrant as Specified in Charter)
1300 N. State Street
Bellingham, Washington 98225-4730
(Address of Principal Executive Offices, including ZIP Code)
Nicole Trudeau
1300 N. State Street
Bellingham, Washington 98225-4730
(Name and Address of Agent for Service)
Registrant's Telephone Number – (360) 734-9900
Date of fiscal year end: November 30, 2019
Date of reporting period: November 30, 2019
Item 1. Annual Report.
| Performance Summary(as of December 31, 2019) | (unaudited) |
| Expense Ratio1 | ||||||||||||||||||||||||||||
Average Annual Total Returns | 1 Year | 3 Year | 5 Year | 10 Year | 15 Year | Gross | Net | |||||||||||||||||||||
Sextant Short-Term Bond Fund(STBFX) | 4.01% | 1.85% | 1.62% | 1.54% | 2.30% | 0.91% | 0.60% | |||||||||||||||||||||
FTSE USBIG Govt/Corp1-3 Year Index | 4.00% | 2.11% | 1.64% | 1.50% | 2.44% | n/a | ||||||||||||||||||||||
Sextant Bond Income Fund(SBIFX) | 10.22% | 4.64% | 3.24% | 4.20% | 4.00% | 0.84% | 0.65% | |||||||||||||||||||||
FTSE US Broad Investment-Grade Bond Index | 8.86% | 4.08% | 3.08% | 3.73% | 4.22% | n/a | ||||||||||||||||||||||
Sextant Core Fund(SCORX) | 19.99% | 9.46% | 5.52% | 6.11% | n/a | 0.88% | ||||||||||||||||||||||
Dow Jones Moderate US Portfolio Index | 18.60% | 8.98% | 6.60% | 7.75% | 6.43% | n/a | ||||||||||||||||||||||
Sextant Global High Income Fund(SGHIX) | 11.47% | 8.32% | 5.74% | n/a | n/a | 0.97% | 0.75% | |||||||||||||||||||||
S&P Global 1200 Index | 28.22% | 13.39% | 9.50% | 9.99% | 7.63% | n/a | ||||||||||||||||||||||
Sextant Growth Fund Investor Shares(SSGFX) | 36.38% | 18.78% | 10.29% | 11.68% | 8.81% | 0.92% | ||||||||||||||||||||||
Sextant Growth Fund Z Shares(SGZFX) | 36.77% | n/a | n/a | n/a | n/a | 0.70% | ||||||||||||||||||||||
S&P 500 Index | 31.49% | 15.26% | 11.69% | 13.55% | 8.99% | n/a | ||||||||||||||||||||||
Sextant International Fund Investor Shares(SSIFX) | 26.85% | 15.20% | 9.00% | 5.83% | 6.69% | �� | 1.05% | |||||||||||||||||||||
Sextant International Fund Z Shares(SIFZX) | 27.19% | n/a | n/a | n/a | n/a | 0.84% | ||||||||||||||||||||||
MSCI EAFE Index | 22.66% | 10.10% | 6.18% | 5.99% | 5.33% | n/a | ||||||||||||||||||||||
Performance data quoted above represents past performance, is before any taxes payable by shareowners, and is no guarantee of future results. Current performance may be higher or lower than that stated herein. Performance current to the most recentmonth-end is available by calling toll-free1-800-728-8762 or visiting www.sextantfunds.com. Average annual total returns are historical and include change in share value as well as reinvestment of dividends and capital gains, if any. The investment return and principal value of an investment will fluctuate so that an investor’s shares, when redeemed, may be worth more or less than their original cost. Funds that invest in foreign securities may involve greater risk, including political and economic uncertainties of foreign countries as well as the risk of currency fluctuations.
Z Shares of Sextant Growth and International Funds began operations June 2, 2017.
A note about risk: Please see Notes to Financial Statements beginning on page 54 for a discussion of investment risks. For a more detailed discussion of the risks associated with each Fund, please see the Funds’ prospectus or each Fund’s summary prospectus.
A Fund’s30-Day Yield, sometimes referred to as “standardized yield” or “SEC yield,” is expressed as an annual percentage rate using a method of calculation adopted by the Securities and Exchange Commission (SEC). The30-Day Yield provides an estimate of a Fund’s investment income rate, but may not equal the actual income distribution rate.
| 1 | By regulation, expense ratios shown in this table are as stated in the Funds’ most recent prospectus, which is dated March 27, 2019, and incorporate results for the fiscal year ended November 30, 2018. Ratios presented in this table differ from the expense ratios shown elsewhere in this report as they represent different periods. Also by regulation, the performance in this table represents the most recentquarter-end performance rather than performance through the Funds’ most recent fiscal period. |
The S&P 500 Index is an index comprised of 500 widely held common stocks considered to be representative of the US stock market in general. The MSCI EAFE Index is an international index focused on Europe, Australasia, and the Far East. The S&P Global 1200 Index is a global stock market index covering nearly 70% of the world’s equity markets. The Dow Jones Moderate Portfolio Index is a broad-based index of stock and bond prices. The FTSE USBIG Govt/Corp Index1-3 Year is a broad-based index of shorter-term investment grade US government and corporate bond prices. The FTSE US Broad Investment-Grade Bond Index is a broad-based index of medium and long-term investment grade bond prices. Investors cannot invest directly in the indices.
Please consider an investment’s objectives, risks, charges, and expenses carefully before investing. To obtain this and other important information about the Sextant Funds in a prospectus or summary prospectus, ask your financial advisor, visit www.sextantfunds.com, or call toll-free1-800-728-8762. Please read the prospectus or summary prospectus carefully before investing.
| 2 | November 30, 2019 | Annual Report | ||||
Fellow Shareowners: | January 24, 2020 |
Following a mixed performance in 2018, US equity markets posted substantial returns for the year ended November 30, 2019. The S&P 500 Index rose 16.11%, while the Dow Jones Moderate US Portfolio Index gained 11.53%. Foreign markets were also positive, with the MSCI EAFE Index returning 13.04% and the S&P Global 1200 Index climbing 14.97%. Fixed-income markets were more subdued but still well into positive territory, with the FTSE USBIG Bond Index gaining 8.55% and the shorter-term FTSE USBIG Government/Corporate1-3 Year Index gaining 4.53%.
The Sextant Funds performed respectably compared to these indices, with most funds outperforming their respective benchmarks. For the year ended November 30, 2019, Sextant Growth Fund Investor Shares gained 21.81%, Sextant International Fund Investor Shares gained 18.82%, Sextant Core Fund gained 13.04%, Sextant Global High Income Fund gained 7.06%, Sextant Bond Income Fund gained 12.45%, and Sextant Short-Term Bond Fund gained 4.64%.
The annualized expense ratios of the sixno-12b-1 fee Sextant Fund share classes range from 0.55% to 0.90%. Saturna Capital helped by capping expenses for the Sextant Short-Term, Sextant Bond Income, and Sextant Global High Income Funds. Overall assets were up 34.36% to $194.16 million.
Morningstar Awards Sextant Top Sustainability Ratings
The Morningstar Sustainability Rating™ for funds gives investors around the world a way to compare fund portfolios based on a standardized measure of sustainability. These ratings are calculated using fund holdings data underpinned with company-level environmental, social, and governance (ESG) information from Sustainalytics, a leading provider of ESG research. Of the four Sextant funds Morningstar rated, one received the top “5 Globe” Sustainability Rating and two received a “4 Globe” above average rating, reflecting Saturna Capital’s emphasis on sustainability when making portfolio investment decisions. Investors are cautioned, however, that more than 200 vendors offer “sustainable” investments data, and that no single global measurement prevails. See page 5 for the details.

Going Forward
2019 was a great year for equity markets, with the S&P 500 Index returning 31.49% through December 31, 2019 – the best annual profit since 2013. At Saturna, we’re not forecasting 2020 to generate the outsized gains seen in 2019. Still, we enter the new decade optimistically.
It’s rare for the market to experience downturns or big profits following a year when returns exceed 25%. Since 1927, the S&P 500 experienced downturns in only 8% of the years following a year with returns in excess of 25%. Over this same period, only three years saw repeated returns greater than 25%. While statistics may support our forecast, we note “past returns may not indicate future performance.” Why then do we believe 2020 will follow a similar course of decent returns? Four reasons: the four-year US presidential election cycle, calming global trade tensions, a reduction of Brexit’s uncertainties, and accommodative yet stretched global monetary policies. The economy continues in a “goldilocks” state: low unemployment, low inflation, low interest rates, and lower taxes.
After minimal debate, both parties in the US Congress agreed to bigger spending and deficits, and the economy is roaring. Presidential election politicking gets our juices flowing from all sides of the spectrum. Then, as the country moves from primaries to the general election, an incumbent’s narrative always pulls the opposition toward the middle.
Also awaiting the election returns, theUS-China trade war should see reduced agitations. As President Trump looks to claim victory and President Xi takes advantage of US election related pressures, the two sides were compelled to sign an agreement. The truce calls for China to increase imports of US farm goods and the US to decrease tariffs on Chinese products.
Brexit will also have continued impact through 2020. The UK leaving the European Union on January 31, 2020, will not mark the end of the process. As the UK “gets Brexit done” this month, we should notice bounces in their economy. However, details of the trade agreement, and uncertainty related to it, will likely produce volatility in 2020 as the December deadline approaches.
2019 marked a year of renewed expansionary monetary policy as fears of recession sprouted across the globe. These fears led the Federal Reserve to cut interest rates while
| Annual Report | November 30, 2019 | 3 | ||||
central banks elsewhere amassed record levels of negative yielding debt during the summer of 2019. In turn, low to negative interest rates injected fuel into equities, igniting the record bull market. Although the amount of negative yielding debt has since been cut, central banks are operating with less dry powder to reignite the economy should fear of recession renew. We expect that in 2020 central banks will play the part of observer as they balance the need to keep tools on hand for an economic downturn with the want to see 2019’s stimulus work its way through the financial system.
Going forward, the Sextant Funds continue to offer investors a broad mix of investment vehicles: growth equities, international exposure, and a blended portfolio, plus global high income, short-term, and long-term fixed income options. This array of portfolios serves our investors in both bull and bear markets by seeking to provide steady, long-term growth with a focus on preservation of capital. Please review the following pages for morein-depth information about each Fund.
Respectfully,
(photo omitted)
Jane Carten,
President
(photo omitted)
Gary Goldfogel,
Independent Board Chairman
| Sextant Funds Portfolio Management | ||||||||||
| (photo omitted) | Nicholas Kaiser MBA, CFA®
Sextant International Fund Portfolio Manager | (photo omitted) | Phelps McIlvaine
Sextant Short-Term Bond Fund Sextant Bond Income Fund Sextant Core Fund Portfolio Manager | |||||||
| (photo omitted) | Scott Klimo CFA®
Sextant Growth Fund Portfolio Manager Sextant International Fund Deputy Portfolio Manager | (photo omitted) | Bryce Fegley CFA®, CIPM®
Sextant Global High Income Fund Portfolio Manager | |||||||
| (photo omitted) | Patrick Drum MBA, CFA®, CFP®
Sextant Short-Term Bond Fund Sextant Bond Income Fund Sextant Global High Income Fund Deputy Portfolio Manager | (photo omitted) | Christopher Paul MBA, CFA®
Sextant Core Fund Portfolio Manager | |||||||
| 4 | November 30, 2019 | Annual Report | ||||
| Morningstar Sustainability Ratings™ | (unaudited) | As of November 30, 2019 |
At Saturna Capital, we describe ourselves as value and values-based investors. We believe our approach improves the likelihood of achieving superior investment results over the long term. Our approach also leads to investment portfolios we can be proud of from the perspective of Environmental, Social, and Governance (ESG) issues. Morningstar recently partnered with leading ESG research firm Sustainalytics to develop the Morningstar Sustainability Rating™ – here are Sextant Funds’ recent results:
Sextant International Fund | Sextant Core Fund | |||||||
Investor Shares (SSIFX) | Ø Ø Ø Ø Ø | SCORX | Ø Ø Ø Ø Ø | |||||
Z Shares (SIFZX) | Ø Ø Ø Ø Ø | |||||||
| 7th percentile among 395 Foreign Large Blend Funds | 16th percentile among 643 Allocation50%-70% Equity Funds | |||||||
Sextant Growth Fund | Sextant Global High Income Fund | |||||||
Investor Shares (SSGFX) | Ø Ø Ø Ø Ø | SGHIX | Ø Ø Ø Ø Ø | |||||
Z Shares (SGZFX) | Ø Ø Ø Ø Ø | 67th percentile among 378 World Allocation Funds | ||||||
| 27th percentile among 1,223 Large Growth Funds | ||||||||
The Sextant Bond Income and Sextant Short-Term Bond Funds were not rated by Morningstar for the period. | ||||||||
The Morningstar Sustainability Rating™ gives investors across the globe a way to compare fund portfolios based on a standard measure of sustainability. The rating is a holdings-based calculation using company-level environmental, social, and governance (ESG) analytics from Sustainalytics. | ||||||||
The Morningstar Sustainability Rating and the Morningstar Portfolio Sustainability Score are not based on fund performance and are not equivalent to the Morningstar Rating (“Star Rating”).
© 2020 Morningstar®.All rights reserved. Morningstar, Inc. is an independent fund performance monitor. The information contained herein: (1) is proprietary to Morningstar and/or its content providers; (2) may not be copied or distributed; and (3) is not warranted to be accurate, complete, or timely. Neither Morningstar nor its content providers are responsible for any damages or losses arising from any use of this information.
Morningstar Sustainability Ratings and Portfolio Sustainability Scores are as of November 30, 2019. The Morningstar Sustainability Rating™ is intended to measure how well the issuing companies of the securities within a fund’s portfolio are managing their environmental, social, and governance (“ESG”) risks and opportunities relative to the fund’s Morningstar category peers. The Morningstar Sustainability Rating calculation is atwo-step process. First, each fund with at least 50% of assets covered by a company-level ESG score from Sustainalytics receives a Morningstar Portfolio Sustainability Score™. The Morningstar Portfolio Sustainability Score is an asset-weighted average of normalized company-level ESG scores with deductions made for controversial incidents by the issuing companies, such as environmental accidents, fraud, or discriminatory behavior. The Morningstar Sustainability Rating is then assigned to all scored funds within Morningstar Categories in which at least ten (10) funds receive a Portfolio Sustainability Score and is determined by each fund’s rank within the following distribution: High (highest 10%), Above Average (next 22.5%), Average (next 35%), Below Average (next 22.5%), and Low (lowest 10%). The Morningstar Sustainability Rating is depicted by globe icons where High equals 5 globes and Low equals 1 globe. A Sustainability Rating is assigned to any fund that has more than half of its underlying assets rated by Sustainalytics and is within a Morningstar Category with at least 10 scored funds; therefore, the rating it is not limited to funds with explicit sustainable or responsible investment mandates. Morningstar updates its Sustainability Ratings monthly. Portfolios receive a Morningstar Portfolio Sustainability Score and Sustainability Rating one month and six business days after their reportedas-of date based on the most recent portfolio. As part of the evaluation process, Morningstar uses Sustainalytics’ ESG scores from the same month as the portfolioas-of date.
The Funds were rated on the following percentages of Assets Under Management:
| Sextant International Fund | 100% | |||
| Sextant Core Fund | 83% | |||
| Sextant Growth Fund | 100% | |||
| Sextant Global High Income Fund | 71% |
The Funds’ portfolios are actively managed and are subject to change, which may result in different Morningstar Sustainability Scores and Ratings.
% Rank in Category is the fund’s percentile rank for the specified time period relative to all funds that have the same Morningstar category. The highest (or most favorable) percentile rank is 1 and the lowest (or least favorable) percentile rank is 100. Thetop-performing fund in a category will always receive a rank of 1. Percentile ranks within categories are most useful in those categories that have a large number of funds.
| Annual Report | November 30, 2019 | 5 | ||||
| Performance Summary(as of November 30, 2019) | (unaudited) |
| Expense Ratio1 | ||||||||||||||||||||||||||||
Average Annual Total Returns | 1 Year | 3 Year | 5 Year | 10 Year | 15 Year | Gross | Net | |||||||||||||||||||||
Sextant Short-Term Bond Fund(STBFX) | 4.64% | 1.90% | 1.48% | 1.43% | 2.29% | 0.91% | 0.60% | |||||||||||||||||||||
FTSE USBIG Govt/Corp1-3 Year Index | 4.53% | 2.06% | 1.54% | 1.42% | 2.44% | n/a | ||||||||||||||||||||||
Sextant Bond Income Fund(SBIFX) | 12.45% | 4.90% | 3.41% | 4.04% | 4.10% | 0.84% | 0.65% | |||||||||||||||||||||
FTSE US Broad Investment-Grade Bond Index | 10.97% | 4.16% | 3.11% | 3.56% | 4.30% | n/a | ||||||||||||||||||||||
Sextant Core Fund(SCORX) | 13.04% | 9.25% | 4.88% | 6.04% | n/a | 0.88% | ||||||||||||||||||||||
Dow Jones Moderate US Portfolio Index | 11.53% | 8.55% | 6.04% | 7.66% | 6.49% | n/a | ||||||||||||||||||||||
Sextant Global High Income Fund(SGHIX) | 7.06% | 8.00% | 5.02% | n/a | n/a | 0.97% | 0.75% | |||||||||||||||||||||
S&P Global 1200 Index | 14.97% | 13.04% | 8.40% | 9.82% | 7.65% | n/a | ||||||||||||||||||||||
Sextant Growth Fund Investor Shares(SSGFX) | 21.81% | 17.99% | 9.52% | 11.81% | 8.86% | 0.92% | ||||||||||||||||||||||
Sextant Growth Fund Z Shares(SGZFX) | 22.22% | n/a | n/a | n/a | n/a | 0.70% | ||||||||||||||||||||||
S&P 500 Index | 16.11% | 14.90% | 10.97% | 13.44% | 9.02% | n/a | ||||||||||||||||||||||
Sextant International Fund Investor Shares(SSIFX) | 18.82% | 15.23% | 7.74% | 5.77% | 6.93% | 1.05% | ||||||||||||||||||||||
Sextant International Fund Z Shares(SIFZX) | 19.14% | n/a | n/a | n/a | n/a | 0.84% | ||||||||||||||||||||||
MSCI EAFE Index | 13.04% | 10.18% | 4.76% | 5.81% | 5.41% | n/a | ||||||||||||||||||||||
Performance data quoted above represents past performance, is before any taxes payable by shareowners, and is no guarantee of future results. Current performance may be higher or lower than that stated herein. Performance current to the most recentmonth-end is available by calling toll-free1-800-728-8762 or visiting www.sextantfunds.com. Average annual total returns are historical and include change in share value as well as reinvestment of dividends and capital gains, if any. The investment return and principal value of an investment will fluctuate so that an investor’s shares, when redeemed, may be worth more or less than their original cost. Funds that invest in foreign securities may involve greater risk, including political and economic uncertainties of foreign countries as well as the risk of currency fluctuations.
| 1 | By regulation, expense ratios shown in this table are as stated in the Funds’ most recent prospectus, which is dated March 27, 2019, and incorporate results for the fiscal year ended November 30, 2018. Ratios presented in this table differ from the expense ratios shown elsewhere in this report as they represent different periods. |
| 6 | November 30, 2019 | Annual Report | ||||
Sextant Short-Term Bond Fund
Performance Summary | (unaudited) |
Average Annual Total Returns as of November 30, 2019 |
| |||||||||||||||
| 1 Year | 5 Year | 10 Year | Expense Ratio1 | |||||||||||||
Sextant Short-Term Bond Fund | 4.64% | 1.48% | 1.43% | 0.91% | ||||||||||||
FTSE USBIG Govt/Corp1-3 Year Index | 4.53% | 1.54% | 1.42% | n/a | ||||||||||||
Growth of $10,000
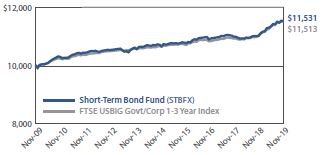 | Comparison of any mutual fund to a market index must be made bearing in mind that the index is expense-free. Conversely, the fund will (1) be actively managed; (2) have an objective other than mirroring the index, such as limiting risk; (3) bear transaction and other costs; (4) stand ready to buy and sell its securities to shareowners on a daily basis; and (5) provide a wide range of services. The graph compares $10,000 invested in the Fund on November 30, 2009, to an identical amount invested in the FTSE USBIG Govt/Corp1-3 Year Index, a broad-based index of shorter-term investment grade US government and corporate bond prices. The graph shows that an investment in the Fund would have risen to $11,531 versus $11,513 in the index. |
Past performance does not guarantee future results.The “Growth of $10,000” graph and “Average Annual Returns” performance table assume the reinvestment of dividends and capital gains. They do not reflect the deduction of taxes that a shareowner might pay on fund distributions or the redemption of fund shares.
| 1 | By regulation, the expense ratio shown in this table is as stated in the Fund’s most recent prospectus which is dated March 27, 2019, and incorporates results for the fiscal year ended November 30, 2018, before fee waivers. The actual expense ratio, shown in the most recent prospectus after fee waivers was 0.60%. The ratio presented in this table differs from expense ratios shown elsewhere in this report as they represent different periods. |
Fund Objective
The objectives of the Short-Term Bond Fund are capital preservation and current income.
Top 10 Holdings |
| |||
| % of Total Net Assets | ||||
United States Treasury Note(3.625% due 02/15/2021) | 8.3% | |||
United States Treasury Note(2.875% due 04/30/2025) | 7.2% | |||
United States Treasury Note(2.50% due 08/15/2023) | 4.7% | |||
McCormick & Co.(2.70% due 08/15/2022) | 4.6% | |||
Honeywell International(4.25% due 03/01/2021) | 4.2% | |||
Loews(2.625% due 05/15/ 2023) | 4.1% | |||
Burlington Northern Santa Fe(3.05% due 09/01/2022) | 3.7% | |||
AvalonBay Communities(2.85% due 03/15/2023) | 3.7% | |||
Qualcomm(2.60% due 01/30/2023) | 3.7% | |||
Gilead Sciences(2.55% due 09/01/2020) | 3.6% | |||
Portfolio Diversification |
| |||||||||||
| % of Total Net Assets |
| |||||||||||
Government Bonds | 23.4% | ∎ | 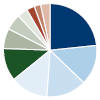 | |||||||||
Financials | 14.1% | ∎ | ||||||||||
Consumer Staples | 13.8% | ∎ | ||||||||||
Health Care | 13.1% | ∎ | ||||||||||
Technology | 11.3% | ∎ | ||||||||||
Industrials | 6.9% | ∎ | ||||||||||
Consumer Discretionary | 5.5% | ∎ | ||||||||||
Materials | 3.6% | ∎ | ||||||||||
Energy | 2.9% | ∎ | ||||||||||
Utilities | 2.3% | ∎ | ||||||||||
Other assets (net of liabilities) | 3.1% | ∎ | ||||||||||
| Annual Report | November 30, 2019 | 7 | ||||
Sextant Short-Term Bond Fund
Discussion of Fund Performance | (unaudited) |
(photo omitted)
Fiscal Year 2019
For the fiscal year ended November 30, 2019, the Sextant Short-Term Bond Fund returned 4.64%, which was lower than the 4.87% average return of its Morningstar Short-Term Bond category peer group. For the five years ended November 30, the Fund provided a 1.48% annualized total return versus 1.86% for its Morningstar category peer group. During the year, the Fund’s share price grew from $4.94 to $5.08. The ratio of net investment income (after fee waivers) to net assets rose from 1.44% to 1.75%. Fund shares outstanding rose 2.53, and Fund assets rose 7.91%. The Fund’s 30-day yield was 1.33%, and its unsubsidized 30-day yield was 0.82%. Reflecting Saturna Capital’s subsidies to cap operating expenses, the Fund’s effective expense ratio was reduced to 0.60% from 0.87%.
Factors Affecting Past Performance
2019 began with the US Federal Reserve Bank policy at an inflection point. Good US economic growth and low US unemployment justified policy normalization, meaning shrinking the Fed’s balance sheet (quantitative tightening) and moving the Federal Funds rates higher. However, softening global growth, trade tensions, a flat yield curve, a strong US dollar, and faltering financial asset prices required the opposite policy response. By November 2019, US policy makers had reversed rate normalization, setting Federal Funds at 1.50%, below their level in June 2018. Quantitative tightening was halted. The policy dichotomy between US economic strength and global economic weakness was resolved with global concerns and the urgent need for greater US dollar liquidity prevailing.
This rapid policy reversal triggered a “risk on” response in financial markets. The Fed succeeded in steepening the US Treasury yield curve, discounting a flat curve’s recession signal. Reinvigorated investors poured money into financial assets, and especially income producing assets such as high-yield bonds. Reinvestment risk suddenlyre-emerged at the most urgent of investment objectives. Corporate bond spreads narrowed significantly, returning to previous lows in 1998, 2003, and 2018. High-yield spreads narrowed significantly more than investment grade spreads. US30-yr bond yields established a new low, eclipsing the previous low in 2016.
More recently, the US Federal Reserve expanded short-term liquidity funding to address funding shortfalls in the US repo market. An unusual structural balance of payments deficit caused by record US government deficit spending, restrictive banking regulations, and weak foreign demand for US Treasury paper combined to create the funding deficit.
In echoes of 2008, the European Central Bank, Japan, and Britain also amplified their own monetary easing policies. With interest rates falling and corporate bond spreads narrowing simultaneously, bond markets produced exceptional returns.
Looking Forward
US economic growth and inflation will likely remain relatively benign, while progress on Brexit and the US China trade negotiations will relax some anxieties. New monetary and fiscal stimulus from the US, Britain, Japan, and others will be deployed to fund debt burdens, fiscal deficits, as well as boost economic growth and inflation. In the last decade, monetary and fiscal stimulus policies initially pushed bond yields higher. However, these reflation policies have a mixed record of producing lasting results. Once these policies run their course, inflation and bond yields may very well fall again, boosting bond prices. Despite these reflation initiatives, negative nominal and real rates will not disappear. Reinvestment risk will remain the most urgent concern for bond investors over the medium to long term. Easing US Federal Reserve monetary policy will remain the first line of defense against global economic weakness. Short rates will remain low.
With yields only slightly higher than recent lows, credit spreads offering historically little additional compensation, and real yields near zero, it is tempting to discount the appeal of bonds in 2020. But bonds still offer another exceptional quality: diversification. As an asset class, short-term bonds demonstrated excellent negative correlation to common stocks on days when stock prices fell during 2019. Higher yields in the next few quarters represent a buying opportunity.
For yield starved investors looking for a relatively calm mooring, short-term bonds may offer the comfort of low correlation that leads to better decision making when many asset classes offer persistently high valuations and low potential returns.
Management Fee Calculations
The Sextant Short-Term Bond Fund calculates the performance part of its management fee by comparing the Fund’s return to the average return of Morningstar’s™ Short-Term Bond category. The Fund’s12-month return of 4.64% was less than 1% percent below the Morningstar™ category average of 4.87% atmonth-end November 30, 2019. Therefore, the basic annual management fee of 0.50% remained unchanged for the month of December 2019. Note that the management fee is partially waived due to the adviser’s cap on total Fund expenses.
| 8 | November 30, 2019 | Annual Report | ||||
Sextant Short-Term Bond Fund
| Schedule of Investments | As of November 30, 2019 | |||||||||||||||||
| Corporate Bonds – 73.5% | Coupon / Maturity | Face Amount | Market Value | Percentage of Assets | ||||||||||||||
| Consumer Discretionary | ||||||||||||||||||
Alibaba Holding Group | 3.125% due 11/28/2021 | $350,000 | $356,710 | 3.2% | ||||||||||||||
Ford Motor Credit | 3.157% due 08/04/2020 | 250,000 | 250,928 | 2.3% | ||||||||||||||
| 607,638 | 5.5% | |||||||||||||||||
| Consumer Staples | ||||||||||||||||||
Church & Dwight | 2.875% due 10/01/2022 | 260,000 | 265,001 | 2.4% | ||||||||||||||
Costco Wholesale | 2.75% due 05/18/2024 | 385,000 | 397,558 | 3.6% | ||||||||||||||
Estee Lauder | 2.35% due 08/15/2022 | 350,000 | 353,594 | 3.2% | ||||||||||||||
McCormick & Co. | 2.70% due 08/15/2022 | 500,000 | 507,714 | 4.6% | ||||||||||||||
| 1,523,867 | 13.8% | |||||||||||||||||
| Energy | ||||||||||||||||||
Schlumberger Investment | 3.65% due 12/01/2023 | 310,000 | 326,135 | 2.9% | ||||||||||||||
| 326,135 | 2.9% | |||||||||||||||||
| Financials | ||||||||||||||||||
AvalonBay Communities | 2.85% due 03/15/2023 | 400,000 | 409,468 | 3.7% | ||||||||||||||
Loews | 2.625% due 05/15/2023 | 450,000 | 458,250 | 4.1% | ||||||||||||||
Paccar Financial | 2.05% due 11/13/2020 | 350,000 | 350,581 | 3.2% | ||||||||||||||
Simon Property Group | 2.00% due 09/13/2024 | 350,000 | 348,051 | 3.1% | ||||||||||||||
| 1,566,350 | 14.1% | |||||||||||||||||
| Health Care | ||||||||||||||||||
AbbVie | 2.50% due 05/14/2020 | 250,000 | 250,414 | 2.3% | ||||||||||||||
Astrazeneca | 2.375% due 01/16/2020 | 155,000 | 155,597 | 1.4% | ||||||||||||||
Celgene | 2.25% due 08/15/2021 | 300,000 | 301,531 | 2.7% | ||||||||||||||
Gilead Sciences | 2.55% due 09/01/2020 | 400,000 | 401,832 | �� | 3.6% | |||||||||||||
Teva Pharmaceutical | 3.65% due 11/10/2021 | 350,000 | 342,846 | 3.1% | ||||||||||||||
| 1,452,220 | 13.1% | |||||||||||||||||
| Industrials | ||||||||||||||||||
Burlington Northern Santa Fe | 3.05% due 09/01/2022 | 400,000 | 410,961 | 3.7% | ||||||||||||||
CSX Corporation | 4.25% due 06/01/2021 | 350,000 | 359,392 | 3.2% | ||||||||||||||
| 770,353 | 6.9% | |||||||||||||||||
| Materials | ||||||||||||||||||
3M | 2.00% due 06/26/2022 | 400,000 | 401,719 | 3.6% | ||||||||||||||
| 401,719 | 3.6% | |||||||||||||||||
| Technology | ||||||||||||||||||
Adobe Systems | 4.75% due 02/01/2020 | 379,000 | 380,759 | 3.4% | ||||||||||||||
Continued on next page.
| The accompanying notes are an integral part of these financial statements. | Annual Report | November 30, 2019 | 9 | |||||
Sextant Short-Term Bond Fund
| Schedule of Investments | As of November 30, 2019 | |||||||||||||||||
| Corporate Bonds – 73.5% | Coupon / Maturity | Face Amount | Market Value | Percentage of Assets | ||||||||||||||
| Technology(continued) | ||||||||||||||||||
Honeywell International | 4.25% due 03/01/2021 | $450,000 | $463,459 | 4.2% | ||||||||||||||
Qualcomm | 2.60% due 01/30/2023 | 400,000 | 406,126 | 3.7% | ||||||||||||||
| 1,250,344 | 11.3% | |||||||||||||||||
| Utilities | ||||||||||||||||||
PacifiCorp | 2.95% due 06/01/2023 | 250,000 | 256,930 | 2.3% | ||||||||||||||
| 256,930 | 2.3% | |||||||||||||||||
| Total Corporate Bonds | $8,155,556 | 73.5% | ||||||||||||||||
| Government Bonds – 23.4% | Coupon / Maturity | Face Amount | Market Value | Percentage of Assets | ||||||||||||||
| United States Treasury Notes | ||||||||||||||||||
United States Treasury Note | 2.625% due 05/15/2021 | $355,000 | $359,771 | 3.2% | ||||||||||||||
United States Treasury Note | 3.625% due 02/15/2021 | 900,000 | 920,461 | 8.3% | ||||||||||||||
United States Treasury Note | 2.50% due 08/15/2023 | 500,000 | 515,801 | 4.7% | ||||||||||||||
United States Treasury Note | 2.875% due 04/30/2025 | 750,000 | 796,699 | 7.2% | ||||||||||||||
| 2,592,732 | 23.4% | |||||||||||||||||
| Total Government Bonds | 2,592,732 | 23.4% | ||||||||||||||||
| Total investments | (Cost is $10,648,234) | 10,748,288 | 96.9% | |||||||||||||||
| Other assets (net of liabilities) | 340,601 | 3.1% | ||||||||||||||||
| Total net assets | $11,088,889 | 100.0% | ||||||||||||||||
Bond Quality Diversification | (unaudited) | |||||||||||
| % of Total Net Assets |
| |||||||||||
Rated “AAA” | 23.4% | ∎ |  | |||||||||
Rated“AA-” | 3.6% | ∎ | ||||||||||
Rated “A+” | 15.2% | ∎ | ||||||||||
Rated “A” | 14.2% | ∎ | ||||||||||
Rated“A-” | 22.3% | ∎ | ||||||||||
Rated “BBB+” | 3.2% | ∎ | ||||||||||
Rated “BBB” | 9.6% | ∎ | ||||||||||
Rated “BB+” | 2.3% | ∎ | ||||||||||
Rated “BB” | 3.1% | ∎ | ||||||||||
Other assets (net of liabilities) | 3.1% | ∎ | ||||||||||
| Credit ratings are the lesser of S&P Global Ratings or Moody’s Investors Service. If neither S&P nor Moody’s rate a particular security, that security is categorized as not rated (except for US Treasury securities and securities issued or backed by US agencies which inherit the credit rating for the US government). Ratings range from AAA (highest) to D (lowest). Bonds rated BBB or above are considered investment grade. Credit ratings BB and below are lower-rated securities (junk bonds). Ratings apply to the creditworthiness of the issuers of the underlying securities and not the Fund or its shares. Ratings may be subject to change. |
| |||||||||||
| 10 | November 30, 2019 | Annual Report | The accompanying notes are an integral part of these financial statements. | |||||
Sextant Short-Term Bond Fund
Statement of Assets and Liabilities
| As of November 30, 2019 |
| |||
Assets | ||||
Investments in securities, at value (Cost $10,648,234) | $10,748,288 | |||
Cash | 266,182 | |||
Dividends and interest receivable | 74,625 | |||
Other assets | 6,247 | |||
Receivable for Fund shares sold | 1,859 | |||
Receivable from adviser | 44 | |||
Total assets | 11,097,245 | |||
Liabilities | ||||
Accrued retirement plan custody fee | 3,138 | |||
Accrued audit expenses | 3,000 | |||
Accrued insurance expenses | 685 | |||
Accrued legal expenses | 510 | |||
Accrued trustee expenses | 362 | |||
Accrued Chief Compliance Officer expenses | 334 | |||
Accrued other expenses | 279 | |||
Distributions payable | 48 | |||
Total liabilities | 8,356 | |||
Net Assets | $11,088,889 | |||
Analysis of net assets | ||||
Paid-in capital (unlimited shares authorized, without par value) | $10,995,696 | |||
Total distributable earnings | 93,193 | |||
Net assets applicable to Fund shares outstanding | $11,088,889 | |||
Fund shares outstanding | 2,181,911 | |||
Net asset value, offering, and redemption price per share | $5.08 | |||
Statement of Operations
| Year ended November 30, 2019 |
| |||
| ||||
Investment income | ||||
Interest income | $252,039 | |||
Miscellaneous income | 269 | |||
Total investment income | 252,308 | |||
Expenses | ||||
Investment adviser fees | 53,500 | |||
Filing and registration fees | 18,335 | |||
Audit fees | 6,307 | |||
Retirement plan custodial fees | 3,477 | |||
Legal fees | 2,659 | |||
Trustee fees | 2,608 | |||
Chief Compliance Officer expenses | 2,591 | |||
Printing and posting fees | 1,933 | |||
Other expenses | 1,492 | |||
Custodian fees | 432 | |||
Total gross expenses | 93,334 | |||
Less adviser fees waived | (28,421 | ) | ||
Less custodian fee credits | (407 | ) | ||
Net expenses | 64,506 | |||
Net investment income | $187,802 | |||
| ||||
Net realized gain from investments | $6,528 | |||
Net increase in unrealized appreciation on investments | 299,329 | |||
Net gain on investments | $305,857 | |||
Net increase in net assets resulting from operations | $493,659 | |||
| The accompanying notes are an integral part of these financial statements. | Annual Report | November 30, 2019 | 11 | |||||
Sextant Short-Term Bond Fund
Statements of Changes in Net Assets | Year ended Nov. 30, 2019 | Year ended Nov. 30, 2018 | ||||||
Increase (decrease) in net assets from operations | ||||||||
From operations | ||||||||
Net investment income | $187,802 | $147,275 | ||||||
Net realized gain (loss) on investment | 6,528 | (16,794 | ) | |||||
Net increase (decrease) in unrealized appreciation | 299,329 | (110,471 | ) | |||||
Net increase in net assets | 493,659 | 20,010 | ||||||
Distributions to shareowners | (187,268 | ) | (150,192 | ) | ||||
Capital share transactions | ||||||||
Proceeds from sales of shares | 1,406,263 | 974,206 | ||||||
Value of shares issued in reinvestment of dividends | 186,358 | 150,567 | ||||||
Cost of shares redeemed | (1,085,719 | ) | (1,423,649 | ) | ||||
Total capital share transactions | 506,902 | (298,876 | ) | |||||
Total increase (decrease) in net assets | 813,293 | (429,058 | ) | |||||
Net assets | ||||||||
Beginning of year | 10,275,596 | 10,704,654 | ||||||
End of year | $11,088,889 | $10,275,596 | ||||||
Shares of the Fund sold and redeemed | ||||||||
Number of shares sold | 279,784 | 196,541 | ||||||
Number of shares issued in reinvestment of dividends | 36,950 | 30,411 | ||||||
Number of shares redeemed | (215,988 | ) | (286,428 | ) | ||||
Net increase (decrease) in number of shares outstanding | 100,746 | (59,476 | ) | |||||
Financial Highlights | For year ended November 30, | |||||||||||||||||||
Selected data per share of outstanding capital stock throughout each year: | 2019 | 2018 | 2017 | 2016 | 2015 | |||||||||||||||
Net asset value at beginning of year | $4.94 | $5.00 | $5.02 | $5.02 | $5.04 | |||||||||||||||
Income from investment operations | ||||||||||||||||||||
Net investment income | 0.09 | 0.07 | 0.06 | 0.05 | 0.05 | |||||||||||||||
Net gains (losses) on securities (both realized and unrealized) | 0.14 | (0.06 | ) | (0.02 | ) | 0.00 | A | (0.02 | ) | |||||||||||
Total from investment operations | 0.23 | 0.01 | 0.04 | 0.05 | 0.03 | |||||||||||||||
Less distributions | ||||||||||||||||||||
Dividends (from net investment income) | (0.09 | ) | (0.07 | ) | (0.06 | ) | (0.05 | ) | (0.05 | ) | ||||||||||
Capital gains distribution | - | (0.00 | )A | - | - | - | ||||||||||||||
Total distributions | (0.09 | ) | (0.07 | ) | (0.06 | ) | (0.05 | ) | (0.05 | ) | ||||||||||
Net asset value at end of year | $5.08 | $4.94 | $5.00 | $5.02 | $5.02 | |||||||||||||||
Total return | 4.64% | 0.26% | 0.87% | 1.06% | 0.67% | |||||||||||||||
Ratios / supplemental data | ||||||||||||||||||||
Net assets ($000), end of year | $11,089 | $10,276 | $10,705 | $10,326 | $7,488 | |||||||||||||||
Ratio of expenses to average net assets | ||||||||||||||||||||
Before fee waivers and custodian fee credits | 0.87% | 0.91% | 1.01% | 1.15% | 1.21% | |||||||||||||||
After fee waivers | 0.61% | 0.61% | 0.68% | 0.76% | 0.76% | |||||||||||||||
After fee waivers and custodian fee credits | 0.60% | 0.60% | 0.68% | 0.75% | 0.75% | |||||||||||||||
Ratio of net investment income after fee waivers and custodian fee credits to average net assets | 1.75% | 1.44% | 1.26% | 1.05% | 1.06% | |||||||||||||||
Portfolio turnover rate | 32% | 36% | 31% | 11% | 13% | |||||||||||||||
| A | Amount is less than $0.01 |
| 12 | November 30, 2019 | Annual Report | The accompanying notes are an integral part of these financial statements. | |||||
Sextant Bond Income Fund
Performance Summary | (unaudited) |
Average Annual Total Returns as of November 30, 2019 |
| |||||||||||||||
| 1 Year | 5 Year | 10 Year | Expense Ratio1 | |||||||||||||
Sextant Bond Income Fund | 12.45% | 3.41% | 4.04% | 0.84% | ||||||||||||
FTSE US Broad Investment-Grade Bond Index | 10.97% | 3.11% | 3.56% | n/a | ||||||||||||
Growth of $10,000
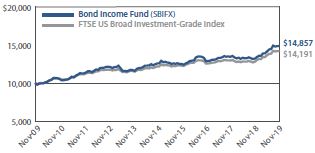 | Comparison of any mutual fund to a market index must be made bearing in mind that the index is expense-free. Conversely, the fund will (1) be actively managed; (2) have an objective other than mirroring the index, such as limiting risk; (3) bear transaction and other costs; (4) stand ready to buy and sell its securities to shareowners on a daily basis; and (5) provide a wide range of services. The graph compares $10,000 invested in the Fund on November 30, 2009, to an identical amount invested in the FTSE US Broad Investment-Grade Bond Index, a broad-based index of medium and long-term investment grade bond prices. The graph shows that an investment in the Fund would have risen to $14,857 versus $14,191 in the index. |
Past performance does not guarantee future results. The “Growth of $10,000” graph and “Average Annual Returns” performance table assume the reinvestment of dividends and capital gains. They do not reflect the deduction of taxes that a shareowner might pay on fund distributions or the redemption of fund shares.
| 1 | By regulation, the expense ratio shown in this table is as stated in the Fund’s most recent prospectus which is dated March 27, 2019, and incorporates results for the fiscal year ended November 30, 2018, before fee waivers. The expense ratio shown in the most recent prospectus after fee waivers was 0.65%. The ratio presented in this table differs from expense ratios shown elsewhere in this report as they represent different periods. |
Fund Objective
The objective of the Bond Income Fund is current income.
Top 10 Holdings | ||||
| % of Total Net Assets | ||||
United States Treasury Bond(4.25% due 05/15/2039) | 8.3% | |||
United States Treasury Bond(5.375% due 02/15/2031) | 4.4% | |||
Apple(4.50% due 02/23/2036) | 3.4% | |||
Microsoft(4.20% due 11/03/2035) | 3.4% | |||
Intel(4.00% due 12/15/2032) | 3.3% | |||
Burlington Northern Santa Fe(5.05% due03/01/2041) | 3.1% | |||
United States Treasury Note(3.625% due 02/15/2021) | 3.0% | |||
Praxair(3.55% due 11/07/2042) | 3.0% | |||
Puget Sound Energy(4.434% due 11/15/2041) | 2.8% | |||
United Technologies(6.05% due 06/01/2036) | 2.7% | |||
Portfolio Diversification | ||||||||||||
| % of Total Net Assets | ||||||||||||
Government Bonds | 24.5% | ∎ |  | |||||||||
Health Care | 11.7% | ∎ | ||||||||||
Municipal Bonds | 10.6% | ∎ | ||||||||||
Technology | 10.1% | ∎ | ||||||||||
Industrials | 9.2% | ∎ | ||||||||||
Utilities | 7.5% | ∎ | ||||||||||
Financials | 6.2% | ∎ | ||||||||||
Energy | 5.8% | ∎ | ||||||||||
Consumer Discretionary | 4.6% | ∎ | ||||||||||
Materials | 3.0% | ∎ | ||||||||||
Consumer Staples | 2.2% | ∎ | ||||||||||
Other Assets(net of liabilities) | 4.6% | ∎ | ||||||||||
| Annual Report | November 30, 2019 | 13 | ||||
Sextant Bond Income Fund
Discussion of Fund Performance | (unaudited) |
(photo omitted)
Fiscal Year 2019
For the fiscal year ended November 30, 2019, the Sextant Bond Income Fund returned 12.45%, lower than the 22.73% average return of its Morningstar Long-Term Bond category peer group. For the five years ended November 30, the Fund provided a 3.41% annualized total return versus 5.81% for its Morningstar category peer group. During the year, the Fund’s share price rose from $4.89 to $5.34 and the ratio of net investment income (after fee waivers) to net assets declined from 3.20% to 2.96%. Fund shares outstanding rose 5.42%, and fund assets rose 13.91%. The Fund’s30-day yield was 2.13%, and its unsubsidized30-day yield was 1.84%. Reflecting Saturna Capital’s subsidies to cap operating expenses, the Fund’s effective expense ratio was reduced to 0.55% from 0.71%.
Factors Affecting Past Performance
2019 began with the US Federal Reserve Bank policy at an inflection point. Good US economic growth and low US unemployment justified policy normalization, meaning shrinking the Fed’s balance sheet (quantitative tightening) and moving the Federal Funds rates higher. However, softening global growth, trade tensions, a flat yield curve, a strong US dollar, and faltering financial asset prices required the opposite policy response. By November 2019, US policy makers had reversed rate normalization, setting Federal Funds at 1.50%, below their level in June 2018. Quantitative tightening was halted. The policy dichotomy between US economic strength and global economic weakness was resolved with global concerns and the urgent need for greater US dollar liquidity prevailing.
This rapid policy reversal triggered a “risk on” response in financial markets. The Fed succeeded in steepening the US Treasury yield curve, discounting a flat curve’s recession signal. Reinvigorated investors poured money into financial assets, and especially income producing assets such as high-yield bonds. Reinvestment risk suddenlyre-emerged as the most urgent of investment objectives. Corporate bond spreads narrowed significantly, returning to previous lows in 1998, 2003, and 2018. High-yield spreads narrowed significantly more than investment grade spreads. US30-yr bond yields established a new low, eclipsing the previous low in 2016.
More recently, the US Federal Reserve expanded short-term liquidity funding to address funding shortfalls in the US repo market. An unusual structural balance of payments deficit caused by record US government deficit spending, restrictive banking regulations, and weak foreign demand for US Treasury paper combined to create the funding deficit.
In echoes of 2008, the European Central Bank, Japan, and Britain also amplified their own monetary easing policies. With interest rates falling and corporate bond spreads narrowing simultaneously, bond markets produced exceptional returns.
Looking Forward
US economic growth and inflation will likely remain relatively benign, while progress on Brexit and the US China trade negotiations will relax some anxieties. New monetary and fiscal stimulus from the US, Britain, Japan, and others will be deployed to fund debt burdens, fiscal deficits, as well as boost economic growth and inflation. In the last decade, monetary and fiscal stimulus policies initially pushed bond yields higher. However, these reflation policies have a mixed record of producing lasting results. Once these policies run their course, inflation and bond yields may very well fall again, boosting bond prices. Despite these reflation initiatives, negative nominal and real rates will not disappear. Reinvestment risk will remain the most urgent concern for bond investors over the medium to long term.
With yields only slightly higher than recent lows, credit spreads offering historically little additional compensation, and real yields near zero, it is tempting to discount the appeal of bonds in 2020. But bonds still offer another exceptional quality: diversification. As an asset class, bonds demonstrated excellent negative correlation to common stocks on days when stock prices fell during 2019. Higher yields in the next few quarters represent a buying opportunity.
For yield starved investors looking for a relatively calm mooring, bonds may offer the comfort of low correlation that leads to better decision making when many asset classes offer persistently high valuations and low potential returns.
Management Fee Calculations
The Sextant Bond Income Fund calculates the performance part of its management fee by comparing the Fund’s return to the return of Morningstar’s™ Long-Term Bond category. The Fund’s12-month return of 12.45% was more than 2% below the Morningstar™ category average of 22.73% atmonth-end November 30, 2019. Therefore, the basic annual management fee of 0.50% was decreased by 0.20% to 0.30% for the month of December 2019. Note that the management fee is partially waived due to the adviser’s cap on total Fund expenses.
| 14 | November 30, 2019 | Annual Report | ||||
Sextant Bond Income Fund
| Schedule of Investments | As of November 30, 2019 | |||||||||||||||||
| Corporate Bonds – 60.3% | Coupon / Maturity | Face Amount | Market Value | Percentage of Assets | ||||||||||||||
| Consumer Discretionary | ||||||||||||||||||
Lowe’s | 5.80% due 10/15/2036 | $250,000 | $312,863 | 2.5% | ||||||||||||||
VF | 6.00% due 10/15/2033 | 200,000 | 258,775 | 2.1% | ||||||||||||||
| 571,638 | 4.6% | |||||||||||||||||
| Consumer Staples | ||||||||||||||||||
Unilever Capital | 5.90% due 11/15/2032 | 200,000 | 271,747 | 2.2% | ||||||||||||||
| 271,747 | 2.2% | |||||||||||||||||
| Energy | ||||||||||||||||||
Baker Hughes | 6.875% due 01/15/2029 | 100,000 | 124,507 | 1.0% | ||||||||||||||
Canadian Natural Resources | 6.45% due 06/30/2033 | 225,000 | 286,151 | 2.3% | ||||||||||||||
Statoil | 7.15% due 01/15/2029 | 224,000 | 304,803 | 2.5% | ||||||||||||||
| 715,461 | 5.8% | |||||||||||||||||
| Financials | ||||||||||||||||||
Affiliated Managers Group | 3.50% due 08/01/2025 | 250,000 | 260,658 | 2.1% | ||||||||||||||
Bank Of New York Mellon MTN | 3.30% due 08/23/2029 | 250,000 | 263,332 | 2.1% | ||||||||||||||
UBS AG Stamford CT | 7.75% due 09/01/2026 | 200,000 | 250,825 | 2.0% | ||||||||||||||
| 774,815 | 6.2% | |||||||||||||||||
| Health Care | ||||||||||||||||||
Becton Dickinson | 6.70% due 08/01/2028 | 240,000 | 298,360 | 2.4% | ||||||||||||||
Johnson & Johnson | 4.95% due 05/15/2033 | 226,000 | 286,927 | 2.3% | ||||||||||||||
Medtronic Inc | 4.375% due 03/15/2035 | 260,000 | 311,484 | 2.5% | ||||||||||||||
Merck & Co. | 6.50% due 12/01/2033 | 215,000 | 309,726 | 2.5% | ||||||||||||||
Teva Pharmaceutical | 3.65% due 11/10/2021 | 250,000 | 244,890 | 2.0% | ||||||||||||||
| 1,451,387 | 11.7% | |||||||||||||||||
| Industrials | ||||||||||||||||||
Boeing | 6.125% due 02/15/2033 | 215,000 | 286,145 | 2.3% | ||||||||||||||
Burlington Northern Santa Fe | 5.05% due 03/01/2041 | 310,000 | 385,448 | 3.1% | ||||||||||||||
Deere & Co. | 8.10% due 05/15/2030 | 95,000 | 138,669 | 1.1% | ||||||||||||||
United Technologies | 6.05% due 06/01/2036 | 250,000 | 338,145 | 2.7% | ||||||||||||||
| 1,148,407 | 9.2% | |||||||||||||||||
| Materials | ||||||||||||||||||
Praxair | 3.55% due 11/07/2042 | 350,000 | 372,778 | 3.0% | ||||||||||||||
| 372,778 | 3.0% | |||||||||||||||||
Continued on next page.
| The accompanying notes are an integral part of these financial statements. | Annual Report | November 30, 2019 | 15 | |||||
Sextant Bond Income Fund
| Schedule of Investments | As of November 30, 2019 | |||||||||||||||||
| Corporate Bonds – 60.3% | Coupon / Maturity | Face Amount | Market Value | Percentage of Assets | ||||||||||||||
| Technology | ||||||||||||||||||
Apple | 4.50% due 02/23/2036 | $350,000 | $427,926 | 3.4% | ||||||||||||||
Intel | 4.00% due 12/15/2032 | 360,000 | 416,946 | 3.3% | ||||||||||||||
Microsoft | 4.20% due 11/03/2035 | 350,000 | 416,965 | 3.4% | ||||||||||||||
| 1,261,837 | 10.1% | |||||||||||||||||
| Utilities | ||||||||||||||||||
Alabama Power | 4.15% due 08/15/2044 | 200,000 | 227,740 | 1.8% | ||||||||||||||
Entergy Louisiana | 5.40% due 11/01/2024 | 200,000 | 229,313 | 1.8% | ||||||||||||||
Florida Power & Light | 5.95% due 10/01/2033 | 100,000 | 134,457 | 1.1% | ||||||||||||||
Puget Sound Energy | 4.434% due 11/15/2041 | 300,000 | 347,575 | 2.8% | ||||||||||||||
| 939,085 | 7.5% | |||||||||||||||||
| Total Corporate Bonds | $7,507,155 | 60.3% | ||||||||||||||||
| Government Bonds – 24.5% | Coupon / Maturity | Face Amount | Market Value | Percentage of Assets | ||||||||||||||
| Foreign Government Bonds | ||||||||||||||||||
Quebec Canada Yankee | 7.125% due 02/09/2024 | $175,000 | $210,954 | 1.7% | ||||||||||||||
| 210,954 | 1.7% | |||||||||||||||||
| United States Treasury Bonds | ||||||||||||||||||
United States Treasury Bond | 5.25% due 02/15/2029 | 170,000 | 220,230 | 1.8% | ||||||||||||||
United States Treasury Bond | 6.25% due 05/15/2030 | 75,000 | 106,893 | 0.8% | ||||||||||||||
United States Treasury Bond | 4.25% due 05/15/2039 | 770,000 | 1,038,898 | 8.3% | ||||||||||||||
United States Treasury Bond | 3.125% due 11/15/2041 | 145,000 | 169,310 | 1.4% | ||||||||||||||
United States Treasury Bond | 3.375% due 11/15/2048 | 60,000 | 75,073 | 0.6% | ||||||||||||||
United States Treasury Bond | 6.125% due 08/15/2029 | 225,000 | 312,275 | 2.5% | ||||||||||||||
United States Treasury Bond | 5.375% due 02/15/2031 | 400,000 | 544,703 | 4.4% | ||||||||||||||
| 2,467,382 | 19.8% | |||||||||||||||||
| United States Treasury Notes | ||||||||||||||||||
United States Treasury Note | 3.625% due 02/15/2021 | 370,000 | 378,412 | 3.0% | ||||||||||||||
| 378,412 | 3.0% | |||||||||||||||||
| Total Government Bonds | $3,056,748 | 24.5% | ||||||||||||||||
Continued on next page.
| 16 | November 30, 2019 | Annual Report | The accompanying notes are an integral part of these financial statements. | |||||
Sextant Bond Income Fund
| Schedule of Investments | As of November 30, 2019 | |||||||||||||||||
| Municipal Bonds – 10.6% | Coupon / Maturity | Face Amount | Market Value | Percentage of Assets | ||||||||||||||
| General Obligation | ||||||||||||||||||
Blaine Co. ID SCD #61 Hailey | 5.25% due 08/01/2020 | $250,000 | $255,650 | 2.1% | ||||||||||||||
Idaho Hsg & Fin GARVEE BABA-2 | 5.379% due 07/15/2020 | 180,000 | 183,467 | 1.5% | ||||||||||||||
San Marcos Texas ULTD GO BAB | 6.028% due 08/15/2030 | 200,000 | 205,994 | 1.6% | ||||||||||||||
Springville UT GO BAB | 5.30% due 05/01/2031 | 240,000 | 243,250 | 1.9% | ||||||||||||||
| 888,361 | 7.1% | |||||||||||||||||
| Municipal Leases | ||||||||||||||||||
Johnson Co KS Bldg Ls/Pr RevBAB | 4.60% due 09/01/2026 | 250,000 | 253,765 | 2.0% | ||||||||||||||
Oklahoma City Fin Auth Ed Lease Rev | 6.60% due 09/01/2022 | 160,000 | 178,230 | 1.5% | ||||||||||||||
| 431,995 | 3.5% | |||||||||||||||||
| Total Municipal Bonds | $1,320,356 | 10.6% | ||||||||||||||||
| Total investments | (Cost = $11,132,690) | $11,884,259 | 95.4% | |||||||||||||||
| Other assets (net of liabilities) | 569,294 | 4.6% | ||||||||||||||||
| Total net assets | $12,453,553 | 100.0% | ||||||||||||||||
Bond Quality Diversification | (unaudited) | |||||||||||
| % of Total Net Assets | ||||||||||||
Rated “AAA” | 30.5% | ∎ |  | |||||||||
Rated “AA+” | 3.4% | ∎ | ||||||||||
Rated “AA” | 10.9% | ∎ | ||||||||||
Rated “A+” | 11.3% | ∎ | ||||||||||
Rated “A” | 14.6% | ∎ | ||||||||||
Rated“A-” | 10.8% | ∎ | ||||||||||
Rated “BBB+” | 7.2% | ∎ | ||||||||||
Rated “BBB” | 2.3% | ∎ | ||||||||||
Rated “BB+” | 2.4% | ∎ | ||||||||||
Rated “BB” | 2.0% | ∎ | ||||||||||
Other assets(net of liabilities) | 4.6% | ∎ | ||||||||||
| Credit ratings are the lesser of S&P Global Ratings or Moody’s Investors Service. If neither S&P nor Moody’s rate a particular security, that security is categorized as not rated (except for US Treasury securities and securities issued or backed by US agencies which inherit the credit rating for the US government). Ratings range from AAA (highest) to D (lowest). Bonds rated BBB or above are considered investment grade. Credit ratings BB and below are lower-rated securities (junk bonds). Ratings apply to the creditworthiness of the issuers of the underlying securities and not the Fund or its shares. Ratings may be subject to change. |
| |||||||||||
| The accompanying notes are an integral part of these financial statements. | Annual Report | November 30, 2019 | 17 | |||||
Sextant Bond Income Fund
Statement of Assets and Liabilities
| ||||
| As of November 30, 2019 |
| |||
| ||||
Assets | ||||
Investments in securities, at value | $11,884,259 | |||
Cash | 443,124 | |||
Interest receivable | 118,150 | |||
Receivable for Fund shares sold | 8,665 | |||
Other assets | 10,955 | |||
Total assets | 12,465,153 | |||
Liabilities | ||||
Accrued audit expenses | 3,709 | |||
Distributions payable | 2,695 | |||
Accrued retirement plan custody fee | 2,516 | |||
Accrued advisory fees | 1,237 | |||
Accrued insurance expenses | 475 | |||
Accrued other operating expenses | 439 | |||
Accrued Chief Compliance Officer expenses | 243 | |||
Accrued legal expenses | 189 | |||
Accrued trustee expenses | 92 | |||
Payable for Fund shares redeemed | 5 | |||
Total liabilities | 11,600 | |||
Net assets | $12,453,553 | |||
Analysis of net assets | ||||
Paid-in capital (unlimited shares authorized, without par value) | $11,705,518 | |||
Total distributable earnings | 748,035 | |||
Net assets applicable to Fund shares outstanding | $12,453,553 | |||
Fund shares outstanding | 2,333,514 | |||
Net asset value, offering, and redemption price per share
| $5.34 | |||
Statement of Operations
| ||||
| Year ended November 30, 2019 |
| |||
Investment income | ||||
Interest income | $397,306 | |||
Total investment income | 397,306 | |||
Expenses | ||||
Investment adviser fees | 48,988 | |||
Filing and registration fees | 10,432 | |||
Audit fees | 6,760 | |||
Retirement plan custodial fees | 2,753 | |||
Chief Compliance Officer expenses | 2,513 | |||
Trustee fees | 2,364 | |||
Legal fees | 2,322 | |||
Printing and postage fees | 1,829 | |||
Other expenses | 1,675 | |||
Custodian fees | 456 | |||
Total gross expenses | 80,092 | |||
Less adviser fees waived | (17,370 | ) | ||
Less custodian fee credits | (429 | ) | ||
Net expenses | 62,293 | |||
Net investment income | $335,013 | |||
Net realized gain from investments | $41,830 | |||
Net increase in unrealized appreciation on investments | $933,335 | |||
Net gain on investments | $975,165 | |||
Net increase in net assets resulting from operations
| $1,310,178 | |||
| 18 | November 30, 2019 | Annual Report | The accompanying notes are an integral part of these financial statements. | |||||
Sextant Bond Income Fund
Statements of Changes in Net Assets | Year ended Nov. 30, 2019 | Year ended Nov. 30, 2018 | ||||||
Increase (decrease) in net assets from operations | ||||||||
From operations | ||||||||
Net investment income | $335,013 | $309,853 | ||||||
Net realized gain on investments | 41,830 | - | ||||||
Net increase (decrease) in unrealized appreciation | 933,335 | (480,051 | ) | |||||
Net increase (decrease) in net assets | 1,310,178 | (170,198 | ) | |||||
Distributions to shareowners | (334,236 | ) | (309,851 | ) | ||||
Capital share transactions | ||||||||
Proceeds from sales of shares | 1,865,586 | 3,232,820 | ||||||
Value of shares issued in reinvestment of dividends | 328,512 | 306,251 | ||||||
Cost of shares redeemed | (1,649,526 | ) | (1,621,814 | ) | ||||
Total capital share transactions | 544,572 | 1,917,257 | ||||||
Total increase (decrease) in net assets | 1,520,514 | 1,437,208 | ||||||
Net assets | ||||||||
Beginning of year | 10,933,039 | 9,495,831 | ||||||
End of year | $12,453,553 | $10,933,039 | ||||||
Shares of the Fund sold and redeemed | ||||||||
Number of shares sold | 361,579 | 650,577 | ||||||
Number of shares issued in reinvestment of dividends | 63,399 | 61,384 | ||||||
Number of shares redeemed | (327,334 | ) | (322,372 | ) | ||||
Net increase in number of shares outstanding | 97,644 | 389,589 | ||||||
Financial Highlights | For year ended November 30, | |||||||||||||||||||
Selected data per share of outstanding capital stock throughout each year: | 2019 | 2018 | 2017 | 2016 | 2015 | |||||||||||||||
Net asset value at beginning of year | $4.89 | $5.14 | $5.07 | $5.07 | $5.26 | |||||||||||||||
Income from investment operations | ||||||||||||||||||||
Net investment income | 0.15 | 0.16 | 0.16 | 0.15 | 0.17 | |||||||||||||||
Net gains (losses) on securities (both realized and unrealized) | 0.45 | (0.25 | ) | 0.07 | 0.00 | A | (0.19 | ) | ||||||||||||
Total from investment operations | 0.60 | (0.09 | ) | 0.23 | 0.15 | (0.02 | ) | |||||||||||||
Less distributions | ||||||||||||||||||||
Dividends (from net investment income) | (0.15 | ) | (0.16 | ) | (0.16 | ) | (0.15 | ) | (0.17 | ) | ||||||||||
Total distributions | (0.15 | ) | (0.16 | ) | (0.16 | ) | (0.15 | ) | (0.17 | ) | ||||||||||
Net asset value at end of year | $5.34 | $4.89 | $5.14 | $5.07 | $5.07 | |||||||||||||||
Total return | 12.45% | (1.78 | )% | 4.51% | 2.91% | (0.47 | )% | |||||||||||||
Ratios / supplemental data | ||||||||||||||||||||
Net assets ($000), end of year | $12,454 | $10,933 | $9,496 | $9,703 | $7,998 | |||||||||||||||
Ratio of expenses to average net assets | ||||||||||||||||||||
Before fee waivers and custodian fee credits | 0.71% | 0.86% | 0.98% | 1.01% | 1.03% | |||||||||||||||
After fee waivers | 0.55% | 0.66% | 0.78% | 0.89% | 0.90% | |||||||||||||||
After fee waivers and custodian fee credits | 0.55% | 0.65% | 0.78% | 0.88% | 0.90% | |||||||||||||||
Ratio of net investment income after fee waivers and custodian fee credits to average net assets | 2.96% | 3.20% | 3.05% | 2.85% | 3.21% | |||||||||||||||
Portfolio turnover rate | 21% | 0% | 4% | 11% | 4% | |||||||||||||||
| A | Amount is less than $0.01 |
| The accompanying notes are an integral part of these financial statements. | Annual Report | November 30, 2019 | 19 | |||||
Sextant Core Fund
Performance Summary | (unaudited) |
Average Annual Total Returns as of November 30, 2019 |
| |||||||||||||||
| 1 Year | 5 Year | 10 Year | Expense Ratio1 | |||||||||||||
Sextant Core Fund | 13.04% | 4.88% | 6.04% | 0.88% | ||||||||||||
Dow Jones Moderate US Portfolio Index | 11.53% | 6.04% | 7.66% | n/a | ||||||||||||
Growth of $10,000
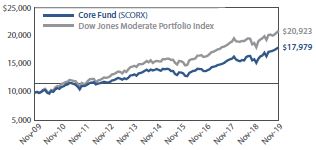 | Comparison of any mutual fund to a market index must be made bearing in mind that the index is expense-free. Conversely, the fund will (1) be actively managed; (2) have an objective other than mirroring the index, such as limiting risk; (3) bear transaction and other costs; (4) stand ready to buy and sell its securities to shareowners on a daily basis; and (5) provide a wide range of services. The graph compares $10,000 invested in the Fund on November 30, 2009, to an identical amount invested in the Dow Jones Moderate US Portfolio Index, a broad-based index of stock and bond prices. The graph shows that an investment in the Fund would have risen to $17,979 versus $20,923 in the index. |
Past performance does not guarantee future results.The “Growth of $10,000” graph and “Average Annual Returns” performance table assume the reinvestment of dividends and capital gains. They do not reflect the deduction of taxes that a shareowner might pay on fund distributions or the redemption of fund shares.
| 1 | By regulation, the expense ratio shown in this table is as stated in the Fund’s most recent prospectus, which is dated March 27, 2019, and incorporates results for the fiscal year ended November 30, 2018. The ratio presented in this table differs from expense ratios shown elsewhere in this report as they represent different periods. |
Fund Objective
The objectives of the Core Fund are long-term appreciation and capital preservation.
Portfolio Diversification | ||||||||
% of Total Net Assets | ||||||||
Sectors | Equity | Fixed Income | ||||||
Health Care | 12.0% | 4.0% | ||||||
Industrials | 8.4% | 4.4% | ||||||
Government Bonds | 0.0% | 12.2% | ||||||
Technology | 9.9% | 1.9% | ||||||
Consumer Discretionary | 7.0% | 2.3% | ||||||
Financials | 3.3% | 2.9% | ||||||
Utilities | 4.1% | 2.1% | ||||||
Communications | 3.7% | 1.3% | ||||||
Materials | 4.7% | 0.0% | ||||||
Consumer Staples | 4.1% | 0.0% | ||||||
Energy | 2.6% | 0.0% | ||||||
Municipal Bonds | 0.0% | 2.6% | ||||||
Total | 59.8% | 33.7% | ||||||
Top 10 Holdings | ||||
| % of Total Net Assets | ||||
United States Treasury Bond(6.25% due 08/15/2023) | 3.0% | |||
Welltower(4.25% due 04/15/2028) | 2.3% | |||
United States Treasury Note(2.75% due 11/15/2023) | 2.2% | |||
PacificCorp(6.00% due 01/15/2039) | 2.1% | |||
Lowe’s(4.25% due 09/15/2044) | 1.6% | |||
Boeing(5.875% due 02/15/2040) | 1.6% | |||
Gilead Sciences(3.70% due 04/01/2024) | 1.6% | |||
Union Pacific Corp(3.375% due 02/01/2035) | 1.5% | |||
Amgen | 1.5% | |||
United States Treasury Note(2.00% due 11/30/2022) | 1.5% | |||
Asset Allocation | ||||||||||||
| % of Total Net Assets |
| |||||||||||
Equity Securities | 59.8% | ∎ |  | |||||||||
Fixed Income Securities | 33.7% | ∎ | ||||||||||
Other assets (net of liabilities) | 6.5% | ∎ | ||||||||||
| 20 | November 30, 2019 | Annual Report | ||||
Sextant Core Fund
Discussion of Fund Performance | (unaudited) |
(photo omitted)
Fiscal Year 2019
The Sextant Core Fund completed fiscal year 2019 with a return of 13.04% for the period versus 11.53% for its Dow Jones Moderate Portfolio Index benchmark.
(photo omitted)
Factors Affecting Past Performance
Equities
The Sextant Core Fund’s mandate specifies a 60% allocation to equity securities, with two-thirds being US-domiciled companies and one-third foreign-domiciled companies. The Fund’s average equity allocation for the year was 61.7%. During the year, the Fund increased the number of equity positions, increased the average dividend yield, maintained the average position size, and increased the average market capitalization. The Energy, Consumer Discretionary, and Utilities sector were the largest contributors, offset by the Financial and Industrial sectors. The largest sector allocation, Technology, contributed modest performance for the year.
Fixed Income
2019 began with the US Federal Reserve Bank policy at an inflection point. Good US economic growth and low US unemployment justified policy normalization, meaning shrinking the Fed’s balance sheet (quantitative tightening) and moving the Federal Funds rates higher. However, softening global growth, trade tensions, a flat yield curve, a strong US dollar, and faltering financial asset prices required the opposite policy response. By November 2019, US policy makers had reversed rate normalization, setting Federal Funds at 1.50%, below their level in June 2018. Quantitative tightening was halted. The policy dichotomy between US economic strength and global economic weakness was resolved with global concerns and the urgent need for greater US dollar liquidity prevailing.
This rapid policy reversal triggered a “risk on” response in financial markets. The Fed succeeded in steepening the US Treasury yield curve, discounting a flat curve’s recession signal. Reinvigorated investors poured money into financial assets, and especially income producing assets such as high-yield bonds. Reinvestment risk suddenlyre-emerged as the most urgent of investment objectives. Corporate bond spreads narrowed significantly, returning to previous lows in 1998, 2003, and 2018. High-yield spreads narrowed significantly more than investment grade spreads. US30-yr bond yields established a new low, eclipsing the previous low in 2016.
More recently, the US Federal Reserve expanded short-term liquidity funding to address funding shortfalls in the US repo market. An unusual structural balance of payments deficit caused by record US government deficit spending, restrictive banking regulations, and weak foreign demand for US Treasury paper combined to create the funding deficit.
Looking Forward
US economic growth and inflation will likely remain relatively benign, while progress on Brexit and the US China trade negotiations will relax some anxieties. New monetary and fiscal stimulus from the US, Britain, Japan, and others will be deployed to fund debt burdens, fiscal deficits, as well as boost economic growth and inflation. In the last decade, monetary and fiscal stimulus policies initially pushed bond yields higher. However, these reflation policies have a mixed record of producing lasting results. Once these policies run their course, inflation and bond yields may very well fall again, boosting bond prices and those of income producing equities. Despite these reflation initiatives, negative nominal and real rates will not disappear.
With regard to equities, we expect to maintain the number of positions and emphasize the Fund’s value and income characteristics. The recent strong equity market performance inflated valuations and constrains the quantity of candidates for inclusion in the portfolio. The Fund’s fiscal 2019 turnover of 28% will likely be similar in 2020, as the Fund pursues its mandate of quality, attractively valued, income producing common equities.
With yields only slightly higher than recent lows, credit spreads offering historically little additional compensation, and real yields near zero, it is tempting to discount the appeal of bonds in 2020. But bonds still offer another exceptional quality: diversification. As an asset class, bonds demonstrated excellent negative correlation to common stocks on days when stock prices fell during 2019. Higher yields in the next few quarters represent a buying opportunity.
Management Fee Calculations
The Sextant Core Fund calculates the performance part of its management fee by comparing the Fund’s return to the return of Morningstar’s™ Allocation – 50% to 70% Equity category. The Fund’s12-month return of 13.13% was more than 2% above the Morningstar™ category average of 10.92% as of November 30, 2019. Therefore, the basic annual management fee of 0.50% was increased by 0.20% to 0.70% for the month of December 2019.
| Annual Report | November 30, 2019 | 21 | ||||
Sextant Core Fund
| Schedule of Investments | As of November 30, 2019 | |||||||||||||||||||||
| Common Stocks – 59.8% | Number of Shares | Cost | Market Value | Country1 | Percentage of Assets | |||||||||||||||||
| Communications | ||||||||||||||||||||||
| Internet Media | ||||||||||||||||||||||
Alphabet, Class A2 | 100 | $77,588 | $130,409 | United States | 0.8% | |||||||||||||||||
| Telecom Carriers | ||||||||||||||||||||||
AT&T | 4,400 | 150,315 | 164,472 | United States | 1.0% | |||||||||||||||||
BCE | 3,300 | 140,233 | 158,631 | Canada | 0.9% | |||||||||||||||||
Verizon Communications | 2,700 | 149,436 | 162,648 | United States | 1.0% | |||||||||||||||||
| 439,984 | 485,751 | 2.9% | ||||||||||||||||||||
| 517,572 | 616,160 | 3.7% | ||||||||||||||||||||
| Consumer Discretionary | ||||||||||||||||||||||
| Apparel, Footwear & Accessory Design | ||||||||||||||||||||||
VF | 2,400 | 153,720 | 212,496 | United States | 1.2% | |||||||||||||||||
| Automobiles | ||||||||||||||||||||||
Subaru ADR | 11,700 | 130,741 | 153,229 | Japan | 0.9% | |||||||||||||||||
| Home Products Stores | ||||||||||||||||||||||
Home Depot | 600 | 114,158 | 132,306 | United States | 0.8% | |||||||||||||||||
Lowe’s | 1,400 | 86,638 | 164,234 | United States | 1.0% | |||||||||||||||||
| 200,796 | 296,540 | 1.8% | ||||||||||||||||||||
| Specialty Apparel Stores | ||||||||||||||||||||||
Industria de Diseno Textil ADR | 12,000 | 152,848 | 186,720 | Spain | 1.1% | |||||||||||||||||
Ross Stores | 1,750 | 125,298 | 203,263 | United States | 1.2% | |||||||||||||||||
TJX Companies | 2,200 | 109,838 | 134,486 | United States | 0.8% | |||||||||||||||||
| 387,984 | 524,469 | 3.1% | ||||||||||||||||||||
| 873,241 | 1,186,734 | 7.0% | ||||||||||||||||||||
| Consumer Staples | ||||||||||||||||||||||
| Beverages | ||||||||||||||||||||||
PepsiCo | 1,350 | 139,207 | 183,371 | United States | 1.1% | |||||||||||||||||
| Household Products | ||||||||||||||||||||||
Procter & Gamble | 1,150 | 93,040 | 140,369 | United States | 0.8% | |||||||||||||||||
Unilever ADR | 2,900 | 132,633 | 172,521 | United Kingdom | 1.0% | |||||||||||||||||
| 225,673 | 312,890 | 1.8% | ||||||||||||||||||||
| Packaged Food | ||||||||||||||||||||||
Nestle ADR | 1,900 | 147,925 | 197,486 | Switzerland | 1.2% | |||||||||||||||||
| 512,805 | 693,747 | 4.1% | ||||||||||||||||||||
| Energy | ||||||||||||||||||||||
| Exploration & Production | ||||||||||||||||||||||
ConocoPhillips | 1,490 | 71,757 | 89,311 | United States | 0.5% | |||||||||||||||||
Continued on next page.
| 22 | November 30, 2019 | Annual Report | The accompanying notes are an integral part of these financial statements. | |||||
Sextant Core Fund
| Schedule of Investments | As of November 30, 2019 | |||||||||||||||||||||
| Common Stocks – 59.8% | Number of Shares | Cost | Market Value | Country1 | Percentage of Assets | |||||||||||||||||
| Energy(Continued) | ||||||||||||||||||||||
| Integrated Oils | ||||||||||||||||||||||
Equinor ADR | 10,200 | $179,884 | $189,006 | Norway | 1.1% | |||||||||||||||||
Total ADR | 3,182 | 170,950 | 167,182 | France | 1.0% | |||||||||||||||||
| 350,834 | 356,188 | 2.1% | ||||||||||||||||||||
| 422,591 | 445,499 | 2.6% | ||||||||||||||||||||
| Financials | ||||||||||||||||||||||
| Banks | ||||||||||||||||||||||
PNC Financial Services Group | 600 | 42,748 | 91,926 | United States | 0.6% | |||||||||||||||||
Toronto-Dominion Bank | 1,500 | 51,382 | 86,700 | Canada | 0.5% | |||||||||||||||||
| 94,130 | 178,626 | 1.1% | ||||||||||||||||||||
| Consumer Finance | ||||||||||||||||||||||
Ally Financial | 4,200 | 108,138 | 133,728 | United States | 0.8% | |||||||||||||||||
| Diversified Banks | ||||||||||||||||||||||
JP Morgan Chase | 500 | 43,088 | 65,880 | United States | 0.4% | |||||||||||||||||
| P&C Insurance | ||||||||||||||||||||||
Chubb | 1,130 | 151,600 | 171,172 | Switzerland | 1.0% | |||||||||||||||||
| 396,956 | 549,406 | 3.3% | ||||||||||||||||||||
| Health Care | ||||||||||||||||||||||
| Biotech | ||||||||||||||||||||||
Amgen | 1,100 | 179,932 | 258,192 | United States | 1.5% | |||||||||||||||||
| Large Pharma | ||||||||||||||||||||||
Bristol-Myers Squibb | 3,300 | 168,719 | 187,902 | United States | 1.1% | |||||||||||||||||
GlaxoSmithKline ADR | 4,100 | 170,001 | 186,468 | United Kingdom | 1.1% | |||||||||||||||||
Johnson & Johnson | 1,800 | 168,551 | 247,482 | United States | 1.5% | |||||||||||||||||
Merck & Co | 850 | 71,440 | 74,103 | United States | 0.4% | |||||||||||||||||
Novartis ADR | 900 | 81,252 | 83,070 | Switzerland | 0.5% | |||||||||||||||||
Novo Nordisk ADR | 2,450 | 81,372 | 137,567 | Denmark | 0.8% | |||||||||||||||||
Pfizer | 5,500 | 187,996 | 211,860 | United States | 1.3% | |||||||||||||||||
| 929,331 | 1,128,452 | 6.7% | ||||||||||||||||||||
| Managed Care | ||||||||||||||||||||||
UnitedHealth Group | 800 | 189,963 | 223,896 | United States | 1.3% | |||||||||||||||||
| Medical Devices | ||||||||||||||||||||||
Abbott Laboratories | 2,700 | 97,630 | 230,715 | United States | 1.4% | |||||||||||||||||
| Medical Equipment | ||||||||||||||||||||||
Koninklijke Philips ADR | 3,800 | 137,793 | 176,624 | Netherlands | 1.1% | |||||||||||||||||
| 1,534,649 | 2,017,879 | 12.0% | ||||||||||||||||||||
Continued on next page.
| The accompanying notes are an integral part of these financial statements. | Annual Report | November 30, 2019 | 23 | |||||
Sextant Core Fund
| Schedule of Investments | As of November 30, 2019 | |||||||||||||||||||||
| Common Stocks – 59.8% | Number of Shares | Cost | Market Value | Country1 | Percentage of Assets | |||||||||||||||||
| Industrials | ||||||||||||||||||||||
| Aircraft & Parts | ||||||||||||||||||||||
L3Harris Technologies | 600 | $124,513 | $120,654 | United States | 0.7% | |||||||||||||||||
United Technologies | 900 | 117,591 | 133,506 | United States | 0.8% | |||||||||||||||||
| 242,104 | 254,160 | 1.5% | ||||||||||||||||||||
| Commercial & Residential Building Equipment & Systems | ||||||||||||||||||||||
Honeywell International | 1,200 | 85,271 | 214,260 | United States | 1.3% | |||||||||||||||||
Johnson Controls International | 4,550 | 183,666 | 194,876 | United States | 1.1% | |||||||||||||||||
| 268,937 | 409,136 | 2.4% | ||||||||||||||||||||
| Flow Control Equipment | ||||||||||||||||||||||
Parker Hannifin | 1,050 | 121,236 | 208,730 | United States | 1.2% | |||||||||||||||||
| Industrial Distribution & Rental | ||||||||||||||||||||||
Fastenal | 2,800 | 64,603 | 99,456 | United States | 0.6% | |||||||||||||||||
| Marine Shipping | ||||||||||||||||||||||
Frontline2 | 8,000 | 84,960 | 89,840 | Norway | 0.5% | |||||||||||||||||
| Rail Freight | ||||||||||||||||||||||
Canadian National Railway | 2,000 | 77,527 | 182,180 | Canada | 1.1% | |||||||||||||||||
Kansas City Southern Industries | 1,200 | 145,800 | 182,904 | United States | 1.1% | |||||||||||||||||
| 223,327 | 365,084 | 2.2% | ||||||||||||||||||||
| 1,005,167 | 1,426,406 | 8.4% | ||||||||||||||||||||
| Materials | ||||||||||||||||||||||
| Basic & Diversified Chemicals | ||||||||||||||||||||||
BASF ADR | 4,000 | 76,520 | 74,840 | Germany | 0.4% | |||||||||||||||||
Linde | 900 | 85,777 | 185,589 | Ireland | 1.1% | |||||||||||||||||
| 162,297 | 260,429 | 1.5% | ||||||||||||||||||||
| Precious Metal Mining | ||||||||||||||||||||||
Agnico-Eagle Mines | 2,000 | 114,365 | 119,200 | Canada | 0.7% | |||||||||||||||||
Barrick Gold | 7,000 | 124,899 | 117,600 | Canada | 0.7% | |||||||||||||||||
Newmont Mining | 2,900 | 113,890 | 111,360 | United States | 0.7% | |||||||||||||||||
| 353,154 | 348,160 | 2.1% | ||||||||||||||||||||
| Specialty Chemicals | ||||||||||||||||||||||
PPG Industries | 700 | 74,662 | 90,188 | United States | 0.5% | |||||||||||||||||
RPM International | 1,400 | 44,141 | 103,222 | United States | 0.6% | |||||||||||||||||
| 118,803 | 193,410 | 1.1% | ||||||||||||||||||||
| 634,254 | 801,999 | 4.7% | ||||||||||||||||||||
| Technology | ||||||||||||||||||||||
| Application Software | ||||||||||||||||||||||
Open Text US | 3,900 | 146,122 | 169,962 | Canada | 1.0% | |||||||||||||||||
| Communications Equipment | ||||||||||||||||||||||
Apple | 600 | 56,454 | 160,350 | United States | 1.0% | |||||||||||||||||
Cisco Systems | 2,000 | 89,540 | 90,620 | United States | 0.5% | |||||||||||||||||
| 145,994 | 250,970 | 1.5% | ||||||||||||||||||||
Continued on next page.
| 24 | November 30, 2019 | Annual Report | The accompanying notes are an integral part of these financial statements. | |||||
Sextant Core Fund
| Schedule of Investments | As of November 30, 2019 | |||||||||||||||||||||
| Common Stocks – 59.8% | Number of Shares | Cost | Market Value | Country1 | Percentage of Assets | |||||||||||||||||
| Technology(continued) | ||||||||||||||||||||||
| Consumer Electronics | ||||||||||||||||||||||
Nintendo ADR | 1,600 | $ 78,824 | $ 77,424 | United States | 0.5% | |||||||||||||||||
| Infrastructure Software | ||||||||||||||||||||||
Micro Focus International ADR | 6,304 | 96,708 | 92,480 | United Kingdom | 0.6% | |||||||||||||||||
Microsoft | 900 | 112,498 | 136,242 | United States | 0.8% | |||||||||||||||||
Oracle | 3,100 | 124,402 | 174,034 | United States | 1.0% | |||||||||||||||||
| 333,608 | 402,756 | 2.4% | ||||||||||||||||||||
| IT Services | ||||||||||||||||||||||
Amdocs Limited | 3,000 | 196,205 | 207,900 | United States | 1.2% | |||||||||||||||||
| Semiconductor Devices | ||||||||||||||||||||||
Infineon Technologies ADR | 3,275 | 59,576 | 69,823 | Germany | 0.4% | |||||||||||||||||
Intel | 2,000 | 70,360 | 116,100 | United States | 0.7% | |||||||||||||||||
Microchip Technology | 600 | 44,621 | 56,724 | United States | 0.3% | |||||||||||||||||
Micron Technology2 | 1,400 | 50,457 | 66,514 | United States | 0.4% | |||||||||||||||||
NXP Semiconductors | 600 | 43,722 | 69,348 | Netherlands | 0.4% | |||||||||||||||||
Qualcomm | 1,000 | 51,858 | 83,550 | United States | 0.5% | |||||||||||||||||
Xilinx | 1,000 | 67,334 | 92,780 | United States | 0.6% | |||||||||||||||||
| 387,928 | 554,839 | 3.3% | ||||||||||||||||||||
| 1,288,681 | 1,663,851 | 9.9% | ||||||||||||||||||||
| Utilities | ||||||||||||||||||||||
| Integrated Utilities | ||||||||||||||||||||||
Dominion Energy | 2,800 | 212,366 | 232,708 | United States | 1.4% | |||||||||||||||||
Duke Energy | 2,600 | 229,507 | 229,242 | United States | 1.3% | |||||||||||||||||
NextEra Energy | 1,000 | 72,153 | 233,820 | United States | 1.4% | |||||||||||||||||
| 514,026 | 695,770 | 4.1% | ||||||||||||||||||||
| 514,026 | 695,770 | 4.1% | ||||||||||||||||||||
| Total Common Stocks | $7,699,942 | $10,097,451 | 59.8% | |||||||||||||||||||
| Corporate Bonds – 18.9% | Coupon / Maturity | Face Amount | Market Value | Percentage of Assets | ||||||||||||||
| Communications | ||||||||||||||||||
Bellsouth Capital Funding | 7.875% due 02/15/2030 | $150,000 | $211,750 | 1.3% | ||||||||||||||
| 211,750 | 1.3% | |||||||||||||||||
| Consumer Discretionary | ||||||||||||||||||
Lowe’s | 4.25% due 09/15/2044 | 250,000 | 270,918 | 1.6% | ||||||||||||||
Stanford University | 4.013% due 05/01/2042 | 100,000 | 118,466 | 0.7% | ||||||||||||||
| 389,384 | 2.3% | |||||||||||||||||
| Financials | ||||||||||||||||||
General Electric Capital | 5.35% due 04/15/2022 | 101,000 | 106,839 | 0.6% | ||||||||||||||
Welltower | 4.25% due 04/15/2028 | 350,000 | 384,570 | 2.3% | ||||||||||||||
| 491,409 | 2.9% | |||||||||||||||||
Continued on next page.
| The accompanying notes are an integral part of these financial statements. | Annual Report | November 30, 2019 | 25 | |||||
Sextant Core Fund
| Schedule of Investments | As of November 30, 2019 | |||||||||||||||||
| Corporate Bonds – 18.9% | Coupon / Maturity | Face Amount | Market Value | Percentage of Assets | ||||||||||||||
| Health Care | ||||||||||||||||||
Becton Dickinson | 3.125% due 11/08/2021 | $100,000 | $101,775 | 0.6% | ||||||||||||||
Cardinal Health | 3.50% due 11/15/2024 | 155,000 | 161,444 | 1.0% | ||||||||||||||
Celgene | 2.875% due 08/15/2020 | 140,000 | 140,963 | 0.8% | ||||||||||||||
Gilead Sciences | 3.70% due 04/01/2024 | 250,000 | 264,835 | 1.6% | ||||||||||||||
| 669,017 | 4.0% | |||||||||||||||||
| Industrials | ||||||||||||||||||
Boeing | 5.875% due 02/15/2040 | 200,000 | 270,781 | 1.6% | ||||||||||||||
Legrand France Yankee | 8.50% due 02/15/2025 | 170,000 | 218,563 | 1.3% | ||||||||||||||
Union Pacific | 3.375% due 02/01/2035 | 250,000 | 260,393 | 1.5% | ||||||||||||||
| 749,737 | 4.4% | |||||||||||||||||
| Technology | ||||||||||||||||||
Cisco Systems | 2.90% due 03/04/2021 | 100,000 | 101,285 | 0.6% | ||||||||||||||
Qualcomm | 3.25% due 05/20/2027 | 220,000 | 230,564 | 1.3% | ||||||||||||||
| 331,849 | 1.9% | |||||||||||||||||
| Utilities | ||||||||||||||||||
PacifiCorp | 6.00% due 01/15/2039 | 250,000 | 346,559 | 2.1% | ||||||||||||||
| 346,559 | 2.1% | |||||||||||||||||
| Total Corporate Bonds | $3,189,705 | 18.9% | ||||||||||||||||
| Government Bonds – 12.2% | Coupon /Maturity | Face Amount | Market Value | Percentage of Assets | ||||||||||||||
| United States Treasury Bonds | ||||||||||||||||||
United States Treasury Bond | 6.25% due 08/15/2023 | $438,000 | $510,424 | 3.0% | ||||||||||||||
United States Treasury Bond | 4.50% due 02/15/2036 | 137,000 | 185,613 | 1.1% | ||||||||||||||
United States Treasury Bond | 3.625% due 02/15/2044 | 155,000 | 196,711 | 1.2% | ||||||||||||||
| 892,748 | 5.3% | |||||||||||||||||
| United States Treasury Notes | ||||||||||||||||||
United States Treasury Note | 1.50% due 06/15/2020 | 150,000 | 149,900 | 0.9% | ||||||||||||||
United States Treasury Note | 2.75% due 11/15/2023 | 350,000 | 364,984 | 2.2% | ||||||||||||||
United States Treasury Note | 2.00% due 05/31/2024 | 80,000 | 81,300 | 0.5% | ||||||||||||||
United States Treasury Note | 2.125% due 08/31/2020 | 204,000 | 204,693 | 1.2% | ||||||||||||||
United States Treasury Note | 2.00% due 11/30/2022 | 250,000 | 252,852 | 1.5% | ||||||||||||||
United States Treasury Note | 1.625% due 04/30/2023 | 106,000 | 106,046 | 0.6% | ||||||||||||||
| 1,159,775 | 6.9% | |||||||||||||||||
| Total Government Bonds | $2,052,523 | 12.2% | ||||||||||||||||
Continued on next page.
| 26 | November 30, 2019 | Annual Report | The accompanying notes are an integral part of these financial statements. | |||||
Sextant Core Fund
| Schedule of Investments | As of November 30, 2019 | |||||||||||||||||
| Municipal Bonds – 2.6% | Coupon / Maturity | Face Amount | Market Value | Percentage of Assets | ||||||||||||||
| General Obligation | ||||||||||||||||||
Lake Washington SD 414 WA BAB | 4.906% due 12/01/2027 | $100,000 | $101,516 | 0.6% | ||||||||||||||
Skagit SD #1 | 4.613% due 12/01/2022 | 100,000 | 103,511 | 0.6% | ||||||||||||||
| 205,027 | 1.2% | |||||||||||||||||
| State Education | ||||||||||||||||||
New York City Housing Dev | 2.65% due 05/01/2021 | 100,000 | 100,983 | 0.6% | ||||||||||||||
| 100,983 | 0.6% | |||||||||||||||||
| Utility Networks | ||||||||||||||||||
Tacoma WA Elec Sys Revenue | 5.966% due 01/01/2035 | 100,000 | 134,814 | 0.8% | ||||||||||||||
| 134,814 | 0.8% | |||||||||||||||||
| Total Municipal Bonds | $440,824 | 2.6% | ||||||||||||||||
| Total investments | (Cost = $13,098,929) | $15,780,503 | 93.5% | |||||||||||||||
| Other assets (net of liabilities) | 1,094,161 | 6.5% | ||||||||||||||||
| Total net assets | $16,874,664 | 100.0% | ||||||||||||||||
| 1 | Country of domicile |
| 2 | Non-income producing security |
ADR: American Depositary Receipt
Bond Quality Diversification | (unaudited) | |||||||||
| % of Total Net Assets |
| |||||||||
Rated “AAA” | 14.1% | ∎ |
| |||||||
Rated “AA” | 0.6% | ∎ | ||||||||
Rated“AA-” | 0.8% | ∎ | ||||||||
Rated “A+” | 2.7% | ∎ | ||||||||
Rated “A” | 2.9% | ∎ | ||||||||
Rated“A-” | 2.9% | ∎ | ||||||||
Rated “BBB+” | 6.0% | ∎ | ||||||||
Rated “BBB” | 3.1% | ∎ | ||||||||
Rated “BB+” | 0.6% | ∎ | ||||||||
Equity | 59.8% | ∎ | ||||||||
Other assets (net of liabilities) | 6.5% | ∎ | ||||||||

| Credit ratings are the lesser of S&P Global Ratings or Moody’s Investors Service. If neither S&P nor Moody’s rate a particular security, that security is categorized as not rated (except for US Treasury securities and securities issued or backed by US agencies which inherit the credit rating for the US government). Ratings range from AAA (highest) to D (lowest). Bonds rated BBB or above are considered investment grade. Credit ratings BB and below are lower-rated securities (junk bonds). Ratings apply to the creditworthiness of the issuers of the underlying securities and not the Fund or its shares. Ratings may be subject to change. | ||||||
| The accompanying notes are an integral part of these financial statements. | Annual Report | November 30, 2019 | 27 | |||||
Sextant Core Fund
Statement of Assets and Liabilities
| ||||
| As of November 30, 2019 |
| |||
| ||||
Assets | ||||
Investments in securities, at value | $15,780,503 | |||
Cash | 1,007,074 | |||
Dividends and interest receivable | 82,901 | |||
Receivable for Fund shares sold | 12,343 | |||
Other assets | 8,662 | |||
Total assets | 16,891,483 | |||
Liabilities | ||||
Accrued advisory fees | 6,823 | |||
Accrued audit expenses | 4,750 | |||
Accrued retirement plan custody fee | 2,717 | |||
Accrued Chief Compliance Officer expenses | 934 | |||
Accrued insurance expenses | 855 | |||
Accrued other operating expenses | 437 | |||
Accrued trustee expenses | 303 | |||
Total liabilities | 16,819 | |||
Net assets | $16,874,664 | |||
Analysis of net assets | ||||
Paid-in capital (unlimited shares authorized, without par value) | $13,224,975 | |||
Total distributable earnings | 3,649,689 | |||
Net assets applicable to Fund shares outstanding | $16,874,664 | |||
Fund shares outstanding | 1,178,845 | |||
Net asset value, offering, and redemption price per share | $14.31 | |||
Statement of Operations
| ||||
| Year ended November 30, 2019 |
| |||
|
| |||
Investment income | ||||
Dividend income (net of foreign tax of $15,607) | $212,711 | |||
Interest income | 160,179 | |||
Total investment income | 372,890 | |||
Expenses | ||||
Investment adviser fees | 91,370 | |||
Filing and registration fees | 15,926 | |||
Audit fees | 8,263 | |||
Chief Compliance Officer expenses | 3,801 | |||
Retirement plan custodial fees | 3,068 | |||
Trustee fees | 2,979 | |||
Legal fees | 2,731 | |||
Printing and postage fees | 2,268 | |||
Other operating expenses | 1,942 | |||
Custodian fees | 591 | |||
Total gross expenses | 132,939 | |||
Less custodian fee credits | (560 | ) | ||
Net expenses | 132,379 | |||
Net investment income | $240,511 | |||
| ||||
Net realized gain from investments and foreign currency | $755,524 | |||
Net increase in unrealized appreciation on investments and foreign currency | 858,747 | |||
Net gain on investments | $1,614,271 | |||
Net increase in net assets resulting from operations | $1,854,782 | |||
| 28 | November 30, 2019 | Annual Report | The accompanying notes are an integral part of these financial statements. | |||||
Sextant Core Fund
Statements of Changes in Net Assets | Year ended Nov. 30, 2019 | Year ended Nov. 30, 2018 | ||||||
Increase (decrease) in net assets from operations | ||||||||
From operations | ||||||||
Net investment income | $240,511 | $175,436 | ||||||
Net realized gain on investment | 755,524 | 145,000 | ||||||
Net increase (decrease) in unrealized appreciation | 858,747 | (280,915 | ) | |||||
Net increase in net assets | 1,854,782 | 39,521 | ||||||
Distributions to shareowners | (179,880 | ) | (166,943 | ) | ||||
Capital share transactions | ||||||||
Proceeds from sales of shares | 3,901,597 | 2,728,274 | ||||||
Value of shares issued in reinvestment of dividends | 179,880 | 166,943 | ||||||
Cost of shares redeemed | (1,733,010 | ) | (2,896,024 | ) | ||||
Total capital share transactions | 2,348,467 | (807 | ) | |||||
Total increase (decrease) in net assets | 4,023,369 | (128,229 | ) | |||||
Net assets | ||||||||
Beginning of year | 12,851,295 | 12,979,524 | ||||||
End of year | $16,874,664 | $12,851,295 | ||||||
Shares of the Fund sold and redeemed | ||||||||
Number of shares sold | 292,063 | 211,487 | ||||||
Number of shares issued in reinvestment of dividends | 14,891 | 12,931 | ||||||
Number of shares redeemed | (129,374 | ) | (222,368 | ) | ||||
Net increase in number of shares outstanding | 177,580 | 2,050 | ||||||
Financial Highlights | For year ended November 30, | |||||||||||||||||||
Selected data per share of outstanding capital stock throughout each year: | 2019 | 2018 | 2017 | 2016 | 2015 | |||||||||||||||
Net asset value at beginning of year | $12.84 | $12.99 | $11.45 | $11.25 | $12.43 | |||||||||||||||
Income from investment operations | ||||||||||||||||||||
Net investment income | 0.19 | 0.18 | 0.16 | 0.18 | 0.18 | |||||||||||||||
Net gains (losses) on securities (both realized and unrealized) | 1.45 | (0.16 | ) | 1.55 | �� | 0.02 | (0.72 | ) | ||||||||||||
Total from investment operations | 1.64 | 0.02 | 1.71 | 0.20 | (0.54 | ) | ||||||||||||||
Less distributions | ||||||||||||||||||||
Dividends (from net investment income) | (0.17 | ) | (0.17 | ) | (0.17 | ) | - | (0.18 | ) | |||||||||||
Distributions (from capital gains) | - | - | - | - | (0.46 | ) | ||||||||||||||
Total distributions | (0.17 | ) | (0.17 | ) | (0.17 | ) | - | (0.64 | ) | |||||||||||
Net asset value at end of year | $14.31 | $12.84 | $12.99 | $11.45 | $11.25 | |||||||||||||||
Total return | 13.04% | 0.16% | 15.15% | 1.78% | (4.38 | )% | ||||||||||||||
Ratios / supplemental data | ||||||||||||||||||||
Net assets ($000), end of year | $16,875 | $12,851 | $12,980 | $8,563 | $8,435 | |||||||||||||||
Ratio of expenses to average net assets | ||||||||||||||||||||
Before custodian fee credits | 0.90% | 0.88% | 0.84% | 1.05% | 1.02% | |||||||||||||||
After custodian fee credits | 0.90% | 0.87% | 0.83% | 1.04% | 1.01% | |||||||||||||||
Ratio of net investment income after custodian fee credits to average net assets | 1.63% | 1.41% | 1.52% | 1.52% | 1.44% | |||||||||||||||
Portfolio turnover rate | 28% | 30% | 34% | 39% | 24% | |||||||||||||||
| The accompanying notes are an integral part of these financial statements. | Annual Report | November 30, 2019 | 29 | |||||
Sextant Global High Income Fund
Performance Summary | (unaudited) |
Average Annual Total Returns as of November 30, 2019 |
| |||||||||||||||
| 1 Year | 5 Year | 10 Year | Expense Ratio1 | |||||||||||||
Sextant Global High Income Fund2 | 7.06% | 5.02% | n/a | 0.97% | ||||||||||||
S&P Global 1200 Index | 14.97% | 8.40% | 9.82% | n/a | ||||||||||||
Growth of $10,000
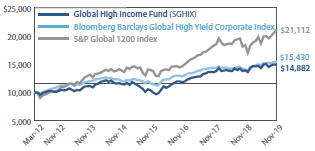 | Comparison of any mutual fund to a market index must be made bearing in mind that the index is expense-free. Conversely, the fund will (1) be actively managed; (2) have an objective other than mirroring the index, such as limiting risk; (3) bear transaction and other costs; (4) stand ready to buy and sell its securities to shareowners on a daily basis; and (5) provide a wide range of services. The graph compares $10,000 invested in the Fund on March 30, 2012 (the Fund’s inception), to an identical amount invested in the S&P Global 1200 Index, a global stock market index covering nearly 70% of the world’s equity markets. The graph shows that an investment in the Fund would have risen to $14,882 versus $21,112 in the index. |
Past performance does not guarantee future results.The “Growth of $10,000” graph and “Average Annual Returns” performance table assume the reinvestment of dividends and capital gains. They do not reflect the deduction of taxes that a shareowner might pay on fund distributions or the redemption of fund shares.
| 1 | By regulation, the expense ratio shown in this table is as stated in the Fund’s most recent prospectus, which is dated March 27, 2019, and incorporates results for the fiscal year ended November 30, 2018, before fee waivers. The expense ratio shown in the most recent prospectus after fee waivers was 0.75%. The ratio presented in this table differs from expense ratios shown elsewhere in this report as they represent different periods. |
2 The Sextant Global High Income Fund began operations on March 30, 2012.
Fund Objective
The objective of the Global High Income Fund is high income, with a secondary objective of capital preservation.
Portfolio Diversification | ||||||||
| % of Total Net Assets | ||||||||
Sectors | Equity | Fixed Income | ||||||
Financials | 6.7% | 8.9% | ||||||
Government Bonds | 0.0% | 10.3% | ||||||
Communications | 7.0% | 2.7% | ||||||
Energy | 8.1% | 1.5% | ||||||
Fixed Income | 0.0% | 7.7% | ||||||
Materials | 3.8% | 2.7% | ||||||
Consumer Discretionary | 1.8% | 2.6% | ||||||
Health Care | 4.1% | 0.0% | ||||||
Industrials | 1.6% | 2.5% | ||||||
Technology | 1.8% | 1.1% | ||||||
Consumer Staples | 0.0% | 2.2% | ||||||
Municipal Bonds | 0.0% | 2.1% | ||||||
Total | 34.9% | 44.3% | ||||||
Top 10 Holdings | ||||
| % of TotaI Net Assets | ||||
United States Treasury Note(2.50% due 01/15/2022) | 7.7% | |||
Mexico Bonos Desarrollo(6.50% due 06/10/2021) | 4.4% | |||
Aviva ADR | 3.0% | |||
AT&T | 2.8% | |||
Jefferies Group(5.125% due 01/20/2023) | 2.7% | |||
T-Mobile(6.50% due 01/15/2026) | 2.7% | |||
Burlington Northern Santa Fe(5.05% due 03/01/2041) | 2.5% | |||
GlaxoSmithKline ADR | 2.3% | |||
Equinor ADR | 2.3% | |||
Royal Dutch Shell ADR, Class A | 2.2% | |||
Asset Allocation | ||||||||||||
| % of Total Net Assets | ||||||||||||
Equity Securities | 34.9% | ∎ |
|
|
| |||||||
Fixed Income Securities | 44.3% | ∎ | ||||||||||
Other assets (net of liabilities) | 20.8% | ∎ | ||||||||||

| 30 | November 30, 2019 | Annual Report | ||||
Sextant Global High Income Fund
Discussion of Fund Performance | (unaudited) |
(photo omitted)
Fiscal Year 2019
The Sextant Global High Income Fund completed fiscal year 2019 with a total return of 7.06%. The Fund paid a qualified income distribution of 21¢, a regular income distribution of 19¢, a short-term capital gain distribution of 23¢, and a long-term capital gain distribution of 29¢. These income and capital gain distributions amounted to a total of 92¢ per share, and represented a 3.70% ratio of net investment income (after fee waivers) to average net assets for the fiscal year. The30-day SEC yield was 2.44% at fiscalyear-end.
The Fund underperformed its equity benchmark, the S&P Global 1200 Index, which returned 14.97%. It outperformed its fixed-income benchmark, the Bloomberg-Barclays Global High Yield Corporate Bond Index, which returned 9.65%; it underperformed its Morningstar World Allocation peer group, which returned 8.82%.
Factors Affecting Past Performance
After a bout of volatility and a sharpsell-off in the last month of 2018, equity and bond markets were able to enjoy smoother sailing for much of the remaining fiscal year through November 2019. There was somewhat of a scare during the summer months as manufacturing contracted sharply in response to trade worries and a temporary inversion in the US yield curve, but the broader economies did not roll over. In the US, continued robust employment trends buoyed the services economy, and helped the US equity market outperformnon-US equities for the ninth year in the past 10. This remarkable run has resulted in the S&P 500 Index outperforming the MSCI EAFE Index ofnon-US developed market stocks by 7.63% on an annualized basis over the past 10 years (as of November 29, 2019).
In accordance with the Fund’s investment policies, as well as our inclination to view market events through a contrarian lens, we have kept the Fund’s center of gravity away from US equities, but long-term structural impediments outside the US have continued to impact relative performance ofnon-US stocks. At the same time, the performance of the US stock market itself has been increasingly driven by a handful of technology-oriented companies, namely Alphabet (i.e., Google), Amazon, Apple, Facebook, and Microsoft, which we like to call the “tech platform monopolies.” Of the above five companies, only Apple and Microsoft pay a dividend, and the yield on both is below 1.5%, which falls well short of what we would consider appropriate for our “high income” mandate, so our ability to participate in the full extent of the US equity market’s performance has been limited by the income as well as geographic allocation mandates.
Looking Forward
Equities
As we turn the corner on the last decade, we note that of the largest 10 global companies by market capitalization at the beginning of each of the prior three decades (1990, 2000, and 2010), only two or three of them remained on that list 10 years later. At present, US companies comprise eight of the top 10, while the tech platform companies we highlighted above — with the addition of their Chinese counterparts Alibaba and Tencent — comprise seven of the top 10. While it is possible that the monopolistic competitive positions of these companies will allow them to endure at the top of the leader board 10 years hence, history at least warrants caution, as political and regulatory hurdles may constrain growth, not to mention the capacity of innovation in technology itself to disrupt technology leaders.
Fixed-Income
Interest rates, as well as risk spreads, spent much of the past decade well below historical averages. Demographic trends (aging populations and slowing birthrates) may continue to lead to disinflationary pressures as we enter the new decade, and we do not expect a sharp increase in interest rates over the short or medium terms.
Foreign Currencies
We believe the US dollar remains overvalued versus many foreign currencies on the basis of purchasing power and will continue to favor currencies where inflation-adjusted rates are higher than in the US, and where we believe there is a valuation tailwind to provide a margin of safety.
Management Fee Calculations
The Sextant Global High Income Fund calculates the performance part of its management fee by comparing the Fund’s return to the return of Morningstar’s™ “World Allocation” category. The Fund’s12-month return of 7.06% was more than one percent but less than two percent below the Morningstar™ category average of 8.82% atmonth-end November 30, 2018. Therefore, the basic annual management fee of 0.50% was decreased by 0.10% to 0.40% for the month of December 2019. Note that significant portions of the Fund’s expenses are waived due to the adviser’s cap on total Fund expenses.
| Annual Report | November 30, 2019 | 31 | ||||
Sextant Global High Income Fund
| Schedule of Investments | As of November 30, 2019 | |||||||||||||||||||||
| Common Stocks – 34.9% | Number of Shares | Cost | Market Value | Country1 | Percentage of Assets | |||||||||||||||||
| Communications | ||||||||||||||||||||||
| Telecom Carriers | ||||||||||||||||||||||
AT&T | 7,500 | $229,195 | $280,350 | United States | 2.8% | |||||||||||||||||
Orange ADR | 12,500 | 188,424 | 204,000 | France | 2.1% | |||||||||||||||||
SK Telecom ADR | 9,000 | 149,321 | 206,280 | Korea | 2.1% | |||||||||||||||||
| 566,940 | 690,630 | 7.0% | ||||||||||||||||||||
| Consumer Discretionary | ||||||||||||||||||||||
| Automobiles | ||||||||||||||||||||||
Subaru ADR | 13,601 | 157,273 | 178,126 | Japan | 1.8% | |||||||||||||||||
| 157,273 | 178,126 | 1.8% | ||||||||||||||||||||
| Energy | ||||||||||||||||||||||
| Exploration & Production | ||||||||||||||||||||||
CNOOC Limited ADR | 1,100 | 155,570 | 159,742 | China | 1.6% | |||||||||||||||||
Goodrich Petroleum2 | 200 | - | 1,964 | United States | 0.0% | 3 | ||||||||||||||||
| 155,570 | 161,706 | 1.6% | ||||||||||||||||||||
| Integrated Oils | ||||||||||||||||||||||
Equinor ADR | 12,000 | 218,810 | 222,360 | Norway | 2.3% | |||||||||||||||||
Royal Dutch Shell ADR, Class A | 3,800 | 241,426 | 218,462 | Netherlands | 2.2% | |||||||||||||||||
Total ADR | 3,800 | 202,606 | 199,652 | France | 2.0% | |||||||||||||||||
| 662,842 | 640,474 | 6.5% | ||||||||||||||||||||
| 818,412 | 802,180 | 8.1% | ||||||||||||||||||||
| Financials | ||||||||||||||||||||||
| Banks | ||||||||||||||||||||||
Skandinaviska Enskilda Banken, Class A | 20,000 | 198,047 | 171,505 | Sweden | 1.7% | |||||||||||||||||
| Diversified Banks | ||||||||||||||||||||||
Itau Unibanco Holding ADR, Class A | 25,000 | 144,759 | 203,500 | Brazil | 2.0% | |||||||||||||||||
| Life Insurance | ||||||||||||||||||||||
Aviva ADR | 28,000 | 249,760 | 292,880 | United States | 3.0% | |||||||||||||||||
| 592,566 | 667,885 | 6.7% | ||||||||||||||||||||
| Health Care | ||||||||||||||||||||||
| Large Pharma | ||||||||||||||||||||||
GlaxoSmithKline ADR | 5,000 | 216,373 | 227,400 | United Kingdom | 2.3% | |||||||||||||||||
Novartis ADR | 1,900 | 96,814 | 175,370 | Switzerland | 1.8% | |||||||||||||||||
| 313,187 | 402,770 | 4.1% | ||||||||||||||||||||
| Industrials | ||||||||||||||||||||||
| Infrastructure Construction | ||||||||||||||||||||||
Hopewell Highway Infrastructure | 325,000 | 168,010 | 156,915 | Hong Kong | 1.6% | |||||||||||||||||
| 168,010 | 156,915 | 1.6% | ||||||||||||||||||||
Continued on next page.
| 32 | November 30, 2019 | Annual Report | The accompanying notes are an integral part of these financial statements. | |||||
Sextant Global High Income Fund
| Schedule of Investments | As of November 30, 2019 | |||||||||||||||||||||
| Common Stocks – 34.9% | Number of Shares | Cost | Market Value | Country1 | Percentage of Assets | |||||||||||||||||
| Materials | ||||||||||||||||||||||
| Base Metals | ||||||||||||||||||||||
South 32 ADR | 19,000 | $134,773 | $173,090 | Australia | 1.7% | |||||||||||||||||
| Steel Raw Material Suppliers | ||||||||||||||||||||||
BHP Billiton ADR | 4,000 | $155,038 | $206,120 | Australia | 2.1% | |||||||||||||||||
| 289,811 | 379,210 | 3.8% | ||||||||||||||||||||
| Technology | ||||||||||||||||||||||
| Infrastructure Software | ||||||||||||||||||||||
Micro Focus International | 12,000 | 216,541 | 176,040 | United Kingdom | 1.8% | |||||||||||||||||
| 216,541 | 176,040 | 1.8% | ||||||||||||||||||||
Total Common Stock
|
| $3,122,740
|
|
| $3,453,756
|
|
| 34.9%
|
| |||||||||||||
| Corporate Bonds – 24.2% | Coupon /Maturity | Face Amount | Market Value | Country1 | Percentage of Assets | |||||||||||||||||
| Communications | ||||||||||||||||||||||
T-Mobile | 6.50% due 01/15/2026 | $250,000 | $267,500 | United States | 2.7% | |||||||||||||||||
| 267,500 | 2.7% | |||||||||||||||||||||
| Consumer Discretionary | ||||||||||||||||||||||
ADT | 4.125% due 06/15/2023 | 150,000 | 153,750 | United States | 1.6% | |||||||||||||||||
GAP | 5.95% due 04/12/2021 | 100,000 | 103,832 | United States | 1.0% | |||||||||||||||||
| 257,582 | 2.6% | |||||||||||||||||||||
| Consumer Staples | ||||||||||||||||||||||
Grupo Bimbo | 4.875% due 06/27/2044 | 200,000 | 215,319 | Mexico | 2.2% | |||||||||||||||||
| 215,319 | 2.2% | |||||||||||||||||||||
| Energy | ||||||||||||||||||||||
Petrobras International Finance | 6.875% due 01/20/2040 | 50,000 | 57,375 | Brazil | 0.6% | |||||||||||||||||
Petrobras International Finance | 6.75% due 01/27/2041 | 80,000 | 90,908 | Brazil | 0.9% | |||||||||||||||||
| 148,283 | 1.5% | |||||||||||||||||||||
| Financials | ||||||||||||||||||||||
Canadian Imperial Bank | 3.42% due 01/26/2026 | CAD 250,000 | 190,787 | Canada | 1.9% | |||||||||||||||||
Jefferies Group | 5.125% due 01/20/2023 | 250,000 | 269,661 | United States | 2.7% | |||||||||||||||||
Lincoln National (3 month LIBOR plus 2.04%)4 | 4.00588% due 04/20/2067 | 250,000 | 206,250 | United States | 2.1% | |||||||||||||||||
Royal Bank of Scotland | 6.125% due 12/15/2022 | 200,000 | 217,083 | United Kingdom | 2.2% | |||||||||||||||||
| 883,781 | 8.9% | |||||||||||||||||||||
Continued on next page.
| The accompanying notes are an integral part of these financial statements. | Annual Report | November 30, 2019 | 33 | |||||
Sextant Global High Income Fund
| Schedule of Investments | As of November 30, 2019 | |||||||||||||||||||
| Corporate Bonds – 24.2% | Coupon / Maturity | Face Amount | Market Value | Country1 | Percentage of Assets | |||||||||||||||
| Industrials | ||||||||||||||||||||
Burlington Northern Santa Fe | 5.05% due 03/01/2041 | $200,000 | $248,676 | United States | 2.5% | |||||||||||||||
| 248,676 | 2.5% | |||||||||||||||||||
| Materials | ||||||||||||||||||||
Allegheny Technologies | 7.875% due 08/15/2023 | 150,000 | 166,688 | United States | 1.7% | |||||||||||||||
AngloGold Ashanti Holdings | 5.375% due 04/15/2020 | 100,000 | 100,930 | South Africa | 1.0% | |||||||||||||||
| 267,618 | 2.7% | |||||||||||||||||||
| Technology | ||||||||||||||||||||
Hewlett Packard | 4.65% due 12/09/2021 | 100,000 | 104,512 | United States | 1.1% | |||||||||||||||
| 104,512 | 1.1% | |||||||||||||||||||
| Total Corporate Bonds | $2,393,271 | 24.2% | ||||||||||||||||||
| Government Bonds – 18.0% | Coupon / Maturity | Face Amount | Market Value | Country1 | Percentage of Assets | |||||||||||||||
| Foreign Government Bonds | ||||||||||||||||||||
Colombia Republic | 8.375% due 02/15/2027 | 125,000 | 145,373 | Colombia | 1.5% | |||||||||||||||
Federal Republic of Brazil | 12.50% due 01/05/2022 | BRL 500,000 | 135,141 | Brazil | 1.3% | |||||||||||||||
Federal Republic of Brazil | 8.50% due 01/05/2024 | BRL 750,000 | 194,263 | Brazil | 2.0% | |||||||||||||||
Mexico Bonos Desarrollo | 6.50% due 06/10/2021 | MXN 8,500,000 | 432,142 | Mexico | 4.4% | |||||||||||||||
Republic of Argentina – Global Bond | 7.50% due 04/22/2026 | 250,000 | 108,437 | Argentina | 1.1% | |||||||||||||||
| 1,015,356 | 10.3% | |||||||||||||||||||
| United States Treasury Note | ||||||||||||||||||||
United States Treasury Note | 2.50% due 01/15/2022 | 750,000 | 763,594 | United States | 7.7% | |||||||||||||||
| 763,594 | 7.7% | |||||||||||||||||||
| Total Government Bonds | $1,778,950 | 18.0% | ||||||||||||||||||
| Municipal Bonds – 2.1% | Coupon / Maturity | Face Amount | Market Value | Country1 | Percentage of Assets | |||||||||||||||
| Real Estate | ||||||||||||||||||||
Colony TX NFM Sales Tax Revenue | 7.00% due 10/01/2027 | 100,000 | 102,283 | United States | 1.0% | |||||||||||||||
Colony TX NFM Sales Tax Revenue | 7.25% due 10/01/2033 | 50,000 | 51,151 | United States | 0.5% | |||||||||||||||
Colony TX NFM Sales Tax Revenue | 7.625% due 10/01/2042 | 50,000 | 57,976 | United States | 0.6% | |||||||||||||||
| 211,410 | 2.1% | |||||||||||||||||||
| Total Municipal Bonds | $211,410 | 2.1% | ||||||||||||||||||
| Warrants – 0.0% | Number of Shares | Cost | Market Value | Country1 | Percentage of Assets | |||||||||||||||
| Energy | ||||||||||||||||||||
| Exploration & Production | ||||||||||||||||||||
Goodrich Petroleum Warrants2 | 1,707 | $- | $- | United States | 0.0% | |||||||||||||||
| $- | 0.0% | |||||||||||||||||||
Continued on next page.
| 34 | November 30, 2019 | Annual Report | The accompanying notes are an integral part of these financial statements. | |||||
Sextant Global High Income Fund
| Schedule of Investments | As of November 30, 2019 | |||||||||||||||||
Total investments |
(Cost = $7,620,094) |
|
7,837,387 |
|
|
79.2% |
| |||||||||||
| Other assets (net of liabilities) | 2,056,011 | 20.8% | ||||||||||||||||
| Total net assets | $9,893,398 | 100.0% | ||||||||||||||||
| 1 | Country of domicile |
| 2 | Non-income producing |
| 3 | Amount is less than 0.05% |
| 4 | Variable rate security. The interest rate represents the rate in effect at November 30, 2019, and resets periodically based on the parenthetically disclosed reference rate and spread. |
ADR: American Depositary Receipt
Countries | (unaudited) | |||
|
| |||
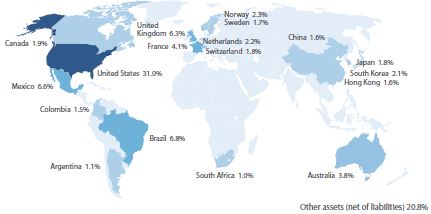 |
| |||
| Weightings shown are a percentage of total net assets. |
| |||
Bond Quality Diversification |
| (unaudited) | ||||||||||
| % of Total Net Assets |
| |||||||||||
Rated “AAA” | 7.7% | ∎ | 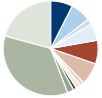 | |||||||||
Rated“A-” | 6.9% | ∎ | ||||||||||
Rated “BBB+” | 1.9% | ∎ | ||||||||||
Rated “BBB” | 5.8% | ∎ | ||||||||||
Rated“BBB-” | 8.0% | ∎ | ||||||||||
Rated “BB” | 7.5% | ∎ | ||||||||||
Rated“BB-” | 1.6% | ∎ | ||||||||||
Rated“B-” | 1.7% | ∎ | ||||||||||
Rated “CC” | 1.1% | ∎ | ||||||||||
Not rated | 2.1% | ∎ | ||||||||||
Equity | 34.9% | ∎ | ||||||||||
Other assets (net of liabilities) | 20.8% | ∎ | ||||||||||
| Credit ratings are the lesser of S&P Global Ratings or Moody’s Investors Service. If neither S&P nor Moody’s rate a particular security, that security is categorized as not rated (except for US Treasury securities and securities issued or backed by US agencies which inherit the credit rating for the US government). Ratings range from AAA (highest) to D (lowest). Bonds rated BBB or above are considered investment grade. Credit ratings BB and below are lower-rated securities (junk bonds). Ratings apply to the creditworthiness of the issuers of the underlying securities and not the Fund or its shares. Ratings may be subject to change. | ||||||
| The accompanying notes are an integral part of these financial statements. | Annual Report | November 30, 2019 | 35 | |||||
Sextant Global High Income Fund
Statement of Assets and Liabilities
| As of November 30, 2019 |
| |||
| ||||
Assets | ||||
Investments in securities, at value (Cost $7,620,094) | $7,837,387 | |||
Cash | 1,963,431 | |||
Dividends and interest receivable | 100,478 | |||
Other assets | 9,804 | |||
Receivable for Fund shares sold | 1,351 | |||
Total assets | 9,912,451 | |||
Liabilities | ||||
Accrued registration/filling fees | 6,574 | |||
Accrued audit expenses | 5,192 | |||
Accrued advisory fees | 2,855 | |||
Accrued retirement plan custody fee | 1,536 | |||
Accrued insurance expenses | 655 | |||
Accrued Chief Compliance Officer expenses | 628 | |||
Accrued other operating expenses | 575 | |||
Accrued printing fees | 539 | |||
Accrued trustee expenses | 499 | |||
Total liabilities | 19,053 | |||
Net assets | $9,893,398 | |||
Analysis of net assets | ||||
Paid-in capital (unlimited shares authorized, without par value) | $8,879,360 | |||
Total distributable earnings | 1,014,038 | |||
Net assets applicable to Fund shares outstanding | $9,893,398 | |||
Fund shares outstanding | 866,000 | |||
Net asset value, offering and redemption price per share | $11.42 | |||
Statement of Operations
| Year ended November 30, 2019 |
| |||
| ||||
Investment income | ||||
Interest income | $247,642 | |||
Dividend income | ||||
(net of foreign tax of $23,464) | 185,593 | |||
Total investment income | 433,235 | |||
Expenses | ||||
Investment adviser fees | 65,447 | |||
Filing and registration fees | 20,439 | |||
Audit fees | 8,639 | |||
Chief Compliance Officer expenses | 2,876 | |||
Trustee fees | 2,586 | |||
Printing and postage fees | 2,337 | |||
Other expenses | 1,790 | |||
Retirement plan custodial fees | 1,709 | |||
Legal fees | 797 | |||
Custodian fees | 778 | |||
Total gross expenses | 107,398 | |||
Less adviser fees waived | (33,817 | ) | ||
Less custodian fee credits | (757 | ) | ||
Net expenses | 72,824 | |||
Net investment income | $360,411 | |||
| ||||
Net realized gain from investments and foreign currency | $470,083 | |||
Net decrease in unrealized appreciation on investments and foreign currency | (183,400 | ) | ||
Net gain on investments | $286,683 | |||
Net increase in net assets resulting from operations | $647,094 | |||
| 36 | November 30, 2019 | Annual Report | The accompanying notes are an integral part of these financial statements. | |||||
Sextant Global High Income Fund
Statements of Changes in Net Assets | Year ended Nov. 30, 2019 | Year ended Nov. 30, 2018 | ||||||
Increase (decrease) in net assets from operations | ||||||||
From operations | ||||||||
Net investment income | $360,411 | $318,693 | ||||||
Net realized gain on investment | 470,083 | 151,626 | ||||||
Net decrease in unrealized appreciation | (183,400 | ) | (267,907 | ) | ||||
Net increase in net assets | 647,094 | 202,412 | ||||||
Distributions to shareowners | (311,447 | ) | (253,597 | ) | ||||
Capital share transactions | ||||||||
Proceeds from sales of shares | 1,877,127 | 564,016 | ||||||
Value of shares issued in reinvestment of dividends | 305,590 | 249,322 | ||||||
Cost of shares redeemed | (1,452,378 | ) | (1,307,655 | ) | ||||
Total capital share transactions | 730,339 | (494,317 | ) | |||||
Total increase (decrease) in net assets | 1,065,986 | (545,502 | ) | |||||
Net assets | ||||||||
Beginning of year | 8,827,412 | 9,372,914 | ||||||
End of year | $9,893,398 | $8,827,412 | ||||||
Shares of the Fund sold and redeemed | ||||||||
Number of shares sold | 168,864 | 50,613 | ||||||
Number of shares issued in reinvestment of dividends | 29,440 | 22,707 | ||||||
Number of shares redeemed | (130,029 | ) | (118,123 | ) | ||||
Net increase (decrease) in number of shares outstanding | 68,275 | (44,803 | ) | |||||
Financial Highlights | For Year ended November 30, | |||||||||||||||||||
Selected data per share of outstanding capital stock throughout each year: | 2019 | 2018 | 2017 | 2016 | 2015 | |||||||||||||||
Net asset value at beginning of year | $11.07 | $11.12 | $10.11 | $8.89 | $10.57 | |||||||||||||||
Income from investment operations | ||||||||||||||||||||
Net investment income | 0.42 | 0.40 | 0.35 | 0.45 | 0.52 | |||||||||||||||
Net gains (losses) on securities (both realized and unrealized) | 0.32 | (0.15 | ) | 1.11 | 0.77 | (1.68 | ) | |||||||||||||
Total from investment operations | 0.74 | 0.25 | 1.46 | 1.22 | (1.16 | ) | ||||||||||||||
Less distributions | ||||||||||||||||||||
Dividends (from net investment income) | (0.39 | ) | (0.30 | ) | (0.45 | ) | - | (0.52 | ) | |||||||||||
Total distributions | (0.39 | ) | (0.30 | ) | (0.45 | ) | - | (0.52 | ) | |||||||||||
Net asset value at end of year | $11.42 | $11.07 | $11.12 | $10.11 | $8.89 | |||||||||||||||
Total return | 7.06% | 2.31% | 15.01% | 13.72% | (11.01 | )% | ||||||||||||||
Ratios / supplemental data | ||||||||||||||||||||
Net assets ($000), end of year | $9,893 | $8,827 | $9,373 | $7,570 | $6,952 | |||||||||||||||
Ratio of expenses to average net assets | ||||||||||||||||||||
Before fee waivers | 1.11% | 0.97% | 1.18% | 1.17% | 1.06% | |||||||||||||||
After fee waivers | 0.76% | 0.75% | 0.83% | 0.91% | 0.90% | |||||||||||||||
After fee waivers and custodian fee credits | 0.75% | 0.75% | 0.82% | 0.90% | 0.89% | |||||||||||||||
Ratio of net investment income after fee waivers and custodian fee credits to average net assets | 3.72% | 3.43% | 3.34% | 4.78% | 4.87% | |||||||||||||||
Portfolio turnover rate | 33% | 10% | 8% | 26% | 40% | |||||||||||||||
| The accompanying notes are an integral part of these financial statements. | Annual Report | November 30, 2019 | 37 | |||||
Sextant Growth Fund
Performance Summary
| (unaudited) | |||||||||||
Average Annual Total Returns as of November 30, 2019 |
| |||||||||||||||
| 1 Year | 5 Year | 10 Year | Expense Ratio1 | |||||||||||||
Sextant Growth Fund Investor Shares (SSGFX) | 21.81% | 9.52% | 11.81% | 0.92% | ||||||||||||
Sextant Growth Fund Z Shares (SGZFX)2 | 22.22% | n/a | n/a | 0.70% | ||||||||||||
S&P 500 Index | 16.11% | 10.97% | 13.44% | n/a | ||||||||||||
Growth of $10,000
| Comparison of any mutual fund to a market index must be made bearing in mind that the index is expense-free. Conversely, the fund will (1) be actively managed; (2) have an objective other than mirroring the index, such as limiting risk; (3) bear transaction and other costs; (4) stand ready to buy and sell its securities to shareowners on a daily basis; and (5) provide a wide range of services. The graph compares $10,000 invested in Investor Shares of the Fund on November 30, 2009, to an identical amount invested in the S&P 500 Index, an index comprised of 500 widely held common stocks considered to be representative of the US stock market in general. The graph shows that an investment in the Investor Shares of the Fund would have risen to $30,539 versus $35,289 in the index. |
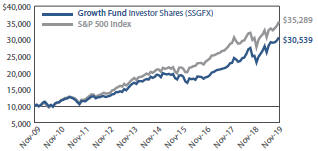
Past performance does not guarantee future results. The “Growth of $10,000” graph and “Average Annual Returns” performance table assume the reinvestment of dividends and capital gains. They do not reflect the deduction of taxes that a shareowner might pay on fund distributions or the redemption of fund shares.
| 1 | By regulation, the expense ratio shown in this table is as stated in the Fund’s most recent prospectus, which is dated March 27, 2019, and incorporates results for the fiscal year ended November 30, 2018. The ratio presented in this table differs from expense ratios shown elsewhere in this report as they represent different periods. |
| 2 | Sextant Growth Fund Z Shares (SGZFX) began operations June 2, 2017. |
Fund Objective
The objective of the Growth Fund is long-term capital growth.
Top 10 Holdings |
| |||
| % of Total Net Assets | ||||
Adobe | 6.3% | |||
Microsoft | 6.3% | |||
Amazon.com | 6.1% | |||
Apple | 5.9% | |||
Mastercard, Class A | 5.7% | |||
Alphabet, Class A | 4.5% | |||
Abbott Laboratories | 3.9% | |||
Fidelity National Information Services | 3.4% | |||
Costco Wholesale | 3.2% | |||
Edwards Life sciences | 3.1% | |||
Portfolio Diversification | ||||||||||||
| % of Total Net Assets |
| |||||||||||
Consumer Finance | 11.5% | ∎ |
|
|
| |||||||
Medical Devices | 8.3% | ∎ | ||||||||||
Application Software | 8.3% | ∎ | ||||||||||
Infrastructure Software | 7.7% | ∎ | ||||||||||
E-Commerce Discretionary | 6.1% | ∎ | ||||||||||
Communications Equipment | 5.9% | ∎ | ||||||||||
Home Products Stores | 4.8% | ∎ | ||||||||||
Internet Media | 4.5% | ∎ | ||||||||||
Specialty Apparel Stores | 4.5% | ∎ | ||||||||||
Large Pharma | 3.9% | ∎ | ||||||||||
Semiconductor Devices | 3.9% | ∎ | ||||||||||
Mass Merchants | 3.2% | ∎ | ||||||||||
Home Improvement | 3.0% | ∎ | ||||||||||
Industries < 3% | 20.1% | ∎ | ||||||||||
Other Assets (net of liabilities) | 4.3% | ∎ | ||||||||||

| 38 | November 30, 2019 | Annual Report | ||||
Sextant Growth Fund
Discussion of Fund Performance | (unaudited) |
(photo omitted)
Fiscal Year 2019
For the fiscal year ended November 30, 2019, the Sextant Growth Fund Investor Shares returned 21.81%, well ahead of the 16.11% gain for the S&P 500 Index. New class Z Shares, without a12b-1 fee expense, were introduced in 2017 and 90.04% of the Fund now benefits from this lower expense option. The Fund also outperformed other growth-oriented funds, as illustrated by its Morningstar US Large Growth category peer group returning an average of 17.63% over the same period.
Factors Affecting Past Performance
Sextant Growth’s performance improved over the past year as many of the largest positions in the Fund experienced solid price appreciation, while significant losses were largely avoided. The Fund’s largest exposure is to Technology, and within that group Apple, Microsoft, Adobe, and Qualcomm led the charge, helped by the fact that the first three are the largest positions in the Fund. Alphabet had a good year but did not keep pace with the others, while Amazon, which was a significant contributor last year, took a breather in 2019. Going forward, each of these companies remains attractive in terms of competitive position and business, but political noise surrounding some of the largest may be an issue in 2020 as the presidential campaign heats up. Payments technology also contributed to the Fund’s strong year, with Mastercard and Fidelity National Information Services both performing admirably. With regard to the latter, it entered the Fund through its purchase of our WorldPay holding, which turned out to be one of the best investments for the year. We believe electronic payments have significant scope for further growth.
Along with Technology, Consumer Discretionary and Consumer Staples were the major contributors as Nike, TJX, Ross Stores, and Costco continued to perform well, outpacing overall Fund returns. In 2019, they were joined by equally strong performances from Starbucks, Lowe’s, and Home Depot, which had lagged the previous year. We believe all of these businesses maintain identifiable and sustainable competitive advantages, making them attractive investments going forward. Health Care provided a mixed bag, with our pharmaceutical investments in Bristol-Myers and Merck lagging overall Fund returns, while Abbott Labs and Stryker performed roughly in line. On the other hand, Edwards Life Sciences was one of the top performers for the year, as its heart valve business moved from strength to strength. The only stock failing to provide a positive return last year was Alaska Air, which registered a low single-digit decline. While airlines aren’t traditionally considered growth stocks, Alaska Air’s combination of attractive valuation, combined with rapidly growing earnings as it consolidates its acquisition of Virgin America, made it suitable.
Looking Forward
The US economy appears to have recovered from the inverted yield curve scare of the past summer with low unemployment and reasonable wage growth. We would be more comfortable if capital spending were demonstrating greater strength but that’s perhaps understandable as we enter a presidential election year that could lead to wholesale changes in policy. As was the case last year, trade policy remains an area of concern, especially as regards China. Since concern over China’s economic policies crosses the political aisle, we may indeed move toward abi-polar world in the economic sphere. We believe much of the manufacturing trend away from China was bound to happen regardless of trade policies, due to China’s shrinking work force and increasing costs, but inefficiencies are still a likely outcome. From a sector perspective, Health Care is probably the most exposed to political risk. In some areas (drug prices), there is broad agreement between the two parties, but in terms of organization of the Health Care system, the two could hardly be further apart. We certainly aren’t going to provide any projections for market returns over the coming year but believe, as always, that staying invested for the long term remains the best strategy.
Management Fee Calculations
The Sextant Growth Fund calculates the performance part of its management fee by comparing the Fund’s return to the average return in Morningstar’s “Large Growth” category.
Sextant Growth Fund Investor Shares’12-month return of 21.81% was more than 2% above the Morningstar™ category average of 17.63% atmonth-end November 30, 2019. Therefore, the base annual management fee of 0.50% for the Fund as a whole was increased by 0.20% to 0.70% for the month of December 2019.
| Annual Report | November 30, 2019 | 39 | ||||
Sextant Growth Fund
| Schedule of Investments | As of November 30, 2019 | |||||||||||||||||||||
| Common Stock – 95.7% | Number of Shares | Cost | Market Value | Percentage of Assets | ||||||||||||||||||
| Communications | ||||||||||||||||||||||
| Internet Media | ||||||||||||||||||||||
Alphabet, Class A1 | 1,584 | $898,428 | $2,065,679 | 4.5% | ||||||||||||||||||
| 898,428 | 2,065,679 | 4.5% | ||||||||||||||||||||
| Consumer Discretionary | ||||||||||||||||||||||
| Airlines | ||||||||||||||||||||||
Alaska Air | 7,422 | 129,600 | 512,192 | 1.1% | ||||||||||||||||||
| Apparel, Footwear & Accessory Design | ||||||||||||||||||||||
Nike, Class B | 10,276 | 528,776 | 960,703 | 2.1% | ||||||||||||||||||
| E-Commerce Discretionary | ||||||||||||||||||||||
Amazon.com1 | 1,529 | 278,191 | 2,753,423 | 6.1% | ||||||||||||||||||
| Home Improvement | ||||||||||||||||||||||
Stanley Black & Decker | 8,684 | 795,475 | 1,369,814 | 3.0% | ||||||||||||||||||
| Home Products Stores | ||||||||||||||||||||||
Home Depot | 4,000 | 451,717 | 882,040 | 1.9% | ||||||||||||||||||
Lowe’s | 11,200 | 794,834 | 1,313,872 | 2.9% | ||||||||||||||||||
| 1,246,551 | 2,195,912 | 4.8% | ||||||||||||||||||||
| Other Commercial Services | ||||||||||||||||||||||
Ecolab | 6,243 | 704,507 | 1,165,381 | 2.5% | ||||||||||||||||||
| Restaurants | ||||||||||||||||||||||
Starbucks | 14,674 | 610,056 | 1,253,600 | 2.8% | ||||||||||||||||||
| Specialty Apparel Stores | ||||||||||||||||||||||
Ross Stores | 11,600 | 742,559 | 1,347,340 | 3.0% | ||||||||||||||||||
TJX Companies | 11,078 | 330,472 | 677,198 | 1.5% | ||||||||||||||||||
| 1,073,031 | 2,024,538 | 4.5% | ||||||||||||||||||||
| 5,366,187 | 12,235,563 | 26.9% | ||||||||||||||||||||
| Consumer Staples | ||||||||||||||||||||||
| Mass Merchants | ||||||||||||||||||||||
Costco Wholesale | 4,883 | 599,638 | 1,463,972 | 3.2% | ||||||||||||||||||
| 599,638 | 1,463,972 | 3.2% | ||||||||||||||||||||
| Financials | ||||||||||||||||||||||
| Consumer Finance | ||||||||||||||||||||||
Ally Financial | 34,000 | 777,141 | 1,082,560 | 2.4% | ||||||||||||||||||
Fidelity National Information Services | 11,144 | 872,896 | 1,539,544 | 3.4% | ||||||||||||||||||
Mastercard, Class A | 8,914 | 806,925 | 2,604,938 | 5.7% | ||||||||||||||||||
| 2,456,962 | 5,227,042 | 11.5% | ||||||||||||||||||||
Continued on next page.
| 40 | November 30, 2019 | Annual Report | The accompanying notes are an integral part of these financial statements. | |||||
Sextant Growth Fund
| Schedule of Investments | As of November 30, 2019 | |||||||||||||||||
| Common Stock – 95.7% | Number of Shares | Cost | Market Value | Percentage of Assets | ||||||||||||||
| Financials(continued) | ||||||||||||||||||
| Diversified Banks | ||||||||||||||||||
JP Morgan Chase | 8,367 | 501,267 | 1,102,436 | 2.4% | ||||||||||||||
| 2,958,229 | 6,329,478 | 13.9% | ||||||||||||||||
| Health Care | ||||||||||||||||||
| Large Pharma | ||||||||||||||||||
Bristol-Myers Squibb | 15,600 | 722,502 | 888,264 | 2.0% | ||||||||||||||
Merck & Co | 10,000 | 837,513 | 871,800 | 1.9% | ||||||||||||||
| 1,560,015 | 1,760,064 | 3.9% | ||||||||||||||||
| Medical Devices | ||||||||||||||||||
Abbott Laboratories | 20,799 | 646,854 | 1,777,274 | 3.9% | ||||||||||||||
Edwards Lifesciences1 | 5,700 | 546,521 | 1,396,158 | 3.1% | ||||||||||||||
Stryker | 3,000 | 374,100 | 614,580 | 1.3% | ||||||||||||||
| 1,567,475 | 3,788,012 | 8.3% | ||||||||||||||||
| 3,127,490 | 5,548,076 | 12.2% | ||||||||||||||||
| Industrials | ||||||||||||||||||
| Commercial & Residential Building Equipment & Systems | ||||||||||||||||||
Honeywell International | 5,000 | 753,256 | 892,750 | 2.0% | ||||||||||||||
| Electrical Components | ||||||||||||||||||
Sensata Technologies Holding1 | 8,500 | 453,176 | 437,665 | 1.0% | ||||||||||||||
TE Connectivity | 6,000 | 549,196 | 556,260 | 1.2% | ||||||||||||||
| 1,002,372 | 993,925 | 2.2% | ||||||||||||||||
| Measurement Instruments | ||||||||||||||||||
Trimble1 | 24,000 | 833,189 | 972,720 | 2.1% | ||||||||||||||
| 2,588,817 | 2,859,395 | 6.3% | ||||||||||||||||
| Materials | ||||||||||||||||||
| Specialty Chemicals | ||||||||||||||||||
RPM International | 18,000 | 737,644 | 1,327,140 | 2.9% | ||||||||||||||
| 737,644 | 1,327,140 | 2.9% | ||||||||||||||||
| Technology | ||||||||||||||||||
| Application Software | ||||||||||||||||||
Adobe Systems1 | 9,300 | 92,094 | 2,878,629 | 6.3% | ||||||||||||||
Take-Two Interactive Software1 | 7,500 | 797,765 | 910,125 | 2.0% | ||||||||||||||
| 889,859 | 3,788,754 | 8.3% | ||||||||||||||||
| Communications Equipment | ||||||||||||||||||
Apple | 10,000 | 11,787 | 2,672,500 | 5.9% | ||||||||||||||
Continued on next page.
| The accompanying notes are an integral part of these financial statements. | Annual Report | November 30, 2019 | 41 | |||||
Sextant Growth Fund
| Schedule of Investments | As of November 30, 2019 | |||||||||||||||||
| Common Stock – 95.7% | Number of Shares | Cost | Market Value | Percentage of Assets | ||||||||||||||
| Technology(continued) | ||||||||||||||||||
| Infrastructure Software | ||||||||||||||||||
Microsoft | 18,920 | 872,435 | 2,864,110 | 6.3% | ||||||||||||||
Oracle | 11,300 | 550,083 | 634,382 | 1.4% | ||||||||||||||
| 1,422,518 | 3,498,492 | 7.7% | ||||||||||||||||
| Semiconductor Devices | ||||||||||||||||||
Qualcomm | 6,000 | 405,540 | 501,300 | 1.1% | ||||||||||||||
Texas Instruments | 3,600 | 386,981 | 432,756 | 0.9% | ||||||||||||||
Xilinx | 9,200 | 853,942 | 853,576 | 1.9% | ||||||||||||||
| 1,646,463 | 1,787,632 | 3.9% | ||||||||||||||||
| 3,970,627 | 11,747,378 | 25.8% | ||||||||||||||||
| Total investments | $20,247,060 | 43,576,681 | 95.7% | |||||||||||||||
| Other assets (net of liabilities) | 1,933,794 | 4.3% | ||||||||||||||||
| Total net assets | $45,510,475 | 100.0% | ||||||||||||||||
| 1 | Non-income producing security |
| 42 | November 30, 2019 | Annual Report | The accompanying notes are an integral part of these financial statements. | |||||
Sextant Growth Fund
Statement of Assets and Liabilities
| As of November 30, 2019 |
| |||
| ||||
Assets | ||||
Investments in securities, at value (Cost $20,247,060) | $43,576,681 | |||
Cash | 1,920,206 | |||
Dividends receivable | 33,968 | |||
Receivable for Fund shares sold | 10,995 | |||
Other assets | 16,365 | |||
Total assets | 45,558,215 | |||
Liabilities | ||||
Accrued advisory fees | 17,872 | |||
Accrued audit expenses | 11,880 | |||
Accrued retirement plan custody fee | 7,667 | |||
Accrued Chief Compliance Officer expenses | 4,197 | |||
Accrued insurance expenses | 2,830 | |||
Accrued other operating expenses | 1,435 | |||
Accrued trustee expenses | 985 | |||
Accrued12b-1 distribution fees | 874 | |||
Total liabilities | 47,740 | |||
Net assets | $45,510,475 | |||
Analysis of net assets | ||||
Paid-in capital (unlimited shares authorized, without par value) | $20,825,704 | |||
Total distributable earnings | 24,684,771 | |||
Net assets applicable to Fund shares outstanding | $45,510,475 | |||
Net asset value per Investor Share | SSGFX | |||
Net assets, at value | $4,532,567 | |||
Shares outstanding | 136,325 | |||
Net asset value, offering and redemption price per share | $33.25 | |||
Net asset value per Z Share | SGZFX | |||
Net assets, at value | $40,977,908 | |||
Shares outstanding | 1,235,854 | |||
Net asset value, offering and redemption price per share | $33.16 | |||
Statement of Operations
| Year ended November 30, 2019 |
| |||
| ||||
Investment income | ||||
Dividend income | $462,531 | |||
Total investment income | 462,531 | |||
Expenses | ||||
Investment adviser fees | 279,840 | |||
Filing and registration fees | 24,453 | |||
Audit fees | 17,922 | |||
Chief Compliance Officer expenses | 12,075 | |||
Other expenses | 10,605 | |||
Distribution fees - Investor Shares | 9,850 | |||
Legal fees | 7,938 | |||
Trustee fees | 7,379 | |||
Retirement plan custodial fees | ||||
Investor Shares | 9 | |||
Z Shares | 7,299 | |||
Printing and postage fees | 4,307 | |||
Custodian fees | 1,650 | |||
Total gross expenses | 383,327 | |||
Less custodian fee credits | (1,566 | ) | ||
Net expenses | 381,761 | |||
Net investment income | $80,770 | |||
| ||||
Net realized gain from investments | $1,280,957 | |||
Net increase in unrealized appreciation on investments | 6,878,691 | |||
Net gain on investments | $8,159,648 | |||
Net increase in net assets resulting from operations | $8,240,418 | |||
| The accompanying notes are an integral part of these financial statements. | Annual Report | November 30, 2019 | 43 | |||||
Sextant Growth Fund
Statements of Changes in Net Assets | Year ended Nov. 30, 2019 | Year ended Nov. 30, 2018 | ||||||
Increase (decrease) in net assets from operations | ||||||||
From operations | ||||||||
Net investment income | $80,770 | $175,267 | ||||||
Net realized gain on investment | 1,280,957 | 1,640,036 | ||||||
Net increase in unrealized appreciation | 6,878,691 | 1,967,640 | ||||||
Net increase in net assets | 8,240,418 | 3,782,943 | ||||||
Distributions to shareowners | ||||||||
Net distribution to shareholders – Investor Shares | (169,455 | ) | (294,960 | ) | ||||
Net distribution to shareholders – Z Shares | (1,652,425 | ) | (1,773,166 | ) | ||||
Total distributions | (1,821,880 | ) | (2,068,126 | ) | ||||
Capital share transactions | ||||||||
Proceeds from sales of shares | ||||||||
Investor Shares | 583,085 | 328,352 | ||||||
Z Shares | 1,729,858 | 2,305,904 | ||||||
Value of shares issued in reinvestment of dividends | ||||||||
Investor Shares | 128,694 | 294,403 | ||||||
Z Shares | 1,612,686 | 1,721,116 | ||||||
Cost of shares redeemed | ||||||||
Investor Shares | (1,779,676 | ) | (1,820,640 | ) | ||||
Z Shares | (2,410,583 | ) | (3,295,790 | ) | ||||
Total capital share transactions | (135,936 | ) | (466,655 | ) | ||||
Total increase in net assets | 6,282,602 | 1,248,162 | ||||||
Net assets | ||||||||
Beginning of year | 39,227,873 | 37,979,711 | ||||||
End of year | $45,510,475 | $39,227,873 | ||||||
Shares of the Fund sold and redeemed | ||||||||
Investor Shares (SSGFX) | ||||||||
Number of shares sold | 18,789 | 11,092 | ||||||
Number of shares issued in reinvestment of dividends and distributions | 5,181 | 11,215 | ||||||
Number of shares redeemed | (63,178 | ) | (63,545 | ) | ||||
Net decrease in number of shares outstanding | (39,208 | ) | (41,238 | ) | ||||
Z Shares (SGZFX) | ||||||||
Number of shares sold | 59,073 | 82,395 | ||||||
Number of shares issued in reinvestment of dividends and distributions | 65,291 | 65,817 | ||||||
Number of shares redeemed | (81,864 | ) | (119,008 | ) | ||||
Net increase in number of shares outstanding | 42,500 | 29,204 | ||||||
| 44 | November 30, 2019 | Annual Report | The accompanying notes are an integral part of these financial statements. | |||||
Sextant Growth Fund:Financial Highlights
Investor Shares (SSGFX) | For year ended November 30, | |||||||||||||||||||
Selected data per share of outstanding capital stock throughout each year: | 2019 | 2018 | 2017 | 2016 | 2015 | |||||||||||||||
Net asset value at beginning of year | $28.70 | $27.51 | $22.52 | $24.03 | $26.36 | |||||||||||||||
Income from investment operations | ||||||||||||||||||||
Net investment income | (0.03 | )A | 0.07 | A | 0.15 | A | 0.11 | 0.03 | ||||||||||||
Net gains (losses) on securities (both realized and unrealized) | 5.86 | 2.53 | 4.93 | (0.88 | ) | (0.25 | ) | |||||||||||||
Total from investment operations | 5.83 | 2.60 | 5.08 | (0.77 | ) | (0.22 | ) | |||||||||||||
Less distributions | ||||||||||||||||||||
Dividends (from net investment income) | (0.04 | ) | (0.07 | ) | (0.09 | ) | (0.02 | ) | (0.04 | ) | ||||||||||
Distributions (from capital gains) | (1.24 | ) | (1.34 | ) | - | (0.72 | ) | (2.07 | ) | |||||||||||
Total distributions | (1.28 | ) | (1.41 | ) | (0.09 | ) | (0.74 | ) | (2.11 | ) | ||||||||||
Net asset value at end of year | $33.25 | $28.70 | $27.51 | $22.52 | $24.03 | |||||||||||||||
Total return | 21.81% | 9.95% | 22.64% | (3.22 | )% | (0.87 | )% | |||||||||||||
Ratios / supplemental data | ||||||||||||||||||||
Net assets ($000), end of year | $4,533 | $5,037 | $5,962 | $34,561 | $55,867 | |||||||||||||||
Ratio of expenses to average net assets | ||||||||||||||||||||
Before custodian fee credits | 1.20% | 0.92% | 0.76% | 0.76% | 0.90% | |||||||||||||||
After custodian fee credits | 1.20% | 0.92% | 0.76% | 0.76% | 0.90% | |||||||||||||||
Ratio of net investment income after custodian fee credits to average net assets | (0.07 | )% | 0.25% | 0.60% | 0.39% | 0.13% | ||||||||||||||
Portfolio turnover rate | 10% | 17% | 18% | 25% | 68% | |||||||||||||||
Z Shares (SGZFX) | For year ended November 30, | Period ended | ||||||||||
Selected data per share of outstanding capital stock throughout each period: | 2019 | 2018 | November 30, 2017 | B | ||||||||
Net asset value at beginning of period | $28.65 | $27.50 | $25.54 | |||||||||
Income from investment operations | ||||||||||||
Net investment income | 0.08 | A | 0.13 | A | 0.16 | A | ||||||
Net gains on securities (both realized & unrealized) | 5.82 | 2.53 | 1.82 | |||||||||
Total from investment operations | 5.90 | 2.66 | 1.98 | |||||||||
Less distributions | ||||||||||||
Dividends (from net investment income) | (0.15 | ) | (0.17 | ) | (0.02 | ) | ||||||
Distributions (from capital gains) | (1.24 | ) | (1.34 | ) | - | |||||||
Total distributions | (1.39 | ) | (1.51 | ) | (0.02 | ) | ||||||
Net asset value at end of period | $33.16 | $28.65 | $27.50 | |||||||||
Total return | 22.22% | 10.20% | 7.73% | C | ||||||||
Ratios / supplemental data | ||||||||||||
Net assets ($000), end of period | $40,978 | $34,191 | $32,017 | |||||||||
Ratio of expenses to average net assets | ||||||||||||
Before custodian fee credits | 0.90% | 0.70% | 0.51% | D | ||||||||
After custodian fee credits | 0.90% | 0.70% | 0.51% | D | ||||||||
Ratio of net investment income after custodian fee credits to average net assets | 0.23% | 0.47% | 0.89% | D | ||||||||
Portfolio turnover rate | 10% | 17% | 18% | C | ||||||||
| A | Calculated using average shares outstanding |
| B | Operations commenced on June 2, 2017 |
| C | Not annualized |
| D | Annualized |
| The accompanying notes are an integral part of these financial statements. | Annual Report | November 30, 2019 | 45 | |||||
Sextant International Fund
Performance Summary | (unaudited) |
Average Annual Total Returns as of November 30, 2019 |
| |||||||||||||||
| 1 Year | 5 Year | 10 Year | Expense Ratio1 | |||||||||||||
Sextant International Fund Investor Shares (SSIFX) | 18.82% | 7.74% | 5.77% | 1.05% | ||||||||||||
Sextant International Fund Z Shares (SIFZX)2 | 19.14% | n/a | n/a | 0.84% | ||||||||||||
MSCI EAFE Index | 13.04% | 4.76% | 5.81% | n/a | ||||||||||||
Growth of $10,000
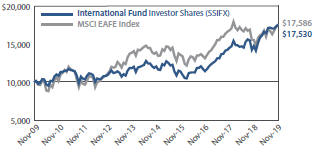 | Comparison of any mutual fund to a market index must be made bearing in mind that the index is unmanaged, and expense-free. Conversely, the fund will (1) be actively managed; (2) have an objective other than mirroring the index, such as limiting risk; (3) bear transaction and other costs; (4) stand ready to buy and sell its securities to shareowners on a daily basis; and (5) provide a wide range of services. The graph compares $10,000 invested in Investor Shares of the Fund on November 30, 2009, to an identical amount invested in the MSCI EAFE Index, an international index focused on Europe, Australasia, and the Far East. The graph shows that an investment in Investor Shares of the Fund would have risen to $17,530 versus $17,586 in the Index. |
Past performance does not guarantee future results. The “Growth of $10,000” graph and “Average Annual Returns” performance table assume the reinvestment of dividends and capital gains. They do not reflect the deduction of taxes that a shareowner might pay on fund distributions or the redemption of fund shares.
| 1 | By regulation, the expense ratio shown in this table is as stated in the Fund’s most recent prospectus, which is dated March 27, 2019, and incorporates results for the fiscal year ended November 30, 2018. The ratio presented in this table differs from expense ratios shown elsewhere in this report as they represent different periods. |
| 2 | Sextant International Fund Z Shares (SIFZX) began operations June 2, 2017. |
Fund Objective
The objective of the International Fund is long-term capital growth.
Top 10 Holdings |
| |||
| % of Total Net Assets | ||||
Wolters Kluwer | 7.3% | |||
NICE Systems ADR | 6.2% | |||
MercadoLibre | 5.9% | |||
ASML Holding | 5.5% | |||
Dassault Systemes ADR | 5.5% | |||
Copa Holdings, Class A | 3.2% | |||
Novartis ADR | 3.1% | |||
BASF ADR | 3.0% | |||
Unilever ADR | 3.0% | |||
Toronto-Dominion Bank | 2.9% | |||
Portfolio Diversification | ||||||||||||
| % of Total Net Assets |
| |||||||||||
Application Software | 15.6% | ∎ |
|
|
| |||||||
Information Services | 7.3% | ∎ | ||||||||||
Airlines | 6.3% | ∎ | ||||||||||
Large Pharma | 6.0% | ∎ | ||||||||||
E-Commerce Discretionary | 5.9% | ∎ | ||||||||||
Semiconductor Manufacturing | 5.5% | ∎ | ||||||||||
Banks | 4.8% | ∎ | ||||||||||
Telecom Carriers | 4.4% | ∎ | ||||||||||
Beverages | 3.5% | ∎ | ||||||||||
Household Products | 3.0% | ∎ | ||||||||||
Basic & Diversified Chemicals | 3.0% | ∎ | ||||||||||
Industries < 3% | 21.7% | ∎ | ||||||||||
Other assets (net of liabilities) | 13.0% | ∎ | ||||||||||

| 46 | November 30, 2019 | Annual Report | ||||
Sextant International Fund
Discussion of Fund Performance | (unaudited) |
(photo omitted)
Fiscal Year 2019
For the fiscal year ended November 30, 2019, the Sextant International Fund Investor Shares returned 18.82%, while the Fund’s benchmark, the MSCI EAFE Index, returned 13.04%. Class Z Shares benefit from lower expenses without a12b-1 fee, and now comprise 31.5% of the Fund.
The Investor Shares paid income dividends of 11¢ per share. The new Z Shares paid an income dividend of 15¢ per share. Total Fund assets increased by 19.62% in fiscal 2019.
Reflecting the lower expense structure (the Fund’s class Z Shares’ do not charge a12b-1 fee) the effective annualized expense ratio of the Z shares was 0.84% compared to 1.06% for the Investor class shares.
Factors Affecting Past Performance
After outperforming its benchmark dramatically in 2018, the Sextant International Fund continued its strong run, returning 18.76% during the fiscal year, while the benchmark MSCI EAFE Index gained 13.04% in US dollar terms. The Technology and Consumer Discretionary sectors provided the largest returns during the year. Technology returns were spread among a variety of companies, but were led by ASML, a Dutch company that dominates the global lithography market. We visited ASML management and toured the facilities at the start of the financial year and came away convinced that the firm’s stranglehold on the market for chip-making equipment would only strengthen in the years to come. Within the Technology sector, France’s Dassault Systemes focuses on 3D modeling and simulation applications, while Israel’s Nice Ltd offers a variety of financial compliance products. Both performed well during the year. Consumer Discretionary returns were dominated by South Americane-commerce leader MercadoLibre. MercadoLibre has been a tremendous investment for the Fund, more that sextupling since the start of 2016. Whilee-commerce supplied the initial boost, the firm’s move into electronic payments provided escape velocity. Based in Argentina, MercadoLibre offerse-commerce solutions throughout Latin America. The Fund received additional Consumer Discretionary returns from LVMH’s purchase of hotel operator Belmond, which closed in January of last year.
Among our Industrials holdings, airlines were a solid source of Fund returns, with Panama’s Copa and Air Canada both enjoying a steady rate of climb throughout the year. Wolters Kluwer, the Dutch provider of electronic media and information services, experienced another strong year as the company moves from the print to electronic transition phase, to developing new and more profitable streams of business.
Health Care performance was muted during the year, although Switzerland’s Novartis and Danish diabetes care leader Novo Nordisk both made positive contributions to Fund returns. With Health Care certain to be a major topic of discussion during the presidential election year, performance may again be lackluster, although both companies provide good downside protection and attractive dividends.
A key aspect of providing positive returns is avoiding significant losses, which was the case during the financial year. Not every investment made a positive contribution but those that did decline only detracted minimally from returns and there was no unifying theme.
Sextant International started the year with a concentrated portfolio of 26 securities. Due to the strong performance in fiscal year 2018, the Fund experienced significant asset inflows. We have taken advantage of this development to reduce concentration by adding several new investments and there are now 36 positions in the Fund. New investments include Adidas, which has been raising its game the past few years, leading consultant Accenture, Japanese airline ANA, Spanish renewable power leader Iberdrola, and French wine and liquor leader Pernod Ricard, among others.
Looking Forward
There has been speculation that 2020 could be a year of relative US dollar weakness, an obvious tailwind for international investing. Exchange rates are notoriously hard to predict, and we have difficulty identifying catalysts leading to a strengthening of overseas currencies when debt and demographic challenges are often greater than our own. Regardless, the discussion illuminates the benefits of diversifying portfolios through an allocation to international securities. International markets, Europe and Japan broadly speaking, also trade at attractive valuations relative to the United States, not only in absolute terms but also relative to their historical relationship with US equities. Of course, Europe must wrestle with the fallout from the UK’s departure from the European Union now that Prime Minster Boris Johnson and the UK Parliament have finalized Brexit. Japan faces a daunting challenge with its shrinking population, but reforms promoted by Prime Minister Abe appear to be gaining traction.
Management Fee Calculations
The Sextant International Fund calculates the performance part of its management fee by comparing the Fund’s return to the average return of Morningstar’sTM “Foreign Large Blend” category.
Sextant International Fund Investor Shares’12-month return of 18.76% was more than 2% above the MorningstarTM category average of 16.71% atmonth-end November 30, 2019. Therefore, the basic annual management fee of 0.50% was increased by 0.20% to 0.70% for the Fund as a whole for the month of December 2019.
| Annual Report | November 30, 2019 | 47 | ||||
Sextant International Fund
| Schedule of Investments | As of November 30, 2019 | |||||||||||||||||||||
| Common Stocks – 87.0% | Number of Shares | Cost | Market Value | Country1 | Percentage of Assets | |||||||||||||||||
| Communications | ||||||||||||||||||||||
| Telecom Carriers | ||||||||||||||||||||||
BCE | 50,000 | $1,164,294 | $2,403,500 | Canada | 2.5% | |||||||||||||||||
Telus | 50,000 | 710,476 | 1,887,500 | Canada | 1.9% | |||||||||||||||||
| 1,874,770 | 4,291,000 | 4.4% | ||||||||||||||||||||
| Consumer Discretionary | ||||||||||||||||||||||
| Airlines | ||||||||||||||||||||||
Air Canada2 | 60,000 | 1,442,774 | 2,252,616 | Canada | 2.3% | |||||||||||||||||
ANA Holdings | 25,000 | 843,274 | 851,077 | Japan | 0.8% | |||||||||||||||||
Copa Holdings, Class A | 30,000 | 1,766,222 | 3,127,800 | Panama | 3.2% | |||||||||||||||||
| 4,052,270 | 6,231,493 | 6.3% | ||||||||||||||||||||
| Apparel, Footwear & Accessory Design | ||||||||||||||||||||||
Adidas | 6,000 | 1,743,151 | 1,872,140 | Germany | 1.9% | |||||||||||||||||
| Automobiles | ||||||||||||||||||||||
Subaru ADR | 50,000 | 653,742 | 654,825 | Japan | 0.7% | |||||||||||||||||
Toyota Motor ADR | 10,000 | 748,148 | 1,402,100 | Japan | 1.4% | |||||||||||||||||
| 1,401,890 | 2,056,925 | 2.1% | ||||||||||||||||||||
| E-Commerce Discretionary | ||||||||||||||||||||||
MercadoLibre | 10,000 | 829,340 | 5,805,800 | Argentina | 5.9% | |||||||||||||||||
| Specialty Apparel Stores | ||||||||||||||||||||||
Industria de Diseno Textil | 60,000 | 1,985,609 | 1,868,224 | Spain | 1.9% | |||||||||||||||||
| 10,012,260 | 17,834,582 | 18.1% | ||||||||||||||||||||
| Consumer Staples | ||||||||||||||||||||||
| Beverages | ||||||||||||||||||||||
Fomento Economico Mex ADR | 30,000 | 1,614,722 | 2,727,900 | Mexico | 2.8% | |||||||||||||||||
Pernod Ricard ADR | 20,000 | 709,440 | 735,600 | France | 0.7% | |||||||||||||||||
| 2,324,162 | 3,463,500 | 3.5% | ||||||||||||||||||||
| Household Products | ||||||||||||||||||||||
Unilever ADR | 50,000 | 1,315,509 | 2,974,500 | United Kingdom | 3.0% | |||||||||||||||||
| 3,639,671 | 6,438,000 | 6.5% | ||||||||||||||||||||
| Energy | ||||||||||||||||||||||
| Integrated Oils | ||||||||||||||||||||||
Total ADR | 39,100 | 2,112,969 | 2,054,314 | France | 2.1% | |||||||||||||||||
| 2,112,969 | 2,054,314 | 2.1% | ||||||||||||||||||||
| Financials | ||||||||||||||||||||||
| Banks | ||||||||||||||||||||||
Australia & New Zealand Banking ADR | 80,000 | 1,581,456 | 1,344,000 | Australia | 1.4% | |||||||||||||||||
Commerzbank ADR | 80,000 | 458,347 | 461,600 | Germany | 0.5% | |||||||||||||||||
Toronto-Dominion Bank | 50,000 | 1,250,872 | 2,890,000 | Canada | 2.9% | |||||||||||||||||
| 3,290,675 | 4,695,600 | 4.8% | ||||||||||||||||||||
Continued on next page.
| 48 | November 30, 2019 | Annual Report | The accompanying notes are an integral part of these financial statements. | |||||
Sextant International Fund
| Schedule of Investments | As of November 30, 2019 | |||||||||||||||||||||
| Common Stocks –87.0% | Number of Shares | Cost | Market Value | Country1 | Percentage of Assets | |||||||||||||||||
| Financials (continued) | ||||||||||||||||||||||
| Diversified Banks | ||||||||||||||||||||||
Mitsubishi UFJ Financial Group ADR | 350,000 | 1,694,977 | 1,858,500 | Japan | 1.9% | |||||||||||||||||
| 4,985,652 | 6,554,100 | 6.7% | ||||||||||||||||||||
| Health Care | ||||||||||||||||||||||
| Health Care Supply Chain | ||||||||||||||||||||||
Sinopharm Group | 250,000 | 798,791 | 825,735 | China | 0.8% | |||||||||||||||||
| Large Pharma | ||||||||||||||||||||||
Novartis ADR | 33,000 | 1,488,815 | 3,045,900 | Switzerland | 3.1% | |||||||||||||||||
Novo Nordisk ADR | 50,000 | 612,798 | 2,807,500 | Denmark | 2.9% | |||||||||||||||||
| 2,101,613 | 5,853,400 | 6.0% | ||||||||||||||||||||
| Medical Equipment | ||||||||||||||||||||||
Alcon2 | 15,000 | 708,000 | 829,350 | Switzerland | 0.9% | |||||||||||||||||
Koninklijke Philips | 32,000 | 1,234,087 | 1,487,360 | Netherlands | 1.5% | |||||||||||||||||
| 1,942,087 | 2,316,710 | 2.4% | ||||||||||||||||||||
| 4,842,491 | 8,995,845 | 9.2% | ||||||||||||||||||||
| Industrials | ||||||||||||||||||||||
| Marine Shipping | ||||||||||||||||||||||
Frontline2 | 60,000 | 675,330 | 673,800 | Norway | 0.7% | |||||||||||||||||
| 675,330 | 673,800 | 0.7% | ||||||||||||||||||||
| Materials | ||||||||||||||||||||||
| Agricultural Chemicals | ||||||||||||||||||||||
Nutrien | 25,000 | 1,426,939 | 1,185,500 | Canada | 1.2% | |||||||||||||||||
| Basic & Diversified Chemicals | ||||||||||||||||||||||
BASF ADR | 160,000 | 2,888,666 | 2,993,600 | Germany | 3.0% | |||||||||||||||||
| Steel Raw Material Suppliers | ||||||||||||||||||||||
Rio Tinto ADR | 35,000 | 1,890,443 | 1,909,600 | United Kingdom | 2.0% | |||||||||||||||||
| 6,206,048 | 6,088,700 | 6.2% | ||||||||||||||||||||
| Technology | ||||||||||||||||||||||
| Application Software | ||||||||||||||||||||||
Dassault Systemes ADR | 34,153 | 1,224,632 | 5,398,223 | France | 5.5% | |||||||||||||||||
NICE Systems ADR | 40,000 | 1,468,919 | 6,059,600 | Israel | 6.2% | |||||||||||||||||
Open Text US | 50,000 | 2,072,526 | 2,179,000 | Canada | 2.2% | |||||||||||||||||
SAP ADR | 12,850 | 1,654,051 | 1,746,958 | Germany | 1.7% | |||||||||||||||||
| 6,420,128 | 15,383,781 | 15.6% | ||||||||||||||||||||
| Consumer Electronics | ||||||||||||||||||||||
Sony ADR | 17,000 | 991,087 | 1,079,160 | Japan | 1.1% | |||||||||||||||||
| Information Services | ||||||||||||||||||||||
Wolters Kluwer | 100,000 | 1,869,506 | 7,187,436 | Netherlands | 7.3% | |||||||||||||||||
Continued on next page.
| The accompanying notes are an integral part of these financial statements. | Annual Report | November 30, 2019 | 49 | |||||
Sextant International Fund
| Schedule of Investments | As of November 30, 2019 | |||||||||||||||||||||
| Common Stocks – 87.0% | Number of Shares | Cost | Market Value | Country1 | Percentage of Assets | |||||||||||||||||
| Technology(continued) | ||||||||||||||||||||||
| IT Services | ||||||||||||||||||||||
Accenture, Class A | 9,250 | 1,709,475 | 1,860,730 | Ireland | 1.9% | |||||||||||||||||
| Semiconductor Manufacturing | ||||||||||||||||||||||
ASML | 20,000 | 697,516 | 5,412,400 | Netherlands | 5.5% | |||||||||||||||||
| 11,687,712 | 30,923,507 | 31.4% | ||||||||||||||||||||
| Utilities | ||||||||||||||||||||||
| Power Generation | ||||||||||||||||||||||
Iberdrola | 173,953 | 1,743,884 | 1,712,541 | Spain | 1.7% | |||||||||||||||||
| 1,743,884 | 1,712,541 | 1.7% | ||||||||||||||||||||
| Total investments | $47,780,787 | 85,566,389 | 87.0% | |||||||||||||||||||
| Other assets (net of liabilities) | 12,786,597 | 13.0% | ||||||||||||||||||||
| Total net assets | $98,352,986 | 100.0% | ||||||||||||||||||||
| 1 | Country of domicile |
| 2 | Non-income producing security |
ADR: American Depositary Receipt
Countries | (unaudited) | |||
|
| |||
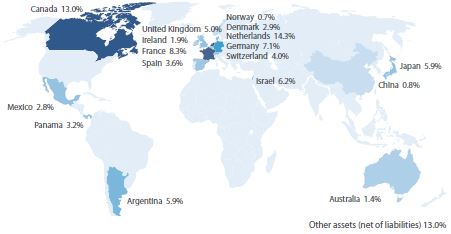 |
| |||
| Weightings shown are a percentage of total net assets. |
| |||
| 50 | November 30, 2019 | Annual Report | The accompanying notes are an integral part of these financial statements. | |||||
Sextant International Fund
Statement of Assets and Liabilities | ||||
| As of November 30, 2019 |
| |||
|
| |||
Assets | ||||
Investments in securities, at value | $85,566,389 | |||
Cash | 14,230,455 | |||
Recoverable tax receivable | 175,179 | |||
Dividends and interest receivable | 148,216 | |||
Other assets | 23,264 | |||
Receivable for Fund shares sold | 5,399 | |||
Total assets | 100,148,902 | |||
Liabilities | ||||
Payable for Fund shares redeemed | 1,700,307 | |||
Accrued advisory fees | 46,230 | |||
Accrued audit expenses | 19,525 | |||
Accrued12b-1 distribution fees | 16,214 | |||
Accrued retirement plan custody fee | 5,872 | |||
Accrued Chief Compliance Officer expenses | 3,446 | |||
Accrued other operating expenses | 3,270 | |||
Accrued trustee expenses | 1,052 | |||
Total liabilities | 1,795,916 | |||
Net assets | $98,352,986 | |||
Analysis of net assets | ||||
Paid-in capital (unlimited shares authorized, without par value) | $57,174,226 | |||
Total distributable earnings | 41,178,760 | |||
Net assets applicable to Fund shares outstanding | $98,352,986 | |||
Net asset value per Investor Share | SSIFX | |||
Net assets, at value | $67,389,868 | |||
Shares outstanding | 3,643,572 | |||
Net asset value, offering and redemption price per share | $18.50 | |||
Net asset value per Z Share | SIFZX | |||
Net assets, at value | $30,963,118 | |||
Shares outstanding | 1,669,593 | |||
Net asset value, offering and redemption price per share | $18.55 | |||
Statement of Operations
| Year ended November 30, 2019 |
| |||
|
| |||
Investment income | ||||
Dividend income (net of foreign tax $226,021) | $1,459,678 | |||
Total investment income | 1,459,678 | |||
Expenses | ||||
Investment adviser fees | 565,056 | |||
Distribution fees - Investor Shares | 148,607 | |||
Audit fees | 34,751 | |||
Filing and registration fees | 25,940 | |||
Chief Compliance Officer expenses | 17,087 | |||
Other operating expenses | 16,571 | |||
Trustee fees | 14,644 | |||
Legal fees | 13,216 | |||
Printing and postage fees | 11,102 | |||
Custodian fees | 6,211 | |||
Retirement plan custodial fees | ||||
Investor Shares | 9 | |||
Z Shares | 4,200 | |||
Total gross expenses | 857,394 | |||
Less custodian fee credits | (6,067 | ) | ||
Net expenses | 851,327 | |||
Net investment income | $608,351 | |||
| ||||
Net realized gain from investments and foreign currency | $2,790,326 | |||
Net increase in unrealized appreciation on investments and foreign currency | 9,915,749 | |||
Net gain on investments | $12,706,075 | |||
Net increase in net assets resulting from operations | $13,314,426 | |||
| The accompanying notes are an integral part of these financial statements. | Annual Report | November 30, 2019 | 51 | |||||
Sextant International Fund
Statements of Changes in Net Assets | Year ended Nov. 30, 2019 | Year ended Nov. 30, 2018 | ||||||
Increase (decrease) in net assets from operations | ||||||||
From operations | ||||||||
Net investment income | $608,351 | $623,611 | ||||||
Net realized gain on investment | 2,790,326 | 3,896,894 | ||||||
Net increase (decrease) in unrealized appreciation | 9,915,749 | (3,361,106 | ) | |||||
Net increase in net assets | 13,314,426 | 1,159,399 | ||||||
Distributions to shareowners | ||||||||
Net distribution to shareholders - Investor Shares | (2,929,551 | ) | (3,595,584 | ) | ||||
Net distribution to shareholders - Z Shares | (1,596,893 | ) | (1,678,906 | ) | ||||
Total distributions | (4,526,444 | ) | (5,274,490 | ) | ||||
Capital share transactions | ||||||||
Proceeds from sales of shares | ||||||||
Investor Shares | 44,612,650 | 4,219,098 | ||||||
Z Shares | 9,895,572 | 1,332,045 | ||||||
Value of shares issued in reinvestment of dividends | ||||||||
Investor Shares | 2,886,627 | 3,545,645 | ||||||
Z Shares | 1,555,608 | 1,619,175 | ||||||
Cost of shares redeemed | ||||||||
Investor Shares | (27,878,254 | ) | (9,575,271 | ) | ||||
Z Shares | (3,886,967 | ) | (1,998,163 | ) | ||||
Total capital share transactions | 27,185,236 | (857,471 | ) | |||||
Total increase (decrease) in net assets | 35,973,218 | (4,972,562 | ) | |||||
Net assets | ||||||||
Beginning of year | 62,379,768 | 67,352,330 | ||||||
End of year | $98,352,986 | $62,379,768 | ||||||
Shares of the Fund sold and redeemed | ||||||||
Investor Shares (SSIFX) | ||||||||
Number of shares sold | 2,532,126 | 247,089 | ||||||
Number of shares issued in reinvestment of dividends and distributions | 195,174 | 211,176 | ||||||
Number of shares redeemed | (1,561,321 | ) | (556,311 | ) | ||||
Net increase (decrease) in number of shares outstanding | 1,165,979 | (98,046 | ) | |||||
Z Shares (SIFZX) | ||||||||
Number of shares sold | 568,002 | 77,828 | ||||||
Number of shares issued in reinvestment of dividends and distributions | 105,108 | 96,380 | ||||||
Number of shares redeemed | (229,953 | ) | (115,999 | ) | ||||
Net increase in number of shares outstanding | 443,157 | 58,209 | ||||||
| 52 | November 30, 2019 | Annual Report | The accompanying notes are an integral part of these financial statements. | |||||
Sextant International Fund:Financial Highlights
Investor Shares (SSIFX) | For year ended November 30, | |||||||||||||||||||
Selected data per share of outstanding capital stock throughout each year: | 2019 | 2018 | 2017 | 2016 | 2015 | |||||||||||||||
Net asset value at beginning of year | $16.83 | $17.98 | $14.37 | $14.35 | $15.47 | |||||||||||||||
Income from investment operations | ||||||||||||||||||||
Net investment income | 0.12 | A | 0.15 | A | 0.16 | A | 0.22 | 0.25 | ||||||||||||
Net gains (losses) on securities (both realized and unrealized) | 2.74 | 0.14 | 3.65 | (0.15 | ) | (1.11 | ) | |||||||||||||
Total from investment operations | 2.86 | 0.29 | 3.81 | 0.07 | (0.86 | ) | ||||||||||||||
Less distributions | ||||||||||||||||||||
Dividends (from net investment income) | (0.15 | ) | (0.17 | ) | (0.20 | ) | (0.05 | ) | (0.25 | ) | ||||||||||
Distributions (from capital gains) | (1.04 | ) | (1.27 | ) | ||||||||||||||||
Distributions (from return of capital) | - | - | - | - | (0.01 | ) | ||||||||||||||
Total distributions | (1.19 | ) | (1.44 | ) | (0.20 | ) | (0.05 | ) | (0.26 | ) | ||||||||||
Net asset value at end of year | $18.50 | $16.83 | $17.98 | $14.37 | $14.35 | |||||||||||||||
Total return | 18.82% | 1.63% | 26.76% | 0.49% | (5.58 | )% | ||||||||||||||
Ratios / supplemental data | ||||||||||||||||||||
Net assets ($000), end of year | $67,390 | $41,688 | $46,321 | $62,412 | $78,296 | |||||||||||||||
Ratio of expenses to average net assets | ||||||||||||||||||||
Before custodian fee credits | 1.07% | 1.05% | 1.04% | 1.00% | 1.05% | |||||||||||||||
After custodian fee credits | 1.06% | 1.04% | 1.04% | 1.00% | 1.04% | |||||||||||||||
Ratio of net investment income after custodian fee credits to average net assets | 0.62% | 0.89% | 1.00% | 1.36% | 1.49% | |||||||||||||||
Portfolio turnover rate | 6% | 2% | 2% | 0% | 0% | |||||||||||||||
Z Shares (SIFZX) | For year ended November 30, | Period ended | ||||||||||
Selected data per share of outstanding capital stock throughout each period: | 2019 | 2018 | November 30, 2017 | B | ||||||||
Net asset value at beginning of period | $16.87 | $18.00 | $16.55 | |||||||||
Income from investment operations | ||||||||||||
Net investment income | 0.19 | A | 0.19 | A | 0.13 | A | ||||||
Net gains on securities (both realized & unrealized) | 2.72 | 0.14 | 1.41 | |||||||||
Total from investment operations | 2.91 | 0.33 | 1.54 | |||||||||
Less distributions | ||||||||||||
Dividends (from net investment income) | (0.19 | ) | (0.19 | ) | (0.09 | ) | ||||||
Distributions (from capital gains) | (1.04 | ) | (1.27 | ) | - | |||||||
Total distributions | (1.23 | ) | (1.46 | ) | (0.09 | ) | ||||||
Net asset value at end of period | $18.55 | $16.87 | $18.00 | |||||||||
Total return | 19.14% | 1.83% | 9.32% | C | ||||||||
Ratios / supplemental data | ||||||||||||
Net assets ($000), end of period | $30,963 | $20,692 | $21,031 | |||||||||
Ratio of expenses to average net assets | ||||||||||||
Before custodian fee credits | 0.85% | 0.84% | 0.79% | D | ||||||||
After custodian fee credits | 0.84% | 0.82% | 0.78% | D | ||||||||
Ratio of net investment income after custodian fee credits to average net assets | 0.91% | 1.13% | 0.53% | D | ||||||||
Portfolio turnover rate | 6% | 2% | 2% | C | ||||||||
| A | Calculated using average shares outstanding |
| B | Operations commenced on June 2, 2017 |
| C | Not annualized |
| D | Annualized |
| The accompanying notes are an integral part of these financial statements. | Annual Report | November 30, 2019 | 53 | |||||
| Notes To Financial Statements |
NOTE 1 – Organization
Saturna Investment Trust (the “Trust”) was established under Washington State Law as a business trust on February 20, 1987. The Trust is registered as anopen-end, diversified management company under the Investment Company Act of 1940, as amended. Nine portfolio series have been created to date: Sextant Short-Term Bond Fund, Sextant Bond Income Fund, Sextant Core Fund, Sextant Global High Income Fund, Sextant Growth Fund, Sextant International Fund (each, a “Fund”, and collectively, the “Funds”), IdahoTax-Exempt Fund, Saturna Sustainable Equity Fund, and Saturna Sustainable Bond Fund. IdahoTax-Exempt Fund, Saturna Sustainable Equity Fund, and Saturna Sustainable Bond Fund are offered through separate prospectuses, the results of which are contained in separate reports.
Sextant Growth Investor Shares (previously known as Idaho Limited MaturityTax-Exempt Fund until October 12, 1990, then Northwest Growth Fund until September 28, 1995, when the investment objective of only Northwest stocks was changed) commenced operations as an equity fund on December 30, 1990. Sextant Growth Fund Z Shares began operations June 2, 2017. Sextant International Investor Shares began operations September 28, 1995 and Sextant International Fund Z Shares began operations on June 2, 2017. Sextant Short-Term Bond began operations September 28, 1995. Sextant Bond Income Fund (previously known as WashingtonTax-Exempt Fund until September 28, 1995, when the investment objective of only Washington State Municipal Bonds was changed) began operations on March 1, 1993. Sextant Core Fund commenced operations March 30, 2007. Sextant Global High Income Fund commenced operations March 30, 2012.
Each Fund is an investment company and accordingly follows the investment company accounting and reporting guidance of the Financial Accounting Standards Board (FASB) Accounting Standard Codification Topic 946 “Financial Services - Investment Companies”.
Each class of shares of a Fund represents an interest in the same portfolio of investments of the Fund and has in all respects the same rights and obligations as each other class of the Fund, except that each class bears its own class expenses, and each class has exclusive voting rights. Each class of shares may be subject to different investment minimums and other conditions of eligibility as may be described in the prospectus for the particular class of shares, as from time to time in effect.
Income, realized and unrealized capital gains and losses, and expenses to be paid by a Fund and not allocated to a particular class as provided below, shall be allocated to each class on the basis of relative net assets. Expenses allocable to a specific class are expenses specifically incurred by or for such class including the following:
| • | Distribution fees; |
| • | Retirement plan custodial fees; and |
| • | Any applicable service fees. |
Net investment income dividends and capital gain distributions paid by the Fund on each class of its shares will be calculated in the same manner on the same day and at the same time.
Investment risks:
Growth, International, Core, Short-Term Bond, Bond Income, andGlobal High Income Funds: The value of each Fund’s shares rises and falls as the value of the securities in which the Fund invests goes up and down. Fund share prices, yields, and total returns will change with market fluctuations as well as the fortunes of the countries, industries, and companies in which the Fund invests. The Funds do not use derivatives to hedge currency, interest rate, or credit risk.
Liquidity risk exists when particular investments are difficult to sell. If a Fund holds illiquid investments, its portfolio may be more difficult to value, especially in changing markets. Investments by a Fund in foreign securities and those that are thinly traded, such as lower quality issuers and smaller companies, tend to involve greater liquidity risk. If a Fund is forced to sell or unwind these investments to meet redemptions or for other cash needs, the Fund may suffer a penalty. Additionally, the market for certain investments may become illiquid under adverse market or economic conditions independent of any specific adverse changes in the conditions of a particular issuer. In such cases, the Fund, due to limitations on investments in illiquid securities and the difficulty in purchasing and selling such securities, may be unable to achieve its investment objective.
Growth andCore Funds: Smaller companies involve higher investment risks in that they often have limited product lines, markets, and resources, or their securities may trade less frequently and have greater price fluctuation than those of larger companies.
Growth stocks, which can be priced on future expectations rather than current results, may decline substantially when expectations are not met.
International, Core, Short-Term Bond, Bond Income, andGlobal High Income Funds: Foreign investing involves risks not normally associated with investing in US securities. These include fluctuations in currency exchange rates, less public information about securities, less governmental market supervision, and the lack of uniform financial, social, and political standards. Foreign investing heightens the risk of confiscatory taxation, seizure or nationalization of assets, currency controls, or adverse political or social developments that affect investments. The risks of investing in foreign securities are typically greater in less developed or emerging countries.
Core Fund: The Core Fund has the risks of growth stocks, foreign securities, credit, and interest rates — but these risks are mitigated by spreading its investments in both stocks and bonds, and by favoring income-producing securities and those of larger, more seasoned companies.
Short-Term Bond,Bond Income,Global High Income, andCore Funds: Bonds entail credit risk, which is the possibility that a bond will not be able to pay interest or principal when due. If the credit quality of a bond is perceived to decline, investors will demand a higher yield, which means a lower price on that bond to compensate for the higher level of risk.
Interest rate fluctuations affect bond prices and a Fund’s net asset value, but not the income received by the Fund from its portfolio securities. Because prices and yields on debt securities vary over time, a Fund’s yield also varies. Bonds with embedded callable options also contain an element of prepayment risk. When interest rates decline, issuers can retire their debt and reissue bonds at a lower interest rate. This hurts investors because yields available for reinvestment will have declined and upward price mobility on callable bonds is generally limited by the call price.
Global High Income Fund: Issuers of high-yield securities are generally not as strong financially as those issuing higher quality securities. These issuers are more likely to encounter financial difficulties and are more vulnerable to changes in the relevant economy, such as a recession or a sustained period of rising interest rates, that could affect their ability to make interest, principal, and dividend payments as expected. The prices of high-yield securities generally fluctuate more than those of higher quality. High-yield securities are generally more illiquid (harder to sell) and harder to value.
The Funds may invest substantially in one or more sectors, which can increase volatility and exposure to issues specific to a particular sector or industry.
| 54 | November 30, 2019 | Annual Report | ||||
| Notes To Financial Statements(continued) |
NOTE 2 – Significant Accounting Policies
The following is a summary of the significant accounting policies, in conformity with accounting principles generally accepted in the United States of America, which are consistently followed by the Funds in preparation of their financial statements.
Security valuation:
Investments in securities traded on a national securities exchange andover-the-counter securities for which sale prices are available are valued at that price. Securities for which there are no sales are valued at the latest bid price.
Debt securities are valued usingbid-side valuations provided by an independent service. The service determines valuations using factors such as yields or prices of bonds of comparable quality, type of issue, coupon maturity, ratings, trading activity, and general market conditions.
Fixed-income debt instruments, such as commercial paper, bankers’ acceptances and US Treasury Bills, with a maturity of 60 days or less are valued at amortized cost, which approximates market value. Any discount or premium is accreted or amortized on a straight-line basis until maturity.
Foreign markets may close before the time as of which the Funds’ share prices are determined. Because of this, events occurring after the close and before the determination of the Funds’ share prices may have a material effect on the values of some or all of the Funds’ foreign securities. To account for this, the Funds may use outside pricing services for valuation of theirnon-US securities.
In cases in which there is not a readily available market price, a fair value for such security is determined in good faith by or under the direction of the Board of Trustees.
Security transactions are recorded on the trade date. Realized gains and losses on sales of securities are recorded on the identified cost basis.
Foreign currency:
Investment securities and other assets and liabilities denominated in foreign currencies are translated into US dollar amounts at the date of valuation. Purchases and sales of investment securities and income and expense items denominated in foreign currencies are translated into US dollar amounts on the respective dates of such transactions.
The Funds do not isolate that portion of the results of operations resulting from changes in foreign exchange rates on investments from the fluctuations arising from changes in market prices of securities held. Such fluctuations are included with the net realized and unrealized gain or loss from investments.
Reported net realized foreign exchange gains or losses arise from sales of foreign currencies, currency gains or losses realized between the trade and settlement dates on securities transactions, and the difference between the amounts of dividends, interest, and foreign withholding taxes recorded on the Funds’ books and the US dollar equivalent of the amounts actually received or paid. Net unrealized foreign exchange gains and losses arise from changes in the fair values of assets and liabilities, other than investments in securities at the fiscal period end, resulting from changes in exchange rates.
Share valuation:
The net asset value (“NAV”) per share of each Fund is calculated by dividing the sum of the value of the securities held by each Fund, plus cash and other assets, minus all liabilities (including estimated accrued expenses) by the total number of shares outstanding for each Fund, rounded to the nearest cent. The Funds’ shares are not priced or traded on days the New York Stock Exchange is closed. The NAV is the offering and redemption price per share.
Fair value measurements:
Accounting Standards Codification (ASC) 820 establishes a three-tier framework for measuring fair value based on a hierarchy of inputs. The hierarchy distinguishes between market data obtained from independent sources (observable inputs) and the Funds’ own market assumptions (unobservable inputs). These inputs are used in determining the value of the Funds’ investments and are summarized below.
| Level 1 — | Unadjusted quoted prices in active markets for identical assets or liabilities that the Trust has the ability to access. |
| Level 2 — | Observable inputs other than quoted prices in Level 1 that are observable for the asset or liability, either directly or indirectly. These inputs may include quoted prices for the identical instrument on an inactive market, prices for similar instruments, interest rates, prepayment speeds, credit risk, yield curves, default rates, and similar data. |
| Level 3 — | Unobservable inputs for the asset or liability, to the extent relevant observable inputs are not available, representing the Trust’s own assumptions about the assumptions a market participant would use in valuing the asset or liability, and would be based on the best information available. |
The availability of observable inputs can vary from security to security and is affected by a wide variety of factors, including, for example, the type of security, whether the security is new and not yet established in the marketplace, the liquidity of markets, and other characteristics particular to the security. To the extent that valuation is based on models or inputs that are less observable or unobservable in the market, the determination of fair value requires more judgment. Accordingly, the degree of judgment exercised in determining fair value is greatest for instruments categorized in Level 3.
The inputs used to measure fair value may fall into different levels of the fair value hierarchy. In such cases, for disclosure purposes, the level in the fair value hierarchy within which the fair value measurement falls in its entirety, is determined based on the lowest level input that is significant to the fair value measurement in its entirety.
The inputs or methodology used for valuing securities are not necessarily an indication of the risk associated with investing in those securities.
| Annual Report | November 30, 2019 | 55 | ||||
| Notes To Financial Statements(continued) |
The following is a summary of the inputs used as of November 30, 2019, in valuing the Funds’ investments carried at value:
| Funds | Level 1 | Level 2 | Level 3 | Total | ||||||||||||
Short-Term Bond | ||||||||||||||||
Corporate Bonds1 | $- | $8,155,556 | $- | $8,155,556 | ||||||||||||
Government Bonds1 | - | 2,592,732 | - | 2,592,732 | ||||||||||||
Total | $- | $10,748,288 | $- | $10,748,288 | ||||||||||||
Bond Income | ||||||||||||||||
Corporate Bonds1 | $- | $7,507,155 | $- | $7,507,155 | ||||||||||||
Government Bonds1 | - | 3,056,748 | - | 3,056,748 | ||||||||||||
Municipal Bonds1 | - | 1,320,356 | - | $1,320,356 | ||||||||||||
Total | $- | $11,884,259 | $- | $11,884,259 | ||||||||||||
Core | ||||||||||||||||
Common Stocks1 | $10,097,451 | $- | $- | $10,097,451 | ||||||||||||
Corporate Bonds1 | - | 3,189,705 | - | 3,189,705 | ||||||||||||
Government Bonds1 | - | 2,052,523 | - | 2,052,523 | ||||||||||||
Municipal Bonds1 | - | 440,824 | - | 440,824 | ||||||||||||
Total | $10,097,451 | $5,683,052 | $- | $15,780,503 | ||||||||||||
Global High Income | ||||||||||||||||
Common Stocks | ||||||||||||||||
Communications | $690,630 | $- | $- | $690,630 | ||||||||||||
Consumer Discretionary | 178,126 | - | - | 178,126 | ||||||||||||
Energy | 802,180 | - | - | 802,180 | ||||||||||||
Financials | 496,380 | 171,505 | - | 667,885 | ||||||||||||
Health Care | 402,770 | - | - | 402,770 | ||||||||||||
Industrials | - | 156,915 | - | 156,915 | ||||||||||||
Materials | 379,210 | - | - | 379,210 | ||||||||||||
Technology | 176,040 | - | - | 176,040 | ||||||||||||
Total Common Stocks | 3,125,336 | 328,420 | - | 3,453,756 | ||||||||||||
Corporate Bonds1 | - | 2,393,271 | - | 2,393,271 | ||||||||||||
Government Bonds1 | - | 1,778,950 | - | 1,778,950 | ||||||||||||
Municipal Bonds1 | - | 211,410 | - | 211,410 | ||||||||||||
Warrants1 | - | - | - | - | ||||||||||||
Total | $3,125,336 | $4,712,051 | $- | $7,837,387 | ||||||||||||
Growth | ||||||||||||||||
Common Stocks1 | $43,576,681 | $- | $- | $43,576,681 | ||||||||||||
Total | $43,576,681 | $- | $- | $43,576,681 | ||||||||||||
International | ||||||||||||||||
Common Stocks | ||||||||||||||||
Communications | $4,291,000 | $- | $- | $4,291,000 | ||||||||||||
Consumer Discretionary | 10,990,525 | 6,844,057 | - | 17,834,582 | ||||||||||||
Consumer Staples | 6,438,000 | - | - | 6,438,000 | ||||||||||||
Energy | 2,054,314 | - | - | 2,054,314 | ||||||||||||
Financials | 6,554,100 | - | - | 6,554,100 | ||||||||||||
Health Care | 8,170,110 | 825,735 | - | 8,995,845 | ||||||||||||
Industrials | 673,800 | - | - | 673,800 | ||||||||||||
Materials | 6,088,700 | - | - | 6,088,700 | ||||||||||||
Technology | 23,736,071 | 7,187,436 | - | 30,923,507 | ||||||||||||
Utilities | - | 1,712,541 | - | 1,712,541 | ||||||||||||
Total | $68,996,620 | $16,569,769 | $- | $85,566,389 | ||||||||||||
During the period ended November 30, 2019, no Fund had transfers between Level 1, Level 2, or Level 3.
| 1 | See Schedule of Investments for industry breakout. |
| 56 | November 30, 2019 | Annual Report | ||||
| Notes To Financial Statements(continued) |
Investment concentration:
The Funds may have deposits of cash with the custodian from time to time for one or more reasons. “Other assets (net of liabilities)” in the Funds’ Schedules of Investments primarily represents cash on deposit with the custodian. Cash on deposit will vary widely over time. Accounting Standards Codification (“ASC”) 825,“Financial Instruments,” identifies these items as a concentration of credit risk. The risk is managed by careful financial analysis and review of the custodian’s operations, resources, and protections available to the Trust. This process includes evaluation of other financial institutions providing investment company custody services.
Federal income taxes:
The Funds intend to comply with the requirements of the Internal Revenue Code necessary to qualify as a regulated investment company and to make the requisite distributions of income and capital gains to its shareowners sufficient to relieve it from all or substantially all federal income taxes. Therefore, no federal income tax provision is required.
The Funds recognize the tax benefits of uncertain tax positions only where the position is “more likely than not” to be sustained assuming examination by tax authorities. Management has analyzed the Funds’ tax positions and has concluded that no liability for unrecognized tax benefits should be recorded related to uncertain tax positions taken on returns filed for open tax years (2016 – 2018) or expected to be taken in the Funds’ 2019 tax returns. The Funds identify their major tax jurisdictions as US federal and foreign jurisdictions where the Funds make significant investments; however, the Funds are not aware of any tax positions for which it is reasonably possible that the total amounts of unrecognized tax benefits will change materially in the next twelve months.
Reclassification of capital accounts:
Accounting principles generally accepted in the United States of America require that certain components of net assets relating to permanent differences be reclassified between financial and tax reporting. These reclassifications have no effect on net assets or net asset value per share. As of November 30, 2019, there were no reclassification of capital accounts.
Distributions to shareowners:
For the Sextant Short-Term Bond Fund and Sextant Bond Income Fund, dividends to shareowners from net investment income are paid daily and distributed on the last business day of each month. For the Sextant Core Fund, Sextant Global High Income Fund, Sextant Growth Fund, and Sextant International Fund, dividends to shareowners from net investment income are payable annually, typically by the end of the year. Distributions of capital gains, if any, are made at least annually, and as required to comply with federal excise tax requirements. Distributions to shareowners are determined in accordance with income tax regulations and are recorded on theex-dividend date. Dividends are paid in shares of the Funds, at the net asset value on the payable date. Shareowners may elect to take distributions if they total $10 or more in cash.
Use of estimates:
The preparation of financial statements in conformity with accounting principles generally accepted in the United States of America requires management to make estimates and assumptions that affect the reported amounts of assets and liabilities and disclosure of contingent assets and liabilities at the date of the financial statements and the reported amounts of increases and decreases in net assets from operations during the reporting period. Actual results could differ from those estimates.
Foreign taxes:
Withholding taxes on foreign dividends are paid (a portion of which may be reclaimable) or provided for in accordance with the applicable country’s tax rules and rates and are disclosed in the Statement of Operations. Withholding tax reclaims are filed in certain countries to recover a portion of the amounts previously withheld. The Funds record a reclaim receivable based on a number of factors, including a jurisdiction’s legal obligation to pay reclaims as well as payment history and market convention.
Other:
Interest income is recognized on an accrual basis. Premiums on securities purchased are amortized, and discounts are accreted over the lives of the respective securities. Dividends from equity securities are recorded as income on theex-dividend date.
Recent accounting pronouncements:
In August 2018, FASB issued Accounting Standards UpdateNo. 2018-13, “Fair Value Measurement (Topic 820: Disclosure Framework—Changes to the Disclosure Requirements for Fair Value Measurement” (“ASU2018-13”). ASU2018-13 eliminates the requirement to disclose the amount of and reasons for transfers between Level 1 and Level 2 of the fair value hierarchy, the timing of transfers between levels of the fair value hierarchy and the valuation processes for Level 3 fair value measurements. ASU2018-13 will require the need to disclose the range and weighted average used to develop significant unobservable inputs for Level 3 fair value measurements and the changes in unrealized gains and losses for recurring Level 3 fair value measurements. ASU2018-13 will also require that information is provided about the measurement uncertainty of Level 3 fair value measurements as of the reporting date. The guidance is effective for fiscal years, and interim periods within those fiscal years, beginning after December 15, 2019, and allows for early adoption of either the entire standard or only the provisions that eliminate or modify the requirements. Management has elected to adopt early the provisions that eliminate the disclosure requirements. Management is still currently evaluating the impact of applying the rest of the guidance.
| Annual Report | November 30, 2019 | 57 | ||||
| Notes To Financial Statements(continued) |
NOTE 3 – Transactions with Affiliated Persons
Under contracts approved annually by the Trust’s independent trustees, Saturna Capital Corporation provides investment advisory services and certain other administrative services required to conduct Trust business. Expenses incurred by the Trust on behalf of the Funds (e.g., legal fees) are allocated to the Funds on the basis of relative daily average net assets. For such services, each of the Funds pays the adviser a base Investment Advisory and Administrative Services Fee of 0.50% of average net assets per annum, payable monthly for each of the Funds. In addition, the adviser has agreed to certain limits on other expenses, as described below.
The base Advisory Fee is subject to adjustment up or down depending on the investment performance of the Fund relative to a specified index.
| • | For each month in which the Fund’s total investment return (change in net asset value plus all distributions reinvested) for the one year period through that month outperforms or underperforms the total return of a specified index for that period by 1% or more but less than 2%, the Base Fee is increased or decreased by the annual rate of .10% of the Fund’s average daily net assets for the preceding year. |
| • | If the outperformance or underperformance is 2% or more, then the adjustment is at the annual rate of ..20%. |
For the period ended November 30, 2019, due to the performance adjustment the Advisory Fee amounts charged or reduced in addition to the Base Fee were as follows:
Base Fees | Performance Fee | Adviser Fee | ||||||||||
Short-Term Bond | $53,500 | $- | $53,500 | |||||||||
Bond Income | 56,481 | (7,493 | ) | 48,988 | ||||||||
Core | 73,388 | 17,982 | 91,370 | |||||||||
Global High Income | 48,299 | 17,148 | 65,447 | |||||||||
Growth | 203,281 | 76,559 | 279,840 | |||||||||
International | $428,273 | $136,783 | $565,056 | |||||||||
The adviser has voluntarily undertaken to limit expenses through March 31, 2020 of Sextant Short-Term Bond Fund to 0.60%, Sextant Bond Income Fund to 0.65%, and Sextant Global High Income to 0.75%. For the year ended November 30, 2019, the advisory fees incurred were as follows:
| Adviser Fees | Adviser Fees Waived | Expense Reimbursement | ||||||||||
Short-Term Bond | $53,500 | $(28,421 | ) | $- | ||||||||
Bond Income | 48,988 | (17,370 | ) | - | ||||||||
Core | 91,370 | - | - | |||||||||
Global High Income | 65,447 | (33,817 | ) | - | ||||||||
Growth | 279,840 | - | - | |||||||||
International | $565,056 | $- | $- | |||||||||
In accordance with the expense limitation noted above, for the year ended November 30, 2019, Saturna Capital waived a portion of the advisory fees of the Sextant Short-Term Bond Fund, Sextant Bond Income Fund, and Sextant Global High Income Fund. The adviser cannot recoup previously waived fees.
Saturna Brokerage Services, Inc. (“SBS”), a discount brokerage and subsidiary of Saturna Capital Corporation, is registered as a broker-dealer and acts as distributor. On October 3, 2006, The Funds adopted a Distribution Plan in accordance with Rule12b-1 under the 1940 Act. The plan provides that the Funds will pay a fee to SBS at an annual rate of 0.25% of the average net assets of the Funds. On June 2, 2017,12b-1 fees were terminated for all Funds except Sextant Growth Investor Shares and Sextant International Investor Shares. During the fiscal year ended November 30, 2019, the Trust paid SBS the following amounts:
| Distribution(12b-1) Fees | ||||
Short-Term Bond | n/a | |||
Bond Income | n/a | |||
Core | n/a | |||
Global High Income | n/a | |||
GrowthInvestor Shares (SSGFX) | $9,850 | |||
GrowthZ Shares (SGZFX) | n/a | |||
InternationalInvestor Shares (SSIFX) | $148,607 | |||
InternationalZ Shares (SIFZX) | n/a | |||
SBS is used to effect portfolio transactions for the Trust. SBS currently executes portfolio transactions without commission. Transactions effected through other brokers are subject to commissions payable to that broker.
Saturna Trust Company (“STC”), a subsidiary of Saturna Capital, acts as retirement plan custodian for Fund shareowners. Each Fund pays an annual fee of $10 per account for retirement plan services to Saturna Trust Company. For the year ended November 30, 2019, the Funds incurred the following amounts:
| Retirement plan custodial fees | ||||
Short-Term Bond | $3,477 | |||
Bond Income | 2,753 | |||
Core | 3,068 | |||
Global High Income | 1,709 | |||
GrowthInvestor Shares (SSGFX) | 9 | |||
GrowthZ Shares (SGZFX) | 7,299 | |||
InternationalInvestor Shares (SSIFX) | 9 | |||
InternationalZ Shares (SIFZX) | $4,200 | |||
Mrs. Jane Carten serves as a trustee and president of the Trust. She is also a director and president of Saturna Capital and vice president of Saturna Trust Company. Mrs. Carten is not compensated by the Trust. For the year ended November 30, 2019, the Trust incurred compensation expenses of $31,500 which is included in $44,545 of total expenses for the independent Trustees. The Sextant Funds incurred $32,560 of these total expenses.
The officers of the Trust are paid by Saturna Capital, not the Trust, except the Chief Compliance Officer, who may be partially compensated by the Trust. For the year ended November 30, 2019, the Funds paid the following compensation expenses for the Chief Compliance Officer:
| Chief Compliance Officer | ||||
Short-Term Bond | $2,591 | |||
Bond Income | 2,513 | |||
Core | 3,801 | |||
Global High Income | 2,876 | |||
Growth | 12,075 | |||
International | $17,087 | |||
On November 30, 2019, the trustees, officers, and their affiliates as a group owned 34.51%, 26.91%, 37.67%, 56.31%, 0.16%, 18.95%, 0.00%, and 19.95% of the outstanding shares of Short-Term Bond Fund, Bond Income Fund, Core Fund, Global High Income Fund, Growth Fund Investor Shares, Growth Fund Z Shares, International Fund Investor Shares, and International Fund Z Shares, respectively.
| 58 | November 30, 2019 | Annual Report | ||||
| Notes To Financial Statements(continued) |
NOTE 4 – Distributions to Shareowners
The tax characteristics of distributions paid during the fiscal years ended November 30, 2019, and 2018, were as follows:
| Year ended Nov. 30, 2019 | Year ended Nov. 30, 2018 | |||||||
Short-Term Bond Fund | ||||||||
Ordinary income | $187,268 | $145,570 | ||||||
Long-term capital gain1 | - | 4,622 | ||||||
Bond Income Fund | ||||||||
Ordinary income | 334,236 | 309,851 | ||||||
Core Fund | ||||||||
Ordinary income | 179,880 | 166,943 | ||||||
Global High Income Fund | ||||||||
Ordinary income | 311,447 | 253,597 | ||||||
Growth Fund | ||||||||
Ordinary income | 181,466 | 290,653 | ||||||
Long-term capital gain1 | 1,640,414 | 1,777,473 | ||||||
International Fund | ||||||||
Ordinary income | 627,004 | 643,299 | ||||||
Long-term capital gain1 | $3,899,440 | $4,631,191 | ||||||
| 1 | Long-Term Capital Gain dividend designated at 20% rate pursuant to Section 852(b)(3) of the Internal Revenue Code. |
NOTE 5 – Federal Income Taxes
The cost basis of investments for federal income tax purposes at November 30, 2019 was as follows:
| Short-Term Bond | Bond Income | |||||||
Cost of investments | $10,648,234 | $11,132,690 | ||||||
Gross tax unrealized appreciation | 118,583 | 756,679 | ||||||
Gross tax unrealized depreciation | (18,529 | ) | (5,110 | ) | ||||
Net tax unrealized appreciation (depreciation) | $100,054 | $751,569 | ||||||
| Core | Global High Income | |||||||
Cost of investments | $13,098,929 | $7,620,094 | ||||||
Gross tax unrealized appreciation | 2,707,878 | 596,509 | ||||||
Gross tax unrealized depreciation | (26,304 | ) | (379,216 | ) | ||||
Net tax unrealized appreciation | $2,681,574 | $217,293 | ||||||
| Growth | International | |||||||
Cost of investments | $20,247,060 | $47,780,787 | ||||||
Gross tax unrealized appreciation | 23,345,498 | $38,473,411 | ||||||
Gross tax unrealized depreciation | (15,877 | ) | $(687,809 | ) | ||||
Net tax unrealized appreciation | $23,329,621 | $37,785,602 | ||||||
As of November 30, 2019, components of distributable earnings on a tax basis were as follows:
Short-Term Bond | ||||
Undistributed ordinary income | $3,405 | |||
Accumulated capital losses | $(10,266 | ) | ||
Tax accumulated earnings | $(6,861 | ) | ||
Unrealized appreciation | $100,054 | |||
Total accumulated earnings | $93,193 | |||
Bond Income | ||||
Undistributed ordinary income | $803 | |||
Accumulated capital losses | $(4,337 | ) | ||
Tax accumulated earnings | $(3,534 | ) | ||
Unrealized appreciation | $751,569 | |||
Total accumulated earnings | $748,035 | |||
Core | ||||
Undistributed ordinary income | $236,097 | |||
Accumulated capital gains | $732,001 | |||
Tax accumulated earnings | $968,098 | |||
Unrealized appreciation | $2,681,574 | |||
Other unrealized losses | 17 | |||
Total accumulated earnings | 3,649,689 | |||
Global High Income | ||||
Undistributed ordinary income | $549,529 | |||
Accumulated capital gains | 248,567 | |||
Tax accumulated earnings | 798,096 | |||
Unrealized appreciation | 217,293 | |||
Other unrealized losses | (1,351 | ) | ||
Total accumulated earnings | 1,014,038 | |||
Growth | ||||
Undistributed ordinary income | $74,571 | |||
Accumulated capital gains | 1,280,579 | |||
Tax accumulated earnings | 1,355,150 | |||
Unrealized appreciation | 23,329,621 | |||
Total accumulated earnings | 24,684,771 | |||
International | ||||
Undistributed ordinary income | $606,809 | |||
Accumulated capital gains | 2,785,842 | |||
Tax accumulated earnings | 3,392,651 | |||
Unrealized appreciation | 37,787,402 | |||
Other unrealized losses | (1,293 | ) | ||
Total accumulated earnings | 41,178,760 | |||
| Annual Report | November 30, 2019 | 59 | ||||
| Notes To Financial Statements(continued) |
As of November 30, 2019, the Funds had capital loss carryforwards as follows, subject to regulation.
| Carryforward | Expiration | |||||||
Short-Term Bond | ||||||||
Long-term loss carryforward | $10,266 | Unlimited | ||||||
| $10,266 | ||||||||
Bond Income | ||||||||
Long-term loss carryforward | $4,337 | Unlimited | ||||||
| $4,337 | ||||||||
NOTE 6 – Investments
Investment transactions other than short-term investments for the fiscal year ended November 30, 2019, were as follows:
| Purchases | Sales | |||||||
Short-Term Bond | $3,845,586 | $3,250,630 | ||||||
Bond Income | 2,731,392 | 2,296,094 | ||||||
Core | 5,599,753 | 3,848,213 | ||||||
Global High Income | 7,299,110 | 2,950,041 | ||||||
Growth | 3,862,295 | 6,661,699 | ||||||
International | $18,356,090 | $4,245,000 | ||||||
NOTE 7 – Custodian
Under agreements in place with the Trust’s custodian, UMB Bank, custody fees are reduced by credits for cash balances. Such reductions for the fiscal year ended November 30, 2019, were as follows:
| Custodian Fee Credits | ||||
Short-Term Bond | $407 | |||
Bond Income | 429 | |||
Core | 560 | |||
Global High Income | 757 | |||
Growth | 1,566 | |||
International | $6,067 | |||
NOTE 8 – Subsequent Events
In preparing these financial statements, the Funds have evaluated events and transactions for potential recognition or disclosure through the date the financial statements were issued.
The Funds declared the payment of a distribution to be paid on December 19, 2019, to all shareowners of record on December 18, 2019, as follows:
| Dividend Income | Short-Term Capital Gain | Long-Term Capital Gain | ||||||||||
Short-Term Bond | $- | $- | $- | |||||||||
Bond Income | - | - | - | |||||||||
Core | 0.19230 | 0.04110 | 0.57640 | |||||||||
Global High Income | 0.20840 | 0.22900 | 0.28640 | |||||||||
Growth(Investor Shares) | 0.01100 | - | 0.93110 | |||||||||
Growth(Z Shares) | 0.05900 | - | 0.93110 | |||||||||
International(Investor Shares) | 0.10550 | - | 0.54730 | |||||||||
International(Z Shares) | $0.14830 | $- | $0.54730 | |||||||||
There were no other events or transactions during the period that materially impacted the amounts or disclosures in the Funds’ financial statements.
| 60 | November 30, 2019 | Annual Report | ||||
Report of Independent Registered Public Accounting Firm |
To the Board of Trustees of
Saturna Investment Trust
and the Shareholders of Sextant Mutual Funds
Opinion on the Financial Statements
We have audited the accompanying statement of assets and liabilities of the Sextant Short Term Bond Fund, Sextant Bond Income Fund, Sextant Core Fund, Sextant Global High Income Fund, Sextant Growth Fund and Sextant International Fund (the “Funds”), each a series of Saturna Investment Trust, including the schedules of investments, as of November 30, 2019, the related statements of operations for the year then ended, the statements of changes in net assets for each of the two years in the period then ended, the financial highlights for each of the five years in the period then ended, and the related notes (collectively referred to as the “financial statements”). In our opinion, the financial statements present fairly, in all material respects, the financial position of the Funds as of November 30, 2019, the results of their operations for the year then ended, the changes in their net assets for each of the two years in the period then ended and their financial highlights for each of the five years in the period then ended, in conformity with accounting principles generally accepted in the United States of America.
Basis for Opinion
These financial statements are the responsibility of the Funds’ management. Our responsibility is to express an opinion on the Funds’ financial statements based on our audits. We are a public accounting firm registered with the Public Company Accounting Oversight Board (United States) (“PCAOB”) and are required to be independent with respect to the Funds in accordance with the US federal securities laws and the applicable rules and regulations of the Securities and Exchange Commission and the PCAOB. We have served as the auditor of one or more of the funds in the Trust since 1997.
We conducted our audits in accordance with the standards of the PCAOB. Those standards require that we plan and perform the audits to obtain reasonable assurance about whether the financial statements are free of material misstatement, whether due to error or fraud. The Funds are not required to have, nor were we engaged to perform, an audit of their internal control over financial reporting. As part of our audits we are required to obtain an understanding of internal control over financial reporting, but not for the purpose of expressing an opinion on the effectiveness of the Funds internal control over financial reporting. Accordingly, we express no such opinion.
Our audits included performing procedures to assess the risks of material misstatement of the financial statements, whether due to error or fraud, and performing procedures that respond to those risks. Such procedures included examining, on a test basis, evidence regarding the amounts and disclosures in the financial statements. Our audits also included evaluating the accounting principles used and significant estimates made by management, as well as evaluating the overall presentation of the financial statements. Our procedures included confirmation of securities owned as of November 30, 2019 by correspondence with the custodian. We believe that our audits provide a reasonable basis for our opinion.
Philadelphia, Pennsylvania
January 29, 2020
/s/ Tait, Weller & Baker LLP
Tait, Weller & Baker LLP
| Annual Report | November 30, 2019 | 61 | ||||
| Expenses | (unaudited) |
All mutual funds have operating expenses. As a Sextant Fund shareowner, you incur ongoing costs, including management fees, distribution (or service)12b-1 fees, and other fund expenses such as shareowner reports (such as this one). Operating expenses, which are deducted from a fund’s gross earnings, directly reduce the investment return of a fund. Mutual funds (unlike other financial investments) only report their results after deduction of operating expenses.
With the Sextant Funds, unlike many other mutual funds, you do not incur sales charges (loads) on purchases, reinvested dividends, or other distributions. You do not incur redemption fees or exchange fees. You may incur fees related to extra services requested by you for your account, such as bank wires. The examples below are intended to help you understand your ongoing costs (in dollars) of investing in the Funds and to compare these costs with the ongoing costs of investing in other mutual funds.
Examples
The following example is based on an investment of $1,000 invested at the beginning of the period and held for the entire period (June 1, 2019, to November 30, 2019).
Actual Expenses
The first line for each Fund provides information about actual account values and actual expenses. You may use the information in this line, together with the amount you have invested, to estimate the expenses you paid over the period. Simply divide your account value by $1,000 (for example, an $8,600 account value divided by $1,000 = 8.6), then multiply the result by the number in the first line under the heading entitled “Expenses Paid During Period” to estimate the expenses you paid on your account during this period. The Funds may charge for extra services (such as domestic bank wires, international bank wires, or overnight courier delivery of redemption checks) rendered on request, which you may need to estimate to determine your total expenses.
Hypothetical Example For Comparison Purposes
The second line provides information about hypothetical account values and hypothetical expenses based on the Fund’s actual expense ratio (based on the last six months) and an assumed rate of return of 5% per year before expenses, which is not the Fund’s actual return. The hypothetical account values and expenses may not be used to estimate the actual ending balance or expenses you paid for the period. You may use this information to compare ongoing costs of investing in the Fund and other mutual funds. To do so, compare this 5% hypothetical example with the 5% hypothetical examples that appear in the shareowner reports of other mutual funds. You may wish to add other fees that are not included in the expenses shown in the table, such as charges for extra services like bank wires.
Please note that the expenses shown in the tables are meant to highlight your ongoing costs only and do not reflect any transactional costs, such as sales charges (loads), redemption fees or exchange fees (note that the Sextant Funds do not charge any such transactional costs). Therefore, the “Hypothetical” line of each fund is useful in comparing ongoing costs only, and may not help you determine the relative total costs of owning different funds.
| Beginning Account Value (June 1, 2019) | Ending Account Value (November 30, 2019) | Expenses Paid During Period1 | Annualized Expense Ratio | |||||||||||||
Short-Term Bond Fund | $1,000 | $1,016.80 | $3.03 | 0.60% | ||||||||||||
Hypothetical (5% return before expenses) | 1,000 | 1,022.06 | $3.04 | 0.60% | ||||||||||||
Bond Income Fund | 1,000 | 1,049.70 | 2.41 | 0.47% | ||||||||||||
Hypothetical (5% return before expenses) | 1,000 | 1,022.72 | 2.38 | 0.47% | ||||||||||||
Core Fund | 1,000 | 1,095.70 | 4.90 | 0.93% | ||||||||||||
Hypothetical (5% return before expenses) | 1,000 | 1,020.40 | 4.72 | 0.93% | ||||||||||||
Global High Income Fund | 1,000 | 1,040.10 | 3.84 | 0.75% | ||||||||||||
Hypothetical (5% return before expenses) | 1,000 | 1,021.31 | 3.80 | 0.75% | ||||||||||||
Growth FundInvestor Shares | 1,000 | 1,171.60 | 6.61 | 1.21% | ||||||||||||
Hypothetical (5% return before expenses) | 1,000 | 1,018.98 | 6.15 | 1.21% | ||||||||||||
Growth FundZ Shares | 1,000 | 1,173.40 | 5.15 | 0.94% | ||||||||||||
Hypothetical (5% return before expenses) | 1,000 | 1,020.33 | 4.78 | 0.94% | ||||||||||||
International FundInvestor Shares | 1,000 | 1,064.50 | 5.30 | 1.02% | ||||||||||||
Hypothetical (5% return before expenses) | 1,000 | 1,019.93 | 5.19 | 1.02% | ||||||||||||
International FundZ Shares | 1,000 | 1,066.10 | 4.23 | 0.82% | ||||||||||||
Hypothetical (5% return before expenses) | $1,000 | $1,020.97 | $4.14 | 0.82% | ||||||||||||
| 1 | Expenses are equal to the annualized expense ratio indicated above (based on the most recent semi-annual period of June 1, 2019, through November 30, 2019), multiplied by the average account value over the period, multiplied by 183/365 (to reflect theone-half year period). |
| 62 | November 30, 2019 | Annual Report | ||||
| Trustees and Officers | (unaudited) |
| Name, Address, and Age | Position(s) Held with Trust and Number of Saturna Fund Portfolios Overseen | Principal occupation(s) during past 5 years, including Directorships | Other Directorships | |||||
Independent Trustees | ||||||||
(photo omitted) | Marina E. Adshade (52) 1300 N. State Street Bellingham WA 98225 | Independent Trustee (since 2017); Nine | Professor of Economics, University of British Columbia, Vancouver and Simon Fraser University;
Author | None | ||||
(photo omitted) | Ronald H. Fielding, MA, MBA, CFA (70) 1300 N. State Street Bellingham WA 98225 | Independent Trustee (since 2009); Thirteen | Director, ICI Mutual Insurance Company | Amana Mutual Funds Trust | ||||
(photo omitted) | Gary A. Goldfogel, MD (61) 1300 N. State Street Bellingham WA 98225 | Chairman (since 2017); Independent Trustee (since 1995); Nine | Medical Examiner (pathologist)
Owner, Avocet Environmental Testing (laboratory) | None | ||||
(photo omitted) | Jim V. McKinney(58) 1300 N. State Street Bellingham WA 98225 | Independent Trustee (since 2017); Nine | Executive Director, Common Threads Northwest; President/CEO, Apple Mountain LLC, consulting and development; US Army Foreign Area Officer—Political/Military Advisor to US Army Central; Senior Defense Official, Defense Attaché, US Embassy Slovenia | None | ||||
(photo omitted) | Sarah E.D. Rothenbuhler (51) 1300 N. State Street Bellingham WA 98225 | Independent Trustee (since 2017); Nine | CEO, Birch Equipment (industrial rentals and sales) | None | ||||
Interested Trustee | ||||||||
(photo omitted) | Jane K. Carten, MBA (44) 1300 N. State Street Bellingham WA 98225 | President, Trustee (since 2017); Nine | President and Director, Saturna Capital Corporation
Vice President and Director, Saturna Trust Company President, Saturna Brokerage Services | None | ||||
| Annual Report | November 30, 2019 | 63 | ||||
| Trustees and Officers(continued) | (unaudited) |
| Name (Age) and Address | Position(s) held with Trust and Number of Saturna Fund Portfolios Overseen | Principal occupation(s) during past 5 years, including Directorships | Other Directorships held by Trustee | |||||
Officers Who Are Not Trustees | ||||||||
(photo omitted) | Phelps S. McIlvaine (66) 1300 N. State Street Bellingham, WA 98225 | Vice President (since 1994); N/A | Vice President, Saturna Capital Corporation
Director, Vice President, and former Treasurer Saturna Brokerage Services | N/A | ||||
(photo omitted) | Christopher R. Fankhauser (47) 1300 N. State Street Bellingham, WA 98225 | Treasurer1(since 2002); N/A | Chief Operations Officer, Saturna Capital Corporation
Vice President and Chief Operations Officer, Saturna Brokerage Services
Director, Vice President, and Chief Operations Officer, Saturna Trust Company | N/A | ||||
(photo omitted) | Michael E. Lewis(58) 1300 N. State Street Bellingham, WA 98225 | Chief Compliance Officer1 (since 2012); | Chief Compliance Officer, Saturna Capital, Saturna Trust Company, and Affiliated Funds | N/A | ||||
(photo omitted) | Jacob A. Stewart(39) 1300 N. State Street Bellingham, WA 98225 | Anti-Money Laundering Officer1 (since 2015); N/A | Anti-Money Laundering Officer, Saturna Capital Corporation, Saturna Brokerage Services
Chief Compliance Officer, Saturna Brokerage Services
Bank Secrecy Act Officer, Saturna Trust Company | N/A | ||||
(photo omitted) | Nicole Trudeau(40) 1300 N. State Street Bellingham WA 98225 | Secretary1 (since 2018) | Chief Legal Officer, Saturna Capital Corporation
Former: Counsel, Simpson Thacher & Bartlett LLP; Partner, Stradley Ronon Stevens & Young, LLP; Partner, K&L Gates LLP | N/A | ||||
Term of Office: each Trustee serves for the lifetime of the Trust or until they die, resign, are removed, or notre-elected by the shareowners. Each officer serves aone-year term subject to annual reappointment by the Trustees.
The Trust’s Statement of Additional Information, available without charge upon request by calling Saturna Capital at1-800-728-8762 and on the Funds’ website, www.sextantfunds.com, includes additional information about the Trustees.
During the year ended November 30, 2019, the Independent Trustess were each paid by the Trust: (1) $2,000 annual retainer plus $1,000 per board meeting attended (in person or by phone), plus reimbursement of travel expenses; (2) $250 for committee meetings; and (3) $250 per quarter for serving as chariman of the board or any committee.
Mrs. Carten is an Interested Trustee by reason of her positions with the Trust’s adviser (Saturna Capital Corporation) and underwriter (Saturna Brokerage Services), and is the primary manager of the Saturna Sustainable Equity Fund portfolio. She is paid by Saturna Capital a salary, plus a bonus for each month the Saturna Sustainable Equity Fund portfolio earns a 4 or 5 star rating from Morningstar (see www.saturna.com). The officers are paid by Saturna Capital and not the Trust.
As of November 30, 2019, all Saturna Capital employees listed above as officers owned shares in one or more of the Saturna Investment Trust funds, with Mrs. Carten owning (directly or indirectly) over $0.92 million.
On November 30, 2019, the trustees, officers, and their affiliates as a group owned 34.51%, 26.91%, 37.67%, 56.31%, 0.16%, 18.95%, 0.00%, and 19.95% of the outstanding shares of Short-Term Bond Fund, Bond Income Fund, Core Fund, Global High Income Fund, Growth Fund Investor Shares, Growth Fund Z Shares, International Fund Investor Shares, and International Fund Z Shares, respectively. Saturna Capital Corporation is the Trust’s adviser and Saturna Brokerage Services, Inc. is the Trust’s distributor.
| 1 | Holds the same postion with Amana Mututal Funds Trust |
| 64 | November 30, 2019 | Annual Report | ||||
| Renewal of Investment Advisory Contract | (unaudited) |
During their meeting of September 17, 2019, the Trustees of Saturna Investment Trust, including those Trustees who are not “interested persons” (as that term is defined in the Investment Company Act of 1940) of the Trust or Saturna Capital (the “Independent Trustees”), discussed the continuance of the Investment Advisory and Administrative Services Agreement (“Agreement”) with the Trust, on behalf of each of the Sextant Funds (Bond Income Fund, Global High Income Fund, Growth Fund, International Fund, Core Fund, and Short-Term Bond Fund) (the “Funds”), and Saturna Capital. In considering the renewal of the Agreement, the Trustees discussed the nature, extent, and quality of the services provided by Saturna Capital to the Trust and each Fund. The Trustees considered Saturna Capital’s specific responsibilities in all aspects ofday-to-day management of the Funds as well as the qualifications, experience and responsibilities of the Funds’ portfolio managers and other key personnel at Saturna Capital. The Trustees discussed Saturna Capital’s experience, ability, and commitment to quality service through performing internally such functions as shareowner servicing, administration, accounting, marketing, and distribution — all in addition to investment management.
The Trustees took into consideration Saturna Capital’s continued avoidance of significant operational and compliance problems, plus its investments in infrastructure, information management systems, personnel, training, and investor education materials, all designed to provide high quality investor services and meet investor needs. They recognized Saturna Capital’s efforts to recruit and retain qualified and experienced staff and improve the capital base on which Saturna Capital operates, which the Trustees believe is important to the long-term success of the Funds. They considered Saturna Capital’s focus on investors and its efforts to avoid potential conflicts of interest.
The Trustees considered the investment performance of each Fund over time, including each Fund’s average annual total returns relative to its benchmark for theone-, three-, five-,ten-, and fifteen-year periods, as applicable, all as of August 31, 2019. The Trustees also considered comparative information published by Morningstar Inc. (“Morningstar”), an independent data service provider that, among other things, ranks mutual fund performance within categories comprised of similarly managed funds. The Trustees considered and discussed each Fund’s performance relative to the Fund’s Morningstar category for theone-, three-, five-,ten-, and fifteen-year periods, as applicable, ended August 31, 2019. The Trustees also considered each Fund’s Morningstar performance rankings (one through five stars) and noted the sustainability ratings assigned to some of the Funds by Morningstar. In addition, the Trustees considered each Fund’s performance ranking relative to the Fund’s category selected by Lipper, Inc.
With respect to long-term(10- and15-year) performance, the Trustees noted that the Sextant International Fund’s average annual total return for theten- and fifteen-year periods ended on August 31, 2019 was below the Morningstar category average, but the Fund outperformed its benchmark during the same periods. The Trustees noted that the Sextant Growth Fund underperformed its Morningstar category average for theten- and fifteen-year periods and underperformed its benchmark for theten-year period, but outperformed its benchmark for the fifteen-year period. The Trustees noted that Sextant Short-Term Bond Fund underperformed its Morningstar category average for theten- and fifteen-year periods and outperformed its benchmark for theten-year period, and slightly underperformed its benchmark for the fifteen-year period. The Trustees noted that Sextant Bond Income Fund had underperformed its respective Morningstar category average and benchmark for the sameten- and fifteen-year periods, and Sextant Core Fund outperformed its benchmark and underperformed its Morningstar category average for theten-year period ended August 31, 2019.
The Trustees considered the short- and medium-term performance of the Funds, noting that Sextant International Fund and Sextant Global High Income Fund each outperformed its Morningstar category average for the five-year period ended August 31, 2019, while each of the other Funds trailed its Morningstar category average during the same period. The Trustees noted that for the three-year period ended on August 31, 2019, Sextant International Fund, Sextant Global High Income Fund, Sextant Growth Fund and Sextant Core Fund each outperformed its respective Morningstar category average, while Sextant Short-Term Bond Fund and Sextant Bond Income Fund each underperformed its respective Morningstar category average.
The Trustees also considered the Funds’ short-term performance, noting that for theone-year period ended on August 31, 2019, Sextant International Fund, Sextant Global High Income Fund, Sextant Growth Fund, Sextant Core Fund and Sextant Short-term Bond Fund each outperformed its benchmark and respective Morningstar category average, while Sextant Bond Income underperformed its Morningstar category average.
The Trustees noted the generally risk-averse investment style of the Funds and other factors which can affect each Fund’s performance relative to its broader Morningstar category. The Trustees also noted certain differences between each Fund and the peer funds within its Morningstar category, including differences in investment strategies and asset size. The Trustees found that Saturna Capital continued to manage each Fund in a manner that is designed to be risk-averse and attractive to long-term investors. The Trustees discussed and considered the efforts of Saturna Capital to make additional resources available to assist in managing the Funds.
| Annual Report | November 30, 2019 | 65 | ||||
| Renewal of Investment Advisory Contract(continued) | (unaudited) |
The Trustees also considered Saturna Capital’s focus on improving investment performance without incurring materially higher levels of risk.
The Trustees also considered the performance and expenses of each Fund as compared to smaller group of funds with similar assets and investment objectives and strategies. The Trustees considered these comparative performance and expense data, along with the comparative data published by Morningstar and each Fund’s performance relative to its benchmark, to evaluate the Fund’s performance over near-term and long-term time periods. The Trustees continued to recognize the fulcrum structure of the advisory fee, where the manager’s compensation is directly related to the relative performance of each Fund.
The Trustees also reviewed the fees and expenses of each Fund, including comparative data on fees and expenses published by Morningstar, and considered the components of the Fund’s operating expenses. The Trustees noted the steps that Saturna Capital has undertaken to maintain competitive levels of Fund operating expenses. They noted the significant sponsorship of the Funds by Saturna Capital evidenced, in part, by certain fees and expenses paid by Saturna Capital out of its own resources. The Trustees recognized Saturna Capital’s efforts help make the Funds more widely available and less expensive than would otherwise be the case without Saturna Capital’s efforts.
The Trustees recognized that each Fund remains relatively small and there have not been opportunities to consider economies of scale. The Trustees noted Saturna Capital’s commitment to continue operating the Funds and the costs undertaken by Saturna Capital.
The Trustees reviewed Saturna Capital’s financial information and discussed the issue of Saturna Capital’s profitability as related to management and administration of the Trust. They discussed the reasonableness of Saturna Capital’s profitability as part of their evaluation of whether each Fund’s advisory fees bear a reasonable relationship to the mix of services provided by Saturna Capital, including the nature, extent, and quality of such services.
The Trustees considered and compared the fees charged by Saturna Capital to other types of accounts, includingnon-mutual fund advisory clients. The Trustees noted the differences between the full range of services Saturna Capital provides to the Funds, including investment advisory and administrative services, transfer agency services, and other services, as compared to the investment advisory services provided to the other advisory accounts.
The Trustees considered potential benefits to Saturna Capital’s other business lines from acting as investment adviser to the Funds, but also recognized that Saturna Capital’s other business lines benefit the Funds. The Trustees also noted that there were no soft dollar arrangements with respect to trading in the Funds’ portfolios. The Trustees considered whether there are other potential benefits to Saturna Capital in continuing to manage the Funds and the Trustees found that there were no material benefits other than Saturna Capital’s receipt of advisory fees and the fact that Saturna Brokerage Services, a wholly owned subsidiary of Saturna Capital, receives distribution and shareholder services fees under Rule12b-1, which it would not otherwise receive if Saturna Capital did not serve as the investment manager for the Funds. The Trustees also noted that Saturna Brokerage Services voluntarily waives brokerage commissions for executing Fund portfolio transactions, resulting in lower transaction costs.
The Trustees concluded based on their business judgement that the fees paid by each Fund to Saturna Capital were, from an arm’s-length bargaining perspective, reasonable and in the best interest of the Fund and its shareowners in light of the services provided, comparative performance, expense and advisory fee information, costs of services provided, profits to be realized, and benefits derived or to be derived by Saturna Capital from its relationship with the Fund. Following this discussion, the Trustees, including the Independent Trustees, unanimously agreed to renew each Fund’s Agreement with Saturna Capital.
| 66 | November 30, 2019 | Annual Report | ||||
Availability of Portfolio Information
| (1) | The Sextant Funds file complete schedules of portfolio holdings with the SEC for the first and third quarters of each fiscal year on FormN-Q. |
| (2) | The Funds’ FormsN-Q are available on the SEC’s website at www.sec.gov and at www.sextantfunds.com. |
| (3) | The Funds’ FormsN-Q may be reviewed and copied at the SEC’s Public Reference Room in Washington, DC. Information on the operation of the Public Reference Room may be obtained by calling1-800-SEC-0330. |
| (4) | The Funds make a complete schedule of portfolio holdings after the end of each month available to investors at www. sextantfunds.com. |
Householding Policy
To reduce expenses, we may mail only one copy of the Funds’ prospectus, each annual and semi-annual report, and proxy statements when necessary, to those addresses shared by two or more accounts. If you wish to receive individual and/or more copies of these documents, please call us at1-800-728-8762 or write to us at Saturna Capital/Sextant Mutual Funds, P.O. Box N, Bellingham, WA 98227. We will begin sending you individual copies 30 days after receiving your request.
If you are currently receiving multiple copies and wish to receive only one copy, please call us at1-800-728-8762 or write to us at Saturna Capital/Sextant Mutual Funds, P.O. Box N, Bellingham, WA 98227. We will begin sending you a single copy with subsequent report mailings.
Availability of Proxy Voting Information
| (1) | A description of the policies and procedures that the Funds use to determine how to vote proxies relating to portfolio securities is available (a) without charge, upon request, by calling Saturna Capital at1-800-728-8762; (b) on the Funds’ website at www. sextantfunds.com; and (c) on the SEC’s website at www.sec.gov. |
| (2) | Information regarding how each Fund voted proxies relating to portfolio securities during the most recent 12-month period ended June 30 is available (a) without charge, upon request, by calling Saturna Capital at1-800-728-8762; (b) on the Funds’ website at www.sextantfunds.com; and (c) on the SEC’s website at www.sec.gov. |
Privacy Statement
At Saturna Capital and Saturna Investment Trust, we understand the importance of maintaining the privacy of your financial information. We want to assure you that we protect the confidentiality of any personal information that you share with us. In addition, we do not sell information about our current or former customers.
In the course of our relationship, we gather certain nonpublic information about you, including your name, address, investment choices, and account information. We do not disclose your information to unaffiliated third parties unless it is necessary to process a transaction; service your account; deliver your account statements, shareowner reports and other information; or as required by law. When we disclose information to unaffiliated third parties, we require a contract to restrict the companies’ use of customer information and from sharing or using it for any purposes other than performing the services for which they were required. We may share information within the Saturna Capital family of companies in the course of informing you about products or services that may address your investing needs.
We maintain our own technology resources to minimize the need for any third party services, and restrict access to information within Saturna. We maintain physical, electronic, and procedural safeguards to guard your personal information. If you have any questions or concerns about the security or privacy of your information, please call us at1-800-728-8762.
| Annual Report | November 30, 2019 | 67 | ||||
| Performance Summary(as of December 31, 2019) | (unaudited) |
Average Annual Returns(before any taxes paid by shareowners) |
| |||||||||||||||||||||||
| Expense Ratio1 | ||||||||||||||||||||||||
| 1 Year | 3 Year | 5 Year | 10 Year | Gross | Net | |||||||||||||||||||
Sustainable Equity Fund(SEEFX) | 30.95% | 15.16% | n/a | n/a | 1.27% | 0.75% | ||||||||||||||||||
S&P Global 1200 Index | 28.22% | 13.39% | 9.50% | 9.99% | n/a | n/a | ||||||||||||||||||
Sustainable Bond Fund(SEBFX) | 7.08% | 3.16% | n/a | n/a | 0.77% | 0.65% | ||||||||||||||||||
FTSE WorldBIG Index | 6.88% | 4.25% | 2.25% | 2.40% | n/a | n/a | ||||||||||||||||||
Performance data quoted in this report represents past performance, is before any taxes payable by shareowners, and is no guarantee of future results. Current performance may be higher or lower than that stated herein. Performance current to the most recentmonth-end is available by calling toll-free1-800-728-8762 or visiting www.saturnasustainable.com. Average annual total returns are historical and include change in share value as well as reinvestment of dividends and capital gains, if any. The investment return and principal value of an investment will fluctuate so that an investor’s shares, when redeemed, may be worth more or less than their original cost. Funds that invest in foreign securities may involve greater risk, including political and economic uncertainties of foreign countries as well as the risk of currency fluctuations.
A note about risk:Please see Notes to Financial Statements beginning on page 23 for a discussion of investment risks. For a more detailed discussion of the risks associated with each Fund, please see the Funds’ prospectus or each Fund’s summary prospectus.
A Fund’s30-Day Yield, sometimes referred to as “standardized yield” or “SEC yield,” is expressed as an annual percentage rate using a method of calculation adopted by the Securities and Exchange Commission (SEC). The30-Day Yield provides an estimate of a Fund’s investment income rate, but may not equal the actual income distribution rate.
| 1 | By regulation, expense ratios shown in these tables are as stated in the Funds’ most recent Prospectus, dated March 27, 2019, and incorporate results for the fiscal year ended November 30, 2018. Ratios presented in this table differ from the expense ratios shown elsewhere in this report as they represent different periods. Also by regulation, the performance in this table represents the most recentquarter-end performance rather than performance through the Funds’ most recent fiscal period. Saturna Capital, the Fund’s adviser, has voluntarily capped actual expenses of the Sustainable Equity Fund at 0.75% and actual expenses of the Sustainable Bond Fund at 0.65% through March 31, 2020. |
The S&P Global 1200 Index is a global stock market index covering nearly 70% of the world’s equity markets. The FTSE WorldBIG Index is a multi-asset, multi-currency benchmark, which provides a broad-based measure of the global fixed income markets.Investors cannot invest directly in the indices.
The Saturna Sustainable Funds limit the securities they purchase to those consistent with sustainable principles. This limits opportunities and may affect performance.
Please consider an investment’s objectives, risks, charges, and expenses carefully before investing. To obtain this and other important information about the Saturna Sustainable Funds in a prospectus or summary prospectus, ask your financial advisor, visit www.saturnasustainable.com, or call toll-free1-800-728-8762. Please read the prospectus or summary prospectus carefully before investing.
| 2 | November 30, 2019 | Annual Report | ||||
| Fellow Shareowners: | January 24, 2020 |
2019 was a great year for equity markets, with the S&P 500 Index returning 31.49% through December 31, 2019 – the best annual profit since 2013. At Saturna, we’re not forecasting 2020 to generate the outsized gains seen in 2019. Still, we enter the new decade optimistically.
It’s rare for the market to experience downturns or big profits following a year when returns exceed 25%. Since 1927, the S&P 500 experienced downturns in only 8% of the years following a year with returns in excess of 25%. Over this same period, only three years saw repeated returns greater than 25%. While statistics may support our forecast, we note “past returns may not indicate future performance.” Why then do we believe 2020 will follow a similar course of decent returns? Four reasons: the four-year US presidential election cycle, calming global trade tensions, a reduction of Brexit’s uncertainties, and accommodative yet stretched global monetary policies. The economy continues in a “goldilocks” state: low unemployment, low inflation, low interest rates, and lower taxes.
After minimal debate, both parties in the US Congress agreed to bigger spending and deficits, and the economy is roaring. Presidential election politicking gets our juices flowing from all sides of the spectrum. Then, as the country moves from primaries to the general election, an incumbent’s narrative always pulls the opposition toward the middle.
Saturna Sustainable Funds seek sustainable investments with low risks in areas of the environment, social responsibility, and governance (ESG).
Also awaiting the election returns, theUS-China trade war should see reduced agitations. As President Trump looks to claim victory and President Xi takes advantage of US election related pressures, the two sides were compelled to sign an agreement. The truce calls for China to increase imports of US farm goods and the US to decrease tariffs on Chinese products.
Brexit will also have continued impact through 2020. The UK leaving the European Union on January 31, 2020, will not mark the end of the process. As the UK “gets Brexit done” this month, expect a first bounce in the economy. However, details of the trade agreement, and uncertainty related to it, will likely produce volatility in 2020 as the December deadline approaches.
| November 30, 2019 | Annual Report | 3 | ||||
2019 marked a year of renewed expansionary monetary policy as fears of recession sprouted across the globe. These fears led the Federal Reserve to cut interest rates while central banks elsewhere amassed record levels of negative yielding debt during the summer of 2019. In turn, low to negative interest rates injected fuel into equities, igniting the record bull market. Although the amount of negative yielding debt has since been cut, central banks are operating with less dry powder to reignite the economy should fear of recession renew. We expect that in 2020 central banks will play the part of observer as they balance the need to keep tools on hand for an economic downturn with the want to see 2019’s stimulus work its way through the financial system.
Thank you for investing with us. Please read this report and let us know how we can be of assistance to you in your quest for responsible investments choices.
Respectfully,
(photo omitted)
Jane Carten,
President
(photo omitted)
Gary Goldfogel,
Independent Board Chairman
| Saturna Sustainable Funds Portfolio Management | ||||||||||
| (photo omitted) | Jane Carten MBA
Saturna Sustainable Equity Fund Portfolio Manager | (photo omitted) | Patrick Drum MBA, CFA®, CFP®
Saturna Sustainable Bond Fund Portfolio Manager | |||||||
| (photo omitted) | Scott Klimo CFA®
Saturna Sustainable Equity Fund Deputy Portfolio Manager | (photo omitted) | Elizabeth Alm CFA®
Saturna Sustainable Bond Fund Deputy Portfolio Manager | |||||||
| 4 | November 30, 2019 | Annual Report | ||||
| Morningstar Sustainability Rating™ & Carbon Metrics™ |
At Saturna Capital, we have long described ourselves as value and values-based investors. We believe our approach improves the likelihood of achieving superior investment results over the long term. Our approach also leads to investment portfolios we can be proud of from the perspective of Environmental, Social, and Governance (ESG) issues. Morningstar partners with leading ESG research firm Sustainalytics to publish the Morningstar Sustainability Rating™ and Carbon Metrics™. Here are Saturna Sustainable Equity Fund’s fiscalperiod-end results (Saturna Sustainable Bond Fund was not rated for the period).
Saturna Sustainable Equity Fund | ||||||||
As of November 30, 2019 | Ø Ø Ø Ø Ø | |||||||
| Ranked in 2nd percentile among 725 World Large Stock Funds | ||||||||
| As of September 30, 2019 | ||||||||
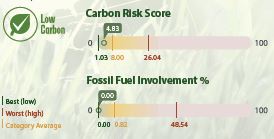
The Morningstar Sustainability Rating, Low Carbon designation, Carbon Risk Score, and Fossil Fuel Involvement % are not based on fund performance and are not equivalent to the Morningstar Rating (“Star Rating”).
© 2019 Morningstar®.All rights reserved. Morningstar, Inc. is an independent fund performance monitor. The information contained herein: (1) is proprietary to Morningstar and/or its content providers; (2) may not be copied or distributed; and (3) is not warranted to be accurate, complete, or timely. Neither Morningstar nor its content providers are responsible for any damages or losses arising from any use of this information.
Morningstar Sustainability Rating is as of November 30, 2019. The Morningstar Sustainability Rating™ is intended to measure how well the issuing companies of the securities within a fund’s portfolio are managing their environmental, social, and governance (“ESG”) risks and opportunities relative to the fund’s Morningstar category peers. The Morningstar Sustainability Rating calculation is atwo-step process. First, each fund with at least 50% of assets covered by a company-level ESG score from Sustainalytics receives a Morningstar Portfolio Sustainability Score™. The Morningstar Portfolio Sustainability Score is an asset-weighted average of normalized company-level ESG scores with deductions made for controversial incidents by the issuing companies, such as environmental accidents, fraud, or discriminatory behavior. The Morningstar Sustainability Rating is then assigned to all scored funds within Morningstar Categories in which at least ten (10) funds receive a Portfolio Sustainability Score and is determined by each fund’s rank within the following distribution: High (highest 10%), Above Average (next 22.5%), Average (next 35%), Below Average (next 22.5%), and Low (lowest 10%). The Morningstar Sustainability Rating is depicted by globe icons where High equals 5 globes and Low equals 1 globe.
A Sustainability Rating is assigned to any fund that has more than half of its underlying assets rated by Sustainalytics and is within a Morningstar Category with at least 10 scored funds; therefore, the rating it is not limited to funds with explicit sustainable or responsible investment mandates. Morningstar updates its Sustainability Ratings monthly. Portfolios receive a Morningstar Portfolio Sustainability Score and Sustainability Rating one month and six business days after their reportedas-of date based on the most recent portfolio. As part of the evaluation process, Morningstar uses Sustainalytics’ ESG scores from the same month as the portfolioas-of date.
Saturna Sustainable Equity Fund was rated on 100% of Assets Under Management.
% Rank in Category is the fund’s percentile rank for the specified time period relative to all funds that have the same Morningstar category. The highest (or most favorable) percentile rank is 1 and the lowest (or least favorable) percentile rank is 100. Thetop-performing fund in a category will always receive a rank of 1. Percentile ranks within categories are most useful in those categories that have a large number of funds.
Morningstar Carbon Metrics are as of September 30, 2019.Morningstar carbon metrics are asset-weighted portfolio calculations based on their Sustainalytics subsidiary’s carbon-risk research. Based on two of these metrics – Carbon Risk Score and Fossil Fund Involvement % – funds may receive the Low Carbon designation, which allows investors to easily identifylow-carbon funds within the global universe.
The portfolio Carbon Risk Score is a number between 0 and 100 (a lower score is better). A portfolio’s Carbon Risk Score is the asset-weighted sum of the carbon risk scores of its holdings, averaged over the trailing 12 months. The carbon risk of a company is Sustainalytics’ evaluation of the degree to which a firm’s activities and products are aligned with the transition to alow-carbon economy. The assessment includes carbon intensity, fossil fuel involvement, stranded assets exposure, mitigation strategies, and green product solutions.
Fossil Fuel Involvement % is the portfolio’s asset-weighted percentage exposure to fossil fuels, averaged over the trailing 12 months. Companies with fossil fuel involment are defined as these in the following subindustries: Thermal Coal Extraction, Thermal Coal Power Generation, Oil & Gas Production, Oil & Gas Power Generation, and Oil and Gas Products and Services.
To receive the Low Carbon designation a fund must have Carbon Risk Score below 10 and a Fossil Fuel Involvement % of less than 7% of assets. For these metrics to be calculated, at least 67% of a portfolio’s assets must be covered by Sustainalytics company carbon-risk research. All Morningstar carbon metrices are calculated quarterly.
Saturna Sustainable Equity Fund was rated on 100% of Assets Under Management.
The Funds’ portfolios are actively managed and are subject to change, which may result in different Morningstar Sustainability Ratings and Carbon Metrics over time.
November 30, 2019 | Annual Report | 5 | ||||
| Saturna Sustainable Equity Fund:Performance Summary | (unaudited) |
Average Annual Returns as of November 30, 2019 | ||||||||||||||||
| 1 Year | 5 Year | 10 Year | Expense Ratio1 | |||||||||||||
Sustainable Equity Fund (SEEFX)2 | 19.04% | n/a | n/a | 1.27% | ||||||||||||
S&P Global 1200 Index | 14.97% | 8.40% | 9.82% | n/a | ||||||||||||
Growth of $10,000
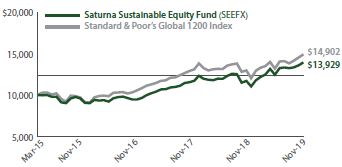 | Comparison of any mutual fund to a market index must be made bearing in mind that the index is expense-free. Conversely, the fund will (1) be actively managed; (2) have an objective other than mirroring the index, such as limiting risk; (3) bear transaction and other costs; (4) stand ready to buy and sell its securities to shareowners on a daily basis; and (5) provide a wide range of services. The graph compares $10,000 invested in the Fund on March 27, 2015, to an identical amount invested in the Standard & Poor’s Global 1200 Index, a global stock market index covering nearly 70% of the world’s equity markets. The graph shows that an investment in the Fund would have risen to $13,929 versus $14,902 in the index. |
Past performance does not guarantee future results.The “Growth of $10,000” graph and “Average Annual Returns” performance table assume the reinvestment of dividends and capital gains. They do not reflect the deduction of taxes that a shareowner might pay on fund distributions or the redemption of fund shares.
| 1 | By regulation, the expense ratio shown in this table is as stated in the Fund’s most recent prospectus which is dated March 27, 2019, and incorporates results for the fiscal year ended November 30, 2018, before fee waivers. The expense ratio shown in the most recent prospectus after fee waivers was 0.75%. The ratio presented in this table differs from expense ratios shown elsewhere in this report as they represent different periods. |
| 2 | Operations commenced on March 27, 2015. |
Fund Objective
The objective of the Sustainable Equity Fund is capital appreciation.
Top 10 Holdings | ||||
| % of Total Net Assets | ||||
Adobe | 3.8% | |||
Apple | 3.3% | |||
Mastercard, Class A | 2.9% | |||
Dassault Systemes ADR | 2.9% | |||
Microsoft | 2.7% | |||
Nintendo ADR | 2.4% | |||
Home Depot | 2.3% | |||
TJX Companies | 2.2% | |||
Accenture, Class A | 2.2% | |||
AIA Group | 2.2% | |||
Portfolio Diversification | ||||||||||||
| % of Total Net Assets |
| |||||||||||
Application Software | 8.7% | ∎ | |  | | |||||||
Household Products | 7.5% | ∎ | ||||||||||
Specialty Chemicals | 5.7% | ∎ | ||||||||||
IT Services | 4.2% | ∎ | ||||||||||
Large Pharma | 4.1% | ∎ | ||||||||||
Specialty Apparel Stores | 3.4% | ∎ | ||||||||||
Home Products Stores | 3.4% | ∎ | ||||||||||
Communications Equipment | 3.3% | ∎ | ||||||||||
Semiconductor Devices | 2.9% | ∎ | ||||||||||
Consumer Finance | 2.9% | ∎ | ||||||||||
Infrastructure Software | 2.7% | ∎ | ||||||||||
Electrical Power Equipment | 2.5% | ∎ | ||||||||||
Industries <2.5% | 42.2% | ∎ | ||||||||||
Other Assets (net of liabilities) | 6.5% | ∎ | ||||||||||
| 6 | November 30, 2019 | Annual Report | ||||
| Saturna Sustainable Equity Fund:Discussion of Fund Performance | (unaudited) |
(photo omitted)
Fiscal Year 2019
The Saturna Sustainable Equity Fund benefitted from its exposure to global markets during the last fiscal year – exposure which, like the tide, has raised all boats. For the fiscal year ended November 30, 2019, the Saturna Sustainable Equity Fund returned 19.04%, confidently outpacing both the 14.97% return of the S&P Global 1200 Index and the 16.11% return of the S&P 500 Total Return Index.
Factors Affecting Past Performance
Saturna Sustainable Equity Fund has a global mandate with assets allocated among 17 nations. The Fund tends to overweight the Technology and Consumer Discretionary sectors – with nine of the Fund’s top 10 holdings in one of those two sectors – but began angling toward greater exposure to Health Care in the past year in order to take advantage of a macrotrend.
Apple, a cornerstone of the Sustainable Equity Fund and the top contributor to the portfolio during the fiscal year, has shattered expectations in the past two years; itsprice-to-earnings (P/E) ratio saw continued growth, reaching a new peak of 24.7 at the end of the 2019 calendar year. Despite having a P/E ratio that is typically lower than the S&P 500, “Apple’s margins are almost double the S&P 500’s,” lending “support to a higher multiple.”1 Some analysts expected iPhone sales to slow and enter a decline, but with excitement brewing for 5G, improving near-term expectations for the iPhone 11, and Apple’s wearable devices selling well, “sentiment has improved” with predictions of “year over year growth.”2 Taiwan Semiconductor and MasterCard – the lone holding among the top 10 that is neither a Technology nor Consumer Staples stock – rounded out the top three contributors with similar blockbuster performance.
The portfolio’s holdings remained relatively consistent but became more focused as we exited a number of smaller positions for which our conviction declined. One such holding, LatAm Airlines, was sold due to poor performance and for the incongruency of holding an airline in a sustainable fund. Though a necessary evil in many cases, air travel currently contributes about 2.5 percent of global carbon dioxide emissions. The United Nations anticipates the amount of CO2 emitted will triple by 2050, while the International Council on Clean Transportation believes the increase will be “more than 1.5 times as fast as the UN estimate.”3 With a commitment to deeply analyzing an issuer’s approach to the material ESG issues that impact its industry, we seek true sustainability leaders that meet our strict financial criteria. It is possible that the Fund may invest in an airline or other industries that may burden the environment, but that decision will always be heavily weighed against the company’s overall ESG commitment and performance. As long-term investors, we are focused on the sustainable business practices that improve our world and that also generate sustainable value.
Number of iPhone users in the United States from 2012 to 2021
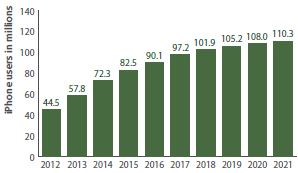
Gross profit margin forecast of the Apple company worldwide from 2017 to 2019, by segment
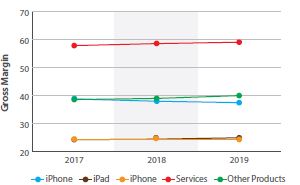
Continued on next page.
| November 30, 2019 | Annual Report | 7 | ||||
Looking Forward
The 2019 fiscal year was remarkable for the market’s continuing boom, but can the frequency of new,all-time highs we are experiencing continue at the same pace into the future? The sheer amplification of market activity seems to indicate that when something does start to happen, it will be colossal. Whether the market continues to grow, or hits its peak and declines, we will work to ensure Saturna Sustainable Equity Fund is well positioned. Saturna’s portfolio managers believe that market volatility is best addressed by a focus on ESG criteria, and Saturna’s focus on low debt and cash generative, highly sustainable companies led by excellent management teams helps protect the investor from potential downsides.
| 1 | Trefis Team. Is Apple’s P/E Ratio Too High Or Too Low? Forbes, December 16, 2019.https://www.forbes.com/sites/greatspeculations/2019/12/16/is-apples-pe-ratio-too-high-or-too-low/#344789a57211 |
| 2 | Feuer, William. After its strongest year in a decade, Apple stock is historically expensive on aprice-to-earnings basis, CNBC, December 31, 2019. https://www.cnbc.com/2019/12/31/apple-pe-ratio-is-at-historic-high-following-an-explosive-year.html |
| 3 | Tabuchi, Hiroko. ‘Worse Than Anyone Expect’: Air Travel Emissions Vastly Outpace Predictions, September 19, 2019. https://www.nytimes.com/2019/09/19/climate/air-travel-emissions.html |
| 8 | November 30, 2019 | Annual Report | ||||
| Saturna Sustainable Equity Fund:Schedule of Investments | As of November 30, 2019 |
| Common Stocks – 93.5% | Number of Shares | Cost | Market Value | Country1 | Percentage of Assets | |||||||||||||||||
| Communications | ||||||||||||||||||||||
| Entertainment Content | ||||||||||||||||||||||
Walt Disney Company | 700 | $81,479 | $106,106 | United States | 1.3% | |||||||||||||||||
| Internet Media | ||||||||||||||||||||||
Naspers ADR | 1,000 | 39,122 | 28,490 | South Africa | 0.3% | |||||||||||||||||
| Telecom Carriers | ||||||||||||||||||||||
Telekomunikasi Indonesia ADR | 2,000 | 65,178 | 55,340 | Indonesia | 0.7% | |||||||||||||||||
| 185,779 | 189,936 | 2.3% | ||||||||||||||||||||
| Consumer Discretionary | ||||||||||||||||||||||
| Apparel, Footwear & Accessory Design | ||||||||||||||||||||||
adidas ADR | 1,100 | 138,601 | 171,655 | Germany3 | 2.1% | |||||||||||||||||
| Automobiles | ||||||||||||||||||||||
Toyota Motor ADR | 1,000 | 107,633 | 140,210 | Japan | 1.7% | |||||||||||||||||
| E-Commerce Discretionary | ||||||||||||||||||||||
Amazon.com2 | 60 | 103,132 | 108,048 | United States | 1.3% | |||||||||||||||||
| Home Products Stores | ||||||||||||||||||||||
Home Depot | 850 | 100,842 | 187,434 | United States | 2.3% | |||||||||||||||||
Lowe’s | 750 | 80,222 | 87,982 | United States | 1.1% | |||||||||||||||||
| 181,064 | 275,416 | 3.4% | ||||||||||||||||||||
| Other Commercial Services | ||||||||||||||||||||||
Ecolab | 723 | 82,096 | 134,962 | United States | 1.6% | |||||||||||||||||
| Restaurants | ||||||||||||||||||||||
Starbucks | 1,713 | 102,502 | 146,342 | United States | 1.8% | |||||||||||||||||
| Specialty Apparel Stores | ||||||||||||||||||||||
Industria de Diseno Textil | 3,000 | 92,121 | 93,411 | Spain | 1.2% | |||||||||||||||||
TJX Companies | 3,000 | 103,932 | 183,390 | United States | 2.2% | |||||||||||||||||
| 196,053 | 276,801 | 3.4% | ||||||||||||||||||||
| Toys & Games | ||||||||||||||||||||||
Hasbro | 600 | 56,958 | 61,020 | United States | 0.8% | |||||||||||||||||
| 968,039 | 1,314,454 | 16.1% | ||||||||||||||||||||
| Consumer Staples | ||||||||||||||||||||||
| Food & Drug Stores | ||||||||||||||||||||||
Clicks Group ADR | 1,500 | 38,630 | 50,460 | South Africa | 0.6% | |||||||||||||||||
Continued on next page.
| The accompanying notes are an integral part of these financial statements. | November 30, 2019 | Annual Report | 9 | |||||
| Saturna Sustainable Equity Fund:Schedule of Investments | As of November 30, 2019 |
| Common Stocks – 93.5% | Number of Shares | Cost | Market Value | Country1 | Percentage of Assets | |||||||||||||||||
| Consumer Staples (continued) | ||||||||||||||||||||||
| Household Products | ||||||||||||||||||||||
Church & Dwight | 2,400 | $104,866 | $168,576 | United States | 2.1% | |||||||||||||||||
Kimberly-Clark de Mexico, Class A2 | 13,000 | 21,584 | 24,721 | Mexico | 0.3% | |||||||||||||||||
L’Oreal ADR | 2,750 | 129,792 | 156,915 | United States3 | 1.9% | |||||||||||||||||
Reckitt Benckiser Group PLC ADR | 6,250 | 100,292 | 100,188 | United Kingdom | 1.2% | |||||||||||||||||
Unilever NY | 2,700 | 116,608 | 160,785 | Netherlands | 2.0% | |||||||||||||||||
| 473,142 | 611,185 | 7.5% | ||||||||||||||||||||
| Packaged Food | ||||||||||||||||||||||
Nestle ADR | 1,000 | 86,610 | 103,940 | Switzerland | 1.2% | |||||||||||||||||
| 598,382 | 765,585 | 9.3% | ||||||||||||||||||||
| Energy | ||||||||||||||||||||||
| Renewable Energy Equipment | ||||||||||||||||||||||
Siemens Gamesa Renewable Energy | 6,000 | 93,745 | 95,748 | Spain | 1.2% | |||||||||||||||||
Vestas Wind Systems | 900 | 65,551 | 85,654 | Denmark | 1.0% | |||||||||||||||||
| 159,296 | 181,402 | 2.2% | ||||||||||||||||||||
| 159,296 | 181,402 | 2.2% | ||||||||||||||||||||
| Financials | ||||||||||||||||||||||
| Banks | ||||||||||||||||||||||
Toronto-Dominion Bank | 2,800 | 131,011 | 161,840 | Canada | 2.0% | |||||||||||||||||
| Consumer Finance | ||||||||||||||||||||||
Mastercard, Class A | 824 | 74,154 | 240,798 | United States | 2.9% | |||||||||||||||||
| Diversified Banks | ||||||||||||||||||||||
Banco Santander ADR | 10,081 | 50,683 | 39,013 | Spain | 0.5% | |||||||||||||||||
| Islamic Banking | ||||||||||||||||||||||
BIMB Holdings | 150,600 | 153,571 | 149,999 | Malaysia | 1.8% | |||||||||||||||||
| Life Insurance | ||||||||||||||||||||||
AIA Group | 18,000 | 131,997 | 180,140 | Hong Kong | 2.2% | |||||||||||||||||
| P&C Insurance | ||||||||||||||||||||||
Chubb | 1,000 | 122,138 | 151,480 | Switzerland | 1.9% | |||||||||||||||||
| 663,554 | 923,270 | 11.3% | ||||||||||||||||||||
| Health Care | ||||||||||||||||||||||
| Health Care Facilities | ||||||||||||||||||||||
IHH Healthcare | 80,000 | 105,026 | 102,895 | Malaysia | 1.3% | |||||||||||||||||
| Large Pharma | ||||||||||||||||||||||
Astellas Pharma Inc. ADR | 5,000 | 82,913 | 85,050 | United States | 1.0% | |||||||||||||||||
Novartis ADR | 1,750 | 157,311 | 161,525 | Switzerland | 2.0% | |||||||||||||||||
Novo Nordisk ADR | 1,569 | 86,408 | 88,099 | Denmark | 1.1% | |||||||||||||||||
| 326,632 | 334,674 | 4.1% | ||||||||||||||||||||
Continued on next page.
| 10 | November 30, 2019 | Annual Report | The accompanying notes are an integral part of these financial statements. | |||||
| Saturna Sustainable Equity Fund:Schedule of Investments | As of November 30, 2019 |
| Common Stocks – 93.5% | Number of Shares | Cost | Market Value | Country1 | Percentage of Assets | |||||||||||||||||
| Health Care(continued) | ||||||||||||||||||||||
| Medical Equipment | ||||||||||||||||||||||
Koninklijke Philips | 3,588 | $101,701 | $166,770 | Netherlands | 2.0% | |||||||||||||||||
| 533,359 | 604,339 | 7.4% | ||||||||||||||||||||
| Industrials | ||||||||||||||||||||||
| Commercial & Residential Building Equipment & Systems | ||||||||||||||||||||||
Legrand | 2,100 | 140,972 | 165,926 | France | 2.0% | |||||||||||||||||
| Electrical Components | ||||||||||||||||||||||
TE Connectivity | 1,351 | 117,010 | 125,251 | Switzerland | 1.5% | |||||||||||||||||
| Electrical Power Equipment | ||||||||||||||||||||||
Schneider Electric ADR | 7,000 | 127,185 | 134,610 | United States | 1.7% | |||||||||||||||||
Siemens ADR | 1,000 | 66,086 | 64,440 | Germany | 0.8% | |||||||||||||||||
| 193,271 | 199,050 | 2.5% | ||||||||||||||||||||
| Rubber & Plastic | ||||||||||||||||||||||
Hartalega | 80,000 | 63,885 | 100,580 | Malaysia | 1.2% | |||||||||||||||||
| 515,138 | 590,807 | 7.2% | ||||||||||||||||||||
| Materials | ||||||||||||||||||||||
| Specialty Chemicals | ||||||||||||||||||||||
Johnson Matthey | 4,031 | 163,844 | 149,746 | United Kingdom | 1.9% | |||||||||||||||||
Koninklijke DSM | 1,213 | 135,638 | 155,545 | Netherlands | 1.9% | |||||||||||||||||
Novozymes ADR | 3,300 | 146,658 | 157,542 | Denmark | 1.9% | |||||||||||||||||
| 446,140 | 462,833 | 5.7% | ||||||||||||||||||||
| 446,140 | 462,833 | 5.7% | ||||||||||||||||||||
| Technology | ||||||||||||||||||||||
| Application Software | ||||||||||||||||||||||
Adobe Systems2 | 1,000 | 108,410 | 309,530 | United States | 3.8% | |||||||||||||||||
Dassault Systemes ADR | 1,506 | 119,029 | 238,038 | France | 2.9% | |||||||||||||||||
Open Text | 3,750 | 154,568 | 163,425 | Canada | 2.0% | |||||||||||||||||
| 382,007 | 710,993 | 8.7% | ||||||||||||||||||||
| Communications Equipment | ||||||||||||||||||||||
Apple | 1,000 | 113,474 | 267,250 | United States | 3.3% | |||||||||||||||||
| Consumer Electronics | ||||||||||||||||||||||
Nintendo ADR | 4,000 | 189,340 | 193,560 | United States | 2.4% | |||||||||||||||||
| Electronics Components | ||||||||||||||||||||||
Murata Manufacturing | 3,000 | 133,698 | 173,885 | Japan | 2.1% | |||||||||||||||||
| Information Services | ||||||||||||||||||||||
Wolters Kluwer | 2,000 | 119,754 | 143,749 | Netherlands | 1.8% | |||||||||||||||||
| Infrastructure Software | ||||||||||||||||||||||
Microsoft | 1,438 | 62,724 | 217,684 | United States | 2.7% | |||||||||||||||||
Continued on next page.
| The accompanying notes are an integral part of these financial statements. | November 30, 2019 | Annual Report | 11 | |||||
| Saturna Sustainable Equity Fund:Schedule of Investments | As of November 30, 2019 |
| Common Stocks – 93.5% | Number of Shares | Cost | Market Value | Country1 | Percentage of Assets | |||||||||||||||||
| Technology(continued) | ||||||||||||||||||||||
| IT Services | ||||||||||||||||||||||
Accenture, Class A | 900 | $89,878 | $181,044 | Ireland | 2.2% | |||||||||||||||||
CGI Group Inc Class A2 | 2,000 | 146,223 | 166,280 | Canada | 2.0% | |||||||||||||||||
| 236,101 | 347,324 | 4.2% | ||||||||||||||||||||
| Semiconductor Devices | ||||||||||||||||||||||
NXP Semiconductors | 1,300 | 127,836 | 150,254 | Netherlands | 1.8% | |||||||||||||||||
STMicroelectronics | 3,800 | 84,537 | 92,606 | Switzerland | 1.1% | |||||||||||||||||
| 212,373 | 242,860 | 2.9% | ||||||||||||||||||||
| Semiconductor Manufacturing | ||||||||||||||||||||||
Taiwan Semiconductor ADR | 3,250 | 78,323 | 172,543 | Taiwan | 2.1% | |||||||||||||||||
| 1,527,794 | 2,469,848 | 30.2% | ||||||||||||||||||||
| Utilities | ||||||||||||||||||||||
| Power Generation | ||||||||||||||||||||||
Iberdrola | 15,000 | 153,475 | 147,673 | Spain | 1.8% | |||||||||||||||||
| 153,475 | 147,673 | 1.8% | ||||||||||||||||||||
| Total investments | $5,750,956 | $7,650,147 | 93.5% | |||||||||||||||||||
| Other assets (net of liabilities) | 534,720 | 6.5% | ||||||||||||||||||||
| Total net assets | $8,184,867 | 100.0% | ||||||||||||||||||||
| 1 | Country of domicile |
| 2 | Non-income producing security |
| 3 | Denotes a country of primary exposure |
ADR: American Depository Receipt
Countries | (unaudited) | |||
|
| |||
| Weightings shown are a percentage of total net assets. |
| |||
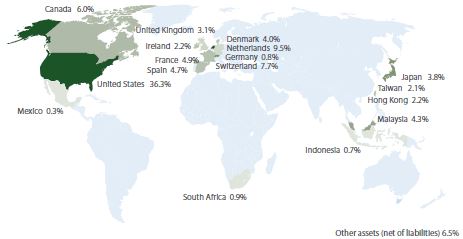
| 12 | November 30, 2019 | Annual Report | The accompanying notes are an integral part of these financial statements. | |||||
Saturna Sustainable Equity Fund
Statement of Assets and Liabilities
| As of November 30, 2019 |
| |||
| ||||
Assets | ||||
Investments in securities, at value | $7,650,147 | |||
Cash | 558,384 | |||
Dividends and interest receivable | 10,721 | |||
Receivable from adviser | 4,487 | |||
Other assets | 2,385 | |||
Receivable for Fund shares sold | 853 | |||
Total assets | 8,226,977 | |||
Liabilities | ||||
Accrued registration/filling fees | 26,630 | |||
Accrued audit expenses | 5,520 | |||
Accrued retirement plan custody fee | 5,099 | |||
Accrued other expenses | 2,024 | |||
Accrued Chief Compliance Officer expenses | 1,958 | |||
Accrued trustee expenses | 879 | |||
Total liabilities | 42,110 | |||
Net assets | $8,184,867 | |||
Analysis of net assets | ||||
Paid-in capital (unlimited shares authorized, without par value) | $6,512,942 | |||
Total distributable earnings | 1,671,925 | |||
Net assets applicable to Fund shares outstanding | $8,184,867 | |||
Fund shares outstanding | 602,641 | |||
Net asset value, offering, and redemption price per share | $13.58 | |||
Statement of Operations
| Year ended November 30, 2019 |
| |||
| ||||
Investment income | ||||
Dividend income (net of foreign tax of ($12,666) | $99,238 | |||
Total investment income | 99,238 | |||
Expenses | ||||
Filing and registration fees | 46,901 | |||
Advisory fees | 40,911 | |||
Audit fees | 8,973 | |||
Retirement plan custodial fees | 5,271 | |||
Printing and postage fees | 3,420 | |||
Chief Compliance Officer expenses | 3,355 | |||
Trustee fees | 2,292 | |||
Other expenses | 1,032 | |||
Legal fees | 954 | |||
Custodian fees | 759 | |||
Other operating expenses | 154 | |||
Misc. Shareowner expense | 15 | |||
Total gross expenses | 114,037 | |||
Less adviser fees waived | (64,802 | ) | ||
Less custodian fee credits | (746 | ) | ||
Net expenses | 48,489 | |||
Net investment income | $50,749 | |||
| ||||
Net realized gain from investments and foreign currency | $12,338 | |||
Net increase in unrealized appreciation on investments and foreign currency | 1,032,935 | |||
Net gain on investments and foreign currency | $1,045,273 | |||
Net increase in net assets resulting from operations | $1,096,022 | |||
| The accompanying notes are an integral part of these financial statements. | November 30, 2019 | Annual Report | 13 | |||||
Saturna Sustainable Equity Fund
Statements of Changes of Net Assets | Year ended November 30, 2019 | Year ended November 30, 2018 | ||||||
Increase in net assets from operations | ||||||||
From operations | ||||||||
Net investment income | $50,749 | $45,439 | ||||||
Net realized gain (loss) on investment and foreign currency | 12,338 | (24,490 | ) | |||||
Net increase in unrealized appreciation on investments and in foreign currencies | 1,032,935 | 23,969 | ||||||
Net increase in net assets resulting from operations | 1,096,022 | 44,918 | ||||||
Distributions to shareowners | (46,186 | ) | (40,318 | ) | ||||
Capital share transactions | ||||||||
Proceeds from sales of shares | 2,048,795 | 1,036,069 | ||||||
Value of shares issued in reinvestment of dividends | 46,186 | 40,318 | ||||||
Cost of shares redeemed | (618,104 | ) | (407,062 | ) | ||||
Total capital share transactions | 1,476,877 | 669,325 | ||||||
Total increase in net assets | 2,526,713 | 673,925 | ||||||
Net assets | ||||||||
Beginning of year | 5,658,154 | 4,984,229 | ||||||
End of year | $8,184,867 | $5,658,154 | ||||||
Shares of the Fund sold and redeemed | ||||||||
Number of shares sold | 159,107 | 87,399 | ||||||
Number of shares issued in reinvestment of dividends | 4,324 | 3,500 | ||||||
Number of shares redeemed | (52,449 | ) | (34,886 | ) | ||||
Net increase in number of shares outstanding | 110,982 | 56,013 | ||||||
Financial Highlights | For year ended November 30, | Period endedA | ||||||||||||||||||
Selected data per share of outstanding capital stock throughout each year: | 2019 | 2018 | 2017 | 2016 | November 30, 2015 | |||||||||||||||
Net asset value at beginning of year | $11.51 | $11.44 | $9.43 | $9.73 | $10.00 | |||||||||||||||
Income from investment operations | ||||||||||||||||||||
Net investment income | 0.09 | 0.09 | 0.09 | 0.06 | 0.02 | |||||||||||||||
Net gains (losses) on securities (both realized & unrealized) | 2.08 | 0.07 | 1.97 | (0.36 | ) | (0.28 | ) | |||||||||||||
Total from investment operations | 2.17 | 0.16 | 2.06 | (0.30 | ) | (0.26 | ) | |||||||||||||
Less distributions | ||||||||||||||||||||
Dividends (from net investment income) | (0.10 | ) | (0.09 | ) | (0.05 | ) | - | (0.01 | ) | |||||||||||
Total distributions | (0.10 | ) | (0.09 | ) | (0.05 | ) | - | (0.01 | ) | |||||||||||
Net asset value at end of year | $13.58 | $11.51 | $11.44 | $9.43 | $9.73 | |||||||||||||||
Total return | 19.04% | 1.39% | 22.01% | (3.08 | )% | (2.60 | )%B | |||||||||||||
Ratios / supplemental data | ||||||||||||||||||||
Net assets ($000), end of year | $8,185 | $5,658 | $4,984 | $3,343 | $3,423 | |||||||||||||||
Ratio of expenses to average net assets | ||||||||||||||||||||
Before fee waivers | 1.81% | 1.27% | 1.48% | 1.65% | 1.23% | C | ||||||||||||||
After fee waivers | 0.78% | 0.76% | 0.88% | 1.00% | 1.00% | C | ||||||||||||||
After fee waivers and custodian fee credits | 0.75% | 0.75% | 0.86% | 0.99% | 0.99% | C | ||||||||||||||
Ratio of net investment income after fee waivers and custodian fee credits to average net assets | 0.80% | 0.82% | 0.95% | 0.67% | 0.29% | C | ||||||||||||||
Portfolio turnover rate | 13% | 8% | 12% | 48% | 53% | B | ||||||||||||||
| A | Operations commenced on March 27, 2015. |
| B | Not annualized. |
| C | Annualized. |
| 14 | November 30, 2019 | Annual Report | The accompanying notes are an integral part of these financial statements. | |||||
| Saturna Sustainable Bond Fund:Performance Summary | (unaudited) |
Average Annual Returns as of November 30, 2019 |
| |||||||||||||||
| 1 Year | 5 Year | 10 Year | Expense Ratio1 | |||||||||||||
Sustainable Bond Fund (SEBFX)2 | 6.09% | n/a | n/a | 0.77% | ||||||||||||
FTSE WorldBIG Index3 | 8.55% | 2.02% | 1.95% | n/a | ||||||||||||
Growth of $10,000
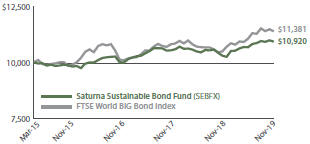 | Comparison of any mutual fund to a market index must be made bearing in mind that the index is expense-free. Conversely, the fund will (1) be actively managed; (2) have an objective other than mirroring the index, such as limiting risk; (3) bear transaction and other costs; (4) stand ready to buy and sell its securities to shareowners on a daily basis; and (5) provide a wide range of services. The graph compares $10,000 invested in the Fund on March 27, 2015, to an identical amount invested in the FTSE WorldBIG Index, a multi-asset, multi-currency benchmark, which provides a broad-based measure of the global fixed income markets. The graph shows that an investment in the Fund would have risen to $10,920 versus rising to $11,381 in the index. |
Past performance does not guarantee future results.The “Growth of $10,000” graph and “Average Annual Returns” performance table assume the reinvestment of dividends and capital gains. They do not reflect the deduction of taxes that a shareowner might pay on fund distributions or the redemption of fund shares.
| 1 | By regulation, the expense ratio shown in this table is as stated in the Fund’s most recent prospectus which is dated March 27, 2019, and incorporates results for the fiscal year ended November 30, 2018, before fee waivers. The expense ratio shown in the most recent prospectus after fee waivers was 0.65%. The ratio presented in this table differs from expense ratios shown elsewhere in this report as they represent different periods. |
| 2 | Operations commenced March 27, 2015. |
| 3 | The FTSE WorldBIG Index was formerly known as the Citi WorldBIG Index. The London Stock Exchange Group acquired Citigroup Index LLC in August 2017. |
Fund Objective
The objectives of the Sustainable Bond Fund are current income and capital preservation.
Top 10 Holdings |
| |||
| % of Total Net Assets | ||||
Toronto-Dominion Bank(1.85% due 09/11/2020) | 4.9% | |||
KFW(2.00% due 11/30/2021) | 4.7% | |||
First Abu Dhabi Bank(3.00% due 03/30/2022) | 4.6% | |||
Nokia OYJ(3.375% due 06/12/2022) | 4.6% | |||
Koninklijke DSM NV(1.00% due 04/09/2025) | 4.1% | |||
Telus(3.20% due 04/05/2021) | 4.1% | |||
United States Treasury Note(3.625% due 02/15/2021) | 4.1% | |||
MAF Sukuk(4.638% due 05/14/2029) | 3.9% | |||
NMC Health Sukuk(5.95% due 11/21/2023) | 3.8% | |||
United States Treasury Bond(4.50% due 05/15/2038) | 3.7% | |||
Portfolio Diversification |
| |||||||||||
| % of Total Net Assets |
| |||||||||||
Government Bonds | 30.9% | ∎ |
|
|
| |||||||
Financials | 25.7% | ∎ | ||||||||||
Technology | 10.4% | ∎ | ||||||||||
Consumer Discretionary | 9.8% | ∎ | ||||||||||
Health Care | 6.5% | ∎ | ||||||||||
Communications | 4.1% | ∎ | ||||||||||
Materials | 4.1% | ∎ | ||||||||||
Consumer Staples | 1.2% | ∎ | ||||||||||
Industrials | 0.9% | ∎ | ||||||||||
Other Assets (net of liabilities) | 6.4% | ∎ | ||||||||||

| November 30, 2019 | Annual Report | 15 | ||||
| Saturna Sustainable Bond Fund:Discussion of Fund Performance | (unaudited) |
(photo omitted)
Fiscal Year 2019
For the fiscal year ending November 30, 2019, the Saturna Sustainable Bond Fund produced a total return of 6.09% versus its benchmark, the FTSE World Big Bond Index, which returned 8.55%. The Fund had an effective duration (price sensitivity to changes in interest rates) of 3.34 years relative to 7.10 for the Index. The underperformance was primarily due to the Fund’s being overweight floating rate securities in December of 2018, when the combination of possible Fed rate cuts and low liquidity caused prices to fall.
Factors Affecting Past Performance
Corporate credit spreads, floating rate securities, currency movements, and US Treasury positions all played an important role in the performance of Sustainable Bond Fund. Corporate credit spreads tightened throughout 2019, especially in the BBB space. Many of the Fund’s top performers included corporate bonds with BBB credit ratings. For example, AXA Insurance was the top performing security, showing a total return of 20% for the year.
The majority of negative performance occurred in the Fund’s floating rate securities frommid-November through December of 2018, with prices leveling out starting the beginning of 2019. Floating rate notes (FRNs) are sensitive to future expectations of interest rates, as the securities have longer final maturities with interest rates that reset quarterly. The price declines coincided immediately after Federal Reserve Chairman Jerome Powell’s November 2018 remarks about growth challenges in 2019 including slowing demand abroad, fading fiscal stimulus at home, and lagged economic impact of the Fed’s past rate increases. The expectations for potentially fewer rate hikes and an extended lower interest rate environment drove the price volatility. The securities saw some price improvement, and the Fund sold all floating rate positions, bringing the exposure down from 19.89% on 11/30/18, to 0% by 2019 fiscalyear-end. Going forward, the Fund is positioned for expected future volatility.
In total, the Sustainable Bond Fund held 27.46% of the portfolio in foreign currencies as of 11/30/19, and currency movement played an important role in performance. The Fund’s 6.49% position in the Mexican peso produced favorable returns, with peso-denominated positions showing a total return of 16.08% for the year. Canadian dollar-denominated positions also produced positive results, returning 4.49% for the year. Brazilian and Colombian currencies depreciated relative to the dollar and detracted from overall performance.
| | Sustainable Bond Fund Exposure | | | Index Exposure | | | 11/30/18 - 11/29/19 Performance (per USD | ) | ||||
Canadian Dollar | 8.67 | - | 0.08 | |||||||||
Mexican Peso | 6.49 | - | 4.28 | |||||||||
Euro | 4.13 | 29.36 | -2.64 | |||||||||
Colombian Peso | 2.74 | - | -8.04 | |||||||||
Brazilian Real | 2.51 | - | -8.75 | |||||||||
Australian Dollar | 1.73 | 0.88 | -7.43 | |||||||||
Norwegian Krone | 1.19 | - | -6.57 | |||||||||
New Zealand Dollar | - | - | -6.55 | |||||||||
British Pound | - | 4.21 | 1.38 | |||||||||
Japanese Yen | - | 10.33 | 3.73 | |||||||||
Other | - | 2.66 | - | |||||||||
Aside from currency movements, the Fund’s positions in US Treasurys contributed positively to performance, with downward shifts across the yield curve for the year. As of 11/30/19, the Fund held 11.39% in Treasury bonds. The 10, 20, and30-year Treasury positions in the Fund produced a total return of 11.88%, 15.36%, and 14.49%, respectively.
US Treasury Curve
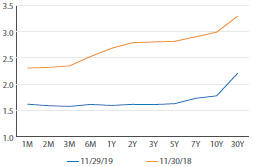
| 16 | November 30, 2019 | Annual Report | ||||
Looking Forward
Over the past year, the Fund has focused on favorable positioning for potential volatility and will continue this into next year. The portfolio has shifted focus to high-grade corporate issues in the one to three-year maturity range, and global exposure in well-diversified companies better positioned to handle business cycles. As a part of the overall strategy, the Fund is also set up to take advantage of select global opportunities with excellent sustainability stories should volatility lend to favorable pricing in 2020. Sustainable Bond Fund has been expanding positions in higher-grade corporate issues, while making strategic curve allocations with the use of Treasurys.
The outlook on monetary policy for early 2020 is that the Federal Reserve will likely stay on hold, keepingshort-end yields stable, while the longer end will move with the economy. The Federal Reserve meeting at the end of January 2020 is likely to focus on funding markets and the balance sheet rather than any meaningful shifts in monetary policy. 2019 saw three cuts by the Fed, which have helped reverse the yield curve inversion. As shown in the chart above, 2019 saw the Treasury curve shift downward, as recession fears driven by falling manufacturing activity and tariffs weighed on the economy and pushed yields lower. Going forward, a trade deal with China or easing fears about a potential recession would likely see the10-year Treasury yields go higher.
| November 30, 2019 | Annual Report | 17 | ||||
| Saturna Sustainable Bond Fund:Schedule of Investments | As of November 30, 2019 |
| Corporate Bonds – 62.7% | Coupon / Maturity | Face Amount | Market Value | Country1 | Percentage of Assets | |||||||||||||||
| Communications | ||||||||||||||||||||
Telus | 3.20% due 04/05/2021 | CAD 1,500,000 | $1,142,679 | Canada | 4.1% | |||||||||||||||
| 1,142,679 | 4.1% | |||||||||||||||||||
| Consumer Discretionary | ||||||||||||||||||||
Barry Callebaut2 | 5.50% due 06/15/2023 | 500,000 | 544,487 | Belgium | 2.0% | |||||||||||||||
Barry Callebaut3 | 5.50% due 06/15/2023 | 500,000 | 544,487 | Belgium | 2.0% | |||||||||||||||
BMW US Capital | 2.75% due 12/02/2019 | AUD 200,000 | 135,280 | Germany | 0.4% | |||||||||||||||
Danone3 | 2.077% due 11/02/2021 | 500,000 | 499,769 | France | 1.8% | |||||||||||||||
Hasbro | 3.15% due 05/15/2021 | 500,000 | 505,616 | United States | 1.8% | |||||||||||||||
Starbucks | 2.45% due 06/15/2026 | 500,000 | 504,101 | United States | 1.8% | |||||||||||||||
| 2,733,740 | 9.8% | |||||||||||||||||||
| Consumer Staples | ||||||||||||||||||||
Nestle Holdings | 2.75% due 04/15/2020 | NOK 3,000,000 | 326,409 | Switzerland | 1.2% | |||||||||||||||
| 326,409 | 1.2% | |||||||||||||||||||
| Financials | ||||||||||||||||||||
AXA2 | 5.125% due 01/17/2047 | 500,000 | 545,909 | France | 2.0% | |||||||||||||||
Canadian Imperial Bank4 | 3.42% due 01/26/2026 | CAD 1,150,000 | 877,621 | Canada | 3.1% | |||||||||||||||
First Abu Dhabi Bank2 | 3.00% due 03/30/2022 | 1,250,000 | 1,266,385 | United Arab Emirates | 4.6% | |||||||||||||||
Iron Mountain | 5.75% due 08/15/2024 | 1,000,000 | 1,013,210 | United States | 3.6% | |||||||||||||||
MAF Sukuk2 | 4.638% due 05/14/2029 | 1,000,000 | 1,072,941 | United Arab Emirates | 3.9% | |||||||||||||||
RaboBank | 2.50% due 01/19/2021 | 500,000 | 503,029 | Netherlands | 1.8% | |||||||||||||||
RaboBank3 | 4.75% due 01/15/2020 | 500,000 | 501,623 | Netherlands | 1.8% | |||||||||||||||
Toronto-Dominion Bank | 1.85% due 09/11/2020 | 1,350,000 | 1,349,908 | United States | 4.9% | |||||||||||||||
| 7,130,626 | 25.7% | |||||||||||||||||||
| Health Care | ||||||||||||||||||||
NMC Health Sukuk2 | 5.95% due 11/21/2023 | 1,000,000 | 1,056,396 | United Arab Emirates | 3.8% | |||||||||||||||
Novartis Capital | 1.80% due 02/14/2020 | 250,000 | 249,936 | Switzerland | 0.9% | |||||||||||||||
Roche | 2.875% due 09/29/2021 | 500,000 | 508,919 | Switzerland | 1.8% | |||||||||||||||
| 1,815,251 | 6.5% | |||||||||||||||||||
| Industrials | ||||||||||||||||||||
Ingersoll-Rand | 2.625% due 05/01/2020 | 250,000 | 250,459 | Luxembourg | 0.9% | |||||||||||||||
| 250,459 | 0.9% | |||||||||||||||||||
| Materials | ||||||||||||||||||||
Koninklijke DSM NV2 | 1.00% due 04/09/2025 | EUR 1,000,000 | 1,150,040 | Netherlands | 4.1% | |||||||||||||||
| 1,150,040 | 4.1% | |||||||||||||||||||
Continued on next page.
| 18 | November 30, 2019 | Annual Report | The accompanying notes are an integral part of these financial statements. | |||||
| Saturna Sustainable Bond Fund:Schedule of Investments | As of November 30, 2019 |
| Corporate Bonds – 62.7% | Coupon / Maturity | Face Amount | Market Value | Country1 | Percentage of Assets | |||||||||||||||
| Technology | ||||||||||||||||||||
Apple2 | 2.65% due 06/10/2020 | AUD 500,000 | $340,670 | United States | 1.2% | |||||||||||||||
Microsoft | 5.30% due 02/08/2041 | 525,000 | 723,429 | United States | 2.6% | |||||||||||||||
Nokia OYJ | 3.375% due 06/12/2022 | 1,250,000 | 1,264,000 | Finland | 4.6% | |||||||||||||||
RELX | 4.00% due 03/18/2029 | 500,000 | 549,469 | United Kingdom | 2.0% | |||||||||||||||
| 2,877,568 | 10.4% | |||||||||||||||||||
| Total Corporate Bonds | $17,426,772 | 62.7% | ||||||||||||||||||
| Government Bonds – 30.9% | Coupon / Maturity | Face Amount | Market Value | Country1 | Percentage of Assets | |||||||||||||||
| Banks | ||||||||||||||||||||
KFW | 2.00% due 11/30/2021 | $1,300,000 | $1,308,183 | Germany | 4.7% | |||||||||||||||
| 1,308,183 | 4.7% | |||||||||||||||||||
| Foreign Government Bonds | ||||||||||||||||||||
Federal Republic of Brazil | 12.50% due 01/05/2022 | BRL 2,500,000 | 675,704 | Brazil | 2.4% | |||||||||||||||
International Financial Corp | 4.75% due 04/29/2021 | MXN 15,000,000 | 741,842 | Mexico | 2.7% | |||||||||||||||
Mexico Bonos Desarrollo | 6.50% due 06/10/2021 | MXN 200,000 | 1,016,804 | Mexico | 3.7% | |||||||||||||||
Ontario | 2.65% due 02/05/2025 | CAD 500,000 | 390,571 | Canada | 1.4% | |||||||||||||||
Perusahaan Penerbit SBSN2 | 3.75% due 03/01/2023 | 500,000 | 518,155 | Indonesia | 1.9% | |||||||||||||||
Republic of Colombia | 7.75% due 04/14/2021 | COP 2,500,000,000 | 735,501 | Colombia | 2.6% | |||||||||||||||
| 4,078,577 | 14.7% | |||||||||||||||||||
| United States Treasury Bonds | ||||||||||||||||||||
United States Treasury Bond | 5.25% due 11/15/2028 | 500,000 | 643,945 | United States | 2.3% | |||||||||||||||
United States Treasury Bond | 4.50% due 05/15/2038 | 750,000 | 1,037,373 | United States | 3.7% | |||||||||||||||
United States Treasury Bond | 3.375% due 11/15/2048 | 300,000 | 375,363 | United States | 1.4% | |||||||||||||||
| 2,056,681 | 7.4% | |||||||||||||||||||
| United States Treasury Note | ||||||||||||||||||||
United States Treasury Note | 3.625% due 02/15/2021 | $1,100,000 | 1,125,008 | United States | 4.1% | |||||||||||||||
| 1,125,008 | 4.1% | |||||||||||||||||||
| Total Government Bonds | $8,568,449 | 30.9% | ||||||||||||||||||
| Total investments | (Cost is $26,038,467) | 25,995,221 | 93.6% | |||||||||||||||||
| Other assets (net of liabilities) | 1,780,211 | 6.4% | ||||||||||||||||||
| Total net assets | $27,775,432 | 100.0% | ||||||||||||||||||
| 1 | Country of risk |
| 2 | Security was purchased pursuant to Regulation S under the Securities Act of 1933 which exempts from registration securities offered and sold outside of the United States. Such a security cannot be sold in the United States without either an effective registration statement filed pursuant to the Securities Act of 1933, or pursuant to an exemption from registration. These securities have been deemed liquid under guidelines approved by the Trust’s Board of Trustees. At November 30, 2019, the aggregate value of these securities was $6,494,983 representing 23.4% of net assets. |
| 3 | Security was purchased pursuant to Rule 144A under the Securities Act of 1933 and may be sold in transactions exempt from registration only to qualified institutional buyers or in public offering registered under the Securities Act of 1933. These securities have been deemed liquid under guidelines approved by the Trust’s Board of Trustees. At November 30, 2019, the net value of these securities was $1,545,879 representing 5.6% of net assets. |
| 4 | Canadian Imperial Bank is a fixed to float bond. The bond has a fixed rate until 01/26/2021. The interest rate represents the rate in effect at November 30, 2019. |
| The accompanying notes are an integral part of these financial statements. | November 30, 2019 | Annual Report | 19 | |||||
| Saturna Sustainable Bond Fund:Schedule of Investments | As of November 30, 2019 |
Countries | (unaudited) | |||
|
| |||
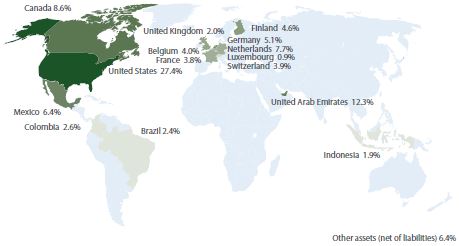 |
| |||
| Weightings shown are a percentage of total net assets. |
| |||
Bond Quality Diversification |
| (unaudited) | ||||||||||
| % of Total Net Assets |
| |||||||||||
Rated “AAA” | 21.5% | ∎ |
|
|
| |||||||
Rated “AA+” | 6.1% | ∎ | ||||||||||
Rated“AA-” | 12.6% | ∎ | ||||||||||
Rated “A+” | 1.3% | ∎ | ||||||||||
Rated“A-” | 9.8% | ∎ | ||||||||||
Rated “BBB+” | 14.6% | ∎ | ||||||||||
Rated “BBB” | 9.3% | ∎ | ||||||||||
Rated“BBB-” | 4.0% | ∎ | ||||||||||
Rated “BB+” | 3.8% | ∎ | ||||||||||
Rated “BB” | 7.0% | ∎ | ||||||||||
Rated “B” | 3.6% | ∎ | ||||||||||
Other Assets (net of liabilities) | 6.4% | ∎ | ||||||||||
| Credit ratings are the lesser of S&P Global Ratings or Moody’s Investors Service. If neither S&P nor Moody’s rate a particular security, that security is categorized as not rated (except for US Treasury securities and securities issued or backed by US agencies which inherit the credit rating for the US government). Ratings range from AAA (highest) to D (lowest). Bonds rated BBB or above are considered investment grade. Credit ratings BB and below are lower-rated securities (junk bonds). Ratings apply to the credit worthiness of the issuers of the underlying securities and not the fund or its shares. Ratings may be subject to change. |
| |||||||||||

| 20 | November 30, 2019 | Annual Report | The accompanying notes are an integral part of these financial statements. | |||||
Saturna Sustainable Bond Fund
Statement of Assets and Liabilities
| As of November 30, 2019 |
| |||
| ||||
Assets | ||||
Investments in securities, at value (Cost $26,038,467) | $25,995,221 | |||
Cash | 1,484,483 | |||
Dividends and interest receivable | 319,522 | |||
Other assets | 20,471 | |||
Receivable for Fund shares sold | 258 | |||
Total assets | 27,819,955 | |||
Liabilities | ||||
Accrued registration/filling fees | 11,886 | |||
Accrued audit expenses | 9,100 | |||
Accrued advisory fees | 6,947 | |||
Payable for Fund shares redeemed | 6,355 | |||
Accrued Chief Compliance Officer expenses | 4,004 | |||
Distributions payable | 2,913 | |||
Accrued other expenses | 1,636 | |||
Accrued trustee expenses | 1,039 | |||
Accrued retirement plan custody fee | 643 | |||
Total liabilities | 44,523 | |||
Net assets | $27,775,432 | |||
Analysis of net assets | ||||
Paid-in capital (unlimited shares authorized, without par value) | $28,284,752 | |||
Total distributable earnings | (509,320 | ) | ||
Net assets applicable to Fund shares outstanding | $27,775,432 | |||
Fund shares outstanding | 2,862,545 | |||
Net asset value, offering, and redemption price per share | $9.70 | |||
Statement of Operations
| Year ended November 30, 2019 |
| |||
| ||||
Investment income | ||||
Interest income | $1,035,947 | |||
Total investment income | 1,035,947 | |||
Expenses | ||||
Advisory fees | 161,348 | |||
Filing and registration fees | 27,117 | |||
Audit fees | 19,482 | |||
Chief Compliance Officer expenses | 13,421 | |||
Trustee fees | 6,530 | |||
Printing fees | 3,549 | |||
Custodian fees | 3,430 | |||
Legal fees | 3,131 | |||
Postage fee expense | 2,172 | |||
Insurance fees | 1,956 | |||
Retirement plan custodial fees | 754 | |||
Other operating expenses | 635 | |||
Total gross expenses | 243,525 | |||
Less adviser fees waived | (48,245 | ) | ||
Less custodian fee credits | (3,353 | ) | ||
Net expenses | 191,927 | |||
Net investment income | 844,020 | |||
| ||||
Net realized loss from investments and foreign currency | (526,018 | ) | ||
Net decrease in unrealized depreciation on investments and foreign currency | 1,466,882 | |||
Net gain on investments | $940,864 | |||
Net increase in net assets resulting from operations | $1,784,884 | |||
| The accompanying notes are an integral part of these financial statements. | November 30, 2019 | Annual Report | 21 | |||||
Saturna Sustainable Bond Fund
Statements of Changes in Net Assets | Year ended November 30, 2019 | Year ended November 30, 2018 | ||||||
Increase (decrease) in net assets from operations | ||||||||
From operations | ||||||||
Net investment income | $844,020 | $821,787 | ||||||
Net realized loss on investment | (526,018 | ) | (88,078 | ) | ||||
Net increase (decrease) in unrealized appreciation | 1,466,882 | (1,499,785 | ) | |||||
Net increase (decrease) in net assets | 1,784,884 | (766,076 | ) | |||||
Distributions to shareowners | (787,144 | ) | (722,566 | ) | ||||
Capital share transactions | ||||||||
Proceeds from sales of shares | 9,188,924 | 14,807,636 | ||||||
Value of shares issued in reinvestment of dividends | 694,871 | 637,199 | ||||||
Cost of shares redeemed | (14,752,663 | ) | (4,289,584 | ) | ||||
Total capital share transactions | (4,868,868 | ) | 11,155,251 | |||||
Total increase (decrease) in net assets | (3,871,128 | ) | 9,666,609 | |||||
Net assets | ||||||||
Beginning of year | 31,646,560 | 21,979,951 | ||||||
End of year | $27,775,432 | $31,646,560 | ||||||
Shares of the Fund sold and redeemed | ||||||||
Number of shares sold | 957,716 | 1,517,615 | ||||||
Number of shares issued in reinvestment of dividends | 72,324 | 65,470 | ||||||
Number of shares redeemed | (1,538,171 | ) | (438,446 | ) | ||||
Net increase (decrease) in number of shares outstanding | (508,131 | ) | 1,144,639 | |||||
Financial Highlights | Year ended November 30, | Period endedA | ||||||||||||||||||
Selected data per share of outstanding capital stock throughout each year: | 2019 | 2018 | 2017 | 2016 | Nov.30, 2015 | |||||||||||||||
Net asset value at beginning of year | $9.39 | $9.87 | $9.65 | $9.75 | $10.00 | |||||||||||||||
Income from investment operations | ||||||||||||||||||||
Net investment income | 0.28 | 0.26 | 0.27 | 0.24 | 0.12 | |||||||||||||||
Net gains (losses) on securities (both realized and unrealized) | 0.29 | (0.48 | ) | 0.23 | (0.10 | ) | (0.25 | ) | ||||||||||||
Total from investment operations | 0.57 | (0.22 | ) | 0.50 | 0.14 | (0.13 | ) | |||||||||||||
Less distributions | ||||||||||||||||||||
Dividends (from net investment income) | (0.26 | ) | (0.26 | ) | (0.27 | ) | (0.24 | ) | (0.12 | ) | ||||||||||
Capital gains distribution | - | - | (0.01 | ) | - | - | ||||||||||||||
Total distributions | (0.26 | ) | (0.26 | ) | (0.28 | ) | (0.24 | ) | (0.12 | ) | ||||||||||
Net asset value at end of year | $9.70 | $9.39 | $9.87 | $9.65 | $9.75 | |||||||||||||||
Total return | 6.09% | (2.29 | )% | 5.28% | 1.37% | (1.29 | )%B | |||||||||||||
Ratios / supplemental data | ||||||||||||||||||||
Net assets ($000), end of year | $27,775 | $31,647 | $21,980 | $8,639 | $6,885 | |||||||||||||||
Ratio of expenses to average net assets | ||||||||||||||||||||
Before fee waivers | 0.83% | 0.77% | 0.92% | 1.17% | 1.02% | C | ||||||||||||||
After fee waivers | 0.66% | 0.66% | 0.75% | 0.89% | 0.90% | C | ||||||||||||||
After fee waivers and custodian fee credits | 0.65% | 0.65% | 0.74% | 0.89% | 0.89% | C | ||||||||||||||
Ratio of net investment income after fee waivers custodian fee credits to average net assets | 2.87% | 2.99% | 2.82% | 2.46% | 1.92% | C | ||||||||||||||
Portfolio turnover rate | 38% | 25% | 14% | 46% | 4% | B | ||||||||||||||
| A | Operations commenced on March 27, 2015. |
| B | Not annualized on periods less than one year. |
| C | Annualized on periods less than one year. |
| 22 | November 30, 2019 | Annual Report | The accompanying notes are an integral part of these financial statements. | |||||
Notes To Financial Statements
NOTE 1 – Organization
Saturna Investment Trust (the “Trust”) was established under Washington State Law as a business trust on February 20, 1987. The Trust is registered as anopen-end, diversified management company under the Investment Company Act of 1940, as amended. Nine portfolio series have been created to date, two of which are covered by this annual report: Saturna Sustainable Equity Fund and Saturna Sustainable Bond Fund (the “Funds”). The Sextant Short-Term Bond Fund, Sextant Bond Income Fund, Sextant Core Fund, Sextant Global High Income Fund, Sextant Growth Fund, Sextant International Fund, and the IdahoTax-Exempt Fund are offered through separate prospectuses, the results of which are contained in separate reports.
Saturna Sustainable Equity Fund and Saturna Sustainable Bond Fund commenced operations on March 27, 2015.
Each Fund is an investment company and accordingly follows the investment company accounting and reporting guidance of the Financial Accounting Standards Board (FASB) Accounting Standard Codification Topic 946 “Financial Services – Investment Companies”.
Investment risks:
Saturna Sustainable Equity andSaturna Sustainable BondFunds: The value of each Fund’s shares rises and falls as the value of the securities in which the Fund invests goes up and down. Fund share prices, yields, and total returns will change with market fluctuations as well as the fortunes of the countries, industries, and companies in which the Fund invests. The Funds do not use derivatives to hedge currency, interest rate, or credit risk.
Ratings are dependent upon the associated ESG risks that are most pertinent to the sector in which an issuer operates. The ratings process associated with sustainable and responsible investing reduces the investable universe for each Fund, which limits opportunities and may increase the risk of loss during market declines. The adviser believes that sustainable investing may mitigate security-specific risk, but there is no guarantee that the securities favored by our investment process will perform better and may perform worse than those that are not favored.
The Funds may invest substantially in one or more sectors, which can increase volatility and exposure to issues specific to a particular sector or industry.
Foreign investing involves risks not normally associated with investing in US securities. These include fluctuations in currency exchange rates, less public information about securities, less governmental market supervision, and the lack of uniform financial, social, and political standards. Foreign investing heightens the risk of confiscatory taxation, seizure or nationalization of assets, establishment of currency controls, or adverse political or social developments that affect investments. The risks of investing in foreign securities are typically greater in less developed or emerging countries.
Liquidity risk exists when particular investments are difficult to sell. If a Fund holds illiquid investments, its portfolio may be more difficult to value, especially in changing markets. Investments by a Fund in foreign securities and those that are thinly traded, such as lower quality issuers, and smaller companies tend to involve greater liquidity risk. If a Fund is forced to sell or unwind these investments to meet redemptions or for other cash needs, the Fund may suffer a penalty. Additionally, the market for certain investments may become illiquid under adverse market or economic conditions independent of any specific adverse changes in the conditions of a particular issuer. In such cases, the Fund, due to limitations on investments in illiquid securities and the difficulty in purchasing and selling such securities, may be unable to achieve its investment objective.
Saturna Sustainable Bond Fund: The risks inherent in the Saturna Sustainable Bond Fund depend primarily on the terms and quality of the obligations in its portfolio, as well as on bond market conditions. When interest rates rise, bond prices fall. When interest rates fall, bond prices go up. Bonds with longer maturities usually are more sensitive to interest rate changes than bonds with shorter maturities. The Fund entails credit risk, which is the possibility that a bond will not be able to pay interest or principal when due. If the credit quality of a bond is perceived to decline, investors will demand a higher yield, which means a lower price on that bond to compensate for the higher level of risk.
The Fund may invest a portion of its assets in securities issued by government sponsored entities such as Fannie Mae, Freddie Mac, and the Federal Home Loan Banks in the US. Foreign governments also sponsor similar entities, which may promote activities such aslow-cost housing or alternative energy. The Fund may also invest in the issues of regional, state, and local governments. The terms of such issues can be complex, and there can be no assurance that a government entity will support such enterprises that encounter financial difficulty.
Issuers of high-yield securities are generally not as strong financially as those issuing higher quality securities. These issuers are more likely to encounter financial difficulties and are more vulnerable to changes in the relevant economy that could affect their ability to make interest and principal payments as expected. High-yield bonds may have low or no ratings, and may be considered “junk bonds.”
Bond investments, especially mortgage-backed and asset-backed securities, are subject to the risk that borrowers will prepay the principal more quickly than expected (prepayment risk) or more slowly than expected (extension risk), which will affect the yield, average life, and price of the securities.
NOTE 2 - Significant Accounting Policies
The following is a summary of the significant accounting policies, in conformity with accounting principles generally accepted in the United States of America, which are consistently followed by the Funds in preparation of their financial statements.
Security valuation:
Investments in securities traded on a national securities exchange andover-the-counter securities for which sale prices are available are valued at that price. Securities for which there are no sales are valued at the latest bid price.
Debt securities are valued usingbid-side valuations provided by an independent service. The service determines valuations using factors such as yields or prices of bonds of comparable quality, type of issue, coupon maturity, ratings, trading activity, and general market conditions.
Fixed-income debt instruments, such as commercial paper, bankers’ acceptances, and US Treasury Bills, with a maturity of 60 days or less are valued at amortized cost, which approximates market value.
| November 30, 2019 | Annual Report | 23 | ||||
Notes To Financial Statements(continued)
Any discount or premium is accreted or amortized on a straight-line basis until maturity.
Foreign markets may close before the time as of which the Funds’ share prices are determined. Because of this, events occurring after the close and before the determination of the Funds’ share prices may have a material effect on the values of some or all of the Funds’ foreign securities. To account for this, the Funds may use outside pricing services for valuation of theirnon-US securities.
In cases in which there is not a readily available market price, a fair value for such security is determined in good faith by or under the direction of the Board of Trustees.
Security transactions are recorded on the trade date. Realized gains and losses on sales of securities are recorded on the identified cost basis.
Foreign currency:
Investment securities and other assets and liabilities denominated in foreign currencies are translated into US dollar amounts at the date of valuation. Purchases and sales of investment securities and income and expense items denominated in foreign currencies are translated into US dollar amounts on the respective dates of such transactions.
The Funds do not isolate that portion of the results of operations resulting from changes in foreign exchange rates on investments from the fluctuations arising from changes in market prices of securities held. Such fluctuations are included with the net realized and unrealized gain or loss from investments.
Reported net realized foreign exchange gains or losses arise from sales of foreign currencies, currency gains or losses realized between the trade and settlement dates on securities transactions, and the difference between the amounts of dividends, interest, and foreign withholding taxes recorded on the Funds’ books and the US dollar equivalent of the amounts actually received or paid. Net unrealized foreign exchange gains and losses arise from changes in the fair values of assets and liabilities, other than investments in securities at fiscal period end, resulting from changes in exchange rates.
Share valuation:
The net asset value (“NAV”) per share of each Fund is calculated by dividing the sum of the value of the securities held by each Fund, plus cash and other assets, minus all liabilities (including estimated accrued expenses) by the total number of shares outstanding for each Fund, rounded to the nearest cent. The Funds’ shares are not priced or traded on days the New York Stock Exchange is closed. The NAV is the offering and redemption price per share.
Fair value measurements:
Accounting Standards Codification (ASC) 820 establishes a three-tier framework for measuring fair value based on a hierarchy of inputs. The hierarchy distinguishes between market data obtained from independent sources (observable inputs) and the Funds’ own market assumptions (unobservable inputs). These inputs are used in determining the value of the Funds’ investments and are summarized below.
| Funds | Level 1 Quoted Price | Level 2 Significant Observable Input | Level 3 Significant Unobservable Input | Total | ||||||||||||
Sustainable Equity Fund | ||||||||||||||||
Common Stocks | ||||||||||||||||
Communications | $189,936 | $- | $- | $189,936 | ||||||||||||
Consumer Discretionary | 1,221,043 | 93,411 | - | $1,314,454 | ||||||||||||
Consumer Staples | 740,864 | 24,721 | - | $765,585 | ||||||||||||
Energy | - | 181,402 | - | $181,402 | ||||||||||||
Financials | 593,131 | 330,139 | - | $923,270 | ||||||||||||
Health Care | 501,444 | 102,895 | - | $604,339 | ||||||||||||
Industrials | 324,301 | 266,506 | - | $590,807 | ||||||||||||
Materials | 157,542 | 305,291 | - | $462,833 | ||||||||||||
Technology | 2,152,214 | 317,634 | - | $2,469,848 | ||||||||||||
Utilities | - | 147,673 | $147,673 | |||||||||||||
Total Assets | $5,880,475 | $1,769,672 | $- | $7,650,147 | ||||||||||||
Sustainable Bond Fund | ||||||||||||||||
Corporate Bonds1 | $- | $17,426,772 | $- | $17,426,772 | ||||||||||||
Government Bonds1 | $- | $8,568,449 | $- | $8,568,449 | ||||||||||||
Total Assets | $- | $25,995,221 | $- | $25,995,221 | ||||||||||||
| 1 | See Schedule of Investments for industry breakout. |
During the period ended November 30, 2019, no Fund had transfers between Level 1, Level 2 or Level 3.
| 24 | November 30, 2019 | Annual Report | ||||
Notes To Financial Statements (continued)
| Level 1 — | Unadjusted quoted prices in active markets for identical assets or liabilities that the Trust has the ability to access. |
| Level 2 — | Observable inputs other than quoted prices in Level 1 that are observable for the asset or liability, either directly or indirectly. These inputs may include quoted prices for the identical instrument on an inactive market, prices for similar instruments, interest rates, prepayment speeds, credit risk, yield curves, default rates, and similar data. |
| Level 3 — | Unobservable inputs for the asset or liability, to the extent relevant observable inputs are not available, representing the Trust’s own assumptions about the assumptions a market participant would use in valuing the asset or liability, and would be based on the best information available. |
The availability of observable inputs can vary from security to security and is affected by a wide variety of factors, including, for example, the type of security, whether the security is new and not yet established in the marketplace, the liquidity of markets, and other characteristics particular to the security. To the extent that valuation is based on models or inputs that are less observable or unobservable in the market, the determination of fair value requires more judgment. Accordingly, the degree of judgment exercised in determining fair value is greatest for instruments categorized in Level 3.
The inputs used to measure fair value may fall into different levels of the fair value hierarchy. In such cases, for disclosure purposes, the level in the fair value hierarchy within which the fair value measurement falls in its entirety, is determined based on the lowest level input that is significant to the fair value measurement in its entirety.
The inputs or methodology used for valuing securities are not necessarily an indication of the risk associated with investing in those securities.
Investment concentration:
The Funds may have deposits of cash with the custodian from time to time for one or more reasons. “Other assets (net of liabilities)” in the Funds’ Schedules of Investments primarily represents cash on deposit with the custodian. Cash on deposit will vary widely over time. Accounting Standards Codification (“ASC”) 825,“Financial Instruments,” identifies these items as a concentration of credit risk. The risk is managed by careful financial analysis and review of the custodian’s operations, resources, and protections available to the Trust. This process includes evaluation of other financial institutions providing investment company custody services.
Federal income taxes:
The Funds intend to comply with the requirements of the Internal Revenue Code necessary to qualify as a regulated investment company and to make the requisite distributions of income and capital gains to its shareowners sufficient to relieve them from all or substantially all federal income taxes. Therefore, no federal income tax provision is required.
The Funds recognize the tax benefits of uncertain tax positions only where the position is “more likely than not” to be sustained assuming examination by tax authorities. Management has analyzed the Funds’ tax positions and has concluded that no liability for unrecognized tax benefits should be recorded related to uncertain tax positions taken on returns filed for open tax years (2016-2018) or expected to be taken in the Funds’ 2019 tax returns. The Funds identify their major tax jurisdictions as US federal and foreign jurisdictions where the Funds make significant investments; however, the Funds are not aware of any tax positions for which it is reasonably possible that the total amounts of unrecognized tax benefits will change materially in the next 12 months.
Reclassification of capital accounts:
Accounting principles generally accepted in the United States of America require that certain components of net assets relating to permanent differences be reclassified between financial and tax reporting.
As of November 30, 2019, the the reclassification of capital accounts were as follows:
| Equity Fund | Bond Fund | |||||||
Distributable earnings | $- | $28,677 | ||||||
Paid-in capital | $- | $(28,677 | ) | |||||
Distributions to shareowners:
For the Sustainable Bond Fund, dividends to shareowners from net investment income are paid daily and distributed on the last business day of each month. Sustainable Equity Fund pays income dividends annually, typically by the end of the year. As a result of its investment strategy, the Saturna Sustainable Equity Fund may not pay income dividends. For both Funds, distributions of capital gains, if any, are made at least annually, and as required to comply with federal excise tax requirements. Distributions to shareowners are determined in accordance with income tax regulations and are recorded on theex-dividend date. Dividends are paid in shares of the Funds, at the net asset value on the payable date. Shareowners may elect to take distributions if they total $10 or more in cash.
Use of estimates:
The preparation of financial statements in conformity with accounting principles generally accepted in the United States of America requires management to make estimates and assumptions that affect the reported amounts of assets and liabilities and disclosure of contingent assets and liabilities at the date of the financial statements and the reported amounts of increases and decreases in net assets from operations during the reporting period. Actual results could differ from those estimates.
Foreign taxes:
Withholding taxes on foreign dividends are paid (a portion of which may be reclaimable) or provided for in accordance with the applicable country’s tax rules and rates and are disclosed in the Statement of Operations. Withholding tax reclaims are filed in certain countries to recover a portion of the amounts previously withheld. The Funds record a reclaim receivable based on a number of factors, including a jurisdiction’s legal obligation to pay reclaims as well as payment history and market convention.
Other:
Interest income is recognized on an accrual basis. Premiums on
| November 30, 2019 | Annual Report | 25 | ||||
Notes To Financial Statements(continued)
securities purchased are amortized, and discounts are accreted over the lives of the respective securities. Dividends from equity securities are recorded as income on theex-dividend date.
Recent Accounting Pronouncement:
In August 2018, FASB issued Accounting Standards UpdateNo. 2018-13, “Fair Value Measurement (Topic 820: Disclosure Framework — Changes to the Disclosure Requirements for Fair Value Measurement” (“ASU2018-13”). ASU2018-13 eliminates the requirement to disclose the amount of and reasons for transfers between Level 1 and Level 2 of the fair value hierarchy, the timing of transfers between levels of the fair value hierarchy and the valuation processes for Level 3 fair value measurements. ASU2018-13 will require the need to disclose the range and weighted average used to develop significant unobservable inputs for Level 3 fair value measurements and the changes in unrealized gains and losses for recurring Level 3 fair value measurements. ASU2018-13 will also require that information is provided about the measurement uncertainty of Level 3 fair value measurements as of the reporting date. The guidance is effective for fiscal years, and interim periods within those fiscal years, beginning after December 15, 2019, and allows for early adoption of either the entire standard or only the provisions that eliminate or modify the requirements. Management has elected to adopt early the provisions that eliminate the disclosure requirements. Management is still currently evaluating the impact of applying the rest of the guidance.
NOTE 3 – Transactions with Affiliated Persons
Under contracts approved annually by the Trust’s independent trustees, Saturna Capital Corporation provides investment advisory services and certain other administrative services required to conduct Trust business. Expenses incurred by the Trust on behalf of the Funds (e.g., legal fees) are allocated to the Funds on the basis of relative daily average net assets. For such services, each of the Funds pays the adviser an Investment Advisory and Administrative Services Fee of 0.65% for the Sustainable Equity Fund and 0.55% for the Sustainable Bond Fund of average net assets per annum, payable monthly. In addition, the adviser has agreed to certain limits on other expenses, as described below.
The Adviser has voluntarily undertaken to limit expenses of the Sustainable Equity Fund to 0.75% and the Sustainable Bond Fund to 0.65% through March 31, 2020. For the year ended November 30, 2019, the advisory fees incurred were as follows:
Adviser Fees | Adviser Fees Waived | Expense Reimbursement | ||||||||||
Sustainable Equity | $40,911 | $(40,911 | ) | $(23,891 | ) | |||||||
Sustainable Bond | $161,348 | $(48,245 | ) | $- | ||||||||
In accordance with the expense limitation noted above, for the year ended November 30, 2019, Saturna Capital waived a portion of the advisory fees of the Sustainable Equity Fund and Sustainable Bond Fund. The adviser cannot recoup previously waived fees.
Saturna Brokerage Services, Inc. (“SBS”), a discount brokerage and subsidiary of Saturna Capital Corporation, is registered as a broker-dealer and acts as distributor. On December 19, 2014, the Funds adopted a Distribution Plan in accordance with Rule12b-1 under the 1940 Act. On June 2, 2017,12b-1 fees were terminated for both Saturna Sustainable Funds.
SBS is used to effect portfolio transactions for the Trust. SBS currently executes portfolio transactions without commission. Transactions effected through other brokers are subject to commissions payable to that broker.
Saturna Trust Company (“STC”), a subsidiary of Saturna Capital, acts as retirement plan custodian for Fund shareowners. Each Fund pays an annual fee of $10 per account for retirement plan services to Saturna Trust Company. For the year ended November 30, 2019, the Funds incurred the following amounts:
| Retirement plan custodial fees | ||||
Sustainable Equity | $5,271 | |||
Sustainable Bond | $754 | |||
Mrs. Jane Carten serves as a trustee and president of the Trust. She is also a director and president of Saturna Capital and vice president of Saturna Trust Company. Mrs. Carten is not compensated by the Trust. For the year ended November 30, 2019, the Trust incurred compensation expenses of $31,500 which is included in $44,545 of total expenses for the independent Trustees. The Saturna Sustainable Funds incurred $8,882 of these total expenses.
The officers of the Trust are paid by Saturna Capital, not the Trust, except the Chief Compliance Officer, who may be partially compensated by the Trust. For the year ended November 30, 2019, the Funds paid the following compensation expenses for the Chief Compliance Officer:
| Chief Compliance Officer | ||||
Sustainable Equity | $3,355 | |||
Sustainable Bond | $13,421 | |||
On November 30, 2019, the trustees, officers, and their affiliates as a group owned 63.51% and 14.04% of the outstanding shares of Sustainable Equity Fund and Sustainable Bond Fund, respectively.
| 26 | November 30, 2019 | Annual Report | ||||
Notes To Financial Statements (continued)
NOTE 4 – Distributions to Shareowners
The tax characteristics of distributions paid for the year ended November 30, 2019, and the fiscal year ended November 30, 2018 were as follows:
| Year ended November 30, 2019 | Year ended November 30, 2018 | |||||||
Sustainable Equity Fund | ||||||||
Ordinary income | $46,186 | $40,318 | ||||||
Sustainable Bond Fund | ||||||||
Ordinary income | $787,144 | $722,566 | ||||||
NOTE 5 – Federal Income Taxes
The cost basis of investments for federal income tax purposes on November 30, 2019, was as follows:
| Sustainable Equity | Sustainable Bond | |||||||
Cost of investments | $5,750,956 | $26,038,467 | ||||||
Gross tax unrealized appreciation | $1,958,684 | $433,637 | ||||||
Gross tax unrealized depreciation | $(59,493 | ) | $(476,883 | ) | ||||
Net tax unrealized appreciation (depreciation) | $1,899,191 | $(43,246 | ) | |||||
As of November 30, 2019, components of distributable earnings on a tax basis were as follows:
Sustainable Equity | ||||
Undistributed ordinary income | $35,663 | |||
Tax accumulated earnings | 35,663 | |||
Accumulated capital losses | (262,636 | ) | ||
Unrealized appreciation | 1,899,191 | |||
Other unrealized losses | (293 | ) | ||
Total accumulated earnings | 1,671,925 | |||
Sustainable Bond | ||||
Accumulated capital losses | (459,923 | ) | ||
Unrealized depreciation | (43,246 | ) | ||
Other unrealized losses | (6,151 | ) | ||
Total accumulated earnings | (509,320 | ) | ||
On November 30, 2019, the Funds had capital loss carryforwards as follows, subject to regulation.
| Carryforward | Expiration | |||||||
Sustainable Equity Fund | ||||||||
Short-term loss carryforward | $262,636 | Unlimited | ||||||
| $262,636 | ||||||||
| Carryforward | Expiration | |||||||
Sustainable Bond Fund | ||||||||
Long-term loss carryforward | $459,923 | Unlimited | ||||||
| $459,923 | ||||||||
NOTE 6 – Investments
Investment transactions other than short-term investments for the year ended November 30, 2019, were as follows:
| Purchases | Sales | |||||||
Sustainable Equity | $241,866 | $462,563 | ||||||
Sustainable Bond | $10,578,924 | $17,826,916 | ||||||
NOTE 7 – Custodian
Under agreements in place with the Trust’s custodian, UMB Bank, custody fees are reduced by credits for cash balances. Such reductions for the period ended November 30, 2019, were as follows:
| Custodian Fee Credits | ||||
Sustainable Equity | $746 | |||
Sustainable Bond | $3,353 | |||
NOTE 8 – Subsequent Events
In preparing these financial statements, the Funds have evaluated events and transactions for potential recognition or disclosure through the date the financial statements were issued.
The Funds declared the payment of a distribution to be paid on December 19, 2019, to all shareowners of record on December 18, 2019, as follows:
Dividend Income | Short-Term Capital Gain | Long-Term Capital Gain | ||||||||||
Sustainable Equity | $0.06960 | $- | $0.06960 | |||||||||
Sustainable Bond | $- | $- | $- | |||||||||
There were no other events or transactions during the period that materially impacted the amounts or disclosures in the Funds’ financial statements.
| November 30, 2019 | Annual Report | 27 | ||||
Report of Independent Registered Public Accounting Firm
To the Board of Trustees of
Saturna Investment Trust
and the Shareholders of Saturna Sustainable Funds
Opinion on the Financial Statements
We have audited the accompanying statement of assets and liabilities of Saturna Sustainable Equity Fund and Saturna Sustainable Bond Fund, (the “Funds”), each a series of Saturna Investment Trust, including the schedules of investments, as of November 30, 2019, the related statements of operations for the year then ended, the statements of changes in net assets for each of the two years in the period then ended, the financial highlights for each of the four years in the period then ended and the period March 27, 2015 through November 30, 2015, and the related notes (collectively referred to as the “financial statements”). In our opinion, the financial statements present fairly, in all material respects, the financial position of the Funds as of November 30, 2019, the results of their operations for the year then ended, the changes in their net assets for each of the two years in the period then ended and their financial highlights each of the four years in the period then ended and the period March 27, 2015 through November 30, 2015, in conformity with accounting principles generally accepted in the United States of America.
Basis for Opinion
These financial statements are the responsibility of the Funds’ management. Our responsibility is to express an opinion on the Funds’ financial statements based on our audits. We are a public accounting firm registered with the Public Company Accounting Oversight Board (United States) (“PCAOB”) and are required to be independent with respect to the Funds in accordance with the US federal securities laws and the applicable rules and regulations of the Securities and Exchange Commission and the PCAOB. We have served as the auditor of one or more of the funds in the Trust since 1997.
We conducted our audits in accordance with the standards of the PCAOB. Those standards require that we plan and perform the audits to obtain reasonable assurance about whether the financial statements are free of material misstatement, whether due to error or fraud. The Funds are not required to have, nor were we engaged to perform, an audit of their internal control over financial reporting. As part of our audits we are required to obtain an understanding of internal control over financial reporting, but not for the purpose of expressing an opinion on the effectiveness of the Funds internal control over financial reporting. Accordingly, we express no such opinion.
Our audits included performing procedures to assess the risks of material misstatement of the financial statements, whether due to error or fraud, and performing procedures that respond to those risks. Such procedures included examining, on a test basis, evidence regarding the amounts and disclosures in the financial statements. Our audits also included evaluating the accounting principles used and significant estimates made by management, as well as evaluating the overall presentation of the financial statements. Our procedures included confirmation of securities owned as of November 30, 2019 by correspondence with the custodian. We believe that our audits provide a reasonable basis for our opinion.
Philadelphia, Pennsylvania
January 29, 2020
/s/ Tait, Weller & Baker LLP
Tait, Weller & Baker LLP
| 28 | November 30, 2019 | Annual Report | ||||
| Expenses |
All mutual funds have operating expenses. As a Saturna Sustainable Fund shareowner, you incur ongoing costs, including management fees and other Fund expenses such as shareowner reports (like this one). Operating expenses, which are deducted from a fund’s gross earnings, directly reduce the investment return of a fund. Mutual funds (unlike other financial investments) only report their results after deduction of operating expenses.
With the Saturna Sustainable Funds, unlike many mutual funds, you do not incur sales charges (loads) on purchases, reinvested dividends, or other distributions. You do not incur redemption fees or exchange fees. You may incur fees related to extra services requested by you for your account, such as bank wires. The examples below are intended to help you understand your ongoing costs (in dollars) of investing in the Funds and to compare these costs with the ongoing costs of investing in other mutual funds.
Examples
The following examples are based on an investment of $1,000 invested at the beginning of the period and held for the entire period (June 1, 2019 to November 30, 2019).
Actual Expenses
The first line for each Fund provides information about actual account values and actual expenses. You may use the information in this line, together with the amount you have invested, to estimate the expenses that you paid over the period. Simply divide your account value by $1,000 (for example, an $8,600 account value divided by $1,000 = 8.6), then multiply the result by the number in the first line under the heading entitled “Expenses Paid During Period” to estimate the expenses you paid on your account during this period. The Funds may charge for extra services (such as domestic bank wires, international bank wires, or overnight courier delivery of redemption checks) rendered on request, which you may need to estimate to determine your total expenses.
Hypothetical Example For Comparison Purposes
The second line for each Fund provides information about hypothetical account values and hypothetical expenses based on each Fund’s actual expense ratio (based on the last six months) and an assumed rate of return of 5% per year before expenses, which is not the Fund’s actual return. The hypothetical account values and expenses may not be used to estimate the actual ending account balance or expenses you paid for the period. You may use this information to compare the ongoing costs of investing in the Funds and other mutual funds. To do so, compare this 5% hypothetical example with the 5% hypothetical examples that appear in the shareowner reports of other mutual funds. You may wish to add other fees that are not included in the expenses shown in the table, such as IRA fees charged by custodians other than Saturna Trust Company (note that Saturna does not charge such fees to shareowners directly on Saturna IRAs, ESAs, or HSAs with the Saturna Sustainable Funds), and charges for extra services such as bank wires.
Please note that the expenses shown in the tables are meant to highlight your ongoing costs only and do not reflect any transactional costs, such as sales charges (loads) or exchange fees (note that the Saturna Sustainable Funds do not assess any such transactional costs). Therefore, the “Hypothetical” line of each fund is useful in comparing ongoing costs only, and may not help you determine the relative total costs of owning different funds.
| Beginning Account Value [June 1, 2019] | Ending Account Value [November 30, 2019] | Expenses Paid During Period | Annualized Expense Ratio | |||||||||||||
Sustainable Equity Fund (SEEFX), Actual | $1,000.00 | $1,118.60 | $4.14 | 0.75% | ||||||||||||
Hypothetical (5% return before expenses) | $1,000.00 | $1,021.16 | $3.95 | 0.75% | ||||||||||||
Sustainable Bond Fund (SEBFX), Actual | $1,000.00 | $1,023.10 | $3.31 | 0.65% | ||||||||||||
Hypothetical (5% return before expenses) | $1,000.00 | $1,021.80 | $3.30 | 0.65% | ||||||||||||
Expenses are equal to annualized expense ratios indicated above (based on the most recent fiscal period of June 1, 2019, through November 30, 2019) multiplied by the average account value over the period, multiplied by 183/365 (to reflect theone-half year period).
November 30, 2019 | Annual Report | 29 | ||||
| Trustees and Officers | (unaudited) |
| Name, Address, and Age | Position(s) Held with Trust and Number of Saturna Fund Portfolios Overseen | Principal occupation(s) during past 5 years, including Directorships | Other Directorships held by Trustee | |||||
Independent Trustees | ||||||||
(photo omitted) | Marina E. Adshade(52) 1300 N. State Street Bellingham WA 98225 | Independent Trustee (since 2017); | Professor of Economics, University of British Columbia, Vancouver and Simon Fraser University;
Author | None | ||||
(photo omitted) | Ronald H. Fielding, MA, MBA, CFA (70) 1300 N. State Street Bellingham WA 98225 | Independent Trustee (since 2009); | Director, ICI Mutual Insurance Company | Amana Mutual Funds Trust | ||||
(photo omitted) | Gary A. Goldfogel, MD (61) 1300 N. State Street Bellingham WA 98225 | Chairman (since 2017); Independent Trustee (since 1995); | Medical Examiner (pathologist)
Owner, Avocet Environmental Testing (laboratory) | None | ||||
(photo omitted) | Jim V. McKinney(58) 1300 N. State Street Bellingham WA 98225 | Independent Trustee (since 2017); | Executive Director, Common Threads Northwest; President/CEO, Apple Mountain LLC, consulting and development; US Army Foreign Area Officer—Political/Military Advisor to US Army Central; Senior Defense Official, Defense Attaché, US Embassy Slovenia | None | ||||
(photo omitted) | Sarah E.D. Rothenbuhler (51) 1300 N. State Street Bellingham WA 98225 | Independent Trustee (since 2017); | CEO, Birch Equipment (industrial rentals and sales) | None | ||||
Interested Trustee | ||||||||
(photo omitted) | Jane K. Carten, MBA (44) 1300 N. State Street Bellingham WA 98225 | President, Trustee (since 2017); Nine | President and Director, Saturna Capital Corporation
Vice President and Director, Saturna Trust Company President, Saturna Brokerage Services | None | ||||
| 30 | November 30, 2019 | Annual Report | ||||
| Trustees and Officers(continued) | (unaudited) |
| Name (Age) and Address | Position(s) held with Trust and Number of Saturna Fund Portfolios Overseen | Principal occupation(s) during past 5 years, including Directorships | Other Directorships held by Trustee | |||||
Officers Who Are Not Trustees | ||||||||
(photo omitted) | Phelps S. McIlvaine (66) 1300 N. State Street Bellingham, WA 98225 | Vice President (since 1994); N/A | Vice President, Saturna Capital Corporation
Director, Vice President, and former Treasurer Saturna Brokerage Services | N/A | ||||
(photo omitted) | Christopher R. Fankhauser (47) 1300 N. State Street Bellingham, WA 98225 | Treasurer1(since 2002); N/A | Chief Operations Officer, Saturna Capital Corporation
Vice President and Chief Operations Officer, Saturna Brokerage Services
Director, Vice President, and Chief Operations Officer, Saturna Trust Company | N/A | ||||
(photo omitted) | Michael E. Lewis(58) 1300 N. State Street Bellingham, WA 98225 | Chief Compliance Officer1 (since 2012); N/A | Chief Compliance Officer, Saturna Capital, Saturna Trust Company, and Affiliated Funds | N/A | ||||
(photo omitted) | Jacob A. Stewart(39) 1300 N. State Street Bellingham, WA 98225 | Anti-Money Laundering Officer1(since 2015); N/A | Anti-Money Laundering Officer, Saturna Capital Corporation, Saturna Brokerage Services
Chief Compliance Officer, Saturna Brokerage Services
Bank Secrecy Act Officer, Saturna Trust Company | N/A | ||||
(photo omitted) | Nicole Trudeau(40) 1300 N. State Street Bellingham WA 98225 | Secretary1(since 2018) N/A | Chief Legal Officer, Saturna Capital Corporation
Former: Counsel, Simpson Thacher & Bartlett LLP; Partner, Stradley Ronon Stevens & Young, LLP; | N/A | ||||
Term of Office: each Trustee serves for the lifetime of the Trust or until they die, resign, are removed, or notre-elected by the shareowners. Each officer serves aone-year term subject to annual reappointment by the Trustees.
The Trust’s Statement of Additional Information, available without charge upon request by calling Saturna Capital at1-800-728-8762 and on the Funds’ website, www.saturnasustainable.com, includes additional information about the Trustees.
On November 30, 2019, the trustees, officers, and their affiliates as a group owned 63.51% and 14.04% of the outstanding shares of Sustainable Equity and Sustainable Bond Funds, respectively.
During the year ended November 30, 2019, the Independent Trustees were each paid by the Trust: (1) $2,000 annual retainer plus $1,000 per board meeting attended (in person or by phone), plus reimbursement of travel expenses; (2) $250 for committee meetings; and (3) $250 per quarter for serving as chairman of the board or any committee.
Mrs. Carten is an Interested Trustee by reason of her positions with the Trust’s adviser (Saturna Capital Corporation) and underwriter (Saturna Brokerage Services), and is the primary manager of the Saturna Sustainable Equity Fund portfolio. She is paid by Saturna Capital a salary, plus a bonus for each month the Saturna Sustainable Equity Fund portfolio earns a 4 or 5 star rating from Morningstar (see www.saturna.com). The officers are paid by Saturna Capital and not the Trust. As of November 30, 2019, all Saturna Capital employees listed above as officers owned shares in one or more of the Saturna Investment Trust funds, with Mrs. Carten owning (directly or indirectly) over $1.4 million.
| 1 | Holds the same position with Amana Mutual Funds Trust |
| November 30, 2019 | Annual Report | 31 | ||||
| Renewal of Investment Advisory Contract | (unaudited) |
During their meeting of September 17, 2019, the Trustees of Saturna Investment Trust, including those Trustees who are not “interested persons” (as that term is defined in the Investment Company Act of 1940) of the Trust or Saturna Capital (the “Independent Trustees”), discussed the continuance of the Investment Advisory and Administrative Services Agreement (“Agreement”) between the Trust, on behalf of each Fund, and Saturna Capital. In considering the renewal of the Agreement, the Trustees discussed the nature, extent, and quality of the services provided by Saturna Capital to the Trust and each Fund. The Trustees considered Saturna Capital’s specific responsibilities in all aspects ofday-to-day management of the Funds as well as the qualifications, experience and responsibilities of the Funds’ portfolio managers and other key personnel at Saturna Capital. The Trustees discussed Saturna Capital’s experience, ability, and commitment to quality service through performing internally such functions as shareowner servicing, administration, accounting, marketing, and distribution — all in addition to investment management.
The Trustees took into consideration Saturna Capital’s continued avoidance of significant operational and compliance problems, plus its investments in infrastructure, information management systems, personnel, training, and investor education materials, all designed to provide high quality investor services and meet investor needs. They recognized Saturna Capital’s efforts to recruit and retain qualified and experienced staff and improve the capital base on which Saturna Capital operates, which the Trustees believe is important to the long-term success of the Funds. They considered Saturna Capital’s focus on investors and its efforts to avoid potential conflicts of interest.
The Trustees considered the investment performance of each Fund, recognizing that because the Funds had commenced investment operations on March 27, 2015, the Funds had a relatively short operating history on which to evaluate performance. The Trustees considered each Fund’s average annual total returns relative to its benchmark for theone- and three-year periods ended August 31, 2019, noting that the Sustainable Equity Fund outperformed its benchmark for theone- and three-year periods and the Sustainable Bond Fund outperformed its benchmark for the three-year period. The Trustees considered comparative information published by Morningstar Inc. (“Morningstar”), an independent data service provider that, among other things, ranks mutual fund performance within categories comprised of similarly managed funds. The Trustees considered and discussed each Fund’s performance relative to the Fund’s Morningstar category for theone- and three-year periods ended August 31, 2019, noting that the Sustainable Equity Fund had outperformed its Morningstar category average for theone- and three- year periods ended on August 31, 2019, and the Sustainable Bond Fund had underperformed its Morningstar category average for theone-year period and outperformed the category average for the three-year period. The Trustees also considered each Fund’s Morningstar performance ranking (one through five stars), and the Fund’s performance ranking relative to the Fund’s category selected by Lipper, Inc. for theone- and three-year periods ended as of August 31, 2019. The Trustees also noted the high sustainability ratings assigned to the Funds by Morningstar.
The Trustees noted the generally risk-averse investment style of the Funds and other factors which can affect each Fund’s performance relative to its broader Morningstar category. The Trustees also noted certain differences between each Fund and the peer funds within its Morningstar category, including differences in investment strategies and asset size. The Trustees found that Saturna Capital continued to manage each Fund in a manner that is designed to be risk-averse and attractive to long-term investors. The Trustees discussed and considered the efforts of Saturna Capital to make additional resources available to assist in managing the Funds. The Trustees also considered Saturna Capital’s focus on improving investment performance without incurring materially higher levels of risk.
The Trustees also considered the performance and expenses of each Fund as compared to smaller group of funds with similar assets and investment objectives and strategies. The Trustees considered these comparative performance and expense data, along with the comparative data published by Morningstar and each Fund’s performance relative to its benchmark, to evaluate the Fund’s performance over near-term and long-term time periods.
The Trustees also reviewed the fees and expenses of each Fund, including comparative data on fees and expenses published by Morningstar, and considered the components of the Fund’s operating expenses. The Trustees noted the steps that Saturna Capital has undertaken to maintain competitive levels of Fund operating expenses. They noted the significant sponsorship of the Funds by Saturna Capital evidenced, in part, by certain fees and expenses paid by Saturna Capital out of its own resources. The Trustees recognized Saturna Capital’s efforts help make the Funds more widely available and less expensive than would otherwise be the case without Saturna Capital’s efforts.
The Trustees recognized that each Fund remains relatively small and there have not been opportunities to consider economies of scale. The Trustees noted Saturna Capital’s commitment to continue operating the Funds and the costs undertaken by Saturna Capital.
The Trustees reviewed Saturna Capital’s financial information and discussed the issue of Saturna Capital’s profitability as related to management and administration of the Trust. They discussed the reasonableness of Saturna Capital’s profitability as part of their evaluation of whether each Fund’s advisory fees bear a reasonable relationship to the mix of services provided by Saturna Capital, including the nature, extent, and quality of such services.
| 32 | November 30, 2019 | Annual Report | ||||
| Renewal of Investment Advisory Contract(continued) | (unaudited) |
The Trustees considered and compared the fees charged by Saturna Capital to other types of accounts, includingnon-mutual fund advisory clients. The Trustees noted the differences between the full range of services Saturna Capital provides to the Funds, including investment advisory and administrative services, transfer agency services, and other services, as compared to the investment advisory services provided to the other advisory accounts.
The Trustees considered potential benefits to Saturna Capital’s other business lines from acting as investment adviser to the Funds, but also recognized that Saturna Capital’s other business lines benefit the Funds. The Trustees considered whether there are other potential benefits to Saturna Capital in continuing to manage the Funds and the Trustees found that there were no material benefits other than Saturna Capital’s receipt of advisory fees. The Trustees also noted with respect to the Sustainable Equity Fund that Saturna Brokerage Services voluntarily waives brokerage commissions for executing Fund portfolio transactions, resulting in lower transaction costs.
The Trustees concluded based on their business judgement that the fees paid by each Fund to Saturna Capital were, from an arm’s-length bargaining perspective, reasonable and in the best interest of the Fund and its shareowners in light of the services provided, comparative performance, expense and advisory fee information, costs of services provided, profits to be realized, and benefits derived or to be derived by Saturna Capital from its relationship with the Fund. Following this discussion, the Trustees, including the Independent Trustees, unanimously agreed to renew each Fund’s Agreement with Saturna Capital.
| November 30, 2019 | Annual Report | 33 | ||||
Availability of Portfolio Information
| (1) | The Saturna Sustainable Funds file complete schedules of portfolio holdings with the SEC for the first and third quarters of each fiscal year on FormN-Q. |
| (2) | The Funds’ FormsN-Q are available on the SEC’s website at www. sec.gov and at www.saturnasustainable.com. |
| (3) | The Funds’ FormsN-Q may be reviewed and copied at the SEC’s Public Reference Room in Washington, DC. Information on the operation of the Public Reference Room may be obtained by calling1-800-SEC-0330. |
| (4) | The Funds make a complete schedule of portfolio holdings after the end of each month available to investors at www.saturnasustainable.com. |
Availability of Proxy Voting Information
| (1) | A description of the policies and procedures that the Funds use to determine how to vote proxies relating to portfolio securities is available (a) without charge, upon request, by calling Saturna Capital at1-800-728-8762; (b) on the Funds’ website at www. saturnasustainable.com; and (c) on the SEC’s website at www. sec.gov. |
| (2) | Information regarding how each Fund voted proxies relating to portfolio securities during the most recent12-month period ended June 30 is available (a) without charge, upon request, by calling Saturna Capital at1-800-728-8762; (b) on the Funds’ website at www.saturnasustainable.com; and (c) on the SEC’s website at www.sec.gov. |
| 34 | November 30, 2019 | Annual Report | ||||
Householding Policy
To reduce expenses, we may mail only one copy of the Funds’ prospectus, each annual and semi-annual report, and proxy statements when necessary, to those addresses shared by two or more accounts. If you wish to receive individual and/or more copies of these documents, please call us at1-800-728-8762 or write to us at Saturna Capital/Saturna Sustainable Funds, P.O. Box N, Bellingham, WA 98227. We will begin sending you individual copies 30 days after receiving your request.
If you are currently receiving multiple copies and wish to receive only one copy, please call us at1-800-728-8762 or write to us at Saturna Capital/Saturna Sustainable Funds, P.O. Box N, Bellingham, WA 98227. We will begin sending you a single copy with subsequent report mailings.
Privacy Statement
At Saturna Capital and Saturna Investment Trust, we understand the importance of maintaining the privacy of your financial information. We want to assure you that we protect the confidentiality of any personal information that you share with us. In addition, we do not sell information about our current or former customers.
In the course of our relationship, we gather certain nonpublic information about you, including your name, address, investment choices, and account information. We do not disclose your information to unaffiliated third parties unless it is necessary to process a transaction; service your account; deliver your account statements, shareowner reports and other information; or as required by law. When we disclose information to unaffiliated third parties, we require a contract to restrict the companies’ use of customer information and from sharing or using it for any purposes other than performing the services for which they were required.
We may share information within the Saturna Capital family of companies in the course of informing you about products or services that may address your investing needs.
We maintain our own technology resources to minimize the need for any third party services, and restrict access to information within Saturna. We maintain physical, electronic, and procedural safeguards to guard your personal information. If you have any questions or concerns about the security or privacy of your information, please call us at1-800-728-8762.
| November 30, 2019 | Annual Report | 35 | ||||

| Performance Summary(as of December 31, 2019) | (unaudited) |
Average Annual Returns(before any taxes paid by shareowners) |
| |||||||||||||||||||||||
| 1 Year | 3 Year | 5 Year | 10 Year | 15 Year | Expense Ratio | |||||||||||||||||||
IdahoTax-Exempt Fund | 6.05% | 3.59% | 2.46% | 3.05% | 3.23% | 0.68% | 1 | |||||||||||||||||
S&P Idaho Municipal Bond Index | 7.04% | 4.41% | 3.71% | 4.74% | 4.70% | n/a | ||||||||||||||||||
“Muni Single State Intermediate” Category Average2 | 5.69% | 3.30% | 2.44% | 3.20% | 3.31% | 0.96% | ||||||||||||||||||
Performance data quoted in this report represents past performance, is before any taxes payable by shareowners, and is no guarantee of future results. Current performance may be higher or lower than that stated herein. Performance current to the most recentmonth-end is available by calling toll-free1-800-728-8762 or visiting www.idahotaxexemptfund.com. Average annual total returns are historical and include change in share value as well as reinvestment of dividends and capital gains, if any. The investment return and principal value of an investment will fluctuate so that an investor’s shares, when redeemed, may be worth more or less than their original cost.
Please consider an investment’s objectives, risks, charges, and expenses carefully before investing. To obtain this and other important information about the IdahoTax-Exempt Fund in a prospectus or summary prospectus, ask your financial advisor, visit www.idahotaxexemptfund.com, or call toll free1-800-728-8762. Please read the prospectus or summary prospectus carefully before investing.
A note about risk: See Notes to Financial Statements for a discussion of investment risks. For a more detailed discussion of the risks associated with the Fund, please see the Fund’s prospectus or summary prospectus.
| 1 | By regulation, the expense ratio shown in this table is as stated in the Fund’s most recent prospectus, which is dated March 27, 2019, and incorporates results for the fiscal year ended November 30, 2018. The ratio presented in this table differs from expense ratios shown elsewhere in this report as they represent different fiscal periods. |
| 2 | Source: Morningstar December 31, 2019. Morningstar, Inc. is an independent fund performance monitor. Category returns are determined monthly from total returns by Morningstar, by category as determined by Morningstar. Category average expense ratios are determined by Morningstar from prospectus level data reported by funds in the category. |
On the cover: An elk in the Sawtooth Mountains.
| 2 | November 30, 2019 | Annual Report | ||||

| Fellow Shareowners: | January 14, 2020 |
Idaho thrived in 2019, and the nation noticed. Personal income has grown at a 6% annual rate since 2016 and the state expects this to increase from $80 billion to $90 billion by 2021. Remarkably, state taxpayers are as healthy as the state’s finances.
Population and urban single-family home prices are both rising at some of the fastest rates in the country. While Hewlett Packard may be cutting jobs in Idaho, Amazon is expanding employment. Wheat exports to Taiwan were recently contracted to grow 10% over two years to $576 million.
Idaho State total gross domestic product reached $80.45 billion, a 2.4% increase for the fiscal year. State Reserve Funds grew 10% to $459 million, equaling 8.8% of the General Fund. The Unassigned General Fund balance (for discretionary use) ended the year at $803 million or 3% of the general fund. Idaho’s Combined Net Position (a useful indicator of whether the financial position of the State is improving or deteriorating) grew $550 million or 4.4%. Idaho also improved pension funding slightly (plan fiduciary net position as a % of total pension liabilities) to 82.6%. With so many Idaho bonds directly or indirectly relying on the state’s finances, the IdahoTax-Exempt Fund pays particular attention to these details.
The 2018 individual and corporate income tax rate reductions, and the 2018 Idaho Child Income Tax Credit contributed to an expected decline in general fund revenue of $227 million. Softer national economic conditions also contributed to general fund revenue coming in below budget. The Idaho Legislature increased appropriations for health and welfare, education, and the Governor’s New Technology initiative, leaving the state’s general fund in a slight budget deficit for the period.
In 2019, Idaho initiated a comprehensive review all state regulations. The result was a significant reduction in the number of regulations. Idaho may now be one of the least regulated states in the nation. The governor is considering making this regulation cull an annual event. This unique editing process adds to the appeal of one of the nation’s most economically competitive states. Cutting personal and corporate taxes as well as regulations appears to be a winning formula practically unique to Idaho.
The American Legislative Exchange Council ranked Idaho second best in the nation in its forward-looking Economic Outlook Rank. Conning’s 2019 “State of the States,” municipal credit report analyzes state reserves, fixed costs, debt burdens, tax collections, population growth, and pension liabilities. This year Idaho ranked third best state municipal credit in the nation citing its “strong balance sheet and generally good economic conditions.”
Idaho continues to offer discriminating investors the opportunity to invest in high qualitytax-exempt securities in an exceptionally creditworthy state.
Respectfully,
(photo omitted)
Jane Carten,
President
(photo omitted)
Phelps McIlvaine,
Vice President, Portfolio Manager
| Annual Report | November 30, 2019 | 3 | ||||
Performance Summary | (unaudited) |
Average Annual Returns (as of November 30, 2019) |
| |||||||||||||||
| 1 Year | 5 Year | 10 Year | Expense Ratio1 | |||||||||||||
IdahoTax-Exempt Fund | 7.30% | 2.56% | 3.01% | 0.68% | ||||||||||||
S&P Idaho Municipal Bond Index | 8.03% | 3.78% | 4.77% | n/a | ||||||||||||
Growth of $10,000
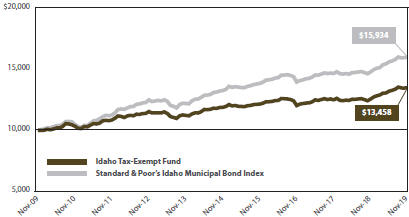 | Comparison of any mutual fund to a market index must be made bearing in mind that the Index is unmanaged and expense-free. Conversely, the fund will (1) be actively managed; (2) have an objective other than mirroring the index, such as limiting risk; (3) bear transaction and other costs; (4) stand ready to buy and sell its securities to shareowners on a daily basis; and (5) provide a wide range of services. The graph compares $10,000 invested in the Fund on November 30, 2009, to an identical amount invested in the Standard & Poor’s Idaho Municipal Bond Index, a broad-based index of Idaho municipal bond prices. The graph shows that an investment in the Fund would have risen to $13,458 versus $15,934 in the S&P Idaho Municipal Bond Index. |
Past performance does not guarantee future results. The “Growth of $10,000” graph and “Average Annual Returns” performance table assume the reinvestment of dividends and capital gains. They do not reflect the deduction of taxes that a shareowner might pay on fund distributions or the redemption of fund shares.
| 1 | By regulation, the expense ratio for the Fund shown in this table is as stated in the Fund’s most recent prospectus, which is dated March 27, 2019, and incorporates results for the fiscal year ended November 30, 2018. The ratio presented in this table differs from expense ratios shown elsewhere in this report as they represent different fiscal periods. |
Fund Objective
IdahoTax-Exempt Fund seeks to provide income free from federal income, federal alternative minimum, and Idaho state income taxes. Preservation of capital is a secondary objective.
Portfolio Diversification | ||||||||||
| % of Total Net Assets |
| |||||||||
| ∎ | General Obligation | 48.9% |
|
|
| |||||
| ∎ | State Education | 19.9% | ||||||||
| ∎ | Real Estate | 11.1% | ||||||||
| ∎ | Financial Services | 5.8% | ||||||||
| ∎ | Pollution Control | 2.5% | ||||||||
| ∎ | Medical - Hospitals | 2.4% | ||||||||
| ∎ | Health Care Facilities | 2.3% | ||||||||
| ∎ | Water Supply | 2.1% | ||||||||
| ∎ | Transportation | 1.6% | ||||||||
| ∎ | Other assets(net of liabilities) | 3.4% | ||||||||
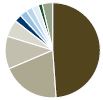
Top 10 Holdings |
| |||
| % of Total Net Assets | ||||
Teton Co, ID SCD #401 Driggs(4.00% due 09/15/2035) | 4.3% | |||
University of Idaho Revenue(5.00% due 04/01/2032) | 3.6% | |||
Canyon Co ID SCD #134 Middleton(4.00% due 09/15/2028) | 3.4% | |||
Idaho Bond Bank(4.00% due 09/15/2032) | 3.3% | |||
Idaho State Building Authority(5.00% due 09/01/2032) | 3.2% | |||
Nez Perce CO ISD #1 Lewiston(5.00% due 09/15/2029) | 3.0% | |||
Idaho Fish Wildlife Foundation Rev(5.00% due 12/01/2033) | 2.9% | |||
Ada & Canyon Cos ID JSD #2 Meridian(5.00% due 08/15/2032) | 2.9% | |||
Boise City Urban Renewal Lease Rev(5.00% due 12/15/2032) | 2.7% | |||
Idaho Housing & Finance Rev(3.00% due 07/01/2036) | 2.5% | |||
| 4 | November 30, 2019 | Annual Report | ||||
Discussion of Fund Performance | (unaudited) |
For the 12 months ended November 30, 2019, IdahoTax- Exempt Fund returned 7.30%, which was higher than the 6.52% average annual return of its Morningstar Muni Single State Intermediate category peer group. For the five years ended November 30, 2019, the Fund provided an annualized total return of 2.56%, compared to the 2.49% annualized return for the Morningstar category peer group.The Fund’s net operating expense ratio was 0.68%. For the year, the Fund’s net assets fell-0.35% to $13.49 million. The Fund’s net asset value per share rose from $5.28 to $5.55. Over theone-year period, the Fund’s outstanding shares declined 5.00% to 2.43 million.
Factors Affecting Past Performance
2019 began with the US Federal Reserve Bank policy at an inflection point. Good US economic growth and low US unemployment justified policy normalization, meaning shrinking the Fed’s balance sheet (quantitative tightening) and moving the Federal Funds rates higher. However, softening global growth, trade tensions, a flat yield curve, a strong US dollar, and faltering financial asset prices required the opposite policy response. By November 2019, US policy makers had reversed rate normalization, setting Federal Funds at 1.50%, below their level in June 2018. Quantitative tightening was halted. The policy dichotomy between US economic strength and global economic weakness was resolved with global concerns and the urgent need for greater US dollar liquidity prevailing.
This rapid policy reversal triggered a “risk on” response in financial markets. The Fed succeeded in steepening the US Treasury yield curve, discounting a flat curve’s recession signal. Reinvigorated investors poured money into financial assets, and especially income producing assets like municipal bonds. Reinvestment risk suddenlyre-emerged at the most urgent of investment objectives. Corporate bond spreads narrowed significantly, returning to previous lows in 1998, 2003, and 2018. High-yield spreads narrowed significantly more than investment grade spreads. US30-yr bond yields established a new low, eclipsing the previous low in 2016.
More recently, the US Federal Reserve expanded short-term liquidity funding to address funding shortfalls in the US repo market. An unusual structural balance of payments deficit caused by record US government deficit spending, restrictive banking regulations, and weak foreign demand for US Treasury paper combined to create the funding deficit.
In echoes of 2008, the European Central Bank, Japan, and Britain also amplified their own monetary easing policies. With interest rates falling and corporate bond spreads narrowing simultaneously, bond markets produced exceptional returns.
Looking Forward
Seven of Conning Municipal Credit Research’s 10 strongest state municipal credits are in the Rocky Mountain region. The economy of the greater Rocky Mountain region looks like it will continue to outperform most of the nation. US economic growth and inflation will likely remain relatively benign while progress on Brexit and the US China trade negotiations may relax some anxieties. New monetary and fiscal stimulus from the US, Britain, Japan, and others will be deployed to fund debt burdens, fiscal deficits as well as boost economic growth and inflation in 2020.
In the last decade, monetary and fiscal stimulus policies initially pushed bond yields higher. However, these reflation policies have a mixed record of producing lasting results. Once these policies run their course, inflation and bond yields may fall again, boosting municipal bond prices. Despite these reflation initiatives, negative nominal and real rates will not disappear. Reinvestment risk will remain the most urgent concern for bond investors over the medium to long term. The yield famine will continue.
With yields only slightly higher than recent lows, credit spreads offering historically little additional compensation, and real yields near zero, it is tempting to discount the appeal of municipal bonds in 2020. But municipal bonds still offer another exceptional quality: diversification. As an asset class, municipal bonds demonstrated excellent negative correlation to common stocks on days when stock prices fell during 2019. Higher yields in the next few quarters represent a buying opportunity. For yield starved investors looking for a relatively calm mooring, Idaho municipal bonds may offer the comfort of low asset class correlation when many asset classes offer persistently high valuations and low potential returns.
For those seeking a conservative investment vehicle, the IdahoTax-Exempt Fund offers a portfolio of high-grade issues intended to provide income exempt from federal income, federal alternative minimum, and Idaho state income taxes. The Fund may purchase carefully vetted, nonrated Idaho bonds.
IdahoTax-Exempt Fund chooses not to invest in US territories such as Puerto Rico, Guam, and the US Virgin Islands to boost income at the expense of creditworthiness. The Fund does not employ derivatives or other financial engineering tools to modify risk and return.
| Bond Quality Diversification | (unaudited) | |||||||||||
| % of Total Net Assets |
| |||||||||||
| ∎ | Rated “AAA” | 35.7% |
|
|
| |||||||
| ∎ | Rated “AA+” | 24.1% | ||||||||||
| ∎ | Rated “AA” | 5.5% | ||||||||||
| ∎ | Rated“AA-” | 15.4% | ||||||||||
| ∎ | Rated “A+” | 9.5% | ||||||||||
| ∎ | Rated “A” | 3.9% | ||||||||||
| ∎ | Not rated | 2.5% | ||||||||||
| ∎ | Other assets(net of liabilities) | 3.4% | ||||||||||
| Credit ratings are the lesser of S&P Global Ratings or Moody’s Investors Service. If neither S&P nor Moody’s rate a particular security, that security is categorized as not rated (except for US Treasury securities and securities issued or backed by US agencies which inherit the credit rating for the US government). Ratings range from AAA (highest) to D (lowest). Bonds rated BBB or above are considered investment grade. Credit ratings BB and below are lower-rated securities (junk bonds). Ratings apply to the creditworthiness of the issuers of the underlying securities and not the Fund or its shares. Ratings may be subject to change. |
| |||||||||||
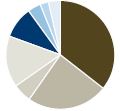
| Annual Report | November 30, 2019 | 5 | ||||
| Schedule of Investments | As of November 30, 2019 | |||||||||||||||||
| Tax-Exempt Municipal Bonds – 96.6% | Coupon / Maturity | Face Amount | Market Value | Percentage of Assets | ||||||||||||||
| Financial Services | ||||||||||||||||||
Idaho Bond Bank | 4.00% due 09/15/2032 | $405,000 | $439,445 | 3.3% | ||||||||||||||
Idaho Housing & Finance Rev | 3.00% due 07/01/2036 | 335,000 | 339,781 | 2.5% | ||||||||||||||
| 779,226 | 5.8% | |||||||||||||||||
| General Obligation | ||||||||||||||||||
Ada & Canyon Cos ID JSD #2 Meridian | 5.00% due 08/15/2032 | 325,000 | 385,200 | 2.9% | ||||||||||||||
Ada & Canyon Cos ID JSD #3 Kuna | 4.00% due 09/15/2027 | 100,000 | 118,479 | 0.8% | ||||||||||||||
Boise City ID Independent SD | 3.00% due 08/01/2038 | 100,000 | 101,793 | 0.8% | ||||||||||||||
Bonneville & Bingham Cos JSD #93 | 5.00% due 09/15/2031 | 200,000 | 220,218 | 1.6% | ||||||||||||||
Bonneville & Bingham Cos JSD #93 | 5.00% due 09/15/2029 | 250,000 | 275,776 | 2.0% | ||||||||||||||
Bonneville Co ID SCD #91 | 4.00% due 09/15/2026 | 15,000 | 16,150 | 0.1% | ||||||||||||||
Bonneville Co ID SCD #91 | 4.00% due 09/15/2026 | 35,000 | 37,632 | 0.3% | ||||||||||||||
Bonneville Co ID SCD #91 | 3.75% due 09/15/2032 | 285,000 | 305,318 | 2.3% | ||||||||||||||
Boundary County ID SCD #101 | 4.00% due 08/15/2021 | 240,000 | 241,462 | 1.8% | ||||||||||||||
Canyon Co ID SCD #134 Middleton | 4.00% due 09/15/2028 | 400,000 | 454,840 | 3.4% | ||||||||||||||
Canyon Co ID SCD #135 Notus | 3.25% due 09/15/2031 | 290,000 | 311,518 | 2.3% | ||||||||||||||
Canyon Co ID SCD #135 Notus | 3.25% due 09/15/2032 | 170,000 | 182,208 | 1.4% | ||||||||||||||
Canyon Co ID SCD #139 Vallivue | 5.00% due 09/15/2024 | 260,000 | 286,959 | 2.1% | ||||||||||||||
Cariboo Franklin Bannock JSD #148 | 3.25% due 09/15/2035 | 300,000 | 324,858 | 2.4% | ||||||||||||||
Cassia Oneida Twin Falls JSD #151 | 3.375% due 09/15/2034 | 160,000 | 167,866 | �� | 1.2% | |||||||||||||
Kootenai Co ID SCD # 271 UNREF | 4.00% due 09/15/2025 | 125,000 | 134,370 | 1.0% | ||||||||||||||
Kootenai Co ID SCD #271 PREREF | 4.00% due 09/15/2025 | 40,000 | 43,011 | 0.3% | ||||||||||||||
Kootenai Co ID SCD #273 | 4.00% due 08/15/2031 | 265,000 | 296,805 | 2.2% | ||||||||||||||
Kootenai-Shoshone ID Area Libraries | 4.25% due 08/01/2021 | 220,000 | 221,120 | 1.6% | ||||||||||||||
Latah Co ID SCD #281 Moscow Ser B | 4.00% due 08/15/2027 | 100,000 | 109,163 | 0.8% | ||||||||||||||
Latah Co ID SCD #281 Moscow Ser B | 4.00% due 08/15/2028 | 200,000 | 217,572 | 1.6% | ||||||||||||||
Madison Co. Id. SDC #321 | 5.00% due 09/15/2035 | 250,000 | 307,432 | 2.3% | ||||||||||||||
Owyhee & Canyon Co. # 363 Marsing | 4.00% due 09/15/2035 | 150,000 | 169,551 | 1.3% | ||||||||||||||
Teton Co, ID SCD #401 Driggs | 4.00% due 09/15/2035 | 500,000 | 575,125 | 4.3% | ||||||||||||||
Twin Falls Co ID SCD #411 | 4.00% due 09/15/2027 | 170,000 | 190,147 | 1.4% | ||||||||||||||
Twin Falls Co ID SCD #411 | 4.25% due 09/15/2030 | 300,000 | 335,205 | 2.5% | ||||||||||||||
Twin Falls Co ID SCD #411 | 4.75% due 09/15/2039 | 200,000 | 232,804 | 1.7% | ||||||||||||||
Twin Falls Co ID SCD #411 Series A | 4.25% due 09/15/2031 | 100,000 | 111,522 | 0.8% | ||||||||||||||
Valley & Adams Cos ID JSD #421 | 3.00% due 08/01/2026 | 220,000 | 229,548 | 1.7% | ||||||||||||||
| 6,603,652 | 48.9% | |||||||||||||||||
| Health Care Facilities | ||||||||||||||||||
Idaho Health Faci Auth Hos Rev | 5.00% due 12/01/2047 | 260,000 | 307,663 | 2.3% | ||||||||||||||
| 307,663 | 2.3% | |||||||||||||||||
| Medical/Hospitals | ||||||||||||||||||
Idaho Health Rev Trinity Health Grp | 3.25% due 12/01/2028 | 300,000 | 320,085 | 2.4% | ||||||||||||||
| 320,085 | 2.4% | |||||||||||||||||
| Pollution Control | ||||||||||||||||||
Idaho Bond Bank | 4.00% due 09/15/2033 | 135,000 | 154,933 | 1.1% | ||||||||||||||
Idaho Bond Bank Authority | 4.30% due 09/01/2022 | 20,000 | 20,048 | 0.1% | ||||||||||||||
Idaho Bond Bank Authority | 4.00% due 09/15/2032 | 130,000 | 149,524 | 1.1% | ||||||||||||||
Idaho Bond Bank Authority | 4.125% due 09/15/2023 | 20,000 | 20,045 | 0.2% | ||||||||||||||
| 344,550 | 2.5% | |||||||||||||||||
Continued on next page.
| 6 | November 30, 2019 | Annual Report | The accompanying notes are an integral part of these financial statements. | |||||
| Schedule of Investments | As of November 30, 2019 | |||||||||||||||||
| Tax-Exempt Municipal Bonds – 96.6% | Coupon / Maturity | Face Amount | Market Value | Percentage of Assets | ||||||||||||||
| Real Estate | ||||||||||||||||||
Boise City Urban Renewal Lease Rev | 5.00% due 12/15/2032 | 300,000 | 355,929 | 2.7% | ||||||||||||||
Idaho Fish Wildlife Foundation Rev | 5.00% due 12/01/2033 | 320,000 | 397,815 | 2.9% | ||||||||||||||
Idaho State Building Authority | 5.00% due 09/01/2031 | 200,000 | 218,412 | 1.6% | ||||||||||||||
Idaho State Building Authority | 5.00% due 09/01/2032 | 400,000 | 436,484 | 3.2% | ||||||||||||||
Post Falls ID LID SPA | 5.00% due 05/01/2021 | 90,000 | 90,438 | 0.7% | ||||||||||||||
| 1,499,078 | 11.1% | |||||||||||||||||
| State Education | ||||||||||||||||||
Boise State University ID Revenue | 5.00% due 04/01/2028 | 125,000 | 146,531 | 1.1% | ||||||||||||||
Boise State University ID Revenue | 5.00% due 04/01/2032 | 160,000 | 189,946 | 1.4% | ||||||||||||||
Idaho State University | 4.00% due 04/01/2027 | 170,000 | 194,698 | 1.5% | ||||||||||||||
Idaho State University | 4.00% due 04/01/2030 | 245,000 | 275,338 | 2.1% | ||||||||||||||
Idaho State University Revenue | 3.00% due 04/01/2031 | 250,000 | 262,618 | 2.0% | ||||||||||||||
Idaho State University Revenue | 3.00% due 04/01/2032 | 160,000 | 167,410 | 1.2% | ||||||||||||||
Nez Perce CO ISD #1 Lewiston | 5.00% due 09/15/2029 | 330,000 | 408,012 | 3.0% | ||||||||||||||
North Idaho College Dormitory Rev | 4.00% due 11/01/2030 | 285,000 | 316,381 | 2.3% | ||||||||||||||
University of Idaho Revenue | 5.00% due 04/01/2028 | 225,000 | 227,702 | 1.7% | ||||||||||||||
University of Idaho Revenue | 5.00% due 04/01/2032 | 455,000 | 490,708 | 3.6% | ||||||||||||||
| 2,679,344 | 19.9% | |||||||||||||||||
| Transportation | ||||||||||||||||||
Boise ID Airport Park Fac Rev | 3.00% due 09/01/2028 | 210,000 | 214,299 | 1.6% | ||||||||||||||
| 214,299 | 1.6% | |||||||||||||||||
| Water Supply | ||||||||||||||||||
Payette Lakes Rec Wtr & Swr Rev | 4.00% due 08/01/2034 | $255,000 | 284,720 | 2.1% | ||||||||||||||
| 284,720 | 2.1% | |||||||||||||||||
| Total investments | (Cost $12,418,803) | 13,032,617 | 96.6% | |||||||||||||||
| Other assets (net of liabilities) | 454,108 | 3.4% | ||||||||||||||||
| Total net assets | $13,486,725 | 100.0% | ||||||||||||||||
| The accompanying notes are an integral part of these financial statements. | Annual Report | November 30, 2019 | 7 | |||||
Statement of Assets and Liabilities
| As of November 30, 2019 |
| |||
Assets | ||||
Investments in securities, at value (Cost $12,418,803) | $13,032,617 | |||
Cash | 340,897 | |||
Interest receivable | 127,427 | |||
Other assets | 4,464 | |||
Receivable for Fund shares sold | 250 | |||
Total assets | 13,505,655 | |||
Liabilities | ||||
Accrued advisory fees | 5,514 | |||
Accrued audit expenses | 4,174 | |||
Distributions payable | 3,442 | |||
Payable for Fund shares redeemed | 2,991 | |||
Accrued insurance expenses | 912 | |||
Accrued registration/filling fees | 687 | |||
Accrued Chief Compliance Officer expenses | 583 | |||
Accrued other operating expenses | 314 | |||
Accrued trustee expenses | 222 | |||
Accrued retirement plan custody fee | 91 | |||
Total liabilities | 18,930 | |||
Net assets | $13,486,725 | |||
Analysis of net assets | ||||
Paid-in capital (unlimited shares authorized, without par value) | $12,960,960 | |||
Total distributable earnings | 525,765 | |||
Net assets applicable to Fund shares outstanding | $13,486,725 | |||
Fund shares outstanding | 2,431,502 | |||
Net asset value, offering and redemption price per share | $5.55 | |||
Statement of Operations
| Year ended November 30, 2019 |
| |||
Investment income | ||||
Interest income | $369,367 | |||
Total investment income | 369,367 | |||
Expenses | ||||
Investment advisory fees | 67,172 | |||
Audit fees | 6,621 | |||
Chief Compliance Officer expenses | 3,902 | |||
Trustee fees | 3,163 | |||
Filing and registration fees | 3,125 | |||
Legal fees | 3,087 | |||
Transfer agent fees | 1,890 | |||
Other expenses | 1,859 | |||
Printing and postage expenses | 995 | |||
Custodian fees | 544 | |||
Retirement plan custodial fees | 99 | |||
Total gross expenses | 92,457 | |||
Less transfer agent fees waived | (1,890 | ) | ||
Less custodian fee credits | (510 | ) | ||
Net expenses | 90,057 | |||
Net investment income | $279,310 | |||
Net realized gain from investments | $15,726 | |||
Net increase in unrealized appreciation on investments | 641,062 | |||
Net gain on investments | $656,788 | |||
Net increase in net assets resulting from operations | $936,098 | |||
| 8 | November 30, 2019 | Annual Report | The accompanying notes are an integral part of these financial statements. | |||||
Statement of Changes of Net Assets | Year ended November 30, 2019 | Year ended November 30, 2018 | ||||||
Decrease in net assets from operations | ||||||||
From operations | ||||||||
Net investment income | $279,310 | $361,335 | ||||||
Net realized gain (loss) on investment | 15,726 | (44,849 | ) | |||||
Net increase (decrease) in unrealized appreciation | 641,062 | (232,107 | ) | |||||
Net increase in net assets | 936,098 | 84,379 | ||||||
Distributions to shareholders | (278,541 | ) | (361,335 | ) | ||||
Capital share transactions | ||||||||
Proceeds from sales of shares | 1,163,543 | 3,147,317 | ||||||
Value of shares issued in reinvestment of dividends | 224,410 | 300,919 | ||||||
Cost of shares redeemed | (2,113,103 | ) | (7,091,173 | ) | ||||
Total capital share transactions | (725,150 | ) | (3,642,937 | ) | ||||
Total decrease in net assets | (67,593 | ) | (3,919,893 | ) | ||||
Net assets | ||||||||
Beginning of year | 13,554,318 | 17,474,211 | ||||||
End of year | $13,486,725 | $13,554,318 | ||||||
Shares of the Fund sold and redeemed | ||||||||
Number of shares sold | 212,460 | 591,416 | ||||||
Number of shares issued in reinvestment of dividends | 40,958 | 56,625 | ||||||
Number of shares redeemed | (386,786 | ) | (1,337,291 | ) | ||||
Net decrease in number of shares outstanding | (133,368 | ) | (689,250 | ) | ||||
Financial Highlights | For the year ended November 30, | |||||||||||||||||||
Selected data per share of outstanding capital stock throughout each year: | 2019 | 2018 | 2017 | 2016 | 2015 | |||||||||||||||
Net asset value at beginning of year | $5.28 | $5.37 | $5.29 | $5.48 | $5.51 | |||||||||||||||
Income from investment operations | ||||||||||||||||||||
Net investment income | 0.11 | 0.12 | 0.13 | 0.14 | 0.15 | |||||||||||||||
Net gains (losses) on securities (both realized and unrealized) | 0.27 | (0.09 | ) | 0.08 | (0.19 | ) | (0.03 | ) | ||||||||||||
Total from investment operations | 0.38 | 0.03 | 0.21 | (0.05 | ) | 0.12 | ||||||||||||||
Less distributions | ||||||||||||||||||||
Dividends (from net investment income) | (0.11 | ) | (0.12 | ) | (0.13 | ) | (0.14 | ) | (0.15 | ) | ||||||||||
Distributions (from capital gains) | - | - | - | 0.00 | A | 0.00 | A | |||||||||||||
Total distributions | (0.11 | ) | (0.12 | ) | (0.13 | ) | (0.14 | ) | (0.15 | ) | ||||||||||
Net asset value at end of year | $5.55 | $5.28 | $5.37 | $5.29 | $5.48 | |||||||||||||||
Total return | 7.30% | 0.51% | 3.90% | (0.95 | )% | 2.21% | ||||||||||||||
Ratios / supplemental data | ||||||||||||||||||||
Net assets ($000), end of year | $13,487 | $13,554 | $17,474 | $17,997 | $17,420 | |||||||||||||||
Ratio of expenses to average net assets | ||||||||||||||||||||
Before transfer agent fee waiver and custodian fee credits | 0.69% | 0.68% | 0.67% | 0.67% | 0.67% | |||||||||||||||
After transfer agent fee waiver | 0.67% | 0.67% | 0.66% | 0.66% | 0.66% | |||||||||||||||
After transfer agent fee waiver and custodian fee credits | 0.67% | 0.67% | 0.65% | 0.65% | 0.66% | |||||||||||||||
Ratio of net investment income after fee waiver and custodian credits to average net assets | 2.07% | 2.20% | 2.33% | 2.54% | 2.66% | |||||||||||||||
Portfolio turnover rate | 4% | 13% | 20% | 15% | 7% | |||||||||||||||
| A | Amount is less than $0.01 |
| The accompanying notes are an integral part of these financial statements. | Annual Report | November 30, 2019 | 9 | |||||
Notes to Financial Statements
Note 1 – Organization
Saturna Investment Trust (the “Trust”) was established under Washington State Law as a business trust on February 20, 1987. The Trust is registered as anopen-end, diversified management company under the Investment Company Act of 1940, as amended. In addition to IdahoTax-Exempt Fund (the “Fund”), eight portfolios have been created to date: Sextant Short-Term Bond Fund, Sextant Bond Income Fund, Sextant Core Fund, Sextant Global High Income Fund, Sextant Growth Fund, Sextant International Fund, Saturna Sustainable Equity Fund, and Saturna Sustainable Bond Fund (each, a “Fund”, and collectively, the “Funds”). The other eight portfolios are distributed through separate prospectuses and the results of those Funds are contained in separate reports.
The IdahoTax-Exempt Fund was first authorized to sell shares of beneficial interest on September 4, 1987.
The Fund is an investment company and accordingly follows the investment accounting and reporting guidance of the Financial Accounting Standards Board (FASB) Accounting Standard Codification Topic 946 “Financial Services – Investment Companies.”
Investment risks:
The value of Fund shares rises and falls as the value of the bonds in which the Fund invests goes up and down. The risks inherent in the Fund depend primarily on the terms and quality of the obligations in the Fund’s portfolio, as well as on market conditions. When interest rates rise, bond prices fall. When interest rates fall, bond prices go up. Bonds with longer maturities, such as those held by the Fund, usually are more sensitive to interest rate changes than bonds with shorter maturities. Only consider investing in the Fund if you are willing to accept the risk that you may lose money.
The Fund entails credit risk, which is the possibility that a bond will not be able to pay interest or principal when due. If the credit quality of a bond is perceived to decline, investors will demand a higher yield, which means a lower price on that bond to compensate for the higher level of risk. If a security held by the Fund defaults on payment of interest or principal, the Fund’s income, ability to preserve capital, and liquidity would all be adversely affected.
Fund investments are susceptible to factors adversely affecting Idaho, such as political, economic, and financial trends unique to this relatively small state. Investing only in Idaho bonds means that the Fund’s investments are more concentrated than other mutual funds, and relatively few bond price changes may lead to underperformance compared to investments selected in greater number and/or from a wider universe.
The Fund is vulnerable to income tax rate changes, either at the Idaho or federal level, since part of municipal securities’ value is derived from the recipient’s ability to exclude interest payments from taxation.
Note 2 – Significant Accounting Policies
The following is a summary of the significant accounting policies, in conformity with accounting principles generally accepted in the United States of America, which are consistently followed by the Fund in the preparation of its financial statements.
Security valuation:
Debt securities are valued usingbid-side valuations provided by an independent service. The service determines valuations using factors such as yields or prices of bonds of comparable quality, type of issue, coupon maturity, ratings, trading activity, and general market conditions. In the absence of a valuation from an independent service for a security, a fair value for such security is determined in good faith by or under the direction of the Board of Trustees.
Security transactions are recorded on trade date. Realized gains and losses on sales of securities are recorded on the identified cost basis.
Share valuation:
The net asset value (“NAV”) per share of the Fund is calculated by dividing the sum of the value of the securities held by the Fund, plus cash and other assets, minus all liabilities (including estimated accrued expenses) by the total number of shares outstanding for the Fund, rounded to the nearest cent. The Fund’s shares are not priced or traded on days the New York Stock Exchange is closed. The NAV is the offering and redemption price per share.
The Trustees have adopted certain policies and procedures with respect to frequent trading of Fund shares. The Fund is intended for long-term investment and does not permit rapid trading of its shares. The Fund cannot always identify all intermediaries, or detect or prevent trading that violates the Frequent Trading Policy through intermediaries or omnibus accounts.
Fair value measurements:
Accounting Standards Codification (ASC) 820 establishes a three-tier framework for measuring fair value based on a hierarchy of inputs. The hierarchy distinguishes between market data obtained from independent sources (observable inputs) and the Fund’s own market assumptions (unobservable inputs). These inputs are used in determining the value of the Fund’s investments and are summarized below.
| Level 1 — | Unadjusted quoted prices in active markets for identical assets or liabilities that the Trust has the ability to access. |
| Level 2 — | Observable inputs other than quoted prices in Level 1 that are observable for the asset or liability, either directly or indirectly. These inputs may include quoted prices for the identical instrument on an inactive market, prices for similar instruments, interest rates, prepayment speeds, credit risk, yield curves, default rates, and similar data. |
| Level 3 — | Unobservable inputs for the asset or liability, to the extent relevant observable inputs are not available, representing the Trust’s own assumptions about the assumptions a market participant would use in valuing the asset or liability, and would be based on the best information available. |
| 10 | November 30, 2019 | Annual Report | ||||
Notes to Financial Statements(continued)
The following table is a summary of the inputs used as of November 30, 2019, in valuing the Fund’s investments carried at value.
| Fair Value Inputs | Level 1 Quoted Price | Level 2 Significant Observable Input | Level 3 Significant Unobservable Input | Total | ||||||||||||
Municipal Bonds1 | $- | $13,032,617 | $- | $13,032,617 | ||||||||||||
Total Assets | $- | $13,032,617 | $- | $13,032,617 | ||||||||||||
| ¹ | See Schedule of Investments for industry breakout. |
During the period ended November 30, 2019, the Fund had no transfers among Levels 1, 2, or 3.
The availability of observable inputs can vary from security to security and is affected by a wide variety of factors, including, for example, the type of security, whether the security is new and not yet established in the marketplace, the liquidity of markets, and other characteristics particular to the security. To the extent that valuation is based on models or inputs that are less observable or unobservable in the market, the determination of fair value requires more judgment. Accordingly, the degree of judgment exercised in determining fair value is greatest for instruments categorized in Level 3.
The inputs used to measure fair value may fall into different levels of the fair value hierarchy. In such cases, for disclosure purposes, the level in the fair value hierarchy within which the fair value measurement falls in its entirety, is determined based on the lowest level input that is significant to the fair value measurement in its entirety.
The inputs or methodology used for valuing securities are not necessarily an indication of the risks associated with investing in those securities.
Income taxes:
The Fund intends to comply with the requirements of the Internal Revenue Code necessary to qualify as a regulated investment company and to make the requisite distributions of income and capital gains to its shareowners sufficient to relieve it from all or substantially all federal income taxes. As the Fund intends to meet requirements fortax-exempt income dividends, and the requirements of the Idaho Department of Revenue for income dividends exempt from Idaho state income tax, no income tax provisions are required.
The Fund recognizes the tax benefits of uncertain tax positions only where the position is “more likely than not” to be sustained assuming examination by tax authorities. Management has analyzed the Fund’s tax positions and has concluded that no liability for unrecognized tax benefits should be recorded related to uncertain tax positions taken on returns filed for open tax years (2016 – 2018), or expected to be taken in the Fund’s 2019 tax return. The Fund identifies its major tax jurisdiction as US federal and foreign jurisdictions where the Fund makes significant investments; however, the Fund is not aware of any tax positions for which it is reasonably possible that the total amounts of unrecognized tax benefits will change materially in the next 12 months.
Reclassification of capital accounts:
Accounting principles generally accepted in the United States of America require that certain components of net assets relating to permanent differences be reclassified between financial and tax reporting.
As of November 30, 2019, there were no reclassifications to the capital accounts.
Distributions to shareowners:
The Fund’s dividends to shareowners from net investment income are paid daily and distributed on the last business day of each month.
Distributions of capital gains, if any, are made at least annually and as required to comply with federal excise tax requirements. Distributions to shareowners are determined in accordance with income tax regulations and are recorded on theex-dividend date. Dividends are paid in shares of the Fund, at the net asset value on the payable date. Shareowners may elect to take distributions in cash if they total $10 or more.
Use of estimates:
The preparation of financial statements in conformity with accounting principles generally accepted in the United States of America requires management to make estimates and assumptions that affect the reported amounts of assets and liabilities and disclosure of contingent assets and liabilities at the date of the financial statements and the reported amounts of increases and decreases in net assets from operations during the reporting period. Actual results could differ from those estimates.
Other:
Interest income is recognized on an accrual basis. Premiums on securities purchased are amortized and discounts are accreted over the lives of the respective securities.
Recent accounting pronouncements:
In August 2018, FASB issuedAccounting Standards Update No. 2018-13, “Fair Value Measurement (Topic 820: Disclosure Framework — Changes to the Disclosure Requirements for Fair Value Measurement” (“ASU2018-13”). ASU2018-13 eliminates the requirement to disclose the amount of and reasons for transfers between Level 1 and Level 2 of the fair value hierarchy, the timing of transfers between levels of the fair value hierarchy and the valuation processes for Level 3 fair value measurements. ASU2018-13 will require the need to disclose the range and weighted average used to develop significant unobservable inputs for Level 3 fair value measurements and the changes in unrealized gains and losses for recurring Level 3 fair value measurements. ASU2018-13 will also require that information is provided about the measurement uncertainty of Level 3 fair value measurements as of the reporting date. The guidance is effective for fiscal years, and interim periods within those fiscal years, beginning after December 15, 2019, and allows for early adoption of either the entire standard or only the provisions that eliminate or modify the requirements. Management has elected to adopt early the provisions that eliminate the disclosure requirements. Management is still currently evaluating the impact of applying the rest of the guidance.
| Annual Report | November 30, 2019 | 11 | ||||
Notes to Financial Statements(continued)
Note 3 – Transactions with Affiliated Persons
Under a contract approved by shareowners on September 28, 1995 and reviewed annually by the Board of Trustees, Saturna Capital Corporation provides investment advisory services and certain other administrative and distribution services to conduct the Fund’s business. For such services, the Fund pays an annual fee equal to 0.50% of its average daily net assets. For the fiscal period ended November 30, 2019, the Fund incurred advisory fee expenses of $67,172. Expenses incurred by the Trust on behalf of the Fund (e.g., legal fees) are allocated to the Fund and the other Funds of the Trust on the basis of relative daily average net assets.
Saturna Capital also acts as transfer agent for the Fund, for which it did not receive any compensation during the fiscal period ended November 30, 2019. Saturna Capital has voluntarily elected to waive the transfer agent fee through November 30, 2019, to reduce the Fund’s operating expenses. Such fees, had they been charged, would have totaled $1,890.
Saturna Brokerage Services, Inc. (“SBS”), a discount brokerage and subsidiary of Saturna Capital, is registered as a broker-dealer and acts as distributor for the Fund.
Saturna Trust Company (“STC”), a subsidiary of Saturna Capital, acts as a retirement plan custodian for Fund shareowners. For the fiscal period ended November 30, 2019, the Fund incurred retirement plan custodial fees of $99.
Mrs. Jane Carten serves as a trustee and president of the Trust. She is also a director and the president of Saturna Capital and Saturna Trust Company. She is not compensated by the Trust. For the fiscal year ended November 30, 2019, the Trust paid trustee compensation expenses of $31,500 which is included in the $44,545 of total expenses paid for the independent Trustees. The Fund’s allocation of these expenses was $3,163.
The officers of the Trust are paid by Saturna Capital, not the Trust, except the Chief Compliance Officer, who is partially compensated by the Trust. For the period ended November 30, 2019, the Fund’s allocation of these expenses was $3,902.
On November 30, 2019, the trustees, officers, and their immediate families as a group directly or indirectly owned 17.98% of the outstanding shares of the Fund.
Note 4 – Distributions to Shareowners
The tax characteristics of distributions paid during the fiscal periods ended November 30, 2019, and November 30, 2018, were as follows:
| November 30, 2019 | November 30, 2018 | |||||||
Tax-exempt income | $277,251 | $360,134 | ||||||
Taxable income | $1,290 | $1,201 | ||||||
Note 5 – Federal Income Taxes
The cost basis of investments for federal income tax purposes at November 30, 2019 was as follows:
Cost of investments | $12,418,803 | |||
Gross unrealized appreciation | $615,218 | |||
Gross unrealized depreciation | $(1,404 | ) | ||
Net unrealized appreciation | $613,814 | |||
As of November 30, 2019, the components of distributable earnings on a tax basis were as follows:
Undistributed tax exempt income | $3,820 | |||
Tax-exempt accumulated earnings | $3,820 | |||
Accumulated capital loss | $(91,869 | ) | ||
Unrealized appreciation | $613,814 | |||
Total accumulated earnings | $525,765 | |||
As of November 30, 2019, the Fund had capital loss carryforwards as follows, subject to regulation.
| Carryforward | Expiration | |||||||
Short-term loss carryforward | $(55,441 | ) | Unlimited | |||||
Long-term loss carryforward | $(36,428 | ) | Unlimited | |||||
| $(91,869 | ) | |||||||
Note 6 – Investments
During the period ended November 30, 2019, the Fund purchased $570,167 of securities and sold/matured $1,112,441 of securities.
Note 7 – Custodian
Under the agreement in place with UMB Bank custody fees are reduced by credits for cash balances. Such reduction for the period ended November 30, 2019, amounted to $510.
Note 8 – Subsequent Events
In preparing these financial statements, the Funds have evaluated events and transactions for potential recognition or disclosure through the date the financial statements were issued.
There were no other events or transactions during the period that materially impacted the amounts or disclosures in the Funds’ financial statements.
| 12 | November 30, 2019 | Annual Report | ||||
Report of Independent Registered Public Accounting Firm
To the Board of Trustees of
Saturna Investment Trust
and the Shareholders of IdahoTax-Exempt Fund,
Opinion on the Financial Statements
We have audited the accompanying statement of assets and liabilities of IdahoTax-Exempt Fund, (the “Fund”), a series of Saturna Investment Trust, including the schedule of investments, as of November 30, 2019, the related statement of operations for the year then ended, the statements of changes in net assets for each of the two years in the period then ended, the financial highlights for each of the five years in the period then ended, and the related notes (collectively referred to as the “financial statements”). In our opinion, the financial statements present fairly, in all material respects, the financial position of the Fund as of November 30, 2019, the results of its operations for the year then ended, the changes in its net assets for each of the two years in the period then ended and its financial highlights each of the five years in the period then ended, in conformity with accounting principles generally accepted in the United States of America.
Basis for Opinion
These financial statements are the responsibility of the Fund’s management. Our responsibility is to express an opinion on the Fund’s financial statements based on our audits. We are a public accounting firm registered with the Public Company Accounting Oversight Board (United States) (“PCAOB”) and are required to be independent with respect to the Fund in accordance with the US federal securities laws and the applicable rules and regulations of the Securities and Exchange Commission and the PCAOB. We have served as the auditor of one or more of the funds in the Trust since 1997.
We conducted our audits in accordance with the standards of the PCAOB. Those standards require that we plan and perform the audits to obtain reasonable assurance about whether the financial statements are free of material misstatement, whether due to error or fraud. The Fund is not required to have, nor were we engaged to perform, an audit of its internal control over financial reporting. As part of our audits we are required to obtain an understanding of internal control over financial reporting, but not for the purpose of expressing an opinion on the effectiveness of the Fund’s internal control over financial reporting. Accordingly, we express no such opinion.
Our audits included performing procedures to assess the risks of material misstatement of the financial statements, whether due to error or fraud, and performing procedures that respond to those risks. Such procedures included examining, on a test basis, evidence regarding the amounts and disclosures in the financial statements. Our audits also included evaluating the accounting principles used and significant estimates made by management, as well as evaluating the overall presentation of the financial statements. Our procedures included confirmation of securities owned as of November 30, 2019 by correspondence with the custodian. We believe that our audits provide a reasonable basis for our opinion.
Philadelphia, Pennsylvania
January 29, 2020
/s/ Tait, Weller & Baker LLP
Tait, Weller & Baker LLP
| Annual Report | November 30, 2019 | 13 | ||||
| Expenses | (unaudited) |
All mutual funds have operating expenses. As an IdahoTax-Exempt Fund shareowner, you incur ongoing costs, including management fees and other fund expenses such as shareowner reports (like this one). Operating expenses, which are deducted from a fund’s gross earnings, directly reduce the investment return of a fund. Mutual funds (unlike other financial investments) only report their results after deduction of operating expenses.
With the IdahoTax-Exempt Fund, unlike many mutual funds, you do not incur sales charges (loads) on purchases, reinvested dividends, or other distributions. You do not incur redemption fees or exchange fees. You may incur fees related to extra services requested by you for your account, such as bank wires. The examples below are intended to help you understand your ongoing costs (in dollars) of investing in the Fund and to compare these costs with the ongoing costs of investing in other mutual funds.
Example
The following example is based on an investment of $1,000 invested at the beginning of the period and held for the entire period (June 1, 2019, to November 30, 2019).
Actual Expenses
The first line provides information about actual account values and actual expenses. You may use the information in this line, together with the amount you have invested, to estimate the expenses that you paid over the period. Simply divide your account value by $1,000 (for example, an $8,600 account value divided by $1,000 = 8.6), then multiply the result by the number in the first line under the heading entitled “Expenses Paid During Period” to estimate the expenses you paid on your account during this period. The Fund may charge for extra services (such as domestic bank wires, international bank wires, or overnight courier delivery of redemption checks) rendered on request, which you may need to estimate to determine your total expenses.
Hypothetical Example for Comparison Purposes
The second line provides information about hypothetical account values and hypothetical expenses based on the Fund’s actual expense ratio (based on the last six months) and an assumed rate of return of 5% per year before expenses, which is not the Fund’s actual return. The hypothetical account values and expenses may not be used to estimate the actual ending account balance or expenses you paid for the period. You may use this information to compare the ongoing costs of investing in the Fund and other mutual funds. To do so, compare this 5% hypothetical example with the 5% hypothetical examples that appear in the shareowner reports of other mutual funds. You may wish to add other fees that are not included in the expenses shown in the table, such as charges for extra services like bank wires.
Please note that the expenses shown are meant to highlight your ongoing costs only and do not reflect any transactional costs, such as sales charges (loads), redemption fees, or exchange fees (note that the IdahoTax-Exempt Fund does not charge any such transactional costs). Therefore, the “Hypothetical” line is useful in comparing ongoing costs only, and may not help you determine the relative total costs of owning different funds.
| Beginning Account Value [June 1, 2019] | Ending Account Value [November 30, 2019] | Expenses Paid During Period1 | Annualized Expense Ratio | |||||||||||||
Actual | $1,000.00 | $1,021.10 | $3.51 | 0.69% | ||||||||||||
Hypothetical (5% return before expenses) | $1,000.00 | $1,021.59 | $3.51 | 0.69% | ||||||||||||
| 1 | Expenses are equal to IdahoTax-Exempt Bond Fund’s annualized expense ratio of 0.69% (based on the most recent semi-annual period of June 1, 2019 through November 30, 2019) multiplied by the average account value over the period multiplied by 183/365 (to reflect theone-half year period). |
| 14 | November 30, 2019 | Annual Report | ||||
| Trustees and Officers | (unaudited) |
| Name, Address, and Age | Position(s) Held with Trust and Number of Saturna Fund Portfolios Overseen | Principal occupation(s) during past 5 years, including Directorships | Other Directorships held by Trustee | |||||
Independent Trustees | ||||||||
(photo omitted) | Marina E. Adshade(52) 1300 N. State Street Bellingham WA 98225 | Independent Trustee (since 2017); Nine | Professor of Economics, University of British Columbia, Vancouver and Simon Fraser University;
Author | None | ||||
(photo omitted) | Ronald H. Fielding, MA, MBA, CFA (70) 1300 N. State Street Bellingham WA 98225 | Independent Trustee (since 2009); Thirteen | Director, ICI Mutual Insurance Company | Amana Mutual Funds Trust | ||||
(photo omitted) | Gary A. Goldfogel, MD (61) 1300 N. State Street Bellingham WA 98225 | Chairman (since 2017); Independent Trustee (since 1995); Nine | Medical Examiner (pathologist)
Owner, Avocet Environmental Testing (laboratory) | None | ||||
(photo omitted) | Jim V. McKinney(58) 1300 N. State Street Bellingham WA 98225 | Independent Trustee (since 2017); Nine | Executive Director, Common Threads Northwest; President/CEO, Apple Mountain LLC, consulting and development; US Army Foreign Area Officer—Political/Military Advisor to US Army Central; Senior Defense Official, Defense Attaché, US Embassy Slovenia | None | ||||
(photo omitted) | Sarah E.D. Rothenbuhler (51) 1300 N. State Street Bellingham WA 98225 | Independent Trustee (since 2017); Nine | CEO, Birch Equipment (industrial rentals and sales) | None | ||||
Interested Trustee | ||||||||
(photo omitted) | Jane K. Carten, MBA (44) 1300 N. State Street Bellingham WA 98225 | President, Trustee (since 2017); Nine | President and Director, Saturna Capital Corporation
Vice President and Director, Saturna Trust Company
President, Saturna Brokerage Services | None | ||||
| Annual Report | November 30, 2019 | 15 | ||||
| Trustees and Officers(continued) | (unaudited) |
| Name (Age) and Address | Position(s) held with Trust and Number of Saturna Fund | Principal occupation(s) during past 5 years, including Directorships | Other Directorships held by Trustee | |||||
Officers Who Are Not Trustees | ||||||||
(photo omitted) | Phelps S. McIlvaine(66) 1300 N. State Street Bellingham, WA 98225 | Vice President (since 1994); N/A | Vice President, Saturna Capital Corporation
Director, Vice President, and former Treasurer Saturna Brokerage Services | N/A | ||||
(photo omitted) | Christopher R. Fankhauser (47) 1300 N. State Street Bellingham, WA 98225 | Treasurer1(since 2002); N/A | Chief Operations Officer, Saturna Capital Corporation
Vice President and Chief Operations Officer, Saturna Brokerage Services
Director, Vice President, and Chief Operations Officer, Saturna Trust Company | N/A | ||||
(photo omitted) | Michael E. Lewis(58) 1300 N. State Street Bellingham, WA 98225 | Chief Compliance Officer1 (since 2012); N/A | Chief Compliance Officer, Saturna Capital, Saturna Trust Company, and Affiliated Funds | N/A | ||||
(photo omitted) | Jacob A. Stewart(39) 1300 N. State Street Bellingham, WA 98225 | Anti-Money Laundering Officer1 (since 2015); N/A | Anti-Money Laundering Officer, Saturna Capital Corporation, Saturna Brokerage Services
Chief Compliance Officer, Saturna Brokerage Services
Bank Secrecy Act Officer, Saturna Trust Company | N/A | ||||
(photo omitted) | Nicole Trudeau(40) 1300 N. State Street Bellingham WA 98225 | Secretary1 (since 2018) N/A | Chief Legal Officer, Saturna Capital Corporation
Former: Counsel, Simpson Thacher & Bartlett LLP; Partner, Stradley Ronon Stevens & Young, LLP; Partner, K&L Gates LLP | N/A | ||||
Term of Office: each Trustee serves for the lifetime of the Trust or until they die, resign, are removed, or notre-elected by the shareowners. Each officer serves aone-year term subject to annual reappointment by the Trustees.
The Trust’s Statement of Additional Information, available without charge upon request by calling Saturna Capital at1-800-728-8762 and on the Funds’ website, www.idahotaxexemptfund.com, includes additional information about the Trustees.
On November 30, 2019 the Trustees, officers, and their related accounts as a group owned 17.98% of the outstanding shares of the Fund.
During the year ended November 30, 2019, the Independent Trustees were each paid by the Trust: (1) $2,000 annual retainer plus $1,000 per board meeting attended (in person or by phone), plus reimbursement of travel expenses; (2) $250 for committee meetings; and (3) $250 per quarter for serving as chariman of the board or any committee.
Mrs. Carten is an Interested Trustee by reason of her positions with the Trust’s adviser (Saturna Capital Corporation) and underwriter (Saturna Brokerage Services), and is the primary manager of the Saturna Sustainable Equity Fund portfolio. She is paid by Saturna Capital a salary, plus a bonus for each month the Saturna Sustainable Equity Fund portfolio earns a 4 or 5 star rating from Morningstar (see www.saturna.com). The officers are paid by Saturna Capital and not the Trust. As of November 30, 2019, all Saturna Capital employees listed above as officers owned shares in one or more of the Saturna Investment Trust funds, with Mrs. Carten owning (directly or indirectly) over $0.92 million.
| 1 | Holds the same postion with Amana Mututal Funds Trust |
| 16 | November 30, 2019 | Annual Report | ||||
Renewal of Investment Advisory Contract | (unaudited) |
During their meeting of September 17, 2019, the Trustees of Saturna Investment Trust, including those Trustees who are not “interested persons” (as that term is defined in the Investment Company Act of 1940) of the Trust or Saturna Capital (the “Independent Trustees”), discussed the continuance of the Investment Advisory and Administrative Services Agreement (“Agreement”) between the Trust, on behalf of the Fund, and Saturna Capital. In considering the renewal of the Agreement, the Trustees discussed the nature, extent, and quality of the services provided by Saturna Capital to the Trust and the Fund. The Trustees considered Saturna Capital’s specific responsibilities in all aspects ofday-to-day management of the Fund as well as the qualifications, experience and responsibilities of the Fund’s portfolio manager and other key personnel at Saturna Capital. The Trustees discussed Saturna Capital’s experience, ability, and commitment to quality service through performing internally such functions as shareowner servicing, administration, accounting, marketing, and distribution — all in addition to investment management.
The Trustees took into consideration Saturna Capital’s continued avoidance of significant operational and compliance problems, plus its investments in infrastructure, information management systems, personnel, training, and investor education materials, all designed to provide high quality investor services and meet investor needs. They recognized Saturna Capital’s efforts to recruit and retain qualified and experienced staff and improve the capital base on which Saturna Capital operates, which the Trustees believe is important to the long-term success of the Fund. They considered Saturna Capital’s focus on investors and its efforts to avoid potential conflicts of interest.
The Trustees considered the investment performance of the Fund over time, including the Fund’s average annual total returns relative to its benchmark for theone-, three-, five-,ten-, and fifteen-year periods, all as of August 31, 2019. The Trustees also considered comparative information published by Morningstar Inc. (“Morningstar”), an independent data service provider that, among other things, ranks mutual fund performance within categories comprised of similarly managed funds. The Trustees considered and discussed the Fund’s performance relative to its Morningstar category for theone-, three-,five-,ten-, and fifteen-year periods ended August 31, 2019. The Trustees also considered the Fund’s Morningstar performance ranking (three stars), and the Fund’s performance ranking relative to the Fund’s category selected by Lipper, Inc. for theone-, three-, five- andten-year periods ended as of August 31, 2019.
With respect to long-term(10- and15-year) performance, the Trustees found that the average annual total return of the Fund for the10- and15-year periods ended on August 31, 2019, was below the Morningstar category average for the same periods. The Trustees also considered the short- and medium-term performance of the Fund, noting that the Fund’s average annual total return for the five-year period ended on August 31, 2019 was below its Morningstar category average, while average annual total return for theone- and three-year periods outperformed its Morningstar category average.
The Trustees noted the risk-averse investment style of the Fund and other factors which can affect the Fund’s performance relative to its broader Morningstar category. The Trustees also noted certain differences between the Fund and the peer funds within its Morningstar category, including differences in investment strategies and asset size. The Trustees found that Saturna Capital continued to manage the Fund in a manner that is designed to be risk-averse and attractive to long-term investors. The Trustees discussed and considered the efforts of Saturna Capital to make additional resources available to assist in managing the Fund. The Trustees also considered Saturna Capital’s focus on improving investment performance without incurring materially higher levels of risk.
The Trustees also considered the performance and expenses of the Fund as compared to smaller group of funds with similar assets and investment objectives and strategies. The Trustees considered these comparative performance and expense data, along with the comparative data published by Morningstar and the Fund’s performance relative to its benchmark, to evaluate the Fund’s performance over near-term and long-term time periods.
The Trustees also reviewed the fees and expenses of the Fund, including comparative data on fees and expenses published by Morningstar, and considered the components of the Fund’s operating expenses. The Trustees noted the steps that Saturna Capital has undertaken to maintain competitive levels of Fund operating expenses. They noted the significant sponsorship of the Fund by Saturna Capital evidenced, in part, by certain fees and expenses paid by Saturna Capital out of its own resources. The Trustees recognized Saturna Capital’s efforts help make the Fund more widely available and less expensive than would otherwise be the case without Saturna Capital’s efforts.
The Trustees recognized that the Fund remains relatively small and there have not been opportunities to consider economies of scale. The Trustees noted Saturna Capital’s commitment to continue operating the Fund and the costs undertaken by Saturna Capital.
The Trustees reviewed Saturna Capital’s financial information and discussed the issue of Saturna Capital’s profitability as related to management and administration of the Trust. They discussed the reasonableness of Saturna Capital’s profitability as part of their evaluation of whether the advisory fees bear a reasonable relationship to the mix of services provided by Saturna Capital, including the nature, extent, and quality of such services.
The Trustees considered and compared the fees charged by Saturna Capital to other types of accounts, includingnon-mutual fund advisory clients. The Trustees noted the differences between the full range of services Saturna Capital provides to the Fund, including investment advisory services, transfer agency services, administrative and other services, as compared to the investment advisory services provided to the other advisory accounts.
Continued on next page.
| Annual Report | November 30, 2019 | 17 | ||||||
| Renewal of Investment Advisory Contract(continued) | (unaudited) |
The Trustees considered potential benefits to Saturna Capital’s other business lines from acting as investment adviser to the Fund, but also recognized that Saturna Capital’s other business lines benefit the Fund. The Trustees considered whether there are other potential benefits to Saturna Capital in continuing to manage the Fund and the Trustees found that there were no material benefits other than Saturna Capital’s receipt of advisory fees.
The Trustees concluded based on their business judgement that the fees paid by the Fund to Saturna Capital were, from anarm’s-length bargaining perspective, reasonable and in the best interest of the Fund and its shareowners in light of the services provided, comparative performance, expense and advisory fee information, costs of services provided, profits to be realized, and benefits derived or to be derived by Saturna Capital from its relationship with the Fund. Following this discussion, the Trustees, including the Independent Trustees, unanimously agreed to renew the Agreement of IdahoTax-Exempt Fund with Saturna Capital.
| 18 | November 30, 2019 | Annual Report | ||||
Availability of Portfolio Information
| (1) | The Fund files a complete schedule of portfolio holdings with the SEC for the first and third quarters of each fiscal year on FormN-Q. |
| (2) | The Fund’s FormN-Q is available on the SEC’s website at www.sec.gov and at www.idahotaxexemptfund.com. |
| (3) | The Fund’s FormN-Q may be reviewed and copied at the SEC’s Public Reference Room in Washington, DC. Information on the operation of the Public Reference Room may be obtained by calling1-800/SEC-0330. |
| (4) | The Fund makes a complete schedule of portfolio holdings after the end of each month available to investors at www.idahotaxexemptfund.com. |
Availability of Proxy Voting Information
| (1) | A description of the policies and procedures that the Fund uses to determine how to vote proxies relating to portfolio securities is available (a) without charge, upon request, by calling Saturna Capital at1-800-728-8762; (b) on the Fund’s website at www. idahotaxexemptfund.com; and (c) on the SEC’s website at www.sec.gov. |
| (2) | Information regarding how the Fund voted proxies relating to portfolio securities during the most recent12-month period ended June 30 is available (a) without charge, upon request, by calling Saturna Capital at1-800-728-8762; (b) on the Fund’s website at www.idahotaxexemptfund.com; and (c) on the SEC’s website at www.sec.gov. |
Householding Policy
To reduce expenses, we may mail only one copy of the Fund’s prospectus, each annual and semi-annual report, and proxy statement when necessary, to those addresses shared by two or more accounts. If you wish to receive individual and/or more copies of these documents, please call us at1-800-728-8762 or write to us at Saturna Capital/IdahoTax-Exempt Fund, P.O. Box N, Bellingham, WA 98227. We will begin sending you individual copies 30 days after receiving your request.
If you are currently receiving multiple copies and wish to receive only one copy, please call us at1-800-728-8762 or write to us at Saturna Capital/IdahoTax-Exempt Fund, P.O. Box N, Bellingham, WA 98227. We will begin sending you a single copy with subsequent report mailings.
Privacy Statement
At Saturna Capital and the IdahoTax-Exempt Fund, we understand the importance of maintaining the privacy of your financial information. We want to assure you that we protect the confidentiality of any personal information that you share with us. In addition, we do not sell information about our current or former customers.
In the course of our relationship, we gather certain nonpublic information about you, including your name, address, investment choices, and account information. We do not disclose your information to unaffiliated third parties unless it is necessary to process a transaction; service your account; deliver your account statements, shareowner reports and other information; or as required by law. When we disclose information to unaffiliated third parties, we require a contract to restrict the companies’ use of customer information and from sharing or using it for any purposes other than performing the services for which they were required.
We may share information within the Saturna Capital family of companies in the course of informing you about products or services that may address your investing needs.
We maintain our own technology resources to minimize the need for any third party services, and restrict access to information within Saturna. We maintain physical, electronic, and procedural safeguards to guard your personal information. If you have any questions or concerns about the security or privacy of your information please call us at1-800-728-8762.
| Annual Report | November 30, 2019 | 19 | ||||
Item 2. Code of Ethics.
Registrant has adopted a code of ethics and is included with this submission as Exhibit (a). It may also be found on Registrant's website at https://www.saturna.com/code-ethics
Item 3. Audit Committee Financial Expert.
(a)(1)(i) The Trust has an audit committee financial expert serving on its audit committee.
(a)(2)(ii) As of November 30, 2014, Mr. Ronald H. Fielding, an independent Trustee (as defined for investment companies), was deemed qualified and agreed to serve.
Item 4. Principal Accountant Fees and Services.
(a) Audit Fees
For the fiscal years ending November 30, 2019, and 2018, the aggregate audit fees billed for professional services rendered by the principal accountant were $113,500 and $113,500, respectively.
(b) Audit-Related Fees
There were no fees billed by the principal accountant for assurance and related services that were not included under paragraph (a) for the fiscal years ending November 30, 2019, and 2018.
(c) Tax Fees
For the fiscal years ending November 30, 2019, and 2018, the aggregate tax fees billed for professional services rendered by the principal accountant were $25,700 and $25,700, respectively. Service includes preparation of the Funds' federal and state income tax returns.
(d) All Other Fees
There were no other fees billed by the principal accountant for the fiscal years ending November 30, 2019, and 2018.
(e)(1) Audit & Compliance Committee Pre-Approval Policies and Procedures
The following is an excerpt from the Saturna Investment Trust Audit & Compliance Committee Charter:
C. Oversight of Independent Auditors
3. Pre-approval of Audit and Non-Audit Services. Except as provided below, the Committee's prior approval is necessary for the engagement of the independent auditors to provide any audit or non-audit services for the Trust and any non-audit services for any entity controlling, controlled by or under common control with Saturna that provides ongoing services to the Trust (Saturna and each such entity, an "Adviser Affiliate") where the engagement relates directly to the operations or financial reporting of the Trust. Non-audit services that qualify under the de minimis exception described in the Securities Exchange Act of 1934, as amended, and applicable rules thereunder, that were not pre-approved by the Committee, must be approved by the Committee prior to the completion of the audit. Pre-approval by the Committee is not required for engagements entered into pursuant to (a) pre-approval policies and procedures established by the Committee, or (b) pre-approval granted by one or more members of the Committee to whom, or by a subcommittee to which, the Committee has delegated pre-approval authority, provided in either case, that the Committee is informed of each such service at its next regular meeting.
(e) (2) Percentages of Services
One hundred percent of the services described in each of paragraphs (b) through (d) were approved by the audit committee pursuant to paragraph (c)(7)(i)(C) of Rule 2-01 of Regulation S-X.
(f) Not applicable.
(g) Aggregate Non-Audit Fees
The aggregate non-audit fees billed by the principal accountant for services rendered to the Registrant are shown above in the response to Item 4(b), (c) and (d) above.
(1) The aggregate non-audit fees billed by the principal accountant for services rendered to the Registrant's investment adviser, Saturna Capital Corporation ("Saturna"), for the fiscal years ended November 30, 2019, and 2018 were:
Fiscal Year Ended
November 2019
November 2018
All other fees:
$23,000
$23,000
The fees listed above consist of fees paid by Saturna to the Registrant's principal accountant for its review and report on Saturna's internal transfer agency control procedures and Saturna's custody control procedures.
(2) The aggregate non-audit fees billed by the principal accountant for services rendered to entities controlling, controlled by, or under common control with Saturna, for the fiscal years ended November 30, 2019, and 2018 were:
Fiscal Year Ended
November 2019
November 2018
All other fees:
None
None
(h) Registrant's Audit Committee
The Registrant's Audit Committee has considered the provision of non-audit services that were rendered to Saturna, and any entity controlling, controlled by or under common control with Saturna that provides ongoing services to the Registrant, that were not pre-approved pursuant to Rule 2-01 (c)(7)(ii) of Regulation S-X and has determined that the provision of such services is compatible with maintaining the independence of the Registrant's principal accountant.
Item 5. Audit Committee of Listed Registrants.
Not applicable.
Item 6. Schedule of Investments.
The schedule is included as part of the report to shareholders filed under Item 1 of this Form.
Item 7. Disclosure of Proxy Voting Policies and Procedures for Closed-End Management Investment Companies.
Not applicable.
Item 8. Portfolio Managers of Closed-End Management Investment Companies.
Not applicable.
Item 9. Purchases of Equity Securities by Closed-End Management Investment Company and Affiliated Purchasers.
Not applicable.
Item 10. Submission of Matters to a Vote of Security Holders.
Not applicable.
Item 11. Controls and Procedures.
(a) Internal control over financial reporting is under the supervision of the principal executive and financial officers. On December 17, 2019, Mrs. Jane Carten (President) and Mr. Christopher Fankhauser (Treasurer), reviewed the internal control procedures for Saturna Investment Trust and found them reasonable and adequate.
(b) No change.
Item 12. Exhibits
Exhibits included with this filing:
(a)(3) Not applicable.
SIGNATURES
Pursuant to the requirements of the Securities Exchange Act of 1934 and the Investment Company Act of 1940, the registrant has duly caused this report to be signed on its behalf by the undersigned, thereunto duly authorized.
SATURNA INVESTMENT TRUST
By:
/s/ Jane Carten, President
Signature and Title
Jane Carten, President
Printed name and Title
January 29, 2020
Date
Pursuant to the requirements of the Securities Exchange Act of 1934 and the Investment Company Act of 1940, this report has been signed below by the following persons on behalf of the registrant and in the capacities and on the dates indicated.
By:
/s/ Jane Carten, President
Signature and Title
Jane Carten, President
Printed name and Title
January 29, 2020
Date
By:
/s/ Christopher Fankhauser, Treasurer
Signature and Title
Christopher Fankhauser, Treasurer
Printed name and Title
January 29, 2020
Date
# # #