SECURITIES AND EXCHANGE COMMISSION
WASHINGTON, DC 20549
FORM N-CSR
CERTIFIED SHAREHOLDER REPORT OF REGISTERED
MANAGEMENT INVESTMENT COMPANIES
Investment Company Act file number: 811-05071 or 33-13247
SATURNA INVESTMENT TRUST
(Exact Name of Registrant as Specified in Charter)
1300 N. State Street
Bellingham, Washington 98225-4730
(Address of Principal Executive Offices, including ZIP Code)
Nicole Trudeau
1300 N. State Street
Bellingham, Washington 98225-4730
(Name and Address of Agent for Service)
Registrant's Telephone Number – (360) 734-9900
Date of fiscal year end: November 30, 2020
Date of reporting period: November 30, 2020
Item 1. Annual Report.

| | | | | | | | | | | | | | |
| Performance Summary (as of December 31, 2020) | | (unaudited) |
| | | | | | | | | | | | | | | | | | | | | | | | | | | | |
| | | | | | | | | | | | | | | | | | | | | | | Expense Ratio1 | |
| | | | | | | |
Average Annual Total Returns | | | 1 Year | | | | 3 Year | | | | 5 Year | | | | 10 Year | | | | 15 Year | | | | Gross | | | | Net | |
| | | | | | | |
Sextant Short-Term Bond Fund (STBFX) | | | 3.42% | | | | 2.83% | | | | 2.09% | | | | 1.54% | | | | 2.44% | | | | 0.87% | | | | 0.60% | |
| | | | | | | |
FTSE USBIG Govt/Corp 1-3 Year Index | | | 3.35% | | | | 2.96% | | | | 2.18% | | | | 1.56% | | | | 2.54% | | | | | | | | n/a | |
| | | | | | | |
Sextant Bond Income Fund (SBIFX) | | | 8.85% | | | | 5.86% | | | | 5.32% | | | | 4.49% | | | | 4.51% | | | | 0.71% | | | | 0.65% | |
| | | | | | | |
FTSE US Broad Investment-Grade Bond Index | | | 7.74% | | | | 5.44% | | | | 4.51% | | | | 3.87% | | | | 4.57% | | | | | | | | n/a | |
| | | | | | |
Sextant Core Fund (SCORX) | | | 10.36% | | | | 8.09% | | | | 8.57% | | | | 6.28% | | | | n/a | | | | 0.90% | |
| | | | | | | |
Dow Jones Moderate US Portfolio Index | | | 12.24% | | | | 8.04% | | | | 9.35% | | | | 7.59% | | | | 6.75% | | | | | | | | n/a | |
| | | | | | | |
Sextant Global High Income Fund (SGHIX) | | | -2.73% | | | | 2.31% | | | | 8.13% | | | | n/a | | | | n/a | | | | 1.11% | | | | 0.75% | |
| | | | | | | |
S&P Global 1200 Index | | | 15.58% | | | | 10.79% | | | | 12.90% | | | | 10.34% | | | | 7.97% | | | | | | | | n/a | |
| | | | | | |
Sextant Growth Fund Investor Shares (SSGFX) | | | 30.48% | | | | 21.35% | | | | 16.83% | | | | 13.42% | | | | 9.50% | | | | 1.20% | |
| | | | | | |
Sextant Growth Fund Z Shares (SGZFX) | | | 30.78% | | | | 21.66% | | | | n/a | | | | n/a | | | | n/a | | | | 0.90% | |
| | | | | | | |
S&P 500 Index | | | 18.40% | | | | 14.14% | | | | 15.20% | | | | 13.87% | | | | 9.87% | | | | | | | | n/a | |
| | | | | | |
Sextant International Fund Investor Shares (SSIFX) | | | 15.09% | | | | 11.93% | | | | 13.51% | | | | 6.16% | | | | 6.59% | | | | 1.07% | |
| | | | | | |
Sextant International Fund Z Shares (SIFZX) | | | 15.32% | | | | 12.20% | | | | n/a | | | | n/a | | | | n/a | | | | 0.85% | |
| | | | | | | |
MSCI EAFE Index | | | 8.28% | | | | 4.78% | | | | 7.96% | | | | 6.00% | | | | 4.97% | | | | | | | | n/a | |
Performance data quoted above represents past performance, is before any taxes payable by shareowners, and is no guarantee of future results. Current performance may be higher or lower than that stated herein. Performance current to the most recent month-end is available by calling toll-free 1-800-728-8762 or visiting www.sextantfunds.com. Average annual total returns are historical and include change in share value as well as reinvestment of dividends and capital gains, if any. The investment return and principal value of an investment will fluctuate so that an investor’s shares, when redeemed, may be worth more or less than their original cost. Funds that invest in foreign securities may involve greater risk, including political and economic uncertainties of foreign countries as well as the risk of currency fluctuations.
Z Shares of Sextant Growth and International Funds began operations June 2, 2017.
A note about risk: Please see Notes to Financial Statements beginning on page 53 for a discussion of investment risks. For a more detailed discussion of the risks associated with each Fund, please see the Funds’ prospectus or each Fund’s summary prospectus.
A Fund’s 30-Day Yield, sometimes referred to as “standardized yield” or “SEC yield,” is expressed as an annual percentage rate using a method of calculation adopted by the Securities and Exchange Commission (SEC). The 30-Day Yield provides an estimate of a Fund’s investment income rate, but may not equal the actual income distribution rate.
| 1 | By regulation, expense ratios shown in this table are as stated in the Funds’ most recent prospectus, which is dated March 27, 2020, and incorporate results for the fiscal year ended November 30, 2019. Ratios presented in this table differ from the expense ratios shown elsewhere in this report as they represent different periods. Also by regulation, the performance in this table represents the most recent quarter-end performance rather than performance through the Funds’ most recent fiscal period. |
The S&P 500 Index is an index comprised of 500 widely held common stocks considered to be representative of the US stock market in general. The MSCI EAFE Index is an international index focused on Europe, Australasia, and the Far East. The S&P Global 1200 Index is a global stock market index covering nearly 70% of the world’s equity markets. The Dow Jones Moderate Portfolio Index is a broad-based index of stock and bond prices. The FTSE USBIG Govt/Corp Index 1-3 Year is a broad-based index of shorter-term investment-grade US government and corporate bond prices. The FTSE US Broad Investment-Grade Bond Index is a broad-based index of medium and long-term investment grade bond prices. Investors cannot invest directly in the indices.
Please consider an investment’s objectives, risks, charges, and expenses carefully before investing. To obtain this and other important information about the Sextant Funds in a prospectus or summary prospectus, ask your financial adviser, visit www.sextantfunds.com, or call toll-free 1-800-728-8762. Please read the prospectus or summary prospectus carefully before investing.
| | | | | | | | | | |
| | | | | | |
| 2 | | | | | | | | November 30, 2020 | | Annual Report |
| | |
| | (unaudited) |
| Fellow Shareowners: | | January 25, 2020 |
2020 was quite a ride. Things got off to a rocky start, with the S&P 500 Index experiencing dramatic COVID-19 pandemic-induced volatility in the first quarter, but then quickly recovering those losses in the second, with the third and fourth riding a mostly sustained rise with a few dips along the way, finishing out the Funds’ fiscal year with a one year return of 17.46% as of November 30, 2020. The Dow Jones Moderate US Portfolio Index rose 11.02% during the same period. Foreign markets endured similar volatility and recovery, with the MSCI EAFE Index rising 6.83% and the S&P Global 1200 Index rising 14.39%. Fixed-income markets were subdued, but remained in positive territory: the FTSE USBIG Bond Index gained 7.47% and the shorter-term FTSE USBIG Government/Corporate 1-3 Year Index climbed 3.50%.
The Sextant Funds performed respectably compared to these indices. For the fiscal year ended November 30, 2020, Sextant Growth Fund Investor Shares gained 29.49%, Sextant International Fund Investor Shares rose 9.86%, Sextant Core Fund gained 9.72%, Sextant Global High Income Fund fell -3.51%, Sextant Bond Income Fund gained 8.48%, and Sextant Short-Term Bond Fund gained 3.46%.
| | |
September 28, 2020, marks 25 years since the Sextant Funds were formed. | |  |
September 28, 2020, marks 25 years since the Sextant Funds were formed. The Sextant Funds offer investors a broad mix of investment vehicles: growth equities, international exposure, and a blended portfolio, plus global high income, short-term and long-term fixed-income options. This array of portfolios serves our investors in both bull and bear markets by providing basic elements to build a low-expense, balanced investment program emphasizing a value approach to investing.
The annualized expense ratios of the six no-12b-1 fee Sextant Fund share classes range from 0.60% to 0.90%. Saturna Capital helped by capping expenses for the Sextant Short-Term, Sextant Bond Income, and Sextant Global High Income Funds. Overall assets of the Funds were $190.1 million as of November 30, 2020.
We entered 2020 with cautious optimism. Geopolitical uncertainties, rich corporate valuations, and stretched monetary policies kept us vigilant, while generally strong business and economic fundamentals supported optimism. What we didn’t foresee was the looming pandemic, widespread economic shutdowns, and rapid government intervention. By nature, such a “black swan” is unforeseeable, and it’s also why we place emphasis on seeking out companies with robust balance sheets and competitive positioning to support earnings growth even through trying times. We cannot control the weather, but we can plot a course and pick a vessel to ride out the storm.
| | | | | | | | | | |
| | | | | | |
| Annual Report | | November 30, 2020 | | | | | | | | 3 |
(unaudited)
With 2020’s bull market largely driven by multiple expansion, particularly in Technology stocks, valuations continue to be a point of contention. One way to consider whether or not the market has become irrational is to look at the cyclically adjusted price-to-earnings, or CAPE ratio. This figure considers inflation-adjusted share prices relative to the 10-year average of real earnings per share. When we compare this figure with the US government’s 10-year interest rate, a common starting point for discount rates used in valuation, the market appears to be fairly priced. That said, we see the strong returns of 2020 largely attributable to the pandemic-driven decline in interest rates. Looking ahead we don’t expect to see further multiple expansion, barring the Federal Reserve cutting nominal interest rates into negative territory. With 2020 being far from a normal baseline, we expect some volatility as the market shakes out which companies are deserving of their newfound valuations.
Broad recovery and a return to more normal conditions remain on hold as vaccines are rolled out. We undoubtedly face more economic turmoil, but we retain faith in the power of human resilience and creativity. As we stand on the precipice of regime change, we will continue to hold the wheel, actively charting a course through turbulent waters. We thank you for your continued investment with us.
Respectfully,
(photo omitted)
Jane Carten,
President
(photo omitted)
Gary Goldfogel,
Independent Board Chairman
| | | | | | | | | | |
| |
| | Sextant Funds Portfolio Management |
| | | | | |
| | (photo omitted) | | Scott Klimo CFA® Sextant Growth Fund Portfolio Manager | | (photo omitted) | | Elizabeth Alm CFA® Sextant Bond Income Fund Portfolio Manager Sextant Short-Term Bond Fund Deputy Portfolio Manager | | |
| | | | | |
| | (photo omitted) | | Christopher Paul MBA, CFA® Sextant Core Fund Sextant International Fund Portfolio Manager Sextant Growth Fund Deputy Portfolio Manager | | (photo omitted) | | Levi Stewart Zurbrugg MBA, CPA® Sextant Short-Term Bond Fund Portfolio Manager | | |
| | | | | |
| | (photo omitted) | | Bryce Fegley MS, CFA®, CIPM® Sextant Global High Income Fund Sextant Core Fund Portfolio Manager Sextant Bond Income Fund Deputy Portfolio Manager | | (photo omitted) | | Chris Lang CFA® Sextant International Fund Deputy Portfolio Manager | | |
| | | | | |
| | (photo omitted) | | Patrick Drum MBA, CFA®, CFP® Sextant Global High Income Fund Deputy Portfolio Manager | | | | | | |
| | | | | | | | | | |
| | | | | | �� |
| 4 | | | | | | | | November 30, 2020 | | Annual Report |
| | |
| Performance Summary (as of November 30, 2020) | | (unaudited) |
| | | | | | | | | | | | | | | | | | | | | | | | | | | | |
| | | | | | | | | | | | | | | | | | | | | | | Expense Ratio1 | |
| | | | | | | |
Average Annual Total Returns | | | 1 Year | | | | 3 Year | | | | 5 Year | | | | 10 Year | | | | 15 Year | | | | Gross | | | | Net | |
| | | | | | | |
Sextant Short-Term Bond Fund (STBFX) | | | 3.46% | | | | 2.77% | | | | 2.04% | | | | 1.49% | | | | 2.46% | | | | 0.87% | | | | 0.60% | |
| | | | | | | |
FTSE USBIG Govt/Corp 1-3 Year Index | | | 3.50% | | | | 2.95% | | | | 2.14% | | | | 1.54% | | | | 2.56% | | | | | | | | n/a | |
| | | | | | | |
Sextant Bond Income Fund (SBIFX) | | | 8.48% | | | | 6.21% | | | | 5.20% | | | | 4.33% | | | | 4.57% | | | | 0.71% | | | | 0.65% | |
| | | | | | | |
FTSE US Broad Investment-Grade Bond Index | | | 7.47% | | | | 5.55% | | | | 4.41% | | | | 3.73% | | | | 4.62% | | | | | | | | n/a | |
| | | | | | |
Sextant Core Fund (SCORX) | | | 9.72% | | | | 7.50% | | | | 7.80% | | | | 6.34% | | | | n/a | | | | 0.90% | |
| | | | | | | |
Dow Jones Moderate US Portfolio Index | | | 11.02% | | | | 7.28% | | | | 8.38% | | | | 7.68% | | | | 6.65% | | | | | | | | n/a | |
| | | | | | | |
Sextant Global High Income Fund (SGHIX) | | | -3.51% | | | | 1.86% | | | | 6.69% | | | | n/a | | | | n/a | | | | 1.11% | | | | 0.75% | |
| | | | | | | |
S&P Global 1200 Index | | | 14.39% | | | | 9.74% | | | | 11.53% | | | | 10.64% | | | | 7.82% | | | | | | | | n/a | |
| | | | | | |
Sextant Growth Fund Investor Shares (SSGFX) | | | 29.49% | | | | 20.15% | | | | 15.53% | | | | 13.55% | | | | 9.37% | | | | 1.20% | |
| | | | | | |
Sextant Growth Fund Z Shares (SGZFX) | | | 29.79% | | | | 20.46% | | | | n/a | | | | n/a | | | | n/a | | | | 0.90% | |
| | | | | | | |
S&P 500 Index | | | 17.46% | | | | 13.16% | | | | 13.97% | | | | 14.18% | | | | 9.60% | | | | | | | | n/a | |
| | | | | | |
Sextant International Fund Investor Shares (SSIFX) | | | 9.86% | | | | 9.88% | | | | 11.06% | | | | 5.92% | | | | 6.31% | | | | 1.07% | |
| | | | | | |
Sextant International Fund Z Shares (SIFZX) | | | 10.09% | | | | 10.13% | | | | n/a | | | | n/a | | | | n/a | | | | 0.85% | |
| | | | | | | |
MSCI EAFE Index | | | 6.83% | | | | 3.76% | | | | 6.70% | | | | 6.34% | | | | 4.97% | | | | | | | | n/a | |
Performance data quoted above represents past performance, is before any taxes payable by shareowners, and is no guarantee of future results. Current performance may be higher or lower than that stated herein. Performance current to the most recent month-end is available by calling toll-free 1-800-728-8762 or visiting www.sextantfunds.com. Average annual total returns are historical and include change in share value as well as reinvestment of dividends and capital gains, if any. The investment return and principal value of an investment will fluctuate so that an investor’s shares, when redeemed, may be worth more or less than their original cost. Funds that invest in foreign securities may involve greater risk, including political and economic uncertainties of foreign countries, as well as the risk of currency fluctuations.
| 1 | By regulation, expense ratios shown in this table are as stated in the Funds’ most recent prospectus, which is dated March 27, 2020, and incorporate results for the fiscal year ended November 30, 2019. Ratios presented in this table differ from the expense ratios shown elsewhere in this report as they represent different periods. |
| | | | | | | | | | |
| | | | | | |
| Annual Report | | November 30, 2020 | | | | | | | | 5 |
Sextant Short-Term Bond Fund
| | | | |
Performance Summary | | | | (unaudited) |
| | | | | | | | | | | | | | | | |
Average Annual Total Returns as of November 30, 2020 | |
| | | | | |
| | | 1 Year | | | 5 Year | | | 10 Year | | | Expense Ratio1 | |
| | | | |
Sextant Short-Term Bond Fund | | | 3.46% | | | | 2.04% | | | | 1.49% | | | | 0.87% | |
| | | | |
FTSE USBIG Govt/Corp 1-3 Year Index | | | 3.50% | | | | 2.14% | | | | 1.54% | | | | n/a | |
Growth of $10,000
| | |
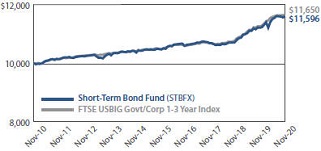 | | Comparison of any mutual fund to a market index must be made bearing in mind that the index is expense-free. Conversely, the fund will (1) be actively managed; (2) have an objective other than mirroring the index, such as limiting risk; (3) bear transaction and other costs; (4) stand ready to buy and sell its securities to shareowners on a daily basis; and (5) provide a wide range of services. The graph compares $10,000 invested in the Fund on November 30, 2010, to an identical amount invested in the FTSE USBIG Govt/Corp 1-3 Year Index, a broad-based index of shorter-term investment grade US government and corporate bond prices. The graph shows that an investment in the Fund would have risen to $11,596 versus $11,650 in the index. |
Past performance does not guarantee future results. The “Growth of $10,000” graph and “Average Annual Returns” performance table assume the reinvestment of dividends and capital gains. They do not reflect the deduction of taxes that a shareowner might pay on fund distributions or the redemption of fund shares.
| 1 | By regulation, the expense ratio shown in this table is as stated in the Fund’s most recent prospectus which is dated March 27, 2020, and incorporates results for the fiscal year ended November 30, 2019, before fee waivers. The actual expense ratio, shown in the most recent prospectus after fee waivers was 0.60%. The ratio presented in this table differs from expense ratios shown elsewhere in this report as they represent different periods. |
Fund Objective
The objectives of the Short-Term Bond Fund are capital preservation and current income.
| | | | |
Top 10 Holdings | |
| |
| % of Total Net Assets | |
| |
United States Treasury Note (2.875% due 04/30/2025) | | | 7.3% | |
| |
United States Treasury Note (3.625% due 02/15/2021) | | | 7.1% | |
| |
United States Treasury Note (2.625% due 05/15/2021) | | | 4.9% | |
| |
United States Treasury Note (2.50% due 08/15/2023) | | | 4.6% | |
| |
McCormick & Co. (2.70% due 08/15/2022) | | | 4.5% | |
| |
Honeywell International (4.25% due 03/01/2021) | | | 4.0% | |
| |
Gilead Sciences (2.50% due 09/01/2023) | | | 3.7% | |
| |
Qualcomm (2.60% due 01/30/2023) | | | 3.7% | |
| |
Burlington Northern Santa Fe (3.05% due 09/01/2022) | | | 3.6% | |
| |
Costco Wholesale Corp (2.75% due 05/18/2024) | | | 3.6% | |
| | | | | | | | | | | | |
Portfolio Diversification | |
| | | |
| % of Total Net Assets | | | | | | | | | |
| | | |
Government Bonds | | | 23.9% | | | ∎ | | | | | 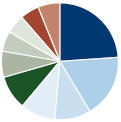 | |
Consumer Staples | | | 17.7% | | | ∎ | | |
Industrials | | | 9.9% | | | ∎ | | |
Technology | | | 9.7% | | | ∎ | | |
Health Care | | | 9.4% | | | ∎ | | |
Materials | | | 7.2% | | | ∎ | | |
Financials | | | 5.8% | | | ∎ | | |
Consumer Discretionary | | | 5.2% | | | ∎ | | |
Utilities | | | 5.1% | | | ∎ | | |
Other assets (net of liabilities) | | | 6.1% | | | ∎ | | |
| | | | | | | | | | |
| | | | | | |
| 6 | | | | | | | | November 30, 2020 | | Annual Report |
Sextant Short-Term Bond Fund
| | | | |
Discussion of Fund Performance | | | (unaudited) | |
(photo omitted)
Fiscal Year 2020
For the fiscal year ended November 30, 2020, the Sextant Short-Term Bond Fund returned 3.46%, underperforming the 3.50% return of its benchmark, the FTSE US BIG Government/ Corporate 1-3 Year Bond Index, and the 3.67% average return of its Morningstar Short-Term Bond category peer group. For the five years ended November 30, the Fund provided a 2.04% annualized total return versus 2.14% for its benchmark. During the year, the Fund’s share price grew from $5.08 to $5.17. The Fund’s 30-day yield was 0.11%, and its unsubsidized 30-day yield was 0.11%. Reflecting Saturna Capital’s subsidies to cap operating expenses, the Fund’s effective expense ratio was reduced to 0.60% from 0.90%.
Factors Affecting Past Performance
2020 began in a sanguine environment. The US stock market had set a record for the longest bull run, and while many questioned how long the continued growth would last, a strong job market and robust balance sheets seemed to support continued economic growth. Few could have foreseen the turmoil caused by a mystery illness cropping up in Wuhan, China. By the end of February, a harsher reality began to appear, and by mid-March, economic progress came to a halt.
Between February 19 and March 23, option-adjusted corporate credit spreads for investment-grade bonds shot up from 1.02% to 4.01%. Recognizing the immediate need for intervention, the Federal Reserve rapidly cut the lower bound of the federal funds target range. On March 2, the rate stood at 1.50%, and by March 16 it had been cut to 0.00%. In this environment the Fund’s Treasury holdings performed well, as lowering yields and investor flight to safety drove prices higher. At the same time corporate bond positions lagged as risk-off appetite sent prices lower.
After peaking on March 23, investment grade spreads rapidly fell. By June 1 spreads had fallen to 1.85%, and by November 30 they reached 1.12%. Meanwhile the federal funds rate held at 0.00%. The Fed’s efforts were successful in reviving investor appetite for risk, and in this setting corporate bonds outperformed. Throughout the year short-term bonds proved their merit in a diversified portfolio, helping to dampen the volatility experienced while providing current income.
Looking Forward
Although the federal funds rate now stands at what many consider the lower bound, with the Federal Reserve’s announcement that it will target an average inflation rate of 2% and in so doing allow for inflation to run “moderately above 2% for some time,” we will continue to consider the implications of this policy shift.
These expectations along with the potential for increased fiscal stimulus from the recently-elected Biden administration have spurred renewed interest in inflation. At the time of this writing, the five-year breakeven inflation rate, a measure of expected inflation, has moved above 2%, the highest level since October 2018. High jobless rates and increasing national debt create disinflationary pressure. Buoyant housing markets and challenged supply chain logistics create inflationary pressure. Whether inflation creeps higher depends on which forces prevail.
Beyond inflation concerns, the rise of so-called zombie companies that are held afloat by their increasing debt loads present potential trouble ahead. Low rates have allowed such companies to stay afloat. Should inflation spur an increase in interest rates, these companies risk having their lifelines pulled. As the debt markets stand on the precipice of a potential regime change, we will continue to hold the wheel, actively charting a course through turbulent waters. We believe bonds as an asset class remain a valuable tool for absorbing volatility.
Management Fee Calculations
The Sextant Short-Term Bond Fund calculates the performance part of its management fee by comparing the Fund’s return to the average return of Morningstar’s™ Short-Term Bond category. The Fund’s 12-month return of 3.46% was less than 1% percent below the Morningstar™ category average of 3.67% at month-end November 30, 2020. Therefore, the basic annual management fee of 0.50% remained unchanged for the month of December 2020. Note that the management fee is partially waived due to the adviser’s cap on total Fund expenses.
| | | | | | | | | | |
| | | | | | |
| Annual Report | | November 30, 2020 | | | | | | | | 7 |
Sextant Short-Term Bond Fund
| | | | | | | | | | | | | | | | | | |
| | | Schedule of Investments | | | | | | | | | | | | As of November 30, 2020 | |
| | | | | | | |
| | | Corporate Bonds – 70.0% | | | | Coupon / Maturity | | Face Amount | | | Market Value | | | Percentage of Net Assets | |
| | | | | | |
| | | Consumer Discretionary | | | | | | | | | | | | | |
| | | | | | | |
| | | Apple | | | | 1.80% due 09/11/2024 | | | $250,000 | | | | $261,562 | | | | 2.3% | |
| | | | | | | |
| | | Autozone | | | | 3.25% due 04/15/2025 | | | 300,000 | | | | 326,964 | | | | 2.9% | |
| | | | | | | |
| | | | | | | | | | | | | 588,526 | | | | 5.2% | |
| | | | | | |
| | | Consumer Staples | | | | | | | | | | | | | |
| | | | | | | |
| | | Church & Dwight | | | | 2.875% due 10/01/2022 | | | 260,000 | | | | 271,366 | | | | 2.4% | |
| | | | | | | |
| | | Costco Wholesale | | | | 2.75% due 05/18/2024 | | | 385,000 | | | | 414,383 | | | | 3.6% | |
| | | | | | | |
| | | Dollar General | | | | 4.15% due 11/01/2025 | | | 300,000 | | | | 345,139 | | | | 3.0% | |
| | | | | | | |
| | | Estee Lauder | | | | 2.35% due 08/15/2022 | | | 350,000 | | | | 362,237 | | | | 3.2% | |
| | | | | | | |
| | | McCormick & Co. | | | | 2.70% due 08/15/2022 | | | 500,000 | | | | 518,109 | | | | 4.5% | |
| | | | | | | |
| | | Walmart | | | | 2.85% due 07/08/2024 | | | 100,000 | | | | 108,307 | | | | 1.0% | |
| | | | | | | |
| | | | | | | | | | | | | 2,019,541 | | | | 17.7% | |
| | | | | | |
| | | Financials | | | | | | | | | | | | | |
| | | | | | | |
| | | Paypal Holdings | | | | 2.65% due 10/01/2026 | | | 300,000 | | | | 327,769 | | | | 2.9% | |
| | | | | | | |
| | | VISA | | | | 3.15% due 12/14/2025 | | | 300,000 | | | | 334,890 | | | | 2.9% | |
| | | | | | | |
| | | | | | | | | | | | | 662,659 | | | | 5.8% | |
| | | | | | |
| | | Health Care | | | | | | | | | | | | | |
| | | | | | | |
| | | Celgene | | | | 2.25% due 08/15/2021 | | | 300,000 | | | | 303,481 | | | | 2.6% | |
| | | | | | | |
| | | Gilead Sciences | | | | 2.50% due 09/01/2023 | | | 400,000 | | | | 420,985 | | | | 3.7% | |
| | | | | | | |
| | | Teva Pharmaceutical | | | | 3.65% due 11/10/2021 | | | 350,000 | | | | 352,625 | | | | 3.1% | |
| | | | | | | |
| | | | | | | | | | | | | 1,077,091 | | | | 9.4% | |
| | | | | | |
| | | Industrials | | | | | | | | | | | | | |
| | | | | | | |
| | | Burlington Northern Santa Fe | | | | 3.05% due 09/01/2022 | | | 400,000 | | | | 416,466 | | | | 3.6% | |
| | | | | | | |
| | | Cintas Corp # 2 | | | | 3.25% due 06/01/2022 | | | 350,000 | | | | 362,472 | | | | 3.2% | |
| | | | | | | |
| | | CSX Corporation | | | | 4.25% due 06/01/2021 | | | 350,000 | | | | 353,409 | | | | 3.1% | |
| | | | | | | |
| | | | | | | | | | | | | 1,132,347 | | | | 9.9% | |
| | | | | | |
| | | Materials | | | | | | | | | | | | | |
| | | | | | | |
| | | 3M | | | | 2.00% due 06/26/2022 | | | 400,000 | | | | 410,843 | | | | 3.6% | |
| | | | | | | |
| | | DuPont De Nemours | | | | 4.493% due 11/15/2025 | | | 350,000 | | | | 408,972 | | | | 3.6% | |
| | | | | | | |
| | | | | | | | | | | | | 819,815 | | | | 7.2% | |
Continued on next page.
| | | | | | | | | | | | |
| | | | | | | |
| 8 | | | | | | | | November 30, 2020 | | Annual Report | | The accompanying notes are an integral part of these financial statements. |
Sextant Short-Term Bond Fund
| | | | | | | | | | | | | | | | | | |
| | | Schedule of Investments | | | | | | | | | | | | As of November 30, 2020 | |
| | | | | | | |
| | | Corporate Bonds – 70.0% | | | | Coupon / Maturity | | Face Amount | | | Market Value | | | Percentage of Net Assets | |
| | | | | | |
| | | Technology | | | | | | | | | | | | | |
| | | | | | | |
| | | Honeywell International | | | | 4.25% due 03/01/2021 | | | $450,000 | | | | $454,479 | | | | 4.0% | |
| | | | | | | |
| | | Microsoft | | | | 2.375% due 05/01/2023 | | | 225,000 | | | | 235,602 | | | | 2.0% | |
| | | | | | | |
| | | Qualcomm | | | | 2.60% due 01/30/2023 | | | 400,000 | | | | 418,805 | | | | 3.7% | |
| | | | | | | |
| | | | | | | | | | | | | 1,108,886 | | | | 9.7% | |
| | | | | | |
| | | Utilities | | | | | | | | | | | | | |
| | | | | | | |
| | | PacifiCorp | | | | 2.95% due 06/01/2023 | | | 250,000 | | | | 264,033 | | | | 2.3% | |
| | | | | | | |
| | | Exelon Generation | | | | 3.25% due 06/01/2025 | | | 300,000 | | | | 323,014 | | | | 2.8% | |
| | | | | | | |
| | | | | | | | | | | | | 587,047 | | | | 5.1% | |
| | | | | | |
| | | | | | | | | | | | | | | | | | |
| | | | | | | |
| | Total Corporate Bonds | | | | (Cost $7,758,062) | | | | | | | $7,995,912 | | | | 70.0% | |
| | | | | | |
| | | | | | | | | | | | | | | | | | |
| | | | | | | |
| | | Government Bonds – 23.9% | | | | Coupon / Maturity | | Face Amount | | | Market Value | | | Percentage of Net Assets | |
| | | | | | |
| | | United States Treasury Notes | | | | | | | | | | | | | |
| | | | | | | |
| | | United States Treasury Note | | | | 3.625% due 02/15/2021 | | | $800,000 | | | | $805,737 | | | | 7.1% | |
| | | | | | | |
| | | United States Treasury Note | | | | 2.625% due 05/15/2021 | | | 555,000 | | | | 561,460 | | | | 4.9% | |
| | | | | | | |
| | | United States Treasury Note | | | | 2.50% due 08/15/2023 | | | 500,000 | | | | 531,426 | | | | 4.6% | |
| | | | | | | |
| | | United States Treasury Note | | | | 2.875% due 04/30/2025 | | | 750,000 | | | | 834,316 | | | | 7.3% | |
| | | | | | | |
| | | | | | | | | | | | | 2,732,939 | | | | 23.9% | |
| | | | | | |
| | | | | | | | | | | | | | | | | | |
| | | | | | | |
| | Total Government Bonds | | | | (Cost $2,667,017) | | | | | | | $2,732,939 | | | | 23.9% | |
| | | | | | |
| | | | | | | | | | | | | | | | | | | |
| | | | | | |
| | Total investments | | | | (Cost $10,425,079) | | | | | | | $10,728,851 | | | | 93.9% | |
| | | | | | |
| | Other assets (net of liabilities) | | | | | | | | | | | 697,604 | | | | 6.1% | |
| | | | | | |
| | Total net assets | | | | | | | | | | | $11,426,455 | | | | 100.0% | |
| | | | | | | |
| | | | | | | | | | | | | | | | | | |
| | | | | | | | | | | | |
Bond Quality Diversification | | | | | | | | | | | (unaudited) | |
| | | |
| % of Total Net Assets | | | | | | | | | |
| | | |
Rated “AAA” | | | 25.9% | | | ∎ | | | | |  | |
Rated “AA+” | | | 2.3% | | | ∎ | | |
Rated “AA” | | | 1.0% | | | ∎ | | |
Rated “AA-” | | | 2.9% | | | ∎ | | |
Rated “A+” | | | 18.9% | | | ∎ | | |
Rated “A” | | | 4.0% | | | ∎ | | |
Rated “A-” | | | 6.9% | | | ∎ | | |
Rated “BBB+” | | | 18.5% | | | ∎ | | |
Rated “BBB” | | | 10.4% | | | ∎ | | |
Rated “BB-” | | | 3.1% | | | ∎ | | |
| | | |
Other assets (net of liabilities) | | | 6.1% | | | ∎ | | | | | | |
|
| Credit ratings are the lesser of S&P Global Ratings or Moody’s Investors Service. If neither S&P nor Moody’s rate a particular security, that security is categorized as not rated (except for US Treasury securities and securities issued or backed by US agencies which inherit the credit rating for the US government). Ratings range from AAA (highest) to D (lowest). Bonds rated BBB or above are considered investment grade. Credit ratings BB and below are lower-rated securities (junk bonds). Ratings apply to the creditworthiness of the issuers of the underlying securities and not the Fund or its shares. Ratings may be subject to change. | |
| | | | | | | | | | | | |
| | | | | | | |
| The accompanying notes are an integral part of these financial statements. | | Annual Report | | November 30, 2020 | | | | | | | | 9 |
Sextant Short-Term Bond Fund
Statement of Assets and Liabilities
| | | | |
As of November 30, 2020 | |
| | |
| | | | |
| |
Assets | | | | |
| |
Investments in securities, at value
(Cost $10,425,079) | | | $10,728,851 | |
| |
Cash | | | 632,963 | |
| |
Interest receivable | | | 76,579 | |
| |
Receivable for Fund shares sold | | | 3,335 | |
| |
Prepaid expenses | | | 2,249 | |
| | | | |
| |
Total assets | | | 11,443,977 | |
| | | | |
| |
Liabilities | | | | |
| |
Accrued audit expenses | | | 4,955 | |
| |
Accrued advisory fees | | | 4,665 | |
| |
Accrued retirement plan custody fee | | | 3,278 | |
| |
Accrued trustee expenses | | | 1,285 | |
| |
Accrued printing fees | | | 980 | |
| |
Accrued legal expenses | | | 896 | |
| |
Accrued other expenses | | | 688 | |
| |
Accrued Chief Compliance Officer expenses | | | 506 | |
| |
Accrued insurance expenses | | | 228 | |
| |
Distributions payable | | | 41 | |
| | | | |
| |
Total liabilities | | | 17,522 | |
| | | | |
| |
Net Assets | | | $11,426,455 | |
| | |
| | | | |
| | |
Analysis of net assets | | | | |
| |
Paid-in capital (unlimited shares authorized, without par value) | | | $11,142,985 | |
| |
Total distributable earnings | | | 283,470 | |
| | | | |
| |
Net assets applicable to Fund shares outstanding | | | $11,426,455 | |
| | |
| | | | |
Fund shares outstanding | | | 2,210,488 | |
| | |
Net asset value, offering, and redemption price per share | | | $5.17 | |
| | | | | |
Statement of Operations
| | | | |
| Year ended November 30, 2020 | |
| | |
| | | | |
| |
Investment income | | | | |
| |
Interest income | | | $253,135 | |
| | | | |
| |
Total investment income | | | 253,135 | |
| | | | |
| |
Expenses | | | | |
| |
Investment advisory fees | | | 59,198 | |
| |
Filing and registration fees | | | 13,896 | |
| |
Audit fees | | | 8,855 | |
| |
Printing and posting fees | | | 4,409 | |
| |
Legal fees | | | 2,907 | |
| |
Retirement plan custodial fees | | | 3,650 | |
| |
Other expenses | | | 2,061 | |
| |
Trustee fees | | | 3,197 | |
| |
Chief Compliance Officer expenses | | | 2,432 | |
| |
Custodian fees | | | 462 | |
| | | | |
| |
Total gross expenses | | | 101,067 | |
| | | | |
| |
Less adviser fees waived | | | (33,133 | ) |
| |
Less custodian fee credits | | | (462 | ) |
| | | | |
| |
Net expenses | | | 67,472 | |
| | | | |
| |
Net investment income | | | $185,663 | |
| | |
| | | | |
| | |
| | | | |
| |
Net realized loss from investments | | | $(13,445 | ) |
| |
Net increase in unrealized appreciation on investments | | | $203,718 | |
| | | | |
| |
Net gain on investments | | | $190,273 | |
| | |
| | | | |
| | |
Net increase in net assets resulting from operations | | | $375,936 | |
| | | | | |
| | | | | | | | | | | | |
| | | | | | | |
| 10 | | | | | | | | November 30, 2020 | | Annual Report | | The accompanying notes are an integral part of these financial statements. |
Sextant Short-Term Bond Fund
| | | | | | | | |
Statements of Changes in Net Assets | | | Year ended November 30, 2020 | | | | Year ended November 30, 2019 | |
| | | |
Increase (decrease) in net assets from operations | | | | | | | | |
| | |
From operations | | | | | | | | |
| | |
Net investment income | | | $185,663 | | | | $187,802 | |
| | |
Net realized gain (loss) on investment | | | (13,445 | ) | | | 6,528 | |
| | |
Net increase in unrealized appreciation | | | 203,718 | | | | 299,329 | |
| | | | | | | | |
| | |
Net increase in net assets | | | 375,936 | | | | 493,659 | |
| | | | | | | | |
| | |
| | | | | | | | |
| | |
Distributions to shareowners | | | (185,659 | ) | | | (187,268 | ) |
| | |
| | | | | | | | |
| | |
Capital share transactions | | | | | | | | |
| | |
Proceeds from sales of shares | | | 1,277,945 | | | | 1,406,263 | |
| | |
Value of shares issued in reinvestment of dividends | | | 184,987 | | | | 186,358 | |
| | |
Cost of shares redeemed | | | (1,315,643 | ) | | | (1,085,719 | ) |
| | | | | | | | |
| | |
Total capital share transactions | | | 147,289 | | | | 506,902 | |
| | | | | | | | |
| | |
Total increase in net assets | | | 337,566 | | | | 813,293 | |
| | | |
| | | | | | | | |
| | | |
Net assets | | | | | | | | |
| | |
Beginning of year | | | 11,088,889 | | | | 10,275,596 | |
| | |
End of year | | | $11,426,455 | | | | $11,088,889 | |
| | | |
| | | | | | | | |
| | | |
Shares of the Fund sold and redeemed | | | | | | | | |
| | |
Number of shares sold | | | 249,434 | | | | 279,784 | |
| | |
Number of shares issued in reinvestment of dividends | | | 35,964 | | | | 36,950 | |
| | |
Number of shares redeemed | | | (256,821 | ) | | | (215,988 | ) |
| | | | | | | | |
| | |
Net increase in number of shares outstanding | | | 28,577 | | | | 100,746 | |
| | | |
| | | | | | | | |
| | | | | | | | | | | | | | | | | | | | |
Financial Highlights | | | For year ended November 30, | |
| | | | | |
Selected data per share of outstanding capital stock throughout each year: | | | 2020 | | | | 2019 | | | | 2018 | | | | 2017 | | | | 2016 | |
| | | | | | |
Net asset value at beginning of year | | | $5.08 | | | | $4.94 | | | | $5.00 | | | | $5.02 | | | | $5.02 | |
| | | | | |
Income from investment operations | | | | | | | | | | | | | | | | | | | | |
| | | | | |
Net investment income | | | 0.08 | | | | 0.09 | | | | 0.07 | | | | 0.06 | | | | 0.05 | |
| | | | | |
Net gains (losses) on securities (both realized and unrealized) | | | 0.09 | | | | 0.14 | | | | (0.06 | ) | | | (0.02 | ) | | | 0.00 | A |
| | | | | | | | | | | | | | | | | | | | |
| | | | | |
Total from investment operations | | | 0.17 | | | | 0.23 | | | | 0.01 | | | | 0.04 | | | | 0.05 | |
| | | | | | | | | | | | | | | | | | | | |
| | | | | |
Less distributions | | | | | | | | | | | | | | | | | | | | |
| | | | | |
Dividends from net investment income | | | (0.08 | ) | | | (0.09 | ) | | | (0.07 | ) | | | (0.06 | ) | | | (0.05 | ) |
| | | | | |
Distributions from capital gains | | | - | | | | - | | | | (0.00 | )A | | | - | | | | - | |
| | | | | | | | | | | | | | | | | | | | |
| | | | | |
Total distributions | | | (0.08 | ) | | | (0.09 | ) | | | (0.07 | ) | | | (0.06 | ) | | | (0.05 | ) |
| | | | | | | | | | | | | | | | | | | | |
| | | | | |
| | | | | | | | | | | | | | | | | | | | |
| | | | | |
Net asset value at end of year | | | $5.17 | | | | $5.08 | | | | $4.94 | | | | $5.00 | | | | $5.02 | |
| | | | | | |
| | | | | | | | | | | | | | | | | | | | |
Total return | | | 3.46% | | | | 4.64% | | | | 0.26% | | | | 0.87% | | | | 1.06% | |
| | | | | | |
Ratios / supplemental data | | | | | | | | | | | | | | | | | | | | |
| | | | | |
Net assets ($000), end of year | | | $11,426 | | | | $11,089 | | | | $10,276 | | | | $10,705 | | | | $10,326 | |
| | | | | |
Ratio of expenses to average net assets | | | | | | | | | | | | | | | | | | | | |
| | | | | |
Before fee waivers and custodian fee credits | | | 0.90% | | | | 0.87% | | | | 0.91% | | | | 1.01% | | | | 1.15% | |
| | | | | |
After fee waivers | | | 0.60% | | | | 0.61% | | | | 0.61% | | | | 0.68% | | | | 0.76% | |
| | | | | |
After fee waivers and custodian fee credits | | | 0.60% | | | | 0.60% | | | | 0.60% | | | | 0.68% | | | | 0.75% | |
| | | | | |
Ratio of net investment income after fee waivers and custodian fee credits to average net assets | | | 1.64% | | | | 1.75% | | | | 1.44% | | | | 1.26% | | | | 1.05% | |
| | | | | |
Portfolio turnover rate | | | 36% | | | | 32% | | | | 36% | | | | 31% | | | | 11% | |
| | | | | | |
| | | | | | | | | | | | | | | | | | | | |
| A | Amount is less than $0.01 |
| | | | | | | | | | | | |
| | | | | | | |
| The accompanying notes are an integral part of these financial statements. | | Annual Report | | November 30, 2020 | | | | | | | | 11 |
Sextant Bond Income Fund
| | |
Performance Summary | | (unaudited) |
| | | | | | | | | | | | | | | | |
Average Annual Total Returns as of November 30, 2020 | |
| | | | | |
| | | 1 Year | | | 5 Year | | | 10 Year | | | Expense Ratio1 | |
| | | | |
Sextant Bond Income Fund | | | 8.48% | | | | 5.20% | | | | 4.33% | | | | 0.71% | |
| | | | |
FTSE US Broad Investment-Grade Bond Index | | | 8.61% | | | | 4.67% | | | | 2.88% | | | | n/a | |
Growth of $10,000
| | |
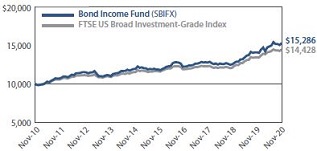
| | comparison of any mutual fund to a market index must be made bearing in mind that the index is expense-free. Conversely, the fund will (1) be actively managed; (2) have an objective other than mirroring the index, such as limiting risk; (3) bear transaction and other costs; (4) stand ready to buy and sell its securities to shareowners on a daily basis; and (5) provide a wide range of services. The graph compares $10,000 invested in the Fund on November 30, 2010, to an identical amount invested in the FTSE US Broad Investment-Grade Bond Index, a broad-based index of medium and long-term investment grade bond prices. The graph shows that an investment in the Fund would have risen to $15,286 versus $14,428 in the index. |
Past performance does not guarantee future results. The “Growth of $10,000” graph and “Average Annual Returns” performance table assume the reinvestment of dividends and capital gains. They do not reflect the deduction of taxes that a shareowner might pay on fund distributions or the redemption of fund shares.
| 1 | By regulation, the expense ratio shown in this table is as stated in the Fund’s most recent prospectus which is dated March 27, 2020, and incorporates results for the fiscal year ended November 30, 2019, before fee waivers. The expense ratio shown in the most recent prospectus after fee waivers was 0.65%. The ratio presented in this table differs from expense ratios shown elsewhere in this report as they represent different periods. |
Fund Objective
The objective of the Bond Income Fund is current income.
| | | | |
Top 10 Holdings | | | | |
| |
| % of Total Net Assets | |
| |
United States Treasury Bond (4.25% due 05/15/2039) | | | 8.2% | |
| |
United States Treasury Bond (3.375% due 11/15/2048) | | | 5.7% | |
| |
United States Treasury Bond (5.375% due 02/15/2031) | | | 4.1% | |
| |
Apple (4.50% due 02/23/2036) | | | 3.4% | |
| |
Microsoft (4.20% due 11/03/2035) | | | 3.3% | |
| |
Intel (4.00% due 12/15/2032) | | | 3.2% | |
| |
Burlington Northern Santa Fe (5.05% due 03/01/2041) | | | 3.1% | |
| |
Praxair (3.55% due 11/07/2042) | | | 3.0% | |
| |
United States Treasury Note (3.625% due 02/15/2021) | | | 2.7% | |
| |
Puget Sound Energy (4.434% due 11/15/2041) | | | 2.6% | |
| | | | | | | | | | | | |
Portfolio Diversification | | | | | | | | | | | | |
| | | |
| % of Total Net Assets | | | | | | | |
| | | |
Government Bonds | | | 28.4% | | | ∎ | | | | | 
| |
Health Care | | | 11.7% | | | ∎ | | |
Technology | | | 10.5% | | | ∎ | | |
Utilities | | | 7.1% | | | ∎ | | |
Industrials | | | 6.7% | | | ∎ | | |
Financials | | | 5.9% | | | ∎ | | |
Consumer Staples | | | 5.2% | | | ∎ | | |
Energy | | | 5.2% | | | ∎ | | |
Consumer Discretionary | | | 4.5% | | | ∎ | | |
Materials | | | 3.0% | | | ∎ | | |
Municipal Bonds | | | 1.2% | | | ∎ | | |
Other assets (net of liabilities) | | | 10.6% | | | ∎ | | |
| | | | | | | | | | |
| | | | | | |
| 12 | | | | | | | | November 30, 2020 | | Annual Report |
Sextant Bond Income Fund
| | |
Discussion of Fund Performance | | (unaudited) |
(photo omitted)
Fiscal Year 2020
For the 12 months ended November 30, 2020, the Sextant Bond Income Fund returned 8.48%, higher than its benchmark, the FTSE US BIG Bond Index, which returned 7.47%. For the five years ended November 30, 2020, the Fund provided an annualized total return of 5.20%, compared to the 4.41% annualized return for the Index. For the year, the Fund’s net assets rose 12.74% from $12.46 million to $14.05 million. The Fund’s net asset value per share rose from $5.34 to $5.65. The Fund’s 30-day yield was 1.18%, and its unsubsidized 30-day yield was 1.11%.
Factors Affecting Past Performance
2020 was a year of extraordinary change and challenge. Volatility hit the markets in the first part of the year with the spread of COVID-19 including a massive shift in the Treasury curve, and both a severe widening then tightening of corporate spreads. At the end of March, spreads of corporate bonds hit their widest levels in 20 years1 requiring intervention by the Federal Reserve. Since that time, spreads have tightened significantly as the result of several factors. The Fed has provided a great deal of support to the market in the form of cutting interest rates to 0%-0.25%, providing liquidity to money market funds, and purchasing bonds in the secondary market. Corporate yields have tightened across the curve in the past year, but most markedly in the investment-grade universe. The Fund’s focus on investment-grade securities contributed overall to positive performance.
Change in Corporate Yield Curve 11/29/19 vs 11/30/20
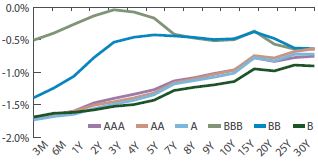
Over the past year long-dated bonds generally performed better, with the Bloomberg Barclays US Aggregate 10+ Years Index returning 15.01%, with decreasing returns down the curve. The Fund had an average maturity of 12.37 at fiscal year-end with 65.55% outside of 10 years. The FTSE US BIG Bond Index had an average maturity of 7.59 years, which is a significant contributor to the performance differential. Fund investments focused on higher-grade companies with expected revenue stability and financial buffers throughout the coronavirus lockdowns.
However, despite the low yields, risk remained present in the market with defaults and downgrades increasing due to unprecedented economic challenges. Throughout the year, the Fund engaged in defensive positioning, including ending the year with 10.6% in cash. The higher percentage of cash will allow the Fund to exploit any forthcoming opportunities.
Looking Forward
There is no shortage of possible events that could upset the current market stability. In the immediate future we face uncertainties about vaccine rollout timing, further government stimulus, and the economic implications of state and local budget deficits. In the longer-term, we also have to consider the potential for inflation. With the Federal Reserve’s announcement that it will target an average inflation rate of 2% and in so doing allow for inflation to run “moderately above 2% for some time,” we will continue to consider the implications of this policy shift. Credit quality will be a focus in coming months as record-low yields continue to belie the underlying credit risks in the market. We will view Fund holdings and potential investments with increased scrutiny due to the heightened risk of downgrades and unprecedented economic challenges that lie before us. As the crisis has been unfolding, we have been focusing our credit research in “BBB” rated corporate bonds, paying special attention to corporate liquidity and flexibility. Our goal has always been to choose good companies and invest through cycles. We are continuously monitoring unfolding events utilizing our robust security selection process which emphasizes high-quality operations and financial resiliency, searching for new opportunities that will contribute to the Fund’s mandate of current income.
Management Fee Calculations
The Sextant Bond Income Fund calculates the performance part of its management fee by comparing the Fund’s return to the return of Morningstar’s™ Long-Term Bond category. The Fund’s 12-month return of 8.48% was more than 2% below the Morningstar™ category average of 13.45% at month-end November 30, 2020. Therefore, the basic annual management fee of 0.50% was decreased by 0.20% to 0.30% for the month of December 2020. Note that the management fee is partially waived due to the adviser’s cap on total Fund expenses.
| 1 | Sekera, Dave.Corporate Bonds Stand Out in Second Quarter. Morningstar, July 8, 2020. https://www.morningstar.com/articles/991119/article |
| | | | | | | | | | |
| | | | | | |
| Annual Report | | November 30, 2020 | | | | | | | | 13 |
Sextant Bond Income Fund
| | | | | | | | | | | | | | | | | | |
| | | Schedule of Investments | | | | | | | | | | | | As of November 30, 2020 | |
| | | | | | | |
| | | Corporate Bonds – 59.8% | | | | Coupon / Maturity | | Face Amount | | | Market Value | | | Percentage of Net Assets | |
| | | | | | |
| | | Consumer Discretionary | | | | | | | | | | | | | |
| | | | | | | |
| | | Home Depot Inc | | | | 5.875% due 12/16/2036 | | | $200,000 | | | | $304,344 | | | | 2.1% | |
| | | | | | | |
| | | Lowe’s | | | | 5.80% due 10/15/2036 | | | 250,000 | | | | 333,014 | | | | 2.4% | |
| | | | | | | |
| | | | | | | | | | | | | 637,358 | | | | 4.5% | |
| | | | | | |
| | | Consumer Staples | | | | | | | | | | | | | |
| | | | | | | |
| | | Kimberly Clark | | | | 5.30% due 03/01/2041 | | | 100,000 | | | | 147,205 | | | | 1.0% | |
| | | | | | | |
| | | Procter & Gamble | | | | 5.50% due 02/01/2034 | | | 200,000 | | | | 289,107 | | | | 2.1% | |
| | | | | | | |
| | | Unilever Capital | | | | 5.90% due 11/15/2032 | | | 200,000 | | | | 294,306 | | | | 2.1% | |
| | | | | | | |
| | | | | | | | | | | | | 730,618 | | | | 5.2% | |
| | | | | | |
| | | Energy | | | | | | | | | | | | | |
| | | | | | | |
| | | Baker Hughes | | | | 6.875% due 01/15/2029 | | | 100,000 | | | | 130,680 | | | | 1.0% | |
| | | | | | | |
| | | Canadian Natural Resources | | | | 6.45% due 06/30/2033 | | | 225,000 | | | | 283,106 | | | | 2.0% | |
| | | | | | | |
| | | Statoil | | | | 7.15% due 01/15/2029 | | | 224,000 | | | | 310,985 | | | | 2.2% | |
| | | | | | | |
| | | | | | | | | | | | | 724,771 | | | | 5.2% | |
| | | | | | |
| | | Financials | | | | | | | | | | | | | |
| | | | | | | |
| | | Affiliated Managers Group | | | | 3.50% due 08/01/2025 | | | 250,000 | | | | 277,388 | | | | 2.0% | |
| | | | | | | |
| | | Bank Of New York Mellon MTN | | | | 3.30% due 08/23/2029 | | | 250,000 | | | | 285,950 | | | | 2.0% | |
| | | | | | | |
| | | UBS AG Stamford CT | | | | 7.75% due 09/01/2026 | | | 200,000 | | | | 258,285 | | | | 1.9% | |
| | | | | | | |
| | | | | | | | | | | | | 821,623 | | | | 5.9% | |
| | | | | | |
| | | Health Care | | | | | | | | | | | | | |
| | | | | | | |
| | | Becton Dickinson | | | | 6.70% due 08/01/2028 | | | 240,000 | | | | 309,108 | | | | 2.2% | |
| | | | | | | |
| | | Johnson & Johnson | | | | 4.95% due 05/15/2033 | | | 226,000 | | | | 314,605 | | | | 2.2% | |
| | | | | | | |
| | | Johnson & Johnson | | | | 5.85% due 07/15/2038 | | | 50,000 | | | | 77,177 | | | | 0.6% | |
| | | | | | | |
| | | Medtronic Inc | | | | 4.375% due 03/15/2035 | | | 260,000 | | | | 356,708 | | | | 2.5% | |
| | | | | | | |
| | | Merck & Co. | | | | 6.50% due 12/01/2033 | | | 215,000 | | | | 336,986 | | | | 2.4% | |
| | | | | | | |
| | | Teva Pharmaceutical | | | | 3.65% due 11/10/2021 | | | 250,000 | | | | 251,875 | | | | 1.8% | |
| | | | | | | |
| | | | | | | | | | | | | 1,646,459 | | | | 11.7% | |
| | | | | | |
| | | Industrials | | | | | | | | | | | | | |
| | | | | | | |
| | | Burlington Northern Santa Fe | | | | 5.05% due 03/01/2041 | | | 310,000 | | | | 435,991 | | | | 3.1% | |
| | | | | | | |
| | | Deere & Co. | | | | 8.10% due 05/15/2030 | | | 95,000 | | | | 144,859 | | | | 1.0% | |
| | | | | | | |
| | | United Technologies | | | | 6.05% due 06/01/2036 | | | 250,000 | | | | 359,152 | | | | 2.6% | |
| | | | | | | |
| | | | | | | | | | | | | 940,002 | | | | 6.7% | |
Continued on next page.
| | | | | | | | | | | | |
| | | | | | | |
| 14 | | | | | | | | November 30, 2020 | | Annual Report | | The accompanying notes are an integral part of these financial statements. |
Sextant Bond Income Fund
| | | | | | | | | | | | | | | | | | |
| | | Schedule of Investments | | | | | | | | | | | | As of November 30, 2020 | |
| | | | | | | |
| | | Corporate Bonds – 59.8% | | | | Coupon / Maturity | | Face Amount | | | Market Value | | | Percentage of Net Assets | |
| | | | | | |
| | | Materials | | | | | | | | | | | | | |
| | | | | | | |
| | | Praxair | | | | 3.55% due 11/07/2042 | | | $350,000 | | | | $422,339 | | | | 3.0% | |
| | | | | | | |
| | | | | | | | | | | | | 422,339 | | | | 3.0% | |
| | | | | | |
| | | Technology | | | | | | | | | | | | | |
| | | | | | | |
| | | Apple | | | | 4.50% due 02/23/2036 | | | 350,000 | | | | 475,260 | | | | 3.4% | |
| | | | | | | |
| | | Intel | | | | 4.00% due 12/15/2032 | | | 360,000 | | | | 450,711 | | | | 3.2% | |
| | | | | | | |
| | | Microsoft | | | | 4.20% due 11/03/2035 | | | 350,000 | | | | 464,986 | | | | 3.3% | |
| | | | | | | |
| | | Microsoft | | | | 5.30% due 02/08/2041 | | | 50,000 | | | | 77,271 | | | | 0.6% | |
| | | | | | | |
| | | | | | | | | | | | | 1,468,228 | | | | 10.5% | |
| | | | | | |
| | | Utilities | | | | | | | | | | | | | |
| | | | | | | |
| | | Alabama Power | | | | 4.15% due 08/15/2044 | | | 200,000 | | | | 252,875 | | | | 1.8% | |
| | | | | | | |
| | | Entergy Louisiana | | | | 5.40% due 11/01/2024 | | | 200,000 | | | | 235,573 | | | | 1.7% | |
| | | | | | | |
| | | Florida Power & Light | | | | 5.95% due 10/01/2033 | | | 100,000 | | | | 145,030 | | | | 1.0% | |
| | | | | | | |
| | | Puget Sound Energy | | | | 4.434% due 11/15/2041 | | | 300,000 | | | | 364,568 | | | | 2.6% | |
| | | | | | | |
| | | | | | | | | | | | | 998,046 | | | | 7.1% | |
| | | | | | |
| | | | | | | | | | | | | | | | | | |
| | | | | | | |
| | Total Corporate Bonds | | | | (Cost $7,279,218) | | | | | | | $8,389,444 | | | | 59.8% | |
| | | | | | |
| | | | | | | | | | | | | | | | | | |
| | | | | | | |
| | | Government Bonds – 28.4% | | | | Coupon / Maturity | | Face Amount | | | Market Value | | | Percentage of Net Assets | |
| | | | | | |
| | | Foreign Government Bonds | | | | | | | | | | | | | |
| | | | | | | |
| | | Quebec Canada Yankee | | | | 7.125% due 02/09/2024 | | | $175,000 | | | | $211,395 | | | | 1.5% | |
| | | | | | | |
| | | | | | | | | | | | | 211,395 | | | | 1.5% | |
| | | | | | |
| | | United States Treasury Bonds | | | | | | | | | | | | | |
| | | | | | | |
| | | United States Treasury Bond | | | | 5.25% due 02/15/2029 | | | 170,000 | | | | 231,984 | | | | 1.7% | |
| | | | | | | |
| | | United States Treasury Bond | | | | 6.25% due 05/15/2030 | | | 75,000 | | | | 112,649 | | | | 0.8% | |
| | | | | | | |
| | | United States Treasury Bond | | | | 3.125% due 11/15/2041 | | | 145,000 | | | | 192,300 | | | | 1.4% | |
| | | | | | | |
| | | United States Treasury Bond | | | | 3.375% due 11/15/2048 | | | 560,000 | | | | 798,350 | | | | 5.7% | |
| | | | | | | |
| | | United States Treasury Bond | | | | 6.125% due 08/15/2029 | | | 225,000 | | | | 328,210 | | | | 2.3% | |
| | | | | | | |
| | | United States Treasury Bond | | | | 5.375% due 02/15/2031 | | | 400,000 | | | | 579,516 | | | | 4.1% | |
| | | | | | | |
| | | United States Treasury Bond | | | | 4.25% due 05/15/2039 | | | 770,000 | | | | 1,158,188 | | | | 8.2% | |
| | | | | | | |
| | | | | | | | | | | | | 3,401,197 | | | | 24.2% | |
| | | | | | |
| | | United States Treasury Notes | | | | | | | | | | | | | |
| | | | | | | |
| | | United States Treasury Note | | | | 3.625% due 02/15/2021 | | | 370,000 | | | | 372,653 | | | | 2.7% | |
| | | | | | | |
| | | | | | | | | | | | | 372,653 | | | | 2.7% | |
| | | | | | |
| | | | | | | | | | | | | | | | | | |
| | | | | | | |
| | Total Government Bonds | | | | (Cost $3,601,296) | | | | | | | $3,985,245 | | | | 28.4% | |
Continued on next page.
| | | | | | | | | | | | |
| | | | | | | |
| The accompanying notes are an integral part of these financial statements. | | Annual Report | | November 30, 2020 | | | | | | | | 15 |
Sextant Bond Income Fund
| | | | | | | | | | | | | | | | | | |
| | | Schedule of Investments | | | | | | | | | | | | As of November 30, 2020 | |
| | | | | | | |
| | | Municipal Bonds – 1.2% | | | | Coupon / Maturity | | Face Amount | | | Market Value | | | Percentage of Net Assets | |
| | | | | | |
| | | Municipal Leases | | | | | | | | | | | | | |
| | | | | | | |
| | | Oklahoma City Fin Auth Ed Lease Rev | | | | 6.60% due 09/01/2022 | | | $160,000 | | | | $174,317 | | | | 1.2% | |
| | | | | | | |
| | | | | | | | | | | | | 174,317 | | | | 1.2% | |
| | | | | | |
| | | | | | | | | | | | | | | | | | |
| | | | | | | |
| | Total Municipal Bonds | | | | (Cost $159,718) | | | | | | | $174,317 | | | | 1.2% | |
| | | | | | |
| | | | | | | | | | | | | | | | | | | |
| | | | | | |
| | Total investments | | | | (Cost $11,040,232) | | | | | | | $12,549,006 | | | | 89.4% | |
| | | | | | |
| | Other assets (net of liabilities) | | | | | | | | | | | 1,493,140 | | | | 10.6% | |
| | | | | | |
| | | Total net assets | | | | | | | | | | | $14,042,146 | | | | 100.0% | |
| | | | | | |
| | | | | | | | | | | | | | | | | | |
| | | | | | | | | | | | |
Bond Quality Diversification | | | | | | | | | | | (unaudited) | |
| | | |
| % of Total Net Assets | | | | | | | | | |
| | | |
Rated “AAA” | | | 33.6% | | | ∎ | | | | | 
| |
Rated “AA+” | | | 3.4% | | | ∎ | | |
Rated “AA-” | | | 8.2% | | | ∎ | | |
Rated “A+” | | | 9.4% | | | ∎ | | |
Rated “A” | | | 14.3% | | | ∎ | | |
Rated “A-” | | | 8.2% | | | ∎ | | |
Rated “BBB+” | | | 6.3% | | | ∎ | | |
Rated “BBB” | | | 4.2% | | | ∎ | | |
Rated “BB-” | | | 1.8% | | | ∎ | | |
Other assets (net of liabilities) | | | 10.6% | | | ∎ | | |
|
| Credit ratings are the lesser of S&P Global Ratings or Moody’s Investors Service. If neither S&P nor Moody’s rate a particular security, that security is categorized as not rated (except for US Treasury securities and securities issued or backed by US agencies which inherit the credit rating for the US government). Ratings range from AAA (highest) to D (lowest). Bonds rated BBB or above are considered investment grade. Credit ratings BB and below are lower-rated securities (junk bonds). Ratings apply to the creditworthiness of the issuers of the underlying securities and not the Fund or its shares. Ratings may be subject to change. | |
| | | | | | | | | | | | |
| | | | | | | |
| 16 | | | | | | | | November 30, 2020 | | Annual Report | | The accompanying notes are an integral part of these financial statements. |
Sextant Bond Income Fund
Statement of Assets and Liabilities
| | | | |
| As of November 30, 2020 | |
| | |
| | | | |
| |
Assets | | | | |
| |
Investments in securities, at value
(Cost $11,040,232) | | | $12,549,006 | |
| |
Cash | | | 1,393,326 | |
| |
Interest receivable | | | 110,458 | |
| |
Prepaid expenses | | | 4,361 | |
| |
Receivable for Fund shares sold | | | 1,270 | |
| |
Other assets | | | 400 | |
| |
Prepaid Chief Compliance Officer expenses Total assets | | | 237 | |
| | | | |
| |
| | | 14,059,058 | |
| | | | |
| |
Liabilities | | | | |
| |
Accrued advisory fees | | | 4,953 | |
| |
Accrued audit expenses | | | 4,213 | |
| |
Accrued retirement plan custody fee | | | 2,767 | |
| |
Distributions payable | | | 1,333 | |
| |
Accrued legal expenses | | | 1,619 | |
| |
Accrued printing fees | | | 926 | |
| |
Accrued other liabilities | | | 564 | |
| |
Accrued trustee expenses | | | 534 | |
| |
Payable for Fund shares redeemed | | | 3 | |
| | | | |
| |
Total liabilities | | | 16,912 | |
| | | | |
| |
Net assets | | | $14,042,146 | |
| | |
| | | | |
| | |
Analysis of net assets | | | | |
| |
Paid-in capital (unlimited shares authorized, without par value) | | | $12,547,645 | |
| |
Total distributable earnings | | | 1,494,501 | |
| | | | |
| |
Net assets applicable to Fund shares outstanding | | | $14,042,146 | |
| | |
| | | | |
Fund shares outstanding | | | 2,486,419 | |
| | |
Net asset value, offering, and redemption price per share | | | $5.65 | |
| | | | | |
Statement of Operations
| | | | |
| Year ended November 30, 2020 | |
| | |
| | | | |
| |
Investment income | | | | |
| |
Interest income | | | $400,163 | |
| | | | |
| |
Total investment income | | | 400,163 | |
| | | | |
| |
Expenses | | | | |
| |
Investment advisory fees | | | 43,569 | |
| |
Filing and registration fees | | | 12,846 | |
| |
Audit fees | | | 7,785 | |
| |
Printing and postage fees | | | 4,323 | |
| |
Legal fees | | | 3,406 | |
| |
Chief Compliance Officer expenses | | | 3,404 | |
| |
Retirement plan custodial fees | | | 3,181 | |
| |
Trustee fees | | | 3,174 | |
| |
Other expenses | | | 2,648 | |
| |
Custodian fees | | | 548 | |
| | | | |
| |
Total gross expenses | | | 84,884 | |
| | | | |
| |
Less adviser fees waived | | | (20,366 | ) |
| |
Less custodian fee credits | | | (548 | ) |
| | | | |
| |
Net expenses | | | 63,970 | |
| | | | |
| |
Net investment income | | | $336,193 | |
| | |
| | | | |
| | |
| | | | |
| |
Net realized loss from investments | | | $(11,587 | ) |
| |
Net increase in unrealized appreciation on investments | | | $757,205 | |
| | | | |
| |
Net gain on investments | | | $745,618 | |
| | |
| | | | |
| | |
Net increase in net assets resulting from operations | | | $1,081,811 | |
| | | | | |
| | | | | | | | | | | | |
| | | | | | | |
| The accompanying notes are an integral part of these financial statements. | | Annual Report | | November 30, 2020 | | | | | | | | 17 |
Sextant Bond Income Fund
| | | | | | | | |
Statements of Changes in Net Assets | | | Year ended November 30, 2020 | | | | Year ended November 30, 2019 | |
| | | |
Increase in net assets from operations | | | | | | | | |
| | |
From operations | | | | | | | | |
| | |
Net investment income | | | $336,193 | | | | $335,013 | |
| | |
Net realized gain (loss) on investments | | | (11,587 | ) | | | 41,830 | |
| | |
Net increase in unrealized appreciation | | | 757,205 | | | | 933,335 | |
| | | | | | | | |
| | |
Net increase in net assets | | | 1,081,811 | | | | 1,310,178 | |
| | | | | | | | |
| | |
| | | | | | | | |
| | |
Distributions to shareowners | | | (335,345 | ) | | | (334,236 | ) |
| | |
| | | | | | | | |
| | |
Capital share transactions | | | | | | | | |
| | |
Proceeds from sales of shares | | | 1,259,745 | | | | 1,865,586 | |
| | |
Value of shares issued in reinvestment of dividends | | | 316,302 | | | | 328,512 | |
| | |
Cost of shares redeemed | | | (733,920 | ) | | | (1,649,526 | ) |
| | | | | | | | |
| | |
Total capital share transactions | | | 842,127 | | | | 544,572 | |
| | | | | | | | |
| | |
Total increase in net assets | | | 1,588,593 | | | | 1,520,514 | |
| | | |
| | | | | | | | |
| | | |
Net assets | | | | | | | | |
| | |
Beginning of year | | | 12,453,553 | | | | 10,933,039 | |
| | |
End of year | | | $14,042,146 | | | | $12,453,553 | |
| | | |
| | | | | | | | |
| | | |
Shares of the Fund sold and redeemed | | | | | | | | |
| | |
Number of shares sold | | | 230,919 | | | | 361,579 | |
| | |
Number of shares issued in reinvestment of dividends | | | 57,146 | | | | 63,399 | |
| | |
Number of shares redeemed | | | (135,160 | ) | | | (327,334 | ) |
| | | | | | | | |
| | |
Net increase in number of shares outstanding | | | 152,905 | | | | 97,644 | |
| | | |
| | | | | | | | |
| | | | | | | | | | | | | | | | | | | | |
Financial Highlights | | | | | | | For year ended November 30, | | | | | |
| | | | | |
Selected data per share of outstanding capital stock throughout each year: | | | 2020 | | | | 2019 | | | | 2018 | | | | 2017 | | | | 2016 | |
| | | | | | |
Net asset value at beginning of year | | | $5.34 | | | | $4.89 | | | | $5.14 | | | | $5.07 | | | | $5.07 | |
| | | | | |
Income from investment operations | | | | | | | | | | | | | | | | | | | | |
| | | | | |
Net investment income | | | 0.14 | | | | 0.15 | | | | 0.16 | | | | 0.16 | | | | 0.15 | |
| | | | | |
Net gains (losses) on securities (both realized and unrealized) | | | 0.31 | | | | 0.45 | | | | (0.25 | ) | | | 0.07 | | | | 0.00 | A |
| | | | | | | | | | | | | | | | | | | | |
| | | | | |
Total from investment operations | | | 0.45 | | | | 0.60 | | | | (0.09 | ) | | | 0.23 | | | | 0.15 | |
| | | | | | | | | | | | | | | | | | | | |
| | | | | |
Less distributions | | | | | | | | | | | | | | | | | | | | |
| | | | | |
Dividends from net investment income | | | (0.14 | ) | | | (0.15 | ) | | | (0.16 | ) | | | (0.16 | ) | | | (0.15 | ) |
| | | | | | | | | | | | | | | | | | | | |
| | | | | |
Total distributions | | | (0.14 | ) | | | (0.15 | ) | | | (0.16 | ) | | | (0.16 | ) | | | (0.15 | ) |
| | | | | | | | | | | | | | | | | | | | |
| | | | | |
| | | | | | | | | | | | | | | | | | | | |
| | | | | |
Net asset value at end of year | | | $5.65 | | | | $5.34 | | | | $4.89 | | | | $5.14 | | | | $5.07 | |
| | | | | | |
| | | | | | | | | | | | | | | | | | | | |
Total return | | | 8.48% | | | | 12.45% | | | | (1.78 | )% | | | 4.51% | | | | 2.91% | |
| | | | | | |
Ratios / supplemental data | | | | | | | | | | | | | | | | | | | | |
| | | | | |
Net assets ($000), end of year | | | $14,042 | | | | $12,454 | | | | $10,933 | | | | $9,496 | | | | $9,703 | |
| | | | | |
Ratio of expenses to average net assets | | | | | | | | | | | | | | | | | | | | |
| | | | | |
Before fee waivers and custodian fee credits | | | 0.63% | | | | 0.71% | | | | 0.86% | | | | 0.98% | | | | 1.01% | |
| | | | | |
After fee waivers | | | 0.48% | | | | 0.55% | | | | 0.66% | | | | 0.78% | | | | 0.89% | |
| | | | | |
After fee waivers and custodian fee credits | | | 0.48% | | | | 0.55% | | | | 0.65% | | | | 0.78% | | | | 0.88% | |
| | | | | |
Ratio of net investment income after fee waivers and custodian fee credits to average net assets | | | 2.50% | | | | 2.96% | | | | 3.20% | | | | 3.05% | | | | 2.85% | |
| | | | | |
Portfolio turnover rate | | | 13% | | | | 21% | | | | 0% | | | | 4% | | | | 11% | |
| | | | | | |
| | | | | | | | | | | | | | | | | | | | |
| A | Amount is less than $0.01 |
| | | | | | | | | | | | |
| | | | | | | |
| 18 | | | | | | | | November 30, 2020 | | Annual Report | | The accompanying notes are an integral part of these financial statements. |
Sextant Core Fund
| | |
| | |
Performance Summary | | (unaudited) |
| | | | | | | | | | | | | | | | |
Average Annual Total Returns as of November 30, 2020 | |
| | | | | |
| | | 1 Year | | | 5 Year | | | 10 Year | | | Expense Ratio1 | |
| | | | |
Sextant Core Fund | | | 9.72% | | | | 7.80% | | | | 6.34% | | | | 0.90% | |
| | | | |
Dow Jones Moderate US Portfolio Index | | | 11.02% | | | | 8.38% | | | | 7.68% | | | | n/a | |
Growth of $10,000
| | |
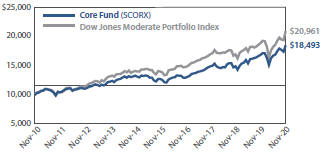
| | Comparison of any mutual fund to a market index must be made bearing in mind that the index is expense-free. Conversely, the fund will (1) be actively managed; (2) have an objective other than mirroring the index, such as limiting risk; (3) bear transaction and other costs; (4) stand ready to buy and sell its securities to shareowners on a daily basis; and (5) provide a wide range of services. The graph compares $10,000 invested in the Fund on November 30, 2010, to an identical amount invested in the Dow Jones Moderate US Portfolio Index, a broad-based index of stock and bond prices. The graph shows that an investment in the Fund would have risen to $18,493 versus $20,961 in the index. |
Past performance does not guarantee future results. The “Growth of $10,000” graph and “Average Annual Returns” performance table assume the reinvestment of dividends and capital gains. They do not reflect the deduction of taxes that a shareowner might pay on fund distributions or the redemption of fund shares.
1 By regulation, the expense ratio shown in this table is as stated in the Fund’s most recent prospectus, which is dated March 27, 2020, and incorporates results for the fiscal year ended November 30, 2019. The ratio presented in this table differs from expense ratios shown elsewhere in this report as they represent different periods.
Fund Objective
The objectives of the Core Fund are long-term appreciation and capital preservation.
| | | | | | | | |
Top 10 Holdings | | | | | | | | |
| | |
| | | % of Total Net Assets | |
| |
United States Treasury Bond (6.25% due 08/15/2023) | | | | 2.7% | |
| | |
Welltower (4.25% due 04/15/2028) | | | | | | | 2.1% | |
| |
United States Treasury Note (2.75% due 11/15/2023) | | | | 2.0% | |
| | |
BRKHEC (6.00% due 01/15/2039) | | | | | | | 2.0% | |
| | |
Alphabet, Class A2 | | | | | | | 1.8% | |
| | |
Virtu Financial | | | | | | | 1.8% | |
| | |
VF | | | | | | | 1.8% | |
| | |
Lowe’s (4.25% due 09/15/2044) | | | | | | | 1.6% | |
| | |
NextEra Energy | | | | | | | 1.6% | |
| | |
Abbott Laboratories | | | | | | | 1.5% | |
| | | | | | | | | | | | |
Asset Allocation | | | | | | | | | | | | |
| | | |
| % of Total Net Assets | | | | | | | | | |
| | | |
Equity Securities | | | 61.2% | | | ∎ | | | | |  | |
Fixed Income Securities | | | 26.6% | | | ∎ | | |
Other assets (net of liabilities) | | | 12.2% | | | ∎ | | |
| | | | | | | | |
Portfolio Diversification | | | | | | | | |
| |
| % of Total Net Assets | |
| | |
Sectors | | | Equity | | | | Fixed Income | |
| | |
Technology | | | 13.1% | | | | 1.8% | |
| | |
Health Care | | | 10.8% | | | | 2.9% | |
| | |
Consumer Discretionary | | | 7.5% | | | | 2.3% | |
| | |
Industrials | | | 6.6% | | | | 2.7% | |
| | |
Government Bonds | | | 0.0% | | | | 9.3% | |
| | |
Financials | | | 5.8% | | | | 2.7% | |
| | |
Utilities | | | 4.0% | | | | 2.0% | |
| | |
Communications | | | 4.6% | | | | 1.1% | |
| | |
Materials | | | 4.5% | | | | 0.0% | |
| | |
Consumer Staples | | | 4.3% | | | | 0.0% | |
| | |
Municipal Bonds | | | 0.0% | | | | 1.8% | |
| | |
Total | | | 61.2% | | | | 26.6% | |
| | | | | | | | | | |
| | | | | | |
| Annual Report | | November 30, 2020 | | | | | | | | 19 |
Sextant Core Fund
| | |
Discussion of Fund Performance | | (unaudited) |
Fiscal Year 2020
(photo omitted)
For the volatile year of 2020, the Sextant Core Fund produced a one-year return of 9.72% as of November 30, 2020. The Fund’s benchmark, the Dow Jones Moderate Portfolio Index, returned 11.02% for the same period. The Fund generally outperformed the benchmark during periods of market decline and underperformed during periods of appreciation. At fiscal year-end, the Fund recorded a 30-day yield of 0.95%. For the year, the Fund reported turnover of 19% and carried a tax-loss position into fiscal 2021.
(photo omitted)
Factors Affecting Past Performance
Equities
The Sextant Core Fund’s mandate allocates a 60% weight in equity securities, with two-thirds being US-domiciled companies and one-third foreign-domiciled companies. The Fund generally holds equity positions in larger companies with strong balance sheets; the average market capitalization of positions held by the Fund was $200 billion with 24% total debt to market capitalization at fiscal year-end. During the year, the Fund reduced the number of equity positions and increased the average position size. The Fund’s quarterly average equity allocation for the year was 61.5%, a 1.0% average position size.
The Health Care sector began the year as the largest sector weighting with 20.0% of the equity portion of the portfolio. Positive contributors from the Materials sector were offset by those from the Energy sector. The Financials sector reported mixed results, detracting from performance in the first half of the year, with a second half rebound resulting in two top 10 contributors for the year. The Technology sector contributed six of the top 10 performers for the year and ended as the largest sector exposure at 14.9%, followed by Health Care at 13.7%.
Fixed Income
The Fund’s mandate allocates a 40% weight in investment-grade fixed-income securities including government and convertible bonds, money-market instruments, and cash. US interest rates plunged amid the economic disruptions and monetary policy response caused by the coronavirus pandemic, ending the fiscal year at or near record lows. The Federal Reserve appears committed to maintaining a very accommodative monetary policy for an extended period, even if inflation should pick up. To the extent future policies include an implicit or explicit attempt to cap longer-term interest rates in the face of building inflation, the returns of bonds in real terms (i.e., adjusted for inflation) could still suffer relative to investments that are somewhat more resilient to inflation pressures such as real estate, commodity companies, and precious metals. The current low yields of bonds appear attractive only in scenarios that would be dire for other asset classes, such as a deep recession or depression and deflation. Consequently, the cash portion of the bond allocation is above historical levels. Nonetheless, part of the reasoning of investing in “balanced” funds such as the Sextant Core Fund is to help balance such economic risks with the safety of the contractual payment schedule of high-quality bonds.
Looking Forward
The US equity market ended 2020 on a positive note, and investors look now into 2021 with expectations of improved pandemic and economic conditions supported by coordinated government stimulus. The US capital markets now appear to discount continued loose monetary policy combined with either loose (divided Congress) or looser (unified) fiscal policy. Year-over-year economic and corporate earnings comparisons will become easier in mid-2021, supporting an improving growth outlook and potential inflation. Offsets to the loose/looser policies, including the debt overhang, likely higher taxation, increased regulation, crowding out of private investment, and continued economic lockdown, attract less attention for now. At present, tailwinds appear stronger than headwinds.
Management Fee Calculations
The Sextant Core Fund calculates the performance part of its management fee by comparing the Fund’s return to the return of Morningstar’s™ Allocation – 50% to 70% Equity category. The Fund’s 12-month return of 9.72% was less than 1% below the Morningstar™ category average of 10.25% as of November 30, 2020. Therefore, the basic annual management fee of 0.50% remained unchanged for the month of December 2020.
| | | | | | | | | | |
| | | | | | |
| 20 | | | | | | | | November 30, 2020 | | Annual Report |
Sextant Core Fund
| | | | | | | | | | | | | | | | | | | | | | |
| | | Schedule of Investments | | | | | | | | | | | | | | | As of November 30, 2020 | |
| | | | | | | | |
| | | Common Stocks – 61.2% | | | | Number of Shares | | | Cost | | | Market Value | | | Country1 | | Percentage of Net Assets | |
| | | | | | | |
| | | Communications | | | | | | | | | | | | | | | | |
| | | | | | | | |
| | | Internet Media | | | | | | | | | | | | | | | | |
| | | | | | | | |
| | | Alphabet, Class A2 | | | | | 200 | | | | $180,424 | | | | $350,880 | | | United States | | | 1.8% | |
| | | | | | | | |
| | | Telecom Carriers | | | | | | | | | | | | | | | | |
| | | | | | | | |
| | | BCE | | | | | 4,000 | | | | 168,153 | | | | 173,440 | | | Canada | | | 0.9% | |
| | | | | | | | |
| | | Telus | | | | | 8,000 | | | | 143,751 | | | | 154,560 | | | Canada | | | 0.8% | |
| | | | | | | | |
| | | Verizon Communications | | | | | 3,300 | | | | 184,440 | | | | 199,353 | | | United States | | | 1.1% | |
| | | | | | | | |
| | | | | | | | | | | | | | | | | | | | | | | |
| | | | | | | | |
| | | | | | | | | | | | 496,344 | | | | 527,353 | | | | | | 2.8% | |
| | | | | | | | |
| | | | | | | | | | | 676,768 | | | | 878,233 | | | | | | 4.6% | |
| | | | | | | |
| | | Consumer Discretionary | | | | | | | | | | | | | | | | |
| | | | | | | | |
| | | Apparel, Footwear & Accessory Design | | | | | | | | | | | | | | | | |
| | | | | | | | |
| | | VF | | | | | 4,000 | | | | 258,814 | | | | 333,600 | | | United States | | | 1.8% | |
| | | | | | | | |
| | | Home Improvement | | | | | | | | | | | | | | | | |
| | | | | | | | |
| | | Stanley Black & Decker | | | | | 1,000 | | | | 96,913 | | | | 184,310 | | | United States | | | 0.9% | |
| | | | | | | | |
| | | Home Products Stores | | | | | | | | | | | | | | | | |
| | | | | | | | |
| | | Home Depot | | | | | 600 | | | | 114,158 | | | | 166,446 | | | United States | | | 0.8% | |
| | | | | | | | |
| | | Lowe’s | | | | | 1,400 | | | | 86,638 | | | | 218,148 | | | United States | | | 1.2% | |
| | | | | | | | |
| | | | | | | | | | | | | | | | | | | | | | | |
| | | | | | | | |
| | | | | | | | | | | | 200,796 | | | | 384,594 | | | | | | 2.0% | |
| | | | | | | | |
| | | Specialty Apparel Stores | | | | | | | | | | | | | | | | |
| | | | | | | | |
| | | Industria de Diseno Textil ADR | | | | | 12,000 | | | | 152,848 | | | | 200,640 | | | Spain | | | 1.1% | |
| | | | | | | | |
| | | Ross Stores | | | | | 1,750 | | | | 125,298 | | | | 188,160 | | | United States | | | 1.0% | |
| | | | | | | | |
| | | TJX Companies | | | | | 2,200 | | | | 109,838 | | | | 139,722 | | | United States | | | 0.7% | |
| | | | | | | | |
| | | | | | | | | | | | | | | | | | | | | | | |
| | | | | | | | |
| | | | | | | | | | | | 387,984 | | | | 528,522 | | | | | | 2.8% | |
| | | | | | | | |
| | | | | | | | | | | 944,507 | | | | 1,431,026 | | | | | | 7.5% | |
| | | | | | | |
| | | Consumer Staples | | | | | | | | | | | | | | | | |
| | | | | | | | |
| | | Beverages | | | | | | | | | | | | | | | | |
| | | | | | | | |
| | | PepsiCo | | | | | 1,250 | | | | 126,934 | | | | 180,288 | | | United States | | | 1.0% | |
| | | | | | | | |
| | | Household Products | | | | | | | | | | | | | | | | |
| | | | | | | | |
| | | Procter & Gamble | | | | | 1,150 | | | | 93,040 | | | | 159,701 | | | United States | | | 0.8% | |
| | | | | | | | |
| | | Unilever ADR | | | | | 2,900 | | | | 132,633 | | | | 177,074 | | | United Kingdom | | | 0.9% | |
| | | | | | | | |
| | | | | | | | | | | | | | | | | | | | | | | |
| | | | | | | | |
| | | | | | | | | | | | 225,673 | | | | 336,775 | | | | | | 1.7% | |
| | | | | | | | |
| | | Packaged Food | | | | | | | | | | | | | | | | |
| | | | | | | | |
| | | McCormick & Co | | | | | 500 | | | | 66,544 | | | | 93,490 | | | United States | | | 0.5% | |
| | | | | | | | |
| | | Nestle ADR | | | | | 1,900 | | | | 147,925 | | | | 211,052 | | | Switzerland | | | 1.1% | |
| | | | | | | | |
| | | | | | | | | | | | | | | | | | | | | | | |
| | | | | | | | |
| | | | | | | | | | | | 214,469 | | | | 304,542 | | | | | | 1.6% | |
| | | | | | | | |
| | | | | | | | | | | 567,076 | | | | 821,605 | | | | | | 4.3% | |
Continued on next page.
| | | | | | | | | | | | |
| | | | | | | |
| The accompanying notes are an integral part of these financial statements. | | Annual Report | | November 30, 2020 | | | | | | | | 21 |
Sextant Core Fund
| | | | | | | | | | | | | | | | | | | | | | |
| | | Schedule of Investments | | | | | | | | | | | | | | | As of November 30, 2020 | |
| | | | | | | | |
| | | Common Stocks – 61.2% | | | | Number of Shares | | | Cost | | | Market Value | | | Country1 | | Percentage of Net Assets | |
| | | | | | | |
| | | Financials | | | | | | | | | | | | | | | | |
| | | | | | | | |
| | | Consumer Finance | | | | | | | | | | | | | | | | |
| | | | | | | | |
| | | Mastercard, Class A | | | | | 500 | | | | $137,490 | | | | $168,255 | | | United States | | | 0.9% | |
| | | | | | | | |
| | | Visa | | | | | 900 | | | | 138,794 | | | | 189,315 | | | United States | | | 1.0% | |
| | | | | | | | |
| | | | | | | | | | | | | | | | | | | | | | | |
| | | | | | | | |
| | | | | | | | | | | | 276,284 | | | | 357,570 | | | | | | 1.9% | |
| | | | | | | | |
| | | Institutional Brokerage | | | | | | | | | | | | | | | | |
| | | | | | | | |
| | | Virtu Financial | | | | | 15,000 | | | | 282,564 | | | | 341,850 | | | United States | | | 1.8% | |
| | | | | | | | |
| | | Investment Management | | | | | | | | | | | | | | | | |
| | | | | | | | |
| | | BlackRock | | | | | 400 | | | | 179,467 | | | | 279,340 | | | United States | | | 1.5% | |
| | | | | | | | |
| | | P&C Insurance | | | | | | | | | | | | | | | | |
| | | | | | | | |
| | | Chubb | | | | | 810 | | | | 102,989 | | | | 119,742 | | | Switzerland | | | 0.6% | |
| | | | | | | | |
| | | | | | | | | | | 841,304 | | | | 1,098,502 | | | | | | 5.8% | |
| | | | | | | |
| | | Health Care | | | | | | | | | | | | | | | | |
| | | | | | | | |
| | | Biotech | | | | | | | | | | | | �� | | | | |
| | | | | | | | |
| | | Amgen | | | | | 880 | | | | 141,190 | | | | 195,395 | | | United States | | | 1.0% | |
| | | | | | | | |
| | | CRISPR Therapeutics2 | | | | | 700 | | | | 65,764 | | | | 88,844 | | | Switzerland | | | 0.5% | |
| | | | | | | | |
| | | Viatris Inc2 | | | | | 682 | | | | 9,785 | | | | 11,471 | | | United States | | | 0.1% | |
| | | | | | | | |
| | | | | | | | | | | | | | | | | | | | | | | |
| | | | | | | | |
| | | | | | | | | | | | 216,739 | | | | 295,710 | | | | | | 1.6% | |
| | | | | | | | |
| | | Large Pharma | | | | | | | | | | | | | | | | |
| | | | | | | | |
| | | Bristol-Myers Squibb | | | | | 4,300 | | | | 226,998 | | | | 268,320 | | | United States | | | 1.4% | |
| | | | | | | | |
| | | GlaxoSmithKline ADR | | | | | 5,000 | | | | 209,031 | | | | 183,950 | | | United Kingdom | | | 0.9% | |
| | | | | | | | |
| | | Johnson & Johnson | | | | | 1,515 | | | | 131,720 | | | | 219,190 | | | United States | | | 1.2% | |
| | | | | | | | |
| | | Novartis ADR | | | | | 2,300 | | | | 199,722 | | | | 208,909 | | | Switzerland | | | 1.1% | |
| | | | | | | | |
| | | Novo Nordisk ADR | | | | | 2,450 | | | | 81,372 | | | | 164,469 | | | Denmark | | | 0.9% | |
| | | | | | | | |
| | | Pfizer | | | | | 5,500 | | | | 178,211 | | | | 210,705 | | | United States | | | 1.1% | |
| | | | | | | | |
| | | | | | | | | | | | | | | | | | | | | | | |
| | | | | | | | |
| | | | | | | | | | | | 1,027,054 | | | | 1,255,543 | | | | | | 6.6% | |
| | | | | | | | |
| | | Medical Devices | | | | | | | | | | | | | | | | |
| | | | | | | | |
| | | Abbott Laboratories | | | | | 2,700 | | | | 97,631 | | | | 292,194 | | | United States | | | 1.5% | |
| | | | | | | | |
| | | Medical Equipment | | | | | | | | | | | | | | | | |
| | | | | | | | |
| | | Koninklijke Philips | | | | | 3,877 | | | | 137,793 | | | | 199,743 | | | Netherlands | | | 1.1% | |
| | | | | | | | |
| | | | | | | | | | | 1,479,217 | | | | 2,043,190 | | | | | | 10.8% | |
| | | | | | | |
| | | Industrials | | | | | | | | | | | | | | | | |
| | | | | | | | |
| | | Commercial & Residential Building Equipment & Systems | | | | | | | | | | | | | | | | |
| | | | | | | | |
| | | Honeywell International | | | | | 1,000 | | | | 49,532 | | | | 203,920 | | | United States | | | 1.1% | |
| | | | | | | | |
| | | Johnson Controls International | | | | | 5,550 | | | | 210,386 | | | | 255,522 | | | United States | | | 1.3% | |
| | | | | | | | |
| | | | | | | | | | | | | | | | | | | | | | | |
| | | | | | | | |
| | | | | | | | | | | | 259,918 | | | | 459,442 | | | | | | 2.4% | |
| | | | | | | | |
| | | Flow Control Equipment | | | | | | | | | | | | | | | | |
| | | | | | | | |
| | | Parker Hannifin | | | | | 800 | | | | 78,065 | | | | 213,808 | | | United States | | | 1.1% | |
| | | | | | | | |
| | | Industrial Distribution & Rental | | | | | | | | | | | | | | | | |
| | | | | | | | |
| | | Fastenal | | | | | 2,800 | | | | 64,603 | | | | 138,460 | | | United States | | | 0.8% | |
Continued on next page.
| | | | | | | | | | | | |
| | | | | | | |
| 22 | | | | | | | | November 30, 2020 | | Annual Report | | The accompanying notes are an integral part of these financial statements. |
Sextant Core Fund
| | | | | | | | | | | | | | | | | | | | | | |
| | | Schedule of Investments | | | | | | | | | | | | | | | As of November 30, 2020 | |
| | | | | | | | |
| | | Common Stocks – 61.2% | | | | Number of Shares | | | Cost | | | Market Value | | | Country1 | | Percentage of Net Assets | |
| | | | | | | |
| | | Industrials (continued) | | | | | | | | | | | | | | | | |
| | | | | | | | |
| | | Rail Freight | | | | | | | | | | | | | | | | |
| | | | | | | | |
| | | Canadian National Railway | | | | | 2,000 | | | | $86,366 | | | | $214,100 | | | Canada | | | 1.1% | |
| | | | | | | | |
| | | Kansas City Southern Industries | | | | | 1,200 | | | | 145,800 | | | | 223,404 | | | United States | | | 1.2% | |
| | | | | | | | |
| | | | | | | | | | | | | | | | | | | | | | | |
| | | | | | | | |
| | | | | | | | | | | | 232,166 | | | | 437,504 | | | | | | 2.3% | |
| | | | | | | | |
| | | | | | | | | | | 634,752 | | | | 1,249,214 | | | | | | 6.6% | |
| | | | | | | |
| | | Materials | | | | | | | | | | | | | | | | |
| | | | | | | | |
| | | Basic & Diversified Chemicals | | | | | | | | | | | | | | | | |
| | | | | | | | |
| | | Linde | | | | | 1,000 | | | | 102,982 | | | | 256,420 | | | Ireland | | | 1.4% | |
| | | | | | | | |
| | | Precious Metal Mining | | | | | | | | | | | | | | | | |
| | | | | | | | |
| | | Barrick Gold | | | | | 10,000 | | | | 181,453 | | | | 231,400 | | | Canada | | | 1.2% | |
| | | | | | | | |
| | | Newmont Corporation | | | | | 4,000 | | | | 162,593 | | | | 235,280 | | | United States | | | 1.3% | |
| | | | | | | | |
| | | | | | | | | | | | | | | | | | | | | | | |
| | | | | | | | |
| | | | | | | | | | | | 344,046 | | | | 466,680 | | | | | | 2.5% | |
| | | | | | | | |
| | | Specialty Chemicals | | | | | | | | | | | | | | | | |
| | | | | | | | |
| | | RPM International | | | | | 1,400 | | | | 44,141 | | | | 123,214 | | | United States | | | 0.6% | |
| | | | | | | | |
| | | | | | | | | | | 491,169 | | | | 846,314 | | | | | | 4.5% | |
| | | | | | | |
| | | Technology | | | | | | | | | | | | | | | | |
| | | | | | | | |
| | | Application Software | | | | | | | | | | | | | | | | |
| | | | | | | | |
| | | Open Text US | | | | | 3,900 | | | | 146,122 | | | | 172,263 | | | Canada | | | 0.9% | |
| | | | | | | | |
| | | Communications Equipment | | | | | | | | | | | | | | | | |
| | | | | | | | |
| | | Apple | | | | | 2,400 | | | | 56,454 | | | | 285,720 | | | United States | | | 1.5% | |
| | | | | | | | |
| | | Consumer Electronics | | | | | | | | | | | | | | | | |
| | | | | | | | |
| | | Nintendo ADR | | | | | 2,600 | | | | 135,994 | | | | 184,470 | | | Japan | | | 1.0% | |
| | | | | | | | |
| | | Sony ADR | | | | | 1,900 | | | | 146,607 | | | | 177,251 | | | Japan | | | 0.9% | |
| | | | | | | | |
| | | | | | | | | | | | | | | | | | | | | | | |
| | | | | | | | |
| | | | | | | | | | | | 282,601 | | | | 361,721 | | | | | | 1.9% | |
| | | | | | | | |
| | | Infrastructure Software | | | | | | | | | | | | | | | | |
| | | | | | | | |
| | | Microsoft | | | | | 1,000 | | | | 126,084 | | | | 214,070 | | | United States | | | 1.1% | |
| | | | | | | | |
| | | Oracle | | | | | 3,100 | | | | 124,402 | | | | 178,932 | | | United States | | | 1.0% | |
| | | | | | | | |
| | | | | | | | | | | | | | | | | | | | | | | |
| | | | | | | | |
| | | | | | | | | | | | 250,486 | | | | 393,002 | | | | | | 2.1% | |
| | | | | | | | |
| | | IT Services | | | | | | | | | | | | | | | | |
| | | | | | | | |
| | | Amdocs Limited | | | | | 1,000 | | | | 58,919 | | | | 65,810 | | | United States | | | 0.3% | |
| | | | | | | | |
| | | Semiconductor Devices | | | | | | | | | | | | | | | | |
| | | | | | | | |
| | | Infineon Technologies ADR | | | | | 4,775 | | | | 105,273 | | | | 169,345 | | | Germany | | | 0.9% | |
| | | | | | | | |
| | | Intel | | | | | 3,500 | | | | 143,397 | | | | 169,225 | | | United States | | | 0.9% | |
| | | | | | | | |
| | | Micron Technology2 | | | | | 4,200 | | | | 193,718 | | | | 269,178 | | | United States | | | 1.4% | |
| | | | | | | | |
| | | NXP Semiconductors | | | | | 950 | | | | 90,828 | | | | 150,499 | | | Netherlands | | | 0.8% | |
| | | | | | | | |
| | | Qualcomm | | | | | 1,500 | | | | 85,745 | | | | 220,755 | | | United States | | | 1.2% | |
| | | | | | | | |
| | | Xilinx | | | | | 1,600 | | | | 119,983 | | | | 232,880 | | | United States | | | 1.2% | |
| | | | | | | | |
| | | | | | | | | | | | | | | | | | | | | | | |
| | | | | | | | |
| | | | | | | | | | | | 738,944 | | | | 1,211,882 | | | | | | 6.4% | |
| | | | | | | | |
| | | | | | | | | | | 1,533,526 | | | | 2,490,398 | | | | | | 13.1% | |
Continued on next page.
| | | | | | | | | | | | |
| | | | | | | |
| The accompanying notes are an integral part of these financial statements. | | Annual Report | | November 30, 2020 | | | | | | | | 23 |
Sextant Core Fund
| | | | | | | | | | | | | | | | | | | | |
| Schedule of Investments | | | | | | As of November 30, 2020 | |
| | | | | | |
| Common Stocks – 61.2% | | Number of Shares | | | Cost | | | Market Value | | | Country1 | | Percentage of Net Assets | |
| | | | | | |
| Utilities | | | | | | | | | | | | | | | | |
| | | | | | | |
| Integrated Utilities | | | | | | | | | | | | | | | | |
| | | | | | | |
Dominion Energy | | | | | 2,800 | | | | $212,366 | | | | $219,772 | | | United States | | | 1.1% | |
| | | | | | | |
Duke Energy | | | | | 2,600 | | | | 229,507 | | | | 240,916 | | | United States | | | 1.3% | |
| | | | | | | |
NextEra Energy | | | | | 4,000 | | | | 72,153 | | | | 294,360 | | | United States | | | 1.6% | |
| | | | | | | |
| | | | | | | | | | | | | | | | | | | | | |
| | | | | | | |
| | | | | | | | | | 514,026 | | | | 755,048 | | | | | | 4.0% | |
| | | | | | | |
| | | | | | | | | 514,026 | | | | 755,048 | | | | | | 4.0% | |
| | | | | | |
| | | | | | | | | | | | | | | | | | | | |
| | | | | | | |
| Total Common Stocks | | | | | | | | | $7,682,345 | | | | $11,613,530 | | | | | | 61.2% | |
| | | | | | | | | | | | | | | | |
| | | | | | | |
| Corporate Bonds – 15.5% | | | | Coupon / Maturity | | | | Face Amount | | | Market Value | | Percentage of Net Assets | |
| | | | | | |
| Communications | | | | | | | | | | | | | | |
| | | | | | | |
Bellsouth Capital Funding | | | | 7.875% due 02/15/2030 | | | | | $150,000 | | | $205,456 | | | 1.1% | |
| | | | | | | |
| | | | | | | | | | | | 205,456 | | | 1.1% | |
| | | | | | |
| Consumer Discretionary | | | | | | | | | | | | | | |
| | | | | | | |
Lowe’s | | | | 4.25% due 09/15/2044 | | | | | 250,000 | | | 301,144 | | | 1.6% | |
| | | | | | | |
Stanford University | | | | 4.013% due 05/01/2042 | | | | | 100,000 | | | 125,657 | | | 0.7% | |
| | | | | | | |
| | | | | | | | | | | | 426,801 | | | 2.3% | |
| | | | | | |
| Financials | | | | | | | | | | | | | | |
| | | | | | | |
General Electric Capital | | | | 5.35% due 04/15/2022 | | | | | 101,000 | | | 106,449 | | | 0.6% | |
| | | | | | | |
Welltower | | | | 4.25% due 04/15/2028 | | | | | 350,000 | | | 405,475 | | | 2.1% | |
| | | | | | | |
| | | | | | | | | | | | 511,924 | | | 2.7% | |
| | | | | | |
| Health Care | | | | | | | | | | | | | | |
| | | | | | | |
Becton Dickinson | | | | 3.125% due 11/08/2021 | | | | | 100,000 | | | 102,506 | | | 0.6% | |
| | | | | | | |
Cardinal Health | | | | 3.50% due 11/15/2024 | | | | | 155,000 | | | 169,993 | | | 0.9% | |
| | | | | | | |
Gilead Sciences | | | | 3.70% due 04/01/2024 | | | | | 250,000 | | | 273,046 | | | 1.4% | |
| | | | | | | |
| | | | | | | | | | | | 545,545 | | | 2.9% | |
| | | | | | |
| Industrials | | | | | | | | | | | | | | |
| | | | | | | |
Legrand France Yankee | | | | 8.50% due 02/15/2025 | | | | | 170,000 | | | 223,257 | | | 1.2% | |
| | | | | | | |
Union Pacific | | | | 3.375% due 02/01/2035 | | | | | 250,000 | | | 290,966 | | | 1.5% | |
| | | | | | | |
| | | | | | | | | | | | 514,223 | | | 2.7% | |
| | | | | | |
| Technology | | | | | | | | | | | | | | |
| | | | | | | |
Cisco Systems | | | | 2.90% due 03/04/2021 | | | | | 100,000 | | | 100,673 | | | 0.5% | |
| | | | | | | |
Qualcomm | | | | 3.25% due 05/20/2027 | | | | | 220,000 | | | 249,393 | | | 1.3% | |
| | | | | | | |
| | | | | | | | | | | | 350,066 | | | 1.8% | |
| | | | | | |
| Utilities | | | | | | | | | | | | | | |
| | | | | | | |
PacifiCorp | | | | 6.00% due 01/15/2039 | | | | | 250,000 | | | 374,653 | | | 2.0% | |
| | | | | | | |
| | | | | | | | | | | | 374,653 | | | 2.0% | |
| | | | | | |
| | | | | | | | | | | | | | | | |
| | | | | | | |
| Total Corporate Bonds | | | | (Cost $2,586,547) | | | | | | | | $2,928,668 | | | 15.5% | |
| | | | | | | | | | | | |
| | | | | | | |
| 24 | | | | | | | | November 30, 2020 | | Annual Report | | The accompanying notes are an integral part of these financial statements. |
Sextant Core Fund
| | | | | | | | | | | | | | |
| | | | | |
| Schedule of Investments | | | | | | | | | | | As of November 30, 2020 | |
| | | | | | |
| Government Bonds – 9.3% | | | | Coupon / Maturity | | Face Amount | | Market Value | | | Percentage of Net Assets | |
| | | | | |
| United States Treasury Bonds | | | | | | | | | | | | |
| | | | | | |
| United States Treasury Bond | | | | 6.25% due 08/15/2023 | | $438,000 | | | $510,048 | | | | 2.7% | |
| | | | | | |
| United States Treasury Bond | | | | 4.50% due 02/15/2036 | | 137,000 | | | 203,552 | | | | 1.0% | |
| | | | | | |
| United States Treasury Bond | | | | 3.625% due 02/15/2044 | | 155,000 | | | 222,497 | | | | 1.2% | |
| | | | | | |
| | | | | | | | | 936,097 | | | | 4.9% | |
| | | | | |
| United States Treasury Notes | | | | | | | | | | | | |
| | | | | | |
| United States Treasury Note | | | | 2.00% due 11/30/2022 | | 250,000 | | | 259,189 | | | | 1.4% | |
| | | | | | |
| United States Treasury Note | | | | 1.625% due 04/30/2023 | | 106,000 | | | 109,735 | | | | 0.6% | |
| | | | | | |
| United States Treasury Note | | | | 2.75% due 11/15/2023 | | 350,000 | | | 376,496 | | | | 2.0% | |
| | | | | | |
| United States Treasury Note | | | | 2.00% due 05/31/2024 | | 80,000 | | | 84,941 | | | | 0.4% | |
| | | | | | |
| | | | | | | | | 830,361 | | | | 4.4% | |
| | | | | |
| | | | | | | | | | | | | | |
| | | | | | |
| Total Government Bonds | | | | (Cost $1,604,743) | | | | | $1,766,458 | | | | 9.3% | |
| | | | | |
| | | | | | | | | | | | | | |
| | | | | | |
| Municipal Bonds – 1.8% | | | | Coupon / Maturity | | Face Amount | | Market Value | | | Percentage of Net Assets | |
| | | | | |
| General Obligation | | | | | | | | | | | | |
| | | | | | |
| Skagit SD #1 | | | | 4.613% due 12/01/2022 | | $100,000 | | | $101,604 | | | | 0.5% | |
| | | | | | |
| | | | | | | | | 101,604 | | | | 0.5% | |
| | | | | |
| State Education | | | | | | | | | | | | |
| | | | | | |
| New York City Housing Dev | | | | 2.65% due 05/01/2021 | | 100,000 | | | 100,754 | | | | 0.5% | |
| | | | | | |
| | | | | | | | | 100,754 | | | | 0.5% | |
| | | | | |
| Utility Networks | | | | | | | | | | | | |
| | | | | | |
| Tacoma WA Elec Sys Revenue | | | | 5.966% due 01/01/2035 | | 100,000 | | | 144,381 | | | | 0.8% | |
| | | | | | |
| | | | | | | | | 144,381 | | | | 0.8% | |
| | | | | |
| | | | | | | | | | | | | | |
| | | | | | |
| Total Municipal Bonds | | | | (Cost $321,289) | | | | | $346,739 | | | | 1.8% | |
| | | | | |
| | | | | | | | | | | | | | | |
| | | | | |
| Total investments | | | | (Cost $12,194,924) | | | | | $16,655,395 | | | | 87.8% | |
| | | | | |
| Other assets (net of liabilities) | | | | | | | | | 2,306,910 | | | | 12.2% | |
| | | | | |
| | | | | | | | | | | | | | |
| | | | | |
| Total net assets | | | | | | | | | $18,962,305 | | | | 100.0% | |
| | | | | | |
| | | | | | | | | | | | | | |
| 2 | Non-income producing security |
ADR: American Depositary Receipt
| | | | | | | | | | | | |
| | | | | | | |
| The accompanying notes are an integral part of these financial statements. | | Annual Report | | November 30, 2020 | | | | | | | | 25 |
Sextant Core Fund
| | |
Schedule of Investments | | As of November 30, 2020 |
| | | | | | | | | | | | |
Bond Quality Diversification | | | | | | | | | | | (unaudited) | |
| | | | |
| % of Total Net Assets | | | | | | | | | | | | |
| | | |
Rated “AAA” | | | 10.5% | | | ∎ | | | | | 
| |
Rated “AA+” | | | 0.5% | | | ∎ | | |
Rated “AA” | | | 0.8% | | | ∎ | | |
Rated “AA-” | | | 0.5% | | | ∎ | | |
Rated “A+” | | | 2.0% | | | ∎ | | |
Rated “A-” | | | 4.0% | | | ∎ | | |
Rated “BBB+” | | | 5.7% | | | ∎ | | |
| | | |
Rated “BBB” | | | 2.6% | | | ∎ | | | | | | |
| | | |
Equity | | | 61.2% | | | ∎ | | | | | | |
| | | |
Other assets (net of liabilities) | | | 12.2% | | | ∎ | | | | | | |
|
| Credit ratings are the lesser of S&P Global Ratings or Moody’s Investors Service. If neither S&P nor Moody’s rate a particular security, that security is categorized as not rated (except for US Treasury securities and securities issued or backed by US agencies which inherit the credit rating for the US government). Ratings range from AAA (highest) to D (lowest). Bonds rated BBB or above are considered investment grade. Credit ratings BB and below are lower-rated securities (junk bonds). Ratings apply to the creditworthiness of the issuers of the underlying securities and not the Fund or its shares. Ratings may be subject to change. | |
| | | | | | | | | | | | |
| | | | | | | |
| 26 | | | | | | | | November 30, 2020 | | Annual Report | | The accompanying notes are an integral part of these financial statements. |
Sextant Core Fund
Statement of Assets and Liabilities
| | | | |
| As of November 30, 2020 | |
| | |
| | | | |
| |
Assets | | | | |
| |
Investments in securities, at value
(Cost $12,194,924) | | | $16,655,395 | |
| |
Cash | | | 2,237,296 | |
| |
Dividends and interest receivable | | | 66,646 | |
| |
Receivable for Fund shares sold | | | 17,839 | |
| |
Prepaid expenses | | | 4,416 | |
| | | | |
| |
Total assets | | | 18,981,592 | |
| | | | |
| |
Liabilities | | | | |
| |
Accrued advisory fees | | | 7,665 | |
| |
Accrued audit expenses | | | 5,394 | |
| |
Accrued retirement plan custody fee | | | 3,161 | |
| |
Accrued trustee expenses | | | 1,245 | |
| |
Accrued printing fees | | | 854 | |
| |
Accrued Chief Compliance Officer expenses | | | 467 | |
| |
Accrued other expenses | | | 372 | |
| |
Payable for Fund shares redeemed | | | 129 | |
| | | | |
| |
Total liabilities | | | 19,287 | |
| | | | |
| |
Net assets | | | $18,962,305 | |
| | |
| | | | | |
| | |
Analysis of net assets | | | | |
| |
Paid-in capital (unlimited shares authorized, without par value) | | | $14,619,582 | |
| |
Total distributable earnings | | | 4,342,723 | |
| | | | |
| |
Net assets applicable to Fund shares outstanding | | | $18,962,305 | |
| | |
| | | | |
Fund shares outstanding | | | 1,280,796 | |
| | |
Net asset value, offering, and redemption price per share | | | $14.81 | |
| | | | | |
Statement of Operations
| | | | |
| Year ended November 30, 2020 | |
| | |
| | | | |
| |
Investment income | | | | |
| |
Dividend Income (net of foreign tax of $10,522) | | | $233,101 | |
| |
Interest income | | | 162,128 | |
| |
Miscellaneous income | | | 55 | |
| | | | |
| |
Total investment income | | | 395,284 | |
| | | | |
| |
Expenses | | | | |
| |
Investment adviser fees | | | 106,542 | |
| |
Filing and registration fees | | | 16,580 | |
| |
Audit fees | | | 10,094 | |
| |
Trustee fees | | | 4,246 | |
| |
Legal fees | | | 3,659 | |
| |
Retirement plan custodial fees | | | 3,654 | |
| |
Chief Compliance Officer expenses | | | 3,217 | |
| |
Printing and postage fees | | | 2,940 | |
| |
Other operating expenses | | | 1,305 | |
| |
Custodian fees | | | 711 | |
| |
Management fees | | | 116 | |
| | | | |
| |
Total gross expenses | | | 153,064 | |
| | | | |
| |
Less custodian fee credits | | | (711 | ) |
| | | | |
| |
Net expenses | | | 152,353 | |
| | | | |
| |
Net investment income | | | $242,931 | |
| | |
| | | | | |
| | |
| | | | |
| |
Net realized loss from investments and foreign currency | | | $(355,444 | ) |
| |
Net increase in unrealized appreciation on investments and foreign currency | | | 1,778,825 | |
| | | | |
| |
Net gain on investments | | | $1,423,381 | |
| | |
| | | | |
| | |
Net increase in net assets resulting from operations | | | $1,666,312 | |
| | | | | | | | | | | | |
| | | | | | | |
| The accompanying notes are an integral part of these financial statements. | | Annual Report | | November 30, 2020 | | | | | | | | 27 |
Sextant Core Fund
| | | | | | | | |
Statements of Changes in Net Assets | | | Year ended November 30, 2020 | | | | Year ended November 30, 2019 | |
| | | |
Increase in net assets from operations | | | | | | | | |
| | |
From operations | | | | | | | | |
| | |
Net investment income | | | $242,931 | | | | $240,511 | |
| | |
Net realized gain (loss) on investment and foreign currency | | | (355,444 | ) | | | 755,524 | |
| | |
Net increase in unrealized appreciation | | | 1,778,825 | | | | 858,747 | |
| | | | | | | | |
| | |
Net increase in net assets | | | 1,666,312 | | | | 1,854,782 | |
| | | | | | | | |
| | |
| | | | | | | | |
| | |
Distributions to shareowners | | | (973,278 | ) | | | (179,880 | ) |
| | |
| | | | | | | | |
| | |
Capital share transactions | | | | | | | | |
| | |
Proceeds from sales of shares | | | 3,542,735 | | | | 3,901,597 | |
| | |
Value of shares issued in reinvestment of dividends | | | 971,268 | | | | 179,880 | |
| | |
Cost of shares redeemed | | | (3,119,396 | ) | | | (1,733,010 | ) |
| | | | | | | | |
| | |
Total capital share transactions | | | 1,394,607 | | | | 2,348,467 | |
| | | | | | | | |
| | |
Total increase in net assets | | | 2,087,641 | | | | 4,023,369 | |
| | | | | | | | |
| | | |
| | | | | | | | |
| | | |
Net assets | | | | | | | | |
| | |
Beginning of year | | | 16,874,664 | | | | 12,851,295 | |
| | | | | | | | |
| | |
End of year | | | $18,962,305 | | | | $16,874,664 | |
| | | |
| | | | | | | | |
| | | |
Shares of the Fund sold and redeemed | | | | | | | | |
| | |
Number of shares sold | | | 260,075 | | | | 292,063 | |
| | |
Number of shares issued in reinvestment of dividends | | | 71,051 | | | | 14,891 | |
| | |
Number of shares redeemed | | | (229,175 | ) | | | (129,374 | ) |
| | | | | | | | |
| | |
Net increase in number of shares outstanding | | | 101,951 | | | | 177,580 | |
| | | |
| | | | | | | | |
| | | | | | | | | | | | | | | | | | | | |
Financial Highlights | | | | | | | For year ended November 30, | | | | | |
| | | | | |
Selected data per share of outstanding capital stock throughout each year: | | | 2020 | | | | 2019 | | | | 2018 | | | | 2017 | | | | 2016 | |
| | | | | | |
Net asset value at beginning of year | | | $14.31 | | | | $12.84 | | | | $12.99 | | | | $11.45 | | | | $11.25 | |
| | | | | |
Income from investment operations | | | | | | | | | | | | | | | | | | | | |
| | | | | |
Net investment income | | | 0.19 | | | | 0.19 | | | | 0.18 | | | | 0.16 | | | | 0.18 | |
| | | | | |
Net gains (losses) on securities (both realized & unrealized) | | | 1.13 | | | | 1.45 | | | | (0.16 | ) | | | 1.55 | | | | 0.02 | |
| | | | | | | | | | | | | | | | | | | | |
| | | | | |
Total from investment operations | | | 1.32 | | | | 1.64 | | | | 0.02 | | | | 1.71 | | | | 0.20 | |
| | | | | | | | | | | | | | | | | | | | |
| | | | | |
Less distributions | | | | | | | | | | | | | | | | | | | | |
| | | | | |
Dividends from net investment income | | | (0.20 | ) | | | (0.17 | ) | | | (0.17 | ) | | | (0.17 | ) | | | - | |
| | | | | |
Distributions from capital gains | | | (0.62 | ) | | | - | | | | - | | | | - | | | | - | |
| | | | | | | | | | | | | | | | | | | | |
| | | | | |
Total distributions | | | (0.82 | ) | | | (0.17 | ) | | | (0.17 | ) | | | (0.17 | ) | | | - | |
| | | | | | | | | | | | | | | | | | | | |
| | | | | |
| | | | | | | | | | | | | | | | | | | | |
| | | | | |
Net asset value at end of year | | | $14.81 | | | | $14.31 | | | | $12.84 | | | | $12.99 | | | | $11.45 | |
| | | | | | |
| | | | | | | | | | | | | | | | | | | | |
Total return | | | 9.72% | | | | 13.04% | | | | 0.16% | | | | 15.15% | | | | 1.78% | |
| | | | | | |
Ratios / supplemental data | | | | | | | | | | | | | | | | | | | | |
| | | | | |
Net assets ($000), end of year | | | $18,962 | | | | $16,875 | | | | $12,851 | | | | $12,980 | | | | $8,563 | |
| | | | | |
Ratio of expenses to average net assets | | | | | | | | | | | | | | | | | | | | |
| | | | | |
Before custodian fee credits | | | 0.88% | | | | 0.90% | | | | 0.88% | | | | 0.84% | | | | 1.05% | |
| | | | | |
After custodian fee credits | | | 0.88% | | | | 0.90% | | | | 0.87% | | | | 0.83% | | | | 1.04% | |
| | | | | |
Ratio of net investment income after custodian fee credits to average net assets | | | 1.40% | | | | 1.63% | | | | 1.41% | | | | 1.52% | | | | 1.52% | |
| | | | | |
Portfolio turnover rate | | | 19% | | | | 28% | | | | 30% | | | | 34% | | | | 39% | |
| | | | | | |
| | | | | | | | | | | | | | | | | | | | |
| | | | | | | | | | | | |
| | | | | | | |
| 28 | | | | | | | | November 30, 2020 | | Annual Report | | The accompanying notes are an integral part of these financial statements. |
Sextant Global High Income Fund
| | | | | | | | |
Performance Summary | | (unaudited) |
| | | | | | | | | | | | | | | | |
Average Annual Total Returns as of November 30, 2020 | | | | | |
| | | | | |
| | | 1 Year | | | 5 Year | | | 10 Year | | | Expense Ratio1 | |
| | | | |
Sextant Global High Income Fund2 | | | -3.51% | | | | 6.69% | | | | n/a | | | | 1.11% | |
| | | | |
S&P Global 1200 Index | | | 14.39% | | | | 11.53% | | | | 10.64% | | | | n/a | |
Growth of $10,000
| | |
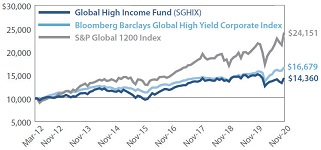
| | Comparison of any mutual fund to a market index must be made bearing in mind that the index is expense-free. Conversely, the fund will (1) be actively managed; (2) have an objective other than mirroring the index, such as limiting risk; (3) bear transaction and other costs; (4) stand ready to buy and sell its securities to shareowners on a daily basis; and (5) provide a wide range of services. The graph compares $10,000 invested in the Fund on March 30, 2012 (the Fund’s inception), to an identical amount invested in the S&P Global 1200 Index, a global stock market index covering nearly 70% of the world’s equity markets. The graph shows that an investment in the Fund would have risen to $14,360 versus $24,151 in the S&P Global 1200 Index and $16,679 in the Bloomberg Barclays Global High Yield Corporate Index. |
Past performance does not guarantee future results. The “Growth of $10,000” graph and “Average Annual Returns” performance table assume the reinvestment of dividends and capital gains. They do not reflect the deduction of taxes that a shareowner might pay on fund distributions or the redemption of fund shares.
| 1 | By regulation, the expense ratio shown in this table is as stated in the Fund’s most recent prospectus, which is dated March 27, 2020, and incorporates results for the fiscal year ended November 30, 2019, before fee waivers. The expense ratio shown in the most recent prospectus after fee waivers was 0.75%. The ratio presented in this table differs from expense ratios shown elsewhere in this report as they represent different periods. |
| 2 | The Sextant Global High Income Fund began operations on March 30, 2012. |
Fund Objective
The objective of the Global High Income Fund is high income, with a secondary objective of capital preservation.
| | | | |
Top 10 Holdings | | | | |
| |
| % of Total Net Assets | |
| |
Mexico Bonos Desarrollo (6.50% due 06/10/2021) | | | 4.9% | |
| |
BHP Biliton | | | 3.6% | |
| |
South32 | | | 3.6% | |
| |
Virtu Financial | | | 3.3% | |
| |
Burlington Northern Santa Fe (5.05% due 03/01/2041) | | | 3.3% | |
| |
Netflix (4.375% due 11/15/2026) | | | 3.2% | |
| |
Jefferies Group (5.125% due 01/20/2023) | | | 3.2% | |
| |
Skandinaviska Enskilda Banken, Cl A | | | 3.1% | |
| |
Equinor | | | 3.0% | |
| |
T-Mobile (6.50% due 01/15/2026) | | | 3.0% | |
| | | | | | | | | | | | |
Asset Allocation | | | | | | | | | | | | |
| | |
| % of Total Net Assets | | | | |
| | | |
Equity Securities | | | 39.9% | | | ∎ | | | | | 
| |
Fixed Income Securities | | | 42.2% | | | ∎ | | |
Other assets (net of liabilities) | | | 17.9% | | | ∎ | | |
| | | | | | | | |
Portfolio Diversification | | | | | | | | |
| |
| % of Total Net Assets | |
| | |
| Sectors | | Equity | | | Fixed Income | |
| | |
Financials | | | 8.1% | | | | 10.1% | |
| | |
Communications | | | 8.1% | | | | 6.2% | |
| | |
Government Bonds | | | 0.0% | | | | 10.7% | |
| | |
Materials | | | 7.2% | | | | 1.9% | |
| | |
Energy | | | 6.4% | | | | 1.8% | |
| | |
Technology | | | 4.1% | | | | 1.2% | |
| | |
Health Care | | | 4.8% | | | | 0.0% | |
| | |
Industrials | | | 1.2% | | | | 3.3% | |
| | |
Consumer Staples | | | 0.0% | | | | 2.8% | |
| | |
Municipal Bonds | | | 0.0% | | | | 2.4% | |
| | |
Consumer Discretionary | | | 0.0% | | | | 1.8% | |
| | |
Total | | | 39.9% | | | | 42.2% | |
| | | | | | | | | | |
| | | | | | |
| Annual Report | | November 30, 2020 | | | | | | | | 29 |
Sextant Global High Income Fund
| | |
Discussion of Fund Performance | | (unaudited) |
(photo omitted)
Fiscal Year 2020
The Sextant Global High Income Fund completed fiscal year 2020 with a total return of -3.51%. In December 2019, the Fund paid distributions that included qualified dividends of 20.84¢, regular income of 19.25¢, short-term capital gains of 22.90¢, and long-term capital gains of 28.64¢. These income and capital gain distributions amounted to a total of $0.9163 per share. The Fund ended the fiscal year with a 30-day yield of 2.96%.
The Fund underperformed its equity benchmark, the S&P Global 1200, which returned 14.39%, and also underperformed its fixed-income benchmark, the Bloomberg-Barclays Global High Yield Corporate Bond Index, which returned 8.09%. The Fund underperformed its Morningstar World Allocation peer group, which returned 5.36%.
Factors Affecting Past Performance
The Fund’s fiscal year covered the first eleven months of 2020, a year that seems likely to stand out for decades as a result of the novel coronavirus pandemic that swept across the globe. Attempts to mitigate the public health impacts of the virus resulted in unprecedented economic disruptions. Many governments responded to these disruptions with aggressive stimulus measures and central bank easing that appear to have been successful in offsetting much of the economic damage, at least in the aggregate. After a deep but brief swoon in February and March, financial markets staged strong recoveries, with benchmarks such as the S&P 500 closing the period at all-time highs. Long-term US Treasury yields also dropped to record lows, driving bond prices higher as well.
Despite the resilience of financial markets in aggregate, many areas of the economy continue to struggle. The global travel and tourism sectors have ground to a virtual halt, while the slowdown in travel of all kinds has led to steep drops in demand for oil and the price of fuels.
Considering this backdrop, the performance of the Sextant Global High Income Fund during the fiscal year was relatively poor. In last year’s letter, we discussed the impact of not owning the large technology platform companies, which again contributed strong gains to US and global equity markets. Apple, Microsoft, Amazon, Alphabet (Google), and Facebook comprised five of the world’s six largest companies by market capitalization at the close of the period (newly public oil giant Saudi Aramco was the other member of the top six). Of the above five companies, only Microsoft and Apple pay dividends, albeit with too paltry of yields to qualify for the Fund’s “High Income” mandate.
In addition to sitting out the strong performance of the above technology companies, the Fund’s performance was hampered by its allocation to global energy companies, including Royal Dutch Shell and CNOOC. Fund performance also suffered from investments in Brazilian bank Itau Unibanco, financial software and services provider Microfocus International, and the insurer Aviva. The above three companies exemplified the risks of investing in lower-quality, higher-yielding companies in a period of economic distress and turmoil.
Looking Forward
Equities
Overall, equity market valuations appear high but perhaps not excessive given an expectation for low discount rates into the foreseeable future. However, an increase in interest rates as a result of an uptick in inflation pressures or concerns about large government deficit financing could undo valuation gains that have resulted from the drop in interest rate expectations witnessed over the past 12 months.
Fixed-Income
As mentioned above, US interest rates ended the fiscal year at or near record lows. In the US, and perhaps elsewhere, the central bank appears committed to maintaining a very accommodative monetary policy for an extended period, even if inflation should pick up. To the extent future policies include an implicit or explicit attempt to cap longer-term interest rates in the face of building inflation, the returns of bonds in real terms (i.e., adjusted for inflation) could still suffer relative to investments that are somewhat more resilient to inflation pressures such as real estate, commodity companies, and precious metals.
Foreign Currencies
The US dollar has weakened recently against other major currencies such as the euro, yen, and post-Brexit British pound. However, we still believe the US dollar remains overvalued relative to a number of other smaller-economy foreign currencies, a number of which also offer the prospect of higher real yields than are available in the US.
Management Fee Calculations
The Sextant Global High Income Fund calculates the performance part of its management fee by comparing the Fund’s return to the return of Morningstar’s™ “World Allocation” category. The Fund’s 12-month return of -3.51% was more than two percent below the Morningstar™ category average of 5.36% at month-end November 30, 2020. Therefore, the basic annual management fee of 0.50% was decreased by 0.20% to 0.30% for the month of December 2020. Note that significant portions of the Fund’s expenses are waived due to the adviser’s cap on total Fund expenses.
| | | | | | | | | | |
| | | | | | |
| 30 | | | | | | | | November 30, 2020 | | Annual Report |
Sextant Global High Income Fund
| | | | | | | | | | | | | | | | | | | | | | |
| | | Schedule of Investments | | | | | | | | | | | | | | | As of November 30, 2020 | |
| | | | | | | | |
| | | Common Stocks – 39.9% | | | | Number of Shares | | Cost | | | Market Value | | | Country1 | | | Percentage of Net Assets | |
| | | | | | | |
| | | Communications | | | | | | | | | | | | | | | | |
| | | | | | | | |
| | | Telecom Carriers | | | | | | | | | | | | | | | | |
| | | | | | | | |
| | | AT&T | | | | 7,500 | | | $229,195 | | | | $215,625 | | | | United States | | | | 2.5% | |
| | | | | | | | |
| | | Orange ADR | | | | 20,000 | | | 270,394 | | | | 251,000 | | | | France | | | | 2.9% | |
| | | | | | | | |
| | | SK Telecom ADR | | | | 10,000 | | | 167,681 | | | | 235,100 | | | | South Korea | | | | 2.7% | |
| | | | | | | | |
| | | | | | | | | 667,270 | | | | 701,725 | | | | | | | | 8.1% | |
| | | | | | | |
| | | Energy | | | | | | | | | | | | | | | | |
| | | | | | | | |
| | | Exploration & Production | | | | | | | | | | | | | | | | |
| | | | | | | | |
| | | Goodrich Petroleum2 | | | | 200 | | | - | | | | 2,312 | | | | United States | | | | 0.0% | (3) |
| | | | | | | | |
| | | Integrated Oils | | | | | | | | | | | | | | | | |
| | | | | | | | |
| | | Equinor ADR | | | | 17,000 | | | 267,535 | | | | 260,780 | | | | Norway | | | | 3.0% | |
| | | | | | | | |
| | | Royal Dutch Shell ADR, Class A | | | | 3,800 | | | 241,426 | | | | 128,592 | | | | Netherlands | | | | 1.5% | |
| | | | | | | | |
| | | Total ADR | | | | 3,800 | | | 202,606 | | | | 160,132 | | | | France | | | | 1.9% | |
| | | | | | | | | | | | | | | | | | | | | | |
| | | | | | | | |
| | | | | | | | | | 711,567 | | | | 549,504 | | | | | | | | 6.4% | |
| | | | | | | | |
| | | | | | | | | 711,567 | | | | 551,816 | | | | | | | | 6.4% | |
| | | | | | | |
| | | Financials | | | | | | | | | | | | | | | | |
| | | | | | | | |
| | | Banks | | | | | | | | | | | | | | | | |
| | | | | | | | |
| | | Skandinaviska Enskilda Banken, Class A | | | | 25,000 | | | 233,632 | | | | 264,753 | | | | Sweden | | | | 3.1% | |
| | | | | | | | |
| | | Institutional Brokerage | | | | | | | | | | | | | | | | |
| | | | | | | | |
| | | Virtu Financial | | | | 12,500 | | | 199,625 | | | | 284,875 | | | | United States | | | | 3.3% | |
| | | | | | | | |
| | | Investment Companies | | | | | | | | | | | | | | | | |
| | | | | | | | |
| | | ICAHN Enterprises Depositary Unit | | | | 3,000 | | | 159,646 | | | | 150,210 | | | | United States | | | | 1.7% | |
| | | | | | | | |
| | | | | | | | | 592,903 | | | | 699,838 | | | | | | | | 8.1% | |
| | | | | | | |
| | | Health Care | | | | | | | | | | | | | | | | |
| | | | | | | | |
| | | Large Pharma | | | | | | | | | | | | | | | | |
| | | | | | | | |
| | | GlaxoSmithKline ADR | | | | 5,000 | | | 216,373 | | | | 183,950 | | | | United Kingdom | | | | 2.2% | |
| | | | | | | | |
| | | Novartis ADR | | | | 2,500 | | | 141,271 | | | | 227,075 | | | | Switzerland | | | | 2.6% | |
| | | | | | | | |
| | | | | | | | | 357,644 | | | | 411,025 | | | | | | | | 4.8% | |
| | | | | | | |
| | | Industrials | | | | | | | | | | | | | | | | |
| | | | | | | | |
| | | Infrastructure Construction | | | | | | | | | | | | | | | | |
| | | | | | | | |
| | | Shenzen Investment Holdings | | | | 325,000 | | | 168,010 | | | | 105,697 | | | | Hong Kong | | | | 1.2% | |
| | | | | | | | |
| | | | | | | | | 168,010 | | | | 105,697 | | | | | | | | 1.2% | |
| | | | | | | |
| | | Materials | | | | | | | | | | | | | | | | |
| | | | | | | | |
| | | Base Metals | | | | | | | | | | | | | | | | |
| | | | | | | | |
| | | South 32 ADR | | | | 35,000 | | | 217,441 | | | | 305,900 | | | | Australia | | | | 3.6% | |
| | | | | | | | |
| | | Steel Raw Material Suppliers | | | | | | | | | | | | | | | | |
| | | | | | | | |
| | | BHP Biliton ADR | | | | 5,500 | | | 209,119 | | | | 306,845 | | | | Australia | | | | 3.6% | |
| | | | | | | | |
| | | | | | | | | 426,560 | | | | 612,745 | | | | | | | | 7.2% | |
Continued on next page.
| | | | | | | | | | | | |
| | | | | | | |
| The accompanying notes are an integral part of these financial statements. | | Annual Report | | November 30, 2020 | | | | | | | | 31 |
Sextant Global High Income Fund
| | | | | | | | | | | | | | | | | | | | | | |
| | | Schedule of Investments | | | | | | | | | | | As of November 30, 2020 | |
| | | | | | | | |
| | | Common Stocks –39.9% | | | | Number of Shares | | Cost | | | Market Value | | | Country1 | | | Percentage of Net Assets | |
| | | | | | | |
| | | Technology | | | | | | | | | | | | | | | | |
| | | | | | | | |
| | | Communications Equipment | | | | | | | | | | | | | | | | |
| | | | | | | | |
| | | Cisco Systems | | | | 5,000 | | | $179,893 | | | | $215,100 | | | | United States | | | | 2.5% | |
| | | | | | | | |
| | | Infrastructure Software | | | | | | | | | | | | | | | | |
| | | | | | | | |
| | | Micro Focus International | | | | 30,000 | | | 223,048 | | | | 137,400 | | | | United Kingdom | | | | 1.6% | |
| | | | | | | | |
| | | | | | | | | 402,941 | | | | 352,500 | | | | | | | | 4.1% | |
| | | | | | | |
| | | | | | | | | | | | | | | | | | | | | | |
| | | | | | | | |
| | Total Common Stock | | | | | | | $3,326,895 | | | | $3,435,346 | | | | | | | | 39.9% | |
| | | | | | | |
| | | | | | | | | | | | | | | | | | | | | | |
| | | | | | | | |
| | | Corporate Bonds –29.1% | | | | Coupon / Maturity | | Face Amount | | | Market Value | | | Country1 | | | Percentage of Net Assets | |
| | | | | | | |
| | | Communications | | | | | | | | | | | | | | | | |
| | | | | | | | |
| | | Netflix | | | | 4.375% due 11/15/2026 | | | $250,000 | | | | $277,188 | | | | United States | | | | 3.2% | |
| | | | | | | | |
| | | T-Mobile | | | | 6.50% due 01/15/2026 | | | 250,000 | | | | 259,745 | | | | United States | | | | 3.0% | |
| | | | | | | | |
| | | | | | | | | | | | | 536,933 | | | | | | | | 6.2% | |
| | | | | | | |
| | | Consumer Discretionary | | | | | | | | | | | | | | | | |
| | | | | | | | |
| | | ADT | | | | 4.125% due 06/15/2023 | | | 150,000 | | | | 158,063 | | | | United States | | | | 1.8% | |
| | | | | | | | |
| | | | | | | | | | | | | 158,063 | | | | | | | | 1.8% | |
| | | | | | | |
| | | Consumer Staples | | | | | | | | | | | | | | | | |
| | | | | | | | |
| | | Grupo Bimbo4 | | | | 4.875% due 06/27/2044 | | | 200,000 | | | | 243,669 | | | | Mexico | | | | 2.8% | |
| | | | | | | | |
| | | | | | | | | | | | | 243,669 | | | | | | | | 2.8% | |
| | | | | | | |
| | | Energy | | | | | | | | | | | | | | | | |
| | | | | | | | |
| | | Petrobras International Finance | | | | 6.875% due 01/20/2040 | | | 50,000 | | | | 60,100 | | | | Brazil | | | | 0.7% | |
| | | | | | | | |
| | | Petrobras International Finance | | | | 6.75% due 01/27/2041 | | | 80,000 | | | | 96,450 | | | | Brazil | | | | 1.1% | |
| | | | | | | | |
| | | | | | | | | | | | | 156,550 | | | | | | | | 1.8% | |
| | | | | | | |
| | | Financials | | | | | | | | | | | | | | | | |
| | | | | | | | |
| | | Canadian Imperial Bank5 | | | | 3.42% due 01/26/2026 | | | CAD 250,000 | | | | 193,362 | | | | Canada | | | | 2.3% | |
| | | | | | | | |
| | | Jefferies Group | | | | 5.125% due 01/20/2023 | | | 250,000 | | | | 272,904 | | | | United States | | | | 3.2% | |
| | | | | | | | |
| | | Lincoln National (3 month LIBOR plus 2.04%)6 | | | | 2.26% due 04/20/2067 | | | 250,000 | | | | 182,500 | | | | United States | | | | 2.1% | |
| | | | | | | | |
| | | Royal Bank of Scotland | | | | 6.125% due 12/15/2022 | | | 200,000 | | | | 219,393 | | | | United Kingdom | | | | 2.5% | |
| | | | | | | | |
| | | | | | | | | | | | | 868,159 | | | | | | | | 10.1% | |
| | | | | | | |
| | | Industrials | | | | | | | | | | | | | | | | |
| | | | | | | | |
| | | Burlington Northern Santa Fe | | | | 5.05% due 03/01/2041 | | | 200,000 | | | | 281,285 | | | | United States | | | | 3.3% | |
| | | | | | | | |
| | | | | | | | | | | | | 281,285 | | | | | | | | 3.3% | |
| | | | | | | |
| | | Materials | | | | | | | | | | | | | | | | |
| | | | | | | | |
| | | Allegheny Technologies | | | | 7.875% due 08/15/2023 | | | $150,000 | | | | $162,375 | | | | United States | | | | 1.9% | |
| | | | | | | | |
| | | | | | | | | | | | | 162,375 | | | | | | | | 1.9% | |
Continued on next page.
| | | | | | | | | | | | |
| | | | | | | |
| 32 | | | | | | | | November 30, 2020 | | Annual Report | | The accompanying notes are an integral part of these financial statements. |
Sextant Global High Income Fund
| | | | | | | | | | | | | | | | | | | | |
| | | Schedule of Investments | | | | | | | | | | | | | | As of November 30, 2020 | |
| | | | | | | | |
| | | Corporate Bonds – 29.1% | | | | Coupon /Maturity | | Face Amount | | | Market Value | | | Country1 | | Percentage of Net Assets | |
| | | | | | | |
| | | Technology | | | | | | | | | | | | | | | |
| | | | | | | | |
| | | Hewlett Packard | | | | 4.65% due 12/09/2021 | | | $100,000 | | | | $104,147 | | | United States | | | 1.2% | |
| | | | | | | | |
| | | | | | | | | | | | | 104,147 | | | | | | 1.2% | |
| | | | | | | |
| | | | | | | | | | | | | | | | | | | | |
| | | | | | | | |
| | Total Corporate Bonds | | | | (Cost $2,324,373) | | | | | | | $2,511,181 | | | | | | 29.1% | |
| | | | | | | |
| | | | | | | | | | | | | | | | | | | | |
| | | | | | | | |
| | | Government Bonds – 10.7% | | | | Coupon / Maturity | | Face Amount | | | Market Value | | | Country1 | | Percentage of Net Assets | |
| | | | | | | |
| | | Foreign Government Bonds | | | | | | | | | | | | | | | |
| | | | | | | | |
| | | Colombia Republic | | | | 8.375% due 02/15/2027 | | | $125,000 | | | | $149,115 | | | Colombia | | | 1.8% | |
| | | | | | | | |
| | | Federal Republic of Brazil | | | | 12.50% due 01/05/2022 | | | BRL 500,000 | | | | 103,252 | | | Brazil | | | 1.2% | |
| | | | | | | | |
| | | Federal Republic of Brazil | | | | 8.50% due 01/05/2024 | | | BRL 750,000 | | | | 151,954 | | | Brazil | | | 1.8% | |
| | | | | | | | |
| | | Mexico Bonos Desarrollo | | | | 6.50% due 06/10/2021 | | | MXN 8,500,000 | | | | 424,587 | | | Mexico | | | 4.9% | |
| | | | | | | | |
| | | Republic of Argentina | | | | 1.00% due 07/09/2029 | | | 9,276 | | | | 3,942 | | | Argentina | | | 0.0%(3 | ) |
| | | | | | | | |
| | | Republic of Argentina | | | | 0.125% due 07/09/2046 | | | 242,500 | | | | 86,330 | | | Argentina | | | 1.0% | |
| | | | | | | | |
| | | | | | | | | | | | | 919,180 | | | | | | 10.7% | |
| | | | | | | |
| | | | | | | | | | | | | | | | | | | | |
| | | | | | | | |
| | Total Government Bonds | | | | (Cost $1,250,015) | | | | | | | $919,180 | | | | | | 10.7% | |
| | | | | | | |
| | | | | | | | | | | | | | | | | | | | |
| | | | | | | | |
| | | Municipal Bonds – 2.4% | | | | Coupon / Maturity | | Face Amount | | | Market Value | | | Country1 | | Percentage of Net Assets | |
| | | | | | | |
| | | Real Estate | | | | | | | | | | | | | | | |
| | | | | | | | |
| | | Colony TX NFM Sales Tax Revenue | | | | 7.00% due 10/01/2027 | | | $100,000 | | | | $102,278 | | | United States | | | 1.2% | |
| | | | | | | | |
| | | Colony TX NFM Sales Tax Revenue | | | | 7.25% due 10/01/2033 | | | 50,000 | | | | 51,139 | | | United States | | | 0.6% | |
| | | | | | | | |
| | | Colony TX NFM Sales Tax Revenue | | | | 7.625% due 10/01/2042 | | | 50,000 | | | | 54,322 | | | United States | | | 0.6% | |
| | | | | | | | |
| | | | | | | | | | | | | 207,739 | | | | | | 2.4% | |
| | | | | | | |
| | | | | | | | | | | | | | | | | | | | |
| | | | | | | | |
| | Total Municipal Bonds | | | | (Cost $196,849) | | | | | | | $207,739 | | | | | | 2.4% | |
| | | | | | | |
| | | | | | | | | | | | | | | | | | | | |
| | | | | | | | |
| | | Warrants – 0.0% | | | | Number of Shares | | Cost | | | Market Value | | | Country1 | | Percentage of Net Assets | |
| | | | | | | |
| | | Energy | | | | | | | | | | | | | | | |
| | | | | | | | |
| | | Exploration & Production | | | | | | | | | | | | | | | |
| | | | | | | | |
| | | Goodrich Petroleum Warrants2 | | | | 1,707 | | | $- | | | | $- | | | United States | | | 0.0% | |
| | | | | | | | |
| | | | | | | | | | | | | | | | | | | | |
| | | | | | | | |
| | | Total Warrants | | | | | | | $- | | | | $- | | | | | | 0.0% | |
| | | | | | | |
| | Total investments | | | | (Cost $7,098,132) | | | | | | | $7,073,446 | | | | | | 82.1% | |
| | | | | | | |
| | Other assets (net of liabilities) | | | | | | | | | | | 1,541,519 | | | | | | 17.9% | |
| | | | | | | |
| | Total net assets | | | | | | | | | | | $8,614,965 | | | | | | 100.0% | |
| | | | | | | | |
| | | | | | | | | | | | | | | | | | | | |
| 1 | Denotes a country of primary exposure |
| 3 | Amount is less than 0.05% |
| 4 | Security was purchased pursuant to Regulation S under the Securities Act of 1933 which exempts from registration securities offered and sold outside of the United States. Such a security cannot be sold in the United States without either an effective registration statement filed pursuant to the Securities Act of 1933, or pursuant to an exemption from registration. These securities have been deemed liquid under guidelines approved by the Trust’s Board of Trustees. At November 30, 2020, the aggregate value of these securities was $243,669 representing 2.8% of net assets. |
| 5 | Canadian Imperial Bank is a fixed to float bond. The bond has a fixed rate until 01/26/2021. The interest rate represents the rate in effect at November 30, 2020. |
| 6 | Variable rate security. The interest rate represents the rate in effect at November 30, 2020, and resets periodically based on the parenthetically disclosed reference rate and spread. |
ADR: American Depositary Receipt
BRL: Brazilian Real
CAD: Canadian Dollar
MXN: Mexican Peso
| | | | | | | | | | | | |
| | | | | | | |
| The accompanying notes are an integral part of these financial statements. | | Annual Report | | November 30, 2020 | | | | | | | | 33 |
Sextant Global High Income Fund
| | | | | | | | | | | | |
| | | Schedule of Investments | | | | | | As of November 30, 2020 |
| | | | |
Countries | | | (unaudited) | |
| |
| |
|
 | |
|
| Weightings shown are a percentage of total net assets. | |
| | | | | | | | | | | | |
Bond Quality Diversification | | | | (unaudited) | |
| | | |
| % of Total Net Assets | | | | | | | | | |
| | | |
Rated “A+” | | | 3.3% | | | ∎ | | | | | 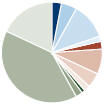 | |
Rated “BBB+” | | | 4.9% | | | ∎ | | |
Rated “BBB” | | | 11.6% | | | ∎ | | |
Rated “BBB-” | | | 1.8% | | | ∎ | | |
Rated “BB+” | | | 2.5% | | | ∎ | | |
Rated “BB” | | | 7.4% | | | ∎ | | |
Rated “BB-” | | | 5.4% | | | ∎ | | |
Rated “B” | | | 1.9% | | | ∎ | | |
Rated “CCC+” | | | 1.0% | | | ∎ | | |
Not rated | | | 2.4% | | | ∎ | | |
Equity | | | 39.9% | | | ∎ | | |
Other assets (net of liabilities) | | | 17.9% | | | ∎ | | |
|
| Credit ratings are the lesser of S&P Global Ratings or Moody’s Investors Service. If neither S&P nor Moody’s rate a particular security, that security is categorized as not rated (except for US Treasury securities and securities issued or backed by US agencies which inherit the credit rating for the US government). Ratings range from AAA (highest) to D (lowest). Bonds rated BBB or above are considered investment grade. Credit ratings BB and below are lower-rated securities (junk bonds). Ratings apply to the creditworthiness of the issuers of the underlying securities and not the Fund or its shares. Ratings may be subject to change. | |
| | | | | | | | | | | | |
| | | | | | | |
| 34 | | | | | | | | November 30, 2020 | | Annual Report | | The accompanying notes are an integral part of these financial statements. |
Sextant Global High Income Fund
Statement of Assets and Liabilities
| | | | |
| As of November 30, 2020 | |
| | |
| | | | |
| |
Assets | | | | |
| |
Investments in securities, at value (Cost $7,098,132) | | | $7,073,446 | |
| |
Cash | | | 1,454,623 | |
| |
Dividends and interest receivable | | | 91,989 | |
| |
Prepaid expenses | | | 3,597 | |
| |
Receivable for Fund shares sold | | | 1,329 | |
| | | | |
| |
Total assets | | | 8,624,984 | |
| | | | |
| |
Liabilities | | | | |
| |
Accrued audit expenses | | | 4,760 | |
| |
Accrued retirement plan custody fee | | | 1,767 | |
| |
Accrued trustee expenses | | | 1,001 | |
| |
Accrued legal expenses | | | 874 | |
| |
Accrued advisory fees | | | 651 | |
| |
Accrued Chief Compliance Officer expenses | | | 406 | |
| |
Accrued other operating expenses | | | 300 | |
| |
Accrued printing fees | | | 260 | |
| | | | |
| |
Total liabilities | | | 10,019 | |
| | | | |
| |
Net assets | | | $8,614,965 | |
| | |
| | | | |
| | |
Analysis of net assets | | | | |
| |
Paid-in capital (unlimited shares authorized, without par value) | | | $8,812,262 | |
| |
Total distributable earnings (losses) | | | (197,297 | ) |
| | | | |
| |
Net assets applicable to Fund shares outstanding | | | $8,614,965 | |
| | |
| | | | |
Fund shares outstanding | | | 848,467 | |
| | |
Net asset value, offering and redemption price per share | | | $10.15 | |
| | | | | |
Statement of Operations
| | | | |
| Year ended November 30, 2020 | |
| | |
| | | | |
| |
Investment income | | | | |
| |
Interest income | | | $191,597 | |
| |
Dividend Income (net of foreign tax of ($12,022)) | | | 129,174 | |
| |
Miscellaneous income | | | 9 | |
| | | | |
| |
Total investment income | | | 320,780 | |
| | | | |
| |
Expenses | | | | |
| |
Investment advisory fees | | | 25,729 | |
| |
Filing and registration fees | | | 16,820 | |
| |
Audit fees | | | 5,804 | |
| |
Trustee fees | | | 2,868 | |
| |
Printing and postage fees | | | 2,468 | |
| |
Chief Compliance Officer expenses | | | 2,225 | |
| |
Legal fees | | | 2,219 | |
| |
Retirement plan custodial fees | | | 2,130 | |
| |
Other expenses | | | 674 | |
| |
Custodian fees | | | 605 | |
| | | | |
| |
Total gross expenses | | | 61,542 | |
| | | | |
| |
Less adviser fees waived | | | (12,728 | ) |
| |
Less custodian fee credits | | | (605 | ) |
| | | | |
| |
Net expenses | | | 48,209 | |
| | | | |
| |
Net investment income | | | $272,571 | |
| | |
| | | | |
| | |
| | | | |
| |
Net realized loss from investments and foreign currency | | | $(448,924 | ) |
| |
Net decrease in unrealized appreciation on investments and foreign currency | | | (239,731 | ) |
| | | | |
| |
Net loss on investments | | | $(688,655 | ) |
| | |
| | | | |
| | |
Net decrease in net assets resulting from operations | | | $(416,084 | ) |
| | | | | |
| | | | | | | | | | | | |
| | | | | | | |
| The accompanying notes are an integral part of these financial statements. | | Annual Report | | November 30, 2020 | | | | | | | | 35 |
Sextant Global High Income Fund
| | | | | | | | |
Statements of Changes in Net Assets | | | Year ended November 30, 2020 | | | | Year ended November. 30, 2019 | |
| | | |
Increase (decrease) in net assets from operations | | | | | | | | |
| | |
From operations | | | | | | | | |
| | |
Net investment income | | | $272,571 | | | | $360,411 | |
| | |
Net realized gain (loss) on investment and foreign currency | | | (448,924 | ) | | | 470,083 | |
| | |
Net decrease in unrealized appreciation | | | (239,731 | ) | | | (183,400 | ) |
| | | | | | | | |
| | |
Net increase (decrease) in net assets | | | (416,084 | ) | | | 647,094 | |
| | | | | | | | |
| | |
| | | | | | | | |
| | |
Distributions to shareowners | | | (795,251 | ) | | | (311,447 | ) |
| | |
| | | | | | | | |
| | |
Capital share transactions | | | | | | | | |
| | |
Proceeds from sales of shares | | | 601,211 | | | | 1,877,127 | |
| | |
Value of shares issued in reinvestment of dividends | | | 778,163 | | | | 305,590 | |
| | |
Cost of shares redeemed | | | (1,446,472 | ) | | | (1,452,378 | ) |
| | | | | | | | |
| | |
Total capital shares transactions | | | (67,098 | ) | | | 730,339 | |
| | | | | | | | |
| | |
Total increase (decrease) in net assets | | | (1,278,433 | ) | | | 1,065,986 | |
| | | |
| | | | | | | | |
| | | |
Net assets | | | | | | | | |
| | |
Beginning of year | | | 9,893,398 | | | | 8,827,412 | |
| | |
End of year | | | $8,614,965 | | | | $9,893,398 | |
| | | |
| | | | | | | | |
| | | |
Shares of the Fund sold and redeemed | | | | | | | | |
| | |
Number of shares sold | | | 60,877 | | | | 168,864 | |
| | |
Number of shares issued in reinvestment of dividends | | | 72,726 | | | | 29,440 | |
| | |
Number of shares redeemed | | | (151,136 | ) | | | (130,029 | ) |
| | | | | | | | |
| | |
Net increase (decrease) in number of shares outstanding | | | (17,533 | ) | | | 68,275 | |
| | | |
| | | | | | | | |
| | | | | | | | | | | | | | | | | | | | |
Financial Highlights | | | | | | | For Year ended November 30, | | | | | |
| | | | | |
Selected data per share of outstanding capital stock throughout each year: | | | 2020 | | | | 2019 | | | | 2018 | | | | 2017 | | | | 2016 | |
| | | | | | |
Net asset value at beginning of year | | | $11.42 | | | | $11.07 | | | | $11.12 | | | | $10.11 | | | | $8.89 | |
| | | | | |
Income from investment operations | | | | | | | | | | | | | | | | | | | | |
| | | | | |
Net investment income | | | 0.31 | | | | 0.42 | | | | 0.40 | | | | 0.35 | | | | 0.45 | |
| | | | | |
Net gains (losses) on securities (both realized and unrealized) | | | (0.66 | ) | | | 0.32 | | | | (0.15 | ) | | | 1.11 | | | | 0.77 | |
| | | | | | | | | | | | | | | | | | | | |
| | | | | |
Total from investment operations | | | (0.35 | ) | | | 0.74 | | | | 0.25 | | | | 1.46 | | | | 1.22 | |
| | | | | | | | | | | | | | | | | | | | |
| | | | | |
Less distributions | | | | | | | | | | | | | | | | | | | | |
| | | | | |
Dividends from net investment income | | | (0.40 | ) | | | (0.39 | ) | | | (0.30 | ) | | | (0.45 | ) | | | - | |
| | | | | |
Distributions from capital gains | | | (0.52 | ) | | | | | | | | | | | | | | | | |
| | | | | | | | | | | | | | | | | | | | |
| | | | | |
Total distributions | | | (0.92 | ) | | | (0.39 | ) | | | (0.30 | ) | | | (0.45 | ) | | | - | |
| | | | | | | | | | | | | | | | | | | | |
| | | | | |
| | | | | | | | | | | | | | | | | | | | |
| | | | | |
Net asset value at end of year | | | $10.15 | | | | $11.42 | | | | $11.07 | | | | $11.12 | | | | $10.11 | |
| | | | | | |
| | | | | | | | | | | | | | | | | | | | |
Total return | | | -3.51% | | | | 7.06% | | | | 2.31% | | | | 15.01% | | | | 13.72% | |
| | | | | | |
Ratios / supplemental data | | | | | | | | | | | | | | | | | | | | |
| | | | | |
Net assets ($000), end of year | | | $8,615 | | | | $9,893 | | | | $8,827 | | | | $9,373 | | | | $7,570 | |
| | | | | |
Ratio of expenses to average net assets | | | | | | | | | | | | | | | | | | | | |
| | | | | |
Before fee waivers | | | 0.70% | | | | 1.11% | | | | 0.97% | | | | 1.18% | | | | 1.17% | |
| | | | | |
After fee waivers | | | 0.56% | | | | 0.76% | | | | 0.75% | | | | 0.83% | | | | 0.91% | |
| | | | | |
After fee waivers and custodian fee credits | | | 0.55% | | | | 0.75% | | | | 0.75% | | | | 0.82% | | | | 0.90% | |
| | | | | |
Ratio of net investment income after fee waivers and custodian fee credits to average net assets | | | 3.12% | | | | 3.72% | | | | 3.43% | | | | 3.34% | | | | 4.78% | |
| | | | | |
Portfolio turnover rate | | | 27% | | | | 33% | | | | 10% | | | | 8% | | | | 26% | |
| | | | | | |
| | | | | | | | | | | | | | | | | | | | |
| | | | | | | | | | | | |
| | | | | | | |
| 36 | | | | | | | | November 30, 2020 | | Annual Report | | The accompanying notes are an integral part of these financial statements. |
Sextant Growth Fund
| | |
| | |
Performance Summary | | (unaudited) |
| | | | | | | | | | | | | | | | |
Average Annual Total Returns as of November 30, 2020 | |
| | | | | |
| | | 1 Year | | | 5 Year | | | 10 Year | | | Expense Ratio1 | |
| | | | |
Sextant Growth Fund Investor Shares (SSGFX) | | | 29.49% | | | | 15.53% | | | | 13.55% | | | | 1.20% | |
| | | | | |
Sextant Growth Fund Z Shares (SGZFX)2 | | | 29.79% | | | | n/a | | | | n/a | | | | 0.90% | |
| | | | |
S&P 500 Index | | | 17.46% | | | | 13.97% | | | | 14.18% | | | | n/a | |
| | |
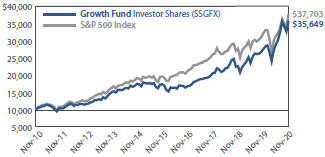 | | Comparison of any mutual fund to a market index must be made bearing in mind that the index is expense-free. Conversely, the fund will (1) be actively managed; (2) have an objective other than mirroring the index, such as limiting risk; (3) bear transaction and other costs; (4) stand ready to buy and sell its securities to shareowners on a daily basis; and (5) provide a wide range of services. The graph compares $10,000 invested in Investor Shares of the Fund on November 30, 2010, to an identical amount invested in the S&P 500 Index, an index comprised of 500 widely held common stocks considered to be representative of the US stock market in general. The graph shows that an investment in the Investor Shares of the Fund would have risen to $35,649 versus $37,703 in the index. |
Past performance does not guarantee future results. The “Growth of $10,000” graph and “Average Annual Returns” performance table assume the reinvestment of dividends and capital gains. They do not reflect the deduction of taxes that a shareowner might pay on fund distributions or the redemption of fund shares.
| 1 | By regulation, the expense ratio shown in this table is as stated in the Fund’s most recent prospectus, which is dated March 27, 2020, and incorporates results for the fiscal year ended November 30, 2019. The ratio presented in this table differs from expense ratios shown elsewhere in this report as they represent different periods. |
| 2 | Sextant Growth Fund Z Shares (SGZFX) began operations June 2, 2017. |
Fund Objective
The objective of the Growth Fund is long-term capital growth.
| | | | | | | | |
Top 10 Holdings | | | | | | | | |
| | |
| | | % of Total Net Assets | |
| |
Amazon.com | | | | 8.2% | |
| | |
Apple | | | | | | | 8.1% | |
| |
Adobe | | | | 7.5% | |
| | |
Microsoft | | | | | | | 6.9% | |
| | |
Mastercard, Class A | | | | | | | 5.1% | |
| | |
Alphabet, Class A | | | | | | | 4.7% | |
| | |
Abbott Laboratories | | | | | | | 3.8% | |
| | |
DocuSign | | | | | | | 3.3% | |
| | |
Costco Wholesale | | | | | | | 3.2% | |
| | |
Qualcomm | | | | | | | 3.0% | |
| | | | | | | | | | | | |
Portfolio Diversification | | | | | | | | | | | | |
| | | |
| % of Total Net Assets | | | | | | | | | |
| | | |
Application Software | | | 14.0% | | | ∎ | | | | | 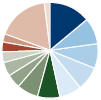 | |
Infrastructure Software | | | 9.0% | | | ∎ | | |
E-Commerce Discretionary | | | 8.2% | | | ∎ | | |
Communications Equipment | | | 8.1% | | | ∎ | | |
Semiconductor Devices | | | 7.5% | | | ∎ | | |
Medical Devices | | | 7.4% | | | ∎ | | |
Consumer Finance | | | 7.2% | | | ∎ | | |
Home Products Stores | | | 4.9% | | | ∎ | | |
Internet Media | | | 4.7% | | | ∎ | | |
Restaurants | | | 3.6% | | | ∎ | | |
Mass Merchants | | | 3.2% | | | ∎ | | |
Large Pharma | | | 3.0% | | | ∎ | | |
Other industries < 3.0% | | | 17.3% | | | ∎ | | |
Other assets (net of liabilities) | | | 1.9% | | | ∎ | | |
| | | | | | | | | | |
| | | | | | |
| Annual Report | | November 30, 2020 | | | | | | | | 37 |
Sextant Growth Fund
| | |
Discussion of Fund Performance | | (unaudited) |
(photo omitted)
Fiscal Year 2020
For the fiscal year ended November 30, 2020, the Sextant Growth Fund Investor Shares returned 29.49%, well ahead of the 17.46% gain for the S&P 500 Index. In 2017, Z Shares without a 12b-1 fee expense were introduced, and now 91.19% of the Fund benefits from this lower expense option. Unlike the previous two years, the Fund trailed other large capitalization growth-oriented funds, as its Morningstar US Large Growth category peer group returned an average of 33.58% over the same period.
Factors Affecting Past Performance
Sextant Growth’s performance, while solid, suffered from a lack of exposure to several of the strongest growth stories of 2020. We do not invest in unprofitable companies and, in 2020, many such companies built to exploit remote work, remote exercise, etc. experienced dramatic appreciation. Nonetheless, Technology accounts for the Fund’s largest exposure, and stock selection within that group excelled. Adobe, Apple, Microsoft, Xilinx, and Qualcomm all significantly outperformed the Technology sector. Whether Amazon is a Technology stock due to cloud services or a Consumer stock can be debated, but it also appreciated far more than the overall sector. The weakest performance among our Technology stocks was within payments as Mastercard and Fidelity National Information Services did no better than to tread water as consumers pulled back on spending and travel ground to a halt. Alphabet (Google) improved on last year’s performance and also managed to outpace the sector, although, within media, the performance of gaming stock Take-Two Interactive was even more impressive. Following Technology, Consumer Discretionary stocks made the largest contribution to Fund returns, driven by the aforementioned Amazon. Our DIY positions in Lowe’s and Home Depot also contributed, as there were more people working from home who decided to upgrade their surroundings. Nike has invested aggressively in developing its omni-channel capabilities, which came through in the form of strong e-commerce sales helping to drive the shares higher. In Materials, coatings specialist RPM, along with environmental supplies and cleaning firm Ecolab and gold miner Newmont, all provided positive returns. Health Care once again proved a mixed bag. Pharmaceutical investments Bristol-Myers and Merck each had another desultory year, but we find valuations and growth prospects compelling. Health Care equipment firm Abbott Labs did well despite the COVID impact on elective procedures. Our investments in Industrials and Finance eroded Fund returns. Within Industrials, Honeywell was the primary laggard and we exited the position due to an unattractive growth versus valuation outlook.
Looking Forward
The economic outlook for 2021 stands in marked contrast to 2020. Despite the arrival of a coronavirus vaccine, real improvement may not occur until the back half of the year. Vaccine distribution has failed to meet expectations and the breakdown of social distancing guidelines over the holiday season could easily lead to a major surge in infections over the first part of the year. As of writing, it appears the Democratic Party has regained control of the Senate via two razor-thin victories in Georgia. Control of all three branches of government raises the possibility of strengthening the Affordable Care Act (possibly benefiting Health Care stocks), an infrastructure development plan (which could filter through to various sectors), and a partial rollback of the Trump corporate tax cuts. We will clearly be devoting much thought to potential investment themes with such a dramatic change in government. Naturally, we aren’t going to provide any projections for market returns over the coming year, but believe as always that staying invested for the long term remains the best strategy.
Management Fee Calculations
The Sextant Growth Fund calculates the performance part of its management fee by comparing the Fund’s return to the average return in Morningstar’s “Large Growth” category. Sextant Growth Fund Investor Shares’ 12-month return of 29.49% was more than 2% below the Morningstar™ category average of 33.58% at month-end November 30, 2020. Therefore, the base annual management fee of 0.50% for the Fund as a whole was decreased by 0.20% to 0.30% for the month of December 2020.
| | | | | | | | | | |
| | | | | | |
| 38 | | | | | | | | November 30, 2020 | | Annual Report |
Sextant Growth Fund
| | | | | | | | | | | | | | | | | | |
| | | Schedule of Investments | | | As of November 30, 2020 | |
| | | | | | | |
| | | Common Stock – 98.1% | | | | Number of Shares | | Cost | | | Market Value | | | Percentage of Net Assets | |
| | | | | | |
| | | Communications | | | | | | | | | | | | | |
| | | | | | | |
| | | Internet Media | | | | | | | | | | | | | |
| | | | | | | |
| | | Alphabet, Class A1 | | | | 1,584 | | | $898,428 | | | | $2,778,970 | | | | 4.7% | |
| | | | | | | |
| | | | | | | | | 898,428 | | | | 2,778,970 | | | | 4.7% | |
| | | | | | |
| | | Consumer Discretionary | | | | | | | | | | | | | |
| | | | | | | |
| | | Airlines | | | | | | | | | | | | | |
| | | | | | | |
| | | Southwest Airlines | | | | 12,500 | | | 583,417 | | | | 579,250 | | | | 1.0% | |
| | | | | |
| | | Apparel, Footwear & Accessory Design | | | | | | | | | |
| | | | | | | |
| | | Nike, Class B | | | | 10,276 | | | 528,776 | | | | 1,384,177 | | | | 2.3% | |
| | | | | | | |
| | | E-Commerce Discretionary | | | | | | | | | | | | | |
| | | | | | | |
| | | Amazon.com1 | | | | 1,529 | | | 278,191 | | | | 4,843,933 | | | | 8.2% | |
| | | | | | | |
| | | Home Improvement | | | | | | | | | | | | | | | | |
| | | | | | | |
| | | Stanley Black & Decker | | | | 8,684 | | | 795,475 | | | | 1,600,548 | | | | 2.7% | |
| | | | | | | |
| | | Home Products Stores | | | | | | | | | | | | | |
| | | | | | | |
| | | Home Depot | | | | 4,000 | | | 451,717 | | | | 1,109,640 | | | | 1.9% | |
| | | | | | | |
| | | Lowe’s | | | | 11,200 | | | 794,834 | | | | 1,745,184 | | | | 3.0% | |
| | | | | | | |
| | | | | | | | | | | | | | | | | | | |
| | | | | | | |
| | | | | | | | | | 1,246,551 | | | | 2,854,824 | | | | 4.9% | |
| | | | | | | |
| | | Other Commercial Services | | | | | | | | | | | | | |
| | | | | | | |
| | | Ecolab | | | | 6,243 | | | 704,507 | | | | 1,386,883 | | | | 2.4% | |
| | | | | | | |
| | | Restaurants | | | | | | | | | | | | | |
| | | | | | | |
| | | Domino’s Pizza | | | | 1,800 | | | 588,465 | | | | 706,626 | | | | 1.2% | |
| | | | | | | |
| | | Starbucks | | | | 14,674 | | | 610,056 | | | | 1,438,345 | | | | 2.4% | |
| | | | | | | |
| | | | | | | | | | | | | | | | | | | |
| | | | | | | |
| | | | | | | | | | 1,198,521 | | | | 2,144,971 | | | | 3.6% | |
| | | | | | | |
| | | Specialty Apparel Stores | | | | | | | | | | | | | |
| | | | | | | |
| | | TJX Companies | | | | 11,078 | | | 330,472 | | | | 703,564 | | | | 1.2% | |
| | | | | | | |
| | | | | | | | | 5,665,910 | | | | 15,498,150 | | | | 26.3% | |
| | | | | | |
| | | Consumer Staples | | | | | | | | | | | | | |
| | | | | | | |
| | | Mass Merchants | | | | | | | | | | | | | |
| | | | | | | |
| | | Costco Wholesale | | | | 4,883 | | | 599,638 | | | | 1,913,013 | | | | 3.2% | |
| | | | | | | |
| | | | | | | | | 599,638 | | | | 1,913,013 | | | | 3.2% | |
| | | | | | |
| | | Financials | | | | | | | | | | | | | |
| | | | | | | |
| | | Consumer Finance | | | | | | | | | | | | | |
| | | | | | | |
| | | Fidelity National Information Services | | | | 8,358 | | | 654,447 | | | | 1,240,411 | | | | 2.1% | |
| | | | | | | |
| | | Mastercard, Class A | | | | 8,914 | | | 806,925 | | | | 2,999,650 | | | | 5.1% | |
| | | | | | | |
| | | | | | | | | | | | | | | | | | | |
| | | | | | | |
| | | | | | | | | | 1,461,372 | | | | 4,240,061 | | | | 7.2% | |
Continued on next page.
| | | | | | | | | | | | |
| | | | | | | |
| The accompanying notes are an integral part of these financial statements. | | Annual Report | | November 30, 2020 | | | | | | | | 39 |
Sextant Growth Fund
| | | | | | | | | | | | | | | | | | |
| | | Schedule of Investments | | | | | | | | | | | | | As of November 30, 2020 |
| | | | | | | |
| | | Common Stock – 98.1% | | | | Number of Shares | | | Cost | | | Market Value | | | Percentage of Net Assets |
| | | | | | |
| | | Financials (continued) | | | | | | | | | | | | | |
| | | | | | | |
| | | Institutional Brokerage | | | | | | | | | | | | | |
| | | | | | | |
| | | Virtu Financial | | | | | 25,000 | | | | $469,842 | | | | $569,750 | | | 1.0% |
| | | | | | | |
| | | | | | | | | | | 1,931,214 | | | | 4,809,811 | | | 8.2% |
| | | | | | |
| | | Health Care | | | | | | | | | | | | | |
| | | | | | | |
| | | Large Pharma | | | | | | | | | | | | | |
| | | | | | | |
| | | Bristol-Myers Squibb | | | | | 15,600 | | | | 722,502 | | | | 973,440 | | | 1.7% |
| | | | | | | |
| | | Merck & Co | | | | | 10,000 | | | | 690,577 | | | | 803,900 | | | 1.3% |
| | | | | | | |
| | | | | | | | | | | | | | | | | | | |
| | | | | | | |
| | | | | | | | | | | | 1,413,079 | | | | 1,777,340 | | | 3.0% |
| | | | | | | |
| | | Medical Devices | | | | | | | | | | | | | |
| | | | | | | |
| | | Abbott Laboratories | | | | | 20,799 | | | | 646,854 | | | | 2,250,868 | | | 3.8% |
| | | | | | | |
| | | Edwards Lifesciences1 | | | | | 17,100 | | | | 546,521 | | | | 1,434,519 | | | 2.4% |
| | | | | | | |
| | | Stryker | | | | | 3,000 | | | | 374,100 | | | | 700,200 | | | 1.2% |
| | | | | | | |
| | | | | | | | | | | | | | | | | | | |
| | | | | | | |
| | | | | | | | | | | | 1,567,475 | | | | 4,385,587 | | | 7.4% |
| | | | | | | |
| | | | | | | | | | | 2,980,554 | | | | 6,162,927 | | | 10.4% |
| | | | | | |
| | | Industrials | | | | | | | | | | | | | |
| | | | | | |
| | | Commercial & Residential Building Equipment &
Systems | | | | | | | | | | | |
| | | | | | | |
| | | Johnson Controls International | | | | | 13,000 | | | | 589,689 | | | | 598,520 | | | 1.0% |
| | | | | | | |
| | | Measurement Instruments | | | | | | | | | | | | | |
| | | | | | | |
| | | Trimble1 | | | | | 12,000 | | | | 415,876 | | | | 718,440 | | | 1.2% |
| | | | | | | |
| | | | | | | | | | | 1,005,565 | | | | 1,316,960 | | | 2.2% |
| | | | | | |
| | | Materials | | | | | | | | | | | | | |
| | | | | | | |
| | | Precious Metal Mining | | | | | | | | | | | | | |
| | | | | | | |
| | | Newmont Corporation | | | | | 18,000 | | | | 1,012,076 | | | | 1,058,760 | | | 1.8% |
| | | | | | | |
| | | Specialty Chemicals | | | | | | | | | | | | | |
| | | | | | | |
| | | RPM International | | | | | 18,000 | | | | 737,644 | | | | 1,584,180 | | | 2.7% |
| | | | | | | |
| | | | | | | | | | | 1,749,720 | | | | 2,642,940 | | | 4.5% |
| | | | | | |
| | | Technology | | | | | | | | | | | | | |
| | | | | | | |
| | | Application Software | | | | | | | | | | | | | |
| | | | | | | |
| | | Adobe1 | | | | | 9,300 | | | | 92,094 | | | | 4,449,771 | | | 7.5% |
| | | | | | | |
| | | DocuSign1 | | | | | 8,500 | | | | 658,445 | | | | 1,936,980 | | | 3.3% |
| | | | | | | |
| | | Electronic Arts1 | | | | | 4,000 | | | | 468,793 | | | | 511,000 | | | 0.9% |
| | | | | | | |
| | | Take-Two Interactive Software1 | | | | | 7,500 | | | | 797,765 | | | | 1,353,825 | | | 2.3% |
| | | | | | | |
| | | | | | | | | | | | | | | | | | | |
| | | | | | | |
| | | | | | | | | | | | 2,017,097 | | | | 8,251,576 | | | 14.0% |
| | | | | | | | | | | | | | | | | | |
| | | | | | | | | | | | | | | | | | Continued on next page. |
| | | | | | | | | | | | |
| | | | | | | |
| 40 | | | | | | | | November 30, 2020 | | Annual Report | | The accompanying notes are an integral part of these financial statements. |
Sextant Growth Fund
| | | | | | | | | | | | | | | | | | |
| | | Schedule of Investments | | | | | | | | | As of November 30, 2020 |
| | | | | | | |
| | | Common Stock – 98.1% | | | | Number of Shares | | | Cost | | | Market Value | | | Percentage of Net Assets |
| | | | | | |
| | | Technology (continued) | | | | | | | | | | | | | |
| | | | | | | |
| | | Communications Equipment | | | | | | | | | | | | | |
| | | | | | | |
| | | Apple | | | | | 40,000 | | | | $11,787 | | | | $4,762,000 | | | 8.1% |
| | | | | | | |
| | | Infrastructure Software | | | | | | | | | | | | | |
| | | | | | | |
| | | Microsoft | | | | | 18,920 | | | | 872,435 | | | | 4,050,204 | | | 6.9% |
| | | | | | | |
| | | Oracle | | | | | 21,300 | | | | 1,083,234 | | | | 1,229,436 | | | 2.1% |
| | | | | | | |
| | | | | | | | | | | | | | | | | | | |
| | | | | | | |
| | | | | | | | | | | | 1,955,669 | | | | 5,279,640 | | | 9.0% |
| | | | | | | |
| | | Semiconductor Devices | | | | | | | | | | | | | |
| | | | | | | |
| | | NVIDIA | | | | | 1,200 | | | | 547,930 | | | | 643,272 | | | 1.0% |
| | | | | | | |
| | | Qualcomm | | | | | 12,000 | | | | 805,753 | | | | 1,766,040 | | | 3.0% |
| | | | | | | |
| | | Texas Instruments | | | | | 3,600 | | | | 386,981 | | | | 580,500 | | | 1.0% |
| | | | | | | |
| | | Xilinx | | | | | 10,000 | | | | 905,256 | | | | 1,455,500 | | | 2.5% |
| | | | | | | |
| | | | | | | | | | | | | | | | | | | |
| | | | | | | |
| | | | | | | | | | | | 2,645,920 | | | | 4,445,312 | | | 7.5% |
| | | | | | | |
| | | | | | | | | | | 6,630,473 | | | | 22,738,528 | | | 38.6% |
| | | | | | |
| | | | | | | | | | | | | | | | | | |
| | | | | | | |
| | Total investments | | | | | | | | | $21,461,502 | | | | $57,861,299 | | | 98.1% |
| | | | | | |
| | Other assets (net of liabilities) | | | | | | | | | | | | | 1,111,484 | | | 1.9% |
| | | | | | |
| | Total net assets | | | | | | | | | | | | | $58,972,783 | | | 100.0% |
| | | | | | | |
| | | | | | | | | | | | | | | | | | |
| 1 | Non-income producing security |
| | | | | | | | | | | | |
| | | | | | | |
| The accompanying notes are an integral part of these financial statements. | | Annual Report | | November 30, 2020 | | | | | | | | 41 |
Sextant Growth Fund
Statement of Assets and Liabilities
| | | | |
| As of November 30, 2020 | |
| | |
| | | | |
| |
Assets | | | | |
| |
Investments in securities, at value
(Cost $21,461,502) | | | $57,861,299 | |
| |
Cash | | | 1,125,862 | |
| |
Dividends receivable | | | 26,474 | |
| |
Receivable for Fund shares sold | | | 9,361 | |
| |
Prepaid expenses | | | 8,468 | |
| |
Other assets | | | 1,215 | |
| | | | |
| |
Total assets | | | 59,032,679 | |
| | | | |
| |
Liabilities | | | | |
| |
Accrued advisory fees | | | 23,632 | |
| |
Accrued audit expenses | | | 14,035 | |
| |
Accrued retirement plan custody fee | | | 7,764 | |
| |
Accrued trustee expenses | | | 4,071 | |
| |
Accrued printing fees | | | 3,424 | |
| |
Accrued other liabilities | | | 2,496 | |
| |
Accrued legal expenses | | | 1,673 | |
| |
Accrued Chief Compliance Officer expenses | | | 1,222 | |
| |
Accrued 12b-1 distribution fees | | | 1,052 | |
| |
Payable for Fund shares redeemed | | | 527 | |
| | | | |
| |
Total liabilities | | | 59,896 | |
| | | | |
| |
Net assets | | | $58,972,783 | |
| | |
| | | | |
| | |
Analysis of net assets | | | | |
| |
Paid-in capital (unlimited shares authorized, without par value) | | | $22,197,742 | |
| |
Total distributable earnings | | | 36,775,041 | |
| | | | |
| |
Net assets applicable to Fund shares outstanding | | | $58,972,783 | |
| | |
| | | | |
| | |
Net asset value per Investor Share | | | SSGFX | |
| |
Net assets, at value | | | $5,197,257 | |
| |
Shares outstanding | | | 124,153 | |
| |
Net asset value, offering and redemption price per share | | | $41.86 | |
| | |
| | | | |
| | |
Net asset value per Z Share | | | SGZFX | |
| |
Net assets, at value | | | $53,775,526 | |
| |
Shares outstanding | | | 1,287,232 | |
| |
Net asset value, offering and redemption price per share | | | $41.78 | |
| | |
| | | | |
Statement of Operations
| | | | |
| Year ended November 30, 2020 | |
| | |
| | | | |
| |
Investment income | | | | |
| |
Dividend income | | | $476,735 | |
| |
Miscellaneous income | | | 102 | |
| | | | |
| |
Total investment income | | | 476,837 | |
| | | | |
| |
Expenses | | | | |
| |
Investment advisory fees | | | 289,231 | |
| |
Audit fees | | | 28,265 | |
| |
Filing and registration fees | | | 23,146 | |
| |
Printing and postage fees | | | 16,644 | |
| |
Trustee fees | | | 12,216 | |
| |
Distribution fees - Investor Shares | | | 11,519 | |
| |
Legal fees | | | 9,566 | |
| |
Chief Compliance Officer expenses | | | 9,164 | |
| |
Retirement plan custodial fees | | | | |
| |
Investor Shares | | | 7 | |
| |
Z Shares | | | 8,369 | |
| |
Other expenses | | | 7,486 | |
| |
Custodian fees | | | 2,043 | |
| | | | |
| |
Total gross expenses | | | 417,656 | |
| | | | |
| |
Less custodian fee credits | | | (2,043 | ) |
| | | | |
| |
Net expenses | | | 415,613 | |
| | | | |
| |
Net investment income | | | $61,224 | |
| | |
| | | | |
| | |
| | | | |
| |
Net realized gain from investments | | | $314,003 | |
| |
Net increase in unrealized appreciation on investments | | | 13,070,176 | |
| | | | |
| |
Net gain on investments | | | $13,384,179 | |
| | |
| | | | |
| | |
Net increase in net assets resulting from operations | | | $13,445,403 | |
| | | | | |
| | | | | | | | | | | | |
| | | | | | | |
| 42 | | | | | | | | November 30, 2020 | | Annual Report | | The accompanying notes are an integral part of these financial statements. |
Sextant Growth Fund
| | | | | | | | |
Statements of Changes in Net Assets | | | Year ended November 30, 2020 | | | | Year ended November 30, 2019 | |
| | | |
Increase in net assets from operations | | | | | | | | |
| | |
From operations | | | | | | | | |
| | |
Net investment income | | | $61,224 | | | | $80,770 | |
| | |
Net realized gain on investment | | | 314,003 | | | | 1,280,957 | |
| | |
Net increase in unrealized appreciation | | | 13,070,176 | | | | 6,878,691 | |
| | | | | | | | |
| | |
Net increase in net assets | | | 13,445,403 | | | | 8,240,418 | |
| | | | | | | | |
| | |
| | | | | | | | |
| | |
Distributions to shareowners | | | | | | | | |
| | |
| | | | | | | | |
| | |
Net distribution to shareholders – Investor Shares | | | (130,452 | ) | | | (169,455 | ) |
| | |
Net distribution to shareholders – Z Shares | | | (1,224,681 | ) | | | (1,652,425 | ) |
| | | | | | | | |
| | |
Total distributions | | | (1,355,133 | ) | | | (1,821,880 | ) |
| | | | | | | | |
| | |
Capital share transactions | | | | | | | | |
| | |
Proceeds from sales of shares | | | | | | | | |
| | |
Investor Shares | | | 742,865 | | | | 583,085 | |
| | |
Z Shares | | | 2,863,064 | | | | 1,729,858 | |
| | |
Value of shares issued in reinvestment of dividends | | | | | | | | |
| | |
Investor Shares | | | 100,384 | | | | 128,694 | |
| | |
Z Shares | | | 1,198,196 | | | | 1,612,686 | |
| | |
Cost of shares redeemed | | | | | | | | |
| | |
Investor Shares | | | (1,218,150 | ) | | | (1,779,676 | ) |
| | |
Z Shares | | | (2,314,321 | ) | | | (2,410,583 | ) |
| | | | | | | | |
| | |
Total capital share transactions | | | 1,372,038 | | | | (135,936 | ) |
| | | | | | | | |
| | |
Total increase in net assets | | | 13,462,308 | | | | 6,282,602 | |
| | | |
| | | | | | | | |
| | | |
Net assets | | | | | | | | |
| | |
Beginning of year | | | 45,510,475 | | | | 39,227,873 | |
| | |
End of year | | | $58,972,783 | | | | $45,510,475 | |
| | | |
| | | | | | | | |
| | | |
Shares of the Fund sold and redeemed | | | | | | | | |
| | |
Investor Shares (SSGFX) | | | | | | | | |
| | |
Number of shares sold | | | 21,466 | | | | 18,789 | |
| | |
Number of shares issued in reinvestment of dividends | | | 3,043 | | | | 5,181 | |
| | |
Number of shares redeemed | | | (36,681 | ) | | | (63,178 | ) |
| | | | | | | | |
| | |
Net decrease in number of shares outstanding | | | (12,172 | ) | | | (39,208 | ) |
| | | | | | | | |
| | |
Z Shares (SGZFX) | | | | | | | | |
| | |
Number of shares sold | | | 81,492 | | | | 59,073 | |
| | |
Number of shares issued in reinvestment of dividends | | | 36,474 | | | | 65,291 | |
| | |
Number of shares redeemed | | | (66,588 | ) | | | (81,864 | ) |
| | | | | | | | |
| | |
Net increase in number of shares outstanding | | | 51,378 | | | | 42,500 | |
| | | |
| | | | | | | | |
| | | | | | | | | | | | |
| | | | | | | |
| The accompanying notes are an integral part of these financial statements. | | Annual Report | | November 30, 2020 | | | | | | | | 43 |
Sextant Growth Fund: Financial Highlights
| | | | | | | | | | | | | | | | | | | | |
Investor Shares (SSGFX) | | | For year ended November 30, | |
| | | | | |
Selected data per share of outstanding capital stock throughout each year: | | | 2020 | | | | 2019 | | | | 2018 | | | | 2017 | | | | 2016 | |
| | | | | | |
Net asset value at beginning of year | | | $33.25 | | | | $28.70 | | | | $27.51 | | | | $22.52 | | | | $24.03 | |
| | | | | |
Income (loss) from investment operations | | | | | | | | | | | | | | | | | | | | |
| | | | | |
Net investment income (loss) | | | (0.03 | )A | | | (0.03 | )A | | | 0.07 | A | | | 0.15 | A | | | 0.11 | |
| | | | | |
Net gains (losses) on securities (both realized & unrealized) | | | 9.58 | | | | 5.86 | | | | 2.53 | | | | 4.93 | | | | (0.88 | ) |
| | | | | | | | | | | | | | | | | | | | |
| | | | | |
Total from investment operations | | | 9.55 | | | | 5.83 | | | | 2.60 | | | | 5.08 | | | | (0.77 | ) |
| | | | | | | | | | | | | | | | | | | | |
| | | | | |
Less distributions | | | | | | | | | | | | | | | | | | | | |
| | | | | |
Dividends from net investment income | | | (0.01 | ) | | | (0.04 | ) | | | (0.07 | ) | | | (0.09 | ) | | | (0.02 | ) |
| | | | | |
Distributions from capital gains | | | (0.93 | ) | | | (1.24 | ) | | | (1.34 | ) | | | - | | | | (0.72 | ) |
| | | | | | | | | | | | | | | | | | | | |
| | | | | |
Total distributions | | | (0.94 | ) | | | (1.28 | ) | | | (1.41 | ) | | | (0.09 | ) | | | (0.74 | ) |
| | | | | | | | | | | | | | | | | | | | |
| | | | | |
| | | | | | | | | | | | | | | | | | | | |
| | | | | |
Net asset value at end of year | | | $41.86 | | | | $33.25 | | | | $28.70 | | | | $27.51 | | | | $22.52 | |
| | | | | | |
| | | | | | | | | | | | | | | | | | | | |
Total return | | | 29.49% | | | | 21.81% | | | | 9.95% | | | | 22.64% | | | | (3.22 | )% |
| | | | | | |
Ratios / supplemental data | | | | | | | | | | | | | | | | | | | | |
| | | | | |
Net assets ($000), end of year | | | $5,197 | | | | $4,533 | | | | $5,037 | | | | $5,962 | | | | $34,561 | |
| | | | | |
Ratio of expenses to average net assets | | | | | | | | | | | | | | | | | | | | |
| | | | | |
Before custodian fee credits | | | 1.05% | | | | 1.20% | | | | 0.92% | | | | 0.76% | | | | 0.76% | |
| | | | | |
After custodian fee credits | | | 1.05% | | | | 1.20% | | | | 0.92% | | | | 0.76% | | | | 0.76% | |
| | | | | |
Ratio of net investment income (loss) after custodian fee credits to average net assets | | | (0.08 | )% | | | (0.07 | )% | | | 0.25% | | | | 0.60% | | | | 0.39% | |
| | | | | |
Portfolio turnover rate | | | 17% | | | | 10% | | | | 17% | | | | 18% | | | | 25% | |
| | | | | | |
| | | | | | | | | | | | | | | | | | | | |
| | | | | | | | | | | | | | | | |
Z Shares (SGZFX) | | | For year ended November 30, | | | | Period ended | |
| | | | |
Selected data per share of outstanding capital stock throughout each period: | | | 2020 | | | | 2019 | | | | 2018 | | | | November 30, 2017 | B |
| | | | | |
Net asset value at beginning of period | | | $33.16 | | | | $28.65 | | | | $27.50 | | | | $25.54 | |
| | | | |
Income from investment operations | | | | | | | | | | | | | | | | |
| | | | |
Net investment income | | | 0.05 | A | | | 0.08 | A | | | 0.13 | A | | | 0.16 | A |
| | | | |
Net gains on securities (both realized & unrealized) | | | 9.56 | | | | 5.82 | | | | 2.53 | | | | 1.82 | |
| | | | | | | | | | | | | | | | |
| | | | |
Total from investment operations | | | 9.61 | | | | 5.90 | | | | 2.66 | | | | 1.98 | |
| | | | | | | | | | | | | | | | |
| | | | |
Less distributions | | | | | | | | | | | | | | | | |
| | | | |
Dividends from net investment income | | | (0.06 | ) | | | (0.15 | ) | | | (0.17 | ) | | | (0.02 | ) |
| | | | |
Distributions from capital gains | | | (0.93 | ) | | | (1.24 | ) | | | (1.34 | ) | | | - | |
| | | | | | | | | | | | | | | | |
| | | | |
Total distributions | | | (0.99 | ) | | | (1.39 | ) | | | (1.51 | ) | | | (0.02 | ) |
| | | | | | | | | | | | | | | | |
| | | | |
| | | | | | | | | | | | | | | | |
| | | | |
Net asset value at end of period | | | $41.78 | | | | $33.16 | | | | $28.65 | | | | $27.50 | |
| | | | | |
| | | | | | | | | | | | | | | | |
Total returnB | | | 29.79% | | | | 22.22% | | | | 10.20% | | | | 7.73% | C |
| | | | | |
Ratios / supplemental data | | | | | | | | | | | | | | | | |
| | | | |
Net assets ($000), end of period | | | $53,776 | | | | $40,978 | | | | $34,191 | | | | $32,017 | |
| | | | |
Ratio of expenses to average net assets | | | | | | | | | | | | | | | | |
| | | | |
Before custodian fee credits | | | 0.82% | | | | 0.90% | | | | 0.70% | | | | 0.51% | D |
| | | | |
After custodian fee credits | | | 0.82% | | | | 0.90% | | | | 0.70% | | | | 0.51% | D |
| | | | |
Ratio of net investment income after custodian fee credits to average net assets | | | 0.14% | | | | 0.23% | | | | 0.47% | | | | 0.89% | D |
| | | | |
Portfolio turnover rate | | | 17% | | | | 10% | | | | 17% | | | | 18% | C |
| | | | | |
| | | | | | | | | | | | | | | | |
| A | Calculated using average shares outstanding |
| B | Operations commenced on June 2, 2017 |
| C | Not annualized for periods of less than one year |
| D | Annualized for periods of less than one year |
| | | | | | | | | | | | |
| | | | | | | |
| 44 | | | | | | | | November 30, 2020 | | Annual Report | | The accompanying notes are an integral part of these financial statements. |
Sextant International Fund
| | |
Performance Summary | | (unaudited) |
| | | | | | | | | | | | | | | | |
Average Annual Total Returns as of November 30, 2020 | |
| | | | | |
| | | 1 Year | | | 5 Year | | | 10 Year | | | Expense Ratio1 | |
| | | | |
Sextant International Fund Investor Shares (SSIFX) | | | 9.86% | | | | 11.06% | | | | 5.92% | | | | 1.07% | |
| | | | |
Sextant International Fund Z Shares (SIFZX)2 | | | 10.09% | | | | n/a | | | | n/a | | | | 0.85% | |
| | | | |
MSCI EAFE Index | | | 6.83% | | | | 6.70% | | | | 6.34% | | | | n/a | |
Growth of $10,000
| | |
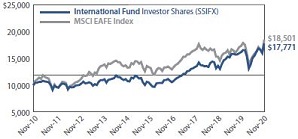 | | Comparison of any mutual fund to a market index must be made bearing in mind that the index is unmanaged, and expense-free. Conversely, the fund will (1) be actively managed; (2) have an objective other than mirroring the index, such as limiting risk; (3) bear transaction and other costs; (4) stand ready to buy and sell its securities to shareowners on a daily basis; and (5) provide a wide range of services. The graph compares $10,000 invested in Investor Shares of the Fund on November 30, 2010, to an identical amount invested in the MSCI EAFE Index, an international index focused on Europe, Australasia, and the Far East. The graph shows that an investment in Investor Shares of the Fund would have risen to $17,771 versus $18,501 in the Index. |
Past performance does not guarantee future results. The “Growth of $10,000” graph and “Average Annual Returns” performance table assume the reinvestment of dividends and capital gains. They do not reflect the deduction of taxes that a shareowner might pay on fund distributions or the redemption of fund shares.
| 1 | By regulation, the expense ratio shown in this table is as stated in the Fund’s most recent prospectus, which is dated March 27, 2020, and incorporates results for the fiscal year ended November 30, 2019. The ratio presented in this table differs from expense ratios shown elsewhere in this report as they represent different periods. |
| 2 | Sextant International Fund Z Shares (SIFZX) began operations June 2, 2017. |
Fund Objective
The objective of the International Fund is long-term capital growth.
| | | | |
Top 10 Holdings | |
| |
| % of Total Net Assets | |
| |
NICE Systems | | | 11.5% | |
| |
ASML Holding NY | | | 10.1% | |
| |
MercadoLibre | | | 9.9% | |
| |
Wolters Kluwer | | | 9.7% | |
| |
Dassault Systemes | | | 8.1% | |
| |
Novo Nordisk | | | 4.1% | |
| |
Unilever | | | 3.9% | |
| |
Novartis | | | 3.7% | |
| |
Iberdrola | | | 3.1% | |
| |
Sony | | | 3.0% | |
| | | | | | | | | | | | |
Portfolio Diversification | |
| | | |
| % of Total Net Assets | | | | | | | | | |
| | | |
Application Software | | | 22.4% | | | ∎ | | | | | 
| |
Semiconductor Mfg | | | 10.1% | | | ∎ | | |
E-Commerce Discretionary | | | 9.9% | | | ∎ | | |
Information Services | | | 9.7% | | | ∎ | | |
Large Pharma | | | 7.8% | | | ∎ | | |
Household Products | | | 7.7% | | | ∎ | | |
Consumer Electronics | | | 5.5% | | | ∎ | | |
Telecom Carriers | | | 5.1% | | | ∎ | | |
Medical Equipment | | | 4.2% | | | ∎ | | |
Power Generation | | | 3.1% | | | ∎ | | |
Other industries < 3% | | | 12.2% | | | ∎ | | |
Other assets (net of liabilities) | | | 2.3% | | | ∎ | | |
| | | | | | | | | | | | |
| | | | | | | |
| | Annual Report | | November 30, 2020 | | | | | | | | 45 |
Sextant International Fund
| | |
Discussion of Fund Performance | | (unaudited) |
(photo omitted)
Fiscal Year 2020
For the fiscal year ended November 30, 2020, the Sextant International Fund Z Shares gained 10.09%. The benchmark MSCI EAFE Index returned 6.83% for the same period. The Fund generally outperformed the benchmark during the first half of the fiscal year and in-line during the second. At fiscal year-end, the Fund recorded a 30-day yield of 0.55%, reported a turnover of 15.6% and carried a tax-loss position into fiscal 2021.
Factors Affecting Past Performance
The Sextant International Fund mandates that 65% of net assets be held in companies with their headquarters and at least half of their assets and earnings outside the US, and with market capitalizations greater than $1 billion. The Fund generally holds equity positions in larger companies with strong balance sheets. The average market capitalization of positions held by the Fund was $130 billion, with 9% total debt to market capitalization at fiscal year-end.
Through the fiscal year, being overweight to the Technology sector produced the largest contribution to return, with five of the top 10 performers for the year. Consumer Discretionary, Health Care, and Materials positions rounded out the top 10 contributors. Detractors included the Industrials and Financial sectors during the first half of the year, followed by Materials in the second half.
The Fund reduced the number of equity positions from 36 to 26 over the fiscal year and increased the average position size to 3.8%. For the same period, the Fund’s top three sectors represented 76.7% of assets: Technology at 50.6%, followed by Health Care at 13.6%, and Consumer Discretionary at 10.7%. The top three positions represented 31.5% of assets. Positions spanned 12 countries, led by the Netherlands at 22.0%, Canada at 10.8%, and Israel at 11.5%.
Looking Forward
Global equity markets generally ended 2020 on a positive note as investors look to 2021 with expectations of improved pandemic and economic conditions supported by coordinated government stimulus. The 2020 pandemic pushed global policymakers to use even greater amounts of debt-funded stimulus to offset the economic lockdowns, none more so than the United States. The growing consensus of a weakening US dollar appears to discount the US intention of continued loose monetary policy combined with either loose (divided Congress) or looser (unified) fiscal policy, which should be supportive of international equities. We anticipate year-over-year economic and corporate earnings comparisons will become easier in mid-2021, supporting an improving growth outlook and potential inflation. Global Purchasing Manager Index activity rebounded from the April 2020 lows in most countries, most notably in the Americas and the eurozone. We anticipate a sustained recovery during 2021 to work its way back into Asia’s global supply chain with inventory restocking, which should be reflected in improving PMIs. Offsets to the expected developed world loose/looser policies, including the debt overhang, likely higher taxation, increased regulation, crowding out of private investment, and continued economic lockdown attract less attention for now. At present, tailwinds appear stronger than headwinds. We expect the number of positions as well as countries represented to grow in 2021 resulting in a lower average position size.
Management Fee Calculations
The Sextant International Fund calculates the performance part of its management fee by comparing the Fund’s return to the average return of Morningstar’sTM “Foreign Large Blend” category. Sextant International Fund Investor Shares’ 12-month return of 9.86% was more than 2% below the MorningstarTM category average of 22.54% at month-end November 30, 2020. Therefore, the basic annual management fee of 0.50% was decreased by 0.20% to 0.30% for the Fund as a whole for the month of December 2020.
| | | | | | | | | | |
| | | | | | |
| 46 | | | | | | | | November 30, 2020 | | Annual Report |
Sextant International Fund
| | | | | | | | | | | | | | | | | | | | | | |
| | | Schedule of Investments | | | | | | | | | | | | | | | As of November 30, 2020 | |
| | | | | | | | |
| | | Common Stocks – 97.7% | | | | Number of Shares | | | Cost | | | Market Value | | | Country1 | | Percentage of Net Assets | |
| | | | | | | |
| | | Communications | | | | | | | | | | | | | | | | |
| | | | | | | | |
| | | Telecom Carriers | | | | | | | | | | | | | | | | |
| | | | | | | | |
| | | BCE | | | | | 47,600 | | | | $1,118,164 | | | | $2,063,936 | | | Canada | | | 2.7% | |
| | | | | | | | |
| | | Telus | | | | | 98,600 | | | | 700,962 | | | | 1,904,952 | | | Canada | | | 2.4% | |
| | | | | | | | |
| | | | | | | | | | | 1,819,126 | | | | 3,968,888 | | | | | | 5.1% | |
| | | | | | | |
| | | Consumer Discretionary | | | | | | | | | | | | | | | | |
| | | | | | | | |
| | | Apparel, Footwear &
Accessory Design | | | | | | | | | | | | | | | | |
| | | | | | | | |
| | | Hermes International | | | | | 600 | | | | 521,388 | | | | 585,414 | | | France | | | 0.8% | |
| | | | | | | | |
| | | E-Commerce Discretionary | | | �� | | | | | | | | | | | | | |
| | | | | | | | |
| | | MercadoLibre | | | | | 5,000 | | | | 414,670 | | | | 7,766,650 | | | Argentina | | | 9.9% | |
| | | | | | | | |
| | | | | | | | | | | 936,058 | | | | 8,352,064 | | | | | | 10.7% | |
| | | | | | | |
| | | Consumer Staples | | | | | | | | | | | | | | | | |
| | | | | | | | |
| | | Household Products | | | | | | | | | | | | | | | | |
| | | | | | | | |
| | | L’Oreal | | | | | 2,000 | | | | 658,700 | | | | 738,260 | | | France | | | 1.0% | |
| | | | | | | | |
| | | Reckitt Benckiser Group | | | | | 16,000 | | | | 1,594,860 | | | | 1,398,583 | | | United Kingdom | | | 1.8% | |
| | | | | | | | |
| | | Unicharm | | | | | 16,000 | | | | 667,496 | | | | 778,111 | | | Japan | | | 1.0% | |
| | | | | | | | |
| | | Unilever ADR | | | | | 50,000 | | | | 1,315,509 | | | | 3,053,000 | | | United Kingdom | | | 3.9% | |
| | | | | | | | |
| | | | | | | | | | | 4,236,565 | | | | 5,967,954 | | | | | | 7.7% | |
| | | | | | | |
| | | Health Care | | | | | | | | | | | | | | | | |
| | | | | | | | |
| | | Biotech | | | | | | | | | | | | | | | | |
| | | | | | | | |
| | | CRISPR Therapeutics2 | | | | | 10,000 | | | | 693,004 | | | | 1,269,200 | | | Switzerland | | | 1.6% | |
| | | | | | | | |
| | | Large Pharma | | | | | | | | | | | | | | | | |
| | | | | | | | |
| | | Novartis ADR | | | | | 31,400 | | | | 1,424,624 | | | | 2,852,062 | | | Switzerland | | | 3.7% | |
| | | | | | | | |
| | | Novo Nordisk ADR | | | | | 48,000 | | | | 588,286 | | | | 3,222,240 | | | Denmark | | | 4.1% | |
| | | | | | | | |
| | | | | | | | | | | | | | | | | | | | | | | |
| | | | | | | | |
| | | | | | | | | | | | 2,012,910 | | | | 6,074,302 | | | | | | 7.8% | |
| | | | | | | | |
| | | Medical Equipment | | | | | | | | | | | | | | | | |
| | | | | | | | |
| | | Alcon2 | | | | | 25,000 | | | | 1,294,019 | | | | 1,605,500 | | | Switzerland | | | 2.0% | |
| | | | | | | | |
| | | Koninklijke Philips | | | | | 32,649 | | | | 1,234,087 | | | | 1,682,076 | | | Netherlands | | | 2.2% | |
| | | | | | | | |
| | | | | | | | | | | | | | | | | | | | | | | |
| | | | | | | | |
| | | | | | | | | | | | 2,528,106 | | | | 3,287,576 | | | | | | 4.2% | |
| | | | | | | | |
| | | | | | | | | | | 5,234,020 | | | | 10,631,078 | | | | | | 13.6% | |
Continued on next page.
| | | | | | | | | | | | |
| | | | | | | |
| The accompanying notes are an integral part of these financial statements. | | Annual Report | | November 30, 2020 | | | | | | | | 47 |
Sextant International Fund
| | | | | | | | | | | | | | | | | | | | | | |
| | | Schedule of Investments | | | | | | | | | | | | | | | As of November 30, 2020 | |
| | | | | | | |
| | | Common Stocks – 97.7% | | Number of Shares | | | Cost | | | Market Value | | | Country1 | | Percentage of Net Assets | |
| | | | | | | |
| | | Materials | | | | | | | | | | | | | | | | |
| | | | | | | | |
| | | Basic & Diversified
Chemicals | | | | | | | | | | | | | | | | |
| | | | | | | | |
| | | Linde | | | | | 3,500 | | | | $771,050 | | | | $897,470 | | | Ireland | | | 1.1% | |
| | | | | | | | |
| | | Precious Metal Mining | | | | | | | | | | | | | | | | |
| | | | | | | | |
| | | Agnico-Eagle Mines | | | | | 20,000 | | | | 1,129,664 | | | | 1,317,400 | | | Canada | | | 1.7% | |
| | | | | | | | |
| | | Barrick Gold | | | | | 40,000 | | | | 999,375 | | | | 925,600 | | | Canada | | | 1.2% | |
| | | | | | | | |
| | | | | | | | | | | | | | | | | | | | | | | |
| | | | | | | | |
| | | | | | | | | | | | 2,129,039 | | | | 2,243,000 | | | | | | 2.9% | |
| | | | | | | | |
| | | Steel Raw Material Suppliers | | | | | | | | | | | | | | | | |
| | | | | | | | |
| | | Rio Tinto ADR | | | | | 35,000 | | | | 1,890,443 | | | | 2,273,950 | | | United Kingdom | | | 2.9% | |
| | | | | | | | |
| | | | | | | | | | | 4,790,532 | | | | 5,414,420 | | | | | | 6.9% | |
| | | | | | | |
| | | Technology | | | | | | | | | | | | | | | | |
| | | | | | | | |
| | | Application Software | | | | | | | | | | | | | | | | |
| | | | | | | | |
| | | Dassault Systemes ADR | | | | | 34,153 | | | | 1,224,633 | | | | 6,316,939 | | | France | | | 8.1% | |
| | | | | | | | |
| | | NICE Systems ADR | | | | | 36,700 | | | | 1,358,765 | | | | 8,944,524 | | | Israel | | | 11.5% | |
| | | | | | | | |
| | | Open Text US | | | | | 50,000 | | | | 2,072,526 | | | | 2,208,500 | | | Canada | | | 2.8% | |
| | | | | | | | |
| | | | | | | | | | | | | | | | | | | | | | | |
| | | | | | | | |
| | | | | | | | | | | | 4,655,924 | | | | 17,469,963 | | | | | | 22.4% | |
| | | | | | | | |
| | | Consumer Electronics | | | | | | | | | | | | | | | | |
| | | | | | | | |
| | | Nintendo | | | | | 3,400 | | | | 1,490,299 | | | | 1,931,412 | | | Japan | | | 2.5% | |
| | | | | | | | |
| | | Sony ADR | | | | | 25,000 | | | | 1,506,327 | | | | 2,332,250 | | | Japan | | | 3.0% | |
| | | | | | | | |
| | | | | | | | | | | | | | | | | | | | | | | |
| | | | | | | | |
| | | | | | | | | | | | 2,996,626 | | | | 4,263,662 | | | | | | 5.5% | |
| | | | | | | | |
| | | Information Services | | | | | | | | | | | | | | | | |
| | | | | | | | |
| | | Wolters Kluwer | | | | | 90,000 | | | | 1,684,803 | | | | 7,555,829 | | | Netherlands | | | 9.7% | |
| | | | | | | | |
| | | IT Services | | | | | | | | | | | | | | | | |
| | | | | | | | |
| | | Accenture, Class A | | | | | 9,250 | | | | 1,709,475 | | | | 2,304,083 | | | Ireland | | | 2.9% | |
| | | | | | | | |
| | | Semiconductor Manufacturing | | | | | | | | | | | | | | | | |
| | | | | | | | |
| | | ASML | | | | | 18,000 | | | | 627,764 | | | | 7,879,140 | | | Netherlands | | | 10.1% | |
| | | | | | | | |
| | | | | | | | | | | 11,674,592 | | | | 39,472,677 | | | | | | 50.6% | |
| | | | | | | |
| | | Utilities | | | | | | | | | | | | | | | | |
| | | | | | | | |
| | | Power Generation | | | | | | | | | | | | | | | | |
| | | | | | | | |
| | | Iberdrola | | | | | 177,174 | | | | 1,776,330 | | | | 2,439,026 | | | Spain | | | 3.1% | |
| | | | | | | | |
| | | | | | | | | | | 1,776,330 | | | | 2,439,026 | | | | | | 3.1% | |
| | | | | | | |
| | | | | | | | | | | | | | | | | | | | | | | |
| | | | | | | |
| | Total investments | | | | | | | | | $30,467,223 | | | | $76,246,107 | | | | | | 97.7% | |
| | | | | | | |
| | Other assets (net of liabilities) | | | | | | | | | | | | | 1,815,607 | | | | | | 2.3% | |
| | | | | | | |
| | Total net assets | | | | | | | | | | | | | $78,061,714 | | | | | | 100.0% | |
| | | | | | | | |
| | | | | | | | | | | | | | | | | | | | | | |
| 2 | Non-income producing security |
ADR: American Depositary Receipt
| | | | | | | | | | | | |
| | | | | | | |
| 48 | | | | | | | | November 30, 2020 | | Annual Report | | The accompanying notes are an integral part of these financial statements. |
| | |
| Sextant International Fund | | As of November 30, 2020 |
| | | | |
Schedule of Investments Countries | | | (unaudited) | |
| | |
| | | | |
|
 | |
|
| Weightings shown are a percentage of total net assets. | |
| | | | | | | | | | | | |
| | | | | | | |
| The accompanying notes are an integral part of these financial statements. | | Annual Report | | November 30, 2020 | | | | | | | | 49 |
Sextant International Fund
Statement of Assets and Liabilities
| | | | |
| As of November 30, 2020 | |
| | |
| | | | |
| |
Assets | | | | |
| |
Investments in securities, at value
(Cost $30,467,223) | | | $76,246,107 | |
| |
Cash | | | 1,771,981 | |
| |
Recoverable tax receivable | | | 155,764 | |
| |
Dividends and interest receivable | | | 33,409 | |
| |
Prepaid expenses | | | 19,536 | |
| |
Receivable for Fund shares sold | | | 4,243 | |
| |
Prepaid Chief Compliance Officer expenses | | | 184 | |
| | | | |
| |
Total assets | | | 78,231,224 | |
| | | | |
| |
Liabilities | | | | |
| |
Payable for Fund shares redeemed | | | 89,620 | |
| |
Accrued advisory fees | | | 31,234 | |
| |
Accrued audit expenses | | | 19,490 | |
| |
Accrued 12b-1 distribution fees | | | 10,237 | |
| |
Accrued other operating expenses | | | 6,698 | |
| |
Accrued retirement plan custody fee | | | 5,502 | |
| |
Accrued trustee expenses | | | 3,444 | |
| |
Accrued postage | | | 3,285 | |
| | | | |
| |
Total liabilities | | | 169,510 | |
| | | | |
| |
Net assets | | | $78,061,714 | |
| | |
| | | | |
| | |
Analysis of net assets | | | | |
| |
Paid-in capital (unlimited shares authorized, without par value) | | | $36,553,800 | |
| |
Total distributable earnings | | | 41,507,914 | |
| | | | |
| |
Net assets applicable to Fund shares outstanding | | | $78,061,714 | |
| | |
| | | | |
| | |
Net asset value per Investor Share | | | SSIFX | |
| |
Net assets, at value | | | $51,141,200 | |
| |
Shares outstanding | | | 2,607,039 | |
| | | | |
| |
Net asset value, offering and redemption price per share | | | $19.62 | |
| | |
| | | | |
| | |
Net asset value per Z Share | | | SIFZX | |
| |
Net assets, at value | | | $26,920,514 | |
| |
Shares outstanding | | | 1,368,619 | |
| | | | |
| |
Net asset value, offering and redemption price per share | | | $19.67 | |
| | |
| | | | |
Statement of Operations
| | | | |
| Year ended November 30, 2020 | |
| | |
| | | | |
| |
Investment income | | | | |
| |
Dividend income (net of foreign tax ($140,904) | | | $1,203,441 | |
| |
Miscellaneous income | | | 889 | |
| | | | |
| |
Total investment income | | | 1,204,330 | |
| | | | |
| |
Expenses | | | | |
| |
Investment advisory fees | | | 281,306 | |
| |
Distribution fees - Investor Shares | | | 134,548 | |
| |
Audit fees | | | 54,758 | |
| |
Printing and postage fees | | | 27,697 | |
| |
Filing and registration fees | | | 26,935 | |
| |
Trustee fees | | | 21,075 | |
| |
Other operating expenses | | | 19,692 | |
| |
Chief Compliance Officer expenses | | | 16,939 | |
| |
Legal fees | | | 16,480 | |
| |
Custodian fees | | | 6,477 | |
| |
Retirement plan custodial fees | | | | |
| |
Investor Shares | | | 18 | |
| |
Z Shares | | | 5,751 | |
| | | | |
| |
Total gross expenses | | | 611,676 | |
| | | | |
| |
Less custodian fee credits | | | (6,477 | ) |
| | | | |
| |
Net expenses | | | 605,199 | |
| | | | |
| |
Net investment income | | | $599,131 | |
| | |
| | | | |
| | |
| | | | |
| |
Net realized loss from investments and foreign currency | | | $(3,075,450 | )A |
| |
Net increase in unrealized appreciation on investments and foreign currency | | | 8,007,812 | |
| | | | |
| |
Net gain on investments | | | $4,932,362 | |
| | |
| | | | |
| | |
Net decrease in net assets resulting from operations | | | $5,531,493 | |
| | | | | |
| A | Includes $1,808,290 in net realized gains from redemptions in-kind. |
| | | | | | | | | | | | |
| | | | | | | |
| 50 | | | | | | | | November 30, 2020 | | Annual Report | | The accompanying notes are an integral part of these financial statements. |
Sextant International Fund
| | | | | | | | |
Statements of Changes in Net Assets | | | Year ended November 30, 2020 | | | | Year ended November 30, 2019 | |
| | | |
Increase (decrease) in net assets from operations | | | | | | | | |
| | |
From operations | | | | | | | | |
| | |
Net investment income | | | $599,131 | | | | $608,351 | |
| | |
Net realized gain (loss) on investment and foreign currency | | | (3,075,450 | ) | | | 2,790,326 | |
| | |
Net increase in unrealized appreciation | | | 8,007,812 | | | | 9,915,749 | |
| | | | | | | | |
| | |
Net increase in net assets | | | 5,531,493 | | | | 13,314,426 | |
| | | | | | | | |
| | |
Distributions to shareowners | | | | | | | | |
| | |
Net distribution to shareholders – Investor Shares | | | (2,232,061 | ) | | | (2,929,551 | ) |
| | |
Net distribution to shareholders – Z Shares | | | (1,161,988 | ) | | | (1,596,893 | ) |
| | | | | | | | |
| | |
Total distributions | | | (3,394,049 | ) | | | (4,526,444 | ) |
| | | | | | | | |
| | |
| | | | | | | | |
| | |
Capital share transactions | | | | | | | | |
| | |
Proceeds from sales of shares | | | | | | | | |
| | |
Investor Shares | | | 9,415,447 | | | | 44,612,650 | |
| | |
Z Shares | | | 5,636,588 | | | | 9,895,572 | |
| | |
Value of shares issued in reinvestment of dividends | | | | | | | | |
| | |
Investor Shares | | | 2,197,723 | | | | 2,886,627 | |
| | |
Z Shares | | | 1,125,526 | | | | 1,555,608 | |
| | |
Cost of shares redeemed | | | | | | | | |
| | |
Investor Shares | | | (29,149,795 | ) | | | (27,878,254 | ) |
| | |
Z Shares | | | (11,654,205 | ) | | | (3,886,967 | ) |
| | | | | | | | |
| | |
Total capital share transactions | | | (22,428,716 | ) | | | 27,185,236 | |
| | | | | | | | |
| | |
Total increase (decrease) in net assets | | | (20,291,272 | ) | | | 35,973,218 | |
| | | |
| | | | | | | | |
| | | |
Net assets | | | | | | | | |
| | |
Beginning of year | | | 98,352,986 | | | | 62,379,768 | |
| | |
End of year | | | $78,061,714 | | | | $98,352,986 | |
| | | |
| | | | | | | | |
| | | |
Shares of the Fund sold and redeemed | | | | | | | | |
| | |
Investor Shares (SSIFX) | | | | | | | | |
| | |
Number of shares sold | | | 547,412 | | | | 2,532,126 | |
| | |
Number of shares issued in reinvestment of dividends | | | 120,887 | | | | 195,174 | |
| | |
Number of shares redeemed | | | (1,704,832 | ) | | | (1,561,321 | ) |
| | | | | | | | |
| | |
Net increase (decrease) in number of shares outstanding | | | (1,036,533 | ) | | | 1,165,979 | |
| | | | | | | | |
| | |
Z Shares (SIFZX) | | | | | | | | |
| | |
Number of shares sold | | | 317,420 | | | | 568,002 | |
| | |
Number of shares issued in reinvestment of dividends | | | 61,876 | | | | 105,108 | |
| | |
Number of shares redeemed | | | (680,270 | ) | | | (229,953 | ) |
| | | | | | | | |
| | |
Net increase (decrease) in number of shares outstanding | | | (300,974 | ) | | | 443,157 | |
| | | |
| | | | | | | | |
| | | | | | | | | | | | |
| | | | | | | |
| The accompanying notes are an integral part of these financial statements. | | Annual Report | | November 30, 2020 | | | | | | | | 51 |
Sextant International Fund: Financial Highlights
| | | | | | | | | | | | | | | | | | | | |
Investor Shares (SSIFX) | | | For year ended November 30, | |
| | | | | |
Selected data per share of outstanding capital stock throughout each year: | | | 2020 | | | | 2019 | | | | 2018 | | | | 2017 | | | | 2016 | |
| | | | | | |
Net asset value at beginning of year | | | $18.50 | | | | $16.83 | | | | $17.98 | | | | $14.37 | | | | $14.35 | |
| | | | | |
Income from investment operations | | | | | | | | | | | | | | | | | | | | |
| | | | | |
Net investment income | | | 0.12 | A | | | 0.12 | A | | | 0.15 | A | | | 0.16 | A | | | 0.22 | |
| | | | | |
Net gains (losses) on securities (both realized and unrealized) | | | 1.66 | | | | 2.74 | | | | 0.14 | | | | 3.65 | | | | (0.15 | ) |
| | | | | | | | | | | | | | | | | | | | |
| | | | | |
Total from investment operations | | | 1.78 | | | | 2.86 | | | | 0.29 | | | | 3.81 | | | | 0.07 | |
| | | | | | | | | | | | | | | | | | | | |
| | | | | |
Less distributions | | | | | | | | | | | | | | | | | | | | |
| | | | | |
Dividends from net investment income | | | (0.11 | ) | | | (0.15 | ) | | | (0.17 | ) | | | (0.20 | ) | | | (0.05 | ) |
| | | | | |
Distributions from capital gains | | | (0.55 | ) | | | (1.04 | ) | | | (1.27 | ) | | | - | | | | - | |
| | | | | | | | | | | | | | | | | | | | |
| | | | | |
Total distributions | | | (0.66 | ) | | | (1.19 | ) | | | (1.44 | ) | | | (0.20 | ) | | | (0.05 | ) |
| | | | | | | | | | | | | | | | | | | | |
| | | | | |
| | | | | | | | | | | | | | | | | | | | |
| | | | | |
Net asset value at end of year | | | $19.62 | | | | $18.50 | | | | $16.83 | | | | $17.98 | | | | $14.37 | |
| | | | | | |
| | | | | | | | | | | | | | | | | | | | |
Total return | | | 9.86% | | | | 18.82% | | | | 1.63% | | | | 26.76% | | | | 0.49% | |
| | | | | | |
Ratios / supplemental data | | | | | | | | | | | | | | | | | | | | |
| | | | | |
Net assets ($000), end of year | | | $51,141 | | | | $67,390 | | | | $41,688 | | | | $46,321 | | | | $62,412 | |
| | | | | |
Ratio of expenses to average net assets | | | | | | | | | | | | | | | | | | | | |
| | | | | |
Before custodian fee credits | | | 0.83% | | | | 1.07% | | | | 1.05% | | | | 1.04% | | | | 1.00% | |
| | | | | |
After custodian fee credits | | | 0.82% | | | | 1.06% | | | | 1.04% | | | | 1.04% | | | | 1.00% | |
| | | | | |
Ratio of net investment income after custodian fee credits to average net assets | | | 0.70% | | | | 0.62% | | | | 0.89% | | | | 1.00% | | | | 1.36% | |
| | | | | |
Portfolio turnover rate | | | 16% | | | | 6% | | | | 2% | | | | 2% | | | | 0% | |
| | | | | | |
| | | | | | | | | | | | | | | | | | | | |
| | | | | | | | | | | | | | | | |
Z Shares (SIFZX) | | | For year ended November 30, | | | | Period ended | |
| | | | |
Selected data per share of outstanding capital stock throughout each period: | | | 2020 | | | | 2019 | | | | 2018 | | | | November 30, 2017 | B |
| | | | | |
Net asset value at beginning of period | | | $18.55 | | | | $16.87 | | | | $18.00 | | | | $16.55 | |
| | | | |
Income from investment operations | | | | | | | | | | | | | | | | |
| | | | |
Net investment income | | | 0.15 | A | | | 0.19 | A | | | 0.19 | A | | | 0.13 | A |
| | | | |
Net gains on securities (both realized & unrealized) | | | 1.67 | | | | 2.72 | | | | 0.14 | | | | 1.41 | |
| | | | | | | | | | | | | | | | |
| | | | |
Total from investment operations | | | 1.82 | | | | 2.91 | | | | 0.33 | | | | 1.54 | |
| | | | | | | | | | | | | | | | |
| | | | |
Less distributions | | | | | | | | | | | | | | | | |
| | | | |
Dividends from net investment income | | | (0.15 | ) | | | (0.19 | ) | | | (0.19 | ) | | | (0.09 | ) |
| | | | |
Distributions from capital gains | | | (0.55 | ) | | | (1.04 | ) | | | (1.27 | ) | | | - | |
| | | | | | | | | | | | | | | | |
| | | | |
Total distributions | | | (0.70 | ) | | | (1.23 | ) | | | (1.46 | ) | | | (0.09 | ) |
| | | | | | | | | | | | | | | | |
| | | | |
| | | | | | | | | | | | | | | | |
| | | | |
Net asset value at end of period | | | $19.67 | | | | $18.55 | | | | $16.87 | | | | $18.00 | |
| | | | | |
| | | | | | | | | | | | | | | | |
Total return | | | 10.09% | | | | 19.14% | | | | 1.83% | | | | 9.32% | C |
| | | | | |
Ratios / supplemental data | | | | | | | | | | | | | | | | |
| | | | |
Net assets ($000), end of period | | | $26,921 | | | | $30,963 | | | | $20,692 | | | | $21,031 | |
| | | | |
Ratio of expenses to average net assets | | | | | | | | | | | | | | | | |
| | | | |
Before custodian fee credits | | | 0.63% | | | | 0.85% | | | | 0.84% | | | | 0.79% | D |
| | | | |
After custodian fee credits | | | 0.63% | | | | 0.84% | | | | 0.82% | | | | 0.78% | D |
| | | | |
Ratio of net investment income after custodian fee credits to average net assets | | | 0.87% | | | | 0.91% | | | | 1.13% | | | | 0.53% | D |
| | | | |
Portfolio turnover rate | | | 16% | | | | 6% | | | | 2% | | | | 2% | C |
| | | | | |
| | | | | | | | | | | | | | | | |
| A | Calculated using average shares outstanding |
| B | Operations commenced on June 2, 2017 |
| C | Not annualized for periods of less than one year |
| D | Annualized for periods of less than one year |
| | | | | | | | | | | | |
| | | | | | | |
| 52 | | | | | | | | November 30, 2020 | | Annual Report | | The accompanying notes are an integral part of these financial statements. |
Notes To Financial Statements
NOTE 1 – Organization
Saturna Investment Trust (the “Trust”) was established under Washington State Law as a business trust on February 20, 1987. The Trust is registered as an open-end, diversified management company under the Investment Company Act of 1940, as amended. Nine portfolio series have been created to date: Sextant Short-Term Bond Fund, Sextant Bond Income Fund, Sextant Core Fund, Sextant Global High Income Fund, Sextant Growth Fund, Sextant International Fund (each, a “Fund”, and collectively, the “Funds”), Idaho Tax-Exempt Fund, Saturna Sustainable Equity Fund, and Saturna Sustainable Bond Fund. Idaho Tax-Exempt Fund, Saturna Sustainable Equity Fund, and Saturna Sustainable Bond Fund are offered through separate prospectuses, the results of which are contained in separate reports.
Sextant Growth Investor Shares (previously known as Idaho Limited Maturity Tax-Exempt Fund until October 12, 1990, then Northwest Growth Fund until September 28, 1995, when the investment objective of only Northwest stocks was changed) commenced operations as an equity fund on December 30, 1990. Sextant Growth Fund Z Shares began operations June 2, 2017. Sextant International Investor Shares began operations September 28, 1995 and Sextant International Fund Z Shares began operations on June 2, 2017. Sextant Short-Term Bond began operations September 28, 1995. Sextant Bond Income Fund (previously known as Washington Tax-Exempt Fund until September 28, 1995, when the investment objective of only Washington State Municipal Bonds was changed) began operations on March 1, 1993. Sextant Core Fund commenced operations March 30, 2007. Sextant Global High Income Fund commenced operations March 30, 2012.
Each Fund is an investment company and accordingly follows the investment company accounting and reporting guidance of the Financial Accounting Standards Board (FASB) Accounting Standard Codification Topic 946 “Financial Services - Investment Companies”.
Each class of shares of a Fund represents an interest in the same portfolio of investments of the Fund and has in all respects the same rights and obligations as each other class of the Fund, except that each class bears its own class expenses, and each class has exclusive voting rights. Each class of shares may be subject to different investment minimums and other conditions of eligibility as may be described in the prospectus for the particular class of shares, as from time to time in effect.
Income, realized and unrealized capital gains and losses, and expenses to be paid by a Fund and not allocated to a particular class as provided below, shall be allocated to each class on the basis of relative net assets. Expenses allocable to a specific class are expenses specifically incurred by or for such class including the following:
| | • | | Retirement plan custodial fees; and |
| | • | | Any applicable service fees. |
Net investment income dividends and capital gain distributions paid by the Fund on each class of its shares will be calculated in the same manner on the same day and at the same time.
Investment risks:
Growth, International, Core, Short-Term Bond, Bond Income, and Global High Income Funds: The value of each Fund’s shares rises and falls as the value of the securities in which the Fund invests goes up and down. Fund share prices, yields, and total returns will change with market fluctuations as well as the fortunes of the countries, industries, and companies in which the Fund invests. The Funds do not use derivatives to hedge currency, interest rate, or credit risk.
Liquidity risk exists when particular investments are difficult to sell. If a Fund holds illiquid investments, its portfolio may be more difficult to value, especially in changing markets. Investments by a Fund in foreign securities and those that are thinly traded, such as lower quality issuers and smaller companies, tend to involve greater liquidity risk. If a Fund is forced to sell or unwind these investments to meet redemptions or for other cash needs, the Fund may suffer a penalty. Additionally, the market for certain investments may become illiquid under adverse market or economic conditions independent of any specific adverse changes in the conditions of a particular issuer. In such cases, the Fund, due to limitations on investments in illiquid securities and the difficulty in purchasing and selling such securities, may be unable to achieve its investment objective.
Growth and Core Funds: Smaller companies involve higher investment risks in that they often have limited product lines, markets, and resources, or their securities may trade less frequently and have greater price fluctuation than those of larger companies.
Growth stocks, which can be priced on future expectations rather than current results, may decline substantially when expectations are not met.
International, Core, Short-Term Bond, Bond Income, and Global High Income Funds: Foreign investing involves risks not normally associated with investing in US securities. These include fluctuations in currency exchange rates, less public information about securities, less governmental market supervision, and the lack of uniform financial, social, and political standards. Foreign investing heightens the risk of confiscatory taxation, seizure or nationalization of assets, currency controls, or adverse political or social developments that affect investments. The risks of investing in foreign securities are typically greater in less developed or emerging countries.
Core Fund: The Core Fund has the risks of growth stocks, foreign securities, credit, and interest rates — but these risks are mitigated by spreading its investments in both stocks and bonds, and by favoring income-producing securities and those of larger, more seasoned companies.
Short-Term Bond, Bond Income, Global High Income, and Core Funds: Bonds entail credit risk, which is the possibility that a bond will not be able to pay interest or principal when due. If the credit quality of a bond is perceived to decline, investors will demand a higher yield, which means a lower price on that bond to compensate for the higher level of risk.
Interest rate fluctuations affect bond prices and a Fund’s net asset value, but not the income received by the Fund from its portfolio securities. Because prices and yields on debt securities vary over time, a Fund’s yield also varies. Bonds with embedded callable options also contain an element of prepayment risk. When interest rates decline, issuers can retire their debt and reissue bonds at a lower interest rate. This hurts investors because yields available for reinvestment will have declined and upward price mobility on callable bonds is generally limited by the call price.
Global High Income Fund: Issuers of high-yield securities are generally not as strong financially as those issuing higher quality securities. These issuers are more likely to encounter financial difficulties and are more vulnerable to changes in the relevant economy, such as a recession or a sustained period of rising interest rates, that could affect their ability to make interest, principal, and dividend payments as expected. The prices of high-yield securities generally fluctuate more than those of higher quality. High-yield securities are generally more illiquid (harder to sell) and harder to value.
The Funds may invest substantially in one or more sectors, which can increase volatility and exposure to issues specific to a particular sector or industry.
| | | | | | | | | | |
| | | | | | |
| Annual Report | | November 30, 2020 | | | | | | | | 53 |
Notes To Financial Statements (continued)
NOTE 2 – Significant Accounting Policies
The following is a summary of the significant accounting policies, in conformity with accounting principles generally accepted in the United States of America, which are consistently followed by the Funds in preparation of their financial statements.
Security valuation:
Investments in securities traded on a national securities exchange and over-the-counter securities for which sale prices are available are valued at that price. Securities for which there are no sales are valued at the latest bid price.
Debt securities are valued using bid-side valuations provided by an independent service. The service determines valuations using factors such as yields or prices of bonds of comparable quality, type of issue, coupon maturity, ratings, trading activity, and general market conditions.
Fixed-income debt instruments, such as commercial paper, bankers’ acceptances and US Treasury Bills, with a maturity of 60 days or less are valued at amortized cost, which approximates market value. Any discount or premium is accreted or amortized on a straight-line basis until maturity.
Foreign markets may close before the time as of which the Funds’ share prices are determined. Because of this, events occurring after the close and before the determination of the Funds’ share prices may have a material effect on the values of some or all of the Funds’ foreign securities. To account for this, the Funds may use outside pricing services for valuation of their non-US securities.
In cases in which there is not a readily available market price, a fair value for such security is determined in good faith by or under the direction of the Board of Trustees.
Security transactions are recorded on the trade date. Realized gains and losses on sales of securities are recorded on the identified cost basis.
Foreign currency:
Investment securities and other assets and liabilities denominated in foreign currencies are translated into US dollar amounts at the date of valuation. Purchases and sales of investment securities and income and expense items denominated in foreign currencies are translated into US dollar amounts on the respective dates of such transactions.
The Funds do not isolate that portion of the results of operations resulting from changes in foreign exchange rates on investments from the fluctuations arising from changes in market prices of securities held. Such fluctuations are included with the net realized and unrealized gain or loss from investments.
Reported net realized foreign exchange gains or losses arise from sales of foreign currencies, currency gains or losses realized between the trade and settlement dates on securities transactions, and the difference between the amounts of dividends, interest, and foreign withholding taxes recorded on the Funds’ books and the US dollar equivalent of the amounts actually received or paid. Net unrealized foreign exchange gains and losses arise from changes in the fair values of assets and liabilities, other than investments in securities at the fiscal period end, resulting from changes in exchange rates.
Share valuation:
The net asset value (“NAV”) per share of each Fund is calculated by dividing the sum of the value of the securities held by each Fund, plus cash and other assets, minus all liabilities (including estimated accrued expenses) by the total number of shares outstanding for each Fund, rounded to the nearest cent. The Funds’ shares are not priced or traded on days the New York Stock Exchange is closed. The NAV is the offering and redemption price per share.
Fair value measurements:
Accounting Standards Codification (ASC) 820 establishes a three-tier framework for measuring fair value based on a hierarchy of inputs. The hierarchy distinguishes between market data obtained from independent sources (observable inputs) and the Funds’ own market assumptions (unobservable inputs). These inputs are used in determining the value of the Funds’ investments and are summarized below.
| | Level 1 — | Unadjusted quoted prices in active markets for identical assets or liabilities that the Trust has the ability to access. |
| | Level 2 — | Observable inputs other than quoted prices in Level 1 that are observable for the asset or liability, either directly or indirectly. These inputs may include quoted prices for the identical instrument on an inactive market, prices for similar instruments, interest rates, prepayment speeds, credit risk, yield curves, default rates, and similar data. |
| | Level 3 — | Unobservable inputs for the asset or liability, to the extent relevant observable inputs are not available, representing the Trust’s own assumptions about the assumptions a market participant would use in valuing the asset or liability, and would be based on the best information available. |
The availability of observable inputs can vary from security to security and is affected by a wide variety of factors, including, for example, the type of security, whether the security is new and not yet established in the marketplace, the liquidity of markets, and other characteristics particular to the security. To the extent that valuation is based on models or inputs that are less observable or unobservable in the market, the determination of fair value requires more judgment. Accordingly, the degree of judgment exercised in determining fair value is greatest for instruments categorized in Level 3.
The inputs used to measure fair value may fall into different levels of the fair value hierarchy. In such cases, for disclosure purposes, the level in the fair value hierarchy within which the fair value measurement falls in its entirety, is determined based on the lowest level input that is significant to the fair value measurement in its entirety.
The inputs or methodology used for valuing securities are not necessarily an indication of the risk associated with investing in those securities.
| | | | | | | | | | |
| | | | | | |
| 54 | | | | | | | | November 30, 2020 | | Annual Report |
Notes To Financial Statements (continued)
The following is a summary of the inputs used as of November 30, 2020, in valuing the Funds’ investments carried at value:
| | | | | | | | | | | | | | | | |
| | | | |
| Funds | | Level 1 | | | Level 2 | | | Level 3 | | | Total | |
| | | | | |
Short-Term Bond | | | | | | | | | | | | | | | | |
| | | | |
Corporate Bonds1 | | | $- | | | | $7,995,912 | | | | $- | | | | $7,995,912 | |
| | | | |
Government Bonds1 | | | - | | | | 2,732,939 | | | | - | | | | 2,732,939 | |
| | | | |
Total | | | $- | | | | $10,728,851 | | | | $- | | | | $10,728,851 | |
| | | | | |
| | | | | | | | | | | | | | | | |
| | | | | |
Bond Income | | | | | | | | | | | | | | | | |
| | | | |
Corporate Bonds1 | | | $- | | | | $8,389,444 | | | | $- | | | | $8,389,444 | |
| | | | |
Government Bonds1 | | | - | | | | 3,985,245 | | | | - | | | | 3,985,245 | |
| | | | |
Municipal Bonds1 | | | - | | | | 174,317 | | | | - | | | | 174,317 | |
| | | | |
Total | | | $- | | | | $12,549,006 | | | | $- | | | | $12,549,006 | |
| | | | | |
| | | | | | | | | | | | | | | | |
| | | | | |
Core | | | | | | | | | | | | | | | | |
| | | | |
Common Stocks1 | | | $11,613,530 | | | | $- | | | | $- | | | | $11,613,530 | |
| | | | |
Corporate Bonds1 | | | - | | | | 2,928,668 | | | | - | | | | 2,928,668 | |
| | | | |
Government Bonds1 | | | - | | | | 1,766,458 | | | | - | | | | 1,766,458 | |
| | | | |
Municipal Bonds1 | | | - | | | | 346,739 | | | | - | | | | 346,739 | |
| | | | |
Total | | | $11,613,530 | | | | $5,041,865 | | | | $- | | | | $16,655,395 | |
| | | | | |
| | | | | | | | | | | | | | | | |
| | | | | |
Global High Income | | | | | | | | | | | | | | | | |
| | | | |
Common Stocks | | | | | | | | | | | | | | | | |
| | | | |
Communications | | | $701,725 | | | | $- | | | | $- | | | | $701,725 | |
| | | | |
Energy | | | 551,816 | | | | - | | | | - | | | | 551,816 | |
| | | | |
Financials | | | 435,085 | | | | 264,753 | | | | - | | | | 699,838 | |
| | | | |
Health Care | | | 411,025 | | | | - | | | | - | | | | 411,025 | |
| | | | |
Industrials | | | - | | | | 105,697 | | | | - | | | | 105,697 | |
| | | | |
Materials | | | 612,745 | | | | - | | | | - | | | | 612,745 | |
| | | | |
Technology | | | 352,500 | | | | - | | | | - | | | | 352,500 | |
| | | | |
Total Common Stocks | | | 3,064,896 | | | | 370,450 | | | | - | | | | 3,435,346 | |
| | | | |
Corporate Bonds1 | | | - | | | | 2,511,181 | | | | - | | | | 2,511,181 | |
| | | | |
Government Bonds1 | | | - | | | | 919,180 | | | | - | | | | 919,180 | |
| | | | |
Municipal Bonds1 | | | - | | | | 207,739 | | | | - | | | | 207,739 | |
| | | | |
Warrants1 | | | - | | | | - | | | | - | | | | - | |
| | | | |
Total | | | $3,064,896 | | | | $4,008,550 | | | | $- | | | | $7,073,446 | |
| | | | | |
| | | | | | | | | | | | | | | | |
| | | | | |
Growth | | | | | | | | | | | | | | | | |
| | | | |
Common Stocks1 | | | $57,861,299 | | | | $- | | | | $- | | | | $57,861,299 | |
| | | | |
Total | | | $57,861,299 | | | | $- | | | | $- | | | | $57,861,299 | |
| | | | | |
| | | | | | | | | | | | | | | | |
| | | | | |
International | | | | | | | | | | | | | | | | |
| | | | |
Common Stocks | | | | | | | | | | | | | | | | |
| | | | |
Communications | | | $3,968,888 | | | | $- | | | | $- | | | | $3,968,888 | |
| | | | |
Consumer Discretionary | | | 7,766,650 | | | | 585,414 | | | | - | | | | 8,352,064 | |
| | | | |
Consumer Staples | | | 3,053,000 | | | | 2,914,954 | | | | - | | | | 5,967,954 | |
| | | | |
Health Care | | | 10,631,078 | | | | - | | | | - | | | | 10,631,078 | |
| | | | |
Materials | | | 5,414,420 | | | | - | | | | - | | | | 5,414,420 | |
| | | | |
Technology | | | 29,985,436 | | | | 9,487,241 | | | | - | | | | 39,472,677 | |
| | | | |
Utilities | | | - | | | | 2,439,026 | | | | - | | | | 2,439,026 | |
| | | | |
Total | | | $60,819,472 | | | | $15,426,635 | | | | $- | | | | $76,246,107 | |
| | | | | | | | | | | | | | | | | |
During the period ended November 30, 2020, no Fund had transfers between Level 1, Level 2 or Level 3.
| 1 | See Schedule of Investments for industry breakout. |
| | | | | | | | | | |
| | | | | | |
| Annual Report | | November 30, 2020 | | | | | | | | 55 |
Notes To Financial Statements (continued)
Investment concentration:
The Funds may have deposits of cash with the custodian from time to time for one or more reasons. “Other assets (net of liabilities)” in the Funds’ Schedules of Investments primarily represents cash on deposit with the custodian. Cash on deposit will vary widely over time. Accounting Standards Codification (“ASC”) 825, “Financial Instruments,” identifies these items as a concentration of credit risk. The risk is managed by careful financial analysis and review of the custodian’s operations, resources, and protections available to the Trust. This process includes evaluation of other financial institutions providing investment company custody services.
Federal income taxes:
The Funds intend to comply with the requirements of the Internal Revenue Code necessary to qualify as a regulated investment company and to make the requisite distributions of income and capital gains to its shareowners sufficient to relieve it from all or substantially all federal income taxes. Therefore, no federal income tax provision is required.
The Funds recognize the tax benefits of uncertain tax positions only where the position is “more likely than not” to be sustained assuming examination by tax authorities. Management has analyzed the Funds’ tax positions and has concluded that no liability for unrecognized tax benefits should be recorded related to uncertain tax positions taken on returns filed for open tax years (2017 – 2019) or expected to be taken in the Funds’ 2020 tax returns. The Funds identify their major tax jurisdictions as US federal and foreign jurisdictions where the Funds make significant investments; however, the Funds are not aware of any tax positions for which it is reasonably possible that the total amounts of unrecognized tax benefits will change materially in the next twelve months.
Reclassification of capital accounts:
Accounting principles generally accepted in the United States of America require that certain components of net assets relating to permanent differences be reclassified between financial and tax reporting. These reclassifications have no effect on net assets or net asset value per share. As of November 30, 2020, the reclassification of capital accounts were as follows:
| | | | |
| | |
| | | International | |
| |
Distributable earnings | | | $(1,808,290 | ) |
| |
Paid-in capital | | | $1,808,290 | |
| | | | | |
These reclassifications were due to redemptions in kind.
The Short-Term Bond, Bond Income, Core, Global High Income, Growth Funds had no reclassification of capital accounts.
Distributions to shareowners:
For the Sextant Short-Term Bond Fund and Sextant Bond Income Fund, dividends to shareowners from net investment income are paid daily and distributed on the last business day of each month. For the Sextant Core Fund, Sextant Global High Income Fund, Sextant Growth Fund, and Sextant International Fund, dividends to shareowners from net investment income are payable annually, typically by the end of the year. Distributions of capital gains, if any, are made at least annually, and as required to comply with federal excise tax requirements. Distributions to shareowners are determined in accordance with income tax regulations and are recorded on the ex-dividend date. Dividends are paid in shares of the Funds, at the net asset value on the payable date. Shareowners may elect to take distributions if they total $10 or more in cash.
Use of estimates:
The preparation of financial statements in conformity with accounting principles generally accepted in the United States of America requires management to make estimates and assumptions that affect the reported amounts of assets and liabilities and disclosure of contingent assets and liabilities at the date of the financial statements and the reported amounts of increases and decreases in net assets from operations during the reporting period. Actual results could differ from those estimates.
Foreign taxes:
Withholding taxes on foreign dividends are paid (a portion of which may be reclaimable) or provided for in accordance with the applicable country’s tax rules and rates and are disclosed in the Statement of Operations. Withholding tax reclaims are filed in certain countries to recover a portion of the amounts previously withheld. The Funds record a reclaim receivable based on a number of factors, including a jurisdiction’s legal obligation to pay reclaims as well as payment history and market convention.
LIBOR Transition Risk:
The United Kingdom’s Financial Conduct Authority announce a phase out of the London Interbank Offered Rate (“LIBOR”) by the end of 2021 and it is expected that LIBOR will cease to be published after that time. The Funds may be exposed to financial instruments tied to LIBOR to determine payment obligations, financing terms, hedging activities, or investment value. The transition process away from LIBOR might lead to increase volatility and illiquidity in markets for , and reduce the effectiveness of new hedges placed against, instruments whose term currently include LIBOR. The ultimate effect of the LIBOR transition process on the Funds is uncertain
Other:
Interest income is recognized on an accrual basis. Premiums on securities purchased are amortized, and discounts are accreted using the yield to maturity method over the lives of the respective securities or where applicable, to the first call date of the securities. Dividends from equity securities are recorded as income on the ex-dividend date or as soon as information is available to the fund.
Recent Accounting Pronouncement:
In August 2018, FASB issued Accounting Standards Update No. 2018-13, “Fair Value Measurement (Topic 820: Disclosure Framework — Changes to the Disclosure Requirements for Fair Value Measurement” (“ASU 2018-13”). ASU 2018-13 eliminates the requirement to disclose the amount of and reasons for transfers between Level 1 and Level 2 of the fair value hierarchy, the timing of transfers between levels of the fair value hierarchy and the valuation processes for Level 3 fair value measurements. ASU 2018-13 will require the need to disclose the range and weighted average used to develop significant unobservable inputs for Level 3 fair value measurements and the changes in unrealized gains and losses for recurring Level 3 fair value measurements. ASU 2018-13 will also require that information is provided about the measurement uncertainty of Level 3 fair value measurements as of the reporting date. The guidance is effective for fiscal years, and interim periods within those fiscal years, beginning after December 15, 2019, and allows for early adoption of either the entire standard or only the provisions that eliminate or modify the requirements. Management has elected to adopt early the provisions that eliminate the disclosure requirements. Management is still currently evaluating the impact of applying the rest of the guidance.
| | | | | | | | | | |
| | | | | | |
| 56 | | | | | | | | November 30, 2020 | | Annual Report |
Notes To Financial Statements (continued)
NOTE 3 – Transactions with Affiliated Persons
Under contracts approved annually by the Trust’s Board of Trustees, including those Trustees who are not parties to the contract or “interested persons” (as defined in the Investment Company Act of 1940) of such parties or the Trust (the “Independent Trustees”), Saturna Capital Corporation (“Saturna Capital���) provides investment advisory services and certain other administrative services required to conduct Trust business. Expenses incurred by the Trust on behalf of the Funds (e.g., legal fees) are allocated to the Funds on the basis of relative daily average net assets. For such services, each of the Funds pays the adviser a base Investment Advisory and Administrative Services Fee of 0.50% of average net assets per annum, payable monthly for each of the Funds. In addition, the adviser has agreed to certain limits on other expenses, as described below.
The base Advisory Fee is subject to adjustment up or down depending on the investment performance of the Fund relative to a specified index.
| | • | | For each month in which the Fund’s total investment return (change in net asset value plus all distributions reinvested) for the one year period through that month outperforms or underperforms the total return of a specified index for that period by 1% or more but less than 2%, the Base Fee is increased or decreased by the annual rate of .10% of the Fund’s average daily net assets for the preceding year. |
| | • | | If the outperformance or underperformance is 2% or more, then the adjustment is at the annual rate of ..20%. |
For the fiscal year ended November 30, 2020, due to the performance adjustment the Advisory Fee amounts charged or reduced in addition to the Base Fee were as follows:
| | | | | | | | | | | | |
| | | | |
| | | Base Fees | | | Performance
Fee | | | Adviser
Fee | |
| | | |
Short-Term Bond | | | $56,445 | | | | $2,753 | | | | $59,198 | |
| | | |
Bond Income | | | $67,187 | | | | $(23,618 | ) | | | $43,569 | |
| | | |
Core | | | $86,609 | | | | $19,933 | | | | $106,542 | |
| | | |
Global High Income | | | $43,868 | | | | $(18,139 | ) | | | $25,729 | |
| | | |
Growth | | | $247,933 | | | | $41,298 | | | | $289,231 | |
| | | |
International | | | $397,833 | | | | $(116,527 | ) | | | $281,306 | |
| | | | | | | | | | | | | |
The adviser has voluntarily undertaken to limit expenses through March 31, 2021 of Sextant Short-Term Bond Fund to 0.60%, Sextant Bond Income Fund to 0.65%, and Sextant Global High Income to 0.75%. For the fiscal year ended November 30, 2020, the advisory fees incurred were as follows:
| | | | | | | | | | | | |
| | | | |
| | | Adviser
Fees | | | Adviser Fees
Waived | | | Expense
Reimbursement | |
| | | |
Short-Term Bond | | | $59,198 | | | | $(33,133 | ) | | | $- | |
| | | |
Bond Income | | | $43,569 | | | | $(20,366 | ) | | | $- | |
| | | |
Core | | | $106,542 | | | | $- | | | | $- | |
| | | |
Global High Income | | | $25,729 | | | | $(12,728 | ) | | | $- | |
| | | |
Growth | | | $289,231 | | | | $- | | | | $- | |
| | | |
International | | | $281,306 | | | | $- | | | | $- | |
| | | | | | | | | | | | | |
In accordance with the expense limitation noted above, for the fiscal year ended November 30, 2020, Saturna Capital waived a portion of the advisory fees of the Sextant Short-Term Bond Fund, Sextant Bond Income Fund, and Sextant Global High Income Fund. The adviser cannot recoup previously waived fees.
Saturna Brokerage Services, Inc. (“SBS”), a discount brokerage and subsidiary of Saturna Capital Corporation, is registered as a broker-dealer and acts as distributor. On October 3, 2006, The Funds adopted a Distribution Plan in accordance with Rule 12b-1 under the 1940 Act. The plan provides that the Funds will pay a fee to SBS at an annual rate of 0.25% of the average net assets of the Funds. On June 2, 2017, 12b-1 fees were terminated for all Funds except Sextant Growth Investor Shares and Sextant International Investor Shares.
During the fiscal year ended November 30, 2020, the Trust paid SBS the following amounts:
| | | | |
| |
| Distribution (12b-1) Fees | |
| |
Short-Term Bond | | | n/a | |
| |
Bond Income | | | n/a | |
| |
Core | | | n/a | |
| |
Global High Income | | | n/a | |
| |
Growth Investor Shares (SSGFX) | | | $11,519 | |
| |
Growth Z Shares (SGZFX) | | | n/a | |
| |
International Investor Shares (SSIFX) | | | $134,548 | |
| |
International Z Shares (SIFZX) | | | n/a | |
| | | | | |
SBS is used to effect portfolio transactions for the Trust. SBS currently executes portfolio transactions without commission. Transactions effected through other brokers are subject to commissions payable to that broker.
Saturna Trust Company (“STC”), a subsidiary of Saturna Capital, acts as retirement plan custodian for Fund shareowners. Each Fund pays an annual fee of $10 per account for retirement plan services to Saturna Trust Company. For the fiscal year ended November 30, 2020, the Funds incurred the following amounts:
| | | | |
| |
| Retirement plan custodial fees | |
| |
Short-Term Bond | | | $3,650 | |
| |
Bond Income | | | $3,181 | |
| |
Core | | | $3,654 | |
| |
Global High Income | | | $2,130 | |
| |
Growth Investor Shares (SSGFX) | | | $7 | |
| |
Growth Z Shares (SGZFX) | | | $8,369 | |
| |
International Investor Shares (SSIFX) | | | $18 | |
| |
International Z Shares (SIFZX) | | | $5,751 | |
| | | | | |
Mrs. Jane Carten serves as a trustee and president of the Trust. She is also a director and president of Saturna Capital and vice president of Saturna Trust Company. Mrs. Carten is not compensated by the Trust. For the fiscal year ended November 30, 2020 the Trust incurred compensation expenses of $35,500 which is included in $66,477 of total expenses for the independent Trustees. The Sextant Funds incurred $46,776 of these total expenses.
The officers of the Trust are paid by Saturna Capital, not the Trust, except the Chief Compliance Officer, who may be partially compensated by the Trust. For the fiscal year ended November 30, 2020, the Funds paid the following compensation expenses for the Chief Compliance Officer:
| | | | |
| |
| Chief Compliance Officer | |
| |
Short-Term Bond | | | $2,432 | |
| |
Bond Income | | | $3,404 | |
| |
Core | | | $3,217 | |
| |
Global High Income | | | $2,225 | |
| |
Growth | | | $9,164 | |
| |
International | | | $16,939 | |
| | | | | |
On November 30, 2020, the trustees, officers, and their affiliates as a group owned 44.90%, 26.16%, 32.49%, 55.76%, 0.34%, 18.05%, 0.00%, and 26.85% of the outstanding shares of Short-Term Bond Fund, Bond Income Fund, Core Fund, Global High Income Fund, Growth Fund Investor Shares, Growth Fund Z Shares, International Fund Investor Shares, and International Fund Z Shares, respectively.
| | | | | | | | | | |
| | | | | | |
| Annual Report | | November 30, 2020 | | | | | | | | 57 |
Notes To Financial Statements (continued)
NOTE 4 – Distributions to Shareowners
The tax characteristics of distributions paid during the fiscal years ended November 30, 2020, and 2019, were as follows:
| | | | | | | | |
| | | |
| | | Year ended
Nov. 30, 2020 | | | Year ended
Nov. 30, 2019 | |
| | |
Short-Term Bond Fund | | | | | | | | |
| | |
Ordinary income | | | $185,659 | | | | $187,268 | |
| | |
Bond Income Fund | | | | | | | | |
| | |
Ordinary income | | | $335,345 | | | | 334,236 | |
| | |
Core Fund | | | | | | | | |
| | |
Ordinary income | | | $289,942 | | | | 179,880 | |
| | |
Long-term capital gain1 | | | $683,336 | | | | - | |
| | |
Global High Income Fund | | | | | | | | |
| | |
Ordinary income | | | $546,681 | | | | 311,447 | |
| | |
Long-term capital gain1 | | | $248,570 | | | | - | |
| | |
Growth Fund | | | | | | | | |
| | |
Ordinary income | | | $74,554 | | | | 181,466 | |
| | |
Long-term capital gain1 | | | $1,280,579 | | | | 1,640,414 | |
| | |
International Fund | | | | | | | | |
| | |
Ordinary income | | | $608,207 | | | | 627,004 | |
| | |
Long-term capital gain1 | | | $2,785,842 | | | | $3,899,440 | |
| | | | | | | | | |
| 1 | Long-Term Capital Gain dividend designated at 20% rate pursuant to Section 852(b)(3) of the Internal Revenue Code. |
NOTE 5 – Federal Income Taxes
The cost basis of investments for federal income tax purposes at November 30, 2020 was as follows:
| | | | | | | | |
| | | |
| | | Short-Term Bond | | | Bond Income | |
| | |
Cost of investments | | | $10,425,079 | | | | $11,040,232 | |
| | |
Gross tax unrealized appreciation | | | 303,772 | | | | 1,508,774 | |
| | |
Gross tax unrealized depreciation | | | - | | | | - | |
| | |
Net tax unrealized appreciation (depreciation) | | | $303,772 | | | | $1,508,774 | |
| | | |
| | | | | | | | |
| | | |
| | | Core | | | Global High Income | |
| | |
Cost of investments | | | $12,194,924 | | | | $7,098,132 | |
| | |
Gross tax unrealized appreciation | | | 4,485,553 | | | | 745,544 | |
| | |
Gross tax unrealized depreciation | | | (25,082 | ) | | | (770,230 | ) |
| | |
Net tax unrealized appreciation | | | $4,460,471 | | | | $(24,686 | ) |
| | | |
| | | | | | | | |
| | | |
| | | Growth | | | International | |
| | |
Cost of investments | | | $21,461,502 | | | | $30,467,223 | |
| | |
Gross tax unrealized appreciation | | | 36,403,963 | | | | 46,048,936 | |
| | |
Gross tax unrealized depreciation | | | (4,166 | ) | | | (270,052 | ) |
| | |
Net tax unrealized appreciation | | | $36,399,797 | | | | $45,778,884 | |
| | | | | | | | | |
As of November 30, 2020, components of distributable earnings on a tax basis were as follows:
| | | | |
| | |
Short-Term Bond | | | | |
| |
Undistributed ordinary income | | | $3,409 | |
| |
Accumulated capital losses | | | (23,711 | ) |
| |
Unrealized appreciation | | | 303,772 | |
| | | | |
| |
Total accumulated earnings | | | $283,470 | |
| | |
| | | | |
| | |
Bond Income | | | | |
| |
Undistributed ordinary income | | | $1,651 | |
| |
Accumulated capital losses | | | (15,924 | ) |
| |
Unrealized appreciation | | | 1,508,774 | |
| | | | |
| |
Total accumulated earnings | | | $1,494,501 | |
| | |
| | | | |
| | |
Core | | | | |
| |
Undistributed ordinary income | | | $237,755 | |
| |
Accumulated capital losses | | | (355,448 | ) |
| |
Unrealized appreciation | | | 4,460,471 | |
| |
Other unrealized losses | | | (55 | ) |
| | | | |
| |
Total accumulated earnings | | | $4,342,723 | |
| | |
| | | | |
| | |
Global High Income | | | | |
| |
Undistributed ordinary income | | | $274,295 | |
| |
Accumulated capital losses | | | (447,800 | ) |
| |
Unrealized appreciation | | | (24,686 | ) |
| |
Other unrealized gain | | | 894 | |
| | | | |
| |
Total accumulated earnings | | | $(197,297 | ) |
| | |
| | | | |
| | |
Growth | | | | |
| |
Undistributed ordinary income | | | $61,241 | |
| |
Accumulated capital gains | | | 314,003 | |
| |
Unrealized appreciation | | | 36,399,797 | |
| | | | |
| |
Total accumulated earnings | | | $36,775,041 | |
| | |
| | | | |
| | |
International | | | | |
| |
Undistributed ordinary income | | | $330,446 | |
| |
Accumulated capital losses | | | (4,616,453 | ) |
| |
Unrealized appreciation | | | 45,778,884 | |
| |
Other unrealized losses | | | 15,037 | |
| | | | |
| |
Total accumulated earnings | | | $41,507,914 | |
| | | | | |
| | | | | | | | | | |
| | | | | | |
| 58 | | | | | | | | November 30, 2020 | | Annual Report |
Notes To Financial Statements (continued)
As of November 30, 2020, the Funds had capital loss carryforwards as follows, subject to regulation.
| | | | | | | | |
| | |
| | | | Carryforward | | | | Expiration | |
| | | |
Short-Term Bond Fund | | | | | | | | |
| | |
Short-term loss carryforward | | | $23,711 | | | | Unlimited | |
| | |
| | | | $23,711 | | | | | |
| | | |
| | | | | | | | |
| | | |
Bond Income Fund | | | | | | | | |
| | |
Long-term loss carryforward | | | $15,924 | | | | Unlimitied | |
| | |
| | | | $15,924 | | | | | |
| | | |
| | | | | | | | |
| | | |
Core Fund | | | | | | | | |
| | |
Short-term loss carryforward | | | $249,554 | | | | Unlimited | |
| | |
Long-term loss carryforward | | | $105,894 | | | | Unlimitied | |
| | |
| | | | $355,448 | | | | | |
| | | |
| | | | | | | | |
| | | |
Global High Income Fund | | | | | | | | |
| | |
Short-term loss carryforward | | | $299,575 | | | | Unlimited | |
| | |
Long-term loss carryforward | | | $148,225 | | | | Unlimitied | |
| | |
| | | | $447,800 | | | | | |
| | | |
| | | | | | | | |
| | | |
International Fund | | | | | | | | |
| | |
Short-term loss carryforward | | | $2,603,538 | | | | Unlimited | |
| | |
Long-term loss carryforward | | | $2,012,915 | | | | Unlimited | |
| | |
| | | | $4,616,453 | | | | | |
NOTE 6 – Investments
Investment transactions other than short-term investments for the fiscal year ended November 30, 2020, were as follows:
| | | | | | | | |
| | | |
| | | Purchases | | | Sales | |
| | |
Short-Term Bond | | | $3,798,901 | | | | $3,957,067 | |
| | |
Bond Income | | | $1,597,708 | | | | $1,596,866 | |
| | |
Core | | | $3,057,170 | | | | $3,574,414 | |
| | |
Global High Income | | | $1,950,927 | | | | $2,006,481 | |
| | |
Growth | | | $8,953,305 | | | | $8,052,866 | |
| | |
International | | | $11,767,155 | | | | $26,062,295 | |
| | | | | | | | | |
NOTE 7 – Custodian
Under agreements in place with the Trust’s custodian, UMB Bank, custody fees are reduced by credits for cash balances. Such reductions for the fiscal year ended November 30, 2020, were as follows:
| | | | |
| |
| Custodian Fee Credits | |
| |
Short-Term Bond | | | $462 | |
| |
Bond Income | | | $548 | |
| |
Core | | | $711 | |
| |
Global High Income | | | $605 | |
| |
Growth | | | $2,043 | |
| |
International | | | $6,477 | |
| | | | | |
NOTE 8 – COVID 19 Pandemic
The COVID-19 Pandemic has adversely impacted global commercial activity and contributed to significant volatility in global equity and debt markets. The pandemic has resulted in quarantines, stay at home orders, travel prohibitions and closures, disrupting supply chains and economic activity. The duration of the pandemic’s effects remain uncertain and difficult to assess. The effects of the pandemic may adversely impact a Fund’s performance and its ability to achieve its investment objective.
NOTE 9 – Subsequent Events
In preparing these financial statements, the Funds have evaluated events and transactions for potential recognition or disclosure through the date the financial statements were issued.
The Funds declared the payment of a distribution to be paid on December 17, 2020, to all shareowners of record on December 16, 2020, as follows:
| | | | | | | | |
| | | |
| | | Income | | | Long-Term
Capital Gain | |
| | |
Core | | | $0.2125 | | | | - | |
| | |
Global High Income | | | 0.3590 | | | | - | |
| | |
Growth (Investor Shares) | | | 0.0250 | | | | 0.2250 | |
| | |
Growth (Z Shares) | | | 0.1120 | | | | 0.2250 | |
| | |
International (Investor Shares) | | | 0.0750 | | | | - | |
| | |
International (Z Shares) | | | 0.1200 | | | | - | |
| | | | | | | | | |
There were no other events or transactions during the period that materially impacted the amounts or disclosures in the Funds’ financial statements.
| | | | | | | | | | |
| | | | | | |
| Annual Report | | November 30, 2020 | | | | | | | | 59 |
Report of Independent Registered Public Accounting Firm
To the Board of Trustees of
Saturna Investment Trust
and the Shareholders of Sextant Mutual Funds
Opinion on the Financial Statements
We have audited the accompanying statement of assets and liabilities of the Sextant Short Term Bond Fund, Sextant Bond Income Fund, Sextant Core Fund, Sextant Global High Income Fund, Sextant Growth Fund and Sextant International Fund (the “Funds”), each a series of Saturna Investment Trust, including the schedules of investments, as of November 30, 2020, the related statements of operations for the year then ended, the statements of changes in net assets for each of the two years in the period then ended, the financial highlights for each of the five years in the period then ended, and the related notes (collectively referred to as the “financial statements”). In our opinion, the financial statements present fairly, in all material respects, the financial position of the Funds as of November 30, 2020, the results of their operations for the year then ended, the changes in their net assets for each of the two years in the period then ended and their financial highlights for each of the five years in the period then ended, in conformity with accounting principles generally accepted in the United States of America.
Basis for Opinion
These financial statements are the responsibility of the Funds’ management. Our responsibility is to express an opinion on the Funds’ financial statements based on our audits. We are a public accounting firm registered with the Public Company Accounting Oversight Board (United States) (“PCAOB”) and are required to be independent with respect to the Funds in accordance with the US federal securities laws and the applicable rules and regulations of the Securities and Exchange Commission and the PCAOB. We have served as the auditor of one or more of the funds in the Trust since 1997.
We conducted our audits in accordance with the standards of the PCAOB. Those standards require that we plan and perform the audits to obtain reasonable assurance about whether the financial statements are free of material misstatement, whether due to error or fraud. The Funds are not required to have, nor were we engaged to perform, an audit of their internal control over financial reporting. As part of our audits we are required to obtain an understanding of internal control over financial reporting, but not for the purpose of expressing an opinion on the effectiveness of the Funds internal control over financial reporting. Accordingly, we express no such opinion.
Our audits included performing procedures to assess the risks of material misstatement of the financial statements, whether due to error or fraud, and performing procedures that respond to those risks. Such procedures included examining, on a test basis, evidence regarding the amounts and disclosures in the financial statements. Our audits also included evaluating the accounting principles used and significant estimates made by management, as well as evaluating the overall presentation of the financial statements. Our procedures included confirmation of securities owned as of November 30, 2020 by correspondence with the custodian. We believe that our audits provide a reasonable basis for our opinion.
Philadelphia, Pennsylvania
January 29, 2021
|
| /s/ Tait, Weller & Baker LLP |
| Tait, Weller & Baker LLP |
| | | | | | | | | | |
| | | | | | |
| 60 | | | | | | | | November 30, 2020 | | Annual Report |
Expenses
All mutual funds have operating expenses. As a Sextant Fund shareowner, you incur ongoing costs, including management fees, distribution (or service) 12b-1 fees, and other fund expenses such as shareowner reports (such as this one). Operating expenses, which are deducted from a fund’s gross earnings, directly reduce the investment return of a fund. Mutual funds (unlike other financial investments) only report their results after deduction of operating expenses.
With the Sextant Funds, unlike many other mutual funds, you do not incur sales charges (loads) on purchases, reinvested dividends, or other distributions. You do not incur redemption fees or exchange fees. You may incur fees related to extra services requested by you for your account, such as bank wires. The examples below are intended to help you understand your ongoing costs (in dollars) of investing in the Funds and to compare these costs with the ongoing costs of investing in other mutual funds.
Examples
The following example is based on an investment of $1,000 invested at the beginning of the period and held for the entire period (June 1, 2020, to November 30, 2020).
Actual Expenses
The first line for each Fund provides information about actual account values and actual expenses. You may use the information in this line, together with the amount you have invested, to estimate the expenses you paid over the period. Simply divide your account value by $1,000 (for example, an $8,600 account value divided by $1,000 = 8.6), then multiply the result by the number in the first line under the heading entitled “Expenses Paid During Period” to estimate the expenses you paid on your account during this period. The Funds may charge for extra services (such as domestic bank wires, international bank wires, or overnight courier delivery of redemption checks) rendered on request, which you may need to estimate to determine your total expenses.
Hypothetical Example For Comparison Purposes
The second line provides information about hypothetical account values and hypothetical expenses based on the Fund’s actual expense ratio (based on the last six months) and an assumed rate of return of 5% per year before expenses, which is not the Fund’s actual return. The hypothetical account values and expenses may not be used to estimate the actual ending balance or expenses you paid for the period. You may use this information to compare ongoing costs of investing in the Fund and other mutual funds. To do so, compare this 5% hypothetical example with the 5% hypothetical examples that appear in the shareowner reports of other mutual funds. You may wish to add other fees that are not included in the expenses shown in the table, such as charges for extra services like bank wires.
Please note that the expenses shown in the tables are meant to highlight your ongoing costs only and do not reflect any transactional costs, such as sales charges (loads), redemption fees or exchange fees (note that the Sextant Funds do not charge any such transactional costs). Therefore, the “Hypothetical” line of each fund is useful in comparing ongoing costs only, and may not help you determine the relative total costs of owning different funds.
| | | | | | | | | | | | | | | | |
| | | | | |
| | | Beginning Account Value (June 1, 2020) | | | Ending Account Value (November 30,
2020) | | | Expenses Paid During Period1
| | | Annualized Expense Ratio | |
| | | | |
Short-Term Bond Fund | | | $1,000 | | | | $1,007.70 | | | | $2.99 | | | | 0.59% | |
| | | | |
Hypothetical (5% return before expenses) | | | $1,000 | | | | $1,022.09 | | | | $3.01 | | | | 0.59% | |
| | | | |
Bond Income Fund | | | $1,000 | | | | $1,029.70 | | | | $2.36 | | | | 0.46% | |
| | | | |
Hypothetical (5% return before expenses) | | | $1,000 | | | | $1,022.74 | | | | $2.35 | | | | 0.46% | |
| | | | |
Core Fund | | | $1,000 | | | | $1,106.00 | | | | $4.17 | | | | 0.79% | |
| | | | |
Hypothetical (5% return before expenses) | | | $1,000 | | | | $1,021.11 | | | | $4.00 | | | | 0.79% | |
| | | | |
Global High Income Fund | | | $1,000 | | | | $1,059.50 | | | | $2.84 | | | | 0.55% | |
| | | | |
Hypothetical (5% return before expenses) | | | $1,000 | | | | $1,022.31 | | | | $2.79 | | | | 0.55% | |
| | | | |
Growth Fund Investor Shares | | | $1,000 | | | | $1,232.60 | | | | $4.70 | | | | 0.84% | |
| | | | |
Hypothetical (5% return before expenses) | | | $1,000 | | | | $1,020.86 | | | | $4.25 | | | | 0.84% | |
| | | | |
Growth Fund Z Shares | | | $1,000 | | | | $1,234.30 | | | | $3.48 | | | | 0.62% | |
| | | | |
Hypothetical (5% return before expenses) | | | $1,000 | | | | $1,021.95 | | | | $3.15 | | | | 0.62% | |
| | | | |
International Fund Investor Shares | | | $1,000 | | | | $1,177.00 | | | | $3.62 | | | | 0.66% | |
| | | | |
Hypothetical (5% return before expenses) | | | $1,000 | | | | $1,021.74 | | | | $3.36 | | | | 0.66% | |
| | | | |
International Fund Z Shares | | | $1,000 | | | | $1,177.90 | | | | $2.52 | | | | 0.46% | |
| | | | |
Hypothetical (5% return before expenses) | | | $1,000 | | | | $1,022.76 | | | | $2.34 | | | | 0.46% | |
| 1 | Expenses are equal to the annualized expense ratio indicated above (based on the most recent semi-annual period of June 1, 2020, through November 30, 2020), multiplied by the average account value over the period, multiplied by 183/365 (to reflect the one-half year period). |
| | | | | | | | | | |
| | | | | | |
| Annual Report | | November 30, 2020 | | | | | | | | 61 |
| | |
| Trustees and Officers | | (unaudited) |
| | | | | | | | |
| Name, Address, and Age | | Position(s) Held with Trust and Number of Saturna Fund Portfolios Overseen | | Principal occupation(s) during past 5 years, including Directorships | | Other Directorships held by Trustee |
|
Independent Trustees |
| | | | |
(photo omitted) | | Marina E. Adshade (53) 1300 N. State Street Bellingham WA 98225 | | Independent Trustee (since 2017);
Nine | | Professor of Economics, University of British Columbia, Vancouver and Simon Fraser University; Author | | None |
| | | | |
(photo omitted) | | Ronald H. Fielding, MA, MBA, CFA (71) 1300 N. State Street Bellingham WA 98225 | | Independent Trustee (since 2009);
Thirteen | | Director, ICI Mutual Insurance Company | | Amana Mutual Funds Trust |
| | | | |
(photo omitted) | | Gary A. Goldfogel, MD (62) 1300 N. State Street Bellingham WA 98225 | | Chairman (since 2017); Independent Trustee (since 1995);
Nine | | Medical Examiner (pathologist) Owner, Avocet Environmental Testing (laboratory) | | None |
| | | | |
(photo omitted) | | Jim V. McKinney (59) 1300 N. State Street Bellingham WA 98225 | | Independent Trustee (since 2017);
Nine | | Executive Director, Common Threads Northwest; President/CEO, Apple Mountain LLC, consulting and development; US Army Foreign Area Officer - Political/Military Advisor to US Army Central; Senior Defense Official, Defense Attaché, US Embassy Slovenia | | None |
| | | | |
(photo omitted) | | Sarah E.D. Rothenbuhler (52) 1300 N. State Street Bellingham WA 98225 | | Independent Trustee (since 2017);
Nine | | CEO, Birch Equipment (industrial rentals and sales) | | None |
| |
Interested Trustee |
| | | | |
(photo omitted) | | Jane K. Carten, MBA (45) 1300 N. State Street Bellingham WA 98225 | | President, Trustee (since 2017);
Nine | | President and Director, Saturna Capital Corporation Vice President and Director, Saturna Trust Company President, Saturna Brokerage Services | | None |
| | | | | |
| | | | | | | | |
| | | | | | | | | | |
| | | | | | |
| 62 | | | | | | | | November 30, 2020 | | Annual Report |
| | |
| Trustees and Officers (continued) | | (unaudited) |
| | | | | | | | |
| Name (Age) and Address | | Position(s) held with Trust and Number of Saturna Fund Portfolios Overseen | | Principal occupation(s) during past 5 years, including Directorships | | Other Directorships held by Trustee |
|
Officers Who Are Not Trustees |
| | | | |
| (photo omitted) | | Bryce R. Fegley (45) 1300 N. State Street Bellingham, WA 98225 | | Vice President (since 2020);
N/A | | Portfolio Manager and Senior Investment Analyst, Saturna Capital | | N/A |
| | | | |
| (photo omitted) | | Christopher R. Fankhauser (48) 1300 N. State Street Bellingham, WA 98225 | | Treasurer1 (since 2002);
N/A | | Chief Operations Officer, Saturna Capital Corporation Vice President and Chief Operations Officer, Saturna Brokerage Services Director, Vice President, and Chief Operations Officer, Saturna Trust Company | | N/A |
| | | | |
| (photo omitted) | | Michael E. Lewis (59) 1300 N. State Street Bellingham, WA 98225 | | Chief Compliance Officer1 (since 2012);
N/A | | Chief Compliance Officer, Saturna Capital, Saturna Trust Company, and Affiliated Funds | | N/A |
| | | | |
| (photo omitted) | | Jacob A. Stewart (40) 1300 N. State Street Bellingham, WA 98225 | | Anti-Money Laundering Officer1 (since 2015);
N/A | | Anti-Money Laundering Officer, Saturna Capital Corporation, Saturna Brokerage Services Chief Compliance Officer, Saturna Brokerage Services Bank Secrecy Act Officer, Saturna Trust Company | | N/A |
| | | | |
| (photo omitted) | | Nicole Trudeau (41) 1300 N. State Street Bellingham WA 98225 | | Secretary1 (since 2018) | | Chief Legal Officer, Saturna Capital Corporation Former: Counsel, Simpson Thacher & Bartlett LLP; Partner, Stradley Ronon Stevens & Young, LLP; Partner, K&L Gates LLP | | N/A |
| | | | | |
| | | | | | | | |
Term of Office: each Trustee serves for the lifetime of the Trust or until they die, resign, are removed, or not re-elected by the shareowners. Each officer serves a one-year term subject to annual reappointment by the Trustees.
The Trust’s Statement of Additional Information, available without charge upon request by calling Saturna Capital at 1-800-728-8762 and on the Funds’ website, www.sextantfunds.com, includes additional information about the Trustees.
On November 30, 2020, the trustees, officers, and their affiliates as a group owned 44.90%, 26.16%, 32.49%, 55.76%, 0.34%, 18.05%, 0.00%, and 26.85% of the outstanding shares of Short-Term Bond Fund, Bond Income Fund, Core Fund, Global High Income Fund, Growth Fund Investor Shares, Growth Fund Z Shares, International Fund Investor Shares, and International Fund Z Shares, respectively. Saturna Capital Corporation is the Trust’s adviser and Saturna Brokerage Services, Inc. is the Trust’s distributor.
During the year ended November 30, 2020, the Independent Trustess were each paid by the Trust: (1) $2,000 annual retainer plus $1,000 per board meeting attended (in person or by phone), plus reimbursement of travel expenses; (2) $250 for committee meetings; and (3) $250 per quarter for serving as chariman of the board or any committee.
Mrs. Carten is an Interested Trustee by reason of her positions with the Trust’s adviser (Saturna Capital Corporation) and underwriter (Saturna Brokerage Services), and is the primary manager of the Saturna Sustainable Equity Fund portfolio. She is paid by Saturna Capital a salary, plus a bonus for each month the Saturna Sustainable Equity Fund portfolio earns a 4 or 5 star rating from Morningstar (see www.saturna.com). The officers are paid by Saturna Capital and not the Trust. As of November 30, 2020, all Saturna Capital employees listed above as officers owned shares in one or more of the Saturna Investment Trust funds, with Mrs. Carten owning (directly or indirectly) over $1.3 million.
| 1 | Holds the same postion with Amana Mututal Funds Trust |
| | | | | | | | | | |
| | | | | | |
| Annual Report | | November 30, 2020 | | | | | | | | 63 |
| | |
| Renewal of Investment Advisory Contract | | (unaudited) |
During their meeting of September 15, 2020, the Trustees of Saturna Investment Trust, including the Independent Trustees, discussed the continuance of the Investment Advisory and Administrative Services Agreement (“Agreement”) with the Trust, on behalf of each of the Sextant Funds (Bond Income Fund, Global High Income Fund, Growth Fund, International Fund, Core Fund, and Short-Term Bond Fund) (the “Funds”), and Saturna Capital. In considering the renewal of the Agreement, the Trustees discussed the nature, extent, and quality of the services provided by Saturna Capital to the Trust and each Fund. The Trustees considered Saturna Capital’s specific responsibilities in all aspects of day-to-day management of the Funds as well as the qualifications, experience and responsibilities of the Funds’ portfolio managers and other key personnel at Saturna Capital. The Trustees discussed Saturna Capital’s experience, ability, and commitment to quality service through performing internally such functions as shareowner servicing, administration, accounting, marketing, and distribution — all in addition to investment management.
The Trustees took into consideration Saturna Capital’s continued avoidance of significant operational and compliance problems, plus its investments in infrastructure, information management systems, personnel, training, and investor education materials, all designed to provide high quality investor services and meet investor needs. They recognized Saturna Capital’s efforts to recruit and retain qualified and experienced staff and improve the capital base on which Saturna Capital operates, which the Trustees believe is important to the long-term success of the Funds. They considered Saturna Capital’s focus on investors and its efforts to avoid potential conflicts of interest.
The Trustees considered the investment performance of each Fund over time, including each Fund’s average annual total returns relative to its benchmark for the one-, three-, five-, ten-, and fifteen-year periods, as applicable, all as of July 31, 2020. The Trustees also considered comparative information from Morningstar and Lipper, which provide independent analysis of mutual fund data and, among other things, rank mutual fund performance within categories comprised of similarly managed funds. The Trustees considered and discussed each Fund’s performance relative to the Fund’s Morningstar category for the one-, three-, five-, ten-, and fifteen-year periods, as applicable, ended July 31, 2020. The Trustees also considered each Fund’s Morningstar performance rankings (one through five stars) and noted the sustainability ratings assigned to some of the Funds by Morningstar. In addition, the Trustees considered each Fund’s performance ranking relative to the Fund’s category selected by Lipper.
With respect to long-term (10- and 15-year) performance, the Trustees noted that the Sextant International Fund’s average annual total return for the ten-year period ended on July 31, 2020 was below the Morningstar category average and was above the Morningstar category average for the fifteen-year period, and that the Fund outperformed its benchmark during the same periods. The Trustees noted that the Sextant Growth Fund underperformed its Morningstar category average for the ten- and fifteen-year periods and underperformed its benchmark for the ten-year period, but outperformed its benchmark for the fifteen-year period. The Trustees noted that Sextant Short-Term Bond Fund underperformed its Morningstar category average for the ten- and fifteen-year periods and outperformed its benchmark for the ten-year period, and slightly underperformed its benchmark for the fifteen-year period. The Trustees noted that Sextant Bond Income Fund underperformed the Morningstar category average for the same ten- and fifteen-year periods, and outperformed and performed in line with its benchmark for those ten- and fifteen-year periods, respectively. The Trustees noted that Sextant Core Fund underperformed its Morningstar category average and benchmark for the ten-year period ended July 31, 2020.
The Trustees considered the short- and medium-term performance of the Funds, noting that Sextant International Fund, Sextant Global High Income Fund and Sextant Core Fund each outperformed its Morningstar category average for the five-year period ended July 31, 2020, while each of the other Funds trailed its Morningstar category average during the same period. The Trustees noted that for the three-year period ended on July 31, 2020, Sextant International Fund, Sextant Growth Fund and Sextant Core Fund each outperformed its respective Morningstar category average, while Sextant Global High Income Fund, Sextant Short-Term Bond Fund, and Sextant Bond Income Fund each underperformed its respective Morningstar category average.
The Trustees also considered the Funds’ short-term performance, noting that for the one-year period ended on July 31, 2020, Sextant Growth Fund, Sextant Core Fund, and Sextant Short-term Bond Fund each outperformed its benchmark and outperformed or performed in line with its respective Morningstar category average, while Sextant International Fund, Sextant Global High Income Fund, and Sextant Bond Income each underperformed its Morningstar category average.
The Trustees noted the generally risk-averse investment style of the Funds and other factors which can affect each Fund’s performance relative to its broader Morningstar category. The Trustees also noted certain differences between each Fund and the peer funds within its Morningstar category, including differences in investment strategies and asset size. The Trustees found that Saturna Capital continued to manage each Fund in a manner that is designed to be risk-averse and attractive to long-term investors. The Trustees discussed and considered the efforts of Saturna Capital to make additional resources available to assist in managing the Funds. The Trustees also considered Saturna Capital’s focus on improving investment performance without incurring materially higher levels of risk.
The Trustees also considered the performance and expenses of each Fund as compared to smaller group of funds with similar assets and investment objectives and strategies. The Trustees considered
| | | | | | | | | | |
| | | | | | |
| 64 | | | | | | | | November 30, 2020 | | Annual Report |
| | |
| Renewal of Investment Advisory Contract (continued) | | (unaudited) |
these comparative performance and expense data, along with the comparative data published by Morningstar and each Fund’s performance relative to its benchmark, to evaluate the Fund’s performance over near-term and long-term time periods. The Trustees continued to recognize the fulcrum structure of the advisory fee, where the manager’s compensation is directly related to the relative performance of each Fund.
The Trustees also reviewed the fees and expenses of each Fund, including comparative data on fees and expenses published by Morningstar, and considered the components of the Fund’s operating expenses. The Trustees noted the steps that Saturna Capital has undertaken to maintain competitive levels of Fund operating expenses. They noted the significant sponsorship of the Funds by Saturna Capital evidenced, in part, by certain fees and expenses paid by Saturna Capital out of its own resources. The Trustees recognized Saturna Capital’s efforts help make the Funds more widely available and less expensive than would otherwise be the case without Saturna Capital’s efforts.
The Trustees recognized that each Fund remains relatively small and there have not been opportunities to consider economies of scale. The Trustees noted Saturna Capital’s commitment to continue operating the Funds and the costs undertaken by Saturna Capital.
The Trustees reviewed Saturna Capital’s financial information and discussed the issue of Saturna Capital’s profitability as related to management and administration of the Trust. They discussed the reasonableness of Saturna Capital’s profitability as part of their evaluation of whether each Fund’s advisory fees bear a reasonable relationship to the mix of services provided by Saturna Capital, including the nature, extent, and quality of such services.
The Trustees considered and compared the fees charged by Saturna Capital to other types of accounts, including non-mutual fund advisory clients. The Trustees noted the differences between the full range of services Saturna Capital provides to the Funds, including investment advisory and administrative services, transfer agency services, and other services, as compared to the investment advisory services provided to the other advisory accounts.
The Trustees considered potential benefits to Saturna Capital’s other business lines from acting as investment adviser to the Funds, but also recognized that Saturna Capital’s other business lines benefit the Funds. The Trustees also noted that there were no soft dollar arrangements with respect to trading in the Funds’ portfolios. The Trustees considered whether there are other potential benefits to Saturna Capital in continuing to manage the Funds and the Trustees found that there were no material benefits other than Saturna Capital’s receipt of advisory fees and the fact that Saturna Brokerage Services, a wholly owned subsidiary of Saturna Capital, receives distribution and shareholder services fees under Rule 12b-1, which it would not otherwise receive if Saturna Capital did not serve as the investment manager for the Funds. The Trustees also noted that Saturna Brokerage Services voluntarily waives brokerage commissions for executing Fund portfolio transactions, resulting in lower transaction costs.
The Trustees concluded based on their business judgement that the fees paid by each Fund to Saturna Capital were, from an arm’slength bargaining perspective, reasonable and in the best interest of the Fund and its shareowners in light of the services provided, comparative performance, expense and advisory fee information, costs of services provided, profits to be realized, and benefits derived or to be derived by Saturna Capital from its relationship with the Fund. Following this discussion, the Trustees, including the Independent Trustees, unanimously agreed to renew each Fund’s Agreement with Saturna Capital.
| | | | | | | | | | |
| | | | | | |
| Annual Report | | November 30, 2020 | | | | | | | | 65 |
Availability of Portfolio Information
| (1) | The Sextant Funds file complete schedules of portfolio holdings with the SEC for the first and third quarters of each fiscal year as an exhibit to its reports on Form N-PORT. Previously, this information was filed on Form N-Q. |
| (2) | The Funds’ Form N-PORT reports are available on the SEC’s website at www.sec.gov and at www.sextantfunds.com. |
| (3) | The Funds make a complete schedule of portfolio holdings after the end of each month available to investors at www.sextantfunds. com. |
Householding Policy
To reduce expenses, we may mail only one copy of the Funds’ prospectus, each annual and semi-annual report, and proxy statements when necessary, to those addresses shared by two or more accounts. If you wish to receive individual and/or more copies of these documents, please call us at 1-800-728-8762 or write to us at Saturna Capital/Sextant Mutual Funds, P.O. Box N, Bellingham, WA 98227. We will begin sending you individual copies 30 days after receiving your request.
If you are currently receiving multiple copies and wish to receive only one copy, please call us at 1-800-728-8762 or write to us at Saturna Capital/Sextant Mutual Funds, P.O. Box N, Bellingham, WA 98227. We will begin sending you a single copy with subsequent report mailings.
Availability of Proxy Voting Information
| (1) | A description of the policies and procedures that the Funds use to determine how to vote proxies relating to portfolio securities is available (a) without charge, upon request, by calling Saturna Capital at 1-800-728-8762; (b) on the Funds’ website at www. sextantfunds.com; and (c) on the SEC’s website at www.sec.gov. |
| (2) | Information regarding how each Fund voted proxies relating to portfolio securities during the most recent 12-month period ended June 30 is available (a) without charge, upon request, by calling Saturna Capital at 1-800-728-8762; (b) on the Funds’ website at www.sextantfunds.com; and (c) on the SEC’s website at www.sec. gov. |
| | | | | | | | | | |
| | | | | | |
| 66 | | | | | | | | November 30, 2020 | | Annual Report |
Statement Regarding Liquidity Risk Management Program
The Securities and Exchange Commission adopted Rule 22e-4 under the Investment Company Act of 1940, as amended (the “Liquidity Rule”) to promote effective liquidity risk management throughout the open-end investment company industry, thereby reducing the risk that funds will be unable to meet their redemption obligations and mitigating dilution of the interests of fund shareholders.
Pursuant to the Liquidity Rule, the Trust, on behalf of the Funds, has adopted a liquidity risk management program (the “Program”) to govern the Trust’s approach to managing liquidity risk. The Program is overseen by Saturna Capital’s Liquidity Risk Committee, and the Program’s principal objectives include assessing, managing and periodically reviewing each Fund’s liquidity risk, based on factors specific to the circumstances of the Fund.
At a meeting of the Board held on December 17, 2019, the Trustees received a report addressing the operation of the Program and assessing its adequacy and effectiveness of implementation. It was reported to the Board that the assessment found that the Program was adequately designed and effective in achieving its objectives. Further, that review of the Program’s implementation evidenced substantial compliance with relevant policies and procedures.
Privacy Statement
At Saturna Capital and Saturna Investment Trust, we understand the importance of maintaining the privacy of your financial information. We want to assure you that we protect the confidentiality of any personal information that you share with us. In addition, we do not sell information about our current or former customers.
In the course of our relationship, we gather certain nonpublic information about you, including your name, address, investment choices, and account information. We do not disclose your information to unaffiliated third parties unless it is necessary to process a transaction; service your account; deliver your account statements, shareowner reports and other information; or as required by law. When we disclose information to unaffiliated third parties, we require a contract to restrict the companies’ use of customer information and from sharing or using it for any purposes other than performing the services for which they were required.
We may share information within the Saturna Capital family of companies in the course of informing you about products or services that may address your investing needs.
We maintain our own technology resources to minimize the need for any third party services, and restrict access to information within Saturna. We maintain physical, electronic, and procedural safeguards to guard your personal information. If you have any questions or concerns about the security or privacy of your information, please call us at 1-800-728-8762.
| | | | | | | | | | |
| | | | | | |
| Annual Report | | November 30, 2020 | | | | | | | | 67 |

| | | | | | | | | | | | | | | | | | | | | | | | |
Performance Summary (as of December 31, 2020) | | | | | | | | | | | | | | | | (unaudited) | |
Average Annual Returns (before any taxes paid by shareowners) | | | | | | | | | | | | | | | | | |
| | | | | | | | | | | | | | | | | | | | Expense Ratio1 | |
| | | | | | |
| | | 1 Year | | | | 3 Year | | | | 5 Year | | | | 10 Year | | | | Gross | | | | Net | |
| | | | | | |
Sustainable Equity Fund (SEEFX) | | | 24.39% | | | | 15.36% | | | | 13.37% | | | | n/a | | | | 1.81% | | | | 0.75% | |
| | | | | | | |
S&P Global 1200 Index | | | 15.58% | | | | 10.79% | | | | 12.90% | | | | 10.34% | | | | n/a | | | | n/a | |
| | | | | | | |
| | | | | | | | | | | | | | | | | | | | | | | | |
| | | | | | |
Sustainable Bond Fund (SEBFX) | | | 7.34% | | | | 3.63% | | | | 3.72% | | | | n/a | | | | 0.83% | | | | 0.65% | |
| | | | | | | |
FTSE WorldBIG Index | | | 9.47% | | | | 4.89% | | | | 4.80% | | | | 2.89% | | | | n/a | | | | n/a | |
Performance data quoted in this report represents past performance, is before any taxes payable by shareowners, and is no guarantee of future results. Current performance may be higher or lower than that stated herein. Performance current to the most recent month-end is available by calling toll-free 1-800-728-8762 or visiting www.saturnasustainable.com. Average annual total returns are historical and include change in share value as well as reinvestment of dividends and capital gains, if any. The investment return and principal value of an investment will fluctuate so that an investor’s shares, when redeemed, may be worth more or less than their original cost. Funds that invest in foreign securities may involve greater risk, including political and economic uncertainties of foreign countries as well as the risk of currency fluctuations.
A note about risk: Please see Notes to Financial Statements beginning on page 21 for a discussion of investment risks. For a more detailed discussion of the risks associated with each Fund, please see the Funds’ prospectus or each Fund’s summary prospectus.
A Fund’s 30-Day Yield, sometimes referred to as “standardized yield” or “SEC yield,” is expressed as an annual percentage rate using a method of calculation adopted by the Securities and Exchange Commission (SEC). The 30-Day Yield provides an estimate of a Fund’s investment income rate, but may not equal the actual income distribution rate.
| 1 | By regulation, expense ratios shown in these tables are as stated in the Funds’ most recent Prospectus, dated March 27, 2020, and incorporate results for the fiscal year ended November 30, 2019. Ratios presented in this table differ from the expense ratios shown elsewhere in this report as they represent different periods. Also by regulation, the performance in this table represents the most recent quarter-end performance rather than performance through the Funds’ most recent fiscal period. Saturna Capital, the Fund’s adviser, has voluntarily capped actual expenses of the Sustainable Equity Fund at 0.75% and actual expenses of the Sustainable Bond Fund at 0.65% through March 31, 2021. |
The S&P Global 1200 Index is a global stock market index covering nearly 70% of the world’s equity markets. The FTSE WorldBIG Index is a multi-asset, multi-currency benchmark, which provides a broad-based measure of the global fixed-income markets. Investors cannot invest directly in the indices.
The Saturna Sustainable Funds limit the securities they purchase to those consistent with sustainable principles. This limits opportunities and may affect performance.

On the cover: Antelope Canyon in Arizona.
Photo by Elizabeth Alm.
Please consider an investment’s objectives, risks, charges, and expenses carefully before investing. To obtain this and other important information about the Saturna Sustainable Funds in a prospectus or summary prospectus, ask your financial adviser, visit www.saturnasustainable.com, or call toll-free 1-800-728-8762. Please read the prospectus or summary prospectus carefully before investing.
| | | | | | | | | | |
| | | | | | |
| 2 | | | | | | | | November 30, 2020 | | Annual Report |
| | |
| Fellow Shareowners: | | January 25, 2021 |
2020 was quite a ride. Things got off to a rocky start, with the S&P 500 Index experiencing dramatic COVID-19 pandemic-induced volatility in the first quarter, but then quickly recovering those losses in the second, with the third and fourth riding a mostly sustained rise with a few dips along the way, finishing out the Funds’ fiscal year with a one year return of 17.46% as of November 30, 2020. Saturna Sustainable Equity Fund fared better, posting a 23.74% increase for the same period, while Saturna Sustainable Bond Fund rose 6.78%. March 27, 2020, marked five years since the launch of the Saturna Sustainable Funds. Since then, assets of the Funds have grown 557%, supporting investors with an innovative approach to sustainable investing and a collection of thought-provoking white papers, practice management tools, and impact reports.
We entered 2020 with cautious optimism. Geopolitical uncertainties, rich corporate valuations, and stretched monetary policies kept us vigilant, while generally strong business and economic fundamentals supported optimism. What we didn’t foresee was the looming pandemic, widespread economic shutdowns, and rapid government intervention. By nature, such a “black swan” is unforeseeable, and it’s also why we place emphasis on seeking out companies with robust balance sheets and competitive positioning to support earnings growth even through trying times. We cannot control the weather, but we can plot a course and pick a vessel to ride out the storm.
Saturna Sustainable Funds seek sustainable investments with low risks in areas of the environment, social responsibility, and governance (ESG). “graphic omitted”
With 2020’s bull market largely driven by multiple expansion, particularly in Technology stocks, valuations continue to be a point of contention. One way to consider whether or not the market has become irrational is to look at the cyclically adjusted price-to-earnings, or CAPE, ratio. This figure considers inflation-adjusted share prices relative to the 10-year average of real earnings per share. When we compare this figure with the US government’s 10-year interest
| | | | | | | | | | | | |
| | | | | | | |
| November 30, 2020 | | | | Annual Report | | | | | | | | 3 |
rate, a common starting point for discount rates used in valuation, the market appears to be fairly priced. That said, we see the strong returns of 2020 largely attributable to the pandemic-driven decline in interest rates as opposed to continued earnings growth. Looking ahead, we don’t expect to see further multiple expansion, barring the Federal Reserve cutting nominal interest rates into negative territory. With 2020 being far from a normal baseline, we expect some volatility as the market shakes out which companies are deserving of their newfound valuations.
Broad recovery and a return to more normal conditions remain on hold as vaccines are rolled out. We undoubtedly face more economic turmoil, but we retain faith in the power of human resilience and creativity. Thank you for investing with us. Please read this report and let us know how we can be of assistance to you in your quest for responsible investment choices.
Respectfully,
(photo omitted)
Jane Carten,
President
(photo omitted)
Gary Goldfogel,
Independent Board Chairman
| | | | | | | | | | |
| | |
| | Saturna Sustainable Funds Portfolio Management | | |
| | | | | |
| | (photo omitted) | | Jane Carten MBA Saturna Sustainable Equity Fund Portfolio Manager | | (photo omitted) | | Patrick Drum MBA, CFA®, CFP® Saturna Sustainable Bond Fund Portfolio Manager | | |
| | | | | |
| | (photo omitted) | | Scott Klimo CFA® Saturna Sustainable Equity Fund Deputy Portfolio Manager | | (photo omitted) | | Elizabeth Alm CFA® Saturna Sustainable Bond Fund Deputy Portfolio Manager | | |
| | | | | | | | | | | | |
| | | | | | | |
| 4 | | | | | | | | November 30, 2020 | | | | Annual Report |
| | | | |
| Morningstar RatingsTM & Carbon MetricsTM | | As of December 31, 2020 | | (unaudited) |
| | | | | | | | | | | | | | | | |
| | | | | | | | | | | | | | | | |
| | | | | |
MorningstarTM RatingsA | | 1 Year | | 3 Year | | | 5 Year | | | | Overall | | | | Sustainability RatingTM B | |
| | | | |
Saturna Sustainable Equity Fund – “Large Blend” Category | | | | | | | | | | | | |
| | | | | |
SEEFX | | n/a | | « « « « | | | « « « « | | | | « « « « | | | | Ø Ø Ø Ø Ø | |
| | | | | | |
% Rank in Category | | 25 | | 18 | | | 27 | | | | n/a | | | | 2 | |
| | | | | | |
Number of Funds in Category | | 867 | | 760 | | | 631 | | | | 760 | | | | | |
| | | | | | | | | | | | | | | | | | | | |
| | | | | |
| | | | | | | | | | | | | | | | | | | | | |
| | |
Saturna Sustainable Bond Fund – “Large Growth” Category | | | | | | | | | |
| | | | | |
SEBFX | | | n/a | | | | « « | | | | « « « | | | | « « | | |
| n/a
|
|
% Rank in Category | | | 74 | | | | 65 | | | | 78 | | | | n/a | |
Number of Funds in Category | | | 204 | | | | 180 | | | | 169 | | | | 180 | |
The Morningstar Sustainability Rating, Low Carbon designation, Carbon Risk Score, and Fossil Fuel Involvement % are not based on fund performance and are not equivalent to the Morningstar Rating (“Star Rating”).
© 2021 Morningstar®. All rights reserved. Morningstar, Inc. is an independent fund performance monitor. The information contained herein: (1) is proprietary to Morningstar and/or its content providers; (2) may not be copied or distributed; and (3) is not warranted to be accurate, complete, or timely. Neither Morningstar nor its content providers are responsible for any damages or losses arising from any use of this information.
| A | Morningstar Ratings™ (“Star Ratings”) are as of December 31, 2020. The Morningstar Rating™ for funds, or “star rating”, is calculated for managed products (including mutual funds, variable annuity and variable life subaccounts, exchange-traded funds, closed-end funds, and separate accounts) with at least a three-year history. Exchange-traded funds and open-ended mutual funds are considered a single population for comparative purposes. It is calculated based on a Morningstar Risk-Adjusted Return measure that accounts for variation in a managed product’s monthly excess performance (not including the effects of sales charges, loads, and redemption fees), placing more emphasis on downward variations and rewarding consistent performance. The top 10% of products in each product category receive 5 stars, the next 22.5% receive 4 stars, the next 35% receive 3 stars, the next 22.5% receive 2 stars, and the bottom 10% receive 1 star. The Overall Morningstar Rating for a managed product is derived from a weighted average of the performance figures associated with its three-, five-, and 10- year (if applicable) Morningstar Rating metrics. The weights are: 100% three- year rating for 36-59 months of total returns, 60% five-year rating/40% three- year rating for 60-119 months of total returns, and 50% 10-year rating/30% five-year rating/20% three-year rating for 120 or more months of total returns. While the 10-year overall star rating formula seems to give the most weight to the 10-year period, the most recent three-year period actually has the greatest impact because it is included in all three rating periods. |
| B | Morningstar Sustainability Rating is as of November 30, 2020. The Morningstar Sustainability Rating™ is intended to measure how well the issuing companies of the securities within a fund’s portfolio are managing their environmental, social, and governance (“ESG”) risks and opportunities relative to the fund’s Morningstar category peers. The Morningstar Sustainability Rating calculation is a two-step process. First, each fund with at least 50% of assets covered by a company-level ESG score from Sustainalytics receives a Morningstar Portfolio Sustainability Score™. The Morningstar Portfolio Sustainability Score is an asset-weighted average of normalized company-level ESG scores with deductions made for controversial incidents by the issuing companies, such as environmental accidents, fraud, or discriminatory behavior. The Morningstar Sustainability Rating is then assigned to all scored funds within Morningstar Categories in which at least ten (10) funds receive a Portfolio Sustainability Score and is determined by each fund’s rank within the following distribution: High (highest 10%), Above Average (next 22.5%), Average (next 35%), Below Average (next 22.5%), and Low (lowest 10%). The Morningstar Sustainability Rating is depicted by globe icons where High equals 5 globes and Low equals 1 globe. |
A Sustainability Rating is assigned to any fund that has more than half of its underlying assets rated by Sustainalytics and is within a Morningstar Category with at least 10 scored funds; therefore, the rating it is not limited to funds with explicit sustainable or responsible investment mandates. Morningstar updates its Sustainability Ratings monthly. Portfolios receive a Morningstar Portfolio Sustainability Score and Sustainability Rating one month and six business days after their reported as-of date based on the most recent portfolio-. As part of the evaluation process, Morningstar uses Sustainalytics’ ESG scores from the same month as the portfolio as-of date.
Saturna Sustainable Equity Fund was rated on 100% of Assets Under Management.
% Rank in Category is the fund’s percentile rank for the specified time period relative to all funds that have the same Morningstar category. The highest (or most favorable) percentile rank is 1 and the lowest (or least favorable) percentile rank is 100. The top-performing fund in a category will always receive a rank of 1. Percentile ranks within categories are most useful in those categories that have a large number of funds.
Morningstar Carbon Metrics are as of September 30, 2020. Morningstar carbon metrics are asset-weighted portfolio calculations based on their Sustainalytics subsidiary’s carbon-risk research. Based on two of these metrics – Carbon Risk Score and Fossil Fund Involvement % – funds may receive the Low Carbon designation, which allows investors to easily identify low-carbon funds within the global universe.
The portfolio Carbon Risk Score is a number between 0 and 100 (a lower score is better). A portfolio’s Carbon Risk Score is the asset-weighted sum of the carbon risk scores of its holdings, averaged over the trailing 12 months. The carbon risk of a company is Sustainalytics’ evaluation of the degree to which a firm’s activities and products are aligned with the transition to a low-carbon economy. The assessment includes carbon intensity, fossil fuel involvement, stranded assets exposure, mitigation strategies, and green product solutions.
Fossil Fuel Involvement % is the portfolio’s asset-weighted percentage exposure to fossil fuels, averaged over the trailing 12 months. Companies with fossil fuel involment are defined as these in the following subindustries: Thermal Coal Extraction, Thermal Coal Power Generation, Oil & Gas Production, Oil & Gas Power Generation, and Oil & Gas Products & Services.
To receive the Low Carbon designation a fund must have a Carbon Risk Score below 10 and a Fossil Fuel Involvement % of less than 7% of assets. For these metrics to be calculated, at least 67% of a portfolio’s assets must be covered by Sustainalytics company carbon-risk research. All Morningstar carbon metrices are calculated quarterly.
Saturna Sustainable Equity Fund was rated on 93% of Assets Under Management.
The Funds’ portfolios are actively managed and are subject to change, which may result in different Morningstar Sustainability Ratings and Carbon Metrics over time.
| | | | | | | | | | | | |
| | | | | | | |
| November 30, 2020 | | | | Annual Report | | | | | | | | 5 |
| | |
| Saturna Sustainable Equity Fund: Performance Summary | | (unaudited) |
| | | | | | | | | | | | | | | | |
Average Annual Returns as of November 30, 2020 | | | | | | | | | | | | | |
| | | | | |
| | | 1 Year | | | 5 Year | | | 10 Year | | | Expense Ratio1 | |
| | | | |
Sustainable Equity Fund (SEEFX)2 | | | 23.74% | | | | 12.05% | | | | n/a | | | | 1.81% | |
| | | | |
S&P Global 1200 Index | | | 14.39% | | | | 11.53% | | | | 10.64% | | | | n/a | |
Growth of $10,000
| | |
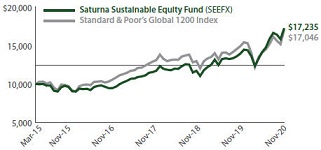 | | Comparison of any mutual fund to a market index must be made bearing in mind that the index is expense-free. Conversely, the fund will (1) be actively managed; (2) have an objective other than mirroring the index, such as limiting risk; (3) bear transaction and other costs; (4) stand ready to buy and sell its securities to shareowners on a daily basis; and (5) provide a wide range of services. The graph compares $10,000 invested in the Fund on March 27, 2015, to an identical amount invested in the Standard & Poor’s Global 1200 Index, a global stock market index covering nearly 70% of the world’s equity markets. The graph shows that an investment in the Fund would have risen to $17,235 versus $17,046 in the index. |
Past performance does not guarantee future results. The “Growth of $10,000” graph and “Average Annual Returns” performance table assume the reinvestment of dividends and capital gains. They do not reflect the deduction of taxes that a shareowner might pay on fund distributions or the redemption of fund shares.
| 1 | By regulation, the expense ratio shown in this table is as stated in the Fund’s most recent prospectus which is dated March 27, 2020, and incorporates results for the fiscal year ended November 30, 2019, before fee waivers. The expense ratio shown in the most recent prospectus after fee waivers was 0.75%. The ratio presented in this table differs from expense ratios shown elsewhere in this report as they represent different periods. |
| 2 | Operations commenced on March 27, 2015. |
Fund Objective
The objective of the Sustainable Equity Fund is capital appreciation.
| | | | |
Top 10 Holdings | | | | |
| |
| % of Total Net Assets | |
| |
Adobe | | | 2.8% | |
| |
Apple | | | 2.8% | |
| |
Vestas Wind Systems | | | 2.7% | |
| |
CGI Group, Class A | | | 2.6% | |
| |
Siemens Gamesa Renewable Energy | | | 2.3% | |
| |
Sony ADR | | | 2.2% | |
| |
Taiwan Semiconductor ADR | | | 2.1% | |
| |
Murata Manufacturing | | | 2.1% | |
| |
L’Oreal ADR | | | 2.0% | |
| |
Atlassian | | | 2.0% | |
| | | | | | | | | | | | |
Portfolio Diversification | | | | | | | | | | | | |
| | | |
| % of Total Net Assets | | | | | | | | | |
| | | |
Household Products | | | 9.4% | | | ∎ | | | | | 
| |
Application Software | | | 9.3% | | | ∎ | | |
Large Pharma | | | 6.9% | | | ∎ | | |
Renewable Energy Equipment | | | 5.0% | | | ∎ | | |
Specialty Chemicals | | | 4.3% | | | ∎ | | |
Consumer Electronics | | | 4.1% | | | ∎ | | |
IT Services | | | 4.0% | | | ∎ | | |
Commercial & Residential Building | | | 3.8% | | | ∎ | | |
Equipment & Systems | | | 3.5% | | | ∎ | | |
Semiconductor Devices | | | 3.5% | | | ∎ | | |
Home Products Stores | | | 3.0% | | | ∎ | | |
Electrical Power Equipment | | | 3.0% | | | ∎ | | |
Communications Equipment | | | 2.8% | | | ∎ | | |
Life Insurance | | | 2.6% | | | ∎ | | |
Industries < 2.5% | | | 31.4% | | | ∎ | | |
Other Assets (net of liabilities) | | | 6.9% | | | ∎ | | |
| | | | | | | | | | |
| | | | | | |
| 6 | | | | | | | | November 30, 2020 | | Annual Report |
| | |
| Saturna Sustainable Equity Fund: Discussion of Fund Performance | | (unaudited) |
(photo omitted)
Fiscal Year 2020
For the third consecutive year, the Saturna Sustainable Equity Fund outperformed its benchmark index, the S&P Global 1200. For the fiscal year ended November 30, 2020, the Fund returned 23.74%, significantly exceeding the benchmark return of 14.39% – its widest margin yet. Contributions to Fund performance were broad-based, with Financials the sole sector suffering a negative return, and positive contributions seen from every region in which the Fund participated, led by Western Europe.
Factors Affecting Past Performance
The Saturna Sustainable Equity Fund has a global mandate with assets allocated among 15 nations. Western Europe accounts for the largest weighting followed by North America and Asia-Pacific. While we are benchmark agnostic, we note that relative to the S&P Global 1200 Index, we are far overweight Western Europe, underweight the United States, and roughly in line with Asia-Pacific. Not only did Western Europe represent our largest exposure, it also made the largest contribution to Fund returns, led by Denmark, home to Vestas Wind Systems. One of the world’s leading wind turbine manufacturers, Vestas performed admirably in 2020 as the effects of anthropogenic climate change become more difficult to ignore. Spain followed, for the same reason, as returns there were led by Siemens Gamesa, another wind turbine manufacturer. We have four investments in the Netherlands, a country which, like Denmark, nurtures global companies to a greater degree than its size would suggest. All of those investments provided positive returns, including medical equipment firm Philips and media, software, and services company Wolters Kluwer.
In the United States, our investments skew toward Technology, a sector that has performed exceptionally well during the pandemic. Apple, which has recently added ESG metrics to its executive compensation scheme and has pledged to be carbon neutral by 2030, was the largest contributor, followed by Adobe and Microsoft. The Fund also benefited from our investments in the stay-at-home theme, represented by Lowe’s and Home Depot.
Within Asia-Pacific, Japan provided the largest exposure and contribution. Nintendo and Sony were the primary drivers, but we also benefited from the investment in Consumer Staples company Unicharm, a leader in adult incontinence products. Malaysia is a country we know well, due to our subsidiary there, and last year it was home to the single largest Fund contributor – Hartalega Holdings. Hartalega is a global leader in nitrile glove production and benefited tremendously from the surge in glove demand due to the pandemic. We expect that even post-pandemic, certain practices will remain, and glove demand will remain high. While the Fund has no holdings in the People’s Republic of China, we do look closely at Taiwan. Corporate reporting, especially of ESG metrics, can be hit or miss but there’s no denying Taiwan’s economic success. Our one investment there – Taiwan Semiconductor – performed strongly. Just as important, it provides detailed information on sustainability metrics such as carbon emissions and water usage and has set ambitious reduction targets.
Looking Forward
The economic outlook for 2021 will stand in marked contrast to 2020, eventually. Despite the arrival of a coronavirus vaccine, real improvement may not occur until the back half of the year. With few exceptions, vaccine distribution has failed to meet expectations around the world and the breakdown of social distancing guidelines over the holiday season could easily lead to a major surge in infections over the first part of the year. In the US, the Democratic Party has regained control of the Senate, adding to their majority in the House and control of the executive branch, pointing to greater cooperation with Europe on issues surrounding trade, global taxation and, of course, the environment. We expect China will continue to be a source of friction. We are devoting much thought to potential investment themes following the dramatic change in government and are hopeful that ESG issues move to the forefront. Naturally, we won’t provide projections for market returns over the coming year but believe, as always, that staying invested for the long term remains the best strategy for most investors.
| | | | | | | | | | | | |
| | | | | | | |
| November 30, 2020 | | | | Annual Report | | | | | | | | 7 |
| | |
| Saturna Sustainable Equity Fund: Schedule of Investments | | As of November 30, 2020 |
| | | | | | | | | | | | | | | | | | | | | | |
| | | | | | | | |
| | | Common Stocks – 93.1% | | | | Number of Shares | | | Cost | | | Market Value | | | Country1 | | Percentage of Net Assets | |
| | | | | | | |
| | | Consumer Discretionary | | | | | | | | | | | | | | | | |
| | | | | | | | |
| | | Apparel, Footwear & Accessory Design | | | | | | | | | | | | | | | | |
| | | | | | | | |
| | | adidas ADR | | | | | 1,900 | | | | $262,587 | | | | $304,190 | | | Germany2 | | | 1.8% | |
| | | | | | | | |
| | | Automobiles | | | | | | | | | | | | | | | | |
| | | | | | | | |
| | | Toyota Motor ADR | | | | | 1,000 | | | | 107,632 | | | | 134,460 | | | Japan | | | 0.8% | |
| | | | | | | | |
| | | Consumer Electronic & Appliance Stores | | | | | | | | | | | | | | | | |
| | | | | | | | |
| | | Best Buy | | | | | 1,000 | | | | 80,900 | | | | 108,800 | | | United States | | | 0.6% | |
| | | | | | | | |
| | | E-Commerce Discretionary | | | | | | | | | | | | | | | | |
| | | | | | | | |
| | | Amazon.com3 | | | | | 96 | | | | 201,118 | | | | 304,132 | | | United States | | | 1.8% | |
| | | | | | | | |
| | | Home Products Stores | | | | | | | | | | | | | | | | |
| | | | | | | | |
| | | Home Depot | | | | | 950 | | | | 127,734 | | | | 263,539 | | | United States | | | 1.6% | |
| | | | | | | | |
| | | Lowe’s | | | | | 1,500 | | | | 150,451 | | | | 233,730 | | | United States | | | 1.4% | |
| | | | | | | | |
| | | | | | | | | | | | | | | | | | | | | | | |
| | | | | | | | |
| | | | | | | | | | | | 278,185 | | | | 497,269 | | | | | | 3.0% | |
| | | | | | | | |
| | | Other Commercial Services | | | | | | | | | | | | | | | | |
| | | | | | | | |
| | | Ecolab | | | | | 1,500 | | | | 237,915 | | | | 333,225 | | | United States | | | 2.0% | |
| | | | | | | | |
| | | Restaurants | | | | | | | | | | | | | | | | |
| | | | | | | | |
| | | Starbucks | | | | | 3,213 | | | | 237,202 | | | | 314,938 | | | United States | | | 1.9% | |
| | | | | | | | |
| | | Specialty Apparel Stores | | | | | | | | | | | | | | | | |
| | | | | | | | |
| | | TJX Companies | | | | | 3,000 | | | | 103,932 | | | | 190,530 | | | United States | | | 1.1% | |
| | | | | | | | |
| | | Toys & Games | | | | | | | | | | | | | | | | |
| | | | | | | | |
| | | Hasbro | | | | | 1,800 | | | | 146,315 | | | | 167,454 | | | United States | | | 1.0% | |
| | | | | | | | |
| | | | | | | | | | | 1,655,786 | | | | 2,354,998 | | | | | | 14.0% | |
| | | | | | | |
| | | Consumer Staples | | | | | | | | | | | | | | | | |
| | | | | | | | |
| | | Household Products | | | | | | | | | | | | | | | | |
| | | | | | | | |
| | | Church & Dwight | | | | | 3,400 | | | | 195,721 | | | | 298,418 | | | United States | | | 1.8% | |
| | | | | | | | |
| | | L’Oreal ADR | | | | | 4,600 | | | | 240,629 | | | | 336,306 | | | France | | | 2.0% | |
| | | | | | | | |
| | | Reckitt Benckiser Group ADR | | | | | 16,700 | | | | 280,226 | | | | 297,678 | | | United Kingdom | | | 1.7% | |
| | | | | | | | |
| | | Unicharm ADR | | | | | 33,000 | | | | 254,030 | | | | 320,100 | | | Japan | | | 1.9% | |
| | | | | | | | |
| | | Unilever ADR | | | | | 5,400 | | | | 269,212 | | | | 329,724 | | | United Kingdom | | | 2.0% | |
| | | | | | | | |
| | | | | | | | | | | | | | | | | | | | | | | |
| | | | | | | | |
| | | | | | | | | | | | 1,239,818 | | | | 1,582,226 | | | | | | 9.4% | |
| | | | | | | | |
| | | Packaged Food | | | | | | | | | | | | | | | | |
| | | | | | | | |
| | | Danone ADR | | | | | 22,500 | | | | 298,304 | | | | 288,225 | | | France | | | 1.7% | |
| | | | | | | | |
| | | Nestle ADR | | | | | 1,000 | | | | 86,610 | | | | 111,080 | | | Switzerland | | | 0.7% | |
| | | | | | | | |
| | | | | | | | | | | | | | | | | | | | | | | |
| | | | | | | | |
| | | | | | | | | | | | 384,914 | | | | 399,305 | | | | | | 2.4% | |
| | | | | | | | |
| | | | | | | | | | | 1,624,732 | | | | 1,981,531 | | | | | | 11.8% | |
| | | | | | | |
| | | Energy | | | | | | | | | | | | | | | | |
| | | | | | | | |
| | | Renewable Energy Equipment | | | | | | | | | | | | | | | | |
| | | | | | | | |
| | | Siemens Gamesa Renewable Energy | | | | | 11,000 | | | | 174,378 | | | | 395,611 | | | Spain | | | 2.3% | |
| | | | | | | | |
| | | Vestas Wind Systems | | | | | 2,200 | | | | 199,477 | | | | 449,665 | | | Denmark | | | 2.7% | |
| | | | | | | | |
| | | | | | | | | | | | | | | | | | | | | | | |
| | | | | | | | |
| | | | | | | | | | | | 373,855 | | | | 845,276 | | | | | | 5.0% | |
| | | | | | | | |
| | | | | | | | | | | 373,855 | | | | 845,276 | | | | | | 5.0% | |
Continued on next page.
| | | | | | | | | | | | |
| | | | | | | |
| 8 | | | | | | | | November 30, 2020 | | Annual Report | | The accompanying notes are an integral part of these financial statements. |
| | |
| Saturna Sustainable Equity Fund: Schedule of Investments | | As of November 30, 2020 |
| | | | | | | | | | | | | | | | | | | | | | |
| | | | | | | | |
| | | Common Stocks – 93.1% | | | | Number of Shares | | | Cost | | | Market Value | | | Country1 | | Percentage of Net Assets | |
| | | | | | | |
| | | Financials | | | | | | | | | | | | | | | | |
| | | | | | | | |
| | | Consumer Finance | | | | | | | | | | | | | | | | |
| | | | | | | | |
| | | Mastercard, Class A | | | | | 860 | | | | $171,375 | | | | $289,399 | | | United States | | | 1.7% | |
| | | | | | | | |
| | | Life Insurance | | | | | | | | | | | | | | | | |
| | | | | | | | |
| | | AIA Group | | | | | 25,000 | | | | 198,003 | | | | 274,308 | | | Hong Kong | | | 1.6% | |
| | | | | | | | |
| | | Aviva ADR | | | | | 20,000 | | | | 168,420 | | | | 169,000 | | | United Kingdom | | | 1.0% | |
| | | | | | | | |
| | | | | | | | | | | | | | | | | | | | | | | |
| | | | | | | | |
| | | | | | | | | | | | 366,423 | | | | 443,308 | | | | | | 2.6% | |
| | | | | | | | |
| | | P&C Insurance | | | | | | | | | | | | | | | | |
| | | | | | | | |
| | | Chubb | | | | | 1,000 | | | | 122,138 | | | | 147,830 | | | Switzerland | | | 0.9% | |
| | | | | | | | |
| | | | | | | | | | | 659,936 | | | | 880,537 | | | | | | 5.2% | |
| | | | | | | |
| | | Health Care | | | | | | | | | | | | | | | | |
| | | | | | | | |
| | | Health Care Facilities | | | | | | | | | | | | | | | | |
| | | | | | | | |
| | | IHH Healthcare | | | | | 141,000 | | | | 190,767 | | | | 194,176 | | | Malaysia | | | 1.2% | |
| | | | | | | | |
| | | Large Pharma | | | | | | | | | | | | | | | | |
| | | | | | | | |
| | | GlaxoSmithKline ADR | | | | | 5,400 | | | | 226,575 | | | | 198,666 | | | United Kingdom | | | 1.2% | |
| | | | | | | | |
| | | Johnson & Johnson | | | | | 700 | | | | 103,184 | | | | 101,276 | | | United States | | | 0.6% | |
| | | | | | | | |
| | | Novartis ADR | | | | | 2,150 | | | | 191,420 | | | | 195,285 | | | Switzerland | | | 1.2% | |
| | | | | | | | |
| | | Novo Nordisk ADR | | | | | 4,100 | | | | 254,929 | | | | 275,233 | | | Denmark | | | 1.6% | |
| | | | | | | | |
| | | Pfizer | | | | | 4,000 | | | | 139,349 | | | | 153,240 | | | United States | | | 0.9% | |
| | | | | | | | |
| | | Roche Holding ADR | | | | | 5,800 | | | | 251,412 | | | | 236,756 | | | Switzerland | | | 1.4% | |
| | | | | | | | |
| | | | | | | | | | | | | | | | | | | | | | | |
| | | | | | | | |
| | | | | | | | | | | | 1,166,869 | | | | 1,160,456 | | | | | | 6.9% | |
| | | | | | | | |
| | | Medical Equipment | | | | | | | | | | | | | | | | |
| | | | | | | | |
| | | Koninklijke Philips | | | | | 5,700 | | | | 202,249 | | | | 293,664 | | | Netherlands | | | 1.7% | |
| | | | | | | | |
| | | | | | | | | | | 1,559,885 | | | | 1,648,296 | | | | | | 9.8% | |
| | | | | | | |
| | | Industrials | | | | | | | | | | | | | | | | |
| | | | | |
| | | Commercial & Residential Building Equipment & Systems | | | | | | | | | |
| | | | | | | | |
| | | Assa Abloy ADR | | | | | 27,500 | | | | 272,304 | | | | 325,875 | | | Sweden | | | 1.9% | |
| | | | | | | | |
| | | Legrand | | | | | 3,600 | | | | 256,294 | | | | 305,706 | | | France | | | 1.9% | |
| | | | | | | | |
| | | | | | | | | | | | | | | | | | | | | | | |
| | | | | | | | |
| | | | | | | | | | | | 528,598 | | | | 631,581 | | | | | | 3.8% | |
| | | | | | | | |
| | | Electrical Components | | | | | | | | | | | | | | | | |
| | | | | | | | |
| | | TE Connectivity | | | | | 1,351 | | | | 117,009 | | | | 153,973 | | | Switzerland | | | 0.9% | |
| | | | | | |
| | | Electrical Power Equipment | | | | | | | | | | | | |
| | | | | | | | |
| | | Schneider Electric ADR | | | | | 11,100 | | | | 204,730 | | | | 308,358 | | | France | | | 1.8% | |
| | | | | | | | |
| | | Siemens ADR | | | | | 3,000 | | | | 190,459 | | | | 200,295 | | | Germany | | | 1.2% | |
| | | | | | | | |
| | | | | | | | | | | | | | | | | | | | | | | |
| | | | | | | | |
| | | | | | | | | | | | 395,189 | | | | 508,653 | | | | | | 3.0% | |
| | | | | | | | |
| | | Rubber & Plastic | | | | | | | | | | | | | | | | |
| | | | | | | | |
| | | Hartalega | | | | | 80,000 | | | | 63,885 | | | | 282,445 | | | Malaysia | | | 1.7% | |
| | | | | | | | |
| | | | | | | | | | | 1,104,681 | | | | 1,576,652 | | | | | | 9.4% | |
Continued on next page.
| | | | | | | | | | | | |
| | | | | | | |
| The accompanying notes are an integral part of these financial statements. | | November 30, 2020 | | Annual Report | | | | | | | | 9 |
| | |
| Saturna Sustainable Equity Fund: Schedule of Investments | | As of November 30, 2020 |
| | | | | | | | | | | | | | | | | | | | | | |
| | | | | | | | |
| | | Common Stocks – 93.1% | | | | Number of Shares | | | Cost | | | Market Value | | | Country1 | | Percentage of Net Assets | |
| | | | | | | |
| | | Materials | | | | | | | | | | | | | | | | |
| | | | | | | | |
| | | Specialty Chemicals | | | | | | | | | | | | | | | | |
| | | | | | | | |
| | | Johnson Matthey | | | | | 4,031 | | | | $163,844 | | | | $118,948 | | | United Kingdom | | | 0.7% | |
| | | | | | | | |
| | | Koninklijke DSM | | | | | 1,900 | | | | 249,713 | | | | 311,118 | | | Netherlands | | | 1.8% | |
| | | | | | | | |
| | | Novozymes ADR | | | | | 5,250 | | | | 256,407 | | | | 299,723 | | | Denmark | | | 1.8% | |
| | | | | | | | |
| | | | | | | | | | | | | | | | | | | | | | | |
| | | | | | | | |
| | | | | | | | | | | | 669,964 | | | | 729,789 | | | | | | 4.3% | |
| | | | | | | | |
| | | | | | | | | | | 669,964 | | | | 729,789 | | | | | | 4.3% | |
| | | | | | | |
| | | Technology | | | | | | | | | | | | | | | | |
| | | | | | | | |
| | | Application Software | | | | | | | | | | | | | | | | |
| | | | | | | | |
| | | Adobe Systems3 | | | | | 1,000 | | | | 108,410 | | | | 478,470 | | | United States | | | 2.8% | |
| | | | | | | | |
| | | Atlassian3 | | | | | 1,490 | | | | 257,788 | | | | 335,325 | | | Australia | | | 2.0% | |
| | | | | | | | |
| | | Dassault Systemes ADR | | | | | 1,506 | | | | 119,029 | | | | 278,550 | | | France | | | 1.7% | |
| | | | | | | | |
| | | Electronic Arts | | | | | 2,400 | | | | 303,422 | | | | 306,600 | | | United States | | | 1.8% | |
| | | | | | | | |
| | | Open Text | | | | | 3,750 | | | | 154,567 | | | | 165,637 | | | Canada | | | 1.0% | |
| | | | | | | | |
| | | | | | | | | | | | | | | | | | | | | | | |
| | | | | | | | |
| | | | | | | | | | | | 943,216 | | | | 1,564,582 | | | | | | 9.3% | |
| | | | | | | | |
| | | Communications
Equipment | | | | | | | | | | | | | | | | |
| | | | | | | | |
| | | Apple | | | | | 4,000 | | | | 113,474 | | | | 476,200 | | | United States | | | 2.8% | |
| | | | | | | | |
| | | Consumer Electronics | | | | | | | | | | | | | | | | |
| | | | | | | | |
| | | Nintendo ADR | | | | | 4,575 | | | | 224,198 | | | | 324,596 | | | Japan | | | 1.9% | |
| | | | | | | | |
| | | Sony ADR | | | | | 4,000 | | | | 261,557 | | | | 373,160 | | | Japan | | | 2.2% | |
| | | | | | | | |
| | | | | | | | | | | | | | | | | | | | | | | |
| | | | | | | | |
| | | | | | | | | | | | 485,755 | | | | 697,756 | | | | | | 4.1% | |
| | | | | | | | |
| | | Electronics Components | | | | | | | | | | | | | | | | |
| | | | | | | | |
| | | Murata Manufacturing | | | | | 4,000 | | | | 203,199 | | | | 349,183 | | | Japan | | | 2.1% | |
| | | | | | | | |
| | | Information Services | | | | | | | | | | | | | | | | |
| | | | | | | | |
| | | Wolters Kluwer | | | | | 3,800 | | | | 270,668 | | | | 319,024 | | | Netherlands | | | 1.9% | |
| | | | | | | | |
| | | Infrastructure Software | | | | | | | | | | | | | | | | |
| | | | | | | | |
| | | Microsoft | | | | | 1,438 | | | | 62,724 | | | | 307,833 | | | United States | | | 1.8% | |
| | | | | | | | |
| | | IT Services | | | | | | | | | | | | | | | | |
| | | | | | | | |
| | | Accenture, Class A | | | | | 900 | | | | 89,878 | | | | 224,181 | | | Ireland | | | 1.4% | |
| | | | | | | | |
| | | CGI Group, Class A2 | | | | | 6,000 | | | | 421,997 | | | | 442,800 | | | Canada | | | 2.6% | |
| | | | | | | | |
| | | | | | | | | | | | | | | | | | | | | | | |
| | | | | | | | |
| | | | | | | | | | | | 511,875 | | | | 666,981 | | | | | | 4.0% | |
| | | | | | | | |
| | | Semiconductor Devices | | | | | | | | | | | | | | | | |
| | | | | | | | |
| | | NXP Semiconductors | | | | | 1,800 | | | | 179,525 | | | | 285,156 | | | Netherlands | | | 1.7% | |
| | | | | | | | |
| | | STMicroelectronics | | | | | 7,800 | | | | 224,246 | | | | 309,270 | | | Switzerland | | | 1.8% | |
| | | | | | | | |
| | | | | | | | | | | | | | | | | | | | | | | |
| | | | | | | | |
| | | | | | | | | | | | 403,771 | | | | 594,426 | | | | | | 3.5% | |
| | | | | | | | |
| | | Semiconductor
Manufacturing | | | | | | | | | | | | | | | | |
| | | | | | | | |
| | | Taiwan Semiconductor ADR | | | | | 3,650 | | | | 114,007 | | | | 354,123 | | | Taiwan | | | 2.1% | |
| | | | | | | | |
| | | | | | | | | | | 3,108,689 | | | | 5,330,108 | | | | | | 31.6% | |
Continued on next page.
| | | | | | | | | | | | |
| | | | | | | |
| 10 | | | | | | | | November 30, 2020 | | Annual Report | | The accompanying notes are an integral part of these financial statements. |
| | |
| Saturna Sustainable Equity Fund: Schedule of Investments | | As of November 30, 2020 |
| | | | | | | | | | | | | | | | | | | | | | |
| | | | | | | | |
| | | Common Stocks – 93.1% | | | | Number of Shares | | | Cost | | | Market Value | | | Country1 | | Percentage of Net Assets | |
| | | | | | | |
| | | Utilities | | | | | | | | | | | | | | | | |
| | | | | | | | |
| | | Power Generation | | | | | | | | | | | | | | | | |
| | | | | | | | |
| | | Iberdrola | | | | | 23,911 | | | | $260,078 | | | | $329,165 | | | Spain | | | 2.0% | |
| | | | | | | | |
| | | | | | | | | | | 260,078 | | | | 329,165 | | | | | | 2.0% | |
| | | | | | | |
| | | | | | | | | | | | | | | | | | | | | | | |
| | | | | | | | |
| | Total investments | | | | | | | | | $11,017,606 | | | | $15,676,352 | | | | | | 93.1% | |
| | | | | | | |
| | Other assets (net of liabilities) | | | | | | | | | | | | | 1,157,352 | | | | | | 6.9% | |
| | | | | | | |
| | | | | | | | | | | | | | | | | | | | | | |
| | | | | | | |
| | Total net assets | | | | | | | | | | | | | $16,833,704 | | | | | | 100.0% | |
| | | | | | | | |
| | | | | | | | | | | | | | | | | | | | | | |
| 2 | Denotes a country of primary exposure |
| 3 | Non-income producing security |
| ADR: | American Depository Receipt |
| | | | |
Countries | | | (unaudited) | |
| | |
| | | | |
|
 | |
|
Weightings shown are a percentage of total net assets. | |
Continued on next page.
| | | | | | | | | | | | |
| | | | | | | |
| The accompanying notes are an integral part of these financial statements. | | November 30, 2020 | | Annual Report | | | | | | | | 11 |
Saturna Sustainable Equity Fund
Statement of Assets and Liabilities
| | | | |
| As of November 30, 2020 | |
| | |
| | | | |
| |
Assets | | | | |
| |
Investments in securities, at value (Cost $11,017,606) | | | $15,676,352 | |
| |
Cash | | | 1,278,782 | |
| |
Receivable for Fund shares sold | | | 40,827 | |
| |
Dividends and interest receivable | | | 17,366 | |
| | | | |
| |
Total assets | | | 17,013,327 | |
| | | | |
| |
Liabilities | | | | |
| |
Payable for securities purchased | | | 87,795 | |
| |
Payable for Fund shares redeemed | | | 67,461 | |
| |
Accrued advisory fees | | | 8,308 | |
| |
Accrued audit expenses | | | 5,636 | |
| |
Accrued registration/filling fees | | | 3,146 | |
| |
Accrued retirement plan custody fee | | | 2,812 | |
| |
Accrued other expenses | | | 1,905 | |
| |
Accrued Chief Compliance Officer expenses | | | 1,594 | |
| |
Accrued trustee expenses | | | 966 | |
| | | | |
| |
Total liabilities | | | 179,623 | |
| | | | |
| |
Net assets | | | $16,833,704 | |
| | |
| | | | |
| | |
Analysis of net assets | | | | |
| |
Paid-in capital (unlimited shares authorized, without par value) | | | $12,404,523 | |
| |
Total distributable earnings | | | 4,429,181 | |
| | | | |
| |
Net assets applicable to Fund shares outstanding | | | $16,833,704 | |
| | |
| | | | |
Fund shares outstanding | | | 1,006,657 | |
| | |
Net asset value, offering, and redemption price per share | | | $16.72 | |
| | | | | |
Statement of Operations
| | | | |
| Year ended November 30, 2020 | |
| | |
| | | | |
| |
Investment income | | | | |
| |
Dividend income (net of foreign tax of $17,620) | | | $151,325 | |
| |
Miscellaneous income | | | 75 | |
| | | | |
| |
Total investment income | | | 151,400 | |
| | | | |
| |
Expenses | | | | |
| |
Investment advisory fees | | | 73,338 | |
| |
Audit fees | | | 5,115 | |
| |
Custodian fees | | | 1,708 | |
| |
Printing and Postage fees | | | 1,975 | |
| |
Trustee fees | | | 1,747 | |
| |
Legal fees | | | 1,379 | |
| |
Chief Compliance Officer expenses | | | 1,301 | |
| |
Filing and registration fees | | | 1,076 | |
| |
Other operating expenses | | | 265 | |
| |
Retirement plan custodial fees | | | 34 | |
| | | | |
| |
Total gross expenses | | | 87,938 | |
| | | | |
| |
Less adviser fees waived | | | (3,388 | ) |
| |
Less custodian fee credits | | | (1,708 | ) |
| | | | |
| |
Net expenses | | | 82,842 | |
| | | | |
| |
Net investment income | | | $68,558 | |
| | |
| | | | |
| | |
| | | | |
| |
Net realized loss from investments and foreign currency | | | $(29,089 | ) |
| |
Net increase in unrealized appreciation on investments and foreign currency | | | 2,760,173 | |
| | | | |
| |
Net gain on investments and foreign currency | | | $2,731,084 | |
| | |
| | | | |
| | |
Net increase in net assets resulting from operations | | | $2,799,642 | |
| | | | | |
| | | | | | | | | | | | |
| | | | | | | |
| 12 | | | | | | | | November 30, 2020 | | Annual Report | | The accompanying notes are an integral part of these financial statements. |
Saturna Sustainable Equity Fund
| | | | | | | | |
Statements of Changes of Net Assets | | | Year ended November 30, 2020 | | | | Year ended November 30, 2019 | |
| | | |
Increase in net assets from operations | | | | | | | | |
| | |
From operations | | | | | | | | |
| | |
Net investment income | | | $68,558 | | | | $50,749 | |
| | |
Net realized gain (loss) on investment and foreign currency | | | (29,089 | ) | | | 12,338 | |
| | |
Net increase in unrealized appreciation on investments and foreign currencies | | | 2,760,173 | | | | 1,032,935 | |
| | | | |
| | |
Net increase in net assets resulting from operations | | | 2,799,642 | | | | 1,096,022 | |
| | | | | | | | |
| | |
| | | | | | | | |
| | |
Distributions to shareowners | | | (42,386 | ) | | | (46,186 | ) |
| | |
| | | | | | | | |
| | |
Capital share transactions | | | | | | | | |
| | |
Proceeds from sales of shares | | | 7,996,955 | | | | 2,048,795 | |
| | |
Value of shares issued in reinvestment of dividends | | | 42,319 | | | | 46,186 | |
| | |
Cost of shares redeemed | | | (2,147,693 | ) | | | (618,104 | ) |
| | | | | | | | |
| | |
Total capital share transactions | | | 5,891,581 | | | | 1,476,877 | |
| | | | | | | | |
| | |
Total increase in net assets | | | 8,648,837 | | | | 2,526,713 | |
| | | |
| | | | | | | | |
| | | |
Net assets | | | | | | | | |
| | |
Beginning of period | | | 8,184,867 | | | | 5,658,154 | |
| | |
End of period | | | $16,833,704 | | | | $8,184,867 | |
| | | |
| | | | | | | | |
| | | |
Shares of the Fund sold and redeemed | | | | | | | | |
| | |
Number of shares sold | | | 546,666 | | | | 159,107 | |
| | |
Number of shares issued in reinvestment of dividends | | | 3,047 | | | | 4,324 | |
| | |
Number of shares redeemed | | | (145,697 | ) | | | (52,449 | ) |
| | | | | | | | |
| | |
Net increase in number of shares outstanding | | | 404,016 | | | | 110,982 | |
| | | |
| | | | | | | | |
| | | | | | | | | | | | | | | | | | | | |
Financial Highlights | | | | | | | For year ended November 30, | | | | | |
| | | | | |
Selected data per share of outstanding capital stock throughout each year: | | | 2020 | | | | 2019 | | | | 2018 | | | | 2017 | | | | 2016 | |
| | | | | | |
Net asset value at beginning of year | | | $13.58 | | | | $11.51 | | | | $11.44 | | | | $9.43 | | | | $9.73 | |
| | | | | |
Income from investment operations | | | | | | | | | | | | | | | | | | | | |
| | | | | |
Net investment income | | | 0.10 | | | | 0.09 | | | | 0.09 | | | | 0.09 | | | | 0.06 | |
| | | | | |
Net gains (losses) on securities (both realized & unrealized) | | | 3.11 | | | | 2.08 | | | | 0.07 | | | | 1.97 | | | | (0.36 | ) |
| | | | | | | | | | | | | | | | | | | | |
| | | | | |
Total from investment operations | | | 3.21 | | | | 2.17 | | | | 0.16 | | | | 2.06 | | | | (0.30 | ) |
| | | | | | | | | | | | | | | | | | | | |
| | | | | |
Less distributions | | | | | | | | | | | | | | | | | | | | |
| | | | | |
Dividends from net investment income | | | (0.07 | ) | | | (0.10 | ) | | | (0.09 | ) | | | (0.05 | ) | | | - | |
| | | | | | | | | | | | | | | | | | | | |
| | | | | |
Total distributions | | | (0.07 | ) | | | (0.10 | ) | | | (0.09 | ) | | | (0.05 | ) | | | - | |
| | | | | | | | | | | | | | | | | | | | |
| | | | | |
| | | | | | | | | | | | | | | | | | | | |
| | | | | |
Net asset value at end of year | | | $16.72 | | | | $13.58 | | | | $11.51 | | | | $11.44 | | | | $9.43 | |
| | | | | | |
| | | | | | | | | | | | | | | | | | | | |
Total return | | | 23.74% | | | | 19.04% | | | | 1.39% | | | | 22.01% | | | | (3.08 | )% |
| | | | | | |
Ratios / supplemental data | | | | | | | | | | | | | | | | | | | | |
| | | | | |
Net assets ($000), end of year | | | $16,834 | | | | $8,185 | | | | $5,658 | | | | $4,984 | | | | $3,343 | |
| | | | | |
Ratio of expenses to average net assets | | | | | | | | | | | | | | | | | | | | |
| | | | | |
Before fee waivers | | | 0.78% | | | | 1.81% | | | | 1.27% | | | | 1.48% | | | | 1.65% | |
| | | | | |
After fee waivers | | | 0.75% | | | | 0.78% | | | | 0.76% | | | | 0.88% | | | | 1.00% | |
| | | | | |
After fee waivers and custodian fee credits | | | 0.73% | | | | 0.75% | | | | 0.75% | | | | 0.86% | | | | 0.99% | |
| | | | | |
Ratio of net investment income after fee waivers and custodian fee credits to average net assets | | | 0.61% | | | | 0.80% | | | | 0.82% | | | | 0.95% | | | | 0.67% | |
| | | | | |
Portfolio turnover rate | | | 13% | | | | 13% | | | | 8% | | | | 12% | | | | 48% | |
| | | | | | |
| | | | | | | | | | | | | | | | | | | | |
| | | | | | | | | | | | |
| | | | | | | |
| The accompanying notes are an integral part of these financial statements. | | November 30, 2020 | | Annual Report | | | | | | | | 13 |
| | |
| Saturna Sustainable Bond Fund: Performance Summary | | (unaudited) |
| | | | | | | | | | | | | | | | |
Average Annual Returns as of November 30, 2020 | |
| | | | | |
| | | 1 Year | | | 5 Year | | | 10 Year | | | Expense Ratio1 | |
| | | | |
Sustainable Bond Fund (SEBFX)2 | | | 6.78% | | | | 3.39% | | | | n/a | | | | 0.83% | |
| | | | |
FTSE WorldBIG Index | | | 8.61% | | | | 4.67% | | | | 2.88% | | | | n/a | |
Growth of $10,000
| | |
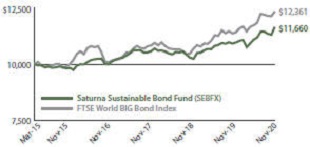
| | Comparison of any mutual fund to a market index must be made bearing in mind that the index is expense-free. Conversely, the fund will (1) be actively managed; (2) have an objective other than mirroring the index, such as limiting risk; (3) bear transaction and other costs; (4) stand ready to buy and sell its securities to shareowners on a daily basis; and (5) provide a wide range of services. The graph compares $10,000 invested in the Fund on March 27, 2015, to an identical amount invested in the FTSE WorldBIG Index, a multi-asset, multi-currency benchmark, which provides a broad-based measure of the global fixed income markets. The graph shows that an investment in the Fund would have risen to $12,361 versus rising to $11,660 in the index. |
Past performance does not guarantee future results. The “Growth of $10,000” graph and “Average Annual Returns” performance table assume the reinvestment of dividends and capital gains. They do not reflect the deduction of taxes that a shareowner might pay on fund distributions or the redemption of fund shares.
| 1 | By regulation, the expense ratio shown in this table is as stated in the Fund’s most recent prospectus which is dated March 27, 2020, and incorporates results for the fiscal year ended November 30, 2019, before fee waivers. The expense ratio shown in the most recent prospectus after fee waivers was 0.65%. The ratio presented in this table differs from expense ratios shown elsewhere in this report as they represent different periods. |
| 2 | Operations commenced March 27, 2015. |
Fund Objective
The objectives of the Sustainable Bond Fund are current income and capital preservation.
| | | | |
Top 10 Holdings | |
| |
| % of Total Net Assets | |
| |
United States Treasury Bond (4.50% due 05/15/2038) | | | 5.9% | |
| |
United States Treasury Bond (3.375% due 11/15/2048) | | | 5.9% | |
| |
Lincoln National (2.5795% due 05/17/2066) | | | 5.8% | |
| |
Microsoft (5.30% due 02/08/2041) | | | 5.3% | |
| |
European Investment Bank (3.30% due 02/03/2028) | | | 4.9% | |
| |
Mexico Bonos Desarrollo (6.50% due 06/10/2021) | | | 4.5% | |
| |
Bank of Nova Scotia (4.90% due 06/04/2070) | | | 3.7% | |
| |
International Financial Corp (4.75% due 04/29/2021) | | | 3.4% | |
| |
Republic of Colombia (7.75% due 04/14/2021) | | | 3.2% | |
| |
Telecom Italia (3.00% due 09/30/2025) | | | 3.0% | |
| | | | | | | | |
Portfolio Diversification | | | | | | | | |
| | | |
| % of Total Net Assets | | | | | |
| | | |
Government Bonds | | | 35.3% | | | ∎ | | 
|
Technology | | | 19.8% | | | ∎ |
Financials | | | 19.3% | | | ∎ |
Consumer Staples | | | 5.2% | | | ∎ |
Materials | | | 5.1% | | | ∎ |
Consumer Discretionary | | | 3.6% | | | ∎ |
Communications | | | 1.2% | | | ∎ |
Health Care | | | 1.0% | | | ∎ |
Utilities | | | 0.8% | | | ∎ |
Other Assets (net of liabilities) | | | 8.7% | | | ∎ |
| | | | | | | | | | |
| | | | | | |
| 14 | | | | | | | | November 30, 2020 | | Annual Report |
| | |
| Saturna Sustainable Bond Fund: Discussion of Fund Performance | | (unaudited) |
(photo omitted)
Fiscal Year 2020
For the fiscal year ended November 30, 2020, Saturna Sustainable Bond Fund produced a total return of 6.78% versus the FTSE WorldBig Index, which returned 8.61%. The Fund had an effective duration (price sensitivity to changes in interest rates) of 5.38 years relative to 7.36 for the Index. The underperformance was primarily due to the Fund’s underweight of the euro, and the Index’s larger exposure to higher-grade securities which benefited from larger downward shifts in yields versus non-investment grade securities.
Factors Affecting Past Performance
2020 was a year of extraordinary change and challenge. Volatility made its mark in the first part of the year including a massive shift in the Treasury curve and both a severe widening then tightening of corporate spreads. On March 23, credit spreads of corporate bonds hit their widest levels since the 2008 financial crisis.1 Since that time spreads have tightened significantly as the result of several factors. The Fed has provided a great deal of support to the market in the form of cutting interest rates, providing liquidity to money market funds, and purchasing corporate bonds in the secondary market. Corporate yields have tightened across the curve in the past year, but most markedly in the investment-grade universe. The Fund saw a total return of 10.31% for “A” rated bonds, versus a total return of -3.83% for “BB” rated bonds. The Fund holds 13.3% of the portfolio in securities rated “BB” relative to the WorldBig Index which does not hold securities rated lower than investment grade. This is one factor that contributed to the performance differential, as investment grade bonds performed better over the year.
Change in Corporate Yield Curve 11/29/19 vs 11/30/20

Currency movement also played an important role in performance. In total, the Fund held 33.02% of the portfolio in foreign currencies as of November 30, 2020. As of the fiscal year-end, the Fund had a 10.96% exposure to the euro and 4.94% exposure to the Australian dollar. Both currencies appreciated against the US dollar, rising 8.59% and 8.25%, respectively. These positions contributed to positive performance. The FTSE World Big Index held 31.87% in euro-denominated debt, and the Fund’s underweight in the currency was a major factor in relative performance. Additionally, the Fund’s exposure to the Brazilian real was an overall detractor from performance, with the currency depreciating around -20% over the year relative to the dollar resulting in a -14% total return for the real-denominated position. However, the Fund maintains a relatively conservative position in the currency at only 1.95% of the portfolio.
Relative Currency Performance and Exposure

Aside from currency movements and corporate yield curve shifts, the Fund’s positions in US Treasurys contributed positively to performance with downward shifts across the yield curve for the year. As of November 30, the Fund held 11.68% in Treasury bonds. The 20-year and 30-year Treasury positions in the Fund produced a total return of 13.8% and 16.51%, respectively.
Looking Forward
Looking to the next year, there is no shortage of possible events that could upset the current stability. In the immediate future we face uncertainties about vaccine rollout timing, further government stimulus, and the economic implications of state and local budget deficits. In the longer-term, we also have to consider the potential for inflation. With the Federal Reserve’s announcement that it will target an average inflation rate of 2% and in so doing allow for inflation to run “moderately above 2% for some time,” we will continue to consider the implications of this policy shift. We will view corporate credit with increased scrutiny due to the heightened risk of downgrades and unprecedented economic challenges that lie before us. As the crisis has been unfolding, we have been focusing our credit research on BBB and lower rated corporate bonds, paying special attention to corporate liquidity and flexibility. Our goal has always been to choose good companies and invest through cycles. Our robust security selection process which emphasizes governance, resiliency, and sustainability is constantly evolving with the unfolding events. We continue to be well positioned to evaluate both the risks and opportunities that remain obscured below the surface.
| 1 | Sekera, Dave. Corporate Bonds Stand Out in Second Quarter. Morningstar, July 8, 2020. https://www.morningstar.com/articles/991119/article |
| | | | | | | | | | |
| | | | | | |
November 30, 2020 | | Annual Report | | | | | | | | 15 |
| | |
| Saturna Sustainable Bond Fund: Schedule of Investments | | As of November 30, 2020 |
| | | | | | | | | | | | | | | | |
| | | | | | | |
| Corporate Bonds – 56.0% | | | | Coupon / Maturity | | Face Amount | | Market Value | | | Country1 | | Percentage of Net Assets | |
| | | | | |
| Communications | | | | | | | | | | | | |
| | | | | | | |
Telecom Italia2 | | | | 5.303% due 05/30/2024 | | $250,000 | | | $271,713 | | | Italy | | | 1.2% | |
| | | | | | | |
| | | | | | | | | 271,713 | | | | | | 1.2% | |
| | | | | | |
| | | | | | | | | | | | | | | | |
| | | | | |
| Consumer Discretionary | | | | | | | | | | | | |
| | | | | | | |
Barry Callebaut2 | | | | 5.50% due 06/15/2023 | | 500,000 | | | 533,681 | | | Belgium | | | 2.4% | |
| | | | | | | |
Starbucks | | | | 2.45% due 06/15/2026 | | 250,000 | | | 270,088 | | | United States | | | 1.2% | |
| | | | | | | |
| | | | | | | | | 803,769 | | | | | | 3.6% | |
| | | | | |
| Consumer Staples | | | | | | | | | | | | |
| | | | | | | |
Danone2 | | | | 2.589% due 11/02/2023 | | 500,000 | | | 526,743 | | | France | | | 2.4% | |
| | | | | | | |
Danone3,4,6 | | | | 1.75% due PERP | | EUR 500,000 | | | 609,843 | | | France | | | 2.8% | |
| | | | | | | |
| | | | | | | | | 1,136,586 | | | | | | 5.2% | |
| | | | | | |
| Financials | | | | | | | | | | | | | | |
| | | | | | | |
AXA4,5 | | | | 5.125% due 01/17/2047 | | 250,000 | | | 288,325 | | | France | | | 1.3% | |
| | | | | | | |
Bank of Nova Scotia6 | | | | 4.90% due PERP | | 750,000 | | | 804,225 | | | Canada | | | 3.7% | |
| | | | | | | |
Canadian Imperial Bank7 | | | | 3.42% due 01/26/2026 | | CAD 500,000 | | | 386,725 | | | Canada | | | 1.8% | |
| | | | | | | |
First Abu Dhabi Bank4 | | | | 3.00% due 03/30/2022 | | 500,000 | | | 515,184 | | | United Arab Emirates | | | 2.3% | |
| | | | | | | |
Iron Mountain2 | | | | 5.25% due 07/15/2030 | | 500,000 | | | 532,500 | | | United States | | | 2.4% | |
| | | | | | | |
Lincoln National (3 month LIBOR plus 2.04%)8 | | | | 2.5795% due 05/17/2066 | | 1,650,000 | | | 1,263,092 | | | United States | | | 5.8% | |
| | | | | | | |
MAF Sukuk4 | | | | 4.638% due 05/14/2029 | | 400,000 | | | 443,681 | | | United Arab Emirates | | | 2.0% | |
| | | | | | | |
| | | | | | | | | 4,233,732 | | | | | | 19.3% | |
| | | | | | |
| Health Care | | | | | | | | | | | | | | |
| | | | | | | |
Roche2 | | | | 2.625% due 05/15/2026 | | 200,000 | | | 219,178 | | | Switzerland | | | 1.0% | |
| | | | | | | |
| | | | | | | | | 219,178 | | | | | | 1.0% | |
| | | | | | |
| Materials | | | | | | | | | | | | | | |
| | | | | | | |
Ball | | | | 5.25% due 07/01/2025 | | 200,000 | | | 229,502 | | | United States | | | 1.0% | |
| | | | | | | |
Koninklijke DSM4 | | | | 1.00% due 04/09/2025 | | EUR 500,000 | | | 627,349 | | | Netherlands | | | 2.9% | |
| | | | | | | |
Stora Enso2 | | | | 7.25% due 04/15/2036 | | 200,000 | | | 270,836 | | | Finland | | | 1.2% | |
| | | | | | | |
| | | | | | | | | 1,127,687 | | | | | | 5.1% | |
| | | | | | |
| Technology | | | | | | | | | | | | | | |
| | | | | | | |
Adobe | | | | 2.30% due 02/01/2030 | | 200,000 | | | 217,396 | | | United States | | | 1.0% | |
| | | | | | | |
Apple | | | | 2.65% due 05/11/2050 | | 500,000 | | | 536,788 | | | United States | | | 2.3% | |
| | | | | | | |
Microsoft | | | | 5.30% due 02/08/2041 | | 750,000 | | | 1,159,066 | | | United States | | | 5.3% | |
| | | | | | | |
Nokia | | | | 3.375% due 06/12/2022 | | 500,000 | | | 515,155 | | | Finland | | | 2.4% | |
| | | | | | | |
Nokia4 | | | | 2.375% due 05/15/2025 | | EUR 400,000 | | | 503,338 | | | Finland | | | 2.3% | |
| | | | | | | |
NXP BV/NXP Funding2 | | | | 3.40% due 05/01/2030 | | 250,000 | | | 282,298 | | | Netherlands | | | 1.3% | |
| | | | | | | |
RELX | | | | 4.00% due 03/18/2029 | | 400,000 | | | 474,961 | | | United Kingdom | | | 2.2% | |
| | | | | | | |
Telecom Italia4 | | | | 3.00% due 09/30/2025 | | EUR 520,000 | | | 659,000 | | | Italy | | | 3.0% | |
| | | | | | | |
| | | | | | | | | 4,348,002 | | | | | | 19.8% | |
Continued on next page.
| | | | | | | | | | | | |
| | | | | | | |
| 16 | | | | | | | | November 30, 2020 | | Annual Report | | The accompanying notes are an integral part of these financial statements. |
| | |
| Saturna Sustainable Bond Fund: Schedule of Investments | | As of November 30, 2020 |
| | | | | | | | | | | | | | | | |
| | | | | | | |
| Corporate Bonds – 56.0% | | | | Coupon / Maturity | | Face Amount | | Market Value | | Country1 | | | Percentage of Net Assets | |
| | | | | | |
| Utilities | | | | | | | | | | | | | | |
| | | | | | | |
United Utilities | | | | 6.875% due 08/15/2028 | | 135,000 | | $174,931 | | | United Kingdom | | | | 0.8% | |
| | | | | | | |
| | | | | | | | 174,931 | | | | | | | 0.8% | |
| | | | | | | | | | | | | | | | |
| | | | | | |
Total Corporate Bonds | | (Cost $12,398,977) | | | | $12,315,598 | | | | | | | 56.0% | |
| | | | | |
| | | | | | | | | | | | | | |
| | | | | | |
| Government Bonds – 35.3% | | Coupon / Maturity | | Face Amount | | Market Value | | Country1 | | | Percentage of Net Assets | |
| | | | | |
| Financial Services | | | | | | | | | | | | |
| | | | | | | |
European Investment Bank | | | | 3.30% due 02/03/2028 | | AUD 1,250,000 | | $1,078,436 | | | Luxembourg | | | | 4.9% | |
| | | | | | | |
KFW | | | | 2.00% due 11/30/2021 | | 250,000 | | 254,483 | | | Germany | | | | 1.2% | |
| | | | | | | |
| | | | | | | | 1,332,919 | | | | | | | 6.1% | |
| | | | |
| Foreign Government Bonds | | | | | | | | | | |
| | | | | | | |
Federal Republic of Brazil | | | | 12.50% due 01/05/2022 | | BRL 2,000,000 | | 413,006 | | | Brazil | | | | 1.9% | |
| | | | | | | |
International Financial Corp | | | | 4.75% due 04/29/2021 | | MXN 15,000,000 | | 738,709 | | | Mexico | | | | 3.4% | |
| | | | | | | |
Mexico Bonos Desarrollo | | | | 6.50% due 06/10/2021 | | MXN 20,000,000 | | 999,028 | | | Mexico | | | | 4.5% | |
| | | | | | | |
Ontario | | | | 2.65% due 02/05/2025 | | CAD 500,000 | | 416,574 | | | Canada | | | | 1.9% | |
| | | | | | | |
Perusahaan Penerbit SBSN4 | | | | 3.75% due 03/01/2023 | | 250,000 | | 265,980 | | | Indonesia | | | | 1.2% | |
| | | | | | | |
Perusahaan Penerbit SBSN4 | | | | 4.45% due 02/20/2029 | | 250,000 | | 294,953 | | | Indonesia | | | | 1.3% | |
| | | | | | | |
Republic of Colombia | | | | 7.75% due 04/14/2021 | | COP 2,500,000,000 | | 706,886 | | | Colombia | | | | 3.2% | |
| | | | | | | |
| | | | | | | | 3,835,136 | | | | | | | 17.4% | |
| | | | |
| United States Treasury Bonds | | | | | | | | | | |
| | | | | | | |
United States Treasury Bond | | | | 4.50% due 05/15/2038 | | 850,000 | | 1,301,297 | | | United States | | | | 5.9% | |
| | | | | | | |
United States Treasury Bond | | | | 3.375% due 11/15/2048 | | 900,000 | | 1,283,062 | | | United States | | | | 5.9% | |
| | | | | | | |
| | | | | | | | 2,584,359 | | | | | | | 11.8% | |
| | | | | | |
Total Government Bonds | | (Cost $6,730,807) | | | | $7,752,414 | | | | | | | 35.3% | |
| | | | | |
| | | | | | | | | | | | | | | |
| | | | | | |
Total investments | | | | (Cost $19,129,784) | | | | 20,068,012 | | | | | | | 91.3% | |
| | | | | | |
Other assets (net of liabilities) | | | | | | | | 1,904,518 | | | | | | | 8.7% | |
| | | | | | |
Total net assets | | | | | | | | $21,972,530 | | | | | | | 100.0% | |
| | | | | | | |
| | | | | | | | | | | | | | | | |
| 2 | Security was purchased pursuant to Rule 144A under the Securities Act of 1933 and may be sold in transactions exempt from registration only to qualified institutional buyers or in public offering registered under the Securities Act of 1933. These securities have been deemed liquid under guidelines approved by the Trust’s Board of Trustees. At November 30, 2020, the net value of these securities was $2,636,949 representing 11.9% of net assets. |
| 3 | Fixed to float bond. The bond has a fixed rate until 06/23/2023. The interest rate shown represents the rate in effect at November 30, 2020. |
| 4 | Security was purchased pursuant to Regulation S under the Securities Act of 1933 which exempts from registration securities offered and sold outside of the United States. Such a security cannot be sold in the United States without either an effective registration statement filed pursuant to the Securities Act of 1933, or pursuant to an exemption from registration. These securities have been deemed liquid under guidelines approved by the Trust’s Board of Trustees. At November 30, 2020, the aggregate value of these securities was $4,207,653 representing 19.2% of net assets. |
| 5 | Fixed to float bond. The bond has a fixed rate until 01/17/2027. The interest rate shown represents the rate in effect at November 30, 2020. |
| 6 | Security is perpetual in nature and has no stated maturity. |
| 7 | Fixed to float bond. The bond has a fixed rate until 01/26/2021. The interest rate shown represents the rate in effect at November 30, 2020. |
| 8 | Variable rate security. The interest rate shown represents the rate in effect at November 30, 2020, and resets periodically based on the parenthetically disclosed reference rate and spread. |
AUD: Australian Dollar
BRL: Brazilian Real
CAD: Canadian Dollar
COP: Colombian Peso
EUR: Euro
MXN: Mexican Peso
| | | | | | | | | | | | |
| | | | | | | |
| The accompanying notes are an integral part of these financial statements. | | November 30, 2020 | | Annual Report | | | | | | | | 17 |
| | |
| Saturna Sustainable Bond Fund: Schedule of Investments | | As of November 30, 2020 |
| | | | |
Countries | | | (unaudited) | |
| | |
| | | | |
|
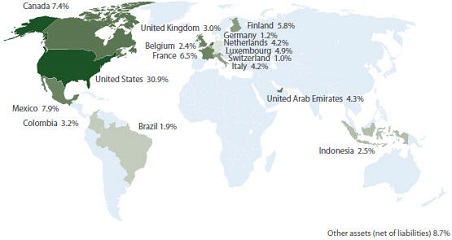 | |
| | |
|
| Weightings shown are a percentage of total net assets. |
| | | | | | | | | | | | |
Bond Quality Diversification | | | | (unaudited) | |
| | | |
| % of Total Net Assets | | | | | | | | | |
| | | |
Rated “AAA” | | | 26.6% | | | ∎ | | | | | 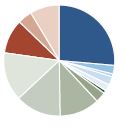
| |
Rated “AA+” | | | 2.4% | | | ∎ | | |
Rated “AA” | | | 1.0% | | | ∎ | | |
Rated “AA-” | | | 2.4% | | | ∎ | | |
Rated “A+” | | | 1.9% | | | ∎ | | |
Rated “A” | | | 1.0% | | | ∎ | | |
Rated “A-” | | | 2.9% | | | ∎ | | |
Rated “BBB+” | | | 12.0% | | | ∎ | | |
Rated “BBB” | | | 13.3% | | | ∎ | | |
Rated “BBB-” | | | 13.7% | | | ∎ | | |
Rated “BB+” | | | 9.8% | | | ∎ | | |
Rated “BB” | | | 4.3% | | | ∎ | | |
| | | |
Other Assets (net of liabilities) | | | 8.7% | | | ∎ | | | | | | |
| | | | | | |
|
| Credit ratings are the lesser of S&P Global Ratings or Moody’s Investors Service. If neither S&P nor Moody’s rate a particular security, that security is categorized as not rated (except for US Treasury securities and securities issued or backed by US agencies which inherit the credit rating for the US government). Ratings range from AAA (highest) to D (lowest). Bonds rated BBB or above are considered investment grade. Credit ratings BB and below are lower-rated securities (junk bonds). Ratings apply to the credit worthiness of the issuers of the underlying securities and not the fund or its shares. Ratings may be subject to change. |
| | | | | | | | | | | | |
| | | | | | | |
| 18 | | | | | | | | November 30,2020 | | Annual Report | | The accompanying notes are an integral part of these financial statements. |
| | |
| Saturna Sustainable Bond Fund | | |
Statement of Assets and Liabilities
| | | | |
| As of November 30, 2020 | |
| | |
| | | | |
| |
Assets | | | | |
| |
Investments in securities, at value (Cost $19,129,784) | | | $20,068,012 | |
| |
Cash | | | 1,652,740 | |
| |
Dividends and interest receivable | | | 239,772 | |
| |
Receivable for Fund shares sold | | | 42,100 | |
| |
Prepaid expenses | | | 145 | |
| | | | |
| |
Total assets | | | 22,002,769 | |
| | | | |
| |
Liabilities | | | | |
| |
Accrued advisory fees | | | 8,364 | |
| |
Accrued audit expenses | | | 7,225 | |
| |
Payable for Fund shares redeemed | | | 3,793 | |
| |
Accrued postage and printing fees | | | 2,747 | |
| |
Accrued legal expenses | | | 2,354 | |
| |
Accrued trustee expenses | | | 2,009 | |
| |
Accrued Chief Compliance Officer expenses | | | 1,787 | |
| |
Accrued retirement plan custody fee | | | 1,048 | |
| |
Accrued other expenses | | | 912 | |
| | | | |
| |
Total liabilities | | | 30,239 | |
| | | | |
| |
Net assets | | | $21,972,530 | |
| | |
| | | | |
| | |
Analysis of net assets | | | | |
| |
Paid-in capital (unlimited shares authorized, without par value) | | | 21,130,298 | |
| |
Total distributable earnings | | | 842,232 | |
| | | | |
| |
Net assets applicable to Fund shares outstanding | | | $21,972,530 | |
| | |
| | | | |
Fund shares outstanding | | | 2,142,920 | |
| | |
Net asset value, offering, and redemption price per share | | | $10.25 | |
| | | | | |
Statement of Operations
| | | | |
| Year ended November 30, 2020 | |
| |
| |
| |
Investment income | | | | |
| |
Interest income | | | $798,324 | |
| |
Miscellaneous income | | | 4,309 | |
| | | | |
| |
Total investment income | | | 802,633 | |
| | | | |
| |
Expenses | | | | |
| |
Investment advisory fees | | | 147,700 | |
| |
Audit fees | | | 16,907 | |
| |
Filing and registration fees | | | 16,642 | |
| |
Trustee fees | | | 13,373 | |
| |
Printing and Postage fee expense | | | 11,451 | |
| |
Legal fees | | | 6,912 | |
| |
Chief Compliance Officer expenses | | | 6,622 | |
| |
Other operating expenses | | | 3,866 | |
| |
Custodian fees | | | 3,287 | |
| |
Retirement plan custodial fees | | | 1,294 | |
| | | | |
| |
Total gross expenses | | | 228,054 | |
| | | | |
| |
Less adviser fees waived | | | (48,792 | ) |
| |
Less custodian fee credits | | | (3,287 | ) |
| | | | |
| |
Net expenses | | | 175,975 | |
| | | | |
| |
Net investment income | | | 626,658 | |
| | |
| | | | |
| | |
| | | | |
| |
Net realized gain from investments and foreign currency | | | 21,779 | |
| |
Net increase in unrealized appreciation on investments and foreign currency | | | 996,180 | |
| | | | |
| |
Net gain on investments | | | $1,017,959 | |
| | |
| | | | |
| | |
Net increase in net assets resulting from operations | | | $1,644,617 | |
| | | | | |
| | | | |
| | | | | | | | | | | | |
| | | | | | | |
| The accompanying notes are an integral part of these financial statements. | | November 30, 2020 | | Annual Report | | | | | | | | 19 |
| | |
| Saturna Sustainable Bond Fund | | |
| | | | | | | | |
Statements of Changes in Net Assets | | | Year ended November 30, 2020 | | | | Year ended November 30, 2019 | |
| | | |
Decrease in net assets from operations | | | | | | | | |
| | |
From operations | | | | | | | | |
| | |
Net investment income | | | $626,658 | | | | $844,020 | |
| | |
Net realized gains on investments and foreign currency | | | 21,779 | | | | (526,018 | ) |
| | |
Net increase in unrealized appreciation | | | 996,180 | | | | 1,466,882 | |
| | | | | | | | |
| | |
Net increase in net assets | | | 1,644,617 | | | | 1,784,884 | |
| | | | | | | | |
| | |
| | | | | | | | |
| | |
Distributions to shareowners | | | (293,065 | ) | | | (787,144 | ) |
| | |
| | | | | | | | |
| | |
Capital share transactions | | | | | | | | |
| | |
Proceeds from sales of shares | | | 7,552,324 | | | | 9,188,924 | |
| | |
Value of shares issued in reinvestment of dividends | | | 255,413 | | | | 694,871 | |
| | |
Cost of shares redeemed | | | (14,962,191 | ) | | | (14,752,663 | ) |
| | | | | | | | |
| | |
Total capital share transactions | | | (7,154,454 | ) | | | (4,868,868 | ) |
| | | | | | | | |
| | |
Total decrease in net assets | | | (5,802,902 | ) | | | (3,871,128 | ) |
| | | |
| | | | | | | | |
| | | |
Net assets | | | | | | | | |
| | |
Beginning of year | | | 27,775,432 | | | | 31,646,560 | |
| | |
End of year | | | $21,972,530 | | | | $27,775,432 | |
| | | |
| | | | | | | | |
| | | |
Shares of the Fund sold and redeemed | | | | | | | | |
| | |
Number of shares sold | | | 764,964 | | | | 957,716 | |
| | |
Number of shares issued in reinvestment of dividends | | | 26,166 | | | | 72,324 | |
| | |
Number of shares redeemed | | | (1,510,755 | ) | | | (1,538,171 | ) |
| | | | | | | | |
| | |
Net decrease in number of shares outstanding | | | (719,625 | ) | | | (508,131 | ) |
| | | |
| | | | | | | | |
| | | | | | | | | | | | | | | | | | | | |
Financial Highlights | | | | | | | Year ended November 30, | | | | | |
| | | | | |
Selected data per share of outstanding capital stock throughout each year: | | | 2020 | | | | 2019 | | | | 2018 | | | | 2017 | | | | 2016 | |
| | | | | | |
Net asset value at beginning of year | | | $9.70 | | | | $9.39 | | | | $9.87 | | | | $9.65 | | | | $9.75 | |
| | | | | |
Income from investment operations | | | | | | | | | | | | | | | | | | | | |
| | | | | |
Net investment income | | | 0.23 | | | | 0.28 | | | | 0.26 | | | | 0.27 | | | | 0.24 | |
| | | | | |
Net gains (losses) on securities (both realized and unrealized) | | | 0.42 | | | | 0.29 | | | | (0.48 | ) | | | 0.23 | | | | (0.10 | ) |
| | | | | | | | | | | | | | | | | | | | |
| | | | | |
Total from investment operations | | | 0.65 | | | | 0.57 | | | | (0.22 | ) | | | 0.50 | | | | 0.14 | |
| | | | | | | | | | | | | | | | | | | | |
| | | | | |
Less distributions | | | | | | | | | | | | | | | | | | | | |
| | | | | |
Dividends from net investment income | | | (0.10 | ) | | | (0.26 | ) | | | (0.26 | ) | | | (0.27 | ) | | | (0.24 | ) |
| | | | | |
Capital gains distribution | | | - | | | | - | | | | - | | | | (0.01 | ) | | | - | |
| | | | | | | | | | | | | | | | | | | | |
| | | | | |
Total distributions | | | (0.10 | ) | | | (0.26 | ) | | | (0.26 | ) | | | (0.28 | ) | | | (0.24 | ) |
| | | | | | | | | | | | | | | | | | | | |
| | | | | |
| | | | | | | | | | | | | | | | | | | | |
| | | | | |
Net asset value at end of year | | | $10.25 | | | | $9.70 | | | | $9.39 | | | | $9.87 | | | | $9.65 | |
| | | | | | |
| | | | | | | | | | | | | | | | | | | | |
Total return | | | 6.78% | | | | 6.09% | | | | (2.29 | )% | | | 5.28% | | | | 1.37% | |
| | | | | | |
Ratios / supplemental data | | | | | | | | | | | | | | | | | | | | |
| | | | | |
Net assets ($000), end of year | | | $21,973 | | | | $27,775 | | | | $31,647 | | | | $21,980 | | | | $8,639 | |
| | | | | |
Ratio of expenses to average net assets | | | | | | | | | | | | | | | | | | | | |
| | | | | |
Before fee waivers | | | 0.85% | | | | 0.83% | | | | 0.77% | | | | 0.92% | | | | 1.17% | |
| | | | | |
After fee waivers | | | 0.67% | | | | 0.66% | | | | 0.66% | | | | 0.75% | | | | 0.89% | |
| | | | | |
After fee waivers and custodian fee credits | | | 0.65% | | | | 0.65% | | | | 0.65% | | | | 0.74% | | | | 0.89% | |
| | | | | |
Ratio of net investment income after fee waivers custodian fee credits to average net assets | | | 2.33% | | | | 2.87% | | | | 2.99% | | | | 2.82% | | | | 2.46% | |
| | | | | |
Portfolio turnover rate | | | 63% | | | | 38% | | | | 25% | | | | 14% | | | | 46% | |
| | | | | | |
| | | | | | | | | | | | | | | | | | | | |
| | | | | | | | | | | | |
| | | | | | | |
| 20 | | | | | | | | November 30, 2020 | | Annual Report | | The accompanying notes are an integral part of these financial statements. |
Notes To Financial Statements
NOTE 1 – Organization
Saturna Investment Trust (the “Trust”) was established under Washington State Law as a business trust on February 20, 1987. The Trust is registered as an open-end, diversified management company under the Investment Company Act of 1940, as amended. Nine portfolio series have been created to date, two of which are covered by this annual report: Saturna Sustainable Equity Fund and Saturna Sustainable Bond Fund (the “Funds”). The Sextant Short-Term Bond Fund, Sextant Bond Income Fund, Sextant Core Fund, Sextant Global High Income Fund, Sextant Growth Fund, Sextant International Fund, and the Idaho Tax-Exempt Fund are offered through separate prospectuses, the results of which are contained in separate reports.
Saturna Sustainable Equity Fund and Saturna Sustainable Bond Fund commenced operations on March 27, 2015.
Each Fund is an investment company and accordingly follows the investment company accounting and reporting guidance of the Financial Accounting Standards Board (FASB) Accounting Standard Codification Topic 946 “Financial Services – Investment Companies”.
Investment risks:
Saturna Sustainable Equity and Saturna Sustainable Bond Funds: The value of each Fund’s shares rises and falls as the value of the securities in which the Fund invests goes up and down. Fund share prices, yields, and total returns will change with market fluctuations as well as the fortunes of the countries, industries, and companies in which the Fund invests. The Funds do not use derivatives to hedge currency, interest rate, or credit risk.
Ratings are dependent upon the associated ESG risks that are most pertinent to the sector in which an issuer operates. The ratings process associated with sustainable and responsible investing reduces the investable universe for each Fund, which limits opportunities and may increase the risk of loss during market declines. The adviser believes that sustainable investing may mitigate security-specific risk, but there is no guarantee that the securities favored by our investment process will perform better and may perform worse than those that are not favored.
The Funds may invest substantially in one or more sectors, which can increase volatility and exposure to issues specific to a particular sector or industry.
Foreign investing involves risks not normally associated with investing in US securities. These include fluctuations in currency exchange rates, less public information about securities, less governmental market supervision, and the lack of uniform financial, social, and political standards. Foreign investing heightens the risk of confiscatory taxation, seizure or nationalization of assets, establishment of currency controls, or adverse political or social developments that affect investments. The risks of investing in foreign securities are typically greater in less developed or emerging countries.
Liquidity risk exists when particular investments are difficult to sell. If a Fund holds illiquid investments, its portfolio may be more difficult to value, especially in changing markets. Investments by a Fund in foreign securities and those that are thinly traded, such as lower quality issuers, and smaller companies tend to involve greater liquidity risk. If a Fund is forced to sell or unwind these investments to meet redemptions or for other cash needs, the Fund may suffer a penalty. Additionally, the market for certain investments may become illiquid under adverse market or economic conditions independent of any specific adverse changes in the conditions of a particular issuer. In such cases, the Fund, due to limitations on investments in illiquid securities and the difficulty in purchasing and selling such securities, may be unable to achieve its investment objective.
Saturna Sustainable Bond Fund: The risks inherent in the Saturna Sustainable Bond Fund depend primarily on the terms and quality of the obligations in its portfolio, as well as on bond market conditions. When interest rates rise, bond prices fall. When interest rates fall, bond prices go up. Bonds with longer maturities usually are more sensitive to interest rate changes than bonds with shorter maturities. The Fund entails credit risk, which is the possibility that a bond will not be able to pay interest or principal when due. If the credit quality of a bond is perceived to decline, investors will demand a higher yield, which means a lower price on that bond to compensate for the higher level of risk.
The Fund may invest a portion of its assets in securities issued by government sponsored entities such as Fannie Mae, Freddie Mac, and the Federal Home Loan Banks in the US. Foreign governments also sponsor similar entities, which may promote activities such as low-cost housing or alternative energy. The Fund may also invest in the issues of regional, state, and local governments. The terms of such issues can be complex, and there can be no assurance that a government entity will support such enterprises that encounter financial difficulty.
Issuers of high-yield securities are generally not as strong financially as those issuing higher quality securities. These issuers are more likely to encounter financial difficulties and are more vulnerable to changes in the relevant economy that could affect their ability to make interest and principal payments as expected. High-yield bonds may have low or no ratings, and may be considered “junk bonds.”
Bond investments, especially mortgage-backed and asset-backed securities, are subject to the risk that borrowers will prepay the principal more quickly than expected (prepayment risk) or more slowly than expected (extension risk), which will affect the yield, average life, and price of the securities.
NOTE 2 – Significant Accounting Policies
The following is a summary of the significant accounting policies, in conformity with accounting principles generally accepted in the United States of America, which are consistently followed by the Funds in preparation of their financial statements.
Security valuation:
Investments in securities traded on a national securities exchange and over-the-counter securities for which sale prices are available are valued at that price. Securities for which there are no sales are valued at the latest bid price.
Debt securities are valued using bid-side valuations provided by an independent service. The service determines valuations using factors such as yields or prices of bonds of comparable quality, type of issue, coupon maturity, ratings, trading activity, and general market conditions.
Fixed-income debt instruments, such as commercial paper, bankers’ acceptances, and US Treasury Bills, with a maturity of 60 days or less are valued at amortized cost, which approximates market value.
| | | | | | | | | | |
| | | | | | |
November 30, 2020 | | Annual Report | | | | | | | | 21 |
Notes To Financial Statements (continued)
Any discount or premium is accreted or amortized on a straight-line basis until maturity.
Foreign markets may close before the time as of which the Funds’ share prices are determined. Because of this, events occurring after the close and before the determination of the Funds’ share prices may have a material effect on the values of some or all of the Funds’ foreign securities. To account for this, the Funds may use outside pricing services for valuation of their non-US securities.
In cases in which there is not a readily available market price, a fair value for such security is determined in good faith by or under the direction of the Board of Trustees.
Security transactions are recorded on the trade date. Realized gains and losses on sales of securities are recorded on the identified cost basis.
Foreign currency:
Investment securities and other assets and liabilities denominated in foreign currencies are translated into US dollar amounts at the date of valuation. Purchases and sales of investment securities and income and expense items denominated in foreign currencies are translated into US dollar amounts on the respective dates of such transactions.
The Funds do not isolate that portion of the results of operations resulting from changes in foreign exchange rates on investments from the fluctuations arising from changes in market prices of securities held. Such fluctuations are included with the net realized and unrealized gain or loss from investments.
Reported net realized foreign exchange gains or losses arise from sales of foreign currencies, currency gains or losses realized between the trade and settlement dates on securities transactions, and the difference between the amounts of dividends, interest, and foreign withholding taxes recorded on the Funds’ books and the US dollar equivalent of the amounts actually received or paid. Net unrealized foreign exchange gains and losses arise from changes in the fair values of assets and liabilities, other than investments in securities at fiscal period end, resulting from changes in exchange rates.
Share valuation:
The net asset value (“NAV”) per share of each Fund is calculated by dividing the sum of the value of the securities held by each Fund, plus cash and other assets, minus all liabilities (including estimated accrued expenses) by the total number of shares outstanding for each Fund, rounded to the nearest cent. The Funds’ shares are not priced or traded on days the New York Stock Exchange is closed. The NAV is the offering and redemption price per share.
Fair value measurements:
Accounting Standards Codification (ASC) 820 establishes a three-tier framework for measuring fair value based on a hierarchy of inputs. The hierarchy distinguishes between market data obtained from independent sources (observable inputs) and the Funds’ own market assumptions (unobservable inputs). These inputs are used in determining the value of the Funds’ investments and are summarized below.
| | Level 1 — | Unadjusted quoted prices in active markets for identical assets or liabilities that the Trust has the ability to access. |
| | Level 2 — | Observable inputs other than quoted prices in Level 1 that are observable for the asset or liability, either directly or indirectly. These inputs may include quoted |
| | | | | | | | | | | | | | | | |
| | | | |
| Funds | | Level 1
Quoted Price | | | Level 2
Significant Observable Input | | | Level 3
Significant Unobservable Input | | | Total | |
| | | | | |
Sustainable Equity Fund | | | | | | | | | | | | | | | | |
| | | | |
Common Stocks | | | | | | | | | | | | | | | | |
| | | | |
Consumer Discretionary | | | $2,354,998 | | | | $- | | | | $- | | | | $2,354,998 | |
| | | | |
Consumer Staples | | | 1,981,531 | | | | - | | | | - | | | | 1,981,531 | |
| | | | |
Energy | | | - | | | | 845,276 | | | | - | | | | 845,276 | |
| | | | |
Financials | | | 606,229 | | | | 274,308 | | | | - | | | | 880,537 | |
| | | | |
Health Care | | | 1,454,120 | | | | 194,176 | | | | - | | | | 1,648,296 | |
| | | | |
Industrials | | | 988,501 | | | | 588,151 | | | | - | | | | 1,576,652 | |
| | | | |
Materials | | | 299,723 | | | | 430,066 | | | | - | | | | 729,789 | |
| | | | |
Technology | | | 4,661,901 | | | | 668,207 | | | | - | | | | 5,330,108 | |
| | | | |
Utilities | | | - | | | | 329,165 | | | | - | | | | 329,165 | |
| | | | |
Total Assets | | | $12,347,003 | | | | $3,329,349 | | | | $- | | | | $15,676,352 | |
| | | | |
| | | | | | | | | | | | | | | | |
| | | | | |
Sustainable Bond Fund | | | | | | | | | | | | | | | | |
| | | | |
Corporate Bonds1 | | | $- | | | | $12,315,598 | | | | $- | | | | $12,315,598 | |
| | | | |
Government Bonds1 | | | - | | | | 7,752,414 | | | | - | | | | 7,752,414 | |
| | | | |
Total Assets | | | $- | | | | $20,068,012 | | | | $- | | | | $20,068,012 | |
| 1 | See Schedule of Investments for industry breakout. |
During the period ended November 30, 2020, no Fund had transfers between Level 1, Level 2 or Level 3.
| | | | | | | | | | |
| | | | | | |
| 22 | | | | | | | | November 30, 2020 | | Annual Report |
Notes To Financial Statements (continued)
prices for the identical instrument on an inactive market, prices for similar instruments, interest rates, prepayment speeds, credit risk, yield curves, default rates, and similar data.
| | Level 3 — | Unobservable inputs for the asset or liability, to the extent relevant observable inputs are not available, representing the Trust’s own assumptions about the assumptions a market participant would use in valuing the asset or liability, and would be based on the best information available. |
The availability of observable inputs can vary from security to security and is affected by a wide variety of factors, including, for example, the type of security, whether the security is new and not yet established in the marketplace, the liquidity of markets, and other characteristics particular to the security. To the extent that valuation is based on models or inputs that are less observable or unobservable in the market, the determination of fair value requires more judgment. Accordingly, the degree of judgment exercised in determining fair value is greatest for instruments categorized in Level 3.
The inputs used to measure fair value may fall into different levels of the fair value hierarchy. In such cases, for disclosure purposes, the level in the fair value hierarchy within which the fair value measurement falls in its entirety, is determined based on the lowest level input that is significant to the fair value measurement in its entirety.
The inputs or methodology used for valuing securities are not necessarily an indication of the risk associated with investing in those securities.
Investment concentration:
The Funds may have deposits of cash with the custodian from time to time for one or more reasons. “Other assets (net of liabilities)” in the Funds’ Schedules of Investments primarily represents cash on deposit with the custodian. Cash on deposit will vary widely over time. Accounting Standards Codification (“ASC”) 825, “Financial Instruments,” identifies these items as a concentration of credit risk. The risk is managed by careful financial analysis and review of the custodian’s operations, resources, and protections available to the Trust. This process includes evaluation of other financial institutions providing investment company custody services.
Federal income taxes:
The Funds intend to comply with the requirements of the Internal Revenue Code necessary to qualify as a regulated investment company and to make the requisite distributions of income and capital gains to its shareowners sufficient to relieve them from all or substantially all federal income taxes. Therefore, no federal income tax provision is required.
The Funds recognize the tax benefits of uncertain tax positions only where the position is “more likely than not” to be sustained assuming examination by tax authorities. Management has analyzed the Funds’ tax positions and has concluded that no liability for unrecognized tax benefits should be recorded related to uncertain tax positions taken on returns filed for open tax years (2017-2019) or expected to be taken in the Funds’ 2020 tax returns. The Funds identify their major tax jurisdictions as US federal and foreign jurisdictions where the Funds make significant investments; however, the Funds are not aware of any tax positions for which it is reasonably possible that the total amounts of unrecognized tax benefits will change materially in the next 12 months.
Reclassification of capital accounts:
Accounting principles generally accepted in the United States of America require that certain components of net assets relating to permanent differences be reclassified between financial and tax reporting.
As of November 30, 2020, there were no reclassifications to the capital accounts.
Distributions to shareowners:
For the Sustainable Bond Fund, dividends to shareowners from net investment income are paid daily and distributed on the last business day of each month. Sustainable Equity Fund pays income dividends annually, typically by the end of the year. As a result of its investment strategy, the Saturna Sustainable Equity Fund may not pay income dividends. For both Funds, distributions of capital gains, if any, are made at least annually, and as required to comply with federal excise tax requirements. Distributions to shareowners are determined in accordance with income tax regulations and are recorded on the ex-dividend date. Dividends are paid in shares of the Funds, at the net asset value on the payable date. Shareowners may elect to take distributions if they total $10 or more in cash.
Use of estimates:
The preparation of financial statements in conformity with accounting principles generally accepted in the United States of America requires management to make estimates and assumptions that affect the reported amounts of assets and liabilities and disclosure of contingent assets and liabilities at the date of the financial statements and the reported amounts of increases and decreases in net assets from operations during the reporting period. Actual results could differ from those estimates.
Foreign taxes:
Withholding taxes on foreign dividends are paid (a portion of which may be reclaimable) or provided for in accordance with the applicable country’s tax rules and rates and are disclosed in the Statement of Operations. Withholding tax reclaims are filed in certain countries to recover a portion of the amounts previously withheld. The Funds record a reclaim receivable based on a number of factors, including a jurisdiction’s legal obligation to pay reclaims as well as payment history and market convention.
LIBOR Transition Risk:
The United Kingdom’s Financial Conduct Authority announce a phase out of the London Interbank Offered Rate (“LIBOR”) by the end of 2021 and it is expected that LIBOR will cease to be published after that time. The Funds may be exposed to financial instruments tied to LIBOR to determine payment obligations, financing terms, hedging activities, or investment value. The transition process away from LIBOR might lead to increase volatility and illiquidity in markets for , and reduce the effectiveness of new hedges placed against, instruments whose term currently include LIBOR. The ultimate effect of the LIBOR transition process on the Funds is uncertain.
Other
Interest income is recognized on an accrual basis. Premiums on securities purchased are amortized, and discounts are accreted
| | | | | | | | | | |
| | | | | | |
November 30, 2020 | | Annual Report | | | | | | | | 23 |
Notes To Financial Statements (continued)
using the yield to maturity method over the lives of the respective securities or where applicable, to the first call date of the securities. Dividends from equity securities are recorded as income on the ex-dividend date or as soon as information is available to the fund.
Recent Accounting Pronouncement:
In August 2018, FASB issued Accounting Standards Update No. 2018-13, “Fair Value Measurement (Topic 820: Disclosure Framework — Changes to the Disclosure Requirements for Fair Value Measurement” (“ASU 2018-13”). ASU 2018-13 eliminates the requirement to disclose the amount of and reasons for transfers between Level 1 and Level 2 of the fair value hierarchy, the timing of transfers between levels of the fair value hierarchy and the valuation processes for Level 3 fair value measurements. ASU 2018-13 will require the need to disclose the range and weighted average used to develop significant unobservable inputs for Level 3 fair value measurements and the changes in unrealized gains and losses for recurring Level 3 fair value measurements. ASU 2018-13 will also require that information is provided about the measurement uncertainty of Level 3 fair value measurements as of the reporting date. The guidance is effective for fiscal years, and interim periods within those fiscal years, beginning after December 15, 2019, and allows for early adoption of either the entire standard or only the provisions that eliminate or modify the requirements. Management has elected to adopt early the provisions that eliminate the disclosure requirements. Management is still currently evaluating the impact of applying the rest of the guidance.
NOTE 3 – Transactions with Affiliated Persons
Under contracts approved annually by the Board of Trustees, including those who are not parties to the contract or “interested persons” (as defined in the Investment Company Act of 1940) of such parties or the Trust (the “Independent Trustees”), Saturna Capital Corporation (“Saturna Capital”) provides investment advisory services and certain other administrative services required to conduct Trust business. Expenses incurred by the Trust on behalf of the Funds (e.g., legal fees) are allocated to the Funds on the basis of relative daily average net assets. For such services, each of the Funds pays the adviser an Investment Advisory and Administrative Services Fee of 0.65% for the Sustainable Equity Fund and 0.55% for the Sustainable Bond Fund of average net assets per annum, payable monthly. In addition, the adviser has agreed to certain limits on other expenses, as described below.
The Adviser has voluntarily undertaken to limit expenses of the Sustainable Equity Fund to 0.75% and the Sustainable Bond Fund to 0.65% through March 31, 2021. For the fiscal year ended November 30, 2020, the advisory fees incurred were as follows:
| | | | | | | | | | | | |
| | | | |
| | | Adviser Fees | | | Adviser Fees Waived | | | Expense Reimbursement | |
| | | |
Sustainable Equity | | | $73,338 | | | | $(3,388 | ) | | | $- | |
| | | |
Sustainable Bond | | | $147,700 | | | | $(48,792 | ) | | | $- | |
In accordance with the expense limitation noted above, for the fiscal year ended November 30, 2020, Saturna Capital waived a portion of the advisory fees of the Sustainable Equity Fund and Sustainable Bond Fund. The adviser cannot recoup previously waived fees.
Saturna Brokerage Services, Inc. (“SBS”), a discount brokerage and subsidiary of Saturna Capital Corporation, is registered as a broker-dealer and acts as distributor. On December 19, 2014, the Funds adopted a Distribution Plan in accordance with Rule 12b-1 under the 1940 Act. On June 2, 2017, 12b-1 fees were terminated for both Saturna Sustainable Funds.
SBS is used to effect portfolio transactions for the Trust. SBS currently executes portfolio transactions without commission. Transactions effected through other brokers are subject to commissions payable to that broker.
Saturna Trust Company (“STC”), a subsidiary of Saturna Capital, acts as retirement plan custodian for Fund shareowners. Each Fund pays an annual fee of $10 per account for retirement plan services to Saturna Trust Company. For the fiscal year ended November 30, 2020, the Funds incurred the following amounts:
| | | | |
| |
Retirement plan custodial fees | |
| |
Sustainable Equity | | | $34 | |
| |
Sustainable Bond | | | $1,294 | |
Mrs. Jane Carten serves as a trustee and president of the Trust. She is also a director and president of Saturna Capital and vice president of Saturna Trust Company. Mrs. Carten is not compensated by the Trust. For the fiscal year ended November 30, 2020, the Trust incurred compensation expenses of $35,500 which is included in $66,477 of total expenses for the independent Trustees. The Saturna Sustainable Funds incurred $15,120 of these total expenses.
The officers of the Trust are paid by Saturna Capital, not the Trust, except the Chief Compliance Officer, who may be partially compensated by the Trust. For the fiscal year ended November 30, 2020, the Funds paid the following compensation expenses for the Chief Compliance Officer:
| | | | |
| |
Chief Compliance Officer | |
| |
Sustainable Equity | | | $1,301 | |
| |
Sustainable Bond | | | $6,622 | |
On November 30, 2020, the trustees, officers, and their affiliates as a group owned 44.22% and 18.97% of the outstanding shares of Sustainable Equity Fund and Sustainable Bond Fund, respectively.
| | | | | | | | | | |
| | | | | | |
| 24 | | | | | | | | November 30, 2020 | | Annual Report |
Notes To Financial Statements (continued)
NOTE 4 – Distributions to Shareowners
The tax characteristics of distributions paid for the fiscal years ended November 30, 2020, and November 30, 2019 were as follows:
| | | | | | | | |
| | | |
| | | Year ended November 30, 2020 | | | Year ended November 30, 2019 | |
| | |
Sustainable Equity Fund | | | | | | | | |
| | |
Ordinary income | | | $42,386 | | | | $46,186 | |
| | | | | | | | |
| | |
Sustainable Bond Fund | | | | | | | | |
| | |
Ordinary income | | | $293,065 | | | | $787,144 | |
NOTE 5 – Federal Income Taxes
The cost basis of investments for federal income tax purposes on November 30, 2020, was as follows:
| | | | | | | | |
| | | |
| | | Sustainable Equity | | | Sustainable Bond | |
| | |
Cost of investments | | | $11,017,606 | | | | $19,129,784 | |
| | | | | | | | |
| | |
Gross tax unrealized appreciation | | | $4,758,193 | | | | $1,200,033 | |
| | |
Gross tax unrealized depreciation | | | $(99,447 | ) | | | $(261,805 | ) |
| | |
Net tax unrealized appreciation | | | $4,658,746 | | | | $938,228 | |
As of November 30, 2020, components of distributable earnings on a tax basis were as follows:
| | | | |
| | |
Sustainable Equity | | | | |
| |
Undistributed ordinary income | | | $62,316 | |
| | | | |
| |
Accumulated capital losses | | | (292,206 | ) |
| |
Unrealized appreciation | | | 4,658,746 | |
| |
Other unrealized losses | | | 325 | |
| | | | |
| |
Total accumulated earnings | | | $4,429,181 | |
| | |
| | | | |
| | |
Sustainable Bond | | | | |
| |
Undistributed net investment income (loss) | | | $(48,793 | )A |
| |
Accumulated capital losses | | | (55,758 | ) |
| |
Unrealized appreciation | | | 938,228 | |
| |
Other unrealized appreciation | | | 8,555 | |
| | | | |
| |
Total accumulated earnings | | | $842,232 | |
| A | Represents late year loss deferrals |
On November 30, 2020, the Funds had capital loss carryforwards as follows, subject to regulation.
| | | | | | | | |
| | |
| | | | Carryforward | | | | Expiration | |
| | | |
Sustainable Equity Fund | | | | | | | | |
| | |
Short-term loss carryforward | | | $260,269 | | | | Unlimited | |
| | |
Long-term loss carryforward | | | $31,937 | | | | Unlimited | |
| | |
| | | | $292,206 | | | | | |
| | |
| | | | | | | | |
| | |
| | | | Carryforward | | | | Expiration | |
| | | |
Sustainable Bond Fund | | | | | | | | |
| | |
Long-term loss carryforward | | | $55,758 | | | | Unlimited | |
| | |
| | | | $55,758 | | | | | |
NOTE 6 – Investments
Investment transactions other than short-term investments for the fiscal year ended November 30, 2020, were as follows:
| | | | | | | | |
| | | |
| | | Purchases | | | Sales | |
| | |
Sustainable Equity | | | $6,667,175 | | | | $1,366,507 | |
| | |
Sustainable Bond | | | $16,313,943 | | | | $23,141,701 | |
NOTE 7 – Custodian
Under agreements in place with the Trust’s custodian, UMB Bank, custody fees are reduced by credits for cash balances. Such reductions for the year ended November 30, 2020, were as follows:
| | | | |
| |
| Custodian Fee Credits | |
| |
Sustainable Equity | | | $1,708 | |
| |
Sustainable Bond | | | $3,287 | |
NOTE 8 – COVID 19 Pandemic
The COVID-19 Pandemic has adversely impacted global commercial activity and contributed to significant volatility in global equity and debt markets. The pandemic has resulted in quarantines, stay at home orders, travel prohibitions and closures, disrupting supply chains and economic activity. The duration of the pandemic’s effects remain uncertain and difficult to assess. The effects of the pandemic may adversely impact a Fund’s performance and its ability to achieve its investment objective.
NOTE 9 – Subsequent Events
The Sustainable Equity Fund declared a distribution to be paid on December 17, 2020, to all share owners of record on December 16, 2020, and the Sustainable Bond Fund declared a distribution to be paid on January 31, 2021, to all share owners of record on January 27, 2021, as follows:
| | | | |
| | |
| | | Income | |
| |
Sustainable Equity | | | $0.0588 | |
| |
Sustainable Bond | | | $0.0110 | |
There were no other events or transactions during the period that materially impacted the amounts or disclosures in the Funds’ financial statements.
| | | | | | | | | | |
| | | | | | |
| November 30, 2020 | | Annual Report | | | | | | | | 25 |
Report of Independent Registered Public Accounting Firm
To the Board of Trustees of
Saturna Investment Trust
and the Shareholders of Saturna Sustainable Funds
Opinion on the Financial Statements
We have audited the accompanying statement of assets and liabilities of Saturna Sustainable Equity Fund and Saturna Sustainable Bond Fund, (the “Funds”), each a series of Saturna Investment Trust, including the schedules of investments, as of November 30, 2020, the related statements of operations for the year then ended, the statements of changes in net assets for each of the two years in the period then ended, the financial highlights for each of the five years then ended, and the related notes (collectively referred to as the “financial statements”). In our opinion, the financial statements present fairly, in all material respects, the financial position of the Funds as of November 30, 2020, the results of their operations for the year then ended, the changes in their net assets for each of the two years in the period then ended, and their financial highlights each of the five years then ended, in conformity with accounting principles generally accepted in the United States of America.
Basis for Opinion
These financial statements are the responsibility of the Funds’ management. Our responsibility is to express an opinion on the Funds’ financial statements based on our audits. We are a public accounting firm registered with the Public Company Accounting Oversight Board (United States) (“PCAOB”) and are required to be independent with respect to the Funds in accordance with the US federal securities laws and the applicable rules and regulations of the Securities and Exchange Commission and the PCAOB. We have served as the auditor of one or more of the funds in the Trust since 1997.
We conducted our audits in accordance with the standards of the PCAOB. Those standards require that we plan and perform the audits to obtain reasonable assurance about whether the financial statements are free of material misstatement, whether due to error or fraud. The Funds are not required to have, nor were we engaged to perform, an audit of their internal control over financial reporting. As part of our audits we are required to obtain an understanding of internal control over financial reporting, but not for the purpose of expressing an opinion on the effectiveness of the Funds internal control over financial reporting. Accordingly, we express no such opinion.
Our audits included performing procedures to assess the risks of material misstatement of the financial statements, whether due to error or fraud, and performing procedures that respond to those risks. Such procedures included examining, on a test basis, evidence regarding the amounts and disclosures in the financial statements. Our audits also included evaluating the accounting principles used and significant estimates made by management, as well as evaluating the overall presentation of the financial statements. Our procedures included confirmation of securities owned as of November 30, 2020 by correspondence with the custodian and brokers. We believe that our audits provide a reasonable basis for our opinion.
Philadelphia, Pennsylvania
January 29, 2021
/s/ Tait, Weller & Baker LLP
Tait, Weller & Baker LLP
| | | | | | | | | | |
| | | | | | |
| 26 | | | | | | | | November 30, 2020 | | Annual Report |
All mutual funds have operating expenses. As a Saturna Sustainable Fund shareowner, you incur ongoing costs, including management fees and other Fund expenses such as shareowner reports (like this one). Operating expenses, which are deducted from a fund’s gross earnings, directly reduce the investment return of a fund. Mutual funds (unlike other financial investments) only report their results after deduction of operating expenses.
With the Saturna Sustainable Funds, unlike many mutual funds, you do not incur sales charges (loads) on purchases, reinvested dividends, or other distributions. You do not incur redemption fees or exchange fees. You may incur fees related to extra services requested by you for your account, such as bank wires. The examples below are intended to help you understand your ongoing costs (in dollars) of investing in the Funds and to compare these costs with the ongoing costs of investing in other mutual funds.
Examples
The following examples are based on an investment of $1,000 invested at the beginning of the period and held for the entire period (June 1, 2020 to November 30, 2020).
Actual Expenses
The first line for each Fund provides information about actual account values and actual expenses. You may use the information in this line, together with the amount you have invested, to estimate the expenses that you paid over the period. Simply divide your account value by $1,000 (for example, an $8,600 account value divided by $1,000 = 8.6), then multiply the result by the number in the first line under the heading entitled “Expenses Paid During Period” to estimate the expenses you paid on your account during this period. The Funds may charge for extra services (such as domestic bank wires, international bank wires, or overnight courier delivery of redemption checks) rendered on request, which you may need to estimate to determine your total expenses.
Hypothetical Example For Comparison Purposes
The second line for each Fund provides information about hypothetical account values and hypothetical expenses based on each Fund’s actual expense ratio (based on the last six months) and an assumed rate of return of 5% per year before expenses, which is not the Fund’s actual return. The hypothetical account values and expenses may not be used to estimate the actual ending account balance or expenses you paid for the period. You may use this information to compare the ongoing costs of investing in the Funds and other mutual funds. To do so, compare this 5% hypothetical example with the 5% hypothetical examples that appear in the shareowner reports of other mutual funds. You may wish to add other fees that are not included in the expenses shown in the table, such as IRA fees charged by custodians other than Saturna Trust Company (note that Saturna does not charge such fees to shareowners directly on Saturna IRAs, ESAs, or HSAs with the Saturna Sustainable Funds), and charges for extra services such as bank wires.
Please note that the expenses shown in the tables are meant to highlight your ongoing costs only and do not reflect any transactional costs, such as sales charges (loads) or exchange fees (note that the Saturna Sustainable Funds do not assess any such transactional costs). Therefore, the “Hypothetical” line of each fund is useful in comparing ongoing costs only, and may not help you determine the relative total costs of owning different funds.
| | | | | | | | | | | | | | | | |
| | | | | |
| | | Beginning Account Value [June 1, 2020] | | | Ending Account Value [November 30, 2020] | | | Expenses Paid
During Period | | | Annualized
Expense Ratio | |
| | | | | |
| | | | | | | | | | | | | | | | |
| | | | |
Sustainable Equity Fund (SEEFX), Actual | | | $1,000.00 | | | | $1,217.80 | | | | $4.15 | | | | 0.75% | |
| | | | |
Hypothetical (5% return before expenses) | | | $1,000.00 | | | | $1,021.33 | | | | $3.78 | | | | 0.75% | |
| | | | | |
| | | | | | | | | | | | | | | | |
| | | | |
Sustainable Bond Fund (SEBFX), Actual | | | $1,000.00 | | | | $1,067.80 | | | | $3.35 | | | | 0.65% | |
| | | | |
Hypothetical (5% return before expenses) | | | $1,000.00 | | | | $1,021.82 | | | | $3.28 | | | | 0.65% | |
Expenses are equal to annualized expense ratios indicated above (based on the most recent fiscal period of June 1, 2020, through November 30, 2020) multiplied by the average account value over the period, multiplied by 183/365 (to reflect the one-half year period).
| | | | | | | | | | |
| | | | | | |
| November 30, 2020 | | Annual Report | | | | | | | | 27 |
| | |
| Trustees and Officers | | (unaudited) |
| | | | | | | | |
| | | |
| Name, Address, and Age | | Position(s) Held with Trust and Number of Saturna Fund Portfolios Overseen | | Principal occupation(s) during past 5 years, including Directorships | | Other Directorships held by Trustee |
| |
Independent Trustees | | |
| | | | |
(photo omitted) | | Marina E. Adshade (53) 1300 N. State Street Bellingham WA 98225 | | Independent Trustee (since 2017);
Nine | | Professor of Economics, University of British Columbia, Vancouver and Simon Fraser University; Author | | None |
| | | | |
(photo omitted) | | Ronald H. Fielding, MA, MBA, CFA (71) 1300 N. State Street
Bellingham WA 98225 | | Independent Trustee
(since 2009);
Thirteen | | Director, ICI Mutual Insurance Company | | Amana Mutual Funds Trust |
| | | | |
(photo omitted) | | Gary A. Goldfogel, MD (62) 1300 N. State Street
Bellingham WA 98225 | | Chairman (since 2017); Independent Trustee (since 1995);
Nine | | Medical Examiner (pathologist) Owner, Avocet Environmental Testing (laboratory) | | None |
| | | | |
(photo omitted) | | Jim V. McKinney (59) 1300 N. State Street
Bellingham WA 98225 | | Independent Trustee (since 2017);
Nine | | Executive Director, Common Threads Northwest; President/CEO, Apple Mountain LLC, consulting and development; US Army Foreign Area Officer - Political/Military Advisor to US Army Central; Senior Defense Official, Defense Attaché, US Embassy Slovenia | | None |
| | | | |
(photo omitted) | | Sarah E.D. Rothenbuhler (52) 1300 N. State Street
Bellingham WA 98225 | | Independent Trustee (since 2017);
Nine | | CEO, Birch Equipment (industrial rentals and sales) | | None |
| | |
Interested Trustee | | |
| | | | |
(photo omitted) | | Jane K. Carten, MBA (45)
1300 N. State Street Bellingham WA 98225 | | President, Trustee (since 2017);
Nine | | President and Director, Saturna Capital Corporation Vice President and Director, Saturna Trust Company President, Saturna Brokerage Services | | None |
| | | | | |
| | | | | | | | |
| | | | | | | | | | |
| | | | | | |
| 28 | | | | | | | | November 30, 2020 | | Annual Report |
| | |
| Trustees and Officers (continued) | | (unaudited) |
| | | | | | | | |
| | | |
| Name, Address, and Age | | Position(s) Held with Trust and Number of Saturna Fund Portfolios Overseen | | Principal occupation(s) during past 5 years, including Directorships | | Other Directorships held by Trustee |
|
Officers Who Are Not Trustees |
| | | | |
(photo omitted) | | Bryce R. Fegley (45) 1300 N. State Street Bellingham, WA 98225 | | Vice President (since 2020);
N/A | | Portfolio Manager and Senior Investment Analyst, Saturna Capital | | N/A |
| | | | |
(photo omitted) | | Christopher R. Fankhauser (48) 1300 N. State Street Bellingham, WA 98225 | | Treasurer1 (since 2002);
N/A | | Chief Operations Officer, Saturna Capital Corporation Vice President and Chief Operations Officer, Saturna Brokerage Services Director, Vice President, and Chief Operations Officer, Saturna Trust Company | | N/A |
| | | | |
(photo omitted) | | Michael E. Lewis (59) 1300 N. State Street Bellingham, WA 98225 | | Chief Compliance Officer1 (since 2012);
N/A | | Chief Compliance Officer, Saturna Capital, Saturna Trust Company, and Affiliated Funds | | N/A |
| | | | |
(photo omitted) | | Jacob A. Stewart (40) 1300 N. State Street Bellingham, WA 98225 | | Anti-Money Laundering Officer1 (since 2015);
N/A | | Anti-Money Laundering Officer, Saturna Capital Corporation, Saturna Brokerage Services Chief Compliance Officer, Saturna Brokerage Services Bank Secrecy Act Officer, Saturna Trust Company | | N/A |
| | | | |
(photo omitted) | | Nicole Trudeau (41) 1300 N. State Street Bellingham WA 98225 | | Secretary1 (since 2018)
N/A | | Chief Legal Officer, Saturna Capital Corporation Former: Counsel, Simpson Thacher & Bartlett LLP; Partner, Stradley Ronon Stevens & Young, LLP; Partner, K&L Gates LLP | | N/A |
| | | �� | | |
| | | | | | | | |
Term of Office: each Trustee serves for the lifetime of the Trust or until they die, resign, are removed, or not re-elected by the shareowners. Each officer serves a one-year term subject to annual reappointment by the Trustees.
The Trust’s Statement of Additional Information, available without charge upon request by calling Saturna Capital at 1-800-728-8762 and on the Funds’ website, www.saturnasustainable.com, includes additional information about the Trustees.
On November 30, 2020, the trustees, officers, and their affiliates as a group owned 44.22% and 18.97% of the outstanding shares of Sustainable Equity and Sustainable Bond Funds, respectively.
During the year ended November 30, 2020, the Independent Trustees were each paid by the Trust: (1) $2,000 annual retainer plus $1,000 per board meeting attended (in person or by phone), plus reimbursement of travel expenses; (2) $250 for committee meetings; and (3) $250 per quarter for serving as chairman of the board or any committee.
Mrs. Carten is an Interested Trustee by reason of her positions with the Trust’s adviser (Saturna Capital Corporation) and underwriter (Saturna Brokerage Services), and is the primary manager of the Saturna Sustainable Equity Fund portfolio. She is paid by Saturna Capital a salary, plus a bonus for each month the Saturna Sustainable Equity Fund portfolio earns a 4 or 5 star rating from Morningstar (see www.saturna.com). The officers are paid by Saturna Capital and not the Trust. As of November 30, 2020, all Saturna Capital employees listed above as officers owned shares in one or more of the Saturna Investment Trust funds, with Mrs. Carten owning (directly or indirectly) over $1.3 million.
| 1 | Holds the same position with Amana Mutual Funds Trust |
| | | | | | | | | | |
| | | | | | |
| November 30, 2020 | | Annual Report | | | | | | | | 29 |
| | |
| Renewal of Investment Advisory Contract | | (unaudited) |
During their meeting of September 15, 2020, the Independent Trustees discussed the continuance of the Investment Advisory and Administrative Services Agreement (“Agreement”) between the Trust, on behalf of each Fund, and Saturna Capital. In considering the renewal of the Agreement, the Trustees discussed the nature, extent, and quality of the services provided by Saturna Capital to the Trust and each Fund. The Trustees considered Saturna Capital’s specific responsibilities in all aspects of day-to-day management of the Funds as well as the qualifications, experience and responsibilities of the Funds’ portfolio managers and other key personnel at Saturna Capital. The Trustees discussed Saturna Capital’s experience, ability, and commitment to quality service through performing internally such functions as shareowner servicing, administration, accounting, marketing, and distribution — all in addition to investment management.
The Trustees took into consideration Saturna Capital’s continued avoidance of significant operational and compliance problems, plus its investments in infrastructure, information management systems, personnel, training, and investor education materials, all designed to provide high quality investor services and meet investor needs. They recognized Saturna Capital’s efforts to recruit and retain qualified and experienced staff and improve the capital base on which Saturna Capital operates, which the Trustees believe is important to the long-term success of the Funds. They considered Saturna Capital’s focus on investors and its efforts to avoid potential conflicts of interest.
The Trustees considered the investment performance of each Fund. The Trustees considered each Fund’s average annual total returns relative to its benchmark for the one-, three- and five-year periods ended July 31, 2020, noting that the Sustainable Equity Fund outperformed its benchmark for all periods and the Sustainable Bond Fund underperformed its benchmark for these periods. The Trustees considered comparative performance information from Morningstar and Lipper, which provide independent analysis of mutual fund data and, among other things, rank mutual fund performance within categories comprised of similarly managed funds. The Trustees considered and discussed each Fund’s performance relative to the Fund’s Morningstar category for the one-, three- and five-year periods ended July 31, 2020, noting that the Sustainable Equity Fund had outperformed its Morningstar category average for all periods, and the Sustainable Bond Fund had outperformed its Morningstar category average for the one-year period and underperformed the category average for the three- and five-year periods. The Trustees also considered each Fund’s Morningstar performance ranking (one through five stars), and the Fund’s performance ranking relative to the Fund’s category selected by Lipper the one-, three- and five-year periods ended July 31, 2020. The Trustees also noted the high sustainability ratings assigned to the Funds by Morningstar.
The Trustees noted the generally risk-averse investment style of the Funds and other factors which can affect each Fund’s performance relative to its broader Morningstar category. The Trustees also noted certain differences between each Fund and the peer funds within its Morningstar category, including differences in investment strategies and asset size. The Trustees found that Saturna Capital continued to manage each Fund in a manner that is designed to be risk-averse and attractive to long-term investors. The Trustees discussed and considered the efforts of Saturna Capital to make additional resources available to assist in managing the Funds. The Trustees also considered Saturna Capital’s focus on improving investment performance without incurring materially higher levels of risk.
The Trustees also considered the performance and expenses of each Fund as compared to smaller group of funds with similar investment objectives and strategies, including socially responsible funds, and a range of asset sizes. The Trustees considered these comparative performance and expense data, along with the comparative data published by Morningstar and each Fund’s performance relative to its benchmark, to evaluate the Fund’s performance over near-term and medium-term time periods.
The Trustees also reviewed the fees and expenses of each Fund, including comparative data on fees and expenses published by Morningstar, and considered the components of the Fund’s operating expenses. The Trustees noted the steps that Saturna Capital has undertaken to maintain competitive levels of Fund operating expenses. They noted the significant sponsorship of the Funds by Saturna Capital evidenced, in part, by certain fees and expenses paid by Saturna Capital out of its own resources. The Trustees recognized Saturna Capital’s efforts help make the Funds more widely available and less expensive than would otherwise be the case without Saturna Capital’s efforts.
The Trustees recognized that each Fund remains relatively small and there have not been opportunities to consider economies of scale. The Trustees noted Saturna Capital’s commitment to continue operating the Funds and the costs undertaken by Saturna Capital.
The Trustees reviewed Saturna Capital’s financial information and discussed the issue of Saturna Capital’s profitability as related to management and administration of the Trust. They discussed the reasonableness of Saturna Capital’s profitability as part of their evaluation of whether each Fund’s advisory fees bear a reasonable relationship to the mix of services provided by Saturna Capital, including the nature, extent, and quality of such services.
The Trustees considered and compared the fees charged by Saturna Capital to other types of accounts, including non-mutual fund advisory clients. The Trustees noted the differences between the full range of services Saturna Capital provides to the Funds, including investment advisory and administrative services, transfer agency services, and other services, as compared to the investment advisory services provided to the other advisory accounts.
The Trustees considered potential benefits to Saturna Capital’s other business lines from acting as investment adviser to the Funds, but also recognized that Saturna Capital’s other business lines benefit the Funds. The Trustees considered whether there are other
| | | | | | | | | | |
| | | | | | |
| 30 | | | | | | | | November 30, 2020 | | Annual Report |
| | |
| Renewal of Investment Advisory Contract (continued) | | |
potential benefits to Saturna Capital in continuing to manage the Funds and the Trustees found that there were no material benefits other than Saturna Capital’s receipt of advisory fees. The Trustees also noted with respect to the Sustainable Equity Fund that Saturna Brokerage Services voluntarily waives brokerage commissions for executing Fund portfolio transactions, resulting in lower transaction costs.
The Trustees concluded based on their business judgement that the fees paid by each Fund to Saturna Capital were, from an arm’slength bargaining perspective, reasonable and in the best interest of the Fund and its shareowners in light of the services provided, comparative performance, expense and advisory fee information, costs of services provided, profits to be realized, and benefits derived or to be derived by Saturna Capital from its relationship with the Fund. Following this discussion, the Trustees, including the Independent Trustees, unanimously agreed to renew each Fund’s Agreement with Saturna Capital.
| | | | | | | | | | |
| | | | | | |
| November 30, 2020 | | Annual Report | | | | | | | | 31 |
Availability of Portfolio Information
| (1) | The Saturna Sustainable Funds file complete schedules of portfolio holdings with the SEC for the first and third quarters of each fiscal year as an exhibit to its reports on Form N-PORT. Previously, this information was filed on Form N-Q. |
| (2) | The Funds’ Form N-PORT reports are available on the SEC’s website at www.sec.gov and at www.saturnasustainable.com. |
| (3) | The Funds make a complete schedule of portfolio holdings after the end of each month available to investors at www.saturnasustainable.com. |
Availability of Proxy Voting Information
| (1) | A description of the policies and procedures that the Funds use to determine how to vote proxies relating to portfolio securities is available (a) without charge, upon request, by calling Saturna Capital at 1-800-728-8762; (b) on the Funds’ website at www.saturnasustainable.com; and (c) on the SEC’s website at www. sec.gov. |
| (2) | Information regarding how each Fund voted proxies relating to portfolio securities during the most recent 12-month period ended June 30 is available (a) without charge, upon request, by calling Saturna Capital at 1-800-728-8762; (b) on the Funds’ website at www.saturnasustainable.com; and (c) on the SEC’s website at www.sec.gov. |
Statement Regarding Liquidity Risk Management Program
The Securities and Exchange Commission adopted Rule 22e-4 under the Investment Company Act of 1940, as amended (the “Liquidity Rule”) to promote effective liquidity risk management throughout the open-end investment company industry, thereby reducing the risk that funds will be unable to meet their redemption obligations and mitigating dilution of the interests of fund shareholders.
Pursuant to the Liquidity Rule, the Trust, on behalf of the Funds, has adopted a liquidity risk management program (the “Program”) to govern the Trust’s approach to managing liquidity risk. The Program is overseen by Saturna Capital’s Liquidity Risk Committee, and the Program’s principal objectives include assessing, managing and periodically reviewing each Fund’s liquidity risk, based on factors specific to the circumstances of the Fund.
At a meeting of the Board held on December 17, 2019, the Trustees received a report addressing the operation of the Program and assessing its adequacy and effectiveness of implementation. It was reported to the Board that the assessment found that the Program was adequately designed and effective in achieving its objectives. Further, that review of the Program’s implementation evidenced substantial compliance with relevant policies and procedures.
| | | | | | | | | | |
| | | | | | |
| 32 | | | | | | | | November 30, 2020 | | Annual Report |
Householding Policy
To reduce expenses, we may mail only one copy of the Funds’ prospectus, each annual and semi-annual report, and proxy statements when necessary, to those addresses shared by two or more accounts. If you wish to receive individual and/or more copies of these documents, please call us at 1-800-728-8762 or write to us at Saturna Capital/Saturna Sustainable Funds, P.O. Box N, Bellingham, WA 98227. We will begin sending you individual copies 30 days after receiving your request.
If you are currently receiving multiple copies and wish to receive only one copy, please call us at 1-800-728-8762 or write to us at Saturna Capital/Saturna Sustainable Funds, P.O. Box N, Bellingham, WA 98227. We will begin sending you a single copy with subsequent report mailings.
Privacy Statement
At Saturna Capital and Saturna Investment Trust, we understand the importance of maintaining the privacy of your financial information. We want to assure you that we protect the confidentiality of any personal information that you share with us. In addition, we do not sell information about our current or former customers.
In the course of our relationship, we gather certain nonpublic information about you, including your name, address, investment choices, and account information. We do not disclose your information to unaffiliated third parties unless it is necessary to process a transaction; service your account; deliver your account statements, shareowner reports and other information; or as required by law. When we disclose information to unaffiliated third parties, we require a contract to restrict the companies’ use of customer information and from sharing or using it for any purposes other than performing the services for which they were required.
We may share information within the Saturna Capital family of companies in the course of informing you about products or services that may address your investing needs.
We maintain our own technology resources to minimize the need for any third party services, and restrict access to information within Saturna. We maintain physical, electronic, and procedural safeguards to guard your personal information. If you have any questions or concerns about the security or privacy of your information, please call us at 1-800-728-8762.
| | | | | | | | | | |
| | | | | | |
| November 30, 2020 | | Annual Report | | | | | | | | 33 |
| | |
| Performance Summary (as of December 31, 2020) | | (unaudited) |
| | | | | | | | | | | | | | | | | | | | | | | | |
Average Annual Returns (before any taxes paid by shareowners) | |
| | | | | | |
| | | 1 Year | | | | 3 Year | | | | 5 Year | | | | 10 Year | | | | 15 Year | | | | Expense Ratio | |
| | | | | | |
Idaho Tax-Exempt Fund | | | 3.68% | | | | 3.53% | | | | 2.76% | | | | 3.23% | | | | 3.37% | | | | 0.69% | 1 |
| | | | | | | |
S&P Idaho Municipal Bond Index | | | 4.72% | | | | 4.29% | | | | 3.77% | | | | 4.97% | | | | 4.68% | | | | n/a | |
| | | | | | | |
“Muni Single State Intermediate” Category Average2 | | | 3.92% | | | | 3.43% | | | | 2.72% | | | | 3.44% | | | | 3.43% | | | | 0.94% | |
Performance data quoted in this report represents past performance, is before any taxes payable by shareowners, and is no guarantee of future results. Current performance may be higher or lower than that stated herein. Performance current to the most recent month-end is available by calling toll-free 1-800-728-8762 or visiting www.idahotaxexemptfund.com. Average annual total returns are historical and include change in share value as well as reinvestment of dividends and capital gains, if any. The investment return and principal value of an investment will fluctuate so that an investor’s shares, when redeemed, may be worth more or less than their original cost.
Please consider an investment’s objectives, risks, charges, and expenses carefully before investing. To obtain this and other important information about the Idaho Tax-Exempt Fund in a prospectus or summary prospectus, ask your financial adviser, visit www.idahotaxexemptfund.com, or call toll-free 1-800-728-8762. Please read the prospectus or summary prospectus carefully before investing.
A note about risk: See Notes to Financial Statements for a discussion of investment risks. For a more detailed discussion of the risks associated with the Fund, please see the Fund’s prospectus or summary prospectus.
| 1 | By regulation, the expense ratio shown in this table is as stated in the Fund’s most recent prospectus, which is dated March 27, 2020, and incorporates results for the fiscal year ended November 30, 2019. The ratio presented in this table differs from expense ratios shown elsewhere in this report as they represent different fiscal periods. |
| 2 | Source: Morningstar December 31, 2020. Morningstar, Inc. is an independent fund performance monitor. Category returns are determined monthly from total returns by Morningstar, by category as determined by Morningstar. Category average expense ratios are determined by Morningstar from prospectus level data reported by funds in the category. |
On the cover: Boise, Idaho, USA downtown cityscape at twilight.
| | | | | | | | | | |
| | | | | | |
| 2 | | | | | | | | November 30, 2020 | | Annual Report |

| | |
| | (unaudited) |
Fellow Share owners: | | January 25, 2021 |
2020 was a year defined by change, challenge, and uncertainty. However, Idaho Tax-Exempt Fund has continued to perform well due to conservative financial management and a growing economy. Idaho maintained strong reserves, good employment, and a balanced budget while many other states faced financial hardship.
According to the Tax Foundation, the state of Idaho’s revenue growth was number one in the nation, rising 8.2% from fiscal year 2019 to fiscal year 2020 even while revenue in neighboring Wyoming fell 6.7%.1 This growth allowed Idaho to end the year with a $600 million budget surplus, avoiding the massive shortfalls seen elsewhere. The governor’s proposed budget for the next fiscal year continues to be very conservative, while restoring funding to K-12 and higher education. Surplus funds may be used to provide tax relief for families and small businesses.2 Adding to the state’s fiscal flexibility, the rainy-day fund (a pool of money that states set aside for emergency use or savings) is the highest it has been since its creation in 1984.3 Idaho’s willingness to maintain a balanced budget and take swift action to maintain that balance will drive good performance into the future.
The state of Idaho’s GDP reached $85.79 billion by the end of the third quarter, ranking number four in the nation for growth in the first three quarters of 2020. The GDP rose a staggering 43.3% in the third quarter alone, recovering almost completely to pre-pandemic levels. The economic base of the state has diversified over the past decade by adding jobs in construction, technology, tourism, and health care. Employment continued good performance relative to the nation as a whole. In November, Idaho’s unemployment rate of 4.8% was significantly lower than the national rate at 6.7%.4
None of the municipal debt that went into distress or default this year was in the state of Idaho, despite the amount of such debt increasing 109% from 2019 – 2020 to $6.6 billion. However, we are vigilant for the potential impacts on credit due to the coronavirus or a slow vaccine rollout. Uncertainty also remains as to the scope and details of any further stimulus or aid from the federal government for state and local governments. We could expect to see some additional revenue volatility as income and sales taxes are economically sensitive. The Fund continues to hold positions in strong issuers with solid liquidity able to withstand such volatility.
The challenges faced due to the COVID-19 crisis highlight the merits of conservative fiscal management. The Fund continues to offer discriminating investors the opportunity to invest in high quality tax-exempt securities in an exceptionally creditworthy state. Looking forward to the next fiscal year, we believe Idaho will have additional flexibility to weather the ongoing pandemic with strong reserves and a strong economy.
Respectfully,
(photo omitted)
Jane Carten MBA,
President
(photo omitted)
Elizabeth Alm CFA®,
Portfolio Manager
| 1 | Walczak, Jared. New Census Data Shows States Beat Revenue Expectations in FY 2020. Tax Foundation, September 18, 2020. https://taxfoundation.org/state-tax-revenues-beat-expecations-fy-2020/ |
| 2 | Masters, John. Gov. Little unveils state budget, calls for more spending on education, transportation and health care. KTVB7, January 11, 2021. https://www.ktvb.com/ article/news/local/capitol-watch/idaho-governor-brad-little-budget-recommendations/277-f650924d-5b76-430a-8d44-46dcd10ef20c |
| 3 | McPeek, Kristin. Idaho’s rainy day funds at $600 million: “It’s the most we’ve had since its creation.” Idaho News. November 23, 2020. https://idahonews.com/news/local/ idahos-rainy-day-funds-at-600-million-its-the-most-weve-had-since-its-creation |
| 4 | U.S. Bureau of Labor Statistics. January 14, 2021. https://www.bls.gov/eag/eag.us.htm |
| | | | | | | | | | |
| | | | | | |
| Annual Report | | November 30, 2020 | | | | | | | | 3 |
| | |
Performance Summary | | (unaudited) |
Average Annual Returns (as of November 30, 2020)
| | | | | | | | | | | | | | | | |
| | | | | |
| | | 1 Year | | | 5 Year | | | 10 Year | | | Expense Ratio1 | |
| | | | |
Idaho Tax-Exempt Fund | | | 3.67% | | | | 2.85% | | | | 3.05% | | | | 0.69% | |
| | | | |
S&P Idaho Municipal Bond Index | | | 4.52% | | | | 3.81% | | | | 4.74% | | | | n/a | |
Growth of $10,000
| | |
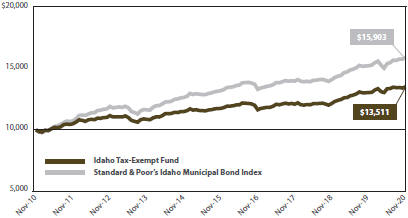 | | Comparison of any mutual fund to a market index must be made bearing in mind that the Index is unmanaged and expense-free. Conversely, the fund will (1) be actively managed; (2) have an objective other than mirroring the index, such as limiting risk; (3) bear transaction and other costs; (4) stand ready to buy and sell its securities to shareowners on a daily basis; and (5) provide a wide range of services. The graph compares $10,000 invested in the Fund on November 30, 2010, to an identical amount invested in the Standard & Poor’s Idaho Municipal Bond Index, a broad-based index of Idaho municipal bond prices. The graph shows that an investment in the Fund would have risen to $13,511 versus $15,903 in the S&P Idaho Municipal Bond Index. |
Past performance does not guarantee future results. The “Growth of $10,000” graph and “Average Annual Returns” performance table assume the reinvestment of dividends and capital gains. They do not reflect the deduction of taxes that a shareowner might pay on fund distributions or the redemption of fund shares.
| 1 | By regulation, the expense ratio for the Fund shown in this table is as stated in the Fund’s most recent prospectus, which is dated March 27, 2020, and incorporates results for the fiscal year ended November 30, 2019. The ratio presented in this table differs from expense ratios shown elsewhere in this report as they represent different fiscal periods. |
Fund Objective
Idaho Tax-Exempt Fund seeks to provide income free from federal income, federal alternative minimum, and Idaho state income taxes. Preservation of capital is a secondary objective.
| | | | | | | | | | |
Portfolio Diversification | |
| | | |
| | % of Total Net Assets | | | | | |
| | | |
∎ | | General Obligation | | | 45.6% | | | | 
| |
∎ | | State Education | | | 17.3% | |
∎ | | Real Estate | | | 9.3% | |
∎ | | Financial Services | | | 4.6% | |
∎ | | Water Supply | | | 3.5% | |
∎ | | Government Bonds | | | 3.1% | |
∎ | | Pollution Control | | | 2.2% | |
∎ | | Medical – Hospitals | | | 2.2% | |
∎ | | Health Care Facilities | | | 2.1% | |
| | | |
∎ | | Transportation | | | 1.4% | | | | | |
| | | |
∎ | | Other assets (net of liabilities) | | | 8.7% | | | | | |
| | | | |
Top 10 Holdings | | | | |
| |
| % of Total Net Assets | |
| |
Teton Co, ID SCD #401 Driggs (4.00% due 09/15/2035) | | | 4.0% | |
| |
University of Idaho Revenue (5.00% due 04/01/2032) | | | 3.2% | |
| |
Canyon Co ID SCD #134 Middleton (4.00% due 09/15/2028) | | | 3.1% | |
| |
Idaho Bond Bank (4.00% due 09/15/2032) | | | 3.0% | |
| |
Idaho State Building Authority (5.00% due 09/01/2032) | | | 2.9% | |
| |
Nez Perce CO ISD #1 Lewiston (5.00% due 09/15/2029) | | | 2.8% | |
| |
Idaho Fish Wildlife Foundation Rev (5.00% due 12/01/2033) | | | 2.7% | |
| |
Ada & Canyon Cos ID JSD #2 Meridian (5.00% due 08/15/2032) | | | 2.6% | |
| |
Twin Falls Co ID SCD #411 (4.25% due 09/15/2030) | | | 2.3% | |
| |
Cariboo Franklin Bannock JSD #148 (3.25% due 09/15/2035) | | | 2.2% | |
| | | | | | |
|
| | | |
| 4 | | | | November 30, 2020 | | Annual Report |
| | |
Discussion of Fund Performance | | (unaudited) |
For the 12 months ended November 30, 2020, Idaho Tax-Exempt Fund returned 3.67%, which was 0.85% below the S&P Idaho Municipal Index which returned 4.52%. For the five years ended November 30, 2020, the Fund provided an annualized total return of 2.85%, compared to the 3.81% annualized return for the index. The Fund’s net operating expense ratio was 0.67%. For the year, the Fund’s net assets rose 11% to $14.99 million. The Fund’s net asset value per share rose from $5.55 to $5.65.
Factors Affecting Past Performance
2020 was a year of extraordinary change and challenge. Volatility hit the markets in the first part of the year with the spread of COVID-19 including a massive shift in the Treasury curve, and both a severe widening then tightening of corporate and municipal spreads. At the end of March, spreads of corporate bonds hit their widest levels since the 2008 financial crisis and the uncertainty driven by COVID-19 required intervention by the Federal Reserve. Since that time, spreads have tightened significantly as the result of several factors. The Fed has provided a great deal of support to the market in the form of cutting interest rates to 0%-0.25%, providing liquidity to money market funds, and importantly, purchasing bonds in the secondary market.
The fiscal year ended with the Bloomberg Valuation Muni AAA Yield Curve shifting significantly downward from last year. The Bond Buyer US Weekly Yields on 20 General Obligation Bond—used as a gauge for municipal bond yields—hit its 50-year low on November 26, 2020. As the result of very low borrowing costs, total municipal issuance increased by 14% from 2019 to 2020. Higher-grade securities performed better, with the Barclays AAA Muni Index returning 5.5% versus the BBB Index which returned 3.3%, a stark reversal from last year where BBB bonds were the best performers. The Fund held 32.9% in “AAA” rated bonds at fiscal year-end, which were the top-performing rating category, providing around a 6% return to the portfolio, versus “A” rated bonds which returned closer to 4%.
Despite the low yields, risk remained present in the market. Bonds backed by convention center revenue, hotel revenue, senior living, and airport debt saw yields rise. Credit downgrades and defaults rose significantly. Through the year the Fund engaged in defensive positioning, including ending the year with 8.7% in cash. This cash holding contributed to the performance differential relative to the benchmark but will also allow the Fund to exploit forthcoming opportunities.
Looking Forward
Municipal credit quality will be a major focus in coming months as record-low yields continue to belie the underlying credit risks in the market. There is no shortage of possible events that could upset the current stability. In the immediate future we face uncertainties in vaccine rollout timing, further government stimulus, and the economic implications of state and local budget deficits. In the longer-term, we also have to consider the potential for inflation. With the Fed’s announcement that it will target an average inflation rate of 2% and in so doing allow for inflation to run “moderately above 2% for some time,” we will continue to consider the implications of this policy shift. We will view municipal credit with increased scrutiny due to the heightened risk of downgrades and unprecedented economic challenges that lie before us. As the crisis unfolded, we focused on credit research and surveillance, paying special attention to financial liquidity and flexibility. Our goal has always been to choose good investments and invest through cycles. Our robust security selection process which emphasizes governance, resiliency, and revenue diversity is constantly evolving with the unfolding events. We are continuously searching for new opportunities that will contribute to the Fund’s mandate of current tax-exempt income and capital preservation.
For those seeking a conservative investment vehicle, the Idaho Tax-Exempt Fund offers a portfolio of high-grade issues intended to provide income exempt from federal income, federal alternative minimum, and Idaho state income taxes. The Fund may purchase carefully vetted, nonrated Idaho bonds.
Idaho Tax-Exempt Fund chooses not to invest in US territories such as Puerto Rico, Guam, and the US Virgin Islands to boost income at the expense of creditworthiness. The Fund does not employ derivatives or other financial engineering tools to modify risk and return.
Bond Buyer US Weekly Yields 20 General Obligation Bond
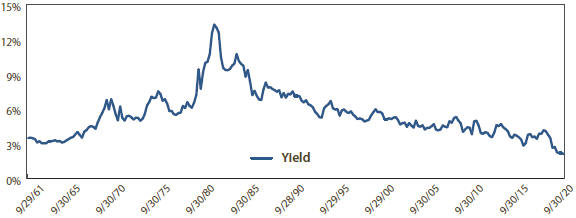
| | | | | | | | | | |
| | | | | | |
| Annual Report | | November 30, 2020 | | | | | | | | 5 |
| | |
Schedule of Investments | | As of November 30, 2020 |
| | | | | | | | | | | | | | | | | | |
| | | | | | | |
| | | Tax-Exempt Municipal Bonds – 91.3% | | | | Coupon / Maturity | | Face Amount | | | Market Value | | | Percentage of Net Assets | |
| | | | | | |
| | | Financial Services | | | | | | | | | | | | | |
| | | | | | | |
| | | Idaho Bond Bank | | | | 4.00% due 09/15/2032 | | | $405,000 | | | | $443,305 | | | | 3.0% | |
| | | | | | | |
| | | Idaho Housing & Finance Rev | | | | 3.00% due 07/01/2036 | | | 235,000 | | | | 238,553 | | | | 1.6% | |
| | | | | | | |
| | | | | | | | | | | | | 681,858 | | | | 4.6% | |
| | | | | | |
| | | General Obligation | | | | | | | | | | | | | |
| | | | | | | |
| | | Ada & Canyon Cos ID JSD #2 Meridian | | | | 5.00% due 08/15/2032 | | | 325,000 | | | | 390,809 | | | | 2.6% | |
| | | | | | | |
| | | Ada & Canyon Cos ID JSD #3 Kuna | | | | 4.00% due 09/15/2027 | | | 100,000 | | | | 122,749 | | | | 0.8% | |
| | | | | | | |
| | | Boise City ID Independent SD | | | | 3.00% due 08/01/2038 | | | 100,000 | | | | 104,559 | | | | 0.7% | |
| | | | | | | |
| | | Bonneville & Bingham Cos JSD #93 | | | | 5.00% due 09/15/2029 | | | 250,000 | | | | 269,895 | | | | 1.8% | |
| | | | | | | |
| | | Bonneville & Bingham Cos JSD #93 | | | | 5.00% due 09/15/2031 | | | 200,000 | | | | 215,692 | | | | 1.4% | |
| | | | | | | |
| | | Bonneville Co ID SCD #91 | | | | 4.00% due 09/15/2026 | | | 15,000 | | | | 15,990 | | | | 0.1% | |
| | | | | | | |
| | | Bonneville Co ID SCD #91 | | | | 4.00% due 09/15/2026 | | | 35,000 | | | | 37,272 | | | | 0.3% | |
| | | | | | | |
| | | Bonneville Co ID SCD #91 | | | | 3.75% due 09/15/2032 | | | 285,000 | | | | 302,924 | | | | 2.0% | |
| | | | | | | |
| | | Boundary County ID SCD #101 | | | | 4.00% due 08/15/2021 | | | 240,000 | | | | 241,862 | | | | 1.6% | |
| | | | | | | |
| | | Canyon Co ID SCD #134 Middleton | | | | 4.00% due 09/15/2028 | | | 400,000 | | | | 460,916 | | | | 3.1% | |
| | | | | | | |
| | | Canyon Co ID SCD #135 Notus | | | | 3.25% due 09/15/2031 | | | 290,000 | | | | 319,989 | | | | 2.1% | |
| | | | | | | |
| | | Canyon Co ID SCD #135 Notus | | | | 3.25% due 09/15/2032 | | | 170,000 | | | | 186,466 | | | | 1.2% | |
| | | | | | | |
| | | Canyon Co ID SCD #139 Vallivue | | | | 5.00% due 09/15/2024 | | | 260,000 | | | | 281,713 | | | | 1.9% | |
| | | | | | | |
| | | Caribou Franklin Bannock JSD #148 | | | | 3.25% due 09/15/2035 | | | 300,000 | | | | 336,558 | | | | 2.2% | |
| | | | | | | |
| | | Cassia Oneida Twin Falls JSD #151 | | | | 3.375% due 09/15/2034 | | | 160,000 | | | | 170,984 | | | | 1.1% | |
| | | | | | | |
| | | College of Western ID Annual Approp | | | | 4.00% due 10/01/2027 | | | 125,000 | | | | 151,985 | | | | 1.0% | |
| | | | | | | |
| | | Kootenai Co ID SCD # 271 UNREF | | | | 4.00% due 09/15/2025 | | | 125,000 | | | | 133,243 | | | | 0.9% | |
| | | | | | | |
| | | Kootenai Co ID SCD #271 PREREF | | | | 4.00% due 09/15/2025 | | | 40,000 | | | | 42,604 | | | | 0.3% | |
| | | | | | | |
| | | Kootenai Co ID SCD #273 | | | | 4.00% due 08/15/2031 | | | 265,000 | | | | 300,722 | | | | 2.0% | |
| | | | | | | |
| | | Kootenai-Shoshone ID Area Libraries | | | | 4.25% due 08/01/2021 | | | 220,000 | | | | 221,474 | | | | 1.5% | |
| | | | | | | |
| | | Latah Co ID SCD #281 Moscow Ser B | | | | 4.00% due 08/15/2027 | | | 100,000 | | | | 108,828 | | | | 0.8% | |
| | | | | | | |
| | | Latah Co ID SCD #281 Moscow Ser B | | | | 4.00% due 08/15/2028 | | | 200,000 | | | | 216,878 | | | | 1.4% | |
| | | | | | | |
| | | Madison Co. Id. SDC #321 | | | | 5.00% due 09/15/2035 | | | 250,000 | | | | 313,703 | | | | 2.1% | |
| | | | | | | |
| | | Owyhee & Canyon Co. # 363 Marsing | | | | 4.00% due 09/15/2035 | | | 150,000 | | | | 174,701 | | | | 1.2% | |
| | | | | | | |
| | | Teton Co, ID SCD #401 Driggs | | | | 4.00% due 09/15/2035 | | | 500,000 | | | | 593,795 | | | | 4.0% | |
| | | | | | | |
| | | Twin Falls Co ID SCD #411 Series A | | | | 4.00% due 09/15/2027 | | | 170,000 | | | | 193,662 | | | | 1.3% | |
| | | | | | | |
| | | Twin Falls Co ID SCD #411 Series A | | | | 4.25% due 09/15/2030 | | | 300,000 | | | | 344,577 | | | | 2.3% | |
| | | | | | | |
| | | Twin Falls Co ID SCD #411 Series A | | | | 4.25% due 09/15/2031 | | | 100,000 | | | | 114,859 | | | | 0.8% | |
| | | | | | | |
| | | Twin Falls Co ID SCD #411 Series B | | | | 4.75% due 09/15/2039 | | | 200,000 | | | | 233,480 | | | | 1.6% | |
| | | | | | | |
| | | Valley & Adams Cos ID JSD #421 | | | | 3.00% due 08/01/2026 | | | 220,000 | | | | 229,563 | | | | 1.5% | |
| | | | | | | |
| | | | | | | | | | | | | 6,832,452 | | | | 45.6% | |
| | | | | | |
| | | Government Bonds | | | | | | | | | | | | | |
| | | | | | | |
| | | Idaho St Bldg Auth Health & Welfare | | | | 5.00% due 09/01/2043 | | | 25,000 | | | | 31,301 | | | | 0.2% | |
| | | | | | | |
| | | Idaho St Health Facs Auth | | | | 4.00% due 09/01/2045 | | | 265,000 | | | | 309,785 | | | | 2.1% | |
| | | | | | | |
| | | Idaho St Hsg & Fin Assn | | | | 5.00% due 07/15/2037 | | | 100,000 | | | | 127,059 | | | | 0.8% | |
| | | | | | | |
| | | | | | | | | | | | | 468,145 | | | | 3.1% | |
| | | | | | |
| | | Health Care Facilities | | | | | | | | | | | | | |
| | | | | | | |
| | | Idaho Health Faci Auth Hos Rev | | | | 5.00% due 12/01/2047 | | | 260,000 | | | | 313,292 | | | | 2.1% | |
| | | | | | | |
| | | | | | | | | | | | | 313,292 | | | | 2.1% | |
| | | | | | |
| | | Medical/Hospitals | | | | | | | | | | | | | |
| | | | | | | |
| | | Idaho Health Rev Trinity Health Grp | | | | 3.25% due 12/01/2028 | | | 300,000 | | | | 323,211 | | | | 2.2% | |
| | | | | | | |
| | | | | | | | | | | | | 323,211 | | | | 2.2% | |
Continued on next page.
| | | | | | | | | | | | |
| | | | | | | |
| 6 | | | | | | | | November 30, 2020 | | Annual Report | | The accompanying notes are an integral part of these financial statements. |
| | | | | | | | | | | | | | | | | | |
| | Schedule of Investments | | | | | | | | | | | | | | | As of November 30, 2020 | |
| | | | | | | |
| | | Tax-Exempt Municipal Bonds – 91.3% | | | | Coupon / Maturity | | Face Amount | | | Market Value | | | Percentage of Net Assets | |
| | | | | | |
| | | Pollution Control | | | | | | | | | | | | | |
| | | | | | | |
| | | Idaho Bond Bank Authority | | | | 4.30% due 09/01/2022 | | | $20,000 | | | | $20,065 | | | | 0.1% | |
| | | | | | | |
| | | Idaho Bond Bank Authority | | | | 4.00% due 09/15/2032 | | | 130,000 | | | | 154,688 | | | | 1.0% | |
| | | | | | | |
| | | Idaho Bond Bank Authority | | | | 4.00% due 09/15/2033 | | | 135,000 | | | | 160,010 | | | | 1.1% | |
| | | | | | | |
| | | | | | | | | | | | | 334,763 | | | | 2.2% | |
| | | | | | |
| | | Real Estate | | | | | | | | | | | | | |
| | | | | | | |
| | | Idaho Fish & Wildlife Foundation Rev | | | | 5.00% due 12/01/2033 | | | 320,000 | | | | 407,325 | | | | 2.7% | |
| | | | | | | |
| | | Idaho Fish & Wildlife Foundation Rev | | | | 4.00% due 12/01/2036 | | | 200,000 | | | | 242,870 | | | | 1.6% | |
| | | | | | | |
| | | Idaho State Building Authority | | | | 5.00% due 09/01/2031 | | | 200,000 | | | | 216,772 | | | | 1.5% | |
| | | | | | | |
| | | Idaho State Building Authority | | | | 5.00% due 09/01/2032 | | | 400,000 | | | | 433,544 | | | | 2.9% | |
| | | | | | | |
| | | Post Falls ID LID SPA | | | | 5.00% due 05/01/2021 | | | 90,000 | | | | 90,354 | | | | 0.6% | |
| | | | | | | |
| | | | | | | | | | | | | 1,390,865 | | | | 9.3% | |
| | | | | | |
| | | State Education | | | | | | | | | | | | | |
| | | | | | | |
| | | Boise State University ID Revenue | | | | 5.00% due 04/01/2028 | | | 125,000 | | | | 146,566 | | | | 0.9% | |
| | | | | | | |
| | | Boise State University ID Revenue | | | | 5.00% due 04/01/2032 | | | 160,000 | | | | 190,360 | | | | 1.3% | |
| | | | | | | |
| | | Idaho State University Revenue | | | | 4.00% due 04/01/2027 | | | 170,000 | | | | 195,704 | | | | 1.3% | |
| | | | | | | |
| | | Idaho State University Revenue | | | | 4.00% due 04/01/2030 | | | 245,000 | | | | 277,830 | | | | 1.9% | |
| | | | | | | |
| | | Idaho State University Revenue | | | | 3.00% due 04/01/2031 | | | 250,000 | | | | 266,113 | | | | 1.8% | |
| | | | | | | |
| | | Idaho State University Revenue | | | | 3.00% due 04/01/2032 | | | 160,000 | | | | 169,688 | | | | 1.1% | |
| | | | | | | |
| | | Jefferson & Madison Cos. ID SCD#251 | | | | 5.00% due 09/15/2028 | | | 100,000 | | | | 132,402 | | | | 0.8% | |
| | | | | | | |
| | | Nez Perce CO ISD #1 Lewiston | | | | 5.00% due 09/15/2029 | | | 330,000 | | | | 416,417 | | | | 2.8% | |
| | | | | | | |
| | | North Idaho College Dormitory Rev | | | | 4.00% due 11/01/2030 | | | 285,000 | | | | 323,099 | | | | 2.2% | |
| | | | | | | |
| | | University of Idaho Revenue | | | | 5.00% due 04/01/2032 | | | 455,000 | | | | 478,287 | | | | 3.2% | |
| | | | | | | |
| | | | | | | | | | | | | 2,596,466 | | | | 17.3% | |
| | | | | | |
| | | Transportation | | | | | | | | | | | | | |
| | | | | | | |
| | | Boise ID Airport Park Fac Rev | | | | 3.00% due 09/01/2028 | | | 210,000 | | | | 212,518 | | | | 1.4% | |
| | | | | | | |
| | | | | | | | | | | | | 212,518 | | | | 1.4% | |
| | | | | | |
| | | Water Supply | | | | | | | | | | | | | |
| | | | | | | |
| | | Payette Lakes Rec Wtr & Swr Rev | | | | 4.00% due 08/01/2032 | | | 195,000 | | | | 225,432 | | | | 1.5% | |
| | | | | | | |
| | | Payette Lakes Rec Wtr & Swr Rev | | | | 4.00% due 08/01/2034 | | | 255,000 | | | | 293,209 | | | | 2.0% | |
| | | | | | | |
| | | | | | | | | | | | | 518,641 | | | | 3.5% | |
| | | | | | |
| | | | | | | | | | | | | | | | | | | |
| | | | | | |
| | Total investments | | | | (Cost $12,804,602) | | | | | | | $13,672,211 | | | | 91.3% | |
| | | | | | |
| | Other assets (net of liabilities) | | | | | | | | | | | 1,307,610 | | | | 8.7% | |
| | | | | | |
| | Total net assets | | | | | | | | | | | $14,979,821 | | | | 100.0% | |
| | | | | | | |
| | | | | | | | | | | | | | | | | | |
| | | | | | | | | | | | |
| | | | Bond Quality Diversification | | | | | | | (unaudited) | |
| | | |
| | | | % of Total Net Assets | | | | | |
| | | |
| ∎ | | | | Rated “AAA” | | | 33.2% | | | | 
| |
| ∎ | | | | Rated “AA+” | | | 19.9% | |
| ∎ | | | | Rated “AA” | | | 4.6% | |
| ∎ | | | | Rated “AA-” | | | 10.8% | |
| ∎ | | | | Rated “A+” | | | 11.7% | |
| ∎ | | | | Rated “A” | | | 8.0% | |
| ∎ | | | | Not rated | | | 3.1% | |
| ∎ | | | | Other assets (net of liabilities) | | | 8.7% | |
| | | | | | |
|
| Credit ratings are the lesser of S&P Global Ratings or Moody’s Investors Service. If neither S&P nor Moody’s rate a particular security, that security is categorized as not rated (except for US Treasury securities and securities issued or backed by US agencies which inherit the credit rating for the US government). Ratings range from AAA (highest) to D (lowest). Bonds rated BBB or above are considered investment grade. Credit ratings BB and below are lower-rated securities (junk bonds). Ratings apply to the creditworthiness of the issuers of the underlying securities and not the Fund or its shares. Ratings may be subject to change. |
| | | | | | | | | | | | |
| | | | | | | |
| The accompanying notes are an integral part of these financial statements. | | Annual Report | | November 30, 2020 | | | | | | | | 7 |
Statement of Assets and Liabilities
| | | | |
| As of November 30, 2020 | |
| | |
| | | | |
| |
Assets | | | | |
| |
Investments in securities, at value
(Cost $12,804,602) | | | $13,672,211 | |
| |
Cash | | | 1,200,538 | |
| |
Interest receivable | | | 129,496 | |
| |
Other assets | | | 801 | |
| |
Prepaid expenses | | | 498 | |
| | | | |
| |
Total assets | | | 15,003,544 | |
| | | | |
| |
Liabilities | | | | |
| |
Accrued advisory fees | | | 6,141 | |
| |
Accrued audit expenses | | | 5,967 | |
| |
Distributions payable | | | 3,630 | |
| |
Payable for Fund shares redeemed | | | 3,081 | |
| |
Accrued trustee expenses | | | 1,965 | |
| |
Accrued Chief Compliance Officer expenses | | | 1,192 | |
| |
Accrued printing & postage fees | | | 950 | |
| |
Accrued other operating expenses | | | 692 | |
| |
Accrued retirement plan custody fee | | | 105 | |
| | | | |
| |
Total liabilities | | | 23,723 | |
| | | | |
| |
Net assets | | | $14,979,821 | |
| | |
| | | | |
| | |
Analysis of net assets | | | | |
| |
Paid-in capital (unlimited shares authorized, without par value) | | | $14,196,310 | |
| |
Total distributable earnings | | | 783,511 | |
| | | | |
| |
Net assets applicable to Fund shares outstanding | | | $14,979,821 | |
| | |
| | | | |
Fund shares outstanding | | | 2,651,129 | |
| | |
Net asset value, offering and redemption price per share | | | $5.65 | |
| | | | | |
Statement of Operations
| | | | |
| Year ended November 30, 2020 | |
| | |
| | | | |
| |
Investment income | | | | |
| |
Interest income | | | $361,753 | |
| | | | |
| |
Total investment income | | | 361,753 | |
| | | | |
| |
Expenses | | | | |
| |
Investment advisory fees | | | 71,556 | |
| |
Audit fees | | | 10,443 | |
| |
Trustee fees | | | 4,581 | |
| |
Chief Compliance Officer expenses | | | 3,931 | |
| |
Legal fees | | | 3,870 | |
| |
Printing and postage expenses | | | 2,604 | |
| |
Filing and registration fees | | | 2,108 | |
| |
Transfer agent fees | | | 1,846 | |
| |
Other expenses | | | 1,716 | |
| |
Custodian fees | | | 585 | |
| |
Retirement plan custodial fees | | | 115 | |
| | | | |
| |
Total gross expenses | | | 103,355 | |
| | | | |
| |
Less transfer agent fees waived | | | (1,846 | ) |
| |
Less custodian fee credits | | | (585 | ) |
| | | | |
| |
Net expenses | | | 100,924 | |
| | | | |
| |
Net investment income | | | $260,829 | |
| | |
| | | | |
| | |
| | | | |
| |
Net realized gain from investments | | | $3,912 | |
| |
Net increase in unrealized appreciation on investments | | | 253,795 | |
| | | | |
| |
Net gain on investments | | | $257,707 | |
| | |
| | | | |
| | |
Net increase in net assets resulting from operations | | | $518,536 | |
| | | | | |
| | | | | | | | | | | | |
| | | | | | | |
| 8 | | | | | | | | November 30, 2020 | | Annual Report | | The accompanying notes are an integral part of these financial statements. |
| | | | | | | | |
Statement of Changes of Net Assets | | | Year ended November 30, 2020 | | | | Year ended November 30, 2019 | |
| | | |
Increase (decrease) in net assets from operations | | | | | | | | |
| | |
From operations | | | | | | | | |
| | |
Net investment income | | | $260,829 | | | | $279,310 | |
| | |
Net realized gain on investment | | | 3,912 | | | | 15,726 | |
| | |
Net increase in unrealized appreciation | | | 253,795 | | | | 641,062 | |
| | | | | | | | |
| | |
Net increase in net assets | | | 518,536 | | | | 936,098 | |
| | | | | | | | |
| | |
| | | | | | | | |
| | |
Distributions to shareholders | | | (260,790 | ) | | | (278,541 | ) |
| | |
| | | | | | | | |
| | |
Capital share transactions | | | | | | | | |
| | |
Proceeds from sales of shares | | | 1,747,848 | | | | 1,163,543 | |
| | |
Value of shares issued in reinvestment of dividends | | | 219,377 | | | | 224,410 | |
| | |
Cost of shares redeemed | | | (731,875 | ) | | | (2,113,103 | ) |
| | | | | | | | |
| | |
Total capital share transactions | | | 1,235,350 | | | | (725,150 | ) |
| | | | | | | | |
| | |
Total increase (decrease) in net assets | | | 1,493,096 | | | | (67,593 | ) |
| | | |
| | | | | | | | |
| | | |
Net assets | | | | | | | | |
| | |
Beginning of year | | | 13,486,725 | | | | 13,554,318 | |
| | |
End of year | | | $14,979,821 | | | | $13,486,725 | |
| | | |
| | | | | | | | |
| | | |
Shares of the Fund sold and redeemed | | | | | | | | |
| | |
Number of shares sold | | | 311,367 | | | | 212,460 | |
| | |
Number of shares issued in reinvestment of dividends | | | 39,076 | | | | 40,958 | |
| | |
Number of shares redeemed | | | (130,816 | ) | | | (386,786 | ) |
| | | | | | | | |
| | |
Net increase (decrease) in number of shares outstanding | | | 219,627 | | | | (133,368 | ) |
| | | |
| | | | | | | | |
| | | | | | | | | | | | | | | | | | | | |
Financial Highlights | | | For the year ended November 30, | |
| | | | | |
Selected data per share of outstanding capital stock throughout each year: | | | 2020 | | | | 2019 | | | | 2018 | | | | 2017 | | | | 2016 | |
| | | | | | |
Net asset value at beginning of year | | | $5.55 | | | | $5.28 | | | | $5.37 | | | | $5.29 | | | | $5.48 | |
| | | | | |
Income from investment operations | | | | | | | | | | | | | | | | | | | | |
| | | | | |
Net investment income | | | 0.10 | | | | 0.11 | | | | 0.12 | | | | 0.13 | | | | 0.14 | |
| | | | | |
Net gains (losses) on securities (both realized and unrealized) | | | 0.10 | | | | 0.27 | | | | (0.09 | ) | | | 0.08 | | | | (0.19 | ) |
| | | | | | | | | | | | | | | | | | | | |
| | | | | |
Total from investment operations | | | 0.20 | | | | 0.38 | | | | 0.03 | | | | 0.21 | | | | (0.05 | ) |
| | | | | | | | | | | | | | | | | | | | |
| | | | | |
Less distributions | | | | | | | | | | | | | | | | | | | | |
| | | | | |
Dividends (from net investment income) | | | (0.10 | ) | | | (0.11 | ) | | | (0.12 | ) | | | (0.13 | ) | | | (0.14 | ) |
| | | | | |
Distributions (from capital gains) | | | - | | | | - | | | | - | | | | - | | | | 0.00 | A |
| | | | | | | | | | | | | | | | | | | | |
| | | | | |
Total distributions | | | (0.10 | ) | | | (0.11 | ) | | | (0.12 | ) | | | (0.13 | ) | | | (0.14 | ) |
| | | | | | | | | | | | | | | | | | | | |
| | | | | |
| | | | | | | | | | | | | | | | | | | | |
| | | | | |
Net asset value at end of year | | | $5.65 | | | | $5.55 | | | | $5.28 | | | | $5.37 | | | | $5.29 | |
| | | | | | |
Total returnB | | | 3.67% | | | | 7.30% | | | | 0.51% | | | | 3.90% | | | | (0.95 | )% |
| | | | | | |
Ratios / supplemental data | | | | | | | | | | | | | | | | | | | | |
| | | | | |
Net assets ($000), end of year | | | $14,980 | | | | $13,487 | | | | $13,554 | | | | $17,474 | | | | $17,997 | |
| | | | | |
Ratio of expenses to average net assets | | | | | | | | | | | | | | | | | | | | |
| | | | | |
Before transfer agent fee waiver and custodian fee credits | | | 0.72% | | | | 0.69% | | | | 0.68% | | | | 0.67% | | | | 0.67% | |
| | | | | |
After transfer agent fee waiver | | | 0.71% | | | | 0.67% | | | | 0.67% | | | | 0.66% | | | | 0.66% | |
| | | | | |
After transfer agent fee waiver and custodian fee credits | | | 0.71% | | | | 0.67% | | | | 0.67% | | | | 0.65% | | | | 0.65% | |
| | | | | |
Ratio of net investment income after fee waiver and custodian credits to average net assets | | | 1.82% | | | | 2.07% | | | | 2.20% | | | | 2.33% | | | | 2.54% | |
| | | | | |
Portfolio turnover rate | | | 5% | | | | 4% | | | | 13% | | | | 20% | | | | 15% | |
| | | | | | |
| | | | | | | | | | | | | | | | | | | | |
| A | Amount is less than $0.01 |
| | | | | | | | | | | | |
| | | | | | | |
| The accompanying notes are an integral part of these financial statements. | | Annual Report | | November 30, 2020 | | | | | | | | 9 |
Notes To Financial Statements
Note 1 – Organization
Saturna Investment Trust (the “Trust”) was established under Washington State Law as a business trust on February 20, 1987. The Trust is registered as an open-end, diversified management company under the Investment Company Act of 1940, as amended. In addition to Idaho Tax-Exempt Fund (the “Fund”), eight portfolios have been created to date: Sextant Short-Term Bond Fund, Sextant Bond Income Fund, Sextant Core Fund, Sextant Global High Income Fund, Sextant Growth Fund, Sextant International Fund, Saturna Sustainable Equity Fund, and Saturna Sustainable Bond Fund (each, a “Fund”, and collectively, the “Funds”). The other eight portfolios are distributed through separate prospectuses and the results of those Funds are contained in separate reports.
The Idaho Tax-Exempt Fund was first authorized to sell shares of beneficial interest on September 4, 1987.
The Fund is an investment company and accordingly follows the investment accounting and reporting guidance of the Financial Accounting Standards Board (FASB) Accounting Standard Codification Topic 946 “Financial Services – Investment Companies.”
Investment risks:
The value of Fund shares rises and falls as the value of the bonds in which the Fund invests goes up and down. The risks inherent in the Fund depend primarily on the terms and quality of the obligations in the Fund’s portfolio, as well as on market conditions. When interest rates rise, bond prices fall. When interest rates fall, bond prices go up. Bonds with longer maturities, such as those held by the Fund, usually are more sensitive to interest rate changes than bonds with shorter maturities. Only consider investing in the Fund if you are willing to accept the risk that you may lose money.
The Fund entails credit risk, which is the possibility that a bond will not be able to pay interest or principal when due. If the credit quality of a bond is perceived to decline, investors will demand a higher yield, which means a lower price on that bond to compensate for the higher level of risk. If a security held by the Fund defaults on payment of interest or principal, the Fund’s income, ability to preserve capital, and liquidity would all be adversely affected.
Fund investments are susceptible to factors adversely affecting Idaho, such as political, economic, and financial trends unique to this relatively small state. Investing only in Idaho bonds means that the Fund’s investments are more concentrated than other mutual funds, and relatively few bond price changes may lead to underperformance compared to investments selected in greater number and/or from a wider universe.
The Fund is vulnerable to income tax rate changes, either at the Idaho or federal level, since part of municipal securities’ value is derived from the recipient’s ability to exclude interest payments from taxation.
Note 2 – Significant Accounting Policies
The following is a summary of the significant accounting policies, in conformity with accounting principles generally accepted in the United States of America, which are consistently followed by the Fund in the preparation of its financial statements.
Security valuation:
Debt securities are valued using bid-side valuations provided by an independent service. The service determines valuations using factors such as yields or prices of bonds of comparable quality, type of issue, coupon maturity, ratings, trading activity, and general market conditions. In the absence of a valuation from an independent service for a security, a fair value for such security is determined in good faith by or under the direction of the Board of Trustees.
Security transactions are recorded on trade date. Realized gains and losses on sales of securities are recorded on the identified cost basis.
Share valuation:
The net asset value (“NAV”) per share of the Fund is calculated by dividing the sum of the value of the securities held by the Fund, plus cash and other assets, minus all liabilities (including estimated accrued expenses) by the total number of shares outstanding for the Fund, rounded to the nearest cent. The Fund’s shares are not priced or traded on days the New York Stock Exchange is closed. The NAV is the offering and redemption price per share.
The Trustees have adopted certain policies and procedures with respect to frequent trading of Fund shares. The Fund is intended for long-term investment and does not permit rapid trading of its shares. The Fund cannot always identify all intermediaries, or detect or prevent trading that violates the Frequent Trading Policy through intermediaries or omnibus accounts.
Fair value measurements:
Accounting Standards Codification (ASC) 820 establishes a three-tier framework for measuring fair value based on a hierarchy of inputs. The hierarchy distinguishes between market data obtained from independent sources (observable inputs) and the Fund’s own market assumptions (unobservable inputs). These inputs are used in determining the value of the Fund’s investments and are summarized below.
| | Level 1 — | Unadjusted quoted prices in active markets for identical assets or liabilities that the Trust has the ability to access. |
| | Level 2 — | Observable inputs other than quoted prices in Level 1 that are observable for the asset or liability, either directly or indirectly. These inputs may include quoted prices for the identical instrument on an inactive market, prices for similar instruments, interest rates, prepayment speeds, credit risk, yield curves, default rates, and similar data. |
| | Level 3 — | Unobservable inputs for the asset or liability, to the extent relevant observable inputs are not available, representing the Trust’s own assumptions about the assumptions a market participant would use in valuing the asset or liability, and would be based on the best information available. |
| | | | | | | | | | |
| | | | | | |
| 10 | | | | | | | | November 30, 2020 | | Annual Report |
Notes To Financial Statements (continued)
The following table is a summary of the inputs used as of November 30, 2020, in valuing the Fund’s investments carried at value.
| | | | | | | | | | | | | | | | |
| | | | | |
| Fair Value Inputs | | Level 1 Quoted Price | | | Level 2 Significant Observable Input | | | Level 3 Significant Unobservable Input | | | Total | |
| | | | |
Municipal Bonds1 | | | $- | | | | $13,672,211 | | | | $- | | | | $13,672,211 | |
| | | | |
Total Assets | | | $- | | | | $13,672,211 | | | | $- | | | | $13,672,211 | |
| ¹ | See Schedule of Investments for industry breakout. |
During the period ended November 30, 2020, the Fund had no transfers among Levels 1, 2, or 3.
The availability of observable inputs can vary from security to security and is affected by a wide variety of factors, including, for example, the type of security, whether the security is new and not yet established in the marketplace, the liquidity of markets, and other characteristics particular to the security. To the extent that valuation is based on models or inputs that are less observable or unobservable in the market, the determination of fair value requires more judgment. Accordingly, the degree of judgment exercised in determining fair value is greatest for instruments categorized in Level 3.
The inputs used to measure fair value may fall into different levels of the fair value hierarchy. In such cases, for disclosure purposes, the level in the fair value hierarchy within which the fair value measurement falls in its entirety, is determined based on the lowest level input that is significant to the fair value measurement in its entirety.
The inputs or methodology used for valuing securities are not necessarily an indication of the risks associated with investing in those securities.
Income taxes:
The Fund intends to comply with the requirements of the Internal Revenue Code necessary to qualify as a regulated investment company and to make the requisite distributions of income and capital gains to its shareowners sufficient to relieve it from all or substantially all federal income taxes. As the Fund intends to meet requirements for tax-exempt income dividends, and the requirements of the Idaho Department of Revenue for income dividends exempt from Idaho state income tax, no income tax provisions are required.
The Fund recognizes the tax benefits of uncertain tax positions only where the position is “more likely than not” to be sustained assuming examination by tax authorities. Management has analyzed the Fund’s tax positions and has concluded that no liability for unrecognized tax benefits should be recorded related to uncertain tax positions taken on returns filed for open tax years (2017 – 2019), or expected to be taken in the Fund’s 2020 tax return. The Fund identifies its major tax jurisdiction as US federal and foreign jurisdictions where the Fund makes significant investments; however, the Fund is not aware of any tax positions for which it is reasonably possible that the total amounts of unrecognized tax benefits will change materially in the next 12 months.
Reclassification of capital accounts:
Accounting principles generally accepted in the United States of America require that certain components of net assets relating to permanent differences be reclassified between financial and tax reporting.
As of November 30, 2020, there were no reclassifications to the capital accounts.
Distributions to shareowners:
The Fund’s dividends to shareowners from net investment income are paid daily and distributed on the last business day of each month.
Distributions of capital gains, if any, are made at least annually and as required to comply with federal excise tax requirements. Distributions to shareowners are determined in accordance with income tax regulations and are recorded on the ex-dividend date. Dividends are paid in shares of the Fund, at the net asset value on the payable date. Shareowners may elect to take distributions in cash if they total $10 or more.
Use of estimates:
The preparation of financial statements in conformity with accounting principles generally accepted in the United States of America requires management to make estimates and assumptions that affect the reported amounts of assets and liabilities and disclosure of contingent assets and liabilities at the date of the financial statements and the reported amounts of increases and decreases in net assets from operations during the reporting period. Actual results could differ from those estimates.
LIBOR Transition Risk:
The United Kingdom’s Financial Conduct Authority announced a phase out of the London Interbank Offered Rate (“LIBOR”) by the end of 2021, and it is expected that LIBOR will cease to be published after that time.
The Fund may be exposed to financial instruments tied to LIBOR to determine payment obligations, financing terms, hedging activities, or investment value. The transition process away from LIBOR might lead to increase volatility and illiquidity in markets for, and reduce the effectiveness of new hedges placed against, instruments whose term currently include LIBOR. The ultimate effect of the LIBOR transition process on the Fund is uncertain.
Other:
Interest income is recognized on an accrual basis. Premiums on securities purchased are amortized and discounts are accreted using the yield to maturity method over the lives of the respective securities or where applicable, to the first call date of the securities.
Recent Accounting Pronouncement:
In August 2018, FASB issued Accounting Standards Update No. 2018-13, “Fair Value Measurement (Topic 820: Disclosure Framework — Changes to the Disclosure Requirements for Fair Value Measurement” (“ASU 2018-13”). ASU 2018-13 eliminates the requirement to disclose the amount of and reasons for transfers between Level 1 and Level 2 of the fair value hierarchy, the timing of transfers between levels of the fair value hierarchy and the valuation processes for Level
| | | | | | | | | | |
| | | | | | |
| Annual Report | | November 30, 2020 | | | | | | | | 11 |
| | |
| Notes To Financial Statements (continued) | | |
3 fair value measurements. ASU 2018-13 will require the need to disclose the range and weighted average used to develop significant unobservable inputs for Level 3 fair value measurements and the changes in unrealized gains and losses for recurring Level 3 fair value measurements. ASU 2018-13 will also require that information is provided about the measurement uncertainty of Level 3 fair value measurements as of the reporting date. The guidance is effective for fiscal years, and interim periods within those fiscal years, beginning after December 15, 2019, and allows for early adoption of either the entire standard or only the provisions that eliminate or modify the requirements. Management has elected to adopt early the provisions that eliminate the disclosure requirements. Management is still currently evaluating the impact of applying the rest of the guidance.
Note 3 – Transactions with Affiliated Persons
Under a contract approved by shareowners on September 28, 1995 and reviewed and approved annually by the Trust’s Board of Trustees, including those Trustees who are not parties to the contract or “interested persons” (as defined in the Investment Company Act of 1940) of such parties or the Trust (the “Independent Trustees”), Saturna Capital Corporation (“Saturna Capital”) provides investment advisory services and certain other administrative and distribution services to conduct the Fund’s business. For such services, the Fund pays an annual fee equal to 0.50% of its average daily net assets. For the fiscal year ended November 30, 2020, the Fund incurred advisory fee expenses of $71,556.
Expenses incurred by the Trust on behalf of the Fund (e.g., legal fees) are allocated to the Fund and the other Funds of the Trust on the basis of relative daily average net assets.
Saturna Capital also acts as transfer agent for the Fund, for which it did not receive any compensation during the fiscal year ended November 30, 2020. Saturna Capital has voluntarily elected to waive the transfer agent fee through November 30, 2020, to reduce the Fund’s operating expenses. Such fees, had they been charged, would have totaled $1,846.
Saturna Brokerage Services, Inc. (“SBS”), a discount brokerage and subsidiary of Saturna Capital, is registered as a broker-dealer and acts as distributor for the Fund.
Saturna Trust Company (“STC”), a subsidiary of Saturna Capital, acts as a retirement plan custodian for Fund shareowners. For the fiscal year ended November 30, 2020, the Fund incurred retirement plan custodial fees of $115.
Mrs. Jane Carten serves as a trustee and president of the Trust. She is also a director and the president of Saturna Capital and Saturna Trust Company. She is not compensated by the Trust. For the fiscal year ended November 30, 2020, the Trust paid trustee compensation expenses of $35,500 which is included in the $66,477 of total expenses incurred for the independent Trustees. The Fund’s allocation of these expenses was $4,581.
The officers of the Trust are paid by Saturna Capital, not the Trust, except the Chief Compliance Officer, who is partially compensated by the Trust. For the fiscal year ended November 30, 2020, the Fund’s allocation of these expenses was $3,931.
On November 30, 2020, the trustees, officers, and their immediate families as a group directly or indirectly owned 16.79% of the outstanding shares of the Fund.
Note 4 – Distributions to Shareowners
The tax characteristics of distributions paid during the fiscal years ended November 30, 2020, and November 30, 2019, were as follows:
| | | | | | | | |
| | | |
| | | November 30,2020 | | | November 30, 2019 | |
| | |
Tax-exempt income | | | $260,597 | | | | $277,251 | |
| | |
Taxable income | | | $193 | | | | $1,290 | |
Note 5 — Federal Income Taxes
The cost basis of investments for federal income tax purposes at November 30, 2020 was as follows:
| | | | |
| | |
Cost of investments | | | $12,804,602 | |
| | | | |
| |
Gross unrealized appreciation | | | $868,000 | |
| |
Gross unrealized depreciation | | | $(391 | ) |
| | | | |
| |
Net unrealized appreciation | | | $867,609 | |
| | | | | |
As of November 30, 2020, the components of distributable earnings on a tax basis were as follows:
| | | | |
| | |
Undistributed tax exempt income | | | $3,859 | |
| |
Accumulated capital loss | | | $(87,957 | ) |
| |
Unrealized appreciation | | | $867,609 | |
| | | | |
| |
Total accumulated earnings | | | $783,511 | |
| | | | | |
As of November 30, 2020, the Fund had capital loss carryforwards as follows, subject to regulation.
| | | | | | | | |
| | |
| | | | Carryforward | | | | Expiration | |
| | |
Short-term loss carryforward | | | $ 55,441 | | | | Unlimited | |
| | |
Long-term loss carryforward | | | $ 32,516 | | | | Unlimited | |
| | |
| | | | $ 87,957 | | | | | |
Note 6 – Investments
During the fiscal year ended November 30, 2020, the Fund purchased $1,195,681 of securities and sold/matured $684,000 of securities.
Note 7 – Custodian
Under the agreement in place with UMB Bank, custody fees are reduced by credits for cash balances. Such reduction for the fiscal year ended November 30, 2020, amounted to $585.
Note 8 – COVID 19 Pandemic
The COVID-19 Pandemic has adversely impacted global commercial activity and contributed to significant volatility in global equity and debt markets. The pandemic has resulted in quarantines, stay at home orders, travel prohibitions and closures, disrupting supply chains and economic activity. The duration of the pandemic’s effects remain uncertain and difficult to assess. The effects of the pandemic may adversely impact the fund’s performance and its ability to achieve its investment objective.
Note 9 – Subsequent Events
In preparing these financial statements, the Funds have evaluated events and transactions for potential recognition or disclosure through the date the financial statements were issued.
There were no other events or transactions during the period that materially impacted the amounts or disclosures in the Funds’ financial statements.
| | | | | | | | | | |
| | | | | | |
| 12 | | | | | | | | November 30, 2020 | | Annual Report |
Report of Independent Registered Public Accounting Firm
To the Board of Trustees of
Saturna Investment Trust
and the Shareholders of Idaho Tax-Exempt Fund,
Opinion on the Financial Statements
We have audited the accompanying statement of assets and liabilities of Idaho Tax-Exempt Fund, (the “Fund”), a series of Saturna Investment Trust, including the schedule of investments, as of November 30, 2020, the related statement of operations for the year then ended, the statements of changes in net assets for each of the two years in the period then ended, the financial highlights for each of the five years in the period then ended, and the related notes (collectively referred to as the “financial statements”). In our opinion, the financial statements present fairly, in all material respects, the financial position of the Fund as of November 30, 2020, the results of its operations for the year then ended, the changes in its net assets for each of the two years in the period then ended and its financial highlights each of the five years in the period then ended, in conformity with accounting principles generally accepted in the United States of America.
Basis for Opinion
These financial statements are the responsibility of the Fund’s management. Our responsibility is to express an opinion on the Fund’s financial statements based on our audits. We are a public accounting firm registered with the Public Company Accounting Oversight Board (United States) (“PCAOB”) and are required to be independent with respect to the Fund in accordance with the US federal securities laws and the applicable rules and regulations of the Securities and Exchange Commission and the PCAOB. We have served as the auditor of one or more of the funds in the Trust since 1997.
We conducted our audits in accordance with the standards of the PCAOB. Those standards require that we plan and perform the audits to obtain reasonable assurance about whether the financial statements are free of material misstatement, whether due to error or fraud. The Fund is not required to have, nor were we engaged to perform, an audit of its internal control over financial reporting. As part of our audits we are required to obtain an understanding of internal control over financial reporting, but not for the purpose of expressing an opinion on the effectiveness of the Fund’s internal control over financial reporting. Accordingly, we express no such opinion.
Our audits included performing procedures to assess the risks of material misstatement of the financial statements, whether due to error or fraud, and performing procedures that respond to those risks. Such procedures included examining, on a test basis, evidence regarding the amounts and disclosures in the financial statements. Our audits also included evaluating the accounting principles used and significant estimates made by management, as well as evaluating the overall presentation of the financial statements. Our procedures included confirmation of securities owned as of November 30, 2020 by correspondence with the custodian. We believe that our audits provide a reasonable basis for our opinion.
Philadelphia, Pennsylvania
January 29, 2021
/s/ Tait, Weller & Baker LLP
Tait, Weller & Baker LLP
| | | | | | | | | | |
| | | | | | |
| Annual Report | | November 30, 2020 | | | | | | | | 13 |
All mutual funds have operating expenses. As an Idaho Tax-Exempt Fund shareowner, you incur ongoing costs, including management fees and other fund expenses such as shareowner reports (like this one). Operating expenses, which are deducted from a fund’s gross earnings, directly reduce the investment return of a fund. Mutual funds (unlike other financial investments) only report their results after deduction of operating expenses.
With the Idaho Tax-Exempt Fund, unlike many mutual funds, you do not incur sales charges (loads) on purchases, reinvested dividends, or other distributions. You do not incur redemption fees or exchange fees. You may incur fees related to extra services requested by you for your account, such as bank wires. The examples below are intended to help you understand your ongoing costs (in dollars) of investing in the Fund and to compare these costs with the ongoing costs of investing in other mutual funds.
Example
The following example is based on an investment of $1,000 invested at the beginning of the period and held for the entire period (June 1, 2020, to November 30, 2020).
Actual Expenses
The first line provides information about actual account values and actual expenses. You may use the information in this line, together with the amount you have invested, to estimate the expenses that you paid over the period. Simply divide your account value by $1,000 (for example, an $8,600 account value divided by $1,000 = 8.6), then multiply the result by the number in the first line under the heading entitled “Expenses Paid During Period” to estimate the expenses you paid on your account during this period. The Fund may charge for extra services (such as domestic bank wires, international bank wires, or overnight courier delivery of redemption checks) rendered on request, which you may need to estimate to determine your total expenses.
Hypothetical Example for Comparison Purposes
The second line provides information about hypothetical account values and hypothetical expenses based on the Fund’s actual expense ratio (based on the last six months) and an assumed rate of return of 5% per year before expenses, which is not the Fund’s actual return. The hypothetical account values and expenses may not be used to estimate the actual ending account balance or expenses you paid for the period. You may use this information to compare the ongoing costs of investing in the Fund and other mutual funds. To do so, compare this 5% hypothetical example with the 5% hypothetical examples that appear in the shareowner reports of other mutual funds. You may wish to add other fees that are not included in the expenses shown in the table, such as charges for extra services like bank wires.
Please note that the expenses shown are meant to highlight your ongoing costs only and do not reflect any transactional costs, such as sales charges (loads), redemption fees, or exchange fees (note that the Idaho Tax-Exempt Fund does not charge any such transactional costs). Therefore, the “Hypothetical” line is useful in comparing ongoing costs only, and may not help you determine the relative total costs of owning different funds.
| | | | | | | | | | | | | | | | |
| | | | | |
| | | Beginning Account Value [June 1, 2020] | | | Ending Account Value [November 30, 2020] | | | Expenses Paid During Period1
| | | Annualized Expense Ratio | |
| | | | |
Actual | | | $1,000.00 | | | | $1,012.80 | | | | $3.07 | | | | 0.61% | |
| | | | |
Hypothetical (5% return before expenses) | | | $1,000.00 | | | | $1,022.01 | | | | $3.09 | | | | 0.61% | |
| 1 | Expenses are equal to Idaho Tax-Exempt Bond Fund’s annualized expense ratio of 0.69% (based on the most recent semi-annual period of June 1, 2020 through November 30, 2020) multiplied by the average account value over the period multiplied by 183/365 (to reflect the one-half year period). |
| | | | | | | | | | |
| | | | | | |
| 14 | | | | | | | | November 30, 2020 | | Annual Report |
| | |
| Trustees and Officers | | (unaudited) |
| | | | | | | | |
| | | |
| Name, Address, and Age | | Position(s) Held with Trust and Number of Saturna Fund
Portfolios Overseen | | Principal occupation(s) during past 5 years, including Directorships | | Other Directorships held by Trustee |
|
Independent Trustees |
| | | | |
(photo omitted) | | Marina E. Adshade (53) 1300 N. State Street Bellingham WA 98225 | | Independent Trustee (since 2017);
Nine | | Professor of Economics, University of British Columbia, Vancouver and Simon Fraser University;
Author | | None |
| | | | |
(photo omitted) | | Ronald H. Fielding, MA, MBA, CFA (71) 1300 N. State Street Bellingham WA 98225 | | Independent Trustee (since 2009);
Thirteen | | Director, ICI Mutual Insurance Company | | Amana Mutual Funds Trust |
| | | | |
(photo omitted) | | Gary A. Goldfogel, MD (62) 1300 N. State Street Bellingham WA 98225 | | Chairman (since 2017); Independent Trustee (since 1995);
Nine | | Medical Examiner (pathologist) Owner, Avocet Environmental Testing (laboratory) | | None |
| | | | |
(photo omitted) | | Jim V. McKinney (59) 1300 N. State Street Bellingham WA 98225 | | Independent Trustee (since 2017);
Nine | | Executive Director, Common Threads Northwest; President/CEO, Apple Mountain LLC, consulting and development; US Army Foreign Area Officer - Political/Military Advisor to US Army Central; Senior Defense Official, Defense Attaché, US Embassy Slovenia | | None |
| | | | |
(photo omitted) | | Sarah E.D. Rothenbuhler (52) 1300 N. State Street Bellingham WA 98225 | | Independent Trustee (since 2017);
Nine | | CEO, Birch Equipment (industrial rentals and sales) | | None |
|
Interested Trustee |
| | | | |
(photo omitted) | | Jane K. Carten, MBA (45) 1300 N. State Street Bellingham WA 98225 | | President, Trustee (since 2017);
Nine | | President and Director, Saturna Capital Corporation Vice President and Director, Saturna Trust Company President, Saturna Brokerage Services | | None |
| | | | | |
| | | | | | | | |
| | | | | | | | | | |
| | | | | | |
| Annual Report | | November 30, 2020 | | | | | | | | 15 |
| | |
| Trustees and Officers (continued) | | (unaudited) |
| | | | | | | | |
| Name (Age) and Address | | Position(s) held with Trust and Number of Saturna Fund Portfolios Overseen | | Principal occupation(s) during past 5 years, including Directorships | | Other Directorships held by Trustee |
|
Officers Who Are Not Trustees |
| | | | |
(photo omitted) | | Bryce R. Fegley (45) 1300 N. State Street Bellingham, WA 98225 | | Vice President (since 2020);
N/A | | Portfolio Manager and Senior Investment Analyst, Saturna Capital | | N/A |
| | | | |
(photo omitted) | | Christopher R. Fankhauser (48) 1300 N. State Street Bellingham, WA 98225 | | Treasurer1 (since 2002);
N/A | | Chief Operations Officer, Saturna Capital Corporation Vice President and Chief Operations Officer, Saturna Brokerage Services Director, Vice President, and Chief Operations Officer, Saturna Trust Company | | N/A |
| | | | |
(photo omitted) | | Michael E. Lewis (59) 1300 N. State Street Bellingham, WA 98225 | | Chief Compliance Officer1 (since 2012);
N/A | | Chief Compliance Officer, Saturna Capital, Saturna Trust Company, and Affiliated Funds | | N/A |
| | | | |
(photo omitted) | | Jacob A. Stewart (40) 1300 N. State Street Bellingham, WA 98225 | | Anti-Money Laundering Officer1 (since 2015);
N/A | | Anti-Money Laundering Officer, Saturna Capital Corporation, Saturna Brokerage Services Chief Compliance Officer, Saturna Brokerage Services Bank Secrecy Act Officer, Saturna Trust Company | | N/A |
| | | | |
(photo omitted) | | Nicole Trudeau (41) 1300 N. State Street Bellingham WA 98225 | | Secretary1 (since 2018)
N/A | | Chief Legal Officer, Saturna Capital Corporation Former: Counsel, Simpson Thacher & Bartlett LLP; Partner, Stradley Ronon Stevens & Young, LLP; Partner, K&L Gates LLP | | N/A |
| | | | | |
| | | | | | | | |
Term of Office: each Trustee serves for the lifetime of the Trust or until they die, resign, are removed, or not re-elected by the shareowners. Each officer serves a one-year term subject to annual reappointment by the Trustees.
The Trust’s Statement of Additional Information, available without charge upon request by calling Saturna Capital at 1-800-728-8762 and on the Funds’ website, www.idahotaxexemptfund.com, includes additional information about the Trustees.
On November 30, 2020 the Trustees, officers, and their related accounts as a group owned 16.79% of the outstanding shares of the Fund.
During the year ended November 30, 2020, the Independent Trustees were each paid by the Trust: (1) $2,000 annual retainer plus $1,000 per board meeting attended (in person or by phone), plus reimbursement of travel expenses; (2) $250 for committee meetings; and (3) $250 per quarter for serving as chariman of the board or any committee.
Mrs. Carten is an Interested Trustee by reason of her positions with the Trust’s adviser (Saturna Capital Corporation) and underwriter (Saturna Brokerage Services), and is the primary manager of the Saturna Sustainable Equity Fund portfolio. She is paid by Saturna Capital a salary, plus a bonus for each month the Saturna Sustainable Equity Fund portfolio earns a 4 or 5 star rating from Morningstar (see www.saturna.com). The officers are paid by Saturna Capital and not the Trust. As of November 30, 2020, all Saturna Capital employees listed above as officers owned shares in one or more of the Saturna Investment Trust funds, with Mrs. Carten owning (directly or indirectly) over $1.34 million.
| 1 | Holds the same postion with Amana Mututal Funds Trust |
| | | | | | | | | | |
| | | | | | |
| 16 | | | | | | | | November 30, 2020 | | Annual Report |
| | |
| Renewal of Investment Advisory Contract | | (unaudited) |
During their meeting of September 15, 2020, the Trustees of Saturna Investment Trust, including the Independent Trustees, discussed the continuance of the Investment Advisory and Administrative Services Agreement (“Agreement”) between the Trust, on behalf of the Fund, and Saturna Capital. In considering the renewal of the Agreement, the Trustees discussed the nature, extent, and quality of the services provided by Saturna Capital to the Trust and the Fund. The Trustees considered Saturna Capital’s specific responsibilities in all aspects of day-to-day management of the Fund as well as the qualifications, experience and responsibilities of the Fund’s portfolio manager and other key personnel at Saturna Capital. The Trustees discussed Saturna Capital’s experience, ability, and commitment to quality service through performing internally such functions as shareowner servicing, administration, accounting, marketing, and distribution — all in addition to investment management.
The Trustees took into consideration Saturna Capital’s continued avoidance of significant operational and compliance problems, plus its investments in infrastructure, information management systems, personnel, training, and investor education materials, all designed to provide high quality investor services and meet investor needs. They recognized Saturna Capital’s efforts to recruit and retain qualified and experienced staff and improve the capital base on which Saturna Capital operates, which the Trustees believe is important to the long-term success of the Fund. They considered Saturna Capital’s focus on investors and its efforts to avoid potential conflicts of interest.
The Trustees considered the investment performance of the Fund over time, including the Fund’s average annual total returns relative to its benchmark for the one-, three-, five-, ten-, and fifteen- year periods, all as of July 31, 2020. The Trustees also considered comparative performance information from Morningstar and Lipper, which provide independent analysis of mutual fund data and, among other things, rank mutual fund performance within categories comprised of similarly managed funds. The Trustees considered and discussed the Fund’s performance relative to its Morningstar category for the one-, three-, five-, ten-, and fifteen-year periods ended July 31, 2020. The Trustees also considered the Fund’s Morningstar performance ranking (three stars), and the Fund’s performance ranking relative to the Fund’s category selected by Lipper, Inc. for the one-, three-, five- and ten-year periods ended as of July 31, 2020.
With respect to long-term (10- and 15-year) performance, the Trustees found that the average annual total return of the Fund for the 10- and 15-year periods ended on July 31, 2020, was below the Morningstar category average for the same periods. The Trustees also considered the short- and medium-term performance of the Fund, noting that the Fund’s average annual total return for the one-, three-, and five-year periods ended on July 31, 2020 outperformed its Morningstar category average.
The Trustees noted the risk-averse investment style of the Fund and other factors which can affect the Fund’s performance relative to its broader Morningstar category. The Trustees also noted certain differences between the Fund and the peer funds within its Morningstar category, including differences in investment strategies and asset size. The Trustees found that Saturna Capital continued to manage the Fund in a manner that is designed to be risk-averse and attractive to long- term investors. The Trustees discussed and considered the efforts of Saturna Capital to make additional resources available to assist in managing the Fund. The Trustees also considered Saturna Capital’s focus on improving investment performance without incurring materially higher levels of risk.
The Trustees also considered the performance and expenses of the Fund as compared to a smaller group of funds with a roughly similar asset range and similar investment objectives and strategies. The Trustees considered these comparative performance and expense data, along with the comparative data published by Morningstar and the Fund’s performance relative to its benchmark, to evaluate the Fund’s performance over near-term and long-term time periods.
The Trustees also reviewed the fees and expenses of the Fund, including comparative data on fees and expenses published by Morningstar, and considered the components of the Fund’s operating expenses. The Trustees noted the steps that Saturna Capital has undertaken to maintain competitive levels of Fund operating expenses. They noted the significant sponsorship of the Fund by Saturna Capital evidenced, in part, by certain fees and expenses paid by Saturna Capital out of its own resources. The Trustees recognized Saturna Capital’s efforts help make the Fund more widely available and less expensive than would otherwise be the case without Saturna Capital’s efforts.
The Trustees recognized that the Fund remains relatively small and there have not been opportunities to consider economies of scale. The Trustees noted Saturna Capital’s commitment to continue operating the Fund and the costs undertaken by Saturna Capital.
The Trustees reviewed Saturna Capital’s financial information and discussed the issue of Saturna Capital’s profitability as related to management and administration of the Trust. They discussed the reasonableness of Saturna Capital’s profitability as part of their evaluation of whether the advisory fees bear a reasonable relationship to the mix of services provided by Saturna Capital, including the nature, extent, and quality of such services.
The Trustees considered and compared the fees charged by Saturna Capital to other types of accounts, including non-mutual fund advisory clients. The Trustees noted the differences between the full range of services Saturna Capital provides to the Fund, including investment advisory services, transfer agency services, administrative and other services, as compared to the investment advisory services provided to the other advisory accounts.
| | | | | | | | | | |
| | | | | | |
| Annual Report | | November 30, 2020 | | | | | | | | 17 |
| | |
| Renewal of Investment Advisory Contract (continued) | | (unaudited) |
The Trustees considered potential benefits to Saturna Capital’s other business lines from acting as investment adviser to the Fund, but also recognized that Saturna Capital’s other business lines benefit the Fund. The Trustees considered whether there are other potential benefits to Saturna Capital in continuing to manage the Fund and the Trustees found that there were no material benefits other than Saturna Capital’s receipt of advisory fees.
The Trustees concluded based on their business judgement that the fees paid by the Fund to Saturna Capital were, from an arm’s length bargaining perspective, reasonable and in the best interest of the Fund and its shareowners in light of the services provided, comparative performance, expense and advisory fee information, costs of services provided, profits to be realized, and benefits derived or to be derived by Saturna Capital from its relationship with the Fund. Following this discussion, the Trustees, including the Independent Trustees, unanimously agreed to renew the Agreement of Idaho Tax-Exempt Fund with Saturna Capital.
| | | | | | | | | | |
| | | | | | |
| 18 | | | | | | | | November 30, 2020 | | Annual Report |
Availability of Quarterly Portfolio Information
| (1) | The Idaho Tax-Exempt Fund files a complete schedule of portfolio holdings with the SEC for the first and third quarters of each fiscal year as an exhibit to its reports on Form N-PORT. Previously, this information was filed on Form N-Q. |
| (2) | The Fund’s Form N-PORT reports are available on the SEC’s website at www.sec.gov. |
| (3) | The Fund makes a complete schedule of portfolio holdings after the end of each month available at www.idahotaxexemptfund.com. |
Availability of Proxy Voting Information
| (1) | A description of the policies and procedures that the Fund uses to determine how to vote proxies relating to portfolio securities is available (a) without charge, upon request, by calling Saturna Capital at 1-800-728-8762; (b) on the Fund’s website at www. idahotaxexemptfund.com; and (c) on the SEC’s website at www.sec.gov. |
| (2) | Information regarding how the Fund voted proxies relating to portfolio securities during the most recent 12-month period ended June 30 is available (a) without charge, upon request, by calling Saturna Capital at 1-800-728-8762; (b) on the Fund’s website at www.idahotaxexemptfund.com; and (c) on the SEC’s website at www.sec.gov. |
Householding Policy
To reduce expenses, we may mail only one copy of the Fund’s prospectus, each annual and semi-annual report, and proxy statement when necessary, to those addresses shared by two or more accounts. If you wish to receive individual and/or more copies of these documents, please call us at 1-800-728-8762 or write to us at Saturna Capital/Idaho Tax-Exempt Fund, P.O. Box N, Bellingham, WA 98227. We will begin sending you individual copies 30 days after receiving your request.
If you are currently receiving multiple copies and wish to receive only one copy, please call us at 1-800-728-8762 or write to us at Saturna Capital/Idaho Tax-Exempt Fund, P.O. Box N, Bellingham, WA 98227. We will begin sending you a single copy with subsequent report mailings.
Statement Regarding Liquidity Risk Management Program
The Securities and Exchange Commission adopted Rule 22e-4 under the Investment Company Act of 1940, as amended (the “Liquidity Rule”) to promote effective liquidity risk management throughout the open-end investment company industry, thereby reducing the risk that funds will be unable to meet their redemption obligations and mitigating dilution of the interests of fund shareholders.
Pursuant to the Liquidity Rule, the Trust, on behalf of the Funds, has adopted a liquidity risk management program (the “Program”) to govern the Trust’s approach to managing liquidity risk. The Program is overseen by Saturna Capital’s Liquidity Risk Committee, and the Program’s principal objectives include assessing, managing and periodically reviewing each Fund’s liquidity risk, based on factors specific to the circumstances of the Fund.
At a meeting of the Board held on December 17, 2019, the Trustees received a report addressing the operation of the Program and assessing its adequacy and effectiveness of implementation. It was reported to the Board that the assessment found that the Program was adequately designed and effective in achieving its objectives. Further, that review of the Program’s implementation evidenced substantial compliance with relevant policies and procedures.
Privacy Statement
At Saturna Capital and the Idaho Tax-Exempt Fund, we understand the importance of maintaining the privacy of your financial information. We want to assure you that we protect the confidentiality of any personal information that you share with us. In addition, we do not sell information about our current or former customers.
In the course of our relationship, we gather certain nonpublic information about you, including your name, address, investment choices, and account information. We do not disclose your information to unaffiliated third parties unless it is necessary to process a transaction; service your account; deliver your account statements, shareowner reports and other information; or as required by law. When we disclose information to unaffiliated third parties, we require a contract to restrict the companies’ use of customer information and from sharing or using it for any purposes other than performing the services for which they were required.
We may share information within the Saturna Capital family of companies in the course of informing you about products or services that may address your investing needs.
We maintain our own technology resources to minimize the need for any third party services, and restrict access to information within Saturna. We maintain physical, electronic, and procedural safeguards to guard your personal information. If you have any questions or concerns about the security or privacy of your information please call us at 1-800-728-8762.
| | | | | | | | | | |
| | | | | | |
| Annual Report | | November 30, 2020 | | | | | | | | 19 |
Item 2. Code of Ethics.
Registrant has adopted a code of ethics and is included with this submission as Exhibit (a). It may also be found on Registrant's website at http://www.saturna.com/code_of_ethics.shtml
Item 3. Audit Committee Financial Expert.
(a)(1)(i) The Trust has an audit committee financial expert serving on its audit committee.
(a)(2)(ii) As of November 30, 2014, Mr. Ronald H. Fielding, an independent Trustee (as defined for investment companies), was deemed qualified and agreed to serve.
Item 4. Principal Accountant Fees and Services.
(a) Audit Fees
For the fiscal years ending November 30, 2020, and 2019, the aggregate audit fees billed for professional services rendered by the principal accountant were $113,500 and $113,500, respectively.
(b) Audit-Related Fees
There were no fees billed by the principal accountant for assurance and related services that were not included under paragraph (a) for the fiscal years ending November 30, 2020, and 2019.
(c) Tax Fees
For the fiscal years ending November 30, 2020, and 2019, the aggregate tax fees billed for professional services rendered by the principal accountant were $25,700 and $25,700, respectively. Service includes preparation of the Funds' federal and state income tax returns.
(d) All Other Fees
There were no other fees billed by the principal accountant for the fiscal years ending November 30, 2020, and 2019.
(e)(1) Audit & Compliance Committee Pre-Approval Policies and Procedures
The following is an excerpt from the Saturna Investment Trust Audit & Compliance Committee Charter:
C. Oversight of Independent Auditors
3. Pre-approval of Audit and Non-Audit Services. Except as provided below, the Committee's prior approval is necessary for the engagement of the independent auditors to provide any audit or non-audit services for the Trust and any non-audit services for any entity controlling, controlled by or under common control with Saturna that provides ongoing services to the Trust (Saturna and each such entity, an "Adviser Affiliate") where the engagement relates directly to the operations or financial reporting of the Trust. Non-audit services that qualify under the de minimis exception described in the Securities Exchange Act of 1934, as amended, and applicable rules thereunder, that were not pre-approved by the Committee, must be approved by the Committee prior to the completion of the audit. Pre-approval by the Committee is not required for engagements entered into pursuant to (a) pre-approval policies and procedures established by the Committee, or (b) pre-approval granted by one or more members of the Committee to whom, or by a subcommittee to which, the Committee has delegated pre-approval authority, provided in either case, that the Committee is informed of each such service at its next regular meeting.
(e) (2) Percentages of Services
One hundred percent of the services described in each of paragraphs (b) through (d) were approved by the audit committee pursuant to paragraph (c)(7)(i)(C) of Rule 2-01 of Regulation S-X.
(f) Not applicable.
(g) Aggregate Non-Audit Fees
The aggregate non-audit fees billed by the principal accountant for services rendered to the Registrant are shown above in the response to Item 4(b), (c) and (d) above.
(1) The aggregate non-audit fees billed by the principal accountant for services rendered to the Registrant's investment adviser, Saturna Capital Corporation ("Saturna"), for the fiscal years ended November 30, 2020, and 2019 were:
| Fiscal Year Ended |
| November 2020 | November 2019 |
All other fees: | $23,000 | $23,000 |
The fees listed above consist of fees paid by Saturna to the Registrant's principal accountant for its review and report on Saturna's internal transfer agency control procedures and Saturna's custody control procedures.
(2) The aggregate non-audit fees billed by the principal accountant for services rendered to entities controlling, controlled by, or under common control with Saturna, for the fiscal years ended November 30, 2020, and 2019 were:
| Fiscal Year Ended |
| November 2020 | November 2020 |
All other fees: | None | None |
(h) Registrant's Audit Committee
The Registrant's Audit Committee has considered the provision of non-audit services that were rendered to Saturna, and any entity controlling, controlled by or under common control with Saturna that provides ongoing services to the Registrant, that were not pre-approved pursuant to Rule 2-01 (c)(7)(ii) of Regulation S-X and has determined that the provision of such services is compatible with maintaining the independence of the Registrant's principal accountant.
Item 5. Audit Committee of Listed Registrants.
Not applicable.
Item 6. Schedule of Investments.
The schedule is included as part of the report to shareholders filed under Item 1 of this Form.
Item 7. Disclosure of Proxy Voting Policies and Procedures for Closed-End Management Investment Companies.
Not applicable.
Item 8. Portfolio Managers of Closed-End Management Investment Companies.
Not applicable.
Item 9. Purchases of Equity Securities by Closed-End Management Investment Company and Affiliated Purchasers.
Not applicable.
Item 10. Submission of Matters to a Vote of Security Holders.
Not applicable.
Item 11. Controls and Procedures.
(a) Internal control over financial reporting is under the supervision of the principal executive and financial officers. On December 9, 2020, Mrs. Jane Carten (President) and Mr. Christopher Fankhauser (Treasurer), reviewed the internal control procedures for Saturna Investment Trust and found them reasonable and adequate.
(b) No change.
Item 12. Exhibits
Exhibits included with this filing:
(a)(1) Code of Ethics.
(a)(2) Certification pursuant to Rule 30a-2(a) under the Investment Company Act of 1940 (17 CFR 270.30a-2(a)) is filed and attached hereto as Exhibit 99.CERT.
(a)(3) Not applicable.
(b) Certification pursuant to Rule 30a-2(b) under the Investment Company Act of 1940 (17 CFR 270.30a-2(b)) is furnished and attached hereto as Exhibit 99.906CERT.
(c) Registrant's Rule 30e-3 Notices pursuant to Item 1(b) of Form N-CSR. Attached hereto as EX-99.30e-3Notice.
SIGNATURES
Pursuant to the requirements of the Securities Exchange Act of 1934 and the Investment Company Act of 1940, the registrant has duly caused this report to be signed on its behalf by the undersigned, thereunto duly authorized.
SATURNA INVESTMENT TRUST
By:
/s/ Jane Carten, President
Signature and Title
Jane Carten, President
Printed name and Title
January 29, 2021
Date
Pursuant to the requirements of the Securities Exchange Act of 1934 and the Investment Company Act of 1940, this report has been signed below by the following persons on behalf of the registrant and in the capacities and on the dates indicated.
By:
/s/ Jane Carten, President
Signature and Title
Jane Carten, President
Printed name and Title
January 29, 2021
Date
By:
/s/ Christopher Fankhauser, Treasurer
Signature and Title
Christopher Fankhauser, Treasurer
Printed name and Title
January 29, 2021
Date
# # #