UNITED STATES
SECURITIES AND EXCHANGE COMMISSION
Washington, D.C. 20549
FORM N-CSR
CERTIFIED SHAREHOLDER REPORT OF REGISTERED
MANAGEMENT INVESTMENT COMPANIES
Investment Company Act file number 811-649
Fidelity Puritan Trust
(Exact name of registrant as specified in charter)
245 Summer St., Boston, MA 02210
(Address of principal executive offices) (Zip code)
William C. Coffey, Secretary
245 Summer St.
Boston, Massachusetts 02210
(Name and address of agent for service)
Registrant's telephone number, including area code:
617-563-7000
| |
Date of fiscal year end: | July 31 |
|
|
Date of reporting period: | January 31, 2019 |
Item 1.
Reports to Stockholders
Fidelity® Low-Priced Stock Fund
Semi-Annual Report January 31, 2019 |
 |
Beginning on January 1, 2021, as permitted by regulations adopted by the Securities and Exchange Commission, paper copies of a fund’s shareholder reports will no longer be sent by mail, unless you specifically request paper copies of the reports from the fund or from your financial intermediary, such as a financial advisor, broker-dealer or bank. Instead, the reports will be made available on a website, and you will be notified by mail each time a report is posted and provided with a website link to access the report.
If you already elected to receive shareholder reports electronically, you will not be affected by this change and you need not take any action. You may elect to receive shareholder reports and other communications from a fund electronically, by contacting your financial intermediary. For Fidelity customers, visit Fidelity's web site or call Fidelity using the contact information listed below.
You may elect to receive all future reports in paper free of charge. If you wish to continue receiving paper copies of your shareholder reports, you may contact your financial intermediary or, if you are a Fidelity customer, visit Fidelity’s website, or call Fidelity at the applicable toll-free number listed below. Your election to receive reports in paper will apply to all funds held with the fund complex/your financial intermediary.
| Account Type | Website | Phone Number |
| Brokerage, Mutual Fund, or Annuity Contracts: | fidelity.com/mailpreferences | 1-800-343-3548 |
| Employer Provided Retirement Accounts: | netbenefits.fidelity.com/preferences (choose 'no' under Required Disclosures to continue to print) | 1-800-343-0860 |
| Advisor Sold Accounts Serviced Through Your Financial Intermediary: | Contact Your Financial Intermediary | Your Financial Intermediary's phone number |
| Advisor Sold Accounts Serviced by Fidelity: | institutional.fidelity.com | 1-877-208-0098 |
Contents
To view a fund's proxy voting guidelines and proxy voting record for the 12-month period ended June 30, visit http://www.fidelity.com/proxyvotingresults or visit the Securities and Exchange Commission's (SEC) web site at http://www.sec.gov.
You may also call 1-800-544-8544 if you’re an individual investing directly with Fidelity, call 1-800-835-5092 if you’re a plan sponsor or participant with Fidelity as your recordkeeper or call 1-877-208-0098 on institutional accounts or if you’re an advisor or invest through one to request a free copy of the proxy voting guidelines.
Standard & Poor's, S&P and S&P 500 are registered service marks of The McGraw-Hill Companies, Inc. and have been licensed for use by Fidelity Distributors Corporation.
Other third-party marks appearing herein are the property of their respective owners.
All other marks appearing herein are registered or unregistered trademarks or service marks of FMR LLC or an affiliated company. © 2019 FMR LLC. All rights reserved.
This report and the financial statements contained herein are submitted for the general information of the shareholders of the Fund. This report is not authorized for distribution to prospective investors in the Fund unless preceded or accompanied by an effective prospectus.
A fund files its complete schedule of portfolio holdings with the SEC for the first and third quarters of each fiscal year on Form N-Q. Forms N-Q are available on the SEC’s web site at http://www.sec.gov. A fund's Forms N-Q may be reviewed and copied at the SEC’s Public Reference Room in Washington, DC. Information regarding the operation of the SEC's Public Reference Room may be obtained by calling 1-800-SEC-0330.
For a complete list of a fund's portfolio holdings, view the most recent holdings listing, semiannual report, or annual report on Fidelity's web site at http://www.fidelity.com, http://www.institutional.fidelity.com, or http://www.401k.com, as applicable.
NOT FDIC INSURED •MAY LOSE VALUE •NO BANK GUARANTEE
Neither the Fund nor Fidelity Distributors Corporation is a bank.
Investment Summary (Unaudited)
Top Ten Stocks as of January 31, 2019
| | % of fund's net assets |
| UnitedHealth Group, Inc. | 6.5 |
| Ross Stores, Inc. | 3.1 |
| Metro, Inc. Class A (sub. vtg.) | 2.9 |
| Seagate Technology LLC | 2.6 |
| Next PLC | 2.6 |
| Twenty-First Century Fox, Inc. Class A | 2.5 |
| Best Buy Co., Inc. | 2.4 |
| MetLife, Inc. | 2.2 |
| AutoZone, Inc. | 1.9 |
| Anthem, Inc. | 1.8 |
| | 28.5 |
Top Five Market Sectors as of January 31, 2019
| | % of fund's net assets |
| Consumer Discretionary | 21.0 |
| Information Technology | 14.1 |
| Financials | 13.3 |
| Health Care | 13.3 |
| Consumer Staples | 9.0 |
Asset Allocation (% of fund's net assets)
| As of January 31, 2019* |
| | Stocks | 93.4% |
| | Short-Term Investments and Net Other Assets (Liabilities) | 6.6% |

* Foreign investments - 41.5%
Schedule of Investments January 31, 2019 (Unaudited)
Showing Percentage of Net Assets
| Common Stocks - 93.3% | | | |
| | | Shares | Value (000s) |
| COMMUNICATION SERVICES - 4.0% | | | |
| Diversified Telecommunication Services - 0.0% | | | |
| AT&T, Inc. | | 19,648 | $591 |
| Entertainment - 2.6% | | | |
| Cinemark Holdings, Inc. | | 122,585 | 5,016 |
| Twenty-First Century Fox, Inc.: | | | |
| Class A | | 15,300,099 | 754,448 |
| Class B | | 45,000 | 2,208 |
| Viacom, Inc. Class B (non-vtg.) | | 1,295,823 | 38,123 |
| | | | 799,795 |
| Interactive Media & Services - 0.5% | | | |
| Alphabet, Inc.: | | | |
| Class A (a) | | 1,398 | 1,574 |
| Class C (a) | | 9,375 | 10,466 |
| Yahoo! Japan Corp. | | 50,507,241 | 135,861 |
| | | | 147,901 |
| Media - 0.9% | | | |
| Comcast Corp. Class A | | 2,616,203 | 95,675 |
| Corus Entertainment, Inc. Class B (non-vtg.) | | 583,656 | 2,474 |
| Discovery Communications, Inc.: | | | |
| Class A (a)(b) | | 2,200,955 | 62,463 |
| Class C (non-vtg.) (a) | | 497,265 | 13,252 |
| Gannett Co., Inc. | | 1,043,650 | 11,574 |
| Hyundai HCN | | 2,723,979 | 10,076 |
| Intage Holdings, Inc. (c) | | 3,294,700 | 26,073 |
| MSG Network, Inc. Class A (a) | | 287,770 | 6,446 |
| Multiplus SA | | 536,800 | 3,827 |
| Pico Far East Holdings Ltd. | | 18,472,000 | 6,875 |
| Proto Corp. | | 199,200 | 2,771 |
| RKB Mainichi Broadcasting Corp. | | 42,200 | 2,266 |
| Saga Communications, Inc. Class A | | 396,025 | 13,394 |
| Sky Network Television Ltd. | | 5,826,362 | 7,611 |
| STW Group Ltd. | | 4,086,192 | 1,634 |
| Tegna, Inc. | | 1,094,277 | 12,847 |
| TOW Co. Ltd. (c) | | 1,824,700 | 11,927 |
| TVA Group, Inc. Class B (non-vtg.) (a) | | 3,079,974 | 4,712 |
| WOWOW INC. | | 183,800 | 4,780 |
| | | | 300,677 |
|
| TOTAL COMMUNICATION SERVICES | | | 1,248,964 |
|
| CONSUMER DISCRETIONARY - 21.0% | | | |
| Auto Components - 1.1% | | | |
| ASTI Corp. (b)(c) | | 180,600 | 2,792 |
| ElringKlinger AG (b) | | 696,203 | 6,120 |
| G-Tekt Corp. | | 174,400 | 2,560 |
| Gentex Corp. | | 2,528,592 | 53,556 |
| GUD Holdings Ltd. | | 343,505 | 2,807 |
| Hi-Lex Corp. | | 1,362,300 | 25,977 |
| INFAC Corp. (c) | | 325,139 | 1,030 |
| INZI Controls Co. Ltd. (c) | | 1,483,492 | 11,615 |
| Lear Corp. | | 20,204 | 3,110 |
| Linamar Corp. | | 199,633 | 7,739 |
| Motonic Corp. (c) | | 3,100,000 | 32,465 |
| Murakami Corp. (c) | | 822,700 | 18,988 |
| Nippon Seiki Co. Ltd. | | 2,630,300 | 48,730 |
| Piolax, Inc. (c) | | 2,477,100 | 50,509 |
| S&T Holdings Co. Ltd. (c) | | 885,108 | 10,383 |
| Samsung Climate Control Co. Ltd. (c) | | 499,950 | 4,283 |
| Sewon Precision Industries Co. Ltd. (c) | | 500,000 | 3,371 |
| SJM Co. Ltd. (c) | | 1,282,000 | 3,728 |
| SJM Holdings Co. Ltd. (c) | | 1,078,139 | 3,213 |
| Strattec Security Corp. (c) | | 366,710 | 12,651 |
| Sungwoo Hitech Co. Ltd. | | 2,518,110 | 9,315 |
| TBK Co. Ltd. | | 922,600 | 3,388 |
| Yachiyo Industry Co. Ltd. | | 893,400 | 5,889 |
| Yutaka Giken Co. Ltd. (c) | | 1,223,600 | 22,388 |
| | | | 346,607 |
| Automobiles - 0.0% | | | |
| Kabe Husvagnar AB (B Shares) | | 276,077 | 4,180 |
| Distributors - 0.1% | | | |
| Arata Corp. | | 93,700 | 3,755 |
| Central Automotive Products Ltd. | | 75,200 | 1,069 |
| Chori Co. Ltd. | | 428,900 | 6,241 |
| Nakayamafuku Co. Ltd. | | 623,900 | 3,001 |
| PALTAC Corp. | | 67,600 | 3,240 |
| SPK Corp. | | 252,700 | 5,343 |
| Uni-Select, Inc. | | 1,297,696 | 19,081 |
| | | | 41,730 |
| Diversified Consumer Services - 0.1% | | | |
| Clip Corp. (c) | | 271,000 | 2,010 |
| Cross-Harbour Holdings Ltd. | | 2,413,000 | 3,410 |
| Estacio Participacoes SA | | 365,200 | 3,114 |
| Shingakukai Holdings Co. Ltd. | | 96,800 | 526 |
| Step Co. Ltd. (c) | | 1,073,400 | 12,377 |
| | | | 21,437 |
| Hotels, Restaurants & Leisure - 0.3% | | | |
| Ark Restaurants Corp. | | 104,997 | 1,942 |
| Bluegreen Vacations Corp. | | 231,505 | 3,102 |
| Flanigans Enterprises, Inc. | | 89,704 | 2,086 |
| Greggs PLC | | 165,841 | 3,372 |
| Hiday Hidaka Corp. | | 1,447,400 | 28,397 |
| Ibersol SGPS SA | | 909,072 | 8,761 |
| Koshidaka Holdings Co. Ltd. | | 293,120 | 4,182 |
| Kura Corp. Ltd. | | 10,000 | 516 |
| Sportscene Group, Inc. Class A (c) | | 330,400 | 3,266 |
| Texas Roadhouse, Inc. Class A | | 112,916 | 6,870 |
| The Monogatari Corp. | | 49,800 | 4,311 |
| The Restaurant Group PLC | | 15,844,932 | 30,986 |
| Wyndham Destinations, Inc. | | 122,584 | 5,166 |
| | | | 102,957 |
| Household Durables - 3.6% | | | |
| Abbey PLC (c) | | 1,769,498 | 27,342 |
| Barratt Developments PLC (c) | | 71,981,309 | 508,496 |
| Bellway PLC | | 3,900,885 | 145,152 |
| D.R. Horton, Inc. | | 2,856,506 | 109,833 |
| Dorel Industries, Inc. Class B (sub. vtg.) | | 1,975,129 | 24,547 |
| Emak SpA | | 4,372,303 | 6,556 |
| First Juken Co. Ltd. (c) | | 1,395,400 | 14,553 |
| Flexsteel Industries, Inc. | | 27,732 | 692 |
| Gree Electric Appliances, Inc. of Zhuhai Class A (a) | | 1,200,000 | 7,477 |
| Hamilton Beach Brands Holding Co.: | | | |
| Class A | | 175,916 | 4,598 |
| Class B (a) | | 183,780 | 4,804 |
| Helen of Troy Ltd. (a) | | 1,229,667 | 142,691 |
| Henry Boot PLC | | 2,939,050 | 10,023 |
| Iida Group Holdings Co. Ltd. | | 141,200 | 2,568 |
| M/I Homes, Inc. (a) | | 174,751 | 4,629 |
| Meritage Homes Corp. (a) | | 647,726 | 29,199 |
| P&F Industries, Inc. Class A (c) | | 321,334 | 2,481 |
| PulteGroup, Inc. | | 88,699 | 2,467 |
| Q.E.P. Co., Inc. | | 29,757 | 714 |
| Sanei Architecture Planning Co. Ltd. (c) | | 1,206,400 | 18,275 |
| Taylor Morrison Home Corp. (a) | | 124,907 | 2,361 |
| Token Corp. | | 621,500 | 36,574 |
| Toll Brothers, Inc. | | 104,645 | 3,866 |
| Tupperware Brands Corp. | | 29,255 | 798 |
| | | | 1,110,696 |
| Internet & Direct Marketing Retail - 0.2% | | | |
| Aucnet, Inc. | | 196,600 | 1,577 |
| Belluna Co. Ltd. (c) | | 6,588,000 | 62,115 |
| Liberty Interactive Corp. QVC Group Series A (a) | | 65,279 | 1,420 |
| Moneysupermarket.com Group PLC | | 586,273 | 2,330 |
| | | | 67,442 |
| Leisure Products - 0.1% | | | |
| Brunswick Corp. | | 110,814 | 5,576 |
| Fenix Outdoor AB Class B (a)(d) | | 32,298 | 0 |
| Mars Group Holdings Corp. | | 473,300 | 9,277 |
| Miroku Corp. | | 140,000 | 2,289 |
| Vista Outdoor, Inc. (a) | | 135,639 | 1,354 |
| | | | 18,496 |
| Multiline Retail - 2.8% | | | |
| Big Lots, Inc. (b) | | 1,229,437 | 38,776 |
| Lifestyle China Group Ltd. (a) | | 18,965,000 | 6,753 |
| Lifestyle International Holdings Ltd. | | 21,920,000 | 33,095 |
| Macy's, Inc. | | 52,821 | 1,389 |
| Next PLC (c) | | 12,553,393 | 798,060 |
| Watts Co. Ltd. | | 273,553 | 1,781 |
| | | | 879,854 |
| Specialty Retail - 11.0% | | | |
| Aaron's, Inc. Class A | | 55,013 | 2,754 |
| Abercrombie & Fitch Co. Class A | | 1,225,581 | 26,558 |
| AT-Group Co. Ltd. | | 1,091,200 | 23,542 |
| AutoNation, Inc. (a) | | 78,593 | 3,045 |
| AutoZone, Inc. (a) | | 706,252 | 598,436 |
| Bed Bath & Beyond, Inc. (b)(c) | | 11,340,465 | 171,128 |
| Best Buy Co., Inc. | | 12,293,412 | 728,262 |
| BMTC Group, Inc. (c) | | 3,571,622 | 40,502 |
| Bonia Corp. Bhd (a) | | 2,503,000 | 156 |
| Buffalo Co. Ltd. | | 92,800 | 758 |
| Burlington Stores, Inc. (a) | | 29,834 | 5,123 |
| Cars.com, Inc. (a) | | 398,329 | 10,878 |
| Cash Converters International Ltd. (a) | | 24,060,204 | 4,285 |
| Delek Automotive Systems Ltd. | | 734,400 | 3,313 |
| DSW, Inc. Class A | | 112,200 | 3,057 |
| Dunelm Group PLC | | 797,132 | 7,554 |
| Formosa Optical Technology Co. Ltd. | | 1,362,000 | 2,635 |
| GameStop Corp. Class A | | 3,019,619 | 34,242 |
| Genesco, Inc. (a) | | 360,231 | 16,275 |
| GNC Holdings, Inc. Class A (a) | | 946,566 | 2,887 |
| Goldlion Holdings Ltd. | | 21,874,000 | 9,081 |
| Guess?, Inc. (c) | | 4,841,523 | 94,458 |
| Hour Glass Ltd. | | 8,824,500 | 4,097 |
| IA Group Corp. (c) | | 117,240 | 3,590 |
| JB Hi-Fi Ltd. (b) | | 249,544 | 4,058 |
| John David Group PLC | | 7,878,322 | 47,822 |
| Jumbo SA (c) | | 9,991,435 | 163,309 |
| K's Holdings Corp. | | 4,773,000 | 47,412 |
| Ku Holdings Co. Ltd. | | 897,300 | 6,434 |
| Leon's Furniture Ltd. | | 211,606 | 2,319 |
| Mr. Bricolage SA (c) | | 857,615 | 6,282 |
| Murphy U.S.A., Inc. (a) | | 63,297 | 4,655 |
| Nafco Co. Ltd. (c) | | 1,931,400 | 29,399 |
| Ross Stores, Inc. | | 10,529,188 | 969,949 |
| Sally Beauty Holdings, Inc. (a) | | 3,014,269 | 51,906 |
| Second Chance Properties Ltd. warrants 1/23/20 (a) | | 1,941,600 | 1 |
| Sonic Automotive, Inc. Class A (sub. vtg.) | | 599,368 | 9,170 |
| The Buckle, Inc. (b)(c) | | 4,486,236 | 77,926 |
| The Children's Place Retail Stores, Inc. | | 36,718 | 3,553 |
| Urban Outfitters, Inc. (a) | | 1,843,492 | 59,545 |
| USS Co. Ltd. | | 5,128,900 | 89,653 |
| Vitamin Shoppe, Inc. (a) | | 870,793 | 4,023 |
| Williams-Sonoma, Inc. | | 666,899 | 36,299 |
| | | | 3,410,331 |
| Textiles, Apparel & Luxury Goods - 1.7% | | | |
| Best Pacific International Holdings Ltd. | | 5,800,000 | 1,399 |
| Capri Holdings Ltd. (a) | | 99,816 | 4,240 |
| CRG, Inc. BHD (d) | | 2,503,000 | 55 |
| Deckers Outdoor Corp. (a) | | 38,370 | 4,929 |
| Embry Holdings Ltd. | | 2,153,000 | 637 |
| Ff Group (a)(c)(d) | | 4,347,724 | 19,109 |
| Fossil Group, Inc. (a)(c) | | 4,123,141 | 69,928 |
| Gildan Activewear, Inc. | | 6,788,276 | 229,746 |
| Handsome Co. Ltd. (c) | | 2,000,000 | 66,521 |
| JLM Couture, Inc. (a)(c) | | 159,778 | 1,598 |
| Makalot Industrial Co. Ltd. | | 481,000 | 3,019 |
| McRae Industries, Inc. | | 24,080 | 600 |
| Steven Madden Ltd. | | 212,780 | 6,947 |
| Sun Hing Vision Group Holdings Ltd. (c) | | 19,761,000 | 7,030 |
| Ted Baker PLC | | 98,631 | 2,410 |
| Texwinca Holdings Ltd. | | 48,760,000 | 18,647 |
| Victory City International Holdings Ltd. | | 97,876,723 | 1,322 |
| Youngone Corp. | | 500,000 | 15,596 |
| Youngone Holdings Co. Ltd. (c) | | 889,600 | 49,261 |
| Yue Yuen Industrial (Holdings) Ltd. | | 2,989,000 | 10,195 |
| | | | 513,189 |
|
| TOTAL CONSUMER DISCRETIONARY | | | 6,516,919 |
|
| CONSUMER STAPLES - 9.0% | | | |
| Beverages - 1.8% | | | |
| A.G. Barr PLC | | 2,891,001 | 28,590 |
| Baron de Ley SA (a) | | 110,000 | 13,724 |
| Britvic PLC | | 6,277,652 | 72,498 |
| C&C Group PLC | | 1,398,004 | 5,281 |
| Jinro Distillers Co. Ltd. | | 47,081 | 1,232 |
| Monster Beverage Corp. (a) | | 6,687,845 | 382,812 |
| Muhak Co. Ltd. (c) | | 2,799,256 | 34,600 |
| Olvi PLC (A Shares) | | 108,903 | 4,126 |
| Spritzer Bhd | | 5,120,400 | 2,575 |
| Yantai Changyu Pioneer Wine Co. Ltd. (B Shares) | | 2,799,936 | 5,416 |
| | | | 550,854 |
| Food & Staples Retailing - 5.3% | | | |
| Amsterdam Commodities NV | | 149,751 | 3,322 |
| Aoki Super Co. Ltd. | | 112,100 | 2,779 |
| Australasian Foods Holdco Pty Ltd. (a)(d) | | 3,481,102 | 2,277 |
| Belc Co. Ltd. (c) | | 1,644,700 | 71,722 |
| Casey's General Stores, Inc. | | 23,615 | 3,039 |
| Cosmos Pharmaceutical Corp. | | 956,500 | 182,826 |
| Create SD Holdings Co. Ltd. (c) | | 5,327,900 | 133,729 |
| Daikokutenbussan Co. Ltd. | | 546,100 | 20,530 |
| Dong Suh Companies, Inc. | | 1,050,000 | 18,122 |
| Genky DrugStores Co. Ltd. | | 731,000 | 17,455 |
| Halows Co. Ltd. (c) | | 1,321,000 | 25,492 |
| Kirindo Holdings Co. Ltd. | | 150,600 | 1,909 |
| Kroger Co. | | 50,827 | 1,440 |
| Kusuri No Aoki Holdings Co. Ltd. | | 499,100 | 33,037 |
| Majestic Wine PLC | | 917,119 | 3,290 |
| McColl's Retail Group PLC | | 1,559,191 | 1,178 |
| Medical System Network Co. Ltd. | | 69,300 | 258 |
| Metro, Inc. Class A (sub. vtg.) (c) | | 24,573,253 | 893,386 |
| North West Co., Inc. | | 111,354 | 2,642 |
| Performance Food Group Co. (a) | | 207,217 | 7,079 |
| Qol Holdings Co. Ltd. | | 1,845,600 | 28,787 |
| Retail Partners Co. Ltd. | | 62,400 | 640 |
| Sundrug Co. Ltd. | | 3,019,000 | 96,314 |
| Thai President Foods PCL | | 510,488 | 2,549 |
| Total Produce PLC | | 8,891,473 | 17,301 |
| United Natural Foods, Inc. (a) | | 597,828 | 7,832 |
| Valor Holdings Co. Ltd. | | 249,000 | 6,033 |
| Walgreens Boots Alliance, Inc. | | 38,434 | 2,777 |
| Walmart, Inc. | | 33,820 | 3,241 |
| Welbilt, Inc. (a) | | 149,200 | 2,092 |
| Yaoko Co. Ltd. | | 847,000 | 44,323 |
| | | | 1,637,401 |
| Food Products - 1.7% | | | |
| Carr's Group PLC | | 2,222,871 | 4,818 |
| Cranswick PLC | | 448,989 | 16,984 |
| Dean Foods Co. | | 195,719 | 816 |
| Devro PLC | | 1,146,106 | 2,339 |
| Food Empire Holdings Ltd. (c) | | 38,834,600 | 15,433 |
| Fresh Del Monte Produce, Inc. (c) | | 4,794,929 | 153,342 |
| Hilton Food Group PLC | | 626,320 | 7,623 |
| Inghams Group Ltd. | | 1,671,788 | 5,590 |
| Ingredion, Inc. | | 404,774 | 40,073 |
| Japan Meat Co. Ltd. | | 167,200 | 2,588 |
| Kaveri Seed Co. Ltd. | | 74,873 | 634 |
| Mitsui Sugar Co. Ltd. | | 350,100 | 9,485 |
| Nam Yang Dairy Products | | 10,500 | 5,965 |
| Origin Enterprises PLC (c) | | 9,166,195 | 60,117 |
| Pacific Andes International Holdings Ltd. (a)(d) | | 106,378,500 | 990 |
| Pacific Andes Resources Development Ltd. (a)(d) | | 207,240,893 | 1,693 |
| Pickles Corp. | | 99,200 | 1,786 |
| Rocky Mountain Chocolate Factory, Inc. (c) | | 434,761 | 3,739 |
| S Foods, Inc. | | 400,600 | 14,435 |
| Seaboard Corp. | | 38,000 | 146,838 |
| Select Harvests Ltd. | | 3,050,601 | 13,327 |
| Sunjin Co. Ltd. (a)(c) | | 2,376,955 | 24,893 |
| | | | 533,508 |
| Household Products - 0.0% | | | |
| Central Garden & Pet Co. Class A (non-vtg.) (a) | | 87,318 | 3,110 |
| Personal Products - 0.1% | | | |
| Grape King Bio Ltd. | | 1,500,000 | 10,209 |
| Hengan International Group Co. Ltd. | | 499,000 | 3,904 |
| Natural Alternatives International, Inc. (a) | | 131,176 | 1,464 |
| Sarantis SA (c) | | 3,990,793 | 33,802 |
| | | | 49,379 |
| Tobacco - 0.1% | | | |
| Karelia Tobacco Co., Inc. | | 1,604 | 459 |
| Scandinavian Tobacco Group A/S (e) | | 1,725,231 | 22,311 |
| | | | 22,770 |
|
| TOTAL CONSUMER STAPLES | | | 2,797,022 |
|
| ENERGY - 5.7% | | | |
| Energy Equipment & Services - 1.2% | | | |
| AKITA Drilling Ltd. Class A (non-vtg.) | | 1,467,382 | 3,775 |
| Bristow Group, Inc. (a)(b)(c) | | 2,738,575 | 9,010 |
| Carbo Ceramics, Inc. (a) | | 967,497 | 3,899 |
| Cathedral Energy Services Ltd. (a) | | 1,322,174 | 714 |
| Diamond Offshore Drilling, Inc. (a)(b) | | 4,882,892 | 53,370 |
| Divestco, Inc. (a) | | 2,889,000 | 99 |
| Dril-Quip, Inc. (a) | | 195,040 | 7,302 |
| Ensco PLC Class A (b) | | 11,310,940 | 49,768 |
| Fugro NV (Certificaten Van Aandelen) (a)(b) | | 168,991 | 1,863 |
| Geospace Technologies Corp. (a)(c) | | 1,069,558 | 16,075 |
| Gulf Island Fabrication, Inc. (a) | | 59,663 | 566 |
| John Wood Group PLC | | 576,497 | 4,092 |
| KLX Energy Services Holdings, Inc. (a) | | 99,640 | 2,597 |
| Liberty Oilfield Services, Inc. Class A (b) | | 1,744,482 | 26,534 |
| Oceaneering International, Inc. (a) | | 398,502 | 6,252 |
| Oil States International, Inc. (a) | | 2,303,819 | 39,672 |
| PHX Energy Services Corp. (a) | | 1,364,597 | 2,669 |
| Shinko Plantech Co. Ltd. | | 1,170,600 | 12,391 |
| Smart Sand, Inc. (a)(b) | | 373,659 | 949 |
| Tidewater, Inc. warrants 11/14/24 (a) | | 76,904 | 29 |
| Total Energy Services, Inc. | | 2,039,975 | 15,060 |
| Transocean Ltd. (United States) (a)(b) | | 3,575,977 | 30,646 |
| Unit Corp. (a)(c) | | 5,367,855 | 85,671 |
| | | | 373,003 |
| Oil, Gas & Consumable Fuels - 4.5% | | | |
| Adams Resources & Energy, Inc. | | 133,464 | 5,289 |
| Beach Energy Ltd. | | 15,725,760 | 20,576 |
| Berry Petroleum Corp. | | 798,560 | 9,415 |
| Bonavista Energy Corp. | | 277,445 | 258 |
| Chevron Corp. | | 249,065 | 28,555 |
| China Petroleum & Chemical Corp.: | | | |
| (H Shares) | | 2,496,000 | 2,087 |
| sponsored ADR (H Shares) | | 99,798 | 8,328 |
| CNX Resources Corp. (a) | | 292,210 | 3,547 |
| ConocoPhillips Co. | | 870,151 | 58,901 |
| CONSOL Energy, Inc. (a) | | 146,138 | 5,192 |
| Contango Oil & Gas Co. (a)(c) | | 2,590,332 | 9,791 |
| Delek U.S. Holdings, Inc. | | 58,591 | 1,905 |
| Denbury Resources, Inc. (a) | | 6,381,967 | 12,955 |
| Eni SpA | | 7,259,124 | 123,085 |
| Fuji Kosan Co. Ltd. (c) | | 635,200 | 3,674 |
| Great Eastern Shipping Co. Ltd. | | 4,900,000 | 20,906 |
| Hankook Shell Oil Co. Ltd. | | 48,000 | 14,282 |
| HollyFrontier Corp. | | 52,210 | 2,942 |
| KyungDong City Gas Co. Ltd. (c) | | 208,063 | 7,313 |
| Kyungdong Invest Co. Ltd. (c) | | 84,315 | 3,346 |
| Marathon Oil Corp. | | 3,637,054 | 57,429 |
| Marathon Petroleum Corp. | | 1,954,172 | 129,483 |
| Michang Oil Industrial Co. Ltd. (c) | | 173,900 | 12,037 |
| Murphy Oil Corp. (c) | | 10,756,592 | 294,193 |
| NACCO Industries, Inc. Class A | | 175,916 | 5,995 |
| Newfield Exploration Co. (a) | | 492,552 | 9,004 |
| Oil & Natural Gas Corp. Ltd. | | 42,200,000 | 84,002 |
| QEP Resources, Inc. (a) | | 1,793,591 | 14,833 |
| Reliance Industries Ltd. | | 143,500 | 2,482 |
| Southwestern Energy Co. (a)(c) | | 46,371,867 | 202,645 |
| Star Petroleum Refining PCL | | 7,419,100 | 2,589 |
| Thai Oil PCL (For. Reg.) | | 498,600 | 1,149 |
| Total SA sponsored ADR | | 1,847,562 | 101,117 |
| Whitecap Resources, Inc. | | 454,511 | 1,532 |
| Whiting Petroleum Corp. (a) | | 3,190,000 | 91,330 |
| World Fuel Services Corp. | | 1,515,029 | 37,709 |
| WPX Energy, Inc. (a) | | 1,006,730 | 12,343 |
| | | | 1,402,219 |
|
| TOTAL ENERGY | | | 1,775,222 |
|
| FINANCIALS - 13.3% | | | |
| Banks - 1.0% | | | |
| ACNB Corp. | | 98,862 | 3,599 |
| American National Bankshares, Inc. | | 42,058 | 1,374 |
| Associated Banc-Corp. | | 170,424 | 3,690 |
| BancFirst Corp. | | 65,436 | 3,513 |
| Bank Ireland Group PLC | | 11,417,286 | 68,478 |
| Bank of America Corp. | | 125,525 | 3,574 |
| Camden National Corp. | | 55,235 | 2,238 |
| Cathay General Bancorp | | 623,500 | 23,144 |
| Central Pacific Financial Corp. | | 90,000 | 2,577 |
| Codorus Valley Bancorp, Inc. (c) | | 660,660 | 14,601 |
| Cullen/Frost Bankers, Inc. | | 67,794 | 6,595 |
| Dah Sing Banking Group Ltd. | | 1,706,800 | 3,339 |
| Dimeco, Inc. | | 36,126 | 1,535 |
| East West Bancorp, Inc. | | 25,912 | 1,304 |
| First Bancorp, Puerto Rico | | 1,600,841 | 17,049 |
| First Citizens Bancshares, Inc. | | 8,854 | 3,608 |
| First Hawaiian, Inc. | | 450,760 | 11,598 |
| Hanmi Financial Corp. | | 298,920 | 6,555 |
| Hope Bancorp, Inc. | | 1,250,099 | 17,889 |
| Huntington Bancshares, Inc. | | 82,816 | 1,096 |
| KeyCorp | | 147,775 | 2,434 |
| LCNB Corp. | | 111,218 | 1,835 |
| Meridian Bank/Malvern, PA (a) | | 148,394 | 2,566 |
| NIBC Holding NV (e) | | 249,100 | 2,478 |
| OFG Bancorp | | 433,979 | 8,411 |
| Peoples Bancorp, Inc. | | 50,471 | 1,615 |
| PNC Financial Services Group, Inc. | | 27,311 | 3,350 |
| Popular, Inc. | | 34,483 | 1,883 |
| Regions Financial Corp. | | 203,221 | 3,083 |
| Signature Bank | | 13,455 | 1,713 |
| SpareBank 1 SR-Bank ASA (primary capital certificate) | | 1,229,115 | 13,291 |
| Sparebanken More (primary capital certificate) | | 207,782 | 7,046 |
| Sparebanken Nord-Norge | | 2,307,148 | 18,055 |
| Umpqua Holdings Corp. | | 84,513 | 1,494 |
| Van Lanschot NV (Bearer) | | 1,058,381 | 24,834 |
| Wells Fargo & Co. | | 197,658 | 9,667 |
| | | | 301,111 |
| Capital Markets - 0.9% | | | |
| AllianceBernstein Holding LP | | 697,607 | 21,270 |
| Ameriprise Financial, Inc. | | 13,683 | 1,732 |
| Ares Capital Corp. | | 205,802 | 3,355 |
| Banca Generali SpA | | 144,497 | 3,407 |
| Close Brothers Group PLC | | 97,121 | 1,892 |
| Franklin Resources, Inc. | | 1,334,896 | 39,526 |
| GAMCO Investors, Inc. Class A | | 124,651 | 2,487 |
| Hamilton Lane, Inc. Class A | | 80,412 | 2,917 |
| Lazard Ltd. Class A | | 820,993 | 32,667 |
| OM Asset Management Ltd. | | 203,765 | 2,521 |
| State Street Corp. | | 1,886,681 | 133,766 |
| Tullett Prebon PLC | | 720,569 | 2,977 |
| Waddell & Reed Financial, Inc. Class A (b) | | 2,461,759 | 42,145 |
| | | | 290,662 |
| Consumer Finance - 2.0% | | | |
| Aeon Credit Service (Asia) Co. Ltd. | | 12,704,000 | 11,503 |
| American Express Co. | | 37,402 | 3,841 |
| Discover Financial Services | | 1,148,028 | 77,480 |
| H&T Group PLC | | 536,844 | 2,126 |
| Navient Corp. | | 1,384,205 | 15,780 |
| Nicholas Financial, Inc. (a) | | 358,289 | 3,769 |
| Santander Consumer U.S.A. Holdings, Inc. | | 10,115,595 | 192,803 |
| Synchrony Financial | | 10,742,986 | 322,719 |
| | | | 630,021 |
| Diversified Financial Services - 0.3% | | | |
| AXA Equitable Holdings, Inc. | | 3,587,602 | 66,514 |
| Far East Horizon Ltd. | | 1,899,000 | 1,963 |
| Ricoh Leasing Co. Ltd. | | 762,800 | 23,320 |
| | | | 91,797 |
| Insurance - 8.1% | | | |
| AEGON NV | | 45,543,424 | 234,628 |
| AFLAC, Inc. | | 652,484 | 31,123 |
| Allstate Corp. | | 40,034 | 3,518 |
| Amerisafe, Inc. | | 34,278 | 2,036 |
| April | | 2,179,750 | 52,643 |
| ASR Nederland NV | | 554,986 | 23,415 |
| Assurant, Inc. | | 1,150,780 | 110,924 |
| Aub Group Ltd. | | 245,387 | 2,112 |
| Axis Capital Holdings Ltd. | | 1,594,737 | 85,398 |
| Employers Holdings, Inc. | | 91,729 | 3,887 |
| FBD Holdings PLC | | 144,525 | 1,373 |
| First American Financial Corp. | | 119,639 | 5,992 |
| FNF Group | | 49,914 | 1,805 |
| Great-West Lifeco, Inc. | | 100,028 | 2,147 |
| Hartford Financial Services Group, Inc. | | 1,694,348 | 79,499 |
| Hiscox Ltd. | | 147,141 | 2,737 |
| Hyundai Fire & Marine Insurance Co. Ltd. | | 99,824 | 3,352 |
| Lincoln National Corp. | | 4,458,517 | 260,779 |
| MetLife, Inc. | | 14,858,685 | 678,596 |
| National Western Life Group, Inc. | | 131,647 | 39,929 |
| NN Group NV | | 1,147,320 | 48,484 |
| Primerica, Inc. | | 64,942 | 7,298 |
| Principal Financial Group, Inc. | | 63,783 | 3,194 |
| RenaissanceRe Holdings Ltd. | | 1,665,008 | 229,821 |
| Sony Financial Holdings, Inc. | | 2,436,200 | 46,141 |
| The Travelers Companies, Inc. | | 28,323 | 3,556 |
| Torchmark Corp. | | 88,942 | 7,450 |
| Universal Insurance Holdings, Inc. | | 39,864 | 1,504 |
| Unum Group (c) | | 15,041,271 | 522,835 |
| | | | 2,496,176 |
| Mortgage Real Estate Investment Trusts - 0.5% | | | |
| Annaly Capital Management, Inc. | | 14,627,982 | 152,716 |
| MFA Financial, Inc. | | 183,000 | 1,341 |
| Redwood Trust, Inc. | | 479,617 | 7,736 |
| | | | 161,793 |
| Thrifts & Mortgage Finance - 0.5% | | | |
| ASAX Co. Ltd. | | 399,400 | 2,039 |
| Genworth MI Canada, Inc. | | 3,978,945 | 135,392 |
| Genworth Mortgage Insurance Ltd. | | 6,157,651 | 9,937 |
| WSFS Financial Corp. | | 37,374 | 1,576 |
| | | | 148,944 |
|
| TOTAL FINANCIALS | | | 4,120,504 |
|
| HEALTH CARE - 13.3% | | | |
| Biotechnology - 1.9% | | | |
| Amgen, Inc. | | 2,850,136 | 533,289 |
| Celgene Corp. (a) | | 456,054 | 40,343 |
| Cell Biotech Co. Ltd. | | 50,000 | 1,272 |
| Essex Bio-Technology Ltd. | | 1,205,000 | 792 |
| Gilead Sciences, Inc. | | 192,361 | 13,467 |
| United Therapeutics Corp. (a) | | 12,832 | 1,480 |
| | | | 590,643 |
| Health Care Equipment & Supplies - 0.5% | | | |
| Apex Biotechnology Corp. | | 1,200,000 | 1,221 |
| Arts Optical International Holdings Ltd. (c) | | 20,946,000 | 5,021 |
| Boston Scientific Corp. (a) | | 210,768 | 8,041 |
| Hoshiiryou Sanki Co. Ltd. (c) | | 295,664 | 11,075 |
| LivaNova PLC (a) | | 30,955 | 2,858 |
| Nakanishi, Inc. | | 498,200 | 8,562 |
| Pacific Hospital Supply Co. Ltd. | | 1,100,000 | 2,723 |
| Prim SA (c) | | 1,432,000 | 18,276 |
| ResMed, Inc. | | 75,292 | 7,166 |
| Shandong Weigao Medical Polymer Co. Ltd. (H Shares) | | 928,000 | 778 |
| St.Shine Optical Co. Ltd. | | 2,100,000 | 39,412 |
| Techno Medica Co. Ltd. | | 38,600 | 718 |
| Utah Medical Products, Inc. (c) | | 263,190 | 24,724 |
| Varex Imaging Corp. (a) | | 92,150 | 2,625 |
| Vieworks Co. Ltd. | | 5,000 | 154 |
| Zimmer Biomet Holdings, Inc. | | 149,734 | 16,405 |
| | | | 149,759 |
| Health Care Providers & Services - 9.8% | | | |
| Anthem, Inc. | | 1,852,170 | 561,208 |
| CVS Health Corp. | | 3,009,614 | 197,280 |
| DVx, Inc. (c) | | 695,500 | 6,973 |
| Hi-Clearance, Inc. | | 1,489,000 | 4,890 |
| Humana, Inc. | | 9,450 | 2,920 |
| Laboratory Corp. of America Holdings (a) | | 193,967 | 27,029 |
| Medica Sur SA de CV | | 331,528 | 538 |
| MEDNAX, Inc. (a) | | 586,608 | 21,182 |
| Premier, Inc. (a) | | 195,731 | 7,788 |
| Quest Diagnostics, Inc. | | 28,850 | 2,520 |
| Ship Healthcare Holdings, Inc. | | 79,400 | 2,992 |
| Tokai Corp. | | 341,300 | 8,867 |
| Triple-S Management Corp. (a)(c) | | 1,633,317 | 32,928 |
| United Drug PLC (United Kingdom) | | 2,097,164 | 15,954 |
| UnitedHealth Group, Inc. | | 7,477,069 | 2,020,304 |
| Universal Health Services, Inc. Class B | | 801,200 | 106,183 |
| WIN-Partners Co. Ltd. (c) | | 2,519,500 | 23,200 |
| | | | 3,042,756 |
| Health Care Technology - 0.1% | | | |
| ND Software Co. Ltd. (c) | | 1,200,100 | 14,455 |
| Pharmaceuticals - 1.0% | | | |
| Akorn, Inc. (a) | | 91,594 | 344 |
| Apex Healthcare Bhd | | 47,600 | 97 |
| Bliss Gvs Pharma Ltd. (a) | | 3,750,000 | 8,255 |
| Daewon Pharmaceutical Co. Ltd. (c) | | 1,871,384 | 28,766 |
| Daewoong Co. Ltd. | | 350,000 | 5,758 |
| Daito Pharmaceutical Co. Ltd. | | 109,300 | 2,810 |
| Dawnrays Pharmaceutical Holdings Ltd. | | 35,870,000 | 7,144 |
| DongKook Pharmaceutical Co. Ltd. (c) | | 623,700 | 31,621 |
| FDC Ltd. (a) | | 2,901,164 | 6,734 |
| Fuji Pharma Co. Ltd. | | 646,400 | 10,563 |
| Genomma Lab Internacional SA de CV (a) | | 5,487,600 | 3,805 |
| Indivior PLC (a) | | 16,530,685 | 24,598 |
| Jazz Pharmaceuticals PLC (a) | | 19,280 | 2,427 |
| Korea United Pharm, Inc. | | 239,629 | 5,041 |
| Kwang Dong Pharmaceutical Co. Ltd. (c) | | 3,100,000 | 20,399 |
| Kyung Dong Pharmaceutical Co. Ltd. (c) | | 960,000 | 9,191 |
| Lee's Pharmaceutical Holdings Ltd. | | 7,985,500 | 6,491 |
| Novo Nordisk A/S Series B sponsored ADR | | 1,072,719 | 50,439 |
| Phibro Animal Health Corp. Class A | | 157,425 | 4,915 |
| Recordati SpA | | 1,597,715 | 57,861 |
| Taro Pharmaceutical Industries Ltd. | | 30,148 | 2,868 |
| Vivimed Labs Ltd. (a) | | 600,000 | 211 |
| Whanin Pharmaceutical Co. Ltd. (c) | | 1,750,000 | 30,440 |
| | | | 320,778 |
|
| TOTAL HEALTH CARE | | | 4,118,391 |
|
| INDUSTRIALS - 6.8% | | | |
| Aerospace & Defense - 0.0% | | | |
| Astronics Corp. (a) | | 86,503 | 2,653 |
| Austal Ltd. | | 1,406,047 | 2,044 |
| United Technologies Corp. | | 74,779 | 8,829 |
| Vectrus, Inc. (a) | | 42,600 | 1,073 |
| | | | 14,599 |
| Air Freight & Logistics - 0.0% | | | |
| Air T, Inc. (a) | | 43,777 | 1,270 |
| Airlines - 0.1% | | | |
| Air New Zealand Ltd. | | 1,130,035 | 2,195 |
| American Airlines Group, Inc. | | 260,478 | 9,317 |
| JetBlue Airways Corp. (a) | | 339,705 | 6,111 |
| | | | 17,623 |
| Building Products - 0.1% | | | |
| Builders FirstSource, Inc. (a) | | 232,400 | 3,072 |
| Continental Building Products, Inc. (a) | | 153,500 | 4,043 |
| COVIA Corp. (a)(b) | | 124,577 | 583 |
| Gibraltar Industries, Inc. (a) | | 106,147 | 3,784 |
| Jeld-Wen Holding, Inc. (a) | | 737,667 | 13,160 |
| Kondotec, Inc. (c) | | 1,642,600 | 14,115 |
| Owens Corning | | 41,200 | 2,158 |
| | | | 40,915 |
| Commercial Services & Supplies - 0.6% | | | |
| ABM Industries, Inc. | | 45,276 | 1,548 |
| Aeon Delight Co. Ltd. | | 114,300 | 4,234 |
| AJIS Co. Ltd. (c) | | 889,600 | 25,767 |
| Asia File Corp. Bhd | | 4,480,000 | 2,888 |
| Calian Technologies Ltd. (c) | | 622,924 | 14,464 |
| Civeo Corp. (a)(c) | | 11,886,737 | 30,073 |
| Fursys, Inc. (c) | | 950,000 | 25,961 |
| Lion Rock Group Ltd. | | 19,159,640 | 3,422 |
| Mears Group PLC | | 834,128 | 3,446 |
| Mitie Group PLC | | 13,175,979 | 20,289 |
| NICE Total Cash Management Co., Ltd. | | 1,025,000 | 8,403 |
| Stericycle, Inc. (a) | | 44,480 | 1,961 |
| VICOM Ltd. | | 2,058,500 | 9,312 |
| VSE Corp. (c) | | 836,309 | 27,289 |
| | | | 179,057 |
| Construction & Engineering - 1.2% | | | |
| AECOM (a) | | 6,608,034 | 202,272 |
| Arcadis NV | | 2,132,226 | 27,627 |
| Boustead Projs. Pte Ltd. | | 1,993,087 | 1,340 |
| Boustead Singapore Ltd. | | 4,030,200 | 2,365 |
| Daiichi Kensetsu Corp. (c) | | 1,722,400 | 24,779 |
| EMCOR Group, Inc. | | 154,859 | 10,101 |
| Fluor Corp. | | 160,208 | 5,859 |
| Geumhwa PSC Co. Ltd. (c) | | 360,000 | 9,951 |
| Kyeryong Construction Industrial Co. Ltd. (a)(c) | | 675,000 | 15,625 |
| Meisei Industrial Co. Ltd. | | 1,100,500 | 7,113 |
| Mirait Holdings Corp. | | 398,900 | 5,753 |
| Nippon Rietec Co. Ltd. | | 1,164,700 | 15,654 |
| Severfield PLC | | 2,752,220 | 2,570 |
| Shinnihon Corp. | | 1,568,800 | 14,431 |
| Toshiba Plant Systems & Services Corp. | | 155,900 | 2,925 |
| United Integrated Services Co. | | 4,114,800 | 12,725 |
| | | | 361,090 |
| Electrical Equipment - 0.5% | | | |
| Aichi Electric Co. Ltd. | | 324,200 | 8,617 |
| Aros Quality Group AB | | 722,622 | 11,995 |
| AZZ, Inc. | | 577,589 | 25,847 |
| Bharat Heavy Electricals Ltd. | | 21,400,290 | 19,512 |
| Chiyoda Integre Co. Ltd. | | 328,300 | 5,745 |
| Eaton Corp. PLC | | 48,144 | 3,671 |
| Generac Holdings, Inc. (a) | | 150,384 | 7,960 |
| Hammond Power Solutions, Inc. Class A | | 450,933 | 2,063 |
| I-Sheng Electric Wire & Cable Co. Ltd. (c) | | 12,500,000 | 16,506 |
| Korea Electric Terminal Co. Ltd. (c) | | 709,401 | 26,911 |
| Regal Beloit Corp. | | 46,552 | 3,573 |
| Servotronics, Inc. | | 114,270 | 1,304 |
| TKH Group NV (depositary receipt) | | 199,796 | 9,641 |
| | | | 143,345 |
| Industrial Conglomerates - 0.8% | | | |
| DCC PLC (United Kingdom) | | 2,370,664 | 193,558 |
| General Electric Co. | | 1,106,200 | 11,239 |
| ITT, Inc. | | 89,114 | 4,684 |
| Lifco AB | | 449,407 | 17,980 |
| Mytilineos Holdings SA | | 887,187 | 8,347 |
| Reunert Ltd. | | 1,693,725 | 9,003 |
| | | | 244,811 |
| Machinery - 1.5% | | | |
| Aalberts Industries NV (c) | | 6,622,639 | 231,881 |
| Allison Transmission Holdings, Inc. | | 292,514 | 14,237 |
| ASL Marine Holdings Ltd. (a)(c) | | 45,025,313 | 2,341 |
| Cummins, Inc. | | 24,868 | 3,658 |
| Daiwa Industries Ltd. | | 194,100 | 1,949 |
| Foremost Income Fund (a) | | 2,141,103 | 8,711 |
| Global Brass & Copper Holdings, Inc. | | 95,835 | 2,898 |
| Haitian International Holdings Ltd. | | 8,469,000 | 19,509 |
| Hurco Companies, Inc. | | 53,423 | 2,049 |
| Hwacheon Machine Tool Co. Ltd. (c) | | 219,900 | 8,342 |
| Hyster-Yale Materials Handling: | | | |
| Class A (c) | | 234,592 | 16,325 |
| Class B (c) | | 310,000 | 21,573 |
| Ihara Science Corp. (c) | | 980,000 | 13,496 |
| Jaya Holdings Ltd. (a)(c)(d) | | 3,239,440 | 70 |
| Kyowakogyosyo Co. Ltd. | | 42,800 | 1,743 |
| Luxfer Holdings PLC sponsored | | 211,709 | 4,215 |
| Maruzen Co. Ltd. (c) | | 1,583,300 | 34,697 |
| Miller Industries, Inc. | | 93,579 | 2,812 |
| Mincon Group PLC | | 2,150,992 | 3,078 |
| Nadex Co. Ltd. (c) | | 792,600 | 6,862 |
| Nitchitsu Co. Ltd. | | 55,600 | 960 |
| Rexnord Corp. (a) | | 111,158 | 2,907 |
| Semperit AG Holding (a) | | 379,932 | 6,088 |
| SIMPAC, Inc. | | 1,483,000 | 3,846 |
| Takamatsu Machinery Co. Ltd. | | 322,000 | 2,185 |
| The Weir Group PLC | | 106,220 | 2,097 |
| Tocalo Co. Ltd. | | 3,053,900 | 25,934 |
| Trinity Industrial Corp. | | 843,800 | 4,416 |
| WABCO Holdings, Inc. (a) | | 107,283 | 12,255 |
| | | | 461,134 |
| Marine - 0.0% | | | |
| SITC International Holdings Co. Ltd. | | 4,770,000 | 4,380 |
| Tokyo Kisen Co. Ltd. (c) | | 826,500 | 5,623 |
| | | | 10,003 |
| Professional Services - 0.2% | | | |
| Asiakastieto Group Oyj (e) | | 82,286 | 2,138 |
| Boardroom Ltd. | | 2,564,842 | 1,248 |
| Kelly Services, Inc. Class A (non-vtg.) | | 99,724 | 2,234 |
| McMillan Shakespeare Ltd. | | 1,694,253 | 18,904 |
| Nielsen Holdings PLC | | 725,168 | 18,622 |
| Robert Half International, Inc. | | 47,700 | 3,073 |
| SHL-JAPAN Ltd. | | 101,400 | 1,608 |
| Sporton International, Inc. | | 509,088 | 2,760 |
| Synergie SA | | 127,141 | 3,929 |
| TrueBlue, Inc. (a) | | 131,400 | 3,205 |
| | | | 57,721 |
| Road & Rail - 0.8% | | | |
| Alps Logistics Co. Ltd. (c) | | 2,846,200 | 20,564 |
| Chilled & Frozen Logistics Holdings Co. Ltd. | | 1,094,600 | 11,577 |
| CSX Corp. | | 88,025 | 5,783 |
| Daqin Railway Co. Ltd. (A Shares) | | 32,250,000 | 41,150 |
| Hamakyorex Co. Ltd. (c) | | 1,249,000 | 44,605 |
| Higashi Twenty One Co. Ltd. | | 249,300 | 1,099 |
| Norfolk Southern Corp. | | 48,919 | 8,206 |
| Ryder System, Inc. | | 34,800 | 2,015 |
| Sakai Moving Service Co. Ltd. (c) | | 1,077,700 | 58,770 |
| Trancom Co. Ltd. (c) | | 852,500 | 52,281 |
| | | | 246,050 |
| Trading Companies & Distributors - 0.9% | | | |
| AddTech AB (B Shares) | | 1,079,947 | 21,269 |
| AerCap Holdings NV (a) | | 231,289 | 10,931 |
| Alconix Corp. (c) | | 2,112,700 | 21,820 |
| Goodfellow, Inc. (a)(c) | | 720,477 | 3,131 |
| HD Supply Holdings, Inc. (a) | | 598,997 | 25,122 |
| HERIGE | | 60,773 | 1,614 |
| Houston Wire & Cable Co. (a) | | 75,971 | 476 |
| Itochu Corp. | | 4,143,000 | 75,747 |
| KS Energy Services Ltd. (a) | | 13,126,100 | 254 |
| Lumax International Corp. Ltd. | | 3,123,900 | 6,726 |
| Meiwa Corp. | | 1,711,600 | 6,647 |
| Mitani Shoji Co. Ltd. | | 732,700 | 36,526 |
| MRC Global, Inc. (a) | | 978,058 | 15,277 |
| Otec Corp. | | 123,900 | 2,290 |
| Parker Corp. (c) | | 2,212,000 | 9,199 |
| Richelieu Hardware Ltd. | | 698,469 | 12,497 |
| Senshu Electric Co. Ltd. (c) | | 891,700 | 20,621 |
| Strongco Corp. (a)(c) | | 846,557 | 1,063 |
| Tanaka Co. Ltd. | | 36,600 | 183 |
| TECHNO ASSOCIE Co. Ltd. | | 254,100 | 2,512 |
| Totech Corp. (c) | | 898,300 | 18,086 |
| | | | 291,991 |
| Transportation Infrastructure - 0.1% | | | |
| Anhui Expressway Co. Ltd. (H Shares) | | 9,004,000 | 5,748 |
| Isewan Terminal Service Co. Ltd. | | 1,288,000 | 8,632 |
| James Fisher and Sons PLC | | 78,729 | 1,999 |
| Meiko Transportation Co. Ltd. | | 826,400 | 8,528 |
| Qingdao Port International Co. Ltd. (a)(e) | | 11,669,000 | 7,269 |
| Sinwa Ltd. (c) | | 20,325,600 | 4,077 |
| | | | 36,253 |
|
| TOTAL INDUSTRIALS | | | 2,105,862 |
|
| INFORMATION TECHNOLOGY - 14.1% | | | |
| Communications Equipment - 0.0% | | | |
| F5 Networks, Inc. (a) | | 18,437 | 2,967 |
| InterDigital, Inc. | | 165,428 | 12,045 |
| Juniper Networks, Inc. | | 88,000 | 2,283 |
| | | | 17,295 |
| Electronic Equipment & Components - 4.4% | | | |
| A&D Co. Ltd. | | 598,900 | 3,772 |
| AVX Corp. | | 149,493 | 2,654 |
| Cardtronics PLC (a) | | 100,000 | 2,707 |
| Casa Systems, Inc. (a) | | 96,672 | 1,125 |
| CDW Corp. | | 181,650 | 15,126 |
| CTS Corp. | | 222,790 | 6,321 |
| Daido Signal Co. Ltd. | | 99,000 | 466 |
| Dynapack International Technology Corp. | | 3,200,000 | 4,944 |
| Elec & Eltek International Co. Ltd. | | 1,486,000 | 2,125 |
| Elematec Corp. (c) | | 1,176,500 | 19,366 |
| ePlus, Inc. (a) | | 124,785 | 9,885 |
| Excel Co. Ltd. (c) | | 743,100 | 13,078 |
| Fabrinet | | 82,800 | 4,706 |
| Hi-P International Ltd. | | 11,889,100 | 8,169 |
| Hon Hai Precision Industry Co. Ltd. (Foxconn) | | 145,980,912 | 338,488 |
| IDIS Holdings Co. Ltd. (c) | | 800,000 | 9,637 |
| Image Sensing Systems, Inc. (a) | | 64,236 | 332 |
| Insight Enterprises, Inc. (a) | | 309,511 | 14,213 |
| INTOPS Co. Ltd. (c) | | 1,719,800 | 22,881 |
| Jabil, Inc. | | 119,594 | 3,187 |
| Keysight Technologies, Inc. (a) | | 925,168 | 68,481 |
| Kingboard Chemical Holdings Ltd. (c) | | 75,779,500 | 266,649 |
| Kingboard Laminates Holdings Ltd. | | 3,711,500 | 3,841 |
| Muramoto Electronic Thailand PCL (For. Reg.) (c) | | 1,224,100 | 8,385 |
| Nippo Ltd. (c) | | 734,000 | 2,567 |
| PAX Global Technology Ltd. | | 4,061,000 | 1,781 |
| Philips Lighting NV (e) | | 76,964 | 1,909 |
| Pinnacle Technology Holdings Ltd. | | 7,310,968 | 9,646 |
| Plexus Corp. (a) | | 145,745 | 8,179 |
| Redington India Ltd. | | 13,947,410 | 14,427 |
| Sanmina Corp. (a) | | 24,380 | 761 |
| ScanSource, Inc. (a)(c) | | 1,425,336 | 54,605 |
| Shibaura Electronics Co. Ltd. (c) | | 624,100 | 21,486 |
| Sigmatron International, Inc. (a) | | 170,092 | 452 |
| Simplo Technology Co. Ltd. | | 6,300,000 | 46,273 |
| SYNNEX Corp. (c) | | 2,725,119 | 263,683 |
| Tomen Devices Corp. (c) | | 536,200 | 11,342 |
| Tripod Technology Corp. | | 1,465,000 | 3,943 |
| TTM Technologies, Inc. (a) | | 922,817 | 10,594 |
| UKC Holdings Corp. (c) | | 991,000 | 17,450 |
| VST Holdings Ltd. (c) | | 118,407,600 | 57,374 |
| Wayside Technology Group, Inc. (c) | | 337,417 | 3,543 |
| Wireless Telecom Group, Inc. (a) | | 249,058 | 428 |
| | | | 1,360,981 |
| IT Services - 3.7% | | | |
| ALTEN | | 590,659 | 56,553 |
| Amdocs Ltd. | | 6,199,773 | 346,443 |
| Argo Graphics, Inc. | | 392,200 | 13,988 |
| CACI International, Inc. Class A (a) | | 63,264 | 10,576 |
| Carbonite, Inc. (a) | | 305,051 | 8,737 |
| Computer Services, Inc. | | 257,424 | 14,416 |
| CSE Global Ltd. (c) | | 40,531,500 | 12,946 |
| Data#3 Ltd. | | 2,794,397 | 3,250 |
| Dimerco Data System Corp. | | 510,000 | 598 |
| E-Credible Co. Ltd. | | 129,349 | 1,866 |
| eClerx Services Ltd. (a) | | 1,684,608 | 25,505 |
| EOH Holdings Ltd. (a) | | 6,369,066 | 12,811 |
| Estore Corp. | | 251,400 | 1,740 |
| ExlService Holdings, Inc. (a) | | 176,082 | 10,125 |
| Gabia, Inc. (c) | | 975,000 | 5,750 |
| Indra Sistemas SA (a)(c) | | 12,563,000 | 129,129 |
| Know IT AB (c) | | 1,387,101 | 25,080 |
| Leidos Holdings, Inc. | | 548,856 | 31,834 |
| Maximus, Inc. | | 267,474 | 18,758 |
| Net 1 UEPS Technologies, Inc. (a) | | 458,939 | 1,308 |
| NIC, Inc. | | 349,824 | 5,737 |
| Nice Information & Telecom, Inc. | | 125,020 | 2,203 |
| Sabre Corp. | | 68,966 | 1,585 |
| Science Applications International Corp. | | 355,260 | 23,852 |
| Societe Pour L'Informatique Industrielle SA (c) | | 1,651,275 | 40,069 |
| Softcreate Co. Ltd. | | 599,900 | 7,297 |
| The Western Union Co. | | 17,836,330 | 325,513 |
| Total System Services, Inc. | | 121,982 | 10,931 |
| TravelSky Technology Ltd. (H Shares) | | 1,001,000 | 2,719 |
| WNS Holdings Ltd. sponsored ADR (a) | | 73,090 | 3,566 |
| | | | 1,154,885 |
| Semiconductors & Semiconductor Equipment - 0.6% | | | |
| Amkor Technology, Inc. (a) | | 199,747 | 1,598 |
| Axell Corp. | | 399,400 | 1,914 |
| Boe Varitronix Ltd. (b) | | 5,016,000 | 1,304 |
| Cirrus Logic, Inc. (a) | | 89,995 | 3,343 |
| Entegris, Inc. | | 279,317 | 9,231 |
| Integrated Device Technology, Inc. (a) | | 188,112 | 9,189 |
| Leeno Industrial, Inc. (c) | | 575,000 | 25,844 |
| Melexis NV | | 1,030,000 | 72,623 |
| Miraial Co. Ltd. | | 149,400 | 1,564 |
| Nanometrics, Inc. (a) | | 278,735 | 8,527 |
| Phison Electronics Corp. | | 1,900,000 | 15,769 |
| Powertech Technology, Inc. | | 10,000,000 | 23,484 |
| Semtech Corp. (a) | | 49,324 | 2,395 |
| Trio-Tech International (a)(c) | | 223,799 | 692 |
| United Microelectronics Corp. | | 4,331,000 | 1,655 |
| | | | 179,132 |
| Software - 2.1% | | | |
| AdaptIT Holdings Ltd. | | 2,505,385 | 1,131 |
| ANSYS, Inc. (a) | | 2,925,085 | 480,738 |
| Aspen Technology, Inc. (a) | | 95,900 | 9,267 |
| Ebix, Inc. (b) | | 1,444,983 | 82,537 |
| ICT Automatisering NV (c) | | 473,967 | 6,347 |
| InfoVine Co. Ltd. (c) | | 175,000 | 3,720 |
| j2 Global, Inc. | | 86,843 | 6,527 |
| Jorudan Co. Ltd. (c) | | 377,600 | 3,453 |
| KSK Co., Ltd. (c) | | 529,600 | 8,163 |
| Micro Focus International PLC | | 227,056 | 4,329 |
| NetGem SA | | 846,825 | 1,066 |
| Nucleus Software Exports Ltd. | | 600,000 | 3,004 |
| Pegasystems, Inc. | | 147,160 | 8,284 |
| Pro-Ship, Inc. | | 503,200 | 6,227 |
| RealPage, Inc. (a) | | 199,910 | 11,149 |
| Vitec Software Group AB | | 548,943 | 4,890 |
| Zensar Technologies Ltd. | | 3,500,000 | 11,081 |
| | | | 651,913 |
| Technology Hardware, Storage & Peripherals - 3.3% | | | |
| Compal Electronics, Inc. | | 67,500,000 | 40,492 |
| HP, Inc. | | 6,137,959 | 135,219 |
| Seagate Technology LLC (c) | | 18,194,679 | 805,660 |
| Super Micro Computer, Inc. (a) | | 1,196,297 | 18,064 |
| TPV Technology Ltd. | | 69,350,000 | 9,641 |
| Western Digital Corp. | | 41,616 | 1,872 |
| | | | 1,010,948 |
|
| TOTAL INFORMATION TECHNOLOGY | | | 4,375,154 |
|
| MATERIALS - 3.7% | | | |
| Chemicals - 2.4% | | | |
| Axalta Coating Systems Ltd. (a) | | 481,384 | 12,333 |
| C. Uyemura & Co. Ltd. | | 382,400 | 22,398 |
| Cabot Corp. | | 15,292 | 717 |
| Chase Corp. (c) | | 618,730 | 62,380 |
| Core Molding Technologies, Inc. (c) | | 677,877 | 5,898 |
| Deepak Fertilisers and Petrochemicals Corp. Ltd. | | 1,150,000 | 1,897 |
| DowDuPont, Inc. | | 95,639 | 5,146 |
| EcoGreen International Group Ltd. (c) | | 49,942,080 | 9,869 |
| FMC Corp. | | 1,188,929 | 94,877 |
| Fujikura Kasei Co., Ltd. (c) | | 2,701,400 | 13,938 |
| Fuso Chemical Co. Ltd. | | 573,700 | 11,219 |
| Gujarat Narmada Valley Fertilizers Co. | | 4,800,000 | 22,218 |
| Gujarat State Fertilizers & Chemicals Ltd. (c) | | 28,500,000 | 38,999 |
| Honshu Chemical Industry Co. Ltd. (c) | | 760,000 | 8,394 |
| Huntsman Corp. | | 294,260 | 6,465 |
| Innospec, Inc. | | 796,100 | 55,942 |
| JSR Corp. | | 261,200 | 4,211 |
| KPC Holdings Corp. | | 55,171 | 2,956 |
| KPX Chemical Co. Ltd. (c) | | 163,083 | 7,770 |
| KPX Green Chemical Co. Ltd. | | 17,839 | 57 |
| Miwon Chemicals Co. Ltd. | | 55,095 | 1,998 |
| Miwon Commercial Co. Ltd. | | 13,819 | 3,093 |
| Muto Seiko Co. Ltd. | | 237,400 | 1,146 |
| Nihon Parkerizing Co. Ltd. | | 331,600 | 3,915 |
| Nippon Soda Co. Ltd. | | 313,800 | 7,945 |
| SK Kaken Co. Ltd. | | 54,800 | 23,822 |
| Soken Chemical & Engineer Co. Ltd. (c) | | 664,600 | 11,410 |
| T&K Toka Co. Ltd. (c) | | 1,340,800 | 11,965 |
| Thai Carbon Black PCL (For. Reg.) (a) | | 11,431,600 | 17,199 |
| Thai Rayon PCL: | | | |
| (For. Reg.) | | 2,709,700 | 3,470 |
| NVDR | | 85,200 | 109 |
| The Chemours Co. LLC | | 253,675 | 9,069 |
| The Mosaic Co. | | 2,794,992 | 90,222 |
| UPL Ltd. (a) | | 875,000 | 9,698 |
| Westlake Chemical Corp. | | 106,175 | 7,846 |
| Yara International ASA | | 3,394,712 | 140,112 |
| Yip's Chemical Holdings Ltd. | | 25,598,000 | 8,071 |
| | | | 738,774 |
| Construction Materials - 0.1% | | | |
| Brampton Brick Ltd. Class A (sub. vtg.) (a) | | 669,553 | 3,470 |
| Mitani Sekisan Co. Ltd. (c) | | 1,485,000 | 34,887 |
| RHI Magnesita NV | | 43,713 | 2,426 |
| | | | 40,783 |
| Containers & Packaging - 0.3% | | | |
| AMVIG Holdings Ltd. | | 5,481,000 | 1,250 |
| Chuoh Pack Industry Co. Ltd. (c) | | 420,300 | 4,746 |
| Kohsoku Corp. (c) | | 1,731,300 | 16,037 |
| Mayr-Melnhof Karton AG | | 17,244 | 2,270 |
| Pact Group Holdings Ltd. | | 687,021 | 1,893 |
| Samhwa Crown & Closure Co. Ltd. | | 50,000 | 2,110 |
| Silgan Holdings, Inc. | | 246,233 | 6,801 |
| The Pack Corp. (c) | | 1,555,200 | 41,134 |
| | | | 76,241 |
| Metals & Mining - 0.8% | | | |
| Ausdrill Ltd. | | 10,864,997 | 9,951 |
| Chubu Steel Plate Co. Ltd. | | 412,800 | 2,308 |
| Cleveland-Cliffs, Inc. (b) | | 12,750,232 | 136,555 |
| Compania de Minas Buenaventura SA sponsored ADR | | 2,248,269 | 35,185 |
| Granges AB | | 261,283 | 2,505 |
| Hill & Smith Holdings PLC | | 796,721 | 11,537 |
| Nucor Corp. | | 28,204 | 1,727 |
| Orvana Minerals Corp. (a) | | 762,104 | 110 |
| Pacific Metals Co. Ltd. | | 346,800 | 9,271 |
| Steel Dynamics, Inc. | | 73,609 | 2,693 |
| Tohoku Steel Co. Ltd. (c) | | 623,500 | 7,653 |
| Tokyo Tekko Co. Ltd. (c) | | 759,400 | 8,324 |
| Universal Stainless & Alloy Products, Inc. (a) | | 73,367 | 1,315 |
| Warrior Metropolitan Coal, Inc. | | 1,049,367 | 30,148 |
| Webco Industries, Inc. (a) | | 7,568 | 916 |
| Worthington Industries, Inc. | | 30,731 | 1,159 |
| | | | 261,357 |
| Paper & Forest Products - 0.1% | | | |
| Louisiana-Pacific Corp. | | 104,870 | 2,557 |
| Stella-Jones, Inc. | | 594,463 | 19,183 |
| Western Forest Products, Inc. | | 1,942,300 | 2,971 |
| | | | 24,711 |
|
| TOTAL MATERIALS | | | 1,141,866 |
|
| REAL ESTATE - 0.4% | | | |
| Equity Real Estate Investment Trusts (REITs) - 0.2% | | | |
| Colony Capital, Inc. | | 1,904,103 | 11,558 |
| Corrections Corp. of America | | 1,481,670 | 29,441 |
| Four Corners Property Trust, Inc. | | 157,272 | 4,441 |
| National Health Investors, Inc. | | 28,323 | 2,358 |
| NSI NV | | 8,433 | 355 |
| Public Storage | | 12,956 | 2,753 |
| Sabra Health Care REIT, Inc. | | 189,673 | 3,896 |
| Spirit Realty Capital, Inc. | | 87,004 | 3,456 |
| Store Capital Corp. | | 156,756 | 5,066 |
| Ventas, Inc. | | 55,135 | 3,556 |
| VEREIT, Inc. | | 339,864 | 2,746 |
| | | | 69,626 |
| Real Estate Management & Development - 0.2% | | | |
| Anabuki Kosan, Inc. | | 42,750 | 1,083 |
| CBRE Group, Inc. (a) | | 49,814 | 2,279 |
| Century21 Real Estate Japan Ltd. | | 124,600 | 1,359 |
| Devine Ltd. (a) | | 1,539,998 | 241 |
| IMMOFINANZ Immobilien Anlagen AG | | 102,047 | 2,698 |
| Jones Lang LaSalle, Inc. | | 21,763 | 3,121 |
| LSL Property Services PLC | | 1,415,519 | 4,641 |
| Relo Group, Inc. | | 1,323,000 | 34,762 |
| Selvaag Bolig ASA | | 940,800 | 4,836 |
| Servcorp Ltd. | | 839,856 | 1,795 |
| Sino Land Ltd. | | 1,885,954 | 3,391 |
| Tejon Ranch Co. (a) | | 430,503 | 8,102 |
| Wing Tai Holdings Ltd. | | 1,717,700 | 2,616 |
| | | | 70,924 |
|
| TOTAL REAL ESTATE | | | 140,550 |
|
| UTILITIES - 2.0% | | | |
| Electric Utilities - 1.7% | | | |
| Edison International | | 299,449 | 17,060 |
| Exelon Corp. | | 2,907,804 | 138,877 |
| PG&E Corp. (a)(b) | | 4,500,350 | 58,505 |
| PPL Corp. | | 10,231,234 | 320,442 |
| | | | 534,884 |
| Gas Utilities - 0.1% | | | |
| Busan City Gas Co. Ltd. | | 50,971 | 1,805 |
| China Resource Gas Group Ltd. | | 678,000 | 2,668 |
| Hokuriku Gas Co. | | 152,100 | 4,280 |
| K&O Energy Group, Inc. | | 323,800 | 4,296 |
| Keiyo Gas Co. Ltd. | | 118,500 | 3,181 |
| Star Gas Partners LP | | 197,441 | 1,807 |
| | | | 18,037 |
| Independent Power and Renewable Electricity Producers - 0.1% | | | |
| Mega First Corp. Bhd (c) | | 32,000,045 | 30,859 |
| Mega First Corp. Bhd warrants 4/8/20 (a) | | 3,800,000 | 1,642 |
| The AES Corp. | | 100,000 | 1,639 |
| | | | 34,140 |
| Multi-Utilities - 0.1% | | | |
| CMS Energy Corp. | | 312,707 | 16,305 |
| Water Utilities - 0.0% | | | |
| Manila Water Co., Inc. | | 5,598,900 | 2,953 |
|
| TOTAL UTILITIES | | | 606,319 |
|
| TOTAL COMMON STOCKS | | | |
| (Cost $16,024,888) | | | 28,946,773 |
|
| Nonconvertible Preferred Stocks - 0.1% | | | |
| CONSUMER STAPLES - 0.0% | | | |
| Food Products - 0.0% | | | |
| Nam Yang Dairy Products | | 4,917 | 891 |
| INDUSTRIALS - 0.0% | | | |
| Industrial Conglomerates - 0.0% | | | |
| Steel Partners Holdings LP Series A, 6.00% | | 162,626 | 3,614 |
| MATERIALS - 0.1% | | | |
| Construction Materials - 0.1% | | | |
| Buzzi Unicem SpA (Risparmio Shares) | | 1,526,381 | 18,589 |
| TOTAL NONCONVERTIBLE PREFERRED STOCKS | | | |
| (Cost $15,730) | | | 23,094 |
| | | Principal Amount (000s) | Value (000s) |
|
| Nonconvertible Bonds - 0.0% | | | |
| ENERGY - 0.0% | | | |
| Oil, Gas & Consumable Fuels - 0.0% | | | |
| Centrus Energy Corp. 8.25% 2/28/27 (e) | | | |
| (Cost $10,139) | | 4,587 | 3,578 |
| | | Shares | Value (000s) |
|
| Money Market Funds - 7.8% | | | |
| Fidelity Cash Central Fund, 2.43% (f) | | 2,018,554,923 | 2,018,959 |
| Fidelity Securities Lending Cash Central Fund 2.43% (f)(g) | | 413,770,209 | 413,812 |
| TOTAL MONEY MARKET FUNDS | | | |
| (Cost $2,432,406) | | | 2,432,771 |
| TOTAL INVESTMENT IN SECURITIES - 101.2% | | | |
| (Cost $18,483,163) | | | 31,406,216 |
| NET OTHER ASSETS (LIABILITIES) - (1.2)% | | | (386,595) |
| NET ASSETS - 100% | | | $31,019,621 |
Values shown as $0 in the Schedule of Investments may reflect amounts less than $500.
Legend
(a) Non-income producing
(b) Security or a portion of the security is on loan at period end.
(c) Affiliated company
(d) Level 3 security
(e) Security exempt from registration under Rule 144A of the Securities Act of 1933. These securities may be resold in transactions exempt from registration, normally to qualified institutional buyers. At the end of the period, the value of these securities amounted to $39,683,000 or 0.1% of net assets.
(f) Affiliated fund that is generally available only to investment companies and other accounts managed by Fidelity Investments. The rate quoted is the annualized seven-day yield of the fund at period end. A complete unaudited listing of the fund's holdings as of its most recent quarter end is available upon request. In addition, each Fidelity Central Fund's financial statements are available on the SEC's website or upon request.
(g) Investment made with cash collateral received from securities on loan.
Affiliated Central Funds
Information regarding fiscal year to date income earned by the Fund from investments in Fidelity Central Funds is as follows:
| Fund | Income earned |
| | (Amounts in thousands) |
| Fidelity Cash Central Fund | $27,513 |
| Fidelity Securities Lending Cash Central Fund | 2,946 |
| Total | $30,459 |
Amounts in the income column in the above table include any capital gain distributions from underlying funds, which are presented in the corresponding line-item in the Statement of Operations, if applicable.
Other Affiliated Issuers
An affiliated company is a company in which the Fund has ownership of at least 5% of the voting securities. Fiscal year to date transactions with companies which are or were affiliates are as follows:
| Affiliate (Amounts in thousands) | Value, beginning of period | Purchases | Sales Proceeds(a) | Dividend Income | Realized Gain (loss) | Change in Unrealized appreciation (depreciation) | Value, end of period |
| Aalberts Industries NV | $301,560 | $-- | $806 | $-- | $571 | $(69,444) | $231,881 |
| Abbey PLC | 31,773 | -- | 104 | 2,222 | 83 | (4,410) | 27,342 |
| Accell Group NV | 36,577 | -- | 37,155 | -- | 92 | 486 | -- |
| Air T, Inc. | 6,043 | -- | 4,789 | -- | 3,185 | (3,169) | -- |
| AJIS Co. Ltd. | 27,747 | -- | 90 | -- | 64 | (1,954) | 25,767 |
| Alconix Corp. | 32,597 | -- | 81 | 322 | 34 | (10,730) | 21,820 |
| Alps Logistics Co. Ltd. | 21,765 | -- | 79 | 205 | 40 | (1,162) | 20,564 |
| Arts Optical International Holdings Ltd. | 5,935 | -- | 397 | 143 | (350) | (167) | 5,021 |
| ASL Marine Holdings Ltd. | 3,319 | -- | 7 | -- | (6) | (965) | 2,341 |
| ASTI Corp. | 3,940 | -- | 11 | -- | 5 | (1,142) | 2,792 |
| Axell Corp. | 5,341 | -- | 1,994 | -- | (9,965) | 8,532 | -- |
| Barratt Developments PLC | 506,341 | -- | 1,524 | 33,644 | 1,008 | 2,671 | 508,496 |
| Bed Bath & Beyond, Inc. | 38,749 | 118,462 | 399 | 2,149 | (15) | 14,331 | 171,128 |
| Belc Co. Ltd. | 79,124 | -- | 295 | 452 | 246 | (7,353) | 71,722 |
| Belluna Co. Ltd. | 81,345 | -- | 4,067 | 404 | 1,689 | (16,852) | 62,115 |
| BMTC Group, Inc. | 42,943 | -- | 670 | 318 | 642 | (2,413) | 40,502 |
| Bristow Group, Inc. | 30,021 | 6,739 | 29 | -- | (63) | (27,658) | 9,010 |
| Calian Technologies Ltd. | 15,163 | -- | 50 | 226 | 33 | (682) | 14,464 |
| Chase Corp. | 83,869 | -- | 7,172 | 497 | 6,324 | (20,641) | 62,380 |
| Chuoh Pack Industry Co. Ltd. | 5,281 | -- | 17 | 67 | 8 | (526) | 4,746 |
| Civeo Corp. | 45,452 | -- | 65 | -- | (56) | (15,258) | 30,073 |
| Clip Corp. | 2,255 | -- | 8 | -- | 2 | (239) | 2,010 |
| Codorus Valley Bancorp, Inc. | 19,497 | 215 | 53 | 203 | 43 | (5,101) | 14,601 |
| Contango Oil & Gas Co. | 14,584 | -- | 33 | -- | 4 | (4,764) | 9,791 |
| Core Molding Technologies, Inc. | 5,129 | 2,676 | 19 | -- | 13 | (1,901) | 5,898 |
| Create SD Holdings Co. Ltd. | 132,942 | -- | 491 | 762 | 377 | 901 | 133,729 |
| CSE Global Ltd. | 13,446 | -- | 44 | 371 | 6 | (462) | 12,946 |
| Daewon Pharmaceutical Co. Ltd. | 32,353 | -- | -- | -- | -- | (3,587) | 28,766 |
| Daiichi Kensetsu Corp. | 27,504 | -- | 92 | -- | 54 | (2,687) | 24,779 |
| DongKook Pharmaceutical Co. Ltd. | 35,177 | -- | -- | 242 | -- | (3,556) | 31,621 |
| DVx, Inc. | 8,927 | -- | 24 | -- | 16 | (1,946) | 6,973 |
| EcoGreen International Group Ltd. | 10,664 | -- | 35 | 96 | 8 | (768) | 9,869 |
| Elematec Corp. | 27,752 | -- | 81 | 283 | 43 | (8,348) | 19,366 |
| Estore Corp. | 2,452 | -- | 257 | -- | 74 | (529) | -- |
| Excel Co. Ltd. | 16,942 | -- | 49 | 60 | 21 | (3,836) | 13,078 |
| Ff Group | 24,491 | -- | 68 | -- | (96) | (5,218) | 19,109 |
| First Juken Co. Ltd. | 17,548 | -- | 55 | 247 | 32 | (2,972) | 14,553 |
| Food Empire Holdings Ltd. | 17,941 | -- | 101 | -- | 24 | (2,431) | 15,433 |
| Fossil Group, Inc. | 108,416 | -- | 265 | -- | 230 | (38,453) | 69,928 |
| Fresh Del Monte Produce, Inc. | 174,685 | -- | 535 | 1,444 | 167 | (20,975) | 153,342 |
| Fuji Kosan Co. Ltd. | 3,729 | -- | 12 | -- | (2) | (41) | 3,674 |
| Fujikura Kasei Co., Ltd. | 15,712 | -- | 54 | 173 | 9 | (1,729) | 13,938 |
| Fursys, Inc. | 25,681 | -- | -- | 567 | -- | 280 | 25,961 |
| Gabia, Inc. | 8,126 | -- | -- | 22 | -- | (2,376) | 5,750 |
| Geospace Technologies Corp. | 16,165 | -- | 1,170 | -- | (1,083) | 2,163 | 16,075 |
| Geumhwa PSC Co. Ltd. | 10,669 | -- | -- | 242 | -- | (718) | 9,951 |
| Goodfellow, Inc. | 4,058 | -- | 11 | -- | 4 | (920) | 3,131 |
| Guess?, Inc. | 111,897 | -- | 2,014 | 2,212 | (703) | (14,722) | 94,458 |
| Gujarat State Fertilizers & Chemicals Ltd. | 48,562 | -- | -- | 863 | -- | (9,563) | 38,999 |
| Halows Co. Ltd. | 29,828 | 772 | 103 | 125 | 73 | (5,078) | 25,492 |
| Hamakyorex Co. Ltd. | 43,329 | -- | 162 | 300 | 100 | 1,338 | 44,605 |
| Handsome Co. Ltd. | 67,806 | -- | -- | 522 | -- | (1,285) | 66,521 |
| Hanger, Inc. | 43,651 | -- | 48,458 | -- | (7,242) | 12,049 | -- |
| Helen of Troy Ltd. | 192,471 | -- | 57,369 | -- | 55,299 | (47,963) | -- |
| Hiday Hidaka Corp. | 39,244 | -- | 7,849 | 247 | 5,704 | (8,702) | -- |
| Honshu Chemical Industry Co. Ltd. | 7,715 | -- | 29 | 61 | 18 | 690 | 8,394 |
| Hoshiiryou Sanki Co. Ltd. | 10,891 | -- | 105 | 71 | 25 | 264 | 11,075 |
| Hwacheon Machine Tool Co. Ltd. | 10,270 | -- | -- | 205 | -- | (1,928) | 8,342 |
| Hyster-Yale Materials Handling Class A | 15,257 | 208 | 53 | 146 | 33 | 880 | 16,325 |
| Hyster-Yale Materials Handling Class B | 20,386 | -- | -- | 192 | -- | 1,187 | 21,573 |
| I-Sheng Electric Wire & Cable Co. Ltd. | 17,495 | -- | -- | 4 | -- | (989) | 16,506 |
| IA Group Corp. | 3,987 | -- | 11 | 56 | 1 | (387) | 3,590 |
| ICT Automatisering NV | 8,682 | -- | 280 | -- | 65 | (2,120) | 6,347 |
| IDIS Holdings Co. Ltd. | 10,166 | -- | -- | 119 | -- | (529) | 9,637 |
| Ihara Science Corp. | 19,975 | -- | 56 | -- | 40 | (6,463) | 13,496 |
| Indra Sistemas SA | 156,113 | -- | 2,751 | -- | (3,669) | (20,564) | 129,129 |
| INFAC Corp. | 1,314 | -- | -- | 32 | -- | (284) | 1,030 |
| InfoVine Co. Ltd. | 3,709 | -- | -- | 141 | -- | 11 | 3,720 |
| Intage Holdings, Inc. | 34,244 | -- | 101 | -- | 62 | (8,132) | 26,073 |
| Intelligent Digital Integrated Security Co. Ltd. | 7,137 | -- | 19,559 | -- | 12,178 | 244 | -- |
| INTOPS Co. Ltd. | 14,024 | -- | -- | 256 | -- | 8,857 | 22,881 |
| INZI Controls Co. Ltd. | 7,407 | -- | 272 | 170 | 150 | 4,330 | 11,615 |
| Isra Vision AG | 76,909 | -- | 66,836 | -- | 60,402 | (70,475) | -- |
| Jaya Holdings Ltd. | 69 | -- | -- | -- | -- | 1 | 70 |
| JLM Couture, Inc. | 1,267 | -- | 6 | -- | 3 | 334 | 1,598 |
| Jorudan Co. Ltd. | 4,066 | -- | 401 | 42 | 14 | (226) | 3,453 |
| Jumbo SA | 160,642 | -- | 533 | 2,100 | 389 | 2,811 | 163,309 |
| Kingboard Chemical Holdings Ltd. | 265,008 | -- | 743 | 10,673 | 604 | 1,780 | 266,649 |
| Know IT AB | 27,548 | -- | 89 | -- | 50 | (2,429) | 25,080 |
| Kohsoku Corp. | 21,243 | -- | 62 | 201 | 29 | (5,173) | 16,037 |
| Kondotec, Inc. | 14,329 | 752 | 52 | 166 | 42 | (956) | 14,115 |
| Korea Electric Terminal Co. Ltd. | 28,981 | 321 | -- | 238 | -- | (2,391) | 26,911 |
| KPX Chemical Co. Ltd. | 9,652 | -- | -- | 182 | -- | (1,882) | 7,770 |
| KSK Co., Ltd. | 8,551 | -- | 28 | -- | 18 | (378) | 8,163 |
| Kwang Dong Pharmaceutical Co. Ltd. | 20,881 | -- | -- | 185 | -- | (482) | 20,399 |
| Kyeryong Construction Industrial Co. Ltd. | 13,397 | -- | -- | -- | -- | 2,228 | 15,625 |
| Kyung Dong Pharmaceutical Co. Ltd. | 10,432 | -- | -- | 214 | -- | (1,241) | 9,191 |
| KyungDong City Gas Co. Ltd. | 8,241 | -- | -- | 116 | -- | (928) | 7,313 |
| Kyungdong Invest Co. Ltd. | 3,673 | -- | -- | 31 | -- | (327) | 3,346 |
| Leeno Industrial, Inc. | 34,547 | -- | -- | 471 | -- | (8,703) | 25,844 |
| Maruzen Co. Ltd. | 31,406 | -- | 111 | 166 | 88 | 3,314 | 34,697 |
| Mega First Corp. Bhd | 28,477 | -- | 577 | 155 | 149 | 2,810 | 30,859 |
| Metro, Inc. Class A (sub. vtg.) | 831,515 | -- | 3,066 | 5,752 | 2,906 | 62,031 | 893,386 |
| Michang Oil Industrial Co. Ltd. | 12,557 | -- | -- | 220 | -- | (520) | 12,037 |
| Mitani Sekisan Co. Ltd. | 36,133 | -- | 129 | 125 | 103 | (1,220) | 34,887 |
| Motonic Corp. | 26,269 | -- | 1,680 | 727 | 386 | 7,490 | 32,465 |
| Mr. Bricolage SA | 13,235 | -- | 27 | -- | (11) | (6,915) | 6,282 |
| Muhak Co. Ltd. | 38,087 | -- | -- | 730 | -- | (3,487) | 34,600 |
| Murakami Corp. | 21,350 | 1,044 | 67 | 129 | 53 | (3,392) | 18,988 |
| Muramoto Electronic Thailand PCL (For. Reg.) | 7,016 | -- | 29 | -- | 9 | 1,389 | 8,385 |
| Murphy Oil Corp. | 362,834 | 4,907 | 10,442 | 5,432 | 1,352 | (64,458) | 294,193 |
| Nadex Co. Ltd. | 7,449 | -- | 25 | 76 | 14 | (576) | 6,862 |
| Nafco Co. Ltd. | 31,794 | -- | 106 | 294 | 36 | (2,325) | 29,399 |
| ND Software Co. Ltd. | 12,926 | -- | 49 | 72 | 25 | 1,553 | 14,455 |
| Next PLC | 989,675 | -- | 9,185 | 8,918 | 5,032 | (187,462) | 798,060 |
| Nippo Ltd. | 2,971 | -- | 8 | -- | (1) | (395) | 2,567 |
| Origin Enterprises PLC | 64,974 | -- | 219 | 1,870 | 28 | (4,666) | 60,117 |
| P&F Industries, Inc. Class A | 2,683 | -- | 9 | 32 | 2 | (195) | 2,481 |
| Parker Corp. | 10,960 | -- | 36 | 106 | 22 | (1,747) | 9,199 |
| Piolax, Inc. | 60,277 | -- | 200 | 447 | 182 | (9,750) | 50,509 |
| Prim SA | 22,014 | -- | 64 | 177 | 20 | (3,694) | 18,276 |
| Roadrunner Transportation Systems, Inc. | 6,911 | -- | 4,101 | -- | (22,024) | 19,214 | -- |
| Rocky Mountain Chocolate Factory, Inc. | 4,481 | -- | 13 | 105 | (1) | (728) | 3,739 |
| S&T Holdings Co. Ltd. | 10,056 | -- | -- | 128 | -- | 327 | 10,383 |
| Sakai Moving Service Co. Ltd. | 57,168 | -- | 216 | 130 | 181 | 1,637 | 58,770 |
| Samsung Climate Control Co. Ltd. | 4,804 | -- | -- | 37 | -- | (521) | 4,283 |
| Sanei Architecture Planning Co. Ltd. | 21,406 | -- | 56 | 468 | 28 | (3,103) | 18,275 |
| Sarantis SA | 32,784 | -- | 114 | -- | 78 | 1,054 | 33,802 |
| ScanSource, Inc. | 93,159 | -- | 32,100 | -- | 6,981 | (13,435) | 54,605 |
| Seagate Technology LLC | 979,279 | -- | 20,173 | 23,019 | 14,562 | (168,008) | 805,660 |
| Senshu Electric Co. Ltd. | 26,771 | -- | 78 | 215 | 46 | (6,118) | 20,621 |
| Sewon Precision Industries Co. Ltd. | 4,625 | -- | -- | 37 | -- | (1,254) | 3,371 |
| Shibaura Electronics Co. Ltd. | 26,494 | -- | 77 | -- | 62 | (4,993) | 21,486 |
| Sinwa Ltd. | 3,446 | -- | 13 | 111 | 6 | 638 | 4,077 |
| SJM Co. Ltd. | 4,312 | -- | -- | 124 | -- | (584) | 3,728 |
| SJM Holdings Co. Ltd. | 4,506 | -- | 702 | 166 | (165) | (426) | 3,213 |
| Societe Pour L'Informatique Industrielle SA | 48,447 | -- | 143 | 248 | 113 | (8,348) | 40,069 |
| Soken Chemical & Engineer Co. Ltd. | 12,151 | -- | 36 | -- | 10 | (715) | 11,410 |
| Southwestern Energy Co. | 65,794 | 172,322 | 659 | -- | 9 | (34,821) | 202,645 |
| Sportscene Group, Inc. Class A | 2,039 | -- | 8 | -- | 6 | 1,229 | 3,266 |
| Step Co. Ltd. | 15,560 | -- | 49 | 146 | 33 | (3,167) | 12,377 |
| Strattec Security Corp. | 11,320 | 916 | 40 | 103 | 9 | 446 | 12,651 |
| Strongco Corp. | 1,437 | -- | 4 | -- | (5) | (365) | 1,063 |
| Sun Hing Vision Group Holdings Ltd. | 6,974 | -- | 25 | 455 | -- | 81 | 7,030 |
| Sunjin Co. Ltd. | 29,566 | -- | -- | -- | -- | (4,673) | 24,893 |
| SYNNEX Corp. | 260,551 | 3,031 | 782 | 1,962 | 625 | 258 | 263,683 |
| T&K Toka Co. Ltd. | 15,501 | -- | 48 | 183 | 28 | (3,516) | 11,965 |
| The Buckle, Inc. | 108,284 | -- | 314 | 6,733 | (122) | (29,922) | 77,926 |
| The Pack Corp. | 49,627 | -- | 160 | 318 | 77 | (8,410) | 41,134 |
| Tohoku Steel Co. Ltd. | 8,562 | -- | 26 | 60 | 13 | (896) | 7,653 |
| Tokyo Kisen Co. Ltd. | 5,987 | -- | 21 | -- | 13 | (356) | 5,623 |
| Tokyo Tekko Co. Ltd. | 11,941 | -- | 31 | 61 | (11) | (3,575) | 8,324 |
| Tomen Devices Corp. | 13,785 | -- | 42 | -- | (5) | (2,396) | 11,342 |
| Totech Corp. | 21,516 | -- | 544 | 126 | 259 | (3,145) | 18,086 |
| TOW Co. Ltd. | 13,217 | -- | 48 | 194 | 29 | (1,271) | 11,927 |
| Trancom Co. Ltd. | 62,738 | -- | 162 | 301 | 159 | (10,454) | 52,281 |
| Trio-Tech International | 1,038 | -- | 2 | -- | (2) | (342) | 692 |
| Triple-S Management Corp. | 59,125 | -- | 609 | -- | 46 | (25,634) | 32,928 |
| UKC Holdings Corp. | 25,947 | -- | 5,220 | 624 | 1,449 | (4,726) | 17,450 |
| Unit Corp. | 134,142 | -- | 340 | -- | (10) | (48,121) | 85,671 |
| Unum Group | 599,747 | -- | 1,759 | 7,838 | 1,034 | (76,187) | 522,835 |
| Utah Medical Products, Inc. | 27,463 | -- | 1,839 | 144 | 1,675 | (2,575) | 24,724 |
| VSE Corp. | 36,175 | -- | 88 | 134 | 51 | (8,849) | 27,289 |
| VST Holdings Ltd. | 64,422 | -- | 280 | -- | 167 | (6,935) | 57,374 |
| Wayside Technology Group, Inc. | 3,713 | 770 | 13 | 104 | (1) | (926) | 3,543 |
| Whanin Pharmaceutical Co. Ltd. | 33,084 | -- | -- | 391 | -- | (2,644) | 30,440 |
| WIN-Partners Co. Ltd. | 37,651 | -- | 85 | -- | 59 | (14,425) | 23,200 |
| Youngone Holdings Co. Ltd. | 42,903 | -- | -- | 398 | -- | 6,358 | 49,261 |
| Yutaka Giken Co. Ltd. | 29,952 | -- | 79 | 353 | 42 | (7,527) | 22,388 |
| Total | $9,571,889 | $313,135 | $368,308 | $136,546 | $143,099 | $(1,151,079) | $8,332,977 |
(a) Includes the value of securities delivered through in-kind transactions, if applicable.
Investment Valuation
The following is a summary of the inputs used, as of January 31, 2019, involving the Fund's assets and liabilities carried at fair value. The inputs or methodology used for valuing securities may not be an indication of the risk associated with investing in those securities. For more information on valuation inputs, and their aggregation into the levels used below, please refer to the Investment Valuation section in the accompanying Notes to Financial Statements.
| | Valuation Inputs at Reporting Date: |
| Description | Total | Level 1 | Level 2 | Level 3 |
| (Amounts in thousands) | | | | |
| Investments in Securities: | | | | |
| Equities: | | | | |
| Communication Services | $1,248,964 | $1,242,089 | $6,875 | $-- |
| Consumer Discretionary | 6,516,919 | 6,400,532 | 97,223 | 19,164 |
| Consumer Staples | 2,797,913 | 2,778,840 | 14,113 | 4,960 |
| Energy | 1,775,222 | 1,650,050 | 125,172 | -- |
| Financials | 4,120,504 | 3,869,071 | 251,433 | -- |
| Health Care | 4,118,391 | 4,049,919 | 68,472 | -- |
| Industrials | 2,109,476 | 2,021,650 | 87,756 | 70 |
| Information Technology | 4,375,154 | 3,551,870 | 823,284 | -- |
| Materials | 1,160,455 | 1,141,265 | 19,190 | -- |
| Real Estate | 140,550 | 137,159 | 3,391 | -- |
| Utilities | 606,319 | 603,651 | 2,668 | -- |
| Corporate Bonds | 3,578 | -- | 3,578 | -- |
| Money Market Funds | 2,432,771 | 2,432,771 | -- | -- |
| Total Investments in Securities: | $31,406,216 | $29,878,867 | $1,503,155 | $24,194 |
Other Information
Distribution of investments by country or territory of incorporation, as a percentage of Total Net Assets, is as follows (Unaudited):
| United States of America | 58.5% |
| Japan | 9.5% |
| United Kingdom | 6.0% |
| Canada | 4.9% |
| Ireland | 3.9% |
| Netherlands | 2.1% |
| Korea (South) | 1.9% |
| Cayman Islands | 1.8% |
| Taiwan | 1.8% |
| Bermuda | 1.8% |
| Bailiwick of Guernsey | 1.1% |
| India | 1.0% |
| Others (Individually Less Than 1%) | 5.7% |
| | 100.0% |
See accompanying notes which are an integral part of the financial statements.
Financial Statements
Statement of Assets and Liabilities
| Amounts in thousands (except per-share amounts) | | January 31, 2019 |
| Assets | | |
Investment in securities, at value (including securities loaned of $402,680) — See accompanying schedule:
Unaffiliated issuers (cost $11,526,546) | $20,640,468 | |
| Fidelity Central Funds (cost $2,432,406) | 2,432,771 | |
| Other affiliated issuers (cost $4,524,211) | 8,332,977 | |
| Total Investment in Securities (cost $18,483,163) | | $31,406,216 |
| Cash | | 82 |
| Foreign currency held at value (cost $455) | | 457 |
| Receivable for investments sold | | 38,091 |
| Receivable for fund shares sold | | 12,932 |
| Dividends receivable | | 27,577 |
| Interest receivable | | 159 |
| Distributions receivable from Fidelity Central Funds | | 4,434 |
| Prepaid expenses | | 43 |
| Other receivables | | 1,887 |
| Total assets | | 31,491,878 |
| Liabilities | | |
| Payable for investments purchased | $14,155 | |
| Payable for fund shares redeemed | 30,518 | |
| Accrued management fee | 8,542 | |
| Other affiliated payables | 3,142 | |
| Other payables and accrued expenses | 2,118 | |
| Collateral on securities loaned | 413,782 | |
| Total liabilities | | 472,257 |
| Net Assets | | $31,019,621 |
| Net Assets consist of: | | |
| Paid in capital | | $16,904,082 |
| Total distributable earnings (loss) | | 14,115,539 |
| Net Assets | | $31,019,621 |
| Net Asset Value and Maximum Offering Price | | |
| Low-Priced Stock: | | |
| Net Asset Value, offering price and redemption price per share ($24,776,324 ÷ 526,749 shares) | | $47.04 |
| Class K: | | |
| Net Asset Value, offering price and redemption price per share ($6,243,297 ÷ 132,868 shares) | | $46.99 |
See accompanying notes which are an integral part of the financial statements.
Statement of Operations
| Amounts in thousands | | Six months ended January 31, 2019 |
| Investment Income | | |
| Dividends (including $136,546 earned from other affiliated issuers) | | $338,149 |
| Interest | | 189 |
| Income from Fidelity Central Funds | | 30,459 |
| Total income | | 368,797 |
| Expenses | | |
| Management fee | | |
| Basic fee | $97,778 | |
| Performance adjustment | (35,691) | |
| Transfer agent fees | 19,344 | |
| Accounting and security lending fees | 1,067 | |
| Custodian fees and expenses | 1,057 | |
| Independent trustees' fees and expenses | 111 | |
| Registration fees | 72 | |
| Audit | 91 | |
| Legal | 45 | |
| Miscellaneous | 100 | |
| Total expenses before reductions | 83,974 | |
| Expense reductions | (389) | |
| Total expenses after reductions | | 83,585 |
| Net investment income (loss) | | 285,212 |
| Realized and Unrealized Gain (Loss) | | |
| Net realized gain (loss) on: | | |
| Investment securities: | | |
| Unaffiliated issuers (net of foreign taxes of $749) | 2,481,393 | |
| Fidelity Central Funds | 178 | |
| Other affiliated issuers | 143,099 | |
| Foreign currency transactions | (1,399) | |
| Total net realized gain (loss) | | 2,623,271 |
| Change in net unrealized appreciation (depreciation) on: | | |
| Investment securities: | | |
| Unaffiliated issuers (net of decrease in deferred foreign taxes of $2,057) | (3,688,442) | |
| Fidelity Central Funds | (187) | |
| Other affiliated issuers | (1,151,079) | |
| Assets and liabilities in foreign currencies | 305 | |
| Total change in net unrealized appreciation (depreciation) | | (4,839,403) |
| Net gain (loss) | | (2,216,132) |
| Net increase (decrease) in net assets resulting from operations | | $(1,930,920) |
See accompanying notes which are an integral part of the financial statements.
Statement of Changes in Net Assets
| Amounts in thousands | Six months ended January 31, 2019 | Year ended July 31, 2018 |
| Increase (Decrease) in Net Assets | | |
| Operations | | |
| Net investment income (loss) | $285,212 | $571,758 |
| Net realized gain (loss) | 2,623,271 | 3,524,905 |
| Change in net unrealized appreciation (depreciation) | (4,839,403) | 309,863 |
| Net increase (decrease) in net assets resulting from operations | (1,930,920) | 4,406,526 |
| Distributions to shareholders | (3,794,431) | – |
| Distributions to shareholders from net investment income | – | (570,162) |
| Distributions to shareholders from net realized gain | – | (2,830,480) |
| Total distributions | (3,794,431) | (3,400,642) |
| Share transactions - net increase (decrease) | 334,820 | (2,815,868) |
| Total increase (decrease) in net assets | (5,390,531) | (1,809,984) |
| Net Assets | | |
| Beginning of period | 36,410,152 | 38,220,136 |
| End of period | $31,019,621 | $36,410,152 |
| Other Information | | |
| Undistributed net investment income end of period | | $275,404 |
See accompanying notes which are an integral part of the financial statements.
Financial Highlights
Fidelity Low-Priced Stock Fund
| | Six months ended January 31, | Years endedJuly 31, | | | | |
| | 2019 | 2018 | 2017 | 2016 | 2015 | 2014 |
| Selected Per–Share Data | | | | | | |
| Net asset value, beginning of period | $55.65 | $54.38 | $49.57 | $52.65 | $51.03 | $47.84 |
| Income from Investment Operations | | | | | | |
| Net investment income (loss)A | .42 | .80 | .74 | .59 | .52 | .53 |
| Net realized and unrealized gain (loss) | (3.19) | 5.33 | 6.47 | (1.44) | 4.06 | 5.96 |
| Total from investment operations | (2.77) | 6.13 | 7.21 | (.85) | 4.58 | 6.49 |
| Distributions from net investment income | (.84) | (.79) | (.60) | (.62) | (.52) | (.39) |
| Distributions from net realized gain | (5.00) | (4.06) | (1.80) | (1.61) | (2.44) | (2.91) |
| Total distributions | (5.84) | (4.86)B | (2.40) | (2.23) | (2.96) | (3.30) |
| Redemption fees added to paid in capitalA | – | – | –C | –C | –C | –C |
| Net asset value, end of period | $47.04 | $55.65 | $54.38 | $49.57 | $52.65 | $51.03 |
| Total ReturnD,E | (5.21)% | 12.07% | 15.17% | (1.48)% | 9.32% | 14.42% |
| Ratios to Average Net AssetsF,G | | | | | | |
| Expenses before reductions | .52%H | .62% | .67% | .88% | .79% | .82% |
| Expenses net of fee waivers, if any | .52%H | .62% | .67% | .88% | .79% | .82% |
| Expenses net of all reductions | .52%H | .62% | .67% | .88% | .79% | .82% |
| Net investment income (loss) | 1.70%H | 1.48% | 1.46% | 1.24% | 1.02% | 1.07% |
| Supplemental Data | | | | | | |
| Net assets, end of period (in millions) | $24,776 | $28,809 | $28,334 | $28,524 | $30,150 | $30,576 |
| Portfolio turnover rateI,J | 22%H | 11% | 8% | 9% | 9% | 12% |
A Calculated based on average shares outstanding during the period.
B Total distributions of $4.86 per share is comprised of distributions from net investment income of $.793 and distributions from net realized gain of $4.064 per share.
C Amount represents less than $.005 per share.
D Total returns for periods of less than one year are not annualized.
E Total returns would have been lower if certain expenses had not been reduced during the applicable periods shown.
F Fees and expenses of any underlying Fidelity Central Funds are not included in the Fund's expense ratio. The Fund indirectly bears its proportionate share of the expenses of any underlying Fidelity Central Funds.
G Expense ratios reflect operating expenses of the class. Expenses before reductions do not reflect amounts reimbursed by the investment adviser or reductions from brokerage service arrangements or reductions from other expense offset arrangements and do not represent the amount paid by the class during periods when reimbursements or reductions occur. Expenses net of fee waivers reflect expenses after reimbursement by the investment adviser but prior to reductions from brokerage service arrangements or other expense offset arrangements. Expenses net of all reductions represent the net expenses paid by the class.
H Annualized
I Amount does not include the portfolio activity of any underlying Fidelity Central Funds.
J Portfolio turnover rate excludes securities received or delivered in-kind.
See accompanying notes which are an integral part of the financial statements.
Fidelity Low-Priced Stock Fund Class K
| | Six months ended January 31, | Years endedJuly 31, | | | | |
| | 2019 | 2018 | 2017 | 2016 | 2015 | 2014 |
| Selected Per–Share Data | | | | | | |
| Net asset value, beginning of period | $55.63 | $54.36 | $49.56 | $52.64 | $51.02 | $47.83 |
| Income from Investment Operations | | | | | | |
| Net investment income (loss)A | .45 | .85 | .79 | .64 | .57 | .58 |
| Net realized and unrealized gain (loss) | (3.20) | 5.33 | 6.46 | (1.44) | 4.06 | 5.96 |
| Total from investment operations | (2.75) | 6.18 | 7.25 | (.80) | 4.63 | 6.54 |
| Distributions from net investment income | (.89) | (.84) | (.64) | (.67) | (.57) | (.44) |
| Distributions from net realized gain | (5.00) | (4.06) | (1.80) | (1.61) | (2.44) | (2.91) |
| Total distributions | (5.89) | (4.91)B | (2.45)C | (2.28) | (3.01) | (3.35) |
| Redemption fees added to paid in capitalA | – | – | –D | –D | –D | –D |
| Net asset value, end of period | $46.99 | $55.63 | $54.36 | $49.56 | $52.64 | $51.02 |
| Total ReturnE,F | (5.18)% | 12.18% | 15.27% | (1.38)% | 9.44% | 14.55% |
| Ratios to Average Net AssetsG,H | | | | | | |
| Expenses before reductions | .43%I | .53% | .58% | .78% | .69% | .72% |
| Expenses net of fee waivers, if any | .43%I | .53% | .58% | .78% | .69% | .72% |
| Expenses net of all reductions | .43%I | .53% | .58% | .78% | .69% | .72% |
| Net investment income (loss) | 1.79%I | 1.57% | 1.56% | 1.34% | 1.11% | 1.17% |
| Supplemental Data | | | | | | |
| Net assets, end of period (in millions) | $6,243 | $7,601 | $9,886 | $11,489 | $13,989 | $16,198 |
| Portfolio turnover rateJ,K | 22%I | 11% | 8% | 9% | 9% | 12% |
A Calculated based on average shares outstanding during the period.
B Total distributions of $4.91 per share is comprised of distributions from net investment income of $.842 and distributions from net realized gain of $4.064 per share.
C Total distributions of $2.45 per share is comprised of distributions from net investment income of $.644 and distributions from net realized gain of $1.803 per share.
D Amount represents less than $.005 per share.
E Total returns for periods of less than one year are not annualized.
F Total returns would have been lower if certain expenses had not been reduced during the applicable periods shown.
G Fees and expenses of any underlying Fidelity Central Funds are not included in the Fund's expense ratio. The Fund indirectly bears its proportionate share of the expenses of any underlying Fidelity Central Funds.
H Expense ratios reflect operating expenses of the class. Expenses before reductions do not reflect amounts reimbursed by the investment adviser or reductions from brokerage service arrangements or reductions from other expense offset arrangements and do not represent the amount paid by the class during periods when reimbursements or reductions occur. Expenses net of fee waivers reflect expenses after reimbursement by the investment adviser but prior to reductions from brokerage service arrangements or other expense offset arrangements. Expenses net of all reductions represent the net expenses paid by the class.
I Annualized
J Amount does not include the portfolio activity of any underlying Fidelity Central Funds.
K Portfolio turnover rate excludes securities received or delivered in-kind.
See accompanying notes which are an integral part of the financial statements.
Notes to Financial Statements (Unaudited)
For the period ended January 31, 2019
(Amounts in thousands except percentages)
1. Organization.
Fidelity Low-Priced Stock Fund (the Fund) is a fund of Fidelity Puritan Trust (the Trust) and is authorized to issue an unlimited number of shares. The Trust is registered under the Investment Company Act of 1940, as amended (the 1940 Act), as an open-end management investment company organized as a Massachusetts business trust. The Fund offers Low-Priced Stock and Class K shares, each of which has equal rights as to assets and voting privileges. Each class has exclusive voting rights with respect to matters that affect that class.
2. Investments in Fidelity Central Funds.
The Fund invests in Fidelity Central Funds, which are open-end investment companies generally available only to other investment companies and accounts managed by the investment adviser and its affiliates. The Fund's Schedule of Investments lists each of the Fidelity Central Funds held as of period end, if any, as an investment of the Fund, but does not include the underlying holdings of each Fidelity Central Fund. As an Investing Fund, the Fund indirectly bears its proportionate share of the expenses of the underlying Fidelity Central Funds.
The Money Market Central Funds seek preservation of capital and current income and are managed by Fidelity Investments Money Management, Inc. (FIMM), an affiliate of the investment adviser. Annualized expenses of the Money Market Central Funds as of their most recent shareholder report date are less than .005%.
A complete unaudited list of holdings for each Fidelity Central Fund is available upon request or at the Securities and Exchange Commission (the SEC) website at www.sec.gov. In addition, the financial statements of the Fidelity Central Funds, which are not covered by the Fund's Report of Independent Registered Public Accounting Firm, are available on the SEC website or upon request.
3. Significant Accounting Policies.
The Fund is an investment company and applies the accounting and reporting guidance of the Financial Accounting Standards Board (FASB) Accounting Standards Codification Topic 946 Financial Services – Investments Companies. The financial statements have been prepared in conformity with accounting principles generally accepted in the United States of America (GAAP), which require management to make certain estimates and assumptions at the date of the financial statements. Actual results could differ from those estimates. Subsequent events, if any, through the date that the financial statements were issued have been evaluated in the preparation of the financial statements. The following summarizes the significant accounting policies of the Fund:
Investment Valuation. Investments are valued as of 4:00 p.m. Eastern time on the last calendar day of the period. The Board of Trustees (the Board) has delegated the day to day responsibility for the valuation of the Fund's investments to the Fair Value Committee (the Committee) established by the Fund's investment adviser. In accordance with valuation policies and procedures approved by the Board, the Fund attempts to obtain prices from one or more third party pricing vendors or brokers to value its investments. When current market prices, quotations or currency exchange rates are not readily available or reliable, investments will be fair valued in good faith by the Committee, in accordance with procedures adopted by the Board. Factors used in determining fair value vary by investment type and may include market or investment specific events, changes in interest rates and credit quality. The frequency with which these procedures are used cannot be predicted and they may be utilized to a significant extent. The Committee oversees the Fund's valuation policies and procedures and reports to the Board on the Committee's activities and fair value determinations. The Board monitors the appropriateness of the procedures used in valuing the Fund's investments and ratifies the fair value determinations of the Committee.
The Fund categorizes the inputs to valuation techniques used to value its investments into a disclosure hierarchy consisting of three levels as shown below:
- Level 1 – quoted prices in active markets for identical investments
- Level 2 – other significant observable inputs (including quoted prices for similar investments, interest rates, prepayment speeds, etc.)
- Level 3 – unobservable inputs (including the Fund's own assumptions based on the best information available)
Valuation techniques used to value the Fund's investments by major category are as follows:
Equity securities, including restricted securities, for which market quotations are readily available, are valued at the last reported sale price or official closing price as reported by a third party pricing vendor on the primary market or exchange on which they are traded and are categorized as Level 1 in the hierarchy. In the event there were no sales during the day or closing prices are not available, securities are valued at the last quoted bid price or may be valued using the last available price and are generally categorized as Level 2 in the hierarchy. For foreign equity securities, when market or security specific events arise, comparisons to the valuation of American Depositary Receipts (ADRs), futures contracts, Exchange-Traded Funds (ETFs) and certain indexes as well as quoted prices for similar securities may be used and would be categorized as Level 2 in the hierarchy. For equity securities, including restricted securities, where observable inputs are limited, assumptions about market activity and risk are used and these securities may be categorized as Level 3 in the hierarchy.
Debt securities, including restricted securities, are valued based on evaluated prices received from third party pricing vendors or from brokers who make markets in such securities. Corporate bonds are valued by pricing vendors who utilize matrix pricing which considers yield or price of bonds of comparable quality, coupon, maturity and type or by broker-supplied prices. When independent prices are unavailable or unreliable, debt securities may be valued utilizing pricing methodologies which consider similar factors that would be used by third party pricing vendors. Debt securities are generally categorized as Level 2 in the hierarchy but may be Level 3 depending on the circumstances.
Investments in open-end mutual funds, including the Fidelity Central Funds, are valued at their closing net asset value (NAV) each business day and are categorized as Level 1 in the hierarchy.
Changes in valuation techniques may result in transfers in or out of an assigned level within the disclosure hierarchy. The aggregate value of investments by input level as of January 31, 2019 is included at the end of the Fund's Schedule of Investments.
Foreign Currency. The Fund may use foreign currency contracts to facilitate transactions in foreign-denominated securities. Gains and losses from these transactions may arise from changes in the value of the foreign currency or if the counterparties do not perform under the contracts' terms.
Foreign-denominated assets, including investment securities, and liabilities are translated into U.S. dollars at the exchange rates at period end. Purchases and sales of investment securities, income and dividends received and expenses denominated in foreign currencies are translated into U.S. dollars at the exchange rate in effect on the transaction date.
The effects of exchange rate fluctuations on investments are included with the net realized and unrealized gain (loss) on investment securities. Other foreign currency transactions resulting in realized and unrealized gain (loss) are disclosed separately.
Investment Transactions and Income. For financial reporting purposes, the Fund's investment holdings and NAV include trades executed through the end of the last business day of the period. The NAV per share for processing shareholder transactions is calculated as of the close of business of the New York Stock Exchange (NYSE), normally 4:00 p.m. Eastern time and includes trades executed through the end of the prior business day. Gains and losses on securities sold are determined on the basis of identified cost and include proceeds received from litigation. Dividend income is recorded on the ex-dividend date, except for certain dividends from foreign securities where the ex-dividend date may have passed, which are recorded as soon as the Fund is informed of the ex-dividend date. Non-cash dividends included in dividend income, if any, are recorded at the fair market value of the securities received. Income and capital gain distributions from Fidelity Central Funds, if any, are recorded on the ex-dividend date. Certain distributions received by the Fund represent a return of capital or capital gain. The Fund determines the components of these distributions subsequent to the ex-dividend date, based upon receipt of tax filings or other correspondence relating to the underlying investment. These distributions are recorded as a reduction of cost of investments and/or as a realized gain. Interest income is accrued as earned and includes coupon interest and amortization of premium and accretion of discount on debt securities as applicable. Investment income is recorded net of foreign taxes withheld where recovery of such taxes is uncertain.
Class Allocations and Expenses. Investment income, realized and unrealized capital gains and losses, common expenses of the Fund, and certain fund-level expense reductions, if any, are allocated daily on a pro-rata basis to each class based on the relative net assets of each class to the total net assets of the Fund. Each class differs with respect to transfer agent fees incurred. Certain expense reductions may also differ by class. For the reporting period, the allocated portion of income and expenses to each class as a percent of its average net assets may vary due to the timing of recording these transactions in relation to fluctuating net assets of the classes. Expenses directly attributable to a fund are charged to that fund. Expenses attributable to more than one fund are allocated among the respective funds on the basis of relative net assets or other appropriate methods. Expense estimates are accrued in the period to which they relate and adjustments are made when actual amounts are known.
Deferred Trustee Compensation. Under a Deferred Compensation Plan (the Plan) for the Fund, certain independent Trustees have elected to defer receipt of a portion of their annual compensation. Deferred amounts are invested in a cross-section of Fidelity funds, are marked-to-market and remain in the Fund until distributed in accordance with the Plan. The investment of deferred amounts and the offsetting payable to the Trustees of $1,549 are included in the accompanying Statement of Assets and Liabilities in other receivables and other payables and accrued expenses, respectively.
Income Tax Information and Distributions to Shareholders. Each year, the Fund intends to qualify as a regulated investment company under Subchapter M of the Internal Revenue Code, including distributing substantially all of its taxable income and realized gains. As a result, no provision for U.S. Federal income taxes is required. The Fund files a U.S. federal tax return, in addition to state and local tax returns as required. The Fund's federal income tax returns are subject to examination by the Internal Revenue Service (IRS) for a period of three fiscal years after they are filed. State and local tax returns may be subject to examination for an additional fiscal year depending on the jurisdiction. Foreign taxes are provided for based on the Fund's understanding of the tax rules and rates that exist in the foreign markets in which it invests. The Fund is subject to a tax imposed on capital gains by certain countries in which it invests.
Distributions are declared and recorded on the ex-dividend date. Income and capital gain distributions are declared separately for each class. Income and capital gain distributions are determined in accordance with income tax regulations, which may differ from GAAP.
Capital accounts within the financial statements are adjusted for permanent book-tax differences. These adjustments have no impact on net assets or the results of operations. Capital accounts are not adjusted for temporary book-tax differences which will reverse in a subsequent period.
Book-tax differences are primarily due to foreign currency transactions, certain foreign taxes, deferred foreign income corporations, passive foreign investment companies (PFIC), redemptions in kind, partnerships, deferred trustees compensation and losses deferred due to wash sales.
As of period end, the cost and unrealized appreciation (depreciation) in securities, and derivatives if applicable, for federal income tax purposes were as follows:
| Gross unrealized appreciation | $14,501,459 |
| Gross unrealized depreciation | (1,864,068) |
| Net unrealized appreciation (depreciation) | $12,637,391 |
| Tax cost | $18,768,825 |
Restricted Securities. The Fund may invest in securities that are subject to legal or contractual restrictions on resale. These securities generally may be resold in transactions exempt from registration or to the public if the securities are registered. Disposal of these securities may involve time-consuming negotiations and expense, and prompt sale at an acceptable price may be difficult. Information regarding restricted securities is included at the end of the Fund's Schedule of Investments.
New Rule Issuance. During August 2018, the U.S. Securities and Exchange Commission issued Final Rule Release No. 33-10532, Disclosure Update and Simplification. This Final Rule includes amendments specific to registered investment companies that are intended to eliminate overlap in disclosure requirements between Regulation S-X and GAAP. In accordance with these amendments, certain line-items in the Fund's financial statements have been combined or removed for the current period as outlined in the table below.
| Financial Statement | Current Line-Item Presentation (As Applicable) | Prior Line-Item Presentation (As Applicable) |
| Statement of Assets and Liabilities | Total distributable earnings (loss) | Undistributed/Distributions in excess of/Accumulated net investment income (loss)
Accumulated/Undistributed net realized gain (loss)
Net unrealized appreciation (depreciation) |
| Statement of Changes in Net Assets | N/A - removed | Undistributed/Distributions in excess of/Accumulated net investment income (loss) end of period |
| Statement of Changes in Net Assets | Distributions to shareholders | Distributions to shareholders from net investment income
Distributions to shareholders from net realized gain |
| Distributions to Shareholders Note to Financial Statements | Distributions to shareholders | Distributions to shareholders from net investment income
Distributions to shareholders from net realized gain |
4. Purchases and Sales of Investments.
Purchases and sales of securities, other than short-term securities and in-kind transactions, aggregated $3,353,032 and $5,008,583, respectively.
Unaffiliated Redemptions In-Kind. During the period, 2,257 shares of the Fund were redeemed in-kind for investments, including accrued interest, and cash with a value of $104,209. The net realized gain of $53,373 on investments delivered through in-kind redemptions is included in the accompanying Statement of Operations. The amount of the in-kind redemptions is included in share transactions in the accompanying Statement of Changes in Net Assets as well as the Notes to Financial Statements. The Fund recognized no gain or loss for federal income tax purposes.
Prior Fiscal Year Redemptions In-Kind. During the prior period, 31,696 shares of the Fund held by unaffiliated entities were redeemed in-kind for investments and cash, including accrued interest, with a value of $1,710,031. The Fund had a net realized gain of $1,005,957 on investments delivered through the in-kind redemptions. The amount of the in-kind redemptions is included in share transactions in the accompanying Statement of Changes in Net Assets as well as the Notes to Financial Statements. The Fund recognized no gain or loss for federal income tax purposes.
5. Fees and Other Transactions with Affiliates.
Management Fee. Fidelity Management & Research Company (the investment adviser) and its affiliates provide the Fund with investment management related services for which the Fund pays a monthly management fee. The management fee is the sum of an individual fund fee rate that is based on an annual rate of .35% of the Fund's average net assets and an annualized group fee rate that averaged .24% during the period. The group fee rate is based upon the average net assets of all the mutual funds advised by the investment adviser, including any mutual funds previously advised by the investment adviser that are currently advised by Fidelity SelectCo, LLC, an affiliate of the investment adviser. The group fee rate decreases as assets under management increase and increases as assets under management decrease. In addition, the management fee is subject to a performance adjustment (up to a maximum of +/- .20% of the Fund's average net assets over a 36 month performance period). The upward or downward adjustment to the management fee is based on the relative investment performance of Low-Priced Stock as compared to its benchmark index, the Russell 2000 Index, over the same 36 month performance period. For the reporting period, the total annualized management fee rate, including the performance adjustment, was .37% of the Fund's average net assets. The performance adjustment included in the management fee rate may be higher or lower than the maximum performance adjustment rate due to the difference between the average net assets for the reporting and performance periods.
Transfer Agent Fees. Fidelity Investments Institutional Operations Company, Inc., (FIIOC), an affiliate of the investment adviser, is the transfer, dividend disbursing and shareholder servicing agent for each class of the Fund. FIIOC receives account fees and asset-based fees that vary according to the account size and type of account of the shareholders of Low-Priced Stock, except for Class K. FIIOC receives an asset-based fee of Class K's average net assets. FIIOC pays for typesetting, printing and mailing of shareholder reports, except proxy statements.
For the period, transfer agent fees for each class were as follows:
| | Amount | % of Class-Level Average Net Assets(a) |
| Low-Priced Stock | $17,768 | .13 |
| Class K | 1,576 | .05 |
| | $19,344 | |
(a) Annualized
Accounting and Security Lending Fees. Fidelity Service Company, Inc. (FSC), an affiliate of the investment adviser, maintains the Fund's accounting records. The accounting fee is based on the level of average net assets for each month. Under a separate contract, FSC administers the security lending program. The security lending fee is based on the number and duration of lending transactions. For the period, the fees were equivalent to an annualized rate of .01%.
Brokerage Commissions. The Fund placed a portion of its portfolio transactions with brokerage firms which are affiliates of the investment adviser. Brokerage commissions are included in net realized gain (loss) and change in net unrealized appreciation (depreciation) in the Statement of Operations. The commissions paid to these affiliated firms were $109 for the period.
Interfund Trades. The Fund may purchase from or sell securities to other Fidelity Funds under procedures adopted by the Board. The procedures have been designed to ensure these interfund trades are executed in accordance with Rule 17a-7 of the 1940 Act. Interfund trades are included within the respective purchases and sales amounts shown in the Purchases and Sales of Investments note.
6. Committed Line of Credit.
The Fund participates with other funds managed by the investment adviser or an affiliate in a $4.25 billion credit facility (the "line of credit") to be utilized for temporary or emergency purposes to fund shareholder redemptions or for other short-term liquidity purposes. The Fund has agreed to pay commitment fees on its pro-rata portion of the line of credit, which amounted to $46 and is reflected in Miscellaneous expenses on the Statement of Operations. During the period, the Fund did not borrow on this line of credit.
7. Security Lending.
The Fund lends portfolio securities through a lending agent from time to time in order to earn additional income. For equity securities, a lending agent is used and may loan securities to certain qualified borrowers, including Fidelity Capital Markets (FCM), a broker-dealer affiliated with the Fund. On the settlement date of the loan, the Fund receives collateral (in the form of U.S. Treasury obligations, letters of credit and/or cash) against the loaned securities and maintains collateral in an amount not less than 100% of the market value of the loaned securities during the period of the loan. The market value of the loaned securities is determined at the close of business of the Fund and any additional required collateral is delivered to the Fund on the next business day. The Fund or borrower may terminate the loan at any time, and if the borrower defaults on its obligation to return the securities loaned because of insolvency or other reasons, the Fund may apply collateral received from the borrower against the obligation. The Fund may experience delays and costs in recovering the securities loaned. Any cash collateral received is invested in the Fidelity Securities Lending Cash Central Fund. The value of loaned securities and cash collateral at period end are disclosed on the Fund's Statement of Assets and Liabilities. At period end, there were no security loans outstanding with FCM. Security lending income represents the income earned on investing cash collateral, less rebates paid to borrowers and any lending agent fees associated with the loan, plus any premium payments received for lending certain types of securities. Security lending income is presented in the Statement of Operations as a component of income from Fidelity Central Funds. Total security lending income during the period amounted to $2,946, including $84 from securities loaned to FCM.
8. Expense Reductions.
Commissions paid to certain brokers with whom the investment adviser, or its affiliates, places trades on behalf of the Fund include an amount in addition to trade execution, which may be rebated back to the Fund to offset certain expenses. This amount totaled $258 for the period. In addition, through arrangements with the Fund's custodian, credits realized as a result of certain uninvested cash balances were used to reduce the Fund's expenses. During the period, these credits reduced the Fund's custody expenses by $7. During the period, credits reduced each class' transfer agent expense as noted in the table below.
| | Transfer Agent expense reduction |
| Low-Priced Stock | $4 |
| | $4 |
In addition, during the period the investment adviser reimbursed and/or waived a portion of fund-level operating expenses in the amount of $120.
9. Distributions to Shareholders.
Distributions to shareholders of each class were as follows:
| | Six months ended
January 31, 2019 | Year ended
July 31, 2018 |
| Distributions to shareholders | | |
| Low-Priced Stock | $3,002,760 | $– |
| Class K | 791,671 | – |
| Total | $3,794,431 | $– |
| From net investment income | | |
| Low-Priced Stock | $– | $422,624 |
| Class K | – | 147,538 |
| Total | $– | $570,162 |
| From net realized gain | | |
| Low-Priced Stock | $– | $2,113,153 |
| Class K | – | 717,327 |
| Total | $– | $2,830,480 |
10. Share Transactions.
Share transactions for each class were as follows and may contain automatic conversions between classes or exchanges between affiliated funds:
| | Shares | Shares | Dollars | Dollars |
| | Six months ended January 31, 2019 | Year ended July 31, 2018 | Six months ended January 31, 2019 | Year ended July 31, 2018 |
| Low-Priced Stock | | | | |
| Shares sold | 16,515 | 78,887 | $814,513 | $4,286,318 |
| Reinvestment of distributions | 55,804 | 45,637 | 2,757,121 | 2,359,539 |
| Shares redeemed | (63,226)(a) | (127,919)(b) | (3,076,606)(a) | (6,976,877)(b) |
| Net increase (decrease) | 9,093 | (3,395) | $495,028 | $(331,020) |
| Class K | | | | |
| Shares sold | 7,542 | 23,375 | $378,602 | $1,267,880 |
| Reinvestment of distributions | 16,031 | 16,747 | 791,671 | 864,865 |
| Shares redeemed | (27,335)(a) | (85,363)(b) | (1,330,481)(a) | (4,617,593)(b) |
| Net increase (decrease) | (3,762) | (45,241) | $(160,208) | $(2,484,848) |
(a) Amount includes in-kind redemptions (see the Redemptions In-Kind note for additional details).
(b) Amount includes in-kind redemptions (see the Prior Fiscal Year Redemptions In-Kind note for additional details).
11. Other.
The Fund's organizational documents provide former and current trustees and officers with a limited indemnification against liabilities arising in connection with the performance of their duties to the Fund. In the normal course of business, the Fund may also enter into contracts that provide general indemnifications. The Fund's maximum exposure under these arrangements is unknown as this would be dependent on future claims that may be made against the Fund. The risk of material loss from such claims is considered remote.
Shareholder Expense Example
As a shareholder of the Fund, you incur two types of costs: (1) transaction costs and (2) ongoing costs, including management fees and other Fund expenses. This Example is intended to help you understand your ongoing costs (in dollars) of investing in the Fund and to compare these costs with the ongoing costs of investing in other mutual funds.
The Example is based on an investment of $1,000 invested at the beginning of the period and held for the entire period (August 1, 2018 to January 31, 2019).
Actual Expenses
The first line of the accompanying table for each class of the Fund provides information about actual account values and actual expenses. You may use the information in this line, together with the amount you invested, to estimate the expenses that you paid over the period. Simply divide your account value by $1,000.00 (for example, an $8,600 account value divided by $1,000.00 = 8.6), then multiply the result by the number in the first line for a class of the Fund under the heading entitled "Expenses Paid During Period" to estimate the expenses you paid on your account during this period. In addition, the Fund, as a shareholder in the underlying Fidelity Central Funds, will indirectly bear its pro-rata share of the fees and expenses incurred by the underlying Fidelity Central Funds. These fees and expenses are not included in the Fund's annualized expense ratio used to calculate the expense estimate in the table below.
Hypothetical Example for Comparison Purposes
The second line of the accompanying table for each class of the Fund provides information about hypothetical account values and hypothetical expenses based on a Class' actual expense ratio and an assumed rate of return of 5% per year before expenses, which is not the Class' actual return. The hypothetical account values and expenses may not be used to estimate the actual ending account balance or expenses you paid for the period. You may use this information to compare the ongoing costs of investing in the Fund and other funds. To do so, compare this 5% hypothetical example with the 5% hypothetical examples that appear in the shareholder reports of the other funds. In addition, the Fund, as a shareholder in the underlying Fidelity Central Funds, will indirectly bear its pro-rata share of the fees and expenses incurred by the underlying Fidelity Central Funds. These fees and expenses are not included in the Fund's annualized expense ratio used to calculate the expense estimate in the table below.
Please note that the expenses shown in the table are meant to highlight your ongoing costs only and do not reflect any transaction costs. Therefore, the second line of the table is useful in comparing ongoing costs only, and will not help you determine the relative total costs of owning different funds.
| | Annualized Expense Ratio-A | Beginning
Account Value
August 1, 2018 | Ending
Account Value
January 31, 2019 | Expenses Paid
During Period-B
August 1, 2018
to January 31, 2019 |
| Low-Priced Stock | .52% | | | |
| Actual | | $1,000.00 | $947.90 | $2.55 |
| Hypothetical-C | | $1,000.00 | $1,022.58 | $2.65 |
| Class K | .43% | | | |
| Actual | | $1,000.00 | $948.20 | $2.11 |
| Hypothetical-C | | $1,000.00 | $1,023.04 | $2.19 |
A Annualized expense ratio reflects expenses net of applicable fee waivers.
B Expenses are equal to each Class' annualized expense ratio, multiplied by the average account value over the period, multiplied by 184/365 (to reflect the one-half year period).
C 5% return per year before expenses
Board Approval of Investment Advisory Contracts and Management Fees
Fidelity Low-Priced Stock Fund
Each year, the Board of Trustees, including the Independent Trustees (together, the Board), votes on the renewal of the management contract with Fidelity Management & Research Company (FMR) and the sub-advisory agreements (together, the Advisory Contracts) for the fund. FMR and the sub-advisers are referred to herein as the Investment Advisers. The Board, assisted by the advice of fund counsel and Independent Trustees' counsel, requests and considers a broad range of information relevant to the renewal of the Advisory Contracts throughout the year.
The Board meets regularly and, at each of its meetings, covers an extensive agenda of topics and materials and considers factors that are relevant to its annual consideration of the renewal of the fund's Advisory Contracts, including the services and support provided to the fund and its shareholders. The Board has established various standing committees (Committees), each composed of and chaired by Independent Trustees with varying backgrounds, to which the Board has assigned specific subject matter responsibilities in order to enhance effective decision-making by the Board. The Board, acting directly and through its Committees, requests and receives information concerning the annual consideration of the renewal of the fund's Advisory Contracts. The Board also meets as needed to review matters specifically related to the Board's annual consideration of the renewal of the Advisory Contracts. Members of the Board may also meet with trustees of other Fidelity funds through joint ad hoc committees to discuss certain matters relevant to all of the Fidelity funds.
At its January 2019 meeting, the Board unanimously determined to renew the fund's Advisory Contracts. In reaching its determination, the Board considered all factors it believed relevant, including (i) the nature, extent, and quality of the services to be provided to the fund and its shareholders (including the investment performance of the fund); (ii) the competitiveness of the fund's management fee and total expense ratio relative to peer funds; (iii) the total costs of the services to be provided by and the profits to be realized by Fidelity from its relationships with the fund; and (iv) the extent to which, if any, economies of scale exist and would be realized as the fund grows, and whether any economies of scale are appropriately shared with fund shareholders.
In considering whether to renew the Advisory Contracts for the fund, the Board reached a determination, with the assistance of fund counsel and Independent Trustees' counsel and through the exercise of its business judgment, that the renewal of the Advisory Contracts was in the best interests of the fund and its shareholders and that the compensation payable under the Advisory Contracts was fair and reasonable. The Board's decision to renew the Advisory Contracts was not based on any single factor, but rather was based on a comprehensive consideration of all the information provided to the Board at its meetings throughout the year. The Board, in reaching its determination to renew the Advisory Contracts, was aware that shareholders of the fund have a broad range of investment choices available to them, including a wide choice among funds offered by Fidelity's competitors, and that the fund's shareholders, who have the opportunity to review and weigh the disclosure provided by the fund in its prospectus and other public disclosures, have chosen to invest in this fund, which is part of the Fidelity family of funds.
Nature, Extent, and Quality of Services Provided. The Board considered Fidelity's staffing as it relates to the fund, including the backgrounds of investment personnel of Fidelity, and also considered the fund's investment objective, strategies, and related investment philosophy. The Independent Trustees also had discussions with senior management of Fidelity's investment operations and investment groups. The Board considered the structure of the investment personnel compensation program and whether this structure provides appropriate incentives to act in the best interests of the fund. Additionally, the Board considered the portfolio managers' investments, if any, in the funds that they manage.
Resources Dedicated to Investment Management and Support Services. The Board and the Fund Oversight and Research Committees reviewed the general qualifications and capabilities of Fidelity's investment staff, including its size, education, experience, and resources, as well as Fidelity's approach to recruiting, training, managing, and compensating investment personnel. The Board noted that Fidelity has continued to increase the resources devoted to non-U.S. offices, including expansion of Fidelity's global investment organization. The Board also noted that Fidelity's analysts have extensive resources, tools and capabilities that allow them to conduct sophisticated quantitative and fundamental analysis, as well as credit analysis of issuers, counterparties and guarantors. Further, the Board considered that Fidelity's investment professionals have sufficient access to global information and data so as to provide competitive investment results over time, and that those professionals also have access to sophisticated tools that permit them to assess portfolio construction and risk and performance attribution characteristics continuously, as well as to transmit new information and research conclusions rapidly around the world. Additionally, in its deliberations, the Board considered Fidelity's trading, risk management, compliance, and technology and operations capabilities and resources, which are integral parts of the investment management process.
Shareholder and Administrative Services. The Board considered (i) the nature, extent, quality, and cost of advisory, administrative, and shareholder services performed by the Investment Advisers and their affiliates under the Advisory Contracts and under separate agreements covering transfer agency, pricing and bookkeeping, and securities lending services for the fund; (ii) the nature and extent of the supervision of third party service providers, principally custodians, subcustodians, and pricing vendors; and (iii) the resources devoted to, and the record of compliance with, the fund's compliance policies and procedures. The Board also reviewed the allocation of fund brokerage, including allocations to brokers affiliated with the Investment Advisers, the use of brokerage commissions to pay fund expenses, and the use of "soft" commission dollars to pay for research services.
The Board noted that the growth of fund assets over time across the complex allows Fidelity to reinvest in the development of services designed to enhance the value and convenience of the Fidelity funds as investment vehicles. These services include 24-hour access to account information and market information through telephone representatives and over the Internet, investor education materials and asset allocation tools, and the expanded availability of Fidelity Investor Centers.
The Board noted that it and the boards of certain other Fidelity funds had formed an ad hoc Committee on Transfer Agency Fees to review the variety of transfer agency fee structures throughout the industry and Fidelity's competitive positioning with respect to industry participants.
Investment in a Large Fund Family. The Board considered the benefits to shareholders of investing in a Fidelity fund, including the benefits of investing in a fund that is part of a large family of funds offering a variety of investment disciplines and providing a large variety of mutual fund investor services. The Board noted that Fidelity had taken, or had made recommendations that resulted in the Fidelity funds taking, a number of actions over the previous year that benefited particular funds, including: (i) continuing to dedicate additional resources to Fidelity's investment research process, which includes meetings with management of issuers of securities in which the funds invest, and to the support of the senior management team that oversees asset management; (ii) continuing efforts to enhance Fidelity's global research capabilities; (iii) launching new funds and making other enhancements to meet client needs; (iv) launching new share classes of existing funds; (v) eliminating purchase minimums and broadening eligibility requirements for certain funds and share classes; (vi) reducing management fees and total expenses for certain growth equity funds and index funds; (vii) lowering expense caps for certain existing funds and classes, and converting certain voluntary expense caps to contractual caps, to reduce expenses borne by shareholders; (viii) eliminating short-term redemption fees for funds that had such fees; (ix) rationalizing product lines and gaining increased efficiencies from fund mergers and share class consolidations; (x) continuing to develop, acquire and implement systems and technology to improve services to the funds and shareholders, strengthen information security, and increase efficiency; and (xi) continuing to implement enhancements to further strengthen Fidelity's product line to increase investors' probability of success in achieving their investment goals, including retirement income goals.
Investment Performance. The Board considered whether the fund has operated in accordance with its investment objective, as well as its record of compliance with its investment restrictions and its performance history. The fund had a portfolio manager change in May 2016, April 2017, and April 2018. The Board will continue to monitor closely the fund's performance, taking into account the portfolio manager changes.
The Board took into account discussions that occur at Board meetings throughout the year with representatives of the Investment Advisers about fund investment performance. In this regard the Board noted that as part of regularly scheduled fund reviews and other reports to the Board on fund performance, the Board considers annualized return information for the fund for different time periods, measured against an appropriate securities market index ("benchmark index") and a peer group of funds with similar objectives ("peer group"), if any. In its evaluation of fund investment performance, the Board gave particular attention to information indicating changes in performance of certain Fidelity funds for specific time periods and discussed with the Investment Advisers the reasons for any overperformance or underperformance.
In addition to reviewing absolute and relative fund performance, the Independent Trustees periodically consider the appropriateness of fund performance metrics in evaluating the results achieved. In general, the Independent Trustees believe that fund performance should be evaluated based on net performance (after fees and expenses) of both the highest performing and lowest performing fund share classes, where applicable, compared to appropriate benchmark indices, over appropriate time periods that may include full market cycles, and compared to peer groups, as applicable, over the same periods, taking into account relevant factors including the following: general market conditions; issuer-specific information; and fund cash flows and other factors.
The Independent Trustees recognize that shareholders evaluate performance on a net basis over their own holding periods, for which one-, three-, and five-year periods are often used as a proxy. For this reason, the performance information reviewed by the Board also included net cumulative total return information for the fund and an appropriate benchmark index and peer group for the most recent one-, three-, and five-year periods ended June 30, 2018, as shown below. Returns are shown compared to the 25th percentile (top of box, 75% beaten) and 75th percentile (bottom of box, 25% beaten) of the peer universe.
Fidelity Low-Priced Stock Fund
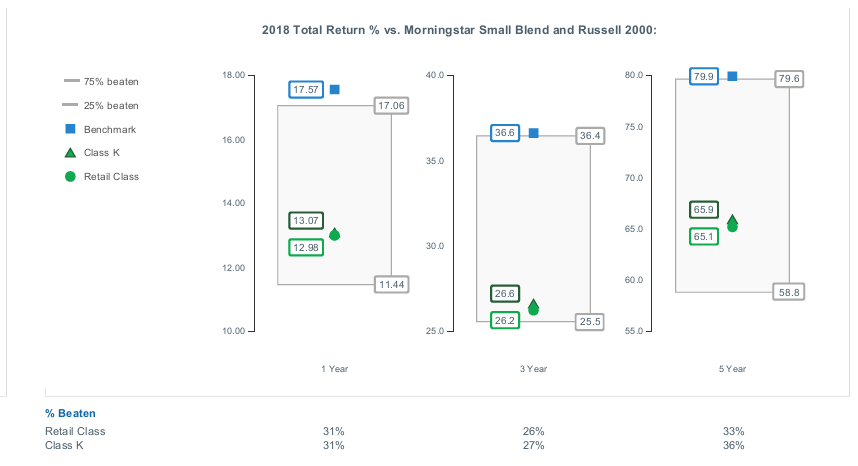
The Board considered the fund's underperformance for different time periods based on the June 30, 2018 data presented above and noted that the fund's underperformance has continued since the Board approved the management contract in 2017. The Board's discussions with FMR regarding underperformance cover topics including, but not limited to: the longer-term track record of a fund's portfolio manager(s); broader trends in the market that may adversely impact a fund's performance; attribution reports on contributors to the fund's underperformance; and the applicable portfolio manager's explanation of his or her underperformance. The Board engages with FMR on steps that might be taken to address a fund's underperformance. For a fund with underperformance over longer periods of time, the Board typically monitors the effect of any remedial actions and other relevant factors.
The Board also considered that the fund's management fee is subject to upward or downward adjustment depending upon whether, and to what extent, the fund's investment performance for the performance period (a rolling 36-month period) exceeds, or is exceeded by, a securities index, thus leading to a performance adjustment for the same period. The Board noted that the performance adjustment provides FMR with a strong economic incentive to seek to achieve superior long-term performance for the fund's shareholders and helps to more closely align the interests of FMR and the shareholders of the fund.
Based on its review, the Board concluded that the nature, extent, and quality of services provided to the fund under the Advisory Contracts should continue to benefit the shareholders of the fund.
Competitiveness of Management Fee and Total Expense Ratio. The Board considered the fund's management fee and total expense ratio compared to "mapped groups" of competitive funds and classes created for the purpose of facilitating the Trustees' competitive analysis of management fees and total expenses. Fidelity creates "mapped groups" by combining similar Lipper investment objective categories that have comparable investment mandates. Combining Lipper investment objective categories aids the Board's management fee and total expense ratio comparisons by broadening the competitive group used for comparison.
Management Fee. The Board considered two proprietary management fee comparisons for the 12-month periods (ended June 30 for 2018 and December 31 for prior periods) shown in basis points (BP) in the chart below. The group of Lipper funds used by the Board for management fee comparisons is referred to below as the "Total Mapped Group." The Total Mapped Group comparison focuses on a fund's standing in terms of gross management fees before expense reimbursements or caps, and without giving effect to the fund's performance adjustment, relative to the total universe of funds with comparable investment mandates, regardless of whether their management fee structures also are comparable. Funds with comparable investment mandates offer exposure to similar types of securities. Funds with comparable management fee structures have similar management fee contractual arrangements (
e.g., flat rate charged for advisory services, all-inclusive fee rate,
etc.). "TMG %" represents the percentage of funds in the Total Mapped Group that had management fees that were lower than the fund's. For example, a hypothetical TMG % of 20% would mean that 80% of the funds in the Total Mapped Group had higher, and 20% had lower, management fees than the fund. The fund's actual TMG %s and the number of funds in the Total Mapped Group are in the chart below. The "Asset-Size Peer Group" (ASPG) comparison focuses on a fund's standing relative to a subset of non-Fidelity funds within the Total Mapped Group that are similar in size and management fee structure without taking into account performance adjustments, if any. For example, if a fund is in the first quartile of the ASPG, the fund's management fee ranks in the least expensive or lowest 25% of funds in the ASPG. The ASPG represents at least 15% of the funds in the Total Mapped Group with comparable asset size and management fee structures, subject to a minimum of 50 funds (or all funds in the Total Mapped Group if fewer than 50). Additional information, such as the ASPG quartile in which the fund's management fee rate ranked and the impact of the fund's performance adjustment, is also included in the chart and was considered by the Board.
Fidelity Low-Priced Stock Fund
The Board noted that the comparisons for 2015 and later reflect a revised Total Mapped Group that no longer includes funds with micro-cap objectives and that FMR believes this Total Mapped Group is a more appropriate comparison because the fund does not have a micro-cap objective.
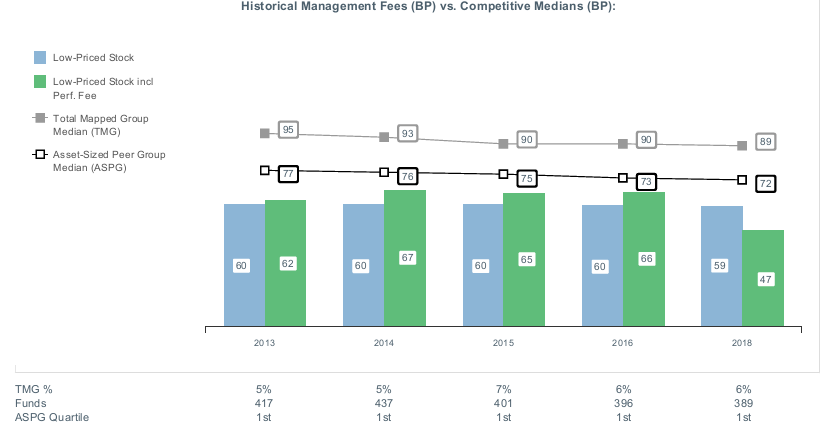
The Board noted that the fund's management fee rate ranked below the median of its Total Mapped Group and below the median of its ASPG for the 12-month period ended June 30, 2018. The Board also noted the effect of the fund's performance adjustment, if any, on the fund's management fee ranking.
The Board noted that it and the boards of other Fidelity funds formed an ad hoc Committee on Group Fee, which meets periodically, to conduct an in-depth review of the "group fee" component of the management fee of funds with such management fee structures. The Committee's focus included the mechanics of the group fee, the competitive landscape of group fee structures, Fidelity funds with no group fee component and investment products not included in group fee assets. The Board also considered that, for funds subject to the group fee, FMR agreed to voluntarily waive fees over a specified period of time in amounts designed to account for assets converted from certain funds to certain collective investment trusts.
The Board also noted that, in 2013, the ad hoc Committee on Management Fees was formed to conduct an in-depth review of the management fee rates of Fidelity's active equity mutual funds. The Committee focused on the following areas: (i) standard fee structures; (ii) research consumption and trading evolution; (iii) management fee competitiveness/profitability by category; and (iv) factors that drive institutional pricing.
Based on its review, the Board concluded that the fund's management fee is fair and reasonable in light of the services that the fund receives and the other factors considered.
Total Expense Ratio. In its review of each class's total expense ratio, the Board considered the fund's management fee rate as well as other fund or class expenses, as applicable, such as transfer agent fees, pricing and bookkeeping fees, and custodial, legal, and audit fees. The Board noted the impact of the fund's performance adjustment. The Board also noted that Fidelity may agree to waive fees and expenses from time to time, and the extent to which, if any, it has done so for the fund. As part of its review, the Board also considered the current and historical total expense ratios of each class of the fund compared to competitive fund median expenses. Each class of the fund is compared to those funds and classes in the Total Mapped Group (used by the Board for management fee comparisons) that have a similar sales load structure.
The Board noted that the total expense ratio of each class ranked below the competitive median for the 12-month period ended June 30, 2018.
Fees Charged to Other Fidelity Clients. The Board also considered Fidelity fee structures and other information with respect to clients of Fidelity, such as other funds advised or subadvised by Fidelity, pension plan clients, and other institutional clients with similar mandates. The Board noted that a joint ad hoc committee created by it and the boards of other Fidelity funds periodically reviews and compares Fidelity's institutional investment advisory business with its business of providing services to the Fidelity funds and also noted the most recent findings of the committee. The Board noted that the committee's review included a consideration of the differences in services provided, fees charged, and costs incurred, as well as competition in the markets serving the different categories of clients.
Based on its review of total expense ratios and fees charged to other Fidelity clients, the Board concluded that the total expense ratio of each class of the fund was reasonable in light of the services that the fund and its shareholders receive and the other factors considered.
Costs of the Services and Profitability. The Board considered the revenues earned and the expenses incurred by Fidelity in conducting the business of developing, marketing, distributing, managing, administering and servicing the fund and servicing the fund's shareholders. The Board also considered the level of Fidelity's profits in respect of all the Fidelity funds.
On an annual basis, Fidelity presents to the Board information about the profitability of its relationships with the fund. Fidelity calculates profitability information for each fund, as well as aggregate profitability information for groups of Fidelity funds and all Fidelity funds, using a series of detailed revenue and cost allocation methodologies which originate with the books and records of Fidelity on which Fidelity's audited financial statements are based. The Audit Committee of the Board reviews any significant changes from the prior year's methodologies.
PricewaterhouseCoopers LLP (PwC), auditor to Fidelity and certain Fidelity funds, has been engaged annually by the Board as part of the Board's assessment of Fidelity's profitability analysis. PwC's engagement includes the review and assessment of the methodologies used by Fidelity in determining the revenues and expenses attributable to Fidelity's mutual fund business, and completion of agreed-upon procedures in respect of the mathematical accuracy of the fund profitability information and its conformity to established allocation methodologies. After considering PwC's reports issued under the engagement and information provided by Fidelity, the Board concluded that while other allocation methods may also be reasonable, Fidelity's profitability methodologies are reasonable in all material respects.
The Board also reviewed Fidelity's non-fund businesses and potential indirect benefits such businesses may have received as a result of their association with Fidelity's mutual fund business (i.e., fall-out benefits) as well as cases where Fidelity's affiliates may benefit from the fund's business. The Board noted that changes to fall-out benefits year-over-year reflect business developments at Fidelity's various businesses.
The Board considered the costs of the services provided by and the profits realized by Fidelity in connection with the operation of the fund and was satisfied that the profitability was not excessive.
Economies of Scale. The Board considered whether there have been economies of scale in respect of the management of the Fidelity funds, whether the Fidelity funds (including the fund) have appropriately benefited from any such economies of scale, and whether there is potential for realization of any further economies of scale. The Board considered the extent to which the fund will benefit from economies of scale as assets grow through increased services to the fund, through waivers or reimbursements, or through fee or expense ratio reductions. The Board also noted that a committee (the Economies of Scale Committee) created by it and the boards of other Fidelity funds periodically analyzes whether Fidelity attains economies of scale in respect of the management and servicing of the Fidelity funds, whether the Fidelity funds have appropriately benefited from such economies of scale, and whether there is potential for realization of any further economies of scale.
The Board recognized that the fund's management contract incorporates a "group fee" structure, which provides for lower group fee rates as total group assets increase, and for higher group fee rates as total group assets decrease (with "group assets" defined to include fund assets under FMR's management plus the assets of sector funds previously under FMR's management). FMR calculates the group fee rates based on a tiered asset "breakpoint" schedule that varies based on asset class. The Board considered that the group fee is designed to deliver the benefits of economies of scale to fund shareholders when total Fidelity fund assets increase, even if assets of any particular fund are unchanged or have declined, because some portion of Fidelity's costs are attributable to services provided to all Fidelity funds, and all funds benefit if those costs can be allocated among more assets. The Board concluded that, given the group fee structure, fund shareholders will benefit from lower management fees as group assets increase at the fund complex level, regardless of whether Fidelity achieves any such economies of scale.
The Board concluded, taking into account the analysis of the Economies of Scale Committee, that economies of scale, if any, are being appropriately shared between fund shareholders and Fidelity.
Additional Information Requested by the Board. In order to develop fully the factual basis for consideration of the Fidelity funds' advisory contracts, the Board requested and received additional information on certain topics, including: (i) fund performance trends, in particular the underperformance of certain funds, and Fidelity's long-term strategies for certain funds; (ii) Fidelity's fund profitability methodology, profitability trends for certain funds, and the impact of certain factors on fund profitability results; (iii) metrics for evaluating index fund and ETF performance and information about ETF trading characteristics; (iv) the methodology with respect to the evaluation of competitive fund data and peer group classifications and fee comparisons; (v) the expense structures for different funds and classes; (vi) information regarding other accounts managed by Fidelity, including collective investment trusts; and (vii) Fidelity's philosophies and strategies for evaluating funds and classes with lower or declining asset levels.
Based on its evaluation of all of the conclusions noted above, and after considering all factors it believed relevant, the Board concluded that the advisory fee arrangements are fair and reasonable, and that the fund's Advisory Contracts should be renewed.

LPS-SANN-0319
1.700505.122
Fidelity® Value Discovery Fund
Semi-Annual Report January 31, 2019 |
|
Beginning on January 1, 2021, as permitted by regulations adopted by the Securities and Exchange Commission, paper copies of a fund’s shareholder reports will no longer be sent by mail, unless you specifically request paper copies of the reports from the fund or from your financial intermediary, such as a financial advisor, broker-dealer or bank. Instead, the reports will be made available on a website, and you will be notified by mail each time a report is posted and provided with a website link to access the report.
If you already elected to receive shareholder reports electronically, you will not be affected by this change and you need not take any action. You may elect to receive shareholder reports and other communications from a fund electronically, by contacting your financial intermediary. For Fidelity customers, visit Fidelity's web site or call Fidelity using the contact information listed below.
You may elect to receive all future reports in paper free of charge. If you wish to continue receiving paper copies of your shareholder reports, you may contact your financial intermediary or, if you are a Fidelity customer, visit Fidelity’s website, or call Fidelity at the applicable toll-free number listed below. Your election to receive reports in paper will apply to all funds held with the fund complex/your financial intermediary.
| Account Type | Website | Phone Number |
| Brokerage, Mutual Fund, or Annuity Contracts: | fidelity.com/mailpreferences | 1-800-343-3548 |
| Employer Provided Retirement Accounts: | netbenefits.fidelity.com/preferences (choose 'no' under Required Disclosures to continue to print) | 1-800-343-0860 |
| Advisor Sold Accounts Serviced Through Your Financial Intermediary: | Contact Your Financial Intermediary | Your Financial Intermediary's phone number |
| Advisor Sold Accounts Serviced by Fidelity: | institutional.fidelity.com | 1-877-208-0098 |
Contents
To view a fund's proxy voting guidelines and proxy voting record for the 12-month period ended June 30, visit http://www.fidelity.com/proxyvotingresults or visit the Securities and Exchange Commission's (SEC) web site at http://www.sec.gov.
You may also call 1-800-544-8544 if you’re an individual investing directly with Fidelity, call 1-800-835-5092 if you’re a plan sponsor or participant with Fidelity as your recordkeeper or call 1-877-208-0098 on institutional accounts or if you’re an advisor or invest through one to request a free copy of the proxy voting guidelines.
Standard & Poor's, S&P and S&P 500 are registered service marks of The McGraw-Hill Companies, Inc. and have been licensed for use by Fidelity Distributors Corporation.
Other third-party marks appearing herein are the property of their respective owners.
All other marks appearing herein are registered or unregistered trademarks or service marks of FMR LLC or an affiliated company. © 2019 FMR LLC. All rights reserved.
This report and the financial statements contained herein are submitted for the general information of the shareholders of the Fund. This report is not authorized for distribution to prospective investors in the Fund unless preceded or accompanied by an effective prospectus.
A fund files its complete schedule of portfolio holdings with the SEC for the first and third quarters of each fiscal year on Form N-Q. Forms N-Q are available on the SEC’s web site at http://www.sec.gov. A fund's Forms N-Q may be reviewed and copied at the SEC’s Public Reference Room in Washington, DC. Information regarding the operation of the SEC's Public Reference Room may be obtained by calling 1-800-SEC-0330.
For a complete list of a fund's portfolio holdings, view the most recent holdings listing, semiannual report, or annual report on Fidelity's web site at http://www.fidelity.com, http://www.institutional.fidelity.com, or http://www.401k.com, as applicable.
NOT FDIC INSURED •MAY LOSE VALUE •NO BANK GUARANTEE
Neither the Fund nor Fidelity Distributors Corporation is a bank.
Investment Summary (Unaudited)
Top Ten Stocks as of January 31, 2019
| | % of fund's net assets |
| Berkshire Hathaway, Inc. Class B | 3.9 |
| Wells Fargo & Co. | 3.4 |
| Exxon Mobil Corp. | 3.0 |
| Comcast Corp. Class A | 2.8 |
| CVS Health Corp. | 2.5 |
| Chevron Corp. | 2.4 |
| Verizon Communications, Inc. | 2.3 |
| U.S. Bancorp | 2.3 |
| Amgen, Inc. | 2.3 |
| Twenty-First Century Fox, Inc. Class A | 2.2 |
| | 27.1 |
Top Five Market Sectors as of January 31, 2019
| | % of fund's net assets |
| Financials | 25.8 |
| Health Care | 16.7 |
| Communication Services | 14.3 |
| Energy | 11.3 |
| Consumer Staples | 9.6 |
Asset Allocation (% of fund's net assets)
| As of January 31, 2019 * |
| | Stocks | 99.5% |
| | Short-Term Investments and Net Other Assets (Liabilities) | 0.5% |

* Foreign investments - 16.4%
Schedule of Investments January 31, 2019 (Unaudited)
Showing Percentage of Net Assets
| Common Stocks - 99.5% | | | �� |
| | | Shares | Value |
| COMMUNICATION SERVICES - 14.3% | | | |
| Diversified Telecommunication Services - 2.3% | | | |
| Verizon Communications, Inc. | | 938,618 | $51,680,307 |
| Entertainment - 5.6% | | | |
| Cinemark Holdings, Inc. | | 447,379 | 18,306,749 |
| Lions Gate Entertainment Corp. Class B | | 1,049,277 | 18,393,826 |
| The Walt Disney Co. | | 343,408 | 38,296,860 |
| Twenty-First Century Fox, Inc. Class A | | 994,833 | 49,055,215 |
| | | | 124,052,650 |
| Interactive Media & Services - 1.4% | | | |
| Alphabet, Inc. Class A (a) | | 28,248 | 31,804,141 |
| Media - 5.0% | | | |
| Comcast Corp. Class A | | 1,732,203 | 63,346,664 |
| comScore, Inc. (a) | | 482,616 | 9,502,709 |
| Entercom Communications Corp. Class A | | 1,246,636 | 9,137,842 |
| Interpublic Group of Companies, Inc. | | 1,339,945 | 30,483,749 |
| | | | 112,470,964 |
|
| TOTAL COMMUNICATION SERVICES | | | 320,008,062 |
|
| CONSUMER DISCRETIONARY - 3.1% | | | |
| Auto Components - 0.4% | | | |
| Lear Corp. | | 61,600 | 9,482,088 |
| Internet & Direct Marketing Retail - 0.6% | | | |
| eBay, Inc. | | 384,669 | 12,944,112 |
| Multiline Retail - 1.1% | | | |
| Dollar General Corp. | | 222,900 | 25,729,347 |
| Textiles, Apparel & Luxury Goods - 1.0% | | | |
| PVH Corp. | | 195,928 | 21,377,704 |
|
| TOTAL CONSUMER DISCRETIONARY | | | 69,533,251 |
|
| CONSUMER STAPLES - 9.6% | | | |
| Beverages - 2.7% | | | |
| C&C Group PLC | | 3,593,410 | 13,572,956 |
| Coca-Cola European Partners PLC | | 293,500 | 13,964,730 |
| PepsiCo, Inc. | | 296,635 | 33,421,865 |
| | | | 60,959,551 |
| Food & Staples Retailing - 1.8% | | | |
| Sysco Corp. | | 379,346 | 24,221,242 |
| Walmart, Inc. | | 166,600 | 15,965,278 |
| | | | 40,186,520 |
| Food Products - 4.9% | | | |
| Danone SA | | 283,900 | 20,659,915 |
| Mondelez International, Inc. | | 276,000 | 12,767,760 |
| Seaboard Corp. | | 2,189 | 8,458,668 |
| The Hershey Co. | | 287,008 | 30,451,549 |
| The J.M. Smucker Co. | | 353,461 | 37,070,990 |
| | | | 109,408,882 |
| Personal Products - 0.2% | | | |
| Coty, Inc. Class A | | 588,200 | 4,564,432 |
|
| TOTAL CONSUMER STAPLES | | | 215,119,385 |
|
| ENERGY - 11.3% | | | |
| Energy Equipment & Services - 1.3% | | | |
| Baker Hughes, a GE Co. Class A | | 949,234 | 22,373,445 |
| FLEX LNG Ltd. (a) | | 5,399,800 | 7,042,702 |
| | | | 29,416,147 |
| Oil, Gas & Consumable Fuels - 10.0% | | | |
| Chevron Corp. | | 474,037 | 54,348,342 |
| Exxon Mobil Corp. | | 913,240 | 66,922,227 |
| GasLog Ltd. | | 256,608 | 4,600,981 |
| GasLog Partners LP | | 827,182 | 18,768,760 |
| Golar LNG Partners LP | | 1,185,160 | 15,881,144 |
| Hoegh LNG Partners LP | | 389,395 | 6,872,822 |
| Phillips 66 Co. | | 258,605 | 24,673,503 |
| Suncor Energy, Inc. | | 519,200 | 16,746,220 |
| Teekay Corp. (b) | | 397,064 | 1,393,695 |
| Teekay LNG Partners LP | | 780,099 | 10,032,073 |
| Teekay Offshore Partners LP | | 2,310,169 | 2,795,304 |
| | | | 223,035,071 |
|
| TOTAL ENERGY | | | 252,451,218 |
|
| FINANCIALS - 25.8% | | | |
| Banks - 9.6% | | | |
| M&T Bank Corp. | | 130,600 | 21,488,924 |
| PNC Financial Services Group, Inc. | | 290,231 | 35,602,637 |
| SunTrust Banks, Inc. | | 537,731 | 31,951,976 |
| U.S. Bancorp | | 1,000,333 | 51,177,036 |
| Wells Fargo & Co. | | 1,539,286 | 75,286,478 |
| | | | 215,507,051 |
| Capital Markets - 2.8% | | | |
| Affiliated Managers Group, Inc. | | 60,100 | 6,307,495 |
| AllianceBernstein Holding LP | | 38,100 | 1,161,669 |
| Goldman Sachs Group, Inc. | | 151,120 | 29,923,271 |
| Invesco Ltd. | | 343,600 | 6,260,392 |
| State Street Corp. | | 281,019 | 19,924,247 |
| | | | 63,577,074 |
| Consumer Finance - 1.9% | | | |
| Capital One Financial Corp. | | 221,132 | 17,821,028 |
| Discover Financial Services | | 350,022 | 23,622,985 |
| | | | 41,444,013 |
| Diversified Financial Services - 3.9% | | | |
| Berkshire Hathaway, Inc. Class B (a) | | 420,160 | 86,359,687 |
| Standard Life PLC | | 199,704 | 659,151 |
| | | | 87,018,838 |
| Insurance - 4.4% | | | |
| Allstate Corp. | | 156,407 | 13,743,483 |
| Chubb Ltd. | | 198,347 | 26,390,068 |
| FNF Group | | 348,848 | 12,614,344 |
| Prudential PLC | | 830,907 | 16,249,350 |
| The Travelers Companies, Inc. | | 233,415 | 29,302,919 |
| | | | 98,300,164 |
| Mortgage Real Estate Investment Trusts - 3.2% | | | |
| AGNC Investment Corp. | | 1,425,411 | 25,529,111 |
| Annaly Capital Management, Inc. | | 2,630,611 | 27,463,579 |
| MFA Financial, Inc. | | 2,559,965 | 18,764,543 |
| | | | 71,757,233 |
|
| TOTAL FINANCIALS | | | 577,604,373 |
|
| HEALTH CARE - 16.7% | | | |
| Biotechnology - 3.1% | | | |
| Amgen, Inc. | | 271,793 | 50,855,188 |
| Celgene Corp. (a) | | 215,000 | 19,018,900 |
| | | | 69,874,088 |
| Health Care Providers & Services - 6.9% | | | |
| Anthem, Inc. | | 106,889 | 32,387,367 |
| Cigna Corp. | | 202,264 | 40,414,370 |
| CVS Health Corp. | | 850,160 | 55,727,988 |
| UnitedHealth Group, Inc. | | 90,700 | 24,507,140 |
| | | | 153,036,865 |
| Pharmaceuticals - 6.7% | | | |
| Allergan PLC | | 178,414 | 25,688,048 |
| Bayer AG | | 388,920 | 29,478,522 |
| Bristol-Myers Squibb Co. | | 237,900 | 11,745,123 |
| Johnson & Johnson | | 87,280 | 11,615,222 |
| Pfizer, Inc. | | 241,957 | 10,271,075 |
| Roche Holding AG (participation certificate) | | 56,994 | 15,162,441 |
| Sanofi SA sponsored ADR | | 482,942 | 20,983,830 |
| Takeda Pharmaceutical Co. Ltd. ADR (b) | | 1,245,507 | 24,872,775 |
| | | | 149,817,036 |
|
| TOTAL HEALTH CARE | | | 372,727,989 |
|
| INDUSTRIALS - 5.5% | | | |
| Aerospace & Defense - 2.6% | | | |
| Harris Corp. | | 112,784 | 17,276,253 |
| United Technologies Corp. | | 343,379 | 40,542,759 |
| | | | 57,819,012 |
| Air Freight & Logistics - 1.2% | | | |
| C.H. Robinson Worldwide, Inc. | | 299,200 | 25,961,584 |
| Machinery - 1.1% | | | |
| Deere & Co. | | 157,488 | 25,828,032 |
| Road & Rail - 0.6% | | | |
| Union Pacific Corp. | | 82,072 | 13,055,193 |
|
| TOTAL INDUSTRIALS | | | 122,663,821 |
|
| INFORMATION TECHNOLOGY - 3.8% | | | |
| Electronic Equipment & Components - 1.1% | | | |
| TE Connectivity Ltd. | | 296,334 | 23,988,237 |
| IT Services - 2.7% | | | |
| Amdocs Ltd. | | 324,882 | 18,154,406 |
| Cognizant Technology Solutions Corp. Class A | | 370,713 | 25,831,282 |
| Fiserv, Inc. (a) | | 58,600 | 4,859,698 |
| The Western Union Co. | | 619,794 | 11,311,241 |
| | | | 60,156,627 |
|
| TOTAL INFORMATION TECHNOLOGY | | | 84,144,864 |
|
| MATERIALS - 1.6% | | | |
| Chemicals - 0.9% | | | |
| LyondellBasell Industries NV Class A | | 92,940 | 8,082,992 |
| The Scotts Miracle-Gro Co. Class A | | 170,374 | 12,667,307 |
| | | | 20,750,299 |
| Containers & Packaging - 0.7% | | | |
| Graphic Packaging Holding Co. | | 1,306,939 | 15,774,754 |
|
| TOTAL MATERIALS | | | 36,525,053 |
|
| REAL ESTATE - 3.0% | | | |
| Equity Real Estate Investment Trusts (REITs) - 1.7% | | | |
| American Tower Corp. | | 118,600 | 20,498,824 |
| Simon Property Group, Inc. | | 99,800 | 18,175,576 |
| | | | 38,674,400 |
| Real Estate Management & Development - 1.3% | | | |
| CBRE Group, Inc. (a) | | 625,593 | 28,620,880 |
|
| TOTAL REAL ESTATE | | | 67,295,280 |
|
| UTILITIES - 4.8% | | | |
| Electric Utilities - 3.8% | | | |
| Exelon Corp. | | 937,812 | 44,789,901 |
| Xcel Energy, Inc. | | 759,152 | 39,749,199 |
| | | | 84,539,100 |
| Independent Power and Renewable Electricity Producers - 0.2% | | | |
| NRG Yield, Inc. Class C | | 227,200 | 3,428,448 |
| Multi-Utilities - 0.8% | | | |
| WEC Energy Group, Inc. | | 251,100 | 18,337,833 |
|
| TOTAL UTILITIES | | | 106,305,381 |
|
| TOTAL COMMON STOCKS | | | |
| (Cost $2,161,242,548) | | | 2,224,378,677 |
|
| Money Market Funds - 0.2% | | | |
| Fidelity Cash Central Fund, 2.43% (c) | | 3,072,213 | 3,072,827 |
| Fidelity Securities Lending Cash Central Fund 2.43% (c)(d) | | 1,340,014 | 1,340,148 |
| TOTAL MONEY MARKET FUNDS | | | |
| (Cost $4,412,795) | | | 4,412,975 |
| TOTAL INVESTMENT IN SECURITIES - 99.7% | | | |
| (Cost $2,165,655,343) | | | 2,228,791,652 |
| NET OTHER ASSETS (LIABILITIES) - 0.3% | | | 7,647,800 |
| NET ASSETS - 100% | | | $2,236,439,452 |
Legend
(a) Non-income producing
(b) Security or a portion of the security is on loan at period end.
(c) Affiliated fund that is generally available only to investment companies and other accounts managed by Fidelity Investments. The rate quoted is the annualized seven-day yield of the fund at period end. A complete unaudited listing of the fund's holdings as of its most recent quarter end is available upon request. In addition, each Fidelity Central Fund's financial statements are available on the SEC's website or upon request.
(d) Investment made with cash collateral received from securities on loan.
Affiliated Central Funds
Information regarding fiscal year to date income earned by the Fund from investments in Fidelity Central Funds is as follows:
| Fund | Income earned |
| Fidelity Cash Central Fund | $1,032,330 |
| Fidelity Securities Lending Cash Central Fund | 54,319 |
| Total | $1,086,649 |
Amounts in the income column in the above table include any capital gain distributions from underlying funds, which are presented in the corresponding line-item in the Statement of Operations, if applicable.
Investment Valuation
The following is a summary of the inputs used, as of January 31, 2019, involving the Fund's assets and liabilities carried at fair value. The inputs or methodology used for valuing securities may not be an indication of the risk associated with investing in those securities. For more information on valuation inputs, and their aggregation into the levels used below, please refer to the Investment Valuation section in the accompanying Notes to Financial Statements.
| | Valuation Inputs at Reporting Date: |
| Description | Total | Level 1 | Level 2 | Level 3 |
| Investments in Securities: | | | | |
| Equities: | | | | |
| Communication Services | $320,008,062 | $320,008,062 | $-- | $-- |
| Consumer Discretionary | 69,533,251 | 69,533,251 | -- | -- |
| Consumer Staples | 215,119,385 | 194,459,470 | 20,659,915 | -- |
| Energy | 252,451,218 | 252,451,218 | -- | -- |
| Financials | 577,604,373 | 561,355,023 | 16,249,350 | -- |
| Health Care | 372,727,989 | 328,087,026 | 44,640,963 | -- |
| Industrials | 122,663,821 | 122,663,821 | -- | -- |
| Information Technology | 84,144,864 | 84,144,864 | -- | -- |
| Materials | 36,525,053 | 36,525,053 | -- | -- |
| Real Estate | 67,295,280 | 67,295,280 | -- | -- |
| Utilities | 106,305,381 | 106,305,381 | -- | -- |
| Money Market Funds | 4,412,975 | 4,412,975 | -- | -- |
| Total Investments in Securities: | $2,228,791,652 | $2,147,241,424 | $81,550,228 | $-- |
Other Information
Distribution of investments by country or territory of incorporation, as a percentage of Total Net Assets, is as follows (Unaudited):
| United States of America | 83.6% |
| Switzerland | 3.0% |
| Marshall Islands | 2.5% |
| France | 1.8% |
| Ireland | 1.8% |
| Canada | 1.7% |
| United Kingdom | 1.3% |
| Germany | 1.3% |
| Japan | 1.1% |
| Others (Individually Less Than 1%) | 1.9% |
| | 100.0% |
See accompanying notes which are an integral part of the financial statements.
Financial Statements
Statement of Assets and Liabilities
| | | January 31, 2019 (Unaudited) |
| Assets | | |
Investment in securities, at value (including securities loaned of $1,253,996) — See accompanying schedule:
Unaffiliated issuers (cost $2,161,242,548) | $2,224,378,677 | |
| Fidelity Central Funds (cost $4,412,795) | 4,412,975 | |
| Total Investment in Securities (cost $2,165,655,343) | | $2,228,791,652 |
| Receivable for investments sold | | 15,810,358 |
| Receivable for fund shares sold | | 2,989,230 |
| Dividends receivable | | 2,923,145 |
| Distributions receivable from Fidelity Central Funds | | 113,577 |
| Prepaid expenses | | 2,765 |
| Other receivables | | 18,140 |
| Total assets | | 2,250,648,867 |
| Liabilities | | |
| Payable for fund shares redeemed | $11,817,343 | |
| Accrued management fee | 669,389 | |
| Other affiliated payables | 347,258 | |
| Other payables and accrued expenses | 36,926 | |
| Collateral on securities loaned | 1,338,499 | |
| Total liabilities | | 14,209,415 |
| Net Assets | | $2,236,439,452 |
| Net Assets consist of: | | |
| Paid in capital | | $2,184,346,108 |
| Total distributable earnings (loss) | | 52,093,344 |
| Net Assets | | $2,236,439,452 |
| Net Asset Value and Maximum Offering Price | | |
| Value Discovery: | | |
| Net Asset Value, offering price and redemption price per share ($2,174,288,495 ÷ 80,567,359 shares) | | $26.99 |
| Class K: | | |
| Net Asset Value, offering price and redemption price per share ($62,150,957 ÷ 2,302,676 shares) | | $26.99 |
See accompanying notes which are an integral part of the financial statements.
Statement of Operations
| | | Six months ended January 31, 2019 (Unaudited) |
| Investment Income | | |
| Dividends | | $26,820,627 |
| Income from Fidelity Central Funds | | 1,086,649 |
| Total income | | 27,907,276 |
| Expenses | | |
| Management fee | | |
| Basic fee | $6,162,689 | |
| Performance adjustment | (1,721,807) | |
| Transfer agent fees | 1,778,616 | |
| Accounting and security lending fees | 343,669 | |
| Custodian fees and expenses | 17,791 | |
| Independent trustees' fees and expenses | 7,678 | |
| Registration fees | 69,114 | |
| Audit | 37,752 | |
| Legal | 6,383 | |
| Miscellaneous | 6,440 | |
| Total expenses before reductions | 6,708,325 | |
| Expense reductions | (35,657) | |
| Total expenses after reductions | | 6,672,668 |
| Net investment income (loss) | | 21,234,608 |
| Realized and Unrealized Gain (Loss) | | |
| Net realized gain (loss) on: | | |
| Investment securities: | | |
| Unaffiliated issuers | 22,304,646 | |
| Fidelity Central Funds | (2,035) | |
| Foreign currency transactions | 22,205 | |
| Futures contracts | 3,642,572 | |
| Total net realized gain (loss) | | 25,967,388 |
| Change in net unrealized appreciation (depreciation) on: | | |
| Investment securities: | | |
| Unaffiliated issuers | (133,353,740) | |
| Fidelity Central Funds | 617 | |
| Assets and liabilities in foreign currencies | (7,451) | |
| Total change in net unrealized appreciation (depreciation) | | (133,360,574) |
| Net gain (loss) | | (107,393,186) |
| Net increase (decrease) in net assets resulting from operations | | $(86,158,578) |
See accompanying notes which are an integral part of the financial statements.
Statement of Changes in Net Assets
| | Six months ended January 31, 2019 (Unaudited) | Year ended July 31, 2018 |
| Increase (Decrease) in Net Assets | | |
| Operations | | |
| Net investment income (loss) | $21,234,608 | $48,440,699 |
| Net realized gain (loss) | 25,967,388 | 261,716,177 |
| Change in net unrealized appreciation (depreciation) | (133,360,574) | (116,467,009) |
| Net increase (decrease) in net assets resulting from operations | (86,158,578) | 193,689,867 |
| Distributions to shareholders | (94,739,011) | – |
| Distributions to shareholders from net investment income | – | (38,872,556) |
| Distributions to shareholders from net realized gain | – | (29,026,203) |
| Total distributions | (94,739,011) | (67,898,759) |
| Share transactions - net increase (decrease) | 36,190,145 | (566,361,059) |
| Total increase (decrease) in net assets | (144,707,444) | (440,569,951) |
| Net Assets | | |
| Beginning of period | 2,381,146,896 | 2,821,716,847 |
| End of period | $2,236,439,452 | $2,381,146,896 |
| Other Information | | |
| Undistributed net investment income end of period | | $22,670,477 |
See accompanying notes which are an integral part of the financial statements.
Financial Highlights
Fidelity Value Discovery Fund
| | Six months ended (Unaudited) January 31, | Years endedJuly 31, | | | | |
| | 2019 | 2018 | 2017 | 2016 | 2015 | 2014 |
| Selected Per–Share Data | | | | | | |
| Net asset value, beginning of period | $29.25 | $28.10 | $24.16 | $24.99 | $23.32 | $19.93 |
| Income from Investment Operations | | | | | | |
| Net investment income (loss)A | .26 | .42 | .38 | .34 | .66B | .31 |
| Net realized and unrealized gain (loss) | (1.36) | 1.28 | 3.86 | (.38)C | 1.35 | 3.34 |
| Total from investment operations | (1.10) | 1.70 | 4.24 | (.04) | 2.01 | 3.65 |
| Distributions from net investment income | (.57) | (.31) | (.29) | (.47) | (.32) | (.26) |
| Distributions from net realized gain | (.59) | (.24) | (.01) | (.32) | (.02) | – |
| Total distributions | (1.16) | (.55) | (.30) | (.79) | (.34) | (.26) |
| Net asset value, end of period | $26.99 | $29.25 | $28.10 | $24.16 | $24.99 | $23.32 |
| Total ReturnD,E | (3.77)% | 6.19% | 17.70% | .05% | 8.68% | 18.52% |
| Ratios to Average Net AssetsF,G | | | | | | |
| Expenses before reductions | .59%H | .69% | .75% | .86% | .84% | .80% |
| Expenses net of fee waivers, if any | .59%H | .69% | .75% | .86% | .84% | .80% |
| Expenses net of all reductions | .59%H | .69% | .75% | .86% | .84% | .80% |
| Net investment income (loss) | 1.85%H | 1.50% | 1.44% | 1.46% | 2.69%B | 1.44% |
| Supplemental Data | | | | | | |
| Net assets, end of period (000 omitted) | $2,174,288 | $2,313,811 | $2,708,049 | $1,712,212 | $1,205,423 | $686,767 |
| Portfolio turnover rateI | 47%H | 33%J | 32%J | 41% | 45% | 58% |
A Calculated based on average shares outstanding during the period.
B Net investment income per share reflects a large, non-recurring dividend which amounted to $.26 per share. Excluding this non-recurring dividend, the ratio of net investment income (loss) to average net assets would have been 1.62%.
C The amount shown for a share outstanding does not correspond with the aggregate net gain (loss) on investments for the period due to the timing of sales and repurchases of shares in relation to fluctuating market values of the investments of the Fund.
D Total returns for periods of less than one year are not annualized.
E Total returns would have been lower if certain expenses had not been reduced during the applicable periods shown.
F Fees and expenses of any underlying Fidelity Central Funds are not included in the Fund's expense ratio. The Fund indirectly bears its proportionate share of the expenses of any underlying Fidelity Central Funds.
G Expense ratios reflect operating expenses of the class. Expenses before reductions do not reflect amounts reimbursed by the investment adviser or reductions from brokerage service arrangements or reductions from other expense offset arrangements and do not represent the amount paid by the class during periods when reimbursements or reductions occur. Expenses net of fee waivers reflect expenses after reimbursement by the investment adviser but prior to reductions from brokerage service arrangements or other expense offset arrangements. Expenses net of all reductions represent the net expenses paid by the class.
H Annualized
I Amount does not include the portfolio activity of any underlying Fidelity Central Funds.
J Portfolio turnover rate excludes securities received or delivered in-kind.
See accompanying notes which are an integral part of the financial statements.
Fidelity Value Discovery Fund Class K
| | Six months ended (Unaudited) January 31, | Years endedJuly 31, | | | | |
| | 2019 | 2018 | 2017 | 2016 | 2015 | 2014 |
| Selected Per–Share Data | | | | | | |
| Net asset value, beginning of period | $29.28 | $28.11 | $24.17 | $24.99 | $23.32 | $19.93 |
| Income from Investment Operations | | | | | | |
| Net investment income (loss)A | .27 | .46 | .41 | .38 | .69B | .34 |
| Net realized and unrealized gain (loss) | (1.36) | 1.28 | 3.86 | (.38)C | 1.34 | 3.34 |
| Total from investment operations | (1.09) | 1.74 | 4.27 | –D | 2.03 | 3.68 |
| Distributions from net investment income | (.61) | (.33) | (.32) | (.50) | (.34) | (.29) |
| Distributions from net realized gain | (.59) | (.24) | (.01) | (.32) | (.02) | – |
| Total distributions | (1.20) | (.57) | (.33) | (.82) | (.36) | (.29) |
| Net asset value, end of period | $26.99 | $29.28 | $28.11 | $24.17 | $24.99 | $23.32 |
| Total ReturnE,F | (3.74)% | 6.34% | 17.82% | .24% | 8.80% | 18.71% |
| Ratios to Average Net AssetsG,H | | | | | | |
| Expenses before reductions | .48%I | .57% | .63% | .70% | .71% | .66% |
| Expenses net of fee waivers, if any | .48%I | .57% | .63% | .70% | .71% | .66% |
| Expenses net of all reductions | .47%I | .56% | .63% | .70% | .71% | .66% |
| Net investment income (loss) | 1.97%I | 1.62% | 1.56% | 1.62% | 2.82%B | 1.58% |
| Supplemental Data | | | | | | |
| Net assets, end of period (000 omitted) | $62,151 | $67,335 | $113,668 | $222,946 | $196,460 | $114,246 |
| Portfolio turnover rateJ | 47%I | 33%K | 32%K | 41% | 45% | 58% |
A Calculated based on average shares outstanding during the period.
B Net investment income per share reflects a large, non-recurring dividend which amounted to $.26 per share. Excluding this non-recurring dividend, the ratio of net investment income (loss) to average net assets would have been 1.75%.
C The amount shown for a share outstanding does not correspond with the aggregate net gain (loss) on investments for the period due to the timing of sales and repurchases of shares in relation to fluctuating market values of the investments of the Fund.
D Amount represents less than $.005 per share.
E Total returns for periods of less than one year are not annualized.
F Total returns would have been lower if certain expenses had not been reduced during the applicable periods shown.
G Fees and expenses of any underlying Fidelity Central Funds are not included in the Fund's expense ratio. The Fund indirectly bears its proportionate share of the expenses of any underlying Fidelity Central Funds.
H Expense ratios reflect operating expenses of the class. Expenses before reductions do not reflect amounts reimbursed by the investment adviser or reductions from brokerage service arrangements or reductions from other expense offset arrangements and do not represent the amount paid by the class during periods when reimbursements or reductions occur. Expenses net of fee waivers reflect expenses after reimbursement by the investment adviser but prior to reductions from brokerage service arrangements or other expense offset arrangements. Expenses net of all reductions represent the net expenses paid by the class.
I Annualized
J Amount does not include the portfolio activity of any underlying Fidelity Central Funds.
K Portfolio turnover rate excludes securities received or delivered in-kind.
See accompanying notes which are an integral part of the financial statements.
Notes to Financial Statements (Unaudited)
For the period ended January 31, 2019
1. Organization.
Fidelity Value Discovery Fund (the Fund) is a fund of Fidelity Puritan Trust (the Trust) and is authorized to issue an unlimited number of shares. The Trust is registered under the Investment Company Act of 1940, as amended (the 1940 Act), as an open-end management investment company organized as a Massachusetts business trust. The Fund offers Value Discovery and Class K shares, each of which has equal rights as to assets and voting privileges. Each class has exclusive voting rights with respect to matters that affect that class.
2. Investments in Fidelity Central Funds.
The Fund invests in Fidelity Central Funds, which are open-end investment companies generally available only to other investment companies and accounts managed by the investment adviser and its affiliates. The Fund's Schedule of Investments lists each of the Fidelity Central Funds held as of period end, if any, as an investment of the Fund, but does not include the underlying holdings of each Fidelity Central Fund. As an Investing Fund, the Fund indirectly bears its proportionate share of the expenses of the underlying Fidelity Central Funds.
The Money Market Central Funds seek preservation of capital and current income and are managed by Fidelity Investments Money Management, Inc. (FIMM), an affiliate of the investment adviser. Annualized expenses of the Money Market Central Funds as of their most recent shareholder report date are less than .005%.
A complete unaudited list of holdings for each Fidelity Central Fund is available upon request or at the Securities and Exchange Commission (the SEC) website at www.sec.gov. In addition, the financial statements of the Fidelity Central Funds are available on the SEC website or upon request.
3. Significant Accounting Policies.
The Fund is an investment company and applies the accounting and reporting guidance of the Financial Accounting Standards Board (FASB) Accounting Standards Codification Topic 946 Financial Services – Investments Companies. The financial statements have been prepared in conformity with accounting principles generally accepted in the United States of America (GAAP), which require management to make certain estimates and assumptions at the date of the financial statements. Actual results could differ from those estimates. Subsequent events, if any, through the date that the financial statements were issued have been evaluated in the preparation of the financial statements. The following summarizes the significant accounting policies of the Fund:
Investment Valuation. Investments are valued as of 4:00 p.m. Eastern time on the last calendar day of the period. The Board of Trustees (the Board) has delegated the day to day responsibility for the valuation of the Fund's investments to the Fair Value Committee (the Committee) established by the Fund's investment adviser. In accordance with valuation policies and procedures approved by the Board, the Fund attempts to obtain prices from one or more third party pricing vendors or brokers to value its investments. When current market prices, quotations or currency exchange rates are not readily available or reliable, investments will be fair valued in good faith by the Committee, in accordance with procedures adopted by the Board. Factors used in determining fair value vary by investment type and may include market or investment specific events. The frequency with which these procedures are used cannot be predicted and they may be utilized to a significant extent. The Committee oversees the Fund's valuation policies and procedures and reports to the Board on the Committee's activities and fair value determinations. The Board monitors the appropriateness of the procedures used in valuing the Fund's investments and ratifies the fair value determinations of the Committee.
The Fund categorizes the inputs to valuation techniques used to value its investments into a disclosure hierarchy consisting of three levels as shown below:
- Level 1 – quoted prices in active markets for identical investments
- Level 2 – other significant observable inputs (including quoted prices for similar investments, interest rates, prepayment speeds, etc.)
- Level 3 – unobservable inputs (including the Fund's own assumptions based on the best information available)
Valuation techniques used to value the Fund's investments by major category are as follows:
Equity securities, including restricted securities, for which market quotations are readily available, are valued at the last reported sale price or official closing price as reported by a third party pricing vendor on the primary market or exchange on which they are traded and are categorized as Level 1 in the hierarchy. In the event there were no sales during the day or closing prices are not available, securities are valued at the last quoted bid price or may be valued using the last available price and are generally categorized as Level 2 in the hierarchy. For foreign equity securities, when market or security specific events arise, comparisons to the valuation of American Depositary Receipts (ADRs), futures contracts, Exchange-Traded Funds (ETFs) and certain indexes as well as quoted prices for similar securities may be used and would be categorized as Level 2 in the hierarchy. For equity securities, including restricted securities, where observable inputs are limited, assumptions about market activity and risk are used and these securities may be categorized as Level 3 in the hierarchy.
Investments in open-end mutual funds, including the Fidelity Central Funds, are valued at their closing net asset value (NAV) each business day and are categorized as Level 1 in the hierarchy.
Changes in valuation techniques may result in transfers in or out of an assigned level within the disclosure hierarchy. The aggregate value of investments by input level as of January 31, 2019 is included at the end of the Fund's Schedule of Investments.
Foreign Currency. The Fund may use foreign currency contracts to facilitate transactions in foreign-denominated securities. Gains and losses from these transactions may arise from changes in the value of the foreign currency or if the counterparties do not perform under the contracts' terms.
Foreign-denominated assets, including investment securities, and liabilities are translated into U.S. dollars at the exchange rates at period end. Purchases and sales of investment securities, income and dividends received and expenses denominated in foreign currencies are translated into U.S. dollars at the exchange rate in effect on the transaction date.
The effects of exchange rate fluctuations on investments are included with the net realized and unrealized gain (loss) on investment securities. Other foreign currency transactions resulting in realized and unrealized gain (loss) are disclosed separately.
Investment Transactions and Income. For financial reporting purposes, the Fund's investment holdings and NAV include trades executed through the end of the last business day of the period. The NAV per share for processing shareholder transactions is calculated as of the close of business of the New York Stock Exchange (NYSE), normally 4:00 p.m. Eastern time and includes trades executed through the end of the prior business day. Gains and losses on securities sold are determined on the basis of identified cost and include proceeds received from litigation. Dividend income is recorded on the ex-dividend date, except for certain dividends from foreign securities where the ex-dividend date may have passed, which are recorded as soon as the Fund is informed of the ex-dividend date. Non-cash dividends included in dividend income, if any, are recorded at the fair market value of the securities received. Income and capital gain distributions from Fidelity Central Funds, if any, are recorded on the ex-dividend date. Certain distributions received by the Fund represent a return of capital or capital gain. The Fund determines the components of these distributions subsequent to the ex-dividend date, based upon receipt of tax filings or other correspondence relating to the underlying investment. These distributions are recorded as a reduction of cost of investments and/or as a realized gain. Investment income is recorded net of foreign taxes withheld where recovery of such taxes is uncertain.
Class Allocations and Expenses. Investment income, realized and unrealized capital gains and losses, common expenses of the Fund, and certain fund-level expense reductions, if any, are allocated daily on a pro-rata basis to each class based on the relative net assets of each class to the total net assets of the Fund. Each class differs with respect to transfer agent fees incurred. Certain expense reductions may also differ by class. For the reporting period, the allocated portion of income and expenses to each class as a percent of its average net assets may vary due to the timing of recording these transactions in relation to fluctuating net assets of the classes. Expenses directly attributable to a fund are charged to that fund. Expenses attributable to more than one fund are allocated among the respective funds on the basis of relative net assets or other appropriate methods. Expense estimates are accrued in the period to which they relate and adjustments are made when actual amounts are known.
Income Tax Information and Distributions to Shareholders. Each year, the Fund intends to qualify as a regulated investment company under Subchapter M of the Internal Revenue Code, including distributing substantially all of its taxable income and realized gains. As a result, no provision for U.S. Federal income taxes is required. The Fund files a U.S. federal tax return, in addition to state and local tax returns as required. The Fund's federal income tax returns are subject to examination by the Internal Revenue Service (IRS) for a period of three fiscal years after they are filed. State and local tax returns may be subject to examination for an additional fiscal year depending on the jurisdiction. Foreign taxes are provided for based on the Fund's understanding of the tax rules and rates that exist in the foreign markets in which it invests.
Distributions are declared and recorded on the ex-dividend date. Income and capital gain distributions are declared separately for each class. Income and capital gain distributions are determined in accordance with income tax regulations, which may differ from GAAP.
Capital accounts within the financial statements are adjusted for permanent book-tax differences. These adjustments have no impact on net assets or the results of operations. Capital accounts are not adjusted for temporary book-tax differences which will reverse in a subsequent period.
Book-tax differences are primarily due to foreign currency transactions, passive foreign investment companies (PFIC), redemptions in kind, partnerships and losses deferred due to wash sales.
As of period end, the cost and unrealized appreciation (depreciation) in securities, and derivatives if applicable, for federal income tax purposes were as follows:
| Gross unrealized appreciation | $204,822,496 |
| Gross unrealized depreciation | (142,808,967) |
| Net unrealized appreciation (depreciation) | $62,013,529 |
| Tax cost | $2,166,778,123 |
New Rule Issuance. During August 2018, the U.S. Securities and Exchange Commission issued Final Rule Release No. 33-10532, Disclosure Update and Simplification. This Final Rule includes amendments specific to registered investment companies that are intended to eliminate overlap in disclosure requirements between Regulation S-X and GAAP. In accordance with these amendments, certain line-items in the Fund's financial statements have been combined or removed for the current period as outlined in the table below.
| Financial Statement | Current Line-Item Presentation (As Applicable) | Prior Line-Item Presentation (As Applicable) |
| Statement of Assets and Liabilities | Total distributable earnings (loss) | Undistributed/Distributions in excess of/Accumulated net investment income (loss)
Accumulated/Undistributed net realized gain (loss)
Net unrealized appreciation (depreciation) |
| Statement of Changes in Net Assets | N/A - removed | Undistributed/Distributions in excess of/Accumulated net investment income (loss) end of period |
| Statement of Changes in Net Assets | Distributions to shareholders | Distributions to shareholders from net investment income
Distributions to shareholders from net realized gain |
| Distributions to Shareholders Note to Financial Statements | Distributions to shareholders | Distributions to shareholders from net investment income
Distributions to shareholders from net realized gain |
4. Derivative Instruments.
Risk Exposures and the Use of Derivative Instruments. The Fund's investment objective allows the Fund to enter into various types of derivative contracts, including futures contracts. Derivatives are investments whose value is primarily derived from underlying assets, indices or reference rates and may be transacted on an exchange or over-the-counter (OTC). Derivatives may involve a future commitment to buy or sell a specified asset based on specified terms, to exchange future cash flows at periodic intervals based on a notional principal amount, or for one party to make one or more payments upon the occurrence of specified events in exchange for periodic payments from the other party.
The Fund used derivatives to increase returns and to manage exposure to certain risks as defined below. The success of any strategy involving derivatives depends on analysis of numerous economic factors, and if the strategies for investment do not work as intended, the Fund may not achieve its objectives.
The Fund's use of derivatives increased or decreased its exposure to the following risk:
| Equity Risk | Equity risk relates to the fluctuations in the value of financial instruments as a result of changes in market prices (other than those arising from interest rate risk or foreign exchange risk), whether caused by factors specific to an individual investment, its issuer, or all factors affecting all instruments traded in a market or market segment.
|
The Fund is also exposed to additional risks from investing in derivatives, such as liquidity risk and counterparty credit risk. Liquidity risk is the risk that the Fund will be unable to close out the derivative in the open market in a timely manner. Counterparty credit risk is the risk that the counterparty will not be able to fulfill its obligation to the Fund. Counterparty credit risk related to exchange-traded futures contracts may be mitigated by the protection provided by the exchange on which they trade.
Investing in derivatives may involve greater risks than investing in the underlying assets directly and, to varying degrees, may involve risk of loss in excess of any initial investment and collateral received and amounts recognized in the Statement of Assets and Liabilities. In addition, there may be the risk that the change in value of the derivative contract does not correspond to the change in value of the underlying instrument.
Futures Contracts. A futures contract is an agreement between two parties to buy or sell a specified underlying instrument for a fixed price at a specified future date. The Fund used futures contracts to manage its exposure to the stock market.
Upon entering into a futures contract, a fund is required to deposit either cash or securities (initial margin) with a clearing broker in an amount equal to a certain percentage of the face value of the contract. Futures contracts are marked-to-market daily and subsequent daily payments (variation margin) are made or received by a fund depending on the daily fluctuations in the value of the futures contracts and are recorded as unrealized appreciation or (depreciation). This receivable and/or payable, if any, is included in daily variation margin on futures contracts in the Statement of Assets and Liabilities. Realized gain or (loss) is recorded upon the expiration or closing of a futures contract. The net realized gain (loss) and change in net unrealized appreciation (depreciation) on futures contracts during the period is presented in the Statement of Operations.
Any open futures contracts at period end are presented in the Schedule of Investments under the caption "Futures Contracts". The notional amount at value reflects each contract's exposure to the underlying instrument or index at period end.
5. Purchases and Sales of Investments.
Purchases and sales of securities, other than short-term securities, aggregated $537,695,555 and $516,952,103, respectively.
Prior Fiscal Year Redemptions In-Kind. During the prior period, 1,238,087 shares of the Fund held by unaffiliated entities were redeemed in-kind for investments and cash, with a value of $35,289,423. The Fund had a net realized gain of $8,392,283 on investments delivered through the in-kind redemptions. The amount of the in-kind redemptions is included in share transactions in the accompanying Statement of Changes in Net Assets as well as the Notes to Financial Statements. The Fund recognized no gain or loss for federal income tax purposes.
6. Fees and Other Transactions with Affiliates.
Management Fee. Fidelity Management & Research Company (the investment adviser) and its affiliates provide the Fund with investment management related services for which the Fund pays a monthly management fee. The management fee is the sum of an individual fund fee rate that is based on an annual rate of .30% of the Fund's average net assets and an annualized group fee rate that averaged .24% during the period. The group fee rate is based upon the average net assets of all the mutual funds advised by the investment adviser, including any mutual funds previously advised by the investment adviser that are currently advised by Fidelity SelectCo, LLC, an affiliate of the investment adviser. The group fee rate decreases as assets under management increase and increases as assets under management decrease. In addition, the management fee is subject to a performance adjustment (up to a maximum of +/- .20% of the Fund's average net assets over a 36 month performance period). The upward or downward adjustment to the management fee is based on the relative investment performance of Value Discovery as compared to its benchmark index, the Russell 3000 Value Index, over the same 36 month performance period. For the reporting period, the total annualized management fee rate, including the performance adjustment, was .39% of the Fund's average net assets. The performance adjustment included in the management fee rate may be higher or lower than the maximum performance adjustment rate due to the difference between the average net assets for the reporting and performance periods.
Transfer Agent Fees. Fidelity Investments Institutional Operations Company, Inc., (FIIOC), an affiliate of the investment adviser, is the transfer, dividend disbursing and shareholder servicing agent for each class of the Fund. FIIOC receives account fees and asset-based fees that vary according to the account size and type of account of the shareholders of Value Discovery, except for Class K. FIIOC receives an asset-based fee of Class K's average net assets. FIIOC pays for typesetting, printing and mailing of shareholder reports, except proxy statements.
For the period, transfer agent fees for each class were as follows:
| | Amount | % of Class-Level Average Net Assets(a) |
| Value Discovery | $1,763,857 | .16 |
| Class K | 14,759 | .05 |
| | $1,778,616 | |
(a) Annualized
Accounting and Security Lending Fees. Fidelity Service Company, Inc. (FSC), an affiliate of the investment adviser, maintains the Fund's accounting records. The accounting fee is based on the level of average net assets for each month. Under a separate contract, FSC administers the security lending program. The security lending fee is based on the number and duration of lending transactions. For the period, the fees were equivalent to an annualized rate of .03%.
Brokerage Commissions. The Fund placed a portion of its portfolio transactions with brokerage firms which are affiliates of the investment adviser. Brokerage commissions are included in net realized gain (loss) and change in net unrealized appreciation (depreciation) in the Statement of Operations. The commissions paid to these affiliated firms were $7,573 for the period.
Interfund Trades. The Fund may purchase from or sell securities to other Fidelity Funds under procedures adopted by the Board. The procedures have been designed to ensure these interfund trades are executed in accordance with Rule 17a-7 of the 1940 Act. Interfund trades are included within the respective purchases and sales amounts shown in the Purchases and Sales of Investments note.
Prior Fiscal Year Redemptions In-Kind. During the prior period, 41,999,841 shares of the Fund held by an affiliated entity were redeemed in kind for investments and cash with a value of $1,195,735,469. The Fund had a net realized gain of $237,440,352 on investments delivered through in-kind redemptions. The amount of in-kind redemptions is included in share transactions in the accompanying Statement of Changes in Net Assets as well as the Notes to Financial Statements. The Fund recognized no gain or loss for federal income tax purposes.
7. Committed Line of Credit.
The Fund participates with other funds managed by the investment adviser or an affiliate in a $4.25 billion credit facility (the "line of credit") to be utilized for temporary or emergency purposes to fund shareholder redemptions or for other short-term liquidity purposes. The Fund has agreed to pay commitment fees on its pro-rata portion of the line of credit, which amounted to $3,062 and is reflected in Miscellaneous expenses on the Statement of Operations. During the period, the Fund did not borrow on this line of credit.
8. Security Lending.
The Fund lends portfolio securities through a lending agent from time to time in order to earn additional income. For equity securities, a lending agent is used and may loan securities to certain qualified borrowers, including Fidelity Capital Markets (FCM), a broker-dealer affiliated with the Fund. On the settlement date of the loan, the Fund receives collateral (in the form of U.S. Treasury obligations, letters of credit and/or cash) against the loaned securities and maintains collateral in an amount not less than 100% of the market value of the loaned securities during the period of the loan. The market value of the loaned securities is determined at the close of business of the Fund and any additional required collateral is delivered to the Fund on the next business day. The Fund or borrower may terminate the loan at any time, and if the borrower defaults on its obligation to return the securities loaned because of insolvency or other reasons, the Fund may apply collateral received from the borrower against the obligation. The Fund may experience delays and costs in recovering the securities loaned. Any cash collateral received is invested in the Fidelity Securities Lending Cash Central Fund. The value of loaned securities and cash collateral at period end are disclosed on the Fund's Statement of Assets and Liabilities. Security lending income represents the income earned on investing cash collateral, less rebates paid to borrowers and any lending agent fees associated with the loan, plus any premium payments received for lending certain types of securities. Security lending income is presented in the Statement of Operations as a component of income from Fidelity Central Funds. Total security lending income during the period amounted to $54,319. During the period, there were no securities loaned to FCM.
9. Expense Reductions.
Commissions paid to certain brokers with whom the investment adviser, or its affiliates, places trades on behalf of the Fund include an amount in addition to trade execution, which may be rebated back to the Fund to offset certain expenses. This amount totaled $26,442 for the period. In addition, through arrangements with the Fund's custodian, credits realized as a result of certain uninvested cash balances were used to reduce the Fund's expenses. During the period, these credits reduced the Fund's custody expenses by $520.
In addition, during the period the investment adviser reimbursed and/or waived a portion of fund-level operating expenses in the amount of $8,695.
10. Distributions to Shareholders.
Distributions to shareholders of each class were as follows:
| | Six months ended
January 31, 2019 | Year ended
July 31, 2018 |
| Distributions to shareholders | | |
| Value Discovery | $91,991,501 | $– |
| Class K | 2,747,510 | – |
| Total | $94,739,011 | $– |
| From net investment income | | |
| Value Discovery | $– | $37,659,342 |
| Class K | – | 1,213,214 |
| Total | $– | $38,872,556 |
| From net realized gain | | |
| Value Discovery | $– | $28,024,993 |
| Class K | – | 1,001,210 |
| Total | $– | $29,026,203 |
11. Share Transactions.
Share transactions for each class were as follows and may contain automatic conversions between classes or exchanges between affiliated funds:
| | Shares | Shares | Dollars | Dollars |
| | Six months ended January 31, 2019 | Year ended July 31, 2018 | Six months ended January 31, 2019 | Year ended July 31, 2018 |
| Value Discovery | | | | |
| Shares sold | 16,427,413 | 92,576,036 | $437,210,434 | $2,602,748,985 |
| Reinvestment of distributions | 2,791,422 | 2,218,173 | 76,426,545 | 60,950,359 |
| Shares redeemed | (17,748,644) | (112,066,142) | (477,505,818) | (3,180,236,752) |
| Net increase (decrease) | 1,470,191 | (17,271,933) | $36,131,161 | $(516,537,408) |
| Class K | | | | |
| Shares sold | 194,454 | 898,035 | $5,406,104 | $25,342,830 |
| Reinvestment of distributions | 100,296 | 80,757 | 2,747,510 | 2,214,424 |
| Shares redeemed | (291,718) | (2,722,401)(a) | (8,094,630) | (77,380,905)(a) |
| Net increase (decrease) | 3,032 | (1,743,609) | $58,984 | $(49,823,651) |
(a) Amount includes in-kind redemptions (see the Prior Fiscal Year Redemptions In-Kind note for additional details).
12. Other.
The Fund's organizational documents provide former and current trustees and officers with a limited indemnification against liabilities arising in connection with the performance of their duties to the Fund. In the normal course of business, the Fund may also enter into contracts that provide general indemnifications. The Fund's maximum exposure under these arrangements is unknown as this would be dependent on future claims that may be made against the Fund. The risk of material loss from such claims is considered remote.
Shareholder Expense Example
As a shareholder of the Fund, you incur two types of costs: (1) transaction costs and (2) ongoing costs, including management fees and other Fund expenses. This Example is intended to help you understand your ongoing costs (in dollars) of investing in the Fund and to compare these costs with the ongoing costs of investing in other mutual funds.
The Example is based on an investment of $1,000 invested at the beginning of the period and held for the entire period (August 1, 2018 to January 31, 2019).
Actual Expenses
The first line of the accompanying table for each class of the Fund provides information about actual account values and actual expenses. You may use the information in this line, together with the amount you invested, to estimate the expenses that you paid over the period. Simply divide your account value by $1,000.00 (for example, an $8,600 account value divided by $1,000.00 = 8.6), then multiply the result by the number in the first line for a class of the Fund under the heading entitled "Expenses Paid During Period" to estimate the expenses you paid on your account during this period. In addition, the Fund, as a shareholder in the underlying Fidelity Central Funds, will indirectly bear its pro-rata share of the fees and expenses incurred by the underlying Fidelity Central Funds. These fees and expenses are not included in the Fund's annualized expense ratio used to calculate the expense estimate in the table below.
Hypothetical Example for Comparison Purposes
The second line of the accompanying table for each class of the Fund provides information about hypothetical account values and hypothetical expenses based on a Class' actual expense ratio and an assumed rate of return of 5% per year before expenses, which is not the Class' actual return. The hypothetical account values and expenses may not be used to estimate the actual ending account balance or expenses you paid for the period. You may use this information to compare the ongoing costs of investing in the Fund and other funds. To do so, compare this 5% hypothetical example with the 5% hypothetical examples that appear in the shareholder reports of the other funds. In addition, the Fund, as a shareholder in the underlying Fidelity Central Funds, will indirectly bear its pro-rata share of the fees and expenses incurred by the underlying Fidelity Central Funds. These fees and expenses are not included in the Fund's annualized expense ratio used to calculate the expense estimate in the table below.
Please note that the expenses shown in the table are meant to highlight your ongoing costs only and do not reflect any transaction costs. Therefore, the second line of the table is useful in comparing ongoing costs only, and will not help you determine the relative total costs of owning different funds.
| | Annualized Expense Ratio-A | Beginning
Account Value
August 1, 2018 | Ending
Account Value
January 31, 2019 | Expenses Paid
During Period-B
August 1, 2018
to January 31, 2019 |
| Value Discovery | .59% | | | |
| Actual | | $1,000.00 | $962.30 | $2.92 |
| Hypothetical-C | | $1,000.00 | $1,022.23 | $3.01 |
| Class K | .48% | | | |
| Actual | | $1,000.00 | $962.60 | $2.37 |
| Hypothetical-C | | $1,000.00 | $1,022.79 | $2.45 |
A Annualized expense ratio reflects expenses net of applicable fee waivers.
B Expenses are equal to each Class' annualized expense ratio, multiplied by the average account value over the period, multiplied by 184/365 (to reflect the one-half year period).
C 5% return per year before expenses
Board Approval of Investment Advisory Contracts and Management Fees
Fidelity Value Discovery Fund
Each year, the Board of Trustees, including the Independent Trustees (together, the Board), votes on the renewal of the management contract with Fidelity Management & Research Company (FMR) and the sub-advisory agreements (together, the Advisory Contracts) for the fund. FMR and the sub-advisers are referred to herein as the Investment Advisers. The Board, assisted by the advice of fund counsel and Independent Trustees' counsel, requests and considers a broad range of information relevant to the renewal of the Advisory Contracts throughout the year.
The Board meets regularly and, at each of its meetings, covers an extensive agenda of topics and materials and considers factors that are relevant to its annual consideration of the renewal of the fund's Advisory Contracts, including the services and support provided to the fund and its shareholders. The Board has established various standing committees (Committees), each composed of and chaired by Independent Trustees with varying backgrounds, to which the Board has assigned specific subject matter responsibilities in order to enhance effective decision-making by the Board. The Board, acting directly and through its Committees, requests and receives information concerning the annual consideration of the renewal of the fund's Advisory Contracts. The Board also meets as needed to review matters specifically related to the Board's annual consideration of the renewal of the Advisory Contracts. Members of the Board may also meet with trustees of other Fidelity funds through joint ad hoc committees to discuss certain matters relevant to all of the Fidelity funds.
At its January 2019 meeting, the Board unanimously determined to renew the fund's Advisory Contracts. In reaching its determination, the Board considered all factors it believed relevant, including (i) the nature, extent, and quality of the services to be provided to the fund and its shareholders (including the investment performance of the fund); (ii) the competitiveness of the fund's management fee and total expense ratio relative to peer funds; (iii) the total costs of the services to be provided by and the profits to be realized by Fidelity from its relationships with the fund; and (iv) the extent to which, if any, economies of scale exist and would be realized as the fund grows, and whether any economies of scale are appropriately shared with fund shareholders.
In considering whether to renew the Advisory Contracts for the fund, the Board reached a determination, with the assistance of fund counsel and Independent Trustees' counsel and through the exercise of its business judgment, that the renewal of the Advisory Contracts was in the best interests of the fund and its shareholders and that the compensation payable under the Advisory Contracts was fair and reasonable. The Board's decision to renew the Advisory Contracts was not based on any single factor, but rather was based on a comprehensive consideration of all the information provided to the Board at its meetings throughout the year. The Board, in reaching its determination to renew the Advisory Contracts, was aware that shareholders of the fund have a broad range of investment choices available to them, including a wide choice among funds offered by Fidelity's competitors, and that the fund's shareholders, who have the opportunity to review and weigh the disclosure provided by the fund in its prospectus and other public disclosures, have chosen to invest in this fund, which is part of the Fidelity family of funds.
Nature, Extent, and Quality of Services Provided. The Board considered Fidelity's staffing as it relates to the fund, including the backgrounds of investment personnel of Fidelity, and also considered the fund's investment objective, strategies, and related investment philosophy. The Independent Trustees also had discussions with senior management of Fidelity's investment operations and investment groups. The Board considered the structure of the investment personnel compensation program and whether this structure provides appropriate incentives to act in the best interests of the fund. Additionally, the Board considered the portfolio managers' investments, if any, in the funds that they manage.
Resources Dedicated to Investment Management and Support Services. The Board and the Fund Oversight and Research Committees reviewed the general qualifications and capabilities of Fidelity's investment staff, including its size, education, experience, and resources, as well as Fidelity's approach to recruiting, training, managing, and compensating investment personnel. The Board noted that Fidelity has continued to increase the resources devoted to non-U.S. offices, including expansion of Fidelity's global investment organization. The Board also noted that Fidelity's analysts have extensive resources, tools and capabilities that allow them to conduct sophisticated quantitative and fundamental analysis, as well as credit analysis of issuers, counterparties and guarantors. Further, the Board considered that Fidelity's investment professionals have sufficient access to global information and data so as to provide competitive investment results over time, and that those professionals also have access to sophisticated tools that permit them to assess portfolio construction and risk and performance attribution characteristics continuously, as well as to transmit new information and research conclusions rapidly around the world. Additionally, in its deliberations, the Board considered Fidelity's trading, risk management, compliance, and technology and operations capabilities and resources, which are integral parts of the investment management process.
Shareholder and Administrative Services. The Board considered (i) the nature, extent, quality, and cost of advisory, administrative, and shareholder services performed by the Investment Advisers and their affiliates under the Advisory Contracts and under separate agreements covering transfer agency, pricing and bookkeeping, and securities lending services for the fund; (ii) the nature and extent of the supervision of third party service providers, principally custodians, subcustodians, and pricing vendors; and (iii) the resources devoted to, and the record of compliance with, the fund's compliance policies and procedures. The Board also reviewed the allocation of fund brokerage, including allocations to brokers affiliated with the Investment Advisers, the use of brokerage commissions to pay fund expenses, and the use of "soft" commission dollars to pay for research services.
The Board noted that the growth of fund assets over time across the complex allows Fidelity to reinvest in the development of services designed to enhance the value and convenience of the Fidelity funds as investment vehicles. These services include 24-hour access to account information and market information through telephone representatives and over the Internet, investor education materials and asset allocation tools, and the expanded availability of Fidelity Investor Centers.
The Board noted that it and the boards of certain other Fidelity funds had formed an ad hoc Committee on Transfer Agency Fees to review the variety of transfer agency fee structures throughout the industry and Fidelity's competitive positioning with respect to industry participants.
Investment in a Large Fund Family. The Board considered the benefits to shareholders of investing in a Fidelity fund, including the benefits of investing in a fund that is part of a large family of funds offering a variety of investment disciplines and providing a large variety of mutual fund investor services. The Board noted that Fidelity had taken, or had made recommendations that resulted in the Fidelity funds taking, a number of actions over the previous year that benefited particular funds, including: (i) continuing to dedicate additional resources to Fidelity's investment research process, which includes meetings with management of issuers of securities in which the funds invest, and to the support of the senior management team that oversees asset management; (ii) continuing efforts to enhance Fidelity's global research capabilities; (iii) launching new funds and making other enhancements to meet client needs; (iv) launching new share classes of existing funds; (v) eliminating purchase minimums and broadening eligibility requirements for certain funds and share classes; (vi) reducing management fees and total expenses for certain growth equity funds and index funds; (vii) lowering expense caps for certain existing funds and classes, and converting certain voluntary expense caps to contractual caps, to reduce expenses borne by shareholders; (viii) eliminating short-term redemption fees for funds that had such fees; (ix) rationalizing product lines and gaining increased efficiencies from fund mergers and share class consolidations; (x) continuing to develop, acquire and implement systems and technology to improve services to the funds and shareholders, strengthen information security, and increase efficiency; and (xi) continuing to implement enhancements to further strengthen Fidelity's product line to increase investors' probability of success in achieving their investment goals, including retirement income goals.
Investment Performance. The Board considered whether the fund has operated in accordance with its investment objective, as well as its record of compliance with its investment restrictions and its performance history.
The Board took into account discussions that occur at Board meetings throughout the year with representatives of the Investment Advisers about fund investment performance. In this regard the Board noted that as part of regularly scheduled fund reviews and other reports to the Board on fund performance, the Board considers annualized return information for the fund for different time periods, measured against an appropriate securities market index ("benchmark index") and a peer group of funds with similar objectives ("peer group"), if any. In its evaluation of fund investment performance, the Board gave particular attention to information indicating changes in performance of certain Fidelity funds for specific time periods and discussed with the Investment Advisers the reasons for any overperformance or underperformance.
In addition to reviewing absolute and relative fund performance, the Independent Trustees periodically consider the appropriateness of fund performance metrics in evaluating the results achieved. In general, the Independent Trustees believe that fund performance should be evaluated based on net performance (after fees and expenses) of both the highest performing and lowest performing fund share classes, where applicable, compared to appropriate benchmark indices, over appropriate time periods that may include full market cycles, and compared to peer groups, as applicable, over the same periods, taking into account relevant factors including the following: general market conditions; issuer-specific information; and fund cash flows and other factors.
The Independent Trustees recognize that shareholders evaluate performance on a net basis over their own holding periods, for which one-, three-, and five-year periods are often used as a proxy. For this reason, the performance information reviewed by the Board also included net cumulative total return information for the fund and an appropriate benchmark index and peer group for the most recent one-, three-, and five-year periods ended June 30, 2018, as shown below. Returns are shown compared to the 25th percentile (top of box, 75% beaten) and 75th percentile (bottom of box, 25% beaten) of the peer universe.
Fidelity Value Discovery Fund
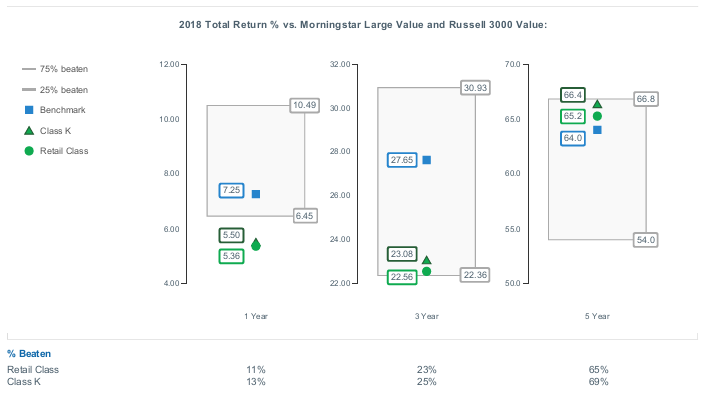
The Board considered the fund's underperformance for different time periods based on the June 30, 2018 data presented above and based on earlier periods ended prior to June 30, 2018. The Board's discussions with FMR regarding underperformance cover topics including, but not limited to: the longer-term track record of a fund's portfolio manager(s); broader trends in the market that may adversely impact a fund's performance; attribution reports on contributors to the fund's underperformance; and the applicable portfolio manager's explanation of his or her underperformance. The Board engages with FMR on steps that might be taken to address a fund's underperformance.
The Board also considered that the fund's management fee is subject to upward or downward adjustment depending upon whether, and to what extent, the fund's investment performance for the performance period (a rolling 36-month period) exceeds, or is exceeded by, a securities index, thus leading to a performance adjustment for the same period. The Board noted that the performance adjustment provides FMR with a strong economic incentive to seek to achieve superior long-term performance for the fund's shareholders and helps to more closely align the interests of FMR and the shareholders of the fund.
Based on its review, the Board concluded that the nature, extent, and quality of services provided to the fund under the Advisory Contracts should continue to benefit the shareholders of the fund.
Competitiveness of Management Fee and Total Expense Ratio. The Board considered the fund's management fee and total expense ratio compared to "mapped groups" of competitive funds and classes created for the purpose of facilitating the Trustees' competitive analysis of management fees and total expenses. Fidelity creates "mapped groups" by combining similar Lipper investment objective categories that have comparable investment mandates. Combining Lipper investment objective categories aids the Board's management fee and total expense ratio comparisons by broadening the competitive group used for comparison.
Management Fee. The Board considered two proprietary management fee comparisons for the 12-month periods (ended June 30 for 2018 and December 31 for prior periods) shown in basis points (BP) in the chart below. The group of Lipper funds used by the Board for management fee comparisons is referred to below as the "Total Mapped Group." The Total Mapped Group comparison focuses on a fund's standing in terms of gross management fees before expense reimbursements or caps, and without giving effect to the fund's performance adjustment, relative to the total universe of funds with comparable investment mandates, regardless of whether their management fee structures also are comparable. Funds with comparable investment mandates offer exposure to similar types of securities. Funds with comparable management fee structures have similar management fee contractual arrangements (e.g., flat rate charged for advisory services, all-inclusive fee rate, etc.). "TMG %" represents the percentage of funds in the Total Mapped Group that had management fees that were lower than the fund's. For example, a hypothetical TMG % of 20% would mean that 80% of the funds in the Total Mapped Group had higher, and 20% had lower, management fees than the fund. The fund's actual TMG %s and the number of funds in the Total Mapped Group are in the chart below. The "Asset-Size Peer Group" (ASPG) comparison focuses on a fund's standing relative to a subset of non-Fidelity funds within the Total Mapped Group that are similar in size and management fee structure without taking into account performance adjustments, if any. For example, if a fund is in the first quartile of the ASPG, the fund's management fee ranks in the least expensive or lowest 25% of funds in the ASPG. The ASPG represents at least 15% of the funds in the Total Mapped Group with comparable asset size and management fee structures, subject to a minimum of 50 funds (or all funds in the Total Mapped Group if fewer than 50). Additional information, such as the ASPG quartile in which the fund's management fee rate ranked and the impact of the fund's performance adjustment, is also included in the chart and was considered by the Board.
Fidelity Value Discovery Fund
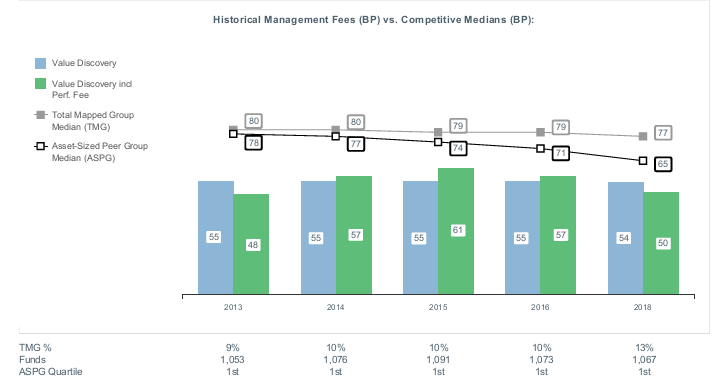
The Board noted that the fund's management fee rate ranked below the median of its Total Mapped Group and below the median of its ASPG for the 12-month period ended June 30, 2018. The Board also noted the effect of the fund's performance adjustment, if any, on the fund's management fee ranking.
The Board noted that it and the boards of other Fidelity funds formed an ad hoc Committee on Group Fee, which meets periodically, to conduct an in-depth review of the "group fee" component of the management fee of funds with such management fee structures. The Committee's focus included the mechanics of the group fee, the competitive landscape of group fee structures, Fidelity funds with no group fee component and investment products not included in group fee assets. The Board also considered that, for funds subject to the group fee, FMR agreed to voluntarily waive fees over a specified period of time in amounts designed to account for assets converted from certain funds to certain collective investment trusts.
The Board also noted that, in 2013, the ad hoc Committee on Management Fees was formed to conduct an in-depth review of the management fee rates of Fidelity's active equity mutual funds. The Committee focused on the following areas: (i) standard fee structures; (ii) research consumption and trading evolution; (iii) management fee competitiveness/profitability by category; and (iv) factors that drive institutional pricing.
Based on its review, the Board concluded that the fund's management fee is fair and reasonable in light of the services that the fund receives and the other factors considered.
Total Expense Ratio. In its review of each class's total expense ratio, the Board considered the fund's management fee rate as well as other fund or class expenses, as applicable, such as transfer agent fees, pricing and bookkeeping fees, and custodial, legal, and audit fees. The Board noted the impact of the fund's performance adjustment. The Board also noted that Fidelity may agree to waive fees and expenses from time to time, and the extent to which, if any, it has done so for the fund. As part of its review, the Board also considered the current and historical total expense ratios of each class of the fund compared to competitive fund median expenses. Each class of the fund is compared to those funds and classes in the Total Mapped Group (used by the Board for management fee comparisons) that have a similar sales load structure.
The Board noted that the total expense ratio of each class ranked below the competitive median for the 12-month period ended June 30, 2018.
Fees Charged to Other Fidelity Clients. The Board also considered Fidelity fee structures and other information with respect to clients of Fidelity, such as other funds advised or subadvised by Fidelity, pension plan clients, and other institutional clients with similar mandates. The Board noted that a joint ad hoc committee created by it and the boards of other Fidelity funds periodically reviews and compares Fidelity's institutional investment advisory business with its business of providing services to the Fidelity funds and also noted the most recent findings of the committee. The Board noted that the committee's review included a consideration of the differences in services provided, fees charged, and costs incurred, as well as competition in the markets serving the different categories of clients.
Based on its review of total expense ratios and fees charged to other Fidelity clients, the Board concluded that the total expense ratio of each class of the fund was reasonable in light of the services that the fund and its shareholders receive and the other factors considered.
Costs of the Services and Profitability. The Board considered the revenues earned and the expenses incurred by Fidelity in conducting the business of developing, marketing, distributing, managing, administering and servicing the fund and servicing the fund's shareholders. The Board also considered the level of Fidelity's profits in respect of all the Fidelity funds.
On an annual basis, Fidelity presents to the Board information about the profitability of its relationships with the fund. Fidelity calculates profitability information for each fund, as well as aggregate profitability information for groups of Fidelity funds and all Fidelity funds, using a series of detailed revenue and cost allocation methodologies which originate with the books and records of Fidelity on which Fidelity's audited financial statements are based. The Audit Committee of the Board reviews any significant changes from the prior year's methodologies.
PricewaterhouseCoopers LLP (PwC), auditor to Fidelity and certain Fidelity funds, has been engaged annually by the Board as part of the Board's assessment of Fidelity's profitability analysis. PwC's engagement includes the review and assessment of the methodologies used by Fidelity in determining the revenues and expenses attributable to Fidelity's mutual fund business, and completion of agreed-upon procedures in respect of the mathematical accuracy of the fund profitability information and its conformity to established allocation methodologies. After considering PwC's reports issued under the engagement and information provided by Fidelity, the Board concluded that while other allocation methods may also be reasonable, Fidelity's profitability methodologies are reasonable in all material respects.
The Board also reviewed Fidelity's non-fund businesses and potential indirect benefits such businesses may have received as a result of their association with Fidelity's mutual fund business (i.e., fall-out benefits) as well as cases where Fidelity's affiliates may benefit from the fund's business. The Board noted that changes to fall-out benefits year-over-year reflect business developments at Fidelity's various businesses.
The Board considered the costs of the services provided by and the profits realized by Fidelity in connection with the operation of the fund and was satisfied that the profitability was not excessive.
Economies of Scale. The Board considered whether there have been economies of scale in respect of the management of the Fidelity funds, whether the Fidelity funds (including the fund) have appropriately benefited from any such economies of scale, and whether there is potential for realization of any further economies of scale. The Board considered the extent to which the fund will benefit from economies of scale as assets grow through increased services to the fund, through waivers or reimbursements, or through fee or expense ratio reductions. The Board also noted that a committee (the Economies of Scale Committee) created by it and the boards of other Fidelity funds periodically analyzes whether Fidelity attains economies of scale in respect of the management and servicing of the Fidelity funds, whether the Fidelity funds have appropriately benefited from such economies of scale, and whether there is potential for realization of any further economies of scale.
The Board recognized that the fund's management contract incorporates a "group fee" structure, which provides for lower group fee rates as total group assets increase, and for higher group fee rates as total group assets decrease (with "group assets" defined to include fund assets under FMR's management plus the assets of sector funds previously under FMR's management). FMR calculates the group fee rates based on a tiered asset "breakpoint" schedule that varies based on asset class. The Board considered that the group fee is designed to deliver the benefits of economies of scale to fund shareholders when total Fidelity fund assets increase, even if assets of any particular fund are unchanged or have declined, because some portion of Fidelity's costs are attributable to services provided to all Fidelity funds, and all funds benefit if those costs can be allocated among more assets. The Board concluded that, given the group fee structure, fund shareholders will benefit from lower management fees as group assets increase at the fund complex level, regardless of whether Fidelity achieves any such economies of scale.
The Board concluded, taking into account the analysis of the Economies of Scale Committee, that economies of scale, if any, are being appropriately shared between fund shareholders and Fidelity.
Additional Information Requested by the Board. In order to develop fully the factual basis for consideration of the Fidelity funds' advisory contracts, the Board requested and received additional information on certain topics, including: (i) fund performance trends, in particular the underperformance of certain funds, and Fidelity's long-term strategies for certain funds; (ii) Fidelity's fund profitability methodology, profitability trends for certain funds, and the impact of certain factors on fund profitability results; (iii) metrics for evaluating index fund and ETF performance and information about ETF trading characteristics; (iv) the methodology with respect to the evaluation of competitive fund data and peer group classifications and fee comparisons; (v) the expense structures for different funds and classes; (vi) information regarding other accounts managed by Fidelity, including collective investment trusts; and (vii) Fidelity's philosophies and strategies for evaluating funds and classes with lower or declining asset levels.
Based on its evaluation of all of the conclusions noted above, and after considering all factors it believed relevant, the Board concluded that the advisory fee arrangements are fair and reasonable, and that the fund's Advisory Contracts should be renewed.
FVD-SANN-0319
1.783113.116
Fidelity® Series Intrinsic Opportunities Fund
Semi-Annual Report January 31, 2019 |
|
Beginning on January 1, 2021, as permitted by regulations adopted by the Securities and Exchange Commission, paper copies of a fund’s shareholder reports will no longer be sent by mail, unless you specifically request paper copies of the reports from the fund or from your financial intermediary, such as a financial advisor, broker-dealer or bank. Instead, the reports will be made available on a website, and you will be notified by mail each time a report is posted and provided with a website link to access the report.
If you already elected to receive shareholder reports electronically, you will not be affected by this change and you need not take any action. You may elect to receive shareholder reports and other communications from a fund electronically, by contacting your financial intermediary. For Fidelity customers, visit Fidelity's web site or call Fidelity using the contact information listed below.
You may elect to receive all future reports in paper free of charge. If you wish to continue receiving paper copies of your shareholder reports, you may contact your financial intermediary or, if you are a Fidelity customer, visit Fidelity’s website, or call Fidelity at the applicable toll-free number listed below. Your election to receive reports in paper will apply to all funds held with the fund complex/your financial intermediary.
| Account Type | Website | Phone Number |
| Brokerage, Mutual Fund, or Annuity Contracts: | fidelity.com/mailpreferences | 1-800-343-3548 |
| Employer Provided Retirement Accounts: | netbenefits.fidelity.com/preferences (choose 'no' under Required Disclosures to continue to print) | 1-800-343-0860 |
| Advisor Sold Accounts Serviced Through Your Financial Intermediary: | Contact Your Financial Intermediary | Your Financial Intermediary's phone number |
| Advisor Sold Accounts Serviced by Fidelity: | institutional.fidelity.com | 1-877-208-0098 |
Contents
To view a fund's proxy voting guidelines and proxy voting record for the 12-month period ended June 30, visit http://www.fidelity.com/proxyvotingresults or visit the Securities and Exchange Commission's (SEC) web site at http://www.sec.gov.
You may also call 1-800-544-8544 to request a free copy of the proxy voting guidelines.
Standard & Poor's, S&P and S&P 500 are registered service marks of The McGraw-Hill Companies, Inc. and have been licensed for use by Fidelity Distributors Corporation.
Other third-party marks appearing herein are the property of their respective owners.
All other marks appearing herein are registered or unregistered trademarks or service marks of FMR LLC or an affiliated company. © 2019 FMR LLC. All rights reserved.
This report and the financial statements contained herein are submitted for the general information of the shareholders of the Fund. This report is not authorized for distribution to prospective investors in the Fund unless preceded or accompanied by an effective prospectus.
A fund files its complete schedule of portfolio holdings with the SEC for the first and third quarters of each fiscal year on Form N-Q. Forms N-Q are available on the SEC’s web site at http://www.sec.gov. A fund's Forms N-Q may be reviewed and copied at the SEC’s Public Reference Room in Washington, DC. Information regarding the operation of the SEC's Public Reference Room may be obtained by calling 1-800-SEC-0330.
For a complete list of a fund's portfolio holdings, view the most recent holdings listing, semiannual report, or annual report on Fidelity's web site at http://www.fidelity.com, http://www.institutional.fidelity.com, or http://www.401k.com, as applicable.
NOT FDIC INSURED •MAY LOSE VALUE •NO BANK GUARANTEE
Neither the Fund nor Fidelity Distributors Corporation is a bank.
Investment Summary (Unaudited)
Top Ten Stocks as of January 31, 2019
| | % of fund's net assets |
| Anthem, Inc. | 5.5 |
| Amgen, Inc. | 2.6 |
| Itochu Corp. | 2.5 |
| MetLife, Inc. | 2.4 |
| Twenty-First Century Fox, Inc. Class A | 1.9 |
| UnitedHealth Group, Inc. | 1.9 |
| The Western Union Co. | 1.8 |
| United Therapeutics Corp. | 1.6 |
| John David Group PLC | 1.4 |
| Total SA sponsored ADR | 1.4 |
| | 23.0 |
Top Five Market Sectors as of January 31, 2019
| | % of fund's net assets |
| Health Care | 18.5 |
| Consumer Discretionary | 15.0 |
| Financials | 14.8 |
| Energy | 9.3 |
| Industrials | 9.1 |
Asset Allocation (% of fund's net assets)
| As of January 31, 2019* |
| | Stocks | 86.2% |
| | Short-Term Investments and Net Other Assets (Liabilities) | 13.8% |

* Foreign investments - 40.3%
Schedule of Investments January 31, 2019 (Unaudited)
Showing Percentage of Net Assets
| Common Stocks - 86.1% | | | |
| | | Shares | Value |
| COMMUNICATION SERVICES - 5.7% | | | |
| Diversified Telecommunication Services - 0.5% | | | |
| Verizon Communications, Inc. | | 1,250,200 | $68,836,012 |
| Entertainment - 2.3% | | | |
| GAMEVIL, Inc. (a) | | 15,000 | 748,362 |
| Twenty-First Century Fox, Inc. Class A | | 5,500,000 | 271,205,000 |
| Viacom, Inc.: | | | |
| Class A (b) | | 800,000 | 27,432,000 |
| Class B (non-vtg.) | | 800,000 | 23,536,000 |
| | | | 322,921,362 |
| Interactive Media & Services - 1.0% | | | |
| Kakaku.com, Inc. | | 500,000 | 8,739,959 |
| mixi, Inc. | | 10,000 | 252,743 |
| Momo, Inc. ADR (a) | | 5,000 | 152,150 |
| XLMedia PLC | | 100,000 | 112,142 |
| Yahoo! Japan Corp. | | 33,500,000 | 90,112,463 |
| YY, Inc. ADR (a) | | 625,000 | 43,393,750 |
| Zappallas, Inc. (a)(c) | | 1,000,000 | 3,433,555 |
| | | | 146,196,762 |
| Media - 1.8% | | | |
| AMC Networks, Inc. Class A (a) | | 125,000 | 7,867,500 |
| Comcast Corp. Class A | | 3,500,000 | 127,995,000 |
| Corus Entertainment, Inc. Class B (non-vtg.) | | 400,000 | 1,695,651 |
| Criteo SA sponsored ADR (a) | | 25,000 | 622,500 |
| Discovery Communications, Inc.: | | | |
| Class A (a)(b) | | 2,400,000 | 68,112,000 |
| Class B (a) | | 19,308 | 675,201 |
| DISH Network Corp. Class A (a) | | 100,000 | 3,067,000 |
| DMS, Inc. | | 250,000 | 3,743,401 |
| F@N Communications, Inc. | | 525,000 | 2,655,726 |
| Gendai Agency, Inc. (c) | | 850,000 | 3,737,893 |
| Hyundai HCN | | 2,250,049 | 8,323,177 |
| Interspace Co. Ltd. | | 20,000 | 192,426 |
| Ipsos SA | | 10,000 | 232,125 |
| ITE Group PLC | | 2,000,871 | 1,697,950 |
| Multiplus SA | | 600,000 | 4,277,254 |
| Nippon BS Broadcasting Corp. | | 200,000 | 1,938,949 |
| Nippon Television Network Corp. | | 150,000 | 2,353,454 |
| Pico Far East Holdings Ltd. | | 8,000,000 | 2,977,518 |
| Proto Corp. | | 50,000 | 695,433 |
| RKB Mainichi Broadcasting Corp. | | 3,000 | 161,120 |
| SMG PLC | | 10,000 | 44,070 |
| Television Broadcasts Ltd. | | 1,500,000 | 2,804,254 |
| WOWOW INC. | | 250,000 | 6,502,180 |
| | | | 252,371,782 |
| Wireless Telecommunication Services - 0.1% | | | |
| Okinawa Cellular Telephone Co. | | 425,000 | 15,041,313 |
|
| TOTAL COMMUNICATION SERVICES | | | 805,367,231 |
|
| CONSUMER DISCRETIONARY - 15.0% | | | |
| Auto Components - 2.9% | | | |
| Adient PLC | | 800,000 | 15,792,000 |
| ASTI Corp. | | 30,000 | 463,805 |
| Burelle SA | | 984 | 1,101,508 |
| Chita Kogyo Co. Ltd. | | 10,000 | 68,028 |
| Cooper Tire & Rubber Co. | | 650,000 | 22,880,000 |
| DaikyoNishikawa Corp. | | 50,000 | 514,574 |
| Dongah Tire & Rubber Co. Ltd. | | 42,120 | 1,169,968 |
| Eagle Industry Co. Ltd. | | 300,000 | 3,530,870 |
| Exedy Corp. | | 15,000 | 377,324 |
| Fukoku Co. Ltd. | | 275,000 | 2,204,039 |
| G-Tekt Corp. (c) | | 2,750,000 | 40,369,520 |
| Gentex Corp. | | 200,000 | 4,236,000 |
| Hi-Lex Corp. | | 249,937 | 4,765,840 |
| Hu Lane Associate, Inc. | | 50,000 | 147,408 |
| Hyundai Mobis | | 950,000 | 192,146,922 |
| IJT Technology Holdings Co. Ltd. | | 1,225,000 | 7,388,800 |
| INFAC Corp. | | 362,529 | 1,148,760 |
| Lear Corp. | | 100,000 | 15,393,000 |
| Linamar Corp. | | 625,000 | 24,230,374 |
| Murakami Corp. | | 35,000 | 807,804 |
| Piolax, Inc. | | 924,000 | 18,840,523 |
| Seoyon Co. Ltd. | | 425,000 | 1,659,992 |
| Seoyon E-Hwa Co., Ltd. | | 685,725 | 3,211,552 |
| SL Corp. | | 15,000 | 272,377 |
| Strattec Security Corp. | | 40,000 | 1,380,000 |
| TBK Co. Ltd. (c) | | 1,800,000 | 6,610,053 |
| The Furukawa Battery Co. Ltd. | | 150,000 | 955,703 |
| TPR Co. Ltd. | | 825,000 | 17,571,724 |
| Xinyi Glass Holdings Ltd. | | 200,000 | 243,607 |
| Yorozu Corp. (c) | | 1,852,000 | 25,571,797 |
| | | | 415,053,872 |
| Automobiles - 0.4% | | | |
| Audi AG | | 26,500 | 23,780,210 |
| Fiat Chrysler Automobiles NV (a) | | 139,000 | 2,392,190 |
| Fiat Chrysler Automobiles NV (a) | | 1,264,900 | 21,598,348 |
| Kabe Husvagnar AB (B Shares) | | 25,000 | 378,522 |
| Renault SA | | 10,000 | 707,935 |
| Thor Industries, Inc. | | 50,000 | 3,256,000 |
| | | | 52,113,205 |
| Distributors - 0.3% | | | |
| Chori Co. Ltd. (c) | | 1,566,400 | 22,793,151 |
| Doshisha Co. Ltd. | | 350,000 | 5,359,651 |
| Harima-Kyowa Co. Ltd. | | 104,400 | 1,621,710 |
| Headlam Group PLC | | 50,000 | 256,418 |
| LKQ Corp. (a) | | 200,000 | 5,244,000 |
| Nakayamafuku Co. Ltd. | | 200,000 | 962,130 |
| SPK Corp. | | 15,000 | 317,145 |
| Yagi & Co. Ltd. | | 450,000 | 6,535,690 |
| Yamae Hisano Co. | | 50,000 | 597,200 |
| | | | 43,687,095 |
| Diversified Consumer Services - 0.4% | | | |
| Asante, Inc. | | 60,000 | 1,177,691 |
| Cross-Harbour Holdings Ltd. | | 300,000 | 423,952 |
| Estacio Participacoes SA | | 5,000 | 42,635 |
| Heian Ceremony Service Co. Ltd. | | 500,000 | 3,952,261 |
| Kukbo Design Co. Ltd. | | 126,203 | 1,633,652 |
| MegaStudy Co. Ltd. (c) | | 1,086,945 | 10,259,452 |
| MegaStudyEdu Co. Ltd. (c) | | 1,048,420 | 30,158,698 |
| Multicampus Co. Ltd. | | 60,000 | 2,815,458 |
| Step Co. Ltd. | | 217,000 | 2,502,199 |
| Tsukada Global Holdings, Inc. | | 1,100,000 | 6,099,610 |
| | | | 59,065,608 |
| Hotels, Restaurants & Leisure - 0.4% | | | |
| Betsson AB (B Shares) | | 125,000 | 1,151,177 |
| Fairwood Holdings Ltd. | | 50,000 | 171,271 |
| Hiday Hidaka Corp. | | 276,000 | 5,414,845 |
| Hiramatsu, Inc. (b) | | 25,000 | 76,888 |
| Kura Corp. Ltd. | | 100,000 | 5,159,513 |
| Net Entertainment NE AB | | 175,000 | 844,988 |
| Playtech Ltd. | | 100,000 | 507,852 |
| The Restaurant Group PLC | | 16,957,111 | 33,161,252 |
| Wyndham Destinations, Inc. | | 250,000 | 10,535,000 |
| ZEAL Network SE | | 1,000 | 25,124 |
| | | | 57,047,910 |
| Household Durables - 1.1% | | | |
| Ace Bed Co. Ltd. | | 250,145 | 5,554,131 |
| Cuckoo Holdings Co. Ltd. | | 35,000 | 3,932,832 |
| Emak SpA | | 600,000 | 899,656 |
| FJ Next Co. Ltd. | | 1,100,000 | 9,260,500 |
| Flexsteel Industries, Inc. | | 10,000 | 249,700 |
| Fuji Corp. Ltd. | | 50,000 | 387,423 |
| Gree Electric Appliances, Inc. of Zhuhai Class A (a) | | 6,250,613 | 38,945,065 |
| Hamilton Beach Brands Holding Co.: | | | |
| Class A | | 125,000 | 3,267,500 |
| Class B (a) | | 125,000 | 3,267,500 |
| Helen of Troy Ltd. (a) | | 425,000 | 49,317,000 |
| Iida Group Holdings Co. Ltd. | | 100,000 | 1,818,683 |
| Nittoh Corp. | | 25,000 | 91,806 |
| Q.E.P. Co., Inc. | | 34,998 | 839,602 |
| SABAF SpA | | 400,000 | 7,004,952 |
| Sanei Architecture Planning Co. Ltd. | | 660,000 | 9,997,705 |
| Sanyo Housing Nagoya Co. Ltd. | | 700,000 | 5,899,472 |
| Taylor Morrison Home Corp. (a) | | 500,000 | 9,450,000 |
| Tupperware Brands Corp. | | 134,500 | 3,667,815 |
| Wellpool Co. Ltd. | | 200,000 | 343,487 |
| | | | 154,194,829 |
| Internet & Direct Marketing Retail - 0.1% | | | |
| Aucnet, Inc. | | 125,000 | 1,002,984 |
| CROOZ, Inc. (a)(b) | | 55,000 | 1,075,006 |
| eBay, Inc. | | 200,000 | 6,730,000 |
| Hyundai Home Shopping Network Corp. | | 10,000 | 925,901 |
| N Brown Group PLC | | 300,000 | 343,902 |
| NS Shopping Co. Ltd. | | 75,000 | 913,541 |
| | | | 10,991,334 |
| Leisure Products - 0.1% | | | |
| Mars Group Holdings Corp. | | 550,000 | 10,780,353 |
| Multiline Retail - 0.4% | | | |
| Grazziotin SA | | 387,100 | 2,865,678 |
| Gwangju Shinsegae Co. Ltd. (c) | | 97,372 | 17,418,649 |
| Lifestyle China Group Ltd. (a)(b) | | 12,500,000 | 4,451,160 |
| Lifestyle International Holdings Ltd. | | 12,500,000 | 18,872,654 |
| Macy's, Inc. | | 550,000 | 14,465,000 |
| Treasure Factory Co. Ltd. (c) | | 850,000 | 6,313,059 |
| Watts Co. Ltd. | | 200,000 | 1,301,813 |
| | | | 65,688,013 |
| Specialty Retail - 7.7% | | | |
| ABC-MART, Inc. | | 25,000 | 1,432,178 |
| Arc Land Sakamoto Co. Ltd. | | 500,000 | 6,274,960 |
| AT-Group Co. Ltd. | | 895,000 | 19,309,158 |
| AutoNation, Inc. (a) | | 350,000 | 13,562,500 |
| Beacon Lighting Group Ltd. | | 25,891 | 22,396 |
| Best Buy Co., Inc. | | 3,000,000 | 177,720,000 |
| Cars.com, Inc. (a) | | 50,000 | 1,365,500 |
| Cash Converters International Ltd. (a) | | 14,400,000 | 2,564,503 |
| DCM Japan Holdings Co. Ltd. | | 25,000 | 254,533 |
| DongAh Tire & Rubber Co. Ltd. (a) | | 57,879 | 629,555 |
| Dunelm Group PLC | | 300,000 | 2,842,893 |
| E-Life Mall Corp. Ltd. | | 100,000 | 208,476 |
| Formosa Optical Technology Co. Ltd. | | 751,383 | 1,453,402 |
| Fuji Corp. (c) | | 705,790 | 13,276,692 |
| GameStop Corp. Class A (b)(c) | | 9,999,167 | 113,390,554 |
| Genesco, Inc. (a) | | 150,000 | 6,777,000 |
| GNC Holdings, Inc. Class A (a)(b)(c) | | 5,939,600 | 18,115,780 |
| Goldlion Holdings Ltd. | | 9,300,000 | 3,860,742 |
| Guess?, Inc. (c) | | 5,750,000 | 112,182,500 |
| Handsman Co. Ltd. | | 713,800 | 7,686,825 |
| Hibbett Sports, Inc. (a)(b)(c) | | 1,150,300 | 18,795,902 |
| Hour Glass Ltd. | | 14,267,900 | 6,624,155 |
| IA Group Corp. | | 18,200 | 557,237 |
| International Housewares Retail Co. Ltd. | | 999,600 | 252,421 |
| JB Hi-Fi Ltd. (b) | | 875,000 | 14,228,159 |
| John David Group PLC | | 33,700,000 | 204,561,858 |
| Jumbo SA | | 1,750,000 | 28,603,554 |
| K's Holdings Corp. | | 3,950,000 | 39,237,090 |
| Ku Holdings Co. Ltd. | | 600,000 | 4,302,043 |
| Leon's Furniture Ltd. | | 25,000 | 273,983 |
| Lookers PLC | | 1,534,541 | 2,173,720 |
| Lovisa Holdings Ltd. | | 10,000 | 52,337 |
| Mandarake, Inc. (b) | | 180,000 | 989,855 |
| Mitsui & Associates Telepark Corp. | | 25,000 | 487,262 |
| Mr. Bricolage SA | | 311,600 | 2,282,607 |
| Nafco Co. Ltd. | | 640,400 | 9,747,838 |
| Nitori Holdings Co. Ltd. | | 625,000 | 81,248,566 |
| Nojima Co. Ltd. | | 50,000 | 984,622 |
| Oriental Watch Holdings Ltd. | | 9,273,000 | 2,379,945 |
| Padini Holdings Bhd | | 2,000,000 | 1,811,523 |
| Sacs Bar Holdings, Inc. | | 400,000 | 4,013,771 |
| Sally Beauty Holdings, Inc. (a) | | 5,900,000 | 101,598,000 |
| Samse SA | | 37,000 | 5,844,328 |
| Silvano Fashion Group A/S | | 9,800 | 28,302 |
| Sports Direct International PLC (a) | | 200,000 | 729,774 |
| The Buckle, Inc. | | 632,900 | 10,993,473 |
| Tokatsu Holdings Co. Ltd. (c) | | 250,000 | 1,101,675 |
| Truworths International Ltd. | | 334,900 | 2,022,467 |
| Vita Group Ltd. | | 350,000 | 295,121 |
| Vitamin Shoppe, Inc. (a) | | 400,000 | 1,848,000 |
| Williams-Sonoma, Inc. (b) | | 825,000 | 44,904,750 |
| | | | 1,095,904,485 |
| Textiles, Apparel & Luxury Goods - 1.2% | | | |
| Best Pacific International Holdings Ltd. | | 2,700,000 | 651,275 |
| Capri Holdings Ltd. (a) | | 1,950,000 | 82,836,000 |
| Embry Holdings Ltd. | | 3,200,000 | 946,944 |
| Ff Group (a)(d) | | 1,180,000 | 5,186,412 |
| Fossil Group, Inc. (a)(b) | | 2,338,700 | 39,664,352 |
| Fujibo Holdings, Inc. | | 2,000 | 49,318 |
| Gerry Weber International AG (Bearer) (b) | | 487,195 | 362,468 |
| Grendene SA | | 300,000 | 751,810 |
| Hagihara Industries, Inc. | | 135,000 | 1,890,062 |
| Magni-Tech Industries Bhd | | 2,750,000 | 2,927,246 |
| Only Corp. | | 15,000 | 136,332 |
| Sakai Ovex Co. Ltd. | | 170,000 | 3,023,089 |
| Sitoy Group Holdings Ltd. | | 11,200,000 | 2,996,921 |
| Ted Baker PLC | | 150,000 | 3,665,266 |
| Texwinca Holdings Ltd. | | 1,800,000 | 688,353 |
| Youngone Holdings Co. Ltd. | | 258,000 | 14,286,562 |
| Yue Yuen Industrial (Holdings) Ltd. | | 2,500,000 | 8,527,045 |
| | | | 168,589,455 |
|
| TOTAL CONSUMER DISCRETIONARY | | | 2,133,116,159 |
|
| CONSUMER STAPLES - 3.5% | | | |
| Beverages - 0.9% | | | |
| A.G. Barr PLC | | 500,000 | 4,944,732 |
| Britvic PLC | | 6,968,131 | 80,472,422 |
| C&C Group PLC | | 412,710 | 1,558,880 |
| Jinro Distillers Co. Ltd. (c) | | 523,000 | 13,681,131 |
| Lucas Bols BV (e) | | 120,000 | 2,149,559 |
| Muhak Co. Ltd. | | 340,000 | 4,202,512 |
| Olvi PLC (A Shares) | | 100,000 | 3,788,626 |
| Spritzer Bhd | | 1,000,000 | 502,930 |
| Thai Beverage PCL | | 100,000 | 54,227 |
| Willamette Valley Vineyards, Inc. | | 5,000 | 35,250 |
| Yantai Changyu Pioneer Wine Co. Ltd. (B Shares) | | 6,100,762 | 11,801,682 |
| | | | 123,191,951 |
| Food & Staples Retailing - 1.1% | | | |
| Amsterdam Commodities NV | | 625,000 | 13,863,967 |
| Belc Co. Ltd. | | 35,000 | 1,526,280 |
| Create SD Holdings Co. Ltd. | | 930,000 | 23,342,851 |
| Daiichi Co. Ltd. | | 172,840 | 1,029,820 |
| Dong Suh Companies, Inc. | | 500,000 | 8,629,756 |
| Genky DrugStores Co. Ltd. | | 400,000 | 9,551,526 |
| Halows Co. Ltd. | | 65,000 | 1,254,349 |
| J Sainsbury PLC | | 200,000 | 748,137 |
| Kroger Co. | | 400,000 | 11,332,000 |
| Magnit OJSC | | 5,388 | 342,468 |
| MARR SpA | | 750,000 | 17,941,605 |
| Medical Ikkou Co. Ltd. | | 4,000 | 328,667 |
| Metro Wholesale & Food Specialist AG | | 10,000 | 169,000 |
| Nihon Chouzai Co. Ltd. | | 50,000 | 1,537,755 |
| OM2 Network Co. Ltd. | | 220,000 | 2,167,179 |
| Qol Holdings Co. Ltd. | | 125,000 | 1,949,736 |
| Retail Partners Co. Ltd. | | 550,000 | 5,640,119 |
| Sapporo Clinical Laboratory | | 20,000 | 373,835 |
| Satoh & Co. Ltd. | | 50,000 | 718,843 |
| Satsudora Holdings Co. Ltd. (c) | | 400,000 | 6,532,936 |
| Shoei Foods Corp. | | 50,000 | 1,207,712 |
| Thai President Foods PCL | | 131,357 | 655,944 |
| United Natural Foods, Inc. (a) | | 412,000 | 5,397,200 |
| Valor Holdings Co. Ltd. | | 650,000 | 15,747,992 |
| Walgreens Boots Alliance, Inc. | | 398,100 | 28,766,706 |
| Yuasa Funashoku Co. Ltd. | | 10,000 | 339,224 |
| | | | 161,095,607 |
| Food Products - 1.0% | | | |
| Ajinomoto Malaysia Bhd | | 1,690,600 | 7,718,315 |
| Armanino Foods of Distinction | | 325,000 | 1,001,000 |
| Bakkavor Group PLC (e) | | 100,000 | 194,117 |
| Bell AG | | 40,500 | 12,686,158 |
| Binggrea Co. Ltd. | | 15,000 | 923,654 |
| Cal-Maine Foods, Inc. | | 5,000 | 210,900 |
| Carr's Group PLC | | 4,270,000 | 9,254,879 |
| Changshouhua Food Co. Ltd. | | 3,500,000 | 1,464,687 |
| Cranswick PLC | | 455,526 | 17,230,974 |
| Fleury Michon SA | | 2,000 | 102,556 |
| Fresh Del Monte Produce, Inc. | | 1,138,200 | 36,399,636 |
| High Liner Foods, Inc. (b) | | 20,000 | 113,855 |
| Ingredion, Inc. | | 85,000 | 8,415,000 |
| JC Comsa Corp. | | 150,000 | 487,491 |
| Kaneko Seeds Co. Ltd. | | 150,000 | 1,757,172 |
| Kaveri Seed Co. Ltd. | | 217,323 | 1,839,711 |
| Lassonde Industries, Inc. Class A (sub. vtg.) | | 50,000 | 7,819,932 |
| London Biscuits Bhd (a) | | 5,000,000 | 726,318 |
| London Biscuits Bhd warrants 1/26/20 (a) | | 500,000 | 7,324 |
| M. Dias Branco SA | | 10,000 | 130,539 |
| Nissin Foods Co. Ltd. | | 500,000 | 231,742 |
| Nitto Fuji Flour Milling Co. Ltd. | | 10,000 | 508,607 |
| Origin Enterprises PLC | | 50,000 | 327,928 |
| Pickles Corp. | | 100,000 | 1,800,321 |
| President Bakery PCL | | 16,500 | 31,690 |
| Prima Meat Packers Ltd. | | 350,000 | 6,609,594 |
| S Foods, Inc. | | 300,000 | 10,810,191 |
| Select Harvests Ltd. | | 900,687 | 3,934,803 |
| Shinobu Food Products Co. Ltd. | | 25,000 | 154,005 |
| Thai Wah PCL | | 426,000 | 109,091 |
| Toyo Sugar Refining Co. Ltd. | | 210,000 | 1,964,563 |
| Valsoia SpA | | 85,000 | 1,191,815 |
| | | | 136,158,568 |
| Personal Products - 0.3% | | | |
| Asaleo Care Ltd. | | 900,000 | 588,789 |
| Hengan International Group Co. Ltd. | | 3,600,000 | 28,162,620 |
| Sarantis SA | | 2,400,000 | 20,328,096 |
| | | | 49,079,505 |
| Tobacco - 0.2% | | | |
| KT&G Corp. | | 315,000 | 28,061,541 |
| Scandinavian Tobacco Group A/S (e) | | 400,000 | 5,172,942 |
| | | | 33,234,483 |
|
| TOTAL CONSUMER STAPLES | | | 502,760,114 |
|
| ENERGY - 9.3% | | | |
| Energy Equipment & Services - 1.0% | | | |
| AKITA Drilling Ltd. Class A (non-vtg.) | | 250,000 | 643,099 |
| Carbo Ceramics, Inc. (a)(b)(c) | | 2,360,200 | 9,511,606 |
| Cathedral Energy Services Ltd. (a) | | 800,000 | 432,284 |
| Diamond Offshore Drilling, Inc. (a)(b) | | 1,200,000 | 13,116,000 |
| Ensco PLC Class A (b) | | 5,850,000 | 25,740,000 |
| Geospace Technologies Corp. (a) | | 588,000 | 8,837,640 |
| High Arctic Energy Services, Inc. | | 300,000 | 865,330 |
| Liberty Oilfield Services, Inc. Class A | | 600,000 | 9,126,000 |
| National Oilwell Varco, Inc. | | 200,000 | 5,896,000 |
| PHX Energy Services Corp. (a) | | 25,000 | 48,898 |
| Precision Drilling Corp. (a) | | 200,000 | 439,895 |
| Prosafe ASA (a)(b) | | 600,000 | 1,152,485 |
| Shelf Drilling Ltd. (a)(e) | | 100,000 | 462,417 |
| Shinko Plantech Co. Ltd. | | 1,925,000 | 20,376,635 |
| Subsea 7 SA | | 100,000 | 1,135,174 |
| Tidewater, Inc. (a) | | 82,985 | 1,785,837 |
| Tidewater, Inc. warrants 11/14/24 (a) | | 4,764 | 1,810 |
| Transocean Ltd. (United States) (a)(b) | | 4,204,720 | 36,034,450 |
| | | | 135,605,560 |
| Oil, Gas & Consumable Fuels - 8.3% | | | |
| Advantage Oil & Gas Ltd. (a) | | 200,000 | 312,036 |
| Alvopetro Energy Ltd. (a) | | 2,800,000 | 681,913 |
| ARC Resources Ltd. | | 25,000 | 180,753 |
| Baytex Energy Corp. (a)(b) | | 5,000,000 | 8,409,757 |
| Beach Energy Ltd. | | 1,392,894 | 1,822,490 |
| Berry Petroleum Corp. | | 100,000 | 1,179,000 |
| Birchcliff Energy Ltd. | | 7,030,814 | 16,801,823 |
| Bonanza Creek Energy, Inc. (a) | | 25,000 | 576,250 |
| Bonavista Energy Corp. | | 2,000,000 | 1,856,996 |
| Bonterra Energy Corp. (b) | | 500,000 | 2,233,723 |
| Cenovus Energy, Inc. (Canada) | | 150,000 | 1,171,277 |
| Chevron Corp. | | 600,000 | 68,790,000 |
| China Petroleum & Chemical Corp.: | | | |
| (H Shares) | | 224,000,000 | 187,307,656 |
| sponsored ADR (H Shares) | | 50,000 | 4,172,500 |
| CNOOC Ltd. | | 450,000 | 752,139 |
| CNOOC Ltd. sponsored ADR | | 100,000 | 16,729,000 |
| ConocoPhillips Co. | | 2,550,000 | 172,609,500 |
| Contango Oil & Gas Co. (a) | | 250,000 | 945,000 |
| Denbury Resources, Inc. (a)(b) | | 6,500,000 | 13,195,000 |
| Enagas SA | | 2,800,000 | 81,500,098 |
| Eni SpA | | 10,000 | 169,558 |
| EQM Midstream Partners LP | | 7,500 | 343,200 |
| Fuji Kosan Co. Ltd. | | 105,000 | 607,299 |
| Fuji Oil Co. Ltd. | | 200,000 | 560,018 |
| Husky Energy, Inc. | | 5,625,000 | 66,740,553 |
| Imperial Oil Ltd. | | 800,000 | 22,697,972 |
| International Seaways, Inc. (a) | | 55,000 | 996,600 |
| Motor Oil (HELLAS) Corinth Refineries SA | | 300,000 | 7,468,515 |
| Murphy Oil Corp. | | 1,600,000 | 43,760,000 |
| NACCO Industries, Inc. Class A | | 125,000 | 4,260,000 |
| NuVista Energy Ltd. (a) | | 250,000 | 751,551 |
| Oil & Natural Gas Corp. Ltd. | | 51,000,000 | 101,518,461 |
| Oil India Ltd. | | 100,000 | 236,260 |
| Peyto Exploration & Development Corp. (b)(c) | | 12,474,700 | 64,179,742 |
| S-Oil Corp. | | 10,000 | 939,385 |
| San-Ai Oil Co. Ltd. | | 200,000 | 1,757,172 |
| Sanrin Co. Ltd. | | 15,000 | 99,151 |
| Seven Generations Energy Ltd. (a) | | 125,000 | 970,357 |
| Sinopec Kantons Holdings Ltd. | | 6,000,000 | 2,753,745 |
| Southwestern Energy Co. (a) | | 11,000,000 | 48,070,000 |
| Star Petroleum Refining PCL | | 3,100,000 | 1,081,626 |
| Thai Oil PCL (For. Reg.) | | 1,000,000 | 2,304,738 |
| Total SA sponsored ADR | | 3,600,059 | 197,031,229 |
| TransGlobe Energy Corp. | | 30,000 | 54,797 |
| Tsakos Energy Navigation Ltd. | | 500,000 | 1,610,000 |
| Whiting Petroleum Corp. (a) | | 725,000 | 20,756,750 |
| World Fuel Services Corp. | | 250,000 | 6,222,500 |
| | | | 1,179,168,090 |
|
| TOTAL ENERGY | | | 1,314,773,650 |
|
| FINANCIALS - 14.8% | | | |
| Banks - 3.2% | | | |
| Banco de Sabadell SA | | 100,000 | 114,391 |
| Bar Harbor Bankshares | | 219,866 | 5,261,393 |
| Central Valley Community Bancorp | | 25,000 | 494,250 |
| Citizens Financial Services, Inc. | | 12,853 | 733,906 |
| Credit Agricole Atlantique Vendee | | 7,000 | 1,017,549 |
| Erste Group Bank AG | | 5,000 | 173,979 |
| F & M Bank Corp. | | 131,632 | 3,988,450 |
| First Hawaiian, Inc. | | 100,000 | 2,573,000 |
| Gunma Bank Ltd. | | 5,600,000 | 24,677,530 |
| Hiroshima Bank Ltd. | | 1,000,000 | 5,783,796 |
| Mitsubishi UFJ Financial Group, Inc. | | 17,000,000 | 91,186,644 |
| NIBC Holding NV (e) | | 1,050,000 | 10,443,903 |
| Nordea Bank ABP | | 100,000 | 908,121 |
| OFG Bancorp | | 1,861,516 | 36,076,180 |
| Ogaki Kyoritsu Bank Ltd. | | 60,000 | 1,247,097 |
| San ju San Financial Group, Inc. | | 300,000 | 4,475,557 |
| Schweizerische Nationalbank | | 10 | 48,771 |
| Shinsei Bank Ltd. | | 100,000 | 1,351,389 |
| Skandiabanken ASA (e) | | 625,000 | 5,669,052 |
| Sparebank 1 Oestlandet | | 1,000,000 | 10,030,887 |
| Sumitomo Mitsui Financial Group, Inc. | | 4,100,000 | 152,528,130 |
| The Keiyo Bank Ltd. | | 600,000 | 3,778,747 |
| The San-In Godo Bank Ltd. | | 1,800,000 | 13,038,329 |
| Unicaja Banco SA (e) | | 6,000,000 | 7,039,290 |
| Van Lanschot NV (Bearer) | | 81,300 | 1,907,648 |
| Wells Fargo & Co. | | 1,200,000 | 58,692,000 |
| Yamaguchi Financial Group, Inc. | | 1,700,000 | 17,277,025 |
| | | | 460,517,014 |
| Capital Markets - 1.7% | | | |
| ABG Sundal Collier ASA | | 1,500,000 | 777,216 |
| BinckBank NV | | 109,000 | 778,511 |
| Blue Sky Alternative Investments Ltd. (a) | | 10,000 | 5,161 |
| Brighthouse Financial, Inc. (a) | | 303,436 | 11,330,300 |
| Diamond Hill Investment Group, Inc. | | 13,000 | 2,015,000 |
| Edify SA (a) | | 10,068 | 587,715 |
| Franklin Resources, Inc. | | 225,000 | 6,662,250 |
| Gluskin Sheff + Associates, Inc. | | 100,000 | 761,064 |
| Goldman Sachs Group, Inc. | | 375,000 | 74,253,750 |
| Morgan Stanley | | 500,000 | 21,150,000 |
| State Street Corp. | | 1,650,000 | 116,985,000 |
| | | | 235,305,967 |
| Consumer Finance - 2.2% | | | |
| Aeon Credit Service (Asia) Co. Ltd. | | 10,300,000 | 9,326,019 |
| Credit Corp. Group Ltd. (b) | | 52,450 | 838,007 |
| Discover Financial Services | | 1,700,000 | 114,733,000 |
| Santander Consumer U.S.A. Holdings, Inc. | | 750,000 | 14,295,000 |
| Synchrony Financial | | 5,850,000 | 175,734,000 |
| | | | 314,926,026 |
| Diversified Financial Services - 1.0% | | | |
| AXA Equitable Holdings, Inc. | | 850,000 | 15,759,000 |
| Fuyo General Lease Co. Ltd. | | 550,000 | 27,367,455 |
| IBJ Leasing Co. Ltd. | | 200,000 | 4,597,659 |
| NICE Holdings Co. Ltd. | | 225,000 | 3,620,453 |
| Ricoh Leasing Co. Ltd. | | 1,070,000 | 32,711,499 |
| Tokyo Century Corp. | | 1,350,000 | 62,960,753 |
| | | | 147,016,819 |
| Insurance - 6.5% | | | |
| AFLAC, Inc. | | 4,000,000 | 190,800,000 |
| April | | 1,100,000 | 26,566,166 |
| ASR Nederland NV | | 1,000,000 | 42,189,956 |
| Db Insurance Co. Ltd. | | 1,375,000 | 85,904,282 |
| Genworth Financial, Inc. Class A (a) | | 14,710,000 | 71,196,400 |
| Hyundai Fire & Marine Insurance Co. Ltd. | | 450,000 | 15,108,816 |
| Kansas City Life Insurance Co. (b) | | 2,000 | 72,520 |
| MetLife, Inc. | | 7,500,000 | 342,525,000 |
| National Western Life Group, Inc. | | 24,000 | 7,279,200 |
| NN Group NV | | 2,022,101 | 85,451,222 |
| Power Corp. of Canada (sub. vtg.) | | 350,000 | 6,957,647 |
| Prudential Financial, Inc. | | 222,300 | 20,482,722 |
| Shinkong Insurance Co. Ltd. | | 100,000 | 116,836 |
| Sony Financial Holdings, Inc. | | 1,000,000 | 18,939,637 |
| Sul America SA unit | | 150,000 | 1,320,191 |
| Talanx AG | | 180,000 | 6,679,428 |
| | | | 921,590,023 |
| Mortgage Real Estate Investment Trusts - 0.0% | | | |
| Two Harbors Investment Corp. | | 74,500 | 1,086,955 |
| Thrifts & Mortgage Finance - 0.2% | | | |
| ASAX Co. Ltd. | | 1,005,600 | 5,133,014 |
| Genworth MI Canada, Inc. (b) | | 449,100 | 15,281,602 |
| Genworth Mortgage Insurance Ltd. (b) | | 3,250,899 | 5,246,034 |
| Hingham Institution for Savings | | 10,100 | 1,867,490 |
| | | | 27,528,140 |
|
| TOTAL FINANCIALS | | | 2,107,970,944 |
|
| HEALTH CARE - 18.5% | | | |
| Biotechnology - 6.7% | | | |
| AbbVie, Inc. | | 700,000 | 56,203,000 |
| Amgen, Inc. | | 1,950,000 | 364,864,500 |
| Biogen, Inc. (a) | | 405,000 | 135,180,900 |
| Celgene Corp. (a) | | 374,280 | 33,108,809 |
| Cell Biotech Co. Ltd. | | 291,958 | 7,427,354 |
| Essex Bio-Technology Ltd. | | 1,548,000 | 1,017,077 |
| Gilead Sciences, Inc. | | 1,816,600 | 127,180,166 |
| United Therapeutics Corp. (a) | | 2,000,000 | 230,660,000 |
| | | | 955,641,806 |
| Health Care Equipment & Supplies - 0.5% | | | |
| A&T Corp. | | 90,000 | 651,090 |
| Create Medic Co. Ltd. | | 35,000 | 305,899 |
| Fukuda Denshi Co. Ltd. | | 625,000 | 42,173,514 |
| Interojo Co. Ltd. | | 5,150 | 105,090 |
| Kawasumi Laboratories, Inc. | | 100,000 | 619,692 |
| Medikit Co. Ltd. | | 35,000 | 1,767,271 |
| Nakanishi, Inc. | | 300,000 | 5,155,841 |
| Paramount Bed Holdings Co. Ltd. | | 75,000 | 3,139,775 |
| Paul Hartmann AG | | 1,000 | 338,802 |
| Riverstone Holdings Ltd. | | 100,000 | 83,197 |
| St.Shine Optical Co. Ltd. | | 900,000 | 16,890,890 |
| Value Added Technology Co. Ltd. | | 75,000 | 1,557,401 |
| Vieworks Co. Ltd. | | 25,000 | 769,711 |
| | | | 73,558,173 |
| Health Care Providers & Services - 10.2% | | | |
| Anthem, Inc. | | 2,575,000 | 780,224,995 |
| CVS Health Corp. | | 1,549,930 | 101,597,912 |
| EBOS Group Ltd. | | 487,300 | 7,305,664 |
| Excelsior Medical Co. Ltd. | | 200,000 | 316,508 |
| Hokuyaku Takeyama Holdings, Inc. | | 15,000 | 109,479 |
| Humana, Inc. | | 448,600 | 138,612,914 |
| Laboratory Corp. of America Holdings (a) | | 375,000 | 52,256,250 |
| MEDNAX, Inc. (a) | | 550,000 | 19,860,500 |
| Quest Diagnostics, Inc. | | 400,000 | 34,940,000 |
| Saint-Care Holding Corp. | | 375,000 | 1,769,566 |
| Sigma Healthcare Ltd. (b) | | 6,500,000 | 2,551,419 |
| Tokai Corp. | | 400,000 | 10,392,472 |
| Uchiyama Holdings Co. Ltd. | | 775,000 | 3,137,709 |
| UnitedHealth Group, Inc. | | 1,000,000 | 270,200,000 |
| Universal Health Services, Inc. Class B | | 200,000 | 26,506,000 |
| Yagami, Inc. | | 5,000 | 79,412 |
| | | | 1,449,860,800 |
| Health Care Technology - 0.1% | | | |
| Pharmagest Interactive (b) | | 190,000 | 11,917,575 |
| Life Sciences Tools & Services - 0.1% | | | |
| ICON PLC (a) | | 75,000 | 10,491,000 |
| Pharmaceuticals - 0.9% | | | |
| Apex Healthcare Bhd | | 750,000 | 1,523,438 |
| Biofermin Pharmaceutical Co. Ltd. | | 100,000 | 2,178,563 |
| Boiron SA | | 15,000 | 829,263 |
| Daito Pharmaceutical Co. Ltd. | | 119,000 | 3,058,986 |
| Dawnrays Pharmaceutical Holdings Ltd. | | 22,005,000 | 4,382,662 |
| DongKook Pharmaceutical Co. Ltd. | | 83,000 | 4,208,085 |
| Genomma Lab Internacional SA de CV (a) | | 5,000,000 | 3,467,165 |
| Huons Co. Ltd. | | 2,904 | 176,992 |
| Indivior PLC (a) | | 3,000,000 | 4,464,031 |
| Kaken Pharmaceutical Co. Ltd. | | 10,000 | 470,966 |
| Korea United Pharm, Inc. | | 130,000 | 2,734,554 |
| Kwang Dong Pharmaceutical Co. Ltd. | | 2,400,000 | 15,792,454 |
| Kyung Dong Pharmaceutical Co. Ltd. | | 50,000 | 478,682 |
| Lee's Pharmaceutical Holdings Ltd. (b) | | 9,300,000 | 7,559,081 |
| Luye Pharma Group Ltd. (e) | | 4,500,000 | 3,362,375 |
| Nippon Chemiphar Co. Ltd. | | 75,010 | 2,238,077 |
| Novo Nordisk A/S Series B sponsored ADR | | 250,000 | 11,755,000 |
| Orient Europharma Co. Ltd. | | 200,000 | 357,258 |
| PT Tempo Scan Pacific Tbk | | 500,000 | 54,571 |
| Samjin Pharmaceutical Co. Ltd. | | 2,000 | 68,768 |
| Sanofi SA sponsored ADR | | 200,000 | 8,690,000 |
| Stallergenes Greer PLC (a) | | 104,976 | 3,640,713 |
| Syngen Biotech Co. Ltd. | | 55,000 | 191,360 |
| Taro Pharmaceutical Industries Ltd. | | 350,000 | 33,299,000 |
| Towa Pharmaceutical Co. Ltd. | | 150,000 | 10,521,001 |
| Vetoquinol SA | | 10,000 | 590,614 |
| Vivimed Labs Ltd. (a) | | 100,000 | 35,231 |
| | | | 126,128,890 |
|
| TOTAL HEALTH CARE | | | 2,627,598,244 |
|
| INDUSTRIALS - 9.1% | | | |
| Aerospace & Defense - 0.1% | | | |
| Austal Ltd. | | 300,000 | 436,140 |
| Magellan Aerospace Corp. | | 125,000 | 1,495,491 |
| SIFCO Industries, Inc. (a) | | 61,000 | 192,150 |
| The Lisi Group | | 10,000 | 317,054 |
| United Technologies Corp. | | 37,525 | 4,430,577 |
| Vectrus, Inc. (a) | | 25,000 | 629,750 |
| | | | 7,501,162 |
| Air Freight & Logistics - 0.1% | | | |
| AIT Corp. | | 900,000 | 8,188,203 |
| CTI Logistics Ltd. | | 445,966 | 320,931 |
| Hub Group, Inc. Class A (a) | | 10,000 | 445,100 |
| Onelogix Group Ltd. | | 4,600,100 | 1,283,225 |
| SBS Co. Ltd. | | 250,000 | 3,656,185 |
| | | | 13,893,644 |
| Airlines - 0.0% | | | |
| WestJet Airlines Ltd. | | 10,000 | 152,974 |
| Building Products - 0.2% | | | |
| COVIA Corp. (a)(b) | | 725,000 | 3,393,000 |
| InnoTec TSS AG | | 50,000 | 721,098 |
| Kondotec, Inc. | | 25,000 | 214,827 |
| KVK Corp. | | 75,000 | 912,325 |
| Miyako, Inc. | | 14,400 | 118,849 |
| Nichias Corp. | | 5,000 | 86,482 |
| Nihon Dengi Co. Ltd. | | 350,000 | 8,611,430 |
| Noda Corp. | | 287,100 | 1,789,680 |
| Resideo Technologies, Inc. (a) | | 50,000 | 1,096,500 |
| Sekisui Jushi Corp. | | 728,100 | 13,696,368 |
| | | | 30,640,559 |
| Commercial Services & Supplies - 0.3% | | | |
| Asia File Corp. Bhd | | 5,300,100 | 3,416,080 |
| Calian Technologies Ltd. | | 309,000 | 7,174,999 |
| Civeo Corp. (a) | | 2,944,500 | 7,449,585 |
| CMC Corp. | | 15,000 | 241,680 |
| Fursys, Inc. | | 200,000 | 5,465,512 |
| Loomis AB (B Shares) | | 50,000 | 1,789,277 |
| Matsuda Sangyo Co. Ltd. | | 150,000 | 1,963,737 |
| Mitie Group PLC | | 2,033,898 | 3,131,834 |
| Nippon Kanzai Co. Ltd. | | 20,000 | 344,641 |
| Secom Joshinetsu Co. Ltd. | | 25,000 | 780,353 |
| VSE Corp. | | 330,000 | 10,767,900 |
| | | | 42,525,598 |
| Construction & Engineering - 0.4% | | | |
| Arcadis NV | | 900,000 | 11,661,185 |
| Boustead Projs. Pte Ltd. | | 2,549,475 | 1,713,917 |
| Boustead Singapore Ltd. | | 9,647,800 | 5,661,686 |
| Daiichi Kensetsu Corp. | | 275,000 | 3,956,163 |
| Geumhwa PSC Co. Ltd. | | 1,000 | 27,642 |
| Hokuriku Electrical Construction Co. Ltd. | | 125,000 | 1,021,345 |
| Joban Kaihatsu Co. Ltd. (b) | | 5,000 | 248,795 |
| Kawasaki Setsubi Kogyo Co. Ltd. | | 175,000 | 578,380 |
| Meisei Industrial Co. Ltd. | | 600,000 | 3,877,898 |
| Mirait Holdings Corp. | | 47,000 | 677,870 |
| Nakano Corp. | | 10,000 | 45,077 |
| Nippon Rietec Co. Ltd. | | 1,041,046 | 13,992,117 |
| Seikitokyu Kogyo Co. Ltd. | | 550,000 | 3,090,200 |
| Shinnihon Corp. | | 75,000 | 689,924 |
| Sinopec Engineering Group Co. Ltd. (H Shares) | | 100,000 | 98,297 |
| Sumiken Mitsui Road Co. Ltd. | | 60,000 | 393,298 |
| Sumitomo Densetsu Co. Ltd. | | 175,000 | 2,858,159 |
| Toshiba Plant Systems & Services Corp. | | 400,000 | 7,506,082 |
| Watanabe Sato Co. Ltd. | | 60,000 | 1,101,675 |
| | | | 59,199,710 |
| Electrical Equipment - 0.4% | | | |
| Aichi Electric Co. Ltd. | | 123,600 | 3,285,031 |
| Aros Quality Group AB | | 853,205 | 14,162,957 |
| Canare Electric Co. Ltd. | | 95,000 | 1,597,797 |
| Dewhurst PLC | | 25,000 | 295,110 |
| Eaton Corp. PLC | | 350,000 | 26,687,500 |
| Hammond Power Solutions, Inc. Class A | | 530,000 | 2,424,217 |
| Holding Co. ADMIE IPTO SA | | 25,000 | 44,926 |
| Iwabuchi Corp. | | 10,000 | 456,277 |
| Regal Beloit Corp. | | 75,000 | 5,757,000 |
| Somfy SA | | 25,000 | 1,974,435 |
| Terasaki Electric Co. Ltd. | | 110,000 | 949,277 |
| | | | 57,634,527 |
| Industrial Conglomerates - 0.1% | | | |
| Lifco AB | | 100,018 | 4,001,450 |
| Mytilineos Holdings SA | | 850,000 | 7,997,320 |
| Nolato AB Series B | | 60,000 | 2,758,514 |
| Reunert Ltd. | | 300,000 | 1,594,572 |
| | | | 16,351,856 |
| Machinery - 0.8% | | | |
| Conrad Industries, Inc. (a) | | 22,800 | 315,324 |
| Daihatsu Diesel Manufacturing Co. Ltd. (c) | | 3,184,000 | 19,321,772 |
| Daiwa Industries Ltd. | | 1,100,000 | 11,047,969 |
| Estic Corp. | | 50,000 | 3,451,916 |
| Fuji Latex Co. Ltd. | | 35,000 | 722,653 |
| Fujimak Corp. (c) | | 820,000 | 7,279,688 |
| Fukushima Industries Corp. | | 75,000 | 2,654,349 |
| Global Brass & Copper Holdings, Inc. | | 275,000 | 8,316,000 |
| Haitian International Holdings Ltd. | | 4,501,000 | 10,368,335 |
| Hy-Lok Corp. | | 150,000 | 2,629,379 |
| Ihara Science Corp. | | 200,000 | 2,754,189 |
| Jaya Holdings Ltd. (a)(d) | | 1,157,500 | 24,935 |
| Koike Sanso Kogyo Co. Ltd. | | 35,000 | 739,362 |
| Krones AG (b) | | 10,000 | 834,986 |
| Mitsuboshi Belting Ltd. | | 12,500 | 238,352 |
| Momentum Group AB Class B | | 525,000 | 4,984,058 |
| Nakanishi Manufacturing Co. Ltd. | | 213,100 | 1,968,130 |
| Nansin Co. Ltd. | | 250,000 | 1,179,711 |
| Sakura Rubber Co. Ltd. (b) | | 36,700 | 1,755,401 |
| Sansei Co. Ltd. (c) | | 850,000 | 3,137,021 |
| Semperit AG Holding (a)(b) | | 300,000 | 4,807,320 |
| SIMPAC, Inc. | | 2,325,000 | 6,029,705 |
| Suzumo Machinery Co. Ltd. | | 10,000 | 98,325 |
| Teikoku Sen-I Co. Ltd. | | 550,000 | 11,194,400 |
| The Hanshin Diesel Works Ltd. | | 30,000 | 548,084 |
| Tocalo Co. Ltd. | | 400,000 | 3,396,833 |
| Yamada Corp. | | 80,000 | 1,836,126 |
| | | | 111,634,323 |
| Marine - 0.1% | | | |
| Freight Management Holdings Bhd | | 1,500,000 | 201,416 |
| Japan Transcity Corp. | | 1,400,000 | 5,449,621 |
| Nippon Concept Corp. | | 25,000 | 224,696 |
| SITC International Holdings Co. Ltd. | | 8,000,000 | 7,345,238 |
| | | | 13,220,971 |
| Professional Services - 1.8% | | | |
| ABIST Co. Ltd. (c) | | 250,000 | 7,355,979 |
| Akka Technologies SA | | 600,000 | 37,565,772 |
| Bertrandt AG | | 200,000 | 17,146,108 |
| Career Design Center Co. Ltd. | | 110,000 | 1,131,053 |
| Cpl Resources PLC | | 50,000 | 349,103 |
| Dun & Bradstreet Corp. | | 1,150,000 | 166,451,000 |
| McMillan Shakespeare Ltd. | | 2,600,000 | 29,010,579 |
| SHL-JAPAN Ltd. | | 103,200 | 1,636,230 |
| WDB Holdings Co. Ltd. | | 100,000 | 2,351,159 |
| | | | 262,996,983 |
| Road & Rail - 0.8% | | | |
| Autohellas SA (c) | | 650,000 | 16,367,780 |
| ComfortDelgro Corp. Ltd. | | 100,000 | 173,080 |
| Daqin Railway Co. Ltd. (A Shares) | | 41,500,695 | 52,953,519 |
| Hamakyorex Co. Ltd. | | 157,000 | 5,606,885 |
| Higashi Twenty One Co. Ltd. | | 200,000 | 881,340 |
| Kyushu Railway Co. | | 260,000 | 8,855,635 |
| NANSO Transport Co. Ltd. | | 125,000 | 1,348,405 |
| Nikkon Holdings Co. Ltd. | | 100,000 | 2,513,656 |
| SENKO Co. Ltd. | | 200,000 | 1,624,971 |
| Shin-Keisei Electric Railway Co. Ltd. | | 25,000 | 477,622 |
| STEF-TFE Group | | 76,445 | 7,376,161 |
| The Hokkaido Chuo Bus Co. Ltd. | | 1,000 | 38,742 |
| Tohbu Network Co. Ltd. | | 175,000 | 1,638,742 |
| Utoc Corp. | | 1,600,000 | 7,491,393 |
| | | | 107,347,931 |
| Trading Companies & Distributors - 3.9% | | | |
| AerCap Holdings NV (a) | | 900,000 | 42,534,000 |
| Alconix Corp. | | 18,000 | 185,908 |
| Bergman & Beving AB (B Shares) | | 625,000 | 6,009,383 |
| Canox Corp. | | 369,600 | 3,019,913 |
| Daiichi Jitsugyo Co. Ltd. | | 25,000 | 788,387 |
| Green Cross Co. Ltd. (c) | | 581,900 | 5,636,029 |
| HERIGE | | 60,000 | 1,593,283 |
| Houston Wire & Cable Co. (a)(c) | | 1,348,500 | 8,455,095 |
| Howden Joinery Group PLC | | 225,000 | 1,491,486 |
| iMarketKorea, Inc. | | 35,000 | 251,701 |
| Itochu Corp. | | 19,100,000 | 349,209,548 |
| Kamei Corp. (c) | | 2,100,000 | 22,325,453 |
| Lumax International Corp. Ltd. | | 1,588,740 | 3,420,510 |
| Meiwa Corp. | | 1,300,000 | 5,048,428 |
| Mitani Shoji Co. Ltd. | | 665,000 | 33,150,792 |
| Mitsubishi Corp. | | 1,300,000 | 37,964,655 |
| Narasaki Sangyo Co. Ltd. | | 60,000 | 944,136 |
| Nishikawa Keisoku Co. Ltd. | | 20,000 | 629,791 |
| Pla Matels Corp. | | 300,000 | 1,478,999 |
| Rasa Corp. | | 235,000 | 1,818,728 |
| Sakai Trading Co. Ltd. | | 30,000 | 421,942 |
| Shinsho Corp. | | 100,000 | 2,275,878 |
| Yamazen Co. Ltd. | | 50,000 | 501,262 |
| Yuasa Trading Co. Ltd. | | 650,000 | 19,006,197 |
| | | | 548,161,504 |
| Transportation Infrastructure - 0.1% | | | |
| Anhui Expressway Co. Ltd. (H Shares) | | 2,500,000 | 1,596,023 |
| Isewan Terminal Service Co. Ltd. | | 300,000 | 2,010,558 |
| Meiko Transportation Co. Ltd. | | 75,000 | 773,927 |
| Qingdao Port International Co. Ltd. (a)(e) | | 15,000,000 | 9,344,235 |
| | | | 13,724,743 |
|
| TOTAL INDUSTRIALS | | | 1,284,986,485 |
|
| INFORMATION TECHNOLOGY - 5.9% | | | |
| Communications Equipment - 0.0% | | | |
| HF Co. (c) | | 225,000 | 1,550,361 |
| SerComm Corp. | | 125,000 | 264,727 |
| | | | 1,815,088 |
| Electronic Equipment & Components - 0.8% | | | |
| AAC Technology Holdings, Inc. | | 5,000 | 31,382 |
| Daido Signal Co. Ltd. | | 400,000 | 1,883,865 |
| Dell Technologies, Inc. (a) | | 194,360 | 9,443,952 |
| Elematec Corp. | | 400,000 | 6,584,347 |
| FLEXium Interconnect, Inc. | | 25,000 | 62,388 |
| HAGIAWARA ELECTRIC Co. Ltd. | | 270,500 | 7,047,776 |
| Hon Hai Precision Industry Co. Ltd. (Foxconn) | | 2,000,000 | 4,637,434 |
| ITC Networks Corp. | | 5,000 | 63,255 |
| Kingboard Chemical Holdings Ltd. | | 5,675,000 | 19,968,884 |
| Kyosha Co. Ltd. (b) | | 50,000 | 163,874 |
| Lacroix SA (c) | | 376,493 | 9,437,452 |
| Lagercrantz Group AB (B Shares) | | 10,000 | 109,081 |
| Makus, Inc. | | 300,000 | 1,173,108 |
| New Cosmos Electric Co. Ltd. | | 35,000 | 536,608 |
| Nihon Denkei Co. Ltd. | | 50,000 | 636,218 |
| Orbotech Ltd. (a) | | 75,000 | 4,599,750 |
| PAX Global Technology Ltd. (b) | | 5,500,000 | 2,412,071 |
| Redington India Ltd. | | 3,625,138 | 3,749,790 |
| Riken Kieki Co. Ltd. | | 550,000 | 10,012,853 |
| Shibaura Electronics Co. Ltd. | | 225,000 | 7,746,156 |
| Simplo Technology Co. Ltd. | | 1,320,000 | 9,695,371 |
| SYNNEX Corp. | | 20,000 | 1,935,200 |
| Thinking Electronic Industries Co. Ltd. | | 1,500,000 | 3,876,325 |
| VST Holdings Ltd. | | 20,419,100 | 9,894,088 |
| | | | 115,701,228 |
| Internet Software & Services - 0.0% | | | |
| Danawa Co. Ltd. | | 10,000 | 159,561 |
| IT Services - 3.2% | | | |
| All for One Steeb AG | | 10,000 | 627,241 |
| Amdocs Ltd. | | 1,250,000 | 69,850,000 |
| Avant Corp. | | 150,000 | 1,900,390 |
| Cielo SA | | 3,000,000 | 9,821,233 |
| Computer Services, Inc. | | 5,000 | 280,000 |
| Data#3 Ltd. | | 800,001 | 930,433 |
| Dimerco Data System Corp. | | 500,000 | 586,287 |
| E-Credible Co. Ltd. | | 240,000 | 3,462,690 |
| eClerx Services Ltd. (a) | | 123,576 | 1,870,968 |
| Enea Data AB (a) | | 210,000 | 2,819,851 |
| Estore Corp. (c) | | 438,100 | 3,032,613 |
| Future Corp. | | 739,200 | 10,193,054 |
| GMO Internet, Inc. | | 5,000 | 67,294 |
| IFIS Japan Ltd. | | 175,000 | 976,819 |
| Korea Information & Communication Co. Ltd. (a) | | 325,000 | 2,670,280 |
| Neurones | | 12,000 | 270,583 |
| NIC, Inc. | | 200,000 | 3,280,000 |
| Nice Information & Telecom, Inc. | | 132,413 | 2,332,996 |
| Persistent Systems Ltd. | | 275,000 | 2,333,392 |
| Societe Pour L'Informatique Industrielle SA | | 174,000 | 4,222,200 |
| Softcreate Co. Ltd. | | 25,000 | 304,108 |
| Sopra Steria Group | | 480,000 | 48,512,726 |
| Tessi SA (a)(c) | | 199,798 | 36,590,206 |
| The Western Union Co. | | 13,818,200 | 252,182,150 |
| TravelSky Technology Ltd. (H Shares) | | 350,000 | 950,676 |
| | | | 460,068,190 |
| Semiconductors & Semiconductor Equipment - 0.1% | | | |
| e-LITECOM Co. Ltd. | | 50,000 | 299,794 |
| Miraial Co. Ltd. (b)(c) | | 600,000 | 6,279,550 |
| Phison Electronics Corp. | | 750,000 | 6,224,684 |
| Protec Co. Ltd. | | 5,000 | 72,814 |
| | | | 12,876,842 |
| Software - 0.3% | | | |
| 8K Miles Software Services Ltd. (a) | | 5,000 | 8,878 |
| Cyient Ltd. | | 50,000 | 429,467 |
| eBase Co. Ltd. | | 120,000 | 1,850,815 |
| Ebix, Inc. | | 300,000 | 17,136,000 |
| InfoVine Co. Ltd. | | 63,600 | 1,352,121 |
| Integrated Research Ltd. | | 15,000 | 26,605 |
| Jastec Co. Ltd. | | 110,000 | 902,823 |
| KPIT Cummins Infosystems Ltd. | | 1,800,000 | 2,899,380 |
| KPIT Engineering Ltd. (a)(d) | | 1,800,000 | 2,071,167 |
| KSK Co., Ltd. | | 121,900 | 1,879,000 |
| Linedata Services | | 10,000 | 405,761 |
| Micro Focus International PLC sponsored ADR | | 500,084 | 9,551,604 |
| Sinosoft Tech Group Ltd. | | 3,000,000 | 847,364 |
| System Research Co. Ltd. | | 25,000 | 694,285 |
| Toho System Science Co. Ltd. | | 100,000 | 823,502 |
| Uchida Esco Co. Ltd. (c) | | 315,400 | 4,320,191 |
| Zensar Technologies Ltd. | | 500,000 | 1,582,934 |
| | | | 46,781,897 |
| Technology Hardware, Storage & Peripherals - 1.5% | | | |
| Bluecom Co. Ltd. | | 55,000 | 215,564 |
| Elecom Co. Ltd. | | 40,000 | 1,066,422 |
| Hewlett Packard Enterprise Co. | | 3,000,000 | 46,770,000 |
| HP, Inc. | | 7,000,000 | 154,210,000 |
| TPV Technology Ltd. | | 25,000,000 | 3,475,511 |
| | | | 205,737,497 |
|
| TOTAL INFORMATION TECHNOLOGY | | | 843,140,303 |
|
| MATERIALS - 1.7% | | | |
| Chemicals - 1.0% | | | |
| Air Water, Inc. | | 100,000 | 1,664,448 |
| C. Uyemura & Co. Ltd. | | 185,000 | 10,835,896 |
| CF Industries Holdings, Inc. | | 265,400 | 11,584,710 |
| Chokwang Paint Ltd. | | 50,000 | 338,448 |
| Dainichiseika Color & Chemicals Manufacturing Co. Ltd. | | 10,000 | 255,497 |
| Daishin-Chemical Co. Ltd. (c) | | 411,495 | 4,726,006 |
| Fuso Chemical Co. Ltd. | | 200,000 | 3,910,948 |
| Green Seal Holding Ltd. | | 55,000 | 68,626 |
| Hannong Chemicals, Inc. (c) | | 1,288,000 | 4,909,181 |
| Hitachi Chemical Co. Ltd. | | 200,000 | 3,282,993 |
| Insecticides (India) Ltd. | | 50,000 | 414,846 |
| Isamu Paint Co. Ltd. (b) | | 20,000 | 664,678 |
| Koatsu Gas Kogyo Co. Ltd. | | 200,000 | 1,353,225 |
| KPC Holdings Corp. | | 12,000 | 642,917 |
| KPX Green Chemical Co. Ltd. | | 50,000 | 160,460 |
| Kukdong Oil & Chemicals Co. Ltd. | | 100,000 | 312,379 |
| Kunsul Chemical Industrial Co. Ltd. | | 5,000 | 118,210 |
| Kuriyama Holdings Corp. | | 200,000 | 1,336,700 |
| LyondellBasell Industries NV Class A | | 200,000 | 17,394,000 |
| Nippon Soda Co. Ltd. | | 160,000 | 4,051,228 |
| NOF Corp. | | 260,000 | 8,557,264 |
| Nutrien Ltd. | | 120,000 | 6,216,675 |
| Okamoto Industries, Inc. | | 2,000 | 102,639 |
| Scientex Bhd | | 4,051,200 | 8,703,750 |
| T&K Toka Co. Ltd. | | 350,000 | 3,123,250 |
| Tae Kyung Industrial Co. Ltd. | | 675,000 | 3,410,102 |
| Thai Carbon Black PCL (For. Reg.) (a) | | 50,000 | 75,224 |
| Thai Rayon PCL NVDR | | 250,000 | 320,102 |
| The Mosaic Co. | | 100,000 | 3,228,000 |
| Toho Acetylene Co. Ltd. | | 225,000 | 2,788,616 |
| Yara International ASA | | 850,000 | 35,082,613 |
| Yip's Chemical Holdings Ltd. | | 3,500,000 | 1,103,569 |
| Yung Chi Paint & Varnish Manufacturing Co. Ltd. | | 2,200,000 | 5,202,874 |
| | | | 145,940,074 |
| Construction Materials - 0.1% | | | |
| Brampton Brick Ltd. Class A (sub. vtg.) (a) | | 5,000 | 25,914 |
| Ibstock PLC (e) | | 500,000 | 1,590,971 |
| Imerys SA | | 10,000 | 526,516 |
| Mitani Sekisan Co. Ltd. | | 250,000 | 5,873,307 |
| Yamau Co. Ltd. | | 5,000 | 16,020 |
| Yotai Refractories Co. Ltd. | | 200,000 | 1,235,713 |
| | | | 9,268,441 |
| Containers & Packaging - 0.1% | | | |
| AMVIG Holdings Ltd. | | 2,500,000 | 570,272 |
| Chuoh Pack Industry Co. Ltd. | | 12,000 | 135,506 |
| Crown Holdings, Inc. (a) | | 1,000 | 51,000 |
| Groupe Guillin SA | | 10,000 | 243,800 |
| Mayr-Melnhof Karton AG | | 120,000 | 15,795,480 |
| The Pack Corp. | | 75,000 | 1,983,704 |
| | | | 18,779,762 |
| Metals & Mining - 0.5% | | | |
| ArcelorMittal SA Class A unit (b) | | 100,000 | 2,350,000 |
| Ausdrill Ltd. | | 20,572,770 | 18,842,477 |
| Castings PLC | | 75,000 | 386,102 |
| Chubu Steel Plate Co. Ltd. | | 458,800 | 2,565,152 |
| CI Resources Ltd. | | 400,000 | 407,064 |
| CK-SAN-ETSU Co. Ltd. | | 110,000 | 2,389,350 |
| Compania de Minas Buenaventura SA sponsored ADR | | 350,000 | 5,477,500 |
| Labrador Iron Ore Royalty Corp. | | 100,000 | 2,309,068 |
| Mount Gibson Iron Ltd. | | 25,487,603 | 11,949,875 |
| Orvana Minerals Corp. (a) | | 50,000 | 7,230 |
| Pacific Metals Co. Ltd. (b) | | 700,999 | 18,740,501 |
| Rio Tinto PLC sponsored ADR (b) | | 100,000 | 5,627,000 |
| Teck Resources Ltd. Class B (sub. vtg.) | | 50,000 | 1,217,702 |
| Warrior Metropolitan Coal, Inc. | | 50,000 | 1,436,500 |
| | | | 73,705,521 |
| Paper & Forest Products - 0.0% | | | |
| Miquel y Costas & Miquel SA | | 5,000 | 97,520 |
|
| TOTAL MATERIALS | | | 247,791,318 |
|
| REAL ESTATE - 0.1% | | | |
| Equity Real Estate Investment Trusts (REITs) - 0.0% | | | |
| CorePoint Lodging, Inc. | | 20,000 | 244,800 |
| Sabra Health Care REIT, Inc. | | 101,100 | 2,076,594 |
| | | | 2,321,394 |
| Real Estate Management & Development - 0.1% | | | |
| CRE, Inc. | | 10,000 | 84,186 |
| Japan Corporate Housing Service, Inc. | | 25,000 | 183,154 |
| Lai Sun Garment (International) Ltd. | | 203,741 | 316,360 |
| LSL Property Services PLC | | 50,000 | 163,950 |
| Nisshin Fudosan Co. Ltd. (c) | | 2,850,000 | 11,460,179 |
| | | | 12,207,829 |
|
| TOTAL REAL ESTATE | | | 14,529,223 |
|
| UTILITIES - 2.5% | | | |
| Electric Utilities - 2.1% | | | |
| Edison International | | 300,000 | 17,091,000 |
| EVN AG | | 18,600 | 300,609 |
| Exelon Corp. | | 1,900,000 | 90,744,000 |
| Fjordkraft Holding ASA (a)(e) | | 650,000 | 2,774,501 |
| PG&E Corp. (a) | | 2,150,000 | 27,950,000 |
| PPL Corp. | | 4,850,134 | 151,906,197 |
| Public Power Corp. of Greece (a) | | 25,000 | 37,257 |
| | | | 290,803,564 |
| Gas Utilities - 0.4% | | | |
| Busan City Gas Co. Ltd. | | 110,000 | 3,895,975 |
| China Resource Gas Group Ltd. | | 2,000,000 | 7,870,215 |
| GAIL India Ltd. (a) | | 5,416,666 | 25,354,363 |
| Hokuriku Gas Co. | | 75,000 | 2,110,397 |
| Keiyo Gas Co. Ltd. | | 15,000 | 402,662 |
| Seoul City Gas Co. Ltd. | | 100,000 | 7,515,080 |
| YESCO Co. Ltd. | | 240,000 | 8,910,224 |
| | | | 56,058,916 |
| Water Utilities - 0.0% | | | |
| Manila Water Co., Inc. | | 500,000 | 263,713 |
| Thessaloniki Water & Sewage SA (a) | | 100,000 | 510,492 |
| | | | 774,205 |
|
| TOTAL UTILITIES | | | 347,636,685 |
|
| TOTAL COMMON STOCKS | | | |
| (Cost $10,187,891,720) | | | 12,229,670,356 |
|
| Nonconvertible Preferred Stocks - 0.1% | | | |
| CONSUMER DISCRETIONARY - 0.0% | | | |
| Automobiles - 0.0% | | | |
| Porsche Automobil Holding SE (Germany) | | 5,000 | 325,135 |
| INDUSTRIALS - 0.0% | | | |
| Industrial Conglomerates - 0.0% | | | |
| Steel Partners Holdings LP Series A, 6.00% | | 148,400 | 3,297,448 |
| Machinery - 0.0% | | | |
| Danieli & C. Officine Meccaniche SpA | | 10,000 | 162,304 |
|
| TOTAL INDUSTRIALS | | | 3,459,752 |
|
| MATERIALS - 0.1% | | | |
| Construction Materials - 0.1% | | | |
| Buzzi Unicem SpA (Risparmio Shares) | | 550,000 | 6,698,199 |
| UTILITIES - 0.0% | | | |
| Electric Utilities - 0.0% | | | |
| Companhia Paranaense de Energia-Copel (PN-B) | | 500,000 | 4,840,700 |
| TOTAL NONCONVERTIBLE PREFERRED STOCKS | | | |
| (Cost $11,119,287) | | | 15,323,786 |
|
| Money Market Funds - 16.6% | | | |
| Fidelity Cash Central Fund, 2.43% (f) | | 1,952,311,537 | 1,952,702,000 |
| Fidelity Securities Lending Cash Central Fund 2.43% (f)(g) | | 398,408,988 | 398,448,829 |
| TOTAL MONEY MARKET FUNDS | | | |
| (Cost $2,351,135,219) | | | 2,351,150,829 |
| TOTAL INVESTMENT IN SECURITIES - 102.8% | | | |
| (Cost $12,550,146,226) | | | 14,596,144,971 |
| NET OTHER ASSETS (LIABILITIES) - (2.8)% | | | (397,284,488) |
| NET ASSETS - 100% | | | $14,198,860,483 |
Legend
(a) Non-income producing
(b) Security or a portion of the security is on loan at period end.
(c) Affiliated company
(d) Level 3 security
(e) Security exempt from registration under Rule 144A of the Securities Act of 1933. These securities may be resold in transactions exempt from registration, normally to qualified institutional buyers. At the end of the period, the value of these securities amounted to $48,203,362 or 0.3% of net assets.
(f) Affiliated fund that is generally available only to investment companies and other accounts managed by Fidelity Investments. The rate quoted is the annualized seven-day yield of the fund at period end. A complete unaudited listing of the fund's holdings as of its most recent quarter end is available upon request. In addition, each Fidelity Central Fund's financial statements are available on the SEC's website or upon request.
(g) Investment made with cash collateral received from securities on loan.
Affiliated Central Funds
Information regarding fiscal year to date income earned by the Fund from investments in Fidelity Central Funds is as follows:
| Fund | Income earned |
| Fidelity Cash Central Fund | $18,954,796 |
| Fidelity Securities Lending Cash Central Fund | 2,205,982 |
| Total | $21,160,778 |
Amounts in the income column in the above table include any capital gain distributions from underlying funds, which are presented in the corresponding line-item in the Statement of Operations, if applicable.
Other Affiliated Issuers
An affiliated company is a company in which the Fund has ownership of at least 5% of the voting securities. Fiscal year to date transactions with companies which are or were affiliates are as follows:
| Affiliate | Value, beginning of period | Purchases | Sales Proceeds | Dividend Income | Realized Gain (loss) | Change in Unrealized appreciation (depreciation) | Value, end of period |
| ABIST Co. Ltd. | $7,230,694 | $2,156,038 | $-- | $131,264 | $-- | $(2,030,753) | $7,355,979 |
| Autohellas SA | 17,937,829 | -- | -- | -- | -- | (1,570,049) | 16,367,780 |
| Bed Bath & Beyond, Inc. | 204,157,000 | 5,462,313 | 142,506,072 | 1,792,000 | (70,907,527) | 3,794,286 | -- |
| Carbo Ceramics, Inc. | 22,020,666 | -- | -- | -- | -- | (12,509,060) | 9,511,606 |
| Chori Co. Ltd. | 29,068,372 | -- | -- | 325,204 | -- | (6,275,221) | 22,793,151 |
| Daihatsu Diesel Manufacturing Co. Ltd. | 21,071,949 | -- | -- | -- | -- | (1,750,177) | 19,321,772 |
| Daishin-Chemical Co. Ltd. | 4,575,671 | 830,065 | -- | -- | -- | (679,730) | 4,726,006 |
| Estore Corp. | 4,319,635 | -- | 492,838 | -- | 119,628 | (913,812) | 3,032,613 |
| Fuji Corp. | 16,821,807 | -- | -- | 197,604 | -- | (3,545,115) | 13,276,692 |
| Fujimak Corp. | 7,377,543 | -- | -- | -- | -- | (97,855) | 7,279,688 |
| G-Tekt Corp. | 46,772,794 | 825,260 | -- | 483,098 | -- | (7,228,534) | 40,369,520 |
| GameStop Corp. Class A | 144,087,996 | -- | -- | 7,599,367 | -- | (30,697,442) | 113,390,554 |
| Gendai Agency, Inc. | 4,074,587 | -- | -- | 81,448 | -- | (336,694) | 3,737,893 |
| GNC Holdings, Inc. Class A | 18,887,928 | -- | -- | -- | -- | (772,148) | 18,115,780 |
| Green Cross Co. Ltd. | 5,010,956 | 617,548 | -- | -- | -- | 7,525 | 5,636,029 |
| Guess?, Inc. | 130,557,856 | -- | 251,993 | 2,590,110 | (118,839) | (18,004,524) | 112,182,500 |
| Gwangju Shinsegae Co. Ltd. | 18,101,973 | -- | -- | 218,636 | -- | (683,324) | 17,418,649 |
| Hannong Chemicals, Inc. | 5,112,810 | -- | -- | 134,418 | -- | (203,629) | 4,909,181 |
| HF Co. | 1,873,299 | -- | -- | -- | -- | (322,938) | 1,550,361 |
| Hibbett Sports, Inc. | 26,399,385 | -- | -- | -- | -- | (7,603,483) | 18,795,902 |
| Houston Wire & Cable Co. | 10,788,000 | -- | -- | -- | -- | (2,332,905) | 8,455,095 |
| Jinro Distillers Co. Ltd. | 14,372,906 | -- | -- | 428,851 | -- | (691,775) | 13,681,131 |
| Kamei Corp. | 29,354,738 | -- | -- | 209,609 | -- | (7,029,285) | 22,325,453 |
| Lacroix SA | 11,886,806 | -- | -- | -- | -- | (2,449,354) | 9,437,452 |
| MegaStudy Co. Ltd. | 14,593,862 | -- | -- | -- | -- | (4,334,410) | 10,259,452 |
| MegaStudyEdu Co. Ltd. | 31,166,266 | -- | -- | 203,199 | -- | (1,007,568) | 30,158,698 |
| Miraial Co. Ltd. | 6,111,881 | -- | -- | 49,387 | -- | 167,669 | 6,279,550 |
| Nisshin Fudosan Co. Ltd. | 17,561,597 | -- | -- | -- | -- | (6,101,418) | 11,460,179 |
| Peyto Exploration & Development Corp. | 102,801,079 | -- | -- | 2,569,118 | -- | (38,621,337) | 64,179,742 |
| Sansei Co. Ltd. | 2,888,700 | -- | -- | -- | -- | 248,321 | 3,137,021 |
| Satsudora Holdings Co. Ltd. | 7,630,461 | -- | -- | -- | -- | (1,097,525) | 6,532,936 |
| TBK Co. Ltd. | 8,242,186 | -- | -- | 114,985 | -- | (1,632,133) | 6,610,053 |
| Tessi SA | 42,638,167 | -- | -- | -- | -- | (6,047,961) | 36,590,206 |
| Tokatsu Holdings Co. Ltd. | 1,202,880 | -- | -- | -- | -- | (101,205) | 1,101,675 |
| Treasure Factory Co. Ltd. | 6,322,944 | -- | 159,284 | 56,396 | (102,523) | 251,922 | 6,313,059 |
| Uchida Esco Co. Ltd. | 4,831,912 | -- | -- | -- | -- | (511,721) | 4,320,191 |
| Yorozu Corp. | 29,416,018 | -- | -- | 340,959 | -- | (3,844,221) | 25,571,797 |
| Zappallas, Inc. | 3,698,967 | -- | 335,331 | -- | (759,177) | 829,096 | 3,433,555 |
| | $1,080,970,120 | $9,891,224 | $143,745,518 | $17,525,653 | $(71,768,438) | $(165,728,487) | $709,618,901 |
Investment Valuation
The following is a summary of the inputs used, as of January 31, 2019, involving the Fund's assets and liabilities carried at fair value. The inputs or methodology used for valuing securities may not be an indication of the risk associated with investing in those securities. For more information on valuation inputs, and their aggregation into the levels used below, please refer to the Investment Valuation section in the accompanying Notes to Financial Statements.
| | Valuation Inputs at Reporting Date: |
| Description | Total | Level 1 | Level 2 | Level 3 |
| Investments in Securities: | | | | |
| Equities: | | | | |
| Communication Services | $805,367,231 | $799,585,459 | $5,781,772 | $-- |
| Consumer Discretionary | 2,133,441,294 | 2,081,310,684 | 46,944,198 | 5,186,412 |
| Consumer Staples | 502,760,114 | 472,901,065 | 29,859,049 | -- |
| Energy | 1,314,773,650 | 1,123,790,552 | 190,983,098 | -- |
| Financials | 2,107,970,944 | 1,854,813,315 | 253,157,629 | -- |
| Health Care | 2,627,598,244 | 2,593,521,033 | 34,077,211 | -- |
| Industrials | 1,288,446,237 | 1,256,248,664 | 32,172,638 | 24,935 |
| Information Technology | 843,140,303 | 778,141,944 | 62,927,192 | 2,071,167 |
| Materials | 254,489,517 | 247,544,176 | 6,945,341 | -- |
| Real Estate | 14,529,223 | 14,212,863 | 316,360 | -- |
| Utilities | 352,477,385 | 344,607,170 | 7,870,215 | -- |
| Money Market Funds | 2,351,150,829 | 2,351,150,829 | -- | -- |
| Total Investments in Securities: | $14,596,144,971 | $13,917,827,754 | $671,034,703 | $7,282,514 |
Other Information
Distribution of investments by country or territory of incorporation, as a percentage of Total Net Assets, is as follows (Unaudited):
| United States of America | 59.7% |
| Japan | 14.3% |
| Korea (South) | 3.5% |
| France | 3.1% |
| United Kingdom | 3.0% |
| China | 2.2% |
| Canada | 2.2% |
| Netherlands | 1.8% |
| Cayman Islands | 1.4% |
| Others (Individually Less Than 1%) | 8.8% |
| | 100.0% |
See accompanying notes which are an integral part of the financial statements.
Financial Statements
Statement of Assets and Liabilities
| | | January 31, 2019 (Unaudited) |
| Assets | | |
Investment in securities, at value (including securities loaned of $384,715,074) — See accompanying schedule:
Unaffiliated issuers (cost $9,350,402,043) | $11,535,375,241 | |
| Fidelity Central Funds (cost $2,351,135,219) | 2,351,150,829 | |
| Other affiliated issuers (cost $848,608,964) | 709,618,901 | |
| Total Investment in Securities (cost $12,550,146,226) | | $14,596,144,971 |
| Foreign currency held at value (cost $240,911) | | 240,911 |
| Receivable for investments sold | | 3,804,203 |
| Receivable for fund shares sold | | 6,818,722 |
| Dividends receivable | | 17,904,890 |
| Distributions receivable from Fidelity Central Funds | | 4,202,489 |
| Total assets | | 14,629,116,186 |
| Liabilities | | |
| Payable for investments purchased | $31,587,334 | |
| Other payables and accrued expenses | 228,486 | |
| Collateral on securities loaned | 398,439,883 | |
| Total liabilities | | 430,255,703 |
| Net Assets | | $14,198,860,483 |
| Net Assets consist of: | | |
| Paid in capital | | $12,000,170,406 |
| Total distributable earnings (loss) | | 2,198,690,077 |
| Net Assets | | $14,198,860,483 |
| Net Asset Value and Maximum Offering Price | | |
| Net Asset Value, offering price and redemption price per share ($14,198,860,483 ÷ 860,348,218 shares) | | $16.50 |
See accompanying notes which are an integral part of the financial statements.
Statement of Operations
| | | Six months ended January 31, 2019 (Unaudited) |
| Investment Income | | |
| Dividends (including $17,525,653 earned from other affiliated issuers) | | $144,564,428 |
| Income from Fidelity Central Funds | | 21,160,778 |
| Total income | | 165,725,206 |
| Expenses | | |
| Custodian fees and expenses | $456,839 | |
| Independent trustees' fees and expenses | 45,909 | |
| Legal | 1,681 | |
| Commitment fees | 18,988 | |
| Total expenses before reductions | 523,417 | |
| Expense reductions | (3,610) | |
| Total expenses after reductions | | 519,807 |
| Net investment income (loss) | | 165,205,399 |
| Realized and Unrealized Gain (Loss) | | |
| Net realized gain (loss) on: | | |
| Investment securities: | | |
| Unaffiliated issuers | 581,234,609 | |
| Fidelity Central Funds | 1,136 | |
| Other affiliated issuers | (71,768,438) | |
| Foreign currency transactions | (182,082) | |
| Total net realized gain (loss) | | 509,285,225 |
| Change in net unrealized appreciation (depreciation) on: | | |
| Investment securities: | | |
| Unaffiliated issuers (net of decrease in deferred foreign taxes of $560,627) | (1,186,414,788) | |
| Fidelity Central Funds | 1,845 | |
| Other affiliated issuers | (165,728,487) | |
| Assets and liabilities in foreign currencies | 155,576 | |
| Total change in net unrealized appreciation (depreciation) | | (1,351,985,854) |
| Net gain (loss) | | (842,700,629) |
| Net increase (decrease) in net assets resulting from operations | | $(677,495,230) |
See accompanying notes which are an integral part of the financial statements.
Statement of Changes in Net Assets
| | Six months ended January 31, 2019 (Unaudited) | Year ended July 31, 2018 |
| Increase (Decrease) in Net Assets | | |
| Operations | | |
| Net investment income (loss) | $165,205,399 | $305,110,590 |
| Net realized gain (loss) | 509,285,225 | 535,939,853 |
| Change in net unrealized appreciation (depreciation) | (1,351,985,854) | 915,826,608 |
| Net increase (decrease) in net assets resulting from operations | (677,495,230) | 1,756,877,051 |
| Distributions to shareholders | (1,141,976,315) | – |
| Distributions to shareholders from net investment income | – | (210,862,362) |
| Distributions to shareholders from net realized gain | – | (390,636,600) |
| Total distributions | (1,141,976,315) | (601,498,962) |
| Share transactions - net increase (decrease) | 1,498,286,839 | 954,341,403 |
| Total increase (decrease) in net assets | (321,184,706) | 2,109,719,492 |
| Net Assets | | |
| Beginning of period | 14,520,045,189 | 12,410,325,697 |
| End of period | $14,198,860,483 | $14,520,045,189 |
| Other Information | | |
| Undistributed net investment income end of period | | $183,602,555 |
See accompanying notes which are an integral part of the financial statements.
Financial Highlights
Fidelity Series Intrinsic Opportunities Fund
| | Six months ended (Unaudited) January 31, | Years endedJuly 31, | | | | |
| | 2019 | 2018 | 2017 | 2016 | 2015 | 2014 |
| Selected Per–Share Data | | | | | | |
| Net asset value, beginning of period | $18.79 | $17.30 | $14.80 | $15.58 | $14.47 | $12.78 |
| Income from Investment Operations | | | | | | |
| Net investment income (loss)A | .20 | .40 | .23 | .18 | .24B | .21 |
| Net realized and unrealized gain (loss) | (1.05) | 1.91 | 2.50 | (.16) | 1.49 | 1.84 |
| Total from investment operations | (.85) | 2.31 | 2.73 | .02 | 1.73 | 2.05 |
| Distributions from net investment income | (.42) | (.28) | (.19) | (.23) | (.21) | (.15) |
| Distributions from net realized gain | (1.02) | (.54) | (.04) | (.58) | (.42) | (.21) |
| Total distributions | (1.44) | (.82) | (.23) | (.80)C | (.62)D | (.36) |
| Net asset value, end of period | $16.50 | $18.79 | $17.30 | $14.80 | $15.58 | $14.47 |
| Total ReturnE,F | (4.67)% | 13.82% | 18.69% | .43% | 12.35% | 16.35% |
| Ratios to Average Net AssetsG,H | | | | | | |
| Expenses before reductions | .01%I | .01% | .52% | .79% | .82% | .81% |
| Expenses net of fee waivers, if any | .01%I | .01% | .52% | .79% | .82% | .81% |
| Expenses net of all reductions | .01%I | - %J | .52% | .79% | .82% | .81% |
| Net investment income (loss) | 2.33%I | 2.19% | 1.48% | 1.28% | 1.60%B | 1.55% |
| Supplemental Data | | | | | | |
| Net assets, end of period (000 omitted) | $14,198,860 | $14,520,045 | $4,948,389 | $2,776,843 | $2,619,363 | $2,479,629 |
| Portfolio turnover rateK | 34%I | 13% | 35%L | 14% | 10% | 16% |
A Calculated based on average shares outstanding during the period.
B Net investment income per share reflects a large, non-recurring dividend which amounted to $.06 per share. Excluding this non-recurring dividend, the ratio of net investment income (loss) to average net assets would have been 1.18%.
C Total distributions of $.80 per share is comprised of distributions from net investment income of $.228 and distributions from net realized gain of $.576 per share.
D Total distributions of $.62 per share is comprised of distributions from net investment income of $.206 and distributions from net realized gain of $.416 per share.
E Total returns for periods of less than one year are not annualized.
F Total returns would have been lower if certain expenses had not been reduced during the applicable periods shown.
G Fees and expenses of any underlying Fidelity Central Funds are not included in the Fund's expense ratio. The Fund indirectly bears its proportionate share of the expenses of any underlying Fidelity Central Funds.
H Expense ratios reflect operating expenses of the Fund. Expenses before reductions do not reflect amounts reimbursed by the investment adviser or reductions from brokerage service arrangements or reductions from other expense offset arrangements and do not represent the amount paid by the Fund during periods when reimbursements or reductions occur. Expense ratios before reductions for start-up periods may not be representative of longer-term operating periods. Expenses net of fee waivers reflect expenses after reimbursement by the investment adviser but prior to reductions from brokerage service arrangements or other expense offset arrangements. Expenses net of all reductions represent the net expenses paid by the Fund.
I Annualized
J Amount represents less than .005%.
K Amount does not include the portfolio activity of any underlying Fidelity Central Funds.
L Portfolio turnover rate excludes securities received or delivered in-kind.
See accompanying notes which are an integral part of the financial statements.
Notes to Financial Statements (Unaudited)
For the period ended January 31, 2019
1. Organization.
Fidelity Series Intrinsic Opportunities Fund (the Fund) is a fund of Fidelity Puritan Trust (the Trust) and is authorized to issue an unlimited number of shares. Shares of the Fund are only available for purchase by mutual funds for which Fidelity Management & Research Company (FMR) or an affiliate serves as an investment manager. The Trust is registered under the Investment Company Act of 1940, as amended (the 1940 Act), as an open-end management investment company organized as a Massachusetts business trust. Effective August 28, 2017, the Fund no longer offered Class F, and all outstanding shares of Class F were exchanged for shares of Series Intrinsic Opportunities.
2. Investments in Fidelity Central Funds.
The Fund invests in Fidelity Central Funds, which are open-end investment companies generally available only to other investment companies and accounts managed by the investment adviser and its affiliates. The Fund's Schedule of Investments lists each of the Fidelity Central Funds held as of period end, if any, as an investment of the Fund, but does not include the underlying holdings of each Fidelity Central Fund. As an Investing Fund, the Fund indirectly bears its proportionate share of the expenses of the underlying Fidelity Central Funds.
The Money Market Central Funds seek preservation of capital and current income and are managed by Fidelity Investments Money Management, Inc. (FIMM), an affiliate of the investment adviser. Annualized expenses of the Money Market Central Funds as of their most recent shareholder report date are less than .005%.
A complete unaudited list of holdings for each Fidelity Central Fund is available upon request or at the Securities and Exchange Commission (the SEC) website at www.sec.gov. In addition, the financial statements of the Fidelity Central Funds are available on the SEC website or upon request.
3. Significant Accounting Policies.
The Fund is an investment company and applies the accounting and reporting guidance of the Financial Accounting Standards Board (FASB) Accounting Standards Codification Topic 946 Financial Services – Investments Companies. The financial statements have been prepared in conformity with accounting principles generally accepted in the United States of America (GAAP), which require management to make certain estimates and assumptions at the date of the financial statements. Actual results could differ from those estimates. Subsequent events, if any, through the date that the financial statements were issued have been evaluated in the preparation of the financial statements. The following summarizes the significant accounting policies of the Fund:
Investment Valuation. Investments are valued as of 4:00 p.m. Eastern time on the last calendar day of the period. The Board of Trustees (the Board) has delegated the day to day responsibility for the valuation of the Fund's investments to the Fair Value Committee (the Committee) established by the Fund's investment adviser. In accordance with valuation policies and procedures approved by the Board, the Fund attempts to obtain prices from one or more third party pricing vendors or brokers to value its investments. When current market prices, quotations or currency exchange rates are not readily available or reliable, investments will be fair valued in good faith by the Committee, in accordance with procedures adopted by the Board. Factors used in determining fair value vary by investment type and may include market or investment specific events. The frequency with which these procedures are used cannot be predicted and they may be utilized to a significant extent. The Committee oversees the Fund's valuation policies and procedures and reports to the Board on the Committee's activities and fair value determinations. The Board monitors the appropriateness of the procedures used in valuing the Fund's investments and ratifies the fair value determinations of the Committee.
The Fund categorizes the inputs to valuation techniques used to value its investments into a disclosure hierarchy consisting of three levels as shown below:
- Level 1 – quoted prices in active markets for identical investments
- Level 2 – other significant observable inputs (including quoted prices for similar investments, interest rates, prepayment speeds, etc.)
- Level 3 – unobservable inputs (including the Fund's own assumptions based on the best information available)
Valuation techniques used to value the Fund's investments by major category are as follows:
Equity securities, including restricted securities, for which market quotations are readily available, are valued at the last reported sale price or official closing price as reported by a third party pricing vendor on the primary market or exchange on which they are traded and are categorized as Level 1 in the hierarchy. In the event there were no sales during the day or closing prices are not available, securities are valued at the last quoted bid price or may be valued using the last available price and are generally categorized as Level 2 in the hierarchy. For foreign equity securities, when market or security specific events arise, comparisons to the valuation of American Depositary Receipts (ADRs), futures contracts, Exchange-Traded Funds (ETFs) and certain indexes as well as quoted prices for similar securities may be used and would be categorized as Level 2 in the hierarchy. For equity securities, including restricted securities, where observable inputs are limited, assumptions about market activity and risk are used and these securities may be categorized as Level 3 in the hierarchy.
Investments in open-end mutual funds, including the Fidelity Central Funds, are valued at their closing net asset value (NAV) each business day and are categorized as Level 1 in the hierarchy.
Changes in valuation techniques may result in transfers in or out of an assigned level within the disclosure hierarchy. The aggregate value of investments by input level as of January 31, 2019 is included at the end of the Fund's Schedule of Investments.
Foreign Currency. The Fund may use foreign currency contracts to facilitate transactions in foreign-denominated securities. Gains and losses from these transactions may arise from changes in the value of the foreign currency or if the counterparties do not perform under the contracts' terms.
Foreign-denominated assets, including investment securities, and liabilities are translated into U.S. dollars at the exchange rates at period end. Purchases and sales of investment securities, income and dividends received and expenses denominated in foreign currencies are translated into U.S. dollars at the exchange rate in effect on the transaction date.
The effects of exchange rate fluctuations on investments are included with the net realized and unrealized gain (loss) on investment securities. Other foreign currency transactions resulting in realized and unrealized gain (loss) are disclosed separately.
Investment Transactions and Income. For financial reporting purposes, the Fund's investment holdings and NAV include trades executed through the end of the last business day of the period. The NAV per share for processing shareholder transactions is calculated as of the close of business of the New York Stock Exchange (NYSE), normally 4:00 p.m. Eastern time and includes trades executed through the end of the prior business day. Gains and losses on securities sold are determined on the basis of identified cost and include proceeds received from litigation. Dividend income is recorded on the ex-dividend date, except for certain dividends from foreign securities where the ex-dividend date may have passed, which are recorded as soon as the Fund is informed of the ex-dividend date. Non-cash dividends included in dividend income, if any, are recorded at the fair market value of the securities received. Income and capital gain distributions from Fidelity Central Funds, if any, are recorded on the ex-dividend date. Certain distributions received by the Fund represent a return of capital or capital gain. The Fund determines the components of these distributions subsequent to the ex-dividend date, based upon receipt of tax filings or other correspondence relating to the underlying investment. These distributions are recorded as a reduction of cost of investments and/or as a realized gain. Investment income is recorded net of foreign taxes withheld where recovery of such taxes is uncertain.
Expenses. Expenses directly attributable to a fund are charged to that fund. Expenses attributable to more than one fund are allocated among the respective funds on the basis of relative net assets or other appropriate methods. Expense estimates are accrued in the period to which they relate and adjustments are made when actual amounts are known.
Income Tax Information and Distributions to Shareholders. Each year, the Fund intends to qualify as a regulated investment company under Subchapter M of the Internal Revenue Code, including distributing substantially all of its taxable income and realized gains. As a result, no provision for U.S. Federal income taxes is required. The Fund files a U.S. federal tax return, in addition to state and local tax returns as required. The Fund's federal income tax returns are subject to examination by the Internal Revenue Service (IRS) for a period of three fiscal years after they are filed. State and local tax returns may be subject to examination for an additional fiscal year depending on the jurisdiction. Foreign taxes are provided for based on the Fund's understanding of the tax rules and rates that exist in the foreign markets in which it invests.
Distributions are declared and recorded on the ex-dividend date. Income and capital gain distributions are determined in accordance with income tax regulations, which may differ from GAAP.
Capital accounts within the financial statements are adjusted for permanent book-tax differences. These adjustments have no impact on net assets or the results of operations. Capital accounts are not adjusted for temporary book-tax differences which will reverse in a subsequent period.
Book-tax differences are primarily due to foreign currency transactions, certain foreign taxes, passive foreign investment companies (PFIC), partnerships and losses deferred due to wash sales.
As of period end, the cost and unrealized appreciation (depreciation) in securities, and derivatives if applicable, for federal income tax purposes were as follows:
| Gross unrealized appreciation | $2,935,836,455 |
| Gross unrealized depreciation | (924,393,710) |
| Net unrealized appreciation (depreciation) | $2,011,442,745 |
| Tax cost | $12,584,702,226 |
Restricted Securities. The Fund may invest in securities that are subject to legal or contractual restrictions on resale. These securities generally may be resold in transactions exempt from registration or to the public if the securities are registered. Disposal of these securities may involve time-consuming negotiations and expense, and prompt sale at an acceptable price may be difficult. Information regarding restricted securities is included at the end of the Fund's Schedule of Investments.
New Rule Issuance. During August 2018, the U.S. Securities and Exchange Commission issued Final Rule Release No. 33-10532, Disclosure Update and Simplification. This Final Rule includes amendments specific to registered investment companies that are intended to eliminate overlap in disclosure requirements between Regulation S-X and GAAP. In accordance with these amendments, certain line-items in the Fund's financial statements have been combined or removed for the current period as outlined in the table below.
| Financial Statement | Current Line-Item Presentation (As Applicable) | Prior Line-Item Presentation (As Applicable) |
| Statement of Assets and Liabilities | Total distributable earnings (loss) | Undistributed/Distributions in excess of/Accumulated net investment income (loss)
Accumulated/Undistributed net realized gain (loss)
Net unrealized appreciation (depreciation) |
| Statement of Changes in Net Assets | N/A - removed | Undistributed/Distributions in excess of/Accumulated net investment income (loss) end of period |
| Statement of Changes in Net Assets | Distributions to shareholders | Distributions to shareholders from net investment income
Distributions to shareholders from net realized gain |
| Distributions to Shareholders Note to Financial Statements | Distributions to shareholders | Distributions to shareholders from net investment income
Distributions to shareholders from net realized gain |
4. Purchases and Sales of Investments.
Purchases and sales of securities, other than short-term securities, aggregated $2,150,317,459 and $2,335,589,859, respectively.
5. Fees and Other Transactions with Affiliates.
Management Fee. Fidelity Management & Research Company (the investment adviser) and its affiliates provide the Fund with investment management related services for which the Fund does not pay a management fee. Under the management contract, the investment adviser or an affiliate pays all ordinary operating expenses of the Fund, except custody fees, fees and expenses of the independent Trustees, and certain miscellaneous expenses such as proxy and shareholder meeting expenses.
Brokerage Commissions. The Fund placed a portion of its portfolio transactions with brokerage firms which are affiliates of the investment adviser. Brokerage commissions are included in net realized gain (loss) and change in net unrealized appreciation (depreciation) in the Statement of Operations. The commissions paid to these affiliated firms were $39,588 for the period.
Interfund Trades. The Fund may purchase from or sell securities to other Fidelity Funds under procedures adopted by the Board. The procedures have been designed to ensure these interfund trades are executed in accordance with Rule 17a-7 of the 1940 Act. Interfund trades are included within the respective purchases and sales amounts shown in the Purchases and Sales of Investments note.
Other. During the period, the investment adviser reimbursed the Fund for certain losses in the amount of $18,809.
6. Committed Line of Credit.
The Fund participates with other funds managed by the investment adviser or an affiliate in a $4.25 billion credit facility (the "line of credit") to be utilized for temporary or emergency purposes to fund shareholder redemptions or for other short-term liquidity purposes. The Fund has agreed to pay commitment fees on its pro-rata portion of the line of credit, which amounted to $18,988 and is reflected in Commitment fees on the Statement of Operations. During the period, the Fund did not borrow on this line of credit.
7. Security Lending.
The Fund lends portfolio securities through a lending agent from time to time in order to earn additional income. For equity securities, a lending agent is used and may loan securities to certain qualified borrowers, including Fidelity Capital Markets (FCM), a broker-dealer affiliated with the Fund. On the settlement date of the loan, the Fund receives collateral (in the form of U.S. Treasury obligations, letters of credit and/or cash) against the loaned securities and maintains collateral in an amount not less than 100% of the market value of the loaned securities during the period of the loan. The market value of the loaned securities is determined at the close of business of the Fund and any additional required collateral is delivered to the Fund on the next business day. The Fund or borrower may terminate the loan at any time, and if the borrower defaults on its obligation to return the securities loaned because of insolvency or other reasons, the Fund may apply collateral received from the borrower against the obligation. The Fund may experience delays and costs in recovering the securities loaned. Any cash collateral received is invested in the Fidelity Securities Lending Cash Central Fund. The value of loaned securities and cash collateral at period end are disclosed on the Fund's Statement of Assets and Liabilities. The value of securities loaned to FCM at period end was $4,017,331. Security lending income represents the income earned on investing cash collateral, less rebates paid to borrowers and any lending agent fees associated with the loan, plus any premium payments received for lending certain types of securities. Security lending income is presented in the Statement of Operations as a component of income from Fidelity Central Funds. Total security lending income during the period amounted to $2,205,982, including $107,027 from securities loaned to FCM.
8. Expense Reductions.
Through arrangements with the Fund's custodian, credits realized as a result of certain uninvested cash balances were used to reduce the Fund's expenses. During the period, these credits reduced the Fund's custody expenses by $3,610.
9. Distributions to Shareholders.
Distributions to shareholders of each class were as follows:
| | Six months ended
January 31, 2019 | Year ended
July 31, 2018 |
| Distributions to shareholders | | |
| Series Intrinsic Opportunities | $1,141,976,315 | $– |
| Total | $1,141,976,315 | $– |
| From net investment income | | |
| Series Intrinsic Opportunities | $– | $210,862,362 |
| Total | $– | $210,862,362 |
| From net realized gain | | |
| Series Intrinsic Opportunities | $– | $390,636,600 |
| Total | $– | $390,636,600 |
10. Share Transactions.
Transactions for each class of shares were as follows:
| | Shares | Shares | Dollars | Dollars |
| | Six months ended January 31, 2019 | Year ended July 31, 2018 | Six months ended January 31, 2019 | Year ended July 31, 2018 |
| Series Intrinsic Opportunities | | | | |
| Shares sold | 31,227,458 | 511,169,556 | $543,528,236 | $8,888,451,603 |
| Reinvestment of distributions | 66,767,287 | 34,832,594 | 1,141,976,315 | 601,498,962 |
| Shares redeemed | (10,278,897) | (59,400,406) | (187,217,712) | (1,080,697,919) |
| Net increase (decrease) | 87,715,848 | 486,601,744 | $1,498,286,839 | $8,409,252,646 |
| Class F | | | | |
| Shares sold | – | 2,035,662 | $– | $35,190,119 |
| Shares redeemed | – | (432,801,551) | – | (7,490,101,362) |
| Net increase (decrease) | – | (430,765,889) | $– | $(7,454,911,243) |
11. Other.
The Fund's organizational documents provide former and current trustees and officers with a limited indemnification against liabilities arising in connection with the performance of their duties to the Fund. In the normal course of business, the Fund may also enter into contracts that provide general indemnifications. The Fund's maximum exposure under these arrangements is unknown as this would be dependent on future claims that may be made against the Fund. The risk of material loss from such claims is considered remote.
At the end of the period, mutual funds managed by the investment adviser or its affiliates were the owners of record of all of the outstanding shares of the Fund.
Shareholder Expense Example
As a shareholder of the Fund, you incur two types of costs: (1) transaction costs and (2) ongoing costs, including other Fund expenses. This Example is intended to help you understand your ongoing costs (in dollars) of investing in the Fund and to compare these costs with the ongoing costs of investing in other mutual funds.
The Example is based on an investment of $1,000 invested at the beginning of the period and held for the entire period (August 1, 2018 to January 31, 2019).
Actual Expenses
The first line of the accompanying table provides information about actual account values and actual expenses. You may use the information in this line, together with the amount you invested, to estimate the expenses that you paid over the period. Simply divide your account value by $1,000.00 (for example, an $8,600 account value divided by $1,000.00 = 8.6), then multiply the result by the number in the first line under the heading entitled "Expenses Paid During Period" to estimate the expenses you paid on your account during this period. In addition, the Fund, as a shareholder in the underlying Fidelity Central Funds, will indirectly bear its pro-rata share of the fees and expenses incurred by the underlying Fidelity Central Funds. These fees and expenses are not included in the Fund's annualized expense ratio used to calculate the expense estimate in the table below.
Hypothetical Example for Comparison Purposes
The second line of the accompanying table provides information about hypothetical account values and hypothetical expenses based on the Fund's actual expense ratio and an assumed rate of return of 5% per year before expenses, which is not the Fund's actual return. The hypothetical account values and expenses may not be used to estimate the actual ending account balance or expenses you paid for the period. You may use this information to compare the ongoing costs of investing in the Fund and other funds. To do so, compare this 5% hypothetical example with the 5% hypothetical examples that appear in the shareholder reports of the other funds. In addition, the Fund, as a shareholder in the underlying Fidelity Central Funds, will indirectly bear its pro-rata share of the fees and expenses incurred by the underlying Fidelity Central Funds. These fees and expenses are not included in the Fund's annualized expense ratio used to calculate the expense estimate in the table below.
Please note that the expenses shown in the table are meant to highlight your ongoing costs only and do not reflect any transaction costs. Therefore, the second line of the table is useful in comparing ongoing costs only, and will not help you determine the relative total costs of owning different funds.
| | Annualized Expense Ratio-A | Beginning
Account Value
August 1, 2018 | Ending
Account Value
January 31, 2019 | Expenses Paid
During Period-B
August 1, 2018
to January 31, 2019 |
| Series Intrinsic Opportunities | .01% | | | |
| Actual | | $1,000.00 | $953.30 | $.05 |
| Hypothetical-C | | $1,000.00 | $1,025.16 | $.05 |
A Annualized expense ratio reflects expenses net of applicable fee waivers.
B Expenses are equal to the Fund's annualized expense ratio, multiplied by the average account value over the period, multiplied by 184/365 (to reflect the one-half year period).
C 5% return per year before expenses
Board Approval of Investment Advisory Contracts and Management Fees
Fidelity Series Intrinsic Opportunities Fund
Each year, the Board of Trustees, including the Independent Trustees (together, the Board), votes on the renewal of the management contract with Fidelity Management & Research Company (FMR) and the sub-advisory agreements (together, the Advisory Contracts) for the fund. FMR and the sub-advisers are referred to herein as the Investment Advisers. The Board, assisted by the advice of fund counsel and Independent Trustees' counsel, requests and considers a broad range of information relevant to the renewal of the Advisory Contracts throughout the year.
The Board meets regularly and, at each of its meetings, covers an extensive agenda of topics and materials and considers factors that are relevant to its annual consideration of the renewal of the fund's Advisory Contracts, including the services and support provided to the fund and its shareholders. The Board has established various standing committees (Committees), each composed of and chaired by Independent Trustees with varying backgrounds, to which the Board has assigned specific subject matter responsibilities in order to enhance effective decision-making by the Board. The Board, acting directly and through its Committees, requests and receives information concerning the annual consideration of the renewal of the fund's Advisory Contracts. The Board also meets as needed to review matters specifically related to the Board's annual consideration of the renewal of the Advisory Contracts. Members of the Board may also meet with trustees of other Fidelity funds through joint ad hoc committees to discuss certain matters relevant to all of the Fidelity funds.
At its January 2019 meeting, the Board unanimously determined to renew the fund's Advisory Contracts. In considering whether to renew the Advisory Contracts for the fund, the Board considered all factors it believed relevant and reached a determination, with the assistance of fund counsel and Independent Trustees' counsel and through the exercise of its business judgment, that the renewal of the Advisory Contracts was in the best interests of the fund and its shareholders and the fact that no fee is payable under the management contract was fair and reasonable.
Nature, Extent, and Quality of Services Provided. The Board considered Fidelity's staffing as it relates to the fund, including the backgrounds of investment personnel of Fidelity, and also considered the fund's investment objective, strategies, and related investment philosophy. The Independent Trustees also had discussions with senior management of Fidelity's investment operations and investment groups. The Board considered the structure of the investment personnel compensation program and whether this structure provides appropriate incentives to act in the best interests of the fund.
Resources Dedicated to Investment Management and Support Services. The Board and the Fund Oversight and Research Committees reviewed the general qualifications and capabilities of Fidelity's investment staff, including its size, education, experience, and resources, as well as Fidelity's approach to recruiting, training, managing, and compensating investment personnel. The Board noted that Fidelity has continued to increase the resources devoted to non-U.S. offices, including expansion of Fidelity's global investment organization. The Board also noted that Fidelity's analysts have extensive resources, tools and capabilities that allow them to conduct sophisticated quantitative and fundamental analysis, as well as credit analysis of issuers, counterparties and guarantors. Further, the Board considered that Fidelity's investment professionals have sufficient access to global information and data so as to provide competitive investment results over time, and that those professionals also have access to sophisticated tools that permit them to assess portfolio construction and risk and performance attribution characteristics continuously, as well as to transmit new information and research conclusions rapidly around the world. Additionally, in its deliberations, the Board considered Fidelity's trading, risk management, compliance, and technology and operations capabilities and resources, which are integral parts of the investment management process.
Administrative Services. The Board considered (i) the nature, extent, quality, and cost of advisory and administrative services performed by the Investment Advisers and their affiliates under the Advisory Contracts and under separate agreements covering transfer agency, pricing and bookkeeping, and securities lending services for the fund; (ii) the nature and extent of the supervision of third party service providers, principally custodians, subcustodians, and pricing vendors; and (iii) the resources devoted to, and the record of compliance with, the fund's compliance policies and procedures. The Board also reviewed the allocation of fund brokerage, including allocations to brokers affiliated with the Investment Advisers, the use of brokerage commissions to pay fund expenses, and the use of "soft" commission dollars to pay for research services.
Investment Performance. The Board considered whether the fund has operated in accordance with its investment objective, as well as its record of compliance with its investment restrictions. The Board reviewed the fund's absolute investment performance, as well as the fund's relative investment performance, but did not consider performance to be a material factor in its decision to renew the fund's Advisory Contracts, as the fund is not publicly offered as a stand-alone investment product. In this regard, the Board noted that the fund is designed to offer an investment option for other investment companies managed by Fidelity and ultimately to enhance the performance of those investment companies.
Based on its review, the Board concluded that the nature, extent, and quality of services provided to the fund under the Advisory Contracts should continue to benefit the shareholders of the fund.
Competitiveness of Management Fee and Total Expense Ratio. The Board considered that the fund does not pay FMR a management fee for investment advisory services. The Board also noted that FMR or an affiliate undertakes to pay all operating expenses of the fund with certain exceptions.
In connection with the renewal of the Advisory Contracts, the Board also approved amendments to the management contract for the fund to clarify that the fund pays its non-operating expenses, including brokerage commissions and fees and expenses associated with the fund's securities lending program. The Board considered that the amendments would not change the services provided to the fund or the party responsible for making such payments under the current management contract.
The Board further considered that FMR has contractually agreed to reimburse the fund to the extent that total operating expenses, with certain exceptions, as a percentage of its average net assets, exceed 0.014% through September 30, 2020.
Based on its review, the Board considered that the fund does not pay a management fee and concluded that the total expense ratio of each class of the fund was reasonable in light of the services that the fund and its shareholders receive and the other factors considered.
Costs of the Services and Profitability. The Board considered the level of Fidelity's profits in respect of all the Fidelity funds.
PricewaterhouseCoopers LLP (PwC), auditor to Fidelity and certain Fidelity funds, has been engaged annually by the Board as part of the Board's assessment of Fidelity's profitability analysis. PwC's engagement includes the review and assessment of the methodologies used by Fidelity in determining the revenues and expenses attributable to Fidelity's mutual fund business, and completion of agreed-upon procedures in respect of the mathematical accuracy of the fund profitability information and its conformity to established allocation methodologies. After considering PwC's reports issued under the engagement and information provided by Fidelity, the Board concluded that while other allocation methods may also be reasonable, Fidelity's profitability methodologies are reasonable in all material respects.
The Board also reviewed Fidelity's non-fund businesses and potential indirect benefits such businesses may have received as a result of their association with Fidelity's mutual fund business (i.e., fall-out benefits) as well as cases where Fidelity's affiliates may benefit from the fund's business. The Board noted that changes to fall-out benefits year-over-year reflect business developments at Fidelity's various businesses.
The Board concluded that the costs of the services provided by and the profits realized by Fidelity in connection with the operation of the fund were not relevant to the renewal of the Advisory Contracts because the fund pays no advisory fees and FMR or an affiliate bears all expenses of the fund with certain exceptions.
Economies of Scale. The Board concluded that because the fund pays no advisory fees and FMR or an affiliate bears all expenses of the fund with certain exceptions, the realization of economies of scale was not a material factor in the Board's decision to renew the fund's Advisory Contracts.
Additional Information Requested by the Board. In order to develop fully the factual basis for consideration of the Fidelity funds' advisory contracts, the Board requested and received additional information on certain topics, including: (i) fund performance trends, in particular the underperformance of certain funds, and Fidelity's long-term strategies for certain funds; (ii) Fidelity's fund profitability methodology, profitability trends for certain funds, and the impact of certain factors on fund profitability results; (iii) metrics for evaluating index fund and ETF performance and information about ETF trading characteristics; (iv) the methodology with respect to the evaluation of competitive fund data and peer group classifications and fee comparisons; (v) the expense structures for different funds and classes; (vi) information regarding other accounts managed by Fidelity, including collective investment trusts; and (vii) Fidelity's philosophies and strategies for evaluating funds and classes with lower or declining asset levels.
Based on its evaluation of all of the conclusions noted above, and after considering all factors it believed relevant, the Board concluded that the advisory fee arrangements are fair and reasonable, and that the fund's Advisory Contracts should be renewed.
O2T-SANN-0319
1.951015.106
Fidelity Flex℠ Funds Fidelity Flex℠ Intrinsic Opportunities Fund
Semi-Annual Report January 31, 2019 |
|
Beginning on January 1, 2021, as permitted by regulations adopted by the Securities and Exchange Commission, paper copies of a fund’s shareholder reports will no longer be sent by mail, unless you specifically request paper copies of the reports from the fund or from your financial intermediary, such as a financial advisor, broker-dealer or bank. Instead, the reports will be made available on a website, and you will be notified by mail each time a report is posted and provided with a website link to access the report.
If you already elected to receive shareholder reports electronically, you will not be affected by this change and you need not take any action. You may elect to receive shareholder reports and other communications from a fund electronically, by contacting your financial intermediary. For Fidelity customers, visit Fidelity's web site or call Fidelity using the contact information listed below.
You may elect to receive all future reports in paper free of charge. If you wish to continue receiving paper copies of your shareholder reports, you may contact your financial intermediary or, if you are a Fidelity customer, visit Fidelity’s website, or call Fidelity at the applicable toll-free number listed below. Your election to receive reports in paper will apply to all funds held with the fund complex/your financial intermediary.
| Account Type | Website | Phone Number |
| Brokerage, Mutual Fund, or Annuity Contracts: | fidelity.com/mailpreferences | 1-800-343-3548 |
| Employer Provided Retirement Accounts: | netbenefits.fidelity.com/preferences (choose 'no' under Required Disclosures to continue to print) | 1-800-343-0860 |
| Advisor Sold Accounts Serviced Through Your Financial Intermediary: | Contact Your Financial Intermediary | Your Financial Intermediary's phone number |
| Advisor Sold Accounts Serviced by Fidelity: | institutional.fidelity.com | 1-877-208-0098 |
Contents
To view a fund's proxy voting guidelines and proxy voting record for the 12-month period ended June 30, visit http://www.fidelity.com/proxyvotingresults or visit the Securities and Exchange Commission's (SEC) web site at http://www.sec.gov.
You may also call 1-800-835-5092 to request a free copy of the proxy voting guidelines.
Standard & Poor's, S&P and S&P 500 are registered service marks of The McGraw-Hill Companies, Inc. and have been licensed for use by Fidelity Distributors Corporation.
Other third-party marks appearing herein are the property of their respective owners.
All other marks appearing herein are registered or unregistered trademarks or service marks of FMR LLC or an affiliated company. © 2019 FMR LLC. All rights reserved.
This report and the financial statements contained herein are submitted for the general information of the shareholders of the Fund. This report is not authorized for distribution to prospective investors in the Fund unless preceded or accompanied by an effective prospectus.
A fund files its complete schedule of portfolio holdings with the SEC for the first and third quarters of each fiscal year on Form N-Q. Forms N-Q are available on the SEC’s web site at http://www.sec.gov. A fund's Forms N-Q may be reviewed and copied at the SEC’s Public Reference Room in Washington, DC. Information regarding the operation of the SEC's Public Reference Room may be obtained by calling 1-800-SEC-0330.
For a complete list of a fund's portfolio holdings, view the most recent holdings listing, semiannual report, or annual report on Fidelity's web site at http://www.fidelity.com, http://www.institutional.fidelity.com, or http://www.401k.com, as applicable.
NOT FDIC INSURED •MAY LOSE VALUE •NO BANK GUARANTEE
Neither the Fund nor Fidelity Distributors Corporation is a bank.
Investment Summary (Unaudited)
Top Ten Stocks as of January 31, 2019
| | % of fund's net assets |
| Anthem, Inc. | 6.1 |
| Amgen, Inc. | 2.8 |
| Itochu Corp. | 2.6 |
| MetLife, Inc. | 2.5 |
| UnitedHealth Group, Inc. | 2.2 |
| Twenty-First Century Fox, Inc. Class A | 2.1 |
| The Western Union Co. | 2.0 |
| United Therapeutics Corp. | 1.8 |
| John David Group PLC | 1.6 |
| Humana, Inc. | 1.6 |
| | 25.3 |
Top Five Market Sectors as of January 31, 2019
| | % of fund's net assets |
| Health Care | 20.1 |
| Consumer Discretionary | 16.9 |
| Financials | 14.1 |
| Energy | 9.6 |
| Industrials | 8.8 |
Asset Allocation (% of fund's net assets)
| As of January 31, 2019 * |
| | Stocks | 90.1% |
| | Short-Term Investments and Net Other Assets (Liabilities) | 9.9% |

* Foreign investments - 40.2%
Schedule of Investments January 31, 2019 (Unaudited)
Showing Percentage of Net Assets
| Common Stocks - 90.0% | | | |
| | | Shares | Value |
| COMMUNICATION SERVICES - 6.2% | | | |
| Diversified Telecommunication Services - 0.6% | | | |
| Verizon Communications, Inc. | | 2,861 | $157,527 |
| Entertainment - 2.5% | | | |
| GAMEVIL, Inc. (a) | | 7 | 349 |
| Twenty-First Century Fox, Inc. Class A | | 10,165 | 501,236 |
| Viacom, Inc.: | | | |
| Class A | | 1,503 | 51,538 |
| Class B (non-vtg.) | | 1,128 | 33,186 |
| | | | 586,309 |
| Interactive Media & Services - 1.0% | | | |
| Kakaku.com, Inc. | | 911 | 15,924 |
| Yahoo! Japan Corp. | | 47,000 | 126,426 |
| YY, Inc. ADR (a) | | 1,175 | 81,580 |
| Zappallas, Inc. (a) | | 2,600 | 8,927 |
| | | | 232,857 |
| Media - 2.0% | | | |
| AMC Networks, Inc. Class A (a) | | 300 | 18,882 |
| Comcast Corp. Class A | | 6,954 | 254,308 |
| Corus Entertainment, Inc. Class B (non-vtg.) | | 273 | 1,157 |
| Discovery Communications, Inc. Class A (a) | | 4,510 | 127,994 |
| DISH Network Corp. Class A (a) | | 188 | 5,766 |
| DMS, Inc. | | 500 | 7,487 |
| F@N Communications, Inc. | | 400 | 2,023 |
| Gendai Agency, Inc. | | 1,500 | 6,596 |
| Hyundai HCN | | 4,802 | 17,763 |
| Ipsos SA | | 7 | 162 |
| Liberty Latin America Ltd. Class A (a) | | 5 | 87 |
| Multiplus SA | | 900 | 6,416 |
| Nippon BS Broadcasting Corp. | | 200 | 1,939 |
| Nippon Television Network Corp. | | 147 | 2,306 |
| Pico Far East Holdings Ltd. | | 6,000 | 2,233 |
| Proto Corp. | | 100 | 1,391 |
| SMG PLC | | 7 | 31 |
| Television Broadcasts Ltd. | | 2,700 | 5,048 |
| WOWOW INC. | | 400 | 10,403 |
| | | | 471,992 |
| Wireless Telecommunication Services - 0.1% | | | |
| Okinawa Cellular Telephone Co. | | 600 | 21,235 |
|
| TOTAL COMMUNICATION SERVICES | | | 1,469,920 |
|
| CONSUMER DISCRETIONARY - 16.9% | | | |
| Auto Components - 2.7% | | | |
| Adient PLC | | 237 | 4,678 |
| Cooper Tire & Rubber Co. | | 1,441 | 50,723 |
| Dongah Tire & Rubber Co. Ltd. | | 29 | 806 |
| Eagle Industry Co. Ltd. | | 395 | 4,649 |
| Fukoku Co. Ltd. | | 200 | 1,603 |
| G-Tekt Corp. | | 5,200 | 76,335 |
| Gentex Corp. | | 325 | 6,884 |
| Hi-Lex Corp. | | 463 | 8,829 |
| Hyundai Mobis | | 1,721 | 348,089 |
| IJT Technology Holdings Co. Ltd. | | 2,900 | 17,492 |
| INFAC Corp. | | 71 | 225 |
| Piolax, Inc. | | 1,100 | 22,429 |
| Seoyon Co. Ltd. | | 345 | 1,348 |
| Seoyon E-Hwa Co., Ltd. | | 1,646 | 7,709 |
| TBK Co. Ltd. | | 400 | 1,469 |
| TPR Co. Ltd. | | 1,600 | 34,078 |
| Yorozu Corp. | | 3,500 | 48,327 |
| | | | 635,673 |
| Automobiles - 0.8% | | | |
| Audi AG | | 50 | 44,868 |
| Fiat Chrysler Automobiles NV (a) | | 96 | 1,652 |
| Fiat Chrysler Automobiles NV (a) | | 2,377 | 40,588 |
| General Motors Co. | | 2,819 | 109,997 |
| | | | 197,105 |
| Distributors - 0.2% | | | |
| Chori Co. Ltd. | | 1,000 | 14,551 |
| Doshisha Co. Ltd. | | 800 | 12,251 |
| Harima-Kyowa Co. Ltd. | | 100 | 1,553 |
| Nakayamafuku Co. Ltd. | | 100 | 481 |
| Yagi & Co. Ltd. | | 700 | 10,167 |
| | | | 39,003 |
| Diversified Consumer Services - 0.5% | | | |
| Asante, Inc. | | 100 | 1,963 |
| Heian Ceremony Service Co. Ltd. | | 1,200 | 9,485 |
| Kukbo Design Co. Ltd. | | 14 | 181 |
| MegaStudy Co. Ltd. | | 2,610 | 24,635 |
| MegaStudyEdu Co. Ltd. | | 2,515 | 72,346 |
| Multicampus Co. Ltd. | | 35 | 1,642 |
| Tsukada Global Holdings, Inc. | | 2,700 | 14,972 |
| | | | 125,224 |
| Hotels, Restaurants & Leisure - 0.5% | | | |
| Hiday Hidaka Corp. | | 360 | 7,063 |
| Kura Corp. Ltd. | | 200 | 10,319 |
| Retail Food Group Ltd. (a) | | 2,910 | 645 |
| The Restaurant Group PLC | | 40,712 | 79,616 |
| Whitbread PLC | | 1 | 64 |
| Wyndham Destinations, Inc. | | 470 | 19,806 |
| Wyndham Hotels & Resorts, Inc. | | 3 | 147 |
| | | | 117,660 |
| Household Durables - 0.9% | | | |
| Ace Bed Co. Ltd. | | 600 | 13,322 |
| Cuckoo Holdings Co. Ltd. | | 100 | 11,237 |
| Emak SpA | | 409 | 613 |
| FJ Next Co. Ltd. | | 1,900 | 15,995 |
| Gree Electric Appliances, Inc. of Zhuhai Class A (a) | | 2,400 | 14,953 |
| Hamilton Beach Brands Holding Co.: | | | |
| Class A | | 104 | 2,719 |
| Class B (a) | | 104 | 2,719 |
| Helen of Troy Ltd. (a) | | 878 | 101,883 |
| Q.E.P. Co., Inc. | | 24 | 576 |
| Sanyo Housing Nagoya Co. Ltd. | | 1,700 | 14,327 |
| Taylor Morrison Home Corp. (a) | | 940 | 17,766 |
| Tupperware Brands Corp. | | 323 | 8,808 |
| | | | 204,918 |
| Internet & Direct Marketing Retail - 0.1% | | | |
| Aucnet, Inc. | | 100 | 802 |
| CROOZ, Inc. (a) | | 100 | 1,955 |
| eBay, Inc. | | 470 | 15,816 |
| Hyundai Home Shopping Network Corp. | | 7 | 648 |
| NS Shopping Co. Ltd. | | 30 | 365 |
| Trade Maine Group Ltd. | | 34 | 149 |
| | | | 19,735 |
| Leisure Products - 0.1% | | | |
| Accell Group NV | | 277 | 6,081 |
| Mars Group Holdings Corp. | | 1,100 | 21,561 |
| | | | 27,642 |
| Multiline Retail - 0.4% | | | |
| Grazziotin SA | | 200 | 1,481 |
| Lifestyle China Group Ltd. (a) | | 30,000 | 10,683 |
| Lifestyle International Holdings Ltd. | | 23,500 | 35,481 |
| Macy's, Inc. | | 940 | 24,722 |
| Treasure Factory Co. Ltd. | | 1,300 | 9,655 |
| Watts Co. Ltd. | | 600 | 3,905 |
| | | | 85,927 |
| Specialty Retail - 9.6% | | | |
| ABC-MART, Inc. | | 100 | 5,729 |
| Arc Land Sakamoto Co. Ltd. | | 900 | 11,295 |
| AT-Group Co. Ltd. | | 1,837 | 39,632 |
| AutoNation, Inc. (a) | | 658 | 25,498 |
| Beacon Lighting Group Ltd. | | 17 | 15 |
| Bed Bath & Beyond, Inc. | | 21,049 | 317,629 |
| Best Buy Co., Inc. | | 5,544 | 328,427 |
| DongAh Tire & Rubber Co. Ltd. (a) | | 39 | 424 |
| Dunelm Group PLC | | 244 | 2,312 |
| Fuji Corp. | | 1,699 | 31,960 |
| GameStop Corp. Class A (b) | | 18,792 | 213,101 |
| Genesco, Inc. (a) | | 564 | 25,482 |
| GNC Holdings, Inc. Class A (a)(b) | | 11,163 | 34,047 |
| Goldlion Holdings Ltd. | | 22,000 | 9,133 |
| Guess?, Inc. | | 10,828 | 211,254 |
| Handsman Co. Ltd. | | 1,700 | 18,307 |
| Hibbett Sports, Inc. (a) | | 2,162 | 35,327 |
| Hour Glass Ltd. | | 15,800 | 7,335 |
| JB Hi-Fi Ltd. (b) | | 1,281 | 20,830 |
| John David Group PLC | | 62,281 | 378,051 |
| K's Holdings Corp. | | 7,400 | 73,507 |
| Ku Holdings Co. Ltd. | | 900 | 6,453 |
| Lookers PLC | | 764 | 1,082 |
| Mandarake, Inc. | | 100 | 550 |
| Nafco Co. Ltd. | | 200 | 3,044 |
| Nitori Holdings Co. Ltd. | | 1,200 | 155,997 |
| Oriental Watch Holdings Ltd. | | 4,000 | 1,027 |
| Padini Holdings Bhd | | 1,800 | 1,630 |
| Sacs Bar Holdings, Inc. | | 800 | 8,028 |
| Sally Beauty Holdings, Inc. (a) | | 11,088 | 190,935 |
| Samse SA | | 65 | 10,267 |
| Silvano Fashion Group A/S | | 7 | 20 |
| Sports Direct International PLC (a) | | 68 | 248 |
| The Buckle, Inc. | | 514 | 8,928 |
| Tokatsu Holdings Co. Ltd. | | 100 | 441 |
| Truworths International Ltd. | | 228 | 1,377 |
| Vita Group Ltd. | | 18 | 15 |
| Vitamin Shoppe, Inc. (a) | | 752 | 3,474 |
| Williams-Sonoma, Inc. (b) | | 1,504 | 81,863 |
| | | | 2,264,674 |
| Textiles, Apparel & Luxury Goods - 1.1% | | | |
| Best Pacific International Holdings Ltd. | | 2,000 | 482 |
| Capri Holdings Ltd. (a) | | 3,571 | 151,696 |
| Embry Holdings Ltd. | | 1,000 | 296 |
| Ff Group (a)(c) | | 2,761 | 12,135 |
| Fossil Group, Inc. (a) | | 4,470 | 75,811 |
| Grendene SA | | 300 | 752 |
| Magni-Tech Industries Bhd | | 4,500 | 4,790 |
| Sitoy Group Holdings Ltd. | | 6,000 | 1,605 |
| Texwinca Holdings Ltd. | | 2,000 | 765 |
| Youngone Holdings Co. Ltd. | | 176 | 9,746 |
| Yue Yuen Industrial (Holdings) Ltd. | | 5,000 | 17,054 |
| | | | 275,132 |
|
| TOTAL CONSUMER DISCRETIONARY | | | 3,992,693 |
|
| CONSUMER STAPLES - 3.8% | | | |
| Beverages - 0.9% | | | |
| A.G. Barr PLC | | 968 | 9,573 |
| Britvic PLC | | 13,096 | 151,241 |
| C&C Group PLC | | 309 | 1,167 |
| Jinro Distillers Co. Ltd. | | 1,256 | 32,856 |
| Lucas Bols BV (d) | | 82 | 1,469 |
| Olvi PLC (A Shares) | | 68 | 2,576 |
| Spritzer Bhd | | 200 | 101 |
| Willamette Valley Vineyards, Inc. | | 3 | 21 |
| Yantai Changyu Pioneer Wine Co. Ltd. (B Shares) | | 11,500 | 22,246 |
| | | | 221,250 |
| Food & Staples Retailing - 1.5% | | | |
| Amsterdam Commodities NV | | 1,175 | 26,064 |
| Belc Co. Ltd. | | 100 | 4,361 |
| Dong Suh Companies, Inc. | | 1,200 | 20,711 |
| Genky DrugStores Co. Ltd. | | 800 | 19,103 |
| Halows Co. Ltd. | | 100 | 1,930 |
| J Sainsbury PLC | | 136 | 509 |
| Kroger Co. | | 2,587 | 73,290 |
| MARR SpA | | 1,410 | 33,730 |
| OM2 Network Co. Ltd. | | 200 | 1,970 |
| Retail Partners Co. Ltd. | | 1,200 | 12,306 |
| Satsudora Holdings Co. Ltd. | | 800 | 13,066 |
| Shoei Foods Corp. | | 100 | 2,415 |
| Tesco PLC | | 18,936 | 55,434 |
| Thai President Foods PCL | | 43 | 215 |
| United Natural Foods, Inc. (a) | | 761 | 9,969 |
| Valor Holdings Co. Ltd. | | 1,200 | 29,073 |
| Walgreens Boots Alliance, Inc. | | 748 | 54,050 |
| | | | 358,196 |
| Food Products - 1.0% | | | |
| Ajinomoto Malaysia Bhd | | 3,000 | 13,696 |
| B&G Foods, Inc. Class A (b) | | 470 | 12,530 |
| Bell AG | | 76 | 23,806 |
| Binggrea Co. Ltd. | | 10 | 616 |
| Carr's Group PLC | | 4,948 | 10,724 |
| Changshouhua Food Co. Ltd. | | 1,000 | 418 |
| Cranswick PLC | | 842 | 31,850 |
| Fresh Del Monte Produce, Inc. | | 1,405 | 44,932 |
| Ingredion, Inc. | | 94 | 9,306 |
| Kaneko Seeds Co. Ltd. | | 100 | 1,171 |
| Kaveri Seed Co. Ltd. | | 400 | 3,386 |
| Kwality Ltd. (a) | | 100 | 9 |
| Lassonde Industries, Inc. Class A (sub. vtg.) | | 120 | 18,768 |
| London Biscuits Bhd (a) | | 3,375 | 490 |
| Pickles Corp. | | 100 | 1,800 |
| Prima Meat Packers Ltd. | | 228 | 4,306 |
| S Foods, Inc. | | 600 | 21,620 |
| Select Harvests Ltd. | | 3,451 | 15,076 |
| Thai Wah PCL | | 300 | 77 |
| The J.M. Smucker Co. | | 63 | 6,607 |
| Toyo Sugar Refining Co. Ltd. | | 200 | 1,871 |
| Valsoia SpA | | 42 | 589 |
| | | | 223,648 |
| Personal Products - 0.1% | | | |
| Asaleo Care Ltd. | | 682 | 446 |
| Hengan International Group Co. Ltd. | | 4,133 | 32,332 |
| | | | 32,778 |
| Tobacco - 0.3% | | | |
| KT&G Corp. | | 556 | 49,531 |
| Scandinavian Tobacco Group A/S (d) | | 960 | 12,415 |
| | | | 61,946 |
|
| TOTAL CONSUMER STAPLES | | | 897,818 |
|
| ENERGY - 9.6% | | | |
| Energy Equipment & Services - 1.1% | | | |
| AKITA Drilling Ltd. Class A (non-vtg.) | | 170 | 437 |
| Carbo Ceramics, Inc. (a)(b) | | 4,436 | 17,877 |
| Diamond Offshore Drilling, Inc. (a)(b) | | 2,161 | 23,620 |
| Ensco PLC Class A | | 10,994 | 48,374 |
| Geospace Technologies Corp. (a) | | 1,122 | 16,864 |
| Liberty Oilfield Services, Inc. Class A | | 1,128 | 17,157 |
| National Oilwell Varco, Inc. | | 480 | 14,150 |
| Oceaneering International, Inc. (a) | | 998 | 15,659 |
| Prosafe ASA (a) | | 68 | 131 |
| Shinko Plantech Co. Ltd. | | 3,600 | 38,107 |
| Tecnicas Reunidas SA | | 291 | 7,438 |
| Tidewater, Inc. (a) | | 4 | 86 |
| Tidewater, Inc. warrants 11/14/24 (a) | | 50 | 19 |
| Transocean Ltd. (United States) (a) | | 7,599 | 65,123 |
| | | | 265,042 |
| Oil, Gas & Consumable Fuels - 8.5% | | | |
| Alvopetro Energy Ltd. (a) | | 1,900 | 463 |
| Baytex Energy Corp. (a) | | 9,397 | 15,805 |
| Birchcliff Energy Ltd. | | 7,203 | 17,213 |
| Bonavista Energy Corp. | | 34 | 32 |
| Bonterra Energy Corp. | | 617 | 2,756 |
| Chevron Corp. | | 1,128 | 129,325 |
| China Petroleum & Chemical Corp.: | | | |
| (H Shares) | | 400,667 | 335,036 |
| sponsored ADR (H Shares) | | 94 | 7,844 |
| CNOOC Ltd. sponsored ADR | | 188 | 31,451 |
| CNX Resources Corp. (a) | | 376 | 4,565 |
| ConocoPhillips Co. | | 4,713 | 319,023 |
| Contango Oil & Gas Co. (a) | | 170 | 643 |
| Denbury Resources, Inc. (a) | | 11,276 | 22,890 |
| Enagas SA | | 5,450 | 158,634 |
| Fuji Kosan Co. Ltd. | | 100 | 578 |
| Husky Energy, Inc. | | 10,324 | 122,494 |
| Imperial Oil Ltd. | | 1,504 | 42,672 |
| International Seaways, Inc. (a) | | 7 | 127 |
| Motor Oil (HELLAS) Corinth Refineries SA | | 581 | 14,464 |
| Murphy Oil Corp. | | 2,957 | 80,874 |
| NACCO Industries, Inc. Class A | | 219 | 7,464 |
| Oil & Natural Gas Corp. Ltd. | | 83,600 | 166,411 |
| Oil India Ltd. | | 200 | 473 |
| Peyto Exploration & Development Corp. | | 21,608 | 111,169 |
| San-Ai Oil Co. Ltd. | | 200 | 1,757 |
| Ship Finance International Ltd. (NY Shares) | | 7 | 85 |
| Southwestern Energy Co. (a) | | 12,592 | 55,027 |
| Thai Oil PCL (For. Reg.) | | 400 | 922 |
| Total SA sponsored ADR | | 5,692 | 311,523 |
| Tsakos Energy Navigation Ltd. | | 307 | 989 |
| Whiting Petroleum Corp. (a) | | 960 | 27,485 |
| World Fuel Services Corp. | | 462 | 11,499 |
| | | | 2,001,693 |
|
| TOTAL ENERGY | | | 2,266,735 |
|
| FINANCIALS - 14.1% | | | |
| Banks - 3.7% | | | |
| Bar Harbor Bankshares | | 282 | 6,748 |
| Central Valley Community Bancorp | | 17 | 336 |
| Citizens Financial Services, Inc. | | 8 | 457 |
| Erste Group Bank AG | | 3 | 104 |
| F & M Bank Corp. | | 214 | 6,484 |
| Gunma Bank Ltd. | | 9,615 | 42,370 |
| Hiroshima Bank Ltd. | | 1,916 | 11,082 |
| Mitsubishi UFJ Financial Group, Inc. | | 31,983 | 171,554 |
| NIBC Holding NV (d) | | 1,973 | 19,625 |
| Nordea Bank ABP | | 69 | 627 |
| OFG Bancorp | | 3,440 | 66,667 |
| Ogaki Kyoritsu Bank Ltd. | | 100 | 2,078 |
| San ju San Financial Group, Inc. | | 632 | 9,429 |
| Skandiabanken ASA (d) | | 1,441 | 13,071 |
| Sparebank 1 Oestlandet | | 1,879 | 18,848 |
| Sumitomo Mitsui Financial Group, Inc. | | 7,367 | 274,067 |
| The Keiyo Bank Ltd. | | 658 | 4,144 |
| The San-In Godo Bank Ltd. | | 2,775 | 20,101 |
| Unicaja Banco SA (d) | | 14,406 | 16,901 |
| Van Lanschot NV (Bearer) | | 55 | 1,291 |
| Wells Fargo & Co. | | 3,007 | 147,072 |
| Yamaguchi Financial Group, Inc. | | 3,238 | 32,908 |
| | | | 865,964 |
| Capital Markets - 0.5% | | | |
| ABG Sundal Collier ASA | | 1,023 | 530 |
| Brighthouse Financial, Inc. (a) | | 570 | 21,284 |
| Edify SA (a) | | 7 | 409 |
| Franklin Resources, Inc. | | 423 | 12,525 |
| Goldman Sachs Group, Inc. | | 188 | 37,226 |
| Morgan Stanley | | 940 | 39,762 |
| | | | 111,736 |
| Consumer Finance - 1.8% | | | |
| Aeon Credit Service (Asia) Co. Ltd. | | 24,000 | 21,731 |
| Credit Corp. Group Ltd. | | 36 | 575 |
| Discover Financial Services | | 1,879 | 126,814 |
| Santander Consumer U.S.A. Holdings, Inc. | | 1,410 | 26,875 |
| Synchrony Financial | | 8,457 | 254,048 |
| | | | 430,043 |
| Diversified Financial Services - 1.0% | | | |
| AXA Equitable Holdings, Inc. | | 846 | 15,685 |
| Fuyo General Lease Co. Ltd. | | 1,000 | 49,759 |
| IBJ Leasing Co. Ltd. | | 363 | 8,345 |
| NICE Holdings Co. Ltd. | | 156 | 2,510 |
| Ricoh Leasing Co. Ltd. | | 2,000 | 61,143 |
| Tokyo Century Corp. | | 2,500 | 116,594 |
| | | | 254,036 |
| Insurance - 6.8% | | | |
| AFLAC, Inc. | | 7,392 | 352,598 |
| ASR Nederland NV | | 1,879 | 79,275 |
| Db Insurance Co. Ltd. | | 2,561 | 160,001 |
| Genworth Financial, Inc. Class A (a) | | 27,646 | 133,807 |
| Hannover Reuck SE | | 108 | 15,563 |
| Hyundai Fire & Marine Insurance Co. Ltd. | | 900 | 30,218 |
| Kansas City Life Insurance Co. | | 1 | 36 |
| MetLife, Inc. | | 12,937 | 590,833 |
| National Western Life Group, Inc. | | 31 | 9,402 |
| NN Group NV | | 3,800 | 160,583 |
| Power Corp. of Canada (sub. vtg.) | | 470 | 9,343 |
| Prudential Financial, Inc. | | 418 | 38,515 |
| Sony Financial Holdings, Inc. | | 1,900 | 35,985 |
| | | | 1,616,159 |
| Mortgage Real Estate Investment Trusts - 0.0% | | | |
| Two Harbors Investment Corp. | | 51 | 744 |
| Thrifts & Mortgage Finance - 0.3% | | | |
| ASAX Co. Ltd. | | 1,500 | 7,657 |
| Genworth MI Canada, Inc. | | 1,080 | 36,749 |
| Genworth Mortgage Insurance Ltd. | | 7,805 | 12,595 |
| Hingham Institution for Savings | | 7 | 1,294 |
| | | | 58,295 |
|
| TOTAL FINANCIALS | | | 3,336,977 |
|
| HEALTH CARE - 20.1% | | | |
| Biotechnology - 7.2% | | | |
| AbbVie, Inc. | | 1,316 | 105,662 |
| Amgen, Inc. | | 3,558 | 665,737 |
| Biogen, Inc. (a) | | 752 | 251,003 |
| Celgene Corp. (a) | | 29 | 2,565 |
| Cell Biotech Co. Ltd. | | 360 | 9,158 |
| Essex Bio-Technology Ltd. | | 6,000 | 3,942 |
| Gilead Sciences, Inc. | | 3,414 | 239,014 |
| United Therapeutics Corp. (a) | | 3,696 | 426,260 |
| | | | 1,703,341 |
| Health Care Equipment & Supplies - 0.7% | | | |
| Ansell Ltd. | | 1,200 | 20,429 |
| Fukuda Denshi Co. Ltd. | | 1,200 | 80,973 |
| Medikit Co. Ltd. | | 100 | 5,049 |
| Nakanishi, Inc. | | 800 | 13,749 |
| Paramount Bed Holdings Co. Ltd. | | 100 | 4,186 |
| Riverstone Holdings Ltd. | | 100 | 83 |
| St.Shine Optical Co. Ltd. | | 2,000 | 37,535 |
| Value Added Technology Co. Ltd. | | 52 | 1,080 |
| Varex Imaging Corp. (a) | | 240 | 6,838 |
| | | | 169,922 |
| Health Care Providers & Services - 11.2% | | | |
| Anthem, Inc. | | 4,759 | 1,441,976 |
| CVS Health Corp. | | 2,864 | 187,735 |
| Humana, Inc. | | 1,200 | 370,788 |
| MEDNAX, Inc. (a) | | 832 | 30,044 |
| Quest Diagnostics, Inc. | | 470 | 41,055 |
| Saint-Care Holding Corp. | | 300 | 1,416 |
| Sigma Healthcare Ltd. | | 11,412 | 4,480 |
| Tokai Corp. | | 700 | 18,187 |
| Uchiyama Holdings Co. Ltd. | | 1,400 | 5,668 |
| UnitedHealth Group, Inc. | | 1,940 | 524,188 |
| Universal Health Services, Inc. Class B | | 132 | 17,494 |
| | | | 2,643,031 |
| Health Care Technology - 0.1% | | | |
| Pharmagest Interactive | | 451 | 28,289 |
| Life Sciences Tools & Services - 0.1% | | | |
| ICON PLC (a) | | 185 | 25,878 |
| Pharmaceuticals - 0.8% | | | |
| Apex Healthcare Bhd | | 500 | 1,016 |
| Biofermin Pharmaceutical Co. Ltd. | | 100 | 2,179 |
| Dawnrays Pharmaceutical Holdings Ltd. | | 28,534 | 5,683 |
| DongKook Pharmaceutical Co. Ltd. | | 114 | 5,780 |
| Genomma Lab Internacional SA de CV (a) | | 6,900 | 4,785 |
| Indivior PLC (a) | | 4,397 | 6,543 |
| Korea United Pharm, Inc. | | 90 | 1,893 |
| Lee's Pharmaceutical Holdings Ltd. | | 21,500 | 17,475 |
| Luye Pharma Group Ltd. (d) | | 1,500 | 1,121 |
| Nippon Chemiphar Co. Ltd. | | 100 | 2,984 |
| Novo Nordisk A/S Series B sponsored ADR | | 470 | 22,099 |
| PT Tempo Scan Pacific Tbk | | 300 | 33 |
| Sanofi SA sponsored ADR | | 351 | 15,251 |
| Stallergenes Greer PLC (a) | | 144 | 4,994 |
| Taro Pharmaceutical Industries Ltd. | | 658 | 62,602 |
| Towa Pharmaceutical Co. Ltd. | | 300 | 21,042 |
| Vetoquinol SA | | 7 | 413 |
| Vivimed Labs Ltd. (a) | | 200 | 70 |
| | | | 175,963 |
|
| TOTAL HEALTH CARE | | | 4,746,424 |
|
| INDUSTRIALS - 8.8% | | | |
| Aerospace & Defense - 0.0% | | | |
| Austal Ltd. | | 205 | 298 |
| SIFCO Industries, Inc. (a) | | 25 | 79 |
| The Lisi Group | | 3 | 95 |
| United Technologies Corp. | | 35 | 4,132 |
| | | | 4,604 |
| Air Freight & Logistics - 0.1% | | | |
| AIT Corp. | | 2,200 | 20,016 |
| CTI Logistics Ltd. | | 297 | 214 |
| Onelogix Group Ltd. | | 2,727 | 761 |
| SBS Co. Ltd. | | 300 | 4,387 |
| | | | 25,378 |
| Building Products - 0.2% | | | |
| InnoTec TSS AG | | 33 | 476 |
| Nihon Dengi Co. Ltd. | | 700 | 17,223 |
| Noda Corp. | | 700 | 4,364 |
| Sekisui Jushi Corp. | | 1,100 | 20,692 |
| | | | 42,755 |
| Commercial Services & Supplies - 0.2% | | | |
| Asia File Corp. Bhd | | 2,400 | 1,547 |
| Calian Technologies Ltd. | | 543 | 12,608 |
| Civeo Corp. (a) | | 7,070 | 17,887 |
| Matsuda Sangyo Co. Ltd. | | 100 | 1,309 |
| Mitie Group PLC | | 2,793 | 4,301 |
| VSE Corp. | | 579 | 18,893 |
| | | | 56,545 |
| Construction & Engineering - 0.3% | | | |
| Arcadis NV | | 1,200 | 15,548 |
| Boustead Projs. Pte Ltd. | | 1,700 | 1,143 |
| Boustead Singapore Ltd. | | 15,600 | 9,155 |
| Geumhwa PSC Co. Ltd. | | 1 | 28 |
| Meisei Industrial Co. Ltd. | | 1,100 | 7,109 |
| Monadelphous Group Ltd. | | 7 | 75 |
| Nippon Rietec Co. Ltd. | | 1,300 | 17,473 |
| Seikitokyu Kogyo Co. Ltd. | | 500 | 2,809 |
| Shinnihon Corp. | | 100 | 920 |
| Sumitomo Densetsu Co. Ltd. | | 155 | 2,532 |
| Toshiba Plant Systems & Services Corp. | | 790 | 14,825 |
| | | | 71,617 |
| Electrical Equipment - 0.4% | | | |
| Aichi Electric Co. Ltd. | | 100 | 2,658 |
| Aros Quality Group AB | | 2,048 | 33,996 |
| Canare Electric Co. Ltd. | | 130 | 2,186 |
| Eaton Corp. PLC | | 603 | 45,979 |
| Hammond Power Solutions, Inc. Class A | | 771 | 3,527 |
| Holding Co. ADMIE IPTO SA | | 17 | 31 |
| Regal Beloit Corp. | | 94 | 7,215 |
| Somfy SA | | 35 | 2,764 |
| | | | 98,356 |
| Industrial Conglomerates - 0.1% | | | |
| Lifco AB | | 191 | 7,641 |
| Mytilineos Holdings SA | | 2,041 | 19,203 |
| Nolato AB Series B | | 24 | 1,103 |
| Reunert Ltd. | | 205 | 1,090 |
| | | | 29,037 |
| Machinery - 0.7% | | | |
| Conrad Industries, Inc. (a) | | 1 | 14 |
| Daihatsu Diesel Manufacturing Co. Ltd. | | 900 | 5,462 |
| Daiwa Industries Ltd. | | 2,000 | 20,087 |
| Estic Corp. | | 100 | 6,904 |
| Fujimak Corp. | | 1,600 | 14,204 |
| Fukushima Industries Corp. | | 100 | 3,539 |
| Global Brass & Copper Holdings, Inc. | | 477 | 14,424 |
| Haitian International Holdings Ltd. | | 7,000 | 16,125 |
| Hy-Lok Corp. | | 68 | 1,192 |
| Ihara Science Corp. | | 463 | 6,376 |
| Luxfer Holdings PLC sponsored | | 3 | 60 |
| Momentum Group AB Class B | | 922 | 8,753 |
| Nakano Refrigerators Co. Ltd. | | 200 | 12,284 |
| Nansin Co. Ltd. | | 200 | 944 |
| Sakura Rubber Co. Ltd. (b) | | 100 | 4,783 |
| Sansei Co. Ltd. | | 1,000 | 3,691 |
| Semperit AG Holding (a) | | 614 | 9,839 |
| SIMPAC, Inc. | | 2,900 | 7,521 |
| Teikoku Sen-I Co. Ltd. | | 1,100 | 22,389 |
| | | | 158,591 |
| Marine - 0.1% | | | |
| Japan Transcity Corp. | | 2,443 | 9,510 |
| SITC International Holdings Co. Ltd. | | 14,000 | 12,854 |
| | | | 22,364 |
| Professional Services - 1.7% | | | |
| ABIST Co. Ltd. | | 332 | 9,769 |
| Akka Technologies SA | | 1,175 | 73,566 |
| Bertrandt AG | | 376 | 32,235 |
| Career Design Center Co. Ltd. | | 100 | 1,028 |
| Dun & Bradstreet Corp. | | 1,550 | 224,347 |
| McMillan Shakespeare Ltd. | | 4,842 | 54,027 |
| WDB Holdings Co. Ltd. | | 200 | 4,702 |
| | | | 399,674 |
| Road & Rail - 0.8% | | | |
| Autohellas SA | | 1,222 | 30,771 |
| Daqin Railway Co. Ltd. (A Shares) | | 77,400 | 98,760 |
| Hamakyorex Co. Ltd. | | 200 | 7,143 |
| Higashi Twenty One Co. Ltd. | | 100 | 441 |
| Kyushu Railway Co. | | 500 | 17,030 |
| Nikkon Holdings Co. Ltd. | | 132 | 3,318 |
| SENKO Co. Ltd. | | 200 | 1,625 |
| STEF-TFE Group | | 7 | 675 |
| Tohbu Network Co. Ltd. | | 100 | 936 |
| Utoc Corp. | | 3,100 | 14,515 |
| | | | 175,214 |
| Trading Companies & Distributors - 4.1% | | | |
| AerCap Holdings NV (a) | | 1,504 | 71,079 |
| Bergman & Beving AB (B Shares) | | 1,501 | 14,432 |
| Canox Corp. | | 800 | 6,537 |
| Green Cross Co. Ltd. | | 1,000 | 9,686 |
| HERIGE | | 41 | 1,089 |
| Houston Wire & Cable Co. (a) | | 3,238 | 20,302 |
| Howden Joinery Group PLC | | 102 | 676 |
| iMarketKorea, Inc. | | 7 | 50 |
| Itochu Corp. | | 34,154 | 624,445 |
| Kamei Corp. | | 3,907 | 41,536 |
| Meiwa Corp. | | 1,600 | 6,213 |
| Mitani Shoji Co. Ltd. | | 1,200 | 59,821 |
| Mitsubishi Corp. | | 2,400 | 70,089 |
| Pla Matels Corp. | | 200 | 986 |
| Rasa Corp. | | 100 | 774 |
| Shinsho Corp. | | 132 | 3,004 |
| Yuasa Trading Co. Ltd. | | 1,600 | 46,784 |
| | | | 977,503 |
| Transportation Infrastructure - 0.1% | | | |
| Isewan Terminal Service Co. Ltd. | | 200 | 1,340 |
| Qingdao Port International Co. Ltd. (a)(d) | | 22,583 | 14,068 |
| | | | 15,408 |
|
| TOTAL INDUSTRIALS | | | 2,077,046 |
|
| INFORMATION TECHNOLOGY - 6.2% | | | |
| Communications Equipment - 0.0% | | | |
| HF Co. | | 153 | 1,054 |
| Electronic Equipment & Components - 0.5% | | | |
| Daido Signal Co. Ltd. | | 1,000 | 4,710 |
| Dell Technologies, Inc. (a) | | 224 | 10,884 |
| Elematec Corp. | | 800 | 13,169 |
| HAGIAWARA ELECTRIC Co. Ltd. | | 300 | 7,816 |
| Hon Hai Precision Industry Co. Ltd. (Foxconn) | | 4,000 | 9,275 |
| Kingboard Chemical Holdings Ltd. | | 10,500 | 36,947 |
| Lacroix SA | | 163 | 4,086 |
| Makus, Inc. | | 205 | 802 |
| Orbotech Ltd. (a) | | 141 | 8,648 |
| PAX Global Technology Ltd. | | 2,000 | 877 |
| Riken Kieki Co. Ltd. | | 1,000 | 18,205 |
| Simplo Technology Co. Ltd. | | 2,000 | 14,690 |
| | | | 130,109 |
| IT Services - 3.5% | | | |
| Amdocs Ltd. | | 2,349 | 131,262 |
| Avant Corp. | | 200 | 2,534 |
| Cielo SA | | 1,400 | 4,583 |
| Computer Services, Inc. | | 3 | 168 |
| Data#3 Ltd. | | 341 | 397 |
| E-Credible Co. Ltd. | | 104 | 1,501 |
| eClerx Services Ltd. (a) | | 300 | 4,542 |
| Estore Corp. | | 200 | 1,384 |
| Future Corp. | | 1,400 | 19,305 |
| Korea Information & Communication Co. Ltd. (a) | | 780 | 6,409 |
| Neurones | | 7 | 158 |
| Persistent Systems Ltd. | | 300 | 2,546 |
| Shinsegae Information & Communication Co. Ltd. | | 19 | 2,118 |
| Sopra Steria Group | | 893 | 90,254 |
| Tessi SA (a) | | 375 | 68,676 |
| The Western Union Co. | | 25,537 | 466,050 |
| Wipro Ltd. | | 3,100 | 16,129 |
| | | | 818,016 |
| Semiconductors & Semiconductor Equipment - 0.1% | | | |
| e-LITECOM Co. Ltd. | | 34 | 204 |
| Miraial Co. Ltd. | | 1,500 | 15,699 |
| Phison Electronics Corp. | | 1,000 | 8,300 |
| | | | 24,203 |
| Software - 0.3% | | | |
| eBase Co. Ltd. | | 200 | 3,085 |
| Ebix, Inc. | | 564 | 32,216 |
| InfoVine Co. Ltd. | | 43 | 914 |
| Jastec Co. Ltd. | | 100 | 821 |
| KPIT Cummins Infosystems Ltd. | | 3,700 | 5,960 |
| KPIT Engineering Ltd. (a)(c) | | 3,700 | 4,257 |
| KSK Co., Ltd. | | 100 | 1,541 |
| Micro Focus International PLC sponsored ADR | | 1,054 | 20,131 |
| Uchida Esco Co. Ltd. | | 96 | 1,315 |
| Zensar Technologies Ltd. | | 1,000 | 3,166 |
| | | | 73,406 |
| Technology Hardware, Storage & Peripherals - 1.8% | | | |
| Hewlett Packard Enterprise Co. | | 8,316 | 129,646 |
| HP, Inc. | | 12,937 | 285,002 |
| TPV Technology Ltd. | | 22,000 | 3,058 |
| | | | 417,706 |
|
| TOTAL INFORMATION TECHNOLOGY | | | 1,464,494 |
|
| MATERIALS - 1.7% | | | |
| Chemicals - 1.1% | | | |
| C. Uyemura & Co. Ltd. | | 300 | 17,572 |
| CF Industries Holdings, Inc. | | 499 | 21,781 |
| Chokwang Paint Ltd. | | 34 | 230 |
| Daishin-Chemical Co. Ltd. | | 603 | 6,925 |
| Fuso Chemical Co. Ltd. | | 400 | 7,822 |
| K&S AG | | 1,504 | 29,231 |
| KPX Green Chemical Co. Ltd. | | 34 | 109 |
| Kuriyama Holdings Corp. | | 200 | 1,337 |
| LyondellBasell Industries NV Class A | | 279 | 24,265 |
| Nippon Soda Co. Ltd. | | 250 | 6,330 |
| NOF Corp. | | 400 | 13,165 |
| Nutrien Ltd. | | 288 | 14,920 |
| Scientex Bhd | | 7,100 | 15,254 |
| T&K Toka Co. Ltd. | | 600 | 5,354 |
| Tae Kyung Industrial Co. Ltd. | | 614 | 3,102 |
| The Mosaic Co. | | 188 | 6,069 |
| Toho Acetylene Co. Ltd. | | 200 | 2,479 |
| Yara International ASA | | 1,597 | 65,914 |
| Yip's Chemical Holdings Ltd. | | 2,000 | 631 |
| Yung Chi Paint & Varnish Manufacturing Co. Ltd. | | 6,000 | 14,190 |
| | | | 256,680 |
| Construction Materials - 0.0% | | | |
| Ibstock PLC (d) | | 334 | 1,063 |
| Mitani Sekisan Co. Ltd. | | 400 | 9,397 |
| | | | 10,460 |
| Containers & Packaging - 0.1% | | | |
| Mayr-Melnhof Karton AG | | 197 | 25,931 |
| The Pack Corp. | | 200 | 5,290 |
| | | | 31,221 |
| Metals & Mining - 0.5% | | | |
| Ausdrill Ltd. | | 38,708 | 35,452 |
| Castings PLC | | 51 | 263 |
| Chubu Steel Plate Co. Ltd. | | 300 | 1,677 |
| CI Resources Ltd. | | 16 | 16 |
| CK-SAN-ETSU Co. Ltd. | | 200 | 4,344 |
| Compania de Minas Buenaventura SA sponsored ADR | | 481 | 7,528 |
| Mount Gibson Iron Ltd. | | 47,938 | 22,476 |
| Orvana Minerals Corp. (a) | | 34 | 5 |
| Pacific Metals Co. Ltd. | | 1,300 | 34,754 |
| Rio Tinto PLC sponsored ADR (b) | | 123 | 6,921 |
| Teck Resources Ltd. Class B (sub. vtg.) | | 7 | 170 |
| | | | 113,606 |
|
| TOTAL MATERIALS | | | 411,967 |
|
| REAL ESTATE - 0.2% | | | |
| Equity Real Estate Investment Trusts (REITs) - 0.1% | | | |
| Piedmont Office Realty Trust, Inc. Class A | | 726 | 14,055 |
| Sabra Health Care REIT, Inc. | | 70 | 1,438 |
| | | | 15,493 |
| Real Estate Management & Development - 0.1% | | | |
| Leopalace21 Corp. | | 900 | 4,255 |
| Nisshin Fudosan Co. Ltd. | | 5,400 | 21,714 |
| | | | 25,969 |
|
| TOTAL REAL ESTATE | | | 41,462 |
|
| UTILITIES - 2.4% | | | |
| Electric Utilities - 2.0% | | | |
| EVN AG | | 7 | 113 |
| Exelon Corp. | | 3,571 | 170,551 |
| Fjordkraft Holding ASA (a)(d) | | 1,561 | 6,663 |
| PG&E Corp. (a) | | 658 | 8,554 |
| PPL Corp. | | 9,021 | 282,538 |
| Public Power Corp. of Greece (a) | | 17 | 25 |
| | | | 468,444 |
| Gas Utilities - 0.4% | | | |
| Busan City Gas Co. Ltd. | | 210 | 7,438 |
| China Resource Gas Group Ltd. | | 4,000 | 15,740 |
| GAIL India Ltd. (a) | | 10,000 | 46,808 |
| K&O Energy Group, Inc. | | 100 | 1,327 |
| Seoul City Gas Co. Ltd. | | 176 | 13,227 |
| YESCO Co. Ltd. | | 576 | 21,385 |
| | | | 105,925 |
| Water Utilities - 0.0% | | | |
| Manila Water Co., Inc. | | 300 | 158 |
|
| TOTAL UTILITIES | | | 574,527 |
|
| TOTAL COMMON STOCKS | | | |
| (Cost $20,928,948) | | | 21,280,063 |
|
| Nonconvertible Preferred Stocks - 0.1% | | | |
| INDUSTRIALS - 0.0% | | | |
| Industrial Conglomerates - 0.0% | | | |
| Steel Partners Holdings LP Series A, 6.00% | | 100 | 2,222 |
| Machinery - 0.0% | | | |
| Danieli & C. Officine Meccaniche SpA | | 7 | 114 |
|
| TOTAL INDUSTRIALS | | | 2,336 |
|
| MATERIALS - 0.1% | | | |
| Construction Materials - 0.1% | | | |
| Buzzi Unicem SpA (Risparmio Shares) | | 966 | 11,764 |
| UTILITIES - 0.0% | | | |
| Electric Utilities - 0.0% | | | |
| Companhia Paranaense de Energia-Copel (PN-B) | | 800 | 7,745 |
| TOTAL NONCONVERTIBLE PREFERRED STOCKS | | | |
| (Cost $22,152) | | | 21,845 |
|
| Money Market Funds - 11.3% | | | |
| Fidelity Cash Central Fund, 2.43% (e) | | 2,270,540 | 2,270,994 |
| Fidelity Securities Lending Cash Central Fund 2.43% (e)(f) | | 413,679 | 413,721 |
| TOTAL MONEY MARKET FUNDS | | | |
| (Cost $2,684,715) | | | 2,684,715 |
| TOTAL INVESTMENT IN SECURITIES - 101.4% | | | |
| (Cost $23,635,815) | | | 23,986,623 |
| NET OTHER ASSETS (LIABILITIES) - (1.4)% | | | (332,658) |
| NET ASSETS - 100% | | | $23,653,965 |
Legend
(a) Non-income producing
(b) Security or a portion of the security is on loan at period end.
(c) Level 3 security
(d) Security exempt from registration under Rule 144A of the Securities Act of 1933. These securities may be resold in transactions exempt from registration, normally to qualified institutional buyers. At the end of the period, the value of these securities amounted to $86,396 or 0.4% of net assets.
(e) Affiliated fund that is generally available only to investment companies and other accounts managed by Fidelity Investments. The rate quoted is the annualized seven-day yield of the fund at period end. A complete unaudited listing of the fund's holdings as of its most recent quarter end is available upon request. In addition, each Fidelity Central Fund's financial statements are available on the SEC's website or upon request.
(f) Investment made with cash collateral received from securities on loan.
Affiliated Central Funds
Information regarding fiscal year to date income earned by the Fund from investments in Fidelity Central Funds is as follows:
| Fund | Income earned |
| Fidelity Cash Central Fund | $30,625 |
| Fidelity Securities Lending Cash Central Fund | 1,895 |
| Total | $32,520 |
Amounts in the income column in the above table include any capital gain distributions from underlying funds, which are presented in the corresponding line-item in the Statement of Operations, if applicable.
Investment Valuation
The following is a summary of the inputs used, as of January 31, 2019, involving the Fund's assets and liabilities carried at fair value. The inputs or methodology used for valuing securities may not be an indication of the risk associated with investing in those securities. For more information on valuation inputs, and their aggregation into the levels used below, please refer to the Investment Valuation section in the accompanying Notes to Financial Statements.
| | Valuation Inputs at Reporting Date: |
| Description | Total | Level 1 | Level 2 | Level 3 |
| Investments in Securities: | | | | |
| Equities: | | | | |
| Communication Services | $1,469,920 | $1,462,639 | $7,281 | $-- |
| Consumer Discretionary | 3,992,693 | 3,904,032 | 76,526 | 12,135 |
| Consumer Staples | 897,818 | 809,634 | 88,184 | -- |
| Energy | 2,266,735 | 1,931,699 | 335,036 | -- |
| Financials | 3,336,977 | 2,869,625 | 467,352 | -- |
| Health Care | 4,746,424 | 4,680,668 | 65,756 | -- |
| Industrials | 2,079,382 | 2,036,335 | 43,047 | -- |
| Information Technology | 1,464,494 | 1,387,090 | 73,147 | 4,257 |
| Materials | 423,731 | 408,910 | 14,821 | -- |
| Real Estate | 41,462 | 41,462 | -- | -- |
| Utilities | 582,272 | 566,532 | 15,740 | -- |
| Money Market Funds | 2,684,715 | 2,684,715 | -- | -- |
| Total Investments in Securities: | $23,986,623 | $22,783,341 | $1,186,890 | $16,392 |
Other Information
Distribution of investments by country or territory of incorporation, as a percentage of Total Net Assets, is as follows (Unaudited):
| United States of America | 59.8% |
| Japan | 14.4% |
| Korea (South) | 3.4% |
| United Kingdom | 3.4% |
| France | 2.6% |
| China | 2.1% |
| Netherlands | 1.9% |
| Canada | 1.9% |
| Cayman Islands | 1.5% |
| India | 1.0% |
| Others (Individually Less Than 1%) | 8.0% |
| | 100.0% |
See accompanying notes which are an integral part of the financial statements.
Financial Statements
Statement of Assets and Liabilities
| | | January 31, 2019 (Unaudited) |
| Assets | | |
Investment in securities, at value (including securities loaned of $406,929) — See accompanying schedule:
Unaffiliated issuers (cost $20,951,100) | $21,301,908 | |
| Fidelity Central Funds (cost $2,684,715) | 2,684,715 | |
| Total Investment in Securities (cost $23,635,815) | | $23,986,623 |
| Cash | | 34,122 |
| Foreign currency held at value (cost $456) | | 462 |
| Receivable for investments sold | | 1,148 |
| Receivable for fund shares sold | | 9,715 |
| Dividends receivable | | 35,580 |
| Distributions receivable from Fidelity Central Funds | | 161 |
| Total assets | | 24,067,811 |
| Liabilities | | |
| Payable for fund shares redeemed | $133 | |
| Collateral on securities loaned | 413,713 | |
| Total liabilities | | 413,846 |
| Net Assets | | $23,653,965 |
| Net Assets consist of: | | |
| Paid in capital | | $23,011,705 |
| Total distributable earnings (loss) | | 642,260 |
| Net Assets, for 2,076,885 shares outstanding | | $23,653,965 |
| Net Asset Value, offering price and redemption price per share ($23,653,965 ÷ 2,076,885 shares) | | $11.39 |
See accompanying notes which are an integral part of the financial statements.
Statement of Operations
| | | Six months ended January 31, 2019 (Unaudited) |
| Investment Income | | |
| Dividends | | $280,726 |
| Income from Fidelity Central Funds | | 32,520 |
| Total income | | 313,246 |
| Expenses | | |
| Independent trustees' fees and expenses | $91 | |
| Commitment fees | 38 | |
| Total expenses | | 129 |
| Net investment income (loss) | | 313,117 |
| Realized and Unrealized Gain (Loss) | | |
| Net realized gain (loss) on: | | |
| Investment securities: | | |
| Unaffiliated issuers (net of foreign taxes of $328) | 392,868 | |
| Fidelity Central Funds | 23 | |
| Foreign currency transactions | (112) | |
| Total net realized gain (loss) | | 392,779 |
| Change in net unrealized appreciation (depreciation) on: | | |
| Investment securities: | | |
| Unaffiliated issuers | (2,070,915) | |
| Fidelity Central Funds | 3 | |
| Assets and liabilities in foreign currencies | 271 | |
| Total change in net unrealized appreciation (depreciation) | | (2,070,641) |
| Net gain (loss) | | (1,677,862) |
| Net increase (decrease) in net assets resulting from operations | | $(1,364,745) |
See accompanying notes which are an integral part of the financial statements.
Statement of Changes in Net Assets
| | Six months ended January 31, 2019 (Unaudited) | Year ended July 31, 2018 |
| Increase (Decrease) in Net Assets | | |
| Operations | | |
| Net investment income (loss) | $313,117 | $464,592 |
| Net realized gain (loss) | 392,779 | 123,976 |
| Change in net unrealized appreciation (depreciation) | (2,070,641) | 2,022,133 |
| Net increase (decrease) in net assets resulting from operations | (1,364,745) | 2,610,701 |
| Distributions to shareholders | (762,655) | – |
| Distributions to shareholders from net investment income | – | (160,531) |
| Distributions to shareholders from net realized gain | – | (66,106) |
| Total distributions | (762,655) | (226,637) |
| Share transactions | | |
| Proceeds from sales of shares | 3,153,459 | 29,809,685 |
| Reinvestment of distributions | 762,655 | 226,637 |
| Cost of shares redeemed | (8,771,815) | (9,808,434) |
| Net increase (decrease) in net assets resulting from share transactions | (4,855,701) | 20,227,888 |
| Total increase (decrease) in net assets | (6,983,101) | 22,611,952 |
| Net Assets | | |
| Beginning of period | 30,637,066 | 8,025,114 |
| End of period | $23,653,965 | $30,637,066 |
| Other Information | | |
| Undistributed net investment income end of period | | $294,258 |
| Shares | | |
| Sold | 267,229 | 2,563,049 |
| Issued in reinvestment of distributions | 66,096 | 19,832 |
| Redeemed | (755,327) | (823,981) |
| Net increase (decrease) | (422,002) | 1,758,900 |
See accompanying notes which are an integral part of the financial statements.
Financial Highlights
Fidelity Flex Intrinsic Opportunities Fund
| | Six months ended (Unaudited) January 31, | Years endedJuly 31, | |
| | 2019 | 2018 | 2017 A |
| Selected Per–Share Data | | | |
| Net asset value, beginning of period | $12.26 | $10.84 | $10.00 |
| Income from Investment Operations | | | |
| Net investment income (loss)B | .13 | .26 | .08 |
| Net realized and unrealized gain (loss) | (.67) | 1.34 | .76 |
| Total from investment operations | (.54) | 1.60 | .84 |
| Distributions from net investment income | (.28) | (.13) | – |
| Distributions from net realized gain | (.05) | (.05) | – |
| Total distributions | (.33) | (.18) | – |
| Net asset value, end of period | $11.39 | $12.26 | $10.84 |
| Total ReturnC,D | (4.42)% | 14.86% | 8.40% |
| Ratios to Average Net AssetsE,F | | | |
| Expenses before reductionsG | - %H | -% | - %H |
| Expenses net of fee waivers, if anyG | - %H | -% | - %H |
| Expenses net of all reductionsG | - %H | -% | - %H |
| Net investment income (loss) | 2.28%H | 2.21% | 1.97%H |
| Supplemental Data | | | |
| Net assets, end of period (000 omitted) | $23,654 | $30,637 | $8,025 |
| Portfolio turnover rateI | 31%H | 6% | 9%J |
A For the period March 8, 2017 (commencement of operations) to July 31, 2017.
B Calculated based on average shares outstanding during the period.
C Total returns for periods of less than one year are not annualized.
D Total returns would have been lower if certain expenses had not been reduced during the applicable periods shown.
E Fees and expenses of any underlying Fidelity Central Funds are not included in the Fund's expense ratio. The Fund indirectly bears its proportionate share of the expenses of any underlying Fidelity Central Funds.
F Expense ratios reflect operating expenses of the Fund. Expenses before reductions do not reflect amounts reimbursed by the investment adviser or reductions from expense offset arrangements and do not represent the amount paid by the Fund during periods when reimbursements or reductions occur. Expenses net of fee waivers reflect expenses after reimbursement by the investment adviser but prior to reductions from expense offset arrangements. Expenses net of all reductions represent the net expenses paid by the Fund.
G Amount represents less than .005%.
H Annualized
I Amount does not include the portfolio activity of any underlying Fidelity Central Funds.
J Amount not annualized.
See accompanying notes which are an integral part of the financial statements.
Notes to Financial Statements (Unaudited)
For the period ended January 31, 2019
1. Organization.
Fidelity Flex Intrinsic Opportunities Fund (the Fund) is a fund of Fidelity Puritan Trust (the Trust) and is authorized to issue an unlimited number of shares. Share transactions on the Statement of Changes in Net Assets may contain exchanges between affiliated funds. The Trust is registered under the Investment Company Act of 1940, as amended (the 1940 Act), as an open-end management investment company organized as a Massachusetts business trust. The Fund is available only to certain fee-based accounts offered by Fidelity.
2. Investments in Fidelity Central Funds.
The Fund invests in Fidelity Central Funds, which are open-end investment companies generally available only to other investment companies and accounts managed by the investment adviser and its affiliates. The Fund's Schedule of Investments lists each of the Fidelity Central Funds held as of period end, if any, as an investment of the Fund, but does not include the underlying holdings of each Fidelity Central Fund. As an Investing Fund, the Fund indirectly bears its proportionate share of the expenses of the underlying Fidelity Central Funds.
The Money Market Central Funds seek preservation of capital and current income and are managed by Fidelity Investments Money Management, Inc. (FIMM), an affiliate of the investment adviser. Annualized expenses of the Money Market Central Funds as of their most recent shareholder report date are less than .005%.
A complete unaudited list of holdings for each Fidelity Central Fund is available upon request or at the Securities and Exchange Commission (the SEC) website at www.sec.gov. In addition, the financial statements of the Fidelity Central Funds are available on the SEC website or upon request.
3. Significant Accounting Policies.
The Fund is an investment company and applies the accounting and reporting guidance of the Financial Accounting Standards Board (FASB) Accounting Standards Codification Topic 946 Financial Services – Investments Companies. The financial statements have been prepared in conformity with accounting principles generally accepted in the United States of America (GAAP), which require management to make certain estimates and assumptions at the date of the financial statements. Actual results could differ from those estimates. Subsequent events, if any, through the date that the financial statements were issued have been evaluated in the preparation of the financial statements. The following summarizes the significant accounting policies of the Fund:
Investment Valuation. Investments are valued as of 4:00 p.m. Eastern time on the last calendar day of the period. The Board of Trustees (the Board) has delegated the day to day responsibility for the valuation of the Fund's investments to the Fair Value Committee (the Committee) established by the Fund's investment adviser. In accordance with valuation policies and procedures approved by the Board, the Fund attempts to obtain prices from one or more third party pricing vendors or brokers to value its investments. When current market prices, quotations or currency exchange rates are not readily available or reliable, investments will be fair valued in good faith by the Committee, in accordance with procedures adopted by the Board. Factors used in determining fair value vary by investment type and may include market or investment specific events. The frequency with which these procedures are used cannot be predicted and they may be utilized to a significant extent. The Committee oversees the Fund's valuation policies and procedures and reports to the Board on the Committee's activities and fair value determinations. The Board monitors the appropriateness of the procedures used in valuing the Fund's investments and ratifies the fair value determinations of the Committee.
The Fund categorizes the inputs to valuation techniques used to value its investments into a disclosure hierarchy consisting of three levels as shown below:
- Level 1 – quoted prices in active markets for identical investments
- Level 2 – other significant observable inputs (including quoted prices for similar investments, interest rates, prepayment speeds, etc.)
- Level 3 – unobservable inputs (including the Fund's own assumptions based on the best information available)
Valuation techniques used to value the Fund's investments by major category are as follows:
Equity securities, including restricted securities, for which market quotations are readily available, are valued at the last reported sale price or official closing price as reported by a third party pricing vendor on the primary market or exchange on which they are traded and are categorized as Level 1 in the hierarchy. In the event there were no sales during the day or closing prices are not available, securities are valued at the last quoted bid price or may be valued using the last available price and are generally categorized as Level 2 in the hierarchy. For foreign equity securities, when market or security specific events arise, comparisons to the valuation of American Depositary Receipts (ADRs), futures contracts, Exchange-Traded Funds (ETFs) and certain indexes as well as quoted prices for similar securities may be used and would be categorized as Level 2 in the hierarchy. For equity securities, including restricted securities, where observable inputs are limited, assumptions about market activity and risk are used and these securities may be categorized as Level 3 in the hierarchy.
Investments in open-end mutual funds, including the Fidelity Central Funds, are valued at their closing net asset value (NAV) each business day and are categorized as Level 1 in the hierarchy.
Changes in valuation techniques may result in transfers in or out of an assigned level within the disclosure hierarchy. The aggregate value of investments by input level as of January 31, 2019 is included at the end of the Fund's Schedule of Investments.
Foreign Currency. The Fund may use foreign currency contracts to facilitate transactions in foreign-denominated securities. Gains and losses from these transactions may arise from changes in the value of the foreign currency or if the counterparties do not perform under the contracts' terms.
Foreign-denominated assets, including investment securities, and liabilities are translated into U.S. dollars at the exchange rates at period end. Purchases and sales of investment securities, income and dividends received and expenses denominated in foreign currencies are translated into U.S. dollars at the exchange rate in effect on the transaction date.
The effects of exchange rate fluctuations on investments are included with the net realized and unrealized gain (loss) on investment securities. Other foreign currency transactions resulting in realized and unrealized gain (loss) are disclosed separately.
Investment Transactions and Income. For financial reporting purposes, the Fund's investment holdings and NAV include trades executed through the end of the last business day of the period. The NAV per share for processing shareholder transactions is calculated as of the close of business of the New York Stock Exchange (NYSE), normally 4:00 p.m. Eastern time and includes trades executed through the end of the prior business day. Gains and losses on securities sold are determined on the basis of identified cost. Dividend income is recorded on the ex-dividend date, except for certain dividends from foreign securities where the ex-dividend date may have passed, which are recorded as soon as the Fund is informed of the ex-dividend date. Non-cash dividends included in dividend income, if any, are recorded at the fair market value of the securities received. Income and capital gain distributions from Fidelity Central Funds, if any, are recorded on the ex-dividend date. Certain distributions received by the Fund represent a return of capital or capital gain. The Fund determines the components of these distributions subsequent to the ex-dividend date, based upon receipt of tax filings or other correspondence relating to the underlying investment. These distributions are recorded as a reduction of cost of investments and/or as a realized gain. Investment income is recorded net of foreign taxes withheld where recovery of such taxes is uncertain.
Expenses. Expenses directly attributable to a fund are charged to that fund. Expenses attributable to more than one fund are allocated among the respective funds on the basis of relative net assets or other appropriate methods. Expense estimates are accrued in the period to which they relate and adjustments are made when actual amounts are known.
Income Tax Information and Distributions to Shareholders. Each year, the Fund intends to qualify as a regulated investment company under Subchapter M of the Internal Revenue Code, including distributing substantially all of its taxable income and realized gains. As a result, no provision for U.S. Federal income taxes is required. The Fund files a U.S. federal tax return, in addition to state and local tax returns as required. The Fund's federal income tax returns are subject to examination by the Internal Revenue Service (IRS) for a period of three fiscal years after they are filed. State and local tax returns may be subject to examination for an additional fiscal year depending on the jurisdiction. Foreign taxes are provided for based on the Fund's understanding of the tax rules and rates that exist in the foreign markets in which it invests. The Fund is subject to a tax imposed on capital gains by certain countries in which it invests.
Distributions are declared and recorded on the ex-dividend date. Income and capital gain distributions are determined in accordance with income tax regulations, which may differ from GAAP.
Capital accounts within the financial statements are adjusted for permanent book-tax differences. These adjustments have no impact on net assets or the results of operations. Capital accounts are not adjusted for temporary book-tax differences which will reverse in a subsequent period.
Book-tax differences are primarily due to foreign currency transactions, passive foreign investment companies (PFIC), and losses deferred due to wash sales.
As of period end, the cost and unrealized appreciation (depreciation) in securities, and derivatives if applicable, for federal income tax purposes were as follows:
| Gross unrealized appreciation | $2,094,805 |
| Gross unrealized depreciation | (1,751,867) |
| Net unrealized appreciation (depreciation) | $342,938 |
| Tax cost | $23,643,685 |
Restricted Securities. The Fund may invest in securities that are subject to legal or contractual restrictions on resale. These securities generally may be resold in transactions exempt from registration or to the public if the securities are registered. Disposal of these securities may involve time-consuming negotiations and expense, and prompt sale at an acceptable price may be difficult. Information regarding restricted securities is included at the end of the Fund's Schedule of Investments.
New Rule Issuance. During August 2018, the U.S. Securities and Exchange Commission issued Final Rule Release No. 33-10532, Disclosure Update and Simplification. This Final Rule includes amendments specific to registered investment companies that are intended to eliminate overlap in disclosure requirements between Regulation S-X and GAAP. In accordance with these amendments, certain line-items in the Fund's financial statements have been combined or removed for the current period as outlined in the table below.
| Financial Statement | Current Line-Item Presentation (As Applicable) | Prior Line-Item Presentation (As Applicable) |
| Statement of Assets and Liabilities | Total distributable earnings (loss) | Undistributed/Distributions in excess of/Accumulated net investment income (loss)
Accumulated/Undistributed net realized gain (loss)
Net unrealized appreciation (depreciation) |
| Statement of Changes in Net Assets | N/A - removed | Undistributed/Distributions in excess of/Accumulated net investment income (loss) end of period |
| Statement of Changes in Net Assets | Distributions to shareholders | Distributions to shareholders from net investment income
Distributions to shareholders from net realized gain |
4. Purchases and Sales of Investments.
Purchases and sales of securities, other than short-term securities, aggregated $3,807,233 and $8,232,825, respectively.
5. Fees and Other Transactions with Affiliates.
Management Fee. Fidelity Management & Research Company (the investment adviser) and its affiliates provide the Fund with investment management related services and the Fund does not pay any fees for these services. Under the management contract, the investment adviser or an affiliate pays all other expenses of the Fund, excluding fees and expenses of the independent Trustees, and certain miscellaneous expenses such as proxy and shareholder meeting expenses.
Brokerage Commissions. The Fund placed a portion of its portfolio transactions with brokerage firms which are affiliates of the investment adviser. Brokerage commissions are included in net realized gain (loss) and change in net unrealized appreciation (depreciation) in the Statement of Operations. The commissions paid to these affiliated firms were $96 for the period.
Interfund Trades. The Fund may purchase from or sell securities to other Fidelity Funds under procedures adopted by the Board. The procedures have been designed to ensure these interfund trades are executed in accordance with Rule 17a-7 of the 1940 Act. Interfund trades are included within the respective purchases and sales amounts shown in the Purchases and Sales of Investments note.
6. Committed Line of Credit.
The Fund participates with other funds managed by the investment adviser or an affiliate in a $4.25 billion credit facility (the "line of credit") to be utilized for temporary or emergency purposes to fund shareholder redemptions or for other short-term liquidity purposes. The Fund has agreed to pay commitment fees on its pro-rata portion of the line of credit, which amounted to $38 and is reflected in Commitment fees on the Statement of Operations. During the period, the Fund did not borrow on this line of credit.
7. Security Lending.
The Fund lends portfolio securities through a lending agent from time to time in order to earn additional income. For equity securities, a lending agent is used and may loan securities to certain qualified borrowers, including Fidelity Capital Markets (FCM), a broker-dealer affiliated with the Fund. On the settlement date of the loan, the Fund receives collateral (in the form of U.S. Treasury obligations, letters of credit and/or cash) against the loaned securities and maintains collateral in an amount not less than 100% of the market value of the loaned securities during the period of the loan. The market value of the loaned securities is determined at the close of business of the Fund and any additional required collateral is delivered to the Fund on the next business day. The Fund or borrower may terminate the loan at any time, and if the borrower defaults on its obligation to return the securities loaned because of insolvency or other reasons, the Fund may apply collateral received from the borrower against the obligation. The Fund may experience delays and costs in recovering the securities loaned. Any cash collateral received is invested in the Fidelity Securities Lending Cash Central Fund. The value of loaned securities and cash collateral at period end are disclosed on the Fund's Statement of Assets and Liabilities. Security lending income represents the income earned on investing cash collateral, less rebates paid to borrowers and any lending agent fees associated with the loan, plus any premium payments received for lending certain types of securities. Security lending income is presented in the Statement of Operations as a component of income from Fidelity Central Funds. Total security lending income during the period amounted to $1,895. During the period, there were no securities loaned to FCM.
8. Other.
The Fund's organizational documents provide former and current trustees and officers with a limited indemnification against liabilities arising in connection with the performance of their duties to the Fund. In the normal course of business, the Fund may also enter into contracts that provide general indemnifications. The Fund's maximum exposure under these arrangements is unknown as this would be dependent on future claims that may be made against the Fund. The risk of material loss from such claims is considered remote.
At the end of the period, the investment adviser or its affiliates were the owners of record of 25% of the total outstanding shares of the Fund.
Shareholder Expense Example
As a shareholder of the Fund, you incur two types of costs: (1) transaction costs and (2) ongoing costs, including other Fund expenses. This Example is intended to help you understand your ongoing costs (in dollars) of investing in the Fund and to compare these costs with the ongoing costs of investing in other mutual funds.
The Example is based on an investment of $1,000 invested at the beginning of the period and held for the entire period (August 1, 2018 to January 31, 2019).
Actual Expenses
The first line of the accompanying table provides information about actual account values and actual expenses. You may use the information in this line, together with the amount you invested, to estimate the expenses that you paid over the period. Simply divide your account value by $1,000.00 (for example, an $8,600 account value divided by $1,000.00 = 8.6), then multiply the result by the number in the first line under the heading entitled "Expenses Paid During Period" to estimate the expenses you paid on your account during this period. In addition, the Fund, as a shareholder in the underlying Fidelity Central Funds, will indirectly bear its pro-rata share of the fees and expenses incurred by the underlying Fidelity Central Funds. These fees and expenses are not included in the Fund's annualized expense ratio used to calculate the expense estimate in the table below.
Hypothetical Example for Comparison Purposes
The second line of the accompanying table provides information about hypothetical account values and hypothetical expenses based on the Fund's actual expense ratio and an assumed rate of return of 5% per year before expenses, which is not the Fund's actual return. The hypothetical account values and expenses may not be used to estimate the actual ending account balance or expenses you paid for the period. You may use this information to compare the ongoing costs of investing in the Fund and other funds. To do so, compare this 5% hypothetical example with the 5% hypothetical examples that appear in the shareholder reports of the other funds. In addition, the Fund, as a shareholder in the underlying Fidelity Central Funds, will indirectly bear its pro-rata share of the fees and expenses incurred by the underlying Fidelity Central Funds. These fees and expenses are not included in the Fund's annualized expense ratio used to calculate the expense estimate in the table below.
Please note that the expenses shown in the table are meant to highlight your ongoing costs only and do not reflect any transaction costs. Therefore, the second line of the table is useful in comparing ongoing costs only, and will not help you determine the relative total costs of owning different funds.
| | Annualized Expense Ratio-A | Beginning
Account Value
August 1, 2018 | Ending
Account Value
January 31, 2019 | Expenses Paid
During Period-B
August 1, 2018
to January 31, 2019 |
| Actual | -%-C | $1,000.00 | $955.80 | $--D |
| Hypothetical-E | | $1,000.00 | $1,025.21 | $--D |
A Annualized expense ratio reflects expenses net of applicable fee waivers.
B Expenses are equal to the Fund's annualized expense ratio, multiplied by the average account value over the period, multiplied by 184/365 (to reflect the one-half year period).
C Amount represents less than .005%.
D Amount represents less than $.005.
E 5% return per year before expenses
Board Approval of Investment Advisory Contracts and Management Fees
Fidelity Flex Intrinsic Opportunities Fund
Each year, the Board of Trustees, including the Independent Trustees (together, the Board), votes on the renewal of the management contract with Fidelity Management & Research Company (FMR) and the sub-advisory agreements (together, the Advisory Contracts) for the fund. FMR and the sub-advisers are referred to herein as the Investment Advisers. The Board, assisted by the advice of fund counsel and Independent Trustees' counsel, requests and considers a broad range of information relevant to the renewal of the Advisory Contracts throughout the year.
The Board meets regularly and, at each of its meetings, covers an extensive agenda of topics and materials and considers factors that are relevant to its annual consideration of the renewal of the fund's Advisory Contracts, including the services and support provided to the fund and its shareholders. The Board has established various standing committees (Committees), each composed of and chaired by Independent Trustees with varying backgrounds, to which the Board has assigned specific subject matter responsibilities in order to enhance effective decision-making by the Board. The Board, acting directly and through its Committees, requests and receives information concerning the annual consideration of the renewal of the fund's Advisory Contracts. The Board also meets as needed to review matters specifically related to the Board's annual consideration of the renewal of the Advisory Contracts. Members of the Board may also meet with trustees of other Fidelity funds through joint ad hoc committees to discuss certain matters relevant to all of the Fidelity funds.
At its January 2019 meeting, the Board unanimously determined to renew the fund's Advisory Contracts. In considering whether to renew the Advisory Contracts for the fund, the Board considered all factors it believed relevant and reached a determination, with the assistance of fund counsel and Independent Trustees' counsel and through the exercise of its business judgment, that the renewal of the Advisory Contracts was in the best interests of the fund and its shareholders and the fact that no fee is payable under the management contract was fair and reasonable.
Nature, Extent, and Quality of Services Provided. The Board considered Fidelity's staffing as it relates to the fund, including the backgrounds of investment personnel of Fidelity, and also considered the fund's investment objective, strategies, and related investment philosophy. The Independent Trustees also had discussions with senior management of Fidelity's investment operations and investment groups. The Board considered the structure of the investment personnel compensation program and whether this structure provides appropriate incentives to act in the best interests of the fund. Additionally, the Board considered the portfolio managers' investments, if any, in the funds that they manage.
Resources Dedicated to Investment Management and Support Services. The Board and the Fund Oversight and Research Committees reviewed the general qualifications and capabilities of Fidelity's investment staff, including its size, education, experience, and resources, as well as Fidelity's approach to recruiting, training, managing, and compensating investment personnel. The Board noted that Fidelity has continued to increase the resources devoted to non-U.S. offices, including expansion of Fidelity's global investment organization. The Board also noted that Fidelity's analysts have extensive resources, tools and capabilities that allow them to conduct sophisticated quantitative and fundamental analysis, as well as credit analysis of issuers, counterparties and guarantors. Further, the Board considered that Fidelity's investment professionals have sufficient access to global information and data so as to provide competitive investment results over time, and that those professionals also have access to sophisticated tools that permit them to assess portfolio construction and risk and performance attribution characteristics continuously, as well as to transmit new information and research conclusions rapidly around the world. Additionally, in its deliberations, the Board considered Fidelity's trading, risk management, compliance, and technology and operations capabilities and resources, which are integral parts of the investment management process.
Shareholder and Administrative Services. The Board considered (i) the nature, extent, quality, and cost of advisory, administrative, and shareholder services performed by the Investment Advisers and their affiliates under the Advisory Contracts and under separate agreements covering transfer agency, pricing and bookkeeping, and securities lending services for the fund; (ii) the nature and extent of the supervision of third party service providers, principally custodians, subcustodians, and pricing vendors; and (iii) the resources devoted to, and the record of compliance with, the fund's compliance policies and procedures. The Board also reviewed the allocation of fund brokerage, including allocations to brokers affiliated with the Investment Advisers, the use of brokerage commissions to pay fund expenses, and the use of "soft" commission dollars to pay for research services.
The Board noted that the growth of fund assets over time across the complex allows Fidelity to reinvest in the development of services designed to enhance the value and convenience of the Fidelity funds as investment vehicles. These services include 24-hour access to account information and market information through telephone representatives and over the Internet, investor education materials and asset allocation tools, and the expanded availability of Fidelity Investor Centers.
Investment in a Large Fund Family. The Board considered the benefits to shareholders of investing in a Fidelity fund, including the benefits of investing in a fund that is part of a large family of funds offering a variety of investment disciplines and providing a large variety of mutual fund investor services. The Board noted that Fidelity had taken, or had made recommendations that resulted in the Fidelity funds taking, a number of actions over the previous year that benefited particular funds, including: (i) continuing to dedicate additional resources to Fidelity's investment research process, which includes meetings with management of issuers of securities in which the funds invest, and to the support of the senior management team that oversees asset management; (ii) continuing efforts to enhance Fidelity's global research capabilities; (iii) launching new funds and making other enhancements to meet client needs; (iv) launching new share classes of existing funds; (v) eliminating purchase minimums and broadening eligibility requirements for certain funds and share classes; (vi) reducing management fees and total expenses for certain growth equity funds and index funds; (vii) lowering expense caps for certain existing funds and classes, and converting certain voluntary expense caps to contractual caps, to reduce expenses borne by shareholders; (viii) eliminating short-term redemption fees for funds that had such fees; (ix) rationalizing product lines and gaining increased efficiencies from fund mergers and share class consolidations; (x) continuing to develop, acquire and implement systems and technology to improve services to the funds and shareholders, strengthen information security, and increase efficiency; and (xi) continuing to implement enhancements to further strengthen Fidelity's product line to increase investors' probability of success in achieving their investment goals, including retirement income goals.
Investment Performance. The Board considered whether the fund has operated in accordance with its investment objective, as well as its record of compliance with its investment restrictions. As the fund recently commenced operations, the Board did not believe that it was appropriate to assign significant weight to its limited investment performance.
Based on its review, the Board concluded that the nature, extent, and quality of services provided to the fund under the Advisory Contracts should continue to benefit the shareholders of the fund.
Competitiveness of Management Fee and Total Expense Ratio. The Board noted that the fund is available exclusively to certain Fidelity fee-based programs. The Board considered that the fund does not pay FMR a management fee for investment advisory services, but that FMR is indirectly compensated for its services out of the program fees. The Board also noted that FMR or an affiliate undertakes to pay all operating expenses of the fund with limited exceptions.
In connection with the renewal of the Advisory Contracts, the Board also approved amendments to the management contract for the fund to clarify that the fund pays its non-operating expenses, including brokerage commissions and fees and expenses associated with the fund's securities lending program. The Board considered that the amendments would not change the services provided to the fund or the party responsible for making such payments under the current management contract.
Based on its review, the Board considered that the fund does not pay a management fee and concluded that the total expense ratio of the fund was reasonable in light of the services that the fund and its shareholders receive and the other factors considered.
Costs of the Services and Profitability. The Board considered the level of Fidelity's profits in respect of all the Fidelity funds.
PricewaterhouseCoopers LLP (PwC), auditor to Fidelity and certain Fidelity funds, has been engaged annually by the Board as part of the Board's assessment of Fidelity's profitability analysis. PwC's engagement includes the review and assessment of the methodologies used by Fidelity in determining the revenues and expenses attributable to Fidelity's mutual fund business, and completion of agreed-upon procedures in respect of the mathematical accuracy of the fund profitability information and its conformity to established allocation methodologies. After considering PwC's reports issued under the engagement and information provided by Fidelity, the Board concluded that while other allocation methods may also be reasonable, Fidelity's profitability methodologies are reasonable in all material respects.
The Board also reviewed Fidelity's non-fund businesses and potential indirect benefits such businesses may have received as a result of their association with Fidelity's mutual fund business (i.e., fall-out benefits) as well as cases where Fidelity's affiliates may benefit from the fund's business. The Board noted that changes to fall-out benefits year-over-year reflect business developments at Fidelity's various businesses.
The Board concluded that the costs of the services provided by and the profits realized by Fidelity in connection with the operation of the fund were not relevant to the renewal of the Advisory Contracts because the fund pays no advisory fees and FMR or an affiliate bears all expenses of the fund with limited exceptions.
Economies of Scale. The Board concluded that because the fund pays no advisory fees and FMR bears all expenses of the fund with limited exceptions, the realization of economies of scale was not a material factor in the Board's decision to renew the fund's Advisory Contract.
Additional Information Requested by the Board. In order to develop fully the factual basis for consideration of the Fidelity funds' advisory contracts, the Board requested and received additional information on certain topics, including: (i) fund performance trends, in particular the underperformance of certain funds, and Fidelity's long-term strategies for certain funds; (ii) Fidelity's fund profitability methodology, profitability trends for certain funds, and the impact of certain factors on fund profitability results; (iii) metrics for evaluating index fund and ETF performance and information about ETF trading characteristics; (iv) the methodology with respect to the evaluation of competitive fund data and peer group classifications and fee comparisons; (v) the expense structures for different funds and classes; (vi) information regarding other accounts managed by Fidelity, including collective investment trusts; and (vii) Fidelity's philosophies and strategies for evaluating funds and classes with lower or declining asset levels.
Based on its evaluation of all of the conclusions noted above, and after considering all factors it believed relevant, the Board concluded that the advisory fee arrangements are fair and reasonable, and that the fund's Advisory Contracts should be renewed.
ZTO-SANN-0319
1.9881590.101
Fidelity® Low-Priced Stock K6 Fund
Semi-Annual Report January 31, 2019 |
|
Beginning on January 1, 2021, as permitted by regulations adopted by the Securities and Exchange Commission, paper copies of a fund’s shareholder reports will no longer be sent by mail, unless you specifically request paper copies of the reports from the fund or from your financial intermediary, such as a financial advisor, broker-dealer or bank. Instead, the reports will be made available on a website, and you will be notified by mail each time a report is posted and provided with a website link to access the report.
If you already elected to receive shareholder reports electronically, you will not be affected by this change and you need not take any action. You may elect to receive shareholder reports and other communications from a fund electronically, by contacting your financial intermediary. For Fidelity customers, visit Fidelity's web site or call Fidelity using the contact information listed below.
You may elect to receive all future reports in paper free of charge. If you wish to continue receiving paper copies of your shareholder reports, you may contact your financial intermediary or, if you are a Fidelity customer, visit Fidelity’s website, or call Fidelity at the applicable toll-free number listed below. Your election to receive reports in paper will apply to all funds held with the fund complex/your financial intermediary.
| Account Type | Website | Phone Number |
| Brokerage, Mutual Fund, or Annuity Contracts: | fidelity.com/mailpreferences | 1-800-343-3548 |
| Employer Provided Retirement Accounts: | netbenefits.fidelity.com/preferences (choose 'no' under Required Disclosures to continue to print) | 1-800-343-0860 |
| Advisor Sold Accounts Serviced Through Your Financial Intermediary: | Contact Your Financial Intermediary | Your Financial Intermediary's phone number |
| Advisor Sold Accounts Serviced by Fidelity: | institutional.fidelity.com | 1-877-208-0098 |
Contents
To view a fund's proxy voting guidelines and proxy voting record for the 12-month period ended June 30, visit http://www.fidelity.com/proxyvotingresults or visit the Securities and Exchange Commission's (SEC) web site at http://www.sec.gov.
You may also call 1-800-835-5092 to request a free copy of the proxy voting guidelines.
Standard & Poor's, S&P and S&P 500 are registered service marks of The McGraw-Hill Companies, Inc. and have been licensed for use by Fidelity Distributors Corporation.
Other third-party marks appearing herein are the property of their respective owners.
All other marks appearing herein are registered or unregistered trademarks or service marks of FMR LLC or an affiliated company. © 2019 FMR LLC. All rights reserved.
This report and the financial statements contained herein are submitted for the general information of the shareholders of the Fund. This report is not authorized for distribution to prospective investors in the Fund unless preceded or accompanied by an effective prospectus.
A fund files its complete schedule of portfolio holdings with the SEC for the first and third quarters of each fiscal year on Form N-Q. Forms N-Q are available on the SEC’s web site at http://www.sec.gov. A fund's Forms N-Q may be reviewed and copied at the SEC’s Public Reference Room in Washington, DC. Information regarding the operation of the SEC's Public Reference Room may be obtained by calling 1-800-SEC-0330.
For a complete list of a fund's portfolio holdings, view the most recent holdings listing, semiannual report, or annual report on Fidelity's web site at http://www.fidelity.com, http://www.institutional.fidelity.com, or http://www.401k.com, as applicable.
NOT FDIC INSURED •MAY LOSE VALUE •NO BANK GUARANTEE
Neither the Fund nor Fidelity Distributors Corporation is a bank.
Investment Summary (Unaudited)
Top Ten Stocks as of January 31, 2019
| | % of fund's net assets |
| UnitedHealth Group, Inc. | 6.7 |
| Ross Stores, Inc. | 3.2 |
| Seagate Technology LLC | 2.7 |
| Twenty-First Century Fox, Inc. Class A | 2.6 |
| Best Buy Co., Inc. | 2.4 |
| Metro, Inc. Class A (sub. vtg.) | 2.3 |
| MetLife, Inc. | 2.2 |
| Next PLC | 2.1 |
| AutoZone, Inc. | 2.0 |
| Anthem, Inc. | 1.8 |
| | 28.0 |
Top Five Market Sectors as of January 31, 2019
| | % of fund's net assets |
| Consumer Discretionary | 20.1 |
| Information Technology | 14.0 |
| Financials | 13.2 |
| Health Care | 13.0 |
| Consumer Staples | 8.2 |
Asset Allocation (% of fund's net assets)
| As of January 31, 2019* |
| | Stocks | 90.9% |
| | Short-Term Investments and Net Other Assets (Liabilities) | 9.1% |

* Foreign investments - 38.7%
Schedule of Investments January 31, 2019 (Unaudited)
Showing Percentage of Net Assets
| Common Stocks - 90.8% | | | |
| | | Shares | Value |
| COMMUNICATION SERVICES - 4.2% | | | |
| Diversified Telecommunication Services - 0.0% | | | |
| AT&T, Inc. | | 1,074 | $32,284 |
| Entertainment - 2.7% | | | |
| Cinemark Holdings, Inc. | | 7,615 | 311,606 |
| Twenty-First Century Fox, Inc.: | | | |
| Class A | | 1,023,637 | 50,475,540 |
| Class B | | 2,700 | 132,462 |
| Viacom, Inc. Class B (non-vtg.) | | 83,598 | 2,459,453 |
| | | | 53,379,061 |
| Interactive Media & Services - 0.5% | | | |
| Alphabet, Inc.: | | | |
| Class A (a) | | 102 | 114,841 |
| Class C (a) | | 566 | 631,865 |
| Yahoo! Japan Corp. | | 3,150,200 | 8,473,799 |
| | | | 9,220,505 |
| Media - 1.0% | | | |
| Comcast Corp. Class A | | 169,370 | 6,193,861 |
| Corus Entertainment, Inc. Class B (non-vtg.) | | 37,800 | 160,239 |
| Discovery Communications, Inc.: | | | |
| Class A (a)(b) | | 143,313 | 4,067,223 |
| Class C (non-vtg.) (a) | | 32,212 | 858,450 |
| Gannett Co., Inc. | | 67,059 | 743,684 |
| Hyundai HCN | | 153,655 | 568,387 |
| Intage Holdings, Inc. | | 213,300 | 1,687,993 |
| MSG Network, Inc. Class A (a) | | 18,651 | 417,782 |
| Multiplus SA | | 30,300 | 216,001 |
| Pico Far East Holdings Ltd. | | 1,110,000 | 413,131 |
| Proto Corp. | | 13,100 | 182,203 |
| RKB Mainichi Broadcasting Corp. | | 2,800 | 150,379 |
| Saga Communications, Inc. Class A | | 25,449 | 860,685 |
| Sky Network Television Ltd. | | 376,985 | 492,481 |
| STW Group Ltd. | | 264,398 | 105,705 |
| Tegna, Inc. | | 70,781 | 830,969 |
| TOW Co. Ltd. | | 118,100 | 771,973 |
| TVA Group, Inc. Class B (non-vtg.) (a) | | 180,590 | 276,255 |
| WOWOW INC. | | 11,800 | 306,903 |
| | | | 19,304,304 |
|
| TOTAL COMMUNICATION SERVICES | | | 81,936,154 |
|
| CONSUMER DISCRETIONARY - 20.1% | | | |
| Auto Components - 0.9% | | | |
| ASTI Corp. | | 11,600 | 179,338 |
| ElringKlinger AG (b) | | 45,007 | 395,635 |
| G-Tekt Corp. | | 10,000 | 146,798 |
| Gentex Corp. | | 162,512 | 3,442,004 |
| GUD Holdings Ltd. | | 20,866 | 170,483 |
| Hi-Lex Corp. | | 88,100 | 1,679,905 |
| Lear Corp. | | 1,221 | 187,949 |
| Linamar Corp. | | 12,367 | 479,451 |
| Murakami Corp. | | 53,100 | 1,225,553 |
| Nippon Seiki Co. Ltd. | | 170,200 | 3,153,212 |
| Piolax, Inc. | | 127,200 | 2,593,630 |
| S&T Holdings Co. Ltd. | | 53,202 | 624,117 |
| Samsung Climate Control Co. Ltd. | | 28,201 | 241,593 |
| SJM Co. Ltd. | | 50 | 145 |
| Strattec Security Corp. | | 23,758 | 819,651 |
| Sungwoo Hitech Co. Ltd. | | 149,030 | 551,278 |
| TBK Co. Ltd. | | 47,200 | 173,330 |
| Yachiyo Industry Co. Ltd. | | 57,800 | 381,000 |
| Yutaka Giken Co. Ltd. | | 62,900 | 1,150,881 |
| | | | 17,595,953 |
| Automobiles - 0.0% | | | |
| Kabe Husvagnar AB (B Shares) | | 17,825 | 269,886 |
| Distributors - 0.1% | | | |
| Arata Corp. | | 5,800 | 232,426 |
| Central Automotive Products Ltd. | | 3,700 | 52,583 |
| Chori Co. Ltd. | | 21,900 | 318,673 |
| Nakayamafuku Co. Ltd. | | 41,400 | 199,161 |
| PALTAC Corp. | | 4,100 | 196,484 |
| SPK Corp. | | 16,400 | 346,745 |
| Uni-Select, Inc. | | 84,508 | 1,242,585 |
| | | | 2,588,657 |
| Diversified Consumer Services - 0.1% | | | |
| Clip Corp. | | 14,000 | 103,851 |
| Cross-Harbour Holdings Ltd. | | 147,000 | 207,737 |
| Estacio Participacoes SA | | 24,500 | 208,914 |
| ServiceMaster Global Holdings, Inc. (a) | | 8 | 312 |
| Shingakukai Holdings Co. Ltd. | | 5,400 | 29,349 |
| Step Co. Ltd. | | 54,900 | 633,045 |
| | | | 1,183,208 |
| Hotels, Restaurants & Leisure - 0.3% | | | |
| Ark Restaurants Corp. | | 6,886 | 127,391 |
| Bluegreen Vacations Corp. | | 13,950 | 186,930 |
| Flanigans Enterprises, Inc. | | 5,742 | 133,502 |
| Greggs PLC | | 10,527 | 214,012 |
| Hiday Hidaka Corp. | | 89,720 | 1,760,217 |
| Ibersol SGPS SA | | 58,852 | 567,188 |
| Koshidaka Holdings Co. Ltd. | | 17,700 | 252,521 |
| Kura Corp. Ltd. | | 600 | 30,957 |
| Sportscene Group, Inc. Class A | | 16,925 | 167,324 |
| Texas Roadhouse, Inc. Class A | | 6,989 | 425,211 |
| The Monogatari Corp. | | 3,300 | 285,692 |
| The Restaurant Group PLC | | 1,007,845 | 1,970,937 |
| Wyndham Destinations, Inc. | | 7,616 | 320,938 |
| | | | 6,442,820 |
| Household Durables - 3.6% | | | |
| Abbey PLC | | 97,083 | 1,500,136 |
| Barratt Developments PLC | | 4,658,105 | 32,906,147 |
| Bellway PLC | | 252,432 | 9,393,018 |
| D.R. Horton, Inc. | | 184,433 | 7,091,449 |
| Dorel Industries, Inc. Class B (sub. vtg.) | | 110,646 | 1,375,128 |
| Emak SpA | | 282,964 | 424,284 |
| First Juken Co. Ltd. | | 71,600 | 746,730 |
| Flexsteel Industries, Inc. | | 1,653 | 41,275 |
| Gree Electric Appliances, Inc. of Zhuhai Class A (a) | | 72,000 | 448,603 |
| Hamilton Beach Brands Holding Co.: | | | |
| Class A | | 10,765 | 281,397 |
| Class B (a) | | 3,511 | 91,778 |
| Helen of Troy Ltd. (a) | | 79,847 | 9,265,446 |
| Henry Boot PLC | | 190,192 | 648,585 |
| Iida Group Holdings Co. Ltd. | | 9,700 | 176,412 |
| M/I Homes, Inc. (a) | | 10,988 | 291,072 |
| Meritage Homes Corp. (a) | | 41,423 | 1,867,349 |
| P&F Industries, Inc. Class A | | 19,575 | 151,119 |
| PulteGroup, Inc. | | 5,501 | 152,983 |
| Q.E.P. Co., Inc. | | 1,585 | 38,024 |
| Sanei Architecture Planning Co. Ltd. | | 61,700 | 934,634 |
| Taylor Morrison Home Corp. (a) | | 12,718 | 240,370 |
| Token Corp. | | 40,200 | 2,365,683 |
| Toll Brothers, Inc. | | 6,555 | 242,142 |
| Tupperware Brands Corp. | | 1,744 | 47,559 |
| | | | 70,721,323 |
| Internet & Direct Marketing Retail - 0.2% | | | |
| Aucnet, Inc. | | 10,800 | 86,658 |
| Belluna Co. Ltd. | | 426,200 | 4,018,429 |
| Liberty Interactive Corp. QVC Group Series A (a) | | 3,932 | 85,521 |
| Moneysupermarket.com Group PLC | | 36,214 | 143,920 |
| | | | 4,334,528 |
| Leisure Products - 0.1% | | | |
| Brunswick Corp. | | 6,786 | 341,472 |
| Mars Group Holdings Corp. | | 30,600 | 599,780 |
| Miroku Corp. | | 9,100 | 148,791 |
| Vista Outdoor, Inc. (a) | | 8,461 | 84,441 |
| | | | 1,174,484 |
| Multiline Retail - 2.3% | | | |
| Big Lots, Inc. | | 76,895 | 2,425,268 |
| Lifestyle China Group Ltd. (a) | | 1,175,000 | 418,409 |
| Lifestyle International Holdings Ltd. | | 1,427,000 | 2,154,502 |
| Macy's, Inc. | | 3,279 | 86,238 |
| Next PLC | | 644,064 | 40,945,243 |
| Watts Co. Ltd. | | 16,800 | 109,352 |
| | | | 46,139,012 |
| Specialty Retail - 11.1% | | | |
| Aaron's, Inc. Class A | | 3,487 | 174,559 |
| Abercrombie & Fitch Co. Class A | | 83,338 | 1,805,934 |
| AT-Group Co. Ltd. | | 70,600 | 1,523,158 |
| AutoNation, Inc. (a) | | 4,685 | 181,544 |
| AutoZone, Inc. (a) | | 45,657 | 38,687,002 |
| Bed Bath & Beyond, Inc. (b) | | 740,008 | 11,166,721 |
| Best Buy Co., Inc. | | 798,813 | 47,321,682 |
| BMTC Group, Inc. | | 209,252 | 2,372,887 |
| Bonia Corp. Bhd (a) | | 200 | 12 |
| Buffalo Co. Ltd. | | 4,900 | 40,037 |
| Burlington Stores, Inc. (a) | | 2,264 | 388,751 |
| Cars.com, Inc. (a) | | 25,811 | 704,898 |
| Cash Converters International Ltd. (a) | | 1,417,490 | 252,442 |
| Delek Automotive Systems Ltd. | | 47,555 | 214,533 |
| DSW, Inc. Class A | | 7,000 | 190,750 |
| Dunelm Group PLC | | 51,458 | 487,632 |
| GameStop Corp. Class A | | 214,662 | 2,434,267 |
| Genesco, Inc. (a) | | 23,906 | 1,080,073 |
| GNC Holdings, Inc. Class A (a) | | 60,409 | 184,247 |
| Goldlion Holdings Ltd. | | 1,415,000 | 587,414 |
| Guess?, Inc. | | 313,773 | 6,121,711 |
| Hour Glass Ltd. | | 526,300 | 244,345 |
| IA Group Corp. | | 6,000 | 183,704 |
| JB Hi-Fi Ltd. (b) | | 16,489 | 268,124 |
| John David Group PLC | | 509,825 | 3,094,681 |
| Jumbo SA | | 512,630 | 8,378,880 |
| K's Holdings Corp. | | 308,900 | 3,068,440 |
| Ku Holdings Co. Ltd. | | 58,100 | 416,581 |
| Leon's Furniture Ltd. | | 15,911 | 174,374 |
| Mr. Bricolage SA | | 44,071 | 322,839 |
| Murphy U.S.A., Inc. (a) | | 3,918 | 288,169 |
| Nafco Co. Ltd. | | 99,200 | 1,509,971 |
| Ross Stores, Inc. | | 685,742 | 63,170,553 |
| Sally Beauty Holdings, Inc. (a) | | 192,072 | 3,307,480 |
| Second Chance Properties Ltd. warrants 1/23/20 (a) | | 100 | 0 |
| Sonic Automotive, Inc. Class A (sub. vtg.) | | 40,139 | 614,127 |
| The Buckle, Inc. | | 230,595 | 4,005,435 |
| The Children's Place Retail Stores, Inc. | | 2,280 | 220,613 |
| Urban Outfitters, Inc. (a) | | 120,062 | 3,878,003 |
| USS Co. Ltd. | | 332,300 | 5,808,577 |
| Vitamin Shoppe, Inc. (a) | | 56,310 | 260,152 |
| Williams-Sonoma, Inc. | | 41,755 | 2,272,725 |
| | | | 217,408,027 |
| Textiles, Apparel & Luxury Goods - 1.4% | | | |
| Best Pacific International Holdings Ltd. | | 320,000 | 77,188 |
| Capri Holdings Ltd. (a) | | 6,184 | 262,696 |
| CRG, Inc. BHD (c) | | 200 | 4 |
| Deckers Outdoor Corp. (a) | | 2,380 | 305,711 |
| Embry Holdings Ltd. | | 110,000 | 32,551 |
| Ff Group (a)(c) | | 254,962 | 1,120,625 |
| Fossil Group, Inc. (a) | | 224,113 | 3,800,956 |
| Gildan Activewear, Inc. | | 439,860 | 14,886,848 |
| Handsome Co. Ltd. | | 87,081 | 2,896,359 |
| JLM Couture, Inc. (a) | | 8,218 | 82,180 |
| Makalot Industrial Co. Ltd. | | 38,000 | 238,478 |
| McRae Industries, Inc. | | 1,496 | 37,250 |
| Steven Madden Ltd. | | 13,073 | 426,833 |
| Sun Hing Vision Group Holdings Ltd. | | 1,014,000 | 360,722 |
| Ted Baker PLC | | 6,181 | 151,033 |
| Texwinca Holdings Ltd. | | 3,156,000 | 1,206,912 |
| Victory City International Holdings Ltd. | | 6,332,407 | 85,546 |
| Youngone Corp. | | 30,054 | 937,474 |
| Youngone Holdings Co. Ltd. | | 19 | 1,052 |
| Yue Yuen Industrial (Holdings) Ltd. | | 195,000 | 665,110 |
| | | | 27,575,528 |
|
| TOTAL CONSUMER DISCRETIONARY | | | 395,433,426 |
|
| CONSUMER STAPLES - 8.2% | | | |
| Beverages - 1.7% | | | |
| A.G. Barr PLC | | 187,234 | 1,851,644 |
| Baron de Ley SA (a) | | 7,210 | 899,530 |
| Britvic PLC | | 411,071 | 4,747,310 |
| C&C Group PLC | | 93,603 | 353,555 |
| Jinro Distillers Co. Ltd. | | 2,262 | 59,172 |
| Monster Beverage Corp. (a) | | 432,793 | 24,773,071 |
| Olvi PLC (A Shares) | | 6,438 | 243,912 |
| Spritzer Bhd | | 288,800 | 145,246 |
| Yantai Changyu Pioneer Wine Co. Ltd. (B Shares) | | 168,255 | 325,483 |
| | | | 33,398,923 |
| Food & Staples Retailing - 4.7% | | | |
| Amsterdam Commodities NV | | 9,193 | 203,922 |
| Aoki Super Co. Ltd. | | 6,900 | 171,035 |
| Belc Co. Ltd. | | 106,400 | 4,639,890 |
| Casey's General Stores, Inc. | | 1,385 | 178,222 |
| Cosmos Pharmaceutical Corp. | | 62,200 | 11,888,951 |
| Create SD Holdings Co. Ltd. | | 274,400 | 6,887,396 |
| Daikokutenbussan Co. Ltd. | | 34,435 | 1,294,573 |
| Dong Suh Companies, Inc. | | 63,125 | 1,089,507 |
| Genky DrugStores Co. Ltd. | | 47,300 | 1,129,468 |
| Halows Co. Ltd. | | 84,400 | 1,628,724 |
| Kirindo Holdings Co. Ltd. | | 8,700 | 110,303 |
| Kroger Co. | | 3,073 | 87,058 |
| Kusuri No Aoki Holdings Co. Ltd. | | 32,900 | 2,177,728 |
| Majestic Wine PLC | | 59,680 | 214,086 |
| McColl's Retail Group PLC | | 94,727 | 71,565 |
| Medical System Network Co. Ltd. | | 3,400 | 12,642 |
| Metro, Inc. Class A (sub. vtg.) | | 1,260,941 | 45,842,803 |
| North West Co., Inc. | | 6,753 | 160,197 |
| Performance Food Group Co. (a) | | 12,504 | 427,137 |
| Qol Holdings Co. Ltd. | | 119,500 | 1,863,948 |
| Sundrug Co. Ltd. | | 195,700 | 6,243,356 |
| Thai President Foods PCL | | 32,980 | 164,689 |
| Total Produce PLC | | 575,415 | 1,119,654 |
| United Natural Foods, Inc. (a) | | 38,768 | 507,861 |
| Valor Holdings Co. Ltd. | | 16,400 | 397,334 |
| Walgreens Boots Alliance, Inc. | | 2,366 | 170,967 |
| Walmart, Inc. | | 2,017 | 193,289 |
| Welbilt, Inc. (a) | | 9,300 | 130,386 |
| Yaoko Co. Ltd. | | 54,800 | 2,867,661 |
| | | | 91,874,352 |
| Food Products - 1.6% | | | |
| Carr's Group PLC | | 114,146 | 247,402 |
| Cranswick PLC | | 29,162 | 1,103,098 |
| Dean Foods Co. | | 11,668 | 48,656 |
| Devro PLC | | 76,142 | 155,394 |
| Food Empire Holdings Ltd. | | 2,518,600 | 1,000,929 |
| Fresh Del Monte Produce, Inc. | | 267,476 | 8,553,882 |
| Hilton Food Group PLC | | 33,803 | 411,438 |
| Inghams Group Ltd. | | 101,314 | 338,768 |
| Ingredion, Inc. | | 26,347 | 2,608,353 |
| Japan Meat Co. Ltd. | | 10,000 | 154,785 |
| Kaveri Seed Co. Ltd. | | 4,501 | 38,102 |
| Mitsui Sugar Co. Ltd. | | 22,600 | 612,280 |
| Nam Yang Dairy Products | | 631 | 358,487 |
| Origin Enterprises PLC | | 476,347 | 3,124,149 |
| Pacific Andes International Holdings Ltd. (a)(c) | | 3,118,000 | 29,006 |
| Pickles Corp. | | 6,500 | 117,021 |
| Rocky Mountain Chocolate Factory, Inc. | | 26,429 | 227,289 |
| S Foods, Inc. | | 25,400 | 915,263 |
| Seaboard Corp. | | 2,505 | 9,679,746 |
| Select Harvests Ltd. | | 199,150 | 870,020 |
| | | | 30,594,068 |
| Household Products - 0.0% | | | |
| Central Garden & Pet Co. Class A (non-vtg.) (a) | | 5,295 | 188,608 |
| Personal Products - 0.1% | | | |
| Grape King Bio Ltd. | | 89,000 | 605,738 |
| Hengan International Group Co. Ltd. | | 31,000 | 242,511 |
| Natural Alternatives International, Inc. (a) | | 7,820 | 87,271 |
| Sarantis SA | | 204,692 | 1,733,749 |
| | | | 2,669,269 |
| Tobacco - 0.1% | | | |
| Karelia Tobacco Co., Inc. | | 83 | 23,750 |
| Scandinavian Tobacco Group A/S (d) | | 111,206 | 1,438,156 |
| | | | 1,461,906 |
|
| TOTAL CONSUMER STAPLES | | | 160,187,126 |
|
| ENERGY - 5.7% | | | |
| Energy Equipment & Services - 1.2% | | | |
| AKITA Drilling Ltd. Class A (non-vtg.) | | 86,062 | 221,386 |
| Bristow Group, Inc. (a)(b) | | 167,577 | 551,328 |
| Carbo Ceramics, Inc. (a) | | 62,581 | 252,201 |
| Cathedral Energy Services Ltd. (a)(b) | | 67,998 | 36,743 |
| Diamond Offshore Drilling, Inc. (a)(b) | | 297,914 | 3,256,200 |
| Divestco, Inc. (a) | | 148,216 | 5,076 |
| Dril-Quip, Inc. (a) | | 12,624 | 472,643 |
| Ensco PLC Class A (b) | | 731,649 | 3,219,256 |
| Fugro NV (Certificaten Van Aandelen) (a)(b) | | 11,570 | 127,583 |
| Geospace Technologies Corp. (a) | | 68,271 | 1,026,113 |
| Gulf Island Fabrication, Inc. (a) | | 3,355 | 31,839 |
| John Wood Group PLC | | 35,657 | 253,107 |
| KLX Energy Services Holdings, Inc. (a) | | 6,360 | 165,742 |
| Liberty Oilfield Services, Inc. Class A | | 107,197 | 1,630,466 |
| Oceaneering International, Inc. (a) | | 25,276 | 396,580 |
| Oil States International, Inc. (a) | | 148,676 | 2,560,201 |
| PHX Energy Services Corp. (a) | | 83,201 | 162,736 |
| Shinko Plantech Co. Ltd. | | 75,900 | 803,422 |
| Smart Sand, Inc. (a) | | 23,314 | 59,218 |
| Tidewater, Inc. warrants 11/14/24 (a) | | 2,256 | 857 |
| Total Energy Services, Inc. | | 106,674 | 787,502 |
| Transocean Ltd. (United States) (a)(b) | | 228,232 | 1,955,948 |
| Unit Corp. (a) | | 347,399 | 5,544,488 |
| | | | 23,520,635 |
| Oil, Gas & Consumable Fuels - 4.5% | | | |
| Adams Resources & Energy, Inc. | | 7,768 | 307,846 |
| Beach Energy Ltd. | | 1,017,683 | 1,331,557 |
| Berry Petroleum Corp. | | 50,740 | 598,225 |
| Bonavista Energy Corp. | | 14,243 | 13,225 |
| Chevron Corp. | | 15,930 | 1,826,375 |
| China Petroleum & Chemical Corp.: | | | |
| (H Shares) | | 154,000 | 128,774 |
| sponsored ADR (H Shares) | | 6,202 | 517,557 |
| CNX Resources Corp. (a) | | 17,791 | 215,983 |
| ConocoPhillips Co. | | 56,277 | 3,809,390 |
| CONSOL Energy, Inc. (a) | | 9,185 | 326,343 |
| Contango Oil & Gas Co. (a) | | 167,625 | 633,623 |
| Delek U.S. Holdings, Inc. | | 3,609 | 117,329 |
| Denbury Resources, Inc. (a) | | 431,446 | 875,835 |
| Eni SpA | | 469,791 | 7,965,701 |
| Fuji Kosan Co. Ltd. | | 32,500 | 187,973 |
| Great Eastern Shipping Co. Ltd. | | 294,552 | 1,256,703 |
| Hankook Shell Oil Co. Ltd. | | 2,900 | 862,886 |
| HollyFrontier Corp. | | 3,190 | 179,725 |
| Kyungdong Invest Co. Ltd. | | 4,756 | 188,756 |
| Marathon Oil Corp. | | 234,856 | 3,708,376 |
| Marathon Petroleum Corp. | | 126,192 | 8,361,482 |
| Murphy Oil Corp. | | 696,290 | 19,043,532 |
| NACCO Industries, Inc. Class A | | 11,365 | 387,319 |
| Newfield Exploration Co. (a) | | 30,787 | 562,786 |
| Oil & Natural Gas Corp. Ltd. | | 2,516,300 | 5,008,841 |
| QEP Resources, Inc. (a) | | 115,064 | 951,579 |
| Reliance Industries Ltd. | | 9,000 | 155,642 |
| Southwestern Energy Co. (a) | | 2,980,574 | 13,025,108 |
| Star Petroleum Refining PCL | | 450,000 | 157,010 |
| Thai Oil PCL (For. Reg.) | | 31,500 | 72,599 |
| Total SA sponsored ADR | | 116,937 | 6,399,962 |
| Whitecap Resources, Inc. | | 27,564 | 92,932 |
| Whiting Petroleum Corp. (a) | | 201,059 | 5,756,319 |
| World Fuel Services Corp. | | 98,180 | 2,443,700 |
| WPX Energy, Inc. (a) | | 63,285 | 775,874 |
| | | | 88,246,867 |
|
| TOTAL ENERGY | | | 111,767,502 |
|
| FINANCIALS - 13.2% | | | |
| Banks - 1.0% | | | |
| ACNB Corp. | | 5,646 | 205,514 |
| American National Bankshares, Inc. | | 2,642 | 86,341 |
| Associated Banc-Corp. | | 10,424 | 225,680 |
| BancFirst Corp. | | 3,969 | 213,056 |
| Bank Ireland Group PLC | | 723,599 | 4,339,933 |
| Bank of America Corp. | | 7,503 | 213,610 |
| Camden National Corp. | | 3,425 | 138,781 |
| Cathay General Bancorp | | 40,381 | 1,498,943 |
| Central Pacific Financial Corp. | | 5,500 | 157,465 |
| Codorus Valley Bancorp, Inc. | | 42,776 | 945,350 |
| Cullen/Frost Bankers, Inc. | | 4,186 | 407,214 |
| Dah Sing Banking Group Ltd. | | 104,000 | 203,485 |
| Dimeco, Inc. | | 1,950 | 82,875 |
| East West Bancorp, Inc. | | 1,556 | 78,298 |
| First Bancorp, Puerto Rico | | 116,096 | 1,236,422 |
| First Citizens Bancshares, Inc. | | 531 | 216,398 |
| First Hawaiian, Inc. | | 28,235 | 726,487 |
| Hanmi Financial Corp. | | 19,080 | 418,424 |
| Hope Bancorp, Inc. | | 78,821 | 1,127,929 |
| Huntington Bancshares, Inc. | | 5,084 | 67,312 |
| KeyCorp | | 8,793 | 144,821 |
| LCNB Corp. | | 6,890 | 113,685 |
| Meridian Bank/Malvern, PA (a) | | 9,093 | 157,218 |
| NIBC Holding NV (d) | | 15,900 | 158,151 |
| OFG Bancorp | | 25,906 | 502,058 |
| Peoples Bancorp, Inc. | | 3,200 | 102,400 |
| PNC Financial Services Group, Inc. | | 1,629 | 199,829 |
| Popular, Inc. | | 2,081 | 113,643 |
| Regions Financial Corp. | | 12,117 | 183,815 |
| Signature Bank | | 845 | 107,577 |
| SpareBank 1 SR-Bank ASA (primary capital certificate) | | 79,547 | 860,177 |
| Sparebanken More (primary capital certificate) | | 13,469 | 456,741 |
| Sparebanken Nord-Norge | | 149,318 | 1,168,490 |
| Umpqua Holdings Corp. | | 5,087 | 89,938 |
| Van Lanschot NV (Bearer) | | 64,092 | 1,503,874 |
| Wells Fargo & Co. | | 11,841 | 579,143 |
| | | | 19,031,077 |
| Capital Markets - 0.9% | | | |
| AllianceBernstein Holding LP | | 42,122 | 1,284,300 |
| Ameriprise Financial, Inc. | | 816 | 103,306 |
| Ares Capital Corp. | | 12,698 | 206,977 |
| Banca Generali SpA | | 8,882 | 209,427 |
| Close Brothers Group PLC | | 7,389 | 143,917 |
| Franklin Resources, Inc. | | 83,781 | 2,480,755 |
| GAMCO Investors, Inc. Class A | | 8,060 | 160,797 |
| Hamilton Lane, Inc. Class A | | 4,834 | 175,329 |
| Lazard Ltd. Class A | | 51,987 | 2,068,563 |
| OM Asset Management Ltd. | | 12,170 | 150,543 |
| State Street Corp. | | 117,495 | 8,330,396 |
| Tullett Prebon PLC | | 43,605 | 180,156 |
| Waddell & Reed Financial, Inc. Class A (b) | | 158,235 | 2,708,983 |
| | | | 18,203,449 |
| Consumer Finance - 2.0% | | | |
| Aeon Credit Service (Asia) Co. Ltd. | | 822,000 | 744,271 |
| American Express Co. | | 2,229 | 228,918 |
| Discover Financial Services | | 72,080 | 4,864,679 |
| H&T Group PLC | | 31,489 | 124,729 |
| Navient Corp. | | 85,871 | 978,929 |
| Nicholas Financial, Inc. (a) | | 21,823 | 229,578 |
| Santander Consumer U.S.A. Holdings, Inc. | | 649,270 | 12,375,086 |
| Synchrony Financial | | 679,398 | 20,409,116 |
| | | | 39,955,306 |
| Diversified Financial Services - 0.3% | | | |
| AXA Equitable Holdings, Inc. | | 221,587 | 4,108,223 |
| Far East Horizon Ltd. | | 152,000 | 157,126 |
| Ricoh Leasing Co. Ltd. | | 49,400 | 1,510,232 |
| | | | 5,775,581 |
| Insurance - 8.0% | | | |
| AEGON NV | | 2,783,040 | 14,337,509 |
| AFLAC, Inc. | | 39,839 | 1,900,320 |
| Allstate Corp. | | 2,387 | 209,746 |
| Amerisafe, Inc. | | 2,122 | 126,068 |
| April | | 113,774 | 2,747,763 |
| ASR Nederland NV | | 35,890 | 1,514,198 |
| Assurant, Inc. | | 75,925 | 7,318,411 |
| Aub Group Ltd. | | 14,842 | 127,738 |
| Axis Capital Holdings Ltd. | | 105,571 | 5,653,327 |
| Employers Holdings, Inc. | | 5,468 | 231,679 |
| FBD Holdings PLC | | 7,443 | 70,710 |
| First American Financial Corp. | | 7,323 | 366,736 |
| FNF Group | | 3,086 | 111,590 |
| Great-West Lifeco, Inc. | | 6,255 | 134,245 |
| Hartford Financial Services Group, Inc. | | 109,600 | 5,142,432 |
| Hiscox Ltd. | | 10,761 | 200,138 |
| Hyundai Fire & Marine Insurance Co. Ltd. | | 5,787 | 194,299 |
| Lincoln National Corp. | | 288,527 | 16,875,944 |
| MetLife, Inc. | | 944,571 | 43,138,558 |
| National Western Life Group, Inc. | | 8,520 | 2,584,116 |
| NN Group NV | | 76,102 | 3,215,966 |
| Primerica, Inc. | | 4,413 | 495,889 |
| Principal Financial Group, Inc. | | 4,017 | 201,131 |
| RenaissanceRe Holdings Ltd. | | 92,644 | 12,787,651 |
| Sony Financial Holdings, Inc. | | 157,700 | 2,986,781 |
| The Travelers Companies, Inc. | | 1,688 | 211,912 |
| Torchmark Corp. | | 5,302 | 444,096 |
| Universal Insurance Holdings, Inc. | | 2,636 | 99,430 |
| Unum Group | | 972,712 | 33,811,469 |
| | | | 157,239,852 |
| Mortgage Real Estate Investment Trusts - 0.5% | | | |
| Annaly Capital Management, Inc. | | 946,564 | 9,882,128 |
| MFA Financial, Inc. | | 11,500 | 84,295 |
| Redwood Trust, Inc. | | 31,031 | 500,530 |
| | | | 10,466,953 |
| Thrifts & Mortgage Finance - 0.5% | | | |
| ASAX Co. Ltd. | | 23,900 | 121,996 |
| Genworth MI Canada, Inc. | | 233,350 | 7,940,240 |
| Genworth Mortgage Insurance Ltd. | | 398,410 | 642,921 |
| WSFS Financial Corp. | | 2,326 | 98,087 |
| | | | 8,803,244 |
|
| TOTAL FINANCIALS | | | 259,475,462 |
|
| HEALTH CARE - 13.0% | | | |
| Biotechnology - 1.9% | | | |
| Amgen, Inc. | | 184,266 | 34,478,011 |
| Celgene Corp. (a) | | 27,437 | 2,427,077 |
| Cell Biotech Co. Ltd. | | 3,100 | 78,863 |
| Essex Bio-Technology Ltd. | | 91,900 | 60,381 |
| Gilead Sciences, Inc. | | 12,341 | 863,993 |
| United Therapeutics Corp. (a) | | 751 | 86,613 |
| | | | 37,994,938 |
| Health Care Equipment & Supplies - 0.4% | | | |
| Apex Biotechnology Corp. | | 71,000 | 72,238 |
| Arts Optical International Holdings Ltd. | | 1,363,400 | 326,851 |
| Boston Scientific Corp. (a) | | 13,921 | 531,086 |
| Hoshiiryou Sanki Co. Ltd. | | 14,800 | 554,363 |
| LivaNova PLC (a) | | 2,980 | 275,114 |
| Nakanishi, Inc. | | 32,500 | 558,549 |
| Pacific Hospital Supply Co. Ltd. | | 67,000 | 165,879 |
| Prim SA | | 73,507 | 938,118 |
| ResMed, Inc. | | 4,640 | 441,589 |
| Shandong Weigao Medical Polymer Co. Ltd. (H Shares) | | 44,000 | 36,866 |
| St.Shine Optical Co. Ltd. | | 6,000 | 112,606 |
| Techno Medica Co. Ltd. | | 1,900 | 35,340 |
| Utah Medical Products, Inc. | | 16,970 | 1,594,162 |
| Varex Imaging Corp. (a) | | 5,621 | 160,142 |
| Vieworks Co. Ltd. | | 300 | 9,237 |
| Zimmer Biomet Holdings, Inc. | | 10,972 | 1,202,092 |
| | | | 7,014,232 |
| Health Care Providers & Services - 10.0% | | | |
| Anthem, Inc. | | 119,855 | 36,316,065 |
| CVS Health Corp. | | 196,844 | 12,903,124 |
| DVx, Inc. | | 35,800 | 358,904 |
| Humana, Inc. | | 564 | 174,270 |
| Laboratory Corp. of America Holdings (a) | | 11,675 | 1,626,911 |
| Medica Sur SA de CV | | 17,125 | 27,780 |
| MEDNAX, Inc. (a) | | 37,392 | 1,350,225 |
| Premier, Inc. (a) | | 11,976 | 476,525 |
| Quest Diagnostics, Inc. | | 1,720 | 150,242 |
| Ship Healthcare Holdings, Inc. | | 4,800 | 180,895 |
| Tokai Corp. | | 19,600 | 509,231 |
| Triple-S Management Corp. (a) | | 92,460 | 1,863,994 |
| United Drug PLC (United Kingdom) | | 135,362 | 1,029,737 |
| UnitedHealth Group, Inc. | | 486,000 | 131,317,193 |
| Universal Health Services, Inc. Class B | | 51,440 | 6,817,343 |
| WIN-Partners Co. Ltd. | | 128,400 | 1,182,329 |
| | | | 196,284,768 |
| Health Care Technology - 0.0% | | | |
| ND Software Co. Ltd. | | 62,800 | 756,425 |
| Pharmaceuticals - 0.7% | | | |
| Akorn, Inc. (a) | | 5,424 | 20,394 |
| Bliss Gvs Pharma Ltd. (a) | | 231,398 | 509,363 |
| Daewoong Co. Ltd. | | 21,038 | 346,085 |
| Daito Pharmaceutical Co. Ltd. | | 9,400 | 241,634 |
| Dawnrays Pharmaceutical Holdings Ltd. | | 2,305,200 | 459,119 |
| DongKook Pharmaceutical Co. Ltd. | | 796 | 40,357 |
| FDC Ltd. (a) | | 174,610 | 405,274 |
| Fuji Pharma Co. Ltd. | | 41,700 | 681,441 |
| Genomma Lab Internacional SA de CV (a) | | 341,021 | 236,475 |
| Indivior PLC (a) | | 853,749 | 1,270,387 |
| Jazz Pharmaceuticals PLC (a) | | 1,149 | 144,648 |
| Korea United Pharm, Inc. | | 14,404 | 302,989 |
| Kyung Dong Pharmaceutical Co. Ltd. | | 57,704 | 552,437 |
| Lee's Pharmaceutical Holdings Ltd. | | 513,500 | 417,375 |
| Novo Nordisk A/S Series B sponsored ADR | | 69,377 | 3,262,107 |
| Phibro Animal Health Corp. Class A | | 9,735 | 303,927 |
| Recordati SpA | | 103,205 | 3,737,584 |
| Taro Pharmaceutical Industries Ltd. | | 1,852 | 176,199 |
| Vivimed Labs Ltd. (a) | | 17,923 | 6,314 |
| Whanin Pharmaceutical Co. Ltd. | | 652 | 11,341 |
| | | | 13,125,450 |
|
| TOTAL HEALTH CARE | | | 255,175,813 |
|
| INDUSTRIALS - 6.4% | | | |
| Aerospace & Defense - 0.0% | | | |
| Astronics Corp. (a) | | 5,245 | 160,864 |
| Austal Ltd. | | 90,992 | 132,284 |
| United Technologies Corp. | | 4,774 | 563,666 |
| Vectrus, Inc. (a) | | 2,700 | 68,013 |
| | | | 924,827 |
| Air Freight & Logistics - 0.0% | | | |
| Air T, Inc. (a) | | 2,047 | 59,404 |
| Airlines - 0.1% | | | |
| Air New Zealand Ltd. | | 71,973 | 139,791 |
| American Airlines Group, Inc. | | 16,193 | 579,224 |
| JetBlue Airways Corp. (a) | | 21,069 | 379,031 |
| | | | 1,098,046 |
| Building Products - 0.1% | | | |
| Builders FirstSource, Inc. (a) | | 14,400 | 190,368 |
| Continental Building Products, Inc. (a) | | 10,300 | 271,302 |
| COVIA Corp. (a)(b) | | 7,623 | 35,676 |
| Gibraltar Industries, Inc. (a) | | 6,438 | 229,515 |
| Jeld-Wen Holding, Inc. (a) | | 45,733 | 815,877 |
| Kondotec, Inc. | | 106,100 | 911,725 |
| Owens Corning | | 2,500 | 130,975 |
| | | | 2,585,438 |
| Commercial Services & Supplies - 0.5% | | | |
| ABM Industries, Inc. | | 2,814 | 96,211 |
| Aeon Delight Co. Ltd. | | 7,000 | 259,307 |
| AJIS Co. Ltd. | | 45,800 | 1,326,592 |
| Asia File Corp. Bhd | | 252,700 | 162,873 |
| Calian Technologies Ltd. | | 35,663 | 828,097 |
| Civeo Corp. (a) | | 697,003 | 1,763,418 |
| Lion Rock Group Ltd. | | 1,168,000 | 208,605 |
| Mears Group PLC | | 50,588 | 209,006 |
| Mitie Group PLC | | 852,662 | 1,312,945 |
| NICE Total Cash Management Co., Ltd. | | 61,611 | 505,104 |
| Stericycle, Inc. (a) | | 2,720 | 119,898 |
| VICOM Ltd. | | 130,300 | 589,457 |
| VSE Corp. | | 44,956 | 1,466,914 |
| | | | 8,848,427 |
| Construction & Engineering - 1.1% | | | |
| AECOM (a) | | 424,234 | 12,985,803 |
| Arcadis NV | | 135,738 | 1,758,740 |
| Boustead Projs. Pte Ltd. | | 115,400 | 77,579 |
| Boustead Singapore Ltd. | | 245,700 | 144,186 |
| Daiichi Kensetsu Corp. | | 88,200 | 1,268,849 |
| EMCOR Group, Inc. | | 9,562 | 623,729 |
| Fluor Corp. | | 9,992 | 365,407 |
| Geumhwa PSC Co. Ltd. | | 21,639 | 598,149 |
| Kyeryong Construction Industrial Co. Ltd. (a) | | 27,197 | 629,543 |
| Meisei Industrial Co. Ltd. | | 71,200 | 460,177 |
| Mirait Holdings Corp. | | 26,200 | 377,877 |
| Nippon Rietec Co. Ltd. | | 59,900 | 805,082 |
| Severfield PLC | | 178,075 | 166,297 |
| Shinnihon Corp. | | 101,500 | 933,698 |
| Toshiba Plant Systems & Services Corp. | | 9,900 | 185,776 |
| United Integrated Services Co. | | 243,200 | 752,111 |
| | | | 22,133,003 |
| Electrical Equipment - 0.5% | | | |
| Aichi Electric Co. Ltd. | | 21,300 | 566,110 |
| Aros Quality Group AB | | 46,774 | 776,435 |
| AZZ, Inc. | | 38,198 | 1,709,361 |
| Bharat Heavy Electricals Ltd. | | 1,345,030 | 1,226,373 |
| Chiyoda Integre Co. Ltd. | | 21,200 | 370,964 |
| Eaton Corp. PLC | | 2,879 | 219,524 |
| Generac Holdings, Inc. (a) | | 9,121 | 482,775 |
| Hammond Power Solutions, Inc. Class A | | 25,210 | 115,310 |
| I-Sheng Electric Wire & Cable Co. Ltd. | | 738,000 | 974,534 |
| Korea Electric Terminal Co. Ltd. | | 43,576 | 1,653,054 |
| Regal Beloit Corp. | | 2,776 | 213,086 |
| Servotronics, Inc. | | 7,341 | 83,751 |
| TKH Group NV (depositary receipt) | | 12,937 | 624,292 |
| | | | 9,015,569 |
| Industrial Conglomerates - 0.8% | | | |
| DCC PLC (United Kingdom) | | 154,328 | 12,600,434 |
| General Electric Co. | | 68,800 | 699,008 |
| ITT, Inc. | | 5,526 | 290,447 |
| Lifco AB | | 29,943 | 1,197,938 |
| Mytilineos Holdings SA | | 56,097 | 527,795 |
| Reunert Ltd. | | 109,580 | 582,444 |
| | | | 15,898,066 |
| Machinery - 1.4% | | | |
| Aalberts Industries NV | | 428,817 | 15,014,304 |
| Allison Transmission Holdings, Inc. | | 18,231 | 887,303 |
| ASL Marine Holdings Ltd. (a) | | 2,913,700 | 151,507 |
| Cummins, Inc. | | 1,483 | 218,164 |
| Daiwa Industries Ltd. | | 12,000 | 120,523 |
| Global Brass & Copper Holdings, Inc. | | 5,965 | 180,382 |
| Haitian International Holdings Ltd. | | 547,000 | 1,260,049 |
| Hurco Companies, Inc. | | 3,481 | 133,496 |
| Hyster-Yale Materials Handling Class A | | 33,821 | 2,353,603 |
| Ihara Science Corp. | | 63,300 | 871,701 |
| Jaya Holdings Ltd. (a)(c) | | 47,300 | 1,019 |
| Kyowakogyosyo Co. Ltd. | | 2,800 | 114,005 |
| Luxfer Holdings PLC sponsored | | 13,102 | 260,861 |
| Maruzen Co. Ltd. | | 81,700 | 1,790,387 |
| Miller Industries, Inc. | | 5,578 | 167,619 |
| Mincon Group PLC | | 130,454 | 186,647 |
| Nadex Co. Ltd. | | 40,900 | 354,085 |
| Nitchitsu Co. Ltd. | | 2,800 | 48,327 |
| Rexnord Corp. (a) | | 6,742 | 176,303 |
| Semperit AG Holding (a) | | 24,534 | 393,143 |
| SIMPAC, Inc. | | 80,000 | 207,474 |
| Takamatsu Machinery Co. Ltd. | | 20,900 | 141,796 |
| The Weir Group PLC | | 6,580 | 129,886 |
| Tocalo Co. Ltd. | | 158,500 | 1,345,995 |
| Trinity Industrial Corp. | | 51,400 | 268,974 |
| WABCO Holdings, Inc. (a) | | 6,700 | 765,341 |
| | | | 27,542,894 |
| Marine - 0.0% | | | |
| SITC International Holdings Co. Ltd. | | 290,000 | 266,265 |
| Tokyo Kisen Co. Ltd. | | 42,500 | 289,121 |
| | | | 555,386 |
| Professional Services - 0.2% | | | |
| Asiakastieto Group Oyj (d) | | 4,995 | 129,782 |
| Boardroom Ltd. | | 131,800 | 64,128 |
| Kelly Services, Inc. Class A (non-vtg.) | | 6,001 | 134,422 |
| McMillan Shakespeare Ltd. | | 109,905 | 1,226,311 |
| Nielsen Holdings PLC | | 44,548 | 1,143,993 |
| Robert Half International, Inc. | | 3,000 | 193,290 |
| SHL-JAPAN Ltd. | | 6,600 | 104,643 |
| Sporton International, Inc. | | 30,000 | 162,656 |
| Synergie SA | | 8,272 | 255,640 |
| TrueBlue, Inc. (a) | | 8,225 | 200,608 |
| | | | 3,615,473 |
| Road & Rail - 0.7% | | | |
| Alps Logistics Co. Ltd. | | 146,100 | 1,055,595 |
| Chilled & Frozen Logistics Holdings Co. Ltd. | | 61,300 | 648,314 |
| CSX Corp. | | 5,431 | 356,817 |
| Daqin Railway Co. Ltd. (A Shares) | | 1,942,807 | 2,478,958 |
| Hamakyorex Co. Ltd. | | 82,200 | 2,935,580 |
| Higashi Twenty One Co. Ltd. | | 12,900 | 56,846 |
| Norfolk Southern Corp. | | 3,037 | 509,426 |
| Ryder System, Inc. | | 2,200 | 127,402 |
| Sakai Moving Service Co. Ltd. | | 69,700 | 3,800,946 |
| Trancom Co. Ltd. | | 43,600 | 2,673,840 |
| | | | 14,643,724 |
| Trading Companies & Distributors - 0.9% | | | |
| AddTech AB (B Shares) | | 69,806 | 1,374,773 |
| AerCap Holdings NV (a) | | 14,997 | 708,758 |
| Alconix Corp. | | 118,354 | 1,222,385 |
| Goodfellow, Inc. (a) | | 39,543 | 171,841 |
| HD Supply Holdings, Inc. (a) | | 36,996 | 1,551,612 |
| HERIGE | | 3,979 | 105,661 |
| Houston Wire & Cable Co. (a) | | 3,979 | 24,948 |
| Itochu Corp. | | 259,200 | 4,739,011 |
| KS Energy Services Ltd. (a) | | 674,500 | 13,027 |
| Lumax International Corp. Ltd. | | 29,000 | 62,436 |
| Meiwa Corp. | | 87,600 | 340,186 |
| Mitani Shoji Co. Ltd. | | 47,000 | 2,342,988 |
| MRC Global, Inc. (a) | | 60,715 | 948,368 |
| Otec Corp. | | 6,400 | 118,276 |
| Parker Corp. | | 114,000 | 474,106 |
| Richelieu Hardware Ltd. | | 45,358 | 811,573 |
| Senshu Electric Co. Ltd. | | 45,800 | 1,059,171 |
| Strongco Corp. (a) | | 43,337 | 54,421 |
| Tanaka Co. Ltd. | | 1,800 | 9,006 |
| TECHNO ASSOCIE Co. Ltd. | | 16,600 | 164,133 |
| Totech Corp. | | 58,200 | 1,171,748 |
| | | | 17,468,428 |
| Transportation Infrastructure - 0.1% | | | |
| Anhui Expressway Co. Ltd. (H Shares) | | 620,000 | 395,814 |
| Isewan Terminal Service Co. Ltd. | | 83,400 | 558,935 |
| James Fisher and Sons PLC | | 5,561 | 141,208 |
| Meiko Transportation Co. Ltd. | | 53,400 | 551,036 |
| Qingdao Port International Co. Ltd. (a)(d) | | 725,000 | 451,638 |
| Sinwa Ltd. | | 1,239,700 | 248,640 |
| | | | 2,347,271 |
|
| TOTAL INDUSTRIALS | | | 126,735,956 |
|
| INFORMATION TECHNOLOGY - 14.0% | | | |
| Communications Equipment - 0.1% | | | |
| F5 Networks, Inc. (a) | | 1,163 | 187,185 |
| InterDigital, Inc. | | 10,035 | 730,648 |
| Juniper Networks, Inc. | | 5,500 | 142,670 |
| | | | 1,060,503 |
| Electronic Equipment & Components - 4.4% | | | |
| A&D Co. Ltd. | | 38,700 | 243,729 |
| AVX Corp. | | 9,007 | 159,874 |
| Cardtronics PLC (a) | | 6,200 | 167,834 |
| Casa Systems, Inc. (a) | | 5,305 | 61,750 |
| CDW Corp. | | 11,378 | 947,446 |
| CTS Corp. | | 13,485 | 382,569 |
| Daido Signal Co. Ltd. | | 3,900 | 18,368 |
| Dynapack International Technology Corp. | | 189,000 | 291,993 |
| Elec & Eltek International Co. Ltd. | | 87,100 | 124,553 |
| Elematec Corp. | | 76,200 | 1,254,318 |
| ePlus, Inc. (a) | | 7,619 | 603,577 |
| Excel Co. Ltd. | | 38,100 | 670,532 |
| Fabrinet | | 5,200 | 295,568 |
| Hi-P International Ltd. | | 769,500 | 528,738 |
| Hon Hai Precision Industry Co. Ltd. (Foxconn) | | 10,773,000 | 24,979,541 |
| IDIS Holdings Co. Ltd. | | 48,087 | 579,242 |
| Image Sensing Systems, Inc. (a) | | 3,277 | 16,942 |
| Insight Enterprises, Inc. (a) | | 19,858 | 911,879 |
| Jabil, Inc. | | 7,406 | 197,370 |
| Keysight Technologies, Inc. (a) | | 64,735 | 4,791,685 |
| Kingboard Chemical Holdings Ltd. | | 4,622,000 | 16,263,644 |
| Kingboard Laminates Holdings Ltd. | | 240,500 | 248,916 |
| Muramoto Electronic Thailand PCL (For. Reg.) | | 79,300 | 543,220 |
| Nippo Ltd. | | 44,800 | 156,702 |
| PAX Global Technology Ltd. | | 262,000 | 114,902 |
| Philips Lighting NV (d) | | 5,214 | 129,325 |
| Pinnacle Technology Holdings Ltd. | | 445,900 | 588,314 |
| Plexus Corp. (a) | | 8,818 | 494,866 |
| Redington India Ltd. | | 326,661 | 337,893 |
| Sanmina Corp. (a) | | 1,445 | 45,113 |
| ScanSource, Inc. (a) | | 94,055 | 3,603,247 |
| Shibaura Electronics Co. Ltd. | | 32,000 | 1,101,675 |
| Sigmatron International, Inc. (a) | | 10,547 | 28,055 |
| Simplo Technology Co. Ltd. | | 372,000 | 2,732,332 |
| SYNNEX Corp. | | 176,149 | 17,044,177 |
| Tomen Devices Corp. | | 34,800 | 736,095 |
| Tripod Technology Corp. | | 84,000 | 226,071 |
| TTM Technologies, Inc. (a) | | 55,882 | 641,525 |
| UKC Holdings Corp. | | 64,800 | 1,141,027 |
| VST Holdings Ltd. | | 6,074,800 | 2,943,548 |
| Wayside Technology Group, Inc. | | 18,931 | 198,776 |
| Wireless Telecom Group, Inc. (a) | | 13,720 | 23,598 |
| | | | 86,570,529 |
| IT Services - 3.5% | | | |
| ALTEN | | 38,608 | 3,696,553 |
| Amdocs Ltd. | | 400,289 | 22,368,149 |
| Argo Graphics, Inc. | | 25,400 | 905,935 |
| CACI International, Inc. Class A (a) | | 3,827 | 639,798 |
| Carbonite, Inc. (a) | | 18,838 | 539,520 |
| Computer Services, Inc. | | 16,620 | 930,720 |
| CSE Global Ltd. | | 2,079,700 | 664,293 |
| Data#3 Ltd. | | 170,415 | 198,199 |
| Dimerco Data System Corp. | | 30,000 | 35,177 |
| E-Credible Co. Ltd. | | 7,775 | 112,177 |
| eClerx Services Ltd. (a) | | 101,259 | 1,533,084 |
| EOH Holdings Ltd. (a) | | 412,174 | 829,087 |
| Estore Corp. | | 9,200 | 63,684 |
| ExlService Holdings, Inc. (a) | | 10,659 | 612,893 |
| Gabia, Inc. | | 58,606 | 345,600 |
| Indra Sistemas SA (a) | | 813,800 | 8,364,650 |
| Know IT AB | | 89,763 | 1,622,973 |
| Leidos Holdings, Inc. | | 35,640 | 2,067,120 |
| Maximus, Inc. | | 16,200 | 1,136,106 |
| Net 1 UEPS Technologies, Inc. (a) | | 27,995 | 79,786 |
| NIC, Inc. | | 21,276 | 348,926 |
| Nice Information & Telecom, Inc. | | 4,280 | 75,410 |
| Sabre Corp. | | 4,234 | 97,297 |
| Science Applications International Corp. | | 22,833 | 1,533,008 |
| Societe Pour L'Informatique Industrielle SA | | 84,700 | 2,055,290 |
| Softcreate Co. Ltd. | | 38,900 | 473,193 |
| The Western Union Co. | | 917,896 | 16,751,602 |
| Total System Services, Inc. | | 7,518 | 673,688 |
| TravelSky Technology Ltd. (H Shares) | | 66,300 | 180,085 |
| WNS Holdings Ltd. sponsored ADR (a) | | 4,410 | 215,164 |
| | | | 69,149,167 |
| Semiconductors & Semiconductor Equipment - 0.6% | | | |
| Amkor Technology, Inc. (a) | | 11,478 | 91,824 |
| Axell Corp. | | 26,300 | 126,037 |
| Boe Varitronix Ltd. | | 324,000 | 84,236 |
| Cirrus Logic, Inc. (a) | | 5,505 | 204,511 |
| Entegris, Inc. | | 17,053 | 563,602 |
| Integrated Device Technology, Inc. (a) | | 11,475 | 560,554 |
| Leeno Industrial, Inc. | | 34,562 | 1,553,446 |
| Melexis NV (b) | | 67,080 | 4,729,634 |
| Miraial Co. Ltd. | | 8,500 | 88,960 |
| Nanometrics, Inc. (a) | | 16,837 | 515,044 |
| Phison Electronics Corp. | | 112,000 | 929,553 |
| Powertech Technology, Inc. | | 591,000 | 1,387,907 |
| Semtech Corp. (a) | | 3,076 | 149,371 |
| Trio-Tech International (a) | | 11,864 | 36,659 |
| United Microelectronics Corp. | | 240,000 | 91,692 |
| | | | 11,113,030 |
| Software - 2.1% | | | |
| AdaptIT Holdings Ltd. | | 162,119 | 73,214 |
| ANSYS, Inc. (a) | | 190,536 | 31,314,592 |
| Aspen Technology, Inc. (a) | | 5,868 | 567,025 |
| Ebix, Inc. (b) | | 93,589 | 5,345,804 |
| ICT Automatisering NV | | 30,668 | 410,700 |
| InfoVine Co. Ltd. | | 2,756 | 58,592 |
| j2 Global, Inc. | | 6,150 | 462,234 |
| Jorudan Co. Ltd. | | 21,000 | 192,022 |
| KSK Co., Ltd. | | 27,000 | 416,185 |
| Micro Focus International PLC | | 13,742 | 261,993 |
| NetGem SA | | 49,609 | 62,461 |
| Nucleus Software Exports Ltd. | | 35,047 | 175,482 |
| Pegasystems, Inc. | | 8,907 | 501,375 |
| Pro-Ship, Inc. | | 28,800 | 356,414 |
| RealPage, Inc. (a) | | 12,089 | 674,204 |
| Vitec Software Group AB | | 35,670 | 317,738 |
| Zensar Technologies Ltd. | | 210,635 | 666,843 |
| | | | 41,856,878 |
| Technology Hardware, Storage & Peripherals - 3.3% | | | |
| Compal Electronics, Inc. | | 3,985,000 | 2,390,542 |
| HP, Inc. | | 397,492 | 8,756,749 |
| Seagate Technology LLC | | 1,183,122 | 52,388,642 |
| Super Micro Computer, Inc. (a) | | 74,010 | 1,117,551 |
| TPV Technology Ltd. | | 4,488,000 | 623,924 |
| Western Digital Corp. | | 2,482 | 111,665 |
| | | | 65,389,073 |
|
| TOTAL INFORMATION TECHNOLOGY | | | 275,139,180 |
|
| MATERIALS - 3.6% | | | |
| Chemicals - 2.4% | | | |
| Axalta Coating Systems Ltd. (a) | | 30,022 | 769,164 |
| C. Uyemura & Co. Ltd. | | 24,700 | 1,446,739 |
| Cabot Corp. | | 911 | 42,717 |
| Chase Corp. | | 40,056 | 4,038,446 |
| Core Molding Technologies, Inc. | | 43,305 | 376,754 |
| Deepak Fertilisers and Petrochemicals Corp. Ltd. | | 69,617 | 114,835 |
| DowDuPont, Inc. | | 6,016 | 323,721 |
| EcoGreen International Group Ltd. | | 3,230,000 | 638,256 |
| FMC Corp. | | 76,908 | 6,137,258 |
| Fujikura Kasei Co., Ltd. | | 138,600 | 715,109 |
| Fuso Chemical Co. Ltd. | | 37,200 | 727,436 |
| Gujarat Narmada Valley Fertilizers Co. | | 288,542 | 1,335,564 |
| Gujarat State Fertilizers & Chemicals Ltd. | | 1,713,087 | 2,344,148 |
| Honshu Chemical Industry Co. Ltd. | | 49,100 | 542,275 |
| Huntsman Corp. | | 18,405 | 404,358 |
| Innospec, Inc. | | 51,229 | 3,599,862 |
| JSR Corp. | | 16,000 | 257,939 |
| KPC Holdings Corp. | | 3,573 | 191,428 |
| Miwon Chemicals Co. Ltd. | | 3,108 | 112,733 |
| Miwon Commercial Co. Ltd. | | 780 | 174,591 |
| Muto Seiko Co. Ltd. | | 13,400 | 64,709 |
| Nihon Parkerizing Co. Ltd. | | 20,000 | 236,126 |
| Nippon Soda Co. Ltd. | | 20,400 | 516,532 |
| SK Kaken Co. Ltd. | | 3,600 | 1,564,930 |
| Soken Chemical & Engineer Co. Ltd. | | 34,000 | 583,704 |
| T&K Toka Co. Ltd. | | 86,900 | 775,458 |
| Thai Carbon Black PCL (For. Reg.) (a) | | 739,800 | 1,113,015 |
| Thai Rayon PCL: | | | |
| (For. Reg.) | | 139,100 | 178,105 |
| NVDR | | 96,600 | 123,688 |
| The Chemours Co. LLC | | 15,401 | 550,586 |
| The Mosaic Co. | | 176,686 | 5,703,424 |
| UPL Ltd. (a) | | 52,595 | 582,948 |
| Westlake Chemical Corp. | | 6,639 | 490,622 |
| Yara International ASA | | 219,119 | 9,043,844 |
| Yip's Chemical Holdings Ltd. | | 1,658,000 | 522,776 |
| | | | 46,343,800 |
| Construction Materials - 0.1% | | | |
| Brampton Brick Ltd. Class A (sub. vtg.) (a) | | 36,729 | 190,361 |
| Mitani Sekisan Co. Ltd. | | 96,100 | 2,257,699 |
| RHI Magnesita NV | | 2,651 | 147,105 |
| | | | 2,595,165 |
| Containers & Packaging - 0.2% | | | |
| AMVIG Holdings Ltd. | | 305,000 | 69,573 |
| Chuoh Pack Industry Co. Ltd. | | 21,500 | 242,782 |
| Kohsoku Corp. | | 89,000 | 824,430 |
| Mayr-Melnhof Karton AG | | 1,353 | 178,094 |
| Pact Group Holdings Ltd. | | 41,554 | 114,479 |
| Samhwa Crown & Closure Co. Ltd. | | 2,820 | 119,018 |
| Silgan Holdings, Inc. | | 15,759 | 435,264 |
| The Pack Corp. | | 100,700 | 2,663,454 |
| | | | 4,647,094 |
| Metals & Mining - 0.8% | | | |
| Ausdrill Ltd. | | 590,409 | 540,752 |
| Chubu Steel Plate Co. Ltd. | | 26,800 | 149,839 |
| Cleveland-Cliffs, Inc. (b) | | 824,890 | 8,834,572 |
| Compania de Minas Buenaventura SA sponsored ADR | | 145,490 | 2,276,919 |
| Granges AB | | 15,847 | 151,931 |
| Hill & Smith Holdings PLC | | 51,962 | 752,413 |
| Nucor Corp. | | 1,708 | 104,598 |
| Orvana Minerals Corp. (a) | | 39,162 | 5,663 |
| Pacific Metals Co. Ltd. | | 22,400 | 598,841 |
| Steel Dynamics, Inc. | | 4,389 | 160,594 |
| Tohoku Steel Co. Ltd. | | 32,000 | 392,784 |
| Tokyo Tekko Co. Ltd. | | 39,000 | 427,505 |
| Universal Stainless & Alloy Products, Inc. (a) | | 4,709 | 84,432 |
| Warrior Metropolitan Coal, Inc. | | 67,796 | 1,947,779 |
| Webco Industries, Inc. (a) | | 419 | 50,699 |
| Worthington Industries, Inc. | | 1,832 | 69,121 |
| | | | 16,548,442 |
| Paper & Forest Products - 0.1% | | | |
| Louisiana-Pacific Corp. | | 6,252 | 152,424 |
| Stella-Jones, Inc. | | 38,419 | 1,239,747 |
| Western Forest Products, Inc. | | 117,796 | 180,197 |
| | | | 1,572,368 |
|
| TOTAL MATERIALS | | | 71,706,869 |
|
| REAL ESTATE - 0.5% | | | |
| Equity Real Estate Investment Trusts (REITs) - 0.2% | | | |
| Colony Capital, Inc. | | 117,421 | 712,745 |
| Corrections Corp. of America | | 93,911 | 1,866,012 |
| Four Corners Property Trust, Inc. | | 9,682 | 273,420 |
| National Health Investors, Inc. | | 1,688 | 140,543 |
| NSI NV | | 438 | 18,449 |
| Public Storage | | 794 | 168,741 |
| Sabra Health Care REIT, Inc. | | 11,627 | 238,819 |
| Spirit Realty Capital, Inc. | | 5,235 | 207,934 |
| Store Capital Corp. | | 10,529 | 340,297 |
| Ventas, Inc. | | 3,287 | 211,979 |
| VEREIT, Inc. | | 20,262 | 163,717 |
| | | | 4,342,656 |
| Real Estate Management & Development - 0.3% | | | |
| Anabuki Kosan, Inc. | | 2,300 | 58,258 |
| CBRE Group, Inc. (a) | | 3,558 | 162,779 |
| Century21 Real Estate Japan Ltd. | | 6,700 | 73,074 |
| Devine Ltd. (a) | | 64,674 | 10,107 |
| IMMOFINANZ Immobilien Anlagen AG | | 6,189 | 163,639 |
| Jones Lang LaSalle, Inc. | | 1,337 | 191,739 |
| LSL Property Services PLC | | 85,848 | 281,496 |
| Relo Group, Inc. | | 90,100 | 2,367,374 |
| Selvaag Bolig ASA | | 57,076 | 293,367 |
| Servcorp Ltd. | | 51,030 | 109,056 |
| Sino Land Ltd. | | 117,078 | 210,540 |
| Tejon Ranch Co. (a) | | 27,820 | 523,572 |
| Wing Tai Holdings Ltd. | | 104,130 | 158,570 |
| | | | 4,603,571 |
|
| TOTAL REAL ESTATE | | | 8,946,227 |
|
| UTILITIES - 1.9% | | | |
| Electric Utilities - 1.7% | | | |
| Edison International | | 18,551 | 1,056,850 |
| Exelon Corp. | | 187,333 | 8,947,024 |
| PG&E Corp. (a) | | 288,820 | 3,754,660 |
| PPL Corp. | | 659,549 | 20,657,075 |
| | | | 34,415,609 |
| Gas Utilities - 0.1% | | | |
| Busan City Gas Co. Ltd. | | 3,130 | 110,858 |
| China Resource Gas Group Ltd. | | 50,000 | 196,755 |
| Hokuriku Gas Co. | | 9,900 | 278,572 |
| K&O Energy Group, Inc. | | 21,300 | 282,566 |
| Keiyo Gas Co. Ltd. | | 7,300 | 195,962 |
| Star Gas Partners LP | | 11,559 | 105,765 |
| | | | 1,170,478 |
| Independent Power and Renewable Electricity Producers - 0.1% | | | |
| Mega First Corp. Bhd | | 1,250,800 | 1,206,216 |
| Mega First Corp. Bhd warrants 4/8/20 (a) | | 124,502 | 53,801 |
| The AES Corp. | | 6,000 | 98,340 |
| | | | 1,358,357 |
| Multi-Utilities - 0.0% | | | |
| CMS Energy Corp. | | 19,652 | 1,024,655 |
| Water Utilities - 0.0% | | | |
| Manila Water Co., Inc. | | 362,300 | 191,087 |
|
| TOTAL UTILITIES | | | 38,160,186 |
|
| TOTAL COMMON STOCKS | | | |
| (Cost $1,824,493,176) | | | 1,784,663,901 |
|
| Nonconvertible Preferred Stocks - 0.1% | | | |
| CONSUMER STAPLES - 0.0% | | | |
| Food Products - 0.0% | | | |
| Nam Yang Dairy Products | | 277 | 50,174 |
| INDUSTRIALS - 0.0% | | | |
| Industrial Conglomerates - 0.0% | | | |
| Steel Partners Holdings LP Series A, 6.00% | | 9,868 | 219,267 |
| MATERIALS - 0.1% | | | |
| Construction Materials - 0.1% | | | |
| Buzzi Unicem SpA (Risparmio Shares) | | 98,802 | 1,203,265 |
| TOTAL NONCONVERTIBLE PREFERRED STOCKS | | | |
| (Cost $1,703,534) | | | 1,472,706 |
| | | Principal Amount | Value |
|
| Nonconvertible Bonds - 0.0% | | | |
| ENERGY - 0.0% | | | |
| Oil, Gas & Consumable Fuels - 0.0% | | | |
| Centrus Energy Corp. 8.25% 2/28/27 (d) | | | |
| (Cost $210,026) | | 256,531 | 200,094 |
| | | Shares | Value |
|
| Money Market Funds - 10.0% | | | |
| Fidelity Cash Central Fund, 2.43% (e) | | 176,064,027 | 176,099,240 |
| Fidelity Securities Lending Cash Central Fund 2.43% (e)(f) | | 20,105,118 | 20,107,129 |
| TOTAL MONEY MARKET FUNDS | | | |
| (Cost $196,205,932) | | | 196,206,369 |
| TOTAL INVESTMENT IN SECURITIES - 100.9% | | | |
| (Cost $2,022,612,668) | | | 1,982,543,070 |
| NET OTHER ASSETS (LIABILITIES) - (0.9)% | | | (17,737,377) |
| NET ASSETS - 100% | | | $1,964,805,693 |
Legend
(a) Non-income producing
(b) Security or a portion of the security is on loan at period end.
(c) Level 3 security
(d) Security exempt from registration under Rule 144A of the Securities Act of 1933. These securities may be resold in transactions exempt from registration, normally to qualified institutional buyers. At the end of the period, the value of these securities amounted to $2,507,146 or 0.1% of net assets.
(e) Affiliated fund that is generally available only to investment companies and other accounts managed by Fidelity Investments. The rate quoted is the annualized seven-day yield of the fund at period end. A complete unaudited listing of the fund's holdings as of its most recent quarter end is available upon request. In addition, each Fidelity Central Fund's financial statements are available on the SEC's website or upon request.
(f) Investment made with cash collateral received from securities on loan.
Affiliated Central Funds
Information regarding fiscal year to date income earned by the Fund from investments in Fidelity Central Funds is as follows:
| Fund | Income earned |
| Fidelity Cash Central Fund | $2,084,646 |
| Fidelity Securities Lending Cash Central Fund | 133,294 |
| Total | $2,217,940 |
Amounts in the income column in the above table include any capital gain distributions from underlying funds, which are presented in the corresponding line-item in the Statement of Operations, if applicable.
Investment Valuation
The following is a summary of the inputs used, as of January 31, 2019, involving the Fund's assets and liabilities carried at fair value. The inputs or methodology used for valuing securities may not be an indication of the risk associated with investing in those securities. For more information on valuation inputs, and their aggregation into the levels used below, please refer to the Investment Valuation section in the accompanying Notes to Financial Statements.
| | Valuation Inputs at Reporting Date: |
| Description | Total | Level 1 | Level 2 | Level 3 |
| Investments in Securities: | | | | |
| Equities: | | | | |
| Communication Services | $81,936,154 | $81,523,023 | $413,131 | $-- |
| Consumer Discretionary | 395,433,426 | 388,278,228 | 6,034,569 | 1,120,629 |
| Consumer Staples | 160,237,300 | 159,360,045 | 848,249 | 29,006 |
| Energy | 111,767,502 | 103,673,027 | 8,094,475 | -- |
| Financials | 259,475,462 | 244,033,071 | 15,442,391 | -- |
| Health Care | 255,175,813 | 253,524,498 | 1,651,315 | -- |
| Industrials | 126,955,223 | 122,420,096 | 4,534,108 | 1,019 |
| Information Technology | 275,139,180 | 221,353,124 | 53,786,056 | -- |
| Materials | 72,910,134 | 71,679,529 | 1,230,605 | -- |
| Real Estate | 8,946,227 | 8,735,687 | 210,540 | -- |
| Utilities | 38,160,186 | 37,963,431 | 196,755 | -- |
| Corporate Bonds | 200,094 | -- | 200,094 | -- |
| Money Market Funds | 196,206,369 | 196,206,369 | -- | -- |
| Total Investments in Securities: | $1,982,543,070 | $1,888,750,128 | $92,642,288 | $1,150,654 |
Other Information
Distribution of investments by country or territory of incorporation, as a percentage of Total Net Assets, is as follows (Unaudited):
| United States of America | 61.3% |
| Japan | 9.2% |
| United Kingdom | 5.6% |
| Canada | 4.1% |
| Ireland | 4.1% |
| Netherlands | 2.0% |
| Taiwan | 1.9% |
| Bermuda | 1.8% |
| Cayman Islands | 1.6% |
| Bailiwick of Guernsey | 1.1% |
| Others (Individually Less Than 1%) | 7.3% |
| | 100.0% |
See accompanying notes which are an integral part of the financial statements.
Financial Statements
Statement of Assets and Liabilities
| | | January 31, 2019 (Unaudited) |
| Assets | | |
Investment in securities, at value (including securities loaned of $19,541,433) — See accompanying schedule:
Unaffiliated issuers (cost $1,826,406,736) | $1,786,336,701 | |
| Fidelity Central Funds (cost $196,205,932) | 196,206,369 | |
| Total Investment in Securities (cost $2,022,612,668) | | $1,982,543,070 |
| Cash | | 13,753 |
| Foreign currency held at value (cost $292,732) | | 294,128 |
| Receivable for investments sold | | 3,472,656 |
| Receivable for fund shares sold | | 1,535,450 |
| Dividends receivable | | 1,186,347 |
| Interest receivable | | 9,004 |
| Distributions receivable from Fidelity Central Funds | | 366,468 |
| Other receivables | | 13,443 |
| Total assets | | 1,989,434,319 |
| Liabilities | | |
| Payable for investments purchased | $887,534 | |
| Payable for fund shares redeemed | 2,838,457 | |
| Accrued management fee | 794,131 | |
| Collateral on securities loaned | 20,108,504 | |
| Total liabilities | | 24,628,626 |
| Net Assets | | $1,964,805,693 |
| Net Assets consist of: | | |
| Paid in capital | | $1,995,246,645 |
| Total distributable earnings (loss) | | (30,440,952) |
| Net Assets, for 183,228,177 shares outstanding | | $1,964,805,693 |
| Net Asset Value, offering price and redemption price per share ($1,964,805,693 ÷ 183,228,177 shares) | | $10.72 |
See accompanying notes which are an integral part of the financial statements.
Statement of Operations
| | | Six months ended January 31, 2019 (Unaudited) |
| Investment Income | | |
| Dividends | | $19,058,801 |
| Interest | | 11,536 |
| Income from Fidelity Central Funds | | 2,217,940 |
| Total income | | 21,288,277 |
| Expenses | | |
| Management fee | $4,944,635 | |
| Independent trustees' fees and expenses | 6,341 | |
| Commitment fees | 2,661 | |
| Total expenses before reductions | 4,953,637 | |
| Expense reductions | (22,465) | |
| Total expenses after reductions | | 4,931,172 |
| Net investment income (loss) | | 16,357,105 |
| Realized and Unrealized Gain (Loss) | | |
| Net realized gain (loss) on: | | |
| Investment securities: | | |
| Unaffiliated issuers (net of foreign taxes of $62,799) | 20,500,071 | |
| Fidelity Central Funds | (2,279) | |
| Foreign currency transactions | (91,014) | |
| Total net realized gain (loss) | | 20,406,778 |
| Change in net unrealized appreciation (depreciation) on: | | |
| Investment securities: | | |
| Unaffiliated issuers | (135,516,845) | |
| Fidelity Central Funds | 436 | |
| Assets and liabilities in foreign currencies | 16,274 | |
| Total change in net unrealized appreciation (depreciation) | | (135,500,135) |
| Net gain (loss) | | (115,093,357) |
| Net increase (decrease) in net assets resulting from operations | | $(98,736,252) |
See accompanying notes which are an integral part of the financial statements.
Statement of Changes in Net Assets
| | Six months ended January 31, 2019 (Unaudited) | Year ended July 31, 2018 |
| Increase (Decrease) in Net Assets | | |
| Operations | | |
| Net investment income (loss) | $16,357,105 | $20,390,731 |
| Net realized gain (loss) | 20,406,778 | 857,583 |
| Change in net unrealized appreciation (depreciation) | (135,500,135) | 94,329,193 |
| Net increase (decrease) in net assets resulting from operations | (98,736,252) | 115,577,507 |
| Distributions to shareholders | (42,521,469) | – |
| Distributions to shareholders from net investment income | – | (4,957,186) |
| Distributions to shareholders from net realized gain | – | (908,817) |
| Total distributions | (42,521,469) | (5,866,003) |
| Share transactions | | |
| Proceeds from sales of shares | 257,611,171 | 1,772,742,021 |
| Reinvestment of distributions | 42,521,469 | 5,866,003 |
| Cost of shares redeemed | (286,828,047) | (255,030,778) |
| Net increase (decrease) in net assets resulting from share transactions | 13,304,593 | 1,523,577,246 |
| Total increase (decrease) in net assets | (127,953,128) | 1,633,288,750 |
| Net Assets | | |
| Beginning of period | 2,092,758,821 | 459,470,071 |
| End of period | $1,964,805,693 | $2,092,758,821 |
| Other Information | | |
| Undistributed net investment income end of period | | $15,458,700 |
| Shares | | |
| Sold | 23,990,676 | 158,977,052 |
| Issued in reinvestment of distributions | 3,927,749 | 531,341 |
| Redeemed | (26,388,326) | (22,708,193) |
| Net increase (decrease) | 1,530,099 | 136,800,200 |
See accompanying notes which are an integral part of the financial statements.
Financial Highlights
Fidelity Low-Priced Stock K6 Fund
| | Six months ended (Unaudited) January 31, | Years endedJuly 31, | |
| | 2019 | 2018 | 2017 A |
| Selected Per–Share Data | | | |
| Net asset value, beginning of period | $11.52 | $10.23 | $10.00 |
| Income from Investment Operations | | | |
| Net investment income (loss)B | .09 | .17 | –C |
| Net realized and unrealized gain (loss) | (.65) | 1.19 | .23 |
| Total from investment operations | (.56) | 1.36 | .23 |
| Distributions from net investment income | (.17) | (.06) | – |
| Distributions from net realized gain | (.06) | (.01) | – |
| Total distributions | (.24)D | (.07) | – |
| Net asset value, end of period | $10.72 | $11.52 | $10.23 |
| Total ReturnE,F | (4.90)% | 13.33% | 2.30% |
| Ratios to Average Net AssetsG,H | | | |
| Expenses before reductions | .50%I | .50% | .50%I |
| Expenses net of fee waivers, if any | .50%I | .50% | .50%I |
| Expenses net of all reductions | .50%I | .50% | .50%I |
| Net investment income (loss) | 1.65%I | 1.54% | (.14)%I |
| Supplemental Data | | | |
| Net assets, end of period (000 omitted) | $1,964,806 | $2,092,759 | $459,470 |
| Portfolio turnover rateJ | 28%I,K | 23%K | 3%K,L |
A For the period May 26, 2017 (commencement of operations) to July 31, 2017.
B Calculated based on average shares outstanding during the period.
C Amount represents less than $.005 per share.
D Total distributions of $.24 per share is comprised of distributions from net investment income of $.174 and distributions from net realized gain of $.063 per share.
E Total returns for periods of less than one year are not annualized.
F Total returns would have been lower if certain expenses had not been reduced during the applicable periods shown.
G Fees and expenses of any underlying Fidelity Central Funds are not included in the Fund's expense ratio. The Fund indirectly bears its proportionate share of the expenses of any underlying Fidelity Central Funds.
H Expense ratios reflect operating expenses of the Fund. Expenses before reductions do not reflect amounts reimbursed by the investment adviser or reductions from brokerage service arrangements or reductions from other expense offset arrangements and do not represent the amount paid by the Fund during periods when reimbursements or reductions occur. Expenses net of fee waivers reflect expenses after reimbursement by the investment adviser but prior to reductions from brokerage service arrangements or other expense offset arrangements. Expenses net of all reductions represent the net expenses paid by the Fund.
I Annualized
J Amount does not include the portfolio activity of any underlying Fidelity Central Funds.
K Portfolio turnover rate excludes securities received or delivered in-kind.
L Amount not annualized.
See accompanying notes which are an integral part of the financial statements.
Notes to Financial Statements (Unaudited)
For the period ended January 31, 2019
1. Organization.
Fidelity Low-Priced Stock K6 Fund (the Fund) is a fund of Fidelity Puritan Trust (the Trust) and is authorized to issue an unlimited number of shares. Share transactions on the Statement of Changes in Net Assets may contain exchanges between affiliated funds. The Trust is registered under the Investment Company Act of 1940, as amended (the 1940 Act), as an open-end management investment company organized as a Massachusetts business trust. Shares generally are available only to employer-sponsored retirement plans that are recordkept by Fidelity, or to certain employer-sponsored retirement plans that are not recordkept by Fidelity.
2. Investments in Fidelity Central Funds.
The Fund invests in Fidelity Central Funds, which are open-end investment companies generally available only to other investment companies and accounts managed by the investment adviser and its affiliates. The Fund's Schedule of Investments lists each of the Fidelity Central Funds held as of period end, if any, as an investment of the Fund, but does not include the underlying holdings of each Fidelity Central Fund. As an Investing Fund, the Fund indirectly bears its proportionate share of the expenses of the underlying Fidelity Central Funds.
The Money Market Central Funds seek preservation of capital and current income and are managed by Fidelity Investments Money Management, Inc. (FIMM), an affiliate of the investment adviser. Annualized expenses of the Money Market Central Funds as of their most recent shareholder report date are less than .005%.
A complete unaudited list of holdings for each Fidelity Central Fund is available upon request or at the Securities and Exchange Commission (the SEC) website at www.sec.gov. In addition, the financial statements of the Fidelity Central Funds are available on the SEC website or upon request.
3. Significant Accounting Policies.
The Fund is an investment company and applies the accounting and reporting guidance of the Financial Accounting Standards Board (FASB) Accounting Standards Codification Topic 946 Financial Services – Investments Companies. The financial statements have been prepared in conformity with accounting principles generally accepted in the United States of America (GAAP), which require management to make certain estimates and assumptions at the date of the financial statements. Actual results could differ from those estimates. Subsequent events, if any, through the date that the financial statements were issued have been evaluated in the preparation of the financial statements. The following summarizes the significant accounting policies of the Fund:
Investment Valuation. Investments are valued as of 4:00 p.m. Eastern time on the last calendar day of the period. The Board of Trustees (the Board) has delegated the day to day responsibility for the valuation of the Fund's investments to the Fair Value Committee (the Committee) established by the Fund's investment adviser. In accordance with valuation policies and procedures approved by the Board, the Fund attempts to obtain prices from one or more third party pricing vendors or brokers to value its investments. When current market prices, quotations or currency exchange rates are not readily available or reliable, investments will be fair valued in good faith by the Committee, in accordance with procedures adopted by the Board. Factors used in determining fair value vary by investment type and may include market or investment specific events, changes in interest rates and credit quality. The frequency with which these procedures are used cannot be predicted and they may be utilized to a significant extent. The Committee oversees the Fund's valuation policies and procedures and reports to the Board on the Committee's activities and fair value determinations. The Board monitors the appropriateness of the procedures used in valuing the Fund's investments and ratifies the fair value determinations of the Committee.
The Fund categorizes the inputs to valuation techniques used to value its investments into a disclosure hierarchy consisting of three levels as shown below:
- Level 1 – quoted prices in active markets for identical investments
- Level 2 – other significant observable inputs (including quoted prices for similar investments, interest rates, prepayment speeds, etc.)
- Level 3 – unobservable inputs (including the Fund's own assumptions based on the best information available)
Valuation techniques used to value the Fund's investments by major category are as follows:
Equity securities, including restricted securities, for which market quotations are readily available, are valued at the last reported sale price or official closing price as reported by a third party pricing vendor on the primary market or exchange on which they are traded and are categorized as Level 1 in the hierarchy. In the event there were no sales during the day or closing prices are not available, securities are valued at the last quoted bid price or may be valued using the last available price and are generally categorized as Level 2 in the hierarchy. For foreign equity securities, when market or security specific events arise, comparisons to the valuation of American Depositary Receipts (ADRs), futures contracts, Exchange-Traded Funds (ETFs) and certain indexes as well as quoted prices for similar securities may be used and would be categorized as Level 2 in the hierarchy. For equity securities, including restricted securities, where observable inputs are limited, assumptions about market activity and risk are used and these securities may be categorized as Level 3 in the hierarchy.
Debt securities, including restricted securities, are valued based on evaluated prices received from third party pricing vendors or from brokers who make markets in such securities. Corporate bonds are valued by pricing vendors who utilize matrix pricing which considers yield or price of bonds of comparable quality, coupon, maturity and type or by broker-supplied prices. When independent prices are unavailable or unreliable, debt securities may be valued utilizing pricing methodologies which consider similar factors that would be used by third party pricing vendors. Debt securities are generally categorized as Level 2 in the hierarchy but may be Level 3 depending on the circumstances.
Investments in open-end mutual funds, including the Fidelity Central Funds, are valued at their closing net asset value (NAV) each business day and are categorized as Level 1 in the hierarchy.
Changes in valuation techniques may result in transfers in or out of an assigned level within the disclosure hierarchy. The aggregate value of investments by input level as of January 31, 2019 is included at the end of the Fund's Schedule of Investments.
Foreign Currency. The Fund may use foreign currency contracts to facilitate transactions in foreign-denominated securities. Gains and losses from these transactions may arise from changes in the value of the foreign currency or if the counterparties do not perform under the contracts' terms.
Foreign-denominated assets, including investment securities, and liabilities are translated into U.S. dollars at the exchange rates at period end. Purchases and sales of investment securities, income and dividends received and expenses denominated in foreign currencies are translated into U.S. dollars at the exchange rate in effect on the transaction date.
The effects of exchange rate fluctuations on investments are included with the net realized and unrealized gain (loss) on investment securities. Other foreign currency transactions resulting in realized and unrealized gain (loss) are disclosed separately.
Investment Transactions and Income. For financial reporting purposes, the Fund's investment holdings and NAV include trades executed through the end of the last business day of the period. The NAV per share for processing shareholder transactions is calculated as of the close of business of the New York Stock Exchange (NYSE), normally 4:00 p.m. Eastern time and includes trades executed through the end of the prior business day. Gains and losses on securities sold are determined on the basis of identified cost. Dividend income is recorded on the ex-dividend date, except for certain dividends from foreign securities where the ex-dividend date may have passed, which are recorded as soon as the Fund is informed of the ex-dividend date. Non-cash dividends included in dividend income, if any, are recorded at the fair market value of the securities received. Income and capital gain distributions from Fidelity Central Funds, if any, are recorded on the ex-dividend date. Certain distributions received by the Fund represent a return of capital or capital gain. The Fund determines the components of these distributions subsequent to the ex-dividend date, based upon receipt of tax filings or other correspondence relating to the underlying investment. These distributions are recorded as a reduction of cost of investments and/or as a realized gain. Interest income is accrued as earned and includes coupon interest and amortization of premium and accretion of discount on debt securities as applicable. Investment income is recorded net of foreign taxes withheld where recovery of such taxes is uncertain.
Expenses. Expenses directly attributable to a fund are charged to that fund. Expenses attributable to more than one fund are allocated among the respective funds on the basis of relative net assets or other appropriate methods. Expense estimates are accrued in the period to which they relate and adjustments are made when actual amounts are known.
Income Tax Information and Distributions to Shareholders. Each year, the Fund intends to qualify as a regulated investment company under Subchapter M of the Internal Revenue Code, including distributing substantially all of its taxable income and realized gains. As a result, no provision for U.S. Federal income taxes is required. The Fund files a U.S. federal tax return, in addition to state and local tax returns as required. The Fund's federal income tax returns are subject to examination by the Internal Revenue Service (IRS) for a period of three fiscal years after they are filed. State and local tax returns may be subject to examination for an additional fiscal year depending on the jurisdiction. Foreign taxes are provided for based on the Fund's understanding of the tax rules and rates that exist in the foreign markets in which it invests. The Fund is subject to a tax imposed on capital gains by certain countries in which it invests.
Distributions are declared and recorded on the ex-dividend date. Income and capital gain distributions are determined in accordance with income tax regulations, which may differ from GAAP.
Capital accounts within the financial statements are adjusted for permanent book-tax differences. These adjustments have no impact on net assets or the results of operations. Capital accounts are not adjusted for temporary book-tax differences which will reverse in a subsequent period.
Book-tax differences are primarily due to foreign currency transactions, certain foreign taxes, passive foreign investment companies (PFIC), partnerships, market discount and losses deferred due to wash sales.
As of period end, the cost and unrealized appreciation (depreciation) in securities, and derivatives if applicable, for federal income tax purposes were as follows:
| Gross unrealized appreciation | $146,919,699 |
| Gross unrealized depreciation | (187,928,346) |
| Net unrealized appreciation (depreciation) | $(41,008,647) |
| Tax cost | $2,023,551,717 |
Restricted Securities. The Fund may invest in securities that are subject to legal or contractual restrictions on resale. These securities generally may be resold in transactions exempt from registration or to the public if the securities are registered. Disposal of these securities may involve time-consuming negotiations and expense, and prompt sale at an acceptable price may be difficult. Information regarding restricted securities is included at the end of the Fund's Schedule of Investments.
New Rule Issuance. During August 2018, the U.S. Securities and Exchange Commission issued Final Rule Release No. 33-10532, Disclosure Update and Simplification. This Final Rule includes amendments specific to registered investment companies that are intended to eliminate overlap in disclosure requirements between Regulation S-X and GAAP. In accordance with these amendments, certain line-items in the Fund's financial statements have been combined or removed for the current period as outlined in the table below.
| Financial Statement | Current Line-Item Presentation (As Applicable) | Prior Line-Item Presentation (As Applicable) |
| Statement of Assets and Liabilities | Total distributable earnings (loss) | Undistributed/Distributions in excess of/Accumulated net investment income (loss)
Accumulated/Undistributed net realized gain (loss)
Net unrealized appreciation (depreciation) |
| Statement of Changes in Net Assets | N/A - removed | Undistributed/Distributions in excess of/Accumulated net investment income (loss) end of period |
| Statement of Changes in Net Assets | Distributions to shareholders | Distributions to shareholders from net investment income
Distributions to shareholders from net realized gain |
4. Purchases and Sales of Investments.
Purchases and sales of securities, other than short-term securities and in-kind transactions, aggregated $248,046,352 and $304,792,225, respectively.
Unaffiliated Exchanges In-Kind. During the period, the Fund received investments, including accrued interest, and cash valued at $104,208,514 in exchange for 10,033,204 shares of the Fund. The amount of in-kind exchanges is included in share transactions in the accompanying Statement of Changes in Net Assets.
Prior Fiscal Year Exchanges In-Kind. During the prior period, an unaffiliated entity completed an exchange in-kind with the Fund. The unaffiliated entity delivered investments, including accrued interest and cash, valued at $1,195,778,687 in exchange for 107,583,509 shares of the Fund. The amount of in-kind exchanges is included in share transactions in the accompanying Statement of Changes in Net Assets. The Fund recognized no gain or loss for federal income tax purposes.
5. Fees and Other Transactions with Affiliates.
Management Fee. Fidelity Management & Research Company (the investment adviser) and its affiliates provide the Fund with investment management related services for which the Fund pays a monthly management fee that is based on an annual rate of .50% of average net assets. Under the management contract, the investment adviser or an affiliate pays all other expenses of the Fund, excluding fees and expenses of the independent Trustees, and certain miscellaneous expenses such as proxy and shareholder meeting expenses.
Brokerage Commissions. The Fund placed a portion of its portfolio transactions with brokerage firms which are affiliates of the investment adviser. Brokerage commissions are included in net realized gain (loss) and change in net unrealized appreciation (depreciation) in the Statement of Operations. The commissions paid to these affiliated firms were $6,607 for the period.
Interfund Trades. The Fund may purchase from or sell securities to other Fidelity Funds under procedures adopted by the Board. The procedures have been designed to ensure these interfund trades are executed in accordance with Rule 17a-7 of the 1940 Act. Interfund trades are included within the respective purchases and sales amounts shown in the Purchases and Sales of Investments note.
6. Committed Line of Credit.
The Fund participates with other funds managed by the investment adviser or an affiliate in a $4.25 billion credit facility (the "line of credit") to be utilized for temporary or emergency purposes to fund shareholder redemptions or for other short-term liquidity purposes. The Fund has agreed to pay commitment fees on its pro-rata portion of the line of credit, which amounted to $2,661 and is reflected in Commitment fees on the Statement of Operations. During the period, the Fund did not borrow on this line of credit.
7. Security Lending.
The Fund lends portfolio securities through a lending agent from time to time in order to earn additional income. For equity securities, a lending agent is used and may loan securities to certain qualified borrowers, including Fidelity Capital Markets (FCM), a broker-dealer affiliated with the Fund. On the settlement date of the loan, the Fund receives collateral (in the form of U.S. Treasury obligations, letters of credit and/or cash) against the loaned securities and maintains collateral in an amount not less than 100% of the market value of the loaned securities during the period of the loan. The market value of the loaned securities is determined at the close of business of the Fund and any additional required collateral is delivered to the Fund on the next business day. The Fund or borrower may terminate the loan at any time, and if the borrower defaults on its obligation to return the securities loaned because of insolvency or other reasons, the Fund may apply collateral received from the borrower against the obligation. The Fund may experience delays and costs in recovering the securities loaned. Any cash collateral received is invested in the Fidelity Securities Lending Cash Central Fund. The value of loaned securities and cash collateral at period end are disclosed on the Fund's Statement of Assets and Liabilities. At period end, there were no security loans outstanding with FCM. Security lending income represents the income earned on investing cash collateral, less rebates paid to borrowers and any lending agent fees associated with the loan, plus any premium payments received for lending certain types of securities. Security lending income is presented in the Statement of Operations as a component of income from Fidelity Central Funds. Total security lending income during the period amounted to $133,294, including $365 from securities loaned to FCM.
8. Expense Reductions.
Commissions paid to certain brokers with whom the investment adviser, or its affiliates, places trades on behalf of the Fund include an amount in addition to trade execution, which may be rebated back to the Fund to offset certain expenses. This amount totaled $21,689 for the period. In addition, through arrangements with the Fund's custodian and transfer agent, credits realized as a result of certain uninvested cash balances were used to reduce the Fund's expenses. During the period, these credits reduced the Fund's expenses by $776.
9. Other.
The Fund's organizational documents provide former and current trustees and officers with a limited indemnification against liabilities arising in connection with the performance of their duties to the Fund. In the normal course of business, the Fund may also enter into contracts that provide general indemnifications. The Fund's maximum exposure under these arrangements is unknown as this would be dependent on future claims that may be made against the Fund. The risk of material loss from such claims is considered remote.
Shareholder Expense Example
As a shareholder of the Fund, you incur two types of costs: (1) transaction costs and (2) ongoing costs, including management fees and other Fund expenses. This Example is intended to help you understand your ongoing costs (in dollars) of investing in the Fund and to compare these costs with the ongoing costs of investing in other mutual funds.
The Example is based on an investment of $1,000 invested at the beginning of the period and held for the entire period (August 1, 2018 to January 31, 2019).
Actual Expenses
The first line of the accompanying table provides information about actual account values and actual expenses. You may use the information in this line, together with the amount you invested, to estimate the expenses that you paid over the period. Simply divide your account value by $1,000.00 (for example, an $8,600 account value divided by $1,000.00 = 8.6), then multiply the result by the number in the first line under the heading entitled "Expenses Paid During Period" to estimate the expenses you paid on your account during this period. In addition, the Fund, as a shareholder in the underlying Fidelity Central Funds, will indirectly bear its pro-rata share of the fees and expenses incurred by the underlying Fidelity Central Funds. These fees and expenses are not included in the Fund's annualized expense ratio used to calculate the expense estimate in the table below.
Hypothetical Example for Comparison Purposes
The second line of the accompanying table provides information about hypothetical account values and hypothetical expenses based on the Fund's actual expense ratio and an assumed rate of return of 5% per year before expenses, which is not the Fund's actual return. The hypothetical account values and expenses may not be used to estimate the actual ending account balance or expenses you paid for the period. You may use this information to compare the ongoing costs of investing in the Fund and other funds. To do so, compare this 5% hypothetical example with the 5% hypothetical examples that appear in the shareholder reports of the other funds. In addition, the Fund, as a shareholder in the underlying Fidelity Central Funds, will indirectly bear its pro-rata share of the fees and expenses incurred by the underlying Fidelity Central Funds. These fees and expenses are not included in the Fund's annualized expense ratio used to calculate the expense estimate in the table below.
Please note that the expenses shown in the table are meant to highlight your ongoing costs only and do not reflect any transaction costs. Therefore, the second line of the table is useful in comparing ongoing costs only, and will not help you determine the relative total costs of owning different funds.
| | Annualized Expense Ratio-A | Beginning
Account Value
August 1, 2018 | Ending
Account Value
January 31, 2019 | Expenses Paid
During Period-B
August 1, 2018
to January 31, 2019 |
| Actual | .50% | $1,000.00 | $951.00 | $2.46 |
| Hypothetical-C | | $1,000.00 | $1,022.68 | $2.55 |
A Annualized expense ratio reflects expenses net of applicable fee waivers.
B Expenses are equal to the Fund's annualized expense ratio, multiplied by the average account value over the period, multiplied by 184/365 (to reflect the one-half year period).
C 5% return per year before expenses
Board Approval of Investment Advisory Contracts and Management Fees
Fidelity Low-Priced Stock K6 Fund
Each year, the Board of Trustees, including the Independent Trustees (together, the Board), votes on the renewal of the management contract with Fidelity Management & Research Company (FMR) and the sub-advisory agreements (together, the Advisory Contracts) for the fund. FMR and the sub-advisers are referred to herein as the Investment Advisers. The Board, assisted by the advice of fund counsel and Independent Trustees' counsel, requests and considers a broad range of information relevant to the renewal of the Advisory Contracts throughout the year.
The Board meets regularly and, at each of its meetings, covers an extensive agenda of topics and materials and considers factors that are relevant to its annual consideration of the renewal of the fund's Advisory Contracts, including the services and support provided to the fund and its shareholders. The Board has established various standing committees (Committees), each composed of and chaired by Independent Trustees with varying backgrounds, to which the Board has assigned specific subject matter responsibilities in order to enhance effective decision-making by the Board. The Board, acting directly and through its Committees, requests and receives information concerning the annual consideration of the renewal of the fund's Advisory Contracts. The Board also meets as needed to review matters specifically related to the Board's annual consideration of the renewal of the Advisory Contracts. Members of the Board may also meet with trustees of other Fidelity funds through joint ad hoc committees to discuss certain matters relevant to all of the Fidelity funds.
At its January 2019 meeting, the Board unanimously determined to renew the fund's Advisory Contracts. In reaching its determination, the Board considered all factors it believed relevant, including (i) the nature, extent, and quality of the services to be provided to the fund and its shareholders (including the investment performance of the fund); (ii) the competitiveness of the fund's management fee and total expense ratio relative to peer funds; (iii) the total costs of the services to be provided by and the profits to be realized by Fidelity from its relationships with the fund; and (iv) the extent to which, if any, economies of scale exist and would be realized as the fund grows, and whether any economies of scale are appropriately shared with fund shareholders.
In considering whether to renew the Advisory Contracts for the fund, the Board reached a determination, with the assistance of fund counsel and Independent Trustees' counsel and through the exercise of its business judgment, that the renewal of the Advisory Contracts was in the best interests of the fund and its shareholders and that the compensation payable under the Advisory Contracts was fair and reasonable. The Board's decision to renew the Advisory Contracts was not based on any single factor, but rather was based on a comprehensive consideration of all the information provided to the Board at its meetings throughout the year. The Board, in reaching its determination to renew the Advisory Contracts, was aware that shareholders of the fund have a broad range of investment choices available to them, including a wide choice among funds offered by Fidelity's competitors, and that the fund's shareholders, who have the opportunity to review and weigh the disclosure provided by the fund in its prospectus and other public disclosures, have chosen to invest in this fund, which is part of the Fidelity family of funds.
Nature, Extent, and Quality of Services Provided. The Board considered Fidelity's staffing as it relates to the fund, including the backgrounds of investment personnel of Fidelity, and also considered the fund's investment objective, strategies, and related investment philosophy. The Independent Trustees also had discussions with senior management of Fidelity's investment operations and investment groups. The Board considered the structure of the investment personnel compensation program and whether this structure provides appropriate incentives to act in the best interests of the fund. Additionally, the Board considered the portfolio managers' investments, if any, in the funds that they manage.
Resources Dedicated to Investment Management and Support Services. The Board and the Fund Oversight and Research Committees reviewed the general qualifications and capabilities of Fidelity's investment staff, including its size, education, experience, and resources, as well as Fidelity's approach to recruiting, training, managing, and compensating investment personnel. The Board noted that Fidelity has continued to increase the resources devoted to non-U.S. offices, including expansion of Fidelity's global investment organization. The Board also noted that Fidelity's analysts have extensive resources, tools and capabilities that allow them to conduct sophisticated quantitative and fundamental analysis, as well as credit analysis of issuers, counterparties and guarantors. Further, the Board considered that Fidelity's investment professionals have sufficient access to global information and data so as to provide competitive investment results over time, and that those professionals also have access to sophisticated tools that permit them to assess portfolio construction and risk and performance attribution characteristics continuously, as well as to transmit new information and research conclusions rapidly around the world. Additionally, in its deliberations, the Board considered Fidelity's trading, risk management, compliance, and technology and operations capabilities and resources, which are integral parts of the investment management process.
Shareholder and Administrative Services. The Board considered (i) the nature, extent, quality, and cost of advisory, administrative, and shareholder services performed by the Investment Advisers and their affiliates under the Advisory Contracts and under separate agreements covering transfer agency, pricing and bookkeeping, and securities lending services for the fund; (ii) the nature and extent of the supervision of third party service providers, principally custodians, subcustodians, and pricing vendors; and (iii) the resources devoted to, and the record of compliance with, the fund's compliance policies and procedures. The Board also reviewed the allocation of fund brokerage, including allocations to brokers affiliated with the Investment Advisers, the use of brokerage commissions to pay fund expenses, and the use of "soft" commission dollars to pay for research services.
The Board noted that the growth of fund assets over time across the complex allows Fidelity to reinvest in the development of services designed to enhance the value and convenience of the Fidelity funds as investment vehicles. These services include 24-hour access to account information and market information through telephone representatives and over the Internet, investor education materials and asset allocation tools, and the expanded availability of Fidelity Investor Centers.
The Board noted that it and the boards of certain other Fidelity funds had formed an ad hoc Committee on Transfer Agency Fees to review the variety of transfer agency fee structures throughout the industry and Fidelity's competitive positioning with respect to industry participants.
Investment in a Large Fund Family. The Board considered the benefits to shareholders of investing in a Fidelity fund, including the benefits of investing in a fund that is part of a large family of funds offering a variety of investment disciplines and providing a large variety of mutual fund investor services. The Board noted that Fidelity had taken, or had made recommendations that resulted in the Fidelity funds taking, a number of actions over the previous year that benefited particular funds, including: (i) continuing to dedicate additional resources to Fidelity's investment research process, which includes meetings with management of issuers of securities in which the funds invest, and to the support of the senior management team that oversees asset management; (ii) continuing efforts to enhance Fidelity's global research capabilities; (iii) launching new funds and making other enhancements to meet client needs; (iv) launching new share classes of existing funds; (v) eliminating purchase minimums and broadening eligibility requirements for certain funds and share classes; (vi) reducing management fees and total expenses for certain growth equity funds and index funds; (vii) lowering expense caps for certain existing funds and classes, and converting certain voluntary expense caps to contractual caps, to reduce expenses borne by shareholders; (viii) eliminating short-term redemption fees for funds that had such fees; (ix) rationalizing product lines and gaining increased efficiencies from fund mergers and share class consolidations; (x) continuing to develop, acquire and implement systems and technology to improve services to the funds and shareholders, strengthen information security, and increase efficiency; and (xi) continuing to implement enhancements to further strengthen Fidelity's product line to increase investors' probability of success in achieving their investment goals, including retirement income goals.
Investment Performance. The Board considered whether the fund has operated in accordance with its investment objective, as well as its record of compliance with its investment restrictions and its performance history. The fund had portfolio manager changes in April 2018 and June 2018. The Board will continue to monitor closely the fund's performance, taking into account the portfolio manager changes.
The Board took into account discussions that occur at Board meetings throughout the year with representatives of the Investment Advisers about fund investment performance. In this regard the Board noted that as part of regularly scheduled fund reviews and other reports to the Board on fund performance, the Board considers annualized return information for the fund for different time periods, measured against an appropriate securities market index ("benchmark index") and a peer group of funds with similar objectives ("peer group"), if any. In its evaluation of fund investment performance, the Board gave particular attention to information indicating changes in performance of certain Fidelity funds for specific time periods and discussed with the Investment Advisers the reasons for any overperformance or underperformance.
In addition to reviewing absolute and relative fund performance, the Independent Trustees periodically consider the appropriateness of fund performance metrics in evaluating the results achieved. In general, the Independent Trustees believe that fund performance should be evaluated based on net performance (after fees and expenses) of both the highest performing and lowest performing fund share classes, where applicable, compared to appropriate benchmark indices, over appropriate time periods that may include full market cycles, and compared to peer groups, as applicable, over the same periods, taking into account relevant factors including the following: general market conditions; issuer-specific information; and fund cash flows and other factors.
The Independent Trustees recognize that shareholders evaluate performance on a net basis over their own holding periods, for which one-, three-, and five-year periods are often used as a proxy. For this reason, the performance information reviewed by the Board also included net total return information for the fund and an appropriate benchmark index and peer group for the most recent one-year period ended June 30, 2018, as shown below. Returns are shown compared to the 25th percentile (top of box, 75% beaten) and 75th percentile (bottom of box, 25% beaten) of the peer universe.
Fidelity Low-Priced Stock K6 Fund
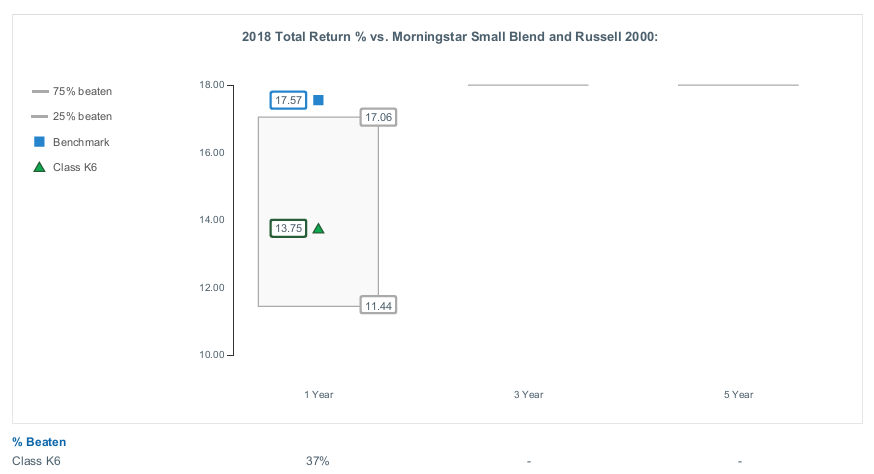
Based on its review, the Board concluded that the nature, extent, and quality of services provided to the fund under the Advisory Contracts should continue to benefit the shareholders of the fund.
Competitiveness of Management Fee and Total Expense Ratio. The Board considered the fund's management fee and total expense ratio compared to "mapped groups" of competitive funds and classes created for the purpose of facilitating the Trustees' competitive analysis of management fees and total expenses. Fidelity creates "mapped groups" by combining similar Lipper investment objective categories that have comparable investment mandates. Combining Lipper investment objective categories aids the Board's management fee and total expense ratio comparisons by broadening the competitive group used for comparison.
Management Fee. The Board considered two proprietary management fee comparisons for the 12-month period ended June 30 shown in basis points (BP) in the chart below. The group of Lipper funds used by the Board for management fee comparisons is referred to below as the "Total Mapped Group." The Total Mapped Group comparison focuses on a fund's standing in terms of gross management fees before expense reimbursements or caps relative to the total universe of funds with comparable investment mandates, regardless of whether their management fee structures also are comparable. Funds with comparable investment mandates offer exposure to similar types of securities. Funds with comparable management fee structures have similar management fee contractual arrangements (
e.g., flat rate charged for advisory services, all-inclusive fee rate,
etc.). "TMG %" represents the percentage of funds in the Total Mapped Group that had management fees that were lower than the fund's. For example, a hypothetical TMG % of 20% would mean that 80% of the funds in the Total Mapped Group had higher, and 20% had lower, management fees than the fund. The fund's actual TMG % and the number of funds in the Total Mapped Group are in the chart below. The "Asset-Size Peer Group" (ASPG) comparison focuses on a fund's standing relative to a subset of non-Fidelity funds within the Total Mapped Group that are similar in size and management fee structure. For example, if a fund is in the first quartile of the ASPG, the fund's management fee ranks in the least expensive or lowest 25% of funds in the ASPG. The ASPG represents at least 15% of the funds in the Total Mapped Group with comparable asset size and management fee structures, subject to a minimum of 50 funds (or all funds in the Total Mapped Group if fewer than 50). Additional information, such as the ASPG quartile in which the fund's management fee rate ranked, is also included in the chart and was considered by the Board.
Fidelity Low-Priced Stock K6 Fund
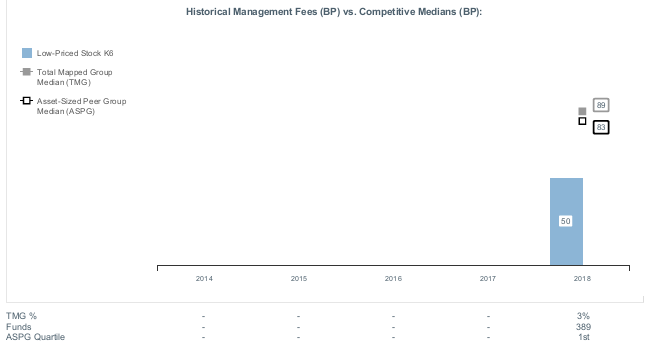
The Board noted that the fund's management fee rate ranked below the median of its Total Mapped Group and below the median of its ASPG for the 12-month period ended June 30, 2018.
The Board noted that it and the boards of other Fidelity funds formed an ad hoc Committee on Group Fee, which meets periodically, to conduct an in-depth review of the "group fee" component of the management fee of funds with such management fee structures. The Committee's focus included the mechanics of the group fee, the competitive landscape of group fee structures, Fidelity funds with no group fee component (such as the fund) and investment products not included in group fee assets. The Board also considered that, for funds subject to the group fee, FMR agreed to voluntarily waive fees over a specified period of time in amounts designed to account for assets converted from certain funds to certain collective investment trusts.
The Board also noted that, in 2013, the ad hoc Committee on Management Fees was formed to conduct an in-depth review of the management fee rates of Fidelity's active equity mutual funds. The Committee focused on the following areas: (i) standard fee structures; (ii) research consumption and trading evolution; (iii) management fee competitiveness/profitability by category; and (iv) factors that drive institutional pricing.
Based on its review, the Board concluded that the fund's management fee is fair and reasonable in light of the services that the fund receives and the other factors considered.
Total Expense Ratio. In its review of the fund's total expense ratio, the Board considered the fund's unitary fee rate as well as other fund expenses paid by FMR under the fund's management contract, such as transfer agent fees, pricing and bookkeeping fees, and custodial, legal, and audit fees. The Board also noted that Fidelity may agree to waive fees and expenses from time to time, and the extent to which, if any, it has done so for the fund. As part of its review, the Board also considered the current total expense ratio of the fund compared to competitive fund median expenses. The fund is compared to those funds in the Total Mapped Group (used by the Board for management fee comparisons) that have a similar sales load structure.
In connection with the renewal of the Advisory Contracts, the Board also approved amendments to the management contract for the fund to clarify that the fund pays its non-operating expenses, including brokerage commissions and fees and expenses associated with the fund's securities lending program. The Board considered that the amendments would not change the services provided to the fund or the party responsible for making such payments under the current management contract.
The Board noted that the fund's total expense ratio ranked below the competitive median for the 12-month period ended June 30, 2018.
Fees Charged to Other Fidelity Clients. The Board also considered Fidelity fee structures and other information with respect to clients of Fidelity, such as other funds advised or subadvised by Fidelity, pension plan clients, and other institutional clients with similar mandates. The Board noted that a joint ad hoc committee created by it and the boards of other Fidelity funds periodically reviews and compares Fidelity's institutional investment advisory business with its business of providing services to the Fidelity funds and also noted the most recent findings of the committee. The Board noted that the committee's review included a consideration of the differences in services provided, fees charged, and costs incurred, as well as competition in the markets serving the different categories of clients.
Based on its review of total expense ratios and fees charged to other Fidelity clients, the Board concluded that the fund's total expense ratio was reasonable in light of the services that the fund and its shareholders receive and the other factors considered.
Costs of the Services and Profitability. The Board considered the revenues earned and the expenses incurred by Fidelity in conducting the business of developing, marketing, distributing, managing, administering and servicing the fund and servicing the fund's shareholders. The Board also considered the level of Fidelity's profits in respect of all the Fidelity funds.
On an annual basis, Fidelity presents to the Board information about the profitability of its relationships with the fund. Fidelity calculates profitability information for each fund, as well as aggregate profitability information for groups of Fidelity funds and all Fidelity funds, using a series of detailed revenue and cost allocation methodologies which originate with the books and records of Fidelity on which Fidelity's audited financial statements are based. The Audit Committee of the Board reviews any significant changes from the prior year's methodologies.
PricewaterhouseCoopers LLP (PwC), auditor to Fidelity and certain Fidelity funds, has been engaged annually by the Board as part of the Board's assessment of Fidelity's profitability analysis. PwC's engagement includes the review and assessment of the methodologies used by Fidelity in determining the revenues and expenses attributable to Fidelity's mutual fund business, and completion of agreed-upon procedures in respect of the mathematical accuracy of the fund profitability information and its conformity to established allocation methodologies. After considering PwC's reports issued under the engagement and information provided by Fidelity, the Board concluded that while other allocation methods may also be reasonable, Fidelity's profitability methodologies are reasonable in all material respects.
The Board also reviewed Fidelity's non-fund businesses and potential indirect benefits such businesses may have received as a result of their association with Fidelity's mutual fund business (i.e., fall-out benefits) as well as cases where Fidelity's affiliates may benefit from the fund's business. The Board noted that changes to fall-out benefits year-over-year reflect business developments at Fidelity's various businesses.
The Board considered the costs of the services provided by and the profits realized by Fidelity in connection with the operation of the fund and was satisfied that the profitability was not excessive.
Economies of Scale. The Board considered whether there have been economies of scale in respect of the management of the Fidelity funds, whether the Fidelity funds (including the fund) have appropriately benefited from any such economies of scale, and whether there is potential for realization of any further economies of scale. The Board considered the extent to which the fund will benefit from economies of scale as assets grow through increased services to the fund, through waivers or reimbursements, or through fee or expense ratio reductions. The Board recognized that, due to the fund's current contractual arrangements, its expense ratio will not decline if the fund's operating costs decrease as assets grow, or rise as assets decrease. The Board also noted that a committee (the Economies of Scale Committee) created by it and the boards of other Fidelity funds periodically analyzes whether Fidelity attains economies of scale in respect of the management and servicing of the Fidelity funds, whether the Fidelity funds have appropriately benefited from such economies of scale, and whether there is potential for realization of any further economies of scale.
The Board concluded, taking into account the analysis of the Economies of Scale Committee, that economies of scale, if any, are being appropriately shared between fund shareholders and Fidelity.
Additional Information Requested by the Board. In order to develop fully the factual basis for consideration of the Fidelity funds' advisory contracts, the Board requested and received additional information on certain topics, including: (i) fund performance trends, in particular the underperformance of certain funds, and Fidelity's long-term strategies for certain funds; (ii) Fidelity's fund profitability methodology, profitability trends for certain funds, and the impact of certain factors on fund profitability results; (iii) metrics for evaluating index fund and ETF performance and information about ETF trading characteristics; (iv) the methodology with respect to the evaluation of competitive fund data and peer group classifications and fee comparisons; (v) the expense structures for different funds and classes; (vi) information regarding other accounts managed by Fidelity, including collective investment trusts; and (vii) Fidelity's philosophies and strategies for evaluating funds and classes with lower or declining asset levels.
Based on its evaluation of all of the conclusions noted above, and after considering all factors it believed relevant, the Board concluded that the advisory fee arrangements are fair and reasonable, and that the fund's Advisory Contracts should be renewed.
LPSK6-SANN-0319
1.9883998.101
Fidelity® Value Discovery K6 Fund
Semi-Annual Report January 31, 2019 |
|
Beginning on January 1, 2021, as permitted by regulations adopted by the Securities and Exchange Commission, paper copies of a fund’s shareholder reports will no longer be sent by mail, unless you specifically request paper copies of the reports from the fund or from your financial intermediary, such as a financial advisor, broker-dealer or bank. Instead, the reports will be made available on a website, and you will be notified by mail each time a report is posted and provided with a website link to access the report.
If you already elected to receive shareholder reports electronically, you will not be affected by this change and you need not take any action. You may elect to receive shareholder reports and other communications from a fund electronically, by contacting your financial intermediary. For Fidelity customers, visit Fidelity's web site or call Fidelity using the contact information listed below.
You may elect to receive all future reports in paper free of charge. If you wish to continue receiving paper copies of your shareholder reports, you may contact your financial intermediary or, if you are a Fidelity customer, visit Fidelity’s website, or call Fidelity at the applicable toll-free number listed below. Your election to receive reports in paper will apply to all funds held with the fund complex/your financial intermediary.
| Account Type | Website | Phone Number |
| Brokerage, Mutual Fund, or Annuity Contracts: | fidelity.com/mailpreferences | 1-800-343-3548 |
| Employer Provided Retirement Accounts: | netbenefits.fidelity.com/preferences (choose 'no' under Required Disclosures to continue to print) | 1-800-343-0860 |
| Advisor Sold Accounts Serviced Through Your Financial Intermediary: | Contact Your Financial Intermediary | Your Financial Intermediary's phone number |
| Advisor Sold Accounts Serviced by Fidelity: | institutional.fidelity.com | 1-877-208-0098 |
Contents
To view a fund's proxy voting guidelines and proxy voting record for the 12-month period ended June 30, visit http://www.fidelity.com/proxyvotingresults or visit the Securities and Exchange Commission's (SEC) web site at http://www.sec.gov.
You may also call 1-800-835-5092 to request a free copy of the proxy voting guidelines.
Standard & Poor's, S&P and S&P 500 are registered service marks of The McGraw-Hill Companies, Inc. and have been licensed for use by Fidelity Distributors Corporation.
Other third-party marks appearing herein are the property of their respective owners.
All other marks appearing herein are registered or unregistered trademarks or service marks of FMR LLC or an affiliated company. © 2019 FMR LLC. All rights reserved.
This report and the financial statements contained herein are submitted for the general information of the shareholders of the Fund. This report is not authorized for distribution to prospective investors in the Fund unless preceded or accompanied by an effective prospectus.
A fund files its complete schedule of portfolio holdings with the SEC for the first and third quarters of each fiscal year on Form N-Q. Forms N-Q are available on the SEC’s web site at http://www.sec.gov. A fund's Forms N-Q may be reviewed and copied at the SEC’s Public Reference Room in Washington, DC. Information regarding the operation of the SEC's Public Reference Room may be obtained by calling 1-800-SEC-0330.
For a complete list of a fund's portfolio holdings, view the most recent holdings listing, semiannual report, or annual report on Fidelity's web site at http://www.fidelity.com, http://www.institutional.fidelity.com, or http://www.401k.com, as applicable.
NOT FDIC INSURED •MAY LOSE VALUE •NO BANK GUARANTEE
Neither the Fund nor Fidelity Distributors Corporation is a bank.
Investment Summary (Unaudited)
Top Ten Stocks as of January 31, 2019
| | % of fund's net assets |
| Berkshire Hathaway, Inc. Class B | 3.9 |
| Wells Fargo & Co. | 3.3 |
| Exxon Mobil Corp. | 3.0 |
| Comcast Corp. Class A | 2.9 |
| CVS Health Corp. | 2.5 |
| Chevron Corp. | 2.4 |
| Verizon Communications, Inc. | 2.3 |
| U.S. Bancorp | 2.3 |
| Amgen, Inc. | 2.3 |
| Twenty-First Century Fox, Inc. Class A | 2.0 |
| | 26.9 |
Top Five Market Sectors as of January 31, 2019
| | % of fund's net assets |
| Financials | 25.2 |
| Health Care | 16.2 |
| Communication Services | 13.8 |
| Energy | 11.6 |
| Consumer Staples | 9.5 |
Asset Allocation (% of fund's net assets)
| As of January 31, 2019 * |
| | Stocks and Equity Futures | 98.3% |
| | Short-Term Investments and Net Other Assets (Liabilities) | 1.7% |

* Foreign investments - 16.5%
Schedule of Investments January 31, 2019 (Unaudited)
Showing Percentage of Net Assets
| Common Stocks - 97.3% | | | |
| | | Shares | Value |
| COMMUNICATION SERVICES - 13.8% | | | |
| Diversified Telecommunication Services - 2.3% | | | |
| Verizon Communications, Inc. | | 87,461 | $4,815,603 |
| Entertainment - 5.2% | | | |
| Cinemark Holdings, Inc. | | 39,575 | 1,619,409 |
| Lions Gate Entertainment Corp. Class B | | 92,889 | 1,628,344 |
| The Walt Disney Co. | | 30,392 | 3,389,316 |
| Twenty-First Century Fox, Inc. Class A | | 87,984 | 4,338,491 |
| | | | 10,975,560 |
| Interactive Media & Services - 1.3% | | | |
| Alphabet, Inc. Class A (a) | | 2,463 | 2,773,067 |
| Media - 5.0% | | | |
| Comcast Corp. Class A | | 168,897 | 6,176,563 |
| comScore, Inc. (a) | | 44,389 | 874,019 |
| Entercom Communications Corp. Class A (b) | | 114,764 | 841,220 |
| Interpublic Group of Companies, Inc. | | 118,555 | 2,697,126 |
| | | | 10,588,928 |
|
| TOTAL COMMUNICATION SERVICES | | | 29,153,158 |
|
| CONSUMER DISCRETIONARY - 3.0% | | | |
| Auto Components - 0.4% | | | |
| Lear Corp. | | 5,700 | 877,401 |
| Internet & Direct Marketing Retail - 0.6% | | | |
| eBay, Inc. | | 34,631 | 1,165,333 |
| Multiline Retail - 1.1% | | | |
| Dollar General Corp. | | 20,900 | 2,412,487 |
| Textiles, Apparel & Luxury Goods - 0.9% | | | |
| PVH Corp. | | 17,425 | 1,901,242 |
|
| TOTAL CONSUMER DISCRETIONARY | | | 6,356,463 |
|
| CONSUMER STAPLES - 9.5% | | | |
| Beverages - 2.7% | | | |
| C&C Group PLC | | 323,500 | 1,221,918 |
| Coca-Cola European Partners PLC | | 26,000 | 1,237,080 |
| PepsiCo, Inc. | | 28,103 | 3,166,365 |
| | | | 5,625,363 |
| Food & Staples Retailing - 1.8% | | | |
| Sysco Corp. | | 36,706 | 2,343,678 |
| Walmart, Inc. | | 15,900 | 1,523,697 |
| | | | 3,867,375 |
| Food Products - 4.8% | | | |
| Danone SA | | 27,800 | 2,023,056 |
| Mondelez International, Inc. | | 24,900 | 1,151,874 |
| Seaboard Corp. | | 202 | 780,562 |
| The Hershey Co. | | 27,592 | 2,927,511 |
| The J.M. Smucker Co. | | 31,309 | 3,283,688 |
| | | | 10,166,691 |
| Personal Products - 0.2% | | | |
| Coty, Inc. Class A | | 54,300 | 421,368 |
|
| TOTAL CONSUMER STAPLES | | | 20,080,797 |
|
| ENERGY - 11.6% | | | |
| Energy Equipment & Services - 1.2% | | | |
| Baker Hughes, a GE Co. Class A | | 83,966 | 1,979,079 |
| FLEX LNG Ltd. (a) | | 497,122 | 648,373 |
| | | | 2,627,452 |
| Oil, Gas & Consumable Fuels - 10.4% | | | |
| Chevron Corp. | | 44,617 | 5,115,339 |
| Exxon Mobil Corp. | | 85,260 | 6,247,853 |
| GasLog Ltd. | | 23,654 | 424,116 |
| GasLog Partners LP | | 76,896 | 1,744,770 |
| Golar LNG Partners LP | | 148,000 | 1,983,200 |
| Hoegh LNG Partners LP | | 64,011 | 1,129,794 |
| Phillips 66 Co. | | 22,849 | 2,180,023 |
| Suncor Energy, Inc. | | 45,887 | 1,480,034 |
| Teekay Corp. (b) | | 36,536 | 128,241 |
| Teekay LNG Partners LP | | 86,616 | 1,113,882 |
| Teekay Offshore Partners LP | | 212,731 | 257,405 |
| | | | 21,804,657 |
|
| TOTAL ENERGY | | | 24,432,109 |
|
| FINANCIALS - 25.2% | | | |
| Banks - 9.4% | | | |
| M&T Bank Corp. | | 11,600 | 1,908,664 |
| PNC Financial Services Group, Inc. | | 26,689 | 3,273,940 |
| SunTrust Banks, Inc. | | 47,573 | 2,826,788 |
| U.S. Bancorp | | 94,062 | 4,812,212 |
| Wells Fargo & Co. | | 142,750 | 6,981,903 |
| | | | 19,803,507 |
| Capital Markets - 2.7% | | | |
| Affiliated Managers Group, Inc. | | 5,600 | 587,720 |
| AllianceBernstein Holding LP | | 3,400 | 103,666 |
| Goldman Sachs Group, Inc. | | 13,808 | 2,734,122 |
| Invesco Ltd. | | 32,000 | 583,040 |
| State Street Corp. | | 24,881 | 1,764,063 |
| | | | 5,772,611 |
| Consumer Finance - 1.7% | | | |
| Capital One Financial Corp. | | 19,582 | 1,578,113 |
| Discover Financial Services | | 30,953 | 2,089,018 |
| | | | 3,667,131 |
| Diversified Financial Services - 3.9% | | | |
| Berkshire Hathaway, Inc. Class B (a) | | 39,375 | 8,093,136 |
| Standard Life PLC | | 17,722 | 58,494 |
| | | | 8,151,630 |
| Insurance - 4.2% | | | |
| Allstate Corp. | | 13,845 | 1,216,560 |
| Chubb Ltd. | | 17,588 | 2,340,083 |
| FNF Group | | 31,437 | 1,136,762 |
| Prudential PLC | | 73,482 | 1,437,026 |
| The Travelers Companies, Inc. | | 20,641 | 2,591,271 |
| | | | 8,721,702 |
| Mortgage Real Estate Investment Trusts - 3.3% | | | |
| AGNC Investment Corp. | | 138,513 | 2,480,768 |
| Annaly Capital Management, Inc. | | 252,408 | 2,635,140 |
| MFA Financial, Inc. | | 244,325 | 1,790,902 |
| | | | 6,906,810 |
|
| TOTAL FINANCIALS | | | 53,023,391 |
|
| HEALTH CARE - 16.2% | | | |
| Biotechnology - 3.1% | | | |
| Amgen, Inc. | | 25,275 | 4,729,205 |
| Celgene Corp. (a) | | 20,000 | 1,769,200 |
| | | | 6,498,405 |
| Health Care Providers & Services - 6.8% | | | |
| Anthem, Inc. | | 9,433 | 2,858,199 |
| Cigna Corp. | | 19,085 | 3,813,374 |
| CVS Health Corp. | | 80,019 | 5,245,245 |
| UnitedHealth Group, Inc. | | 8,600 | 2,323,720 |
| | | | 14,240,538 |
| Pharmaceuticals - 6.3% | | | |
| Allergan PLC | | 15,826 | 2,278,627 |
| Bayer AG | | 34,437 | 2,610,182 |
| Bristol-Myers Squibb Co. | | 21,200 | 1,046,644 |
| Johnson & Johnson | | 7,895 | 1,050,667 |
| Pfizer, Inc. | | 21,743 | 922,990 |
| Roche Holding AG (participation certificate) | | 5,036 | 1,339,756 |
| Sanofi SA sponsored ADR | | 42,759 | 1,857,879 |
| Takeda Pharmaceutical Co. Ltd. ADR | | 114,235 | 2,281,273 |
| | | | 13,388,018 |
|
| TOTAL HEALTH CARE | | | 34,126,961 |
|
| INDUSTRIALS - 5.3% | | | |
| Aerospace & Defense - 2.4% | | | |
| Harris Corp. | | 9,952 | 1,524,447 |
| United Technologies Corp. | | 30,393 | 3,588,502 |
| | | | 5,112,949 |
| Air Freight & Logistics - 1.2% | | | |
| C.H. Robinson Worldwide, Inc. | | 28,700 | 2,490,299 |
| Machinery - 1.1% | | | |
| Deere & Co. | | 14,429 | 2,366,356 |
| Road & Rail - 0.6% | | | |
| Union Pacific Corp. | | 7,428 | 1,181,572 |
|
| TOTAL INDUSTRIALS | | | 11,151,176 |
|
| INFORMATION TECHNOLOGY - 3.6% | | | |
| Electronic Equipment & Components - 1.0% | | | |
| TE Connectivity Ltd. | | 26,417 | 2,138,456 |
| IT Services - 2.6% | | | |
| Amdocs Ltd. | | 30,169 | 1,685,844 |
| Cognizant Technology Solutions Corp. Class A | | 33,743 | 2,351,212 |
| Fiserv, Inc. (a) | | 5,400 | 447,822 |
| The Western Union Co. | | 57,087 | 1,041,838 |
| | | | 5,526,716 |
|
| TOTAL INFORMATION TECHNOLOGY | | | 7,665,172 |
|
| MATERIALS - 1.6% | | | |
| Chemicals - 0.9% | | | |
| LyondellBasell Industries NV Class A | | 8,715 | 757,944 |
| The Scotts Miracle-Gro Co. Class A | | 15,403 | 1,145,213 |
| | | | 1,903,157 |
| Containers & Packaging - 0.7% | | | |
| Graphic Packaging Holding Co. | | 119,631 | 1,443,946 |
|
| TOTAL MATERIALS | | | 3,347,103 |
|
| REAL ESTATE - 3.0% | | | |
| Equity Real Estate Investment Trusts (REITs) - 1.8% | | | |
| American Tower Corp. | | 11,300 | 1,953,092 |
| Simon Property Group, Inc. | | 9,500 | 1,730,140 |
| | | | 3,683,232 |
| Real Estate Management & Development - 1.2% | | | |
| CBRE Group, Inc. (a) | | 55,338 | 2,531,714 |
|
| TOTAL REAL ESTATE | | | 6,214,946 |
|
| UTILITIES - 4.5% | | | |
| Electric Utilities - 3.6% | | | |
| Exelon Corp. | | 82,989 | 3,963,555 |
| Xcel Energy, Inc. | | 67,197 | 3,518,435 |
| | | | 7,481,990 |
| Independent Power and Renewable Electricity Producers - 0.1% | | | |
| NRG Yield, Inc. Class C | | 20,900 | 315,381 |
| Multi-Utilities - 0.8% | | | |
| WEC Energy Group, Inc. | | 22,200 | 1,621,266 |
|
| TOTAL UTILITIES | | | 9,418,637 |
|
| TOTAL COMMON STOCKS | | | |
| (Cost $203,068,013) | | | 204,969,913 |
|
| Money Market Funds - 2.4% | | | |
| Fidelity Cash Central Fund, 2.43% (c) | | 3,982,141 | 3,982,938 |
| Fidelity Securities Lending Cash Central Fund 2.43% (c)(d) | | 997,438 | 997,538 |
| TOTAL MONEY MARKET FUNDS | | | |
| (Cost $4,980,346) | | | 4,980,476 |
| TOTAL INVESTMENT IN SECURITIES - 99.7% | | | |
| (Cost $208,048,359) | | | 209,950,389 |
| NET OTHER ASSETS (LIABILITIES) - 0.3% | | | 597,669 |
| NET ASSETS - 100% | | | $210,548,058 |
| Futures Contracts | | | | | |
| | Number of contracts | Expiration Date | Notional Amount | Value | Unrealized Appreciation/(Depreciation) |
| Purchased | | | | | |
| Equity Index Contracts | | | | | |
| CME E-mini Russell 1000 Value Index Contracts (United States) | 37 | March 2019 | $2,176,895 | $163,393 | $163,393 |
The notional amount of futures purchased as a percentage of Net Assets is 1.0%
Legend
(a) Non-income producing
(b) Security or a portion of the security is on loan at period end.
(c) Affiliated fund that is generally available only to investment companies and other accounts managed by Fidelity Investments. The rate quoted is the annualized seven-day yield of the fund at period end. A complete unaudited listing of the fund's holdings as of its most recent quarter end is available upon request. In addition, each Fidelity Central Fund's financial statements are available on the SEC's website or upon request.
(d) Investment made with cash collateral received from securities on loan.
Affiliated Central Funds
Information regarding fiscal year to date income earned by the Fund from investments in Fidelity Central Funds is as follows:
| Fund | Income earned |
| Fidelity Cash Central Fund | $105,110 |
| Fidelity Securities Lending Cash Central Fund | 16,421 |
| Total | $121,531 |
Amounts in the income column in the above table include any capital gain distributions from underlying funds, which are presented in the corresponding line-item in the Statement of Operations, if applicable.
Investment Valuation
The following is a summary of the inputs used, as of January 31, 2019, involving the Fund's assets and liabilities carried at fair value. The inputs or methodology used for valuing securities may not be an indication of the risk associated with investing in those securities. For more information on valuation inputs, and their aggregation into the levels used below, please refer to the Investment Valuation section in the accompanying Notes to Financial Statements.
| | Valuation Inputs at Reporting Date: |
| Description | Total | Level 1 | Level 2 | Level 3 |
| Investments in Securities: | | | | |
| Equities: | | | | |
| Communication Services | $29,153,158 | $29,153,158 | $-- | $-- |
| Consumer Discretionary | 6,356,463 | 6,356,463 | -- | -- |
| Consumer Staples | 20,080,797 | 18,057,741 | 2,023,056 | -- |
| Energy | 24,432,109 | 24,432,109 | -- | -- |
| Financials | 53,023,391 | 51,586,365 | 1,437,026 | -- |
| Health Care | 34,126,961 | 30,177,023 | 3,949,938 | -- |
| Industrials | 11,151,176 | 11,151,176 | -- | -- |
| Information Technology | 7,665,172 | 7,665,172 | -- | -- |
| Materials | 3,347,103 | 3,347,103 | -- | -- |
| Real Estate | 6,214,946 | 6,214,946 | -- | -- |
| Utilities | 9,418,637 | 9,418,637 | -- | -- |
| Money Market Funds | 4,980,476 | 4,980,476 | -- | -- |
| Total Investments in Securities: | $209,950,389 | $202,540,369 | $7,410,020 | $-- |
| Derivative Instruments: | | | | |
| Assets | | | | |
| Futures Contracts | $163,393 | $163,393 | $-- | $-- |
| Total Assets | $163,393 | $163,393 | $-- | $-- |
| Total Derivative Instruments: | $163,393 | $163,393 | $-- | $-- |
Value of Derivative Instruments
The following table is a summary of the Fund's value of derivative instruments by primary risk exposure as of January 31, 2019. For additional information on derivative instruments, please refer to the Derivative Instruments section in the accompanying Notes to Financial Statements.
| Primary Risk Exposure / Derivative Type | Value |
| | Asset | Liability |
| Equity Risk | | |
| Futures Contracts(a) | $163,393 | $0 |
| Total Equity Risk | 163,393 | 0 |
| Total Value of Derivatives | $163,393 | $0 |
(a) Reflects gross cumulative appreciation (depreciation) on futures contracts as presented in the Schedule of Investments. In the Statement of Assets and Liabilities, the period end daily variation margin is included in receivable or payable for daily variation margin on futures contracts, and the net cumulative appreciation (depreciation) is included in net unrealized appreciation (depreciation).
Other Information
Distribution of investments by country or territory of incorporation, as a percentage of Total Net Assets, is as follows (Unaudited):
| United States of America | 83.5% |
| Marshall Islands | 3.1% |
| Switzerland | 2.7% |
| France | 1.9% |
| Ireland | 1.7% |
| Canada | 1.5% |
| United Kingdom | 1.3% |
| Germany | 1.2% |
| Japan | 1.1% |
| Others (Individually Less Than 1%) | 2.0% |
| | 100.0% |
See accompanying notes which are an integral part of the financial statements.
Financial Statements
Statement of Assets and Liabilities
| | | January 31, 2019 (Unaudited) |
| Assets | | |
Investment in securities, at value (including securities loaned of $969,461) — See accompanying schedule:
Unaffiliated issuers (cost $203,068,013) | $204,969,913 | |
| Fidelity Central Funds (cost $4,980,346) | 4,980,476 | |
| Total Investment in Securities (cost $208,048,359) | | $209,950,389 |
| Segregated cash with brokers for derivative instruments | | 88,800 |
| Cash | | 6,488 |
| Receivable for investments sold | | 1,381,558 |
| Receivable for fund shares sold | | 85,662 |
| Dividends receivable | | 279,239 |
| Distributions receivable from Fidelity Central Funds | | 15,170 |
| Receivable for daily variation margin on futures contracts | | 16,465 |
| Other receivables | | 2,259 |
| Total assets | | 211,826,030 |
| Liabilities | | |
| Payable for investments purchased | $35,696 | |
| Payable for fund shares redeemed | 168,498 | |
| Accrued management fee | 76,038 | |
| Collateral on securities loaned | 997,740 | |
| Total liabilities | | 1,277,972 |
| Net Assets | | $210,548,058 |
| Net Assets consist of: | | |
| Paid in capital | | $211,494,031 |
| Total distributable earnings (loss) | | (945,973) |
| Net Assets, for 20,603,896 shares outstanding | | $210,548,058 |
| Net Asset Value, offering price and redemption price per share ($210,548,058 ÷ 20,603,896 shares) | | $10.22 |
See accompanying notes which are an integral part of the financial statements.
Statement of Operations
| | | Six months ended January 31, 2019 (Unaudited) |
| Investment Income | | |
| Dividends | | $2,854,572 |
| Income from Fidelity Central Funds | | 121,531 |
| Total income | | 2,976,103 |
| Expenses | | |
| Management fee | $542,819 | |
| Independent trustees' fees and expenses | 863 | |
| Commitment fees | 347 | |
| Total expenses before reductions | 544,029 | |
| Expense reductions | (1,202) | |
| Total expenses after reductions | | 542,827 |
| Net investment income (loss) | | 2,433,276 |
| Realized and Unrealized Gain (Loss) | | |
| Net realized gain (loss) on: | | |
| Investment securities: | | |
| Unaffiliated issuers | 522,464 | |
| Fidelity Central Funds | (256) | |
| Foreign currency transactions | 4,583 | |
| Futures contracts | 231,820 | |
| Total net realized gain (loss) | | 758,611 |
| Change in net unrealized appreciation (depreciation) on: | | |
| Investment securities: | | |
| Unaffiliated issuers | (13,512,799) | |
| Fidelity Central Funds | 130 | |
| Assets and liabilities in foreign currencies | (669) | |
| Futures contracts | 163,393 | |
| Total change in net unrealized appreciation (depreciation) | | (13,349,945) |
| Net gain (loss) | | (12,591,334) |
| Net increase (decrease) in net assets resulting from operations | | $(10,158,058) |
See accompanying notes which are an integral part of the financial statements.
Statement of Changes in Net Assets
| | Six months ended January 31, 2019 (Unaudited) | Year ended July 31, 2018 |
| Increase (Decrease) in Net Assets | | |
| Operations | | |
| Net investment income (loss) | $2,433,276 | $5,707,771 |
| Net realized gain (loss) | 758,611 | (1,999,146) |
| Change in net unrealized appreciation (depreciation) | (13,349,945) | 14,978,593 |
| Net increase (decrease) in net assets resulting from operations | (10,158,058) | 18,687,218 |
| Distributions to shareholders | (7,450,300) | – |
| Distributions to shareholders from net investment income | – | (2,457,414) |
| Total distributions | (7,450,300) | (2,457,414) |
| Share transactions | | |
| Proceeds from sales of shares | 20,051,775 | 96,394,707 |
| Reinvestment of distributions | 7,450,300 | 2,457,414 |
| Cost of shares redeemed | (65,561,118) | (145,935,433) |
| Net increase (decrease) in net assets resulting from share transactions | (38,059,043) | (47,083,312) |
| Total increase (decrease) in net assets | (55,667,401) | (30,853,508) |
| Net Assets | | |
| Beginning of period | 266,215,459 | 297,068,967 |
| End of period | $210,548,058 | $266,215,459 |
| Other Information | | |
| Undistributed net investment income end of period | | $3,192,986 |
| Shares | | |
| Sold | 1,933,616 | 9,017,571 |
| Issued in reinvestment of distributions | 716,537 | 229,023 |
| Redeemed | (6,296,174) | (13,603,763) |
| Net increase (decrease) | (3,646,021) | (4,357,169) |
See accompanying notes which are an integral part of the financial statements.
Financial Highlights
Fidelity Value Discovery K6 Fund
| | Six months ended (Unaudited) January 31, | Years endedJuly 31, | |
| | 2019 | 2018 | 2017 A |
| Selected Per–Share Data | | | |
| Net asset value, beginning of period | $10.98 | $10.38 | $10.00 |
| Income from Investment Operations | | | |
| Net investment income (loss)B | .11 | .19 | –C |
| Net realized and unrealized gain (loss) | (.52) | .49 | .38 |
| Total from investment operations | (.41) | .68 | .38 |
| Distributions from net investment income | (.27) | (.08) | – |
| Distributions from net realized gain | (.08) | – | – |
| Total distributions | (.35) | (.08) | – |
| Net asset value, end of period | $10.22 | $10.98 | $10.38 |
| Total ReturnD,E | (3.80)% | 6.58% | 3.80% |
| Ratios to Average Net AssetsF,G | | | |
| Expenses before reductions | .45%H | .45% | .45%H |
| Expenses net of fee waivers, if any | .45%H | .45% | .45%H |
| Expenses net of all reductions | .45%H | .45% | .45%H |
| Net investment income (loss) | 2.01%H | 1.81% | (.28)%H |
| Supplemental Data | | | |
| Net assets, end of period (000 omitted) | $210,548 | $266,215 | $297,069 |
| Portfolio turnover rateI | 46%H | 38%J | - %J,K |
A For the period May 25, 2017 (commencement of operations) to July 31, 2017.
B Calculated based on average shares outstanding during the period.
C Amount represents less than $.005 per share.
D Total returns for periods of less than one year are not annualized.
E Total returns would have been lower if certain expenses had not been reduced during the applicable periods shown.
F Fees and expenses of any underlying Fidelity Central Funds are not included in the Fund's expense ratio. The Fund indirectly bears its proportionate share of the expenses of any underlying Fidelity Central Funds.
G Expense ratios reflect operating expenses of the Fund. Expenses before reductions do not reflect amounts reimbursed by the investment adviser or reductions from brokerage service arrangements or reductions from other expense offset arrangements and do not represent the amount paid by the Fund during periods when reimbursements or reductions occur. Expense ratios before reductions for start-up periods may not be representative of longer term operating periods. Expenses net of fee waivers reflect expenses after reimbursement by the investment adviser but prior to reductions from brokerage service arrangements or other expense offset arrangements. Expenses net of all reductions represent the net expenses paid by the Fund.
H Annualized
I Amount does not include the portfolio activity of any underlying Fidelity Central Funds.
J Portfolio turnover rate excludes securities received or delivered in-kind.
K Amount not annualized.
See accompanying notes which are an integral part of the financial statements.
Notes to Financial Statements (Unaudited)
For the period ended January 31, 2019
1. Organization.
Fidelity Value Discovery K6 Fund (the Fund) is a fund of Fidelity Puritan Trust (the Trust) and is authorized to issue an unlimited number of shares. Share transactions on the Statement of Changes in Net Assets may contain exchanges between affiliated funds. The Trust is registered under the Investment Company Act of 1940, as amended (the 1940 Act), as an open-end management investment company organized as a Massachusetts business trust. Shares generally are available only to employer-sponsored retirement plans that are recordkept by Fidelity, or to certain employer-sponsored retirement plans that are not recordkept by Fidelity.
2. Investments in Fidelity Central Funds.
The Fund invests in Fidelity Central Funds, which are open-end investment companies generally available only to other investment companies and accounts managed by the investment adviser and its affiliates. The Fund's Schedule of Investments lists each of the Fidelity Central Funds held as of period end, if any, as an investment of the Fund, but does not include the underlying holdings of each Fidelity Central Fund. As an Investing Fund, the Fund indirectly bears its proportionate share of the expenses of the underlying Fidelity Central Funds.
The Money Market Central Funds seek preservation of capital and current income and are managed by Fidelity Investments Money Management, Inc. (FIMM), an affiliate of the investment adviser. Annualized expenses of the Money Market Central Funds as of their most recent shareholder report date are less than .005%.
A complete unaudited list of holdings for each Fidelity Central Fund is available upon request or at the Securities and Exchange Commission (the SEC) website at www.sec.gov. In addition, the financial statements of the Fidelity Central Funds are available on the SEC website or upon request.
3. Significant Accounting Policies.
The Fund is an investment company and applies the accounting and reporting guidance of the Financial Accounting Standards Board (FASB) Accounting Standards Codification Topic 946 Financial Services – Investments Companies. The financial statements have been prepared in conformity with accounting principles generally accepted in the United States of America (GAAP), which require management to make certain estimates and assumptions at the date of the financial statements. Actual results could differ from those estimates. Subsequent events, if any, through the date that the financial statements were issued have been evaluated in the preparation of the financial statements. The following summarizes the significant accounting policies of the Fund:
Investment Valuation. Investments are valued as of 4:00 p.m. Eastern time on the last calendar day of the period. The Board of Trustees (the Board) has delegated the day to day responsibility for the valuation of the Fund's investments to the Fair Value Committee (the Committee) established by the Fund's investment adviser. In accordance with valuation policies and procedures approved by the Board, the Fund attempts to obtain prices from one or more third party pricing vendors or brokers to value its investments. When current market prices, quotations or currency exchange rates are not readily available or reliable, investments will be fair valued in good faith by the Committee, in accordance with procedures adopted by the Board. Factors used in determining fair value vary by investment type and may include market or investment specific events. The frequency with which these procedures are used cannot be predicted and they may be utilized to a significant extent. The Committee oversees the Fund's valuation policies and procedures and reports to the Board on the Committee's activities and fair value determinations. The Board monitors the appropriateness of the procedures used in valuing the Fund's investments and ratifies the fair value determinations of the Committee.
The Fund categorizes the inputs to valuation techniques used to value its investments into a disclosure hierarchy consisting of three levels as shown below:
- Level 1 – quoted prices in active markets for identical investments
- Level 2 – other significant observable inputs (including quoted prices for similar investments, interest rates, prepayment speeds, etc.)
- Level 3 – unobservable inputs (including the Fund's own assumptions based on the best information available)
Valuation techniques used to value the Fund's investments by major category are as follows:
Equity securities, including restricted securities, for which market quotations are readily available, are valued at the last reported sale price or official closing price as reported by a third party pricing vendor on the primary market or exchange on which they are traded and are categorized as Level 1 in the hierarchy. In the event there were no sales during the day or closing prices are not available, securities are valued at the last quoted bid price or may be valued using the last available price and are generally categorized as Level 2 in the hierarchy. For foreign equity securities, when market or security specific events arise, comparisons to the valuation of American Depositary Receipts (ADRs), futures contracts, Exchange-Traded Funds (ETFs) and certain indexes as well as quoted prices for similar securities may be used and would be categorized as Level 2 in the hierarchy. For equity securities, including restricted securities, where observable inputs are limited, assumptions about market activity and risk are used and these securities may be categorized as Level 3 in the hierarchy.
Futures contracts are valued at the settlement price established each day by the board of trade or exchange on which they are traded and are categorized as Level 1 in the hierarchy.
Investments in open-end mutual funds, including the Fidelity Central Funds, are valued at their closing net asset value (NAV) each business day and are categorized as Level 1 in the hierarchy.
Changes in valuation techniques may result in transfers in or out of an assigned level within the disclosure hierarchy. The aggregate value of investments by input level as of January 31, 2019 is included at the end of the Fund's Schedule of Investments.
Foreign Currency. The Fund may use foreign currency contracts to facilitate transactions in foreign-denominated securities. Gains and losses from these transactions may arise from changes in the value of the foreign currency or if the counterparties do not perform under the contracts' terms.
Foreign-denominated assets, including investment securities, and liabilities are translated into U.S. dollars at the exchange rates at period end. Purchases and sales of investment securities, income and dividends received and expenses denominated in foreign currencies are translated into U.S. dollars at the exchange rate in effect on the transaction date.
The effects of exchange rate fluctuations on investments are included with the net realized and unrealized gain (loss) on investment securities. Other foreign currency transactions resulting in realized and unrealized gain (loss) are disclosed separately.
Investment Transactions and Income. For financial reporting purposes, the Fund's investment holdings and NAV include trades executed through the end of the last business day of the period. The NAV per share for processing shareholder transactions is calculated as of the close of business of the New York Stock Exchange (NYSE), normally 4:00 p.m. Eastern time and includes trades executed through the end of the prior business day. Gains and losses on securities sold are determined on the basis of identified cost. Dividend income is recorded on the ex-dividend date, except for certain dividends from foreign securities where the ex-dividend date may have passed, which are recorded as soon as the Fund is informed of the ex-dividend date. Non-cash dividends included in dividend income, if any, are recorded at the fair market value of the securities received. Income and capital gain distributions from Fidelity Central Funds, if any, are recorded on the ex-dividend date. Certain distributions received by the Fund represent a return of capital or capital gain. The Fund determines the components of these distributions subsequent to the ex-dividend date, based upon receipt of tax filings or other correspondence relating to the underlying investment. These distributions are recorded as a reduction of cost of investments and/or as a realized gain. Investment income is recorded net of foreign taxes withheld where recovery of such taxes is uncertain.
Expenses. Expenses directly attributable to a fund are charged to that fund. Expenses attributable to more than one fund are allocated among the respective funds on the basis of relative net assets or other appropriate methods. Expense estimates are accrued in the period to which they relate and adjustments are made when actual amounts are known.
Income Tax Information and Distributions to Shareholders. Each year, the Fund intends to qualify as a regulated investment company under Subchapter M of the Internal Revenue Code, including distributing substantially all of its taxable income and realized gains. As a result, no provision for U.S. Federal income taxes is required. The Fund files a U.S. federal tax return, in addition to state and local tax returns as required. The Fund's federal income tax returns are subject to examination by the Internal Revenue Service (IRS) for a period of three fiscal years after they are filed. State and local tax returns may be subject to examination for an additional fiscal year depending on the jurisdiction. Foreign taxes are provided for based on the Fund's understanding of the tax rules and rates that exist in the foreign markets in which it invests.
Distributions are declared and recorded on the ex-dividend date. Income and capital gain distributions are determined in accordance with income tax regulations, which may differ from GAAP.
Capital accounts within the financial statements are adjusted for permanent book-tax differences. These adjustments have no impact on net assets or the results of operations. Capital accounts are not adjusted for temporary book-tax differences which will reverse in a subsequent period.
Book-tax differences are primarily due to foreign currency transactions, partnerships, passive foreign investment companies (PFIC), capital loss carryforwards and losses deferred due to wash sales.
As of period end, the cost and unrealized appreciation (depreciation) in securities, and derivatives if applicable, for federal income tax purposes were as follows:
| Gross unrealized appreciation | $14,363,711 |
| Gross unrealized depreciation | (13,054,848) |
| Net unrealized appreciation (depreciation) | $1,308,863 |
| Tax cost | $208,804,919 |
Capital loss carryforwards are only available to offset future capital gains of the Fund to the extent provided by regulations and may be limited. Under the Regulated Investment Company Modernization Act of 2010 (the Act), the Fund is permitted to carry forward capital losses incurred in taxable years beginning after December 22, 2010 for an unlimited period and such capital losses are required to be used prior to any losses that expire. The capital loss carryforward information presented below, including any applicable limitation, is estimated as of prior fiscal period end and is subject to adjustment.
| No expiration | |
| Short-term | $(1,683,615) |
New Rule Issuance. During August 2018, the U.S. Securities and Exchange Commission issued Final Rule Release No. 33-10532, Disclosure Update and Simplification. This Final Rule includes amendments specific to registered investment companies that are intended to eliminate overlap in disclosure requirements between Regulation S-X and GAAP. In accordance with these amendments, certain line-items in the Fund's financial statements have been combined or removed for the current period as outlined in the table below.
| Financial Statement | Current Line-Item Presentation (As Applicable) | Prior Line-Item Presentation (As Applicable) |
| Statement of Assets and Liabilities | Total distributable earnings (loss) | Undistributed/Distributions in excess of/Accumulated net investment income (loss)
Accumulated/Undistributed net realized gain (loss)
Net unrealized appreciation (depreciation) |
| Statement of Changes in Net Assets | N/A - removed | Undistributed/Distributions in excess of/Accumulated net investment income (loss) end of period |
| Statement of Changes in Net Assets | Distributions to shareholders | Distributions to shareholders from net investment income
Distributions to shareholders from net realized gain |
4. Derivative Instruments.
Risk Exposures and the Use of Derivative Instruments. The Fund's investment objective allows the Fund to enter into various types of derivative contracts, including futures contracts. Derivatives are investments whose value is primarily derived from underlying assets, indices or reference rates and may be transacted on an exchange or over-the-counter (OTC). Derivatives may involve a future commitment to buy or sell a specified asset based on specified terms, to exchange future cash flows at periodic intervals based on a notional principal amount, or for one party to make one or more payments upon the occurrence of specified events in exchange for periodic payments from the other party.
The Fund used derivatives to increase returns and to manage exposure to certain risks as defined below. The success of any strategy involving derivatives depends on analysis of numerous economic factors, and if the strategies for investment do not work as intended, the Fund may not achieve its objectives.
The Fund's use of derivatives increased or decreased its exposure to the following risk:
| Equity Risk | Equity risk relates to the fluctuations in the value of financial instruments as a result of changes in market prices (other than those arising from interest rate risk or foreign exchange risk), whether caused by factors specific to an individual investment, its issuer, or all factors affecting all instruments traded in a market or market segment.
|
The Fund is also exposed to additional risks from investing in derivatives, such as liquidity risk and counterparty credit risk. Liquidity risk is the risk that the Fund will be unable to close out the derivative in the open market in a timely manner. Counterparty credit risk is the risk that the counterparty will not be able to fulfill its obligation to the Fund. Counterparty credit risk related to exchange-traded futures contracts may be mitigated by the protection provided by the exchange on which they trade.
Investing in derivatives may involve greater risks than investing in the underlying assets directly and, to varying degrees, may involve risk of loss in excess of any initial investment and collateral received and amounts recognized in the Statement of Assets and Liabilities. In addition, there may be the risk that the change in value of the derivative contract does not correspond to the change in value of the underlying instrument.
Futures Contracts. A futures contract is an agreement between two parties to buy or sell a specified underlying instrument for a fixed price at a specified future date. The Fund used futures contracts to manage its exposure to the stock market.
Upon entering into a futures contract, a fund is required to deposit either cash or securities (initial margin) with a clearing broker in an amount equal to a certain percentage of the face value of the contract. Futures contracts are marked-to-market daily and subsequent daily payments (variation margin) are made or received by a fund depending on the daily fluctuations in the value of the futures contracts and are recorded as unrealized appreciation or (depreciation). This receivable and/or payable, if any, is included in daily variation margin on futures contracts in the Statement of Assets and Liabilities. Realized gain or (loss) is recorded upon the expiration or closing of a futures contract. The net realized gain (loss) and change in net unrealized appreciation (depreciation) on futures contracts during the period is presented in the Statement of Operations.
Any open futures contracts at period end are presented in the Schedule of Investments under the caption "Futures Contracts". The notional amount at value reflects each contract's exposure to the underlying instrument or index at period end and is representative of volume of activity during the period. Cash deposited to meet initial margin requirements is presented as segregated cash with brokers for derivative instruments in the Statement of Assets and Liabilities.
5. Purchases and Sales of Investments.
Purchases and sales of securities, other than short-term securities, aggregated $53,591,130 and $94,330,106, respectively.
Prior Fiscal Year Exchanges In-Kind. During the prior period, an unaffiliated entity completed an exchange in-kind with the Fund. The unaffiliated entity delivered investments and cash, valued at $35,289,423 in exchange for 3,301,335 shares of the Fund. The amount of in-kind exchanges is included in share transactions in the accompanying Statement of Changes in Net Assets. The Fund recognized no gain or loss for federal income tax purposes.
6. Fees and Other Transactions with Affiliates.
Management Fee. Fidelity Management & Research Company (the investment adviser) and its affiliates provide the Fund with investment management related services for which the Fund pays a monthly management fee that is based on an annual rate of .45% of average net assets. Under the management contract, the investment adviser or an affiliate pays all other expenses of the Fund, excluding fees and expenses of the independent Trustees, and certain miscellaneous expenses such as proxy and shareholder meeting expenses.
Brokerage Commissions. The Fund placed a portion of its portfolio transactions with brokerage firms which are affiliates of the investment adviser. Brokerage commissions are included in net realized gain (loss) and change in net unrealized appreciation (depreciation) in the Statement of Operations. The commissions paid to these affiliated firms were $976 for the period.
Interfund Trades. The Fund may purchase from or sell securities to other Fidelity Funds under procedures adopted by the Board. The procedures have been designed to ensure these interfund trades are executed in accordance with Rule 17a-7 of the 1940 Act. Interfund trades are included within the respective purchases and sales amounts shown in the Purchases and Sales of Investments note.
7. Committed Line of Credit.
The Fund participates with other funds managed by the investment adviser or an affiliate in a $4.25 billion credit facility (the "line of credit") to be utilized for temporary or emergency purposes to fund shareholder redemptions or for other short-term liquidity purposes. The Fund has agreed to pay commitment fees on its pro-rata portion of the line of credit, which amounted to $347 and is reflected in Commitment fees on the Statement of Operations. During the period, the Fund did not borrow on this line of credit.
8. Security Lending.
The Fund lends portfolio securities through a lending agent from time to time in order to earn additional income. For equity securities, a lending agent is used and may loan securities to certain qualified borrowers, including Fidelity Capital Markets (FCM), a broker-dealer affiliated with the Fund. On the settlement date of the loan, the Fund receives collateral (in the form of U.S. Treasury obligations, letters of credit and/or cash) against the loaned securities and maintains collateral in an amount not less than 100% of the market value of the loaned securities during the period of the loan. The market value of the loaned securities is determined at the close of business of the Fund and any additional required collateral is delivered to the Fund on the next business day. The Fund or borrower may terminate the loan at any time, and if the borrower defaults on its obligation to return the securities loaned because of insolvency or other reasons, the Fund may apply collateral received from the borrower against the obligation. The Fund may experience delays and costs in recovering the securities loaned. Any cash collateral received is invested in the Fidelity Securities Lending Cash Central Fund. The value of loaned securities and cash collateral at period end are disclosed on the Fund's Statement of Assets and Liabilities. Security lending income represents the income earned on investing cash collateral, less rebates paid to borrowers and any lending agent fees associated with the loan, plus any premium payments received for lending certain types of securities. Security lending income is presented in the Statement of Operations as a component of income from Fidelity Central Funds. Total security lending income during the period amounted to $16,421. During the period, there were no securities loaned to FCM.
9. Expense Reductions.
Commissions paid to certain brokers with whom the investment adviser, or its affiliates, places trades on behalf of the Fund include an amount in addition to trade execution, which may be rebated back to the Fund to offset certain expenses. This amount totaled $567 for the period. In addition, through arrangements with the Fund's custodian, credits realized as a result of certain uninvested cash balances were used to reduce the Fund's expenses. During the period, these credits reduced the Fund's expenses by $635.
10. Other.
The Fund's organizational documents provide former and current trustees and officers with a limited indemnification against liabilities arising in connection with the performance of their duties to the Fund. In the normal course of business, the Fund may also enter into contracts that provide general indemnifications. The Fund's maximum exposure under these arrangements is unknown as this would be dependent on future claims that may be made against the Fund. The risk of material loss from such claims is considered remote.
Shareholder Expense Example
As a shareholder of a Fund, you incur two types of costs: (1) transaction costs and (2) ongoing costs, including management fees and other Fund expenses. This Example is intended to help you understand your ongoing costs (in dollars) of investing in the Funds and to compare these costs with the ongoing costs of investing in other mutual funds.
The Example is based on an investment of $1,000 invested at the beginning of the period and held for the entire period (August 1, 2018 to January 31, 2019).
Actual Expenses
The first line of the accompanying table provides information about actual account values and actual expenses. You may use the information in this line, together with the amount you invested, to estimate the expenses that you paid over the period. Simply divide your account value by $1,000.00 (for example, an $8,600 account value divided by $1,000.00 = 8.6), then multiply the result by the number in the first line under the heading entitled "Expenses Paid During Period" to estimate the expenses you paid on your account during this period. In addition, the Fund, as a shareholder in the underlying Fidelity Central Funds, will indirectly bear its pro-rata share of the fees and expenses incurred by the underlying Fidelity Central Funds. These fees and expenses are not included in the Fund's annualized expense ratio used to calculate the expense estimate in the table below.
Hypothetical Example for Comparison Purposes
The second line of the accompanying table provides information about hypothetical account values and hypothetical expenses based on the Fund's actual expense ratio and an assumed rate of return of 5% per year before expenses, which is not the Fund's actual return. The hypothetical account values and expenses may not be used to estimate the actual ending account balance or expenses you paid for the period. You may use this information to compare the ongoing costs of investing in the Fund and other funds. To do so, compare this 5% hypothetical example with the 5% hypothetical examples that appear in the shareholder reports of the other funds. In addition, the Fund, as a shareholder in the underlying Fidelity Central Funds, will indirectly bear its pro-rata share of the fees and expenses incurred by the underlying Fidelity Central Funds. These fees and expenses are not included in the Fund's annualized expense ratio used to calculate the expense estimate in the table below.
Please note that the expenses shown in the table are meant to highlight your ongoing costs only and do not reflect any transaction costs. Therefore, the second line of the table is useful in comparing ongoing costs only, and will not help you determine the relative total costs of owning different funds.
| | Annualized Expense Ratio-A | Beginning
Account Value
August 1, 2018 | Ending
Account Value
January 31, 2019 | Expenses Paid
During Period-B
August 1, 2018
to January 31, 2019 |
| Actual | .45% | $1,000.00 | $962.00 | $2.23 |
| Hypothetical-C | | $1,000.00 | $1,022.94 | $2.29 |
A Annualized expense ratio reflects expenses net of applicable fee waivers.
B Expenses are equal to the Fund's annualized expense ratio, multiplied by the average account value over the period, multiplied by 184/365 (to reflect the one-half year period).
C 5% return per year before expenses.
Board Approval of Investment Advisory Contracts and Management Fees
Fidelity Value Discovery K6 Fund
Each year, the Board of Trustees, including the Independent Trustees (together, the Board), votes on the renewal of the management contract with Fidelity Management & Research Company (FMR) and the sub-advisory agreements (together, the Advisory Contracts) for the fund. FMR and the sub-advisers are referred to herein as the Investment Advisers. The Board, assisted by the advice of fund counsel and Independent Trustees' counsel, requests and considers a broad range of information relevant to the renewal of the Advisory Contracts throughout the year.
The Board meets regularly and, at each of its meetings, covers an extensive agenda of topics and materials and considers factors that are relevant to its annual consideration of the renewal of the fund's Advisory Contracts, including the services and support provided to the fund and its shareholders. The Board has established various standing committees (Committees), each composed of and chaired by Independent Trustees with varying backgrounds, to which the Board has assigned specific subject matter responsibilities in order to enhance effective decision-making by the Board. The Board, acting directly and through its Committees, requests and receives information concerning the annual consideration of the renewal of the fund's Advisory Contracts. The Board also meets as needed to review matters specifically related to the Board's annual consideration of the renewal of the Advisory Contracts. Members of the Board may also meet with trustees of other Fidelity funds through joint ad hoc committees to discuss certain matters relevant to all of the Fidelity funds.
At its January 2019 meeting, the Board unanimously determined to renew the fund's Advisory Contracts. In reaching its determination, the Board considered all factors it believed relevant, including (i) the nature, extent, and quality of the services to be provided to the fund and its shareholders (including the investment performance of the fund); (ii) the competitiveness of the fund's management fee and total expense ratio relative to peer funds; (iii) the total costs of the services to be provided by and the profits to be realized by Fidelity from its relationships with the fund; and (iv) the extent to which, if any, economies of scale exist and would be realized as the fund grows, and whether any economies of scale are appropriately shared with fund shareholders.
In considering whether to renew the Advisory Contracts for the fund, the Board reached a determination, with the assistance of fund counsel and Independent Trustees' counsel and through the exercise of its business judgment, that the renewal of the Advisory Contracts was in the best interests of the fund and its shareholders and that the compensation payable under the Advisory Contracts was fair and reasonable. The Board's decision to renew the Advisory Contracts was not based on any single factor, but rather was based on a comprehensive consideration of all the information provided to the Board at its meetings throughout the year. The Board, in reaching its determination to renew the Advisory Contracts, was aware that shareholders of the fund have a broad range of investment choices available to them, including a wide choice among funds offered by Fidelity's competitors, and that the fund's shareholders, who have the opportunity to review and weigh the disclosure provided by the fund in its prospectus and other public disclosures, have chosen to invest in this fund, which is part of the Fidelity family of funds.
Nature, Extent, and Quality of Services Provided. The Board considered Fidelity's staffing as it relates to the fund, including the backgrounds of investment personnel of Fidelity, and also considered the fund's investment objective, strategies, and related investment philosophy. The Independent Trustees also had discussions with senior management of Fidelity's investment operations and investment groups. The Board considered the structure of the investment personnel compensation program and whether this structure provides appropriate incentives to act in the best interests of the fund. Additionally, the Board considered the portfolio managers' investments, if any, in the funds that they manage.
Resources Dedicated to Investment Management and Support Services. The Board and the Fund Oversight and Research Committees reviewed the general qualifications and capabilities of Fidelity's investment staff, including its size, education, experience, and resources, as well as Fidelity's approach to recruiting, training, managing, and compensating investment personnel. The Board noted that Fidelity has continued to increase the resources devoted to non-U.S. offices, including expansion of Fidelity's global investment organization. The Board also noted that Fidelity's analysts have extensive resources, tools and capabilities that allow them to conduct sophisticated quantitative and fundamental analysis, as well as credit analysis of issuers, counterparties and guarantors. Further, the Board considered that Fidelity's investment professionals have sufficient access to global information and data so as to provide competitive investment results over time, and that those professionals also have access to sophisticated tools that permit them to assess portfolio construction and risk and performance attribution characteristics continuously, as well as to transmit new information and research conclusions rapidly around the world. Additionally, in its deliberations, the Board considered Fidelity's trading, risk management, compliance, and technology and operations capabilities and resources, which are integral parts of the investment management process.
Shareholder and Administrative Services. The Board considered (i) the nature, extent, quality, and cost of advisory, administrative, and shareholder services performed by the Investment Advisers and their affiliates under the Advisory Contracts and under separate agreements covering transfer agency, pricing and bookkeeping, and securities lending services for the fund; (ii) the nature and extent of the supervision of third party service providers, principally custodians, subcustodians, and pricing vendors; and (iii) the resources devoted to, and the record of compliance with, the fund's compliance policies and procedures. The Board also reviewed the allocation of fund brokerage, including allocations to brokers affiliated with the Investment Advisers, the use of brokerage commissions to pay fund expenses, and the use of "soft" commission dollars to pay for research services.
The Board noted that the growth of fund assets over time across the complex allows Fidelity to reinvest in the development of services designed to enhance the value and convenience of the Fidelity funds as investment vehicles. These services include 24-hour access to account information and market information through telephone representatives and over the Internet, investor education materials and asset allocation tools, and the expanded availability of Fidelity Investor Centers.
The Board noted that it and the boards of certain other Fidelity funds had formed an ad hoc Committee on Transfer Agency Fees to review the variety of transfer agency fee structures throughout the industry and Fidelity's competitive positioning with respect to industry participants.
Investment in a Large Fund Family. The Board considered the benefits to shareholders of investing in a Fidelity fund, including the benefits of investing in a fund that is part of a large family of funds offering a variety of investment disciplines and providing a large variety of mutual fund investor services. The Board noted that Fidelity had taken, or had made recommendations that resulted in the Fidelity funds taking, a number of actions over the previous year that benefited particular funds, including: (i) continuing to dedicate additional resources to Fidelity's investment research process, which includes meetings with management of issuers of securities in which the funds invest, and to the support of the senior management team that oversees asset management; (ii) continuing efforts to enhance Fidelity's global research capabilities; (iii) launching new funds and making other enhancements to meet client needs; (iv) launching new share classes of existing funds; (v) eliminating purchase minimums and broadening eligibility requirements for certain funds and share classes; (vi) reducing management fees and total expenses for certain growth equity funds and index funds; (vii) lowering expense caps for certain existing funds and classes, and converting certain voluntary expense caps to contractual caps, to reduce expenses borne by shareholders; (viii) eliminating short-term redemption fees for funds that had such fees; (ix) rationalizing product lines and gaining increased efficiencies from fund mergers and share class consolidations; (x) continuing to develop, acquire and implement systems and technology to improve services to the funds and shareholders, strengthen information security, and increase efficiency; and (xi) continuing to implement enhancements to further strengthen Fidelity's product line to increase investors' probability of success in achieving their investment goals, including retirement income goals.
Investment Performance. The Board considered whether the fund has operated in accordance with its investment objective, as well as its record of compliance with its investment restrictions and its performance history.
The Board took into account discussions that occur at Board meetings throughout the year with representatives of the Investment Advisers about fund investment performance. In this regard the Board noted that as part of regularly scheduled fund reviews and other reports to the Board on fund performance, the Board considers annualized return information for the fund for different time periods, measured against an appropriate securities market index ("benchmark index") and a peer group of funds with similar objectives ("peer group"), if any. In its evaluation of fund investment performance, the Board gave particular attention to information indicating changes in performance of certain Fidelity funds for specific time periods and discussed with the Investment Advisers the reasons for any overperformance or underperformance.
In addition to reviewing absolute and relative fund performance, the Independent Trustees periodically consider the appropriateness of fund performance metrics in evaluating the results achieved. In general, the Independent Trustees believe that fund performance should be evaluated based on net performance (after fees and expenses) of both the highest performing and lowest performing fund share classes, where applicable, compared to appropriate benchmark indices, over appropriate time periods that may include full market cycles, and compared to peer groups, as applicable, over the same periods, taking into account relevant factors including the following: general market conditions; issuer-specific information; and fund cash flows and other factors.
The Independent Trustees recognize that shareholders evaluate performance on a net basis over their own holding periods, for which one-, three-, and five-year periods are often used as a proxy. For this reason, the performance information reviewed by the Board also included net total return information for the fund and an appropriate benchmark index and peer group for the most recent one-year period ended June 30, 2018, as shown below. Returns are shown compared to the 25th percentile (top of box, 75% beaten) and 75th percentile (bottom of box, 25% beaten) of the peer universe.
Fidelity Value Discovery K6 Fund
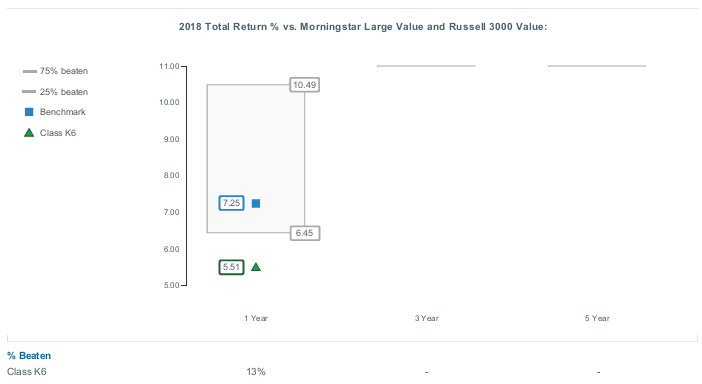
Based on its review, the Board concluded that the nature, extent, and quality of services provided to the fund under the Advisory Contracts should continue to benefit the shareholders of the fund.
Competitiveness of Management Fee and Total Expense Ratio. The Board considered the fund's management fee and total expense ratio compared to "mapped groups" of competitive funds and classes created for the purpose of facilitating the Trustees' competitive analysis of management fees and total expenses. Fidelity creates "mapped groups" by combining similar Lipper investment objective categories that have comparable investment mandates. Combining Lipper investment objective categories aids the Board's management fee and total expense ratio comparisons by broadening the competitive group used for comparison.
Management Fee. The Board considered two proprietary management fee comparisons for the 12-month period ended June 30 shown in basis points (BP) in the chart below. The group of Lipper funds used by the Board for management fee comparisons is referred to below as the "Total Mapped Group." The Total Mapped Group comparison focuses on a fund's standing in terms of gross management fees before expense reimbursements or caps relative to the total universe of funds with comparable investment mandates, regardless of whether their management fee structures also are comparable. Funds with comparable investment mandates offer exposure to similar types of securities. Funds with comparable management fee structures have similar management fee contractual arrangements (
e.g., flat rate charged for advisory services, all-inclusive fee rate,
etc.). "TMG %" represents the percentage of funds in the Total Mapped Group that had management fees that were lower than the fund's. For example, a hypothetical TMG % of 20% would mean that 80% of the funds in the Total Mapped Group had higher, and 20% had lower, management fees than the fund. The fund's actual TMG % and the number of funds in the Total Mapped Group are in the chart below. The "Asset-Size Peer Group" (ASPG) comparison focuses on a fund's standing relative to a subset of non-Fidelity funds within the Total Mapped Group that are similar in size and management fee structure. For example, if a fund is in the first quartile of the ASPG, the fund's management fee ranks in the least expensive or lowest 25% of funds in the ASPG. The ASPG represents at least 15% of the funds in the Total Mapped Group with comparable asset size and management fee structures, subject to a minimum of 50 funds (or all funds in the Total Mapped Group if fewer than 50). Additional information, such as the ASPG quartile in which the fund's management fee rate ranked is also included in the chart and was considered by the Board.
Fidelity Value Discovery K6 Fund
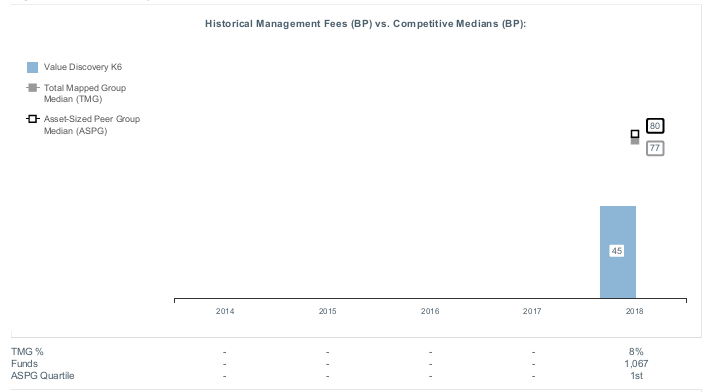
The Board noted that the fund's management fee rate ranked below the median of its Total Mapped Group and below the median of its ASPG for the 12-month period ended June 30, 2018.
The Board noted that it and the boards of other Fidelity funds formed an ad hoc Committee on Group Fee, which meets periodically, to conduct an in-depth review of the "group fee" component of the management fee of funds with such management fee structures. The Committee's focus included the mechanics of the group fee, the competitive landscape of group fee structures, Fidelity funds with no group fee component (such as the fund) and investment products not included in group fee assets. The Board also considered that, for funds subject to the group fee, FMR agreed to voluntarily waive fees over a specified period of time in amounts designed to account for assets converted from certain funds to certain collective investment trusts.
The Board also noted that, in 2013, the ad hoc Committee on Management Fees was formed to conduct an in-depth review of the management fee rates of Fidelity's active equity mutual funds. The Committee focused on the following areas: (i) standard fee structures; (ii) research consumption and trading evolution; (iii) management fee competitiveness/profitability by category; and (iv) factors that drive institutional pricing.
Based on its review, the Board concluded that the fund's management fee is fair and reasonable in light of the services that the fund receives and the other factors considered.
Total Expense Ratio. In its review of the fund's total expense ratio, the Board considered the fund's unitary fee rate as well as other fund expenses paid by FMR under the fund's management contract, such as transfer agent fees, pricing and bookkeeping fees, and custodial, legal, and audit fees. The Board also noted that Fidelity may agree to waive fees and expenses from time to time, and the extent to which, if any, it has done so for the fund. As part of its review, the Board also considered the current total expense ratio of the fund compared to competitive fund median expenses. The fund is compared to those funds in the Total Mapped Group (used by the Board for management fee comparisons) that have a similar sales load structure.
In connection with the renewal of the Advisory Contracts, the Board also approved amendments to the management contract for the fund to clarify that the fund pays its non-operating expenses, including brokerage commissions and fees and expenses associated with the fund's securities lending program. The Board considered that the amendments would not change the services provided to the fund or the party responsible for making such payments under the current management contract.
The Board noted that the fund's total expense ratio ranked below the competitive median for the 12-month period ended June 30, 2018.
Fees Charged to Other Fidelity Clients. The Board also considered Fidelity fee structures and other information with respect to clients of Fidelity, such as other funds advised or subadvised by Fidelity, pension plan clients, and other institutional clients with similar mandates. The Board noted that a joint ad hoc committee created by it and the boards of other Fidelity funds periodically reviews and compares Fidelity's institutional investment advisory business with its business of providing services to the Fidelity funds and also noted the most recent findings of the committee. The Board noted that the committee's review included a consideration of the differences in services provided, fees charged, and costs incurred, as well as competition in the markets serving the different categories of clients.
Based on its review of total expense ratios and fees charged to other Fidelity clients, the Board concluded that the fund's total expense ratio was reasonable in light of the services that the fund and its shareholders receive and the other factors considered.
Costs of the Services and Profitability. The Board considered the revenues earned and the expenses incurred by Fidelity in conducting the business of developing, marketing, distributing, managing, administering and servicing the fund and servicing the fund's shareholders. The Board also considered the level of Fidelity's profits in respect of all the Fidelity funds.
On an annual basis, Fidelity presents to the Board information about the profitability of its relationships with the fund. Fidelity calculates profitability information for each fund, as well as aggregate profitability information for groups of Fidelity funds and all Fidelity funds, using a series of detailed revenue and cost allocation methodologies which originate with the books and records of Fidelity on which Fidelity's audited financial statements are based. The Audit Committee of the Board reviews any significant changes from the prior year's methodologies.
PricewaterhouseCoopers LLP (PwC), auditor to Fidelity and certain Fidelity funds, has been engaged annually by the Board as part of the Board's assessment of Fidelity's profitability analysis. PwC's engagement includes the review and assessment of the methodologies used by Fidelity in determining the revenues and expenses attributable to Fidelity's mutual fund business, and completion of agreed-upon procedures in respect of the mathematical accuracy of the fund profitability information and its conformity to established allocation methodologies. After considering PwC's reports issued under the engagement and information provided by Fidelity, the Board concluded that while other allocation methods may also be reasonable, Fidelity's profitability methodologies are reasonable in all material respects.
The Board also reviewed Fidelity's non-fund businesses and potential indirect benefits such businesses may have received as a result of their association with Fidelity's mutual fund business (i.e., fall-out benefits) as well as cases where Fidelity's affiliates may benefit from the fund's business. The Board noted that changes to fall-out benefits year-over-year reflect business developments at Fidelity's various businesses.
The Board considered the costs of the services provided by and the profits realized by Fidelity in connection with the operation of the fund and was satisfied that the profitability was not excessive.
Economies of Scale. The Board considered whether there have been economies of scale in respect of the management of the Fidelity funds, whether the Fidelity funds (including the fund) have appropriately benefited from any such economies of scale, and whether there is potential for realization of any further economies of scale. The Board considered the extent to which the fund will benefit from economies of scale as assets grow through increased services to the fund, through waivers or reimbursements, or through fee or expense ratio reductions. The Board recognized that, due to the fund's current contractual arrangements, its expense ratio will not decline if the fund's operating costs decrease as assets grow, or rise as assets decrease. The Board also noted that a committee (the Economies of Scale Committee) created by it and the boards of other Fidelity funds periodically analyzes whether Fidelity attains economies of scale in respect of the management and servicing of the Fidelity funds, whether the Fidelity funds have appropriately benefited from such economies of scale, and whether there is potential for realization of any further economies of scale.
The Board concluded, taking into account the analysis of the Economies of Scale Committee, that economies of scale, if any, are being appropriately shared between fund shareholders and Fidelity.
Additional Information Requested by the Board. In order to develop fully the factual basis for consideration of the Fidelity funds' advisory contracts, the Board requested and received additional information on certain topics, including: (i) fund performance trends, in particular the underperformance of certain funds, and Fidelity's long-term strategies for certain funds; (ii) Fidelity's fund profitability methodology, profitability trends for certain funds, and the impact of certain factors on fund profitability results; (iii) metrics for evaluating index fund and ETF performance and information about ETF trading characteristics; (iv) the methodology with respect to the evaluation of competitive fund data and peer group classifications and fee comparisons; (v) the expense structures for different funds and classes; (vi) information regarding other accounts managed by Fidelity, including collective investment trusts; and (vii) Fidelity's philosophies and strategies for evaluating funds and classes with lower or declining asset levels.
Based on its evaluation of all of the conclusions noted above, and after considering all factors it believed relevant, the Board concluded that the advisory fee arrangements are fair and reasonable, and that the fund's Advisory Contracts should be renewed.
FVDK6-SANN-0319
1.9884002.101
Item 2.
Code of Ethics
Not applicable.
Item 3.
Audit Committee Financial Expert
Not applicable.
Item 4.
Principal Accountant Fees and Services
Not applicable.
Item 5.
Audit Committee of Listed Registrants
Not applicable.
Item 6.
Investments
(a)
Not applicable.
(b)
Not applicable
Item 7.
Disclosure of Proxy Voting Policies and Procedures for Closed-End Management Investment Companies
Not applicable.
Item 8.
Portfolio Managers of Closed-End Management Investment Companies
Not applicable.
Item 9.
Purchase of Equity Securities by Closed-End Management Investment Company and Affiliated Purchasers
Not applicable.
Item 10.
Submission of Matters to a Vote of Security Holders
There were no material changes to the procedures by which shareholders may recommend nominees to the Fidelity Puritan Trust’s Board of Trustees.
Item 11.
Controls and Procedures
(a)(i) The President and Treasurer and the Chief Financial Officer have concluded that the Fidelity Puritan Trust’s (the “Trust”) disclosure controls and procedures (as defined in Rule 30a-3(c) under the Investment Company Act) provide reasonable assurances that
material information relating to the Trust is made known to them by the appropriate persons, based on their evaluation of these controls and procedures as of a date within 90 days of the filing date of this report.
(a)(ii) There was no change in the Trust’s internal control over financial reporting (as defined in Rule 30a-3(d) under the Investment Company Act) that occurred during the period covered by this report that has materially affected, or is reasonably likely to materially affect, the Trust’s internal control over financial reporting.
Item 12.
Disclosure of Securities Lending Activities for Closed-End Management
Investment Companies
Not applicable.
Item 13.
Exhibits
| | |
(a) | (1) | Not applicable. |
(a) | (2) | Certification pursuant to Rule 30a-2(a) under the Investment Company Act of 1940 (17 CFR 270.30a-2(a)) is filed and attached hereto as Exhibit 99.CERT. |
(a) | (3) | Not applicable. |
(b) |
| Certification pursuant to Rule 30a-2(b) under the Investment Company Act of 1940 (17 CFR 270.30a-2(b)) is furnished and attached hereto as Exhibit 99.906CERT. |
SIGNATURES
Pursuant to the requirements of the Securities Exchange Act of 1934 and the Investment Company Act of 1940, the registrant has duly caused this report to be signed on its behalf by the undersigned, thereunto duly authorized.
Fidelity Puritan Trust
| |
By: | /s/Stacie M. Smith |
| Stacie M. Smith |
| President and Treasurer |
|
|
Date: | March 26, 2019 |
Pursuant to the requirements of the Securities Exchange Act of 1934 and the Investment Company Act of 1940, this report has been signed below by the following persons on behalf of the registrant and in the capacities and on the dates indicated.
| |
By: | /s/Stacie M. Smith |
| Stacie M. Smith |
| President and Treasurer |
|
|
Date: | March 26, 2019 |
| |
By: | /s/John J. Burke III |
| John J. Burke III |
| Chief Financial Officer |
|
|
Date: | March 26, 2019 |