UNITED STATES
SECURITIES AND EXCHANGE COMMISSION
Washington, D.C. 20549
FORM N-CSR
CERTIFIED SHAREHOLDER REPORT OF REGISTERED
MANAGEMENT INVESTMENT COMPANIES
Investment Company Act file number 811-00649
Fidelity Puritan Trust
(Exact name of registrant as specified in charter)
245 Summer St., Boston, MA 02210
(Address of principal executive offices) (Zip code)
Cynthia Lo Bessette, Secretary
245 Summer St.
Boston, Massachusetts 02210
(Name and address of agent for service)
Registrant's telephone number, including area code:
617-563-7000
| |
Date of fiscal year end: | August 31 |
|
|
Date of reporting period: | February 29, 2020 |
Item 1.
Reports to Stockholders
Fidelity® Puritan® Fund
Semi-Annual Report
February 29, 2020

See the inside front cover for important information about access to your fund’s shareholder reports.

Beginning on January 1, 2021, as permitted by regulations adopted by the Securities and Exchange Commission, paper copies of a fund’s shareholder reports will no longer be sent by mail, unless you specifically request paper copies of the reports from the fund or from your financial intermediary, such as a financial advisor, broker-dealer or bank. Instead, the reports will be made available on a website, and you will be notified by mail each time a report is posted and provided with a website link to access the report.
If you already elected to receive shareholder reports electronically, you will not be affected by this change and you need not take any action. You may elect to receive shareholder reports and other communications from a fund electronically, by contacting your financial intermediary. For Fidelity customers, visit Fidelity's web site or call Fidelity using the contact information listed below.
You may elect to receive all future reports in paper free of charge. If you wish to continue receiving paper copies of your shareholder reports, you may contact your financial intermediary or, if you are a Fidelity customer, visit Fidelity’s website, or call Fidelity at the applicable toll-free number listed below. Your election to receive reports in paper will apply to all funds held with the fund complex/your financial intermediary.
| Account Type | Website | Phone Number |
| Brokerage, Mutual Fund, or Annuity Contracts: | fidelity.com/mailpreferences | 1-800-343-3548 |
| Employer Provided Retirement Accounts: | netbenefits.fidelity.com/preferences (choose 'no' under Required Disclosures to continue to print) | 1-800-343-0860 |
| Advisor Sold Accounts Serviced Through Your Financial Intermediary: | Contact Your Financial Intermediary | Your Financial Intermediary's phone number |
| Advisor Sold Accounts Serviced by Fidelity: | institutional.fidelity.com | 1-877-208-0098 |
Contents
To view a fund's proxy voting guidelines and proxy voting record for the 12-month period ended June 30, visit http://www.fidelity.com/proxyvotingresults or visit the Securities and Exchange Commission's (SEC) web site at http://www.sec.gov.
You may also call 1-800-544-8544 if you’re an individual investing directly with Fidelity, call 1-800-835-5092 if you’re a plan sponsor or participant with Fidelity as your recordkeeper or call 1-877-208-0098 on institutional accounts or if you’re an advisor or invest through one to request a free copy of the proxy voting guidelines.
Standard & Poor's, S&P and S&P 500 are registered service marks of The McGraw-Hill Companies, Inc. and have been licensed for use by Fidelity Distributors Corporation.
Other third-party marks appearing herein are the property of their respective owners.
All other marks appearing herein are registered or unregistered trademarks or service marks of FMR LLC or an affiliated company. © 2020 FMR LLC. All rights reserved.
This report and the financial statements contained herein are submitted for the general information of the shareholders of the Fund. This report is not authorized for distribution to prospective investors in the Fund unless preceded or accompanied by an effective prospectus.
A fund files its complete schedule of portfolio holdings with the SEC for the first and third quarters of each fiscal year on Form N-PORT. Forms N-PORT are available on the SEC’s web site at http://www.sec.gov. A fund's Forms N-PORT may be reviewed and copied at the SEC’s Public Reference Room in Washington, DC. Information regarding the operation of the SEC's Public Reference Room may be obtained by calling 1-800-SEC-0330.
For a complete list of a fund's portfolio holdings, view the most recent holdings listing, semiannual report, or annual report on Fidelity's web site at http://www.fidelity.com, http://www.institutional.fidelity.com, or http://www.401k.com, as applicable.
NOT FDIC INSURED •MAY LOSE VALUE •NO BANK GUARANTEE
Neither the Fund nor Fidelity Distributors Corporation is a bank.
Note to Shareholders:
Early in 2020, the outbreak and spread of a new coronavirus emerged as a public health emergency that had a major influence on financial markets, primarily based on its impact on the global economy and corporate earnings. The virus causes a respiratory disease known as COVID-19. On March 11, the World Health Organization declared the COVID-19 outbreak a pandemic, citing sustained risk of further global spread.
In the weeks following the end of this reporting period, as the crisis worsened, we witnessed an escalating human tragedy with wide-scale social and economic consequences from coronavirus-containment measures. The outbreak of COVID-19 prompted a number of measures to limit the spread, including travel and border restrictions, quarantines, and restrictions on large gatherings. In turn, these resulted in lower consumer activity, diminished demand for a wide range of products and services, disruption in manufacturing and supply chains, and – given the wide variability in outcomes regarding the outbreak – significant market uncertainty and volatility. Amid the turmoil, the U.S. government took unprecedented action – in concert with the U.S. Federal Reserve and central banks around the world – to help support consumers, businesses, and the broader economy, and to limit disruption to the financial system.
The situation continues to unfold, and the extent and duration of its impact on financial markets and the economy remain highly uncertain. Extreme events such as the coronavirus crisis are “exogenous shocks” that can have significant adverse effects on mutual funds and their investments. Although multiple asset classes may be affected by market disruption, the duration and impact may not be the same for all types of assets.
Fidelity is committed to helping you stay informed amid news about COVID-19 and during increased market volatility, and we’re taking extra steps to be responsive to customer needs. We encourage you to visit our websites, where we offer ongoing updates, commentary, and analysis on the markets and our funds.
Investment Summary (Unaudited)
The information in the following tables is based on the combined investments of the Fund and its pro-rata share of the investments of Fidelity's Fixed-Income Central Funds.
Top Five Stocks as of February 29, 2020
| | % of fund's net assets |
| Microsoft Corp. | 4.2 |
| Alphabet, Inc. Class C | 3.7 |
| Amazon.com, Inc. | 2.6 |
| Apple, Inc. | 2.2 |
| Facebook, Inc. Class A | 2.0 |
| | 14.7 |
Top Five Bond Issuers as of February 29, 2020
| (with maturities greater than one year) | % of fund's net assets |
| U.S. Treasury Obligations | 8.0 |
| Fannie Mae | 2.1 |
| Freddie Mac | 1.6 |
| Ginnie Mae | 1.6 |
| Citigroup, Inc. | 0.5 |
| | 13.8 |
Top Five Market Sectors as of February 29, 2020
| | % of fund's net assets |
| Information Technology | 18.1 |
| Financials | 13.2 |
| Health Care | 11.5 |
| Communication Services | 10.5 |
| Consumer Discretionary | 8.9 |
Asset Allocation (% of fund's net assets)
| As of February 29, 2020 * |
| | Stocks | 66.0% |
| | Bonds | 31.8% |
| | Convertible Securities | 0.8% |
| | Other Investments | 0.8% |
| | Short-Term Investments and Net Other Assets (Liabilities) | 0.6% |

* Foreign investments - 11.2%
An unaudited holdings listing for the Fund, which presents direct holdings as well as the pro-rata share of any securities and other investments held indirectly through its investment in underlying non-money market Fidelity Central Funds, is available at fidelity.com and/or institutional.fidelity.com, as applicable.
Percentages are adjusted for the effect of futures contracts and swaps, if applicable.
Percentages in the above tables are adjusted for the effect of TBA Sale Commitments.
Schedule of Investments February 29, 2020 (Unaudited)
Showing Percentage of Net Assets
| Common Stocks - 65.9% | | | |
| | | Shares | Value (000s) |
| COMMUNICATION SERVICES - 8.6% | | | |
| Entertainment - 2.0% | | | |
| Activision Blizzard, Inc. | | 2,594,309 | $150,807 |
| Electronic Arts, Inc. (a) | | 208,280 | 21,113 |
| LiveXLive Media, Inc. (a)(b)(c) | | 6,536,621 | 8,236 |
| Netflix, Inc. (a) | | 345,151 | 127,371 |
| The Void LLC (a)(d)(e)(f) | | 40,946 | 23,557 |
| The Walt Disney Co. | | 919,837 | 108,219 |
| WME Entertainment Parent, LLC Class A (a)(d)(e)(f) | | 26,182,064 | 73,310 |
| | | | 512,613 |
| Interactive Media & Services - 5.7% | | | |
| Alphabet, Inc. Class C (a) | | 727,809 | 974,776 |
| Facebook, Inc. Class A (a) | | 2,664,993 | 512,931 |
| | | | 1,487,707 |
| Media - 0.5% | | | |
| Comcast Corp. Class A | | 1,385,524 | 56,017 |
| Vice Holding, Inc. (a)(e)(f) | | 86,301 | 64,684 |
| | | | 120,701 |
| Wireless Telecommunication Services - 0.4% | | | |
| T-Mobile U.S., Inc. (a) | | 1,209,897 | 109,084 |
|
| TOTAL COMMUNICATION SERVICES | | | 2,230,105 |
|
| CONSUMER DISCRETIONARY - 7.9% | | | |
| Hotels, Restaurants & Leisure - 0.7% | | | |
| Compass Group PLC | | 681,300 | 15,011 |
| McDonald's Corp. | | 334,369 | 64,924 |
| Penn National Gaming, Inc. (a) | | 264,422 | 7,819 |
| Starbucks Corp. | | 1,276,210 | 100,093 |
| | | | 187,847 |
| Household Durables - 0.1% | | | |
| Blu Homes, Inc. (a)(e)(f) | | 14,988,638 | 26 |
| D.R. Horton, Inc. | | 556,310 | 29,635 |
| | | | 29,661 |
| Internet & Direct Marketing Retail - 3.5% | | | |
| Alibaba Group Holding Ltd. sponsored ADR (a) | | 698,310 | 145,248 |
| Amazon.com, Inc. (a) | | 366,463 | 690,325 |
| eBay, Inc. | | 636,414 | 22,045 |
| The Booking Holdings, Inc. (a) | | 39,279 | 66,604 |
| | | | 924,222 |
| Leisure Products - 0.1% | | | |
| Peloton Interactive, Inc. Class A (a)(b) | | 657,862 | 17,558 |
| Multiline Retail - 0.6% | | | |
| Dollar General Corp. | | 757,172 | 113,803 |
| Dollar Tree, Inc. (a) | | 411,277 | 34,148 |
| | | | 147,951 |
| Specialty Retail - 1.5% | | | |
| Lowe's Companies, Inc. | | 1,150,286 | 122,586 |
| The Home Depot, Inc. | | 646,692 | 140,875 |
| TJX Companies, Inc. | | 2,150,447 | 128,597 |
| | | | 392,058 |
| Textiles, Apparel & Luxury Goods - 1.4% | | | |
| Brunello Cucinelli SpA | | 1,327,832 | 44,427 |
| LVMH Moet Hennessy Louis Vuitton SE | | 255,025 | 106,430 |
| Moncler SpA | | 465,759 | 18,328 |
| NIKE, Inc. Class B | | 1,524,623 | 136,271 |
| Tapestry, Inc. | | 259,259 | 6,080 |
| Tory Burch LLC: | | | |
| Class A (a)(d)(e)(f) | | 702,741 | 36,545 |
| Class B (a)(d)(e)(f) | | 324,840 | 18,061 |
| | | | 366,142 |
|
| TOTAL CONSUMER DISCRETIONARY | | | 2,065,439 |
|
| CONSUMER STAPLES - 2.8% | | | |
| Beverages - 1.2% | | | |
| Keurig Dr. Pepper, Inc. | | 1,043,571 | 29,095 |
| Monster Beverage Corp. (a) | | 812,916 | 50,734 |
| PepsiCo, Inc. | | 169,639 | 22,397 |
| The Coca-Cola Co. | | 4,071,771 | 217,799 |
| | | | 320,025 |
| Food & Staples Retailing - 1.2% | | | |
| Costco Wholesale Corp. | | 335,597 | 94,350 |
| Kroger Co. | | 867,613 | 24,406 |
| Walmart, Inc. | | 1,814,047 | 195,337 |
| | | | 314,093 |
| Personal Products - 0.2% | | | |
| Estee Lauder Companies, Inc. Class A | | 178,664 | 32,803 |
| L'Oreal SA | | 10,493 | 2,820 |
| | | | 35,623 |
| Tobacco - 0.2% | | | |
| Altria Group, Inc. | | 1,454,315 | 58,711 |
|
| TOTAL CONSUMER STAPLES | | | 728,452 |
|
| ENERGY - 0.8% | | | |
| Oil, Gas & Consumable Fuels - 0.8% | | | |
| ConocoPhillips Co. | | 201,964 | 9,779 |
| Hess Corp. | | 1,923,624 | 108,069 |
| Pioneer Natural Resources Co. | | 479,433 | 58,865 |
| Reliance Industries Ltd. | | 2,352,300 | 43,086 |
| | | | 219,799 |
| FINANCIALS - 7.6% | | | |
| Banks - 3.8% | | | |
| Bank of America Corp. | | 11,410,364 | 325,195 |
| Citigroup, Inc. | | 1,406,372 | 89,248 |
| HDFC Bank Ltd. sponsored ADR | | 73,241 | 4,017 |
| JPMorgan Chase & Co. | | 3,022,942 | 350,994 |
| M&T Bank Corp. | | 175,763 | 24,674 |
| Truist Financial Corp. | | 377,969 | 17,439 |
| Wells Fargo & Co. | | 4,717,789 | 192,722 |
| | | | 1,004,289 |
| Capital Markets - 2.6% | | | |
| CME Group, Inc. | | 649,924 | 129,218 |
| London Stock Exchange Group PLC | | 819,500 | 80,495 |
| Moody's Corp. | | 443,517 | 106,457 |
| Morningstar, Inc. | | 368,684 | 54,160 |
| MSCI, Inc. | | 349,989 | 103,401 |
| S&P Global, Inc. | | 456,221 | 121,314 |
| The Blackstone Group LP | | 737,871 | 39,727 |
| Tradeweb Markets, Inc. Class A | | 596,074 | 28,743 |
| XP, Inc. Class A (a) | | 297,503 | 10,308 |
| | | | 673,823 |
| Consumer Finance - 0.4% | | | |
| American Express Co. | | 967,403 | 106,347 |
| Diversified Financial Services - 0.8% | | | |
| Berkshire Hathaway, Inc. Class B (a) | | 956,919 | 197,451 |
|
| TOTAL FINANCIALS | | | 1,981,910 |
|
| HEALTH CARE - 10.2% | | | |
| Biotechnology - 2.5% | | | |
| AbbVie, Inc. | | 1,639,928 | 140,558 |
| ACADIA Pharmaceuticals, Inc. (a) | | 172,595 | 7,377 |
| Acceleron Pharma, Inc. (a) | | 307,650 | 26,436 |
| Amgen, Inc. | | 883,473 | 176,456 |
| Biogen, Inc. (a) | | 76,767 | 23,674 |
| Black Diamond Therapeutics, Inc. (a) | | 103,517 | 2,794 |
| Neurocrine Biosciences, Inc. (a) | | 89,025 | 8,431 |
| Regeneron Pharmaceuticals, Inc. (a) | | 300,082 | 133,407 |
| Revolution Medicines, Inc. | | 52,703 | 1,648 |
| Vertex Pharmaceuticals, Inc. (a) | | 537,825 | 120,489 |
| | | | 641,270 |
| Health Care Equipment & Supplies - 2.4% | | | |
| Boston Scientific Corp. (a) | | 4,371,352 | 163,445 |
| Danaher Corp. | | 1,190,572 | 172,133 |
| DexCom, Inc. (a) | | 155,078 | 42,802 |
| Hologic, Inc. (a) | | 891,018 | 41,985 |
| Intuitive Surgical, Inc. (a) | | 282,274 | 150,723 |
| Stryker Corp. | | 357,050 | 68,050 |
| | | | 639,138 |
| Health Care Providers & Services - 2.0% | | | |
| 1Life Healthcare, Inc. (a)(b) | | 447,479 | 9,674 |
| Centene Corp. (a) | | 1,407,573 | 74,630 |
| Cigna Corp. | | 929,121 | 169,973 |
| Humana, Inc. | | 57,023 | 18,229 |
| UnitedHealth Group, Inc. | | 975,468 | 248,705 |
| | | | 521,211 |
| Life Sciences Tools & Services - 1.0% | | | |
| 10X Genomics, Inc. (a) | | 178,681 | 14,241 |
| Bruker Corp. | | 2,323,621 | 101,217 |
| Thermo Fisher Scientific, Inc. | | 485,237 | 141,107 |
| | | | 256,565 |
| Pharmaceuticals - 2.3% | | | |
| AstraZeneca PLC sponsored ADR | | 2,750,652 | 120,479 |
| Eli Lilly & Co. | | 948,194 | 119,596 |
| Roche Holding AG (participation certificate) | | 139,770 | 44,941 |
| Sanofi SA sponsored ADR | | 3,780,786 | 174,861 |
| Zoetis, Inc. Class A | | 990,017 | 131,900 |
| | | | 591,777 |
|
| TOTAL HEALTH CARE | | | 2,649,961 |
|
| INDUSTRIALS - 6.0% | | | |
| Aerospace & Defense - 1.1% | | | |
| Northrop Grumman Corp. | | 649,000 | 213,417 |
| Space Exploration Technologies Corp.: | | | |
| Class A (a)(e)(f) | | 41,122 | 9,047 |
| Class C (a)(e)(f) | | 5,607 | 1,234 |
| TransDigm Group, Inc. | | 97,888 | 54,603 |
| | | | 278,301 |
| Air Freight & Logistics - 0.1% | | | |
| United Parcel Service, Inc. Class B | | 212,045 | 19,188 |
| Commercial Services & Supplies - 0.2% | | | |
| Copart, Inc. (a) | | 72,953 | 6,163 |
| TulCo LLC (a)(d)(e)(f) | | 42,857 | 19,897 |
| Waste Management, Inc. (b) | | 181,975 | 20,165 |
| | | | 46,225 |
| Construction & Engineering - 0.2% | | | |
| Jacobs Engineering Group, Inc. | | 606,254 | 55,981 |
| Electrical Equipment - 0.7% | | | |
| AMETEK, Inc. | | 1,512,953 | 130,114 |
| Generac Holdings, Inc. (a) | | 280,091 | 28,847 |
| Rockwell Automation, Inc. | | 184,340 | 33,826 |
| | | | 192,787 |
| Industrial Conglomerates - 0.8% | | | |
| General Electric Co. | | 17,916,591 | 194,933 |
| Roper Technologies, Inc. | | 22,076 | 7,764 |
| | | | 202,697 |
| Machinery - 0.9% | | | |
| Caterpillar, Inc. | | 519,907 | 64,593 |
| Gardner Denver Holdings, Inc. | | 1,660,894 | 54,461 |
| ITT, Inc. | | 190,009 | 11,429 |
| Parker Hannifin Corp. | | 248,139 | 45,849 |
| Trane Technologies PLC | | 523,647 | 67,571 |
| | | | 243,903 |
| Professional Services - 0.6% | | | |
| Clarivate Analytics PLC (a) | | 347,741 | 7,073 |
| Equifax, Inc. | | 76,469 | 10,862 |
| Experian PLC | | 1,389,400 | 46,245 |
| IHS Markit Ltd. | | 1,253,896 | 89,328 |
| | | | 153,508 |
| Road & Rail - 1.4% | | | |
| Lyft, Inc. | | 2,190,040 | 83,484 |
| Uber Technologies, Inc. | | 4,381,476 | 148,401 |
| Union Pacific Corp. | | 873,754 | 139,635 |
| | | | 371,520 |
|
| TOTAL INDUSTRIALS | | | 1,564,110 |
|
| INFORMATION TECHNOLOGY - 17.8% | | | |
| IT Services - 4.5% | | | |
| Accenture PLC Class A | | 649,291 | 117,255 |
| Automatic Data Processing, Inc. | | 227,350 | 35,180 |
| Black Knight, Inc. (a) | | 1,100,998 | 73,448 |
| Edenred SA | | 768,720 | 40,241 |
| Fidelity National Information Services, Inc. | | 1,522,671 | 212,748 |
| Global Payments, Inc. | | 356,920 | 65,663 |
| MasterCard, Inc. Class A | | 940,056 | 272,851 |
| MongoDB, Inc. Class A (a) | | 126,081 | 19,227 |
| Visa, Inc. Class A | | 1,834,825 | 333,498 |
| | | | 1,170,111 |
| Semiconductors & Semiconductor Equipment - 4.7% | | | |
| Advanced Micro Devices, Inc. (a) | | 436,451 | 19,850 |
| Analog Devices, Inc. | | 1,093,151 | 119,208 |
| ASML Holding NV | | 551,386 | 152,574 |
| Broadcom, Inc. | | 76,633 | 20,892 |
| Lam Research Corp. | | 551,390 | 161,794 |
| Marvell Technology Group Ltd. | | 4,089,689 | 87,110 |
| Micron Technology, Inc. (a) | | 2,675,691 | 140,634 |
| NVIDIA Corp. | | 925,302 | 249,896 |
| NXP Semiconductors NV | | 831,469 | 94,530 |
| Qualcomm, Inc. | | 1,757,259 | 137,593 |
| Universal Display Corp. | | 56,183 | 8,921 |
| Xilinx, Inc. | | 258,928 | 21,618 |
| | | | 1,214,620 |
| Software - 6.3% | | | |
| Adobe, Inc. (a) | | 796,047 | 274,732 |
| Aspen Technology, Inc. (a) | | 176,704 | 18,821 |
| Atom Tickets LLC (a)(d)(e)(f) | | 2,580,511 | 3,071 |
| HubSpot, Inc. (a) | | 98,888 | 17,745 |
| Microsoft Corp. | | 6,817,397 | 1,104,481 |
| Salesforce.com, Inc. (a) | | 1,237,538 | 210,876 |
| Slack Technologies, Inc. Class A (a)(b) | | 467,367 | 12,628 |
| | | | 1,642,354 |
| Technology Hardware, Storage & Peripherals - 2.3% | | | |
| Apple, Inc. | | 2,095,470 | 572,818 |
| Samsung Electronics Co. Ltd. | | 782,810 | 35,332 |
| | | | 608,150 |
|
| TOTAL INFORMATION TECHNOLOGY | | | 4,635,235 |
|
| MATERIALS - 2.0% | | | |
| Chemicals - 1.0% | | | |
| Air Products & Chemicals, Inc. | | 396,933 | 87,170 |
| Albemarle Corp. U.S. (b) | | 229,905 | 18,818 |
| CF Industries Holdings, Inc. | | 497,035 | 18,321 |
| Linde PLC | | 431,526 | 82,426 |
| Sherwin-Williams Co. | | 98,421 | 50,859 |
| The Chemours Co. LLC | | 745,798 | 11,083 |
| | | | 268,677 |
| Containers & Packaging - 0.4% | | | |
| Avery Dennison Corp. | | 945,267 | 108,224 |
| Metals & Mining - 0.6% | | | |
| Barrick Gold Corp. | | 7,383,080 | 140,574 |
|
| TOTAL MATERIALS | | | 517,475 |
|
| REAL ESTATE - 1.8% | | | |
| Equity Real Estate Investment Trusts (REITs) - 1.8% | | | |
| American Tower Corp. | | 1,095,841 | 248,537 |
| Ant International Co. Ltd. Class C (a)(e)(f) | | 1,782,512 | 13,743 |
| Crown Castle International Corp. | | 778,205 | 111,509 |
| Equinix, Inc. | | 69,610 | 39,873 |
| Prologis, Inc. | | 796,285 | 67,111 |
| | | | 480,773 |
| UTILITIES - 0.4% | | | |
| Electric Utilities - 0.4% | | | |
| NextEra Energy, Inc. | | 373,758 | 94,471 |
| Independent Power and Renewable Electricity Producers - 0.0% | | | |
| Vistra Energy Corp. | | 340,587 | 6,549 |
|
| TOTAL UTILITIES | | | 101,020 |
|
| TOTAL COMMON STOCKS | | | |
| (Cost $12,560,170) | | | 17,174,279 |
|
| Convertible Preferred Stocks - 0.7% | | | |
| CONSUMER DISCRETIONARY - 0.5% | | | |
| Hotels, Restaurants & Leisure - 0.1% | | | |
| Neutron Holdings, Inc.: | | | |
| Series C (a)(e)(f) | | 38,589,900 | 9,358 |
| Series D (a)(e)(f) | | 40,824,742 | 9,900 |
| | | | 19,258 |
| Internet & Direct Marketing Retail - 0.1% | | | |
| The Honest Co., Inc.: | | | |
| Series D (a)(e)(f) | | 196,700 | 9,001 |
| Series E (a)(e)(f) | | 1,020,158 | 19,995 |
| | | | 28,996 |
| Specialty Retail - 0.1% | | | |
| Moda Operandi, Inc.: | | | |
| Series E (a)(e)(f) | | 508,444 | 12,625 |
| Series F (a)(e)(f) | | 157,251 | 3,905 |
| | | | 16,530 |
| Textiles, Apparel & Luxury Goods - 0.2% | | | |
| Goop International Holdings, Inc.: | | | |
| Series C (a)(e)(f) | | 1,881,874 | 30,524 |
| Series D (e)(f) | | 342,241 | 5,551 |
| Rent the Runway, Inc.: | | | |
| Series E (a)(e)(f) | | 1,378,930 | 26,572 |
| Series F (e)(f) | | 223,676 | 4,310 |
| | | | 66,957 |
|
| TOTAL CONSUMER DISCRETIONARY | | | 131,741 |
|
| HEALTH CARE - 0.1% | | | |
| Biotechnology - 0.0% | | | |
| Generation Bio Series B (a)(e)(f) | | 370,500 | 2,353 |
| Health Care Providers & Services - 0.1% | | | |
| Get Heal, Inc. Series B (a)(e)(f) | | 8,512,822 | 263 |
| Mulberry Health, Inc.: | | | |
| Series A-8 (a)(e)(f) | | 2,960,879 | 15,693 |
| Series A-9 (a)(e)(f) | | 700,782 | 3,714 |
| Series AA-9 (a)(e)(f) | | 58,145 | 308 |
| | | | 19,978 |
|
| TOTAL HEALTH CARE | | | 22,331 |
|
| INDUSTRIALS - 0.1% | | | |
| Aerospace & Defense - 0.1% | | | |
| Space Exploration Technologies Corp. Series H (a)(e)(f) | | 51,921 | 11,423 |
| INFORMATION TECHNOLOGY - 0.0% | | | |
| Software - 0.0% | | | |
| Jello Labs, Inc. Series C (a)(e)(f) | | 1,050,307 | 0 |
| TOTAL CONVERTIBLE PREFERRED STOCKS | | | |
| (Cost $189,646) | | | 165,495 |
|
| Fixed-Income Funds - 32.8% | | | |
| Fidelity High Income Central Fund (g) | | 12,019,090 | 1,308,398 |
| Fidelity Investment Grade Bond Central Fund (g) | | 62,574,650 | 7,234,255 |
| TOTAL FIXED-INCOME FUNDS | | | |
| (Cost $8,127,565) | | | 8,542,653 |
|
| Money Market Funds - 0.3% | | | |
| Fidelity Cash Central Fund 1.60% (h) | | 57,201,080 | 57,213 |
| Fidelity Securities Lending Cash Central Fund 1.60% (h)(i) | | 26,116,870 | 26,119 |
| TOTAL MONEY MARKET FUNDS | | | |
| (Cost $83,331) | | | 83,332 |
| TOTAL INVESTMENT IN SECURITIES - 99.7% | | | |
| (Cost $20,960,712) | | | 25,965,759 |
| NET OTHER ASSETS (LIABILITIES) - 0.3% | | | 88,935 |
| NET ASSETS - 100% | | | $26,054,694 |
Values shown as $0 in the Schedule of Investments may reflect amounts less than $500.
Legend
(a) Non-income producing
(b) Security or a portion of the security is on loan at period end.
(c) Affiliated company
(d) Investment is owned by a wholly-owned subsidiary (Subsidiary) that is treated as a corporation for U.S. tax purposes.
(e) Restricted securities (including private placements) - Investment in securities not registered under the Securities Act of 1933 (excluding 144A issues). At the end of the period, the value of restricted securities (excluding 144A issues) amounted to $428,670,000 or 1.6% of net assets.
(f) Level 3 security
(g) Affiliated fund that is generally available only to investment companies and other accounts managed by Fidelity Investments. A complete unaudited schedule of portfolio holdings for each Fidelity Central Fund is filed with the SEC for the first and third quarters of each fiscal year on Form N-PORT and is available upon request or at the SEC's website at www.sec.gov. An unaudited holdings listing for the Fund, which presents direct holdings as well as the pro-rata share of securities and other investments held indirectly through its investment in underlying non-money market Fidelity Central Funds is available at fidelity.com and/or institutional.fidelity.com, as applicable. In addition, each Fidelity Central Fund's financial statements are available on the SEC's website or upon request.
(h) Affiliated fund that is generally available only to investment companies and other accounts managed by Fidelity Investments. The rate quoted is the annualized seven-day yield of the fund at period end. A complete unaudited listing of the fund's holdings as of its most recent quarter end is available upon request. In addition, each Fidelity Central Fund's financial statements are available on the SEC's website or upon request.
(i) Investment made with cash collateral received from securities on loan.
Additional information on each restricted holding is as follows:
| Security | Acquisition Date | Acquisition Cost (000s) |
| Ant International Co. Ltd. Class C | 5/16/18 | $10,000 |
| Atom Tickets LLC | 8/15/17 | $15,000 |
| Blu Homes, Inc. | 6/10/13 | $5,000 |
| Generation Bio Series B | 2/21/18 | $3,388 |
| Get Heal, Inc. Series B | 11/7/16 | $2,597 |
| Goop International Holdings, Inc. Series C | 12/15/17 | $20,000 |
| Goop International Holdings, Inc. Series D | 6/21/19 | $5,000 |
| Jello Labs, Inc. Series C | 12/22/16 | $17,000 |
| Moda Operandi, Inc. Series E | 12/18/14 | $20,000 |
| Moda Operandi, Inc. Series F | 12/13/17 | $8,526 |
| Mulberry Health, Inc. Series A-8 | 1/20/16 | $20,000 |
| Mulberry Health, Inc. Series A-9 | 3/23/18 | $5,000 |
| Mulberry Health, Inc. Series AA-9 | 3/23/18 | $170 |
| Neutron Holdings, Inc. Series C | 7/3/18 | $7,056 |
| Neutron Holdings, Inc. Series D | 1/25/19 | $9,900 |
| Rent the Runway, Inc. Series E | 12/22/16 | $30,000 |
| Rent the Runway, Inc. Series F | 3/21/19 | $5,000 |
| Space Exploration Technologies Corp. Class A | 9/11/17 | $5,551 |
| Space Exploration Technologies Corp. Class C | 9/11/17 | $757 |
| Space Exploration Technologies Corp. Series H | 8/4/17 | $7,009 |
| The Honest Co., Inc. Series D | 8/3/15 | $9,000 |
| The Honest Co., Inc. Series E | 9/28/17 | $20,000 |
| The Void LLC | 12/21/17 | $20,000 |
| Tory Burch LLC Class A | 5/14/15 | $50,000 |
| Tory Burch LLC Class B | 12/31/12 | $17,505 |
| TulCo LLC | 8/24/17 - 12/14/17 | $15,000 |
| Vice Holding, Inc. | 8/3/12 - 7/18/14 | $61,641 |
| WME Entertainment Parent, LLC Class A | 4/13/16 - 8/16/16 | $50,000 |
Affiliated Central Funds
Information regarding fiscal year to date income earned by the Fund from investments in Fidelity Central Funds is as follows:
| Fund | Income earned |
| | (Amounts in thousands) |
| Fidelity Cash Central Fund | $1,741 |
| Fidelity High Income Central Fund | 42,438 |
| Fidelity Investment Grade Bond Central Fund | 109,919 |
| Fidelity Securities Lending Cash Central Fund | 487 |
| Total | $154,585 |
Amounts in the income column in the above table include any capital gain distributions from underlying funds, which are presented in the corresponding line-item in the Statement of Operations, if applicable. Amount for Fidelity Securities Lending Cash Central Fund represents the income earned on investing cash collateral, less rebates paid to borrowers and any lending agent fees associated with the loan, plus any premium payments received for lending certain types of securities.
Fiscal year to date information regarding the Fund’s investments in non-Money Market Central Funds, including the ownership percentage, is presented below.
| Fund (Amounts in thousands) | Value, beginning of period | Purchases(a) | Sales Proceeds | Realized Gain/Loss | Change in Unrealized appreciation (depreciation) | Value, end of period | % ownership, end of period |
| Fidelity High Income Central Fund | $1,357,271 | $45,537 | $63,809 | $(583) | $(30,018) | $1,308,398 | 56.2% |
| Fidelity Investment Grade Bond Central Fund | 7,256,004 | 368,801 | 530,638 | 17,232 | 122,856 | 7,234,255 | 25.5% |
| Total | $8,613,275 | $414,338 | $594,447 | $16,649 | $92,838 | $8,542,653 | |
(a) Includes the value of shares purchased or redeemed through in-kind transactions, if applicable.
Other Affiliated Issuers
An affiliated company is a company in which the Fund has ownership of at least 5% of the voting securities. Fiscal year to date transactions with companies which are or were affiliates are as follows:
| Affiliate (Amounts in thousands) | Value, beginning of period | Purchases | Sales Proceeds(a) | Dividend Income | Realized Gain (loss) | Change in Unrealized appreciation (depreciation) | Value, end of period |
| LiveXLive Media, Inc. | $14,613 | $-- | $62 | $-- | $(34) | $(6,281) | $8,236 |
| Total | $14,613 | $-- | $62 | $-- | $(34) | $(6,281) | $8,236 |
(a) Includes the value of securities delivered through in-kind transactions, if applicable.
Investment Valuation
The following is a summary of the inputs used, as of February 29, 2020, involving the Fund's assets and liabilities carried at fair value. The inputs or methodology used for valuing securities may not be an indication of the risk associated with investing in those securities. For more information on valuation inputs, and their aggregation into the levels used below, please refer to the Investment Valuation section in the accompanying Notes to Financial Statements.
| | Valuation Inputs at Reporting Date: |
| Description | Total | Level 1 | Level 2 | Level 3 |
| (Amounts in thousands) | | | | |
| Investments in Securities: | | | | |
| Equities: | | | | |
| Communication Services | $2,230,105 | $2,068,554 | $-- | $161,551 |
| Consumer Discretionary | 2,197,180 | 1,826,611 | 184,196 | 186,373 |
| Consumer Staples | 728,452 | 725,632 | 2,820 | -- |
| Energy | 219,799 | 219,799 | -- | -- |
| Financials | 1,981,910 | 1,901,415 | 80,495 | -- |
| Health Care | 2,672,292 | 2,605,020 | 44,941 | 22,331 |
| Industrials | 1,575,533 | 1,487,687 | 46,245 | 41,601 |
| Information Technology | 4,635,235 | 4,591,923 | 40,241 | 3,071 |
| Materials | 517,475 | 517,475 | -- | -- |
| Real Estate | 480,773 | 467,030 | -- | 13,743 |
| Utilities | 101,020 | 101,020 | -- | -- |
| Fixed-Income Funds | 8,542,653 | 8,542,653 | -- | -- |
| Money Market Funds | 83,332 | 83,332 | -- | -- |
| Total Investments in Securities: | $25,965,759 | $25,138,151 | $398,938 | $428,670 |
The following is a reconciliation of Investments in Securities for which Level 3 inputs were used in determining value:
| (Amounts in thousands) | |
| Investments in Securities: | |
| Beginning Balance | $415,078 |
| Net Realized Gain (Loss) on Investment Securities | -- |
| Net Unrealized Gain (Loss) on Investment Securities | 13,449 |
| Cost of Purchases | 143 |
| Proceeds of Sales | -- |
| Amortization/Accretion | -- |
| Transfers into Level 3 | -- |
| Transfers out of Level 3 | -- |
| Ending Balance | $428,670 |
| The change in unrealized gain (loss) for the period attributable to Level 3 securities held at February 29, 2020 | $13,449 |
The information used in the above reconciliations represents fiscal year to date activity for any Investments in Securities identified as using Level 3 inputs at either the beginning or the end of the current fiscal period. Transfers in or out of Level 3 represent the beginning value of any Security or Instrument where a change in the pricing level occurred from the beginning to the end of the period. The cost of purchases and the proceeds of sales may include securities received or delivered through corporate actions or exchanges. Realized and unrealized gains (losses) disclosed in the reconciliations are included in Net Gain (Loss) on the Fund's Statement of Operations.
Other Information
The composition of credit quality ratings as a percentage of Total Net Assets is as follows (Unaudited):
| U.S. Government and U.S. Government Agency Obligations | 14.8% |
| AAA,AA,A | 3.5% |
| BBB | 7.9% |
| BB | 2.9% |
| B | 1.9% |
| CCC,CC,C | 0.7% |
| D | 0.2% |
| Not Rated | 0.8% |
| Equities | 66.7% |
| Short-Term Investments and Net Other Assets | 0.6% |
| | 100.0% |
We have used ratings from Moody's Investors Service, Inc. Where Moody's® ratings are not available, we have used S&P® ratings. All ratings are as of the date indicated and do not reflect subsequent changes.
Distribution of investments by country or territory of incorporation, as a percentage of Total Net Assets, is as follows (Unaudited):
| United States of America | 88.8% |
| United Kingdom | 1.7% |
| Netherlands | 1.5% |
| France | 1.5% |
| Cayman Islands | 1.4% |
| Canada | 1.2% |
| Ireland | 1.0% |
| Others (Individually Less Than 1%) | 2.9% |
| | 100.0% |
The information in the above tables is based on the combined investments of the fund and its pro-rata share of the investments of Fidelity's Fixed-Income Central Funds
See accompanying notes which are an integral part of the financial statements.
Financial Statements
Statement of Assets and Liabilities
| Amounts in thousands (except per-share amounts) | | February 29, 2020 |
| Assets | | |
Investment in securities, at value (including securities loaned of $24,372) — See accompanying schedule:
Unaffiliated issuers (cost $12,728,383) | $17,331,538 | |
| Fidelity Central Funds (cost $8,210,896) | 8,625,985 | |
| Other affiliated issuers (cost $21,433) | 8,236 | |
| Total Investment in Securities (cost $20,960,712) | | $25,965,759 |
| Cash | | 486 |
| Restricted cash | | 277 |
| Receivable for investments sold | | 444,716 |
| Receivable for fund shares sold | | 18,188 |
| Dividends receivable | | 19,851 |
| Distributions receivable from Fidelity Central Funds | | 208 |
| Prepaid expenses | | 25 |
| Other receivables | | 1,565 |
| Total assets | | 26,451,075 |
| Liabilities | | |
| Payable for investments purchased | $121,272 | |
| Payable for fund shares redeemed | 235,858 | |
| Accrued management fee | 8,951 | |
| Other affiliated payables | 2,619 | |
| Other payables and accrued expenses | 1,552 | |
| Collateral on securities loaned | 26,129 | |
| Total liabilities | | 396,381 |
| Net Assets | | $26,054,694 |
| Net Assets consist of: | | |
| Paid in capital | | $20,510,370 |
| Total accumulated earnings (loss) | | 5,544,324 |
| Net Assets | | $26,054,694 |
| Net Asset Value and Maximum Offering Price | | |
| Puritan: | | |
| Net Asset Value, offering price and redemption price per share ($20,878,966 ÷ 948,536 shares) | | $22.01 |
| Class K: | | |
| Net Asset Value, offering price and redemption price per share ($5,175,728 ÷ 235,308 shares) | | $22.00 |
See accompanying notes which are an integral part of the financial statements.
Statement of Operations
| Amounts in thousands | | Six months ended February 29, 2020 |
| Investment Income | | |
| Dividends | | $115,520 |
| Interest | | 40 |
| Income from Fidelity Central Funds (including $487 from security lending) | | 146,781 |
| Total income | | 262,341 |
| Expenses | | |
| Management fee | $52,373 | |
| Transfer agent fees | 14,688 | |
| Accounting fees | 1,115 | |
| Custodian fees and expenses | 135 | |
| Independent trustees' fees and expenses | 73 | |
| Registration fees | 82 | |
| Audit | 91 | |
| Legal | 25 | |
| Interest | 10 | |
| Miscellaneous | 71 | |
| Total expenses before reductions | 68,663 | |
| Expense reductions | (557) | |
| Total expenses after reductions | | 68,106 |
| Net investment income (loss) | | 194,235 |
| Realized and Unrealized Gain (Loss) | | |
| Net realized gain (loss) on: | | |
| Investment securities: | | |
| Unaffiliated issuers | 768,287 | |
| Redemptions in-kind with affiliated entities (including loss from Other affiliated issuers of $(29)) | 276 | |
| Fidelity Central Funds | 16,649 | |
| Other affiliated issuers | (5) | |
| Foreign currency transactions | 29 | |
| Futures contracts | 1,227 | |
| Capital gain distributions from Fidelity Central Funds | 7,804 | |
| Total net realized gain (loss) | | 794,267 |
| Change in net unrealized appreciation (depreciation) on: | | |
| Investment securities: | | |
| Unaffiliated issuers (net of increase in deferred foreign taxes of $156) | (264,330) | |
| Fidelity Central Funds | 92,838 | |
| Other affiliated issuers | (6,281) | |
| Assets and liabilities in foreign currencies | 1 | |
| Total change in net unrealized appreciation (depreciation) | | (177,772) |
| Net gain (loss) | | 616,495 |
| Net increase (decrease) in net assets resulting from operations | | $810,730 |
See accompanying notes which are an integral part of the financial statements.
Statement of Changes in Net Assets
| Amounts in thousands | Six months ended February 29, 2020 | Year ended August 31, 2019 |
| Increase (Decrease) in Net Assets | | |
| Operations | | |
| Net investment income (loss) | $194,235 | $434,797 |
| Net realized gain (loss) | 794,267 | 2,034,112 |
| Change in net unrealized appreciation (depreciation) | (177,772) | (2,295,355) |
| Net increase (decrease) in net assets resulting from operations | 810,730 | 173,554 |
| Distributions to shareholders | (964,905) | (3,621,517) |
| Share transactions - net increase (decrease) | (771,964) | 953,016 |
| Total increase (decrease) in net assets | (926,139) | (2,494,947) |
| Net Assets | | |
| Beginning of period | 26,980,833 | 29,475,780 |
| End of period | $26,054,694 | $26,980,833 |
See accompanying notes which are an integral part of the financial statements.
Financial Highlights
Fidelity Puritan Fund
| | Six months ended February 29, | Years endedAugust 31, | | | | |
| | 2020 | 2019 | 2018 | 2017 | 2016 | 2015 |
| Selected Per–Share Data | | | | | | |
| Net asset value, beginning of period | $22.17 | $25.10 | $22.90 | $21.07 | $21.02 | $22.91 |
| Income from Investment Operations | | | | | | |
| Net investment income (loss)A | .16 | .34 | .37 | .37 | .36 | .47B |
| Net realized and unrealized gain (loss) | .48 | (.27) | 2.81 | 2.21 | 1.10 | (.33) |
| Total from investment operations | .64 | .07 | 3.18 | 2.58 | 1.46 | .14 |
| Distributions from net investment income | (.17) | (.36)C | (.32) | (.39)C | (.34) | (.46) |
| Distributions from net realized gain | (.63) | (2.63)C | (.67) | (.36)C | (1.07) | (1.57) |
| Total distributions | (.80) | (3.00)D | (.98)E | (.75) | (1.41) | (2.03) |
| Net asset value, end of period | $22.01 | $22.17 | $25.10 | $22.90 | $21.07 | $21.02 |
| Total ReturnF,G | 2.94% | 1.17% | 14.34% | 12.64% | 7.36% | .87% |
| Ratios to Average Net AssetsH,I | | | | | | |
| Expenses before reductions | .52%J | .53% | .54% | .55% | .56% | .56% |
| Expenses net of fee waivers, if any | .52%J | .53% | .53% | .55% | .56% | .56% |
| Expenses net of all reductions | .52%J | .53% | .53% | .55% | .55% | .55% |
| Net investment income (loss) | 1.41%J | 1.58% | 1.54% | 1.73% | 1.77% | 2.13%B |
| Supplemental Data | | | | | | |
| Net assets, end of period (in millions) | $20,879 | $21,319 | $22,864 | $20,132 | $19,754 | $18,812 |
| Portfolio turnover rateK | 52%J,L | 132%L | 44%L | 45% | 36% | 106% |
A Calculated based on average shares outstanding during the period.
B Net investment income per share reflects a large, non-recurring dividend which amounted to $.13 per share. Excluding this non-recurring dividend, the ratio of net investment income (loss) to average net assets would have been 1.55%.
C The amounts shown reflect certain reclassifications related to book to tax differences that were made in the year shown.
D Total distributions of $3.00 per share is comprised of distributions from net investment income of $.369 and distributions from net realized gain of $2.628 per share.
E Total distributions of $.98 per share is comprised of distributions from net investment income of $.318 and distributions from net realized gain of $.666 per share.
F Total returns for periods of less than one year are not annualized.
G Total returns would have been lower if certain expenses had not been reduced during the applicable periods shown.
H Fees and expenses of any underlying Fidelity Central Funds are not included in the Fund's expense ratio. The Fund indirectly bears its proportionate share of the expenses of any underlying Fidelity Central Funds. Based on their most recent shareholder report date, the expenses of any underlying non-money market Fidelity Central Funds were less than .005%.
I Expense ratios reflect operating expenses of the class. Expenses before reductions do not reflect amounts reimbursed by the investment adviser or reductions from brokerage service arrangements or reductions from other expense offset arrangements and do not represent the amount paid by the class during periods when reimbursements or reductions occur. Expenses net of fee waivers reflect expenses after reimbursement by the investment adviser but prior to reductions from brokerage service arrangements or other expense offset arrangements. Expenses net of all reductions represent the net expenses paid by the class.
J Annualized
K Amount does not include the portfolio activity of any underlying Fidelity Central Funds.
L Portfolio turnover rate excludes securities received or delivered in-kind.
See accompanying notes which are an integral part of the financial statements.
Fidelity Puritan Fund Class K
| | Six months ended February 29, | Years endedAugust 31, | | | | |
| | 2020 | 2019 | 2018 | 2017 | 2016 | 2015 |
| Selected Per–Share Data | | | | | | |
| Net asset value, beginning of period | $22.15 | $25.09 | $22.89 | $21.06 | $21.01 | $22.90 |
| Income from Investment Operations | | | | | | |
| Net investment income (loss)A | .17 | .36 | .39 | .39 | .38 | .49B |
| Net realized and unrealized gain (loss) | .49 | (.28) | 2.81 | 2.21 | 1.10 | (.33) |
| Total from investment operations | .66 | .08 | 3.20 | 2.60 | 1.48 | .16 |
| Distributions from net investment income | (.18) | (.38)C | (.34) | (.41)C | (.36) | (.48) |
| Distributions from net realized gain | (.63) | (2.63)C | (.67) | (.36)C | (1.07) | (1.57) |
| Total distributions | (.81) | (3.02)D | (1.00)E | (.77) | (1.43) | (2.05) |
| Net asset value, end of period | $22.00 | $22.15 | $25.09 | $22.89 | $21.06 | $21.01 |
| Total ReturnF,G | 3.04% | 1.22% | 14.44% | 12.76% | 7.48% | .96% |
| Ratios to Average Net AssetsH,I | | | | | | |
| Expenses before reductions | .44%J | .45% | .45% | .46% | .46% | .46% |
| Expenses net of fee waivers, if any | .44%J | .45% | .45% | .46% | .46% | .46% |
| Expenses net of all reductions | .44%J | .44% | .44% | .45% | .46% | .46% |
| Net investment income (loss) | 1.49%J | 1.67% | 1.63% | 1.82% | 1.86% | 2.23%B |
| Supplemental Data | | | | | | |
| Net assets, end of period (in millions) | $5,176 | $5,662 | $6,612 | $6,198 | $6,009 | $5,939 |
| Portfolio turnover rateK | 52%J,L | 132%L | 44%L | 45% | 36% | 106% |
A Calculated based on average shares outstanding during the period.
B Net investment income per share reflects a large, non-recurring dividend which amounted to $.13 per share. Excluding this non-recurring dividend, the ratio of net investment income (loss) to average net assets would have been 1.65%.
C The amounts shown reflect certain reclassifications related to book to tax differences that were made in the year shown.
D Total distributions of $3.02 per share is comprised of distributions from net investment income of $.389 and distributions from net realized gain of $2.628 per share.
E Total distributions of $1.00 per share is comprised of distributions from net investment income of $.337 and distributions from net realized gain of $.666 per share.
F Total returns for periods of less than one year are not annualized.
G Total returns would have been lower if certain expenses had not been reduced during the applicable periods shown.
H Fees and expenses of any underlying Fidelity Central Funds are not included in the Fund's expense ratio. The Fund indirectly bears its proportionate share of the expenses of any underlying Fidelity Central Funds. Based on their most recent shareholder report date, the expenses of any underlying non-money market Fidelity Central Funds were less than .005%.
I Expense ratios reflect operating expenses of the class. Expenses before reductions do not reflect amounts reimbursed by the investment adviser or reductions from brokerage service arrangements or reductions from other expense offset arrangements and do not represent the amount paid by the class during periods when reimbursements or reductions occur. Expenses net of fee waivers reflect expenses after reimbursement by the investment adviser but prior to reductions from brokerage service arrangements or other expense offset arrangements. Expenses net of all reductions represent the net expenses paid by the class.
J Annualized
K Amount does not include the portfolio activity of any underlying Fidelity Central Funds.
L Portfolio turnover rate excludes securities received or delivered in-kind.
See accompanying notes which are an integral part of the financial statements.
Notes to Financial Statements (Unaudited)
For the period ended February 29, 2020
(Amounts in thousands except percentages)
1. Organization.
Fidelity Puritan Fund (the Fund) is a fund of Fidelity Puritan Trust (the Trust) and is authorized to issue an unlimited number of shares. The Trust is registered under the Investment Company Act of 1940, as amended (the 1940 Act), as an open-end management investment company organized as a Massachusetts business trust. The Fund offers Puritan and Class K shares, each of which has equal rights as to assets and voting privileges. Each class has exclusive voting rights with respect to matters that affect that class.
Effective January 1, 2020:
Investment advisers Fidelity Investments Money Management, Inc., FMR Co., Inc., and Fidelity SelectCo, LLC, merged with and into Fidelity Management & Research Company. In connection with the merger transactions, the resulting merged investment adviser was then redomiciled from Massachusetts to Delaware, changed its corporate structure from a corporation to a limited liability company, and changed its name to "Fidelity Management & Research Company LLC".
Fidelity Investments Institutional Operations Company, Inc. converted from a Massachusetts corporation to a Massachusetts LLC, and changed its name to "Fidelity Investments Institutional Operations Company LLC".
2. Investments in Fidelity Central Funds.
The Fund invests in Fidelity Central Funds, which are open-end investment companies generally available only to other investment companies and accounts managed by the investment adviser and its affiliates. The Fund's Schedule of Investments lists each of the Fidelity Central Funds held as of period end, if any, as an investment of the Fund, but does not include the underlying holdings of each Fidelity Central Fund. As an Investing Fund, the Fund indirectly bears its proportionate share of the expenses of the underlying Fidelity Central Funds.
Based on its investment objective, each Fidelity Central Fund may invest or participate in various investment vehicles or strategies that are similar to those of the Fund. These strategies are consistent with the investment objectives of the Fund and may involve certain economic risks which may cause a decline in value of each of the Fidelity Central Funds and thus a decline in the value of the Fund. The Money Market Central Funds seek preservation of capital and current income and are managed by the investment adviser. Annualized expenses of the Money Market Central Funds as of their most recent shareholder report date ranged from less than .005% to .01%. The following summarizes the Fund's investment in each non-money market Fidelity Central Fund.
| Fidelity Central Fund | Investment Manager | Investment Objective | Investment Practices | Expense Ratio(a) |
| Fidelity High Income Central Fund | FMR | Seeks a high level of income and may also seek capital appreciation by investing primarily in debt securities, preferred stocks, and convertible securities, with an emphasis on lower-quality debt securities. | Delayed Delivery & When Issued Securities
Loans & Direct Debt Instruments
Restricted Securities
| Less than .005% |
| Fidelity Investment Grade Bond Central Fund | FMR | Seeks a high level of income by normally investing in investment–grade debt securities. | Delayed Delivery & When Issued Securities
Restricted Securities
Swaps | Less than .005% |
(a) Expenses expressed as a percentage of average net assets and are as of each underlying Central Fund's most recent annual or semi-annual shareholder report.
An unaudited holdings listing for the Fund, which presents direct holdings as well as the pro-rata share of any securities and other investments held indirectly through its investment in underlying non-money market Fidelity Central Funds, is available at fidelity.com. A complete unaudited list of holdings for each Fidelity Central Fund is available upon request or at the Securities and Exchange Commission (the SEC) website at www.sec.gov. In addition, the financial statements of the Fidelity Central Funds which contain the significant accounting policies (including investment valuation policies) of those funds, which are not covered by the Fund's Report of Independent Registered Public Accounting Firm, are available on the SEC website or upon request.
3. Significant Accounting Policies.
The Fund is an investment company and applies the accounting and reporting guidance of the Financial Accounting Standards Board (FASB) Accounting Standards Codification Topic 946 Financial Services – Investments Companies. The financial statements have been prepared in conformity with accounting principles generally accepted in the United States of America (GAAP), which require management to make certain estimates and assumptions at the date of the financial statements. Actual results could differ from those estimates. Subsequent events, if any, through the date that the financial statements were issued have been evaluated in the preparation of the financial statements. The following summarizes the significant accounting policies of the Fund:
Investment Valuation. Investments are valued as of 4:00 p.m. Eastern time on the last calendar day of the period. The Board of Trustees (the Board) has delegated the day to day responsibility for the valuation of the Fund's investments to the Fair Value Committee (the Committee) established by the Fund's investment adviser. In accordance with valuation policies and procedures approved by the Board, the Fund attempts to obtain prices from one or more third party pricing vendors or brokers to value its investments. When current market prices, quotations or currency exchange rates are not readily available or reliable, investments will be fair valued in good faith by the Committee, in accordance with procedures adopted by the Board. Factors used in determining fair value vary by investment type and may include market or investment specific events. The frequency with which these procedures are used cannot be predicted and they may be utilized to a significant extent. The Committee oversees the Fund's valuation policies and procedures and reports to the Board on the Committee's activities and fair value determinations. The Board monitors the appropriateness of the procedures used in valuing the Fund's investments and ratifies the fair value determinations of the Committee.
The Fund categorizes the inputs to valuation techniques used to value its investments into a disclosure hierarchy consisting of three levels as shown below:
- Level 1 – quoted prices in active markets for identical investments
- Level 2 – other significant observable inputs (including quoted prices for similar investments, interest rates, prepayment speeds, etc.)
- Level 3 – unobservable inputs (including the Fund's own assumptions based on the best information available)
Valuation techniques used to value the Fund's investments by major category are as follows:
Equity securities, including restricted securities, for which market quotations are readily available, are valued at the last reported sale price or official closing price as reported by a third party pricing vendor on the primary market or exchange on which they are traded and are categorized as Level 1 in the hierarchy. In the event there were no sales during the day or closing prices are not available, securities are valued at the last quoted bid price or may be valued using the last available price and are generally categorized as Level 2 in the hierarchy. For foreign equity securities, when market or security specific events arise, comparisons to the valuation of American Depositary Receipts (ADRs), futures contracts, Exchange-Traded Funds (ETFs) and certain indexes as well as quoted prices for similar securities may be used and would be categorized as Level 2 in the hierarchy. For equity securities, including restricted securities, where observable inputs are limited, assumptions about market activity and risk are used and these securities may be categorized as Level 3 in the hierarchy. Securities, including private placements or other restricted securities, for which observable inputs are not available are valued using alternate valuation approaches, including the market approach, the income approach and cost approach are categorized as Level 3 in the hierarchy. The market approach considers factors including the price of recent investments in the same or a similar security or financial metrics of comparable securities. The income approach considers factors including expected future cash flows, security specific risks and corresponding discount rates. The cost approach considers factors including the value of the security's underlying assets and liabilities.
Investments in open-end mutual funds, including the Fidelity Central Funds, are valued at their closing net asset value (NAV) each business day and are categorized as Level 1 in the hierarchy.
The following provides information on Level 3 securities held by the Fund that were valued at period end based on unobservable inputs. These amounts exclude valuations provided by a broker.
| Asset Type | Fair Value | Valuation Technique(s) | Unobservable Input | Amount or Range/Weighted Average | Impact to Valuation from an Increase in Input(a) |
| Equities | $ 428,670 | Market comparable | Enterprise value/Sales multiple (EV/S) | 1.5 - 8.7 / 3.6 | Increase |
| | | | Transaction price | $5.59 - $60.06 / $54.30 | Increase |
| | | | Discount rate | 6.0% - 21.0% / 16.9% | Decrease |
| | | | Liquidity preference | $19.60 - $45.76 / $27.72 | Increase |
| | | | Premium rate | 13.6% - 75.7% / 46.5% | Increase |
| | | | Discount for lack of marketability | 10.0% - 20.0% / 11.8% | Decrease |
| | | Market approach | Transaction price | $0.00 - $575.31 / $270.12 | Increase |
| | | | Tender price | $2.80 - $55.60 / $33.32 | Increase |
| | | Recovery value | Recovery value | 0.0% | Increase |
(a) Represents the directional change in the fair value of the Level 3 investments that could have resulted from an increase in the corresponding input as of period end. A decrease to the unobservable input would have had the opposite effect. Significant changes in these inputs may have resulted in a significantly higher or lower fair value measurement at period end.
Changes in valuation techniques may result in transfers in or out of an assigned level within the disclosure hierarchy. The aggregate value of investments by input level as of February 29, 2020, as well as a roll forward of Level 3 investments, is included at the end of the Fund's Schedule of Investments.
Foreign Currency. The Fund may use foreign currency contracts to facilitate transactions in foreign-denominated securities. Gains and losses from these transactions may arise from changes in the value of the foreign currency or if the counterparties do not perform under the contracts' terms.
Foreign-denominated assets, including investment securities, and liabilities are translated into U.S. dollars at the exchange rates at period end. Purchases and sales of investment securities, income and dividends received and expenses denominated in foreign currencies are translated into U.S. dollars at the exchange rate in effect on the transaction date.
The effects of exchange rate fluctuations on investments are included with the net realized and unrealized gain (loss) on investment securities. Other foreign currency transactions resulting in realized and unrealized gain (loss) are disclosed separately.
Investment Transactions and Income. For financial reporting purposes, the Fund's investment holdings and NAV include trades executed through the end of the last business day of the period. The NAV per share for processing shareholder transactions is calculated as of the close of business of the New York Stock Exchange (NYSE), normally 4:00 p.m. Eastern time and includes trades executed through the end of the prior business day. Gains and losses on securities sold are determined on the basis of identified cost and include proceeds received from litigation. Dividend income is recorded on the ex-dividend date, except for certain dividends from foreign securities where the ex-dividend date may have passed, which are recorded as soon as the Fund is informed of the ex-dividend date. Non-cash dividends included in dividend income, if any, are recorded at the fair market value of the securities received. Income and capital gain distributions from Fidelity Central Funds, if any, are recorded on the ex-dividend date. Certain distributions received by the Fund represent a return of capital or capital gain. The Fund determines the components of these distributions subsequent to the ex-dividend date, based upon receipt of tax filings or other correspondence relating to the underlying investment. These distributions are recorded as a reduction of cost of investments and/or as a realized gain. Interest income is accrued as earned and includes coupon interest and amortization of premium and accretion of discount on debt securities as applicable. Investment income is recorded net of foreign taxes withheld where recovery of such taxes is uncertain.
Class Allocations and Expenses. Investment income, realized and unrealized capital gains and losses, common expenses of the Fund, and certain fund-level expense reductions, if any, are allocated daily on a pro-rata basis to each class based on the relative net assets of each class to the total net assets of the Fund. Each class differs with respect to transfer agent fees incurred. Certain expense reductions may also differ by class. For the reporting period, the allocated portion of income and expenses to each class as a percent of its average net assets may vary due to the timing of recording these transactions in relation to fluctuating net assets of the classes. Expenses directly attributable to a fund are charged to that fund. Expenses attributable to more than one fund are allocated among the respective funds on the basis of relative net assets or other appropriate methods. Expense estimates are accrued in the period to which they relate and adjustments are made when actual amounts are known.
Deferred Trustee Compensation. Under a Deferred Compensation Plan (the Plan) for the Fund, certain independent Trustees have elected to defer receipt of a portion of their annual compensation. Deferred amounts are invested in a cross-section of Fidelity funds, are marked-to-market and remain in the Fund until distributed in accordance with the Plan. The investment of deferred amounts and the offsetting payable to the Trustees of $1,376 are included in the accompanying Statement of Assets and Liabilities in other receivables and other payables and accrued expenses, respectively.
Income Tax Information and Distributions to Shareholders. Each year, the Fund intends to qualify as a regulated investment company under Subchapter M of the Internal Revenue Code, including distributing substantially all of its taxable income and realized gains. As a result, no provision for U.S. Federal income taxes is required. The Fund files a U.S. federal tax return, in addition to state and local tax returns as required. The Fund's federal income tax returns are subject to examination by the Internal Revenue Service (IRS) for a period of three fiscal years after they are filed. State and local tax returns may be subject to examination for an additional fiscal year depending on the jurisdiction. Foreign taxes are provided for based on the Fund's understanding of the tax rules and rates that exist in the foreign markets in which it invests. The Fund is subject to a tax imposed on capital gains by certain countries in which it invests. An estimated deferred tax liability for net unrealized appreciation on the applicable securities is included in Other payables and accrued expenses on the Statement of Assets & Liabilities.
Distributions are declared and recorded on the ex-dividend date. Income and capital gain distributions are declared separately for each class. Income and capital gain distributions are determined in accordance with income tax regulations, which may differ from GAAP.
Capital accounts within the financial statements are adjusted for permanent book-tax differences. These adjustments have no impact on net assets or the results of operations. Capital accounts are not adjusted for temporary book-tax differences which will reverse in a subsequent period.
Book-tax differences are primarily due to the short-term gain distributions from the Underlying Funds, futures contracts, foreign currency transactions, certain foreign taxes, passive foreign investment companies (PFIC), market discount, contingent interest, deferred trustees compensation, redemptions in kind, partnerships (including allocations from Fidelity Central Funds), equity-debt classifications, losses deferred due to wash sales and excise tax regulations.
As of period end, the cost and unrealized appreciation (depreciation) in securities, and derivatives if applicable, for federal income tax purposes were as follows:
| Gross unrealized appreciation | $5,534,183 |
| Gross unrealized depreciation | (543,721) |
| Net unrealized appreciation (depreciation) | $4,990,462 |
| Tax cost | $20,975,297 |
The Fund elected to defer to its next fiscal year approximately $75,000 of capital losses recognized during the period November 1, 2018 to August 31, 2019.
Restricted Securities (including Private Placements). The Fund may invest in securities that are subject to legal or contractual restrictions on resale. These securities generally may be resold in transactions exempt from registration or to the public if the securities are registered. Disposal of these securities may involve time-consuming negotiations and expense, and prompt sale at an acceptable price may be difficult. Information regarding restricted securities is included at the end of the Fund's Schedule of Investments.
Consolidated Subsidiary. The Fund invests in certain investments through a wholly-owned subsidiary ("Subsidiary"), which may be subject to federal and state taxes upon disposition.
As of period end, the Fund held an investment of $174,718 in these Subsidiaries, representing .67% of the Fund's net assets. The financial statements have been consolidated and include accounts of the Fund and each Subsidiary. Accordingly, all inter-company transactions and balances have been eliminated.
Any cash held by the Subsidiaries is restricted as to its use and is presented as Restricted cash in the Statement of Assets and Liabilities.
4. Derivative Instruments.
Risk Exposures and the Use of Derivative Instruments. The Fund's investment objective allows the Fund to enter into various types of derivative contracts, including futures contracts. Derivatives are investments whose value is primarily derived from underlying assets, indices or reference rates and may be transacted on an exchange or over-the-counter (OTC). Derivatives may involve a future commitment to buy or sell a specified asset based on specified terms, to exchange future cash flows at periodic intervals based on a notional principal amount, or for one party to make one or more payments upon the occurrence of specified events in exchange for periodic payments from the other party.
The Fund used derivatives to increase returns and to manage exposure to certain risks as defined below. The success of any strategy involving derivatives depends on analysis of numerous economic factors, and if the strategies for investment do not work as intended, the Fund may not achieve its objectives.
The Fund's use of derivatives increased or decreased its exposure to the following risk:
| Equity Risk | Equity risk relates to the fluctuations in the value of financial instruments as a result of changes in market prices (other than those arising from interest rate risk or foreign exchange risk), whether caused by factors specific to an individual investment, its issuer, or all factors affecting all instruments traded in a market or market segment.
|
The Fund is also exposed to additional risks from investing in derivatives, such as liquidity risk and counterparty credit risk. Liquidity risk is the risk that the Fund will be unable to close out the derivative in the open market in a timely manner. Counterparty credit risk is the risk that the counterparty will not be able to fulfill its obligation to the Fund. Counterparty credit risk related to exchange-traded futures contracts may be mitigated by the protection provided by the exchange on which they trade.
Investing in derivatives may involve greater risks than investing in the underlying assets directly and, to varying degrees, may involve risk of loss in excess of any initial investment and collateral received and amounts recognized in the Statement of Assets and Liabilities. In addition, there may be the risk that the change in value of the derivative contract does not correspond to the change in value of the underlying instrument.
Futures Contracts. A futures contract is an agreement between two parties to buy or sell a specified underlying instrument for a fixed price at a specified future date. The Fund used futures contracts to manage its exposure to the stock market.
Upon entering into a futures contract, a fund is required to deposit either cash or securities (initial margin) with a clearing broker in an amount equal to a certain percentage of the face value of the contract. Futures contracts are marked-to-market daily and subsequent daily payments (variation margin) are made or received by a fund depending on the daily fluctuations in the value of the futures contracts and are recorded as unrealized appreciation or (depreciation). This receivable and/or payable, if any, is included in daily variation margin on futures contracts in the Statement of Assets and Liabilities. Realized gain or (loss) is recorded upon the expiration or closing of a futures contract. The net realized gain (loss) and change in net unrealized appreciation (depreciation) on futures contracts during the period is presented in the Statement of Operations.
Any open futures contracts at period end are presented in the Schedule of Investments under the caption "Futures Contracts". The notional amount at value reflects each contract's exposure to the underlying instrument or index at period end.
5. Purchases and Sales of Investments.
Purchases and sales of securities, other than short-term securities and certain in-kind transactions are noted in the table below.
| | Purchases ($) | Sales ($) |
| Fidelity Puritan Fund | 7,027,263 | 8,343,694 |
Unaffiliated Redemptions In-Kind. During the period, 8,081 shares of the Fund were redeemed in-kind for investments and cash with a value of $178,479. The net realized gain of $56,411 on investments delivered through in-kind redemptions is included in the accompanying Statement of Operations. The amount of the in-kind redemptions is included in share transactions in the accompanying Statement of Changes in Net Assets as well as the Notes to Financial Statements. The Fund recognized no gain or loss for federal income tax purposes.
6. Fees and Other Transactions with Affiliates.
Management Fee. Fidelity Management & Research Company LLC (the investment adviser) and its affiliates provide the Fund with investment management related services for which the Fund pays a monthly management fee. The management fee is the sum of an individual fund fee rate that is based on an annual rate of .15% of the Fund's average net assets and an annualized group fee rate that averaged .23% during the period. The group fee rate is based upon the monthly average net assets of a group of registered investment companies with which the investment adviser has management contracts. The group fee rate decreases as assets under management increase and increases as assets under management decrease. For the reporting period, the total annualized management fee rate was .38% of the Fund's average net assets.
Transfer Agent Fees. Fidelity Investments Institutional Operations Company LLC (FIIOC), an affiliate of the investment adviser, is the transfer, dividend disbursing and shareholder servicing agent for each class of the Fund. FIIOC receives account fees and asset-based fees that vary according to the account size and type of account of the shareholders of Puritan, except for Class K. FIIOC receives an asset-based fee of Class K's average net assets. FIIOC pays for typesetting, printing and mailing of shareholder reports, except proxy statements. Effective February 1, 2020, the Board approved to change the fee for Class K from .046% to .044%.
For the period, transfer agent fees for each class were as follows:
| | Amount | % of Class-Level Average Net Assets(a) |
| Puritan | $13,464 | .12 |
| Class K | 1,224 | .04 |
| | $14,688 | |
(a) Annualized
Accounting Fees. Fidelity Service Company, Inc. (FSC), an affiliate of the investment adviser, maintains the Fund's accounting records. The accounting fee is based on the level of average net assets for each month. For the period, the fees were equivalent to the following annualized rates:
| | % of Average Net Assets |
| Fidelity Puritan Fund | .01 |
Brokerage Commissions. A portion of portfolio transactions were placed with brokerage firms which are affiliates of the investment adviser. Brokerage commissions are included in net realized gain (loss) and change in net unrealized appreciation (depreciation) in the Statement of Operations. The commissions paid to these affiliated firms were as follows:
| | Amount |
| Fidelity Puritan Fund | $119 |
Interfund Lending Program. Pursuant to an Exemptive Order issued by the SEC, the fund, along with other registered investment companies having management contracts with Fidelity Management & Research Company LLC (FMR), or other affiliated entities of FMR, may participate in an interfund lending program. This program provides an alternative credit facility allowing the fund to borrow from, or lend money to, other participating affiliated funds. At period end, there were no interfund loans outstanding. Activity in this program during the period for which loans were outstanding was as follows:
| | Borrower or Lender | Average Loan Balance | Weighted Average Interest Rate | Interest Expense |
| Fidelity Puritan Fund | Borrower | $47,086 | 1.82% | $10 |
Interfund Trades. Funds may purchase from or sell securities to other Fidelity Funds under procedures adopted by the Board. The procedures have been designed to ensure these interfund trades are executed in accordance with Rule 17a-7 of the 1940 Act. Interfund trades are included within the respective purchases and sales amounts shown in the Purchases and Sales of Investments note.
Affiliated Exchanges In-Kind. During the period, the Fund completed exchanges in-kind with Fidelity High Income Central Fund. The Fund delivered investments valued at $2,795 to Fidelity High Income Central Fund in exchange for 25 shares. The net realized gain of $276 on investments delivered through in-kind redemptions is include in the accompanying Statement of Operations. The Fund recognized gains for federal income tax purposes.
Prior Fiscal Year Affiliated Exchanges In-Kind. During the prior period, the Fund completed exchanges in-kind with Fidelity Investment Grade Bond Central Fund and Fidelity High Income Central Fund (formerly Fidelity High Income Central Fund 2). The Fund delivered investments, including accrued interest, and cash with a value of $7,608,088 and $1,384,938 to Fidelity Investment Grade Bond Central Fund and Fidelity High Income Central Fund in exchange for 70,309 and 12,414 shares, respectively. The Fund recognized a net realized gain of $157,088 on investments delivered through in-kind redemptions. The Fund recognized gains for federal income tax purposes.
In addition, the Fund redeemed 18,856 shares of Fidelity Mortgage Backed Securities Central Fund in exchange for investments and cash, including accrued interest, with a value of $2,023,773. The Fund recognized a net realized gain of $48,383 on the Fund's redemptions of Fidelity Mortgage Backed Securities Central Fund. The Fund recognized gains on the exchange for federal income tax purposes.
Prior Fiscal Year Affiliated Redemptions In-Kind. During the prior period, 3,722 shares of the Fund were redeemed in-kind for investments and cash with a value of $81,770. The Fund had a net realized gain of $23,826 on investments delivered through in-kind redemptions. The amount of the in-kind redemptions is included in share transactions in the accompanying Statement of Changes in Net Assets as well as the Notes to Financial Statements. The Fund recognized no gain or loss for federal income tax purposes.
Other. During the period, the investment advisor reimbursed the Fund for certain losses in the amount of $178.
7. Committed Line of Credit.
Certain Funds participate with other funds managed by the investment adviser or an affiliate in a $4.25 billion credit facility (the "line of credit") to be utilized for temporary or emergency purposes to fund shareholder redemptions or for other short-term liquidity purposes. The participating funds have agreed to pay commitment fees on their pro-rata portion of the line of credit, which are reflected in Miscellaneous expenses on the Statement of Operations, and are as follows:
| | Amount |
| Fidelity Puritan Fund | $32 |
During the period, there were no borrowings on this line of credit.
8. Security Lending.
The Fund lends portfolio securities from time to time in order to earn additional income. For equity securities, lending agents are used, including National Financial Services (NFS), an affiliate of the Fund. Pursuant to a securities lending agreement, NFS will receive a fee, which is capped at 9.9% of daily lending revenue, for its services as lending agent. The Fund may lend securities to certain qualified borrowers, including NFS. On the settlement date of the loan, the Fund receives collateral (in the form of U.S. Treasury obligations, letters of credit and/or cash) against the loaned securities and maintains collateral in an amount not less than 100% of the market value of the loaned securities during the period of the loan. The market value of the loaned securities is determined at the close of business of the Fund and any additional required collateral is delivered to the Fund on the next business day. The Fund or borrower may terminate the loan at any time, and if the borrower defaults on its obligation to return the securities loaned because of insolvency or other reasons, the Fund may apply collateral received from the borrower against the obligation. The Fund may experience delays and costs in recovering the securities loaned. Any cash collateral received is invested in the Fidelity Securities Lending Cash Central Fund. The value of loaned securities and cash collateral at period end are disclosed on the Fund's Statement of Assets and Liabilities. The value of securities loaned to NFS, as affiliated borrower, at period end was $7,783. Total fees paid by the Fund to NFS, as lending agent, amounted to $36. Security lending income represents the income earned on investing cash collateral, less rebates paid to borrowers and any lending agent fees associated with the loan, plus any premium payments received for lending certain types of securities. Security lending income is presented in the Statement of Operations as a component of income from Fidelity Central Funds and includes $2 from securities loaned to NFS, as affiliated borrower.
9. Expense Reductions.
Commissions paid to certain brokers with whom the investment adviser, or its affiliates, places trades on behalf of the Fund include an amount in addition to trade execution, which may be rebated back to the Fund to offset certain expenses. This amount totaled $476 for the period. In addition, through arrangements with the Fund's custodian and each class' transfer agent, credits realized as a result of certain uninvested cash balances were used to reduce the Fund's expenses. During the period, custodian credits reduced the Fund's expenses by $13. During the period, transfer agent credits reduced each class' expenses as noted in the table below.
| | Expense reduction |
| Puritan | $13 |
In addition, during the period the investment adviser or an affiliate reimbursed and/or waived a portion of fund-level operating expenses in the amount of $55.
10. Distributions to Shareholders.
Distributions to shareholders of each class were as follows:
| | Six months ended
February 29, 2020 | Year ended
August 31, 2019 |
| Distributions to shareholders | | |
| Puritan | $763,644 | $2,813,985 |
| Class K | 201,261 | 807,532 |
| Total | $964,905 | $3,621,517 |
11. Share Transactions.
Share transactions for each class were as follows and may contain automatic conversions between classes or exchanges between affiliated funds:
| | Shares | Shares | Dollars | Dollars |
| | Six months ended February 29, 2020 | Year ended August 31, 2019 | Six months ended February 29, 2020 | Year ended August 31, 2019 |
| Puritan | | | | |
| Shares sold | 30,946 | 89,485 | $700,909 | $1,968,246 |
| Reinvestment of distributions | 33,044 | 124,730 | 722,480 | 2,667,252 |
| Shares redeemed | (77,189) | (163,199) | (1,737,904) | (3,514,587) |
| Net increase (decrease) | (13,199) | 51,016 | $(314,515) | $1,120,911 |
| Class K | | | | |
| Shares sold | 13,460 | 32,207 | $304,234 | $703,067 |
| Reinvestment of distributions | 9,213 | 37,792 | 201,245 | 807,484 |
| Shares redeemed | (42,945)(a) | (77,948)(b) | (962,928)(a) | (1,678,446)(b) |
| Net increase (decrease) | (20,272) | (7,949) | $(457,449) | $(167,895) |
(a) Amount includes in-kind redemptions (see the Unaffiliated Redemptions In-Kind note for additional details).
(b) Amount includes in-kind redemptions (see the Prior Fiscal Period Affiliated Redemptions In-Kind note for additional details).
12. Other.
The Fund's organizational documents provide former and current trustees and officers with a limited indemnification against liabilities arising in connection with the performance of their duties to the Fund. In the normal course of business, the Fund may also enter into contracts that provide general indemnifications. The Fund's maximum exposure under these arrangements is unknown as this would be dependent on future claims that may be made against the Fund. The risk of material loss from such claims is considered remote.
13. Coronavirus (COVID-19) Pandemic.
An outbreak of COVID-19 first detected in China during December 2019 has since spread globally and was declared a pandemic by the World Health Organization during March 2020. Developments that disrupt global economies and financial markets, such as the COVID-19 pandemic, may magnify factors that affect the Fund's performance.
Shareholder Expense Example
As a shareholder of the Fund, you incur two types of costs: (1) transaction costs and (2) ongoing costs, including management fees and other Fund expenses. This Example is intended to help you understand your ongoing costs (in dollars) of investing in the Fund and to compare these costs with the ongoing costs of investing in other mutual funds.
The Example is based on an investment of $1,000 invested at the beginning of the period and held for the entire period (September 1, 2019 to February 29, 2020).
Actual Expenses
The first line of the accompanying table for each class of the Fund provides information about actual account values and actual expenses. You may use the information in this line, together with the amount you invested, to estimate the expenses that you paid over the period. Simply divide your account value by $1,000.00 (for example, an $8,600 account value divided by $1,000.00 = 8.6), then multiply the result by the number in the first line for a class of the Fund under the heading entitled "Expenses Paid During Period" to estimate the expenses you paid on your account during this period. In addition, the Fund, as a shareholder in the underlying Fidelity Central Funds, will indirectly bear its pro-rata share of the fees and expenses incurred by the underlying Fidelity Central Funds. These fees and expenses are not included in the Fund's annualized expense ratio used to calculate the expense estimate in the table below.
Hypothetical Example for Comparison Purposes
The second line of the accompanying table for each class of the Fund provides information about hypothetical account values and hypothetical expenses based on a Class' actual expense ratio and an assumed rate of return of 5% per year before expenses, which is not the Class' actual return. The hypothetical account values and expenses may not be used to estimate the actual ending account balance or expenses you paid for the period. You may use this information to compare the ongoing costs of investing in the Fund and other funds. To do so, compare this 5% hypothetical example with the 5% hypothetical examples that appear in the shareholder reports of the other funds. In addition, the Fund, as a shareholder in the underlying Fidelity Central Funds, will indirectly bear its pro-rata share of the fees and expenses incurred by the underlying Fidelity Central Funds. These fees and expenses are not included in the Fund's annualized expense ratio used to calculate the expense estimate in the table below.
Please note that the expenses shown in the table are meant to highlight your ongoing costs only and do not reflect any transaction costs. Therefore, the second line of the table is useful in comparing ongoing costs only, and will not help you determine the relative total costs of owning different funds.
| | Annualized Expense Ratio-A | Beginning
Account Value
September 1, 2019 | Ending
Account Value
February 29, 2020 | Expenses Paid
During Period-B
September 1, 2019
to February 29, 2020 |
| Puritan | .52% | | | |
| Actual | | $1,000.00 | $1,029.40 | $2.62 |
| Hypothetical-C | | $1,000.00 | $1,022.28 | $2.61 |
| Class K | .44% | | | |
| Actual | | $1,000.00 | $1,030.40 | $2.22 |
| Hypothetical-C | | $1,000.00 | $1,022.68 | $2.21 |
A Annualized expense ratio reflects expenses net of applicable fee waivers.
B Expenses are equal to each Class' annualized expense ratio, multiplied by the average account value over the period, multiplied by 182/366 (to reflect the one-half year period). The fees and expenses of the underlying Fidelity Central Funds in which the Fund invests are not included in each Class' annualized expense ratio. In addition to the expenses noted above, the Fund also indirectly bears its proportional share of the expenses of the underlying Fidelity Central Funds. Annualized expenses of the underlying non-money market Fidelity Central Funds as of their most recent fiscal half year were less than .005%.
C 5% return per year before expenses
Board Approval of Investment Advisory Contracts and Management Fees
Fidelity Puritan Fund
Each year, the Board of Trustees, including the Independent Trustees (together, the Board), votes on the renewal of the management contract with Fidelity Management & Research Company LLC (FMR) and the sub-advisory agreements (together, the Advisory Contracts) for the fund. FMR and the sub-advisers are referred to herein as the Investment Advisers. The Board, assisted by the advice of fund counsel and Independent Trustees' counsel, requests and considers a broad range of information relevant to the renewal of the Advisory Contracts throughout the year.
Approval of Amended and Restated Advisory Contracts. At its November 2019 meeting, the Board unanimously determined to approve an amended and restated management contract and sub-advisory agreements (Amended and Restated Contracts) for a stub period of January 1, 2020 through January 31, 2020 in connection with a consolidation of certain of Fidelity's advisory businesses. The Board considered that, on or about January 1, 2020, FMR Co., Inc. (FMRC) and Fidelity Investments Money Management, Inc. (FIMM) expected to merge with and into FMR and, after the merger, FMR expected to redomicile as a Delaware limited liability company. The Board also approved the termination of the sub-advisory agreements with FMRC and FIMM upon the completion of the merger. The Board noted that references to FMR in the Amended and Restated Contracts would be updated to reflect FMR's new form of organization and domicile and considered that the definition of "group assets" for purposes of the fund's group fee would be modified to avoid double-counting assets once the reorganization is complete. The Board also noted Fidelity's assurance that neither the planned consolidation nor the Amended and Restated Contracts will change the investment processes, the level or nature of services provided, the resources and personnel allocated, trading and compliance operations, or any fees paid by the fund.
The Board meets regularly and, at each of its meetings, covers an extensive agenda of topics and materials and considers factors that are relevant to its annual consideration of the renewal of the fund's Advisory Contracts, including the services and support provided to the fund and its shareholders. The Board has established various standing committees (Committees), each composed of and chaired by Independent Trustees with varying backgrounds, to which the Board has assigned specific subject matter responsibilities in order to enhance effective decision-making by the Board. The Board, acting directly and through its Committees, requests and receives information concerning the annual consideration of the renewal of the fund's Advisory Contracts. The Board also meets as needed to review matters specifically related to the Board's annual consideration of the renewal of the Advisory Contracts. Members of the Board may also meet with trustees of other Fidelity funds through joint ad hoc committees to discuss certain matters relevant to all of the Fidelity funds.
At its January 2020 meeting, the Board unanimously determined to renew the fund's Advisory Contracts. In reaching its determination, the Board considered all factors it believed relevant, including (i) the nature, extent, and quality of the services provided to the fund and its shareholders (including the investment performance of the fund); (ii) the competitiveness of the fund's management fee and total expense ratio relative to peer funds; (iii) the total costs of the services provided by and the profits realized by Fidelity from its relationships with the fund; and (iv) the extent to which, if any, economies of scale exist and are realized as the fund grows, and whether any economies of scale are appropriately shared with fund shareholders.
In considering whether to renew the Advisory Contracts for the fund, the Board reached a determination, with the assistance of fund counsel and Independent Trustees' counsel and through the exercise of its business judgment, that the renewal of the Advisory Contracts was in the best interests of the fund and its shareholders and that the compensation payable under the Advisory Contracts was fair and reasonable. The Board's decision to renew the Advisory Contracts was not based on any single factor, but rather was based on a comprehensive consideration of all the information provided to the Board at its meetings throughout the year. The Board, in reaching its determination to renew the Advisory Contracts, was aware that shareholders of the fund have a broad range of investment choices available to them, including a wide choice among funds offered by Fidelity's competitors, and that the fund's shareholders, who have the opportunity to review and weigh the disclosure provided by the fund in its prospectus and other public disclosures, have chosen to invest in this fund, which is part of the Fidelity family of funds.
Nature, Extent, and Quality of Services Provided. The Board considered Fidelity's staffing as it relates to the fund, including the backgrounds of investment personnel of Fidelity, and also considered the fund's investment objective, strategies, and related investment philosophy. The Independent Trustees also had discussions with senior management of Fidelity's investment operations and investment groups. The Board considered the structure of the investment personnel compensation program and whether this structure provides appropriate incentives to act in the best interests of the fund. Additionally, the Board considered the portfolio managers' investments, if any, in the funds that they manage.
Resources Dedicated to Investment Management and Support Services. The Board and the Fund Oversight and Research Committees reviewed the general qualifications and capabilities of Fidelity's investment staff, including its size, education, experience, and resources, as well as Fidelity's approach to recruiting, training, managing, and compensating investment personnel. The Board noted that Fidelity has continued to increase the resources devoted to non-U.S. offices, including expansion of Fidelity's global investment organization. The Board also noted that Fidelity's analysts have extensive resources, tools and capabilities that allow them to conduct sophisticated quantitative and fundamental analysis, as well as credit analysis of issuers, counterparties and guarantors. Further, the Board considered that Fidelity's investment professionals have sufficient access to global information and data so as to provide competitive investment results over time, and that those professionals also have access to sophisticated tools that permit them to assess portfolio construction and risk and performance attribution characteristics continuously, as well as to transmit new information and research conclusions rapidly around the world. Additionally, in its deliberations, the Board considered Fidelity's trading, risk management, compliance, and technology and operations capabilities and resources, which are integral parts of the investment management process.
Shareholder and Administrative Services. The Board considered (i) the nature, extent, quality, and cost of advisory, administrative, and shareholder services performed by the Investment Advisers and their affiliates under the Advisory Contracts and under separate agreements covering transfer agency, pricing and bookkeeping, and securities lending services for the fund; (ii) the nature and extent of the supervision of third party service providers, principally custodians, subcustodians, and pricing vendors; and (iii) the resources devoted to, and the record of compliance with, the fund's compliance policies and procedures. The Board also reviewed the allocation of fund brokerage, including allocations to brokers affiliated with the Investment Advisers, the use of brokerage commissions to pay fund expenses, and the use of "soft" commission dollars to pay for research services.
The Board noted that the growth of fund assets over time across the complex allows Fidelity to reinvest in the development of services designed to enhance the value and convenience of the Fidelity funds as investment vehicles. These services include 24-hour access to account information and market information over the Internet and through telephone representatives, investor education materials and asset allocation tools, and the expanded availability of Fidelity Investor Centers.
The Board noted that it and the boards of certain other Fidelity funds had formed an ad hoc Committee on Transfer Agency Fees to review the variety of transfer agency fee structures throughout the industry and Fidelity's competitive positioning with respect to industry participants.
Investment in a Large Fund Family. The Board considered the benefits to shareholders of investing in a Fidelity fund, including the benefits of investing in a fund that is part of a large family of funds offering a variety of investment disciplines and providing a large variety of mutual fund investor services. The Board noted that Fidelity had taken, or had made recommendations that resulted in the Fidelity funds taking, a number of actions over the previous year that benefited particular funds, including: (i) continuing to dedicate additional resources to Fidelity's investment research process, which includes meetings with management of issuers of securities in which the funds invest, and to the support of the senior management team that oversees asset management; (ii) continuing efforts to enhance Fidelity's global research capabilities; (iii) launching new funds and ETFs with innovative structures, strategies and pricing and making other enhancements to meet client needs; (iv) launching new share classes of existing funds; (v) eliminating purchase minimums and broadening eligibility requirements for certain funds and share classes; (vi) reducing management fees and total expenses for certain target date funds and index funds; (vii) lowering expense caps for certain existing funds and classes, and converting certain voluntary expense caps to contractual caps, to reduce expenses borne by shareholders; (viii) rationalizing product lines and gaining increased efficiencies from fund mergers, liquidations, and share class consolidations; (ix) continuing to develop, acquire and implement systems and technology to improve services to the funds and shareholders, strengthen information security, and increase efficiency; and (x) continuing to implement enhancements to further strengthen Fidelity's product line to increase investors' probability of success in achieving their investment goals, including retirement income goals.
Investment Performance. The Board considered whether the fund has operated in accordance with its investment objective, as well as its record of compliance with its investment restrictions and its performance history. The Board noted that there were portfolio management changes for the fund in June 2018 and October 2019. The Board will continue to monitor closely the fund's performance, taking into account the portfolio management changes.
The Board took into account discussions that occur at Board meetings throughout the year with representatives of the Investment Advisers about fund investment performance. In this regard the Board noted that as part of regularly scheduled fund reviews and other reports to the Board on fund performance, the Board considers annualized return information for the fund for different time periods, measured against an appropriate securities market index (benchmark index) and a peer group of funds with similar objectives (peer group), if any. In its evaluation of fund investment performance, the Board gave particular attention to information indicating changes in performance of certain Fidelity funds for specific time periods and discussed with the Investment Advisers the reasons for any overperformance or underperformance.
In addition to reviewing absolute and relative fund performance, the Independent Trustees periodically consider the appropriateness of fund performance metrics in evaluating the results achieved. In general, the Independent Trustees believe that fund performance should be evaluated based on net performance (after fees and expenses) of both the highest performing and lowest performing fund share classes, where applicable, compared to appropriate benchmark indices, over appropriate time periods that may include full market cycles, and compared to peer groups, as applicable, over the same periods, taking into account relevant factors including the following: general market conditions; issuer-specific information; and fund cash flows and other factors.
The Independent Trustees recognize that shareholders evaluate performance on a net basis over their own holding periods, for which one-, three-, and five-year periods are often used as a proxy. For this reason, the performance information reviewed by the Board also included net cumulative total return information for the fund and an appropriate benchmark index and peer group for the most recent one-, three-, and five-year periods ended June 30, 2019, as shown below. Returns are shown compared to the 25th percentile (top of box, 75% beaten) and 75th percentile (bottom of box, 25% beaten) of the peer universe.
Fidelity Puritan Fund
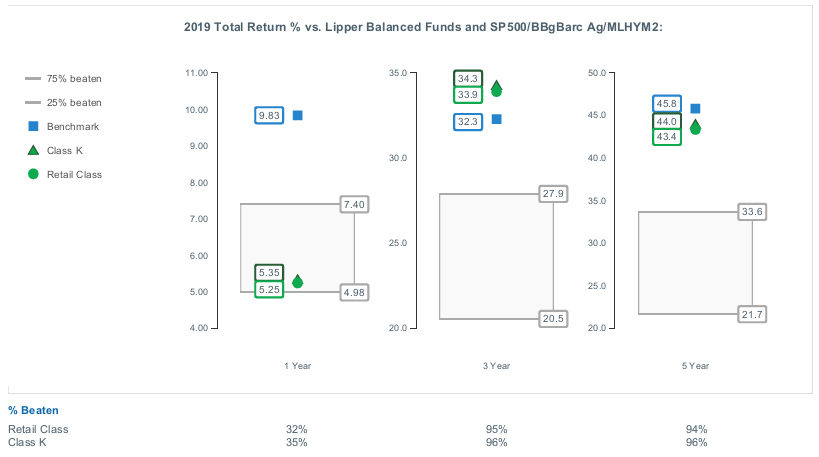
Based on its review, the Board concluded that the nature, extent, and quality of services provided to the fund under the Advisory Contracts should continue to benefit the shareholders of the fund.
Competitiveness of Management Fee and Total Expense Ratio. The Board considered the fund's management fee and total expense ratio compared to "mapped groups" of competitive funds and classes created for the purpose of facilitating the Trustees' competitive analysis of management fees and total expenses. Fidelity creates "mapped groups" by combining similar Lipper investment objective categories that have comparable investment mandates. Combining Lipper investment objective categories aids the Board's management fee and total expense ratio comparisons by broadening the competitive group used for comparison.
Management Fee. The Board considered two proprietary management fee comparisons for the 12-month periods ended June 30 (December 31 for periods prior to 2018) shown in basis points (BP) in the chart below. The group of Lipper funds used by the Board for management fee comparisons is referred to below as the "Total Mapped Group." The Total Mapped Group is broader than the Lipper peer group used by the Board for performance comparisons because the Total Mapped Group combines several Lipper investment objective categories while the Lipper peer group does not. The Total Mapped Group comparison focuses on a fund's standing in terms of gross management fees before expense reimbursements or caps relative to the total universe of funds with comparable investment mandates, regardless of whether their management fee structures also are comparable. Funds with comparable investment mandates offer exposure to similar types of securities. Funds with comparable management fee structures have similar management fee contractual arrangements (
e.g., flat rate charged for advisory services, all-inclusive fee rate,
etc.). "TMG %" represents the percentage of funds in the Total Mapped Group that had management fees that were lower than the fund's. For example, a hypothetical TMG % of 20% would mean that 80% of the funds in the Total Mapped Group had higher, and 20% had lower, management fees than the fund. The fund's actual TMG %s and the number of funds in the Total Mapped Group are in the chart below. The "Asset-Sized Peer Group" (ASPG) comparison focuses on a fund's standing relative to a subset of non-Fidelity funds within the Total Mapped Group that are similar in size and management fee structure. For example, if a fund is in the first quartile of the ASPG, the fund's management fee ranks in the least expensive or lowest 25% of funds in the ASPG. The ASPG represents at least 15% of the funds in the Total Mapped Group with comparable asset size and management fee structures, subject to a minimum of 50 funds (or all funds in the Total Mapped Group if fewer than 50). Additional information, such as the ASPG quartile in which the fund's management fee rate ranked, is also included in the chart and was considered by the Board.
Fidelity Puritan Fund

The Board noted that the fund's management fee rate ranked below the median of its Total Mapped Group and below the median of its ASPG for the 12-month period ended June 30, 2019.
The Board noted that it and the boards of other Fidelity funds formed an ad hoc Committee on Group Fee, which meets periodically, to conduct an in-depth review of the "group fee" component of the management fee of funds with such management fee structures. The Committee's focus included the mechanics of the group fee, the competitive landscape of group fee structures, Fidelity funds with no group fee component and investment products not included in group fee assets. The Board also considered that, for funds subject to the group fee, FMR agreed to voluntarily waive fees over a specified period of time in amounts designed to account for assets converted from certain funds to certain collective investment trusts.
The Board also noted that, in 2013, the ad hoc Committee on Management Fees was formed to conduct an in-depth review of the management fee rates of Fidelity's active equity mutual funds. The Committee focused on the following areas: (i) standard fee structures; (ii) research consumption and trading evolution; (iii) management fee competitiveness/profitability by category; and (iv) factors that drive institutional pricing.
Based on its review, the Board concluded that the fund's management fee is fair and reasonable in light of the services that the fund receives and the other factors considered.
Total Expense Ratio. In its review of each class's total expense ratio, the Board considered the fund's management fee rate as well as other fund or class expenses, as applicable, such as transfer agent fees, pricing and bookkeeping fees, and custodial, legal, and audit fees. The Board also noted that Fidelity may agree to waive fees or reimburse expenses from time to time, and the extent to which, if any, it has done so for the fund. As part of its review, the Board also considered the current and historical total expense ratios of each class of the fund compared to competitive fund median expenses. Each class of the fund is compared to those funds and classes in the Total Mapped Group (used by the Board for management fee comparisons) that have a similar sales load structure.
The Board noted that the total expense ratio of each class ranked below the competitive median for the 12-month period ended June 30, 2019.
Fees Charged to Other Fidelity Clients. The Board also considered Fidelity fee structures and other information with respect to clients of Fidelity, such as other funds advised or subadvised by Fidelity, pension plan clients, and other institutional clients with similar mandates. The Board noted that a joint ad hoc committee created by it and the boards of other Fidelity funds periodically reviews and compares Fidelity's institutional investment advisory business with its business of providing services to the Fidelity funds and also noted the most recent findings of the committee. The Board noted that the committee's review included a consideration of the differences in services provided, fees charged, and costs incurred, as well as competition in the markets serving the different categories of clients.
Based on its review of total expense ratios and fees charged to other Fidelity clients, the Board concluded that the total expense ratio of each class of the fund was reasonable in light of the services that the fund and its shareholders receive and the other factors considered.
Costs of the Services and Profitability. The Board considered the revenues earned and the expenses incurred by Fidelity in conducting the business of developing, marketing, distributing, managing, administering and servicing the fund and servicing the fund's shareholders. The Board also considered the level of Fidelity's profits in respect of all the Fidelity funds.
On an annual basis, Fidelity presents to the Board information about the profitability of its relationships with the fund. Fidelity calculates profitability information for each fund, as well as aggregate profitability information for groups of Fidelity funds and all Fidelity funds, using a series of detailed revenue and cost allocation methodologies which originate with the books and records of Fidelity on which Fidelity's audited financial statements are based. The Audit Committee of the Board reviews any significant changes from the prior year's methodologies and the full Board approves such changes.
PricewaterhouseCoopers LLP (PwC), auditor to Fidelity and certain Fidelity funds, has been engaged annually by the Board as part of the Board's assessment of Fidelity's profitability analysis. PwC's engagement includes the review and assessment of the methodologies used by Fidelity in determining the revenues and expenses attributable to Fidelity's mutual fund business, and completion of agreed-upon procedures in respect of the mathematical accuracy of the fund profitability information and its conformity to established allocation methodologies. After considering PwC's reports issued under the engagement and information provided by Fidelity, the Board concluded that while other allocation methods may also be reasonable, Fidelity's profitability methodologies are reasonable in all material respects.
The Board also reviewed Fidelity's non-fund businesses and potential indirect benefits such businesses may have received as a result of their association with Fidelity's mutual fund business (i.e., fall-out benefits) as well as cases where Fidelity's affiliates may benefit from the funds' business. The Board noted that changes to fall-out benefits year-over-year reflect business developments at Fidelity's various businesses. The Board considered that a joint ad hoc committee created by it and the boards of other Fidelity funds had recently been established, and met periodically, to evaluate potential fall-out benefits (PFOB Committee). The Board noted that the PFOB Committee, among other things: (i) discussed the legal framework surrounding potential fall-out benefits; (ii) reviewed the Board's responsibilities and approach to potential fall-out benefits; and (iii) reviewed practices employed by competitor funds regarding the review of potential fall-out benefits.
The Board considered the costs of the services provided by and the profits realized by Fidelity in connection with the operation of the fund, including the conclusions of the PFOB Committee, and was satisfied that the profitability was not excessive.
Economies of Scale. The Board considered whether there have been economies of scale in respect of the management of the Fidelity funds, whether the Fidelity funds (including the fund) have appropriately benefited from any such economies of scale, and whether there is potential for realization of any further economies of scale. The Board considered the extent to which the fund will benefit from economies of scale as assets grow through increased services to the fund, through waivers or reimbursements, or through fee or expense ratio reductions. The Board also noted that a committee (the Economies of Scale Committee) created by it and the boards of other Fidelity funds periodically analyzes whether Fidelity attains economies of scale in respect of the management and servicing of the Fidelity funds, whether the Fidelity funds have appropriately benefited from such economies of scale, and whether there is potential for realization of any further economies of scale.
The Board recognized that the fund's management contract incorporates a "group fee" structure, which provides for lower group fee rates as total "group assets" increase, and for higher group fee rates as total "group assets" decrease ("group assets" as defined in the management contract). FMR calculates the group fee rates based on a tiered asset "breakpoint" schedule that varies based on asset class. The Board considered that the group fee is designed to deliver the benefits of economies of scale to fund shareholders when total Fidelity fund assets increase, even if assets of any particular fund are unchanged or have declined, because some portion of Fidelity's costs are attributable to services provided to all Fidelity funds, and all funds benefit if those costs can be allocated among more assets. The Board concluded that, given the group fee structure, fund shareholders will benefit from lower management fees as "group assets" increase at the fund complex level, regardless of whether Fidelity achieves any such economies of scale.
The Board concluded, taking into account the analysis of the Economies of Scale Committee, that economies of scale, if any, are being appropriately shared between fund shareholders and Fidelity.
Additional Information Requested by the Board. In order to develop fully the factual basis for consideration of the Fidelity funds' advisory contracts, the Board requested and received additional information on certain topics, including: (i) fund flow and performance trends, in particular the underperformance of certain funds and strategies, and Fidelity's long-term strategies for certain funds; (ii) consideration of performance fees for additional funds; (iii) changes in Fidelity's non-fund businesses and the impact of such changes on the funds; (iv) metrics for evaluating index fund and ETF performance and information about ETF trading characteristics; (v) the methodology with respect to evaluating competitive fund data and peer group classifications and fee comparisons; (vi) the expense structures for different funds and classes; (vii) information regarding other accounts managed by Fidelity, including collective investment trusts and separately managed accounts; and (viii) Fidelity's philosophies and strategies for evaluating funds and classes with lower or declining asset levels.
Based on its evaluation of all of the conclusions noted above, and after considering all factors it believed relevant, the Board concluded that the advisory fee arrangements are fair and reasonable, and that the fund's Amended and Restated Contracts should be approved and the fund's Advisory Contracts should be renewed.
Liquidity Risk Management Program
The Securities and Exchange Commission adopted Rule 22e-4 under the Investment Company Act of 1940 (the Liquidity Rule) to promote effective liquidity risk management throughout the open-end investment company industry, thereby reducing the risk that funds will be unable to meet their redemption obligations and mitigating dilution of the interests of fund shareholders.
The Fund has adopted and implemented a liquidity risk management program pursuant to the Liquidity Rule (the Program) effective December 1, 2018. The Program is reasonably designed to assess and manage the Fund’s liquidity risk and to comply with the requirements of the Liquidity Rule. The Fund’s Board of Trustees (the Board) has designated the Fund’s investment adviser as administrator of the Program. The Fidelity advisers have established a Liquidity Risk Management Committee (the LRM Committee) to manage the Program for each of the Fidelity Funds. The LRM Committee monitors the adequacy and effectiveness of implementation of the Program and on a periodic basis assesses each Fund’s liquidity risk based on a variety of factors including (1) the Fund’s investment strategy, (2) portfolio liquidity and cash flow projections during normal and reasonably foreseeable stressed conditions, (3) shareholder redemptions, (4) borrowings and other funding sources and (5) in the case of exchange-traded funds, certain additional factors including the effect of the Fund’s prices and spreads, market participants, and basket compositions on the overall liquidity of the Fund’s portfolio, as applicable.
In accordance with the Program, each of the Fund’s portfolio investments is classified into one of four liquidity categories described below based on a determination of a reasonable expectation for how long it would take to convert the investment to cash (or sell or dispose of the investment) without significantly changing its market value.
- Highly liquid investments – cash or convertible to cash within three business days or less
- Moderately liquid investments – convertible to cash in three to seven calendar days
- Less liquid investments – can be sold or disposed of, but not settled, within seven calendar days
- Illiquid investments – cannot not be sold or disposed of within seven calendar days
Liquidity classification determinations take into account a variety of factors including various market, trading and investment-specific considerations, as well as market depth, and generally utilize analysis from a third-party liquidity metrics service.
The Liquidity Rule places a 15% limit on a fund’s illiquid investments and requires funds that do not primarily hold assets that are highly liquid investments to determine and maintain a minimum percentage of the fund’s net assets to be invested in highly liquid investments (highly liquid investment minimum or HLIM). The Program includes provisions reasonably designed to comply with the 15% limit on illiquid investments and for determining, periodically reviewing and complying with the HLIM requirement as applicable.
At a recent meeting of the Fund’s Board of Trustees, the LRM Committee provided a written report to the Board pertaining to the operation, adequacy, and effectiveness of implementation of the Program for the annual period from December 1, 2018 through November 30, 2019. The report concluded that the Program has been implemented and is operating effectively and is reasonably designed to assess and manage the Fund’s liquidity risk.

PUR-SANN-0420
1.700677.122
Fidelity® Balanced Fund
Semi-Annual Report
February 29, 2020
See the inside front cover for important information about access to your fund’s shareholder reports.
Beginning on January 1, 2021, as permitted by regulations adopted by the Securities and Exchange Commission, paper copies of a fund’s shareholder reports will no longer be sent by mail, unless you specifically request paper copies of the reports from the fund or from your financial intermediary, such as a financial advisor, broker-dealer or bank. Instead, the reports will be made available on a website, and you will be notified by mail each time a report is posted and provided with a website link to access the report.
If you already elected to receive shareholder reports electronically, you will not be affected by this change and you need not take any action. You may elect to receive shareholder reports and other communications from a fund electronically, by contacting your financial intermediary. For Fidelity customers, visit Fidelity's web site or call Fidelity using the contact information listed below.
You may elect to receive all future reports in paper free of charge. If you wish to continue receiving paper copies of your shareholder reports, you may contact your financial intermediary or, if you are a Fidelity customer, visit Fidelity’s website, or call Fidelity at the applicable toll-free number listed below. Your election to receive reports in paper will apply to all funds held with the fund complex/your financial intermediary.
| Account Type | Website | Phone Number |
| Brokerage, Mutual Fund, or Annuity Contracts: | fidelity.com/mailpreferences | 1-800-343-3548 |
| Employer Provided Retirement Accounts: | netbenefits.fidelity.com/preferences (choose 'no' under Required Disclosures to continue to print) | 1-800-343-0860 |
| Advisor Sold Accounts Serviced Through Your Financial Intermediary: | Contact Your Financial Intermediary | Your Financial Intermediary's phone number |
| Advisor Sold Accounts Serviced by Fidelity: | institutional.fidelity.com | 1-877-208-0098 |
Contents
To view a fund's proxy voting guidelines and proxy voting record for the 12-month period ended June 30, visit http://www.fidelity.com/proxyvotingresults or visit the Securities and Exchange Commission's (SEC) web site at http://www.sec.gov.
You may also call 1-800-544-8544 if you’re an individual investing directly with Fidelity, call 1-800-835-5092 if you’re a plan sponsor or participant with Fidelity as your recordkeeper or call 1-877-208-0098 on institutional accounts or if you’re an advisor or invest through one to request a free copy of the proxy voting guidelines.
Standard & Poor's, S&P and S&P 500 are registered service marks of The McGraw-Hill Companies, Inc. and have been licensed for use by Fidelity Distributors Corporation.
Other third-party marks appearing herein are the property of their respective owners.
All other marks appearing herein are registered or unregistered trademarks or service marks of FMR LLC or an affiliated company. © 2020 FMR LLC. All rights reserved.
This report and the financial statements contained herein are submitted for the general information of the shareholders of the Fund. This report is not authorized for distribution to prospective investors in the Fund unless preceded or accompanied by an effective prospectus.
A fund files its complete schedule of portfolio holdings with the SEC for the first and third quarters of each fiscal year on Form N-PORT. Forms N-PORT are available on the SEC’s web site at http://www.sec.gov. A fund's Forms N-PORT may be reviewed and copied at the SEC’s Public Reference Room in Washington, DC. Information regarding the operation of the SEC's Public Reference Room may be obtained by calling 1-800-SEC-0330.
For a complete list of a fund's portfolio holdings, view the most recent holdings listing, semiannual report, or annual report on Fidelity's web site at http://www.fidelity.com, http://www.institutional.fidelity.com, or http://www.401k.com, as applicable.
NOT FDIC INSURED •MAY LOSE VALUE •NO BANK GUARANTEE
Neither the Fund nor Fidelity Distributors Corporation is a bank.
Note to Shareholders:
Early in 2020, the outbreak and spread of a new coronavirus emerged as a public health emergency that had a major influence on financial markets, primarily based on its impact on the global economy and corporate earnings. The virus causes a respiratory disease known as COVID-19. On March 11, the World Health Organization declared the COVID-19 outbreak a pandemic, citing sustained risk of further global spread.
In the weeks following the end of this reporting period, as the crisis worsened, we witnessed an escalating human tragedy with wide-scale social and economic consequences from coronavirus-containment measures. The outbreak of COVID-19 prompted a number of measures to limit the spread, including travel and border restrictions, quarantines, and restrictions on large gatherings. In turn, these resulted in lower consumer activity, diminished demand for a wide range of products and services, disruption in manufacturing and supply chains, and – given the wide variability in outcomes regarding the outbreak – significant market uncertainty and volatility. Amid the turmoil, the U.S. government took unprecedented action – in concert with the U.S. Federal Reserve and central banks around the world – to help support consumers, businesses, and the broader economy, and to limit disruption to the financial system.
The situation continues to unfold, and the extent and duration of its impact on financial markets and the economy remain highly uncertain. Extreme events such as the coronavirus crisis are “exogenous shocks” that can have significant adverse effects on mutual funds and their investments. Although multiple asset classes may be affected by market disruption, the duration and impact may not be the same for all types of assets.
Fidelity is committed to helping you stay informed amid news about COVID-19 and during increased market volatility, and we’re taking extra steps to be responsive to customer needs. We encourage you to visit our websites, where we offer ongoing updates, commentary, and analysis on the markets and our funds.
Investment Summary (Unaudited)
The information in the following tables is based on the combined investments of the Fund and its pro-rata share of the investments of Fidelity's Fixed-Income Central Funds.
Top Five Stocks as of February 29, 2020
| | % of fund's net assets |
| Microsoft Corp. | 3.5 |
| Apple, Inc. | 3.0 |
| Amazon.com, Inc. | 1.9 |
| Alphabet, Inc. Class C | 1.8 |
| Facebook, Inc. Class A | 1.5 |
| | 11.7 |
Top Five Bond Issuers as of February 29, 2020
| (with maturities greater than one year) | % of fund's net assets |
| U.S. Treasury Obligations | 9.0 |
| Fannie Mae | 2.3 |
| Freddie Mac | 1.8 |
| Ginnie Mae | 1.9 |
| Morgan Stanley | 0.5 |
| | 15.5 |
Top Five Market Sectors as of February 29, 2020
| | % of fund's net assets |
| Information Technology | 15.0 |
| Financials | 14.0 |
| Health Care | 10.5 |
| Communication Services | 7.9 |
| Industrials | 7.9 |
Asset Allocation (% of fund's net assets)
| As of February 29, 2020* |
| | Stocks and Equity Futures | 66.3% |
| | Bonds | 31.9% |
| | Other Investments | 0.5% |
| | Short-Term Investments and Net Other Assets (Liabilities) | 1.3% |

* Foreign investments – 9.5%
An unaudited holdings listing for the Fund, which presents direct holdings as well as the pro-rata share of any securities and other investments held indirectly through its investment in underlying non-money market Fidelity Central Funds, is available at fidelity.com and/or institutional.fidelity.com, as applicable.
Percentages in the above tables are adjusted for the effect of TBA Sale Commitments.
Percentages are adjusted for the effect of futures contracts and swaps, if applicable.
Schedule of Investments February 29, 2020 (Unaudited)
Showing Percentage of Net Assets
| Common Stocks - 66.0% | | | |
| | | Shares | Value (000s) |
| COMMUNICATION SERVICES - 6.7% | | | |
| Diversified Telecommunication Services - 0.1% | | | |
| AT&T, Inc. | | 1,112,460 | $39,181 |
| Entertainment - 2.2% | | | |
| Activision Blizzard, Inc. | | 5,817,395 | 338,165 |
| DouYu International Holdings Ltd. ADR | | 247,132 | 1,920 |
| Electronic Arts, Inc. (a) | | 490,063 | 49,678 |
| Netflix, Inc. (a) | | 454,670 | 167,787 |
| The Walt Disney Co. | | 1,651,314 | 194,277 |
| World Wrestling Entertainment, Inc. Class A (b) | | 145,800 | 6,819 |
| | | | 758,646 |
| Interactive Media & Services - 4.0% | | | |
| Alphabet, Inc.: | | | |
| Class A (a) | | 126,029 | 168,784 |
| Class C (a) | | 459,441 | 615,343 |
| ANGI Homeservices, Inc. Class A (a) | | 2,443,297 | 17,421 |
| CarGurus, Inc. Class A (a)(b) | | 223,500 | 5,697 |
| Facebook, Inc. Class A (a) | | 2,632,557 | 506,688 |
| Tencent Holdings Ltd. | | 164,242 | 8,328 |
| Twitter, Inc. (a) | | 721,165 | 23,943 |
| Wise Talent Information Technology Co. Ltd. (a) | | 10,537,987 | 25,956 |
| | | | 1,372,160 |
| Media - 0.2% | | | |
| Altice U.S.A., Inc. Class A (a) | | 1,182,201 | 30,572 |
| ViacomCBS, Inc. Class B | | 697,508 | 17,166 |
| | | | 47,738 |
| Wireless Telecommunication Services - 0.2% | | | |
| Boingo Wireless, Inc. (a) | | 990,370 | 12,548 |
| T-Mobile U.S., Inc. (a) | | 746,414 | 67,297 |
| | | | 79,845 |
|
| TOTAL COMMUNICATION SERVICES | | | 2,297,570 |
|
| CONSUMER DISCRETIONARY - 6.4% | | | |
| Auto Components - 0.1% | | | |
| Aptiv PLC | | 484,874 | 37,874 |
| Distributors - 0.1% | | | |
| LKQ Corp. (a) | | 1,530,265 | 45,265 |
| Diversified Consumer Services - 0.1% | | | |
| Afya Ltd. | | 997,708 | 23,725 |
| Hotels, Restaurants & Leisure - 1.1% | | | |
| ARAMARK Holdings Corp. | | 798,312 | 27,733 |
| Boyd Gaming Corp. | | 328,100 | 8,764 |
| Churchill Downs, Inc. | | 219,568 | 27,587 |
| Compass Group PLC | | 3,183,849 | 70,148 |
| Dunkin' Brands Group, Inc. | | 352,692 | 23,461 |
| McDonald's Corp. | | 1,070,076 | 207,777 |
| Starbucks Corp. | | 201,958 | 15,840 |
| | | | 381,310 |
| Household Durables - 0.2% | | | |
| Lennar Corp. Class A | | 1,142,186 | 68,920 |
| Internet & Direct Marketing Retail - 2.5% | | | |
| Alibaba Group Holding Ltd. | | 281,270 | 7,217 |
| Amazon.com, Inc. (a) | | 338,098 | 636,892 |
| GrubHub, Inc. (a)(b) | | 657,028 | 31,610 |
| Ocado Group PLC (a) | | 547,812 | 7,589 |
| Pinduoduo, Inc. ADR (a) | | 995,538 | 35,620 |
| The Booking Holdings, Inc. (a) | | 74,850 | 126,920 |
| Wayfair LLC Class A (a) | | 14,769 | 934 |
| | | | 846,782 |
| Leisure Products - 0.1% | | | |
| Mattel, Inc. (a)(b) | | 1,462,707 | 17,245 |
| Peloton Interactive, Inc. Class A (a)(b) | | 487,800 | 13,019 |
| | | | 30,264 |
| Multiline Retail - 0.2% | | | |
| Dollar Tree, Inc. (a) | | 1,076,862 | 89,412 |
| Specialty Retail - 1.6% | | | |
| Burlington Stores, Inc. (a) | | 149,484 | 32,327 |
| Lowe's Companies, Inc. | | 1,494,740 | 159,294 |
| The Children's Place Retail Stores, Inc. | | 169,342 | 9,754 |
| The Home Depot, Inc. | | 697,977 | 152,047 |
| TJX Companies, Inc. | | 2,425,886 | 145,068 |
| Ulta Beauty, Inc. (a) | | 135,361 | 34,800 |
| | | | 533,290 |
| Textiles, Apparel & Luxury Goods - 0.4% | | | |
| LVMH Moet Hennessy Louis Vuitton SE | | 37,946 | 15,836 |
| NIKE, Inc. Class B | | 585,786 | 52,358 |
| PVH Corp. | | 350,548 | 25,979 |
| Tapestry, Inc. | | 1,380,682 | 32,377 |
| | | | 126,550 |
|
| TOTAL CONSUMER DISCRETIONARY | | | 2,183,392 |
|
| CONSUMER STAPLES - 4.4% | | | |
| Beverages - 1.2% | | | |
| Boston Beer Co., Inc. Class A (a) | | 27,400 | 10,160 |
| Keurig Dr. Pepper, Inc. | | 894,299 | 24,933 |
| Monster Beverage Corp. (a) | | 846,392 | 52,823 |
| PepsiCo, Inc. | | 2,226,879 | 294,015 |
| Pernod Ricard SA | | 189,452 | 30,895 |
| | | | 412,826 |
| Food & Staples Retailing - 1.3% | | | |
| Costco Wholesale Corp. | | 503,428 | 141,534 |
| Kroger Co. | | 1,992,236 | 56,042 |
| Performance Food Group Co. (a) | | 568,958 | 24,124 |
| U.S. Foods Holding Corp. (a) | | 1,519,782 | 51,125 |
| Walmart, Inc. | | 1,615,339 | 173,940 |
| | | | 446,765 |
| Food Products - 0.4% | | | |
| Beyond Meat, Inc. (b) | | 77,737 | 6,969 |
| Freshpet, Inc. (a) | | 142,513 | 9,471 |
| Hilton Food Group PLC | | 109 | 1 |
| Lamb Weston Holdings, Inc. | | 250,700 | 21,783 |
| Mondelez International, Inc. | | 1,946,244 | 102,762 |
| | | | 140,986 |
| Household Products - 1.0% | | | |
| Colgate-Palmolive Co. | | 44,100 | 2,980 |
| Energizer Holdings, Inc. | | 858,926 | 36,925 |
| Procter & Gamble Co. | | 2,461,102 | 278,671 |
| Reynolds Consumer Products, Inc. (a) | | 48,146 | 1,389 |
| | | | 319,965 |
| Personal Products - 0.1% | | | |
| Estee Lauder Companies, Inc. Class A | | 230,439 | 42,309 |
| Tobacco - 0.4% | | | |
| Altria Group, Inc. | | 3,292,248 | 132,908 |
|
| TOTAL CONSUMER STAPLES | | | 1,495,759 |
|
| ENERGY - 2.5% | | | |
| Energy Equipment & Services - 0.2% | | | |
| Baker Hughes Co. Class A | | 957,345 | 15,404 |
| CGG SA (a) | | 1,385,666 | 3,853 |
| NCS Multistage Holdings, Inc. (a) | | 1,477,566 | 1,611 |
| Oceaneering International, Inc. (a) | | 861,264 | 9,078 |
| SBM Offshore NV | | 415,943 | 6,584 |
| Schlumberger Ltd. | | 364,550 | 9,876 |
| Subsea 7 SA | | 1,695,668 | 15,408 |
| TechnipFMC PLC | | 402,094 | 5,967 |
| TGS Nopec Geophysical Co. ASA | | 102,948 | 2,402 |
| | | | 70,183 |
| Oil, Gas & Consumable Fuels - 2.3% | | | |
| Africa Oil Corp. (a) | | 2,614,028 | 2,415 |
| Apache Corp. | | 420,593 | 10,481 |
| Cairn Energy PLC (a) | | 2,264,762 | 4,117 |
| Canadian Natural Resources Ltd. | | 808,258 | 20,805 |
| Cheniere Energy, Inc. (a) | | 178,210 | 9,140 |
| Chevron Corp. | | 997,459 | 93,103 |
| Concho Resources, Inc. | | 126,124 | 8,579 |
| ConocoPhillips Co. | | 217,168 | 10,515 |
| Enbridge, Inc. | | 294,535 | 11,024 |
| Equinor ASA sponsored ADR | | 1,743,490 | 27,111 |
| Exxon Mobil Corp. | | 5,243,654 | 269,734 |
| Galp Energia SGPS SA Class B | | 1,291,176 | 17,811 |
| Gibson Energy, Inc. | | 252,800 | 4,825 |
| Hess Corp. | | 1,026,114 | 57,647 |
| Lundin Petroleum AB | | 272,506 | 7,780 |
| Marathon Petroleum Corp. | | 186,100 | 8,825 |
| MEG Energy Corp. (a) | | 5,049,170 | 23,247 |
| Murphy Oil Corp. | | 983,422 | 18,538 |
| Noble Energy, Inc. | | 172,170 | 2,725 |
| Phillips 66 Co. | | 552,361 | 41,350 |
| Pioneer Natural Resources Co. | | 170,472 | 20,931 |
| Reliance Industries Ltd. | | 1,120,001 | 20,514 |
| Shell Midstream Partners LP | | 512,618 | 8,771 |
| Total SA sponsored ADR | | 958,278 | 41,340 |
| Valero Energy Corp. | | 543,400 | 36,000 |
| | | | 777,328 |
|
| TOTAL ENERGY | | | 847,511 |
|
| FINANCIALS - 8.2% | | | |
| Banks - 3.0% | | | |
| Bank of America Corp. | | 11,404,451 | 325,027 |
| Citigroup, Inc. | | 2,888,737 | 183,319 |
| EFG Eurobank Ergasias SA (a) | | 23,880,870 | 15,217 |
| First Horizon National Corp. | | 1,109,284 | 14,787 |
| Huntington Bancshares, Inc. | | 3,546,074 | 43,510 |
| KeyCorp | | 3,135,447 | 51,265 |
| M&T Bank Corp. | | 334,579 | 46,968 |
| Signature Bank | | 285,485 | 35,714 |
| Societe Generale Series A | | 786,905 | 22,298 |
| Synovus Financial Corp. | | 490,244 | 14,227 |
| Truist Financial Corp. | | 1,611,076 | 74,335 |
| Wells Fargo & Co. | | 4,656,215 | 190,206 |
| | | | 1,016,873 |
| Capital Markets - 1.3% | | | |
| Apollo Global Management LLC Class A | | 289,295 | 12,052 |
| Bank of New York Mellon Corp. | | 729,900 | 29,123 |
| BlackRock, Inc. Class A | | 140,085 | 64,861 |
| Cboe Global Markets, Inc. | | 812,014 | 92,570 |
| E*TRADE Financial Corp. | | 568,295 | 26,017 |
| Intercontinental Exchange, Inc. | | 758,965 | 67,715 |
| Invesco Ltd. | | 1,253,899 | 18,056 |
| Morgan Stanley | | 1,801,520 | 81,122 |
| Virtu Financial, Inc. Class A (b) | | 2,062,233 | 38,791 |
| | | | 430,307 |
| Consumer Finance - 1.8% | | | |
| 360 Finance, Inc. ADR (a) | | 2,458,071 | 20,549 |
| Ally Financial, Inc. | | 1,057,223 | 26,505 |
| American Express Co. | | 647,214 | 71,148 |
| Capital One Financial Corp. | | 3,347,300 | 295,433 |
| OneMain Holdings, Inc. | | 2,993,154 | 109,998 |
| Qudian, Inc. ADR (a)(b) | | 1,594,596 | 4,178 |
| Shriram Transport Finance Co. Ltd. | | 932,400 | 15,377 |
| SLM Corp. | | 3,567,313 | 36,993 |
| Synchrony Financial | | 1,031,634 | 30,021 |
| | | | 610,202 |
| Diversified Financial Services - 0.6% | | | |
| Berkshire Hathaway, Inc.: | | | |
| Class A (a) | | 90 | 27,819 |
| Class B (a) | | 754,652 | 155,715 |
| StepStone Group Holdings LLC (c)(d)(e) | | 10,313 | 8,250 |
| StepStone Group LP Class A (c)(d)(e) | | 10,313 | 8,250 |
| | | | 200,034 |
| Insurance - 1.5% | | | |
| American International Group, Inc. | | 1,723,223 | 72,651 |
| Fairfax Financial Holdings Ltd. (sub. vtg.) | | 47,200 | 20,333 |
| Hartford Financial Services Group, Inc. | | 844,356 | 42,176 |
| Marsh & McLennan Companies, Inc. | | 1,128,546 | 118,001 |
| MetLife, Inc. | | 983,105 | 41,998 |
| The Travelers Companies, Inc. | | 1,112,952 | 133,343 |
| Willis Group Holdings PLC | | 462,608 | 87,549 |
| | | | 516,051 |
|
| TOTAL FINANCIALS | | | 2,773,467 |
|
| HEALTH CARE - 9.4% | | | |
| Biotechnology - 1.8% | | | |
| Alexion Pharmaceuticals, Inc. (a) | | 713,998 | 67,137 |
| Amgen, Inc. | | 1,104,792 | 220,660 |
| Argenx SE ADR (a) | | 24,848 | 3,513 |
| Biogen, Inc. (a) | | 115,123 | 35,503 |
| Global Blood Therapeutics, Inc. (a) | | 564,472 | 36,104 |
| PTC Therapeutics, Inc. (a) | | 368,994 | 20,236 |
| Regeneron Pharmaceuticals, Inc. (a) | | 149,100 | 66,285 |
| Vertex Pharmaceuticals, Inc. (a) | | 668,988 | 149,873 |
| | | | 599,311 |
| Health Care Equipment & Supplies - 2.1% | | | |
| Abbott Laboratories | | 1,927,035 | 148,440 |
| Becton, Dickinson & Co. | | 352,170 | 83,753 |
| Boston Scientific Corp. (a) | | 4,489,607 | 167,866 |
| Danaher Corp. | | 293,598 | 42,448 |
| DexCom, Inc. (a) | | 58,800 | 16,229 |
| Haemonetics Corp. (a) | | 354,516 | 38,405 |
| Intuitive Surgical, Inc. (a) | | 223,227 | 119,194 |
| Stryker Corp. | | 434,577 | 82,826 |
| ViewRay, Inc. (a) | | 1,554,909 | 4,463 |
| | | | 703,624 |
| Health Care Providers & Services - 2.2% | | | |
| Cigna Corp. | | 753,333 | 137,815 |
| HCA Holdings, Inc. | | 699,656 | 88,863 |
| Humana, Inc. | | 485,274 | 155,132 |
| UnitedHealth Group, Inc. | | 1,468,655 | 374,448 |
| | | | 756,258 |
| Health Care Technology - 0.0% | | | |
| Change Healthcare, Inc. (b) | | 964,805 | 13,112 |
| Life Sciences Tools & Services - 0.5% | | | |
| Thermo Fisher Scientific, Inc. | | 543,316 | 157,996 |
| Pharmaceuticals - 2.8% | | | |
| AstraZeneca PLC sponsored ADR | | 3,579,425 | 156,779 |
| Bristol-Myers Squibb Co. | | 4,287,080 | 253,195 |
| Bristol-Myers Squibb Co. rights (a) | | 1,390,827 | 4,659 |
| Eli Lilly & Co. | | 1,656,476 | 208,931 |
| Horizon Pharma PLC (a) | | 1,695,610 | 58,024 |
| Roche Holding AG (participation certificate) | | 623,738 | 200,553 |
| Zoetis, Inc. Class A | | 549,453 | 73,204 |
| | | | 955,345 |
|
| TOTAL HEALTH CARE | | | 3,185,646 |
|
| INDUSTRIALS - 7.6% | | | |
| Aerospace & Defense - 0.5% | | | |
| General Dynamics Corp. | | 212,766 | 33,977 |
| Northrop Grumman Corp. | | 151,074 | 49,679 |
| The Boeing Co. | | 275,120 | 75,688 |
| United Technologies Corp. | | 134,252 | 17,532 |
| | | | 176,876 |
| Air Freight & Logistics - 0.3% | | | |
| FedEx Corp. | | 801,052 | 113,085 |
| Airlines - 0.3% | | | |
| American Airlines Group, Inc. | | 4,295,646 | 81,832 |
| JetBlue Airways Corp. (a) | | 1,529,098 | 24,129 |
| | | | 105,961 |
| Construction & Engineering - 0.7% | | | |
| AECOM (a) | | 4,132,457 | 185,713 |
| Granite Construction, Inc. | | 1,859,593 | 37,787 |
| | | | 223,500 |
| Electrical Equipment - 0.9% | | | |
| Sensata Technologies, Inc. PLC (a) | | 3,581,580 | 146,128 |
| Sunrun, Inc. (a) | | 1,740,972 | 33,670 |
| Vivint Solar, Inc. (a)(b)(f) | | 10,623,163 | 119,404 |
| | | | 299,202 |
| Industrial Conglomerates - 1.2% | | | |
| 3M Co. | | 330,640 | 49,345 |
| General Electric Co. | | 29,121,221 | 316,839 |
| Honeywell International, Inc. | | 143,300 | 23,239 |
| | | | 389,423 |
| Machinery - 0.5% | | | |
| Allison Transmission Holdings, Inc. | | 2,905,500 | 117,963 |
| Caterpillar, Inc. | | 499,600 | 62,070 |
| | | | 180,033 |
| Marine - 0.2% | | | |
| A.P. Moller - Maersk A/S Series B | | 50,256 | 50,714 |
| Professional Services - 0.6% | | | |
| Nielsen Holdings PLC | | 11,772,603 | 214,379 |
| Road & Rail - 2.0% | | | |
| CSX Corp. | | 383,150 | 26,993 |
| Lyft, Inc. | | 1,547,630 | 58,996 |
| Norfolk Southern Corp. | | 989,585 | 180,451 |
| Uber Technologies, Inc. | | 11,286,468 | 382,273 |
| Union Pacific Corp. | | 254,800 | 40,720 |
| | | | 689,433 |
| Trading Companies & Distributors - 0.4% | | | |
| HD Supply Holdings, Inc. (a) | | 3,560,484 | 135,370 |
|
| TOTAL INDUSTRIALS | | | 2,577,976 |
|
| INFORMATION TECHNOLOGY - 14.8% | | | |
| Communications Equipment - 0.1% | | | |
| CommScope Holding Co., Inc. (a) | | 1,221,793 | 13,452 |
| Ericsson (B Shares) sponsored ADR (b) | | 1,838,829 | 14,784 |
| | | | 28,236 |
| Electronic Equipment & Components - 0.5% | | | |
| Flextronics International Ltd. (a) | | 7,407,794 | 82,301 |
| II-VI, Inc. (a) | | 1,628,309 | 48,344 |
| Jabil, Inc. | | 993,910 | 31,855 |
| | | | 162,500 |
| IT Services - 1.7% | | | |
| DXC Technology Co. | | 696,231 | 16,786 |
| Fastly, Inc. Class A (b) | | 622,847 | 12,332 |
| Fidelity National Information Services, Inc. | | 1,144,264 | 159,877 |
| Genpact Ltd. | | 974,724 | 37,488 |
| Global Payments, Inc. | | 210,985 | 38,815 |
| GoDaddy, Inc. (a) | | 618,914 | 43,312 |
| GreenSky, Inc. Class A (a)(b) | | 2,296,004 | 18,322 |
| MongoDB, Inc. Class A (a)(b) | | 145,528 | 22,193 |
| PayPal Holdings, Inc. (a) | | 1,303,774 | 140,795 |
| Twilio, Inc. Class A (a)(b) | | 918,932 | 103,509 |
| | | | 593,429 |
| Semiconductors & Semiconductor Equipment - 2.8% | | | |
| Advanced Micro Devices, Inc. (a) | | 849,906 | 38,654 |
| Applied Materials, Inc. | | 1,271,950 | 73,926 |
| Lam Research Corp. | | 77,199 | 22,653 |
| Marvell Technology Group Ltd. | | 3,274,378 | 69,744 |
| Micron Technology, Inc. (a) | | 4,028,796 | 211,754 |
| NVIDIA Corp. | | 626,607 | 169,228 |
| NXP Semiconductors NV | | 1,548,976 | 176,103 |
| ON Semiconductor Corp. (a) | | 1,805,034 | 33,682 |
| Qualcomm, Inc. | | 990,445 | 77,552 |
| Sanken Electric Co. Ltd. | | 329,856 | 7,820 |
| Skyworks Solutions, Inc. | | 216,723 | 21,711 |
| STMicroelectronics NV: | | | |
| (France) | | 838,794 | 23,151 |
| (NY Shares) unit (b) | | 721,782 | 19,777 |
| Xilinx, Inc. | | 45,304 | 3,782 |
| | | | 949,537 |
| Software - 6.4% | | | |
| Adobe, Inc. (a) | | 440,214 | 151,927 |
| Autodesk, Inc. (a) | | 1,863,382 | 355,682 |
| Avaya Holdings Corp. (a) | | 227,800 | 2,952 |
| Citrix Systems, Inc. | | 54,400 | 5,624 |
| Cloudflare, Inc. (a) | | 480,225 | 10,229 |
| Elastic NV (a) | | 768,285 | 56,746 |
| HubSpot, Inc. (a) | | 106,147 | 19,048 |
| LivePerson, Inc. (a) | | 1,834,667 | 48,545 |
| Microsoft Corp. | | 7,371,953 | 1,194,322 |
| Nortonlifelock, Inc. | | 108,495 | 2,065 |
| Nutanix, Inc. Class A (a) | | 70,675 | 1,685 |
| Oracle Corp. | | 342,300 | 16,930 |
| Parametric Technology Corp. (a) | | 54,764 | 4,137 |
| RingCentral, Inc. (a) | | 29,969 | 7,065 |
| Salesforce.com, Inc. (a) | | 1,125,227 | 191,739 |
| SS&C Technologies Holdings, Inc. | | 281,112 | 15,602 |
| Talend SA ADR (a) | | 11 | 0 |
| Workday, Inc. Class A (a) | | 213,839 | 37,048 |
| Workiva, Inc. (a) | | 112,250 | 4,798 |
| Yext, Inc. (a)(b) | | 1,161,911 | 17,615 |
| Zendesk, Inc. (a) | | 186,356 | 14,780 |
| Zuora, Inc. (a) | | 79,238 | 1,049 |
| | | | 2,159,588 |
| Technology Hardware, Storage & Peripherals - 3.3% | | | |
| Apple, Inc. | | 3,773,968 | 1,031,652 |
| HP, Inc. | | 1,168,000 | 24,283 |
| Western Digital Corp. | | 804,874 | 44,719 |
| Xerox Holdings Corp. | | 920,000 | 29,624 |
| | | | 1,130,278 |
|
| TOTAL INFORMATION TECHNOLOGY | | | 5,023,568 |
|
| MATERIALS - 1.6% | | | |
| Chemicals - 0.9% | | | |
| Air Products & Chemicals, Inc. | | 206,663 | 45,385 |
| Albemarle Corp. U.S. (b) | | 299,078 | 24,480 |
| Amyris, Inc. (a)(b)(f) | | 7,009,659 | 22,326 |
| Amyris, Inc. (d)(f) | | 2,782,258 | 7,975 |
| Ecolab, Inc. | | 199,324 | 35,968 |
| FMC Corp. | | 224,870 | 20,935 |
| Innospec, Inc. | | 238,385 | 20,630 |
| Linde PLC | | 237,991 | 45,459 |
| Livent Corp. (a) | | 5,063,598 | 45,218 |
| Sherwin-Williams Co. | | 40,215 | 20,781 |
| Tronox Holdings PLC | | 1,410,618 | 10,354 |
| | | | 299,511 |
| Construction Materials - 0.1% | | | |
| Martin Marietta Materials, Inc. | | 68,810 | 15,656 |
| Summit Materials, Inc. (a) | | 1,000,485 | 19,549 |
| | | | 35,205 |
| Containers & Packaging - 0.2% | | | |
| Avery Dennison Corp. | | 138,820 | 15,894 |
| Crown Holdings, Inc. (a) | | 616,871 | 43,489 |
| | | | 59,383 |
| Metals & Mining - 0.4% | | | |
| Commercial Metals Co. | | 849,332 | 15,509 |
| First Quantum Minerals Ltd. | | 2,515,389 | 18,590 |
| Freeport-McMoRan, Inc. | | 2,144,866 | 21,363 |
| Kaiser Aluminum Corp. | | 215,040 | 20,332 |
| Newmont Corp. | | 1,137,877 | 50,783 |
| Reliance Steel & Aluminum Co. | | 203,968 | 20,864 |
| | | | 147,441 |
|
| TOTAL MATERIALS | | | 541,540 |
|
| REAL ESTATE - 2.2% | | | |
| Equity Real Estate Investment Trusts (REITs) - 2.1% | | | |
| Alexandria Real Estate Equities, Inc. | | 299,667 | 45,513 |
| American Homes 4 Rent Class A | | 505,532 | 13,088 |
| American Tower Corp. | | 544,312 | 123,450 |
| Ant International Co. Ltd. Class C (a)(d)(e) | | 4,971,128 | 38,327 |
| Corporate Office Properties Trust (SBI) | | 1,171,082 | 29,675 |
| CubeSmart | | 814,048 | 24,641 |
| Digital Realty Trust, Inc. | | 726,885 | 87,306 |
| Equinix, Inc. | | 112,569 | 64,480 |
| Equity Lifestyle Properties, Inc. | | 307,250 | 20,994 |
| Front Yard Residential Corp. Class B | | 2,378,684 | 30,162 |
| Lexington Corporate Properties Trust | | 318,700 | 3,305 |
| Omega Healthcare Investors, Inc. | | 346,770 | 13,732 |
| Potlatch Corp. | | 279,706 | 10,276 |
| Prologis, Inc. | | 1,015,132 | 85,555 |
| Public Storage | | 191,939 | 40,138 |
| Store Capital Corp. | | 220,833 | 7,257 |
| Welltower, Inc. | | 641,344 | 47,985 |
| Weyerhaeuser Co. | | 1,084,905 | 28,186 |
| | | | 714,070 |
| Real Estate Management & Development - 0.1% | | | |
| Cushman & Wakefield PLC (a) | | 1,847,366 | 33,604 |
|
| TOTAL REAL ESTATE | | | 747,674 |
|
| UTILITIES - 2.2% | | | |
| Electric Utilities - 1.4% | | | |
| Edison International | | 1,054,656 | 70,862 |
| Entergy Corp. | | 364,929 | 42,664 |
| Evergy, Inc. | | 648,241 | 42,363 |
| Exelon Corp. | | 2,421,385 | 104,386 |
| FirstEnergy Corp. | | 945,303 | 42,094 |
| NextEra Energy, Inc. | | 591,394 | 149,481 |
| Southern Co. | | 480,894 | 29,027 |
| | | | 480,877 |
| Independent Power and Renewable Electricity Producers - 0.1% | | | |
| NRG Energy, Inc. | | 452,176 | 15,017 |
| The AES Corp. | | 1,068,281 | 17,872 |
| | | | 32,889 |
| Multi-Utilities - 0.7% | | | |
| CenterPoint Energy, Inc. | | 366,698 | 8,441 |
| Dominion Energy, Inc. | | 1,669,764 | 130,542 |
| Sempra Energy | | 665,161 | 92,976 |
| | | | 231,959 |
|
| TOTAL UTILITIES | | | 745,725 |
|
| TOTAL COMMON STOCKS | | | |
| (Cost $17,918,283) | | | 22,419,828 |
| | | Principal Amount (000s) | Value (000s) |
|
| U.S. Treasury Obligations - 0.0% | | | |
| U.S. Treasury Bills, yield at date of purchase 1.53% to 1.54% 3/12/20 to 3/19/20 (g) | | | |
| (Cost $7,855) | | 7,860 | 7,855 |
| | | Shares | Value (000s) |
|
| Fixed-Income Funds - 33.4% | | | |
| Fidelity High Income Central Fund (h) | | 6,202,022 | $675,152 |
| Fidelity Investment Grade Bond Central Fund (h) | | 92,175,913 | 10,656,457 |
| TOTAL FIXED-INCOME FUNDS | | | |
| (Cost $11,025,059) | | | 11,331,609 |
|
| Money Market Funds - 1.7% | | | |
| Fidelity Cash Central Fund 1.60% (i) | | 286,118,128 | 286,175 |
| Fidelity Securities Lending Cash Central Fund 1.60% (i)(j) | | 293,743,364 | 293,773 |
| TOTAL MONEY MARKET FUNDS | | | |
| (Cost $579,903) | | | 579,948 |
| TOTAL INVESTMENT IN SECURITIES - 101.1% | | | |
| (Cost $29,531,100) | | | 34,339,240 |
| NET OTHER ASSETS (LIABILITIES) - (1.1)% | | | (373,647) |
| NET ASSETS - 100% | | | $33,965,593 |
| Futures Contracts | | | | | |
| | Number of contracts | Expiration Date | Notional Amount (000s) | Value (000s) | Unrealized Appreciation/(Depreciation) (000s) |
| Purchased | | | | | |
| Equity Index Contracts | | | | | |
| CME E-mini S&P 500 Index Contracts (United States) | 699 | March 2020 | $103,141 | $(10,255) | $(10,255) |
The notional amount of futures purchased as a percentage of Net Assets is 0.3%
Values shown as $0 in the Schedule of Investments may reflect amounts less than $500.
Legend
(a) Non-income producing
(b) Security or a portion of the security is on loan at period end.
(c) Investment is owned by a wholly-owned subsidiary (Subsidiary) that is treated as a corporation for U.S. tax purposes.
(d) Restricted securities (including private placements) - Investment in securities not registered under the Securities Act of 1933 (excluding 144A issues). At the end of the period, the value of restricted securities (excluding 144A issues) amounted to $62,802,000 or 0.1% of net assets.
(e) Level 3 security
(f) Affiliated company
(g) Security or a portion of the security was pledged to cover margin requirements for futures contracts. At period end, the value of securities pledged amounted to $4,868,000.
(h) Affiliated fund that is generally available only to investment companies and other accounts managed by Fidelity Investments. A complete unaudited schedule of portfolio holdings for each Fidelity Central Fund is filed with the SEC for the first and third quarters of each fiscal year on Form N-PORT and is available upon request or at the SEC's website at www.sec.gov. An unaudited holdings listing for the Fund, which presents direct holdings as well as the pro-rata share of securities and other investments held indirectly through its investment in underlying non-money market Fidelity Central Funds, is available at fidelity.com and/or institutional.fidelity.com, as applicable. In addition, each Fidelity Central Fund's financial statements are available on the SEC's website or upon request.
(i) Affiliated fund that is generally available only to investment companies and other accounts managed by Fidelity Investments. The rate quoted is the annualized seven-day yield of the fund at period end. A complete unaudited listing of the fund's holdings as of its most recent quarter end is available upon request. In addition, each Fidelity Central Fund's financial statements are available on the SEC's website or upon request.
(j) Investment made with cash collateral received from securities on loan.
Additional information on each restricted holding is as follows:
| Security | Acquisition Date | Acquisition Cost (000s) |
| Amyris, Inc. | 2/3/20 | $7,985 |
| Ant International Co. Ltd. Class C | 5/16/18 | $27,888 |
| StepStone Group Holdings LLC | 8/19/19 | $8,250 |
| StepStone Group LP Class A | 8/19/19 | $8,250 |
Affiliated Central Funds
Information regarding fiscal year to date income earned by the Fund from investments in Fidelity Central Funds is as follows:
| Fund | Income earned |
| | (Amounts in thousands) |
| Fidelity Cash Central Fund | $3,719 |
| Fidelity High Income Central Fund | 27,337 |
| Fidelity Investment Grade Bond Central Fund | 136,617 |
| Fidelity Mortgage Backed Securities Central Fund | 5,650 |
| Fidelity Securities Lending Cash Central Fund | 1,340 |
| Total | $174,663 |
Amounts in the income column in the above table include any capital gain distributions from underlying funds, which are presented in the corresponding line-item in the Statement of Operations, if applicable. Amount for Fidelity Securities Lending Cash Central Fund represents the income earned on investing cash collateral, less rebates paid to borrowers and any lending agent fees associated with the loan, plus any premium payments received for lending certain types of securities.
Fiscal year to date information regarding the Fund’s investments in non-Money Market Central Funds, including the ownership percentage, is presented below.
| Fund (Amounts in thousands) | Value, beginning of period | Purchases(a) | Sales Proceeds(a) | Realized Gain/Loss | Change in Unrealized appreciation (depreciation) | Value, end of period | % ownership, end of period |
| Fidelity High Income Central Fund | $758,795 | $186,003 | $256,958 | $10,536 | $(23,224) | $675,152 | 29.0% |
| Fidelity Investment Grade Bond Central Fund | -- | 10,553,922 | 183,890 | 2,433 | 283,992 | 10,656,457 | 37.6% |
| Fidelity Mortgage Backed Securities Central Fund | 2,590,157 | -- | 2,581,907 | 83,354 | (91,604) | -- | 0.0% |
| Total | $3,348,952 | $10,739,925 | $3,022,755 | $96,323 | $169,164 | $11,331,609 | |
(a) Includes the value of shares purchased or redeemed through in-kind transactions, if applicable.
Other Affiliated Issuers
An affiliated company is a company in which the Fund has ownership of at least 5% of the voting securities. Fiscal year to date transactions with companies which are or were affiliates are as follows:
| Affiliate (Amounts in thousands) | Value, beginning of period | Purchases | Sales Proceeds(a) | Dividend Income | Realized Gain (loss) | Change in Unrealized appreciation (depreciation) | Value, end of period |
| Amyris, Inc. | $6,445 | $18,813 | $95 | $-- | $10 | $(2,847) | $22,326 |
| Amyris, Inc. | -- | 7,985 | -- | -- | -- | (10) | 7,975 |
| Sunrun, Inc. | 107,296 | 20,853 | 124,903 | -- | 74,064 | (43,640) | -- |
| Vivint Solar, Inc. | 76,160 | 12,980 | 560 | -- | 390 | 30,434 | 119,404 |
| Total | $189,901 | $60,631 | $125,558 | $-- | $74,464 | $(16,063) | $149,705 |
(a) Includes the value of shares redeemed through in-kind transactions, if applicable.
Investment Valuation
The following is a summary of the inputs used, as of February 29, 2020, involving the Fund's assets and liabilities carried at fair value. The inputs or methodology used for valuing securities may not be an indication of the risk associated with investing in those securities. For more information on valuation inputs, and their aggregation into the levels used below, please refer to the Investment Valuation section in the accompanying Notes to Financial Statements.
| | Valuation Inputs at Reporting Date: |
| Description | Total | Level 1 | Level 2 | Level 3 |
| (Amounts in thousands) | | | | |
| Investments in Securities: | | | | |
| Equities: | | | | |
| Communication Services | $2,297,570 | $2,289,242 | $8,328 | $-- |
| Consumer Discretionary | 2,183,392 | 2,089,819 | 93,573 | -- |
| Consumer Staples | 1,495,759 | 1,464,863 | 30,896 | -- |
| Energy | 847,511 | 789,556 | 57,955 | -- |
| Financials | 2,773,467 | 2,719,452 | 37,515 | 16,500 |
| Health Care | 3,185,646 | 2,985,093 | 200,553 | -- |
| Industrials | 2,577,976 | 2,527,262 | 50,714 | -- |
| Information Technology | 5,023,568 | 5,000,417 | 23,151 | -- |
| Materials | 541,540 | 533,565 | 7,975 | -- |
| Real Estate | 747,674 | 709,347 | -- | 38,327 |
| Utilities | 745,725 | 745,725 | -- | -- |
| U.S. Government and Government Agency Obligations | 7,855 | -- | 7,855 | -- |
| Fixed-Income Funds | 11,331,609 | 11,331,609 | -- | -- |
| Money Market Funds | 579,948 | 579,948 | -- | -- |
| Total Investments in Securities: | $34,339,240 | $33,765,898 | $518,515 | $54,827 |
| Derivative Instruments: | | | | |
| Liabilities | | | | |
| Futures Contracts | $(10,255) | $(10,255) | $-- | $-- |
| Total Liabilities | $(10,255) | $(10,255) | $-- | $-- |
| Total Derivative Instruments: | $(10,255) | $(10,255) | $-- | $-- |
Value of Derivative Instruments
The following table is a summary of the Fund's value of derivative instruments by primary risk exposure as of February 29, 2020. For additional information on derivative instruments, please refer to the Derivative Instruments section in the accompanying Notes to Financial Statements.
| Primary Risk Exposure / Derivative Type | Value |
| | Asset | Liability |
| (Amounts in thousands) | | |
| Equity Risk | | |
| Futures Contracts(a) | $-- | $(10,255) |
| Total Equity Risk | -- | (10,255) |
| Total Value of Derivatives | $-- | $(10,255) |
(a) Reflects gross cumulative appreciation (depreciation) on futures contracts as presented in the Schedule of Investments. In the Statement of Assets and Liabilities, the period end daily variation margin is included in receivable or payable for daily variation margin on futures contracts, and the net cumulative appreciation (depreciation) is included in Total accumulated earnings (loss).
Other Information
The composition of credit quality ratings as a percentage of Total Net Assets is as follows (Unaudited):
| U.S. Government and U.S. Government Agency Obligations | 15.3% |
| AAA,AA,A | 3.9% |
| BBB | 8.9% |
| BB | 2.6% |
| B | 0.5% |
| CCC,CC,C | 0.3% |
| D | 0.1% |
| Not Rated | 0.8% |
| Equities | 66.0% |
| Short-Term Investments and Net Other Assets | 1.6% |
| | 100.0% |
We have used ratings from Moody's Investors Service, Inc. Where Moody's® ratings are not available, we have used S&P® ratings. All ratings are as of the date indicated and do not reflect subsequent changes.
The information in the above tables is based on the combined investments of the fund and its pro-rata share of the investments of Fidelity's Fixed-Income Central Funds
See accompanying notes which are an integral part of the financial statements.
Financial Statements
Statement of Assets and Liabilities
| Amounts in thousands (except per-share amounts) | | February 29, 2020 (Unaudited) |
| Assets | | |
Investment in securities, at value (including securities loaned of $289,492) — See accompanying schedule:
Unaffiliated issuers (cost $17,843,555) | $22,277,978 | |
| Fidelity Central Funds (cost $11,604,962) | 11,911,557 | |
| Other affiliated issuers (cost $82,583) | 149,705 | |
| Total Investment in Securities (cost $29,531,100) | | $34,339,240 |
| Cash | | 1,912 |
| Restricted cash | | 414 |
| Foreign currency held at value (cost $643) | | 643 |
| Receivable for investments sold | | 268,444 |
| Receivable for fund shares sold | | 43,701 |
| Dividends receivable | | 45,573 |
| Distributions receivable from Fidelity Central Funds | | 766 |
| Prepaid expenses | | 30 |
| Other receivables | | 1,597 |
| Total assets | | 34,702,320 |
| Liabilities | | |
| Payable for investments purchased | $262,662 | |
| Payable for fund shares redeemed | 163,194 | |
| Accrued management fee | 11,651 | |
| Payable for daily variation margin on futures contracts | 203 | |
| Other affiliated payables | 3,219 | |
| Other payables and accrued expenses | 2,024 | |
| Collateral on securities loaned | 293,774 | |
| Total liabilities | | 736,727 |
| Net Assets | | $33,965,593 |
| Net Assets consist of: | | |
| Paid in capital | | $28,231,542 |
| Total accumulated earnings (loss) | | 5,734,051 |
| Net Assets | | $33,965,593 |
| Net Asset Value and Maximum Offering Price | | |
| Balanced: | | |
| Net Asset Value, offering price and redemption price per share ($25,901,533 ÷ 1,096,659 shares) | | $23.62 |
| Class K: | | |
| Net Asset Value, offering price and redemption price per share ($8,064,060 ÷ 341,402 shares) | | $23.62 |
See accompanying notes which are an integral part of the financial statements.
Statement of Operations
| Amounts in thousands | | Six months ended February 29, 2020 (Unaudited) |
| Investment Income | | |
| Dividends | | $206,107 |
| Interest | | 20,374 |
| Income from Fidelity Central Funds (including $1,340 from security lending) | | 163,118 |
| Total income | | 389,599 |
| Expenses | | |
| Management fee | $67,039 | |
| Transfer agent fees | 17,922 | |
| Accounting fees | 1,188 | |
| Custodian fees and expenses | 432 | |
| Independent trustees' fees and expenses | 92 | |
| Registration fees | 304 | |
| Audit | 61 | |
| Legal | 31 | |
| Miscellaneous | 89 | |
| Total expenses before reductions | 87,158 | |
| Expense reductions | (712) | |
| Total expenses after reductions | | 86,446 |
| Net investment income (loss) | | 303,153 |
| Realized and Unrealized Gain (Loss) | | |
| Net realized gain (loss) on: | | |
| Investment securities: | | |
| Unaffiliated issuers (net of foreign taxes of $1,055) | 1,148,606 | |
| Redemptions in-kind with affiliated entities | 388,674 | |
| Fidelity Central Funds | 96,323 | |
| Other affiliated issuers | 74,464 | |
| Foreign currency transactions | 111 | |
| Futures contracts | 13,571 | |
| Capital gain distributions from Fidelity Central Funds | 11,545 | |
| Total net realized gain (loss) | | 1,733,294 |
| Change in net unrealized appreciation (depreciation) on: | | |
| Investment securities: | | |
| Unaffiliated issuers (net of increase in deferred foreign taxes of $151) | (890,058) | |
| Fidelity Central Funds | 169,164 | |
| Other affiliated issuers | (16,063) | |
| Assets and liabilities in foreign currencies | 47 | |
| Futures contracts | (11,463) | |
| Total change in net unrealized appreciation (depreciation) | | (748,373) |
| Net gain (loss) | | 984,921 |
| Net increase (decrease) in net assets resulting from operations | | $1,288,074 |
See accompanying notes which are an integral part of the financial statements.
Statement of Changes in Net Assets
| Amounts in thousands | Six months ended February 29, 2020 (Unaudited) | Year ended August 31, 2019 |
| Increase (Decrease) in Net Assets | | |
| Operations | | |
| Net investment income (loss) | $303,153 | $599,006 |
| Net realized gain (loss) | 1,733,294 | 510,456 |
| Change in net unrealized appreciation (depreciation) | (748,373) | (335,278) |
| Net increase (decrease) in net assets resulting from operations | 1,288,074 | 774,184 |
| Distributions to shareholders | (1,198,014) | (3,135,825) |
| Share transactions - net increase (decrease) | 476,716 | 1,514,959 |
| Total increase (decrease) in net assets | 566,776 | (846,682) |
| Net Assets | | |
| Beginning of period | 33,398,817 | 34,245,499 |
| End of period | $33,965,593 | $33,398,817 |
See accompanying notes which are an integral part of the financial statements.
Financial Highlights
Fidelity Balanced Fund
| | Six months ended (Unaudited) February 29, | Years endedAugust 31, | | | | |
| | 2020 | 2019 | 2018 | 2017 | 2016 | 2015 |
| Selected Per–Share Data | | | | | | |
| Net asset value, beginning of period | $23.54 | $25.33 | $24.27 | $22.32 | $22.33 | $24.40 |
| Income from Investment Operations | | | | | | |
| Net investment income (loss)A | .21 | .42 | .38 | .38 | .37 | .37 |
| Net realized and unrealized gain (loss) | .71 | .08 | 2.55 | 2.26 | 1.25 | (.23) |
| Total from investment operations | .92 | .50 | 2.93 | 2.64 | 1.62 | .14 |
| Distributions from net investment income | (.22) | (.40) | (.37) | (.37) | (.36) | (.35) |
| Distributions from net realized gain | (.62) | (1.89) | (1.50) | (.32) | (1.27) | (1.86) |
| Total distributions | (.84) | (2.29) | (1.87) | (.69) | (1.63) | (2.21) |
| Net asset value, end of period | $23.62 | $23.54 | $25.33 | $24.27 | $22.32 | $22.33 |
| Total ReturnB,C | 3.89% | 2.61% | 12.78% | 12.12% | 7.73% | .86% |
| Ratios to Average Net AssetsD,E | | | | | | |
| Expenses before reductions | .52%F | .53% | .53% | .55% | .55% | .56% |
| Expenses net of fee waivers, if any | .52%F | .53% | .53% | .54% | .55% | .55% |
| Expenses net of all reductions | .51%F | .53% | .53% | .54% | .55% | .55% |
| Net investment income (loss) | 1.72%F | 1.82% | 1.55% | 1.65% | 1.71% | 1.59% |
| Supplemental Data | | | | | | |
| Net assets, end of period (in millions) | $25,902 | $24,969 | $25,088 | $22,915 | $20,840 | $20,176 |
| Portfolio turnover rateG | 111%F,H | 60% | 66%H | 91% | 64% | 128% |
A Calculated based on average shares outstanding during the period.
B Total returns for periods of less than one year are not annualized.
C Total returns would have been lower if certain expenses had not been reduced during the applicable periods shown.
D Fees and expenses of any underlying Fidelity Central Funds are not included in the Fund's expense ratio. The Fund indirectly bears its proportionate share of the expenses of any underlying Fidelity Central Funds. Based on their most recent shareholder report date, the expenses of any underlying non-money market Fidelity Central Funds ranged from less than .005% to .01%.
E Expense ratios reflect operating expenses of the class. Expenses before reductions do not reflect amounts reimbursed by the investment adviser or reductions from brokerage service arrangements or reductions from other expense offset arrangements and do not represent the amount paid by the class during periods when reimbursements or reductions occur. Expenses net of fee waivers reflect expenses after reimbursement by the investment adviser but prior to reductions from brokerage service arrangements or other expense offset arrangements. Expenses net of all reductions represent the net expenses paid by the class.
F Annualized
G Amount does not include the portfolio activity of any underlying Fidelity Central Funds.
H Portfolio turnover rate excludes securities received or delivered in-kind.
See accompanying notes which are an integral part of the financial statements.
Fidelity Balanced Fund Class K
| | Six months ended (Unaudited) February 29, | Years endedAugust 31, | | | | |
| | 2020 | 2019 | 2018 | 2017 | 2016 | 2015 |
| Selected Per–Share Data | | | | | | |
| Net asset value, beginning of period | $23.55 | $25.33 | $24.27 | $22.32 | $22.33 | $24.40 |
| Income from Investment Operations | | | | | | |
| Net investment income (loss)A | .22 | .44 | .40 | .40 | .39 | .39 |
| Net realized and unrealized gain (loss) | .70 | .09 | 2.55 | 2.26 | 1.25 | (.23) |
| Total from investment operations | .92 | .53 | 2.95 | 2.66 | 1.64 | .16 |
| Distributions from net investment income | (.23) | (.42) | (.39) | (.39) | (.38) | (.37) |
| Distributions from net realized gain | (.62) | (1.89) | (1.50) | (.32) | (1.27) | (1.86) |
| Total distributions | (.85) | (2.31) | (1.89) | (.71) | (1.65) | (2.23) |
| Net asset value, end of period | $23.62 | $23.55 | $25.33 | $24.27 | $22.32 | $22.33 |
| Total ReturnB,C | 3.89% | 2.74% | 12.87% | 12.22% | 7.84% | .95% |
| Ratios to Average Net AssetsD,E | | | | | | |
| Expenses before reductions | .44%F | .45% | .45% | .46% | .46% | .46% |
| Expenses net of fee waivers, if any | .44%F | .45% | .45% | .45% | .46% | .46% |
| Expenses net of all reductions | .44%F | .44% | .44% | .45% | .45% | .46% |
| Net investment income (loss) | 1.80%F | 1.91% | 1.63% | 1.74% | 1.81% | 1.68% |
| Supplemental Data | | | | | | |
| Net assets, end of period (in millions) | $8,064 | $8,429 | $9,157 | $8,536 | $7,984 | $7,695 |
| Portfolio turnover rateG | 111%F,H | 60% | 66%H | 91% | 64% | 128% |
A Calculated based on average shares outstanding during the period.
B Total returns for periods of less than one year are not annualized.
C Total returns would have been lower if certain expenses had not been reduced during the applicable periods shown.
D Fees and expenses of any underlying Fidelity Central Funds are not included in the Fund's expense ratio. The Fund indirectly bears its proportionate share of the expenses of any underlying Fidelity Central Funds. Based on their most recent shareholder report date, the expenses of any underlying non-money market Fidelity Central Funds ranged from less than .005% to .01%.
E Expense ratios reflect operating expenses of the class. Expenses before reductions do not reflect amounts reimbursed by the investment adviser or reductions from brokerage service arrangements or reductions from other expense offset arrangements and do not represent the amount paid by the class during periods when reimbursements or reductions occur. Expenses net of fee waivers reflect expenses after reimbursement by the investment adviser but prior to reductions from brokerage service arrangements or other expense offset arrangements. Expenses net of all reductions represent the net expenses paid by the class.
F Annualized
G Amount does not include the portfolio activity of any underlying Fidelity Central Funds.
H Portfolio turnover rate excludes securities received or delivered in-kind.
See accompanying notes which are an integral part of the financial statements.
Notes to Financial Statements (Unaudited)
For the period ended February 29, 2020
(Amounts in thousands except percentages)
1. Organization.
Fidelity Balanced Fund (the Fund) is a fund of Fidelity Puritan Trust (the Trust) and is authorized to issue an unlimited number of shares. The Trust is registered under the Investment Company Act of 1940, as amended (the 1940 Act), as an open-end management investment company organized as a Massachusetts business trust. The Fund offers Balanced and Class K shares, each of which has equal rights as to assets and voting privileges. Each class has exclusive voting rights with respect to matters that affect that class.
Effective January 1, 2020:
Investment advisers Fidelity Investments Money Management, Inc., FMR Co., Inc., and Fidelity SelectCo, LLC, merged with and into Fidelity Management & Research Company. In connection with the merger transactions, the resulting, merged investment adviser was then redomiciled from Massachusetts to Delaware, changed its corporate structure from a corporation to a limited liability company, and changed its name to "Fidelity Management & Research Company LLC".
Fidelity Investments Institutional Operations Company, Inc. converted from a Massachusetts corporation to a Massachusetts LLC, and changed its name to "Fidelity Investments Institutional Operations Company LLC".
2. Investments in Fidelity Central Funds.
The Fund invests in Fidelity Central Funds, which are open-end investment companies generally available only to other investment companies and accounts managed by the investment adviser and its affiliates. The Fund's Schedule of Investments lists each of the Fidelity Central Funds held as of period end, if any, as an investment of the Fund, but does not include the underlying holdings of each Fidelity Central Fund. As an Investing Fund, the Fund indirectly bears its proportionate share of the expenses of the underlying Fidelity Central Funds.
Based on its investment objective, each Fidelity Central Fund may invest or participate in various investment vehicles or strategies that are similar to those of the Fund. These strategies are consistent with the investment objectives of the Fund and may involve certain economic risks which may cause a decline in value of each of the Fidelity Central Funds and thus a decline in the value of the Fund. The Money Market Central Funds seek preservation of capital and current income and are managed by the investment adviser. Annualized expenses of the Money Market Central Funds as of their most recent shareholder report date ranged from less than .005% to .01%. The following summarizes the Fund's investment in each non-money market Fidelity Central Fund.
| Fidelity Central Fund | Investment Manager | Investment Objective | Investment Practices | Expense Ratio(a) |
| Fidelity High Income Central Fund | FMR | Seeks a high level of income and may also seek capital appreciation by investing primarily in debt securities, preferred stocks, and convertible securities, with an emphasis on lower-quality debt securities. | Delayed Delivery & When Issued Securities
Loans & Direct Debt Instruments
Restricted Securities
| Less than .005% |
| Fidelity Mortgage Backed Securities Central Fund | FMR | Seeks a high level of income by normally investing in investment-grade mortgage-related securities and repurchase agreements for those securities. | Delayed Delivery & When Issued Securities
Futures
Options
Swaps | .01% |
| Fidelity Investment Grade Bond Central Fund | FMR | Seeks a high level of income by normally investing in investment–grade debt securities. | Delayed Delivery & When Issued Securities
Restricted Securities
Swaps | Less than .005% |
(a) Expenses expressed as a percentage of average net assets and are as of each underlying Central Fund's most recent annual or semi-annual shareholder report.
An unaudited holdings listing for the Fund, which presents direct holdings as well as the pro-rata share of any securities and other investments held indirectly through its investment in underlying non-money market Fidelity Central Funds, is available at fidelity.com. A complete unaudited list of holdings for each Fidelity Central Fund is available upon request or at the Securities and Exchange Commission (the SEC) website at www.sec.gov. In addition, the financial statements of the Fidelity Central Funds which contain the significant accounting policies (including investment valuation policies) of those funds are available on the SEC website or upon request.
3. Significant Accounting Policies.
The Fund is an investment company and applies the accounting and reporting guidance of the Financial Accounting Standards Board (FASB) Accounting Standards Codification Topic 946 Financial Services – Investments Companies. The financial statements have been prepared in conformity with accounting principles generally accepted in the United States of America (GAAP), which require management to make certain estimates and assumptions at the date of the financial statements. Actual results could differ from those estimates. Subsequent events, if any, through the date that the financial statements were issued have been evaluated in the preparation of the financial statements. The following summarizes the significant accounting policies of the Fund:
Investment Valuation. Investments are valued as of 4:00 p.m. Eastern time on the last calendar day of the period. The Board of Trustees (the Board) has delegated the day to day responsibility for the valuation of the Fund's investments to the Fair Value Committee (the Committee) established by the Fund's investment adviser. In accordance with valuation policies and procedures approved by the Board, the Fund attempts to obtain prices from one or more third party pricing vendors or brokers to value its investments. When current market prices, quotations or currency exchange rates are not readily available or reliable, investments will be fair valued in good faith by the Committee, in accordance with procedures adopted by the Board. Factors used in determining fair value vary by investment type and may include market or investment specific events, changes in interest rates and credit quality. The frequency with which these procedures are used cannot be predicted and they may be utilized to a significant extent. The Committee oversees the Fund's valuation policies and procedures and reports to the Board on the Committee's activities and fair value determinations. The Board monitors the appropriateness of the procedures used in valuing the Fund's investments and ratifies the fair value determinations of the Committee.
The Fund categorizes the inputs to valuation techniques used to value its investments into a disclosure hierarchy consisting of three levels as shown below:
- Level 1 – quoted prices in active markets for identical investments
- Level 2 – other significant observable inputs (including quoted prices for similar investments, interest rates, prepayment speeds, etc.)
- Level 3 – unobservable inputs (including the Fund's own assumptions based on the best information available)
Valuation techniques used to value the Fund's investments by major category are as follows:
Equity securities, including restricted securities, for which market quotations are readily available, are valued at the last reported sale price or official closing price as reported by a third party pricing vendor on the primary market or exchange on which they are traded and are categorized as Level 1 in the hierarchy. In the event there were no sales during the day or closing prices are not available, securities are valued at the last quoted bid price or may be valued using the last available price and are generally categorized as Level 2 in the hierarchy. For foreign equity securities, when market or security specific events arise, comparisons to the valuation of American Depositary Receipts (ADRs), futures contracts, Exchange-Traded Funds (ETFs) and certain indexes as well as quoted prices for similar securities may be used and would be categorized as Level 2 in the hierarchy. For equity securities, including restricted securities, where observable inputs are limited, assumptions about market activity and risk are used and these securities may be categorized as Level 3 in the hierarchy.
Debt securities, including restricted securities, are valued based on evaluated prices received from third party pricing vendors or from brokers who make markets in such securities. U.S. government and government agency obligations are valued by pricing vendors who utilize matrix pricing which considers yield or price of bonds of comparable quality, coupon, maturity and type or by broker-supplied prices. When independent prices are unavailable or unreliable, debt securities may be valued utilizing pricing methodologies which consider similar factors that would be used by third party pricing vendors. Debt securities are generally categorized as Level 2 in the hierarchy but may be Level 3 depending on the circumstances.
Futures contracts are valued at the settlement price established each day by the board of trade or exchange on which they are traded and are categorized as Level 1 in the hierarchy. Investments in open-end mutual funds, including the Fidelity Central Funds, are valued at their closing net asset value (NAV) each business day and are categorized as Level 1 in the hierarchy.
Changes in valuation techniques may result in transfers in or out of an assigned level within the disclosure hierarchy. The aggregate value of investments by input level as of February 29, 2020 is included at the end of the Fund's Schedule of Investments.
Foreign Currency. The Fund may use foreign currency contracts to facilitate transactions in foreign-denominated securities. Gains and losses from these transactions may arise from changes in the value of the foreign currency or if the counterparties do not perform under the contracts' terms.
Foreign-denominated assets, including investment securities, and liabilities are translated into U.S. dollars at the exchange rates at period end. Purchases and sales of investment securities, income and dividends received and expenses denominated in foreign currencies are translated into U.S. dollars at the exchange rate in effect on the transaction date.
The effects of exchange rate fluctuations on investments are included with the net realized and unrealized gain (loss) on investment securities. Other foreign currency transactions resulting in realized and unrealized gain (loss) are disclosed separately.
Investment Transactions and Income. For financial reporting purposes, the Fund's investment holdings and NAV include trades executed through the end of the last business day of the period. The NAV per share for processing shareholder transactions is calculated as of the close of business of the New York Stock Exchange (NYSE), normally 4:00 p.m. Eastern time and includes trades executed through the end of the prior business day. Gains and losses on securities sold are determined on the basis of identified cost and include proceeds received from litigation. Dividend income is recorded on the ex-dividend date, except for certain dividends from foreign securities where the ex-dividend date may have passed, which are recorded as soon as the Fund is informed of the ex-dividend date. Non-cash dividends included in dividend income, if any, are recorded at the fair market value of the securities received. Income and capital gain distributions from Fidelity Central Funds, if any, are recorded on the ex-dividend date. Certain distributions received by the Fund represent a return of capital or capital gain. The Fund determines the components of these distributions subsequent to the ex-dividend date, based upon receipt of tax filings or other correspondence relating to the underlying investment. These distributions are recorded as a reduction of cost of investments and/or as a realized gain. Interest income is accrued as earned and includes coupon interest and amortization of premium and accretion of discount on debt securities as applicable. The principal amount on inflation-indexed securities is periodically adjusted to the rate of inflation and interest is accrued based on the principal amount. The adjustments to principal due to inflation are reflected as increases or decreases to Interest in the accompanying Statement of Operations. Investment income is recorded net of foreign taxes withheld where recovery of such taxes is uncertain.
Class Allocations and Expenses. Investment income, realized and unrealized capital gains and losses, common expenses of the Fund, and certain fund-level expense reductions, if any, are allocated daily on a pro-rata basis to each class based on the relative net assets of each class to the total net assets of the Fund. Each class differs with respect to transfer agent fees incurred. Certain expense reductions may also differ by class. For the reporting period, the allocated portion of income and expenses to each class as a percent of its average net assets may vary due to the timing of recording these transactions in relation to fluctuating net assets of the classes. Expenses directly attributable to a fund are charged to that fund. Expenses attributable to more than one fund are allocated among the respective funds on the basis of relative net assets or other appropriate methods. Expense estimates are accrued in the period to which they relate and adjustments are made when actual amounts are known.
Deferred Trustee Compensation. Under a Deferred Compensation Plan (the Plan) for the Fund, certain independent Trustees have elected to defer receipt of a portion of their annual compensation. Deferred amounts are invested in a cross-section of Fidelity funds, are marked-to-market and remain in the Fund until distributed in accordance with the Plan. The investment of deferred amounts and the offsetting payable to the Trustees of $1,406 are included in the accompanying Statement of Assets and Liabilities in other receivables and other payables and accrued expenses, respectively.
Income Tax Information and Distributions to Shareholders. Each year, the Fund intends to qualify as a regulated investment company under Subchapter M of the Internal Revenue Code, including distributing substantially all of its taxable income and realized gains. As a result, no provision for U.S. Federal income taxes is required. The Fund files a U.S. federal tax return, in addition to state and local tax returns as required. The Fund's federal income tax returns are subject to examination by the Internal Revenue Service (IRS) for a period of three fiscal years after they are filed. State and local tax returns may be subject to examination for an additional fiscal year depending on the jurisdiction. Foreign taxes are provided for based on the Fund's understanding of the tax rules and rates that exist in the foreign markets in which it invests. The Fund is subject to a tax imposed on capital gains by certain countries in which it invests. An estimated deferred tax liability for net unrealized appreciation on the applicable securities is included in Other payables and accrued expenses on the Statement of Assets & Liabilities.
Distributions are declared and recorded on the ex-dividend date. Income and capital gain distributions are declared separately for each class. Income and capital gain distributions are determined in accordance with income tax regulations, which may differ from GAAP.
Capital accounts within the financial statements are adjusted for permanent book-tax differences. These adjustments have no impact on net assets or the results of operations. Capital accounts are not adjusted for temporary book-tax differences which will reverse in a subsequent period.
Book-tax differences are primarily due to futures contracts, swaps, foreign currency transactions, passive foreign investment companies (PFIC), market discount, short-term gain distributions from the Underlying Funds, partnerships, deferred trustees compensation and losses deferred due to wash sales.
As of period end, the cost and unrealized appreciation (depreciation) in securities, and derivatives if applicable, for federal income tax purposes were as follows:
| Gross unrealized appreciation | $5,863,469 |
| Gross unrealized depreciation | (1,160,292) |
| Net unrealized appreciation (depreciation) | $4,703,177 |
| Tax cost | $29,625,808 |
Restricted Securities. The Fund may invest in securities that are subject to legal or contractual restrictions on resale. These securities generally may be resold in transactions exempt from registration or to the public if the securities are registered. Disposal of these securities may involve time-consuming negotiations and expense, and prompt sale at an acceptable price may be difficult. Information regarding restricted securities is included at the end of the Fund's Schedule of Investments.
Consolidated Subsidiary. The Fund invests in certain investments through a wholly-owned subsidiary ("Subsidiary"), which may be subject to federal and state taxes upon disposition.
As of period end, the Fund held an investment of $16,914 in this Subsidiary, representing .05% of the Fund's net assets. The financial statements have been consolidated and include accounts of the Fund and the Subsidiary. Accordingly, all inter-company transactions and balances have been eliminated.
Any cash held by the Subsidiary is restricted as to its use and is presented as Restricted cash in the Statement of Assets and Liabilities.
4. Derivative Instruments.
Risk Exposures and the Use of Derivative Instruments. The Fund's investment objective allows the Fund to enter into various types of derivative contracts, including futures contracts and swaps. Derivatives are investments whose value is primarily derived from underlying assets, indices or reference rates and may be transacted on an exchange or over-the-counter (OTC). Derivatives may involve a future commitment to buy or sell a specified asset based on specified terms, to exchange future cash flows at periodic intervals based on a notional principal amount, or for one party to make one or more payments upon the occurrence of specified events in exchange for periodic payments from the other party.
The Fund used derivatives to increase returns, to gain exposure to certain types of assets and to manage exposure to certain risks as defined below. The success of any strategy involving derivatives depends on analysis of numerous economic factors, and if the strategies for investment do not work as intended, the Fund may not achieve its objectives.
The Fund's use of derivatives increased or decreased its exposure to the following risk:
| Equity Risk | Equity risk relates to the fluctuations in the value of financial instruments as a result of changes in market prices (other than those arising from interest rate risk or foreign exchange risk), whether caused by factors specific to an individual investment, its issuer, or all factors affecting all instruments traded in a market or market segment.
|
The Fund is also exposed to additional risks from investing in derivatives, such as liquidity risk and counterparty credit risk. Liquidity risk is the risk that the Fund will be unable to close out the derivative in the open market in a timely manner. Counterparty credit risk is the risk that the counterparty will not be able to fulfill its obligation to the Fund. Counterparty credit risk related to exchange-traded futures contracts may be mitigated by the protection provided by the exchange on which they trade.
Investing in derivatives may involve greater risks than investing in the underlying assets directly and, to varying degrees, may involve risk of loss in excess of any initial investment and collateral received and amounts recognized in the Statement of Assets and Liabilities. In addition, there may be the risk that the change in value of the derivative contract does not correspond to the change in value of the underlying instrument.
Futures Contracts. A futures contract is an agreement between two parties to buy or sell a specified underlying instrument for a fixed price at a specified future date. The Fund used futures contracts to manage its exposure to the stock market.
Upon entering into a futures contract, a fund is required to deposit either cash or securities (initial margin) with a clearing broker in an amount equal to a certain percentage of the face value of the contract. Futures contracts are marked-to-market daily and subsequent daily payments (variation margin) are made or received by a fund depending on the daily fluctuations in the value of the futures contracts and are recorded as unrealized appreciation or (depreciation). This receivable and/or payable, if any, is included in daily variation margin on futures contracts in the Statement of Assets and Liabilities. Realized gain or (loss) is recorded upon the expiration or closing of a futures contract. The net realized gain (loss) and change in net unrealized appreciation (depreciation) on futures contracts during the period is presented in the Statement of Operations.
Any open futures contracts at period end are presented in the Schedule of Investments under the caption "Futures Contracts". The notional amount at value reflects each contract's exposure to the underlying instrument or index at period end and is representative of volume of activity during the period. Securities deposited to meet initial margin requirements are identified in the Schedule of Investments.
5. Purchases and Sales of Investments.
Purchases and sales of securities, other than short-term securities, U.S. government securities and certain in-kind transactions, are noted in the table below.
| | Purchases ($) | Sales ($) |
| Fidelity Balanced Fund | 19,786,459 | 16,517,861 |
Unaffiliated Redemptions In-Kind. During the period, 11,524 shares of the Fund were redeemed in-kind for investments and cash with a value of $276,641. The net realized gain of $72,548 on investments delivered through in-kind redemptions is included in the accompanying Statement of Operations. The amount of the in-kind redemptions is included in share transactions in the accompanying Statement of Changes in Net Assets as well as the Notes to Financial Statements. The Fund recognized no gain or loss for federal income tax purposes.
6. Fees and Other Transactions with Affiliates.
Management Fee. Fidelity Management & Research Company LLC (the investment adviser) and its affiliates provide the Fund with investment management related services for which the Fund pays a monthly management fee. The management fee is the sum of an individual fund fee rate that is based on an annual rate of .15% of the Fund's average net assets and an annualized group fee rate that averaged .24% during the period. The group fee rate is based upon the monthly average net assets of a group of registered investment companies with which the investment adviser has management contracts. The group fee rate decreases as assets under management increase and increases as assets under management decrease. For the reporting period, the total annualized management fee rate was .38% of the Fund's average net assets.
Transfer Agent Fees. Fidelity Investments Institutional Operations Company LLC (FIIOC), an affiliate of the investment adviser, is the transfer, dividend disbursing and shareholder servicing agent for each class of the Fund. FIIOC receives account fees and asset-based fees that vary according to the account size and type of account of the shareholders of Balanced, except for Class K. FIIOC receives an asset-based fee of Class K's average net assets. FIIOC pays for typesetting, printing and mailing of shareholder reports, except proxy statements. Effective February 1, 2020, the Board approved to change the fee for Class K from .046% to .044%.
For the period, transfer agent fees for each class were as follows:
| | Amount | % of Class-Level Average Net Assets(a) |
| Balanced | $16,068 | .12 |
| Class K | 1,854 | .04 |
| | $17,922 | |
(a) Annualized
Accounting Fees. Fidelity Service Company, Inc. (FSC), an affiliate of the investment adviser, maintains the Fund's accounting records. The accounting fee is based on the level of average net assets for each month. For the period, the fees were equivalent to the following annualized rates:
| | % of Average Net Assets |
| Fidelity Balanced Fund | .01 |
Brokerage Commissions. A portion of portfolio transactions were placed with brokerage firms which are affiliates of the investment adviser. Brokerage commissions are included in net realized gain (loss) and change in net unrealized appreciation (depreciation) in the Statement of Operations. The commissions paid to these affiliated firms were as follows:
| | Amount |
| Fidelity Balanced Fund | $279 |
Interfund Trades. Funds may purchase from or sell securities to other Fidelity Funds under procedures adopted by the Board. The procedures have been designed to ensure these interfund trades are executed in accordance with Rule 17a-7 of the 1940 Act. Interfund trades are included within the respective purchases and sales amounts shown in the Purchases and Sales of Investments note.
Other. During the period, the investment adviser reimbursed the Fund for certain losses in the amount of $222.
Affiliated Exchanges In-Kind. During the period, the Fund completed exchanges in-kind with Fidelity Investment Grade Bond Central Fund. The Fund delivered investments, including accrued interest, and cash valued at $7,636,082 to Fidelity Investment Grade Bond Central Fund in exchange for 67,868 shares. The net realized gain of $388,674 on investments delivered through in-kind redemptions is included in the accompanying Statement of Operations. The Fund recognized gains for federal income tax purposes.
In addition, the Fund redeemed 23,570 shares of Fidelity Mortgage Backed Securities Central Fund in exchange for investments and cash with a value of $2,581,907 and a non-taxable exchange of those investments for 22,948 shares of Fidelity Investment Grade Bond Central Fund. The net realized gains of $83,354 on the Fund's redemptions of Fidelity Mortgage Backed Securities Central Fund shares are included in "Net realized gain (loss) on Investment securities: Fidelity Central Funds" in the accompanying Statement of Operations. The Fund recognized gains on the redemption of Fidelity Mortgage Backed Securities Central Fund for federal income tax purposes.
7. Committed Line of Credit.
Certain Funds participate with other funds managed by the investment adviser or an affiliate in a $4.25 billion credit facility (the "line of credit") to be utilized for temporary or emergency purposes to fund shareholder redemptions or for other short-term liquidity purposes. The participating funds have agreed to pay commitment fees on their pro-rata portion of the line of credit, which are reflected in Miscellaneous expenses on the Statement of Operations, and are as follows:
| | Amount |
| Fidelity Balanced Fund | $41 |
During the period, there were no borrowings on this line of credit.
8. Security Lending.
The Fund lends portfolio securities from time to time in order to earn additional income. For equity securities, lending agents are used, including National Financial Services (NFS), an affiliate of the Fund. Pursuant to a securities lending agreement, NFS will receive a fee, which is capped at 9.9% of daily lending revenue, for its services as lending agent. The Fund may lend securities to certain qualified borrowers, including NFS. On the settlement date of the loan, the Fund receives collateral (in the form of U.S. Treasury obligations, letters of credit and/or cash) against the loaned securities and maintains collateral in an amount not less than 100% of the market value of the loaned securities during the period of the loan. The market value of the loaned securities is determined at the close of business of the Fund and any additional required collateral is delivered to the Fund on the next business day. The Fund or borrower may terminate the loan at any time, and if the borrower defaults on its obligation to return the securities loaned because of insolvency or other reasons, the Fund may apply collateral received from the borrower against the obligation. The Fund may experience delays and costs in recovering the securities loaned. Any cash collateral received is invested in the Fidelity Securities Lending Cash Central Fund. The value of loaned securities and cash collateral at period end are disclosed on the Fund's Statement of Assets and Liabilities. At period end, there were no security loans outstanding with NFS, as affiliated borrower. Total fees paid by the Fund to NFS, as lending agent, amounted to $136. Security lending income represents the income earned on investing cash collateral, less rebates paid to borrowers and any lending agent fees associated with the loan, plus any premium payments received for lending certain types of securities. Security lending income is presented in the Statement of Operations as a component of income from Fidelity Central Funds, and includes less than five hundred dollars from securities loaned to NFS, as affiliated borrower.
9. Expense Reductions.
Commissions paid to certain brokers with whom the investment adviser, or its affiliates, places trades on behalf of the Fund include an amount in addition to trade execution, which may be rebated back to the Fund to offset certain expenses. This amount totaled $631 for the period. In addition, through arrangements with the Fund's custodian, credits realized as a result of certain uninvested cash balances were used to reduce the Fund's expenses. During the period, custodian credits reduced the Fund's expenses by $10. During the period, transfer agent credits reduced each class' expenses as noted in the table below.
| | Expense reduction |
| Balanced | $1 |
In addition, during the period the investment adviser or an affiliate reimbursed and/or waived a portion of fund-level operating expenses in the amount of $70.
10. Distributions to Shareholders.
Distributions to shareholders of each class were as follows:
| | Six months ended
February 29, 2020 | Year ended
August 31, 2019 |
| Distributions to shareholders | | |
| Balanced | $902,928 | $2,302,966 |
| Class K | 295,086 | 832,859 |
| Total | $1,198,014 | $3,135,825 |
11. Share Transactions.
Share transactions for each class were as follows and may contain automatic conversions between classes or exchanges between affiliated funds:
| | Shares | Shares | Dollars | Dollars |
| | Six months ended February 29, 2020 | Year ended August 31, 2019 | Six months ended February 29, 2020 | Year ended August 31, 2019 |
| Balanced | | | | |
| Shares sold | 90,704 | 148,956 | $2,220,591 | $3,403,373 |
| Reinvestment of distributions | 35,558 | 97,405 | 854,434 | 2,184,283 |
| Shares redeemed | (90,111) | (176,229) | (2,197,543) | (3,985,668) |
| Net increase (decrease) | 36,151 | 70,132 | $877,482 | $1,601,988 |
| Class K | | | | |
| Shares sold | 25,215 | 50,621 | $616,399 | $1,153,250 |
| Reinvestment of distributions | 12,282 | 37,144 | 295,086 | 832,859 |
| Shares redeemed | (54,077) | (91,238) | (1,312,251) | (2,073,138) |
| Net increase (decrease) | (16,580) | (3,473) | $(400,766) | $(87,029) |
12. Other.
The Fund's organizational documents provide former and current trustees and officers with a limited indemnification against liabilities arising in connection with the performance of their duties to the Fund. In the normal course of business, the Fund may also enter into contracts that provide general indemnifications. The Fund's maximum exposure under these arrangements is unknown as this would be dependent on future claims that may be made against the Fund. The risk of material loss from such claims is considered remote.
13. Coronavirus (COVID-19) Pandemic.
An outbreak of COVID-19 first detected in China during December 2019 has since spread globally and was declared a pandemic by the World Health Organization during March 2020. Developments that disrupt global economies and financial markets, such as the COVID-19 pandemic, may magnify factors that affect the Fund's performance.
Shareholder Expense Example
As a shareholder of the Fund, you incur two types of costs: (1) transaction costs and (2) ongoing costs, including management fees and other Fund expenses. This Example is intended to help you understand your ongoing costs (in dollars) of investing in the Fund and to compare these costs with the ongoing costs of investing in other mutual funds.
The Example is based on an investment of $1,000 invested at the beginning of the period and held for the entire period (September 1, 2019 to February 29, 2020).
Actual Expenses
The first line of the accompanying table for each class of the Fund provides information about actual account values and actual expenses. You may use the information in this line, together with the amount you invested, to estimate the expenses that you paid over the period. Simply divide your account value by $1,000.00 (for example, an $8,600 account value divided by $1,000.00 = 8.6), then multiply the result by the number in the first line for a class of the Fund under the heading entitled "Expenses Paid During Period" to estimate the expenses you paid on your account during this period. In addition, the Fund, as a shareholder in the underlying Fidelity Central Funds, will indirectly bear its pro-rata share of the fees and expenses incurred by the underlying Fidelity Central Funds. These fees and expenses are not included in the Fund's annualized expense ratio used to calculate the expense estimate in the table below.
Hypothetical Example for Comparison Purposes
The second line of the accompanying table for each class of the Fund provides information about hypothetical account values and hypothetical expenses based on a Class' actual expense ratio and an assumed rate of return of 5% per year before expenses, which is not the Class' actual return. The hypothetical account values and expenses may not be used to estimate the actual ending account balance or expenses you paid for the period. You may use this information to compare the ongoing costs of investing in the Fund and other funds. To do so, compare this 5% hypothetical example with the 5% hypothetical examples that appear in the shareholder reports of the other funds. In addition, the Fund, as a shareholder in the underlying Fidelity Central Funds, will indirectly bear its pro-rata share of the fees and expenses incurred by the underlying Fidelity Central Funds. These fees and expenses are not included in the Fund's annualized expense ratio used to calculate the expense estimate in the table below.
Please note that the expenses shown in the table are meant to highlight your ongoing costs only and do not reflect any transaction costs. Therefore, the second line of the table is useful in comparing ongoing costs only, and will not help you determine the relative total costs of owning different funds.
| | Annualized Expense Ratio-A | Beginning
Account Value
September 1, 2019 | Ending
Account Value
February 29, 2020 | Expenses Paid
During Period-B
September 1, 2019
to February 29, 2020 |
| Balanced | .52% | | | |
| Actual | | $1,000.00 | $1,038.90 | $2.64 |
| Hypothetical-C | | $1,000.00 | $1,022.28 | $2.61 |
| Class K | .44% | | | |
| Actual | | $1,000.00 | $1,038.90 | $2.23 |
| Hypothetical-C | | $1,000.00 | $1,022.68 | $2.21 |
A Annualized expense ratio reflects expenses net of applicable fee waivers.
B Expenses are equal to each Class' annualized expense ratio, multiplied by the average account value over the period, multiplied by 182/366 (to reflect the one-half year period). The fees and expenses of the underlying Fidelity Central Funds in which the Fund invests are not included in each Class' annualized expense ratio. In addition to the expenses noted above, the Fund also indirectly bears its proportional share of the expenses of the underlying Fidelity Central Funds. Annualized expenses of the underlying non-money market Fidelity Central Funds as of their most recent fiscal half year ranged from less than .005% to .01%.
C 5% return per year before expenses
Board Approval of Investment Advisory Contracts and Management Fees
Fidelity Balanced Fund
Each year, the Board of Trustees, including the Independent Trustees (together, the Board), votes on the renewal of the management contract with Fidelity Management & Research Company LLC (FMR) and the sub-advisory agreements (together, the Advisory Contracts) for the fund. FMR and the sub-advisers are referred to herein as the Investment Advisers. The Board, assisted by the advice of fund counsel and Independent Trustees' counsel, requests and considers a broad range of information relevant to the renewal of the Advisory Contracts throughout the year.
Approval of Amended and Restated Advisory Contracts. At its November 2019 meeting, the Board unanimously determined to approve an amended and restated management contract and sub-advisory agreements (Amended and Restated Contracts) for a stub period of January 1, 2020 through January 31, 2020 in connection with a consolidation of certain of Fidelity's advisory businesses. The Board considered that, on or about January 1, 2020, FMR Co., Inc. (FMRC) and Fidelity Investments Money Management, Inc. (FIMM) expected to merge with and into FMR and, after the merger, FMR expected to redomicile as a Delaware limited liability company. The Board also approved the termination of the sub-advisory agreements with FMRC and FIMM upon the completion of the merger. The Board noted that references to FMR in the Amended and Restated Contracts would be updated to reflect FMR's new form of organization and domicile and considered that the definition of "group assets" for purposes of the fund's group fee would be modified to avoid double-counting assets once the reorganization is complete. The Board also noted Fidelity's assurance that neither the planned consolidation nor the Amended and Restated Contracts will change the investment processes, the level or nature of services provided, the resources and personnel allocated, trading and compliance operations, or any fees paid by the fund.
The Board meets regularly and, at each of its meetings, covers an extensive agenda of topics and materials and considers factors that are relevant to its annual consideration of the renewal of the fund's Advisory Contracts, including the services and support provided to the fund and its shareholders. The Board has established various standing committees (Committees), each composed of and chaired by Independent Trustees with varying backgrounds, to which the Board has assigned specific subject matter responsibilities in order to enhance effective decision-making by the Board. The Board, acting directly and through its Committees, requests and receives information concerning the annual consideration of the renewal of the fund's Advisory Contracts. The Board also meets as needed to review matters specifically related to the Board's annual consideration of the renewal of the Advisory Contracts. Members of the Board may also meet with trustees of other Fidelity funds through joint ad hoc committees to discuss certain matters relevant to all of the Fidelity funds.
At its January 2020 meeting, the Board unanimously determined to renew the fund's Advisory Contracts. In reaching its determination, the Board considered all factors it believed relevant, including (i) the nature, extent, and quality of the services provided to the fund and its shareholders (including the investment performance of the fund); (ii) the competitiveness of the fund's management fee and total expense ratio relative to peer funds; (iii) the total costs of the services provided by and the profits realized by Fidelity from its relationships with the fund; and (iv) the extent to which, if any, economies of scale exist and are realized as the fund grows, and whether any economies of scale are appropriately shared with fund shareholders.
In considering whether to renew the Advisory Contracts for the fund, the Board reached a determination, with the assistance of fund counsel and Independent Trustees' counsel and through the exercise of its business judgment, that the renewal of the Advisory Contracts was in the best interests of the fund and its shareholders and that the compensation payable under the Advisory Contracts was fair and reasonable. The Board's decision to renew the Advisory Contracts was not based on any single factor, but rather was based on a comprehensive consideration of all the information provided to the Board at its meetings throughout the year. The Board, in reaching its determination to renew the Advisory Contracts, was aware that shareholders of the fund have a broad range of investment choices available to them, including a wide choice among funds offered by Fidelity's competitors, and that the fund's shareholders, who have the opportunity to review and weigh the disclosure provided by the fund in its prospectus and other public disclosures, have chosen to invest in this fund, which is part of the Fidelity family of funds.
Nature, Extent, and Quality of Services Provided. The Board considered Fidelity's staffing as it relates to the fund, including the backgrounds of investment personnel of Fidelity, and also considered the fund's investment objective, strategies, and related investment philosophy. The Independent Trustees also had discussions with senior management of Fidelity's investment operations and investment groups. The Board considered the structure of the investment personnel compensation program and whether this structure provides appropriate incentives to act in the best interests of the fund. Additionally, the Board considered the portfolio managers' investments, if any, in the funds that they manage.
Resources Dedicated to Investment Management and Support Services. The Board and the Fund Oversight and Research Committees reviewed the general qualifications and capabilities of Fidelity's investment staff, including its size, education, experience, and resources, as well as Fidelity's approach to recruiting, training, managing, and compensating investment personnel. The Board noted that Fidelity has continued to increase the resources devoted to non-U.S. offices, including expansion of Fidelity's global investment organization. The Board also noted that Fidelity's analysts have extensive resources, tools and capabilities that allow them to conduct sophisticated quantitative and fundamental analysis, as well as credit analysis of issuers, counterparties and guarantors. Further, the Board considered that Fidelity's investment professionals have sufficient access to global information and data so as to provide competitive investment results over time, and that those professionals also have access to sophisticated tools that permit them to assess portfolio construction and risk and performance attribution characteristics continuously, as well as to transmit new information and research conclusions rapidly around the world. Additionally, in its deliberations, the Board considered Fidelity's trading, risk management, compliance, and technology and operations capabilities and resources, which are integral parts of the investment management process.
Shareholder and Administrative Services. The Board considered (i) the nature, extent, quality, and cost of advisory, administrative, and shareholder services performed by the Investment Advisers and their affiliates under the Advisory Contracts and under separate agreements covering transfer agency, pricing and bookkeeping, and securities lending services for the fund; (ii) the nature and extent of the supervision of third party service providers, principally custodians, subcustodians, and pricing vendors; and (iii) the resources devoted to, and the record of compliance with, the fund's compliance policies and procedures. The Board also reviewed the allocation of fund brokerage, including allocations to brokers affiliated with the Investment Advisers, the use of brokerage commissions to pay fund expenses, and the use of "soft" commission dollars to pay for research services.
The Board noted that the growth of fund assets over time across the complex allows Fidelity to reinvest in the development of services designed to enhance the value and convenience of the Fidelity funds as investment vehicles. These services include 24-hour access to account information and market information over the Internet and through telephone representatives, investor education materials and asset allocation tools, and the expanded availability of Fidelity Investor Centers.
The Board noted that it and the boards of certain other Fidelity funds had formed an ad hoc Committee on Transfer Agency Fees to review the variety of transfer agency fee structures throughout the industry and Fidelity's competitive positioning with respect to industry participants.
Investment in a Large Fund Family. The Board considered the benefits to shareholders of investing in a Fidelity fund, including the benefits of investing in a fund that is part of a large family of funds offering a variety of investment disciplines and providing a large variety of mutual fund investor services. The Board noted that Fidelity had taken, or had made recommendations that resulted in the Fidelity funds taking, a number of actions over the previous year that benefited particular funds, including: (i) continuing to dedicate additional resources to Fidelity's investment research process, which includes meetings with management of issuers of securities in which the funds invest, and to the support of the senior management team that oversees asset management; (ii) continuing efforts to enhance Fidelity's global research capabilities; (iii) launching new funds and ETFs with innovative structures, strategies and pricing and making other enhancements to meet client needs; (iv) launching new share classes of existing funds; (v) eliminating purchase minimums and broadening eligibility requirements for certain funds and share classes; (vi) reducing management fees and total expenses for certain target date funds and index funds; (vii) lowering expense caps for certain existing funds and classes, and converting certain voluntary expense caps to contractual caps, to reduce expenses borne by shareholders; (viii) rationalizing product lines and gaining increased efficiencies from fund mergers, liquidations, and share class consolidations; (ix) continuing to develop, acquire and implement systems and technology to improve services to the funds and shareholders, strengthen information security, and increase efficiency; and (x) continuing to implement enhancements to further strengthen Fidelity's product line to increase investors' probability of success in achieving their investment goals, including retirement income goals.
Investment Performance. The Board considered whether the fund has operated in accordance with its investment objective, as well as its record of compliance with its investment restrictions and its performance history. The Board noted that there were portfolio management changes for the fund in August 2018, November 2018, March 2019, October 2019, and November 2019. The Board will continue to monitor closely the fund's performance, taking into account the portfolio management changes.
The Board took into account discussions that occur at Board meetings throughout the year with representatives of the Investment Advisers about fund investment performance. In this regard the Board noted that as part of regularly scheduled fund reviews and other reports to the Board on fund performance, the Board considers annualized return information for the fund for different time periods, measured against an appropriate securities market index (benchmark index) and a peer group of funds with similar objectives (peer group), if any. In its evaluation of fund investment performance, the Board gave particular attention to information indicating changes in performance of certain Fidelity funds for specific time periods and discussed with the Investment Advisers the reasons for any overperformance or underperformance.
In addition to reviewing absolute and relative fund performance, the Independent Trustees periodically consider the appropriateness of fund performance metrics in evaluating the results achieved. In general, the Independent Trustees believe that fund performance should be evaluated based on net performance (after fees and expenses) of both the highest performing and lowest performing fund share classes, where applicable, compared to appropriate benchmark indices, over appropriate time periods that may include full market cycles, and compared to peer groups, as applicable, over the same periods, taking into account relevant factors including the following: general market conditions; issuer-specific information; and fund cash flows and other factors.
The Independent Trustees recognize that shareholders evaluate performance on a net basis over their own holding periods, for which one-, three-, and five-year periods are often used as a proxy. For this reason, the performance information reviewed by the Board also included net cumulative total return information for the fund and an appropriate benchmark index and peer group for the most recent one-, three-, and five-year periods ended June 30, 2019, as shown below. Returns are shown compared to the 25th percentile (top of box, 75% beaten) and 75th percentile (bottom of box, 25% beaten) of the peer universe.
Fidelity Balanced Fund
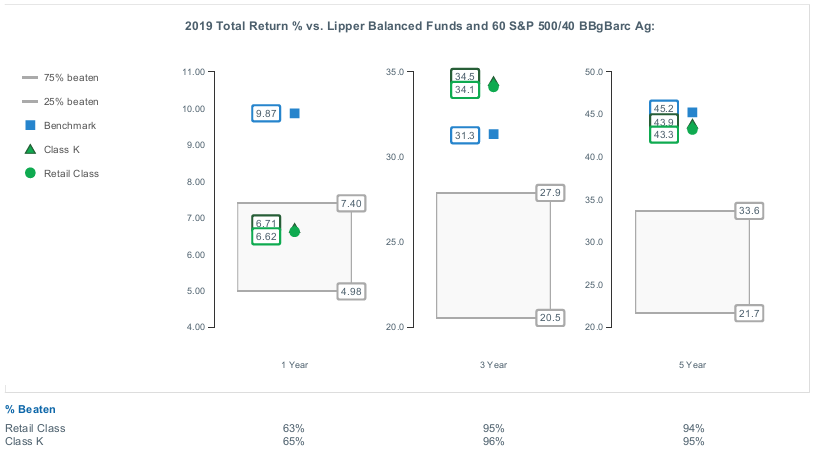
Based on its review, the Board concluded that the nature, extent, and quality of services provided to the fund under the Advisory Contracts should continue to benefit the shareholders of the fund.
Competitiveness of Management Fee and Total Expense Ratio. The Board considered the fund's management fee and total expense ratio compared to "mapped groups" of competitive funds and classes created for the purpose of facilitating the Trustees' competitive analysis of management fees and total expenses. Fidelity creates "mapped groups" by combining similar Lipper investment objective categories that have comparable investment mandates. Combining Lipper investment objective categories aids the Board's management fee and total expense ratio comparisons by broadening the competitive group used for comparison.
Management Fee. The Board considered two proprietary management fee comparisons for the 12-month periods ended June 30 (December 31 for periods prior to 2018) shown in basis points (BP) in the chart below. The group of Lipper funds used by the Board for management fee comparisons is referred to below as the "Total Mapped Group." The Total Mapped Group is broader than the Lipper peer group used by the Board for performance comparisons because the Total Mapped Group combines several Lipper investment objective categories while the Lipper peer group does not. The Total Mapped Group comparison focuses on a fund's standing in terms of gross management fees before expense reimbursements or caps relative to the total universe of funds with comparable investment mandates, regardless of whether their management fee structures also are comparable. Funds with comparable investment mandates offer exposure to similar types of securities. Funds with comparable management fee structures have similar management fee contractual arrangements (
e.g., flat rate charged for advisory services, all-inclusive fee rate,
etc.). "TMG %" represents the percentage of funds in the Total Mapped Group that had management fees that were lower than the fund's. For example, a hypothetical TMG % of 20% would mean that 80% of the funds in the Total Mapped Group had higher, and 20% had lower, management fees than the fund. The fund's actual TMG %s and the number of funds in the Total Mapped Group are in the chart below. The "Asset-Sized Peer Group" (ASPG) comparison focuses on a fund's standing relative to a subset of non-Fidelity funds within the Total Mapped Group that are similar in size and management fee structure. For example, if a fund is in the first quartile of the ASPG, the fund's management fee ranks in the least expensive or lowest 25% of funds in the ASPG. The ASPG represents at least 15% of the funds in the Total Mapped Group with comparable asset size and management fee structures, subject to a minimum of 50 funds (or all funds in the Total Mapped Group if fewer than 50). Additional information, such as the ASPG quartile in which the fund's management fee rate ranked, is also included in the chart and was considered by the Board.
Fidelity Balanced Fund

The Board noted that the fund's management fee rate ranked below the median of its Total Mapped Group and below the median of its ASPG for the 12-month period ended June 30, 2019.
The Board noted that it and the boards of other Fidelity funds formed an ad hoc Committee on Group Fee, which meets periodically, to conduct an in-depth review of the "group fee" component of the management fee of funds with such management fee structures. The Committee's focus included the mechanics of the group fee, the competitive landscape of group fee structures, Fidelity funds with no group fee component and investment products not included in group fee assets. The Board also considered that, for funds subject to the group fee, FMR agreed to voluntarily waive fees over a specified period of time in amounts designed to account for assets converted from certain funds to certain collective investment trusts.
The Board also noted that, in 2013, the ad hoc Committee on Management Fees was formed to conduct an in-depth review of the management fee rates of Fidelity's active equity mutual funds. The Committee focused on the following areas: (i) standard fee structures; (ii) research consumption and trading evolution; (iii) management fee competitiveness/profitability by category; and (iv) factors that drive institutional pricing.
Based on its review, the Board concluded that the fund's management fee is fair and reasonable in light of the services that the fund receives and the other factors considered.
Total Expense Ratio. In its review of each class's total expense ratio, the Board considered the fund's management fee rate as well as other fund or class expenses, as applicable, such as transfer agent fees, pricing and bookkeeping fees, and custodial, legal, and audit fees. The Board also noted that Fidelity may agree to waive fees or reimburse expenses from time to time, and the extent to which, if any, it has done so for the fund. As part of its review, the Board also considered the current and historical total expense ratios of each class of the fund compared to competitive fund median expenses. Each class of the fund is compared to those funds and classes in the Total Mapped Group (used by the Board for management fee comparisons) that have a similar sales load structure.
The Board noted that the total expense ratio of each class ranked below the competitive median for the 12-month period ended June 30, 2019.
Fees Charged to Other Fidelity Clients. The Board also considered Fidelity fee structures and other information with respect to clients of Fidelity, such as other funds advised or subadvised by Fidelity, pension plan clients, and other institutional clients with similar mandates. The Board noted that a joint ad hoc committee created by it and the boards of other Fidelity funds periodically reviews and compares Fidelity's institutional investment advisory business with its business of providing services to the Fidelity funds and also noted the most recent findings of the committee. The Board noted that the committee's review included a consideration of the differences in services provided, fees charged, and costs incurred, as well as competition in the markets serving the different categories of clients.
Based on its review of total expense ratios and fees charged to other Fidelity clients, the Board concluded that the total expense ratio of each class of the fund was reasonable in light of the services that the fund and its shareholders receive and the other factors considered.
Costs of the Services and Profitability. The Board considered the revenues earned and the expenses incurred by Fidelity in conducting the business of developing, marketing, distributing, managing, administering and servicing the fund and servicing the fund's shareholders. The Board also considered the level of Fidelity's profits in respect of all the Fidelity funds.
On an annual basis, Fidelity presents to the Board information about the profitability of its relationships with the fund. Fidelity calculates profitability information for each fund, as well as aggregate profitability information for groups of Fidelity funds and all Fidelity funds, using a series of detailed revenue and cost allocation methodologies which originate with the books and records of Fidelity on which Fidelity's audited financial statements are based. The Audit Committee of the Board reviews any significant changes from the prior year's methodologies and the full Board approves such changes.
PricewaterhouseCoopers LLP (PwC), auditor to Fidelity and certain Fidelity funds, has been engaged annually by the Board as part of the Board's assessment of Fidelity's profitability analysis. PwC's engagement includes the review and assessment of the methodologies used by Fidelity in determining the revenues and expenses attributable to Fidelity's mutual fund business, and completion of agreed-upon procedures in respect of the mathematical accuracy of the fund profitability information and its conformity to established allocation methodologies. After considering PwC's reports issued under the engagement and information provided by Fidelity, the Board concluded that while other allocation methods may also be reasonable, Fidelity's profitability methodologies are reasonable in all material respects.
The Board also reviewed Fidelity's non-fund businesses and potential indirect benefits such businesses may have received as a result of their association with Fidelity's mutual fund business (i.e., fall-out benefits) as well as cases where Fidelity's affiliates may benefit from the funds' business. The Board noted that changes to fall-out benefits year-over-year reflect business developments at Fidelity's various businesses. The Board considered that a joint ad hoc committee created by it and the boards of other Fidelity funds had recently been established, and met periodically, to evaluate potential fall-out benefits (PFOB Committee). The Board noted that the PFOB Committee, among other things: (i) discussed the legal framework surrounding potential fall-out benefits; (ii) reviewed the Board's responsibilities and approach to potential fall-out benefits; and (iii) reviewed practices employed by competitor funds regarding the review of potential fall-out benefits.
The Board considered the costs of the services provided by and the profits realized by Fidelity in connection with the operation of the fund, including the conclusions of the PFOB Committee, and was satisfied that the profitability was not excessive.
Economies of Scale. The Board considered whether there have been economies of scale in respect of the management of the Fidelity funds, whether the Fidelity funds (including the fund) have appropriately benefited from any such economies of scale, and whether there is potential for realization of any further economies of scale. The Board considered the extent to which the fund will benefit from economies of scale as assets grow through increased services to the fund, through waivers or reimbursements, or through fee or expense ratio reductions. The Board also noted that a committee (the Economies of Scale Committee) created by it and the boards of other Fidelity funds periodically analyzes whether Fidelity attains economies of scale in respect of the management and servicing of the Fidelity funds, whether the Fidelity funds have appropriately benefited from such economies of scale, and whether there is potential for realization of any further economies of scale.
The Board recognized that the fund's management contract incorporates a "group fee" structure, which provides for lower group fee rates as total "group assets" increase, and for higher group fee rates as total "group assets" decrease ("group assets" as defined in the management contract). FMR calculates the group fee rates based on a tiered asset "breakpoint" schedule that varies based on asset class. The Board considered that the group fee is designed to deliver the benefits of economies of scale to fund shareholders when total Fidelity fund assets increase, even if assets of any particular fund are unchanged or have declined, because some portion of Fidelity's costs are attributable to services provided to all Fidelity funds, and all funds benefit if those costs can be allocated among more assets. The Board concluded that, given the group fee structure, fund shareholders will benefit from lower management fees as "group assets" increase at the fund complex level, regardless of whether Fidelity achieves any such economies of scale.
The Board concluded, taking into account the analysis of the Economies of Scale Committee, that economies of scale, if any, are being appropriately shared between fund shareholders and Fidelity.
Additional Information Requested by the Board. In order to develop fully the factual basis for consideration of the Fidelity funds' advisory contracts, the Board requested and received additional information on certain topics, including: (i) fund flow and performance trends, in particular the underperformance of certain funds and strategies, and Fidelity's long-term strategies for certain funds; (ii) consideration of performance fees for additional funds; (iii) changes in Fidelity's non-fund businesses and the impact of such changes on the funds; (iv) metrics for evaluating index fund and ETF performance and information about ETF trading characteristics; (v) the methodology with respect to evaluating competitive fund data and peer group classifications and fee comparisons; (vi) the expense structures for different funds and classes; (vii) information regarding other accounts managed by Fidelity, including collective investment trusts and separately managed accounts; and (viii) Fidelity's philosophies and strategies for evaluating funds and classes with lower or declining asset levels.
Based on its evaluation of all of the conclusions noted above, and after considering all factors it believed relevant, the Board concluded that the advisory fee arrangements are fair and reasonable, and that the fund's Amended and Restated Contracts should be approved and the fund's Advisory Contracts should be renewed.
Liquidity Risk Management Program
The Securities and Exchange Commission adopted Rule 22e-4 under the Investment Company Act of 1940 (the Liquidity Rule) to promote effective liquidity risk management throughout the open-end investment company industry, thereby reducing the risk that funds will be unable to meet their redemption obligations and mitigating dilution of the interests of fund shareholders.
The Fund has adopted and implemented a liquidity risk management program pursuant to the Liquidity Rule (the Program) effective December 1, 2018. The Program is reasonably designed to assess and manage the Fund’s liquidity risk and to comply with the requirements of the Liquidity Rule. The Fund’s Board of Trustees (the Board) has designated the Fund’s investment adviser as administrator of the Program. The Fidelity advisers have established a Liquidity Risk Management Committee (the LRM Committee) to manage the Program for each of the Fidelity Funds. The LRM Committee monitors the adequacy and effectiveness of implementation of the Program and on a periodic basis assesses each Fund’s liquidity risk based on a variety of factors including (1) the Fund’s investment strategy, (2) portfolio liquidity and cash flow projections during normal and reasonably foreseeable stressed conditions, (3) shareholder redemptions, (4) borrowings and other funding sources and (5) in the case of exchange-traded funds, certain additional factors including the effect of the Fund’s prices and spreads, market participants, and basket compositions on the overall liquidity of the Fund’s portfolio, as applicable.
In accordance with the Program, each of the Fund’s portfolio investments is classified into one of four liquidity categories described below based on a determination of a reasonable expectation for how long it would take to convert the investment to cash (or sell or dispose of the investment) without significantly changing its market value.
- Highly liquid investments – cash or convertible to cash within three business days or less
- Moderately liquid investments – convertible to cash in three to seven calendar days
- Less liquid investments – can be sold or disposed of, but not settled, within seven calendar days
- Illiquid investments – cannot not be sold or disposed of within seven calendar days
Liquidity classification determinations take into account a variety of factors including various market, trading and investment-specific considerations, as well as market depth, and generally utilize analysis from a third-party liquidity metrics service.
The Liquidity Rule places a 15% limit on a fund’s illiquid investments and requires funds that do not primarily hold assets that are highly liquid investments to determine and maintain a minimum percentage of the fund’s net assets to be invested in highly liquid investments (highly liquid investment minimum or HLIM). The Program includes provisions reasonably designed to comply with the 15% limit on illiquid investments and for determining, periodically reviewing and complying with the HLIM requirement as applicable.
At a recent meeting of the Fund’s Board of Trustees, the LRM Committee provided a written report to the Board pertaining to the operation, adequacy, and effectiveness of implementation of the Program for the annual period from December 1, 2018 through November 30, 2019. The report concluded that the Program has been implemented and is operating effectively and is reasonably designed to assess and manage the Fund’s liquidity risk.
BAL-SANN-0420
1.471161.122
Fidelity® Balanced K6 Fund
Semi-Annual Report
February 29, 2020
See the inside front cover for important information about access to your fund’s shareholder reports.
Beginning on January 1, 2021, as permitted by regulations adopted by the Securities and Exchange Commission, paper copies of a fund’s shareholder reports will no longer be sent by mail, unless you specifically request paper copies of the reports from the fund or from your financial intermediary, such as a financial advisor, broker-dealer or bank. Instead, the reports will be made available on a website, and you will be notified by mail each time a report is posted and provided with a website link to access the report.
If you already elected to receive shareholder reports electronically, you will not be affected by this change and you need not take any action. You may elect to receive shareholder reports and other communications from a fund electronically, by contacting your financial intermediary. For Fidelity customers, visit Fidelity's web site or call Fidelity using the contact information listed below.
You may elect to receive all future reports in paper free of charge. If you wish to continue receiving paper copies of your shareholder reports, you may contact your financial intermediary or, if you are a Fidelity customer, visit Fidelity’s website, or call Fidelity at the applicable toll-free number listed below. Your election to receive reports in paper will apply to all funds held with the fund complex/your financial intermediary.
| Account Type | Website | Phone Number |
| Brokerage, Mutual Fund, or Annuity Contracts: | fidelity.com/mailpreferences | 1-800-343-3548 |
| Employer Provided Retirement Accounts: | netbenefits.fidelity.com/preferences (choose 'no' under Required Disclosures to continue to print) | 1-800-343-0860 |
| Advisor Sold Accounts Serviced Through Your Financial Intermediary: | Contact Your Financial Intermediary | Your Financial Intermediary's phone number |
| Advisor Sold Accounts Serviced by Fidelity: | institutional.fidelity.com | 1-877-208-0098 |
Contents
To view a fund's proxy voting guidelines and proxy voting record for the 12-month period ended June 30, visit http://www.fidelity.com/proxyvotingresults or visit the Securities and Exchange Commission's (SEC) web site at http://www.sec.gov.
You may also call 1-800-835-5092 to request a free copy of the proxy voting guidelines.
Standard & Poor's, S&P and S&P 500 are registered service marks of The McGraw-Hill Companies, Inc. and have been licensed for use by Fidelity Distributors Corporation.
Other third-party marks appearing herein are the property of their respective owners.
All other marks appearing herein are registered or unregistered trademarks or service marks of FMR LLC or an affiliated company. © 2020 FMR LLC. All rights reserved.
This report and the financial statements contained herein are submitted for the general information of the shareholders of the Fund. This report is not authorized for distribution to prospective investors in the Fund unless preceded or accompanied by an effective prospectus.
A fund files its complete schedule of portfolio holdings with the SEC for the first and third quarters of each fiscal year on Form N-PORT. Forms N-PORT are available on the SEC’s web site at http://www.sec.gov. A fund's Forms N-PORT may be reviewed and copied at the SEC’s Public Reference Room in Washington, DC. Information regarding the operation of the SEC's Public Reference Room may be obtained by calling 1-800-SEC-0330.
For a complete list of a fund's portfolio holdings, view the most recent holdings listing, semiannual report, or annual report on Fidelity's web site at http://www.fidelity.com, http://www.institutional.fidelity.com, or http://www.401k.com, as applicable.
NOT FDIC INSURED •MAY LOSE VALUE •NO BANK GUARANTEE
Neither the Fund nor Fidelity Distributors Corporation is a bank.
Note to Shareholders:
Early in 2020, the outbreak and spread of a new coronavirus emerged as a public health emergency that had a major influence on financial markets, primarily based on its impact on the global economy and corporate earnings. The virus causes a respiratory disease known as COVID-19. On March 11, the World Health Organization declared the COVID-19 outbreak a pandemic, citing sustained risk of further global spread.
In the weeks following the end of this reporting period, as the crisis worsened, we witnessed an escalating human tragedy with wide-scale social and economic consequences from coronavirus-containment measures. The outbreak of COVID-19 prompted a number of measures to limit the spread, including travel and border restrictions, quarantines, and restrictions on large gatherings. In turn, these resulted in lower consumer activity, diminished demand for a wide range of products and services, disruption in manufacturing and supply chains, and – given the wide variability in outcomes regarding the outbreak – significant market uncertainty and volatility. Amid the turmoil, the U.S. government took unprecedented action – in concert with the U.S. Federal Reserve and central banks around the world – to help support consumers, businesses, and the broader economy, and to limit disruption to the financial system.
The situation continues to unfold, and the extent and duration of its impact on financial markets and the economy remain highly uncertain. Extreme events such as the coronavirus crisis are “exogenous shocks” that can have significant adverse effects on mutual funds and their investments. Although multiple asset classes may be affected by market disruption, the duration and impact may not be the same for all types of assets.
Fidelity is committed to helping you stay informed amid news about COVID-19 and during increased market volatility, and we’re taking extra steps to be responsive to customer needs. We encourage you to visit our websites, where we offer ongoing updates, commentary, and analysis on the markets and our funds.
Investment Summary (Unaudited)
The information in the following tables is based on the combined investments of the Fund and its pro-rata share of the investments of Fidelity's Fixed-Income Central Funds.
Top Five Stocks as of February 29, 2020
| | % of fund's net assets |
| Microsoft Corp. | 3.5 |
| Apple, Inc. | 3.0 |
| Amazon.com, Inc. | 1.9 |
| Alphabet, Inc. Class C | 1.7 |
| Facebook, Inc. Class A | 1.5 |
| | 11.6 |
Top Five Bond Issuers as of February 29, 2020
| (with maturities greater than one year) | % of fund's net assets |
| U.S. Treasury Obligations | 8.9 |
| Fannie Mae | 2.3 |
| Freddie Mac | 1.8 |
| Ginnie Mae | 1.9 |
| Morgan Stanley | 0.5 |
| | 15.4 |
Top Five Market Sectors as of February 29, 2020
| | % of fund's net assets |
| Information Technology | 15.1 |
| Financials | 13.9 |
| Health Care | 10.4 |
| Industrials | 8.0 |
| Communication Services | 8.0 |
Asset Allocation (% of fund's net assets)
| As of February 29, 2020* |
| | Stocks | 66.8% |
| | Bonds | 32.2% |
| | Other Investments | 0.5% |
| | Short-Term Investments and Net Other Assets (Liabilities) | 0.5% |

* Foreign investments – 9.5%
An unaudited holdings listing for the Fund, which presents direct holdings as well as the pro-rata share of any securities and other investments held indirectly through its investment in underlying non-money market Fidelity Central Funds, is available at fidelity.com and/or institutional.fidelity.com, as applicable.
Percentages in the above tables are adjusted for the effect of TBA Sale Commitments.
Schedule of Investments February 29, 2020 (Unaudited)
Showing Percentage of Net Assets
| Common Stocks - 66.7% | | | |
| | | Shares | Value |
| COMMUNICATION SERVICES - 6.6% | | | |
| Diversified Telecommunication Services - 0.1% | | | |
| AT&T, Inc. | | 9,823 | $345,966 |
| Entertainment - 2.2% | | | |
| Activision Blizzard, Inc. | | 51,186 | 2,975,442 |
| DouYu International Holdings Ltd. ADR | | 2,211 | 17,179 |
| Electronic Arts, Inc. (a) | | 4,326 | 438,527 |
| Netflix, Inc. (a) | | 3,997 | 1,475,013 |
| The Walt Disney Co. | | 14,491 | 1,704,866 |
| World Wrestling Entertainment, Inc. Class A (b) | | 1,282 | 59,959 |
| | | | 6,670,986 |
| Interactive Media & Services - 3.9% | | | |
| Alphabet, Inc.: | | | |
| Class A (a) | | 1,117 | 1,495,942 |
| Class C (a) | | 3,983 | 5,334,551 |
| ANGI Homeservices, Inc. Class A (a) | | 21,647 | 154,343 |
| CarGurus, Inc. Class A (a) | | 1,965 | 50,088 |
| Facebook, Inc. Class A (a) | | 23,156 | 4,456,835 |
| Tencent Holdings Ltd. | | 1,511 | 76,615 |
| Twitter, Inc. (a) | | 6,390 | 212,148 |
| Wise Talent Information Technology Co. Ltd. (a) | | 88,826 | 218,789 |
| | | | 11,999,311 |
| Media - 0.2% | | | |
| Altice U.S.A., Inc. Class A (a) | | 10,428 | 269,668 |
| ViacomCBS, Inc. Class B | | 6,091 | 149,900 |
| | | | 419,568 |
| Wireless Telecommunication Services - 0.2% | | | |
| Boingo Wireless, Inc. (a) | | 8,696 | 110,178 |
| T-Mobile U.S., Inc. (a) | | 6,516 | 587,483 |
| | | | 697,661 |
|
| TOTAL COMMUNICATION SERVICES | | | 20,133,492 |
|
| CONSUMER DISCRETIONARY - 6.7% | | | |
| Auto Components - 0.1% | | | |
| Aptiv PLC | | 4,449 | 347,511 |
| Distributors - 0.1% | | | |
| LKQ Corp. (a) | | 14,039 | 415,274 |
| Diversified Consumer Services - 0.1% | | | |
| Afya Ltd. | | 8,869 | 210,905 |
| Hotels, Restaurants & Leisure - 1.3% | | | |
| ARAMARK Holdings Corp. | | 7,324 | 254,436 |
| Churchill Downs, Inc. | | 1,872 | 235,198 |
| Compass Group PLC | | 26,167 | 576,523 |
| Dunkin' Brands Group, Inc. | | 2,636 | 175,347 |
| Marriott International, Inc. Class A | | 4,491 | 556,884 |
| McDonald's Corp. | | 9,582 | 1,860,537 |
| Starbucks Corp. | | 1,975 | 154,899 |
| Wynn Resorts Ltd. | | 1,506 | 162,618 |
| | | | 3,976,442 |
| Household Durables - 0.2% | | | |
| Lennar Corp. Class A | | 10,715 | 646,543 |
| Internet & Direct Marketing Retail - 2.5% | | | |
| Alibaba Group Holding Ltd. | | 2,464 | 63,220 |
| Amazon.com, Inc. (a) | | 3,144 | 5,922,510 |
| GrubHub, Inc. (a)(b) | | 5,728 | 275,574 |
| Ocado Group PLC (a) | | 5,347 | 74,073 |
| Pinduoduo, Inc. ADR (a) | | 8,767 | 313,683 |
| The Booking Holdings, Inc. (a) | | 645 | 1,093,701 |
| Wayfair LLC Class A (a) | | 131 | 8,281 |
| | | | 7,751,042 |
| Leisure Products - 0.0% | | | |
| Mattel, Inc. (a)(b) | | 13,419 | 158,210 |
| Multiline Retail - 0.3% | | | |
| Dollar Tree, Inc. (a) | | 9,875 | 819,921 |
| Specialty Retail - 1.7% | | | |
| Burlington Stores, Inc. (a) | | 1,371 | 296,492 |
| Lowe's Companies, Inc. | | 13,713 | 1,461,394 |
| The Children's Place Retail Stores, Inc. | | 1,553 | 89,453 |
| The Home Depot, Inc. | | 6,976 | 1,519,652 |
| TJX Companies, Inc. | | 22,255 | 1,330,849 |
| Ulta Beauty, Inc. (a) | | 1,472 | 378,436 |
| | | | 5,076,276 |
| Textiles, Apparel & Luxury Goods - 0.4% | | | |
| LVMH Moet Hennessy Louis Vuitton SE | | 371 | 154,830 |
| NIKE, Inc. Class B | | 5,644 | 504,461 |
| PVH Corp. | | 2,831 | 209,805 |
| Tapestry, Inc. | | 12,666 | 297,018 |
| | | | 1,166,114 |
|
| TOTAL CONSUMER DISCRETIONARY | | | 20,568,238 |
|
| CONSUMER STAPLES - 4.8% | | | |
| Beverages - 1.3% | | | |
| Boston Beer Co., Inc. Class A (a) | | 268 | 99,372 |
| Keurig Dr. Pepper, Inc. | | 8,746 | 243,838 |
| Monster Beverage Corp. (a) | | 8,278 | 516,630 |
| PepsiCo, Inc. | | 21,778 | 2,875,349 |
| Pernod Ricard SA | | 1,853 | 302,176 |
| | | | 4,037,365 |
| Food & Staples Retailing - 1.4% | | | |
| Costco Wholesale Corp. | | 4,923 | 1,384,052 |
| Kroger Co. | | 19,487 | 548,169 |
| Performance Food Group Co. (a) | | 5,562 | 235,829 |
| U.S. Foods Holding Corp. (a) | | 13,097 | 440,583 |
| Walmart, Inc. | | 15,798 | 1,701,129 |
| | | | 4,309,762 |
| Food Products - 0.5% | | | |
| Beyond Meat, Inc. (b) | | 757 | 67,865 |
| Freshpet, Inc. (a) | | 1,541 | 102,415 |
| Lamb Weston Holdings, Inc. | | 2,452 | 213,054 |
| Mondelez International, Inc. | | 19,036 | 1,005,101 |
| | | | 1,388,435 |
| Household Products - 1.0% | | | |
| Colgate-Palmolive Co. | | 411 | 27,771 |
| Energizer Holdings, Inc. | | 8,400 | 361,116 |
| Procter & Gamble Co. | | 24,069 | 2,725,333 |
| | | | 3,114,220 |
| Personal Products - 0.2% | | | |
| Estee Lauder Companies, Inc. Class A | | 2,254 | 413,834 |
| Tobacco - 0.4% | | | |
| Altria Group, Inc. | | 32,200 | 1,299,914 |
|
| TOTAL CONSUMER STAPLES | | | 14,563,530 |
|
| ENERGY - 2.5% | | | |
| Energy Equipment & Services - 0.2% | | | |
| Baker Hughes Co. Class A | | 8,694 | 139,886 |
| CGG SA (a) | | 12,582 | 34,982 |
| NCS Multistage Holdings, Inc. (a) | | 10,878 | 11,857 |
| Oceaneering International, Inc. (a) | | 9,042 | 95,303 |
| SBM Offshore NV | | 3,776 | 59,772 |
| Schlumberger Ltd. | | 3,230 | 87,501 |
| Subsea 7 SA | | 15,399 | 139,925 |
| TechnipFMC PLC | | 3,652 | 54,196 |
| TGS Nopec Geophysical Co. ASA | | 880 | 20,534 |
| | | | 643,956 |
| Oil, Gas & Consumable Fuels - 2.3% | | | |
| Africa Oil Corp. (a) | | 25,070 | 23,160 |
| Apache Corp. | | 3,815 | 95,070 |
| Cairn Energy PLC (a) | | 19,325 | 35,133 |
| Canadian Natural Resources Ltd. | | 7,334 | 188,780 |
| Cheniere Energy, Inc. (a) | | 1,618 | 82,987 |
| Chevron Corp. | | 9,059 | 845,567 |
| Concho Resources, Inc. | | 1,047 | 71,217 |
| ConocoPhillips Co. | | 1,972 | 95,484 |
| Enbridge, Inc. | | 2,650 | 99,190 |
| Equinor ASA sponsored ADR | | 15,832 | 246,188 |
| Exxon Mobil Corp. | | 47,611 | 2,449,110 |
| Galp Energia SGPS SA Class B | | 11,725 | 161,737 |
| Gibson Energy, Inc. | | 2,206 | 42,107 |
| Hess Corp. | | 9,318 | 523,485 |
| Lundin Petroleum AB | | 2,475 | 70,657 |
| Marathon Petroleum Corp. | | 1,690 | 80,140 |
| MEG Energy Corp. (a) | | 42,886 | 197,456 |
| Murphy Oil Corp. | | 8,927 | 168,274 |
| Noble Energy, Inc. | | 1,489 | 23,571 |
| Phillips 66 Co. | | 5,014 | 375,348 |
| Pioneer Natural Resources Co. | | 1,494 | 183,433 |
| Shell Midstream Partners LP | | 4,655 | 79,647 |
| Total SA sponsored ADR | | 8,710 | 375,749 |
| Valero Energy Corp. | | 4,934 | 326,878 |
| | | | 6,840,368 |
|
| TOTAL ENERGY | | | 7,484,324 |
|
| FINANCIALS - 8.1% | | | |
| Banks - 2.9% | | | |
| Bank of America Corp. | | 100,828 | 2,873,598 |
| Citigroup, Inc. | | 22,306 | 1,415,539 |
| EFG Eurobank Ergasias SA (a) | | 156,847 | 99,941 |
| First Horizon National Corp. | | 9,391 | 125,182 |
| Huntington Bancshares, Inc. | | 50,423 | 618,690 |
| KeyCorp | | 26,542 | 433,962 |
| M&T Bank Corp. | | 2,833 | 397,697 |
| Signature Bank | | 2,417 | 302,367 |
| Societe Generale Series A | | 6,662 | 188,779 |
| Synovus Financial Corp. | | 4,150 | 120,433 |
| Truist Financial Corp. | | 12,103 | 558,432 |
| Wells Fargo & Co. | | 39,956 | 1,632,203 |
| | | | 8,766,823 |
| Capital Markets - 1.3% | | | |
| Apollo Global Management LLC Class A | | 6,801 | 283,330 |
| BlackRock, Inc. Class A | | 1,235 | 571,817 |
| Cboe Global Markets, Inc. | | 6,669 | 760,266 |
| E*TRADE Financial Corp. | | 7,712 | 353,055 |
| Intercontinental Exchange, Inc. | | 5,702 | 508,732 |
| Invesco Ltd. | | 9,420 | 135,648 |
| Morgan Stanley | | 15,250 | 686,708 |
| State Street Corp. | | 4,109 | 279,864 |
| Virtu Financial, Inc. Class A (b) | | 19,020 | 357,766 |
| | | | 3,937,186 |
| Consumer Finance - 1.8% | | | |
| 360 Finance, Inc. ADR (a) | | 21,584 | 180,442 |
| Ally Financial, Inc. | | 10,167 | 254,887 |
| American Express Co. | | 7,861 | 864,160 |
| Capital One Financial Corp. | | 29,713 | 2,622,469 |
| OneMain Holdings, Inc. | | 25,337 | 931,135 |
| Qudian, Inc. ADR (a)(b) | | 14,354 | 37,607 |
| SLM Corp. | | 26,798 | 277,895 |
| Synchrony Financial | | 12,638 | 367,766 |
| | | | 5,536,361 |
| Diversified Financial Services - 0.7% | | | |
| Berkshire Hathaway, Inc.: | | | |
| Class A (a) | | 1 | 309,096 |
| Class B (a) | | 7,910 | 1,632,149 |
| | | | 1,941,245 |
| Insurance - 1.4% | | | |
| American International Group, Inc. | | 16,457 | 693,827 |
| Fairfax Financial Holdings Ltd. (sub. vtg.) | | 104 | 44,801 |
| Hartford Financial Services Group, Inc. | | 10,941 | 546,503 |
| Marsh & McLennan Companies, Inc. | | 9,554 | 998,966 |
| MetLife, Inc. | | 10,388 | 443,775 |
| The Travelers Companies, Inc. | | 7,876 | 943,624 |
| Willis Group Holdings PLC | | 3,672 | 694,926 |
| | | | 4,366,422 |
|
| TOTAL FINANCIALS | | | 24,548,037 |
|
| HEALTH CARE - 9.3% | | | |
| Biotechnology - 1.8% | | | |
| Alexion Pharmaceuticals, Inc. (a) | | 6,366 | 598,595 |
| Amgen, Inc. | | 9,851 | 1,967,540 |
| Argenx SE ADR (a) | | 208 | 29,407 |
| Biogen, Inc. (a) | | 1,026 | 316,408 |
| Global Blood Therapeutics, Inc. (a) | | 5,033 | 321,911 |
| PTC Therapeutics, Inc. (a) | | 3,237 | 177,517 |
| Regeneron Pharmaceuticals, Inc. (a) | | 1,379 | 613,062 |
| Vertex Pharmaceuticals, Inc. (a) | | 5,965 | 1,336,339 |
| | | | 5,360,779 |
| Health Care Equipment & Supplies - 2.0% | | | |
| Abbott Laboratories | | 17,200 | 1,324,916 |
| Becton, Dickinson & Co. | | 3,140 | 746,755 |
| Boston Scientific Corp. (a) | | 40,030 | 1,496,722 |
| Danaher Corp. | | 2,559 | 369,980 |
| DexCom, Inc. (a) | | 556 | 153,456 |
| Haemonetics Corp. (a) | | 3,161 | 342,431 |
| Intuitive Surgical, Inc. (a) | | 1,990 | 1,062,580 |
| Stryker Corp. | | 3,875 | 738,536 |
| ViewRay, Inc. (a) | | 13,021 | 37,370 |
| | | | 6,272,746 |
| Health Care Providers & Services - 2.2% | | | |
| Cigna Corp. | | 6,717 | 1,228,808 |
| HCA Holdings, Inc. | | 6,207 | 788,351 |
| Humana, Inc. | | 4,327 | 1,383,255 |
| UnitedHealth Group, Inc. | | 13,084 | 3,335,897 |
| | | | 6,736,311 |
| Health Care Technology - 0.0% | | | |
| Change Healthcare, Inc. (b) | | 8,409 | 114,278 |
| Life Sciences Tools & Services - 0.5% | | | |
| Thermo Fisher Scientific, Inc. | | 4,876 | 1,417,941 |
| Pharmaceuticals - 2.8% | | | |
| AstraZeneca PLC sponsored ADR | | 31,915 | 1,397,877 |
| Bristol-Myers Squibb Co. | | 38,142 | 2,252,667 |
| Bristol-Myers Squibb Co. rights (a) | | 4,898 | 16,408 |
| Eli Lilly & Co. | | 14,770 | 1,862,940 |
| Horizon Pharma PLC (a) | | 15,118 | 517,338 |
| Roche Holding AG (participation certificate) | | 5,561 | 1,788,049 |
| Zoetis, Inc. Class A | | 4,899 | 652,694 |
| | | | 8,487,973 |
|
| TOTAL HEALTH CARE | | | 28,390,028 |
|
| INDUSTRIALS - 7.6% | | | |
| Aerospace & Defense - 0.5% | | | |
| General Dynamics Corp. | | 1,929 | 308,042 |
| Northrop Grumman Corp. | | 1,412 | 464,322 |
| The Boeing Co. | | 2,507 | 689,701 |
| United Technologies Corp. | | 1,282 | 167,416 |
| | | | 1,629,481 |
| Air Freight & Logistics - 0.3% | | | |
| FedEx Corp. | | 7,194 | 1,015,577 |
| Airlines - 0.3% | | | |
| American Airlines Group, Inc. | | 38,619 | 735,692 |
| JetBlue Airways Corp. (a) | | 20,814 | 328,445 |
| | | | 1,064,137 |
| Construction & Engineering - 0.7% | | | |
| AECOM (a) | | 37,244 | 1,673,745 |
| Granite Construction, Inc. | | 17,116 | 347,797 |
| | | | 2,021,542 |
| Electrical Equipment - 0.9% | | | |
| Sensata Technologies, Inc. PLC (a) | | 32,614 | 1,330,651 |
| Sunrun, Inc. (a) | | 17,085 | 330,424 |
| Vivint Solar, Inc. (a)(b) | | 97,091 | 1,091,303 |
| | | | 2,752,378 |
| Industrial Conglomerates - 1.2% | | | |
| 3M Co. | | 3,013 | 449,660 |
| General Electric Co. | | 262,015 | 2,850,723 |
| Honeywell International, Inc. | | 1,297 | 210,334 |
| | | | 3,510,717 |
| Machinery - 0.5% | | | |
| Allison Transmission Holdings, Inc. | | 26,008 | 1,055,925 |
| Caterpillar, Inc. | | 4,530 | 562,807 |
| | | | 1,618,732 |
| Marine - 0.2% | | | |
| A.P. Moller - Maersk A/S Series B | | 456 | 460,154 |
| Professional Services - 0.6% | | | |
| Nielsen Holdings PLC | | 105,946 | 1,929,277 |
| Road & Rail - 2.0% | | | |
| CSX Corp. | | 3,475 | 244,814 |
| Lyft, Inc. | | 13,809 | 526,399 |
| Norfolk Southern Corp. | | 8,847 | 1,613,250 |
| Uber Technologies, Inc. | | 100,341 | 3,398,550 |
| Union Pacific Corp. | | 2,251 | 359,732 |
| | | | 6,142,745 |
| Trading Companies & Distributors - 0.4% | | | |
| HD Supply Holdings, Inc. (a) | | 30,786 | 1,170,484 |
|
| TOTAL INDUSTRIALS | | | 23,315,224 |
|
| INFORMATION TECHNOLOGY - 14.9% | | | |
| Communications Equipment - 0.1% | | | |
| CommScope Holding Co., Inc. (a) | | 11,026 | 121,396 |
| Ericsson (B Shares) sponsored ADR | | 16,561 | 133,150 |
| | | | 254,546 |
| Electronic Equipment & Components - 0.5% | | | |
| Flextronics International Ltd. (a) | | 66,714 | 741,193 |
| II-VI, Inc. (a) | | 14,675 | 435,701 |
| Jabil, Inc. | | 9,005 | 288,610 |
| | | | 1,465,504 |
| IT Services - 1.8% | | | |
| DXC Technology Co. | | 6,301 | 151,917 |
| Fastly, Inc. Class A (b) | | 4,825 | 95,535 |
| Fidelity National Information Services, Inc. | | 10,274 | 1,435,483 |
| Genpact Ltd. | | 8,775 | 337,487 |
| Global Payments, Inc. | | 2,664 | 490,096 |
| GoDaddy, Inc. (a) | | 5,523 | 386,500 |
| GreenSky, Inc. Class A (a) | | 21,968 | 175,305 |
| MongoDB, Inc. Class A (a) | | 957 | 145,943 |
| PagSeguro Digital Ltd. (a) | | 4,264 | 133,762 |
| PayPal Holdings, Inc. (a) | | 11,754 | 1,269,314 |
| Twilio, Inc. Class A (a) | | 8,256 | 929,956 |
| | | | 5,551,298 |
| Semiconductors & Semiconductor Equipment - 2.8% | | | |
| Advanced Micro Devices, Inc. (a) | | 7,638 | 347,376 |
| Applied Materials, Inc. | | 11,495 | 668,089 |
| Lam Research Corp. | | 696 | 204,227 |
| Marvell Technology Group Ltd. | | 29,445 | 627,179 |
| Micron Technology, Inc. (a) | | 36,285 | 1,907,140 |
| NVIDIA Corp. | | 5,688 | 1,536,158 |
| NXP Semiconductors NV | | 13,917 | 1,582,224 |
| ON Semiconductor Corp. (a) | | 16,241 | 303,057 |
| Qualcomm, Inc. | | 8,883 | 695,539 |
| Sanken Electric Co. Ltd. | | 258 | 6,116 |
| Skyworks Solutions, Inc. | | 1,939 | 194,249 |
| STMicroelectronics NV: | | | |
| (France) | | 7,506 | 207,164 |
| (NY Shares) unit (b) | | 6,510 | 178,374 |
| Xilinx, Inc. | | 409 | 34,147 |
| | | | 8,491,039 |
| Software - 6.4% | | | |
| Adobe, Inc. (a) | | 3,616 | 1,247,954 |
| Autodesk, Inc. (a) | | 16,855 | 3,217,282 |
| Avaya Holdings Corp. (a) | | 2,050 | 26,568 |
| Citrix Systems, Inc. | | 490 | 50,661 |
| Cloudflare, Inc. (a) | | 5,621 | 119,727 |
| Elastic NV (a) | | 6,937 | 512,367 |
| HubSpot, Inc. (a) | | 958 | 171,913 |
| LivePerson, Inc. (a) | | 16,630 | 440,030 |
| Microsoft Corp. | | 66,383 | 10,754,710 |
| Nortonlifelock, Inc. | | 1,198 | 22,798 |
| Nutanix, Inc. Class A (a) | | 1,373 | 32,732 |
| Oracle Corp. | | 3,083 | 152,485 |
| Parametric Technology Corp. (a) | | 505 | 38,153 |
| RingCentral, Inc. (a) | | 315 | 74,261 |
| Salesforce.com, Inc. (a) | | 10,100 | 1,721,040 |
| SS&C Technologies Holdings, Inc. | | 2,538 | 140,859 |
| Workday, Inc. Class A (a) | | 1,871 | 324,151 |
| Workiva, Inc. (a) | | 972 | 41,543 |
| Yext, Inc. (a)(b) | | 10,778 | 163,394 |
| Zendesk, Inc. (a) | | 1,691 | 134,113 |
| Zuora, Inc. (a) | | 762 | 10,089 |
| | | | 19,396,830 |
| Technology Hardware, Storage & Peripherals - 3.3% | | | |
| Apple, Inc. | | 33,999 | 9,293,967 |
| HP, Inc. | | 10,565 | 219,646 |
| Western Digital Corp. | | 7,357 | 408,755 |
| Xerox Holdings Corp. | | 8,354 | 268,999 |
| | | | 10,191,367 |
|
| TOTAL INFORMATION TECHNOLOGY | | | 45,350,584 |
|
| MATERIALS - 1.9% | | | |
| Chemicals - 1.1% | | | |
| Air Products & Chemicals, Inc. | | 2,254 | 495,001 |
| Albemarle Corp. U.S. (b) | | 3,261 | 266,913 |
| Amyris, Inc. (a)(b) | | 88,758 | 282,694 |
| Ecolab, Inc. | | 2,173 | 392,118 |
| FMC Corp. | | 2,452 | 228,281 |
| Innospec, Inc. | | 2,599 | 224,917 |
| Linde PLC | | 2,595 | 495,671 |
| Livent Corp. (a) | | 48,249 | 430,864 |
| Sherwin-Williams Co. | | 438 | 226,337 |
| Tronox Holdings PLC | | 15,380 | 112,889 |
| | | | 3,155,685 |
| Construction Materials - 0.1% | | | |
| Martin Marietta Materials, Inc. | | 750 | 170,648 |
| Summit Materials, Inc. (a) | | 10,909 | 213,162 |
| | | | 383,810 |
| Containers & Packaging - 0.2% | | | |
| Avery Dennison Corp. | | 1,514 | 173,338 |
| Crown Holdings, Inc. (a) | | 6,726 | 474,183 |
| | | | 647,521 |
| Metals & Mining - 0.5% | | | |
| Commercial Metals Co. | | 9,260 | 169,088 |
| First Quantum Minerals Ltd. | | 27,426 | 202,694 |
| Freeport-McMoRan, Inc. | | 23,386 | 232,925 |
| Kaiser Aluminum Corp. | | 2,345 | 221,720 |
| Newmont Corp. | | 12,406 | 553,680 |
| Reliance Steel & Aluminum Co. | | 2,224 | 227,493 |
| | | | 1,607,600 |
|
| TOTAL MATERIALS | | | 5,794,616 |
|
| REAL ESTATE - 2.0% | | | |
| Equity Real Estate Investment Trusts (REITs) - 1.9% | | | |
| Alexandria Real Estate Equities, Inc. | | 2,723 | 413,569 |
| American Homes 4 Rent Class A | | 4,711 | 121,968 |
| American Tower Corp. | | 4,589 | 1,040,785 |
| Corporate Office Properties Trust (SBI) | | 9,895 | 250,739 |
| CubeSmart | | 6,952 | 210,437 |
| Digital Realty Trust, Inc. | | 6,215 | 746,484 |
| Equinix, Inc. | | 921 | 527,549 |
| Equity Lifestyle Properties, Inc. | | 2,854 | 195,014 |
| Front Yard Residential Corp. Class B | | 19,560 | 248,021 |
| Lexington Corporate Properties Trust | | 2,800 | 29,036 |
| Omega Healthcare Investors, Inc. | | 3,235 | 128,106 |
| Potlatch Corp. | | 2,847 | 104,599 |
| Prologis, Inc. | | 8,714 | 734,416 |
| Public Storage | | 1,661 | 347,348 |
| Store Capital Corp. | | 2,435 | 80,014 |
| Welltower, Inc. | | 5,408 | 404,627 |
| Weyerhaeuser Co. | | 9,295 | 241,484 |
| | | | 5,824,196 |
| Real Estate Management & Development - 0.1% | | | |
| Cushman & Wakefield PLC (a) | | 15,601 | 283,782 |
|
| TOTAL REAL ESTATE | | | 6,107,978 |
|
| UTILITIES - 2.3% | | | |
| Electric Utilities - 1.5% | | | |
| Duke Energy Corp. | | 33 | 3,026 |
| Edison International | | 9,749 | 655,035 |
| Entergy Corp. | | 3,565 | 416,784 |
| Evergy, Inc. | | 10,454 | 683,169 |
| Exelon Corp. | | 22,047 | 950,446 |
| FirstEnergy Corp. | | 7,812 | 347,868 |
| NextEra Energy, Inc. | | 5,321 | 1,344,936 |
| Southern Co. | | 4,386 | 264,739 |
| | | | 4,666,003 |
| Independent Power and Renewable Electricity Producers - 0.1% | | | |
| Atlantica Yield PLC | | 32 | 925 |
| NRG Energy, Inc. | | 3,676 | 122,080 |
| The AES Corp. | | 11,191 | 187,225 |
| | | | 310,230 |
| Multi-Utilities - 0.7% | | | |
| CenterPoint Energy, Inc. | | 3,487 | 80,271 |
| Dominion Energy, Inc. | | 15,334 | 1,198,812 |
| Sempra Energy | | 6,326 | 884,248 |
| | | | 2,163,331 |
|
| TOTAL UTILITIES | | | 7,139,564 |
|
| TOTAL COMMON STOCKS | | | |
| (Cost $207,481,528) | | | 203,395,615 |
| | | Principal Amount | Value |
|
| U.S. Treasury Obligations - 0.1% | | | |
| U.S. Treasury Bills, yield at date of purchase 1.53% to 1.55% 4/16/20 to 5/14/20 | | | |
| (Cost $169,556) | | 170,000 | 169,629 |
| | | Shares | Value |
|
| Fixed-Income Funds - 33.8% | | | |
| Fidelity High Income Central Fund (c) | | 75,256 | $8,192,355 |
| Fidelity Investment Grade Bond Central Fund (c) | | 822,011 | 95,032,748 |
| TOTAL FIXED-INCOME FUNDS | | | |
| (Cost $101,350,278) | | | 103,225,103 |
|
| Money Market Funds - 1.4% | | | |
| Fidelity Cash Central Fund 1.60% (d) | | 2,779,426 | 2,779,982 |
| Fidelity Securities Lending Cash Central Fund 1.60% (d)(e) | | 1,447,205 | 1,447,350 |
| TOTAL MONEY MARKET FUNDS | | | |
| (Cost $4,227,332) | | | 4,227,332 |
| TOTAL INVESTMENT IN SECURITIES - 102.0% | | | |
| (Cost $313,228,694) | | | 311,017,679 |
| NET OTHER ASSETS (LIABILITIES) - (2.0)% | | | (5,954,035) |
| NET ASSETS - 100% | | | $305,063,644 |
Legend
(a) Non-income producing
(b) Security or a portion of the security is on loan at period end.
(c) Affiliated fund that is generally available only to investment companies and other accounts managed by Fidelity Investments. A complete unaudited schedule of portfolio holdings for each Fidelity Central Fund is filed with the SEC for the first and third quarters of each fiscal year on Form N-PORT and is available upon request or at the SEC's website at www.sec.gov. An unaudited holdings listing for the Fund, which presents direct holdings as well as the pro-rata share of securities and other investments held indirectly through its investment in underlying non-money market Fidelity Central Funds, is available at fidelity.com and/or institutional.fidelity.com, as applicable. In addition, each Fidelity Central Fund's financial statements are available on the SEC's website or upon request.
(d) Affiliated fund that is generally available only to investment companies and other accounts managed by Fidelity Investments. The rate quoted is the annualized seven-day yield of the fund at period end. A complete unaudited listing of the fund's holdings as of its most recent quarter end is available upon request. In addition, each Fidelity Central Fund's financial statements are available on the SEC's website or upon request.
(e) Investment made with cash collateral received from securities on loan.
Affiliated Central Funds
Information regarding fiscal year to date income earned by the Fund from investments in Fidelity Central Funds is as follows:
| Fund | Income earned |
| Fidelity Cash Central Fund | $32,285 |
| Fidelity High Income Central Fund | 171,486 |
| Fidelity Investment Grade Bond Central Fund | 923,316 |
| Fidelity Securities Lending Cash Central Fund | 4,830 |
| Total | $1,131,917 |
Amounts in the income column in the above table include any capital gain distributions from underlying funds, which are presented in the corresponding line-item in the Statement of Operations, if applicable. Amount for Fidelity Securities Lending Cash Central Fund represents the income earned on investing cash collateral, less rebates paid to borrowers and any lending agent fees associated with the loan, plus any premium payments received for lending certain types of securities.
Fiscal year to date information regarding the Fund’s investments in non-Money Market Central Funds, including the ownership percentage, is presented below.
| Fund | Value, beginning of period | Purchases | Sales Proceeds | Realized Gain/Loss | Change in Unrealized appreciation (depreciation) | Value, end of period | % ownership, end of period |
| Fidelity High Income Central Fund | $44,546 | $8,322,101 | $-- | $-- | $(174,292) | $8,192,355 | 0.4% |
| Fidelity Investment Grade Bond Central Fund | 503,800 | 92,494,786 | -- | -- | 2,034,162 | 95,032,748 | 0.3% |
| Total | $548,346 | $100,816,887 | $-- | $-- | $1,859,870 | $103,225,103 | |
Investment Valuation
The following is a summary of the inputs used, as of February 29, 2020, involving the Fund's assets and liabilities carried at fair value. The inputs or methodology used for valuing securities may not be an indication of the risk associated with investing in those securities. For more information on valuation inputs, and their aggregation into the levels used below, please refer to the Investment Valuation section in the accompanying Notes to Financial Statements.
| | Valuation Inputs at Reporting Date: |
| Description | Total | Level 1 | Level 2 | Level 3 |
| Investments in Securities: | | | | |
| Equities: | | | | |
| Communication Services | $20,133,492 | $20,056,877 | $76,615 | $-- |
| Consumer Discretionary | 20,568,238 | 19,762,812 | 805,426 | -- |
| Consumer Staples | 14,563,530 | 14,261,354 | 302,176 | -- |
| Energy | 7,484,324 | 6,961,584 | 522,740 | -- |
| Financials | 24,548,037 | 24,259,317 | 288,720 | -- |
| Health Care | 28,390,028 | 26,601,979 | 1,788,049 | -- |
| Industrials | 23,315,224 | 22,855,070 | 460,154 | -- |
| Information Technology | 45,350,584 | 45,143,420 | 207,164 | -- |
| Materials | 5,794,616 | 5,794,616 | -- | -- |
| Real Estate | 6,107,978 | 6,107,978 | -- | -- |
| Utilities | 7,139,564 | 7,139,564 | -- | -- |
| U.S. Government and Government Agency Obligations | 169,629 | -- | 169,629 | -- |
| Fixed-Income Funds | 103,225,103 | 103,225,103 | -- | -- |
| Money Market Funds | 4,227,332 | 4,227,332 | -- | -- |
| Total Investments in Securities: | $311,017,679 | $306,397,006 | $4,620,673 | $-- |
Other Information
The composition of credit quality ratings as a percentage of Total Net Assets is as follows (Unaudited):
| U.S. Government and U.S. Government Agency Obligations | 15.2% |
| AAA,AA,A | 3.9% |
| BBB | 8.8% |
| BB | 2.7% |
| B | 0.8% |
| CCC,CC,C | 0.3% |
| D | 0.1% |
| Not Rated | 0.9% |
| Equities | 66.8% |
| Short-Term Investments and Net Other Assets | 0.5% |
| | 100% |
We have used ratings from Moody's Investors Service, Inc. Where Moody's® ratings are not available, we have used S&P® ratings. All ratings are as of the date indicated and do not reflect subsequent changes.
See accompanying notes which are an integral part of the financial statements.
Financial Statements
Statement of Assets and Liabilities
| | | February 29, 2020 (Unaudited) |
| Assets | | |
Investment in securities, at value (including securities loaned of $1,430,945) — See accompanying schedule:
Unaffiliated issuers (cost $207,651,084) | $203,565,244 | |
| Fidelity Central Funds (cost $105,577,610) | 107,452,435 | |
| Total Investment in Securities (cost $313,228,694) | | $311,017,679 |
| Receivable for investments sold | | 901,769 |
| Receivable for fund shares sold | | 484,888 |
| Dividends receivable | | 378,401 |
| Distributions receivable from Fidelity Central Funds | | 9,491 |
| Total assets | | 312,792,228 |
| Liabilities | | |
| Payable to custodian bank | $3,196,570 | �� |
| Payable for investments purchased | 1,715,780 | |
| Payable for fund shares redeemed | 1,280,014 | |
| Accrued management fee | 88,066 | |
| Other payables and accrued expenses | 804 | |
| Collateral on securities loaned | 1,447,350 | |
| Total liabilities | | 7,728,584 |
| Net Assets | | $305,063,644 |
| Net Assets consist of: | | |
| Paid in capital | | $303,880,500 |
| Total accumulated earnings (loss) | | 1,183,144 |
| Net Assets | | $305,063,644 |
| Net Asset Value, offering price and redemption price per share ($305,063,644 ÷ 28,895,170 shares) | | $10.56 |
See accompanying notes which are an integral part of the financial statements.
Statement of Operations
| | | Six months ended February 29, 2020 (Unaudited) |
| Investment Income | | |
| Dividends | | $1,044,257 |
| Special dividends | | 274,812 |
| Interest | | 1,029 |
| Income from Fidelity Central Funds (including $4,830 from security lending) | | 1,061,184 |
| Total income | | 2,381,282 |
| Expenses | | |
| Management fee | $331,492 | |
| Independent trustees' fees and expenses | 331 | |
| Total expenses before reductions | 331,823 | |
| Expense reductions | (786) | |
| Total expenses after reductions | | 331,037 |
| Net investment income (loss) | | 2,050,245 |
| Realized and Unrealized Gain (Loss) | | |
| Net realized gain (loss) on: | | |
| Investment securities: | | |
| Unaffiliated issuers | 2,018,933 | |
| Foreign currency transactions | (84) | |
| Futures contracts | 292,587 | |
| Capital gain distributions from Fidelity Central Funds | 70,733 | |
| Total net realized gain (loss) | | 2,382,169 |
| Change in net unrealized appreciation (depreciation) on: | | |
| Investment securities: | | |
| Unaffiliated issuers | (4,096,585) | |
| Fidelity Central Funds | 1,859,870 | |
| Assets and liabilities in foreign currencies | (71) | |
| Total change in net unrealized appreciation (depreciation) | | (2,236,786) |
| Net gain (loss) | | 145,383 |
| Net increase (decrease) in net assets resulting from operations | | $2,195,628 |
See accompanying notes which are an integral part of the financial statements.
Statement of Changes in Net Assets
| | Six months ended February 29, 2020 (Unaudited) | For the period
June 14, 2019 (commencement of operations) to August 31, 2019 |
| Increase (Decrease) in Net Assets | | |
| Operations | | |
| Net investment income (loss) | $2,050,245 | $6,668 |
| Net realized gain (loss) | 2,382,169 | 3,025 |
| Change in net unrealized appreciation (depreciation) | (2,236,786) | 25,700 |
| Net increase (decrease) in net assets resulting from operations | 2,195,628 | 35,393 |
| Distributions to shareholders | (1,047,128) | (750) |
| Share transactions | | |
| Proceeds from sales of shares | 324,897,942 | 1,593,622 |
| Reinvestment of distributions | 1,047,128 | 750 |
| Cost of shares redeemed | (23,658,941) | – |
| Net increase (decrease) in net assets resulting from share transactions | 302,286,129 | 1,594,372 |
| Total increase (decrease) in net assets | 303,434,629 | 1,629,015 |
| Net Assets | | |
| Beginning of period | 1,629,015 | – |
| End of period | $305,063,644 | $1,629,015 |
| Other Information | | |
| Shares | | |
| Sold | 30,796,761 | 159,126 |
| Issued in reinvestment of distributions | 96,786 | 73 |
| Redeemed | (2,157,576) | – |
| Net increase (decrease) | 28,735,971 | 159,199 |
See accompanying notes which are an integral part of the financial statements.
Financial Highlights
Fidelity Balanced K6 Fund
| | Six months ended (Unaudited) February 29, | Years endedAugust 31, |
| | 2020 | 2019 A |
| Selected Per–Share Data | | |
| Net asset value, beginning of period | $10.23 | $10.00 |
| Income from Investment Operations | | |
| Net investment income (loss)B | .11C | .04 |
| Net realized and unrealized gain (loss) | .27 | .20 |
| Total from investment operations | .38 | .24 |
| Distributions from net investment income | (.04) | (.01) |
| Distributions from net realized gain | (.01) | – |
| Total distributions | (.05) | (.01) |
| Net asset value, end of period | $10.56 | $10.23 |
| Total ReturnD,E | 3.71% | 2.35% |
| Ratios to Average Net AssetsF,G | | |
| Expenses before reductions | .32%H | .32%H |
| Expenses net of fee waivers, if any | .32%H | .32%H |
| Expenses net of all reductions | .32%H | .32%H |
| Net investment income (loss) | 2.06%C,H | 2.00%H |
| Supplemental Data | | |
| Net assets, end of period (000 omitted) | $305,064 | $1,629 |
| Portfolio turnover rateI | 83%H,J | 6%K |
A For the period June 14, 2019 (commencement of operations) to August 31, 2019.
B Calculated based on average shares outstanding during the period.
C Net investment income per share reflects a large, non-recurring dividend which amounted to $.01 per share. This dividend is not annualized in the ratio of net investment income (loss) to average net assets. Excluding this non-recurring dividend the ratio of net investment income (loss) to average net assets would have been 1.79%.
D Total returns for periods of less than one year are not annualized.
E Total returns would have been lower if certain expenses had not been reduced during the applicable periods shown.
F Fees and expenses of any underlying Fidelity Central Funds are not included in the Fund's expense ratio. The Fund indirectly bears its proportionate share of the expenses of any underlying Fidelity Central Funds. Based on their most recent shareholder report date, the expenses of any underlying non-money market Fidelity Central Funds were less than .005%.
G Expense ratios reflect operating expenses of the Fund. Expenses before reductions do not reflect amounts reimbursed by the investment adviser or reductions from brokerage service arrangements or reductions from other expense offset arrangements and do not represent the amount paid by the Fund during periods when reimbursements or reductions occur. Expense ratios before reductions for start-up periods may not be representative of longer term operating periods. Expenses net of fee waivers reflect expenses after reimbursement by the investment adviser but prior to reductions from brokerage service arrangements or other expense offset arrangements. Expenses net of all reductions represent the net expenses paid by the Fund.
H Annualized
I Amount does not include the portfolio activity of any underlying Fidelity Central Funds.
J Portfolio turnover rate excludes securities received or delivered in-kind.
K Amount not annualized.
See accompanying notes which are an integral part of the financial statements.
Notes to Financial Statements (Unaudited)
For the period ended February 29, 2020
1. Organization.
Fidelity Balanced K6 Fund (the Fund) is a fund of Fidelity Puritan Trust (the Trust) and is authorized to issue an unlimited number of shares. Share transactions on the Statement of Changes in Net Assets may contain exchanges between affiliated funds. The Trust is registered under the Investment Company Act of 1940, as amended (the 1940 Act), as an open-end management investment company organized as a Massachusetts business trust. Shares generally are available only to employer-sponsored retirement plans that are recordkept by Fidelity, or to certain employer-sponsored retirement plans that are not recordkept by Fidelity.
Effective January 1, 2020:
Investment advisers Fidelity Investments Money Management, Inc., FMR Co., Inc., and Fidelity SelectCo, LLC, merged with and into Fidelity Management & Research Company. In connection with the merger transactions, the resulting, merged investment adviser was then redomiciled from Massachusetts to Delaware, changed its corporate structure from a corporation to a limited liability company, and changed its name to "Fidelity Management & Research Company LLC".
2. Investments in Fidelity Central Funds.
The Fund invests in Fidelity Central Funds, which are open-end investment companies generally available only to other investment companies and accounts managed by the investment adviser and its affiliates. The Fund's Schedule of Investments lists each of the Fidelity Central Funds held as of period end, if any, as an investment of the Fund, but does not include the underlying holdings of each Fidelity Central Fund. As an Investing Fund, the Fund indirectly bears its proportionate share of the expenses of the underlying Fidelity Central Funds.
Based on its investment objective, each Fidelity Central Fund may invest or participate in various investment vehicles or strategies that are similar to those of the Fund. These strategies are consistent with the investment objectives of the Fund and may involve certain economic risks which may cause a decline in value of each of the Fidelity Central Funds and thus a decline in the value of the Fund. The Money Market Central Funds seek preservation of capital and current income and are managed by the investment adviser. Annualized expenses of the Money Market Central Funds as of their most recent shareholder report date ranged from less than .005% to .01%. The following summarizes the Fund's investment in each non-money market Fidelity Central Fund.
| Fidelity Central Fund | Investment Manager | Investment Objective | Investment Practices | Expense Ratio(a) |
| Fidelity High Income Central Fund | FMR | Seeks a high level of income and may also seek capital appreciation by investing primarily in debt securities, preferred stocks, and convertible securities, with an emphasis on lower-quality debt securities. | Delayed Delivery & When Issued Securities
Loans & Direct Debt Instruments
Restricted Securities
| Less than .005% |
| Fidelity Investment Grade Bond Central Fund | FMR | Seeks a high level of income by normally investing in investment–grade debt securities. | Delayed Delivery & When Issued Securities
Restricted Securities
Swaps | Less than .005% |
(a) Expenses expressed as a percentage of average net assets and are as of each underlying Central Fund's most recent annual or semi-annual shareholder report.
An unaudited holdings listing for the Fund, which presents direct holdings as well as the pro-rata share of any securities and other investments held indirectly through its investment in underlying non-money market Fidelity Central Funds, is available at fidelity.com. A complete unaudited list of holdings for each Fidelity Central Fund is available upon request or at the Securities and Exchange Commission (the SEC) website at www.sec.gov. In addition, the financial statements of the Fidelity Central Funds which contain the significant accounting policies (including investment valuation policies) of those funds are available on the SEC website or upon request.
3. Significant Accounting Policies.
The Fund is an investment company and applies the accounting and reporting guidance of the Financial Accounting Standards Board (FASB) Accounting Standards Codification Topic 946 Financial Services – Investments Companies. The financial statements have been prepared in conformity with accounting principles generally accepted in the United States of America (GAAP), which require management to make certain estimates and assumptions at the date of the financial statements. Actual results could differ from those estimates. Subsequent events, if any, through the date that the financial statements were issued have been evaluated in the preparation of the financial statements. The following summarizes the significant accounting policies of the Fund:
Investment Valuation. Investments are valued as of 4:00 p.m. Eastern time on the last calendar day of the period. The Board of Trustees (the Board) has delegated the day to day responsibility for the valuation of the Fund's investments to the Fair Value Committee (the Committee) established by the Fund's investment adviser. In accordance with valuation policies and procedures approved by the Board, the Fund attempts to obtain prices from one or more third party pricing vendors or brokers to value its investments. When current market prices, quotations or currency exchange rates are not readily available or reliable, investments will be fair valued in good faith by the Committee, in accordance with procedures adopted by the Board. Factors used in determining fair value vary by investment type and may include market or investment specific events, changes in interest rates and credit quality. The frequency with which these procedures are used cannot be predicted and they may be utilized to a significant extent. The Committee oversees the Fund's valuation policies and procedures and reports to the Board on the Committee's activities and fair value determinations. The Board monitors the appropriateness of the procedures used in valuing the Fund's investments and ratifies the fair value determinations of the Committee.
The Fund categorizes the inputs to valuation techniques used to value its investments into a disclosure hierarchy consisting of three levels as shown below:
- Level 1 – quoted prices in active markets for identical investments
- Level 2 – other significant observable inputs (including quoted prices for similar investments, interest rates, prepayment speeds, etc.)
- Level 3 – unobservable inputs (including the Fund's own assumptions based on the best information available)
Valuation techniques used to value the Fund's investments by major category are as follows:
Equity securities, including restricted securities, for which market quotations are readily available, are valued at the last reported sale price or official closing price as reported by a third party pricing vendor on the primary market or exchange on which they are traded and are categorized as Level 1 in the hierarchy. In the event there were no sales during the day or closing prices are not available, securities are valued at the last quoted bid price or may be valued using the last available price and are generally categorized as Level 2 in the hierarchy. For foreign equity securities, when market or security specific events arise, comparisons to the valuation of American Depositary Receipts (ADRs), futures contracts, Exchange-Traded Funds (ETFs) and certain indexes as well as quoted prices for similar securities may be used and would be categorized as Level 2 in the hierarchy. For equity securities, including restricted securities, where observable inputs are limited, assumptions about market activity and risk are used and these securities may be categorized as Level 3 in the hierarchy.
Debt securities, including restricted securities, are valued based on evaluated prices received from third party pricing vendors or from brokers who make markets in such securities. U.S. government and government agency obligations are valued by pricing vendors who utilize matrix pricing which considers yield or price of bonds of comparable quality, coupon, maturity and type or by broker-supplied prices. When independent prices are unavailable or unreliable, debt securities may be valued utilizing pricing methodologies which consider similar factors that would be used by third party pricing vendors. Debt securities are generally categorized as Level 2 in the hierarchy but may be Level 3 depending on the circumstances.
Investments in open-end mutual funds, including the Fidelity Central Funds, are valued at their closing net asset value (NAV) each business day and are categorized as Level 1 in the hierarchy.
Changes in valuation techniques may result in transfers in or out of an assigned level within the disclosure hierarchy. The aggregate value of investments by input level as of February 29, 2020 is included at the end of the Fund's Schedule of Investments.
Foreign Currency. The Fund may use foreign currency contracts to facilitate transactions in foreign-denominated securities. Gains and losses from these transactions may arise from changes in the value of the foreign currency or if the counterparties do not perform under the contracts' terms.
Foreign-denominated assets, including investment securities, and liabilities are translated into U.S. dollars at the exchange rates at period end. Purchases and sales of investment securities, income and dividends received and expenses denominated in foreign currencies are translated into U.S. dollars at the exchange rate in effect on the transaction date.
The effects of exchange rate fluctuations on investments are included with the net realized and unrealized gain (loss) on investment securities. Other foreign currency transactions resulting in realized and unrealized gain (loss) are disclosed separately.
Investment Transactions and Income. For financial reporting purposes, the Fund's investment holdings and NAV include trades executed through the end of the last business day of the period. The NAV per share for processing shareholder transactions is calculated as of the close of business of the New York Stock Exchange (NYSE), normally 4:00 p.m. Eastern time and includes trades executed through the end of the prior business day. Gains and losses on securities sold are determined on the basis of identified cost. Dividend income is recorded on the ex-dividend date, except for certain dividends from foreign securities where the ex-dividend date may have passed, which are recorded as soon as the Fund is informed of the ex-dividend date. Non-cash dividends included in dividend income, if any, are recorded at the fair market value of the securities received. Income and capital gain distributions from Fidelity Central Funds, if any, are recorded on the ex-dividend date. Certain distributions received by the Fund represent a return of capital or capital gain. The Fund determines the components of these distributions subsequent to the ex-dividend date, based upon receipt of tax filings or other correspondence relating to the underlying investment. These distributions are recorded as a reduction of cost of investments and/or as a realized gain. Large, non-recurring dividends recognized by the Fund are presented separately on the Statement of Operations as "Special Dividends" and the impact of these dividends is presented in the Financial Highlights. Interest income is accrued as earned and includes coupon interest and amortization of premium and accretion of discount on debt securities as applicable. Investment income is recorded net of foreign taxes withheld where recovery of such taxes is uncertain.
Expenses. Expenses directly attributable to a fund are charged to that fund. Expenses attributable to more than one fund are allocated among the respective funds on the basis of relative net assets or other appropriate methods. Expense estimates are accrued in the period to which they relate and adjustments are made when actual amounts are known.
Income Tax Information and Distributions to Shareholders. Each year, the Fund intends to qualify as a regulated investment company under Subchapter M of the Internal Revenue Code, including distributing substantially all of its taxable income and realized gains. As a result, no provision for U.S. Federal income taxes is required. The Fund files a U.S. federal tax return, in addition to state and local tax returns as required. The Fund's federal income tax returns are subject to examination by the Internal Revenue Service (IRS) for a period of three fiscal years after they are filed. State and local tax returns may be subject to examination for an additional fiscal year depending on the jurisdiction. Foreign taxes are provided for based on the Fund's understanding of the tax rules and rates that exist in the foreign markets in which it invests.
Distributions are declared and recorded on the ex-dividend date. Income and capital gain distributions are determined in accordance with income tax regulations, which may differ from GAAP.
Capital accounts within the financial statements are adjusted for permanent book-tax differences. These adjustments have no impact on net assets or the results of operations. Capital accounts are not adjusted for temporary book-tax differences which will reverse in a subsequent period.
Book-tax differences are primarily due to foreign currency transactions, partnerships and losses deferred due to wash sales.
As of period end, the cost and unrealized appreciation (depreciation) in securities, and derivatives if applicable, for federal income tax purposes were as follows:
| Gross unrealized appreciation | $11,685,765 |
| Gross unrealized depreciation | (14,088,640) |
| Net unrealized appreciation (depreciation) | $(2,402,875) |
| Tax cost | $313,420,554 |
4. Derivative Instruments.
Risk Exposures and the Use of Derivative Instruments. The Fund's investment objective allows the Fund to enter into various types of derivative contracts, including futures contracts. Derivatives are investments whose value is primarily derived from underlying assets, indices or reference rates and may be transacted on an exchange or over-the-counter (OTC). Derivatives may involve a future commitment to buy or sell a specified asset based on specified terms, to exchange future cash flows at periodic intervals based on a notional principal amount, or for one party to make one or more payments upon the occurrence of specified events in exchange for periodic payments from the other party.
The Fund used derivatives to increase returns and to manage exposure to certain risks as defined below. The success of any strategy involving derivatives depends on analysis of numerous economic factors, and if the strategies for investment do not work as intended, the Fund may not achieve its objectives.
The Fund's use of derivatives increased or decreased its exposure to the following risk:
| Equity Risk | Equity risk relates to the fluctuations in the value of financial instruments as a result of changes in market prices (other than those arising from interest rate risk or foreign exchange risk), whether caused by factors specific to an individual investment, its issuer, or all factors affecting all instruments traded in a market or market segment.
|
The Fund is also exposed to additional risks from investing in derivatives, such as liquidity risk and counterparty credit risk. Liquidity risk is the risk that the Fund will be unable to close out the derivative in the open market in a timely manner. Counterparty credit risk is the risk that the counterparty will not be able to fulfill its obligation to the Fund. Counterparty credit risk related to exchange-traded futures contracts may be mitigated by the protection provided by the exchange on which they trade.
Investing in derivatives may involve greater risks than investing in the underlying assets directly and, to varying degrees, may involve risk of loss in excess of any initial investment and collateral received and amounts recognized in the Statement of Assets and Liabilities. In addition, there may be the risk that the change in value of the derivative contract does not correspond to the change in value of the underlying instrument.
Futures Contracts. A futures contract is an agreement between two parties to buy or sell a specified underlying instrument for a fixed price at a specified future date. The Fund used futures contracts to manage its exposure to the stock market.
Upon entering into a futures contract, a fund is required to deposit either cash or securities (initial margin) with a clearing broker in an amount equal to a certain percentage of the face value of the contract. Futures contracts are marked-to-market daily and subsequent daily payments (variation margin) are made or received by a fund depending on the daily fluctuations in the value of the futures contracts and are recorded as unrealized appreciation or (depreciation). This receivable and/or payable, if any, is included in daily variation margin on futures contracts in the Statement of Assets and Liabilities. Realized gain or (loss) is recorded upon the expiration or closing of a futures contract. The net realized gain (loss) and change in net unrealized appreciation (depreciation) on futures contracts during the period is presented in the Statement of Operations.
Any open futures contracts at period end are presented in the Schedule of Investments under the caption "Futures Contracts". The notional amount at value reflects each contract's exposure to the underlying instrument or index at period end.
5. Purchases and Sales of Investments.
Purchases and sales of securities, other than short-term securities and in-kind transactions, are noted in the table below.
| | Purchases ($) | Sales ($) |
| Fidelity Balanced K6 Fund | 93,065,776 | 61,431,748 |
Unaffiliated Exchanges In-Kind. During the period, the Fund received investments and cash valued at $276,640,885 in exchange for 26,374,986 shares of the Fund. The amount of in-kind exchanges is included in share transactions in the accompanying Statement of Changes in Net Assets.
6. Fees and Other Transactions with Affiliates.
Management Fee. Fidelity Management & Research Company LLC (the investment adviser) and its affiliates provide the Fund with investment management related services for which the Fund pays a monthly management fee that is based on an annual rate of .32% of average net assets. Under the management contract, the investment adviser or an affiliate pays all other expenses of the Fund, excluding fees and expenses of the independent Trustees, and certain miscellaneous expenses such as proxy and shareholder meeting expenses.
Brokerage Commissions. A portion of portfolio transactions were placed with brokerage firms which are affiliates of the investment adviser. Brokerage commissions are included in net realized gain (loss) and change in net unrealized appreciation (depreciation) in the Statement of Operations. The commissions paid to these affiliated firms were as follows:
| | Amount |
| Fidelity Balanced K6 Fund | $2,713 |
Interfund Trades. Funds may purchase from or sell securities to other Fidelity Funds under procedures adopted by the Board. The procedures have been designed to ensure these interfund trades are executed in accordance with Rule 17a-7 of the 1940 Act. Interfund trades are included within the respective purchases and sales amounts shown in the Purchases and Sales of Investments note.
7. Security Lending.
The Fund lends portfolio securities from time to time in order to earn additional income. For equity securities, lending agents are used, including National Financial Services (NFS), an affiliate of the Fund. Pursuant to a securities lending agreement, NFS will receive a fee, which is capped at 9.9% of daily lending revenue, for its services as lending agent. The Fund may lend securities to certain qualified borrowers, including NFS. On the settlement date of the loan, the Fund receives collateral (in the form of U.S. Treasury obligations, letters of credit and/or cash) against the loaned securities and maintains collateral in an amount not less than 100% of the market value of the loaned securities during the period of the loan. The market value of the loaned securities is determined at the close of business of the Fund and any additional required collateral is delivered to the Fund on the next business day. The Fund or borrower may terminate the loan at any time, and if the borrower defaults on its obligation to return the securities loaned because of insolvency or other reasons, the Fund may apply collateral received from the borrower against the obligation. The Fund may experience delays and costs in recovering the securities loaned. Any cash collateral received is invested in the Fidelity Securities Lending Cash Central Fund. The value of loaned securities and cash collateral at period end are disclosed on the Fund's Statement of Assets and Liabilities. Total fees paid by the Fund to NFS, as lending agent, amounted to $488. Security lending income represents the income earned on investing cash collateral, less rebates paid to borrowers and any lending agent fees associated with the loan, plus any premium payments received for lending certain types of securities. Security lending income is presented in the Statement of Operations as a component of income from Fidelity Central Funds. During the period, there were no securities loaned to NFS.
8. Expense Reductions.
Commissions paid to certain brokers with whom the investment adviser, or its affiliates, places trades on behalf of the Fund include an amount in addition to trade execution, which may be rebated back to the Fund to offset certain expenses. This amount totaled $693 for the period. In addition, through arrangements with the Fund's custodian, credits realized as a result of certain uninvested cash balances were used to reduce the Fund's expenses by $93.
9. Other.
The Fund's organizational documents provide former and current trustees and officers with a limited indemnification against liabilities arising in connection with the performance of their duties to the Fund. In the normal course of business, the Fund may also enter into contracts that provide general indemnifications. The Fund's maximum exposure under these arrangements is unknown as this would be dependent on future claims that may be made against the Fund. The risk of material loss from such claims is considered remote.
10. Coronavirus (COVID-19) Pandemic.
An outbreak of COVID-19 first detected in China during December 2019 has since spread globally and was declared a pandemic by the World Health Organization during March 2020. Developments that disrupt global economies and financial markets, such as the COVID-19 pandemic, may magnify factors that affect the Fund's performance.
Shareholder Expense Example
As a shareholder of the Fund, you incur two types of costs: (1) transaction costs and (2) ongoing costs, including management fees and other Fund expenses. This Example is intended to help you understand your ongoing costs (in dollars) of investing in the Fund and to compare these costs with the ongoing costs of investing in other mutual funds.
The Example is based on an investment of $1,000 invested at the beginning of the period and held for the entire period (September 1, 2019 to February 29, 2020).
Actual Expenses
The first line of the accompanying table provides information about actual account values and actual expenses. You may use the information in this line, together with the amount you invested, to estimate the expenses that you paid over the period. Simply divide your account value by $1,000.00 (for example, an $8,600 account value divided by $1,000.00 = 8.6), then multiply the result by the number in the first line under the heading entitled "Expenses Paid During Period" to estimate the expenses you paid on your account during this period. In addition, the Fund, as a shareholder in the underlying Fidelity Central Funds, will indirectly bear its pro-rata share of the fees and expenses incurred by the underlying Fidelity Central Funds. These fees and expenses are not included in the Fund's annualized expense ratio used to calculate the expense estimate in the table below.
Hypothetical Example for Comparison Purposes
The second line of the accompanying table provides information about hypothetical account values and hypothetical expenses based on the Fund's actual expense ratio and an assumed rate of return of 5% per year before expenses, which is not the Fund's actual return. The hypothetical account values and expenses may not be used to estimate the actual ending account balance or expenses you paid for the period. You may use this information to compare the ongoing costs of investing in the Fund and other funds. To do so, compare this 5% hypothetical example with the 5% hypothetical examples that appear in the shareholder reports of the other funds. In addition, the Fund, as a shareholder in the underlying Fidelity Central Funds, will indirectly bear its pro-rata share of the fees and expenses incurred by the underlying Fidelity Central Funds. These fees and expenses are not included in the Fund's annualized expense ratio used to calculate the expense estimate in the table below.
Please note that the expenses shown in the table are meant to highlight your ongoing costs only and do not reflect any transaction costs. Therefore, the second line of the table is useful in comparing ongoing costs only, and will not help you determine the relative total costs of owning different funds.
| | Annualized Expense Ratio-A | Beginning
Account Value
September 1, 2019 | Ending
Account Value
February 29, 2020 | Expenses Paid
During Period-B
September 1, 2019
to February 29, 2020 |
| Actual | .32% | $1,000.00 | $1,037.10 | $1.62 |
| Hypothetical-C | | $1,000.00 | $1,023.27 | $1.61 |
A Annualized expense ratio reflects expenses net of applicable fee waivers.
B Expenses are equal to the Fund's annualized expense ratio, multiplied by the average account value over the period, multiplied by 182/366 (to reflect the one-half year period). The fees and expenses of the underlying Fidelity Central Funds in which the Fund invests are not included in the Fund's annualized expense ratio. In addition to the expenses noted above, the Fund also indirectly bears its proportional share of the expenses of the underlying Fidelity Central Funds. Annualized expenses of the underlying non-money market Fidelity Central Funds as of their most recent fiscal half year were less than .005%.
C 5% return per year before expenses
Board Approval of Investment Advisory Contracts and Management Fees
Fidelity Balanced K6 Fund
Each year, the Board of Trustees, including the Independent Trustees (together, the Board), votes on the renewal of the management contract with Fidelity Management & Research Company LLC (FMR) and the sub-advisory agreements (together, the Advisory Contracts) for the fund. FMR and the sub-advisers are referred to herein as the Investment Advisers. The Board, assisted by the advice of fund counsel and Independent Trustees' counsel, requests and considers a broad range of information relevant to the renewal of the Advisory Contracts throughout the year.
Approval of Amended and Restated Advisory Contracts. At its November 2019 meeting, the Board unanimously determined to approve an amended and restated management contract and sub-advisory agreements (Amended and Restated Contracts) for a stub period of January 1, 2020 through January 31, 2020 in connection with a consolidation of certain of Fidelity's advisory businesses. The Board considered that, on or about January 1, 2020, FMR Co., Inc. (FMRC) and Fidelity Investments Money Management, Inc. (FIMM) expected to merge with and into FMR and, after the merger, FMR expected to redomicile as a Delaware limited liability company. The Board also approved the termination of the sub-advisory agreements with FMRC and FIMM upon the completion of the merger. The Board noted that references to FMR in the Amended and Restated Contracts would be updated to reflect FMR's new form of organization and domicile. The Board also noted Fidelity's assurance that neither the planned consolidation nor the Amended and Restated Contracts will change the investment processes, the level or nature of services provided, the resources and personnel allocated, trading and compliance operations, or any fees paid by the fund.
The Board meets regularly and, at each of its meetings, covers an extensive agenda of topics and materials and considers factors that are relevant to its annual consideration of the renewal of the fund's Advisory Contracts, including the services and support provided to the fund and its shareholders. The Board has established various standing committees (Committees), each composed of and chaired by Independent Trustees with varying backgrounds, to which the Board has assigned specific subject matter responsibilities in order to enhance effective decision-making by the Board. The Board, acting directly and through its Committees, requests and receives information concerning the annual consideration of the renewal of the fund's Advisory Contracts. The Board also meets as needed to review matters specifically related to the Board's annual consideration of the renewal of the Advisory Contracts. Members of the Board may also meet with trustees of other Fidelity funds through joint ad hoc committees to discuss certain matters relevant to all of the Fidelity funds.
At its January 2020 meeting, the Board unanimously determined to renew the fund's Advisory Contracts. In reaching its determination, the Board considered all factors it believed relevant, including (i) the nature, extent, and quality of the services provided to the fund and its shareholders (including the investment performance of the fund); (ii) the competitiveness of the fund's management fee and total expense ratio relative to peer funds; (iii) the total costs of the services provided by and the profits realized by Fidelity from its relationships with the fund; and (iv) the extent to which, if any, economies of scale exist and are realized as the fund grows, and whether any economies of scale are appropriately shared with fund shareholders.
In considering whether to renew the Advisory Contracts for the fund, the Board reached a determination, with the assistance of fund counsel and Independent Trustees' counsel and through the exercise of its business judgment, that the renewal of the Advisory Contracts was in the best interests of the fund and its shareholders and that the compensation payable under the Advisory Contracts was fair and reasonable. The Board's decision to renew the Advisory Contracts was not based on any single factor, but rather was based on a comprehensive consideration of all the information provided to the Board at its meetings throughout the year. The Board, in reaching its determination to renew the Advisory Contracts, was aware that shareholders of the fund have a broad range of investment choices available to them, including a wide choice among funds offered by Fidelity's competitors, and that the fund's shareholders, who have the opportunity to review and weigh the disclosure provided by the fund in its prospectus and other public disclosures, have chosen to invest in this fund, which is part of the Fidelity family of funds.
Nature, Extent, and Quality of Services Provided. The Board considered Fidelity's staffing as it relates to the fund, including the backgrounds of investment personnel of Fidelity, and also considered the fund's investment objective, strategies, and related investment philosophy. The Independent Trustees also had discussions with senior management of Fidelity's investment operations and investment groups. The Board considered the structure of the investment personnel compensation program and whether this structure provides appropriate incentives to act in the best interests of the fund. Additionally, the Board considered the portfolio managers' investments, if any, in the funds that they manage.
Resources Dedicated to Investment Management and Support Services. The Board and the Fund Oversight and Research Committees reviewed the general qualifications and capabilities of Fidelity's investment staff, including its size, education, experience, and resources, as well as Fidelity's approach to recruiting, training, managing, and compensating investment personnel. The Board noted that Fidelity has continued to increase the resources devoted to non-U.S. offices, including expansion of Fidelity's global investment organization. The Board also noted that Fidelity's analysts have extensive resources, tools and capabilities that allow them to conduct sophisticated quantitative and fundamental analysis, as well as credit analysis of issuers, counterparties and guarantors. Further, the Board considered that Fidelity's investment professionals have sufficient access to global information and data so as to provide competitive investment results over time, and that those professionals also have access to sophisticated tools that permit them to assess portfolio construction and risk and performance attribution characteristics continuously, as well as to transmit new information and research conclusions rapidly around the world. Additionally, in its deliberations, the Board considered Fidelity's trading, risk management, compliance, and technology and operations capabilities and resources, which are integral parts of the investment management process.
Shareholder and Administrative Services. The Board considered (i) the nature, extent, quality, and cost of advisory, administrative, and shareholder services performed by the Investment Advisers and their affiliates under the Advisory Contracts and under separate agreements covering transfer agency, pricing and bookkeeping, and securities lending services for the fund; (ii) the nature and extent of the supervision of third party service providers, principally custodians, subcustodians, and pricing vendors; and (iii) the resources devoted to, and the record of compliance with, the fund's compliance policies and procedures. The Board also reviewed the allocation of fund brokerage, including allocations to brokers affiliated with the Investment Advisers, the use of brokerage commissions to pay fund expenses, and the use of "soft" commission dollars to pay for research services.
The Board noted that the growth of fund assets over time across the complex allows Fidelity to reinvest in the development of services designed to enhance the value and convenience of the Fidelity funds as investment vehicles. These services include 24-hour access to account information and market information over the Internet and through telephone representatives, investor education materials and asset allocation tools, and the expanded availability of Fidelity Investor Centers.
The Board noted that it and the boards of certain other Fidelity funds had formed an ad hoc Committee on Transfer Agency Fees to review the variety of transfer agency fee structures throughout the industry and Fidelity's competitive positioning with respect to industry participants.
Investment in a Large Fund Family. The Board considered the benefits to shareholders of investing in a Fidelity fund, including the benefits of investing in a fund that is part of a large family of funds offering a variety of investment disciplines and providing a large variety of mutual fund investor services. The Board noted that Fidelity had taken, or had made recommendations that resulted in the Fidelity funds taking, a number of actions over the previous year that benefited particular funds, including: (i) continuing to dedicate additional resources to Fidelity's investment research process, which includes meetings with management of issuers of securities in which the funds invest, and to the support of the senior management team that oversees asset management; (ii) continuing efforts to enhance Fidelity's global research capabilities; (iii) launching new funds and ETFs with innovative structures, strategies and pricing and making other enhancements to meet client needs; (iv) launching new share classes of existing funds; (v) eliminating purchase minimums and broadening eligibility requirements for certain funds and share classes; (vi) reducing management fees and total expenses for certain target date funds and index funds; (vii) lowering expense caps for certain existing funds and classes, and converting certain voluntary expense caps to contractual caps, to reduce expenses borne by shareholders; (viii) rationalizing product lines and gaining increased efficiencies from fund mergers, liquidations, and share class consolidations; (ix) continuing to develop, acquire and implement systems and technology to improve services to the funds and shareholders, strengthen information security, and increase efficiency; and (x) continuing to implement enhancements to further strengthen Fidelity's product line to increase investors' probability of success in achieving their investment goals, including retirement income goals.
Investment Performance. The Board considered whether the fund has operated in accordance with its investment objective, as well as its record of compliance with its investment restrictions. As the fund recently commenced operations, the Board did not believe that it was appropriate to assign significant weight to its limited investment performance.
Based on its review, the Board concluded that the nature, extent, and quality of services provided to the fund under the Advisory Contracts should continue to benefit the shareholders of the fund.
Competitiveness of Management Fee and Total Expense Ratio. The Board considered the fund's management fee and total expense ratio compared to "mapped groups" of competitive funds and classes created for the purpose of facilitating the Trustees' competitive analysis of management fees and total expenses. Fidelity creates "mapped groups" by combining similar Lipper investment objective categories that have comparable investment mandates. Combining Lipper investment objective categories aids the Board's management fee and total expense ratio comparisons by broadening the competitive group used for comparison.
Management Fee. The Board considered two proprietary management fee comparisons for the period of the fund's operations ended June 30 shown in basis points (BP) in the chart below. The group of Lipper funds used by the Board for management fee comparisons is referred to below as the "Total Mapped Group." The Total Mapped Group comparison focuses on a fund's standing in terms of gross management fees before expense reimbursements or caps relative to the total universe of funds with comparable investment mandates, regardless of whether their management fee structures also are comparable. Funds with comparable investment mandates offer exposure to similar types of securities. Funds with comparable management fee structures have similar management fee contractual arrangements (
e.g., flat rate charged for advisory services, all-inclusive fee rate,
etc.). "TMG %" represents the percentage of funds in the Total Mapped Group that had management fees that were lower than the fund's. For example, a hypothetical TMG % of 20% would mean that 80% of the funds in the Total Mapped Group had higher, and 20% had lower, management fees than the fund. The fund's actual TMG % and the number of funds in the Total Mapped Group are in the chart below. The "Asset-Sized Peer Group" (ASPG) comparison focuses on a fund's standing relative to a subset of non-Fidelity funds within the Total Mapped Group that are similar in size and management fee structure. For example, if a fund is in the first quartile of the ASPG, the fund's management fee ranks in the least expensive or lowest 25% of funds in the ASPG. The ASPG represents at least 15% of the funds in the Total Mapped Group with comparable asset size and management fee structures, subject to a minimum of 50 funds (or all funds in the Total Mapped Group if fewer than 50). Additional information, such as the ASPG quartile in which the fund's management fee rate ranked is also included in the chart and was considered by the Board.
Fidelity Balanced K6 Fund
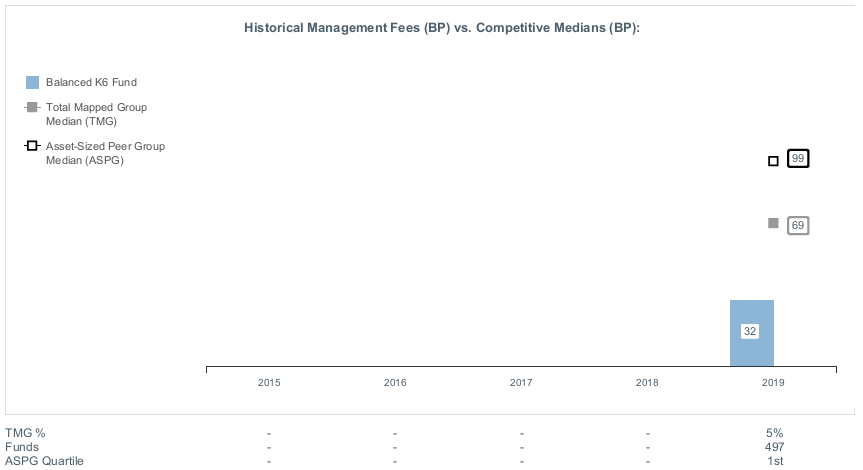
The Board noted that the fund's management fee rate ranked below the median of its Total Mapped Group and below the median of its ASPG for the period ended June 30, 2019.
The Board noted that it and the boards of other Fidelity funds formed an ad hoc Committee on Group Fee, which meets periodically, to conduct an in-depth review of the "group fee" component of the management fee of funds with such management fee structures. The Committee's focus included the mechanics of the group fee, the competitive landscape of group fee structures, Fidelity funds with no group fee component (such as the fund) and investment products not included in group fee assets. The Board also considered that, for funds subject to the group fee, FMR agreed to voluntarily waive fees over a specified period of time in amounts designed to account for assets converted from certain funds to certain collective investment trusts.
The Board also noted that, in 2013, the ad hoc Committee on Management Fees was formed to conduct an in-depth review of the management fee rates of Fidelity's active equity mutual funds. The Committee focused on the following areas: (i) standard fee structures; (ii) research consumption and trading evolution; (iii) management fee competitiveness/profitability by category; and (iv) factors that drive institutional pricing.
Based on its review, the Board concluded that the fund's management fee is fair and reasonable in light of the services that the fund receives and the other factors considered.
Total Expense Ratio. In its review of the fund's total expense ratio, the Board considered the fund's unitary fee rate as well as other fund expenses paid by FMR under the fund's management contract, such as transfer agent fees, pricing and bookkeeping fees, and custodial, legal, and audit fees. The Board also noted that Fidelity may agree to waive fees or reimburse expenses from time to time, and the extent to which, if any, it has done so for the fund. As part of its review, the Board also considered the current total expense ratio of the fund compared to competitive fund median expenses. The fund is compared to those funds in the Total Mapped Group (used by the Board for management fee comparisons) that have a similar sales load structure.
The Board noted that the fund's total expense ratio ranked below the competitive median for the period ended June 30, 2019.
Fees Charged to Other Fidelity Clients. The Board also considered Fidelity fee structures and other information with respect to clients of Fidelity, such as other funds advised or subadvised by Fidelity, pension plan clients, and other institutional clients with similar mandates. The Board noted that a joint ad hoc committee created by it and the boards of other Fidelity funds periodically reviews and compares Fidelity's institutional investment advisory business with its business of providing services to the Fidelity funds and also noted the most recent findings of the committee. The Board noted that the committee's review included a consideration of the differences in services provided, fees charged, and costs incurred, as well as competition in the markets serving the different categories of clients.
Based on its review of total expense ratios and fees charged to other Fidelity clients, the Board concluded that the fund's total expense ratio was reasonable in light of the services that the fund and its shareholders receive and the other factors considered.
Costs of the Services and Profitability. The Board considered the revenues earned and the expenses incurred by Fidelity in conducting the business of developing, marketing, distributing, managing, administering and servicing the fund and servicing the fund's shareholders. The Board also considered the level of Fidelity's profits in respect of all the Fidelity funds.
On an annual basis, Fidelity presents to the Board information about the profitability of its relationships with the fund. Fidelity calculates profitability information for each fund, as well as aggregate profitability information for groups of Fidelity funds and all Fidelity funds, using a series of detailed revenue and cost allocation methodologies which originate with the books and records of Fidelity on which Fidelity's audited financial statements are based. The Audit Committee of the Board reviews any significant changes from the prior year's methodologies and the full Board approves such changes.
PricewaterhouseCoopers LLP (PwC), auditor to Fidelity and certain Fidelity funds, has been engaged annually by the Board as part of the Board's assessment of Fidelity's profitability analysis. PwC's engagement includes the review and assessment of the methodologies used by Fidelity in determining the revenues and expenses attributable to Fidelity's mutual fund business, and completion of agreed-upon procedures in respect of the mathematical accuracy of the fund profitability information and its conformity to established allocation methodologies. After considering PwC's reports issued under the engagement and information provided by Fidelity, the Board concluded that while other allocation methods may also be reasonable, Fidelity's profitability methodologies are reasonable in all material respects.
The Board also reviewed Fidelity's non-fund businesses and potential indirect benefits such businesses may have received as a result of their association with Fidelity's mutual fund business (i.e., fall-out benefits) as well as cases where Fidelity's affiliates may benefit from the funds' business. The Board noted that changes to fall-out benefits year-over-year reflect business developments at Fidelity's various businesses. The Board considered that a joint ad hoc committee created by it and the boards of other Fidelity funds had recently been established, and met periodically, to evaluate potential fall-out benefits (PFOB Committee). The Board noted that the PFOB Committee, among other things: (i) discussed the legal framework surrounding potential fall-out benefits; (ii) reviewed the Board's responsibilities and approach to potential fall-out benefits; and (iii) reviewed practices employed by competitor funds regarding the review of potential fall-out benefits.
The Board considered the costs of the services provided by and the profits realized by Fidelity in connection with the operation of the fund, including the conclusions of the PFOB Committee, and was satisfied that the profitability was not excessive.
Economies of Scale. The Board considered whether there have been economies of scale in respect of the management of the Fidelity funds, whether the Fidelity funds (including the fund) have appropriately benefited from any such economies of scale, and whether there is potential for realization of any further economies of scale. The Board considered the extent to which the fund will benefit from economies of scale as assets grow through increased services to the fund, through waivers or reimbursements, or through fee or expense ratio reductions. The Board recognized that, due to the fund's current contractual arrangements, its expense ratio will not decline if the fund's operating costs decrease as assets grow, or rise as assets decrease. The Board also noted that a committee (the Economies of Scale Committee) created by it and the boards of other Fidelity funds periodically analyzes whether Fidelity attains economies of scale in respect of the management and servicing of the Fidelity funds, whether the Fidelity funds have appropriately benefited from such economies of scale, and whether there is potential for realization of any further economies of scale.
The Board concluded, taking into account the analysis of the Economies of Scale Committee, that economies of scale, if any, are being appropriately shared between fund shareholders and Fidelity.
Additional Information Requested by the Board. In order to develop fully the factual basis for consideration of the Fidelity funds' advisory contracts, the Board requested and received additional information on certain topics, including: (i) fund flow and performance trends, in particular the underperformance of certain funds and strategies, and Fidelity's long-term strategies for certain funds; (ii) consideration of performance fees for additional funds; (iii) changes in Fidelity's non-fund businesses and the impact of such changes on the funds; (iv) metrics for evaluating index fund and ETF performance and information about ETF trading characteristics; (v) the methodology with respect to evaluating competitive fund data and peer group classifications and fee comparisons; (vi) the expense structures for different funds and classes; (vii) information regarding other accounts managed by Fidelity, including collective investment trusts and separately managed accounts; and (viii) Fidelity's philosophies and strategies for evaluating funds and classes with lower or declining asset levels.
Based on its evaluation of all of the conclusions noted above, and after considering all factors it believed relevant, the Board concluded that the advisory fee arrangements are fair and reasonable, and that the fund's Amended and Restated Contracts should be approved and the fund's Advisory Contracts should be renewed.
Liquidity Risk Management Program
The Securities and Exchange Commission adopted Rule 22e-4 under the Investment Company Act of 1940 (the Liquidity Rule) to promote effective liquidity risk management throughout the open-end investment company industry, thereby reducing the risk that funds will be unable to meet their redemption obligations and mitigating dilution of the interests of fund shareholders.
The Fund has adopted and implemented a liquidity risk management program pursuant to the Liquidity Rule (the Program) effective December 1, 2018. The Program is reasonably designed to assess and manage the Fund’s liquidity risk and to comply with the requirements of the Liquidity Rule. The Fund’s Board of Trustees (the Board) has designated the Fund’s investment adviser as administrator of the Program. The Fidelity advisers have established a Liquidity Risk Management Committee (the LRM Committee) to manage the Program for each of the Fidelity Funds. The LRM Committee monitors the adequacy and effectiveness of implementation of the Program and on a periodic basis assesses each Fund’s liquidity risk based on a variety of factors including (1) the Fund’s investment strategy, (2) portfolio liquidity and cash flow projections during normal and reasonably foreseeable stressed conditions, (3) shareholder redemptions, (4) borrowings and other funding sources and (5) in the case of exchange-traded funds, certain additional factors including the effect of the Fund’s prices and spreads, market participants, and basket compositions on the overall liquidity of the Fund’s portfolio, as applicable.
In accordance with the Program, each of the Fund’s portfolio investments is classified into one of four liquidity categories described below based on a determination of a reasonable expectation for how long it would take to convert the investment to cash (or sell or dispose of the investment) without significantly changing its market value.
- Highly liquid investments – cash or convertible to cash within three business days or less
- Moderately liquid investments – convertible to cash in three to seven calendar days
- Less liquid investments – can be sold or disposed of, but not settled, within seven calendar days
- Illiquid investments – cannot not be sold or disposed of within seven calendar days
Liquidity classification determinations take into account a variety of factors including various market, trading and investment-specific considerations, as well as market depth, and generally utilize analysis from a third-party liquidity metrics service.
The Liquidity Rule places a 15% limit on a fund’s illiquid investments and requires funds that do not primarily hold assets that are highly liquid investments to determine and maintain a minimum percentage of the fund’s net assets to be invested in highly liquid investments (highly liquid investment minimum or HLIM). The Program includes provisions reasonably designed to comply with the 15% limit on illiquid investments and for determining, periodically reviewing and complying with the HLIM requirement as applicable.
At a recent meeting of the Fund’s Board of Trustees, the LRM Committee provided a written report to the Board pertaining to the operation, adequacy, and effectiveness of implementation of the Program for the annual period from December 1, 2018 through November 30, 2019. The report concluded that the Program has been implemented and is operating effectively and is reasonably designed to assess and manage the Fund’s liquidity risk.
BAL-K6-SANN-0420
1.9893902.100
Fidelity® Puritan® K6 Fund
Semi-Annual Report
February 29, 2020
See the inside front cover for important information about access to your fund’s shareholder reports.
Beginning on January 1, 2021, as permitted by regulations adopted by the Securities and Exchange Commission, paper copies of a fund’s shareholder reports will no longer be sent by mail, unless you specifically request paper copies of the reports from the fund or from your financial intermediary, such as a financial advisor, broker-dealer or bank. Instead, the reports will be made available on a website, and you will be notified by mail each time a report is posted and provided with a website link to access the report.
If you already elected to receive shareholder reports electronically, you will not be affected by this change and you need not take any action. You may elect to receive shareholder reports and other communications from a fund electronically, by contacting your financial intermediary. For Fidelity customers, visit Fidelity's web site or call Fidelity using the contact information listed below.
You may elect to receive all future reports in paper free of charge. If you wish to continue receiving paper copies of your shareholder reports, you may contact your financial intermediary or, if you are a Fidelity customer, visit Fidelity’s website, or call Fidelity at the applicable toll-free number listed below. Your election to receive reports in paper will apply to all funds held with the fund complex/your financial intermediary.
| Account Type | Website | Phone Number |
| Brokerage, Mutual Fund, or Annuity Contracts: | fidelity.com/mailpreferences | 1-800-343-3548 |
| Employer Provided Retirement Accounts: | netbenefits.fidelity.com/preferences (choose 'no' under Required Disclosures to continue to print) | 1-800-343-0860 |
| Advisor Sold Accounts Serviced Through Your Financial Intermediary: | Contact Your Financial Intermediary | Your Financial Intermediary's phone number |
| Advisor Sold Accounts Serviced by Fidelity: | institutional.fidelity.com | 1-877-208-0098 |
Contents
To view a fund's proxy voting guidelines and proxy voting record for the 12-month period ended June 30, visit http://www.fidelity.com/proxyvotingresults or visit the Securities and Exchange Commission's (SEC) web site at http://www.sec.gov.
You may also call 1-800-835-5092 to request a free copy of the proxy voting guidelines.
Standard & Poor's, S&P and S&P 500 are registered service marks of The McGraw-Hill Companies, Inc. and have been licensed for use by Fidelity Distributors Corporation.
Other third-party marks appearing herein are the property of their respective owners.
All other marks appearing herein are registered or unregistered trademarks or service marks of FMR LLC or an affiliated company. © 2020 FMR LLC. All rights reserved.
This report and the financial statements contained herein are submitted for the general information of the shareholders of the Fund. This report is not authorized for distribution to prospective investors in the Fund unless preceded or accompanied by an effective prospectus.
A fund files its complete schedule of portfolio holdings with the SEC for the first and third quarters of each fiscal year on Form N-PORT. Forms N-PORT are available on the SEC’s web site at http://www.sec.gov. A fund's Forms N-PORT may be reviewed and copied at the SEC’s Public Reference Room in Washington, DC. Information regarding the operation of the SEC's Public Reference Room may be obtained by calling 1-800-SEC-0330.
For a complete list of a fund's portfolio holdings, view the most recent holdings listing, semiannual report, or annual report on Fidelity's web site at http://www.fidelity.com, http://www.institutional.fidelity.com, or http://www.401k.com, as applicable.
NOT FDIC INSURED •MAY LOSE VALUE •NO BANK GUARANTEE
Neither the Fund nor Fidelity Distributors Corporation is a bank.
Note to Shareholders:
Early in 2020, the outbreak and spread of a new coronavirus emerged as a public health emergency that had a major influence on financial markets, primarily based on its impact on the global economy and corporate earnings. The virus causes a respiratory disease known as COVID-19. On March 11, the World Health Organization declared the COVID-19 outbreak a pandemic, citing sustained risk of further global spread.
In the weeks following the end of this reporting period, as the crisis worsened, we witnessed an escalating human tragedy with wide-scale social and economic consequences from coronavirus-containment measures. The outbreak of COVID-19 prompted a number of measures to limit the spread, including travel and border restrictions, quarantines, and restrictions on large gatherings. In turn, these resulted in lower consumer activity, diminished demand for a wide range of products and services, disruption in manufacturing and supply chains, and – given the wide variability in outcomes regarding the outbreak – significant market uncertainty and volatility. Amid the turmoil, the U.S. government took unprecedented action – in concert with the U.S. Federal Reserve and central banks around the world – to help support consumers, businesses, and the broader economy, and to limit disruption to the financial system.
The situation continues to unfold, and the extent and duration of its impact on financial markets and the economy remain highly uncertain. Extreme events such as the coronavirus crisis are “exogenous shocks” that can have significant adverse effects on mutual funds and their investments. Although multiple asset classes may be affected by market disruption, the duration and impact may not be the same for all types of assets.
Fidelity is committed to helping you stay informed amid news about COVID-19 and during increased market volatility, and we’re taking extra steps to be responsive to customer needs. We encourage you to visit our websites, where we offer ongoing updates, commentary, and analysis on the markets and our funds.
Investment Summary (Unaudited)
The information in the following tables is based on the combined investments of the Fund and its pro-rata share of the investments of Fidelity's Fixed-Income Central Funds.
Top Five Stocks as of February 29, 2020
| | % of fund's net assets |
| Microsoft Corp. | 4.2 |
| Alphabet, Inc. Class C | 3.9 |
| Amazon.com, Inc. | 2.7 |
| Apple, Inc. | 2.3 |
| Facebook, Inc. Class A | 2.0 |
| | 15.1 |
Top Five Bond Issuers as of February 29, 2020
| (with maturities greater than one year) | % of fund's net assets |
| U.S. Treasury Obligations | 7.9 |
| Fannie Mae | 2.0 |
| Freddie Mac | 1.6 |
| Ginnie Mae | 1.6 |
| Citigroup, Inc. | 0.5 |
| | 13.6 |
Top Five Market Sectors as of February 29, 2020
| | % of fund's net assets |
| Information Technology | 18.4 |
| Financials | 13.6 |
| Health Care | 11.7 |
| Communication Services | 10.1 |
| Consumer Discretionary | 8.4 |
Asset Allocation (% of fund's net assets)
| As of February 29, 2020* |
| | Stocks | 67.7% |
| | Bonds | 30.7% |
| | Convertible Securities | 0.1% |
| | Other Investments | 0.8% |
| | Short-Term Investments and Net Other Assets (Liabilities) | 0.7% |

* Foreign investments - 10.6%
An unaudited holdings listing for the Fund, which presents direct holdings as well as the pro-rata share of any securities and other investments held indirectly through its investment in underlying non-money market Fidelity Central Funds, is available at fidelity.com and/or institutional.fidelity.com, as applicable.
Percentages in the above tables are adjusted for the effect of TBA Sale Commitments.
Percentages are adjusted for the effect of futures contracts and swaps, if applicable.
Schedule of Investments February 29, 2020 (Unaudited)
Showing Percentage of Net Assets
| Common Stocks - 66.7% | | | |
| | | Shares | Value |
| COMMUNICATION SERVICES - 8.2% | | | |
| Entertainment - 1.7% | | | |
| Activision Blizzard, Inc. | | 29,146 | $1,694,257 |
| Electronic Arts, Inc. (a) | | 2,339 | 237,104 |
| LiveXLive Media, Inc. (a)(b) | | 75,495 | 95,124 |
| Netflix, Inc. (a) | | 3,436 | 1,267,987 |
| The Walt Disney Co. | | 12,864 | 1,513,450 |
| | | | 4,807,922 |
| Interactive Media & Services - 5.9% | | | |
| Alphabet, Inc. Class C (a) | | 8,154 | 10,920,897 |
| Facebook, Inc. Class A (a) | | 29,940 | 5,762,552 |
| | | | 16,683,449 |
| Media - 0.2% | | | |
| Comcast Corp. Class A | | 15,557 | 628,970 |
| Wireless Telecommunication Services - 0.4% | | | |
| T-Mobile U.S., Inc. (a) | | 13,585 | 1,224,824 |
|
| TOTAL COMMUNICATION SERVICES | | | 23,345,165 |
|
| CONSUMER DISCRETIONARY - 7.9% | | | |
| Hotels, Restaurants & Leisure - 0.8% | | | |
| Compass Group PLC | | 8,439 | 185,932 |
| McDonald's Corp. | | 4,260 | 827,164 |
| Penn National Gaming, Inc. (a) | | 2,710 | 80,135 |
| Starbucks Corp. | | 14,597 | 1,144,843 |
| | | | 2,238,074 |
| Household Durables - 0.1% | | | |
| D.R. Horton, Inc. | | 6,247 | 332,778 |
| Internet & Direct Marketing Retail - 3.6% | | | |
| Alibaba Group Holding Ltd. sponsored ADR (a) | | 7,841 | 1,630,928 |
| Amazon.com, Inc. (a) | | 4,055 | 7,638,606 |
| eBay, Inc. | | 7,150 | 247,676 |
| The Booking Holdings, Inc. (a) | | 441 | 747,786 |
| | | | 10,264,996 |
| Leisure Products - 0.1% | | | |
| Peloton Interactive, Inc. Class A (a) | | 7,387 | 197,159 |
| Multiline Retail - 0.6% | | | |
| Dollar General Corp. | | 8,339 | 1,253,352 |
| Dollar Tree, Inc. (a) | | 4,618 | 383,433 |
| | | | 1,636,785 |
| Specialty Retail - 1.5% | | | |
| Lowe's Companies, Inc. | | 12,923 | 1,377,204 |
| The Home Depot, Inc. | | 7,261 | 1,581,736 |
| TJX Companies, Inc. | | 24,145 | 1,443,871 |
| | | | 4,402,811 |
| Textiles, Apparel & Luxury Goods - 1.2% | | | |
| Brunello Cucinelli SpA | | 14,909 | 498,830 |
| LVMH Moet Hennessy Louis Vuitton SE | | 2,864 | 1,195,235 |
| Moncler SpA | | 5,233 | 205,924 |
| NIKE, Inc. Class B | | 17,119 | 1,530,096 |
| Tapestry, Inc. | | 3,069 | 71,968 |
| | | | 3,502,053 |
|
| TOTAL CONSUMER DISCRETIONARY | | | 22,574,656 |
|
| CONSUMER STAPLES - 2.9% | | | |
| Beverages - 1.3% | | | |
| Keurig Dr. Pepper, Inc. | | 11,717 | 326,670 |
| Monster Beverage Corp. (a) | | 9,128 | 569,678 |
| PepsiCo, Inc. | | 1,905 | 251,517 |
| The Coca-Cola Co. | | 45,745 | 2,446,900 |
| | | | 3,594,765 |
| Food & Staples Retailing - 1.3% | | | |
| Costco Wholesale Corp. | | 3,769 | 1,059,617 |
| Kroger Co. | | 9,742 | 274,042 |
| Walmart, Inc. | | 21,699 | 2,336,548 |
| | | | 3,670,207 |
| Personal Products - 0.1% | | | |
| Estee Lauder Companies, Inc. Class A | | 2,007 | 368,485 |
| L'Oreal SA | | 107 | 28,760 |
| | | | 397,245 |
| Tobacco - 0.2% | | | |
| Altria Group, Inc. | | 16,330 | 659,242 |
|
| TOTAL CONSUMER STAPLES | | | 8,321,459 |
|
| ENERGY - 0.8% | | | |
| Oil, Gas & Consumable Fuels - 0.8% | | | |
| ConocoPhillips Co. | | 8,170 | 395,591 |
| Hess Corp. | | 21,989 | 1,235,342 |
| Pioneer Natural Resources Co. | | 5,383 | 660,925 |
| | | | 2,291,858 |
| FINANCIALS - 8.0% | | | |
| Banks - 4.0% | | | |
| Bank of America Corp. | | 132,234 | 3,768,669 |
| Citigroup, Inc. | | 17,259 | 1,095,256 |
| HDFC Bank Ltd. sponsored ADR | | 437 | 23,969 |
| JPMorgan Chase & Co. | | 33,942 | 3,941,006 |
| M&T Bank Corp. | | 1,974 | 277,110 |
| Truist Financial Corp. | | 4,745 | 218,934 |
| Wells Fargo & Co. | | 53,003 | 2,165,173 |
| | | | 11,490,117 |
| Capital Markets - 2.7% | | | |
| CME Group, Inc. | | 7,247 | 1,440,849 |
| London Stock Exchange Group PLC | | 9,185 | 902,188 |
| Moody's Corp. | | 4,981 | 1,195,589 |
| Morningstar, Inc. | | 4,122 | 605,522 |
| MSCI, Inc. | | 3,930 | 1,161,079 |
| S&P Global, Inc. | | 5,187 | 1,379,275 |
| The Blackstone Group LP | | 10,609 | 571,189 |
| Tradeweb Markets, Inc. Class A | | 6,693 | 322,736 |
| XP, Inc. Class A (a) | | 3,483 | 120,686 |
| | | | 7,699,113 |
| Consumer Finance - 0.5% | | | |
| American Express Co. | | 11,744 | 1,291,018 |
| Diversified Financial Services - 0.8% | | | |
| Berkshire Hathaway, Inc. Class B (a) | | 10,745 | 2,217,123 |
|
| TOTAL FINANCIALS | | | 22,697,371 |
|
| HEALTH CARE - 10.5% | | | |
| Biotechnology - 2.5% | | | |
| AbbVie, Inc. | | 17,900 | 1,534,209 |
| ACADIA Pharmaceuticals, Inc. (a) | | 2,129 | 90,993 |
| Acceleron Pharma, Inc. (a) | | 3,210 | 275,835 |
| Amgen, Inc. | | 9,920 | 1,981,322 |
| Biogen, Inc. (a) | | 863 | 266,141 |
| Black Diamond Therapeutics, Inc. (a) | | 1,167 | 31,497 |
| Neurocrine Biosciences, Inc. (a) | | 1,060 | 100,382 |
| Regeneron Pharmaceuticals, Inc. (a) | | 3,303 | 1,468,415 |
| Revolution Medicines, Inc. | | 612 | 19,137 |
| Vertex Pharmaceuticals, Inc. (a) | | 6,321 | 1,416,094 |
| | | | 7,184,025 |
| Health Care Equipment & Supplies - 2.6% | | | |
| Boston Scientific Corp. (a) | | 49,761 | 1,860,564 |
| Danaher Corp. | | 13,369 | 1,932,890 |
| DexCom, Inc. (a) | | 1,742 | 480,792 |
| Hologic, Inc. (a) | | 10,005 | 471,436 |
| Intuitive Surgical, Inc. (a) | | 3,170 | 1,692,653 |
| Stryker Corp. | | 4,504 | 858,417 |
| | | | 7,296,752 |
| Health Care Providers & Services - 2.1% | | | |
| 1Life Healthcare, Inc. (a) | | 5,025 | 108,641 |
| Centene Corp. (a) | | 15,813 | 838,405 |
| Cigna Corp. | | 10,433 | 1,908,613 |
| Humana, Inc. | | 867 | 277,163 |
| UnitedHealth Group, Inc. | | 10,959 | 2,794,107 |
| | | | 5,926,929 |
| Life Sciences Tools & Services - 1.0% | | | |
| 10X Genomics, Inc. (a)(b) | | 3,701 | 294,970 |
| Bruker Corp. | | 26,090 | 1,136,480 |
| Thermo Fisher Scientific, Inc. | | 5,449 | 1,584,569 |
| | | | 3,016,019 |
| Pharmaceuticals - 2.3% | | | |
| AstraZeneca PLC sponsored ADR | | 30,885 | 1,352,763 |
| Eli Lilly & Co. | | 10,647 | 1,342,906 |
| Roche Holding AG (participation certificate) | | 1,582 | 508,666 |
| Sanofi SA sponsored ADR | | 41,178 | 1,904,483 |
| Zoetis, Inc. Class A | | 11,117 | 1,481,118 |
| | | | 6,589,936 |
|
| TOTAL HEALTH CARE | | | 30,013,661 |
|
| INDUSTRIALS - 6.1% | | | |
| Aerospace & Defense - 1.1% | | | |
| Harris Corp. | | 219 | 43,303 |
| Northrop Grumman Corp. | | 7,261 | 2,387,707 |
| TransDigm Group, Inc. | | 1,194 | 666,025 |
| | | | 3,097,035 |
| Air Freight & Logistics - 0.1% | | | |
| United Parcel Service, Inc. Class B | | 2,882 | 260,792 |
| Airlines - 0.0% | | | |
| Delta Air Lines, Inc. | | 2,242 | 103,423 |
| Commercial Services & Supplies - 0.1% | | | |
| Copart, Inc. (a) | | 893 | 75,441 |
| Waste Management, Inc. | | 2,043 | 226,385 |
| | | | 301,826 |
| Construction & Engineering - 0.2% | | | |
| Jacobs Engineering Group, Inc. | | 6,808 | 628,651 |
| Electrical Equipment - 0.8% | | | |
| AMETEK, Inc. | | 16,988 | 1,460,968 |
| Generac Holdings, Inc. (a) | | 3,145 | 323,904 |
| Rockwell Automation, Inc. | | 2,071 | 380,029 |
| | | | 2,164,901 |
| Industrial Conglomerates - 0.8% | | | |
| General Electric Co. | | 200,330 | 2,179,590 |
| Roper Technologies, Inc. | | 248 | 87,222 |
| | | | 2,266,812 |
| Machinery - 1.0% | | | |
| Caterpillar, Inc. | | 5,838 | 725,313 |
| Gardner Denver Holdings, Inc. | | 19,025 | 623,830 |
| ITT, Inc. | | 2,134 | 128,360 |
| Parker Hannifin Corp. | | 2,787 | 514,954 |
| Trane Technologies PLC | | 5,906 | 762,110 |
| | | | 2,754,567 |
| Professional Services - 0.6% | | | |
| Clarivate Analytics PLC (a) | | 3,907 | 79,468 |
| Equifax, Inc. | | 859 | 122,012 |
| Experian PLC | | 15,573 | 518,330 |
| IHS Markit Ltd. | | 14,079 | 1,002,988 |
| | | | 1,722,798 |
| Road & Rail - 1.4% | | | |
| Lyft, Inc. | | 24,591 | 937,409 |
| Uber Technologies, Inc. | | 46,727 | 1,582,643 |
| Union Pacific Corp. | | 9,738 | 1,556,230 |
| | | | 4,076,282 |
|
| TOTAL INDUSTRIALS | | | 17,377,087 |
|
| INFORMATION TECHNOLOGY - 18.1% | | | |
| IT Services - 4.5% | | | |
| Accenture PLC Class A | | 7,739 | 1,397,586 |
| Automatic Data Processing, Inc. | | 2,553 | 395,051 |
| Black Knight, Inc. (a) | | 12,084 | 806,124 |
| Edenred SA | | 8,675 | 454,119 |
| Fidelity National Information Services, Inc. | | 16,677 | 2,330,110 |
| Global Payments, Inc. | | 4,008 | 737,352 |
| MasterCard, Inc. Class A | | 10,561 | 3,065,330 |
| MongoDB, Inc. Class A (a) | | 1,416 | 215,940 |
| Visa, Inc. Class A | | 19,213 | 3,492,155 |
| | | | 12,893,767 |
| Semiconductors & Semiconductor Equipment - 4.9% | | | |
| Advanced Micro Devices, Inc. (a) | | 7,126 | 324,090 |
| Analog Devices, Inc. | | 12,256 | 1,336,517 |
| ASML Holding NV | | 6,191 | 1,713,112 |
| Broadcom, Inc. | | 861 | 234,726 |
| Lam Research Corp. | | 6,219 | 1,824,841 |
| Marvell Technology Group Ltd. | | 45,919 | 978,075 |
| Micron Technology, Inc. (a) | | 30,043 | 1,579,060 |
| NVIDIA Corp. | | 10,390 | 2,806,027 |
| NXP Semiconductors NV | | 9,336 | 1,061,410 |
| Qualcomm, Inc. | | 20,682 | 1,619,401 |
| Universal Display Corp. | | 634 | 100,673 |
| Xilinx, Inc. | | 2,909 | 242,872 |
| | | | 13,820,804 |
| Software - 6.3% | | | |
| Adobe, Inc. (a) | | 8,764 | 3,024,632 |
| Aspen Technology, Inc. (a) | | 1,985 | 211,422 |
| HubSpot, Inc. (a) | | 1,111 | 199,369 |
| Microsoft Corp. | | 74,645 | 12,093,233 |
| Salesforce.com, Inc. (a) | | 13,601 | 2,317,610 |
| Slack Technologies, Inc. Class A (a) | | 5,251 | 141,882 |
| | | | 17,988,148 |
| Technology Hardware, Storage & Peripherals - 2.4% | | | |
| Apple, Inc. | | 24,018 | 6,565,560 |
| Samsung Electronics Co. Ltd. | | 4,355 | 196,560 |
| | | | 6,762,120 |
|
| TOTAL INFORMATION TECHNOLOGY | | | 51,464,839 |
|
| MATERIALS - 2.0% | | | |
| Chemicals - 1.1% | | | |
| Air Products & Chemicals, Inc. | | 4,457 | 978,802 |
| Albemarle Corp. U.S. (b) | | 2,583 | 211,419 |
| CF Industries Holdings, Inc. | | 5,581 | 205,716 |
| Linde PLC | | 4,845 | 925,443 |
| Sherwin-Williams Co. | | 1,106 | 571,526 |
| The Chemours Co. LLC | | 8,375 | 124,453 |
| | | | 3,017,359 |
| Containers & Packaging - 0.4% | | | |
| Avery Dennison Corp. | | 10,614 | 1,215,197 |
| Metals & Mining - 0.5% | | | |
| Barrick Gold Corp. | | 81,424 | 1,550,313 |
|
| TOTAL MATERIALS | | | 5,782,869 |
|
| REAL ESTATE - 1.9% | | | |
| Equity Real Estate Investment Trusts (REITs) - 1.9% | | | |
| American Tower Corp. | | 12,305 | 2,790,774 |
| Crown Castle International Corp. | | 9,069 | 1,299,497 |
| Equinix, Inc. | | 782 | 447,930 |
| Prologis, Inc. | | 8,711 | 734,163 |
| | | | 5,272,364 |
| UTILITIES - 0.3% | | | |
| Electric Utilities - 0.3% | | | |
| NextEra Energy, Inc. | | 3,620 | 914,991 |
| Independent Power and Renewable Electricity Producers - 0.0% | | | |
| Vistra Energy Corp. | | 3,825 | 73,555 |
|
| TOTAL UTILITIES | | | 988,546 |
|
| TOTAL COMMON STOCKS | | | |
| (Cost $188,662,909) | | | 190,129,875 |
|
| Fixed-Income Funds - 32.6% | | | |
| Fidelity High Income Central Fund (c) | | 131,195 | 14,281,861 |
| Fidelity Investment Grade Bond Central Fund (c) | | 682,084 | 78,855,676 |
| TOTAL FIXED-INCOME FUNDS | | | |
| (Cost $92,354,868) | | | 93,137,537 |
|
| Money Market Funds - 0.4% | | | |
| Fidelity Cash Central Fund 1.60% (d) | | 777,636 | 777,792 |
| Fidelity Securities Lending Cash Central Fund 1.60% (d)(e) | | 302,020 | 302,050 |
| TOTAL MONEY MARKET FUNDS | | | |
| (Cost $1,079,842) | | | 1,079,842 |
| TOTAL INVESTMENT IN SECURITIES - 99.7% | | | |
| (Cost $282,097,619) | | | 284,347,254 |
| NET OTHER ASSETS (LIABILITIES) - 0.3% | | | 774,631 |
| NET ASSETS - 100% | | | $285,121,885 |
Legend
(a) Non-income producing
(b) Security or a portion of the security is on loan at period end.
(c) Affiliated fund that is generally available only to investment companies and other accounts managed by Fidelity Investments. A complete unaudited schedule of portfolio holdings for each Fidelity Central Fund is filed with the SEC for the first and third quarters of each fiscal year on Form N-PORT and is available upon request or at the SEC's website at www.sec.gov. An unaudited holdings listing for the Fund, which presents direct holdings as well as the pro-rata share of securities and other investments held indirectly through its investment in underlying non-money market Fidelity Central Funds, is available at fidelity.com and/or institutional.fidelity.com, as applicable. In addition, each Fidelity Central Fund's financial statements are available on the SEC's website or upon request.
(d) Affiliated fund that is generally available only to investment companies and other accounts managed by Fidelity Investments. The rate quoted is the annualized seven-day yield of the fund at period end. A complete unaudited listing of the fund's holdings as of its most recent quarter end is available upon request. In addition, each Fidelity Central Fund's financial statements are available on the SEC's website or upon request.
(e) Investment made with cash collateral received from securities on loan.
Affiliated Central Funds
Information regarding fiscal year to date income earned by the Fund from investments in Fidelity Central Funds is as follows:
| Fund | Income earned |
| Fidelity Cash Central Fund | $9,224 |
| Fidelity High Income Central Fund | 179,610 |
| Fidelity Investment Grade Bond Central Fund | 460,841 |
| Fidelity Securities Lending Cash Central Fund | 2,298 |
| Total | $651,973 |
Amounts in the income column in the above table include any capital gain distributions from underlying funds, which are presented in the corresponding line-item in the Statement of Operations, if applicable. Amount for Fidelity Securities Lending Cash Central Fund represents the income earned on investing cash collateral, less rebates paid to borrowers and any lending agent fees associated with the loan, plus any premium payments received for lending certain types of securities.
Fiscal year to date information regarding the Fund’s investments in non-Money Market Central Funds, including the ownership percentage, is presented below.
| Fund | Value, beginning of period | Purchases(a) | Sales Proceeds | Realized Gain/Loss | Change in Unrealized appreciation (depreciation) | Value, end of period | % ownership, end of period |
| Fidelity High Income Central Fund | $4,208,799 | $10,383,835 | $140,127 | $(883) | $(169,763) | $14,281,861 | 0.6% |
| Fidelity Investment Grade Bond Central Fund | 22,476,266 | 56,848,817 | 1,266,820 | (10,365) | 807,778 | 78,855,676 | 0.3% |
| Total | $26,685,065 | $67,232,652 | $1,406,947 | $(11,248) | $638,015 | $93,137,537 | |
(a) Includes the value of shares purchased through in-kind transactions, if applicable.
Investment Valuation
The following is a summary of the inputs used, as of February 29, 2020, involving the Fund's assets and liabilities carried at fair value. The inputs or methodology used for valuing securities may not be an indication of the risk associated with investing in those securities. For more information on valuation inputs, and their aggregation into the levels used below, please refer to the Investment Valuation section in the accompanying Notes to Financial Statements.
| | Valuation Inputs at Reporting Date: |
| Description | Total | Level 1 | Level 2 | Level 3 |
| Investments in Securities: | | | | |
| Equities: | | | | |
| Communication Services | $23,345,165 | $23,345,165 | $-- | $-- |
| Consumer Discretionary | 22,574,656 | 20,488,735 | 2,085,921 | -- |
| Consumer Staples | 8,321,459 | 8,292,699 | 28,760 | -- |
| Energy | 2,291,858 | 2,291,858 | -- | -- |
| Financials | 22,697,371 | 21,795,183 | 902,188 | -- |
| Health Care | 30,013,661 | 29,504,995 | 508,666 | -- |
| Industrials | 17,377,087 | 16,858,757 | 518,330 | -- |
| Information Technology | 51,464,839 | 51,010,720 | 454,119 | -- |
| Materials | 5,782,869 | 5,782,869 | -- | -- |
| Real Estate | 5,272,364 | 5,272,364 | -- | -- |
| Utilities | 988,546 | 988,546 | -- | -- |
| Fixed-Income Funds | 93,137,537 | 93,137,537 | -- | -- |
| Money Market Funds | 1,079,842 | 1,079,842 | -- | -- |
| Total Investments in Securities: | $284,347,254 | $279,849,270 | $4,497,984 | $-- |
Other Information
The composition of credit quality ratings as a percentage of Total Net Assets is as follows (Unaudited):
| U.S. Government and U.S. Government Agency Obligations | 14.7% |
| AAA,AA,A | 3.5% |
| BBB | 7.9% |
| BB | 2.9% |
| B | 1.9% |
| CCC,CC,C | 0.7% |
| D | 0.2% |
| Not Rated | 0.8% |
| Equities | 66.7% |
| Short-Term Investments and Net Other Assets | 0.7% |
| | 100.0% |
We have used ratings from Moody's Investors Service, Inc. Where Moody's® ratings are not available, we have used S&P® ratings. All ratings are as of the date indicated and do not reflect subsequent changes.
Distribution of investments by country or territory of incorporation, as a percentage of Total Net Assets, is as follows (Unaudited):
| United States of America | 89.4% |
| United Kingdom | 1.7% |
| Netherlands | 1.5% |
| France | 1.4% |
| Cayman Islands | 1.4% |
| Ireland | 1.1% |
| Others (Individually Less Than 1%) | 3.5% |
| | 100.0% |
The information in the above tables is based on the combined investments of the fund and its pro-rata share of the investments of Fidelity's Fixed-Income Central Funds
See accompanying notes which are an integral part of the financial statements.
Financial Statements
Statement of Assets and Liabilities
| | | February 29, 2020 (Unaudited) |
| Assets | | |
Investment in securities, at value (including securities loaned of $315,651) — See accompanying schedule:
Unaffiliated issuers (cost $188,662,909) | $190,129,875 | |
| Fidelity Central Funds (cost $93,434,710) | 94,217,379 | |
| Total Investment in Securities (cost $282,097,619) | | $284,347,254 |
| Receivable for investments sold | | 91,216 |
| Receivable for fund shares sold | | 142,973,555 |
| Dividends receivable | | 110,107 |
| Distributions receivable from Fidelity Central Funds | | 6,246 |
| Other receivables | | 63 |
| Total assets | | 427,528,441 |
| Liabilities | | |
| Payable to custodian bank | $11,181 | |
| Payable for investments purchased | 141,583,296 | |
| Payable for fund shares redeemed | 469,430 | |
| Accrued management fee | 40,599 | |
| Collateral on securities loaned | 302,050 | |
| Total liabilities | | 142,406,556 |
| Net Assets | | $285,121,885 |
| Net Assets consist of: | | |
| Paid in capital | | $283,195,525 |
| Total accumulated earnings (loss) | | 1,926,360 |
| Net Assets | | $285,121,885 |
| Net Asset Value, offering price and redemption price per share ($285,121,885 ÷ 27,150,733 shares) | | $10.50 |
See accompanying notes which are an integral part of the financial statements.
Statement of Operations
| | | Six months ended February 29, 2020 (Unaudited) |
| Investment Income | | |
| Dividends | | $510,970 |
| Income from Fidelity Central Funds (including $2,298 from security lending) | | 621,234 |
| Total income | | 1,132,204 |
| Expenses | | |
| Management fee | $187,106 | |
| Independent trustees' fees and expenses | 226 | |
| Total expenses before reductions | 187,332 | |
| Expense reductions | (627) | |
| Total expenses after reductions | | 186,705 |
| Net investment income (loss) | | 945,499 |
| Realized and Unrealized Gain (Loss) | | |
| Net realized gain (loss) on: | | |
| Investment securities: | | |
| Unaffiliated issuers | (643,864) | |
| Fidelity Central Funds | (11,248) | |
| Foreign currency transactions | (96) | |
| Capital gain distributions from Fidelity Central Funds | 30,739 | |
| Total net realized gain (loss) | | (624,469) |
| Change in net unrealized appreciation (depreciation) on: | | |
| Investment securities: | | |
| Unaffiliated issuers | 810,940 | |
| Fidelity Central Funds | 638,015 | |
| Assets and liabilities in foreign currencies | (122) | |
| Total change in net unrealized appreciation (depreciation) | | 1,448,833 |
| Net gain (loss) | | 824,364 |
| Net increase (decrease) in net assets resulting from operations | | $1,769,863 |
See accompanying notes which are an integral part of the financial statements.
Statement of Changes in Net Assets
| | Six months ended February 29, 2020 (Unaudited) | For the period
June 14, 2019 (commencement of operations) to August 31, 2019 |
| Increase (Decrease) in Net Assets | | |
| Operations | | |
| Net investment income (loss) | $945,499 | $56,762 |
| Net realized gain (loss) | (624,469) | (29,959) |
| Change in net unrealized appreciation (depreciation) | 1,448,833 | 800,678 |
| Net increase (decrease) in net assets resulting from operations | 1,769,863 | 827,481 |
| Distributions to shareholders | (670,235) | (750) |
| Share transactions | | |
| Proceeds from sales of shares | 212,148,557 | 83,747,719 |
| Reinvestment of distributions | 670,235 | 750 |
| Cost of shares redeemed | (11,981,577) | (1,390,158) |
| Net increase (decrease) in net assets resulting from share transactions | 200,837,215 | 82,358,311 |
| Total increase (decrease) in net assets | 201,936,843 | 83,185,042 |
| Net Assets | | |
| Beginning of period | 83,185,042 | – |
| End of period | $285,121,885 | $83,185,042 |
| Other Information | | |
| Shares | | |
| Sold | 20,093,461 | 8,244,921 |
| Issued in reinvestment of distributions | 63,222 | 73 |
| Redeemed | (1,114,712) | (136,232) |
| Net increase (decrease) | 19,041,971 | 8,108,762 |
See accompanying notes which are an integral part of the financial statements.
Financial Highlights
Fidelity Puritan K6 Fund
| | Six months ended (Unaudited) February 29, | Years endedAugust 31, |
| | 2020 | 2019 A |
| Selected Per–Share Data | | |
| Net asset value, beginning of period | $10.26 | $10.00 |
| Income from Investment Operations | | |
| Net investment income (loss)B | .09 | .03 |
| Net realized and unrealized gain (loss) | .21 | .24 |
| Total from investment operations | .30 | .27 |
| Distributions from net investment income | (.06) | (.01) |
| Total distributions | (.06) | (.01) |
| Net asset value, end of period | $10.50 | $10.26 |
| Total ReturnC,D | 2.96% | 2.65% |
| Ratios to Average Net AssetsE,F | | |
| Expenses before reductions | .32%G | .31%G,H |
| Expenses net of fee waivers, if any | .32%G | .31%G,H |
| Expenses net of all reductions | .32%G | .31%G,H |
| Net investment income (loss) | 1.63%G | 1.62%G |
| Supplemental Data | | |
| Net assets, end of period (000 omitted) | $285,122 | $83,185 |
| Portfolio turnover rateI,J | 64%G | 99%K |
A For the period June 14, 2019 (commencement of operations) to August 31, 2019.
B Calculated based on average shares outstanding during the period.
C Total returns for periods of less than one year are not annualized.
D Total returns would have been lower if certain expenses had not been reduced during the applicable periods shown.
E Fees and expenses of any underlying Fidelity Central Funds are not included in the Fund's expense ratio. The Fund indirectly bears its proportionate share of the expenses of any underlying Fidelity Central Funds. Based on their most recent shareholder report date, the expenses of any underlying non-money market Fidelity Central Funds were less than .005%.
F Expense ratios reflect operating expenses of the Fund. Expenses before reductions do not reflect amounts reimbursed by the investment adviser or reductions from brokerage service arrangements or reductions from other expense offset arrangements and do not represent the amount paid by the Fund during periods when reimbursements or reductions occur. Expense ratios before reductions for start-up periods may not be representative of longer term operating periods. Expenses net of fee waivers reflect expenses after reimbursement by the investment adviser but prior to reductions from brokerage service arrangements or other expense offset arrangements. Expenses net of all reductions represent the net expenses paid by the Fund.
G Annualized
H The size and fluctuation of net assets and expense amounts may cause ratios to differ from contractual rates.
I Amount does not include the portfolio activity of any underlying Fidelity Central Funds.
J Portfolio turnover rate excludes securities received or delivered in-kind.
K Amount not annualized.
See accompanying notes which are an integral part of the financial statements.
Notes to Financial Statements (Unaudited)
For the period ended February 29, 2020
1. Organization.
Fidelity Puritan K6 Fund (the Fund) is a fund of Fidelity Puritan Trust (the Trust) and is authorized to issue an unlimited number of shares. Share transactions on the Statement of Changes in Net Assets may contain exchanges between affiliated funds. The Trust is registered under the Investment Company Act of 1940, as amended (the 1940 Act), as an open-end management investment company organized as a Massachusetts business trust. Shares generally are available only to employer-sponsored retirement plans that are recordkept by Fidelity, or to certain employer-sponsored retirement plans that are not recordkept by Fidelity.
Effective January 1, 2020:
Investment advisers Fidelity Investments Money Management, Inc., FMR Co., Inc., and Fidelity SelectCo, LLC, merged with and into Fidelity Management & Research Company. In connection with the merger transactions, the resulting, merged investment adviser was then redomiciled from Massachusetts to Delaware, changed its corporate structure from a corporation to a limited liability company, and changed its name to "Fidelity Management & Research Company LLC".
2. Investments in Fidelity Central Funds.
The Fund invests in Fidelity Central Funds, which are open-end investment companies generally available only to other investment companies and accounts managed by the investment adviser and its affiliates. The Fund's Schedule of Investments lists each of the Fidelity Central Funds held as of period end, if any, as an investment of the Fund, but does not include the underlying holdings of each Fidelity Central Fund. As an Investing Fund, the Fund indirectly bears its proportionate share of the expenses of the underlying Fidelity Central Funds.
Based on its investment objective, each Fidelity Central Fund may invest or participate in various investment vehicles or strategies that are similar to those of the Fund. These strategies are consistent with the investment objectives of the Fund and may involve certain economic risks which may cause a decline in value of each of the Fidelity Central Funds and thus a decline in the value of the Fund. The Money Market Central Funds seek preservation of capital and current income and are managed by the investment adviser. Annualized expenses of the Money Market Central Funds as of their most recent shareholder report date ranged from less than .005% to .01%. The following summarizes the Fund's investment in each non-money market Fidelity Central Fund.
| Fidelity Central Fund | Investment Manager | Investment Objective | Investment Practices | Expense Ratio(a) |
| Fidelity High Income Central Fund | FMR | Seeks a high level of income and may also seek capital appreciation by investing primarily in debt securities, preferred stocks, and convertible securities, with an emphasis on lower-quality debt securities. | Delayed Delivery & When Issued Securities
Loans & Direct Debt Instruments
Restricted Securities
| Less than .005% |
| Fidelity Investment Grade Bond Central Fund | FMR | Seeks a high level of income by normally investing in investment–grade debt securities. | Delayed Delivery & When Issued Securities
Restricted Securities
Swaps | Less than .005% |
(a) Expenses expressed as a percentage of average net assets and are as of each underlying Central Fund's most recent annual or semi-annual shareholder report.
An unaudited holdings listing for the Fund, which presents direct holdings as well as the pro-rata share of any securities and other investments held indirectly through its investment in underlying non-money market Fidelity Central Funds, is available at fidelity.com. A complete unaudited list of holdings for each Fidelity Central Fund is available upon request or at the Securities and Exchange Commission (the SEC) website at www.sec.gov. In addition, the financial statements of the Fidelity Central Funds which contain the significant accounting policies (including investment valuation policies) of those funds are available on the SEC website or upon request.
3. Significant Accounting Policies.
The Fund is an investment company and applies the accounting and reporting guidance of the Financial Accounting Standards Board (FASB) Accounting Standards Codification Topic 946 Financial Services – Investments Companies. The financial statements have been prepared in conformity with accounting principles generally accepted in the United States of America (GAAP), which require management to make certain estimates and assumptions at the date of the financial statements. Actual results could differ from those estimates. Subsequent events, if any, through the date that the financial statements were issued have been evaluated in the preparation of the financial statements. The following summarizes the significant accounting policies of the Fund:
Investment Valuation. Investments are valued as of 4:00 p.m. Eastern time on the last calendar day of the period. The Board of Trustees (the Board) has delegated the day to day responsibility for the valuation of the Fund's investments to the Fair Value Committee (the Committee) established by the Fund's investment adviser. In accordance with valuation policies and procedures approved by the Board, the Fund attempts to obtain prices from one or more third party pricing vendors or brokers to value its investments. When current market prices, quotations or currency exchange rates are not readily available or reliable, investments will be fair valued in good faith by the Committee, in accordance with procedures adopted by the Board. Factors used in determining fair value vary by investment type and may include market or investment specific events. The frequency with which these procedures are used cannot be predicted and they may be utilized to a significant extent. The Committee oversees the Fund's valuation policies and procedures and reports to the Board on the Committee's activities and fair value determinations. The Board monitors the appropriateness of the procedures used in valuing the Fund's investments and ratifies the fair value determinations of the Committee.
The Fund categorizes the inputs to valuation techniques used to value its investments into a disclosure hierarchy consisting of three levels as shown below:
- Level 1 – quoted prices in active markets for identical investments
- Level 2 – other significant observable inputs (including quoted prices for similar investments, interest rates, prepayment speeds, etc.)
- Level 3 – unobservable inputs (including the Fund's own assumptions based on the best information available)
Valuation techniques used to value the Fund's investments by major category are as follows:
Equity securities, including restricted securities, for which market quotations are readily available, are valued at the last reported sale price or official closing price as reported by a third party pricing vendor on the primary market or exchange on which they are traded and are categorized as Level 1 in the hierarchy. In the event there were no sales during the day or closing prices are not available, securities are valued at the last quoted bid price or may be valued using the last available price and are generally categorized as Level 2 in the hierarchy. For foreign equity securities, when market or security specific events arise, comparisons to the valuation of American Depositary Receipts (ADRs), futures contracts, Exchange-Traded Funds (ETFs) and certain indexes as well as quoted prices for similar securities may be used and would be categorized as Level 2 in the hierarchy. For equity securities, including restricted securities, where observable inputs are limited, assumptions about market activity and risk are used and these securities may be categorized as Level 3 in the hierarchy.
Investments in open-end mutual funds, including the Fidelity Central Funds, are valued at their closing net asset value (NAV) each business day and are categorized as Level 1 in the hierarchy.
Changes in valuation techniques may result in transfers in or out of an assigned level within the disclosure hierarchy. The aggregate value of investments by input level as of February 29, 2020 is included at the end of the Fund's Schedule of Investments.
Foreign Currency. The Fund may use foreign currency contracts to facilitate transactions in foreign-denominated securities. Gains and losses from these transactions may arise from changes in the value of the foreign currency or if the counterparties do not perform under the contracts' terms.
Foreign-denominated assets, including investment securities, and liabilities are translated into U.S. dollars at the exchange rates at period end. Purchases and sales of investment securities, income and dividends received and expenses denominated in foreign currencies are translated into U.S. dollars at the exchange rate in effect on the transaction date.
The effects of exchange rate fluctuations on investments are included with the net realized and unrealized gain (loss) on investment securities. Other foreign currency transactions resulting in realized and unrealized gain (loss) are disclosed separately.
Investment Transactions and Income. For financial reporting purposes, the Fund's investment holdings and NAV include trades executed through the end of the last business day of the period. The NAV per share for processing shareholder transactions is calculated as of the close of business of the New York Stock Exchange (NYSE), normally 4:00 p.m. Eastern time and includes trades executed through the end of the prior business day. Gains and losses on securities sold are determined on the basis of identified cost. Dividend income is recorded on the ex-dividend date, except for certain dividends from foreign securities where the ex-dividend date may have passed, which are recorded as soon as the Fund is informed of the ex-dividend date. Non-cash dividends included in dividend income, if any, are recorded at the fair market value of the securities received. Income and capital gain distributions from Fidelity Central Funds, if any, are recorded on the ex-dividend date. Investment income is recorded net of foreign taxes withheld where recovery of such taxes is uncertain.
Expenses. Expenses directly attributable to a fund are charged to that fund. Expenses attributable to more than one fund are allocated among the respective funds on the basis of relative net assets or other appropriate methods. Expense estimates are accrued in the period to which they relate and adjustments are made when actual amounts are known.
Income Tax Information and Distributions to Shareholders. Each year, the Fund intends to qualify as a regulated investment company under Subchapter M of the Internal Revenue Code, including distributing substantially all of its taxable income and realized gains. As a result, no provision for U.S. Federal income taxes is required. The Fund files a U.S. federal tax return, in addition to state and local tax returns as required. The Fund's federal income tax returns are subject to examination by the Internal Revenue Service (IRS) for a period of three fiscal years after they are filed. State and local tax returns may be subject to examination for an additional fiscal year depending on the jurisdiction. Foreign taxes are provided for based on the Fund's understanding of the tax rules and rates that exist in the foreign markets in which it invests.
Distributions are declared and recorded on the ex-dividend date. Income and capital gain distributions are determined in accordance with income tax regulations, which may differ from GAAP.
Capital accounts within the financial statements are adjusted for permanent book-tax differences. These adjustments have no impact on net assets or the results of operations. Capital accounts are not adjusted for temporary book-tax differences which will reverse in a subsequent period.
Book-tax differences are primarily due to foreign currency transactions and losses deferred due to wash sales.
As of period end, the cost and unrealized appreciation (depreciation) in securities, and derivatives if applicable, for federal income tax purposes were as follows:
| Gross unrealized appreciation | $6,301,333 |
| Gross unrealized depreciation | (4,182,662) |
| Net unrealized appreciation (depreciation) | $2,118,671 |
| Tax cost | $282,228,583 |
Capital loss carryforwards are only available to offset future capital gains of the Fund to the extent provided by regulations and may be limited. The capital loss carryforward information presented below, including any applicable limitation, is estimated as of prior fiscal period end and is subject to adjustment.
| No expiration | |
| Short-term | $(20,543) |
4. Purchases and Sales of Investments.
Purchases and sales of securities, other than short-term securities and certain in-kind transactions are noted in the table below.
| | Purchases ($) | Sales ($) |
| Fidelity Puritan K6 Fund | 53,289,157 | 31,048,018 |
Unaffiliated Exchanges In-Kind. During the period, the Fund received investments and cash valued at $178,478,814 in exchange for 16,966,683 shares of the Fund. The amount of in-kind exchanges is included in share transactions in the accompanying Statement of Changes in Net Assets.
5. Fees and Other Transactions with Affiliates.
Management Fee. Fidelity Management & Research Company LLC (the investment adviser) and its affiliates provide the Fund with investment management related services for which the Fund pays a monthly management fee that is based on an annual rate of .32% of average net assets. Under the management contract, the investment adviser or an affiliate pays all other expenses of the Fund, excluding fees and expenses of the independent Trustees, and certain miscellaneous expenses such as proxy and shareholder meeting expenses.
Brokerage Commissions. A portion of portfolio transactions were placed with brokerage firms which are affiliates of the investment adviser. Brokerage commissions are included in net realized gain (loss) and change in net unrealized appreciation (depreciation) in the Statement of Operations. The commissions paid to these affiliated firms were as follows:
| | Amount |
| Fidelity Puritan K6 Fund | $601 |
Interfund Trades. Funds may purchase from or sell securities to other Fidelity Funds under procedures adopted by the Board. The procedures have been designed to ensure these interfund trades are executed in accordance with Rule 17a-7 of the 1940 Act. Interfund trades are included within the respective purchases and sales amounts shown in the Purchases and Sales of Investments note.
Prior Fiscal Year Affiliated Exchanges In-Kind. During the prior period, the Fund received investments and cash valued at $81,770,350 in exchange for 8,048,263 shares of the Fund. The amount of in-kind exchanges is included in share transactions in the accompanying Statement of Changes in Net Assets.
Other. During the prior period, the investment adviser reimbursed the Fund for certain losses in the amount of $2,422.
6. Security Lending.
The Fund lends portfolio securities from time to time in order to earn additional income. For equity securities, lending agents are used, including National Financial Services (NFS), an affiliate of the Fund. Pursuant to a securities lending agreement, NFS will receive a fee, which is capped at 9.9% of daily lending revenue, for its services as lending agent. The Fund may lend securities to certain qualified borrowers, including NFS. On the settlement date of the loan, the Fund receives collateral (in the form of U.S. Treasury obligations, letters of credit and/or cash) against the loaned securities and maintains collateral in an amount not less than 100% of the market value of the loaned securities during the period of the loan. The market value of the loaned securities is determined at the close of business of the Fund and any additional required collateral is delivered to the Fund on the next business day. The Fund or borrower may terminate the loan at any time, and if the borrower defaults on its obligation to return the securities loaned because of insolvency or other reasons, the Fund may apply collateral received from the borrower against the obligation. The Fund may experience delays and costs in recovering the securities loaned. Any cash collateral received is invested in the Fidelity Securities Lending Cash Central Fund. The value of loaned securities and cash collateral at period end are disclosed on the Fund's Statement of Assets and Liabilities. Total fees paid by the Fund to NFS, as lending agent, amounted to $170. Security lending income represents the income earned on investing cash collateral, less rebates paid to borrowers and any lending agent fees associated with the loan, plus any premium payments received for lending certain types of securities. During the period, there were no securities loaned to NFS, as affiliated borrower.
7. Expense Reductions.
Commissions paid to certain brokers with whom the investment adviser, or its affiliates, places trades on behalf of the Fund include an amount in addition to trade execution, which may be rebated back to the Fund to offset certain expenses. This amount totaled $626 for the period. In addition, through arrangements with the Fund's custodian, credits realized as a result of certain uninvested cash balances were used to reduce the Fund's expenses by $1.
8. Other.
The Fund's organizational documents provide former and current trustees and officers with a limited indemnification against liabilities arising in connection with the performance of their duties to the Fund. In the normal course of business, the Fund may also enter into contracts that provide general indemnifications. The Fund's maximum exposure under these arrangements is unknown as this would be dependent on future claims that may be made against the Fund. The risk of material loss from such claims is considered remote.
9. Coronavirus (COVID-19) Pandemic.
An outbreak of COVID-19 first detected in China during December 2019 has since spread globally and was declared a pandemic by the World Health Organization during March 2020. Developments that disrupt global economies and financial markets, such as the COVID-19 pandemic, may magnify factors that affect the Fund's performance.
Shareholder Expense Example
As a shareholder of the Fund, you incur two types of costs: (1) transaction costs and (2) ongoing costs, including management fees and other Fund expenses. This Example is intended to help you understand your ongoing costs (in dollars) of investing in the Fund and to compare these costs with the ongoing costs of investing in other mutual funds.
The Example is based on an investment of $1,000 invested at the beginning of the period and held for the entire period (September 1, 2019 to February 29, 2020).
Actual Expenses
The first line of the accompanying table provides information about actual account values and actual expenses. You may use the information in this line, together with the amount you invested, to estimate the expenses that you paid over the period. Simply divide your account value by $1,000.00 (for example, an $8,600 account value divided by $1,000.00 = 8.6), then multiply the result by the number in the first line under the heading entitled "Expenses Paid During Period" to estimate the expenses you paid on your account during this period. In addition, the Fund, as a shareholder in the underlying Fidelity Central Funds, will indirectly bear its pro-rata share of the fees and expenses incurred by the underlying Fidelity Central Funds. These fees and expenses are not included in the Fund's annualized expense ratio used to calculate the expense estimate in the table below.
Hypothetical Example for Comparison Purposes
The second line of the accompanying table provides information about hypothetical account values and hypothetical expenses based on the Fund's actual expense ratio and an assumed rate of return of 5% per year before expenses, which is not the Fund's actual return. The hypothetical account values and expenses may not be used to estimate the actual ending account balance or expenses you paid for the period. You may use this information to compare the ongoing costs of investing in the Fund and other funds. To do so, compare this 5% hypothetical example with the 5% hypothetical examples that appear in the shareholder reports of the other funds. In addition, the Fund, as a shareholder in the underlying Fidelity Central Funds, will indirectly bear its pro-rata share of the fees and expenses incurred by the underlying Fidelity Central Funds. These fees and expenses are not included in the Fund's annualized expense ratio used to calculate the expense estimate in the table below.
Please note that the expenses shown in the table are meant to highlight your ongoing costs only and do not reflect any transaction costs. Therefore, the second line of the table is useful in comparing ongoing costs only, and will not help you determine the relative total costs of owning different funds.
| | Annualized Expense Ratio-A | Beginning
Account Value
September 1, 2019 | Ending
Account Value
February 29, 2020 | Expenses Paid
During Period-B
September 1, 2019
to February 29, 2020 |
| Actual | .32% | $1,000.00 | $1,029.60 | $1.61 |
| Hypothetical-C | | $1,000.00 | $1,023.27 | $1.61 |
A Annualized expense ratio reflects expenses net of applicable fee waivers.
B Expenses are equal to the Fund's annualized expense ratio, multiplied by the average account value over the period, multiplied by 182/366 (to reflect the one-half year period). The fees and expenses of the underlying Fidelity Central Funds in which the Fund invests are not included in the Fund's annualized expense ratio. In addition to the expenses noted above, the Fund also indirectly bears its proportional share of the expenses of the underlying Fidelity Central Funds. Annualized expenses of the underlying non-money market Fidelity Central Funds as of their most recent fiscal half year were less than .005%.
C 5% return per year before expenses
Board Approval of Investment Advisory Contracts and Management Fees
Fidelity Puritan K6 Fund
Each year, the Board of Trustees, including the Independent Trustees (together, the Board), votes on the renewal of the management contract with Fidelity Management & Research Company LLC (FMR) and the sub-advisory agreements (together, the Advisory Contracts) for the fund. FMR and the sub-advisers are referred to herein as the Investment Advisers. The Board, assisted by the advice of fund counsel and Independent Trustees' counsel, requests and considers a broad range of information relevant to the renewal of the Advisory Contracts throughout the year.
Approval of Amended and Restated Advisory Contracts. At its November 2019 meeting, the Board unanimously determined to approve an amended and restated management contract and sub-advisory agreements (Amended and Restated Contracts) for a stub period of January 1, 2020 through January 31, 2020 in connection with a consolidation of certain of Fidelity's advisory businesses. The Board considered that, on or about January 1, 2020, FMR Co., Inc. (FMRC) and Fidelity Investments Money Management, Inc. (FIMM) expected to merge with and into FMR and, after the merger, FMR expected to redomicile as a Delaware limited liability company. The Board also approved the termination of the sub-advisory agreements with FMRC and FIMM upon the completion of the merger. The Board noted that references to FMR in the Amended and Restated Contracts would be updated to reflect FMR's new form of organization and domicile. The Board also noted Fidelity's assurance that neither the planned consolidation nor the Amended and Restated Contracts will change the investment processes, the level or nature of services provided, the resources and personnel allocated, trading and compliance operations, or any fees paid by the fund.
The Board meets regularly and, at each of its meetings, covers an extensive agenda of topics and materials and considers factors that are relevant to its annual consideration of the renewal of the fund's Advisory Contracts, including the services and support provided to the fund and its shareholders. The Board has established various standing committees (Committees), each composed of and chaired by Independent Trustees with varying backgrounds, to which the Board has assigned specific subject matter responsibilities in order to enhance effective decision-making by the Board. The Board, acting directly and through its Committees, requests and receives information concerning the annual consideration of the renewal of the fund's Advisory Contracts. The Board also meets as needed to review matters specifically related to the Board's annual consideration of the renewal of the Advisory Contracts. Members of the Board may also meet with trustees of other Fidelity funds through joint ad hoc committees to discuss certain matters relevant to all of the Fidelity funds.
At its January 2020 meeting, the Board unanimously determined to renew the fund's Advisory Contracts. In reaching its determination, the Board considered all factors it believed relevant, including (i) the nature, extent, and quality of the services provided to the fund and its shareholders (including the investment performance of the fund); (ii) the competitiveness of the fund's management fee and total expense ratio relative to peer funds; (iii) the total costs of the services provided by and the profits realized by Fidelity from its relationships with the fund; and (iv) the extent to which, if any, economies of scale exist and are realized as the fund grows, and whether any economies of scale are appropriately shared with fund shareholders.
In considering whether to renew the Advisory Contracts for the fund, the Board reached a determination, with the assistance of fund counsel and Independent Trustees' counsel and through the exercise of its business judgment, that the renewal of the Advisory Contracts was in the best interests of the fund and its shareholders and that the compensation payable under the Advisory Contracts was fair and reasonable. The Board's decision to renew the Advisory Contracts was not based on any single factor, but rather was based on a comprehensive consideration of all the information provided to the Board at its meetings throughout the year. The Board, in reaching its determination to renew the Advisory Contracts, was aware that shareholders of the fund have a broad range of investment choices available to them, including a wide choice among funds offered by Fidelity's competitors, and that the fund's shareholders, who have the opportunity to review and weigh the disclosure provided by the fund in its prospectus and other public disclosures, have chosen to invest in this fund, which is part of the Fidelity family of funds.
Nature, Extent, and Quality of Services Provided. The Board considered Fidelity's staffing as it relates to the fund, including the backgrounds of investment personnel of Fidelity, and also considered the fund's investment objective, strategies, and related investment philosophy. The Independent Trustees also had discussions with senior management of Fidelity's investment operations and investment groups. The Board considered the structure of the investment personnel compensation program and whether this structure provides appropriate incentives to act in the best interests of the fund. Additionally, the Board considered the portfolio managers' investments, if any, in the funds that they manage.
Resources Dedicated to Investment Management and Support Services. The Board and the Fund Oversight and Research Committees reviewed the general qualifications and capabilities of Fidelity's investment staff, including its size, education, experience, and resources, as well as Fidelity's approach to recruiting, training, managing, and compensating investment personnel. The Board noted that Fidelity has continued to increase the resources devoted to non-U.S. offices, including expansion of Fidelity's global investment organization. The Board also noted that Fidelity's analysts have extensive resources, tools and capabilities that allow them to conduct sophisticated quantitative and fundamental analysis, as well as credit analysis of issuers, counterparties and guarantors. Further, the Board considered that Fidelity's investment professionals have sufficient access to global information and data so as to provide competitive investment results over time, and that those professionals also have access to sophisticated tools that permit them to assess portfolio construction and risk and performance attribution characteristics continuously, as well as to transmit new information and research conclusions rapidly around the world. Additionally, in its deliberations, the Board considered Fidelity's trading, risk management, compliance, and technology and operations capabilities and resources, which are integral parts of the investment management process.
Shareholder and Administrative Services. The Board considered (i) the nature, extent, quality, and cost of advisory, administrative, and shareholder services performed by the Investment Advisers and their affiliates under the Advisory Contracts and under separate agreements covering transfer agency, pricing and bookkeeping, and securities lending services for the fund; (ii) the nature and extent of the supervision of third party service providers, principally custodians, subcustodians, and pricing vendors; and (iii) the resources devoted to, and the record of compliance with, the fund's compliance policies and procedures. The Board also reviewed the allocation of fund brokerage, including allocations to brokers affiliated with the Investment Advisers, the use of brokerage commissions to pay fund expenses, and the use of "soft" commission dollars to pay for research services.
The Board noted that the growth of fund assets over time across the complex allows Fidelity to reinvest in the development of services designed to enhance the value and convenience of the Fidelity funds as investment vehicles. These services include 24-hour access to account information and market information over the Internet and through telephone representatives, investor education materials and asset allocation tools, and the expanded availability of Fidelity Investor Centers.
The Board noted that it and the boards of certain other Fidelity funds had formed an ad hoc Committee on Transfer Agency Fees to review the variety of transfer agency fee structures throughout the industry and Fidelity's competitive positioning with respect to industry participants.
Investment in a Large Fund Family. The Board considered the benefits to shareholders of investing in a Fidelity fund, including the benefits of investing in a fund that is part of a large family of funds offering a variety of investment disciplines and providing a large variety of mutual fund investor services. The Board noted that Fidelity had taken, or had made recommendations that resulted in the Fidelity funds taking, a number of actions over the previous year that benefited particular funds, including: (i) continuing to dedicate additional resources to Fidelity's investment research process, which includes meetings with management of issuers of securities in which the funds invest, and to the support of the senior management team that oversees asset management; (ii) continuing efforts to enhance Fidelity's global research capabilities; (iii) launching new funds and ETFs with innovative structures, strategies and pricing and making other enhancements to meet client needs; (iv) launching new share classes of existing funds; (v) eliminating purchase minimums and broadening eligibility requirements for certain funds and share classes; (vi) reducing management fees and total expenses for certain target date funds and index funds; (vii) lowering expense caps for certain existing funds and classes, and converting certain voluntary expense caps to contractual caps, to reduce expenses borne by shareholders; (viii) rationalizing product lines and gaining increased efficiencies from fund mergers, liquidations, and share class consolidations; (ix) continuing to develop, acquire and implement systems and technology to improve services to the funds and shareholders, strengthen information security, and increase efficiency; and (x) continuing to implement enhancements to further strengthen Fidelity's product line to increase investors' probability of success in achieving their investment goals, including retirement income goals.
Investment Performance. The Board considered whether the fund has operated in accordance with its investment objective, as well as its record of compliance with its investment restrictions. As the fund recently commenced operations, the Board did not believe that it was appropriate to assign significant weight to its limited investment performance.
Based on its review, the Board concluded that the nature, extent, and quality of services provided to the fund under the Advisory Contracts should continue to benefit the shareholders of the fund.
Competitiveness of Management Fee and Total Expense Ratio. The Board considered the fund's management fee and total expense ratio compared to "mapped groups" of competitive funds and classes created for the purpose of facilitating the Trustees' competitive analysis of management fees and total expenses. Fidelity creates "mapped groups" by combining similar Lipper investment objective categories that have comparable investment mandates. Combining Lipper investment objective categories aids the Board's management fee and total expense ratio comparisons by broadening the competitive group used for comparison.
Management Fee. The Board considered two proprietary management fee comparisons for the period of the fund's operations ended June 30 shown in basis points (BP) in the chart below. The group of Lipper funds used by the Board for management fee comparisons is referred to below as the "Total Mapped Group." The Total Mapped Group comparison focuses on a fund's standing in terms of gross management fees before expense reimbursements or caps relative to the total universe of funds with comparable investment mandates, regardless of whether their management fee structures also are comparable. Funds with comparable investment mandates offer exposure to similar types of securities. Funds with comparable management fee structures have similar management fee contractual arrangements (
e.g., flat rate charged for advisory services, all-inclusive fee rate,
etc.). "TMG %" represents the percentage of funds in the Total Mapped Group that had management fees that were lower than the fund's. For example, a hypothetical TMG % of 20% would mean that 80% of the funds in the Total Mapped Group had higher, and 20% had lower, management fees than the fund. The fund's actual TMG % and the number of funds in the Total Mapped Group are in the chart below. The "Asset-Sized Peer Group" (ASPG) comparison focuses on a fund's standing relative to a subset of non-Fidelity funds within the Total Mapped Group that are similar in size and management fee structure. For example, if a fund is in the first quartile of the ASPG, the fund's management fee ranks in the least expensive or lowest 25% of funds in the ASPG. The ASPG represents at least 15% of the funds in the Total Mapped Group with comparable asset size and management fee structures, subject to a minimum of 50 funds (or all funds in the Total Mapped Group if fewer than 50). Additional information, such as the ASPG quartile in which the fund's management fee rate ranked is also included in the chart and was considered by the Board.
Fidelity Puritan K6 Fund
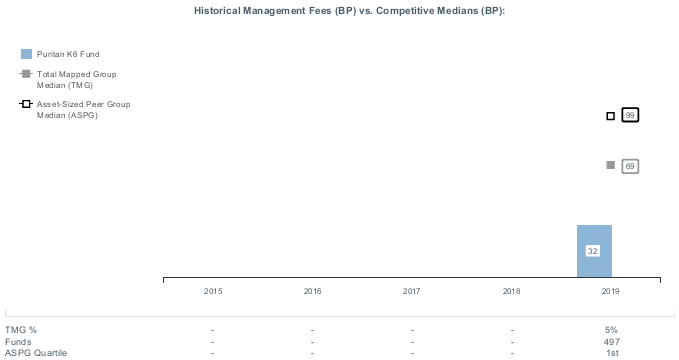
The Board noted that the fund's management fee rate ranked below the median of its Total Mapped Group and below the median of its ASPG for the period ended June 30, 2019.
The Board noted that it and the boards of other Fidelity funds formed an ad hoc Committee on Group Fee, which meets periodically, to conduct an in-depth review of the "group fee" component of the management fee of funds with such management fee structures. The Committee's focus included the mechanics of the group fee, the competitive landscape of group fee structures, Fidelity funds with no group fee component (such as the fund) and investment products not included in group fee assets. The Board also considered that, for funds subject to the group fee, FMR agreed to voluntarily waive fees over a specified period of time in amounts designed to account for assets converted from certain funds to certain collective investment trusts.
The Board also noted that, in 2013, the ad hoc Committee on Management Fees was formed to conduct an in-depth review of the management fee rates of Fidelity's active equity mutual funds. The Committee focused on the following areas: (i) standard fee structures; (ii) research consumption and trading evolution; (iii) management fee competitiveness/profitability by category; and (iv) factors that drive institutional pricing.
Based on its review, the Board concluded that the fund's management fee is fair and reasonable in light of the services that the fund receives and the other factors considered.
Total Expense Ratio. In its review of the fund's total expense ratio, the Board considered the fund's unitary fee rate as well as other fund expenses paid by FMR under the fund's management contract, such as transfer agent fees, pricing and bookkeeping fees, and custodial, legal, and audit fees. The Board also noted that Fidelity may agree to waive fees or reimburse expenses from time to time, and the extent to which, if any, it has done so for the fund. As part of its review, the Board also considered the current total expense ratio of the fund compared to competitive fund median expenses. The fund is compared to those funds in the Total Mapped Group (used by the Board for management fee comparisons) that have a similar sales load structure.
The Board noted that the fund's total expense ratio ranked below the competitive median for the period ended June 30, 2019.
Fees Charged to Other Fidelity Clients. The Board also considered Fidelity fee structures and other information with respect to clients of Fidelity, such as other funds advised or subadvised by Fidelity, pension plan clients, and other institutional clients with similar mandates. The Board noted that a joint ad hoc committee created by it and the boards of other Fidelity funds periodically reviews and compares Fidelity's institutional investment advisory business with its business of providing services to the Fidelity funds and also noted the most recent findings of the committee. The Board noted that the committee's review included a consideration of the differences in services provided, fees charged, and costs incurred, as well as competition in the markets serving the different categories of clients.
Based on its review of total expense ratios and fees charged to other Fidelity clients, the Board concluded that the fund's total expense ratio was reasonable in light of the services that the fund and its shareholders receive and the other factors considered.
Costs of the Services and Profitability. The Board considered the revenues earned and the expenses incurred by Fidelity in conducting the business of developing, marketing, distributing, managing, administering and servicing the fund and servicing the fund's shareholders. The Board also considered the level of Fidelity's profits in respect of all the Fidelity funds.
On an annual basis, Fidelity presents to the Board information about the profitability of its relationships with the fund. Fidelity calculates profitability information for each fund, as well as aggregate profitability information for groups of Fidelity funds and all Fidelity funds, using a series of detailed revenue and cost allocation methodologies which originate with the books and records of Fidelity on which Fidelity's audited financial statements are based. The Audit Committee of the Board reviews any significant changes from the prior year's methodologies and the full Board approves such changes.
PricewaterhouseCoopers LLP (PwC), auditor to Fidelity and certain Fidelity funds, has been engaged annually by the Board as part of the Board's assessment of Fidelity's profitability analysis. PwC's engagement includes the review and assessment of the methodologies used by Fidelity in determining the revenues and expenses attributable to Fidelity's mutual fund business, and completion of agreed-upon procedures in respect of the mathematical accuracy of the fund profitability information and its conformity to established allocation methodologies. After considering PwC's reports issued under the engagement and information provided by Fidelity, the Board concluded that while other allocation methods may also be reasonable, Fidelity's profitability methodologies are reasonable in all material respects.
The Board also reviewed Fidelity's non-fund businesses and potential indirect benefits such businesses may have received as a result of their association with Fidelity's mutual fund business (i.e., fall-out benefits) as well as cases where Fidelity's affiliates may benefit from the funds' business. The Board noted that changes to fall-out benefits year-over-year reflect business developments at Fidelity's various businesses. The Board considered that a joint ad hoc committee created by it and the boards of other Fidelity funds had recently been established, and met periodically, to evaluate potential fall-out benefits (PFOB Committee). The Board noted that the PFOB Committee, among other things: (i) discussed the legal framework surrounding potential fall-out benefits; (ii) reviewed the Board's responsibilities and approach to potential fall-out benefits; and (iii) reviewed practices employed by competitor funds regarding the review of potential fall-out benefits.
The Board considered the costs of the services provided by and the profits realized by Fidelity in connection with the operation of the fund, including the conclusions of the PFOB Committee, and was satisfied that the profitability was not excessive.
Economies of Scale. The Board considered whether there have been economies of scale in respect of the management of the Fidelity funds, whether the Fidelity funds (including the fund) have appropriately benefited from any such economies of scale, and whether there is potential for realization of any further economies of scale. The Board considered the extent to which the fund will benefit from economies of scale as assets grow through increased services to the fund, through waivers or reimbursements, or through fee or expense ratio reductions. The Board recognized that, due to the fund's current contractual arrangements, its expense ratio will not decline if the fund's operating costs decrease as assets grow, or rise as assets decrease. The Board also noted that a committee (the Economies of Scale Committee) created by it and the boards of other Fidelity funds periodically analyzes whether Fidelity attains economies of scale in respect of the management and servicing of the Fidelity funds, whether the Fidelity funds have appropriately benefited from such economies of scale, and whether there is potential for realization of any further economies of scale.
The Board concluded, taking into account the analysis of the Economies of Scale Committee, that economies of scale, if any, are being appropriately shared between fund shareholders and Fidelity.
Additional Information Requested by the Board. In order to develop fully the factual basis for consideration of the Fidelity funds' advisory contracts, the Board requested and received additional information on certain topics, including: (i) fund flow and performance trends, in particular the underperformance of certain funds and strategies, and Fidelity's long-term strategies for certain funds; (ii) consideration of performance fees for additional funds; (iii) changes in Fidelity's non-fund businesses and the impact of such changes on the funds; (iv) metrics for evaluating index fund and ETF performance and information about ETF trading characteristics; (v) the methodology with respect to evaluating competitive fund data and peer group classifications and fee comparisons; (vi) the expense structures for different funds and classes; (vii) information regarding other accounts managed by Fidelity, including collective investment trusts and separately managed accounts; and (viii) Fidelity's philosophies and strategies for evaluating funds and classes with lower or declining asset levels.
Based on its evaluation of all of the conclusions noted above, and after considering all factors it believed relevant, the Board concluded that the advisory fee arrangements are fair and reasonable, and that the fund's Amended and Restated Contracts should be approved and the fund's Advisory Contracts should be renewed.
Liquidity Risk Management Program
The Securities and Exchange Commission adopted Rule 22e-4 under the Investment Company Act of 1940 (the Liquidity Rule) to promote effective liquidity risk management throughout the open-end investment company industry, thereby reducing the risk that funds will be unable to meet their redemption obligations and mitigating dilution of the interests of fund shareholders.
The Fund has adopted and implemented a liquidity risk management program pursuant to the Liquidity Rule (the Program) effective December 1, 2018. The Program is reasonably designed to assess and manage the Fund’s liquidity risk and to comply with the requirements of the Liquidity Rule. The Fund’s Board of Trustees (the Board) has designated the Fund’s investment adviser as administrator of the Program. The Fidelity advisers have established a Liquidity Risk Management Committee (the LRM Committee) to manage the Program for each of the Fidelity Funds. The LRM Committee monitors the adequacy and effectiveness of implementation of the Program and on a periodic basis assesses each Fund’s liquidity risk based on a variety of factors including (1) the Fund’s investment strategy, (2) portfolio liquidity and cash flow projections during normal and reasonably foreseeable stressed conditions, (3) shareholder redemptions, (4) borrowings and other funding sources and (5) in the case of exchange-traded funds, certain additional factors including the effect of the Fund’s prices and spreads, market participants, and basket compositions on the overall liquidity of the Fund’s portfolio, as applicable.
In accordance with the Program, each of the Fund’s portfolio investments is classified into one of four liquidity categories described below based on a determination of a reasonable expectation for how long it would take to convert the investment to cash (or sell or dispose of the investment) without significantly changing its market value.
- Highly liquid investments – cash or convertible to cash within three business days or less
- Moderately liquid investments – convertible to cash in three to seven calendar days
- Less liquid investments – can be sold or disposed of, but not settled, within seven calendar days
- Illiquid investments – cannot not be sold or disposed of within seven calendar days
Liquidity classification determinations take into account a variety of factors including various market, trading and investment-specific considerations, as well as market depth, and generally utilize analysis from a third-party liquidity metrics service.
The Liquidity Rule places a 15% limit on a fund’s illiquid investments and requires funds that do not primarily hold assets that are highly liquid investments to determine and maintain a minimum percentage of the fund’s net assets to be invested in highly liquid investments (highly liquid investment minimum or HLIM). The Program includes provisions reasonably designed to comply with the 15% limit on illiquid investments and for determining, periodically reviewing and complying with the HLIM requirement as applicable.
At a recent meeting of the Fund’s Board of Trustees, the LRM Committee provided a written report to the Board pertaining to the operation, adequacy, and effectiveness of implementation of the Program for the annual period from December 1, 2018 through November 30, 2019. The report concluded that the Program has been implemented and is operating effectively and is reasonably designed to assess and manage the Fund’s liquidity risk.
PUR-K6-SANN-0420
1.9893908.100
Item 2.
Code of Ethics
Not applicable.
Item 3.
Audit Committee Financial Expert
Not applicable.
Item 4.
Principal Accountant Fees and Services
Not applicable.
Item 5.
Audit Committee of Listed Registrants
Not applicable.
Item 6.
Investments
(a)
Not applicable.
(b)
Not applicable
Item 7.
Disclosure of Proxy Voting Policies and Procedures for Closed-End Management Investment Companies
Not applicable.
Item 8.
Portfolio Managers of Closed-End Management Investment Companies
Not applicable.
Item 9.
Purchase of Equity Securities by Closed-End Management Investment Company and Affiliated Purchasers
Not applicable.
Item 10.
Submission of Matters to a Vote of Security Holders
There were no material changes to the procedures by which shareholders may recommend nominees to the Fidelity Puritan Trust’s Board of Trustees.
Item 11.
Controls and Procedures
(a)(i) The President and Treasurer and the Chief Financial Officer have concluded that the Fidelity Puritan Trust’s (the “Trust”) disclosure controls and procedures (as defined in
Rule 30a-3(c) under the Investment Company Act) provide reasonable assurances that material information relating to the Trust is made known to them by the appropriate persons, based on their evaluation of these controls and procedures as of a date within 90 days of the filing date of this report.
(a)(ii) There was no change in the Trust’s internal control over financial reporting (as defined in Rule 30a-3(d) under the Investment Company Act) that occurred during the period covered by this report that has materially affected, or is reasonably likely to materially affect, the Trust’s internal control over financial reporting.
Item 12.
Disclosure of Securities Lending Activities for Closed-End Management
Investment Companies
Not applicable.
Item 13.
Exhibits
SIGNATURES
Pursuant to the requirements of the Securities Exchange Act of 1934 and the Investment Company Act of 1940, the registrant has duly caused this report to be signed on its behalf by the undersigned, thereunto duly authorized.
Fidelity Puritan Trust
| |
By: | /s/Stacie M. Smith |
| Stacie M. Smith |
| President and Treasurer |
|
|
Date: | April 23, 2020 |
Pursuant to the requirements of the Securities Exchange Act of 1934 and the Investment Company Act of 1940, this report has been signed below by the following persons on behalf of the registrant and in the capacities and on the dates indicated.
| |
By: | /s/Stacie M. Smith |
| Stacie M. Smith |
| President and Treasurer |
|
|
Date: | April 23, 2020 |
| |
By: | /s/John J. Burke III |
| John J. Burke III |
| Chief Financial Officer |
|
|
Date: | April 23, 2020 |