UNITED STATES
SECURITIES AND EXCHANGE COMMISSION
Washington, D.C. 20549
FORM N-CSR
CERTIFIED SHAREHOLDER REPORT OF REGISTERED
MANAGEMENT INVESTMENT COMPANIES
Investment Company Act file number 811-649
Fidelity Puritan Trust
(Exact name of registrant as specified in charter)
245 Summer St., Boston, MA 02210
(Address of principal executive offices) (Zip code)
William C. Coffey, Secretary
245 Summer St.
Boston, Massachusetts 02210
(Name and address of agent for service)
Registrant's telephone number, including area code:
617-563-7000
| |
Date of fiscal year end: | August 31 |
|
|
Date of reporting period: | February 28, 2019 |
Item 1.
Reports to Stockholders
Fidelity® Puritan® Fund
Semi-Annual Report February 28, 2019 |
 |
Beginning on January 1, 2021, as permitted by regulations adopted by the Securities and Exchange Commission, paper copies of a fund’s shareholder reports will no longer be sent by mail, unless you specifically request paper copies of the reports from the fund or from your financial intermediary, such as a financial advisor, broker-dealer or bank. Instead, the reports will be made available on a website, and you will be notified by mail each time a report is posted and provided with a website link to access the report.
If you already elected to receive shareholder reports electronically, you will not be affected by this change and you need not take any action. You may elect to receive shareholder reports and other communications from a fund electronically, by contacting your financial intermediary. For Fidelity customers, visit Fidelity's web site or call Fidelity using the contact information listed below.
You may elect to receive all future reports in paper free of charge. If you wish to continue receiving paper copies of your shareholder reports, you may contact your financial intermediary or, if you are a Fidelity customer, visit Fidelity’s website, or call Fidelity at the applicable toll-free number listed below. Your election to receive reports in paper will apply to all funds held with the fund complex/your financial intermediary.
| Account Type | Website | Phone Number |
| Brokerage, Mutual Fund, or Annuity Contracts: | fidelity.com/mailpreferences | 1-800-343-3548 |
| Employer Provided Retirement Accounts: | netbenefits.fidelity.com/preferences (choose 'no' under Required Disclosures to continue to print) | 1-800-343-0860 |
| Advisor Sold Accounts Serviced Through Your Financial Intermediary: | Contact Your Financial Intermediary | Your Financial Intermediary's phone number |
| Advisor Sold Accounts Serviced by Fidelity: | institutional.fidelity.com | 1-877-208-0098 |
Contents
To view a fund's proxy voting guidelines and proxy voting record for the 12-month period ended June 30, visit http://www.fidelity.com/proxyvotingresults or visit the Securities and Exchange Commission's (SEC) web site at http://www.sec.gov.
You may also call 1-800-544-8544 if you’re an individual investing directly with Fidelity, call 1-800-835-5092 if you’re a plan sponsor or participant with Fidelity as your recordkeeper or call 1-877-208-0098 on institutional accounts or if you’re an advisor or invest through one to request a free copy of the proxy voting guidelines.
Standard & Poor's, S&P and S&P 500 are registered service marks of The McGraw-Hill Companies, Inc. and have been licensed for use by Fidelity Distributors Corporation.
Other third-party marks appearing herein are the property of their respective owners.
All other marks appearing herein are registered or unregistered trademarks or service marks of FMR LLC or an affiliated company. © 2019 FMR LLC. All rights reserved.
This report and the financial statements contained herein are submitted for the general information of the shareholders of the Fund. This report is not authorized for distribution to prospective investors in the Fund unless preceded or accompanied by an effective prospectus.
A fund files its complete schedule of portfolio holdings with the SEC for the first and third quarters of each fiscal year on Form N-Q. Forms N-Q are available on the SEC’s web site at http://www.sec.gov. A fund's Forms N-Q may be reviewed and copied at the SEC’s Public Reference Room in Washington, DC. Information regarding the operation of the SEC's Public Reference Room may be obtained by calling 1-800-SEC-0330.
For a complete list of a fund's portfolio holdings, view the most recent holdings listing, semiannual report, or annual report on Fidelity's web site at http://www.fidelity.com, http://www.institutional.fidelity.com, or http://www.401k.com, as applicable.
NOT FDIC INSURED •MAY LOSE VALUE •NO BANK GUARANTEE
Neither the Fund nor Fidelity Distributors Corporation is a bank.
Investment Summary (Unaudited)
The information in the following tables is based on the combined investments of the Fund and its pro-rata share of the investments of Fidelity's Fixed-Income Central Funds.
Top Five Stocks as of February 28, 2019
| | % of fund's net assets |
| Microsoft Corp. | 3.5 |
| Alphabet, Inc. Class C | 2.2 |
| Bank of America Corp. | 2.0 |
| Salesforce.com, Inc. | 1.6 |
| Amazon.com, Inc. | 1.6 |
| | 10.9 |
Top Five Bond Issuers as of February 28, 2019
| (with maturities greater than one year) | % of fund's net assets |
| U.S. Treasury Obligations | 9.4 |
| Fannie Mae | 3.7 |
| Freddie Mac | 2.0 |
| Ginnie Mae | 2.0 |
| Bank of America Corp. | 0.4 |
| | 17.5 |
Top Five Market Sectors as of February 28, 2019
| | % of fund's net assets |
| Information Technology | 15.6 |
| Health Care | 14.1 |
| Financials | 11.9 |
| Communication Services | 8.3 |
| Consumer Discretionary | 8.0 |
Asset Allocation (% of fund's net assets)
| As of February 28, 2019*,** |
| | Stocks | 64.7% |
| | Bonds | 33.9% |
| | Convertible Securities | 1.2% |
| | Other Investments | 1.0% |
| | Short-Term Investments and Net Other Assets (Liabilities)*** | (0.8)% |

* Foreign investments - 7.9%
** Futures and Swaps - 0.1%
*** Short-Term Investments and Net Other Assets (Liabilities) are not included in the pie chart
An unaudited holdings listing for the Fund, which presents direct holdings as well as the pro-rata share of any securities and other investments held indirectly through its investment in underlying non-money market Fidelity Central Funds, is available at fidelity.com and/or institutional.fidelity.com, as applicable.
Percentages in the above tables are adjusted for the effect of TBA Sale Commitments.
Percentages are adjusted for the effect of futures contracts and swaps, if applicable.
Schedule of Investments February 28, 2019 (Unaudited)
Showing Percentage of Net Assets
| Common Stocks - 64.6% | | | |
| | | Shares | Value (000s) |
| COMMUNICATION SERVICES - 6.6% | | | |
| Diversified Telecommunication Services - 1.0% | | | |
| Verizon Communications, Inc. | | 4,797,500 | $273,074 |
| Entertainment - 2.0% | | | |
| Electronic Arts, Inc. (a) | | 820,900 | 78,626 |
| Lions Gate Entertainment Corp. Class B | | 602,385 | 8,849 |
| Live Nation Entertainment, Inc. (a) | | 543,900 | 30,763 |
| LiveXLive Media, Inc. (a)(b)(c) | | 4,110,233 | 24,456 |
| Netflix, Inc. (a) | | 436,700 | 156,382 |
| The Void LLC (a)(d)(e)(f) | | 40,946 | 11,285 |
| The Walt Disney Co. | | 1,297,200 | 146,376 |
| WME Entertainment Parent, LLC Class A (a)(d)(e)(f) | | 25,595,704 | 74,995 |
| | | | 531,732 |
| Interactive Media & Services - 3.1% | | | |
| Alphabet, Inc. Class C (a) | | 537,083 | 601,490 |
| Facebook, Inc. Class A (a) | | 1,435,260 | 231,723 |
| Momo, Inc. ADR (a) | | 224,500 | 7,447 |
| | | | 840,660 |
| Media - 0.5% | | | |
| Comcast Corp. Class A | | 887,000 | 34,300 |
| Tribune Media Co. Class A | | 13,773 | 637 |
| tronc, Inc. (a) | | 3,443 | 42 |
| Vice Holding, Inc. (a)(e)(f) | | 86,301 | 83,343 |
| | | | 118,322 |
|
| TOTAL COMMUNICATION SERVICES | | | 1,763,788 |
|
| CONSUMER DISCRETIONARY - 6.8% | | | |
| Auto Components - 0.0% | | | |
| Aptiv PLC | | 18,393 | 1,529 |
| UC Holdings, Inc. (a)(f) | | 18,330 | 417 |
| | | | 1,946 |
| Diversified Consumer Services - 0.2% | | | |
| Arco Platform Ltd. Class A | | 166,100 | 4,006 |
| Grand Canyon Education, Inc. (a) | | 350,737 | 40,573 |
| | | | 44,579 |
| Hotels, Restaurants & Leisure - 1.0% | | | |
| Boyd Gaming Corp. | | 81,500 | 2,425 |
| Eldorado Resorts, Inc. (a) | | 57,808 | 2,787 |
| Extended Stay America, Inc. unit | | 51,900 | 947 |
| Golden Entertainment, Inc. (a) | | 126,300 | 2,301 |
| McDonald's Corp. | | 1,287,300 | 236,657 |
| Penn National Gaming, Inc. (a) | | 161,400 | 4,011 |
| Red Rock Resorts, Inc. | | 153,655 | 4,321 |
| Sea Ltd. ADR (a) | | 550,000 | 11,825 |
| Studio City International Holdings Ltd. ADR | | 28,000 | 455 |
| YETI Holdings, Inc. (b) | | 300,000 | 7,197 |
| | | | 272,926 |
| Household Durables - 0.0% | | | |
| Blu Homes, Inc. (a)(e)(f) | | 14,988,638 | 26 |
| Internet & Direct Marketing Retail - 2.3% | | | |
| Alibaba Group Holding Ltd. sponsored ADR (a) | | 222,700 | 40,761 |
| Amazon.com, Inc. (a) | | 260,200 | 426,684 |
| Etsy, Inc. (a) | | 640,400 | 45,641 |
| GrubHub, Inc. (a)(b) | | 945,498 | 77,134 |
| The Booking Holdings, Inc. (a) | | 18,300 | 31,056 |
| | | | 621,276 |
| Multiline Retail - 0.6% | | | |
| Dollar General Corp. | | 58,000 | 6,871 |
| Dollar Tree, Inc. (a) | | 1,563,500 | 150,612 |
| | | | 157,483 |
| Specialty Retail - 1.4% | | | |
| Burlington Stores, Inc. (a) | | 110,900 | 18,824 |
| Five Below, Inc. (a) | | 228,000 | 27,440 |
| Lowe's Companies, Inc. | | 1,307,700 | 137,426 |
| TJX Companies, Inc. | | 1,310,700 | 67,226 |
| Ulta Beauty, Inc. (a) | | 254,300 | 79,466 |
| Williams-Sonoma, Inc. (b) | | 1,010,300 | 58,759 |
| | | | 389,141 |
| Textiles, Apparel & Luxury Goods - 1.3% | | | |
| Brunello Cucinelli SpA | | 1,540,200 | 60,003 |
| Kering SA | | 11,600 | 6,335 |
| LVMH Moet Hennessy - Louis Vuitton SA | | 53,314 | 18,297 |
| NIKE, Inc. Class B | | 1,347,400 | 115,513 |
| PVH Corp. | | 500,500 | 57,477 |
| Tory Burch LLC: | | | |
| Class A (d)(e)(f) | | 702,741 | 39,136 |
| Class B (d)(e)(f) | | 324,840 | 19,036 |
| Under Armour, Inc. Class A (sub. vtg.) (a)(b) | | 1,228,609 | 27,705 |
| | | | 343,502 |
|
| TOTAL CONSUMER DISCRETIONARY | | | 1,830,879 |
|
| CONSUMER STAPLES - 2.8% | | | |
| Beverages - 0.5% | | | |
| Coca-Cola European Partners PLC | | 79,852 | 3,764 |
| Keurig Dr. Pepper, Inc. | | 664,700 | 16,717 |
| Monster Beverage Corp. (a) | | 906,200 | 57,843 |
| The Coca-Cola Co. | | 991,564 | 44,958 |
| | | | 123,282 |
| Food & Staples Retailing - 0.8% | | | |
| BJ's Wholesale Club Holdings, Inc. | | 1,513,800 | 38,329 |
| Costco Wholesale Corp. | | 124,600 | 27,255 |
| Southeastern Grocers, Inc. (a)(f) | | 51,368 | 2,177 |
| Tops Markets Corp. (f) | | 2,955 | 1,039 |
| Tops Markets Corp. (Escrow) (e)(f) | | 2,955,000 | 0 |
| Walmart, Inc. | | 1,521,100 | 150,574 |
| | | | 219,374 |
| Food Products - 0.1% | | | |
| Darling International, Inc. (a) | | 1,754,200 | 38,557 |
| Household Products - 1.0% | | | |
| Kimberly-Clark Corp. | | 190,500 | 22,256 |
| Procter & Gamble Co. | | 2,499,800 | 246,355 |
| | | | 268,611 |
| Personal Products - 0.2% | | | |
| Estee Lauder Companies, Inc. Class A | | 262,000 | 41,118 |
| L'Oreal SA | | 10,600 | 2,673 |
| | | | 43,791 |
| Tobacco - 0.2% | | | |
| Altria Group, Inc. | | 1,151,000 | 60,324 |
|
| TOTAL CONSUMER STAPLES | | | 753,939 |
|
| ENERGY - 2.3% | | | |
| Energy Equipment & Services - 0.0% | | | |
| Pacific Drilling SA (a) | | 305,987 | 4,682 |
| Pacific Drilling SA | | 17,729 | 271 |
| Tidewater, Inc.: | | | |
| warrants 11/14/42 (a) | | 23,695 | 592 |
| warrants 11/14/42 (a) | | 8,251 | 206 |
| | | | 5,751 |
| Oil, Gas & Consumable Fuels - 2.3% | | | |
| Anadarko Petroleum Corp. | | 1,479,900 | 64,376 |
| Ascent Resources Marcellus Holdings, Inc. (f) | | 182,155 | 579 |
| Ascent Resources Marcellus Holdings, Inc. warrants 3/30/23 (a)(f) | | 51,925 | 26 |
| BP PLC | | 17,561,400 | 124,498 |
| Chevron Corp. | | 366,000 | 43,766 |
| ConocoPhillips Co. | | 534,600 | 36,273 |
| Contura Energy, Inc. (a) | | 840 | 52 |
| Devon Energy Corp. | | 900,000 | 26,559 |
| EOG Resources, Inc. | | 505,600 | 47,526 |
| Hess Corp. | | 1,673,200 | 96,795 |
| Marathon Petroleum Corp. | | 1,016,300 | 63,021 |
| Reliance Industries Ltd. | | 3,777,500 | 65,645 |
| Riviera Resources, Inc. (a) | | 5,326 | 79 |
| Roan Resources, Inc. (a) | | 42,734 | 332 |
| Suncor Energy, Inc. | | 1,060,000 | 36,538 |
| Ultra Petroleum Corp. warrants 7/14/25 (a) | | 33,810 | 0 |
| | | | 606,065 |
|
| TOTAL ENERGY | | | 611,816 |
|
| FINANCIALS - 6.4% | | | |
| Banks - 3.9% | | | |
| Bank of America Corp. | | 19,002,100 | 552,581 |
| Citigroup, Inc. | | 3,030,340 | 193,881 |
| HDFC Bank Ltd. sponsored ADR | | 174,900 | 17,686 |
| Huntington Bancshares, Inc. | | 3,763,000 | 54,225 |
| JPMorgan Chase & Co. | | 1,108,523 | 115,685 |
| M&T Bank Corp. | | 246,000 | 42,573 |
| SunTrust Banks, Inc. | | 1,304,000 | 84,590 |
| | | | 1,061,221 |
| Capital Markets - 1.6% | | | |
| Charles Schwab Corp. | | 1,845,100 | 84,893 |
| CME Group, Inc. | | 693,900 | 126,227 |
| E*TRADE Financial Corp. | | 485,800 | 23,799 |
| Motors Liquidation Co. GUC Trust (a) | | 28,150 | 274 |
| MSCI, Inc. | | 554,300 | 102,390 |
| S&P Global, Inc. | | 410,200 | 82,192 |
| | | | 419,775 |
| Diversified Financial Services - 0.9% | | | |
| Berkshire Hathaway, Inc. Class B (a) | | 1,167,300 | 234,977 |
|
| TOTAL FINANCIALS | | | 1,715,973 |
|
| HEALTH CARE - 12.9% | | | |
| Biotechnology - 3.4% | | | |
| ACADIA Pharmaceuticals, Inc. (a) | | 860,504 | 22,803 |
| Alexion Pharmaceuticals, Inc. (a) | | 1,585,300 | 214,539 |
| Amgen, Inc. | | 249,800 | 47,482 |
| Audentes Therapeutics, Inc. (a) | | 644,800 | 19,744 |
| Biogen, Inc. (a) | | 192,500 | 63,142 |
| Blueprint Medicines Corp. (a) | | 121,200 | 9,961 |
| Celgene Corp. (a) | | 145,000 | 12,052 |
| Neurocrine Biosciences, Inc. (a) | | 401,522 | 31,018 |
| Regeneron Pharmaceuticals, Inc. (a) | | 280,000 | 120,607 |
| Sarepta Therapeutics, Inc. (a) | | 393,900 | 56,816 |
| Vertex Pharmaceuticals, Inc. (a) | | 1,608,000 | 303,510 |
| | | | 901,674 |
| Health Care Equipment & Supplies - 4.2% | | | |
| Becton, Dickinson & Co. | | 1,165,600 | 289,990 |
| Boston Scientific Corp. (a) | | 7,356,700 | 295,151 |
| Corindus Vascular Robotics, Inc. (a)(e) | | 5,000,000 | 6,600 |
| Danaher Corp. | | 1,019,022 | 129,436 |
| Edwards Lifesciences Corp. (a) | | 419,700 | 71,051 |
| Hologic, Inc. (a) | | 765,016 | 36,071 |
| Intuitive Surgical, Inc. (a) | | 242,500 | 132,795 |
| Stryker Corp. | | 697,200 | 131,429 |
| Teleflex, Inc. | | 98,000 | 28,404 |
| | | | 1,120,927 |
| Health Care Providers & Services - 2.8% | | | |
| Cigna Corp. | | 337,000 | 58,786 |
| HCA Holdings, Inc. | | 587,500 | 81,686 |
| Humana, Inc. | | 744,200 | 212,127 |
| UnitedHealth Group, Inc. | | 1,488,700 | 360,593 |
| Wellcare Health Plans, Inc. (a) | | 200,828 | 50,926 |
| | | | 764,118 |
| Life Sciences Tools & Services - 0.6% | | | |
| Thermo Fisher Scientific, Inc. | | 576,600 | 149,668 |
| Pharmaceuticals - 1.9% | | | |
| Allergan PLC | | 453,400 | 62,438 |
| AstraZeneca PLC sponsored ADR | | 4,520,700 | 187,971 |
| Bristol-Myers Squibb Co. | | 1,227,000 | 63,387 |
| Eli Lilly & Co. | | 575,700 | 72,705 |
| Nektar Therapeutics (a) | | 234,300 | 9,499 |
| The Medicines Company (a) | | 461,000 | 11,373 |
| Zoetis, Inc. Class A | | 1,115,400 | 105,104 |
| | | | 512,477 |
|
| TOTAL HEALTH CARE | | | 3,448,864 |
|
| INDUSTRIALS - 7.0% | | | |
| Aerospace & Defense - 1.8% | | | |
| Huntington Ingalls Industries, Inc. | | 183,600 | 38,448 |
| Northrop Grumman Corp. | | 319,400 | 92,613 |
| Space Exploration Technologies Corp.: | | | |
| Class A (a)(e)(f) | | 41,122 | 7,649 |
| Class C (a)(e)(f) | | 5,607 | 1,043 |
| The Boeing Co. | | 443,000 | 194,902 |
| TransDigm Group, Inc. (a) | | 95,500 | 41,456 |
| United Technologies Corp. | | 866,900 | 108,943 |
| | | | 485,054 |
| Air Freight & Logistics - 0.1% | | | |
| United Parcel Service, Inc. Class B | | 270,000 | 29,754 |
| Airlines - 0.1% | | | |
| American Airlines Group, Inc. | | 1,019,500 | 36,325 |
| Commercial Services & Supplies - 0.1% | | | |
| TulCo LLC (a)(d)(e)(f) | | 42,857 | 23,493 |
| Construction & Engineering - 0.5% | | | |
| Jacobs Engineering Group, Inc. | | 1,847,200 | 136,286 |
| Electrical Equipment - 0.6% | | | |
| AMETEK, Inc. | | 567,000 | 45,122 |
| Emerson Electric Co. | | 562,800 | 38,355 |
| Fortive Corp. | | 815,000 | 66,480 |
| | | | 149,957 |
| Industrial Conglomerates - 0.4% | | | |
| General Electric Co. | | 11,645,300 | 120,995 |
| Machinery - 0.9% | | | |
| Deere & Co. | | 1,220,340 | 200,185 |
| Wabtec Corp. | | 43,211 | 3,166 |
| Xylem, Inc. | | 338,863 | 25,601 |
| | | | 228,952 |
| Professional Services - 0.3% | | | |
| IHS Markit Ltd. (a) | | 1,289,300 | 68,552 |
| Road & Rail - 2.2% | | | |
| CSX Corp. | | 1,910,400 | 138,829 |
| Norfolk Southern Corp. | | 1,444,100 | 258,927 |
| Union Pacific Corp. | | 1,204,100 | 201,928 |
| | | | 599,684 |
| Trading Companies & Distributors - 0.0% | | | |
| United Rentals, Inc. (a) | | 22,500 | 3,028 |
|
| TOTAL INDUSTRIALS | | | 1,882,080 |
|
| INFORMATION TECHNOLOGY - 14.7% | | | |
| Communications Equipment - 0.1% | | | |
| Telefonaktiebolaget LM Ericsson (B Shares) sponsored ADR | | 2,705,000 | 24,534 |
| Electronic Equipment & Components - 0.0% | | | |
| CDW Corp. | | 16,700 | 1,568 |
| IT Services - 3.2% | | | |
| Accenture PLC Class A | | 403,000 | 65,036 |
| Adyen BV (g) | | 40,895 | 30,701 |
| GoDaddy, Inc. (a) | | 350,000 | 26,128 |
| MasterCard, Inc. Class A | | 1,172,400 | 263,520 |
| MongoDB, Inc. Class A (a)(b) | | 170,000 | 17,265 |
| PayPal Holdings, Inc. (a) | | 1,389,100 | 136,229 |
| Visa, Inc. Class A | | 1,973,200 | 292,270 |
| Worldpay, Inc. (a) | | 390,200 | 37,381 |
| | | | 868,530 |
| Semiconductors & Semiconductor Equipment - 2.1% | | | |
| Advanced Micro Devices, Inc. (a) | | 600,000 | 14,118 |
| ASML Holding NV | | 612,200 | 111,953 |
| Broadcom, Inc. | | 546,800 | 150,567 |
| Cypress Semiconductor Corp. | | 1,614 | 25 |
| Intel Corp. | | 838,100 | 44,386 |
| Lam Research Corp. | | 400,700 | 70,559 |
| Marvell Technology Group Ltd. | | 559,600 | 11,164 |
| NVIDIA Corp. | | 356,000 | 54,917 |
| NXP Semiconductors NV | | 666,600 | 60,874 |
| Qualcomm, Inc. | | 572,000 | 30,539 |
| | | | 549,102 |
| Software - 8.5% | | | |
| 2U, Inc. (a)(b) | | 1,071,853 | 78,996 |
| Adobe, Inc. (a) | | 970,600 | 254,783 |
| Atom Tickets LLC (a)(d)(e)(f) | | 2,580,511 | 7,690 |
| Autodesk, Inc. (a) | | 185,000 | 30,157 |
| CDK Global, Inc. | | 67,200 | 3,898 |
| Citrix Systems, Inc. | | 935,700 | 98,716 |
| Guidewire Software, Inc. (a) | | 360,000 | 33,026 |
| Intuit, Inc. | | 637,766 | 157,611 |
| Microsoft Corp. | | 8,318,700 | 931,935 |
| Salesforce.com, Inc. (a) | | 2,671,182 | 437,139 |
| The Trade Desk, Inc. (a) | | 386,500 | 76,349 |
| Workday, Inc. Class A (a) | | 887,400 | 175,643 |
| | | | 2,285,943 |
| Technology Hardware, Storage & Peripherals - 0.8% | | | |
| Apple, Inc. | | 1,237,500 | 214,273 |
|
| TOTAL INFORMATION TECHNOLOGY | | | 3,943,950 |
|
| MATERIALS - 2.0% | | | |
| Chemicals - 1.8% | | | |
| CF Industries Holdings, Inc. | | 1,284,400 | 54,202 |
| DowDuPont, Inc. | | 2,268,202 | 120,736 |
| FMC Corp. | | 198,512 | 17,767 |
| Nutrien Ltd. | | 1,715,000 | 93,365 |
| Olin Corp. | | 1,430,000 | 36,980 |
| Sherwin-Williams Co. | | 152,900 | 66,236 |
| The Chemours Co. LLC | | 327,500 | 12,455 |
| The Mosaic Co. | | 2,965,700 | 92,737 |
| | | | 494,478 |
| Metals & Mining - 0.2% | | | |
| Barrick Gold Corp. | | 3,298,500 | 41,693 |
| Franco-Nevada Corp. | | 156,000 | 11,753 |
| Warrior Metropolitan Coal, Inc. | | 242 | 7 |
| | | | 53,453 |
|
| TOTAL MATERIALS | | | 547,931 |
|
| REAL ESTATE - 1.8% | | | |
| Equity Real Estate Investment Trusts (REITs) - 1.8% | | | |
| American Tower Corp. | | 1,698,500 | 299,191 |
| Ant International Co. Ltd. Class C (e)(f) | | 1,782,512 | 11,283 |
| Crown Castle International Corp. | | 1,071,500 | 127,241 |
| Gaming & Leisure Properties | | 126,400 | 4,598 |
| Simon Property Group, Inc. | | 283,605 | 51,378 |
| | | | 493,691 |
| UTILITIES - 1.3% | | | |
| Electric Utilities - 0.9% | | | |
| FirstEnergy Corp. | | 699,000 | 28,484 |
| NextEra Energy, Inc. | | 440,500 | 82,691 |
| Vistra Energy Corp. | | 5,314,300 | 138,384 |
| | | | 249,559 |
| Independent Power and Renewable Electricity Producers - 0.4% | | | |
| NRG Energy, Inc. | | 2,309,200 | 96,247 |
| NRG Yield, Inc. Class C | | 144,200 | 2,162 |
| | | | 98,409 |
|
| TOTAL UTILITIES | | | 347,968 |
|
| TOTAL COMMON STOCKS | | | |
| (Cost $13,053,304) | | | 17,340,879 |
|
| Convertible Preferred Stocks - 1.2% | | | |
| CONSUMER DISCRETIONARY - 0.5% | | | |
| Hotels, Restaurants & Leisure - 0.1% | | | |
| Neutron Holdings, Inc.: | | | |
| Series C (e)(f) | | 38,589,900 | 9,358 |
| Series D (e)(f) | | 40,824,742 | 9,900 |
| | | | 19,258 |
| Internet & Direct Marketing Retail - 0.1% | | | |
| The Honest Co., Inc.: | | | |
| Series D (a)(e)(f) | | 196,700 | 9,001 |
| Series E (a)(e)(f) | | 1,020,158 | 19,995 |
| | | | 28,996 |
| Leisure Products - 0.1% | | | |
| Peloton Interactive, Inc. Series E (a)(e)(f) | | 1,846,568 | 26,665 |
| Specialty Retail - 0.1% | | | |
| Moda Operandi, Inc.: | | | |
| Series E (a)(e)(f) | | 508,444 | 16,006 |
| Series F (a)(e)(f) | | 157,251 | 4,950 |
| | | | 20,956 |
| Textiles, Apparel & Luxury Goods - 0.1% | | | |
| Goop International Holdings, Inc. Series C (a)(e)(f) | | 1,881,874 | 13,681 |
| Rent the Runway, Inc. Series E (a)(e)(f) | | 1,378,930 | 30,819 |
| | | | 44,500 |
|
| TOTAL CONSUMER DISCRETIONARY | | | 140,375 |
|
| HEALTH CARE - 0.1% | | | |
| Biotechnology - 0.0% | | | |
| Generation Bio Series B (e)(f) | | 370,500 | 3,368 |
| Health Care Providers & Services - 0.1% | | | |
| Get Heal, Inc. Series B (a)(e)(f) | | 8,512,822 | 145 |
| Mulberry Health, Inc.: | | | |
| Series A (e)(f) | | 700,782 | 5,008 |
| Series A8 (a)(e)(f) | | 2,960,879 | 21,158 |
| Series AA (e)(f) | | 58,145 | 415 |
| | | | 26,726 |
|
| TOTAL HEALTH CARE | | | 30,094 |
|
| INDUSTRIALS - 0.1% | | | |
| Aerospace & Defense - 0.1% | | | |
| Space Exploration Technologies Corp. Series H (a)(e)(f) | | 51,921 | 9,657 |
| INFORMATION TECHNOLOGY - 0.5% | | | |
| Software - 0.5% | | | |
| Jello Labs, Inc. Series C (a)(e)(f) | | 1,050,307 | 0 |
| Lyft, Inc.: | | | |
| Series H (a)(e)(f) | | 754,791 | 37,513 |
| Series I (e)(f) | | 380,117 | 18,892 |
| Uber Technologies, Inc. Series D, 8.00% (a)(e)(f) | | 1,596,241 | 77,849 |
| | | | 134,254 |
| UTILITIES - 0.0% | | | |
| Electric Utilities - 0.0% | | | |
| Vistra Energy Corp. 7.00% | | 57,400 | 5,665 |
| TOTAL CONVERTIBLE PREFERRED STOCKS | | | |
| (Cost $267,357) | | | 320,045 |
| | | Principal Amount (000s) | Value (000s) |
|
| Corporate Bonds - 14.5% | | | |
| Convertible Bonds - 0.0% | | | |
| INDUSTRIALS - 0.0% | | | |
| Electrical Equipment - 0.0% | | | |
| SolarCity Corp. 1.625% 11/1/19 | | 4,288 | 4,071 |
| Nonconvertible Bonds - 14.5% | | | |
| COMMUNICATION SERVICES - 1.6% | | | |
| Diversified Telecommunication Services - 0.4% | | | |
| Altice Finco SA: | | | |
| 7.625% 2/15/25 (g) | | 4,785 | 4,283 |
| 8.125% 1/15/24 (g) | | 574 | 580 |
| AT&T, Inc.: | | | |
| 2.45% 6/30/20 | | 4,383 | 4,352 |
| 3.6% 2/17/23 | | 9,124 | 9,181 |
| 4.45% 4/1/24 | | 590 | 611 |
| 4.5% 3/9/48 | | 17,000 | 15,217 |
| BellSouth Capital Funding Corp. 7.875% 2/15/30 | | 68 | 80 |
| C&W Senior Financing Designated Activity Co.: | | | |
| 6.875% 9/15/27 (g) | | 1,715 | 1,681 |
| 7.5% 10/15/26 (g) | | 1,270 | 1,295 |
| CenturyLink, Inc. 6.15% 9/15/19 | | 3,331 | 3,368 |
| Frontier Communications Corp.: | | | |
| 8.5% 4/1/26 (g) | | 3,620 | 3,367 |
| 11% 9/15/25 | | 4,170 | 2,664 |
| GCI, Inc. 6.875% 4/15/25 | | 1,350 | 1,377 |
| Level 3 Communications, Inc. 5.75% 12/1/22 | | 1,295 | 1,310 |
| Level 3 Financing, Inc.: | | | |
| 5.375% 8/15/22 | | 2,110 | 2,123 |
| 6.125% 1/15/21 | | 1,405 | 1,411 |
| SFR Group SA: | | | |
| 6.25% 5/15/24 (g) | | 660 | 660 |
| 7.375% 5/1/26 (g) | | 4,650 | 4,563 |
| 8.125% 2/1/27 (g) | | 4,145 | 4,166 |
| Sprint Capital Corp.: | | | |
| 6.875% 11/15/28 | | 3,440 | 3,395 |
| 6.9% 5/1/19 | | 3,975 | 3,985 |
| 8.75% 3/15/32 | | 4,680 | 5,075 |
| Verizon Communications, Inc.: | | | |
| 2.625% 2/21/20 | | 4,697 | 4,689 |
| 3.85% 11/1/42 | | 1,470 | 1,325 |
| 4.522% 9/15/48 | | 2,247 | 2,205 |
| 4.862% 8/21/46 | | 4,188 | 4,306 |
| 5.012% 4/15/49 | | 6,100 | 6,385 |
| 5.012% 8/21/54 | | 23,690 | 24,336 |
| | | | 117,990 |
| Entertainment - 0.2% | | | |
| AOL Time Warner, Inc. 2.95% 7/15/26 | | 17,000 | 15,784 |
| NBCUniversal, Inc.: | | | |
| 4.45% 1/15/43 | | 2,479 | 2,457 |
| 5.95% 4/1/41 | | 1,734 | 2,048 |
| Netflix, Inc.: | | | |
| 4.375% 11/15/26 | | 3,415 | 3,286 |
| 5.875% 11/15/28 (g) | | 2,195 | 2,286 |
| New Cotai LLC/New Cotai Capital Corp. 10.625% 5/1/19 pay-in-kind (g)(h) | | 6,964 | 3,482 |
| Time Warner, Inc. 2.1% 6/1/19 | | 10,446 | 10,422 |
| Viacom, Inc.: | | | |
| 5.875% 2/28/57 (h) | | 1,375 | 1,358 |
| 6.25% 2/28/57 (h) | | 1,850 | 1,840 |
| | | | 42,963 |
| Interactive Media & Services - 0.0% | | | |
| Match Group, Inc.: | | | |
| 5% 12/15/27 (g) | | 1,235 | 1,221 |
| 5.625% 2/15/29 (g) | | 1,255 | 1,248 |
| | | | 2,469 |
| Media - 0.9% | | | |
| 21st Century Fox America, Inc. 7.75% 12/1/45 | | 8,012 | 11,807 |
| Altice Financing SA: | | | |
| 6.625% 2/15/23 (g) | | 2,620 | 2,679 |
| 7.5% 5/15/26 (g) | | 3,625 | 3,507 |
| Altice SA: | | | |
| 7.625% 2/15/25 (g) | | 4,905 | 4,356 |
| 7.75% 5/15/22 (g) | | 10,065 | 10,002 |
| Cable One, Inc. 5.75% 6/15/22 (g) | | 895 | 911 |
| CCO Holdings LLC/CCO Holdings Capital Corp.: | | | |
| 5% 2/1/28 (g) | | 1,315 | 1,266 |
| 5.125% 5/1/23 (g) | | 3,155 | 3,211 |
| 5.125% 5/1/27 (g) | | 9,765 | 9,582 |
| 5.25% 3/15/21 | | 3,375 | 3,388 |
| 5.5% 5/1/26 (g) | | 2,370 | 2,417 |
| 5.75% 1/15/24 | | 4,235 | 4,338 |
| 5.75% 2/15/26 (g) | | 5,010 | 5,192 |
| 5.875% 5/1/27 (g) | | 6,060 | 6,225 |
| Cengage Learning, Inc. 9.5% 6/15/24 (g) | | 1,005 | 837 |
| Charter Communications Operating LLC/Charter Communications Operating Capital Corp.: | | | |
| 4.464% 7/23/22 | | 7,702 | 7,900 |
| 4.908% 7/23/25 | | 5,177 | 5,363 |
| 5.375% 5/1/47 | | 27,968 | 26,517 |
| 6.484% 10/23/45 | | 1,983 | 2,133 |
| Clear Channel Worldwide Holdings, Inc.: | | | |
| Series A, 6.5% 11/15/22 | | 755 | 771 |
| 7.625% 3/15/20 | | 3,205 | 3,207 |
| Comcast Corp.: | | | |
| 3.9% 3/1/38 | | 1,325 | 1,253 |
| 3.969% 11/1/47 | | 4,281 | 3,971 |
| 3.999% 11/1/49 | | 4,886 | 4,537 |
| 4% 3/1/48 | | 2,423 | 2,265 |
| 4.6% 8/15/45 | | 3,500 | 3,534 |
| 4.65% 7/15/42 | | 3,127 | 3,175 |
| CSC Holdings LLC: | | | |
| 5.375% 7/15/23 (g) | | 2,375 | 2,441 |
| 5.375% 2/1/28 (g) | | 3,605 | 3,542 |
| 5.5% 4/15/27 (g) | | 8,830 | 8,874 |
| 6.5% 2/1/29 (g) | | 3,155 | 3,301 |
| 7.5% 4/1/28 (g) | | 3,610 | 3,809 |
| 7.75% 7/15/25 (g) | | 1,990 | 2,124 |
| DISH DBS Corp.: | | | |
| 5% 3/15/23 | | 2,675 | 2,364 |
| 5.875% 7/15/22 | | 2,655 | 2,536 |
| E.W. Scripps Co. 5.125% 5/15/25 (g) | | 695 | 669 |
| Fox Corp.: | | | |
| 3.666% 1/25/22 (g) | | 1,060 | 1,072 |
| 4.03% 1/25/24 (g) | | 1,864 | 1,900 |
| 4.709% 1/25/29 (g) | | 2,698 | 2,797 |
| 5.476% 1/25/39 (g) | | 2,660 | 2,788 |
| 5.576% 1/25/49 (g) | | 1,765 | 1,864 |
| Lamar Media Corp. 5.375% 1/15/24 | | 630 | 647 |
| Nielsen Finance LLC/Nielsen Finance Co. 5% 4/15/22 (g) | | 685 | 683 |
| Sirius XM Radio, Inc.: | | | |
| 5% 8/1/27 (g) | | 2,770 | 2,708 |
| 5.375% 4/15/25 (g) | | 1,490 | 1,518 |
| Time Warner Cable, Inc.: | | | |
| 4% 9/1/21 | | 9,654 | 9,749 |
| 4.5% 9/15/42 | | 14,732 | 12,375 |
| 5.5% 9/1/41 | | 2,304 | 2,180 |
| 6.55% 5/1/37 | | 12,627 | 13,390 |
| 7.3% 7/1/38 | | 3,823 | 4,315 |
| 8.25% 4/1/19 | | 10,176 | 10,217 |
| Ziggo Bond Finance BV: | | | |
| 5.875% 1/15/25 (g) | | 1,120 | 1,089 |
| 6% 1/15/27 (g) | | 4,760 | 4,510 |
| Ziggo Secured Finance BV 5.5% 1/15/27 (g) | | 7,840 | 7,566 |
| | | | 245,372 |
| Wireless Telecommunication Services - 0.1% | | | |
| Intelsat Jackson Holdings SA 8.5% 10/15/24 (g) | | 5,935 | 5,993 |
| Neptune Finco Corp. 10.875% 10/15/25 (g) | | 3,767 | 4,370 |
| Sprint Communications, Inc. 6% 11/15/22 | | 9,820 | 9,962 |
| Sprint Corp.: | | | |
| 7.125% 6/15/24 | | 3,105 | 3,208 |
| 7.625% 2/15/25 | | 775 | 812 |
| 7.625% 3/1/26 | | 1,220 | 1,266 |
| 7.875% 9/15/23 | | 4,515 | 4,825 |
| T-Mobile U.S.A., Inc. 6% 3/1/23 | | 2,590 | 2,661 |
| | | | 33,097 |
| TOTAL COMMUNICATION SERVICES | | | 441,891 |
| CONSUMER DISCRETIONARY - 0.6% | | | |
| Automobiles - 0.2% | | | |
| General Motors Financial Co., Inc.: | | | |
| 3.15% 1/15/20 | | 12,000 | 11,999 |
| 3.5% 7/10/19 | | 17,868 | 17,902 |
| 4% 1/15/25 | | 6,368 | 6,117 |
| 4.25% 5/15/23 | | 3,285 | 3,295 |
| 4.375% 9/25/21 | | 11,267 | 11,451 |
| | | | 50,764 |
| Diversified Consumer Services - 0.0% | | | |
| Laureate Education, Inc. 8.25% 5/1/25 (g) | | 4,170 | 4,504 |
| Service Corp. International 5.375% 1/15/22 | | 505 | 510 |
| | | | 5,014 |
| Hotels, Restaurants & Leisure - 0.3% | | | |
| Aramark Services, Inc. 5% 2/1/28 (g) | | 2,480 | 2,449 |
| Chukchansi Economic Development Authority 9.75% 5/30/20 (g)(i) | | 2,861 | 1,573 |
| Delta Merger Sub, Inc. 6% 9/15/26 (g) | | 685 | 697 |
| Eldorado Resorts, Inc. 6% 4/1/25 | | 1,690 | 1,717 |
| GLP Capital LP/GLP Financing II, Inc.: | | | |
| 5.25% 6/1/25 | | 1,440 | 1,491 |
| 5.375% 4/15/26 | | 735 | 759 |
| Golden Nugget, Inc.: | | | |
| 6.75% 10/15/24 (g) | | 3,025 | 3,040 |
| 8.75% 10/1/25 (g) | | 1,385 | 1,427 |
| Hilton Domestic Operating Co., Inc. 5.125% 5/1/26 (g) | | 3,650 | 3,667 |
| Hilton Worldwide Finance LLC/Hilton Worldwide Finance Corp.: | | | |
| 4.625% 4/1/25 | | 1,940 | 1,930 |
| 4.875% 4/1/27 | | 1,165 | 1,159 |
| International Game Technology PLC 6.25% 1/15/27 (g) | | 960 | 1,000 |
| KFC Holding Co./Pizza Hut Holding LLC: | | | |
| 4.75% 6/1/27 (g) | | 1,325 | 1,305 |
| 5% 6/1/24 (g) | | 3,275 | 3,317 |
| Merlin Entertainments PLC 5.75% 6/15/26 (g) | | 4,500 | 4,646 |
| MGM Growth Properties Operating Partnership LP 5.75% 2/1/27 (g) | | 1,315 | 1,346 |
| MGM Mirage, Inc. 5.75% 6/15/25 | | 5,680 | 5,803 |
| Penn National Gaming, Inc. 5.625% 1/15/27 (g) | | 355 | 339 |
| Scientific Games Corp.: | | | |
| 6.25% 9/1/20 | | 580 | 581 |
| 6.625% 5/15/21 | | 5,350 | 5,420 |
| 10% 12/1/22 | | 6,840 | 7,191 |
| Silversea Cruises 7.25% 2/1/25 (g) | | 745 | 807 |
| Studio City Co. Ltd. 5.875% 11/30/19 (g) | | 1,180 | 1,194 |
| Sugarhouse HSP Gaming Prop Mezz LP/Sugarhouse HSP Gaming Finance Corp. 5.875% 5/15/25 (g) | | 1,280 | 1,264 |
| Voc Escrow Ltd. 5% 2/15/28 (g) | | 1,265 | 1,230 |
| Wyndham Hotels & Resorts, Inc. 5.375% 4/15/26 (g) | | 2,180 | 2,205 |
| Wynn Las Vegas LLC/Wynn Las Vegas Capital Corp. 5.25% 5/15/27 (g) | | 3,060 | 2,927 |
| Wynn Macau Ltd.: | | | |
| 4.875% 10/1/24 (g) | | 1,175 | 1,134 |
| 5.5% 10/1/27 (g) | | 1,445 | 1,378 |
| | | | 62,996 |
| Household Durables - 0.0% | | | |
| Brookfield Residential Properties, Inc./Brookfield Residential U.S. Corp. 6.125% 7/1/22 (g) | | 785 | 780 |
| Brookfield Residential Properties, Inc. 6.5% 12/15/20 (g) | | 620 | 622 |
| Reynolds Group Issuer, Inc./Reynolds Group Issuer LLC/Reynolds Group Issuer (Luxembourg) SA: | | | |
| 5.125% 7/15/23 (g) | | 925 | 925 |
| 5.75% 10/15/20 | | 4,433 | 4,442 |
| 7% 7/15/24 (g) | | 1,160 | 1,188 |
| | | | 7,957 |
| Internet & Direct Marketing Retail - 0.0% | | | |
| Netflix, Inc. 4.875% 4/15/28 | | 1,735 | 1,688 |
| Zayo Group LLC/Zayo Capital, Inc. 5.75% 1/15/27 (g) | | 3,785 | 3,671 |
| | | | 5,359 |
| Specialty Retail - 0.1% | | | |
| Home Depot, Inc. 3.9% 12/6/28 | | 15,000 | 15,544 |
| Sonic Automotive, Inc. 5% 5/15/23 | | 195 | 184 |
| | | | 15,728 |
| TOTAL CONSUMER DISCRETIONARY | | | 147,818 |
| CONSUMER STAPLES - 0.7% | | | |
| Beverages - 0.3% | | | |
| Anheuser-Busch InBev Finance, Inc.: | | | |
| 3.65% 2/1/26 | | 20,000 | 19,758 |
| 4.7% 2/1/36 | | 14,328 | 13,868 |
| 4.9% 2/1/46 | | 9,290 | 8,941 |
| Anheuser-Busch InBev Worldwide, Inc.: | | | |
| 4.75% 4/15/58 | | 7,024 | 6,376 |
| 5.45% 1/23/39 | | 6,930 | 7,273 |
| 5.55% 1/23/49 | | 15,844 | 16,641 |
| 5.8% 1/23/59 (Reg. S) | | 16,764 | 17,884 |
| | | | 90,741 |
| Food & Staples Retailing - 0.1% | | | |
| C&S Group Enterprises LLC 5.375% 7/15/22 (g) | | 1,445 | 1,454 |
| Cumberland Farms, Inc. 6.75% 5/1/25 (g) | | 670 | 694 |
| ESAL GmbH 6.25% 2/5/23 (g) | | 3,315 | 3,345 |
| Performance Food Group, Inc. 5.5% 6/1/24 (g) | | 1,050 | 1,053 |
| Rite Aid Corp.: | | | |
| 6.875% 12/15/28 (g)(h) | | 3,505 | 2,138 |
| 7.7% 2/15/27 | | 3,085 | 2,103 |
| Tops Markets LLC 13% 11/19/24 pay-in-kind (h) | | 528 | 536 |
| | | | 11,323 |
| Food Products - 0.1% | | | |
| CF Industries Holdings, Inc.: | | | |
| 4.95% 6/1/43 | | 6,065 | 5,072 |
| 5.15% 3/15/34 | | 3,065 | 2,881 |
| 5.375% 3/15/44 | | 2,305 | 2,014 |
| Darling International, Inc. 5.375% 1/15/22 | | 745 | 752 |
| JBS Investments II GmbH 7% 1/15/26 (g) | | 1,415 | 1,461 |
| JBS U.S.A. LLC/JBS U.S.A. Finance, Inc.: | | | |
| 5.75% 6/15/25 (g) | | 6,370 | 6,461 |
| 5.875% 7/15/24 (g) | | 1,500 | 1,542 |
| 6.75% 2/15/28 (g) | | 3,150 | 3,256 |
| Pilgrim's Pride Corp.: | | | |
| 5.75% 3/15/25 (g) | | 525 | 525 |
| 5.875% 9/30/27 (g) | | 935 | 919 |
| Post Holdings, Inc.: | | | |
| 5% 8/15/26 (g) | | 5,230 | 5,027 |
| 5.5% 3/1/25 (g) | | 1,485 | 1,489 |
| 5.75% 3/1/27 (g) | | 4,110 | 4,053 |
| | | | 35,452 |
| Tobacco - 0.2% | | | |
| Altria Group, Inc.: | | | |
| 2.625% 1/14/20 | | 4,950 | 4,935 |
| 4% 1/31/24 | | 3,123 | 3,152 |
| Imperial Tobacco Finance PLC: | | | |
| 3.75% 7/21/22 (g) | | 6,420 | 6,432 |
| 4.25% 7/21/25 (g) | | 6,420 | 6,411 |
| Reynolds American, Inc.: | | | |
| 3.25% 6/12/20 | | 1,273 | 1,272 |
| 4% 6/12/22 | | 4,375 | 4,428 |
| 4.45% 6/12/25 | | 3,173 | 3,200 |
| 4.85% 9/15/23 | | 7,000 | 7,312 |
| 5.7% 8/15/35 | | 1,646 | 1,623 |
| 5.85% 8/15/45 | | 5,525 | 5,264 |
| 7.25% 6/15/37 | | 6,101 | 6,668 |
| Vector Group Ltd. 6.125% 2/1/25 (g) | | 2,745 | 2,429 |
| | | | 53,126 |
| TOTAL CONSUMER STAPLES | | | 190,642 |
| ENERGY - 2.5% | | | |
| Energy Equipment & Services - 0.2% | | | |
| El Paso Pipeline Partners Operating Co. LLC: | | | |
| 5% 10/1/21 | | 5,755 | 5,975 |
| 6.5% 4/1/20 | | 2,937 | 3,039 |
| Ensco PLC: | | | |
| 4.5% 10/1/24 | | 3,510 | 2,716 |
| 5.2% 3/15/25 | | 660 | 507 |
| 7.75% 2/1/26 | | 1,600 | 1,344 |
| Exterran Partners LP/EXLP Finance Corp.: | | | |
| 6% 4/1/21 | | 7,640 | 7,602 |
| 6% 10/1/22 | | 930 | 921 |
| Halliburton Co.: | | | |
| 3.8% 11/15/25 | | 3,469 | 3,485 |
| 4.85% 11/15/35 | | 3,029 | 3,069 |
| Jonah Energy LLC 7.25% 10/15/25 (g) | | 2,740 | 1,767 |
| KLX Energy Services Holdings, Inc. 11.5% 11/1/25 (g) | | 1,585 | 1,648 |
| Nabors Industries, Inc.: | | | |
| 5.5% 1/15/23 | | 1,205 | 1,130 |
| 5.75% 2/1/25 | | 3,671 | 3,240 |
| Noble Holding International Ltd.: | | | |
| 6.05% 3/1/41 | | 80 | 51 |
| 6.2% 8/1/40 | | 2,270 | 1,453 |
| 7.75% 1/15/24 | | 3,517 | 3,130 |
| 7.875% 2/1/26 (g) | | 1,405 | 1,314 |
| 7.95% 4/1/25 (h) | | 2,995 | 2,621 |
| Pacific Drilling Second Lien Escrow Issuer Ltd. 12% 4/1/24 pay-in-kind (g)(h) | | 137 | 140 |
| Pride International, Inc. 7.875% 8/15/40 | | 2,554 | 2,069 |
| SESI LLC 7.75% 9/15/24 | | 985 | 837 |
| Summit Midstream Holdings LLC 5.75% 4/15/25 | | 1,290 | 1,232 |
| Transocean Pontus Ltd. 6.125% 8/1/25 (g) | | 473 | 477 |
| Transocean, Inc. 7.25% 11/1/25 (g) | | 3,170 | 3,027 |
| Weatherford International Ltd. 9.875% 2/15/24 | | 1,560 | 1,123 |
| Weatherford International, Inc. 9.875% 3/1/25 | | 6,937 | 4,943 |
| | | | 58,860 |
| Oil, Gas & Consumable Fuels - 2.3% | | | |
| Alberta Energy Co. Ltd. 8.125% 9/15/30 | | 5,984 | 7,352 |
| Alpha Natural Resources, Inc. 9.75% 4/15/18 (f)(i) | | 1,099 | 0 |
| Amerada Hess Corp.: | | | |
| 7.3% 8/15/31 | | 1,988 | 2,265 |
| 7.875% 10/1/29 | | 2,989 | 3,503 |
| Anadarko Finance Co. 7.5% 5/1/31 | | 6,940 | 8,399 |
| Anadarko Petroleum Corp.: | | | |
| 4.85% 3/15/21 | | 8,942 | 9,187 |
| 5.55% 3/15/26 | | 7,601 | 8,122 |
| 6.45% 9/15/36 | | 3,100 | 3,489 |
| 6.6% 3/15/46 | | 8,166 | 9,655 |
| Antero Midstream Partners LP/Antero Midstream Finance Corp.: | | | |
| 5.375% 9/15/24 | | 785 | 785 |
| 5.75% 3/1/27 (g) | | 2,685 | 2,705 |
| Antero Resources Finance Corp. 5.375% 11/1/21 | | 1,790 | 1,797 |
| Blue Racer Midstream LLC/Blue Racer Finance Corp. 6.125% 11/15/22 (g) | | 5,000 | 5,069 |
| California Resources Corp. 8% 12/15/22 (g) | | 13,740 | 10,975 |
| Callon Petroleum Co.: | | | |
| 6.125% 10/1/24 | | 730 | 735 |
| 6.375% 7/1/26 | | 845 | 845 |
| Canadian Natural Resources Ltd. 5.85% 2/1/35 | | 3,450 | 3,771 |
| Cenovus Energy, Inc. 4.25% 4/15/27 | | 6,485 | 6,176 |
| Cheniere Corpus Christi Holdings LLC: | | | |
| 5.125% 6/30/27 | | 4,290 | 4,376 |
| 5.875% 3/31/25 | | 2,210 | 2,354 |
| Cheniere Energy Partners LP 5.625% 10/1/26 (g) | | 1,685 | 1,717 |
| Chesapeake Energy Corp.: | | | |
| 3 month U.S. LIBOR + 3.250% 6.0373% 4/15/19 (h)(j) | | 2,150 | 2,153 |
| 4.875% 4/15/22 | | 2,820 | 2,707 |
| 5.75% 3/15/23 | | 1,800 | 1,737 |
| 8% 6/15/27 | | 4,455 | 4,412 |
| Columbia Pipeline Group, Inc.: | | | |
| 3.3% 6/1/20 | | 5,938 | 5,944 |
| 4.5% 6/1/25 | | 1,813 | 1,861 |
| Comstock Escrow Corp. 9.75% 8/15/26 (g) | | 3,095 | 2,869 |
| Consolidated Energy Finance SA: | | | |
| 3 month U.S. LIBOR + 3.750% 6.5382% 6/15/22 (g)(h)(j) | | 3,895 | 3,876 |
| 6.5% 5/15/26 (g) | | 6,020 | 5,704 |
| 6.875% 6/15/25 (g) | | 3,205 | 3,125 |
| Covey Park Energy LLC 7.5% 5/15/25 (g) | | 670 | 623 |
| Crestwood Midstream Partners LP/Crestwood Midstream Finance Corp. 6.25% 4/1/23 | | 1,150 | 1,180 |
| DCP Midstream LLC: | | | |
| 4.75% 9/30/21 (g) | | 5,634 | 5,733 |
| 5.35% 3/15/20 (g) | | 5,174 | 5,265 |
| 5.85% 5/21/43 (g)(h) | | 5,735 | 5,075 |
| DCP Midstream Operating LP: | | | |
| 2.7% 4/1/19 | | 4,139 | 4,134 |
| 3.875% 3/15/23 | | 2,327 | 2,310 |
| 4.95% 4/1/22 | | 1,048 | 1,072 |
| 5.375% 7/15/25 | | 2,390 | 2,486 |
| 5.6% 4/1/44 | | 1,686 | 1,557 |
| Denbury Resources, Inc.: | | | |
| 4.625% 7/15/23 | | 4,810 | 3,175 |
| 5.5% 5/1/22 | | 2,000 | 1,470 |
| 6.375% 8/15/21 | | 610 | 511 |
| 7.5% 2/15/24 (g) | | 4,531 | 4,044 |
| 9.25% 3/31/22 (g) | | 815 | 817 |
| Duke Energy Field Services 6.45% 11/3/36 (g) | | 3,753 | 3,781 |
| Empresa Nacional de Petroleo 4.375% 10/30/24 (g) | | 4,545 | 4,621 |
| Enable Midstream Partners LP: | | | |
| 2.4% 5/15/19 (h) | | 1,656 | 1,654 |
| 3.9% 5/15/24 (h) | | 1,746 | 1,700 |
| Enbridge Energy Partners LP: | | | |
| 4.2% 9/15/21 | | 6,629 | 6,747 |
| 4.375% 10/15/20 | | 4,351 | 4,429 |
| Enbridge, Inc. 4.25% 12/1/26 | | 2,391 | 2,438 |
| Endeavor Energy Resources LP/EER Finance, Inc.: | | | |
| 5.5% 1/30/26 (g) | | 665 | 697 |
| 5.75% 1/30/28 (g) | | 670 | 714 |
| Energy Transfer Partners LP: | | | |
| 4.2% 9/15/23 | | 1,460 | 1,489 |
| 4.5% 4/15/24 | | 1,866 | 1,916 |
| 4.95% 6/15/28 | | 4,982 | 5,076 |
| 5.25% 4/15/29 | | 3,035 | 3,174 |
| 5.8% 6/15/38 | | 2,778 | 2,835 |
| 6% 6/15/48 | | 21,809 | 22,629 |
| 6.25% 4/15/49 | | 4,731 | 5,078 |
| EP Energy LLC/Everest Acquisition Finance, Inc.: | | | |
| 7.75% 5/15/26 (g) | | 6,350 | 5,628 |
| 8% 11/29/24 (g) | | 990 | 698 |
| Hess Infrastructure Partners LP 5.625% 2/15/26 (g) | | 1,990 | 2,000 |
| Hilcorp Energy I LP/Hilcorp Finance Co.: | | | |
| 5.75% 10/1/25 (g) | | 6,625 | 6,584 |
| 6.25% 11/1/28 (g) | | 1,570 | 1,539 |
| Indigo Natural Resources LLC 6.875% 2/15/26 (g) | | 1,660 | 1,448 |
| Kinder Morgan Energy Partners LP: | | | |
| 3.45% 2/15/23 | | 7,202 | 7,212 |
| 3.5% 3/1/21 | | 2,994 | 3,012 |
| 6.55% 9/15/40 | | 674 | 775 |
| Kinder Morgan, Inc.: | | | |
| 5% 2/15/21 (g) | | 3,749 | 3,863 |
| 5.55% 6/1/45 | | 3,581 | 3,760 |
| Magnolia Oil & Gas Operating LLC 6% 8/1/26 (g) | | 1,480 | 1,476 |
| Marathon Petroleum Corp. 5.125% 3/1/21 | | 3,173 | 3,282 |
| MEG Energy Corp.: | | | |
| 6.375% 1/30/23 (g) | | 1,855 | 1,693 |
| 7% 3/31/24 (g) | | 4,725 | 4,323 |
| MPLX LP: | | | |
| 4.5% 7/15/23 | | 2,476 | 2,559 |
| 4.8% 2/15/29 | | 1,458 | 1,495 |
| 4.875% 12/1/24 | | 3,335 | 3,482 |
| 5.5% 2/15/49 | | 4,374 | 4,480 |
| Nakilat, Inc. 6.067% 12/31/33 (g) | | 1,839 | 2,064 |
| Nexen, Inc. 6.2% 7/30/19 | | 1,865 | 1,889 |
| Nine Energy Service, Inc. 8.75% 11/1/23 (g) | | 760 | 760 |
| Northern Oil & Gas, Inc. 9.5% 5/15/23 pay-in-kind | | 1,639 | 1,680 |
| Oasis Petroleum, Inc. 6.875% 3/15/22 | | 563 | 562 |
| Parsley Energy LLC/Parsley: | | | |
| 5.375% 1/15/25 (g) | | 2,595 | 2,601 |
| 5.625% 10/15/27 (g) | | 780 | 772 |
| 6.25% 6/1/24 (g) | | 4,225 | 4,331 |
| PBF Holding Co. LLC/PBF Finance Corp.: | | | |
| 7% 11/15/23 | | 1,475 | 1,508 |
| 7.25% 6/15/25 | | 1,820 | 1,866 |
| PBF Logistics LP/PBF Logistics Finance, Inc. 6.875% 5/15/23 | | 2,785 | 2,835 |
| Peabody Securities Finance Corp.: | | | |
| 6% 3/31/22 (g) | | 545 | 550 |
| 6.375% 3/31/25 (g) | | 680 | 669 |
| Petrobras Global Finance BV: | | | |
| 4.375% 5/20/23 | | 3,648 | 3,660 |
| 7.25% 3/17/44 | | 28,868 | 30,845 |
| Petroleos Mexicanos: | | | |
| 3.5% 1/30/23 | | 4,530 | 4,219 |
| 4.5% 1/23/26 | | 6,398 | 5,713 |
| 4.625% 9/21/23 | | 10,200 | 9,769 |
| 4.875% 1/24/22 | | 2,315 | 2,296 |
| 4.875% 1/18/24 | | 5,974 | 5,708 |
| 5.375% 3/13/22 | | 3,625 | 3,632 |
| 5.5% 1/21/21 | | 12,842 | 13,006 |
| 5.5% 6/27/44 | | 7,252 | 5,653 |
| 5.625% 1/23/46 | | 6,203 | 4,854 |
| 6% 3/5/20 | | 2,593 | 2,638 |
| 6.375% 1/23/45 | | 13,324 | 11,189 |
| 6.5% 3/13/27 | | 5,590 | 5,397 |
| 6.5% 6/2/41 | | 7,783 | 6,771 |
| 6.75% 9/21/47 | | 45,424 | 39,387 |
| 6.875% 8/4/26 | | 12,000 | 11,985 |
| 8% 5/3/19 | | 2,772 | 2,793 |
| Phillips 66 Co. 4.3% 4/1/22 | | 5,338 | 5,521 |
| Phillips 66 Partners LP 2.646% 2/15/20 | | 527 | 525 |
| Rose Rock Midstream LP/Rose Rock Finance Corp. 5.625% 7/15/22 | | 635 | 618 |
| Sanchez Energy Corp.: | | | |
| 6.125% 1/15/23 | | 4,680 | 708 |
| 7.25% 2/15/23 (g) | | 5,515 | 4,757 |
| SemGroup Corp. 7.25% 3/15/26 | | 2,140 | 2,070 |
| Shell International Finance BV 4.375% 5/11/45 | | 6,392 | 6,720 |
| SM Energy Co.: | | | |
| 5% 1/15/24 | | 1,585 | 1,492 |
| 5.625% 6/1/25 | | 1,670 | 1,561 |
| 6.625% 1/15/27 | | 1,145 | 1,091 |
| 6.75% 9/15/26 | | 805 | 771 |
| Southeast Supply Header LLC 4.25% 6/15/24 (g) | | 4,893 | 4,876 |
| Southwestern Energy Co.: | | | |
| 6.2% 1/23/25 (h) | | 3,470 | 3,434 |
| 7.5% 4/1/26 | | 1,470 | 1,529 |
| 7.75% 10/1/27 | | 1,090 | 1,132 |
| Sunoco Logistics Partner Operations LP 5.4% 10/1/47 | | 2,002 | 1,926 |
| Sunoco LP/Sunoco Finance Corp.: | | | |
| 4.875% 1/15/23 | | 1,630 | 1,650 |
| 5.5% 2/15/26 | | 1,385 | 1,376 |
| Targa Resources Partners LP/Targa Resources Partners Finance Corp.: | | | |
| 5.375% 2/1/27 | | 1,025 | 1,030 |
| 5.875% 4/15/26 (g) | | 1,095 | 1,139 |
| 6.5% 7/15/27 (g) | | 785 | 830 |
| 6.75% 3/15/24 | | 3,500 | 3,666 |
| 6.875% 1/15/29 (g) | | 1,390 | 1,479 |
| Teekay Corp. 8.5% 1/15/20 | | 5,705 | 5,674 |
| Teine Energy Ltd. 6.875% 9/30/22 (g) | | 2,994 | 3,009 |
| Tesoro Logistics LP/Tesoro Logistics Finance Corp. 6.375% 5/1/24 | | 1,185 | 1,241 |
| The Williams Companies, Inc.: | | | |
| 3.7% 1/15/23 | | 12,205 | 12,194 |
| 4.55% 6/24/24 | | 19,902 | 20,499 |
| Ultra Resources, Inc. 11% 7/12/24 pay-in-kind | | 1,671 | 1,078 |
| W&T Offshore, Inc. 9.75% 11/1/23 (g) | | 1,530 | 1,515 |
| Western Gas Partners LP: | | | |
| 4.65% 7/1/26 | | 1,642 | 1,630 |
| 4.75% 8/15/28 | | 1,458 | 1,439 |
| 5.375% 6/1/21 | | 16,313 | 16,806 |
| Whiting Petroleum Corp. 6.625% 1/15/26 | | 1,005 | 985 |
| Williams Partners LP: | | | |
| 3.6% 3/15/22 | | 5,146 | 5,173 |
| 3.9% 1/15/25 | | 1,767 | 1,770 |
| 4% 11/15/21 | | 2,349 | 2,387 |
| 4.3% 3/4/24 | | 4,038 | 4,130 |
| 4.5% 11/15/23 | | 2,564 | 2,646 |
| WPX Energy, Inc. 8.25% 8/1/23 | | 1,070 | 1,200 |
| | | | 620,283 |
| TOTAL ENERGY | | | 679,143 |
| FINANCIALS - 5.1% | | | |
| Banks - 2.3% | | | |
| Banco Nacional de Desenvolvimento Economico e Social: | | | |
| 4% 4/14/19 (g) | | 21,750 | 21,742 |
| 5.5% 7/12/20 (g) | | 16,673 | 17,236 |
| 5.75% 9/26/23 (g) | | 5,082 | 5,425 |
| 6.5% 6/10/19 (g) | | 1,763 | 1,772 |
| Bank of America Corp.: | | | |
| 3.004% 12/20/23 (h) | | 57,008 | 56,267 |
| 3.419% 12/20/28 (h) | | 8,042 | 7,759 |
| 3.5% 4/19/26 | | 7,374 | 7,299 |
| 3.705% 4/24/28 (h) | | 7,919 | 7,810 |
| 3.864% 7/23/24 (h) | | 37,687 | 38,298 |
| 3.95% 4/21/25 | | 5,678 | 5,674 |
| 4.2% 8/26/24 | | 9,221 | 9,398 |
| 4.25% 10/22/26 | | 5,465 | 5,490 |
| Barclays PLC: | | | |
| 2.75% 11/8/19 | | 4,598 | 4,580 |
| 4.375% 1/12/26 | | 8,817 | 8,745 |
| BB&T Corp. 3.95% 3/22/22 | | 1,495 | 1,520 |
| CIT Group, Inc.: | | | |
| 4.125% 3/9/21 | | 1,570 | 1,587 |
| 5.25% 3/7/25 | | 1,310 | 1,369 |
| Citigroup, Inc.: | | | |
| 2.4% 2/18/20 | | 4,295 | 4,273 |
| 2.7% 10/27/22 | | 32,987 | 32,392 |
| 3.142% 1/24/23 (h) | | 5,705 | 5,683 |
| 4.05% 7/30/22 | | 14,700 | 14,983 |
| 4.3% 11/20/26 | | 14,141 | 14,160 |
| 4.45% 9/29/27 | | 14,000 | 14,048 |
| 5.5% 9/13/25 | | 18,723 | 20,222 |
| Citizens Bank NA 2.55% 5/13/21 | | 2,268 | 2,239 |
| Citizens Financial Group, Inc. 4.15% 9/28/22 (g) | | 6,650 | 6,685 |
| Credit Suisse Group Funding Guernsey Ltd.: | | | |
| 2.75% 3/26/20 | | 6,421 | 6,394 |
| 3.75% 3/26/25 | | 6,420 | 6,344 |
| 3.8% 9/15/22 | | 9,940 | 9,993 |
| 3.8% 6/9/23 | | 12,454 | 12,453 |
| Credit Suisse New York Branch 5.4% 1/14/20 | | 1,200 | 1,223 |
| Discover Bank 7% 4/15/20 | | 3,075 | 3,193 |
| Fifth Third Bancorp 3.5% 3/15/22 | | 529 | 533 |
| HSBC Holdings PLC 4.25% 3/14/24 | | 2,900 | 2,937 |
| Huntington Bancshares, Inc. 7% 12/15/20 | | 2,561 | 2,724 |
| Huntington National Bank 2.2% 4/1/19 | | 2,700 | 2,699 |
| Intesa Sanpaolo SpA: | | | |
| 5.017% 6/26/24 (g) | | 5,678 | 5,261 |
| 5.71% 1/15/26 (g) | | 13,492 | 12,634 |
| JPMorgan Chase & Co.: | | | |
| 2.95% 10/1/26 | | 8,946 | 8,529 |
| 3.875% 9/10/24 | | 12,321 | 12,463 |
| 4.125% 12/15/26 | | 49,975 | 50,572 |
| 4.452% 12/5/29 (h) | | 25,000 | 26,165 |
| KeyCorp. 5.1% 3/24/21 | | 519 | 540 |
| Rabobank Nederland 4.375% 8/4/25 | | 9,821 | 9,935 |
| Regions Bank 6.45% 6/26/37 | | 10,147 | 12,061 |
| Regions Financial Corp. 3.2% 2/8/21 | | 4,117 | 4,122 |
| Royal Bank of Scotland Group PLC: | | | |
| 5.125% 5/28/24 | | 45,209 | 45,825 |
| 6% 12/19/23 | | 14,202 | 14,924 |
| 6.1% 6/10/23 | | 10,097 | 10,591 |
| 6.125% 12/15/22 | | 35,362 | 37,307 |
| Synchrony Bank 3% 6/15/22 | | 5,296 | 5,136 |
| UniCredit SpA 6.572% 1/14/22 (g) | | 8,231 | 8,438 |
| | | | 629,652 |
| Capital Markets - 1.3% | | | |
| Affiliated Managers Group, Inc.: | | | |
| 3.5% 8/1/25 | | 7,721 | 7,467 |
| 4.25% 2/15/24 | | 2,760 | 2,835 |
| Balboa Merger Sub, Inc. 11.375% 12/1/21 (g) | | 9,335 | 9,918 |
| CyrusOne LP/CyrusOne Finance Corp.: | | | |
| 5% 3/15/24 | | 1,110 | 1,129 |
| 5.375% 3/15/27 | | 920 | 936 |
| Deutsche Bank AG 4.5% 4/1/25 | | 14,192 | 13,211 |
| Deutsche Bank AG New York Branch: | | | |
| 3.15% 1/22/21 | | 6,215 | 6,071 |
| 3.3% 11/16/22 | | 13,520 | 12,760 |
| 5% 2/14/22 | | 13,461 | 13,544 |
| Goldman Sachs Group, Inc.: | | | |
| 2.876% 10/31/22 (h) | | 95,103 | 93,678 |
| 3.2% 2/23/23 | | 1,300 | 1,289 |
| 3.691% 6/5/28 (h) | | 19,000 | 18,398 |
| 3.75% 2/25/26 | | 15,000 | 14,814 |
| 6.75% 10/1/37 | | 2,771 | 3,296 |
| Lazard Group LLC 4.25% 11/14/20 | | 1,706 | 1,732 |
| Moody's Corp.: | | | |
| 3.25% 1/15/28 | | 2,803 | 2,677 |
| 4.875% 2/15/24 | | 2,632 | 2,784 |
| Morgan Stanley: | | | |
| 3.125% 1/23/23 | | 39,834 | 39,515 |
| 3.7% 10/23/24 | | 10,237 | 10,282 |
| 3.737% 4/24/24 (h) | | 30,000 | 30,261 |
| 4.431% 1/23/30 (h) | | 6,495 | 6,706 |
| 4.875% 11/1/22 | | 7,232 | 7,569 |
| 5% 11/24/25 | | 20,351 | 21,391 |
| 5.625% 9/23/19 | | 453 | 460 |
| MSCI, Inc. 5.75% 8/15/25 (g) | | 870 | 905 |
| Peachtree Corners Funding Trust 3.976% 2/15/25 (g) | | 7,000 | 6,951 |
| UBS AG Stamford Branch 2.375% 8/14/19 | | 10,750 | 10,735 |
| UBS Group Funding Ltd. 4.125% 9/24/25 (g) | | 7,279 | 7,401 |
| | | | 348,715 |
| Consumer Finance - 0.6% | | | |
| AerCap Ireland Capital Ltd./AerCap Global Aviation Trust: | | | |
| 3.5% 5/26/22 | | 2,254 | 2,223 |
| 4.125% 7/3/23 | | 5,160 | 5,126 |
| 4.45% 12/16/21 | | 4,345 | 4,402 |
| 4.875% 1/16/24 | | 2,590 | 2,650 |
| Ally Financial, Inc.: | | | |
| 5.75% 11/20/25 | | 4,715 | 4,998 |
| 8% 11/1/31 | | 9,130 | 11,139 |
| 8% 11/1/31 | | 17,338 | 21,412 |
| Capital One Financial Corp. 3.8% 1/31/28 | | 5,544 | 5,328 |
| Discover Financial Services: | | | |
| 3.85% 11/21/22 | | 1,983 | 1,995 |
| 3.95% 11/6/24 | | 15,000 | 14,846 |
| 4.5% 1/30/26 | | 6,952 | 6,984 |
| 5.2% 4/27/22 | | 2,146 | 2,245 |
| Ford Motor Credit Co. LLC: | | | |
| 5.085% 1/7/21 | | 4,339 | 4,420 |
| 5.596% 1/7/22 | | 8,976 | 9,196 |
| 5.875% 8/2/21 | | 10,438 | 10,786 |
| Navient Corp.: | | | |
| 5.875% 10/25/24 | | 5,675 | 5,462 |
| 6.75% 6/25/25 | | 1,840 | 1,801 |
| 6.75% 6/15/26 | | 5,455 | 5,237 |
| SLM Corp.: | | | |
| 4.875% 6/17/19 | | 2,727 | 2,727 |
| 5.5% 1/25/23 | | 190 | 188 |
| 6.125% 3/25/24 | | 6,670 | 6,503 |
| 8% 3/25/20 | | 5,930 | 6,193 |
| Springleaf Financial Corp. 7.125% 3/15/26 | | 4,515 | 4,538 |
| Synchrony Financial: | | | |
| 3% 8/15/19 | | 1,910 | 1,909 |
| 3.75% 8/15/21 | | 7,084 | 7,100 |
| 3.95% 12/1/27 | | 9,650 | 8,837 |
| 4.25% 8/15/24 | | 2,903 | 2,846 |
| | | | 161,091 |
| Diversified Financial Services - 0.4% | | | |
| Avolon Holdings Funding Ltd.: | | | |
| 5.125% 10/1/23 (g) | | 7,244 | 7,316 |
| 5.25% 5/15/24 (g)(k) | | 2,570 | 2,634 |
| 5.5% 1/15/23 (g) | | 2,905 | 2,978 |
| AXA Equitable Holdings, Inc. 3.9% 4/20/23 | | 1,279 | 1,289 |
| Brixmor Operating Partnership LP: | | | |
| 3.25% 9/15/23 | | 8,309 | 8,065 |
| 3.875% 8/15/22 | | 7,497 | 7,501 |
| 4.125% 6/15/26 | | 2,949 | 2,880 |
| Chobani LLC/Finance Corp., Inc. 7.5% 4/15/25 (g) | | 2,400 | 2,160 |
| Cigna Corp.: | | | |
| 4.125% 11/15/25 (g) | | 2,979 | 3,024 |
| 4.375% 10/15/28 (g) | | 7,689 | 7,794 |
| 4.8% 8/15/38 (g) | | 4,787 | 4,778 |
| 4.9% 12/15/48 (g) | | 4,783 | 4,762 |
| CRC Escrow Issuer LLC/CRC Finance LLC 5.25% 10/15/25 (g) | | 8,365 | 7,936 |
| Crown Americas LLC/Crown Americas Capital Corp. IV 4.75% 2/1/26 | | 4,315 | 4,336 |
| Eagle Intermediate Global Holding BV 7.5% 5/1/25 (g) | | 555 | 539 |
| Grinding Media, Inc./MC Grinding Media Canada, Inc. 7.375% 12/15/23 (g) | | 1,110 | 1,111 |
| Icahn Enterprises LP/Icahn Enterprises Finance Corp.: | | | |
| 5.875% 2/1/22 | | 2,725 | 2,756 |
| 6% 8/1/20 | | 2,230 | 2,252 |
| 6.375% 12/15/25 | | 4,115 | 4,233 |
| 6.75% 2/1/24 | | 1,565 | 1,637 |
| j2 Cloud Services LLC/j2 Global Communications, Inc. 6% 7/15/25 (g) | | 1,150 | 1,181 |
| Park Aerospace Holdings Ltd.: | | | |
| 4.5% 3/15/23 (g) | | 2,520 | 2,501 |
| 5.25% 8/15/22 (g)(k) | | 1,790 | 1,832 |
| 5.5% 2/15/24 (g) | | 11,360 | 11,743 |
| Radiate Holdco LLC/Radiate Financial Service Ltd.: | | | |
| 6.625% 2/15/25 (g) | | 3,365 | 3,163 |
| 6.875% 2/15/23 (g) | | 1,505 | 1,460 |
| Solera LLC/Solera Finance, Inc. 10.5% 3/1/24 (g) | | 5,165 | 5,598 |
| Starfruit Finco BV / Starfruit U.S. Holdco LLC 8% 10/1/26 (g) | | 945 | 943 |
| Transocean Poseidon Ltd. 6.875% 2/1/27 (g) | | 2,175 | 2,235 |
| Voya Financial, Inc. 3.125% 7/15/24 | | 3,320 | 3,213 |
| | | | 113,850 |
| Insurance - 0.5% | | | |
| Acrisure LLC / Acrisure Finance, Inc.: | | | |
| 7% 11/15/25 (g) | | 2,320 | 2,049 |
| 8.125% 2/15/24 (g) | | 1,095 | 1,122 |
| AIA Group Ltd. 2.25% 3/11/19 (g) | | 1,203 | 1,203 |
| Alliant Holdings Co.-Issuer, Inc./Wayne Merger Sub LLC 8.25% 8/1/23 (g) | | 2,360 | 2,438 |
| American International Group, Inc.: | | | |
| 3.3% 3/1/21 | | 3,455 | 3,460 |
| 3.75% 7/10/25 | | 11,144 | 10,954 |
| 4.875% 6/1/22 | | 10,692 | 11,204 |
| AmWINS Group, Inc. 7.75% 7/1/26 (g) | | 2,090 | 2,142 |
| Aon Corp. 5% 9/30/20 | | 107 | 110 |
| Centene Escrow Corp. 5.375% 6/1/26 (g) | | 3,715 | 3,854 |
| HUB International Ltd. 7% 5/1/26 (g) | | 1,395 | 1,367 |
| Liberty Mutual Group, Inc.: | | | |
| 4.25% 6/15/23 (g) | | 586 | 596 |
| 4.569% 2/1/29 (g) | | 8,132 | 8,230 |
| Marsh & McLennan Companies, Inc.: | | | |
| 4.375% 3/15/29 | | 5,883 | 6,063 |
| 4.75% 3/15/39 | | 2,700 | 2,796 |
| 4.8% 7/15/21 | | 3,441 | 3,559 |
| 4.9% 3/15/49 | | 5,372 | 5,651 |
| Massachusetts Mutual Life Insurance Co. 4.5% 4/15/65 (g) | | 7,265 | 6,834 |
| Northwestern Mutual Life Insurance Co. 6.063% 3/30/40 (g) | | 3,585 | 4,426 |
| Pacific LifeCorp 5.125% 1/30/43 (g) | | 6,960 | 7,119 |
| Prudential Financial, Inc.: | | | |
| 4.5% 11/16/21 | | 1,461 | 1,514 |
| 7.375% 6/15/19 | | 1,880 | 1,904 |
| Teachers Insurance & Annuity Association of America 4.9% 9/15/44 (g) | | 6,853 | 7,332 |
| TIAA Asset Management Finance LLC 4.125% 11/1/24 (g) | | 2,275 | 2,349 |
| Unum Group: | | | |
| 3.875% 11/5/25 | | 6,934 | 6,743 |
| 5.625% 9/15/20 | | 2,879 | 2,974 |
| 5.75% 8/15/42 | | 10,079 | 10,505 |
| USIS Merger Sub, Inc. 6.875% 5/1/25 (g) | | 2,030 | 1,974 |
| | | | 120,472 |
| TOTAL FINANCIALS | | | 1,373,780 |
| HEALTH CARE - 1.1% | | | |
| Health Care Equipment & Supplies - 0.0% | | | |
| Hologic, Inc.: | | | |
| 4.375% 10/15/25 (g) | | 1,505 | 1,479 |
| 4.625% 2/1/28 (g) | | 505 | 489 |
| | | | 1,968 |
| Health Care Providers & Services - 0.8% | | | |
| Cigna Corp. 3.75% 7/15/23 (g) | | 6,161 | 6,235 |
| Community Health Systems, Inc.: | | | |
| 5.125% 8/1/21 | | 2,120 | 2,080 |
| 6.25% 3/31/23 | | 13,660 | 13,148 |
| 8% 3/15/26 (g) | | 8,440 | 8,329 |
| 8.125% 6/30/24 (g) | | 965 | 803 |
| 8.625% 1/15/24 (g) | | 3,670 | 3,771 |
| CVS Health Corp.: | | | |
| 3.7% 3/9/23 | | 3,400 | 3,421 |
| 3.875% 7/20/25 | | 5,311 | 5,300 |
| 4.1% 3/25/25 | | 14,035 | 14,227 |
| 4.3% 3/25/28 | | 16,299 | 16,310 |
| 4.78% 3/25/38 | | 7,256 | 7,058 |
| 5.05% 3/25/48 | | 10,668 | 10,571 |
| DaVita HealthCare Partners, Inc.: | | | |
| 5% 5/1/25 | | 3,525 | 3,401 |
| 5.125% 7/15/24 | | 5,800 | 5,742 |
| Elanco Animal Health, Inc.: | | | |
| 3.912% 8/27/21 (g) | | 1,267 | 1,275 |
| 4.272% 8/28/23 (g) | | 4,000 | 4,059 |
| 4.9% 8/28/28 (g) | | 1,685 | 1,746 |
| Encompass Health Corp.: | | | |
| 5.75% 11/1/24 | | 4,285 | 4,329 |
| 5.75% 9/15/25 | | 3,965 | 4,005 |
| HCA Holdings, Inc.: | | | |
| 4.25% 10/15/19 | | 3,850 | 3,874 |
| 4.75% 5/1/23 | | 305 | 315 |
| 5.375% 2/1/25 | | 6,835 | 7,089 |
| 5.375% 9/1/26 | | 1,560 | 1,598 |
| 5.625% 9/1/28 | | 2,740 | 2,825 |
| 5.875% 3/15/22 | | 365 | 388 |
| 5.875% 2/15/26 | | 5,470 | 5,778 |
| 5.875% 2/1/29 | | 835 | 876 |
| 6.5% 2/15/20 | | 13,898 | 14,314 |
| Medco Health Solutions, Inc. 4.125% 9/15/20 | | 3,728 | 3,782 |
| Polaris Intermediate Corp. 8.5% 12/1/22 pay-in-kind (g)(h) | | 2,925 | 2,888 |
| Sabra Health Care LP/Sabra Capital Corp. 5.5% 2/1/21 | | 625 | 634 |
| Tenet Healthcare Corp.: | | | |
| 4.625% 7/15/24 | | 5,240 | 5,207 |
| 5.125% 5/1/25 | | 5,585 | 5,536 |
| 6.25% 2/1/27 (g) | | 3,770 | 3,881 |
| 6.75% 6/15/23 | | 13,530 | 13,868 |
| 8.125% 4/1/22 | | 5,010 | 5,348 |
| Toledo Hospital: | | | |
| 5.325% 11/15/28 | | 2,704 | 2,778 |
| 6.015% 11/15/48 | | 12,979 | 13,732 |
| Vizient, Inc. 10.375% 3/1/24 (g) | | 2,055 | 2,225 |
| Wellcare Health Plans, Inc.: | | | |
| 5.25% 4/1/25 | | 1,405 | 1,434 |
| 5.375% 8/15/26 (g) | | 945 | 972 |
| | | | 215,152 |
| Health Care Technology - 0.0% | | | |
| IMS Health, Inc. 5% 10/15/26 (g) | | 1,070 | 1,089 |
| Life Sciences Tools & Services - 0.0% | | | |
| Charles River Laboratories International, Inc. 5.5% 4/1/26 (g) | | 595 | 619 |
| Pharmaceuticals - 0.3% | | | |
| Actavis Funding SCS 3.45% 3/15/22 | | 12,768 | 12,712 |
| Bayer U.S. Finance II LLC 4.25% 12/15/25 (g) | | 6,406 | 6,407 |
| Catalent Pharma Solutions 4.875% 1/15/26 (g) | | 530 | 525 |
| Mylan NV: | | | |
| 2.5% 6/7/19 | | 3,008 | 3,004 |
| 3.15% 6/15/21 | | 7,274 | 7,191 |
| 3.95% 6/15/26 | | 3,535 | 3,297 |
| NVA Holdings, Inc. 6.875% 4/1/26 (g) | | 775 | 748 |
| Perrigo Finance PLC 3.5% 12/15/21 | | 569 | 547 |
| Teva Pharmaceutical Finance Netherlands III BV: | | | |
| 2.2% 7/21/21 | | 5,133 | 4,877 |
| 2.8% 7/21/23 | | 2,079 | 1,881 |
| Valeant Pharmaceuticals International, Inc.: | | | |
| 5.5% 3/1/23 (g) | | 3,325 | 3,308 |
| 5.5% 11/1/25 (g) | | 2,295 | 2,315 |
| 5.75% 8/15/27 (g)(k) | | 395 | 398 |
| 5.875% 5/15/23 (g) | | 7,005 | 6,970 |
| 6.125% 4/15/25 (g) | | 7,740 | 7,450 |
| 7% 3/15/24 (g) | | 2,965 | 3,124 |
| 8.5% 1/31/27 (g)(k) | | 1,190 | 1,232 |
| 9.25% 4/1/26 (g) | | 3,415 | 3,680 |
| | | | 69,666 |
| TOTAL HEALTH CARE | | | 288,494 |
| INDUSTRIALS - 0.4% | | | |
| Aerospace & Defense - 0.1% | | | |
| BAE Systems Holdings, Inc. 6.375% 6/1/19 (g) | | 3,650 | 3,679 |
| BBA U.S. Holdings, Inc. 5.375% 5/1/26 (g) | | 520 | 530 |
| Bombardier, Inc.: | | | |
| 7.5% 12/1/24 (g) | | 1,530 | 1,561 |
| 7.875% 4/15/27 (g) | | 4,255 | 4,223 |
| BWX Technologies, Inc. 5.375% 7/15/26 (g) | | 1,010 | 1,030 |
| DAE Funding LLC: | | | |
| 4.5% 8/1/22 (g) | | 1,210 | 1,198 |
| 5% 8/1/24 (g) | | 1,665 | 1,650 |
| TransDigm UK Holdings PLC 6.875% 5/15/26 (g) | | 1,460 | 1,424 |
| TransDigm, Inc.: | | | |
| 6.25% 3/15/26 (g) | | 1,510 | 1,548 |
| 7.5% 3/15/27 (g) | | 5,445 | 5,472 |
| | | | 22,315 |
| Airlines - 0.0% | | | |
| Continental Airlines, Inc. pass-thru trust certificates: | | | |
| 8.388% 11/1/20 | | 0 | 0 |
| 9.798% 4/1/21 | | 720 | 752 |
| | | | 752 |
| Building Products - 0.0% | | | |
| HD Supply, Inc. 5.375% 10/15/26 (g) | | 2,355 | 2,390 |
| HMAN Finance Sub Corp. 6.375% 7/15/22 (g) | | 510 | 439 |
| | | | 2,829 |
| Commercial Services & Supplies - 0.1% | | | |
| APX Group, Inc. 7.625% 9/1/23 | | 3,500 | 3,084 |
| Brand Energy & Infrastructure Services, Inc. 8.5% 7/15/25 (g) | | 3,740 | 3,375 |
| CD&R Waterworks Merger Sub LLC 6.125% 8/15/25 (g) | | 655 | 630 |
| Covanta Holding Corp.: | | | |
| 5.875% 3/1/24 | | 2,865 | 2,926 |
| 6% 1/1/27 | | 2,705 | 2,712 |
| LBC Tank Terminals Holding Netherlands BV 6.875% 5/15/23 (g) | | 2,710 | 2,564 |
| Ritchie Brothers Auctioneers, Inc. 5.375% 1/15/25 (g) | | 545 | 555 |
| Tervita Escrow Corp. 7.625% 12/1/21 (g) | | 650 | 648 |
| | | | 16,494 |
| Electrical Equipment - 0.0% | | | |
| Vertiv Group Corp. 9.25% 10/15/24 (g) | | 910 | 911 |
| Machinery - 0.0% | | | |
| Apergy Corp. 6.375% 5/1/26 | | 515 | 514 |
| Ingersoll-Rand Luxembourg Finance SA 2.625% 5/1/20 | | 1,481 | 1,469 |
| U.S.A. Compression Partners LP 6.875% 4/1/26 (k)(l) | | 520 | 529 |
| | | | 2,512 |
| Marine - 0.0% | | | |
| Navios Maritime Acquisition Corp./Navios Acquisition Finance U.S., Inc. 8.125% 11/15/21 (g) | | 3,825 | 2,773 |
| Navios Maritime Holdings, Inc.: | | | |
| 7.375% 1/15/22 (g) | | 4,775 | 2,137 |
| 11.25% 8/15/22 (g) | | 2,475 | 1,572 |
| Navios South American Logistics, Inc./Navios Logistics Finance U.S., Inc. 7.25% 5/1/22 (g) | | 1,380 | 1,242 |
| | | | 7,724 |
| Professional Services - 0.0% | | | |
| Thomson Reuters Corp. 3.85% 9/29/24 | | 1,327 | 1,299 |
| Road & Rail - 0.0% | | | |
| Jurassic Holdings III, Inc. 6.875% 2/15/21 (Reg. S) (g) | | 1,245 | 1,162 |
| Trading Companies & Distributors - 0.2% | | | |
| Air Lease Corp.: | | | |
| 2.125% 1/15/20 | | 10,000 | 9,916 |
| 3% 9/15/23 | | 1,146 | 1,100 |
| 3.375% 6/1/21 | | 3,689 | 3,663 |
| 3.75% 2/1/22 | | 6,505 | 6,516 |
| 3.875% 4/1/21 | | 4,155 | 4,186 |
| 4.25% 2/1/24 | | 8,439 | 8,487 |
| 4.25% 9/15/24 | | 4,566 | 4,563 |
| 4.75% 3/1/20 | | 4,617 | 4,682 |
| FLY Leasing Ltd. 5.25% 10/15/24 | | 1,260 | 1,197 |
| | | | 44,310 |
| TOTAL INDUSTRIALS | | | 100,308 |
| INFORMATION TECHNOLOGY - 0.3% | | | |
| Communications Equipment - 0.1% | | | |
| CommScope Finance LLC 6% 3/1/26 (g) | | 1,650 | 1,689 |
| Gray Escrow, Inc. 7% 5/15/27 (g) | | 4,135 | 4,373 |
| Hughes Satellite Systems Corp. 6.5% 6/15/19 | | 5,408 | 5,442 |
| | | | 11,504 |
| Electronic Equipment & Components - 0.1% | | | |
| Diamond 1 Finance Corp./Diamond 2 Finance Corp.: | | | |
| 3.48% 6/1/19 (g) | | 13,573 | 13,568 |
| 5.45% 6/15/23 (g) | | 6,600 | 6,935 |
| 6.02% 6/15/26 (g) | | 2,285 | 2,423 |
| Sanmina Corp. 4.375% 6/1/19 (g) | | 1,295 | 1,295 |
| TTM Technologies, Inc. 5.625% 10/1/25 (g) | | 540 | 512 |
| | | | 24,733 |
| IT Services - 0.0% | | | |
| Banff Merger Sub, Inc. 9.75% 9/1/26 (g) | | 5,470 | 5,299 |
| Semiconductors & Semiconductor Equipment - 0.0% | | | |
| Entegris, Inc. 4.625% 2/10/26 (g) | | 1,735 | 1,705 |
| Qorvo, Inc. 5.5% 7/15/26 (g) | | 6,700 | 6,834 |
| Sensata Technologies UK Financing Co. PLC 6.25% 2/15/26 (g) | | 2,675 | 2,822 |
| | | | 11,361 |
| Software - 0.1% | | | |
| CDK Global, Inc. 5.875% 6/15/26 | | 535 | 552 |
| Ensemble S Merger Sub, Inc. 9% 9/30/23 (g) | | 4,530 | 4,677 |
| Open Text Corp. 5.875% 6/1/26 (g) | | 3,700 | 3,893 |
| Uber Technologies, Inc. 8% 11/1/26 (g) | | 4,755 | 4,969 |
| Veritas U.S., Inc./Veritas Bermuda Ltd.: | | | |
| 7.5% 2/1/23 (g) | | 795 | 755 |
| 10.5% 2/1/24 (g) | | 6,565 | 5,525 |
| | | | 20,371 |
| TOTAL INFORMATION TECHNOLOGY | | | 73,268 |
| MATERIALS - 0.3% | | | |
| Chemicals - 0.1% | | | |
| Element Solutions, Inc. 5.875% 12/1/25 (g) | | 1,610 | 1,629 |
| LSB Industries, Inc. 9.625% 5/1/23 (g) | | 835 | 873 |
| NOVA Chemicals Corp.: | | | |
| 4.875% 6/1/24 (g) | | 1,835 | 1,777 |
| 5.25% 6/1/27 (g) | | 1,860 | 1,748 |
| OCI NV 6.625% 4/15/23 (g) | | 6,265 | 6,484 |
| Olin Corp. 5% 2/1/30 | | 1,215 | 1,180 |
| The Chemours Co. LLC: | | | |
| 5.375% 5/15/27 | | 715 | 697 |
| 7% 5/15/25 | | 825 | 860 |
| The Dow Chemical Co. 4.55% 11/30/25 (g) | | 13,459 | 13,907 |
| TPC Group, Inc. 8.75% 12/15/20 (g) | | 7,895 | 7,737 |
| | | | 36,892 |
| Containers & Packaging - 0.1% | | | |
| Ardagh Packaging Finance PLC/Ardagh MP Holdings U.S.A., Inc.: | | | |
| 6% 2/15/25 (g) | | 3,030 | 2,992 |
| 7.25% 5/15/24 (g) | | 3,410 | 3,541 |
| Berry Global, Inc. 4.5% 2/15/26 (g) | | 3,580 | 3,388 |
| Crown Americas LLC/Crown Americas Capital Corp. V 4.25% 9/30/26 | | 970 | 934 |
| Flex Acquisition Co., Inc. 6.875% 1/15/25 (g) | | 810 | 765 |
| Plastipak Holdings, Inc. 6.25% 10/15/25 (g) | | 465 | 425 |
| | | | 12,045 |
| Metals & Mining - 0.1% | | | |
| Alcoa Nederland Holding BV 6.125% 5/15/28 (g) | | 425 | 435 |
| BHP Billiton Financial (U.S.A.) Ltd.: | | | |
| 6.25% 10/19/75 (g)(h) | | 2,727 | 2,838 |
| 6.75% 10/19/75 (g)(h) | | 6,773 | 7,430 |
| Big River Steel LLC/BRS Finance Corp. 7.25% 9/1/25 (g) | | 1,270 | 1,316 |
| Constellium NV 5.875% 2/15/26 (g) | | 650 | 632 |
| Corporacion Nacional del Cobre de Chile (Codelco): | | | |
| 3.625% 8/1/27 (g) | | 1,966 | 1,940 |
| 4.5% 8/1/47 (g) | | 1,995 | 1,999 |
| First Quantum Minerals Ltd.: | | | |
| 6.5% 3/1/24 (g) | | 1,605 | 1,517 |
| 6.875% 3/1/26 (g) | | 1,605 | 1,501 |
| 7.25% 4/1/23 (g) | | 1,705 | 1,675 |
| 7.5% 4/1/25 (g) | | 3,525 | 3,402 |
| FMG Resources (August 2006) Pty Ltd.: | | | |
| 4.75% 5/15/22 (g) | | 1,140 | 1,140 |
| 5.125% 3/15/23 (g) | | 1,530 | 1,526 |
| Freeport-McMoRan, Inc. 6.875% 2/15/23 | | 6,818 | 7,202 |
| Joseph T Ryerson & Son, Inc. 11% 5/15/22 (g) | | 1,085 | 1,138 |
| Murray Energy Corp. 11.25% 4/15/21 (g) | | 305 | 159 |
| Novelis Corp. 5.875% 9/30/26 (g) | | 2,150 | 2,096 |
| | | | 37,946 |
| TOTAL MATERIALS | | | 86,883 |
| REAL ESTATE - 1.1% | | | |
| Equity Real Estate Investment Trusts (REITs) - 0.7% | | | |
| Alexandria Real Estate Equities, Inc.: | | | |
| 2.75% 1/15/20 | | 1,148 | 1,143 |
| 4.6% 4/1/22 | | 2,000 | 2,064 |
| American Campus Communities Operating Partnership LP 3.75% 4/15/23 | | 1,587 | 1,584 |
| American Tower Corp. 2.8% 6/1/20 | | 6,000 | 5,976 |
| AvalonBay Communities, Inc. 3.625% 10/1/20 | | 2,452 | 2,475 |
| Boston Properties, Inc. 4.5% 12/1/28 | | 5,097 | 5,285 |
| Camden Property Trust 2.95% 12/15/22 | | 2,154 | 2,130 |
| CommonWealth REIT 5.875% 9/15/20 | | 991 | 1,013 |
| Corporate Office Properties LP: | | | |
| 3.6% 5/15/23 | | 5,166 | 5,049 |
| 3.7% 6/15/21 | | 3,614 | 3,585 |
| 5% 7/1/25 | | 4,043 | 4,144 |
| 5.25% 2/15/24 | | 3,576 | 3,721 |
| CTR Partnership LP/CareTrust Capital Corp. 5.25% 6/1/25 | | 2,585 | 2,598 |
| DDR Corp.: | | | |
| 3.625% 2/1/25 | | 3,112 | 3,002 |
| 4.25% 2/1/26 | | 2,564 | 2,534 |
| 4.625% 7/15/22 | | 1,216 | 1,244 |
| Duke Realty LP: | | | |
| 3.25% 6/30/26 | | 1,061 | 1,021 |
| 3.625% 4/15/23 | | 2,844 | 2,860 |
| 3.75% 12/1/24 | | 2,012 | 2,020 |
| 3.875% 10/15/22 | | 4,799 | 4,886 |
| 4.375% 6/15/22 | | 3,202 | 3,310 |
| Equinix, Inc. 5.375% 5/15/27 | | 1,410 | 1,459 |
| Equity One, Inc. 3.75% 11/15/22 | | 7,300 | 7,338 |
| HCP, Inc.: | | | |
| 3.4% 2/1/25 | | 8,000 | 7,773 |
| 3.875% 8/15/24 | | 11,000 | 11,037 |
| Health Care REIT, Inc.: | | | |
| 4% 6/1/25 | | 4,568 | 4,608 |
| 4.125% 4/1/19 | | 11,300 | 11,304 |
| Hudson Pacific Properties LP 4.65% 4/1/29 | | 2,056 | 2,025 |
| Lexington Corporate Properties Trust 4.4% 6/15/24 | | 1,905 | 1,901 |
| MPT Operating Partnership LP/MPT Finance Corp.: | | | |
| 5% 10/15/27 | | 5,480 | 5,439 |
| 5.25% 8/1/26 | | 2,206 | 2,234 |
| 6.375% 3/1/24 | | 1,545 | 1,618 |
| Omega Healthcare Investors, Inc.: | | | |
| 4.375% 8/1/23 | | 8,734 | 8,785 |
| 4.5% 1/15/25 | | 3,358 | 3,342 |
| 4.5% 4/1/27 | | 21,587 | 21,172 |
| 4.75% 1/15/28 | | 7,767 | 7,766 |
| 4.95% 4/1/24 | | 1,785 | 1,818 |
| 5.25% 1/15/26 | | 7,807 | 8,028 |
| Retail Opportunity Investments Partnership LP: | | | |
| 4% 12/15/24 | | 1,250 | 1,191 |
| 5% 12/15/23 | | 980 | 985 |
| Store Capital Corp. 4.625% 3/15/29 | | 2,656 | 2,622 |
| Ventas Realty LP: | | | |
| 3.125% 6/15/23 | | 1,874 | 1,847 |
| 3.5% 2/1/25 | | 2,295 | 2,262 |
| 4% 3/1/28 | | 2,728 | 2,689 |
| 4.125% 1/15/26 | | 2,088 | 2,096 |
| 4.375% 2/1/45 | | 1,098 | 1,017 |
| WP Carey, Inc. 4% 2/1/25 | | 7,547 | 7,444 |
| | | | 191,444 |
| Real Estate Management & Development - 0.4% | | | |
| Brandywine Operating Partnership LP: | | | |
| 3.95% 2/15/23 | | 7,907 | 7,941 |
| 3.95% 11/15/27 | | 5,258 | 5,062 |
| 4.1% 10/1/24 | | 5,444 | 5,424 |
| 4.55% 10/1/29 | | 5,773 | 5,716 |
| Digital Realty Trust LP: | | | |
| 3.4% 10/1/20 | | 6,817 | 6,837 |
| 3.95% 7/1/22 | | 4,464 | 4,520 |
| 4.75% 10/1/25 | | 4,899 | 5,096 |
| 5.25% 3/15/21 | | 2,876 | 2,967 |
| Howard Hughes Corp. 5.375% 3/15/25 (g) | | 3,040 | 3,002 |
| Kennedy-Wilson, Inc. 5.875% 4/1/24 | | 795 | 782 |
| Liberty Property LP: | | | |
| 3.25% 10/1/26 | | 2,723 | 2,582 |
| 3.375% 6/15/23 | | 2,951 | 2,919 |
| 4.125% 6/15/22 | | 2,746 | 2,807 |
| 4.75% 10/1/20 | | 6,595 | 6,725 |
| Mack-Cali Realty LP: | | | |
| 3.15% 5/15/23 | | 6,708 | 5,695 |
| 4.5% 4/18/22 | | 1,689 | 1,603 |
| Mattamy Group Corp. 6.875% 12/15/23 (g) | | 660 | 657 |
| Mid-America Apartments LP 4% 11/15/25 | | 1,682 | 1,702 |
| Post Apartment Homes LP 3.375% 12/1/22 | | 1,196 | 1,190 |
| Tanger Properties LP: | | | |
| 3.125% 9/1/26 | | 4,273 | 3,877 |
| 3.75% 12/1/24 | | 3,781 | 3,685 |
| 3.875% 12/1/23 | | 2,341 | 2,322 |
| 3.875% 7/15/27 | | 9,215 | 8,681 |
| | | | 91,792 |
| TOTAL REAL ESTATE | | | 283,236 |
| UTILITIES - 0.8% | | | |
| Electric Utilities - 0.4% | | | |
| Clearway Energy Operating LLC 5.75% 10/15/25 (g) | | 1,695 | 1,665 |
| Cleco Corporate Holdings LLC 3.743% 5/1/26 | | 2,557 | 2,437 |
| Drax Finco PLC 6.625% 11/1/25 (g) | | 1,335 | 1,357 |
| Duquesne Light Holdings, Inc.: | | | |
| 5.9% 12/1/21 (g) | | 3,934 | 4,145 |
| 6.4% 9/15/20 (g) | | 10,769 | 11,214 |
| FirstEnergy Corp.: | | | |
| 4.25% 3/15/23 | | 23,348 | 23,912 |
| 7.375% 11/15/31 | | 16,161 | 20,826 |
| InterGen NV 7% 6/30/23 (g) | | 14,505 | 13,055 |
| IPALCO Enterprises, Inc.: | | | |
| 3.45% 7/15/20 | | 10,457 | 10,429 |
| 3.7% 9/1/24 | | 2,490 | 2,447 |
| LG&E and KU Energy LLC 3.75% 11/15/20 | | 745 | 750 |
| NSG Holdings II LLC/NSG Holdings, Inc. 7.75% 12/15/25 (g) | | 3,827 | 4,095 |
| NV Energy, Inc. 6.25% 11/15/20 | | 1,666 | 1,752 |
| TECO Finance, Inc. 5.15% 3/15/20 | | 2,029 | 2,070 |
| Vistra Operations Co. LLC: | | | |
| 5.5% 9/1/26 (g) | | 2,025 | 2,101 |
| 5.625% 2/15/27 (g) | | 3,580 | 3,687 |
| | | | 105,942 |
| Gas Utilities - 0.0% | | | |
| Southern Natural Gas Co./Southern Natural Issuing Corp. 4.4% 6/15/21 | | 1,753 | 1,795 |
| Independent Power and Renewable Electricity Producers - 0.3% | | | |
| Calpine Corp.: | | | |
| 5.375% 1/15/23 | | 1,475 | 1,460 |
| 6% 1/15/22 (g) | | 1,115 | 1,130 |
| Dolphin Subsidiary II, Inc. 7.25% 10/15/21 | | 17,756 | 19,043 |
| Dynegy, Inc.: | | | |
| 5.875% 6/1/23 | | 1,745 | 1,793 |
| 7.625% 11/1/24 | | 7,785 | 8,272 |
| Emera U.S. Finance LP: | | | |
| 2.15% 6/15/19 | | 1,742 | 1,736 |
| 2.7% 6/15/21 | | 1,715 | 1,683 |
| 3.55% 6/15/26 | | 2,743 | 2,631 |
| NextEra Energy Partners LP: | | | |
| 4.25% 9/15/24 (g) | | 1,070 | 1,051 |
| 4.5% 9/15/27 (g) | | 745 | 708 |
| NRG Energy, Inc.: | | | |
| 5.75% 1/15/28 | | 7,555 | 7,753 |
| 6.625% 1/15/27 | | 4,390 | 4,675 |
| Pattern Energy Group, Inc. 5.875% 2/1/24 (g) | | 855 | 867 |
| Talen Energy Supply LLC: | | | |
| 6.5% 6/1/25 | | 3,405 | 3,034 |
| 10.5% 1/15/26 (g) | | 5,700 | 5,900 |
| TerraForm Global, Inc. 6.125% 3/1/26 (g) | | 2,450 | 2,358 |
| TerraForm Power Operating LLC: | | | |
| 4.25% 1/31/23 (g) | | 805 | 798 |
| 5% 1/31/28 (g) | | 805 | 765 |
| 6.625% 6/15/25 (g)(h) | | 1,200 | 1,260 |
| The AES Corp.: | | | |
| 4% 3/15/21 | | 3,125 | 3,124 |
| 4.5% 3/15/23 | | 2,065 | 2,080 |
| 5.125% 9/1/27 | | 1,280 | 1,315 |
| | | | 73,436 |
| Multi-Utilities - 0.1% | | | |
| Dominion Resources, Inc.: | | | |
| 3 month U.S. LIBOR + 2.300% 5.103% 9/30/66 (h)(j) | | 19,347 | 17,799 |
| 3 month U.S. LIBOR + 2.825% 5.628% 6/30/66 (h)(j) | | 2,474 | 2,350 |
| Puget Energy, Inc. 6% 9/1/21 | | 691 | 729 |
| Sempra Energy 6% 10/15/39 | | 5,386 | 6,066 |
| Wind Tre SpA 5% 1/20/26 (g) | | 2,690 | 2,319 |
| Wisconsin Energy Corp. 3 month U.S. LIBOR + 2.113% 4.7963% 5/15/67 (h)(j) | | 3,876 | 3,409 |
| | | | 32,672 |
| TOTAL UTILITIES | | | 213,845 |
|
| TOTAL NONCONVERTIBLE BONDS | | | 3,879,308 |
|
| TOTAL CORPORATE BONDS | | | |
| (Cost $3,864,808) | | | 3,883,379 |
|
| U.S. Treasury Obligations - 9.5% | | | |
| U.S. Treasury Bills, yield at date of purchase 2.35% 3/7/19 (m) | | 16,700 | 16,694 |
| U.S. Treasury Bonds 3% 2/15/49 (b) | | 345,515 | 339,765 |
| U.S. Treasury Notes: | | | |
| 1.25% 10/31/21 | | $282,669 | $273,526 |
| 1.625% 5/15/26 | | 218,148 | 203,747 |
| 1.75% 6/30/22 | | 849,611 | 829,400 |
| 1.875% 7/31/22 | | 207,750 | 203,465 |
| 2% 8/15/25 | | 167,514 | 161,461 |
| 2.125% 11/30/24 | | 12,481 | 12,180 |
| 2.25% 1/31/24 | | 59,805 | 59,013 |
| 2.25% 12/31/24 | | 16,866 | 16,564 |
| 2.25% 2/15/27 | | 67,980 | 65,975 |
| 2.25% 8/15/27 | | 243,505 | 235,544 |
| 2.625% 12/31/23 | | 37,800 | 37,957 |
| 3.125% 11/15/28 | | 96,100 | 99,381 |
| TOTAL U.S. TREASURY OBLIGATIONS | | | |
| (Cost $2,586,938) | | | 2,554,672 |
|
| Asset-Backed Securities - 0.2% | | | |
| AASET Trust Series 2018-1A Class A, 3.844% 1/16/38 (g) | | $5,368 | $5,340 |
| Blackbird Capital Aircraft Series 2016-1A: | | | |
| Class A, 4.213% 12/16/41 (g) | | 11,721 | 11,836 |
| Class AA, 2.487% 12/16/41 (g) | | 2,520 | 2,450 |
| Castlelake Aircraft Structured Trust Series 2018-1 Class A, 4.125% 6/15/43 (g) | | 8,517 | 8,506 |
| Countrywide Home Loans, Inc. Series 2004-7 Class AF5, 4.7734% 1/25/35 | | 176 | 177 |
| DB Master Finance LLC Series 2017-1A: | | | |
| Class A2I, 3.629% 11/20/47 (g) | | 4,017 | 3,954 |
| Class A2II, 4.03% 11/20/47 (g) | | 6,767 | 6,656 |
| First Franklin Mortgage Loan Trust Series 2004-FF2 Class M3, 1 month U.S. LIBOR + 0.825% 3.3149% 3/25/34 (h)(j) | | 2 | 2 |
| GE Business Loan Trust Series 2006-2A: | | | |
| Class A, 1 month U.S. LIBOR + 0.180% 2.6688% 11/15/34 (g)(h)(j) | | 168 | 165 |
| Class B, 1 month U.S. LIBOR + 0.280% 2.7688% 11/15/34 (g)(h)(j) | | 61 | 60 |
| Class C, 1 month U.S. LIBOR + 0.380% 2.8688% 11/15/34 (g)(h)(j) | | 101 | 96 |
| Class D, 1 month U.S. LIBOR + 0.750% 3.2388% 11/15/34 (g)(h)(j) | | 38 | 36 |
| Horizon Aircraft Finance I Ltd. Series 2018-1 Class A, 4.458% 12/15/38 (g) | | 3,905 | 3,961 |
| Keycorp Student Loan Trust Series 2006-A Class 2C, 3 month U.S. LIBOR + 1.150% 3.9716% 3/27/42 (h)(j) | | 2,016 | 1,638 |
| Magnetite CLO Ltd. Series 2019-21A Class A, 3 month U.S. LIBOR + 1.280% 0% 4/20/30 (g)(h)(j)(k) | | 8,375 | 8,375 |
| New Century Home Equity Loan Trust Series 2005-4 Class M2, 1 month U.S. LIBOR + 0.510% 2.9999% 9/25/35 (h)(j) | | 736 | 735 |
| Park Place Securities, Inc. Series 2005-WCH1 Class M4, 1 month U.S. LIBOR + 1.245% 3.7349% 1/25/36 (h)(j) | | 1,120 | 1,112 |
| Terwin Mortgage Trust Series 2003-4HE Class A1, 1 month U.S. LIBOR + 0.860% 3.3499% 9/25/34 (h)(j) | | 19 | 18 |
| Thunderbolt Aircraft Lease Ltd. Series 2018-A Class A, 4.147% 9/15/38 (g) | | 8,605 | 8,657 |
| Trapeza CDO XII Ltd./Trapeza CDO XII, Inc. Series 2007-12A Class B, 3 month U.S. LIBOR + 0.560% 3.355% 4/6/42 (f)(g)(h)(j) | | 1,467 | 1,015 |
| TOTAL ASSET-BACKED SECURITIES | | | |
| (Cost $61,590) | | | 64,789 |
|
| Collateralized Mortgage Obligations - 0.0% | | | |
| Private Sponsor - 0.0% | | | |
| Bear Stearns ALT-A Trust floater Series 2005-1 Class A1, 1 month U.S. LIBOR + 0.560% 3.0499% 1/25/35 (h)(j) | | 141 | 141 |
| Merrill Lynch Alternative Note Asset Trust floater Series 2007-OAR1 Class A1, 1 month U.S. LIBOR + 0.170% 2.68% 2/25/37 (h)(j) | | 116 | 114 |
| Opteum Mortgage Acceptance Corp. floater Series 2005-3 Class APT, 1 month U.S. LIBOR + 0.290% 2.7799% 7/25/35 (h)(j) | | 133 | 132 |
| Sequoia Mortgage Trust floater Series 2004-6 Class A3B, 6 month U.S. LIBOR + 0.880% 3.3769% 7/20/34 (h)(j) | | 10 | 10 |
| Thornburg Mortgage Securities Trust floater Series 2003-4 Class A1, 1 month U.S. LIBOR + 0.640% 3.1299% 9/25/43 (h)(j) | | 861 | 855 |
|
| TOTAL PRIVATE SPONSOR | | | 1,252 |
|
| U.S. Government Agency - 0.0% | | | |
| Ginnie Mae guaranteed REMIC pass-thru certificates sequential payer Series 2013-H06 Class HA, 1.65% 1/20/63 (n) | | 3,335 | 3,298 |
| TOTAL COLLATERALIZED MORTGAGE OBLIGATIONS | | | |
| (Cost $4,488) | | | 4,550 |
|
| Commercial Mortgage Securities - 0.4% | | | |
| Asset Securitization Corp. Series 1997-D5 Class PS1, 1.8356% 2/14/43 (h)(o) | | 10 | 0 |
| Bayview Commercial Asset Trust: | | | |
| Series 2004-1, Class IO, 1.25% 4/25/34 (g)(o) | | 375 | 15 |
| Series 2006-3A, Class IO, 0% 10/25/36 (f)(g)(h)(o) | | 9,323 | 0 |
| Benchmark Mortgage Trust Series 2018-B8 Class A5, 4.2317% 1/15/52 | | 15,031 | 15,808 |
| BX Trust floater: | | | |
| Series 2018-EXCL Class D, 1 month U.S. LIBOR + 2.625% 5.1138% 9/15/37 (g)(h)(j) | | 2,568 | 2,564 |
| Series 2018-IND Class F, 1 month U.S. LIBOR + 1.800% 4.2888% 11/15/35 (g)(h)(j) | | 3,681 | 3,687 |
| CGBAM Commercial Mortgage Trust Series 2015-SMRT Class D, 3.768% 4/10/28 (g) | | 1,100 | 1,108 |
| Citigroup Commercial Mortgage Trust Series 2018-C6 Class A4, 4.412% 11/10/51 | | 4,362 | 4,643 |
| Credit Suisse Mortgage Trust Series 2018-SITE: | | | |
| Class A, 4.284% 4/15/36 (g) | | 5,378 | 5,574 |
| Class B, 4.5349% 4/15/36 (g) | | 964 | 999 |
| Class C, 4.6278% 4/15/36 (g) | | 1,110 | 1,140 |
| Class D, 4.6278% 4/15/36 (g) | | 2,219 | 2,229 |
| CSAIL Commercial Mtg Trust Series 2018-C14 Class A4 4.4216% 11/15/51 | | 3,584 | 3,805 |
| GAHR Commercial Mortgage Trust Series 2015-NRF: | | | |
| Class BFX, 3.3822% 12/15/34 (g)(h) | | 6,410 | 6,381 |
| Class CFX, 3.3822% 12/15/34 (g)(h) | | 5,380 | 5,349 |
| Class DFX, 3.3822% 12/15/34 (g)(h) | | 4,559 | 4,517 |
| JPMorgan Chase Commercial Mortgage Securities Trust Series 2018-WPT: | | | |
| Class CFX, 4.9498% 7/5/33 (g) | | 914 | 954 |
| Class DFX, 5.3503% 7/5/33 (g) | | 1,406 | 1,467 |
| Class EFX, 5.5422% 7/5/33 (g) | | 1,924 | 1,999 |
| Morgan Stanley Capital I Trust Series 2018-H4 Class A4, 4.31% 12/15/51 | | 15,164 | 15,997 |
| MSCG Trust Series 2016-SNR: | | | |
| Class A, 3.348% 11/15/34 (g)(h) | | 5,237 | 5,124 |
| Class B, 4.181% 11/15/34 (g) | | 2,207 | 2,172 |
| Class C, 5.205% 11/15/34 (g) | | 1,548 | 1,541 |
| Wells Fargo Commercial Mortgage Trust Series 2018-C48 Class A5, 4.302% 1/15/52 | | 11,378 | 11,994 |
| TOTAL COMMERCIAL MORTGAGE SECURITIES | | | |
| (Cost $98,671) | | | 99,067 |
|
| Municipal Securities - 0.4% | | | |
| California Gen. Oblig. Series 2009: | | | |
| 7.35% 11/1/39 | | $1,095 | $1,545 |
| 7.5% 4/1/34 | | 7,195 | 10,130 |
| 7.55% 4/1/39 | | 10,865 | 15,958 |
| Chicago Gen. Oblig.: | | | |
| (Taxable Proj.): | | | |
| Series 2008 B, 5.63% 1/1/22 | | 790 | 800 |
| Series 2010 C1, 7.781% 1/1/35 | | 4,620 | 5,090 |
| 6.05% 1/1/29 | | 310 | 319 |
| Illinois Gen. Oblig.: | | | |
| Series 2003, 4.95% 6/1/23 | | 1,700 | 1,717 |
| Series 2010-1, 6.63% 2/1/35 | | 15,330 | 16,345 |
| Series 2010-3: | | | |
| 5.547% 4/1/19 | | 155 | 155 |
| 6.725% 4/1/35 | | 11,505 | 12,149 |
| 7.35% 7/1/35 | | 4,495 | 4,989 |
| Series 2010-5, 6.2% 7/1/21 | | 1,149 | 1,185 |
| Series 2011, 5.877% 3/1/19 | | 19,390 | 19,390 |
| Series 2013, 4% 12/1/20 | | 6,040 | 6,084 |
| TOTAL MUNICIPAL SECURITIES | | | |
| (Cost $93,324) | | | 95,856 |
|
| Bank Loan Obligations - 0.5% | | | |
| COMMUNICATION SERVICES - 0.1% | | | |
| Diversified Telecommunication Services - 0.0% | | | |
| Sable International Finance Ltd. Tranche B 4LN, term loan 3 month U.S. LIBOR + 3.250% 5.743% 2/2/26 (h)(j) | | $2,335 | $2,324 |
| SFR Group SA Tranche B 12LN, term loan 3 month U.S. LIBOR + 3.688% 6.1763% 1/31/26 (h)(j) | | 4,024 | 3,888 |
| | | | 6,212 |
| Entertainment - 0.0% | | | |
| Cinemark U.S.A., Inc. Tranche B, term loan 3 month U.S. LIBOR + 1.750% 4.25% 3/29/25 (h)(j) | | 2,574 | 2,557 |
| Media - 0.1% | | | |
| Cengage Learning, Inc. Tranche B, term loan 3 month U.S. LIBOR + 4.250% 6.7399% 6/7/23 (h)(j) | | 3,191 | 2,940 |
| CSC Holdings LLC Tranche B, term loan 3 month U.S. LIBOR + 2.500% 4.9888% 1/25/26 (h)(j) | | 457 | 454 |
| Mediacom Illinois LLC Tranche N, term loan 3 month U.S. LIBOR + 1.750% 4.17% 2/15/24 (h)(j) | | 2,054 | 2,031 |
| NEP/NCP Holdco, Inc. Tranche B 1LN, term loan 3 month U.S. LIBOR + 3.250% 5.743% 10/19/25 (h)(j) | | 85 | 85 |
| WideOpenWest Finance LLC Tranche B, term loan 3 month U.S. LIBOR + 3.250% 5.7311% 8/19/23 (h)(j) | | 10,682 | 10,495 |
| | | | 16,005 |
| Wireless Telecommunication Services - 0.0% | | | |
| Intelsat Jackson Holdings SA Tranche B, term loan 3 month U.S. LIBOR + 3.750% 6.2291% 11/27/23 (h)(j) | | 9,305 | 9,295 |
| SBA Senior Finance II, LLC Tranche B, term loan 3 month U.S. LIBOR + 2.000% 4.5% 4/11/25 (h)(j) | | 498 | 492 |
| Sprint Communications, Inc. Tranche B 2LN, term loan 3 month U.S. LIBOR + 3.000% 5.5% 2/2/24 (h)(j) | | 1,190 | 1,175 |
| | | | 10,962 |
|
| TOTAL COMMUNICATION SERVICES | | | 35,736 |
|
| CONSUMER DISCRETIONARY - 0.1% | | | |
| Diversified Consumer Services - 0.0% | | | |
| KUEHG Corp.: | | | |
| Tranche B 2LN, term loan 3 month U.S. LIBOR + 8.250% 11.053% 8/22/25 (h)(j) | | 2,230 | 2,208 |
| Tranche B, term loan 3 month U.S. LIBOR + 3.750% 6.553% 2/21/25 (h)(j) | | 627 | 621 |
| | | | 2,829 |
| Hotels, Restaurants & Leisure - 0.0% | | | |
| Alterra Mountain Co. Tranche B 1LN, term loan 3 month U.S. LIBOR + 3.000% 5.493% 7/31/24 (h)(j) | | 45 | 44 |
| Internet & Direct Marketing Retail - 0.0% | | | |
| Bass Pro Shops LLC. Tranche B, term loan 3 month U.S. LIBOR + 5.000% 7.493% 9/25/24 (h)(j) | | 2,918 | 2,908 |
| Media - 0.1% | | | |
| Crown Finance U.S., Inc. Tranche B 1LN, term loan 3 month U.S. LIBOR + 2.500% 4.993% 2/28/25 (h)(j) | | 4,538 | 4,505 |
|
| TOTAL CONSUMER DISCRETIONARY | | | 10,286 |
|
| CONSUMER STAPLES - 0.0% | | | |
| Food & Staples Retailing - 0.0% | | | |
| BI-LO LLC Tranche B, term loan 3 month U.S. LIBOR + 8.000% 10.7665% 5/31/24 (h)(j) | | 4,975 | 4,772 |
| Tops Markets LLC 1LN, term loan 3 month U.S. LIBOR + 8.500% 11% 11/19/23 (h)(j) | | 1,201 | 1,231 |
| U.S. Foods, Inc. Tranche B, term loan 3 month U.S. LIBOR + 2.000% 4.493% 6/27/23 (h)(j) | | 630 | 626 |
| | | | 6,629 |
| ENERGY - 0.1% | | | |
| Energy Equipment & Services - 0.0% | | | |
| BCP Raptor II LLC Tranche B, term loan 3 month U.S. LIBOR + 4.750% 7.3695% 11/3/25 (h)(j) | | 745 | 720 |
| Oil, Gas & Consumable Fuels - 0.1% | | | |
| Ascent Resources Marcellus LLC term loan 3 month U.S. LIBOR + 6.500% 9.0169% 3/30/23 (h)(j) | | 279 | 279 |
| BCP Raptor LLC Tranche B, term loan 3 month U.S. LIBOR + 4.250% 6.8789% 6/22/24 (h)(j) | | 1,276 | 1,217 |
| California Resources Corp.: | | | |
| Tranche 1LN, term loan 3 month U.S. LIBOR + 10.375% 12.868% 12/31/21 (h)(j) | | 6,180 | 6,477 |
| Tranche B, term loan 3 month U.S. LIBOR + 4.750% 7.243% 12/31/22 (h)(j) | | 3,700 | 3,638 |
| Epic Crude Services LP Tranche B 1LN, term loan 3 month U.S. LIBOR + 5.000% 2/21/26 (j)(p) | | 5,205 | 5,140 |
| Gavilan Resources LLC Tranche 2LN, term loan 3 month U.S. LIBOR + 6.000% 8.4899% 3/1/24 (h)(j) | | 4,780 | 3,791 |
| GIP III Stetson I LP Tranche B, term loan 3 month U.S. LIBOR + 4.250% 6.7314% 7/18/25 (h)(j) | | 618 | 611 |
| Natgasoline LLC Tranche B, term loan 3 month U.S. LIBOR + 3.500% 6.25% 11/14/25 (h)(j) | | 275 | 275 |
| | | | 21,428 |
|
| TOTAL ENERGY | | | 22,148 |
|
| FINANCIALS - 0.1% | | | |
| Capital Markets - 0.0% | | | |
| HarbourVest Partners LLC Tranche B 1LN, term loan 3 month U.S. LIBOR + 2.250% 4.8489% 3/1/25 (h)(j) | | 306 | 303 |
| Diversified Financial Services - 0.1% | | | |
| Cabazon Finance Authority term loan 11% 3/7/24 pay-in-kind (f) | | 1,992 | 1,992 |
| Financial & Risk U.S. Holdings, Inc. Tranche B, term loan 3 month U.S. LIBOR + 3.750% 6.243% 10/1/25 (h)(j) | | 4,365 | 4,296 |
| RegionalCare Hospital Partners Holdings, Inc. Tranche B, term loan 3 month U.S. LIBOR + 4.500% 6.9814% 11/16/25 (h)(j) | | 3,860 | 3,854 |
| | | | 10,142 |
| Insurance - 0.0% | | | |
| Alliant Holdings Intermediate LLC Tranche B, term loan 3 month U.S. LIBOR + 2.750% 5.2314% 5/10/25 (h)(j) | | 64 | 63 |
| Asurion LLC: | | | |
| Tranche B 7LN, term loan 3 month U.S. LIBOR + 3.000% 5.493% 11/3/24 (h)(j) | | 3,841 | 3,838 |
| Tranche B, term loan 3 month U.S. LIBOR + 6.500% 8.993% 8/4/25 (h)(j) | | 360 | 365 |
| USI, Inc. Tranche B, term loan 3 month U.S. LIBOR + 3.000% 5.803% 5/16/24 (h)(j) | | 454 | 450 |
| | | | 4,716 |
|
| TOTAL FINANCIALS | | | 15,161 |
|
| HEALTH CARE - 0.0% | | | |
| Health Care Equipment & Supplies - 0.0% | | | |
| VVC Holding Corp. Tranche B 1LN, term loan 3 month U.S. LIBOR + 4.500% 7.197% 2/5/26 (h)(j) | | 3,760 | 3,737 |
| Pharmaceuticals - 0.0% | | | |
| Valeant Pharmaceuticals International, Inc. Tranche B 2LN, term loan 3 month U.S. LIBOR + 2.750% 5.2623% 11/27/25 (h)(j) | | 3,210 | 3,200 |
|
| TOTAL HEALTH CARE | | | 6,937 |
|
| INDUSTRIALS - 0.0% | | | |
| Aerospace & Defense - 0.0% | | | |
| TransDigm, Inc. Tranche G, term loan 3 month U.S. LIBOR + 2.500% 4.993% 8/22/24 (h)(j) | | 4,309 | 4,246 |
| Commercial Services & Supplies - 0.0% | | | |
| IRI Holdings, Inc. Tranche B 1LN, term loan 3 month U.S. LIBOR + 4.500% 7.1289% 11/30/25 (h)(j) | | 4,720 | 4,649 |
|
| TOTAL INDUSTRIALS | | | 8,895 |
|
| INFORMATION TECHNOLOGY - 0.1% | | | |
| Communications Equipment - 0.0% | | | |
| Anastasia Parent LLC Tranche B, term loan 3 month U.S. LIBOR + 3.750% 6.243% 8/10/25 (h)(j) | | 374 | 354 |
| Electronic Equipment & Components - 0.0% | | | |
| ATS Consolidated, Inc. Tranche B 1LN, term loan 3 month U.S. LIBOR + 3.750% 6.243% 2/28/25 (h)(j) | | 154 | 154 |
| IT Services - 0.0% | | | |
| Web.com Group, Inc.: | | | |
| 2LN, term loan 3 month U.S. LIBOR + 7.750% 10.2669% 10/11/26 (h)(j) | | 710 | 696 |
| Tranche B 1LN, term loan 3 month U.S. LIBOR + 3.750% 6.2669% 10/11/25 (h)(j) | | 290 | 288 |
| | | | 984 |
| Software - 0.1% | | | |
| Kronos, Inc.: | | | |
| 2LN, term loan 3 month U.S. LIBOR + 8.250% 10.9863% 11/1/24 (h)(j) | | 6,915 | 7,032 |
| Tranche B 1LN, term loan 3 month U.S. LIBOR + 3.000% 5.7363% 11/1/23 (h)(j) | | 1,670 | 1,662 |
| SS&C Technologies, Inc.: | | | |
| Tranche B 3LN, term loan 3 month U.S. LIBOR + 2.250% 4.743% 4/16/25 (h)(j) | | 3,478 | 3,461 |
| Tranche B 4LN, term loan 3 month U.S. LIBOR + 2.250% 4.743% 4/16/25 (h)(j) | | 1,332 | 1,326 |
| Tranche B 5LN, term loan 3 month U.S. LIBOR + 2.250% 4.743% 4/16/25 (h)(j) | | 384 | 382 |
| Uber Technologies, Inc. Tranche B, term loan: | | | |
| 3 month U.S. LIBOR + 3.500% 5.9814% 7/13/23 (h)(j) | | 2,015 | 2,005 |
| 3 month U.S. LIBOR + 4.000% 6.5169% 4/4/25 (h)(j) | | 1,572 | 1,572 |
| | | | 17,440 |
|
| TOTAL INFORMATION TECHNOLOGY | | | 18,932 |
|
| MATERIALS - 0.0% | | | |
| Chemicals - 0.0% | | | |
| Invictus U.S. Newco LLC Tranche 1LN, term loan 3 month U.S. LIBOR + 3.000% 5.5791% 3/28/25 (h)(j) | | 134 | 133 |
| Messer Industries U.S.A., Inc. Tranche B 1LN, term loan 3 month U.S. LIBOR + 2.500% 9/28/25 (j)(p) | | 5,085 | 5,047 |
| PQ Corp. Tranche B, term loan 3 month U.S. LIBOR + 2.500% 5.2444% 2/8/25 (h)(j) | | 87 | 86 |
| Starfruit U.S. Holdco LLC Tranche B, term loan 3 month U.S. LIBOR + 3.250% 5.7638% 10/1/25 (h)(j) | | 880 | 874 |
| | | | 6,140 |
| TOTAL BANK LOAN OBLIGATIONS | | | |
| (Cost $131,389) | | | 130,864 |
|
| Bank Notes - 0.2% | | | |
| Capital One NA 2.95% 7/23/21 | | 7,402 | 7,334 |
| Discover Bank: | | | |
| (Delaware) 3.2% 8/9/21 | | $9,037 | $9,005 |
| 3.1% 6/4/20 | | 8,635 | 8,628 |
| 4.682% 8/9/28 (h) | | 3,485 | 3,474 |
| 8.7% 11/18/19 | | 532 | 551 |
| RBS Citizens NA 2.5% 3/14/19 | | 4,029 | 4,029 |
| Synchrony Bank 3.65% 5/24/21 | | 5,873 | 5,898 |
| TOTAL BANK NOTES | | | |
| (Cost $38,988) | | | 38,919 |
|
| Preferred Securities - 0.3% | | | |
| FINANCIALS - 0.3% | | | |
| Banks - 0.3% | | | |
| Bank of America Corp.: | | | |
| 5.875% (h)(q) | | $14,020 | $14,093 |
| 6.1% (h)(q) | | 1,680 | 1,833 |
| Barclays Bank PLC 7.625% 11/21/22 | | 7,765 | 8,541 |
| Citigroup, Inc.: | | | |
| 5.35% (h)(q) | | 6,540 | 6,561 |
| 5.95% (h)(q) | | 12,415 | 12,725 |
| 5.95% (h)(q) | | 5,000 | 5,074 |
| 6.3% (h)(q) | | 3,635 | 3,766 |
| Credit Agricole SA: | | | |
| 6.625% (g)(h)(q) | | 7,820 | 7,990 |
| 7.875% (g)(h)(q) | | 2,225 | 2,421 |
| 8.125% (g)(h)(q) | | 2,840 | 3,211 |
| JPMorgan Chase & Co. 6% (h)(q) | | 11,680 | 12,118 |
| Standard Chartered PLC 7.5% (g)(h)(q) | | 3,195 | 3,438 |
| TOTAL PREFERRED SECURITIES | | | |
| (Cost $79,815) | | | 81,771 |
| | | Shares | Value (000s) |
|
| Fixed-Income Funds - 7.4% | | | |
| Fidelity Mortgage Backed Securities Central Fund (r) | | | |
| (Cost $1,970,110) | | 18,805,985 | 1,996,820 |
|
| Other - 0.0% | | | |
| Other - 0.0% | | | |
| Tribune Co. Claim (a)(f) | | | |
| (Cost $11) | | 11,217 | 11 |
|
| Money Market Funds - 1.5% | | | |
| Fidelity Cash Central Fund, 2.44% (s) | | 249,119,339 | 249,169 |
| Fidelity Securities Lending Cash Central Fund 2.45% (s)(t) | | 153,453,956 | 153,469 |
| TOTAL MONEY MARKET FUNDS | | | |
| (Cost $402,628) | | | 402,638 |
| | | Maturity Amount (000s) | Value (000s) |
|
| Repurchase Agreements - 0.7% | | | |
| Investments in repurchase agreements in a joint trading account at 2.59%, dated 2/28/19 due 3/1/19 (Collateralized by U.S. Government Obligations) # (u) | | | |
| (Cost $197,097) | | 197,111 | 197,097 |
| TOTAL INVESTMENT IN SECURITIES - 101.4% | | | |
| (Cost $22,850,518) | | | 27,211,357 |
| NET OTHER ASSETS (LIABILITIES) - (1.4)% | | | (366,907) |
| NET ASSETS - 100% | | | $26,844,450 |
| Futures Contracts | | | | | |
| | Number of contracts | Expiration Date | Notional Amount (000s) | Value (000s) | Unrealized Appreciation/(Depreciation) (000s) |
| Purchased | | | | | |
| Equity Index Contracts | | | | | |
| CME E-mini S&P 500 Index Contracts (United States) | 125 | March 2019 | $17,404 | $1,354 | $1,354 |
The notional amount of futures purchased as a percentage of Net Assets is 0.1%
Values shown as $0 in the Schedule of Investments may reflect amounts less than $500.
Legend
(a) Non-income producing
(b) Security or a portion of the security is on loan at period end.
(c) Affiliated company
(d) Investment is owned by a wholly-owned subsidiary (Subsidiary) that is treated as a corporation for U.S. tax purposes.
(e) Restricted securities - Investment in securities not registered under the Securities Act of 1933 (excluding 144A issues). At the end of the period, the value of restricted securities (excluding 144A issues) amounted to $599,959,000 or 2.2% of net assets.
(f) Level 3 security
(g) Security exempt from registration under Rule 144A of the Securities Act of 1933. These securities may be resold in transactions exempt from registration, normally to qualified institutional buyers. At the end of the period, the value of these securities amounted to $1,087,273,000 or 4.1% of net assets.
(h) Coupon rates for floating and adjustable rate securities reflect the rates in effect at period end.
(i) Non-income producing - Security is in default.
(j) Coupon is indexed to a floating interest rate which may be multiplied by a specified factor and/or subject to caps or floors.
(k) Security or a portion of the security purchased on a delayed delivery or when-issued basis.
(l) A portion of the security sold on a delayed delivery basis.
(m) Security or a portion of the security was pledged to cover margin requirements for futures contracts. At period end, the value of securities pledged amounted to $802,000.
(n) Represents an investment in an underlying pool of reverse mortgages which typically do not require regular principal and interest payments as repayment is deferred until a maturity event.
(o) Security represents right to receive monthly interest payments on an underlying pool of mortgages or assets. Principal shown is the outstanding par amount of the pool as of the end of the period.
(p) The coupon rate will be determined upon settlement of the loan after period end.
(q) Security is perpetual in nature with no stated maturity date.
(r) Affiliated fund that is generally available only to investment companies and other accounts managed by Fidelity Investments. A complete unaudited schedule of portfolio holdings for each Fidelity Central Fund is filed with the SEC for the first and third quarters of each fiscal year on Form N-Q and is available upon request or at the SEC's website at www.sec.gov. An unaudited holdings listing for the Fund, which presents direct holdings as well as the pro-rata share of securities and other investments held indirectly through its investment in underlying non-money market Fidelity Central Funds is available at fidelity.com and/or institutional.fidelity.com, as applicable. In addition, each Fidelity Central Fund's financial statements are available on the SEC's website or upon request.
(s) Affiliated fund that is generally available only to investment companies and other accounts managed by Fidelity Investments. The rate quoted is the annualized seven-day yield of the fund at period end. A complete unaudited listing of the fund's holdings as of its most recent quarter end is available upon request. In addition, each Fidelity Central Fund's financial statements are available on the SEC's website or upon request.
(t) Investment made with cash collateral received from securities on loan.
(u) Includes investment made with cash collateral received from securities on loan.
Additional information on each restricted holding is as follows:
| Security | Acquisition Date | Acquisition Cost (000s) |
| Ant International Co. Ltd. Class C | 5/16/18 | $10,000 |
| Atom Tickets LLC | 8/15/17 | $15,000 |
| Blu Homes, Inc. | 6/10/13 | $5,000 |
| Corindus Vascular Robotics, Inc. | 9/12/14 | $12,500 |
| Generation Bio Series B | 2/21/18 | $3,388 |
| Get Heal, Inc. Series B | 11/7/16 | $2,597 |
| Goop International Holdings, Inc. Series C | 12/15/17 | $20,000 |
| Jello Labs, Inc. Series C | 12/22/16 | $17,000 |
| Lyft, Inc. Series H | 11/22/17 | $30,000 |
| Lyft, Inc. Series I | 6/27/18 | $18,000 |
| Moda Operandi, Inc. Series E | 12/18/14 | $20,000 |
| Moda Operandi, Inc. Series F | 12/13/17 | $8,526 |
| Mulberry Health, Inc. Series A | 3/23/18 | $5,000 |
| Mulberry Health, Inc. Series A8 | 1/20/16 | $20,000 |
| Mulberry Health, Inc. Series AA | 3/23/18 | $170 |
| Neutron Holdings, Inc. Series C | 7/3/18 | $7,056 |
| Neutron Holdings, Inc. Series D | 1/25/19 | $9,900 |
| Peloton Interactive, Inc. Series E | 3/31/17 | $10,000 |
| Rent the Runway, Inc. Series E | 12/22/16 | $30,000 |
| Space Exploration Technologies Corp. Class A | 9/11/17 | $5,551 |
| Space Exploration Technologies Corp. Class C | 9/11/17 | $757 |
| Space Exploration Technologies Corp. Series H | 8/4/17 | $7,009 |
| The Honest Co., Inc. Series D | 8/3/15 | $9,000 |
| The Honest Co., Inc. Series E | 9/28/17 | $20,000 |
| The Void LLC | 12/21/17 | $20,000 |
| Tory Burch LLC Class A | 5/14/15 | $50,000 |
| Tory Burch LLC Class B | 12/31/12 | $17,505 |
| TulCo LLC | 8/24/17 - 12/14/17 | $15,000 |
| Uber Technologies, Inc. Series D, 8.00% | 6/6/14 | $25,000 |
| Vice Holding, Inc. | 8/3/12 - 7/18/14 | $61,641 |
| WME Entertainment Parent, LLC Class A | 4/13/16 - 8/16/16 | $50,000 |
Affiliated Central Funds
Information regarding fiscal year to date income earned by the Fund from investments in Fidelity Central Funds is as follows:
| Fund | Income earned |
| | (Amounts in thousands) |
| Fidelity Cash Central Fund | $12,159 |
| Fidelity Mortgage Backed Securities Central Fund | 28,414 |
| Fidelity Securities Lending Cash Central Fund | 690 |
| Total | $41,263 |
Amounts in the income column in the above table include any capital gain distributions from underlying funds, which are presented in the corresponding line-item in the Statement of Operations, if applicable.
Fiscal year to date information regarding the Fund’s investments in non-Money Market Central Funds, including the ownership percentage, is presented below.
| Fund (Amounts in thousands) | Value, beginning of period | Purchases | Sales Proceeds | Realized Gain/Loss | Change in Unrealized appreciation (depreciation) | Value, end of period | % ownership, end of period |
| Fidelity Mortgage Backed Securities Central Fund | $1,547,167 | $429,214 | $-- | $-- | $20,439 | $1,996,820 | 22.5% |
| Total | $1,547,167 | $429,214 | $-- | $-- | $20,439 | $1,996,820 | |
Other Affiliated Issuers
An affiliated company is a company in which the Fund has ownership of at least 5% of the voting securities. Fiscal year to date transactions with companies which are or were affiliates are as follows:
| Affiliate (Amounts in thousands) | Value, beginning of period | Purchases | Sales Proceeds | Dividend Income | Realized Gain (loss) | Change in Unrealized appreciation (depreciation) | Value, end of period |
| LiveXLive Media, Inc. | $20,381 | $314 | $-- | $-- | $-- | $3,761 | $24,456 |
| Total | $20,381 | $314 | $-- | $-- | $-- | $3,761 | $24,456 |
Investment Valuation
The following is a summary of the inputs used, as of February 28, 2019, involving the Fund's assets and liabilities carried at fair value. The inputs or methodology used for valuing securities may not be an indication of the risk associated with investing in those securities. For more information on valuation inputs, and their aggregation into the levels used below, please refer to the Investment Valuation section in the accompanying Notes to Financial Statements.
| | Valuation Inputs at Reporting Date: |
| Description | Total | Level 1 | Level 2 | Level 3 |
| (Amounts in thousands) | | | | |
| Investments in Securities: | | | | |
| Equities: | | | | |
| Communication Services | $1,763,788 | $1,594,165 | $-- | $169,623 |
| Consumer Discretionary | 1,971,254 | 1,753,967 | 18,297 | 198,990 |
| Consumer Staples | 753,939 | 748,050 | 2,673 | 3,216 |
| Energy | 611,816 | 486,713 | 124,498 | 605 |
| Financials | 1,715,973 | 1,715,973 | -- | -- |
| Health Care | 3,478,958 | 3,448,864 | -- | 30,094 |
| Industrials | 1,891,737 | 1,849,895 | -- | 41,842 |
| Information Technology | 4,078,204 | 3,936,260 | -- | 141,944 |
| Materials | 547,931 | 547,931 | -- | -- |
| Real Estate | 493,691 | 482,408 | -- | 11,283 |
| Utilities | 353,633 | 347,968 | 5,665 | -- |
| Corporate Bonds | 3,883,379 | -- | 3,883,379 | -- |
| U.S. Government and Government Agency Obligations | 2,554,672 | -- | 2,554,672 | -- |
| Asset-Backed Securities | 64,789 | -- | 63,774 | 1,015 |
| Collateralized Mortgage Obligations | 4,550 | -- | 4,550 | -- |
| Commercial Mortgage Securities | 99,067 | -- | 99,067 | -- |
| Municipal Securities | 95,856 | -- | 95,856 | -- |
| Bank Loan Obligations | 130,864 | -- | 128,872 | 1,992 |
| Bank Notes | 38,919 | -- | 38,919 | -- |
| Preferred Securities | 81,771 | -- | 81,771 | -- |
| Fixed-Income Funds | 1,996,820 | 1,996,820 | -- | -- |
| Other | 11 | -- | -- | 11 |
| Money Market Funds | 402,638 | 402,638 | -- | -- |
| Repurchase Agreements | 197,097 | -- | 197,097 | -- |
| Total Investments in Securities: | $27,211,357 | $19,311,652 | $7,299,090 | $600,615 |
| Derivative Instruments: | | | | |
| Assets | | | | |
| Futures Contracts | $1,354 | $1,354 | $-- | $-- |
| Total Assets | $1,354 | $1,354 | $-- | $-- |
| Total Derivative Instruments: | $1,354 | $1,354 | $-- | $-- |
The following is a reconciliation of Investments in Securities and Derivative Instruments for which Level 3 inputs were used in determining value:
| (Amounts in thousands) | |
| Investments in Securities: | |
| Equities - Consumer Discretionary | |
| Beginning Balance | $418,843 |
| Net Realized Gain (Loss) on Investment Securities | 128 |
| Net Unrealized Gain (Loss) on Investment Securities | (229,254) |
| Cost of Purchases | 15,016 |
| Proceeds of Sales | (5,743) |
| Amortization/Accretion | -- |
| Transfers into Level 3 | -- |
| Transfers out of Level 3 | -- |
| Ending Balance | $198,990 |
| The change in unrealized gain (loss) for the period attributable to Level 3 securities held at February 28, 2019 | $(229,254) |
| Other Investments in Securities | |
| Beginning Balance | $248,058 |
| Net Realized Gain (Loss) on Investment Securities | (7,747) |
| Net Unrealized Gain (Loss) on Investment Securities | 163,196 |
| Cost of Purchases | 1,178 |
| Proceeds of Sales | (3,081) |
| Amortization/Accretion | 21 |
| Transfers into Level 3 | -- |
| Transfers out of Level 3 | -- |
| Ending Balance | $401,625 |
| The change in unrealized gain (loss) for the period attributable to Level 3 securities held at February 28, 2019 | $155,193 |
The information used in the above reconciliation represents fiscal year to date activity for any Investments in Securities identified as using Level 3 inputs at either the beginning or the end of the current fiscal period. Transfers in or out of Level 3 represent the beginning value of any Security or Instrument where a change in the pricing level occurred from the beginning to the end of the period. The cost of purchases and the proceeds of sales may include securities received or delivered through corporate actions or exchanges. Realized and unrealized gains (losses) disclosed in the reconciliation are included in Net Gain (Loss) on the Fund's Statement of Operations.
Value of Derivative Instruments
The following table is a summary of the Fund's value of derivative instruments by primary risk exposure as of February 28, 2019. For additional information on derivative instruments, please refer to the Derivative Instruments section in the accompanying Notes to Financial Statements.
| Primary Risk Exposure / Derivative Type | Value |
| | Asset | Liability |
| (Amounts in thousands) | | |
| Equity Risk | | |
| Futures Contracts(a) | $1,354 | $0 |
| Total Equity Risk | 1,354 | 0 |
| Total Value of Derivatives | $1,354 | $0 |
(a) Reflects gross cumulative appreciation (depreciation) on futures contracts as presented in the Schedule of Investments. In the Statement of Assets and Liabilities, the period end daily variation margin is included in receivable or payable for daily variation margin on futures contracts, and the net cumulative appreciation (depreciation) is included in distributable earnings.
Other Information
# Additional information on each counterparty to the repurchase agreement is as follows:
| Repurchase Agreement / Counterparty | Value |
| | (000s) |
| $197,097,000 due 3/1/19 at 2.59% | |
| Merrill Lynch, Pierce, Fenner & Smith, Inc. | $39,427 |
| J.P. Morgan Securities, Inc. | 157,670 |
| | $197,097 |
The composition of credit quality ratings as a percentage of Total Net Assets is as follows (Unaudited):
| U.S. Government and U.S. Government Agency Obligations | 17.9% |
| AAA,AA,A | 2.8% |
| BBB | 8.4% |
| BB | 3.2% |
| B | 1.1% |
| CCC,CC,C | 1.0% |
| Not Rated | 0.1% |
| Equities | 65.8% |
| Short-Term Investments and Net Other Assets | (0.3)% |
| | 100.0% |
We have used ratings from Moody's Investors Service, Inc. Where Moody's® ratings are not available, we have used S&P® ratings. All ratings are as of the date indicated and do not reflect subsequent changes.
The information in the above tables is based on the combined investments of the fund and its pro-rata share of the investments of Fidelity's Fixed-Income Central Funds
See accompanying notes which are an integral part of the financial statements.
Financial Statements
Statement of Assets and Liabilities
| Amounts in thousands (except per-share amounts) | | February 28, 2019 |
| Assets | | |
Investment in securities, at value (including securities loaned of $342,265 and repurchase agreements of $197,097) — See accompanying schedule:
Unaffiliated issuers (cost $20,461,385) | $24,787,443 | |
| Fidelity Central Funds (cost $2,372,738) | 2,399,458 | |
| Other affiliated issuers (cost $16,395) | 24,456 | |
| Total Investment in Securities (cost $22,850,518) | | $27,211,357 |
| Cash | | 44 |
| Restricted cash | | 380 |
| Receivable for investments sold | | |
| Regular delivery | | 193,309 |
| Delayed delivery | | 1,151 |
| Receivable for fund shares sold | | 11,001 |
| Dividends receivable | | 28,146 |
| Interest receivable | | 62,409 |
| Distributions receivable from Fidelity Central Funds | | 1,183 |
| Prepaid expenses | | 27 |
| Other receivables | | 1,868 |
| Total assets | | 27,510,875 |
| Liabilities | | |
| Payable for investments purchased | | |
| Regular delivery | $153,512 | |
| Delayed delivery | 15,513 | |
| Payable for fund shares redeemed | 133,627 | |
| Accrued management fee | 8,709 | |
| Payable for daily variation margin on futures contracts | 65 | |
| Other affiliated payables | 2,684 | |
| Other payables and accrued expenses | 1,737 | |
| Collateral on securities loaned | 350,578 | |
| Total liabilities | | 666,425 |
| Net Assets | | $26,844,450 |
| Net Assets consist of: | | |
| Paid in capital | | $22,303,022 |
| Total distributable earnings (loss) | | 4,541,428 |
| Net Assets | | $26,844,450 |
| Net Asset Value and Maximum Offering Price | | |
| Puritan: | | |
| Net Asset Value, offering price and redemption price per share ($21,063,579 ÷ 995,082 shares) | | $21.17 |
| Class K: | | |
| Net Asset Value, offering price and redemption price per share ($5,780,871 ÷ 273,275 shares) | | $21.15 |
See accompanying notes which are an integral part of the financial statements.
Statement of Operations
| Amounts in thousands | | Six months ended February 28, 2019 |
| Investment Income | | |
| Dividends | | $118,536 |
| Interest | | 134,081 |
| Income from Fidelity Central Funds | | 41,263 |
| Total income | | 293,880 |
| Expenses | | |
| Management fee | $53,099 | |
| Transfer agent fees | 15,507 | |
| Accounting and security lending fees | 1,123 | |
| Custodian fees and expenses | 131 | |
| Independent trustees' fees and expenses | 88 | |
| Registration fees | 311 | |
| Audit | 98 | |
| Legal | 31 | |
| Miscellaneous | 81 | |
| Total expenses before reductions | 70,469 | |
| Expense reductions | (396) | |
| Total expenses after reductions | | 70,073 |
| Net investment income (loss) | | 223,807 |
| Realized and Unrealized Gain (Loss) | | |
| Net realized gain (loss) on: | | |
| Investment securities: | | |
| Unaffiliated issuers (net of foreign taxes of $1) | 1,631,868 | |
| Fidelity Central Funds | (15) | |
| Foreign currency transactions | (73) | |
| Futures contracts | (34,052) | |
| Total net realized gain (loss) | | 1,597,728 |
| Change in net unrealized appreciation (depreciation) on: | | |
| Investment securities: | | |
| Unaffiliated issuers (net of increase in deferred foreign taxes of $40) | (3,141,666) | |
| Fidelity Central Funds | 20,454 | |
| Other affiliated issuers | 3,761 | |
| Assets and liabilities in foreign currencies | 189 | |
| Futures contracts | 1,354 | |
| Total change in net unrealized appreciation (depreciation) | | (3,115,908) |
| Net gain (loss) | | (1,518,180) |
| Net increase (decrease) in net assets resulting from operations | | $(1,294,373) |
See accompanying notes which are an integral part of the financial statements.
Statement of Changes in Net Assets
| Amounts in thousands | Six months ended February 28, 2019 | Year ended August 31, 2018 |
| Increase (Decrease) in Net Assets | | |
| Operations | | |
| Net investment income (loss) | $223,807 | $434,354 |
| Net realized gain (loss) | 1,597,728 | 2,067,514 |
| Change in net unrealized appreciation (depreciation) | (3,115,908) | 1,226,331 |
| Net increase (decrease) in net assets resulting from operations | (1,294,373) | 3,728,199 |
| Distributions to shareholders | (3,401,022) | – |
| Distributions to shareholders from net investment income | – | (374,856) |
| Distributions to shareholders from net realized gain | – | (766,442) |
| Total distributions | (3,401,022) | (1,141,298) |
| Share transactions - net increase (decrease) | 2,064,065 | 559,715 |
| Total increase (decrease) in net assets | (2,631,330) | 3,146,616 |
| Net Assets | | |
| Beginning of period | 29,475,780 | 26,329,164 |
| End of period | $26,844,450 | $29,475,780 |
| Other Information | | |
| Undistributed net investment income end of period | | $116,716 |
See accompanying notes which are an integral part of the financial statements.
Financial Highlights
Fidelity Puritan Fund
| | Six months ended February 28, | Years endedAugust 31, | | | | |
| | 2019 | 2018 | 2017 | 2016 | 2015 | 2014 |
| Selected Per–Share Data | | | | | | |
| Net asset value, beginning of period | $25.10 | $22.90 | $21.07 | $21.02 | $22.91 | $20.98 |
| Income from Investment Operations | | | | | | |
| Net investment income (loss)A | .18 | .37 | .37 | .36 | .47B | .36 |
| Net realized and unrealized gain (loss) | (1.29) | 2.81 | 2.21 | 1.10 | (.33) | 3.60 |
| Total from investment operations | (1.11) | 3.18 | 2.58 | 1.46 | .14 | 3.96 |
| Distributions from net investment income | (.19) | (.32) | (.39)C | (.34) | (.46) | (.35) |
| Distributions from net realized gain | (2.63) | (.67) | (.36)C | (1.07) | (1.57) | (1.68) |
| Total distributions | (2.82) | (.98)D | (.75) | (1.41) | (2.03) | (2.03) |
| Net asset value, end of period | $21.17 | $25.10 | $22.90 | $21.07 | $21.02 | $22.91 |
| Total ReturnE,F | (4.16)% | 14.34% | 12.64% | 7.36% | .87% | 20.17% |
| Ratios to Average Net AssetsG,H | | | | | | |
| Expenses before reductions | .54%I | .54% | .55% | .56% | .56% | .56% |
| Expenses net of fee waivers, if any | .54%I | .53% | .55% | .56% | .56% | .56% |
| Expenses net of all reductions | .53%I | .53% | .55% | .55% | .55% | .56% |
| Net investment income (loss) | 1.62%I | 1.54% | 1.73% | 1.77% | 2.13%B | 1.68% |
| Supplemental Data | | | | | | |
| Net assets, end of period (in millions) | $21,064 | $22,864 | $20,132 | $19,754 | $18,812 | $18,351 |
| Portfolio turnover rateJ | 125%I | 44%K | 45% | 36% | 106% | 160% |
A Calculated based on average shares outstanding during the period.
B Net investment income per share reflects a large, non-recurring dividend which amounted to $.13 per share. Excluding this non-recurring dividend, the ratio of net investment income (loss) to average net assets would have been 1.55%.
C The amounts shown reflect certain reclassifications related to book to tax differences that were made in the year shown.
D Total distributions of $.98 per share is comprised of distributions from net investment income of $.318 and distributions from net realized gain of $.666 per share.
E Total returns for periods of less than one year are not annualized.
F Total returns would have been lower if certain expenses had not been reduced during the applicable periods shown.
G Fees and expenses of any underlying Fidelity Central Funds are not included in the Fund's expense ratio. The Fund indirectly bears its proportionate share of the expenses of any underlying Fidelity Central Funds. Based on their most recent shareholder report date, the expenses of any underlying non-money market Fidelity Central Funds were less than .005%.
H Expense ratios reflect operating expenses of the class. Expenses before reductions do not reflect amounts reimbursed by the investment adviser or reductions from brokerage service arrangements or reductions from other expense offset arrangements and do not represent the amount paid by the class during periods when reimbursements or reductions occur. Expenses net of fee waivers reflect expenses after reimbursement by the investment adviser but prior to reductions from brokerage service arrangements or other expense offset arrangements. Expenses net of all reductions represent the net expenses paid by the class.
I Annualized
J Amount does not include the portfolio activity of any underlying Fidelity Central Funds.
K Portfolio turnover rate excludes securities received or delivered in-kind.
See accompanying notes which are an integral part of the financial statements.
Fidelity Puritan Fund Class K
| | Six months ended February 28, | Years endedAugust 31, | | | | |
| | 2019 | 2018 | 2017 | 2016 | 2015 | 2014 |
| Selected Per–Share Data | | | | | | |
| Net asset value, beginning of period | $25.09 | $22.89 | $21.06 | $21.01 | $22.90 | $20.98 |
| Income from Investment Operations | | | | | | |
| Net investment income (loss)A | .19 | .39 | .39 | .38 | .49B | .39 |
| Net realized and unrealized gain (loss) | (1.30) | 2.81 | 2.21 | 1.10 | (.33) | 3.58 |
| Total from investment operations | (1.11) | 3.20 | 2.60 | 1.48 | .16 | 3.97 |
| Distributions from net investment income | (.20) | (.34) | (.41)C | (.36) | (.48) | (.37) |
| Distributions from net realized gain | (2.63) | (.67) | (.36)C | (1.07) | (1.57) | (1.68) |
| Total distributions | (2.83) | (1.00)D | (.77) | (1.43) | (2.05) | (2.05) |
| Net asset value, end of period | $21.15 | $25.09 | $22.89 | $21.06 | $21.01 | $22.90 |
| Total ReturnE,F | (4.16)% | 14.44% | 12.76% | 7.48% | .96% | 20.25% |
| Ratios to Average Net AssetsG,H | | | | | | |
| Expenses before reductions | .45%I | .45% | .46% | .46% | .46% | .46% |
| Expenses net of fee waivers, if any | .45%I | .45% | .46% | .46% | .46% | .46% |
| Expenses net of all reductions | .45%I | .44% | .45% | .46% | .46% | .46% |
| Net investment income (loss) | 1.71%I | 1.63% | 1.82% | 1.86% | 2.23%B | 1.78% |
| Supplemental Data | | | | | | |
| Net assets, end of period (in millions) | $5,781 | $6,612 | $6,198 | $6,009 | $5,939 | $6,162 |
| Portfolio turnover rateJ | 125%I | 44%K | 45% | 36% | 106% | 160% |
A Calculated based on average shares outstanding during the period.
B Net investment income per share reflects a large, non-recurring dividend which amounted to $.13 per share. Excluding this non-recurring dividend, the ratio of net investment income (loss) to average net assets would have been 1.65%.
C The amounts shown reflect certain reclassifications related to book to tax differences that were made in the year shown.
D Total distributions of $1.00 per share is comprised of distributions from net investment income of $.337 and distributions from net realized gain of $.666 per share.
E Total returns for periods of less than one year are not annualized.
F Total returns would have been lower if certain expenses had not been reduced during the applicable periods shown.
G Fees and expenses of any underlying Fidelity Central Funds are not included in the Fund's expense ratio. The Fund indirectly bears its proportionate share of the expenses of any underlying Fidelity Central Funds. Based on their most recent shareholder report date, the expenses of any underlying non-money market Fidelity Central Funds were less than .005%.
H Expense ratios reflect operating expenses of the class. Expenses before reductions do not reflect amounts reimbursed by the investment adviser or reductions from brokerage service arrangements or reductions from other expense offset arrangements and do not represent the amount paid by the class during periods when reimbursements or reductions occur. Expenses net of fee waivers reflect expenses after reimbursement by the investment adviser but prior to reductions from brokerage service arrangements or other expense offset arrangements. Expenses net of all reductions represent the net expenses paid by the class.
I Annualized
J Amount does not include the portfolio activity of any underlying Fidelity Central Funds.
K Portfolio turnover rate excludes securities received or delivered in-kind.
See accompanying notes which are an integral part of the financial statements.
Notes to Financial Statements (Unaudited)
For the period ended February 28, 2019
(Amounts in thousands except percentages)
1. Organization.
Fidelity Puritan Fund (the Fund) is a fund of Fidelity Puritan Trust (the Trust) and is authorized to issue an unlimited number of shares. The Trust is registered under the Investment Company Act of 1940, as amended (the 1940 Act), as an open-end management investment company organized as a Massachusetts business trust. The Fund offers Puritan and Class K shares, each of which has equal rights as to assets and voting privileges. Each class has exclusive voting rights with respect to matters that affect that class.
2. Investments in Fidelity Central Funds.
The Fund invests in Fidelity Central Funds, which are open-end investment companies generally available only to other investment companies and accounts managed by the investment adviser and its affiliates. The Fund's Schedule of Investments lists each of the Fidelity Central Funds held as of period end, if any, as an investment of the Fund, but does not include the underlying holdings of each Fidelity Central Fund. As an Investing Fund, the Fund indirectly bears its proportionate share of the expenses of the underlying Fidelity Central Funds.
Based on its investment objective, each Fidelity Central Fund may invest or participate in various investment vehicles or strategies that are similar to those of the Fund. These strategies are consistent with the investment objectives of the Fund and may involve certain economic risks which may cause a decline in value of each of the Fidelity Central Funds and thus a decline in the value of the Fund. The Money Market Central Funds seek preservation of capital and current income and are managed by Fidelity Investments Money Management, Inc. (FIMM), an affiliate of the investment adviser. Annualized expenses of the Money Market Central Funds as of their most recent shareholder report date are less than .005%. The following summarizes the Fund's investment in each non-money market Fidelity Central Fund.
| Fidelity Central Fund | Investment Manager | Investment Objective | Investment Practices | Expense Ratio(a) |
| Fidelity Mortgage Backed Securities Central Fund | Fidelity Investment Money Management, Inc. (FIMM) | Seeks a high level of income by normally investing in investment-grade mortgage-related securities and repurchase agreements for those securities. | Delayed Delivery & When Issued Securities
Futures
Options
Restricted Securities
| Less than .005% |
(a) Expenses expressed as a percentage of average net assets and are as of each underlying Central Fund's most recent annual or semi-annual shareholder report.
An unaudited holdings listing for the Fund, which presents direct holdings as well as the pro-rata share of any securities and other investments held indirectly through its investment in underlying non-money market Fidelity Central Funds, is available at fidelity.com. A complete unaudited list of holdings for each Fidelity Central Fund is available upon request or at the Securities and Exchange Commission (the SEC) website at www.sec.gov. In addition, the financial statements of the Fidelity Central Funds which contain the significant accounting policies (including investment valuation policies) of those funds, which are not covered by the Fund's Report of Independent Registered Public Accounting Firm, are available on the SEC website or upon request.
3. Significant Accounting Policies.
The Fund is an investment company and applies the accounting and reporting guidance of the Financial Accounting Standards Board (FASB) Accounting Standards Codification Topic 946 Financial Services – Investments Companies. The financial statements have been prepared in conformity with accounting principles generally accepted in the United States of America (GAAP), which require management to make certain estimates and assumptions at the date of the financial statements. Actual results could differ from those estimates. Subsequent events, if any, through the date that the financial statements were issued have been evaluated in the preparation of the financial statements. The following summarizes the significant accounting policies of the Fund:
Investment Valuation. Investments are valued as of 4:00 p.m. Eastern time on the last calendar day of the period. The Board of Trustees (the Board) has delegated the day to day responsibility for the valuation of the Fund's investments to the Fair Value Committee (the Committee) established by the Fund's investment adviser. In accordance with valuation policies and procedures approved by the Board, the Fund attempts to obtain prices from one or more third party pricing vendors or brokers to value its investments. When current market prices, quotations or currency exchange rates are not readily available or reliable, investments will be fair valued in good faith by the Committee, in accordance with procedures adopted by the Board. Factors used in determining fair value vary by investment type and may include market or investment specific events, changes in interest rates and credit quality. The frequency with which these procedures are used cannot be predicted and they may be utilized to a significant extent. The Committee oversees the Fund's valuation policies and procedures and reports to the Board on the Committee's activities and fair value determinations. The Board monitors the appropriateness of the procedures used in valuing the Fund's investments and ratifies the fair value determinations of the Committee.
The Fund categorizes the inputs to valuation techniques used to value its investments into a disclosure hierarchy consisting of three levels as shown below:
- Level 1 – quoted prices in active markets for identical investments
- Level 2 – other significant observable inputs (including quoted prices for similar investments, interest rates, prepayment speeds, etc.)
- Level 3 – unobservable inputs (including the Fund's own assumptions based on the best information available)
Valuation techniques used to value the Fund's investments by major category are as follows:
Equity securities, including restricted securities, for which market quotations are readily available, are valued at the last reported sale price or official closing price as reported by a third party pricing vendor on the primary market or exchange on which they are traded and are categorized as Level 1 in the hierarchy. In the event there were no sales during the day or closing prices are not available, securities are valued at the last quoted bid price or may be valued using the last available price and are generally categorized as Level 2 in the hierarchy. For foreign equity securities, when market or security specific events arise, comparisons to the valuation of American Depositary Receipts (ADRs), futures contracts, Exchange-Traded Funds (ETFs) and certain indexes as well as quoted prices for similar securities may be used and would be categorized as Level 2 in the hierarchy. For equity securities, including restricted securities, where observable inputs are limited, assumptions about market activity and risk are used and these securities may be categorized as Level 3 in the hierarchy. Equity securities, including restricted securities, for which observable inputs are not available are valued using alternate valuation approaches, including the market approach and the income approach and are categorized as Level 3 in the hierarchy. The market approach generally consists of using comparable market transactions while the income approach generally consists of using the net present value of estimated future cash flows, adjusted as appropriate for liquidity, credit, market and/or other risk factors.
Debt securities, including restricted securities, are valued based on evaluated prices received from third party pricing vendors or from brokers who make markets in such securities. Corporate bonds, bank notes, bank loan obligations, municipal securities, preferred securities and U.S. government and government agency obligations are valued by pricing vendors who utilize matrix pricing which considers yield or price of bonds of comparable quality, coupon, maturity and type or by broker-supplied prices. Asset backed securities, collateralized mortgage obligations and commercial mortgage securities are valued by pricing vendors who utilize matrix pricing which considers prepayment speed assumptions, attributes of the collateral, yield or price of bonds of comparable quality, coupon, maturity and type or by broker-supplied prices. When independent prices are unavailable or unreliable, debt securities may be valued utilizing pricing methodologies which consider similar factors that would be used by third party pricing vendors. Debt securities are generally categorized as Level 2 in the hierarchy but may be Level 3 depending on the circumstances.
Futures contracts are valued at the settlement price established each day by the board of trade or exchange on which they are traded and are categorized as Level 1 in the hierarchy. Investments in open-end mutual funds, including the Fidelity Central Funds, are valued at their closing net asset value (NAV) each business day and are categorized as Level 1 in the hierarchy. Short-term securities with remaining maturities of sixty days or less may be valued at amortized cost, which approximates fair value, and are categorized as Level 2 in the hierarchy.
The following provides information on Level 3 securities held by the Fund that were valued at period end based on unobservable inputs. These amounts exclude valuations provided by a broker.
| Asset Type | Fair Value | Valuation Technique(s) | Unobservable Input | Amount or Range/Weighted Average | Impact to Valuation from an Increase in Input(a) |
| Corporate Bonds | $0 | Recovery value | Recovery value | 0.0% | Increase |
| Equities | $597,597 | Recovery value | Recovery value | 0.0% | Increase |
| | | Market comparable | Enterprise value/Sales multiple (EV/S) | 1.2 - 8.8 / 3.3 | Increase |
| | | | Transaction price | $9.15 | Increase |
| | | | Enterprise value/EBITDA multiple (EV/EBITDA) | 3.6 - 5.8 / 5.4 | Increase |
| | | | Liquidity preference | $19.60 - $45.76 / $27.72 | Increase |
| | | | Discount rate | 6.0% - 60.0% / 21.1% | Decrease |
| | | | Discount for lack of marketability | 10.0% - 25.0% / 10.0% | Decrease |
| | | | Proxy discount | 0.6% | Decrease |
| | | | Premium rate | 29.0% | Increase |
| | | Book value | Book value multiple | 1.0 | Increase |
| | | Market Approach | Transaction price | $0.00 - $548.17 / $83.34 | Increase |
| Asset-Backed Securities | $1,015 | Discount cash flow | Spread | 3.3% | Decrease |
| Commercial Mortgage Securities | $0 | Expected distribution | Recovery rate | 0.0% | Increase |
| Bank Loan Obligations | $1,992 | Market comparable | Enterprise value/EBITDA multiple (EV/EBITDA) | 6.5 | Increase |
| | | | Discount for lack of marketability | 15.0% | Decrease |
| Other | $11 | Recovery value | Recovery value | 1.0% | Increase |
(a) Represents the directional change in the fair value of the Level 3 investments that could have resulted from an increase in the corresponding input as of period end. A decrease to the unobservable input would have had the opposite effect. Significant changes in these inputs may have resulted in a significantly higher or lower fair value measurement at period end.
Changes in valuation techniques may result in transfers in or out of an assigned level within the disclosure hierarchy. The aggregate value of investments by input level as of February 28, 2019, as well as a roll forward of Level 3 investments, is included at the end of the Fund's Schedule of Investments.
Foreign Currency. The Fund may use foreign currency contracts to facilitate transactions in foreign-denominated securities. Gains and losses from these transactions may arise from changes in the value of the foreign currency or if the counterparties do not perform under the contracts' terms.
Foreign-denominated assets, including investment securities, and liabilities are translated into U.S. dollars at the exchange rates at period end. Purchases and sales of investment securities, income and dividends received and expenses denominated in foreign currencies are translated into U.S. dollars at the exchange rate in effect on the transaction date.
The effects of exchange rate fluctuations on investments are included with the net realized and unrealized gain (loss) on investment securities. Other foreign currency transactions resulting in realized and unrealized gain (loss) are disclosed separately.
Investment Transactions and Income. For financial reporting purposes, the Fund's investment holdings and NAV include trades executed through the end of the last business day of the period. The NAV per share for processing shareholder transactions is calculated as of the close of business of the New York Stock Exchange (NYSE), normally 4:00 p.m. Eastern time and includes trades executed through the end of the prior business day. Gains and losses on securities sold are determined on the basis of identified cost and include proceeds received from litigation. Dividend income is recorded on the ex-dividend date, except for certain dividends from foreign securities where the ex-dividend date may have passed, which are recorded as soon as the Fund is informed of the ex-dividend date. Non-cash dividends included in dividend income, if any, are recorded at the fair market value of the securities received. Income and capital gain distributions from Fidelity Central Funds, if any, are recorded on the ex-dividend date. Certain distributions received by the Fund represent a return of capital or capital gain. The Fund determines the components of these distributions subsequent to the ex-dividend date, based upon receipt of tax filings or other correspondence relating to the underlying investment. These distributions are recorded as a reduction of cost of investments and/or as a realized gain. Interest income is accrued as earned and includes coupon interest and amortization of premium and accretion of discount on debt securities as applicable. Paid in Kind (PIK) income is recorded at the fair market value of the securities received. The principal amount on inflation-indexed securities is periodically adjusted to the rate of inflation and interest is accrued based on the principal amount. The adjustments to principal due to inflation are reflected as increases or decreases to Interest in the accompanying Statement of Operations. Investment income is recorded net of foreign taxes withheld where recovery of such taxes is uncertain. Debt obligations may be placed on non-accrual status and related interest income may be reduced by ceasing current accruals and writing off interest receivables when the collection of all or a portion of interest has become doubtful based on consistently applied procedures. A debt obligation is removed from non-accrual status when the issuer resumes interest payments or when collectability of interest is reasonably assured.
Class Allocations and Expenses. Investment income, realized and unrealized capital gains and losses, common expenses of the Fund, and certain fund-level expense reductions, if any, are allocated daily on a pro-rata basis to each class based on the relative net assets of each class to the total net assets of the Fund. Each class differs with respect to transfer agent fees incurred. Certain expense reductions may also differ by class. For the reporting period, the allocated portion of income and expenses to each class as a percent of its average net assets may vary due to the timing of recording these transactions in relation to fluctuating net assets of the classes. Expenses directly attributable to a fund are charged to that fund. Expenses attributable to more than one fund are allocated among the respective funds on the basis of relative net assets or other appropriate methods. Expense estimates are accrued in the period to which they relate and adjustments are made when actual amounts are known.
Deferred Trustee Compensation. Under a Deferred Compensation Plan (the Plan) for the Fund, certain independent Trustees have elected to defer receipt of a portion of their annual compensation. Deferred amounts are invested in a cross-section of Fidelity funds, are marked-to-market and remain in the Fund until distributed in accordance with the Plan. The investment of deferred amounts and the offsetting payable to the Trustees of $1,123 are included in the accompanying Statement of Assets and Liabilities in other receivables and other payables and accrued expenses, respectively.
Income Tax Information and Distributions to Shareholders. Each year, the Fund intends to qualify as a regulated investment company under Subchapter M of the Internal Revenue Code, including distributing substantially all of its taxable income and realized gains. As a result, no provision for U.S. Federal income taxes is required. The Fund files a U.S. federal tax return, in addition to state and local tax returns as required. The Fund's federal income tax returns are subject to examination by the Internal Revenue Service (IRS) for a period of three fiscal years after they are filed. State and local tax returns may be subject to examination for an additional fiscal year depending on the jurisdiction. Foreign taxes are provided for based on the Fund's understanding of the tax rules and rates that exist in the foreign markets in which it invests. The Fund is subject to a tax imposed on capital gains by certain countries in which it invests. An estimated deferred tax liability for net unrealized appreciation on the applicable securities is included in Other payables and accrued expenses on the Statement of Assets & Liabilities.
Distributions are declared and recorded on the ex-dividend date. Income and capital gain distributions are declared separately for each class. Income and capital gain distributions are determined in accordance with income tax regulations, which may differ from GAAP.
Capital accounts within the financial statements are adjusted for permanent book-tax differences. These adjustments have no impact on net assets or the results of operations. Capital accounts are not adjusted for temporary book-tax differences which will reverse in a subsequent period.
Book-tax differences are primarily due to foreign currency transactions, market discount, contingent interest, deferred trustees compensation, partnerships (including allocations from Fidelity Central Funds), equity-debt classifications and losses deferred due to wash sales.
As of period end, the cost and unrealized appreciation (depreciation) in securities, and derivatives if applicable, for federal income tax purposes were as follows:
| Gross unrealized appreciation | $4,806,266 |
| Gross unrealized depreciation | (570,273) |
| Net unrealized appreciation (depreciation) | $4,235,993 |
| Tax cost | $22,976,718 |
Repurchase Agreements. Pursuant to an Exemptive Order issued by the SEC, the Fund along with other registered investment companies having management contracts with Fidelity Management & Research Company (FMR), or other affiliated entities of FMR, are permitted to transfer uninvested cash balances into joint trading accounts which are then invested in repurchase agreements. The Fund may also invest directly with institutions in repurchase agreements. Repurchase agreements may be collateralized by government or non-government securities. Upon settlement date, collateral is held in segregated accounts with custodian banks and may be obtained in the event of a default of the counterparty. The Fund monitors, on a daily basis, the value of the collateral to ensure it is at least equal to the principal amount of the repurchase agreement (including accrued interest). In the event of a default by the counterparty, realization of the collateral proceeds could be delayed, during which time the value of the collateral may decline.
Delayed Delivery Transactions and When-Issued Securities. During the period, the Fund transacted in securities on a delayed delivery or when-issued basis. Payment and delivery may take place after the customary settlement period for that security. The price of the underlying securities and the date when the securities will be delivered and paid for are fixed at the time the transaction is negotiated. The securities purchased on a delayed delivery or when-issued basis are identified as such in the Fund's Schedule of Investments. Losses may arise due to changes in the value of the underlying securities or if the counterparty does not perform under the contract's terms, or if the issuer does not issue the securities due to political, economic, or other factors.
Restricted Securities. The Fund may invest in securities that are subject to legal or contractual restrictions on resale. These securities generally may be resold in transactions exempt from registration or to the public if the securities are registered. Disposal of these securities may involve time-consuming negotiations and expense, and prompt sale at an acceptable price may be difficult. Information regarding restricted securities is included at the end of the Fund's Schedule of Investments.
Loans and Other Direct Debt Instruments. The Fund invests in direct debt instruments which are interests in amounts owed to lenders by corporate or other borrowers. These instruments may be in the form of loans, trade claims or other receivables and may include standby financing commitments such as revolving credit facilities that obligate the Fund to supply additional cash to the borrower on demand. Loans may be acquired through assignment or participation. The Fund did not have any unfunded loan commitments, which are contractual obligations for future funding, at period end.
Consolidated Subsidiary. The Fund invests in certain investments through a wholly-owned subsidiary ("Subsidiary"), which may be subject to federal and state taxes upon disposition.
As of period end, the Fund held an investment of $176,015 in these Subsidiaries, representing 0.66% of the Fund's net assets. The financial statements have been consolidated and include accounts of the Fund and each Subsidiary. Accordingly, all inter-company transactions and balances have been eliminated.
Any cash held by the Subsidiaries is restricted as to its use and is presented as Restricted cash in the Statement of Assets and Liabilities.
New Rule Issuance. During August 2018, the U.S. Securities and Exchange Commission issued Final Rule Release No. 33-10532, Disclosure Update and Simplification. This Final Rule includes amendments specific to registered investment companies that are intended to eliminate overlap in disclosure requirements between Regulation S-X and GAAP. In accordance with these amendments, certain line-items in the Fund's financial statements have been combined or removed for the current period as outlined in the table below.
| Financial Statement | Current Line-Item Presentation (As Applicable) | Prior Line-Item Presentation (As Applicable) |
| Statement of Assets and Liabilities | Total distributable earnings (loss) | Undistributed/Distributions in excess of/Accumulated net investment income (loss)
Accumulated/Undistributed net realized gain (loss)
Net unrealized appreciation (depreciation) |
| Statement of Changes in Net Assets | N/A - removed | Undistributed/Distributions in excess of/Accumulated net investment income (loss) end of period |
| Statement of Changes in Net Assets | Distributions to shareholders | Distributions to shareholders from net investment income
Distributions to shareholders from net realized gain |
| Distributions to Shareholders Note to Financial Statements | Distributions to shareholders | Distributions to shareholders from net investment income
Distributions to shareholders from net realized gain |
4. Derivative Instruments.
Risk Exposures and the Use of Derivative Instruments. The Fund's investment objective allows the Fund to enter into various types of derivative contracts, including futures contracts. Derivatives are investments whose value is primarily derived from underlying assets, indices or reference rates and may be transacted on an exchange or over-the-counter (OTC). Derivatives may involve a future commitment to buy or sell a specified asset based on specified terms, to exchange future cash flows at periodic intervals based on a notional principal amount, or for one party to make one or more payments upon the occurrence of specified events in exchange for periodic payments from the other party.
The Fund used derivatives to increase returns and to manage exposure to certain risks as defined below. The success of any strategy involving derivatives depends on analysis of numerous economic factors, and if the strategies for investment do not work as intended, the Fund may not achieve its objectives.
The Fund's use of derivatives increased or decreased its exposure to the following risk:
| Equity Risk | Equity risk relates to the fluctuations in the value of financial instruments as a result of changes in market prices (other than those arising from interest rate risk or foreign exchange risk), whether caused by factors specific to an individual investment, its issuer, or all factors affecting all instruments traded in a market or market segment.
|
The Fund is also exposed to additional risks from investing in derivatives, such as liquidity risk and counterparty credit risk. Liquidity risk is the risk that the Fund will be unable to close out the derivative in the open market in a timely manner. Counterparty credit risk is the risk that the counterparty will not be able to fulfill its obligation to the Fund. Counterparty credit risk related to exchange-traded futures contracts may be mitigated by the protection provided by the exchange on which they trade.
Investing in derivatives may involve greater risks than investing in the underlying assets directly and, to varying degrees, may involve risk of loss in excess of any initial investment and collateral received and amounts recognized in the Statement of Assets and Liabilities. In addition, there may be the risk that the change in value of the derivative contract does not correspond to the change in value of the underlying instrument.
Futures Contracts. A futures contract is an agreement between two parties to buy or sell a specified underlying instrument for a fixed price at a specified future date. The Fund used futures contracts to manage its exposure to the stock market.
Upon entering into a futures contract, a fund is required to deposit either cash or securities (initial margin) with a clearing broker in an amount equal to a certain percentage of the face value of the contract. Futures contracts are marked-to-market daily and subsequent daily payments (variation margin) are made or received by a fund depending on the daily fluctuations in the value of the futures contracts and are recorded as unrealized appreciation or (depreciation). This receivable and/or payable, if any, is included in daily variation margin on futures contracts in the Statement of Assets and Liabilities. Realized gain or (loss) is recorded upon the expiration or closing of a futures contract. The net realized gain (loss) and change in net unrealized appreciation (depreciation) on futures contracts during the period is presented in the Statement of Operations.
Any open futures contracts at period end are presented in the Schedule of Investments under the caption "Futures Contracts". The notional amount at value reflects each contract's exposure to the underlying instrument or index at period end and is representative of volume of activity during the period. Securities deposited to meet initial margin requirements are identified in the Schedule of Investments.
5. Purchases and Sales of Investments.
Purchases and sales of securities (including the Fixed-Income Central Funds), other than short-term securities and U.S. government securities, aggregated $14,775,492 and $14,403,139, respectively.
6. Fees and Other Transactions with Affiliates.
Management Fee. Fidelity Management & Research Company (the investment adviser) and its affiliates provide the Fund with investment management related services for which the Fund pays a monthly management fee. The management fee is the sum of an individual fund fee rate that is based on an annual rate of .15% of the Fund's average net assets and an annualized group fee rate that averaged .24% during the period. The group fee rate is based upon the average net assets of all the mutual funds advised by the investment adviser, including any mutual funds previously advised by the investment adviser that are currently advised by Fidelity SelectCo, LLC, an affiliate of the investment adviser. The group fee rate decreases as assets under management increase and increases as assets under management decrease. For the reporting period, the total annualized management fee rate was .39% of the Fund's average net assets.
Transfer Agent Fees. Fidelity Investments Institutional Operations Company, Inc., (FIIOC), an affiliate of the investment adviser, is the transfer, dividend disbursing and shareholder servicing agent for each class of the Fund. FIIOC receives account fees and asset-based fees that vary according to the account size and type of account of the shareholders of Puritan, except for Class K. FIIOC receives an asset-based fee of Class K's average net assets. FIIOC pays for typesetting, printing and mailing of shareholder reports, except proxy statements.
For the period, transfer agent fees for each class were as follows:
| | Amount | % of Class-Level Average Net Assets(a) |
| Puritan | $14,117 | .13 |
| Class K | 1,390 | .05 |
| | $15,507 | |
(a) Annualized
Accounting and Security Lending Fees. Fidelity Service Company, Inc. (FSC), an affiliate of the investment adviser, maintains the Fund's accounting records. The accounting fee is based on the level of average net assets for each month. Under a separate contract, FSC administers the security lending program. The security lending fee is based on the number and duration of lending transactions. For the period, the fees were equivalent to an annualized rate of .01%.
Brokerage Commissions. The Fund placed a portion of its portfolio transactions with brokerage firms which are affiliates of the investment adviser. Brokerage commissions are included in net realized gain (loss) and change in net unrealized appreciation (depreciation) in the Statement of Operations. The commissions paid to these affiliated firms were $311 for the period.
Interfund Trades. The Fund may purchase from or sell securities to other Fidelity Funds under procedures adopted by the Board. The procedures have been designed to ensure these interfund trades are executed in accordance with Rule 17a-7 of the 1940 Act. Interfund trades are included within the respective purchases and sales amounts shown in the Purchases and Sales of Investments note.
Other. During the period, the investment adviser reimbursed the Fund for certain losses in the amount of $63.
Prior Fiscal Year Exchanges In-Kind. During the prior period, the Fund completed an exchange in-kind with Fidelity Mortgage Backed Securities Central Fund. The Fund delivered investments, including accrued interest valued at $74,989 (which included $19 of unrealized depreciation), in exchange for 695 shares of Fidelity Mortgage Backed Securities Central Fund. The Fund generally did not recognize gain or loss for federal income tax purposes.
7. Committed Line of Credit.
The Fund participates with other funds managed by the investment adviser or an affiliate in a $4.25 billion credit facility (the "line of credit") to be utilized for temporary or emergency purposes to fund shareholder redemptions or for other short-term liquidity purposes. The Fund has agreed to pay commitment fees on its pro-rata portion of the line of credit, which amounted to $37 and is reflected in Miscellaneous expenses on the Statement of Operations. During the period, the Fund did not borrow on this line of credit.
8. Security Lending.
The Fund lends portfolio securities through a lending agent from time to time in order to earn additional income. For equity securities, a lending agent is used and may loan securities to certain qualified borrowers, including Fidelity Capital Markets (FCM), a broker-dealer affiliated with the Fund. On the settlement date of the loan, the Fund receives collateral (in the form of U.S. Treasury obligations, letters of credit and/or cash) against the loaned securities and maintains collateral in an amount not less than 100% of the market value of the loaned securities during the period of the loan. The market value of the loaned securities is determined at the close of business of the Fund and any additional required collateral is delivered to the Fund on the next business day. The Fund or borrower may terminate the loan at any time, and if the borrower defaults on its obligation to return the securities loaned because of insolvency or other reasons, the Fund may apply collateral received from the borrower against the obligation. The Fund may experience delays and costs in recovering the securities loaned. Any cash collateral received is maintained at the Fund's custodian and/or invested in cash equivalents and/or the Fidelity Securities Lending Cash Central Fund. The value of loaned securities and cash collateral at period end are disclosed on the Fund's Statement of Assets and Liabilities. The value of securities loaned to FCM at period end was $691. Security lending income represents the income earned on investing cash collateral, less rebates paid to borrowers and any lending agent fees associated with the loan, plus any premium payments received for lending certain types of securities. Security lending income is presented in the Statement of Operations as a component of interest income. Total security lending income during the period, presented in the Statement of Operations as a component of interest income, amounted to $11. Net income from the Fidelity Securities Lending Cash Central Fund during the period, presented in the Statement of Operations as a component of income from Fidelity Central Funds, amounted to $690 (including $61 from securities loaned to FCM).
9. Expense Reductions.
Commissions paid to certain brokers with whom the investment adviser, or its affiliates, places trades on behalf of the Fund include an amount in addition to trade execution, which may be rebated back to the Fund to offset certain expenses. This amount totaled $260 for the period. In addition, through arrangements with the Fund's custodian credits realized as a result of certain uninvested cash balances were used to reduce the Fund's expenses. During the period, these credits reduced the Fund's custody expenses by $18. During the period, credits reduced each class' transfer agent expense as noted in the table below.
| | Transfer Agent expense reduction |
| Puritan | $14 |
In addition, during the period the investment adviser reimbursed and/or waived a portion of fund-level operating expenses in the amount of $104.
10. Distributions to Shareholders.
Distributions to shareholders of each class were as follows:
| | Six months ended
February 28, 2019 | Year ended
August 31, 2018 |
| Distributions to shareholders | | |
| Puritan | $2,642,810 | $– |
| Class K | 758,212 | – |
| Total | $3,401,022 | $– |
| From net investment income | | |
| Puritan | $– | $284,446 |
| Class K | – | 90,410 |
| Total | $– | $374,856 |
| From net realized gain | | |
| Puritan | $– | $586,678 |
| Class K | – | 179,764 |
| Total | $– | $766,442 |
11. Share Transactions.
Share transactions for each class were as follows and may contain automatic conversions between classes or exchanges between affiliated funds:
| | Shares | Shares | Dollars | Dollars |
| | Six months ended February 28, 2019 | Year ended August 31, 2018 | Six months ended February 28, 2019 | Year ended August 31, 2018 |
| Puritan | | | | |
| Shares sold | 56,218 | 116,115 | $1,244,199 | $2,767,345 |
| Reinvestment of distributions | 117,378 | 35,650 | 2,505,815 | 823,587 |
| Shares redeemed | (89,233) | (120,147) | (1,905,387) | (2,852,632) |
| Net increase (decrease) | 84,363 | 31,618 | $1,844,627 | $738,300 |
| Class K | | | | |
| Shares sold | 17,549 | 38,459 | $384,393 | $912,229 |
| Reinvestment of distributions | 35,544 | 11,704 | 758,168 | 270,174 |
| Shares redeemed | (43,347) | (57,431) | (923,123) | (1,360,988) |
| Net increase (decrease) | 9,746 | (7,268) | $219,438 | $(178,585) |
12. Other.
The Fund's organizational documents provide former and current trustees and officers with a limited indemnification against liabilities arising in connection with the performance of their duties to the Fund. In the normal course of business, the Fund may also enter into contracts that provide general indemnifications. The Fund's maximum exposure under these arrangements is unknown as this would be dependent on future claims that may be made against the Fund. The risk of material loss from such claims is considered remote.
Shareholder Expense Example
As a shareholder of the Fund, you incur two types of costs: (1) transaction costs and (2) ongoing costs, including management fees and other Fund expenses. This Example is intended to help you understand your ongoing costs (in dollars) of investing in the Fund and to compare these costs with the ongoing costs of investing in other mutual funds.
The Example is based on an investment of $1,000 invested at the beginning of the period and held for the entire period (September 1, 2018 to February 28, 2019).
Actual Expenses
The first line of the accompanying table for each class of the Fund provides information about actual account values and actual expenses. You may use the information in this line, together with the amount you invested, to estimate the expenses that you paid over the period. Simply divide your account value by $1,000.00 (for example, an $8,600 account value divided by $1,000.00 = 8.6), then multiply the result by the number in the first line for a class of the Fund under the heading entitled "Expenses Paid During Period" to estimate the expenses you paid on your account during this period. In addition, the Fund, as a shareholder in the underlying Fidelity Central Funds, will indirectly bear its pro-rata share of the fees and expenses incurred by the underlying Fidelity Central Funds. These fees and expenses are not included in the Fund's annualized expense ratio used to calculate the expense estimate in the table below.
Hypothetical Example for Comparison Purposes
The second line of the accompanying table for each class of the Fund provides information about hypothetical account values and hypothetical expenses based on a Class' actual expense ratio and an assumed rate of return of 5% per year before expenses, which is not the Class' actual return. The hypothetical account values and expenses may not be used to estimate the actual ending account balance or expenses you paid for the period. You may use this information to compare the ongoing costs of investing in the Fund and other funds. To do so, compare this 5% hypothetical example with the 5% hypothetical examples that appear in the shareholder reports of the other funds. In addition, the Fund, as a shareholder in the underlying Fidelity Central Funds, will indirectly bear its pro-rata share of the fees and expenses incurred by the underlying Fidelity Central Funds. These fees and expenses are not included in the Fund's annualized expense ratio used to calculate the expense estimate in the table below.
Please note that the expenses shown in the table are meant to highlight your ongoing costs only and do not reflect any transaction costs. Therefore, the second line of the table is useful in comparing ongoing costs only, and will not help you determine the relative total costs of owning different funds.
| | Annualized Expense Ratio-A | Beginning
Account Value
September 1, 2018 | Ending
Account Value
February 28, 2019 | Expenses Paid
During Period-B
September 1, 2018
to February 28, 2019 |
| Puritan | .54% | | | |
| Actual | | $1,000.00 | $958.40 | $2.62 |
| Hypothetical-C | | $1,000.00 | $1,022.12 | $2.71 |
| Class K | .45% | | | |
| Actual | | $1,000.00 | $958.40 | $2.19 |
| Hypothetical-C | | $1,000.00 | $1,022.56 | $2.26 |
A Annualized expense ratio reflects expenses net of applicable fee waivers.
B Expenses are equal to each Class' annualized expense ratio, multiplied by the average account value over the period, multiplied by 181/365 (to reflect the one-half year period). The fees and expenses of the underlying Fidelity Central Funds in which the Fund invests are not included in each Class' annualized expense ratio. In addition to the expenses noted above, the Fund also indirectly bears its proportional share of the expenses of the underlying Fidelity Central Funds. Annualized expenses of the underlying non-money market Fidelity Central Funds as of their most recent fiscal half year were less than .005%.
C 5% return per year before expenses
Board Approval of Investment Advisory Contracts and Management Fees
Fidelity Puritan Fund
Each year, the Board of Trustees, including the Independent Trustees (together, the Board), votes on the renewal of the management contract with Fidelity Management & Research Company (FMR) and the sub-advisory agreements (together, the Advisory Contracts) for the fund. FMR and the sub-advisers are referred to herein as the Investment Advisers. The Board, assisted by the advice of fund counsel and Independent Trustees' counsel, requests and considers a broad range of information relevant to the renewal of the Advisory Contracts throughout the year.
The Board meets regularly and, at each of its meetings, covers an extensive agenda of topics and materials and considers factors that are relevant to its annual consideration of the renewal of the fund's Advisory Contracts, including the services and support provided to the fund and its shareholders. The Board has established various standing committees (Committees), each composed of and chaired by Independent Trustees with varying backgrounds, to which the Board has assigned specific subject matter responsibilities in order to enhance effective decision-making by the Board. The Board, acting directly and through its Committees, requests and receives information concerning the annual consideration of the renewal of the fund's Advisory Contracts. The Board also meets as needed to review matters specifically related to the Board's annual consideration of the renewal of the Advisory Contracts. Members of the Board may also meet with trustees of other Fidelity funds through joint ad hoc committees to discuss certain matters relevant to all of the Fidelity funds.
At its January 2019 meeting, the Board unanimously determined to renew the fund's Advisory Contracts. In reaching its determination, the Board considered all factors it believed relevant, including (i) the nature, extent, and quality of the services to be provided to the fund and its shareholders (including the investment performance of the fund); (ii) the competitiveness of the fund's management fee and total expense ratio relative to peer funds; (iii) the total costs of the services to be provided by and the profits to be realized by Fidelity from its relationships with the fund; and (iv) the extent to which, if any, economies of scale exist and would be realized as the fund grows, and whether any economies of scale are appropriately shared with fund shareholders.
In considering whether to renew the Advisory Contracts for the fund, the Board reached a determination, with the assistance of fund counsel and Independent Trustees' counsel and through the exercise of its business judgment, that the renewal of the Advisory Contracts was in the best interests of the fund and its shareholders and that the compensation payable under the Advisory Contracts was fair and reasonable. The Board's decision to renew the Advisory Contracts was not based on any single factor, but rather was based on a comprehensive consideration of all the information provided to the Board at its meetings throughout the year. The Board, in reaching its determination to renew the Advisory Contracts, was aware that shareholders of the fund have a broad range of investment choices available to them, including a wide choice among funds offered by Fidelity's competitors, and that the fund's shareholders, who have the opportunity to review and weigh the disclosure provided by the fund in its prospectus and other public disclosures, have chosen to invest in this fund, which is part of the Fidelity family of funds.
Nature, Extent, and Quality of Services Provided. The Board considered Fidelity's staffing as it relates to the fund, including the backgrounds of investment personnel of Fidelity, and also considered the fund's investment objective, strategies, and related investment philosophy. The Independent Trustees also had discussions with senior management of Fidelity's investment operations and investment groups. The Board considered the structure of the investment personnel compensation program and whether this structure provides appropriate incentives to act in the best interests of the fund. Additionally, the Board considered the portfolio managers' investments, if any, in the funds that they manage.
Resources Dedicated to Investment Management and Support Services. The Board and the Fund Oversight and Research Committees reviewed the general qualifications and capabilities of Fidelity's investment staff, including its size, education, experience, and resources, as well as Fidelity's approach to recruiting, training, managing, and compensating investment personnel. The Board noted that Fidelity has continued to increase the resources devoted to non-U.S. offices, including expansion of Fidelity's global investment organization. The Board also noted that Fidelity's analysts have extensive resources, tools and capabilities that allow them to conduct sophisticated quantitative and fundamental analysis, as well as credit analysis of issuers, counterparties and guarantors. Further, the Board considered that Fidelity's investment professionals have sufficient access to global information and data so as to provide competitive investment results over time, and that those professionals also have access to sophisticated tools that permit them to assess portfolio construction and risk and performance attribution characteristics continuously, as well as to transmit new information and research conclusions rapidly around the world. Additionally, in its deliberations, the Board considered Fidelity's trading, risk management, compliance, and technology and operations capabilities and resources, which are integral parts of the investment management process.
Shareholder and Administrative Services. The Board considered (i) the nature, extent, quality, and cost of advisory, administrative, and shareholder services performed by the Investment Advisers and their affiliates under the Advisory Contracts and under separate agreements covering transfer agency, pricing and bookkeeping, and securities lending services for the fund; (ii) the nature and extent of the supervision of third party service providers, principally custodians, subcustodians, and pricing vendors; and (iii) the resources devoted to, and the record of compliance with, the fund's compliance policies and procedures. The Board also reviewed the allocation of fund brokerage, including allocations to brokers affiliated with the Investment Advisers, the use of brokerage commissions to pay fund expenses, and the use of "soft" commission dollars to pay for research services.
The Board noted that the growth of fund assets over time across the complex allows Fidelity to reinvest in the development of services designed to enhance the value and convenience of the Fidelity funds as investment vehicles. These services include 24-hour access to account information and market information through telephone representatives and over the Internet, investor education materials and asset allocation tools, and the expanded availability of Fidelity Investor Centers.
The Board noted that it and the boards of certain other Fidelity funds had formed an ad hoc Committee on Transfer Agency Fees to review the variety of transfer agency fee structures throughout the industry and Fidelity's competitive positioning with respect to industry participants.
Investment in a Large Fund Family. The Board considered the benefits to shareholders of investing in a Fidelity fund, including the benefits of investing in a fund that is part of a large family of funds offering a variety of investment disciplines and providing a large variety of mutual fund investor services. The Board noted that Fidelity had taken, or had made recommendations that resulted in the Fidelity funds taking, a number of actions over the previous year that benefited particular funds, including: (i) continuing to dedicate additional resources to Fidelity's investment research process, which includes meetings with management of issuers of securities in which the funds invest, and to the support of the senior management team that oversees asset management; (ii) continuing efforts to enhance Fidelity's global research capabilities; (iii) launching new funds and making other enhancements to meet client needs; (iv) launching new share classes of existing funds; (v) eliminating purchase minimums and broadening eligibility requirements for certain funds and share classes; (vi) reducing management fees and total expenses for certain growth equity funds and index funds; (vii) lowering expense caps for certain existing funds and classes, and converting certain voluntary expense caps to contractual caps, to reduce expenses borne by shareholders; (viii) eliminating short-term redemption fees for funds that had such fees; (ix) rationalizing product lines and gaining increased efficiencies from fund mergers and share class consolidations; (x) continuing to develop, acquire and implement systems and technology to improve services to the funds and shareholders, strengthen information security, and increase efficiency; and (xi) continuing to implement enhancements to further strengthen Fidelity's product line to increase investors' probability of success in achieving their investment goals, including retirement income goals.
Investment Performance. The Board considered whether the fund has operated in accordance with its investment objective, as well as its record of compliance with its investment restrictions and its performance history. The fund had portfolio manager changes in July 2015 and June 2018. The Board will continue to monitor closely the fund's performance, taking into account the portfolio manager changes.
The Board took into account discussions that occur at Board meetings throughout the year with representatives of the Investment Advisers about fund investment performance. In this regard the Board noted that as part of regularly scheduled fund reviews and other reports to the Board on fund performance, the Board considers annualized return information for the fund for different time periods, measured against an appropriate securities market index ("benchmark index") and a peer group of funds with similar objectives ("peer group"), if any. In its evaluation of fund investment performance, the Board gave particular attention to information indicating changes in performance of certain Fidelity funds for specific time periods and discussed with the Investment Advisers the reasons for any overperformance or underperformance.
In addition to reviewing absolute and relative fund performance, the Independent Trustees periodically consider the appropriateness of fund performance metrics in evaluating the results achieved. In general, the Independent Trustees believe that fund performance should be evaluated based on net performance (after fees and expenses) of both the highest performing and lowest performing fund share classes, where applicable, compared to appropriate benchmark indices, over appropriate time periods that may include full market cycles, and compared to peer groups, as applicable, over the same periods, taking into account relevant factors including the following: general market conditions; issuer-specific information; and fund cash flows and other factors.
The Independent Trustees recognize that shareholders evaluate performance on a net basis over their own holding periods, for which one-, three-, and five-year periods are often used as a proxy. For this reason, the performance information reviewed by the Board also included net cumulative total return information for the fund and an appropriate benchmark index and peer group for the most recent one-, three-, and five-year periods ended June 30, 2018, as shown below. Returns are shown compared to the 25th percentile (top of box, 75% beaten) and 75th percentile (bottom of box, 25% beaten) of the peer universe.
Fidelity Puritan Fund
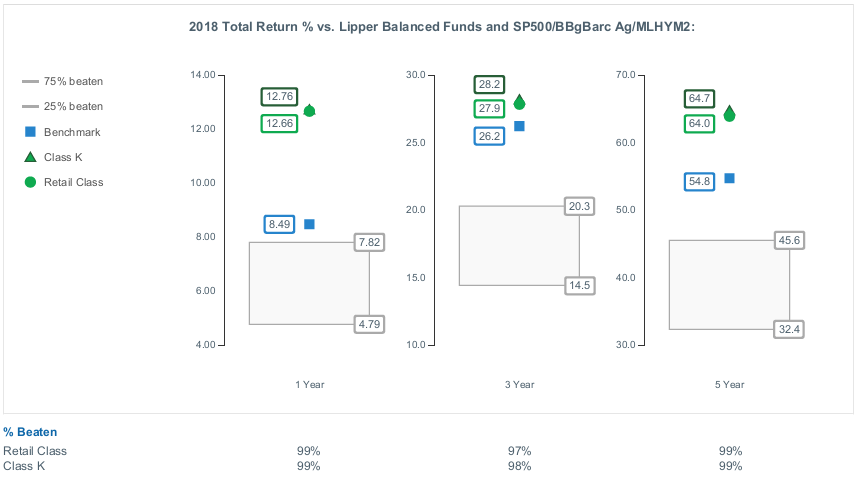
Based on its review, the Board concluded that the nature, extent, and quality of services provided to the fund under the Advisory Contracts should continue to benefit the shareholders of the fund.
Competitiveness of Management Fee and Total Expense Ratio. The Board considered the fund's management fee and total expense ratio compared to "mapped groups" of competitive funds and classes created for the purpose of facilitating the Trustees' competitive analysis of management fees and total expenses. Fidelity creates "mapped groups" by combining similar Lipper investment objective categories that have comparable investment mandates. Combining Lipper investment objective categories aids the Board's management fee and total expense ratio comparisons by broadening the competitive group used for comparison.
Management Fee. The Board considered two proprietary management fee comparisons for the 12-month periods (ended June 30 for 2018 and December 31 for prior periods) shown in basis points (BP) in the chart below. The group of Lipper funds used by the Board for management fee comparisons is referred to below as the "Total Mapped Group." The Total Mapped Group is broader than the Lipper peer group used by the Board for performance comparisons because the Total Mapped Group combines several Lipper investment objective categories while the Lipper peer group does not. The Total Mapped Group comparison focuses on a fund's standing in terms of gross management fees before expense reimbursements or caps relative to the total universe of funds with comparable investment mandates, regardless of whether their management fee structures also are comparable. Funds with comparable investment mandates offer exposure to similar types of securities. Funds with comparable management fee structures have similar management fee contractual arrangements (
e.g., flat rate charged for advisory services, all-inclusive fee rate,
etc.). "TMG %" represents the percentage of funds in the Total Mapped Group that had management fees that were lower than the fund's. For example, a hypothetical TMG % of 20% would mean that 80% of the funds in the Total Mapped Group had higher, and 20% had lower, management fees than the fund. The fund's actual TMG %s and the number of funds in the Total Mapped Group are in the chart below. The "Asset-Size Peer Group" (ASPG) comparison focuses on a fund's standing relative to a subset of non-Fidelity funds within the Total Mapped Group that are similar in size and management fee structure. For example, if a fund is in the first quartile of the ASPG, the fund's management fee ranks in the least expensive or lowest 25% of funds in the ASPG. The ASPG represents at least 15% of the funds in the Total Mapped Group with comparable asset size and management fee structures, subject to a minimum of 50 funds (or all funds in the Total Mapped Group if fewer than 50). Additional information, such as the ASPG quartile in which the fund's management fee rate ranked, is also included in the chart and was considered by the Board.
Fidelity Puritan Fund
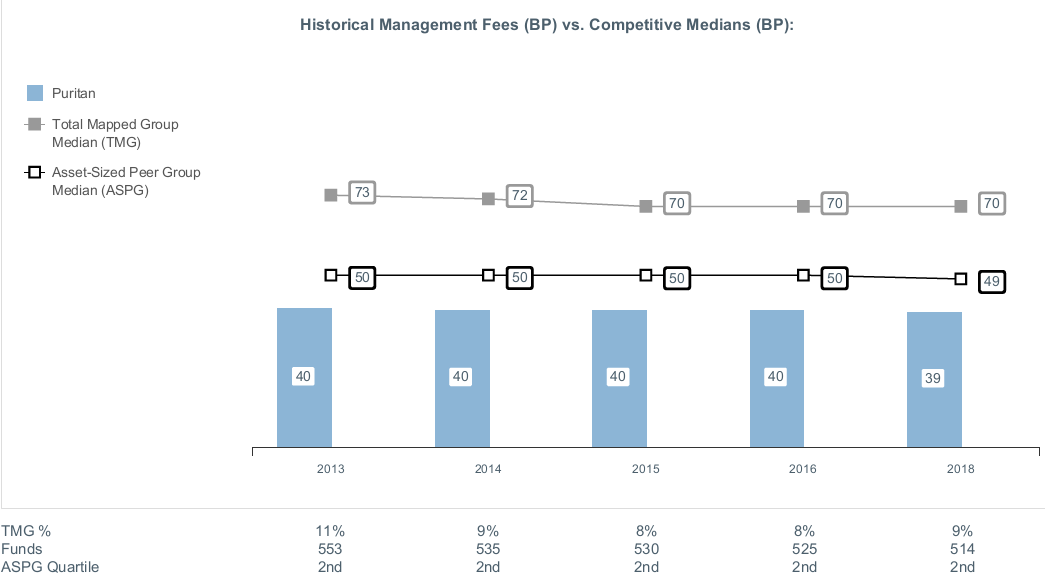
The Board noted that the fund's management fee rate ranked below the median of its Total Mapped Group and below the median of its ASPG for the 12-month period ended June 30, 2018.
The Board noted that it and the boards of other Fidelity funds formed an ad hoc Committee on Group Fee, which meets periodically, to conduct an in-depth review of the "group fee" component of the management fee of funds with such management fee structures. The Committee's focus included the mechanics of the group fee, the competitive landscape of group fee structures, Fidelity funds with no group fee component and investment products not included in group fee assets. The Board also considered that, for funds subject to the group fee, FMR agreed to voluntarily waive fees over a specified period of time in amounts designed to account for assets converted from certain funds to certain collective investment trusts.
The Board also noted that, in 2013, the ad hoc Committee on Management Fees was formed to conduct an in-depth review of the management fee rates of Fidelity's active equity mutual funds. The Committee focused on the following areas: (i) standard fee structures; (ii) research consumption and trading evolution; (iii) management fee competitiveness/profitability by category; and (iv) factors that drive institutional pricing.
Based on its review, the Board concluded that the fund's management fee is fair and reasonable in light of the services that the fund receives and the other factors considered.
Total Expense Ratio. In its review of each class's total expense ratio, the Board considered the fund's management fee rate as well as other fund or class expenses, as applicable, such as transfer agent fees, pricing and bookkeeping fees, and custodial, legal, and audit fees. The Board also noted that Fidelity may agree to waive fees and expenses from time to time, and the extent to which, if any, it has done so for the fund. As part of its review, the Board also considered the current and historical total expense ratios of each class of the fund compared to competitive fund median expenses. Each class of the fund is compared to those funds and classes in the Total Mapped Group (used by the Board for management fee comparisons) that have a similar sales load structure.
The Board noted that the total expense ratio of each class ranked below the competitive median for the 12-month period ended June 30, 2018.
Fees Charged to Other Fidelity Clients. The Board also considered Fidelity fee structures and other information with respect to clients of Fidelity, such as other funds advised or subadvised by Fidelity, pension plan clients, and other institutional clients with similar mandates. The Board noted that a joint ad hoc committee created by it and the boards of other Fidelity funds periodically reviews and compares Fidelity's institutional investment advisory business with its business of providing services to the Fidelity funds and also noted the most recent findings of the committee. The Board noted that the committee's review included a consideration of the differences in services provided, fees charged, and costs incurred, as well as competition in the markets serving the different categories of clients.
Based on its review of total expense ratios and fees charged to other Fidelity clients, the Board concluded that the total expense ratio of each class of the fund was reasonable in light of the services that the fund and its shareholders receive and the other factors considered.
Costs of the Services and Profitability. The Board considered the revenues earned and the expenses incurred by Fidelity in conducting the business of developing, marketing, distributing, managing, administering and servicing the fund and servicing the fund's shareholders. The Board also considered the level of Fidelity's profits in respect of all the Fidelity funds.
On an annual basis, Fidelity presents to the Board information about the profitability of its relationships with the fund. Fidelity calculates profitability information for each fund, as well as aggregate profitability information for groups of Fidelity funds and all Fidelity funds, using a series of detailed revenue and cost allocation methodologies which originate with the books and records of Fidelity on which Fidelity's audited financial statements are based. The Audit Committee of the Board reviews any significant changes from the prior year's methodologies.
PricewaterhouseCoopers LLP (PwC), auditor to Fidelity and certain Fidelity funds, has been engaged annually by the Board as part of the Board's assessment of Fidelity's profitability analysis. PwC's engagement includes the review and assessment of the methodologies used by Fidelity in determining the revenues and expenses attributable to Fidelity's mutual fund business, and completion of agreed-upon procedures in respect of the mathematical accuracy of the fund profitability information and its conformity to established allocation methodologies. After considering PwC's reports issued under the engagement and information provided by Fidelity, the Board concluded that while other allocation methods may also be reasonable, Fidelity's profitability methodologies are reasonable in all material respects.
The Board also reviewed Fidelity's non-fund businesses and potential indirect benefits such businesses may have received as a result of their association with Fidelity's mutual fund business (i.e., fall-out benefits) as well as cases where Fidelity's affiliates may benefit from the fund's business. The Board noted that changes to fall-out benefits year-over-year reflect business developments at Fidelity's various businesses.
The Board considered the costs of the services provided by and the profits realized by Fidelity in connection with the operation of the fund and was satisfied that the profitability was not excessive.
Economies of Scale. The Board considered whether there have been economies of scale in respect of the management of the Fidelity funds, whether the Fidelity funds (including the fund) have appropriately benefited from any such economies of scale, and whether there is potential for realization of any further economies of scale. The Board considered the extent to which the fund will benefit from economies of scale as assets grow through increased services to the fund, through waivers or reimbursements, or through fee or expense ratio reductions. The Board also noted that a committee (the Economies of Scale Committee) created by it and the boards of other Fidelity funds periodically analyzes whether Fidelity attains economies of scale in respect of the management and servicing of the Fidelity funds, whether the Fidelity funds have appropriately benefited from such economies of scale, and whether there is potential for realization of any further economies of scale.
The Board recognized that the fund's management contract incorporates a "group fee" structure, which provides for lower group fee rates as total group assets increase, and for higher group fee rates as total group assets decrease (with "group assets" defined to include fund assets under FMR's management plus the assets of sector funds previously under FMR's management). FMR calculates the group fee rates based on a tiered asset "breakpoint" schedule that varies based on asset class. The Board considered that the group fee is designed to deliver the benefits of economies of scale to fund shareholders when total Fidelity fund assets increase, even if assets of any particular fund are unchanged or have declined, because some portion of Fidelity's costs are attributable to services provided to all Fidelity funds, and all funds benefit if those costs can be allocated among more assets. The Board concluded that, given the group fee structure, fund shareholders will benefit from lower management fees as group assets increase at the fund complex level, regardless of whether Fidelity achieves any such economies of scale.
The Board concluded, taking into account the analysis of the Economies of Scale Committee, that economies of scale, if any, are being appropriately shared between fund shareholders and Fidelity.
Additional Information Requested by the Board. In order to develop fully the factual basis for consideration of the Fidelity funds' advisory contracts, the Board requested and received additional information on certain topics, including: (i) fund performance trends, in particular the underperformance of certain funds, and Fidelity's long-term strategies for certain funds; (ii) Fidelity's fund profitability methodology, profitability trends for certain funds, and the impact of certain factors on fund profitability results; (iii) metrics for evaluating index fund and ETF performance and information about ETF trading characteristics; (iv) the methodology with respect to the evaluation of competitive fund data and peer group classifications and fee comparisons; (v) the expense structures for different funds and classes; (vi) information regarding other accounts managed by Fidelity, including collective investment trusts; and (vii) Fidelity's philosophies and strategies for evaluating funds and classes with lower or declining asset levels.
Based on its evaluation of all of the conclusions noted above, and after considering all factors it believed relevant, the Board concluded that the advisory fee arrangements are fair and reasonable, and that the fund's Advisory Contracts should be renewed.

PUR-SANN-0419
1.700677.121
Fidelity® Balanced Fund
Semi-Annual Report February 28, 2019 |
|
Beginning on January 1, 2021, as permitted by regulations adopted by the Securities and Exchange Commission, paper copies of a fund’s shareholder reports will no longer be sent by mail, unless you specifically request paper copies of the reports from the fund or from your financial intermediary, such as a financial advisor, broker-dealer or bank. Instead, the reports will be made available on a website, and you will be notified by mail each time a report is posted and provided with a website link to access the report.
If you already elected to receive shareholder reports electronically, you will not be affected by this change and you need not take any action. You may elect to receive shareholder reports and other communications from a fund electronically, by contacting your financial intermediary. For Fidelity customers, visit Fidelity's web site or call Fidelity using the contact information listed below.
You may elect to receive all future reports in paper free of charge. If you wish to continue receiving paper copies of your shareholder reports, you may contact your financial intermediary or, if you are a Fidelity customer, visit Fidelity’s website, or call Fidelity at the applicable toll-free number listed below. Your election to receive reports in paper will apply to all funds held with the fund complex/your financial intermediary.
| Account Type | Website | Phone Number |
| Brokerage, Mutual Fund, or Annuity Contracts: | fidelity.com/mailpreferences | 1-800-343-3548 |
| Employer Provided Retirement Accounts: | netbenefits.fidelity.com/preferences (choose 'no' under Required Disclosures to continue to print) | 1-800-343-0860 |
| Advisor Sold Accounts Serviced Through Your Financial Intermediary: | Contact Your Financial Intermediary | Your Financial Intermediary's phone number |
| Advisor Sold Accounts Serviced by Fidelity: | institutional.fidelity.com | 1-877-208-0098 |
Contents
To view a fund's proxy voting guidelines and proxy voting record for the 12-month period ended June 30, visit http://www.fidelity.com/proxyvotingresults or visit the Securities and Exchange Commission's (SEC) web site at http://www.sec.gov.
You may also call 1-800-544-8544 if you’re an individual investing directly with Fidelity, call 1-800-835-5092 if you’re a plan sponsor or participant with Fidelity as your recordkeeper or call 1-877-208-0098 on institutional accounts or if you’re an advisor or invest through one to request a free copy of the proxy voting guidelines.
Standard & Poor's, S&P and S&P 500 are registered service marks of The McGraw-Hill Companies, Inc. and have been licensed for use by Fidelity Distributors Corporation.
Other third-party marks appearing herein are the property of their respective owners.
All other marks appearing herein are registered or unregistered trademarks or service marks of FMR LLC or an affiliated company. © 2019 FMR LLC. All rights reserved.
This report and the financial statements contained herein are submitted for the general information of the shareholders of the Fund. This report is not authorized for distribution to prospective investors in the Fund unless preceded or accompanied by an effective prospectus.
A fund files its complete schedule of portfolio holdings with the SEC for the first and third quarters of each fiscal year on Form N-Q. Forms N-Q are available on the SEC’s web site at http://www.sec.gov. A fund's Forms N-Q may be reviewed and copied at the SEC’s Public Reference Room in Washington, DC. Information regarding the operation of the SEC's Public Reference Room may be obtained by calling 1-800-SEC-0330.
For a complete list of a fund's portfolio holdings, view the most recent holdings listing, semiannual report, or annual report on Fidelity's web site at http://www.fidelity.com, http://www.institutional.fidelity.com, or http://www.401k.com, as applicable.
NOT FDIC INSURED •MAY LOSE VALUE •NO BANK GUARANTEE
Neither the Fund nor Fidelity Distributors Corporation is a bank.
Investment Summary (Unaudited)
The information in the following tables is based on the combined investments of the Fund and its pro-rata share of the investments of Fidelity's Fixed-Income Central Funds.
Top Five Stocks as of February 28, 2019
| | % of fund's net assets |
| Microsoft Corp. | 3.0 |
| Apple, Inc. | 2.5 |
| Amazon.com, Inc. | 1.9 |
| Alphabet, Inc. Class C | 1.6 |
| UnitedHealth Group, Inc. | 1.2 |
| | 10.2 |
Top Five Bond Issuers as of February 28, 2019
| (with maturities greater than one year) | % of fund's net assets |
| U.S. Treasury Obligations | 9.5 |
| Fannie Mae | 3.8 |
| Freddie Mac | 2.1 |
| Ginnie Mae | 2.0 |
| Morgan Stanley | 0.5 |
| | 17.9 |
Top Five Market Sectors as of February 28, 2019
| | % of fund's net assets |
| Financials | 13.8 |
| Information Technology | 13.2 |
| Health Care | 11.1 |
| Communication Services | 8.2 |
| Consumer Discretionary | 7.4 |
Asset Allocation (% of fund's net assets)
| As of February 28, 2019*,** |
| | Stocks and Equity Futures | 66.8% |
| | Bonds | 32.6% |
| | Other Investments | 0.5% |
| | Short-Term Investments and Net Other Assets (Liabilities) | 0.1% |

* Foreign investments - 8.6%
** Futures and Swaps - 0.1%
An unaudited holdings listing for the Fund, which presents direct holdings as well as the pro-rata share of any securities and other investments held indirectly through its investment in underlying non-money market Fidelity Central Funds, is available at fidelity.com and/or institutional.fidelity.com, as applicable.
Percentages in the above tables are adjusted for the effect of TBA Sale Commitments.
Percentages are adjusted for the effect of futures contracts and swaps, if applicable.
Schedule of Investments February 28, 2019 (Unaudited)
Showing Percentage of Net Assets
| Common Stocks - 66.3% | | | |
| | | Shares | Value (000s) |
| COMMUNICATION SERVICES - 6.7% | | | |
| Diversified Telecommunication Services - 0.8% | | | |
| AT&T, Inc. | | 8,169,364 | $254,231 |
| CenturyLink, Inc. | | 891,300 | 11,756 |
| | | | 265,987 |
| Entertainment - 1.3% | | | |
| Activision Blizzard, Inc. | | 1,697,531 | 71,534 |
| Electronic Arts, Inc. (a) | | 810,884 | 77,666 |
| Netflix, Inc. (a) | | 394,514 | 141,275 |
| Take-Two Interactive Software, Inc. (a) | | 204,800 | 17,871 |
| The Walt Disney Co. | | 903,200 | 101,917 |
| | | | 410,263 |
| Interactive Media & Services - 3.5% | | | |
| Alphabet, Inc.: | | | |
| Class A (a) | | 141,723 | 159,658 |
| Class C (a) | | 472,447 | 529,103 |
| ANGI Homeservices, Inc. Class A (a) | | 1,759,685 | 28,894 |
| Facebook, Inc. Class A (a) | | 2,230,069 | 360,045 |
| Momo, Inc. ADR (a) | | 1,020,800 | 33,860 |
| Tencent Holdings Ltd. | | 312,100 | 13,365 |
| Twitter, Inc. (a) | | 663,000 | 20,407 |
| | | | 1,145,332 |
| Media - 0.7% | | | |
| Charter Communications, Inc. Class A (a) | | 30,800 | 10,623 |
| Comcast Corp. Class A | | 4,752,992 | 183,798 |
| Liberty Broadband Corp. Class A (a) | | 193,200 | 17,257 |
| MDC Partners, Inc. Class A (a) | | 2,162,434 | 7,179 |
| MultiChoice Group Ltd. | | 19,000 | 142 |
| Naspers Ltd. Class N | | 19,000 | 4,106 |
| | | | 223,105 |
| Wireless Telecommunication Services - 0.4% | | | |
| T-Mobile U.S., Inc. (a) | | 1,717,566 | 124,025 |
|
| TOTAL COMMUNICATION SERVICES | | | 2,168,712 |
|
| CONSUMER DISCRETIONARY - 7.0% | | | |
| Auto Components - 0.1% | | | |
| Aptiv PLC | | 510,100 | 42,394 |
| Distributors - 0.1% | | | |
| LKQ Corp. (a) | | 934,000 | 25,872 |
| Diversified Consumer Services - 0.0% | | | |
| Arco Platform Ltd. Class A | | 522,300 | 12,598 |
| Hotels, Restaurants & Leisure - 2.1% | | | |
| ARAMARK Holdings Corp. | | 839,800 | 25,446 |
| Cedar Fair LP (depositary unit) | | 553,100 | 29,314 |
| Compass Group PLC | | 2,861,700 | 63,201 |
| Dunkin' Brands Group, Inc. | | 331,900 | 23,714 |
| Marriott International, Inc. Class A | | 586,537 | 73,475 |
| McDonald's Corp. | | 1,068,400 | 196,415 |
| Sea Ltd. ADR (a)(b) | | 3,417,500 | 73,476 |
| Starbucks Corp. | | 885,474 | 62,213 |
| U.S. Foods Holding Corp. (a) | | 1,725,300 | 60,800 |
| Wyndham Destinations, Inc. | | 352,000 | 15,851 |
| Wyndham Hotels & Resorts, Inc. | | 650,200 | 34,181 |
| | | | 658,086 |
| Household Durables - 0.2% | | | |
| Lennar Corp. Class A | | 1,169,600 | 56,117 |
| Internet & Direct Marketing Retail - 2.2% | | | |
| Alibaba Group Holding Ltd. sponsored ADR (a) | | 266,100 | 48,704 |
| Amazon.com, Inc. (a) | | 368,800 | 604,769 |
| The Booking Holdings, Inc. (a) | | 37,600 | 63,809 |
| | | | 717,282 |
| Leisure Products - 0.1% | | | |
| Mattel, Inc. (a)(b) | | 1,538,800 | 22,189 |
| Multiline Retail - 0.2% | | | |
| Dollar Tree, Inc. (a) | | 721,500 | 69,502 |
| Specialty Retail - 1.6% | | | |
| Home Depot, Inc. | | 1,301,944 | 241,042 |
| Lowe's Companies, Inc. | | 1,035,200 | 108,789 |
| O'Reilly Automotive, Inc. (a) | | 119,208 | 44,341 |
| TJX Companies, Inc. | | 2,463,514 | 126,354 |
| Ulta Beauty, Inc. (a) | | 18,600 | 5,812 |
| | | | 526,338 |
| Textiles, Apparel & Luxury Goods - 0.4% | | | |
| NIKE, Inc. Class B | | 887,150 | 76,055 |
| Prada SpA | | 3,673,800 | 11,771 |
| PVH Corp. | | 148,500 | 17,054 |
| Tapestry, Inc. | | 882,300 | 30,828 |
| | | | 135,708 |
|
| TOTAL CONSUMER DISCRETIONARY | | | 2,266,086 |
|
| CONSUMER STAPLES - 4.4% | | | |
| Beverages - 1.2% | | | |
| Constellation Brands, Inc. Class A (sub. vtg.) | | 349,627 | 59,143 |
| Keurig Dr. Pepper, Inc. | | 574,300 | 14,444 |
| Monster Beverage Corp. (a) | | 840,542 | 53,652 |
| PepsiCo, Inc. | | 517,900 | 59,890 |
| The Coca-Cola Co. | | 4,434,208 | 201,047 |
| | | | 388,176 |
| Food & Staples Retailing - 0.5% | | | |
| Costco Wholesale Corp. | | 135,800 | 29,705 |
| Kroger Co. | | 246,700 | 7,236 |
| Sysco Corp. | | 580,600 | 39,220 |
| Walgreens Boots Alliance, Inc. | | 361,075 | 25,705 |
| Walmart, Inc. | | 543,800 | 53,831 |
| | | | 155,697 |
| Food Products - 0.6% | | | |
| Bunge Ltd. | | 445,263 | 23,635 |
| Conagra Brands, Inc. | | 788,500 | 18,427 |
| Mondelez International, Inc. | | 2,698,500 | 127,261 |
| The Kraft Heinz Co. | | 802,900 | 26,648 |
| The Simply Good Foods Co. (a) | | 522,621 | 10,693 |
| | | | 206,664 |
| Household Products - 1.0% | | | |
| Colgate-Palmolive Co. | | 1,536,167 | 101,187 |
| Procter & Gamble Co. | | 2,071,700 | 204,166 |
| | | | 305,353 |
| Personal Products - 0.3% | | | |
| Coty, Inc. Class A | | 2,478,902 | 27,268 |
| Edgewell Personal Care Co. (a) | | 352,300 | 15,628 |
| Estee Lauder Companies, Inc. Class A | | 255,282 | 40,064 |
| Unilever NV (Certificaten Van Aandelen) (Bearer) | | 453,200 | 24,544 |
| | | | 107,504 |
| Tobacco - 0.8% | | | |
| Altria Group, Inc. | | 1,681,695 | 88,138 |
| British American Tobacco PLC sponsored ADR | | 548,719 | 20,160 |
| Philip Morris International, Inc. | | 1,660,799 | 144,390 |
| | | | 252,688 |
|
| TOTAL CONSUMER STAPLES | | | 1,416,082 |
|
| ENERGY - 3.4% | | | |
| Energy Equipment & Services - 0.3% | | | |
| Baker Hughes, a GE Co. Class A | | 1,578,000 | 41,628 |
| Hess Midstream Partners LP | | 407,700 | 9,328 |
| Liberty Oilfield Services, Inc. Class A (b) | | 628,700 | 10,298 |
| NCS Multistage Holdings, Inc. (a) | | 1,567,839 | 8,639 |
| Oceaneering International, Inc. (a) | | 474,391 | 7,329 |
| Schlumberger Ltd. | | 435,800 | 19,201 |
| | | | 96,423 |
| Oil, Gas & Consumable Fuels - 3.1% | | | |
| Anadarko Petroleum Corp. | | 1,448,502 | 63,010 |
| Black Stone Minerals LP | | 757,000 | 13,505 |
| BP PLC sponsored ADR | | 766,670 | 32,698 |
| Cabot Oil & Gas Corp. | | 1,005,150 | 24,747 |
| Centennial Resource Development, Inc. Class A (a) | | 696,100 | 6,314 |
| Chevron Corp. | | 664,905 | 79,509 |
| ConocoPhillips Co. | | 486,600 | 33,016 |
| Devon Energy Corp. | | 2,451,000 | 72,329 |
| Diamondback Energy, Inc. | | 134,900 | 13,885 |
| EOG Resources, Inc. | | 1,134,400 | 106,634 |
| Exxon Mobil Corp. | | 1,411,743 | 111,570 |
| HollyFrontier Corp. | | 487,500 | 24,960 |
| Magnolia Oil & Gas Corp. | | 931,000 | 11,451 |
| Magnolia Oil & Gas Corp. Class A (a) | | 1,185,000 | 14,576 |
| Noble Energy, Inc. | | 1,832,800 | 40,597 |
| Parsley Energy, Inc. Class A (a) | | 1,092,230 | 19,813 |
| Phillips 66 Co. | | 811,417 | 78,188 |
| Pioneer Natural Resources Co. | | 357,800 | 50,432 |
| PrairieSky Royalty Ltd. (b) | | 858,637 | 12,508 |
| Reliance Industries Ltd. | | 2,625,662 | 45,628 |
| Suncor Energy, Inc. | | 1,918,100 | 66,116 |
| Targa Resources Corp. | | 316,200 | 12,724 |
| Valero Energy Corp. | | 635,600 | 51,840 |
| Viper Energy Partners LP | | 168,300 | 5,539 |
| Whiting Petroleum Corp. (a) | | 434,900 | 10,599 |
| | | | 1,002,188 |
|
| TOTAL ENERGY | | | 1,098,611 |
|
| FINANCIALS - 8.8% | | | |
| Banks - 3.8% | | | |
| Bank of America Corp. | | 10,646,208 | 309,592 |
| Citigroup, Inc. | | 3,364,012 | 215,229 |
| First Horizon National Corp. | | 3,650,700 | 57,060 |
| Huntington Bancshares, Inc. | | 12,332,512 | 177,711 |
| KB Financial Group, Inc. | | 136,300 | 5,368 |
| KeyCorp | | 4,120,400 | 72,766 |
| M&T Bank Corp. | | 205,300 | 35,529 |
| PNC Financial Services Group, Inc. | | 422,600 | 53,256 |
| Signature Bank | | 315,500 | 42,832 |
| SunTrust Banks, Inc. | | 662,400 | 42,970 |
| Wells Fargo & Co. | | 4,567,100 | 227,853 |
| | | | 1,240,166 |
| Capital Markets - 1.3% | | | |
| Bank of New York Mellon Corp. | | 1,112,400 | 58,379 |
| Cboe Global Markets, Inc. | | 688,011 | 65,987 |
| E*TRADE Financial Corp. | | 2,413,949 | 118,259 |
| Goldman Sachs Group, Inc. | | 121,800 | 23,958 |
| Morgan Stanley | | 963,900 | 40,465 |
| Oaktree Capital Group LLC Class A | | 556,300 | 23,570 |
| State Street Corp. | | 261,200 | 18,772 |
| TD Ameritrade Holding Corp. | | 686,900 | 38,693 |
| Virtu Financial, Inc. Class A | | 1,206,600 | 30,334 |
| | | | 418,417 |
| Consumer Finance - 1.9% | | | |
| 360 Finance, Inc. ADR | | 584,900 | 9,914 |
| American Express Co. | | 623,400 | 67,165 |
| Capital One Financial Corp. | | 3,606,201 | 301,406 |
| LexinFintech Holdings Ltd. ADR (a) | | 1,685,600 | 19,637 |
| OneMain Holdings, Inc. | | 3,139,194 | 103,593 |
| PPDAI Group, Inc. ADR (a) | | 1,818,600 | 8,766 |
| SLM Corp. | | 3,891,498 | 43,001 |
| Synchrony Financial | | 1,312,900 | 42,814 |
| | | | 596,296 |
| Diversified Financial Services - 0.1% | | | |
| Berkshire Hathaway, Inc. Class A (a) | | 78 | 23,572 |
| Kimbell Royalty Partners LP | | 821,226 | 14,371 |
| | | | 37,943 |
| Insurance - 1.7% | | | |
| American International Group, Inc. | | 2,768,500 | 119,599 |
| Hartford Financial Services Group, Inc. | | 767,100 | 37,864 |
| Marsh & McLennan Companies, Inc. | | 923,377 | 85,893 |
| MetLife, Inc. | | 2,846,300 | 128,624 |
| RSA Insurance Group PLC | | 1,913,000 | 12,966 |
| The Travelers Companies, Inc. | | 463,986 | 61,668 |
| Willis Group Holdings PLC | | 579,543 | 99,693 |
| | | | 546,307 |
|
| TOTAL FINANCIALS | | | 2,839,129 |
|
| HEALTH CARE - 10.2% | | | |
| Biotechnology - 1.9% | | | |
| Alexion Pharmaceuticals, Inc. (a) | | 956,404 | 129,430 |
| Amgen, Inc. | | 957,288 | 181,961 |
| Biogen, Inc. (a) | | 265,185 | 86,983 |
| Global Blood Therapeutics, Inc. (a) | | 327,146 | 17,175 |
| Immunomedics, Inc. (a)(b) | | 632,600 | 9,970 |
| Sarepta Therapeutics, Inc. (a) | | 301,300 | 43,460 |
| Vertex Pharmaceuticals, Inc. (a) | | 763,100 | 144,035 |
| | | | 613,014 |
| Health Care Equipment & Supplies - 3.3% | | | |
| Abbott Laboratories | | 2,908,000 | 225,719 |
| Baxter International, Inc. | | 1,475,800 | 110,287 |
| Becton, Dickinson & Co. | | 817,500 | 203,386 |
| Boston Scientific Corp. (a) | | 6,469,070 | 259,539 |
| Danaher Corp. | | 158,200 | 20,095 |
| Hologic, Inc. (a) | | 949,000 | 44,745 |
| Intuitive Surgical, Inc. (a) | | 250,100 | 136,957 |
| Wright Medical Group NV (a) | | 1,531,300 | 47,945 |
| | | | 1,048,673 |
| Health Care Providers & Services - 2.7% | | | |
| AmerisourceBergen Corp. | | 589,000 | 49,064 |
| DaVita HealthCare Partners, Inc. (a) | | 900,700 | 51,250 |
| Elanco Animal Health, Inc. (b) | | 912,300 | 27,588 |
| HCA Holdings, Inc. | | 852,100 | 118,476 |
| Humana, Inc. | | 487,600 | 138,986 |
| Molina Healthcare, Inc. (a) | | 712,100 | 95,870 |
| UnitedHealth Group, Inc. | | 1,609,684 | 389,898 |
| | | | 871,132 |
| Life Sciences Tools & Services - 0.6% | | | |
| Thermo Fisher Scientific, Inc. | | 736,597 | 191,198 |
| Pharmaceuticals - 1.7% | | | |
| Allergan PLC | | 396,843 | 54,649 |
| AstraZeneca PLC sponsored ADR | | 3,936,700 | 163,688 |
| Bristol-Myers Squibb Co. | | 2,793,041 | 144,288 |
| Nektar Therapeutics (a) | | 44,151 | 1,790 |
| Roche Holding AG (participation certificate) | | 642,257 | 178,242 |
| | | | 542,657 |
|
| TOTAL HEALTH CARE | | | 3,266,674 |
|
| INDUSTRIALS - 7.0% | | | |
| Aerospace & Defense - 1.3% | | | |
| General Dynamics Corp. | | 204,100 | 34,742 |
| Northrop Grumman Corp. | | 228,174 | 66,161 |
| Raytheon Co. | | 122,980 | 22,936 |
| The Boeing Co. | | 284,120 | 125,001 |
| United Technologies Corp. | | 1,349,052 | 169,535 |
| | | | 418,375 |
| Air Freight & Logistics - 0.5% | | | |
| United Parcel Service, Inc. Class B | | 1,350,191 | 148,791 |
| Airlines - 0.3% | | | |
| American Airlines Group, Inc. | | 2,838,746 | 101,145 |
| Building Products - 0.2% | | | |
| Allegion PLC | | 531,570 | 47,820 |
| USG Corp. | | 425,056 | 18,324 |
| | | | 66,144 |
| Commercial Services & Supplies - 0.0% | | | |
| Stericycle, Inc. (a) | | 225,600 | 10,057 |
| Construction & Engineering - 0.6% | | | |
| AECOM (a) | | 5,370,657 | 166,276 |
| Jacobs Engineering Group, Inc. | | 106,800 | 7,880 |
| | | | 174,156 |
| Electrical Equipment - 1.0% | | | |
| Sensata Technologies, Inc. PLC (a) | | 2,426,101 | 123,076 |
| Sunrun, Inc. (a)(b)(c) | | 10,106,501 | 156,752 |
| Vivint Solar, Inc. (a)(c) | | 10,129,753 | 52,979 |
| | | | 332,807 |
| Industrial Conglomerates - 0.6% | | | |
| 3M Co. | | 92,940 | 19,275 |
| General Electric Co. | | 9,316,816 | 96,802 |
| Honeywell International, Inc. | | 421,700 | 64,971 |
| | | | 181,048 |
| Machinery - 0.4% | | | |
| Minebea Mitsumi, Inc. | | 2,373,200 | 38,195 |
| WABCO Holdings, Inc. (a) | | 557,844 | 76,720 |
| Wabtec Corp. | | 50,040 | 3,666 |
| | | | 118,581 |
| Marine - 0.3% | | | |
| A.P. Moller - Maersk A/S Series B | | 61,609 | 82,887 |
| Professional Services - 0.4% | | | |
| Nielsen Holdings PLC | | 3,504,330 | 91,813 |
| WageWorks, Inc. (a) | | 1,287,855 | 42,370 |
| | | | 134,183 |
| Road & Rail - 0.9% | | | |
| CSX Corp. | | 1,616,150 | 117,446 |
| Norfolk Southern Corp. | | 824,836 | 147,893 |
| Union Pacific Corp. | | 197,300 | 33,087 |
| | | | 298,426 |
| Trading Companies & Distributors - 0.5% | | | |
| HD Supply Holdings, Inc. (a) | | 3,844,684 | 165,360 |
| Univar, Inc. (a) | | 246,300 | 5,569 |
| | | | 170,929 |
|
| TOTAL INDUSTRIALS | | | 2,237,529 |
|
| INFORMATION TECHNOLOGY - 13.0% | | | |
| Electronic Equipment & Components - 0.1% | | | |
| Flextronics International Ltd. (a) | | 1,833,100 | 19,321 |
| Jabil, Inc. | | 242,400 | 6,884 |
| TE Connectivity Ltd. | | 163,700 | 13,438 |
| | | | 39,643 |
| IT Services - 1.4% | | | |
| Akamai Technologies, Inc. (a) | | 32,600 | 2,271 |
| Alliance Data Systems Corp. | | 889,900 | 153,953 |
| Cognizant Technology Solutions Corp. Class A | | 823,600 | 58,459 |
| DXC Technology Co. | | 381,300 | 25,112 |
| FleetCor Technologies, Inc. (a) | | 80,700 | 18,826 |
| GoDaddy, Inc. (a) | | 269,900 | 20,148 |
| Leidos Holdings, Inc. | | 153,400 | 9,908 |
| Liveramp Holdings, Inc. (a) | | 42,900 | 2,306 |
| MasterCard, Inc. Class A | | 64,400 | 14,475 |
| MongoDB, Inc. Class A (a)(b) | | 220,728 | 22,417 |
| PayPal Holdings, Inc. (a) | | 781,071 | 76,600 |
| Shopify, Inc. Class A (a) | | 189,800 | 35,954 |
| | | | 440,429 |
| Semiconductors & Semiconductor Equipment - 3.4% | | | |
| Analog Devices, Inc. | | 252,547 | 27,012 |
| Applied Materials, Inc. | | 2,042,700 | 78,317 |
| Broadcom, Inc. | | 308,984 | 85,082 |
| Intel Corp. | | 2,058,900 | 109,039 |
| Lam Research Corp. | | 695,400 | 122,453 |
| MACOM Technology Solutions Holdings, Inc. (a)(c) | | 3,723,626 | 71,084 |
| Marvell Technology Group Ltd. | | 2,545,200 | 50,777 |
| Microchip Technology, Inc. (b) | | 162,800 | 14,142 |
| Micron Technology, Inc. (a) | | 1,990,426 | 81,369 |
| NVIDIA Corp. | | 836,942 | 129,107 |
| NXP Semiconductors NV | | 823,000 | 75,156 |
| ON Semiconductor Corp. (a) | | 6,355,395 | 136,514 |
| Qualcomm, Inc. | | 1,989,177 | 106,202 |
| | | | 1,086,254 |
| Software - 5.6% | | | |
| 2U, Inc. (a) | | 370,200 | 27,284 |
| Adobe, Inc. (a) | | 495,416 | 130,047 |
| Autodesk, Inc. (a) | | 937,991 | 152,902 |
| Avast PLC (d) | | 7,459,300 | 30,527 |
| Box, Inc. Class A (a) | | 85,700 | 1,735 |
| Cardlytics, Inc. (a) | | 494,572 | 8,714 |
| Citrix Systems, Inc. | | 322,750 | 34,050 |
| Cloudera, Inc. (a) | | 3,459,610 | 50,407 |
| Kingsoft Corp. Ltd. | | 18,782,000 | 36,512 |
| Microsoft Corp. | | 8,767,312 | 982,200 |
| Nuance Communications, Inc. (a) | | 730,455 | 12,250 |
| Nutanix, Inc. Class A (a) | | 216,300 | 10,834 |
| Oracle Corp. | | 489,600 | 25,523 |
| Parametric Technology Corp. (a) | | 308,311 | 28,617 |
| Salesforce.com, Inc. (a) | | 913,120 | 149,432 |
| Sophos Group PLC (d) | | 3,521,300 | 15,310 |
| SS&C Technologies Holdings, Inc. | | 54,700 | 3,368 |
| SurveyMonkey (b) | | 1,728,358 | 26,219 |
| Symantec Corp. | | 100,800 | 2,267 |
| Talend SA ADR (a) | | 1,076,294 | 51,554 |
| Totvs SA | | 689,800 | 6,694 |
| Varonis Systems, Inc. (a) | | 365,900 | 20,842 |
| Zuora, Inc. | | 179,500 | 4,265 |
| | | | 1,811,553 |
| Technology Hardware, Storage & Peripherals - 2.5% | | | |
| Apple, Inc. | | 4,580,339 | 793,086 |
|
| TOTAL INFORMATION TECHNOLOGY | | | 4,170,965 |
|
| MATERIALS - 1.7% | | | |
| Chemicals - 1.5% | | | |
| Air Products & Chemicals, Inc. | | 259,200 | 46,962 |
| DowDuPont, Inc. | | 3,073,914 | 163,624 |
| Element Solutions, Inc. (a) | | 1,339,500 | 15,083 |
| LG Chemical Ltd. | | 56,660 | 19,659 |
| Linde PLC | | 375,494 | 65,051 |
| LyondellBasell Industries NV Class A | | 123,300 | 10,545 |
| Olin Corp. | | 1,870,400 | 48,369 |
| Sherwin-Williams Co. | | 13,200 | 5,718 |
| The Chemours Co. LLC | | 2,092,964 | 79,595 |
| Tronox Ltd. Class A | | 1,498,400 | 17,726 |
| Westlake Chemical Corp. | | 74,541 | 5,208 |
| | | | 477,540 |
| Construction Materials - 0.1% | | | |
| Vulcan Materials Co. | | 201,400 | 22,448 |
| Containers & Packaging - 0.0% | | | |
| Crown Holdings, Inc. (a) | | 289,500 | 15,717 |
| Metals & Mining - 0.1% | | | |
| Antofagasta PLC | | 1,247,800 | 15,504 |
| Livent Corp. (b) | | 455,900 | 5,836 |
| Newmont Mining Corp. | | 460,000 | 15,695 |
| | | | 37,035 |
|
| TOTAL MATERIALS | | | 552,740 |
|
| REAL ESTATE - 2.0% | | | |
| Equity Real Estate Investment Trusts (REITs) - 1.9% | | | |
| American Tower Corp. | | 854,300 | 150,485 |
| Ant International Co. Ltd. Class C (e)(f) | | 4,971,128 | 31,467 |
| Boston Properties, Inc. | | 376,197 | 49,918 |
| CorePoint Lodging, Inc. | | 766,400 | 10,707 |
| Corporate Office Properties Trust (SBI) | | 919,900 | 23,908 |
| Crown Castle International Corp. | | 251,700 | 29,889 |
| Equinix, Inc. | | 121,000 | 51,244 |
| Equity Lifestyle Properties, Inc. | | 123,900 | 13,460 |
| Essex Property Trust, Inc. | | 127,200 | 35,596 |
| Front Yard Residential Corp. Class B | | 2,091,811 | 23,282 |
| Outfront Media, Inc. | | 373,862 | 8,389 |
| Prologis, Inc. | | 825,200 | 57,814 |
| Public Storage | | 163,900 | 34,663 |
| Simon Property Group, Inc. | | 123,600 | 22,391 |
| Spirit Realty Capital, Inc. | | 150,920 | 5,832 |
| Store Capital Corp. | | 470,000 | 15,261 |
| The Macerich Co. | | 302,500 | 13,189 |
| VEREIT, Inc. | | 742,600 | 5,919 |
| Welltower, Inc. | | 639,500 | 47,521 |
| | | | 630,935 |
| Real Estate Management & Development - 0.1% | | | |
| Cushman & Wakefield PLC | | 794,700 | 14,567 |
| VICI Properties, Inc. | | 472,900 | 10,077 |
| | | | 24,644 |
|
| TOTAL REAL ESTATE | | | 655,579 |
|
| UTILITIES - 2.1% | | | |
| Electric Utilities - 1.3% | | | |
| Duke Energy Corp. | | 136,800 | 12,265 |
| Edison International | | 597,938 | 35,811 |
| Entergy Corp. | | 275,200 | 25,684 |
| Evergy, Inc. | | 279,461 | 15,625 |
| Exelon Corp. | | 2,017,225 | 98,017 |
| FirstEnergy Corp. | | 1,310,500 | 53,403 |
| NextEra Energy, Inc. | | 590,900 | 110,924 |
| PPL Corp. | | 1,699,194 | 54,663 |
| Southern Co. | | 327,131 | 16,255 |
| | | | 422,647 |
| Independent Power and Renewable Electricity Producers - 0.1% | | | |
| NRG Energy, Inc. | | 484,575 | 20,197 |
| The AES Corp. | | 929,000 | 16,007 |
| | | | 36,204 |
| Multi-Utilities - 0.7% | | | |
| Dominion Resources, Inc. | | 1,351,392 | 100,125 |
| Public Service Enterprise Group, Inc. | | 894,370 | 52,598 |
| Sempra Energy | | 472,057 | 56,855 |
| | | | 209,578 |
|
| TOTAL UTILITIES | | | 668,429 |
|
| TOTAL COMMON STOCKS | | | |
| (Cost $16,880,387) | | | 21,340,536 |
| | | Principal Amount (000s) | Value (000s) |
|
| Nonconvertible Bonds - 10.9% | | | |
| COMMUNICATION SERVICES - 1.0% | | | |
| Diversified Telecommunication Services - 0.3% | | | |
| AT&T, Inc.: | | | |
| 2.45% 6/30/20 | | 5,759 | 5,718 |
| 3.6% 2/17/23 | | 12,300 | 12,377 |
| 4.45% 4/1/24 | | 854 | 884 |
| 4.5% 3/9/48 | | 25,000 | 22,378 |
| 4.75% 5/15/46 | | 10,000 | 9,285 |
| BellSouth Capital Funding Corp. 7.875% 2/15/30 | | 61 | 72 |
| Verizon Communications, Inc.: | | | |
| 2.625% 2/21/20 | | 5,764 | 5,754 |
| 3.85% 11/1/42 | | 2,128 | 1,918 |
| 5.012% 4/15/49 | | 5,561 | 5,821 |
| 5.012% 8/21/54 | | 23,143 | 23,774 |
| 5.5% 3/16/47 | | 16,500 | 18,343 |
| | | | 106,324 |
| Entertainment - 0.1% | | | |
| AOL Time Warner, Inc. 2.95% 7/15/26 | | 23,000 | 21,355 |
| NBCUniversal, Inc.: | | | |
| 4.45% 1/15/43 | | 3,588 | 3,557 |
| 5.95% 4/1/41 | | 2,510 | 2,964 |
| Time Warner, Inc. 2.1% 6/1/19 | | 12,500 | 12,471 |
| | | | 40,347 |
| Media - 0.6% | | | |
| 21st Century Fox America, Inc. 7.75% 12/1/45 | | 9,421 | 13,883 |
| Charter Communications Operating LLC/Charter Communications Operating Capital Corp.: | | | |
| 4.464% 7/23/22 | | 10,261 | 10,525 |
| 4.908% 7/23/25 | | 6,898 | 7,146 |
| 5.375% 5/1/47 | | 9,270 | 8,789 |
| 5.75% 4/1/48 | | 9,330 | 9,338 |
| Comcast Corp.: | | | |
| 3.9% 3/1/38 | | 1,918 | 1,814 |
| 3.969% 11/1/47 | | 6,197 | 5,748 |
| 3.999% 11/1/49 | | 7,076 | 6,571 |
| 4% 3/1/48 | | 3,508 | 3,280 |
| 4.6% 8/15/45 | | 5,066 | 5,115 |
| 4.65% 7/15/42 | | 4,526 | 4,596 |
| Fox Corp.: | | | |
| 3.666% 1/25/22 (d) | | 1,312 | 1,327 |
| 4.03% 1/25/24 (d) | | 2,307 | 2,351 |
| 4.709% 1/25/29 (d) | | 3,339 | 3,461 |
| 5.476% 1/25/39 (d) | | 3,293 | 3,452 |
| 5.576% 1/25/49 (d) | | 2,185 | 2,307 |
| Time Warner Cable, Inc.: | | | |
| 4% 9/1/21 | | 10,989 | 11,097 |
| 4.5% 9/15/42 | | 2,648 | 2,224 |
| 5.5% 9/1/41 | | 3,051 | 2,887 |
| 5.875% 11/15/40 | | 7,066 | 7,011 |
| 6.55% 5/1/37 | | 43,346 | 45,964 |
| 7.3% 7/1/38 | | 7,024 | 7,927 |
| 8.25% 4/1/19 | | 11,974 | 12,022 |
| | | | 178,835 |
|
| TOTAL COMMUNICATION SERVICES | | | 325,506 |
|
| CONSUMER DISCRETIONARY - 0.3% | | | |
| Automobiles - 0.3% | | | |
| General Motors Financial Co., Inc.: | | | |
| 3.15% 1/15/20 | | 19,000 | 18,998 |
| 3.5% 7/10/19 | | 41,541 | 41,619 |
| 4% 1/15/25 | | 7,674 | 7,371 |
| 4.2% 3/1/21 | | 10,665 | 10,786 |
| 4.25% 5/15/23 | | 3,220 | 3,230 |
| | | | 82,004 |
| CONSUMER STAPLES - 0.9% | | | |
| Beverages - 0.4% | | | |
| Anheuser-Busch InBev Finance, Inc.: | | | |
| 4.7% 2/1/36 | | 19,253 | 18,635 |
| 4.9% 2/1/46 | | 22,019 | 21,191 |
| Anheuser-Busch InBev Worldwide, Inc.: | | | |
| 4.75% 4/15/58 | | 10,422 | 9,460 |
| 5.45% 1/23/39 | | 8,520 | 8,941 |
| 5.55% 1/23/49 | | 19,483 | 20,463 |
| 5.8% 1/23/59 (Reg. S) | | 20,579 | 21,954 |
| Molson Coors Brewing Co. 3% 7/15/26 | | 30,000 | 27,527 |
| | | | 128,171 |
| Food & Staples Retailing - 0.0% | | | |
| Walgreens Boots Alliance, Inc.: | | | |
| 2.7% 11/18/19 | | 3,939 | 3,931 |
| 3.3% 11/18/21 | | 4,671 | 4,696 |
| | | | 8,627 |
| Tobacco - 0.5% | | | |
| Altria Group, Inc.: | | | |
| 2.625% 1/14/20 | | 12,900 | 12,860 |
| 3.875% 9/16/46 | | 8,420 | 6,381 |
| 4% 1/31/24 | | 3,615 | 3,649 |
| 4.25% 8/9/42 | | 10,063 | 8,128 |
| 4.4% 2/14/26 | | 4,333 | 4,367 |
| 4.5% 5/2/43 | | 6,746 | 5,584 |
| 4.8% 2/14/29 | | 5,634 | 5,623 |
| 5.375% 1/31/44 | | 12,168 | 11,327 |
| 5.95% 2/14/49 | | 6,600 | 6,584 |
| BAT Capital Corp. 4.54% 8/15/47 | | 20,000 | 16,223 |
| Imperial Tobacco Finance PLC: | | | |
| 3.75% 7/21/22 (d) | | 8,553 | 8,568 |
| 4.25% 7/21/25 (d) | | 10,443 | 10,429 |
| Reynolds American, Inc.: | | | |
| 3.25% 6/12/20 | | 1,695 | 1,693 |
| 4% 6/12/22 | | 5,830 | 5,901 |
| 4.45% 6/12/25 | | 4,227 | 4,263 |
| 4.85% 9/15/23 | | 8,000 | 8,357 |
| 5.7% 8/15/35 | | 2,194 | 2,163 |
| 5.85% 8/15/45 | | 16,830 | 16,035 |
| 6.15% 9/15/43 | | 14,000 | 13,791 |
| 7.25% 6/15/37 | | 7,569 | 8,273 |
| | | | 160,199 |
|
| TOTAL CONSUMER STAPLES | | | 296,997 |
|
| ENERGY - 1.7% | | | |
| Energy Equipment & Services - 0.1% | | | |
| El Paso Pipeline Partners Operating Co. LLC: | | | |
| 5% 10/1/21 | | 2,791 | 2,897 |
| 6.5% 4/1/20 | | 3,517 | 3,639 |
| Halliburton Co.: | | | |
| 3.8% 11/15/25 | | 4,660 | 4,681 |
| 4.85% 11/15/35 | | 4,069 | 4,122 |
| Noble Holding International Ltd.: | | | |
| 7.95% 4/1/25 (g) | | 3,936 | 3,444 |
| 8.95% 4/1/45 (g) | | 3,799 | 3,115 |
| | | | 21,898 |
| Oil, Gas & Consumable Fuels - 1.6% | | | |
| Amerada Hess Corp.: | | | |
| 7.3% 8/15/31 | | 2,435 | 2,774 |
| 7.875% 10/1/29 | | 4,487 | 5,258 |
| Anadarko Finance Co. 7.5% 5/1/31 | | 14,552 | 17,611 |
| Anadarko Petroleum Corp.: | | | |
| 4.85% 3/15/21 | | 12,068 | 12,398 |
| 5.55% 3/15/26 | | 9,887 | 10,565 |
| 6.45% 9/15/36 | | 8,540 | 9,611 |
| 6.6% 3/15/46 | | 11,115 | 13,142 |
| Canadian Natural Resources Ltd. 5.85% 2/1/35 | | 4,725 | 5,164 |
| Cenovus Energy, Inc. 4.25% 4/15/27 | | 14,753 | 14,049 |
| Columbia Pipeline Group, Inc.: | | | |
| 3.3% 6/1/20 | | 7,911 | 7,919 |
| 4.5% 6/1/25 | | 2,416 | 2,480 |
| DCP Midstream LLC: | | | |
| 4.75% 9/30/21 (d) | | 6,909 | 7,030 |
| 5.35% 3/15/20 (d) | | 6,814 | 6,933 |
| DCP Midstream Operating LP: | | | |
| 3.875% 3/15/23 | | 2,761 | 2,740 |
| 4.95% 4/1/22 | | 1,267 | 1,296 |
| 5.6% 4/1/44 | | 2,216 | 2,047 |
| Duke Energy Field Services 6.45% 11/3/36 (d) | | 6,493 | 6,542 |
| Empresa Nacional de Petroleo 4.375% 10/30/24 (d) | | 5,615 | 5,709 |
| Enable Midstream Partners LP: | | | |
| 2.4% 5/15/19 (g) | | 1,957 | 1,954 |
| 3.9% 5/15/24 (g) | | 2,064 | 2,010 |
| Enbridge Energy Partners LP: | | | |
| 4.2% 9/15/21 | | 8,103 | 8,248 |
| 4.375% 10/15/20 | | 5,808 | 5,913 |
| Enbridge, Inc. 4.25% 12/1/26 | | 3,252 | 3,316 |
| Energy Transfer Partners LP: | | | |
| 4.2% 9/15/23 | | 2,113 | 2,155 |
| 4.5% 4/15/24 | | 2,294 | 2,356 |
| 4.95% 6/15/28 | | 7,210 | 7,346 |
| 5.25% 4/15/29 | | 3,732 | 3,903 |
| 5.8% 6/15/38 | | 4,020 | 4,103 |
| 6% 6/15/48 | | 2,618 | 2,716 |
| 6.25% 4/15/49 | | 5,817 | 6,243 |
| Kinder Morgan Energy Partners LP 6.55% 9/15/40 | | 904 | 1,039 |
| Kinder Morgan, Inc. 5.55% 6/1/45 | | 4,432 | 4,653 |
| Marathon Petroleum Corp. 5.125% 3/1/21 | | 4,415 | 4,566 |
| MPLX LP: | | | |
| 4.5% 7/15/23 | | 3,584 | 3,704 |
| 4.8% 2/15/29 | | 2,108 | 2,161 |
| 4.875% 12/1/24 | | 4,918 | 5,134 |
| 5.5% 2/15/49 | | 6,323 | 6,476 |
| Nakilat, Inc. 6.067% 12/31/33 (d) | | 2,490 | 2,795 |
| Nexen, Inc. 6.2% 7/30/19 | | 2,252 | 2,281 |
| Petrobras Global Finance BV: | | | |
| 4.375% 5/20/23 | | 4,137 | 4,150 |
| 7.25% 3/17/44 | | 30,172 | 32,239 |
| Petroleos Mexicanos: | | | |
| 3.5% 1/30/23 | | 5,005 | 4,662 |
| 4.5% 1/23/26 | | 11,915 | 10,640 |
| 4.625% 9/21/23 | | 13,980 | 13,389 |
| 4.875% 1/24/22 | | 1,430 | 1,419 |
| 4.875% 1/18/24 | | 7,021 | 6,708 |
| 5.375% 3/13/22 | | 4,960 | 4,970 |
| 5.5% 1/21/21 | | 13,423 | 13,594 |
| 5.5% 6/27/44 | | 6,301 | 4,912 |
| 5.625% 1/23/46 | | 11,673 | 9,134 |
| 6% 3/5/20 | | 3,052 | 3,105 |
| 6.35% 2/12/48 | | 15,500 | 12,857 |
| 6.375% 1/23/45 | | 26,396 | 22,166 |
| 6.5% 3/13/27 | | 8,390 | 8,101 |
| 6.5% 6/2/41 | | 8,420 | 7,325 |
| 6.75% 9/21/47 | | 21,513 | 18,654 |
| 6.875% 8/4/26 | | 13,000 | 12,984 |
| 8% 5/3/19 | | 3,330 | 3,355 |
| Phillips 66 Co. 4.3% 4/1/22 | | 6,383 | 6,602 |
| Phillips 66 Partners LP 2.646% 2/15/20 | | 652 | 650 |
| Southeast Supply Header LLC 4.25% 6/15/24 (d) | | 5,790 | 5,770 |
| Southwestern Energy Co. 6.2% 1/23/25 (g) | | 4,632 | 4,584 |
| Sunoco Logistics Partner Operations LP 5.4% 10/1/47 | | 2,451 | 2,358 |
| The Williams Companies, Inc.: | | | |
| 3.7% 1/15/23 | | 5,046 | 5,042 |
| 4.55% 6/24/24 | | 25,316 | 26,075 |
| Western Gas Partners LP: | | | |
| 4.5% 3/1/28 | | 1,600 | 1,549 |
| 4.65% 7/1/26 | | 2,228 | 2,212 |
| 4.75% 8/15/28 | | 2,109 | 2,081 |
| 5.375% 6/1/21 | | 23,110 | 23,809 |
| Williams Partners LP: | | | |
| 3.6% 3/15/22 | | 6,925 | 6,962 |
| 3.9% 1/15/25 | | 2,391 | 2,395 |
| 4% 11/15/21 | | 3,157 | 3,208 |
| 4.3% 3/4/24 | | 10,014 | 10,243 |
| 4.5% 11/15/23 | | 3,444 | 3,554 |
| | | | 517,798 |
|
| TOTAL ENERGY | | | 539,696 |
|
| FINANCIALS - 4.6% | | | |
| Banks - 2.3% | | | |
| Bank of America Corp.: | | | |
| 3.004% 12/20/23 (g) | | 49,521 | 48,877 |
| 3.3% 1/11/23 | | 13,500 | 13,540 |
| 3.419% 12/20/28 (g) | | 10,395 | 10,029 |
| 3.5% 4/19/26 | | 9,902 | 9,802 |
| 3.864% 7/23/24 (g) | | 8,285 | 8,419 |
| 3.95% 4/21/25 | | 6,998 | 6,993 |
| 4.2% 8/26/24 | | 11,449 | 11,669 |
| 4.25% 10/22/26 | | 6,748 | 6,779 |
| 4.45% 3/3/26 | | 2,886 | 2,938 |
| Barclays PLC: | | | |
| 2.75% 11/8/19 | | 5,728 | 5,706 |
| 3.25% 1/12/21 | | 8,790 | 8,730 |
| 4.375% 1/12/26 | | 11,847 | 11,750 |
| 5.2% 5/12/26 | | 10,495 | 10,560 |
| BB&T Corp. 3.95% 3/22/22 | | 1,805 | 1,836 |
| Citigroup, Inc.: | | | |
| 2.7% 10/27/22 | | 53,057 | 52,100 |
| 3.875% 3/26/25 | | 17,000 | 16,894 |
| 4.05% 7/30/22 | | 17,500 | 17,837 |
| 4.3% 11/20/26 | | 17,098 | 17,120 |
| 4.45% 9/29/27 | | 14,000 | 14,048 |
| Citizens Bank NA 2.55% 5/13/21 | | 3,064 | 3,025 |
| Citizens Financial Group, Inc. 4.15% 9/28/22 (d) | | 7,659 | 7,699 |
| Credit Suisse Group Funding Guernsey Ltd.: | | | |
| 2.75% 3/26/20 | | 8,440 | 8,405 |
| 3.75% 3/26/25 | | 8,440 | 8,340 |
| 3.8% 9/15/22 | | 13,270 | 13,341 |
| 3.8% 6/9/23 | | 16,850 | 16,849 |
| 4.55% 4/17/26 | | 4,788 | 4,905 |
| Credit Suisse New York Branch 5.4% 1/14/20 | | 1,450 | 1,477 |
| Discover Bank 7% 4/15/20 | | 4,144 | 4,303 |
| Fifth Third Bancorp: | | | |
| 2.875% 7/27/20 | | 43,000 | 42,935 |
| 3.5% 3/15/22 | | 638 | 643 |
| HSBC Holdings PLC 4.25% 3/14/24 | | 3,415 | 3,458 |
| Huntington Bancshares, Inc. 7% 12/15/20 | | 3,353 | 3,567 |
| Huntington National Bank: | | | |
| 2.2% 4/1/19 | | 3,200 | 3,199 |
| 2.4% 4/1/20 | | 40,000 | 39,769 |
| Intesa Sanpaolo SpA: | | | |
| 5.017% 6/26/24 (d) | | 7,748 | 7,179 |
| 5.71% 1/15/26 (d) | | 18,498 | 17,322 |
| JPMorgan Chase & Co.: | | | |
| 2.95% 10/1/26 | | 34,906 | 33,279 |
| 3.797% 7/23/24 (g) | | 10,331 | 10,479 |
| 3.875% 9/10/24 | | 24,177 | 24,456 |
| 4.125% 12/15/26 | | 61,229 | 61,961 |
| KeyCorp. 5.1% 3/24/21 | | 628 | 653 |
| Rabobank Nederland 4.375% 8/4/25 | | 13,516 | 13,673 |
| Regions Bank 6.45% 6/26/37 | | 12,100 | 14,382 |
| Regions Financial Corp. 3.2% 2/8/21 | | 5,563 | 5,570 |
| Royal Bank of Scotland Group PLC: | | | |
| 5.125% 5/28/24 | | 23,104 | 23,419 |
| 6% 12/19/23 | | 16,075 | 16,892 |
| 6.1% 6/10/23 | | 12,713 | 13,335 |
| 6.125% 12/15/22 | | 39,429 | 41,597 |
| UniCredit SpA 6.572% 1/14/22 (d) | | 10,119 | 10,374 |
| | | | 732,113 |
| Capital Markets - 1.4% | | | |
| Affiliated Managers Group, Inc.: | | | |
| 3.5% 8/1/25 | | 9,670 | 9,352 |
| 4.25% 2/15/24 | | 3,357 | 3,448 |
| Credit Suisse Group AG 3.869% 1/12/29 (d)(g) | | 6,889 | 6,627 |
| Deutsche Bank AG 4.5% 4/1/25 | | 27,715 | 25,800 |
| Deutsche Bank AG New York Branch: | | | |
| 3.3% 11/16/22 | | 18,270 | 17,243 |
| 5% 2/14/22 | | 16,487 | 16,589 |
| Goldman Sachs Group, Inc.: | | | |
| 2.876% 10/31/22 (g) | | 125,990 | 124,102 |
| 3.2% 2/23/23 | | 14,500 | 14,374 |
| 4.25% 10/21/25 | | 4,219 | 4,236 |
| 6.75% 10/1/37 | | 4,014 | 4,774 |
| IntercontinentalExchange, Inc. 2.75% 12/1/20 | | 3,082 | 3,070 |
| Lazard Group LLC 4.25% 11/14/20 | | 2,027 | 2,058 |
| Moody's Corp.: | | | |
| 3.25% 1/15/28 | | 4,208 | 4,019 |
| 4.875% 2/15/24 | | 3,952 | 4,180 |
| Morgan Stanley: | | | |
| 2.65% 1/27/20 | | 2,659 | 2,651 |
| 3.125% 1/23/23 | | 68,526 | 67,977 |
| 3.125% 7/27/26 | | 1,531 | 1,461 |
| 3.7% 10/23/24 | | 5,388 | 5,412 |
| 3.737% 4/24/24 (g) | | 53,000 | 53,462 |
| 4.35% 9/8/26 | | 8,014 | 8,047 |
| 4.431% 1/23/30(g) | | 8,038 | 8,300 |
| 4.875% 11/1/22 | | 8,674 | 9,079 |
| 5% 11/24/25 | | 13,300 | 13,980 |
| 5.625% 9/23/19 | | 547 | 555 |
| Peachtree Corners Funding Trust 3.976% 2/15/25 (d) | | 10,000 | 9,930 |
| UBS AG Stamford Branch 2.375% 8/14/19 | | 12,750 | 12,732 |
| UBS Group Funding Ltd. 4.125% 9/24/25 (d) | | 9,717 | 9,880 |
| | | | 443,338 |
| Consumer Finance - 0.3% | | | |
| AerCap Ireland Capital Ltd./AerCap Global Aviation Trust: | | | |
| 3.5% 5/26/22 | | 3,172 | 3,128 |
| 4.125% 7/3/23 | | 7,468 | 7,419 |
| 4.45% 12/16/21 | | 5,342 | 5,412 |
| 4.875% 1/16/24 | | 3,187 | 3,261 |
| Capital One Financial Corp. 3.8% 1/31/28 | | 7,659 | 7,360 |
| Discover Financial Services: | | | |
| 3.85% 11/21/22 | | 2,701 | 2,717 |
| 3.95% 11/6/24 | | 20,000 | 19,795 |
| 4.5% 1/30/26 | | 8,513 | 8,552 |
| 5.2% 4/27/22 | | 2,488 | 2,603 |
| Ford Motor Credit Co. LLC: | | | |
| 5.085% 1/7/21 | | 5,501 | 5,603 |
| 5.596% 1/7/22 | | 11,381 | 11,660 |
| 5.875% 8/2/21 | | 12,574 | 12,994 |
| Synchrony Financial: | | | |
| 3% 8/15/19 | | 2,283 | 2,282 |
| 3.75% 8/15/21 | | 8,466 | 8,485 |
| 3.95% 12/1/27 | | 13,987 | 12,808 |
| 4.25% 8/15/24 | | 3,469 | 3,400 |
| | | | 117,479 |
| Diversified Financial Services - 0.2% | | | |
| AXA Equitable Holdings, Inc. 3.9% 4/20/23 | | 1,851 | 1,865 |
| Brixmor Operating Partnership LP: | | | |
| 3.25% 9/15/23 | | 11,325 | 10,992 |
| 3.875% 8/15/22 | | 10,251 | 10,257 |
| 4.125% 6/15/26 | | 3,990 | 3,897 |
| Cigna Corp.: | | | |
| 4.125% 11/15/25 (d) | | 4,310 | 4,375 |
| 4.375% 10/15/28 (d) | | 11,124 | 11,276 |
| 4.8% 8/15/38 (d) | | 6,926 | 6,912 |
| 4.9% 12/15/48 (d) | | 6,920 | 6,890 |
| Voya Financial, Inc. 3.125% 7/15/24 | | 4,991 | 4,830 |
| | | | 61,294 |
| Insurance - 0.4% | | | |
| AIA Group Ltd. 2.25% 3/11/19 (d) | | 1,416 | 1,416 |
| American International Group, Inc.: | | | |
| 3.3% 3/1/21 | | 4,640 | 4,646 |
| 3.75% 7/10/25 | | 14,847 | 14,593 |
| 4.875% 6/1/22 | | 11,881 | 12,450 |
| Aon Corp. 5% 9/30/20 | | 129 | 132 |
| Liberty Mutual Group, Inc.: | | | |
| 4.25% 6/15/23 (d) | | 1,433 | 1,456 |
| 4.569% 2/1/29 (d) | | 13,590 | 13,754 |
| Marsh & McLennan Companies, Inc.: | | | |
| 4.375% 3/15/29 | | 7,233 | 7,455 |
| 4.75% 3/15/39 | | 3,319 | 3,437 |
| 4.8% 7/15/21 | | 4,819 | 4,984 |
| 4.9% 3/15/49 | | 6,605 | 6,948 |
| Massachusetts Mutual Life Insurance Co. 4.5% 4/15/65 (d) | | 9,547 | 8,981 |
| Northwestern Mutual Life Insurance Co. 6.063% 3/30/40 (d) | | 4,915 | 6,068 |
| Pacific LifeCorp 5.125% 1/30/43 (d) | | 7,709 | 7,885 |
| Prudential Financial, Inc. 7.375% 6/15/19 | | 2,520 | 2,552 |
| Teachers Insurance & Annuity Association of America 4.9% 9/15/44 (d) | | 8,243 | 8,819 |
| TIAA Asset Management Finance LLC 4.125% 11/1/24 (d) | | 2,810 | 2,901 |
| Unum Group: | | | |
| 3.875% 11/5/25 | | 9,271 | 9,016 |
| 5.625% 9/15/20 | | 3,860 | 3,987 |
| 5.75% 8/15/42 | | 12,079 | 12,590 |
| | | | 134,070 |
|
| TOTAL FINANCIALS | | | 1,488,294 |
|
| HEALTH CARE - 0.7% | | | |
| Health Care Equipment & Supplies - 0.0% | | | |
| Becton, Dickinson & Co.: | | | |
| 2.894% 6/6/22 | | 4,880 | 4,826 |
| 3.7% 6/6/27 | | 2,392 | 2,317 |
| | | | 7,143 |
| Health Care Providers & Services - 0.5% | | | |
| Cigna Corp. 3.75% 7/15/23 (d) | | 8,913 | 9,020 |
| CVS Health Corp.: | | | |
| 3.7% 3/9/23 | | 4,500 | 4,528 |
| 3.875% 7/20/25 | | 7,967 | 7,950 |
| 4.1% 3/25/25 | | 20,820 | 21,105 |
| 4.3% 3/25/28 | | 24,177 | 24,194 |
| 4.78% 3/25/38 | | 10,763 | 10,470 |
| 5.05% 3/25/48 | | 15,824 | 15,680 |
| Elanco Animal Health, Inc.: | | | |
| 3.912% 8/27/21 (d) | | 1,834 | 1,846 |
| 4.272% 8/28/23 (d) | | 5,788 | 5,874 |
| 4.9% 8/28/28 (d) | | 2,438 | 2,526 |
| HCA Holdings, Inc.: | | | |
| 4.25% 10/15/19 | | 20,200 | 20,327 |
| 4.75% 5/1/23 | | 375 | 388 |
| 5.875% 3/15/22 | | 450 | 479 |
| 6.5% 2/15/20 | | 12,966 | 13,354 |
| Medco Health Solutions, Inc. 4.125% 9/15/20 | | 5,031 | 5,103 |
| Toledo Hospital: | | | |
| 5.325% 11/15/28 | | 3,910 | 4,018 |
| 6.015% 11/15/48 | | 18,768 | 19,857 |
| | | | 166,719 |
| Pharmaceuticals - 0.2% | | | |
| Actavis Funding SCS 3.45% 3/15/22 | | 16,210 | 16,139 |
| Bayer U.S. Finance II LLC 4.25% 12/15/25 (d) | | 7,941 | 7,943 |
| Mylan NV: | | | |
| 2.5% 6/7/19 | | 2,645 | 2,641 |
| 3.15% 6/15/21 | | 9,840 | 9,728 |
| 3.95% 6/15/26 | | 4,843 | 4,516 |
| 4.55% 4/15/28 | | 6,200 | 5,851 |
| Perrigo Finance PLC 3.5% 12/15/21 | | 739 | 711 |
| Teva Pharmaceutical Finance Netherlands III BV: | | | |
| 2.2% 7/21/21 | | 6,966 | 6,619 |
| 2.8% 7/21/23 | | 2,817 | 2,549 |
| | | | 56,697 |
|
| TOTAL HEALTH CARE | | | 230,559 |
|
| INDUSTRIALS - 0.1% | | | |
| Aerospace & Defense - 0.0% | | | |
| BAE Systems Holdings, Inc. 6.375% 6/1/19 (d) | | 5,000 | 5,039 |
| Machinery - 0.0% | | | |
| Ingersoll-Rand Luxembourg Finance SA 2.625% 5/1/20 | | 1,829 | 1,814 |
| Professional Services - 0.0% | | | |
| Thomson Reuters Corp. 3.85% 9/29/24 | | 1,596 | 1,562 |
| Trading Companies & Distributors - 0.1% | | | |
| Air Lease Corp.: | | | |
| 3% 9/15/23 | | 1,367 | 1,312 |
| 3.375% 6/1/21 | | 4,953 | 4,918 |
| 3.75% 2/1/22 | | 7,839 | 7,852 |
| 3.875% 4/1/21 | | 4,953 | 4,990 |
| 4.25% 2/1/24 | | 10,444 | 10,503 |
| 4.25% 9/15/24 | | 5,492 | 5,489 |
| 4.75% 3/1/20 | | 5,518 | 5,596 |
| | | | 40,660 |
|
| TOTAL INDUSTRIALS | | | 49,075 |
|
| INFORMATION TECHNOLOGY - 0.0% | | | |
| Electronic Equipment & Components - 0.0% | | | |
| Diamond 1 Finance Corp./Diamond 2 Finance Corp.: | | | |
| 5.45% 6/15/23 (d) | | 8,400 | 8,827 |
| 6.02% 6/15/26 (d) | | 2,888 | 3,063 |
| | | | 11,890 |
| MATERIALS - 0.1% | | | |
| Metals & Mining - 0.1% | | | |
| BHP Billiton Financial (U.S.A.) Ltd.: | | | |
| 6.25% 10/19/75 (d)(g) | | 3,645 | 3,794 |
| 6.75% 10/19/75 (d)(g) | | 9,054 | 9,932 |
| Corporacion Nacional del Cobre de Chile (Codelco): | | | |
| 3.625% 8/1/27 (d) | | 2,954 | 2,915 |
| 4.5% 8/1/47 (d) | | 3,000 | 3,006 |
| | | | 19,647 |
| REAL ESTATE - 1.0% | | | |
| Equity Real Estate Investment Trusts (REITs) - 0.7% | | | |
| Alexandria Real Estate Equities, Inc.: | | | |
| 2.75% 1/15/20 | | 1,369 | 1,363 |
| 4.6% 4/1/22 | | 2,434 | 2,512 |
| American Campus Communities Operating Partnership LP 3.75% 4/15/23 | | 1,759 | 1,756 |
| American Tower Corp. 2.8% 6/1/20 | | 8,000 | 7,968 |
| AvalonBay Communities, Inc. 3.625% 10/1/20 | | 2,800 | 2,827 |
| Boston Properties, Inc. 4.5% 12/1/28 | | 7,294 | 7,563 |
| Camden Property Trust 2.95% 12/15/22 | | 2,417 | 2,390 |
| CommonWealth REIT 5.875% 9/15/20 | | 1,166 | 1,192 |
| Corporate Office Properties LP: | | | |
| 3.7% 6/15/21 | | 4,267 | 4,233 |
| 5% 7/1/25 | | 5,570 | 5,710 |
| DDR Corp.: | | | |
| 3.625% 2/1/25 | | 3,968 | 3,828 |
| 4.25% 2/1/26 | | 3,429 | 3,389 |
| 4.625% 7/15/22 | | 1,402 | 1,435 |
| Duke Realty LP: | | | |
| 3.625% 4/15/23 | | 3,152 | 3,169 |
| 3.75% 12/1/24 | | 2,549 | 2,559 |
| 3.875% 10/15/22 | | 5,452 | 5,551 |
| Equity One, Inc. 3.75% 11/15/22 | | 8,200 | 8,243 |
| HCP, Inc.: | | | |
| 3.4% 2/1/25 | | 7,000 | 6,801 |
| 3.875% 8/15/24 | | 13,000 | 13,043 |
| Health Care REIT, Inc. 4.125% 4/1/19 | | 13,700 | 13,705 |
| Hudson Pacific Properties LP 4.65% 4/1/29 | | 2,518 | 2,480 |
| Lexington Corporate Properties Trust 4.4% 6/15/24 | | 2,249 | 2,244 |
| Omega Healthcare Investors, Inc.: | | | |
| 4.375% 8/1/23 | | 11,855 | 11,924 |
| 4.5% 1/15/25 | | 4,460 | 4,439 |
| 4.5% 4/1/27 | | 34,977 | 34,304 |
| 4.75% 1/15/28 | | 11,399 | 11,398 |
| 4.95% 4/1/24 | | 2,101 | 2,139 |
| 5.25% 1/15/26 | | 10,420 | 10,715 |
| Retail Opportunity Investments Partnership LP: | | | |
| 4% 12/15/24 | | 1,583 | 1,508 |
| 5% 12/15/23 | | 1,140 | 1,146 |
| Store Capital Corp. 4.625% 3/15/29 | | 3,261 | 3,219 |
| Ventas Realty LP: | | | |
| 3.125% 6/15/23 | | 2,534 | 2,497 |
| 3.5% 2/1/25 | | 2,833 | 2,792 |
| 3.75% 5/1/24 | | 7,900 | 7,932 |
| 4% 3/1/28 | | 4,046 | 3,989 |
| 4.125% 1/15/26 | | 2,782 | 2,793 |
| 4.375% 2/1/45 | | 1,322 | 1,224 |
| Weingarten Realty Investors 3.375% 10/15/22 | | 1,228 | 1,216 |
| WP Carey, Inc. 4% 2/1/25 | | 9,404 | 9,275 |
| | | | 216,471 |
| Real Estate Management & Development - 0.3% | | | |
| Brandywine Operating Partnership LP: | | | |
| 3.95% 2/15/23 | | 9,479 | 9,520 |
| 3.95% 11/15/27 | | 7,910 | 7,616 |
| 4.1% 10/1/24 | | 6,548 | 6,524 |
| 4.55% 10/1/29 | | 7,034 | 6,965 |
| Digital Realty Trust LP: | | | |
| 3.4% 10/1/20 | | 9,100 | 9,127 |
| 3.95% 7/1/22 | | 5,951 | 6,026 |
| 4.75% 10/1/25 | | 6,539 | 6,802 |
| 5.25% 3/15/21 | | 4,138 | 4,269 |
| Liberty Property LP: | | | |
| 3.375% 6/15/23 | | 3,313 | 3,278 |
| 4.125% 6/15/22 | | 3,219 | 3,291 |
| 4.75% 10/1/20 | | 8,747 | 8,919 |
| Mack-Cali Realty LP: | | | |
| 3.15% 5/15/23 | | 7,438 | 6,314 |
| 4.5% 4/18/22 | | 2,016 | 1,914 |
| Post Apartment Homes LP 3.375% 12/1/22 | | 1,364 | 1,357 |
| Tanger Properties LP: | | | |
| 3.125% 9/1/26 | | 5,880 | 5,335 |
| 3.75% 12/1/24 | | 4,790 | 4,668 |
| 3.875% 12/1/23 | | 2,716 | 2,694 |
| | | | 94,619 |
|
| TOTAL REAL ESTATE | | | 311,090 |
|
| UTILITIES - 0.5% | | | |
| Electric Utilities - 0.4% | | | |
| Cleco Corporate Holdings LLC 3.743% 5/1/26 | | 3,700 | 3,527 |
| Duquesne Light Holdings, Inc.: | | | |
| 5.9% 12/1/21 (d) | | 5,539 | 5,836 |
| 6.4% 9/15/20 (d) | | 14,254 | 14,843 |
| FirstEnergy Corp.: | | | |
| 4.25% 3/15/23 | | 27,079 | 27,733 |
| 7.375% 11/15/31 | | 35,412 | 45,634 |
| IPALCO Enterprises, Inc.: | | | |
| 3.45% 7/15/20 | | 13,932 | 13,895 |
| 3.7% 9/1/24 | | 3,782 | 3,717 |
| LG&E and KU Energy LLC 3.75% 11/15/20 | | 1,034 | 1,041 |
| NV Energy, Inc. 6.25% 11/15/20 | | 1,957 | 2,057 |
| TECO Finance, Inc. 5.15% 3/15/20 | | 164 | 167 |
| | | | 118,450 |
| Gas Utilities - 0.0% | | | |
| Southern Natural Gas Co./Southern Natural Issuing Corp. 4.4% 6/15/21 | | 2,473 | 2,532 |
| Independent Power and Renewable Electricity Producers - 0.0% | | | |
| Emera U.S. Finance LP: | | | |
| 2.15% 6/15/19 | | 2,358 | 2,350 |
| 2.7% 6/15/21 | | 2,321 | 2,278 |
| 3.55% 6/15/26 | | 3,712 | 3,561 |
| | | | 8,189 |
| Multi-Utilities - 0.1% | | | |
| Dominion Resources, Inc.: | | | |
| 3 month U.S. LIBOR + 2.300% 5.103% 9/30/66 (g)(h) | | 20,448 | 18,812 |
| 3 month U.S. LIBOR + 2.825% 5.628% 6/30/66 (g)(h) | | 5,485 | 5,211 |
| Puget Energy, Inc. 6% 9/1/21 | | 813 | 858 |
| Wisconsin Energy Corp. 3 month U.S. LIBOR + 2.113% 4.7963% 5/15/67 (g)(h) | | 4,882 | 4,294 |
| | | | 29,175 |
|
| TOTAL UTILITIES | | | 158,346 |
|
| TOTAL NONCONVERTIBLE BONDS | | | |
| (Cost $3,506,133) | | | 3,513,104 |
|
| U.S. Government and Government Agency Obligations - 9.5% | | | |
| U.S. Treasury Inflation-Protected Obligations - 1.0% | | | |
| U.S. Treasury Inflation-Indexed Bonds: | | | |
| 0.75% 2/15/45 | | $60,248 | $55,277 |
| 1% 2/15/46 | | 26,200 | 25,478 |
| U.S. Treasury Inflation-Indexed Notes: | | | |
| 0.125% 7/15/26 | | 17,294 | 16,623 |
| 0.375% 1/15/27 | | 31,118 | 30,261 |
| 0.625% 1/15/26 | | 96,623 | 96,224 |
| 0.75% 7/15/28 | | 97,364 | 97,491 |
|
| TOTAL U.S. TREASURY INFLATION-PROTECTED OBLIGATIONS | | | 321,354 |
|
| U.S. Treasury Obligations - 8.5% | | | |
| U.S. Treasury Bills, yield at date of purchase 2.41% 5/30/19 (i) | | 8,380 | 8,330 |
| U.S. Treasury Bonds: | | | |
| 2.75% 11/15/47 | | 49,046 | 45,848 |
| 3% 2/15/49 (b) | | 316,398 | 311,133 |
| U.S. Treasury Notes: | | | |
| 1.25% 10/31/21 (j) | | 441,071 | 426,805 |
| 1.75% 6/30/22 | | 95,692 | 93,416 |
| 1.875% 3/31/22 | | 207,272 | 203,507 |
| 1.875% 7/31/22 | | 98,619 | 96,585 |
| 2% 12/31/21 | | 442,692 | 436,726 |
| 2.125% 12/31/22 | | 201,389 | 198,510 |
| 2.125% 7/31/24 | | 236,093 | 230,892 |
| 2.125% 11/30/24 | | 137,131 | 133,826 |
| 2.25% 12/31/24 | | 157,034 | 154,225 |
| 2.25% 8/15/27 | | 9,044 | 8,748 |
| 2.375% 2/29/24 | | 81,650 | 81,105 |
| 2.5% 1/31/24 (b) | | 80,000 | 79,913 |
| 2.625% 6/30/23 | | 105,807 | 106,241 |
| 3.125% 11/15/28 | | 97,390 | 100,715 |
|
| TOTAL U.S. TREASURY OBLIGATIONS | | | 2,716,525 |
|
| TOTAL U.S. GOVERNMENT AND GOVERNMENT AGENCY OBLIGATIONS | | | |
| (Cost $3,088,660) | | | 3,037,879 |
|
| Asset-Backed Securities - 0.3% | | | |
| AASET Trust Series 2018-1A Class A, 3.844% 1/16/38 (d) | | $7,416 | $7,377 |
| Blackbird Capital Aircraft Series 2016-1A: | | | |
| Class A, 4.213% 12/16/41 (d) | | 15,937 | 16,093 |
| Class AA, 2.487% 12/16/41 (d) | | 3,426 | 3,332 |
| Castlelake Aircraft Structured Trust Series 2018-1 Class A, 4.125% 6/15/43 (d) | | 12,328 | 12,312 |
| Countrywide Home Loans, Inc. Series 2004-7 Class AF5, 4.7734% 1/25/35 | | 203 | 203 |
| DB Master Finance LLC Series 2017-1A: | | | |
| Class A2I, 3.629% 11/20/47 (d) | | 6,111 | 6,014 |
| Class A2II, 4.03% 11/20/47 (d) | | 10,310 | 10,140 |
| First Franklin Mortgage Loan Trust Series 2004-FF2 Class M3, 1 month U.S. LIBOR + 0.825% 3.3149% 3/25/34 (g)(h) | | 2 | 2 |
| GE Business Loan Trust Series 2006-2A: | | | |
| Class A, 1 month U.S. LIBOR + 0.180% 2.6688% 11/15/34 (d)(g)(h) | | 242 | 238 |
| Class B, 1 month U.S. LIBOR + 0.280% 2.7688% 11/15/34 (d)(g)(h) | | 87 | 86 |
| Class C, 1 month U.S. LIBOR + 0.380% 2.8688% 11/15/34 (d)(g)(h) | | 145 | 138 |
| Class D, 1 month U.S. LIBOR + 0.750% 3.2388% 11/15/34 (d)(g)(h) | | 55 | 52 |
| Horizon Aircraft Finance I Ltd. Series 2018-1 Class A, 4.458% 12/15/38 (d) | | 5,642 | 5,722 |
| Keycorp Student Loan Trust Series 2006-A Class 2C, 3 month U.S. LIBOR + 1.150% 3.9716% 3/27/42 (g)(h) | | 2,909 | 2,363 |
| Magnetite CLO Ltd. Series 2019-21A Class A, 3 month U.S. LIBOR + 1.280% 0% 4/20/30 (d)(g)(h)(k) | | 10,257 | 10,257 |
| New Century Home Equity Loan Trust Series 2005-4 Class M2, 1 month U.S. LIBOR + 0.510% 2.9999% 9/25/35 (g)(h) | | 1,064 | 1,062 |
| Park Place Securities, Inc. Series 2005-WCH1 Class M4, 1 month U.S. LIBOR + 1.245% 3.7349% 1/25/36 (g)(h) | | 1,620 | 1,607 |
| Terwin Mortgage Trust Series 2003-4HE Class A1, 1 month U.S. LIBOR + 0.860% 3.3499% 9/25/34 (g)(h) | | 27 | 26 |
| Thunderbolt Aircraft Lease Ltd. Series 2018-A Class A, 4.147% 9/15/38 (d) | | 12,454 | 12,529 |
| Trapeza CDO XII Ltd./Trapeza CDO XII, Inc. Series 2007-12A Class B, 3 month U.S. LIBOR + 0.560% 3.355% 4/6/42 (d)(f)(g)(h) | | 2,116 | 1,464 |
| TOTAL ASSET-BACKED SECURITIES | | | |
| (Cost $86,407) | | | 91,017 |
|
| Collateralized Mortgage Obligations - 0.0% | | | |
| Private Sponsor - 0.0% | | | |
| Bear Stearns ALT-A Trust floater Series 2005-1 Class A1, 1 month U.S. LIBOR + 0.560% 3.0499% 1/25/35 (g)(h) | | 204 | 204 |
| Merrill Lynch Alternative Note Asset Trust floater Series 2007-OAR1 Class A1, 1 month U.S. LIBOR + 0.170% 2.68% 2/25/37 (g)(h) | | 167 | 165 |
| Opteum Mortgage Acceptance Corp. floater Series 2005-3 Class APT, 1 month U.S. LIBOR + 0.290% 2.7799% 7/25/35 (g)(h) | | 192 | 190 |
| Sequoia Mortgage Trust floater Series 2004-6 Class A3B, 6 month U.S. LIBOR + 0.880% 3.3769% 7/20/34 (g)(h) | | 15 | 15 |
| Thornburg Mortgage Securities Trust floater Series 2003-4 Class A1, 1 month U.S. LIBOR + 0.640% 3.1299% 9/25/43 (g)(h) | | 955 | 948 |
|
| TOTAL PRIVATE SPONSOR | | | 1,522 |
|
| U.S. Government Agency - 0.0% | | | |
| Ginnie Mae guaranteed REMIC pass-thru certificates: | | | |
| sequential payer Series 2013-H06 Class HA, 1.65% 1/20/63 (l) | | 4,477 | 4,428 |
| Series 2015-H21 Class JA, 2.5% 6/20/65 (l) | | 4,286 | 4,266 |
|
| TOTAL U.S. GOVERNMENT AGENCY | | | 8,694 |
|
| TOTAL COLLATERALIZED MORTGAGE OBLIGATIONS | | | |
| (Cost $10,167) | | | 10,216 |
|
| Commercial Mortgage Securities - 0.4% | | | |
| Asset Securitization Corp. Series 1997-D5 Class PS1, 1.8356% 2/14/43 (g)(m) | | 15 | 0 |
| Bayview Commercial Asset Trust: | | | |
| Series 2004-1, Class IO, 1.25% 4/25/34 (d)(m) | | 540 | 21 |
| Series 2006-3A, Class IO, 0% 10/25/36 (d)(f)(g)(m) | | 9,660 | 0 |
| Benchmark Mortgage Trust Series 2018-B8 Class A5, 4.2317% 1/15/52 | | 19,567 | 20,578 |
| BX Trust floater: | | | |
| Series 2018-EXCL Class D, 1 month U.S. LIBOR + 2.625% 5.1138% 9/15/37 (d)(g)(h) | | 3,670 | 3,665 |
| Series 2018-IND Class F, 1 month U.S. LIBOR + 1.800% 4.2888% 11/15/35 (d)(g)(h) | | 5,322 | 5,330 |
| Citigroup Commercial Mortgage Trust Series 2018-C6 Class A4, 4.412% 11/10/51 | | 6,304 | 6,710 |
| Credit Suisse Mortgage Trust Series 2018-SITE: | | | |
| Class A, 4.284% 4/15/36 (d) | | 6,999 | 7,254 |
| Class B, 4.5349% 4/15/36 (d) | | 1,255 | 1,300 |
| Class C, 4.6278% 4/15/36 (d) | | 1,444 | 1,483 |
| Class D, 4.6278% 4/15/36 (d) | | 2,888 | 2,902 |
| CSAIL Commercial Mtg Trust Series 2018-C14 Class A4 4.4216% 11/15/51 | | 5,179 | 5,499 |
| GAHR Commercial Mortgage Trust Series 2015-NRF: | | | |
| Class BFX, 3.3822% 12/15/34 (d)(g) | | 7,930 | 7,895 |
| Class CFX, 3.3822% 12/15/34 (d)(g) | | 6,656 | 6,617 |
| Class DFX, 3.3822% 12/15/34 (d)(g) | | 5,641 | 5,589 |
| JPMorgan Chase Commercial Mortgage Securities Trust Series 2018-WPT: | | | |
| Class CFX, 4.9498% 7/5/33 (d) | | 1,323 | 1,381 |
| Class DFX, 5.3503% 7/5/33 (d) | | 2,035 | 2,124 |
| Class EFX, 5.5422% 7/5/33 (d) | | 2,784 | 2,893 |
| Morgan Stanley Capital I Trust Series 2018-H4 Class A4, 4.31% 12/15/51 | | 19,734 | 20,818 |
| MSCG Trust Series 2016-SNR: | | | |
| Class A, 3.348% 11/15/34 (d)(g) | | 7,135 | 6,982 |
| Class B, 4.181% 11/15/34 (d) | | 3,007 | 2,961 |
| Class C, 5.205% 11/15/34 (d) | | 2,110 | 2,100 |
| Wells Fargo Commercial Mortgage Trust Series 2018-C48 Class A5, 4.302% 1/15/52 | | 14,814 | 15,616 |
| TOTAL COMMERCIAL MORTGAGE SECURITIES | | | |
| (Cost $128,879) | | | 129,718 |
|
| Municipal Securities - 0.5% | | | |
| California Gen. Oblig. Series 2009: | | | |
| 7.35% 11/1/39 | | $1,255 | $1,771 |
| 7.5% 4/1/34 | | 8,780 | 12,362 |
| 7.55% 4/1/39 | | 17,675 | 25,960 |
| Chicago Gen. Oblig.: | | | |
| (Taxable Proj.): | | | |
| Series 2008 B, 5.63% 1/1/22 | | 920 | 931 |
| Series 2010 C1, 7.781% 1/1/35 | | 1,665 | 1,834 |
| Series 2012 B, 5.432% 1/1/42 | | 6,845 | 6,066 |
| 6.05% 1/1/29 | | 365 | 375 |
| Illinois Gen. Oblig.: | | | |
| Series 2003: | | | |
| 4.95% 6/1/23 | | 8,975 | 9,064 |
| 5.1% 6/1/33 | | 16,965 | 16,091 |
| Series 2010-1, 6.63% 2/1/35 | | 17,960 | 19,149 |
| Series 2010-3: | | | |
| 5.547% 4/1/19 | | 185 | 185 |
| 6.725% 4/1/35 | | 10,580 | 11,172 |
| 7.35% 7/1/35 | | 5,140 | 5,705 |
| Series 2010-5, 6.2% 7/1/21 | | 2,472 | 2,549 |
| Series 2011, 5.877% 3/1/19 | | 26,600 | 26,600 |
| Series 2013, 4% 12/1/20 | | 7,040 | 7,092 |
| TOTAL MUNICIPAL SECURITIES | | | |
| (Cost $142,182) | | | 146,906 |
|
| Foreign Government and Government Agency Obligations - 0.0% | | | |
Brazilian Federative Republic 4.625% 1/13/28
(Cost $3,827) | | $3,841 | $3,816 |
|
| Bank Notes - 0.2% | | | |
| Capital One NA 2.95% 7/23/21 | | 8,837 | 8,755 |
| Discover Bank: | | | |
| (Delaware) 3.2% 8/9/21 | | $10,936 | $10,897 |
| 3.1% 6/4/20 | | 11,505 | 11,496 |
| 3.35% 2/6/23 | | 5,490 | 5,422 |
| 4.682% 8/9/28 (g) | | 14,042 | 13,999 |
| 8.7% 11/18/19 | | 745 | 772 |
| RBS Citizens NA 2.5% 3/14/19 | | 5,410 | 5,410 |
| Synchrony Bank 3.65% 5/24/21 | | 8,499 | 8,536 |
| TOTAL BANK NOTES | | | |
| (Cost $65,476) | | | 65,287 |
| | | Shares | Value (000s) |
|
| Fixed-Income Funds - 9.8% | | | |
| Fidelity High Income Central Fund 2 (n) | | 6,597,017 | $725,276 |
| Fidelity Mortgage Backed Securities Central Fund (n) | | 22,982,268 | 2,440,257 |
| TOTAL FIXED-INCOME FUNDS | | | |
| (Cost $3,124,089) | | | 3,165,533 |
|
| Money Market Funds - 2.6% | | | |
| Fidelity Cash Central Fund, 2.44% (o) | | 711,238,848 | 711,381 |
| Fidelity Securities Lending Cash Central Fund 2.45% (o)(p) | | 126,318,924 | 126,332 |
| TOTAL MONEY MARKET FUNDS | | | |
| (Cost $837,662) | | | 837,713 |
| | | Maturity Amount (000s) | Value (000s) |
|
| Repurchase Agreements - 0.8% | | | |
| Investments in repurchase agreements in a joint trading account at 2.59%, dated 2/28/19 due 3/1/19 (Collateralized by U.S. Government Obligations) # (q) | | | |
| (Cost $260,748) | | 260,767 | 260,748 |
| TOTAL INVESTMENT IN SECURITIES - 101.3% | | | |
| (Cost $28,134,617) | | | 32,602,473 |
| NET OTHER ASSETS (LIABILITIES) - (1.3)% | | | (408,378) |
| NET ASSETS - 100% | | | $32,194,095 |
| Futures Contracts | | | | | |
| | Number of contracts | Expiration Date | Notional Amount (000s) | Value (000s) | Unrealized Appreciation/(Depreciation) (000s) |
| Purchased | | | | | |
| Equity Index Contracts | | | | | |
| CME E-mini S&P 500 Index Contracts (United States) | 1,247 | March 2019 | $173,626 | $12,970 | $12,970 |
The notional amount of futures purchased as a percentage of Net Assets is 0.5%
Swaps
| Underlying Reference | Rating(1) | Maturity Date | Clearinghouse / Counterparty | Fixed Payment Received/(Paid) | Payment Frequency | Notional Amount (000s)(2) | Value (000s)(1) | Upfront Premium Received/(Paid) (000s) | Unrealized Appreciation/(Depreciation) (000s) |
| Credit Default Swaps | | | | | | | | | |
| Sell Protection | | | | | | | | | |
| Ameriquest Mortgage Securities Inc Series 2004-R11 Class M9 | C | Dec. 2034 | Bank of America | 4.25% | Monthly | $161 | $(158) | $0 | $(158) |
(1) Ratings are presented for credit default swaps in which the Fund has sold protection on the underlying referenced debt. Ratings for an underlying index represent a weighted average of the ratings of all securities included in the index. The credit rating or value can be measures of the current payment/performance risk. Ratings are from Moody's Investors Service, Inc. Where Moody's® ratings are not available, S&P® ratings are disclosed and are indicated as such. All ratings are as of the report date and do not reflect subsequent changes.
(2) The notional amount of each credit default swap where the Fund has sold protection approximates the maximum potential amount of future payments that the Portfolio could be required to make if a credit event were to occur.
Values shown as $0 in the Schedule of Investments may reflect amounts less than $500.
Legend
(a) Non-income producing
(b) Security or a portion of the security is on loan at period end.
(c) Affiliated company
(d) Security exempt from registration under Rule 144A of the Securities Act of 1933. These securities may be resold in transactions exempt from registration, normally to qualified institutional buyers. At the end of the period, the value of these securities amounted to $492,970,000 or 1.5% of net assets.
(e) Restricted securities - Investment in securities not registered under the Securities Act of 1933 (excluding 144A issues). At the end of the period, the value of restricted securities (excluding 144A issues) amounted to $31,467,000 or 0.1% of net assets.
(f) Level 3 security
(g) Coupon rates for floating and adjustable rate securities reflect the rates in effect at period end.
(h) Coupon is indexed to a floating interest rate which may be multiplied by a specified factor and/or subject to caps or floors.
(i) Security or a portion of the security was pledged to cover margin requirements for futures contracts. At period end, the value of securities pledged amounted to $8,330,000.
(j) Security or a portion of the security has been segregated as collateral for open bi-lateral over-the-counter (OTC) swaps. At period end, the value of securities pledged amounted to $113,000.
(k) Security or a portion of the security purchased on a delayed delivery or when-issued basis.
(l) Represents an investment in an underlying pool of reverse mortgages which typically do not require regular principal and interest payments as repayment is deferred until a maturity event.
(m) Security represents right to receive monthly interest payments on an underlying pool of mortgages or assets. Principal shown is the outstanding par amount of the pool as of the end of the period.
(n) Affiliated fund that is generally available only to investment companies and other accounts managed by Fidelity Investments. A complete unaudited schedule of portfolio holdings for each Fidelity Central Fund is filed with the SEC for the first and third quarters of each fiscal year on Form N-Q and is available upon request or at the SEC's website at www.sec.gov. An unaudited holdings listing for the Fund, which presents direct holdings as well as the pro-rata share of securities and other investments held indirectly through its investment in underlying non-money market Fidelity Central Funds, is available at fidelity.com and/or institutional.fidelity.com, as applicable. In addition, each Fidelity Central Fund's financial statements are available on the SEC's website or upon request.
(o) Affiliated fund that is generally available only to investment companies and other accounts managed by Fidelity Investments. The rate quoted is the annualized seven-day yield of the fund at period end. A complete unaudited listing of the fund's holdings as of its most recent quarter end is available upon request. In addition, each Fidelity Central Fund's financial statements are available on the SEC's website or upon request.
(p) Investment made with cash collateral received from securities on loan.
(q) Includes investment made with cash collateral received from securities on loan.
Additional information on each restricted holding is as follows:
| Security | Acquisition Date | Acquisition Cost (000s) |
| Ant International Co. Ltd. Class C | 5/16/18 | $27,888 |
Affiliated Central Funds
Information regarding fiscal year to date income earned by the Fund from investments in Fidelity Central Funds is as follows:
| Fund | Income earned |
| | (Amounts in thousands) |
| Fidelity Cash Central Fund | $7,689 |
| Fidelity High Income Central Fund 2 | 28,055 |
| Fidelity Mortgage Backed Securities Central Fund | 38,209 |
| Fidelity Securities Lending Cash Central Fund | 393 |
| Total | $74,346 |
Amounts in the income column in the above table include any capital gain distributions from underlying funds, which are presented in the corresponding line-item in the Statement of Operations, if applicable.
Fiscal year to date information regarding the Fund’s investments in non-Money Market Central Funds, including the ownership percentage, is presented below.
| Fund (Amounts in thousands) | Value, beginning of period | Purchases | Sales Proceeds | Realized Gain/Loss | Change in Unrealized appreciation (depreciation) | Value, end of period | % ownership, end of period |
| Fidelity High Income Central Fund 2 | $715,546 | $24,343 | $-- | $-- | $(14,613) | $725,276 | 80.8% |
| Fidelity Mortgage Backed Securities Central Fund | 2,366,031 | 173,209 | 120,102 | 804 | 20,315 | 2,440,257 | 27.5% |
| Total | $3,081,577 | $197,552 | $120,102 | $804 | $5,702 | $3,165,533 | |
Other Affiliated Issuers
An affiliated company is a company in which the Fund has ownership of at least 5% of the voting securities. Fiscal year to date transactions with companies which are or were affiliates are as follows:
| Affiliate (Amounts in thousands) | Value, beginning of period | Purchases | Sales Proceeds | Dividend Income | Realized Gain (loss) | Change in Unrealized appreciation (depreciation) | Value, end of period |
| MACOM Technology Solutions Holdings, Inc. | $74,037 | $15,209 | $9,235 | $-- | $(819) | $(8,108) | $71,084 |
| Sunrun, Inc. | 161,066 | 3,140 | 30,646 | -- | 10,111 | 13,081 | 156,752 |
| Vivint Solar, Inc. | 43,267 | 9,229 | -- | -- | -- | 483 | 52,979 |
| Total | $278,370 | $27,578 | $39,881 | $-- | $9,292 | $5,456 | $280,815 |
Investment Valuation
The following is a summary of the inputs used, as of February 28, 2019, involving the Fund's assets and liabilities carried at fair value. The inputs or methodology used for valuing securities may not be an indication of the risk associated with investing in those securities. For more information on valuation inputs, and their aggregation into the levels used below, please refer to the Investment Valuation section in the accompanying Notes to Financial Statements.
| | Valuation Inputs at Reporting Date: |
| Description | Total | Level 1 | Level 2 | Level 3 |
| (Amounts in thousands) | | | | |
| Investments in Securities: | | | | |
| Equities: | | | | |
| Communication Services | $2,168,712 | $2,155,347 | $13,365 | $-- |
| Consumer Discretionary | 2,266,086 | 2,202,885 | 63,201 | -- |
| Consumer Staples | 1,416,082 | 1,391,538 | 24,544 | -- |
| Energy | 1,098,611 | 1,098,611 | -- | -- |
| Financials | 2,839,129 | 2,833,761 | 5,368 | -- |
| Health Care | 3,266,674 | 3,088,432 | 178,242 | -- |
| Industrials | 2,237,529 | 2,116,447 | 121,082 | -- |
| Information Technology | 4,170,965 | 4,170,965 | -- | -- |
| Materials | 552,740 | 552,740 | -- | -- |
| Real Estate | 655,579 | 624,112 | -- | 31,467 |
| Utilities | 668,429 | 668,429 | -- | -- |
| Corporate Bonds | 3,513,104 | -- | 3,513,104 | -- |
| U.S. Government and Government Agency Obligations | 3,037,879 | -- | 3,037,879 | -- |
| Asset-Backed Securities | 91,017 | -- | 89,553 | 1,464 |
| Collateralized Mortgage Obligations | 10,216 | -- | 10,216 | -- |
| Commercial Mortgage Securities | 129,718 | -- | 129,718 | -- |
| Municipal Securities | 146,906 | -- | 146,906 | -- |
| Foreign Government and Government Agency Obligations | 3,816 | -- | 3,816 | -- |
| Bank Notes | 65,287 | -- | 65,287 | -- |
| Fixed-Income Funds | 3,165,533 | 3,165,533 | -- | -- |
| Money Market Funds | 837,713 | 837,713 | -- | -- |
| Repurchase Agreements | 260,748 | -- | 260,748 | -- |
| Total Investments in Securities: | $32,602,473 | $24,906,513 | $7,663,029 | $32,931 |
| Derivative Instruments: | | | | |
| Assets | | | | |
| Futures Contracts | $12,970 | $12,970 | $-- | $-- |
| Total Assets | $12,970 | $12,970 | $-- | $-- |
| Liabilities | | | | |
| Swaps | $(158) | $-- | $(158) | $-- |
| Total Liabilities | $(158) | $-- | $(158) | $-- |
| Total Derivative Instruments: | $12,812 | $12,970 | $(158) | $-- |
Value of Derivative Instruments
The following table is a summary of the Fund's value of derivative instruments by primary risk exposure as of February 28, 2019. For additional information on derivative instruments, please refer to the Derivative Instruments section in the accompanying Notes to Financial Statements.
| Primary Risk Exposure / Derivative Type | Value |
| | Asset | Liability |
| (Amounts in thousands) | | |
| Credit Risk | | |
| Swaps(a) | $0 | $(158) |
| Total Credit Risk | 0 | (158) |
| Equity Risk | | |
| Futures Contracts(b) | 12,970 | 0 |
| Total Equity Risk | 12,970 | 0 |
| Total Value of Derivatives | $12,970 | $(158) |
(a) For bi-lateral over-the-counter (OTC) swaps, reflects gross value which is presented in the Statement of Assets and Liabilities in the bi-lateral OTC swaps, at value line-items.
(b) Reflects gross cumulative appreciation (depreciation) on futures contracts as presented in the Schedule of Investments. In the Statement of Assets and Liabilities, the period end daily variation margin is included in receivable or payable for daily variation margin on futures contracts, and the net cumulative appreciation (depreciation) is included in distributable earnings.
Other Information
# Additional information on each counterparty to the repurchase agreement is as follows:
| Repurchase Agreement / Counterparty | Value (000s) |
| $260,748,000 due 3/01/19 at 2.59% | |
| J.P. Morgan Securities, Inc. | $52,160 |
| Merrill Lynch, Pierce, Penner & Smith, Inc. | 208,588 |
| | $260,748 |
The composition of credit quality ratings as a percentage of Total Net Assets is as follows (Unaudited):
| U.S. Government and U.S. Government Agency Obligations | 18.2% |
| AAA,AA,A | 3.0% |
| BBB | 7.8% |
| BB | 2.3% |
| B | 0.9% |
| CCC,CC,C | 0.4% |
| Not Rated | 0.2% |
| Equities | 66.3% |
| Short-Term Investments and Net Other Assets | 0.9% |
| | 100.0% |
We have used ratings from Moody's Investors Service, Inc. Where Moody's® ratings are not available, we have used S&P® ratings. All ratings are as of the date indicated and do not reflect subsequent changes.
The information in the above tables is based on the combined investments of the fund and its pro-rata share of the investments of Fidelity's Fixed-Income Central Funds
See accompanying notes which are an integral part of the financial statements.
Financial Statements
Statement of Assets and Liabilities
| Amounts in thousands (except per-share amounts) | | February 28, 2019 (Unaudited) |
| Assets | | |
Investment in securities, at value (including securities loaned of $380,116 and repurchase agreements of $260,748) — See accompanying schedule:
Unaffiliated issuers (cost $23,988,235) | $28,318,412 | |
| Fidelity Central Funds (cost $3,961,751) | 4,003,246 | |
| Other affiliated issuers (cost $184,631) | 280,815 | |
| Total Investment in Securities (cost $28,134,617) | | $32,602,473 |
| Receivable for investments sold | | 153,168 |
| Receivable for fund shares sold | | 18,445 |
| Dividends receivable | | 39,695 |
| Interest receivable | | 54,191 |
| Distributions receivable from Fidelity Central Funds | | 1,660 |
| Prepaid expenses | | 31 |
| Other receivables | | 1,240 |
| Total assets | | 32,870,903 |
| Liabilities | | |
| Payable to custodian bank | $2,931 | |
| Payable for investments purchased | | |
| Regular delivery | 246,219 | |
| Delayed delivery | 10,257 | |
| Payable for fund shares redeemed | 14,576 | |
| Bi-lateral OTC swaps, at value | 158 | |
| Accrued management fee | 10,368 | |
| Payable for daily variation margin on futures contracts | 648 | |
| Other affiliated payables | 3,005 | |
| Other payables and accrued expenses | 1,573 | |
| Collateral on securities loaned | 387,073 | |
| Total liabilities | | 676,808 |
| Net Assets | | $32,194,095 |
| Net Assets consist of: | | |
| Paid in capital | | $27,979,981 |
| Total distributable earnings (loss) | | 4,214,114 |
| Net Assets | | $32,194,095 |
| Net Asset Value and Maximum Offering Price | | |
| Balanced: | | |
| Net Asset Value, offering price and redemption price per share ($23,787,676 ÷ 1,056,105 shares) | | $22.52 |
| Class K: | | |
| Net Asset Value, offering price and redemption price per share ($8,406,419 ÷ 373,215 shares) | | $22.52 |
See accompanying notes which are an integral part of the financial statements.
Statement of Operations
| Amounts in thousands | | Six months ended February 28, 2019 (Unaudited) |
| Investment Income | | |
| Dividends | | $187,073 |
| Interest | | 114,176 |
| Income from Fidelity Central Funds | | 68,097 |
| Total income | | 369,346 |
| Expenses | | |
| Management fee | $62,183 | |
| Transfer agent fees | 17,290 | |
| Accounting and security lending fees | 1,170 | |
| Custodian fees and expenses | 393 | |
| Independent trustees' fees and expenses | 102 | |
| Registration fees | 474 | |
| Audit | 63 | |
| Legal | 34 | |
| Miscellaneous | 94 | |
| Total expenses before reductions | 81,803 | |
| Expense reductions | (325) | |
| Total expenses after reductions | | 81,478 |
| Net investment income (loss) | | 287,868 |
| Realized and Unrealized Gain (Loss) | | |
| Net realized gain (loss) on: | | |
| Investment securities: | | |
| Unaffiliated issuers | 150,110 | |
| Fidelity Central Funds | 838 | |
| Other affiliated issuers | 9,292 | |
| Foreign currency transactions | 33 | |
| Futures contracts | (14,978) | |
| Swaps | 1 | |
| Capital gain distributions from Fidelity Central Funds | 6,249 | |
| Total net realized gain (loss) | | 151,545 |
| Change in net unrealized appreciation (depreciation) on: | | |
| Investment securities: | | |
| Unaffiliated issuers | (1,412,989) | |
| Fidelity Central Funds | 5,674 | |
| Other affiliated issuers | 5,456 | |
| Assets and liabilities in foreign currencies | (39) | |
| Futures contracts | 1,148 | |
| Swaps | (3) | |
| Total change in net unrealized appreciation (depreciation) | | (1,400,753) |
| Net gain (loss) | | (1,249,208) |
| Net increase (decrease) in net assets resulting from operations | | $(961,340) |
See accompanying notes which are an integral part of the financial statements.
Statement of Changes in Net Assets
| Amounts in thousands | Six months ended February 28, 2019 (Unaudited) | Year ended August 31, 2018 |
| Increase (Decrease) in Net Assets | | |
| Operations | | |
| Net investment income (loss) | $287,868 | $513,482 |
| Net realized gain (loss) | 151,545 | 2,804,960 |
| Change in net unrealized appreciation (depreciation) | (1,400,753) | 629,349 |
| Net increase (decrease) in net assets resulting from operations | (961,340) | 3,947,791 |
| Distributions to shareholders | (2,851,604) | – |
| Distributions to shareholders from net investment income | – | (499,431) |
| Distributions to shareholders from net realized gain | – | (1,956,992) |
| Total distributions | (2,851,604) | (2,456,423) |
| Share transactions - net increase (decrease) | 1,761,540 | 1,303,346 |
| Total increase (decrease) in net assets | (2,051,404) | 2,794,714 |
| Net Assets | | |
| Beginning of period | 34,245,499 | 31,450,785 |
| End of period | $32,194,095 | $34,245,499 |
| Other Information | | |
| Undistributed net investment income end of period | | $116,764 |
See accompanying notes which are an integral part of the financial statements.
Financial Highlights
Fidelity Balanced Fund
| | Six months ended (Unaudited) February 28, | Years endedAugust 31, | | | | |
| | 2019 | 2018 | 2017 | 2016 | 2015 | 2014 |
| Selected Per–Share Data | | | | | | |
| Net asset value, beginning of period | $25.33 | $24.27 | $22.32 | $22.33 | $24.40 | $21.85 |
| Income from Investment Operations | | | | | | |
| Net investment income (loss)A | .20 | .38 | .38 | .37 | .37 | .38 |
| Net realized and unrealized gain (loss) | (.92) | 2.55 | 2.26 | 1.25 | (.23) | 3.68 |
| Total from investment operations | (.72) | 2.93 | 2.64 | 1.62 | .14 | 4.06 |
| Distributions from net investment income | (.21) | (.37) | (.37) | (.36) | (.35) | (.38) |
| Distributions from net realized gain | (1.89) | (1.50) | (.32) | (1.27) | (1.86) | (1.13) |
| Total distributions | (2.09)B | (1.87) | (.69) | (1.63) | (2.21) | (1.51) |
| Net asset value, end of period | $22.52 | $25.33 | $24.27 | $22.32 | $22.33 | $24.40 |
| Total ReturnC,D | (2.66)% | 12.78% | 12.12% | 7.73% | .86% | 19.46% |
| Ratios to Average Net AssetsE,F | | | | | | |
| Expenses before reductions | .54%G | .53% | .55% | .55% | .56% | .56% |
| Expenses net of fee waivers, if any | .53%G | .53% | .54% | .55% | .55% | .56% |
| Expenses net of all reductions | .53%G | .53% | .54% | .55% | .55% | .56% |
| Net investment income (loss) | 1.78%G | 1.55% | 1.65% | 1.71% | 1.59% | 1.65% |
| Supplemental Data | | | | | | |
| Net assets, end of period (in millions) | $23,788 | $25,088 | $22,915 | $20,840 | $20,176 | $19,574 |
| Portfolio turnover rateH | 65%G | 66%I | 91% | 64% | 128% | 176% |
A Calculated based on average shares outstanding during the period.
B Total distributions of $2.09 per share is comprised of distributions from net investment income of $.205 and distributions from net realized gain of $1.886 per share.
C Total returns for periods of less than one year are not annualized.
D Total returns would have been lower if certain expenses had not been reduced during the applicable periods shown.
E Fees and expenses of any underlying Fidelity Central Funds are not included in the Fund's expense ratio. The Fund indirectly bears its proportionate share of the expenses of any underlying Fidelity Central Funds. Based on their most recent shareholder report date, the expenses of any underlying non-money market Fidelity Central Funds were less than .005%.
F Expense ratios reflect operating expenses of the class. Expenses before reductions do not reflect amounts reimbursed by the investment adviser or reductions from brokerage service arrangements or reductions from other expense offset arrangements and do not represent the amount paid by the class during periods when reimbursements or reductions occur. Expenses net of fee waivers reflect expenses after reimbursement by the investment adviser but prior to reductions from brokerage service arrangements or other expense offset arrangements. Expenses net of all reductions represent the net expenses paid by the class.
G Annualized
H Amount does not include the portfolio activity of any underlying Fidelity Central Funds.
I Portfolio turnover rate excludes securities received or delivered in-kind.
See accompanying notes which are an integral part of the financial statements.
Fidelity Balanced Fund Class K
| | Six months ended (Unaudited) February 28, | Years endedAugust 31, | | | | |
| | 2019 | 2018 | 2017 | 2016 | 2015 | 2014 |
| Selected Per–Share Data | | | | | | |
| Net asset value, beginning of period | $25.33 | $24.27 | $22.32 | $22.33 | $24.40 | $21.85 |
| Income from Investment Operations | | | | | | |
| Net investment income (loss)A | .21 | .40 | .40 | .39 | .39 | .40 |
| Net realized and unrealized gain (loss) | (.92) | 2.55 | 2.26 | 1.25 | (.23) | 3.69 |
| Total from investment operations | (.71) | 2.95 | 2.66 | 1.64 | .16 | 4.09 |
| Distributions from net investment income | (.22) | (.39) | (.39) | (.38) | (.37) | (.40) |
| Distributions from net realized gain | (1.89) | (1.50) | (.32) | (1.27) | (1.86) | (1.13) |
| Total distributions | (2.10)B | (1.89) | (.71) | (1.65) | (2.23) | (1.54)C |
| Net asset value, end of period | $22.52 | $25.33 | $24.27 | $22.32 | $22.33 | $24.40 |
| Total ReturnD,E | (2.61)% | 12.87% | 12.22% | 7.84% | .95% | 19.59% |
| Ratios to Average Net AssetsF,G | | | | | | |
| Expenses before reductions | .45%H | .45% | .46% | .46% | .46% | .46% |
| Expenses net of fee waivers, if any | .45%H | .45% | .45% | .46% | .46% | .46% |
| Expenses net of all reductions | .45%H | .44% | .45% | .45% | .46% | .46% |
| Net investment income (loss) | 1.87%H | 1.63% | 1.74% | 1.81% | 1.68% | 1.75% |
| Supplemental Data | | | | | | |
| Net assets, end of period (in millions) | $8,406 | $9,157 | $8,536 | $7,984 | $7,695 | $7,372 |
| Portfolio turnover rateI | 65%H | 66%J | 91% | 64% | 128% | 176% |
A Calculated based on average shares outstanding during the period.
B Total distributions of $2.10 per share is comprised of distributions from net investment income of $.216 and distributions from net realized gain of $1.886 per share.
C Total distributions of $1.54 per share is comprised of distributions from net investment income of $.401 and distributions from net realized gain of $1.134 per share.
D Total returns for periods of less than one year are not annualized.
E Total returns would have been lower if certain expenses had not been reduced during the applicable periods shown.
F Fees and expenses of any underlying Fidelity Central Funds are not included in the Fund's expense ratio. The Fund indirectly bears its proportionate share of the expenses of any underlying Fidelity Central Funds. Based on their most recent shareholder report date, the expenses of any underlying non-money market Fidelity Central Funds were less than .005%.
G Expense ratios reflect operating expenses of the class. Expenses before reductions do not reflect amounts reimbursed by the investment adviser or reductions from brokerage service arrangements or reductions from other expense offset arrangements and do not represent the amount paid by the class during periods when reimbursements or reductions occur. Expenses net of fee waivers reflect expenses after reimbursement by the investment adviser but prior to reductions from brokerage service arrangements or other expense offset arrangements. Expenses net of all reductions represent the net expenses paid by the class.
H Annualized
I Amount does not include the portfolio activity of any underlying Fidelity Central Funds.
J Portfolio turnover rate excludes securities received or delivered in-kind.
See accompanying notes which are an integral part of the financial statements.
Notes to Financial Statements (Unaudited)
For the period ended February 28, 2019
(Amounts in thousands except percentages)
1. Organization.
Fidelity Balanced Fund (the Fund) is a fund of Fidelity Puritan Trust (the Trust) and is authorized to issue an unlimited number of shares. The Trust is registered under the Investment Company Act of 1940, as amended (the 1940 Act), as an open-end management investment company organized as a Massachusetts business trust. The Fund offers Balanced and Class K shares, each of which has equal rights as to assets and voting privileges. Each class has exclusive voting rights with respect to matters that affect that class.
2. Investments in Fidelity Central Funds.
The Fund invests in Fidelity Central Funds, which are open-end investment companies generally available only to other investment companies and accounts managed by the investment adviser and its affiliates. The Fund's Schedule of Investments lists each of the Fidelity Central Funds held as of period end, if any, as an investment of the Fund, but does not include the underlying holdings of each Fidelity Central Fund. As an Investing Fund, the Fund indirectly bears its proportionate share of the expenses of the underlying Fidelity Central Funds.
Based on its investment objective, each Fidelity Central Fund may invest or participate in various investment vehicles or strategies that are similar to those of the Fund. These strategies are consistent with the investment objectives of the Fund and may involve certain economic risks which may cause a decline in value of each of the Fidelity Central Funds and thus a decline in the value of the Fund. The Money Market Central Funds seek preservation of capital and current income and are managed by Fidelity Investments Money Management, Inc. (FIMM), an affiliate of the investment adviser. Annualized expenses of the Money Market Central Funds as of their most recent shareholder report date are less than .005%. The following summarizes the Fund's investment in each non-money market Fidelity Central Fund.
| Fidelity Central Fund | Investment Manager | Investment Objective | Investment Practices | Expense Ratio(a) |
| Fidelity High Income Central Fund 2 | FMR Co., Inc. (FMRC) | Seeks a high level of income and may also seek capital appreciation by investing primarily in debt securities, preferred stocks, and convertible securities, with an emphasis on lower-quality debt securities. | Delayed Delivery & When Issued Securities
Loans & Direct Debt Instruments
Restricted Securities
| Less than .005% |
| Fidelity Mortgage Backed Securities Central Fund | FIMM | Seeks a high level of income by normally investing in investment-grade mortgage-related securities and repurchase agreements for those securities. | Delayed Delivery & When Issued Securities
Futures
Restricted Securities
Options
| Less than .005% |
(a) Expenses expressed as a percentage of average net assets and are as of each underlying Central Fund's most recent annual or semi-annual shareholder report.
An unaudited holdings listing for the Fund, which presents direct holdings as well as the pro-rata share of any securities and other investments held indirectly through its investment in underlying non-money market Fidelity Central Funds, is available at fidelity.com. A complete unaudited list of holdings for each Fidelity Central Fund is available upon request or at the Securities and Exchange Commission (the SEC) website at www.sec.gov. In addition, the financial statements of the Fidelity Central Funds which contain the significant accounting policies (including investment valuation policies) of those funds are available on the SEC website or upon request.
3. Significant Accounting Policies.
The Fund is an investment company and applies the accounting and reporting guidance of the Financial Accounting Standards Board (FASB) Accounting Standards Codification Topic 946 Financial Services – Investments Companies. The financial statements have been prepared in conformity with accounting principles generally accepted in the United States of America (GAAP), which require management to make certain estimates and assumptions at the date of the financial statements. Actual results could differ from those estimates. Subsequent events, if any, through the date that the financial statements were issued have been evaluated in the preparation of the financial statements. The following summarizes the significant accounting policies of the Fund:
Investment Valuation. Investments are valued as of 4:00 p.m. Eastern time on the last calendar day of the period. The Board of Trustees (the Board) has delegated the day to day responsibility for the valuation of the Fund's investments to the Fair Value Committee (the Committee) established by the Fund's investment adviser. In accordance with valuation policies and procedures approved by the Board, the Fund attempts to obtain prices from one or more third party pricing vendors or brokers to value its investments. When current market prices, quotations or currency exchange rates are not readily available or reliable, investments will be fair valued in good faith by the Committee, in accordance with procedures adopted by the Board. Factors used in determining fair value vary by investment type and may include market or investment specific events, changes in interest rates and credit quality. The frequency with which these procedures are used cannot be predicted and they may be utilized to a significant extent. The Committee oversees the Fund's valuation policies and procedures and reports to the Board on the Committee's activities and fair value determinations. The Board monitors the appropriateness of the procedures used in valuing the Fund's investments and ratifies the fair value determinations of the Committee.
The Fund categorizes the inputs to valuation techniques used to value its investments into a disclosure hierarchy consisting of three levels as shown below:
- Level 1 – quoted prices in active markets for identical investments
- Level 2 – other significant observable inputs (including quoted prices for similar investments, interest rates, prepayment speeds, etc.)
- Level 3 – unobservable inputs (including the Fund's own assumptions based on the best information available)
Valuation techniques used to value the Fund's investments by major category are as follows:
Equity securities, including restricted securities, for which market quotations are readily available, are valued at the last reported sale price or official closing price as reported by a third party pricing vendor on the primary market or exchange on which they are traded and are categorized as Level 1 in the hierarchy. In the event there were no sales during the day or closing prices are not available, securities are valued at the last quoted bid price or may be valued using the last available price and are generally categorized as Level 2 in the hierarchy. For foreign equity securities, when market or security specific events arise, comparisons to the valuation of American Depositary Receipts (ADRs), futures contracts, Exchange-Traded Funds (ETFs) and certain indexes as well as quoted prices for similar securities may be used and would be categorized as Level 2 in the hierarchy. For equity securities, including restricted securities, where observable inputs are limited, assumptions about market activity and risk are used and these securities may be categorized as Level 3 in the hierarchy.
Debt securities, including restricted securities, are valued based on evaluated prices received from third party pricing vendors or from brokers who make markets in such securities. Corporate bonds, bank notes, foreign government and government agency obligations, municipal securities and U.S. government and government agency obligations are valued by pricing vendors who utilize matrix pricing which considers yield or price of bonds of comparable quality, coupon, maturity and type or by broker-supplied prices. Asset backed securities, collateralized mortgage obligations and commercial mortgage securities are valued by pricing vendors who utilize matrix pricing which considers prepayment speed assumptions, attributes of the collateral, yield or price of bonds of comparable quality, coupon, maturity and type or by broker-supplied prices. Swaps are marked-to-market daily based on valuations from third party pricing vendors, registered derivatives clearing organizations (clearinghouses) or broker-supplied valuations. These pricing sources may utilize inputs such as interest rate curves, credit spread curves, default possibilities and recovery rates. When independent prices are unavailable or unreliable, debt securities and swaps may be valued utilizing pricing methodologies which consider similar factors that would be used by third party pricing vendors. Debt securities and swaps are generally categorized as Level 2 in the hierarchy but may be Level 3 depending on the circumstances.
Futures contracts are valued at the settlement price established each day by the board of trade or exchange on which they are traded and are categorized as Level 1 in the hierarchy. Investments in open-end mutual funds, including the Fidelity Central Funds, are valued at their closing net asset value (NAV) each business day and are categorized as Level 1 in the hierarchy.
Changes in valuation techniques may result in transfers in or out of an assigned level within the disclosure hierarchy. The aggregate value of investments by input level as of February 28, 2019 is included at the end of the Fund's Schedule of Investments.
Foreign Currency. The Fund may use foreign currency contracts to facilitate transactions in foreign-denominated securities. Gains and losses from these transactions may arise from changes in the value of the foreign currency or if the counterparties do not perform under the contracts' terms.
Foreign-denominated assets, including investment securities, and liabilities are translated into U.S. dollars at the exchange rates at period end. Purchases and sales of investment securities, income and dividends received and expenses denominated in foreign currencies are translated into U.S. dollars at the exchange rate in effect on the transaction date.
The effects of exchange rate fluctuations on investments are included with the net realized and unrealized gain (loss) on investment securities. Other foreign currency transactions resulting in realized and unrealized gain (loss) are disclosed separately.
Investment Transactions and Income. For financial reporting purposes, the Fund's investment holdings and NAV include trades executed through the end of the last business day of the period. The NAV per share for processing shareholder transactions is calculated as of the close of business of the New York Stock Exchange (NYSE), normally 4:00 p.m. Eastern time and includes trades executed through the end of the prior business day. Gains and losses on securities sold are determined on the basis of identified cost and include proceeds received from litigation. Dividend income is recorded on the ex-dividend date, except for certain dividends from foreign securities where the ex-dividend date may have passed, which are recorded as soon as the Fund is informed of the ex-dividend date. Non-cash dividends included in dividend income, if any, are recorded at the fair market value of the securities received. Income and capital gain distributions from Fidelity Central Funds, if any, are recorded on the ex-dividend date. Certain distributions received by the Fund represent a return of capital or capital gain. The Fund determines the components of these distributions subsequent to the ex-dividend date, based upon receipt of tax filings or other correspondence relating to the underlying investment. These distributions are recorded as a reduction of cost of investments and/or as a realized gain. Interest income is accrued as earned and includes coupon interest and amortization of premium and accretion of discount on debt securities as applicable. The principal amount on inflation-indexed securities is periodically adjusted to the rate of inflation and interest is accrued based on the principal amount. The adjustments to principal due to inflation are reflected as increases or decreases to Interest in the accompanying Statement of Operations. Investment income is recorded net of foreign taxes withheld where recovery of such taxes is uncertain. Debt obligations may be placed on non-accrual status and related interest income may be reduced by ceasing current accruals and writing off interest receivables when the collection of all or a portion of interest has become doubtful based on consistently applied procedures. A debt obligation is removed from non-accrual status when the issuer resumes interest payments or when collectability of interest is reasonably assured.
Class Allocations and Expenses. Investment income, realized and unrealized capital gains and losses, common expenses of the Fund, and certain fund-level expense reductions, if any, are allocated daily on a pro-rata basis to each class based on the relative net assets of each class to the total net assets of the Fund. Each class differs with respect to transfer agent fees incurred. Certain expense reductions may also differ by class. For the reporting period, the allocated portion of income and expenses to each class as a percent of its average net assets may vary due to the timing of recording these transactions in relation to fluctuating net assets of the classes. Expenses directly attributable to a fund are charged to that fund. Expenses attributable to more than one fund are allocated among the respective funds on the basis of relative net assets or other appropriate methods. Expense estimates are accrued in the period to which they relate and adjustments are made when actual amounts are known.
Deferred Trustee Compensation. Under a Deferred Compensation Plan (the Plan) for the Fund, certain independent Trustees have elected to defer receipt of a portion of their annual compensation. Deferred amounts are invested in a cross-section of Fidelity funds, are marked-to-market and remain in the Fund until distributed in accordance with the Plan. The investment of deferred amounts and the offsetting payable to the Trustees of $1,138 are included in the accompanying Statement of Assets and Liabilities in other receivables and other payables and accrued expenses, respectively.
Income Tax Information and Distributions to Shareholders. Each year, the Fund intends to qualify as a regulated investment company under Subchapter M of the Internal Revenue Code, including distributing substantially all of its taxable income and realized gains. As a result, no provision for U.S. Federal income taxes is required. The Fund files a U.S. federal tax return, in addition to state and local tax returns as required. The Fund's federal income tax returns are subject to examination by the Internal Revenue Service (IRS) for a period of three fiscal years after they are filed. State and local tax returns may be subject to examination for an additional fiscal year depending on the jurisdiction. Foreign taxes are provided for based on the Fund's understanding of the tax rules and rates that exist in the foreign markets in which it invests.
Distributions are declared and recorded on the ex-dividend date. Income and capital gain distributions are declared separately for each class. Income and capital gain distributions are determined in accordance with income tax regulations, which may differ from GAAP.
Capital accounts within the financial statements are adjusted for permanent book-tax differences. These adjustments have no impact on net assets or the results of operations. Capital accounts are not adjusted for temporary book-tax differences which will reverse in a subsequent period.
Book-tax differences are primarily due to futures contracts, swaps, foreign currency transactions, passive foreign investment companies (PFIC), market discount, short-term gain distributions from the Underlying Funds, partnerships (including allocations from Fidelity Central Funds), deferred trustees compensation and losses deferred due to wash sales.
As of period end, the cost and unrealized appreciation (depreciation) in securities, and derivatives if applicable, for federal income tax purposes were as follows:
| Gross unrealized appreciation | $5,308,306 |
| Gross unrealized depreciation | (1,009,726) |
| Net unrealized appreciation (depreciation) | $4,298,580 |
| Tax cost | $28,316,705 |
Repurchase Agreements. Pursuant to an Exemptive Order issued by the SEC, the Fund along with other registered investment companies having management contracts with Fidelity Management & Research Company (FMR), or other affiliated entities of FMR, are permitted to transfer uninvested cash balances into joint trading accounts which are then invested in repurchase agreements. The Fund may also invest directly with institutions in repurchase agreements. Repurchase agreements may be collateralized by government or non-government securities. Upon settlement date, collateral is held in segregated accounts with custodian banks and may be obtained in the event of a default of the counterparty. The Fund monitors, on a daily basis, the value of the collateral to ensure it is at least equal to the principal amount of the repurchase agreement (including accrued interest). In the event of a default by the counterparty, realization of the collateral proceeds could be delayed, during which time the value of the collateral may decline.
Delayed Delivery Transactions and When-Issued Securities. During the period, the Fund transacted in securities on a delayed delivery or when-issued basis. Payment and delivery may take place after the customary settlement period for that security. The price of the underlying securities and the date when the securities will be delivered and paid for are fixed at the time the transaction is negotiated. The securities purchased on a delayed delivery or when-issued basis are identified as such in the Fund's Schedule of Investments. Losses may arise due to changes in the value of the underlying securities or if the counterparty does not perform under the contract's terms, or if the issuer does not issue the securities due to political, economic, or other factors.
Restricted Securities. The Fund may invest in securities that are subject to legal or contractual restrictions on resale. These securities generally may be resold in transactions exempt from registration or to the public if the securities are registered. Disposal of these securities may involve time-consuming negotiations and expense, and prompt sale at an acceptable price may be difficult. Information regarding restricted securities is included at the end of the Fund's Schedule of Investments.
New Rule Issuance. During August 2018, the U.S. Securities and Exchange Commission issued Final Rule Release No. 33-10532, Disclosure Update and Simplification. This Final Rule includes amendments specific to registered investment companies that are intended to eliminate overlap in disclosure requirements between Regulation S-X and GAAP. In accordance with these amendments, certain line-items in the Fund's financial statements have been combined or removed for the current period as outlined in the table below.
| Financial Statement | Current Line-Item Presentation (As Applicable) | Prior Line-Item Presentation (As Applicable) |
| Statement of Assets and Liabilities | Total distributable earnings (loss) | Undistributed/Distributions in excess of/Accumulated net investment income (loss)
Accumulated/Undistributed net realized gain (loss)
Net unrealized appreciation (depreciation) |
| Statement of Changes in Net Assets | N/A - removed | Undistributed/Distributions in excess of/Accumulated net investment income (loss) end of period |
| Statement of Changes in Net Assets | Distributions to shareholders | Distributions to shareholders from net investment income
Distributions to shareholders from net realized gain |
| Distributions to Shareholders Note to Financial Statements | Distributions to shareholders | Distributions to shareholders from net investment income
Distributions to shareholders from net realized gain |
4. Derivative Instruments.
Risk Exposures and the Use of Derivative Instruments. The Fund's investment objective allows the Fund to enter into various types of derivative contracts, including futures contracts and swaps. Derivatives are investments whose value is primarily derived from underlying assets, indices or reference rates and may be transacted on an exchange or over-the-counter (OTC). Derivatives may involve a future commitment to buy or sell a specified asset based on specified terms, to exchange future cash flows at periodic intervals based on a notional principal amount, or for one party to make one or more payments upon the occurrence of specified events in exchange for periodic payments from the other party.
The Fund used derivatives to increase returns, to gain exposure to certain types of assets and to manage exposure to certain risks as defined below. The success of any strategy involving derivatives depends on analysis of numerous economic factors, and if the strategies for investment do not work as intended, the Fund may not achieve its objectives.
The Fund's use of derivatives increased or decreased its exposure to the following risks:
| Credit Risk | Credit risk relates to the ability of the issuer of a financial instrument to make further principal or interest payments on an obligation or commitment that it has to the Fund.
|
| Equity Risk | Equity risk relates to the fluctuations in the value of financial instruments as a result of changes in market prices (other than those arising from interest rate risk or foreign exchange risk), whether caused by factors specific to an individual investment, its issuer, or all factors affecting all instruments traded in a market or market segment.
|
The Fund is also exposed to additional risks from investing in derivatives, such as liquidity risk and counterparty credit risk. Liquidity risk is the risk that the Fund will be unable to close out the derivative in the open market in a timely manner. Counterparty credit risk is the risk that the counterparty will not be able to fulfill its obligation to the Fund. Derivative counterparty credit risk is managed through formal evaluation of the creditworthiness of all potential counterparties. On certain OTC derivatives such as bi-lateral swaps, the Fund attempts to reduce its exposure to counterparty credit risk by entering into an International Swaps and Derivatives Association, Inc. (ISDA) Master Agreement with each of its counterparties. The ISDA Master Agreement gives the Fund the right to terminate all transactions traded under such agreement upon the deterioration in the credit quality of the counterparty beyond specified levels. The ISDA Master Agreement gives each party the right, upon an event of default by the other party or a termination of the agreement, to close out all transactions traded under such agreement and to net amounts owed under each transaction to one net payable by one party to the other. To mitigate counterparty credit risk on bi-lateral OTC derivatives, the Fund receives collateral in the form of cash or securities once the Fund's net unrealized appreciation on outstanding derivative contracts under an ISDA Master Agreement exceeds certain applicable thresholds, subject to certain minimum transfer provisions. The collateral received is held in segregated accounts with the Fund's custodian bank in accordance with the collateral agreements entered into between the Fund, the counterparty and the Fund's custodian bank. The Fund could experience delays and costs in gaining access to the collateral even though it is held by the Fund's custodian bank. The Fund's maximum risk of loss from counterparty credit risk related to bi-lateral OTC derivatives is generally the aggregate unrealized appreciation and unpaid counterparty payments in excess of any collateral pledged by the counterparty to the Fund. The Fund may be required to pledge collateral for the benefit of the counterparties on bi-lateral OTC derivatives in an amount not less than each counterparty's unrealized appreciation on outstanding derivative contracts, subject to certain minimum transfer provisions, and any such pledged collateral is identified in the Schedule of Investments. Exchange-traded futures contracts are not covered by the ISDA Master Agreement; however counterparty credit risk related to exchange-traded futures contracts may be mitigated by the protection provided by the exchange on which they trade.
Investing in derivatives may involve greater risks than investing in the underlying assets directly and, to varying degrees, may involve risk of loss in excess of any initial investment and collateral received and amounts recognized in the Statement of Assets and Liabilities. In addition, there may be the risk that the change in value of the derivative contract does not correspond to the change in value of the underlying instrument.
Net Realized Gain (Loss) and Change in Net Unrealized Appreciation (Depreciation) on Derivatives. The table below, which reflects the impacts of derivatives on the financial performance of the Fund, summarizes the net realized gain (loss) and change in net unrealized appreciation (depreciation) for derivatives during the period as presented in the Statement of Operations.
| Primary Risk Exposure / Derivative Type | Net Realized Gain (Loss) | Change in Net Unrealized Appreciation (Depreciation) |
| Credit Risk | | |
| Swaps | $1 | $(3) |
| Equity Risk | | |
| Futures Contracts | (14,978) | 1,148 |
| Totals | $(14,977) | $1,145 |
A summary of the value of derivatives by primary risk exposure as of period end is included at the end of the Schedule of Investments.
Futures Contracts. A futures contract is an agreement between two parties to buy or sell a specified underlying instrument for a fixed price at a specified future date. The Fund used futures contracts to manage its exposure to the stock market.
Upon entering into a futures contract, a fund is required to deposit either cash or securities (initial margin) with a clearing broker in an amount equal to a certain percentage of the face value of the contract. Futures contracts are marked-to-market daily and subsequent daily payments (variation margin) are made or received by a fund depending on the daily fluctuations in the value of the futures contracts and are recorded as unrealized appreciation or (depreciation). This receivable and/or payable, if any, is included in daily variation margin on futures contracts in the Statement of Assets and Liabilities. Realized gain or (loss) is recorded upon the expiration or closing of a futures contract. The net realized gain (loss) and change in net unrealized appreciation (depreciation) on futures contracts during the period is presented in the Statement of Operations.
Any open futures contracts at period end are presented in the Schedule of Investments under the caption "Futures Contracts". The notional amount at value reflects each contract's exposure to the underlying instrument or index at period end and is representative of volume of activity during the period. Securities deposited to meet initial margin requirements are identified in the Schedule of Investments.
Swaps. A swap is a contract between two parties to exchange future cash flows at periodic intervals based on a notional principal amount. A bi-lateral OTC swap is a transaction between a fund and a dealer counterparty where cash flows are exchanged between the two parties for the life of the swap.
Bi-lateral OTC swaps are marked-to-market daily and changes in value are reflected in the Statement of Assets and Liabilities in the bi-lateral OTC swaps at value line items. Any upfront premiums paid or received upon entering a bi-lateral OTC swap to compensate for differences between stated terms of the swap and prevailing market conditions (e.g. credit spreads, interest rates or other factors) are recorded in net unrealized appreciation (depreciation) in the Statement of Assets and Liabilities and amortized to realized gain or (loss) ratably over the term of the swap. Any unamortized upfront premiums are presented in the Schedule of Investments.
Payments are exchanged at specified intervals, accrued daily commencing with the effective date of the contract and recorded as realized gain or (loss). Some swaps may be terminated prior to the effective date and realize a gain or loss upon termination. The net realized gain (loss) and change in net unrealized appreciation (depreciation) on swaps during the period is presented in the Statement of Operations.
Any open swaps at period end are included in the Schedule of Investments under the caption "Swaps" and are representative of volume of activity during the period.
Credit Default Swaps. Credit default swaps enable the Fund to buy or sell protection against specified credit events on a single-name issuer or a traded credit index. Under the terms of a credit default swap the buyer of protection (buyer) receives credit protection in exchange for making periodic payments to the seller of protection (seller) based on a fixed percentage applied to a notional principal amount. In return for these payments, the seller will be required to make a payment upon the occurrence of one or more specified credit events. The Fund enters into credit default swaps as a seller to gain credit exposure to an issuer and/or as a buyer to obtain a measure of protection against defaults of an issuer. Periodic payments are made over the life of the contract by the buyer provided that no credit event occurs.
For credit default swaps on most corporate and sovereign issuers, credit events include bankruptcy, failure to pay or repudiation/moratorium. For credit default swaps on corporate or sovereign issuers, the obligation that may be put to the seller is not limited to the specific reference obligation described in the Schedule of Investments. For credit default swaps on asset-backed securities, a credit event may be triggered by events such as failure to pay principal, maturity extension, rating downgrade or write-down. For credit default swaps on asset-backed securities, the reference obligation described represents the security that may be put to the seller. For credit default swaps on a traded credit index, a specified credit event may affect all or individual underlying securities included in the index.
As a seller, if an underlying credit event occurs, the Fund will pay a net settlement amount of cash equal to the notional amount of the swap less the recovery value of the reference obligation or underlying securities comprising an index. Only in the event of the industry's inability to value the underlying asset will the Fund be required to take delivery of the reference obligation or underlying securities comprising an index and pay an amount equal to the notional amount of the swap.
As a buyer, if an underlying credit event occurs, the Fund will receive a net settlement amount of cash equal to the notional amount of the swap less the recovery value of the reference obligation or underlying securities comprising an index. Only in the event of the industry's inability to value the underlying asset will the Fund be required to deliver the reference obligation or underlying securities comprising an index in exchange for payment of an amount equal to the notional amount of the swap.
Typically, the value of each credit default swap and credit rating disclosed for each reference obligation in the Schedule of Investments, where the Fund is the seller, can be used as measures of the current payment/performance risk of the swap. As the value of the swap changes as a positive or negative percentage of the total notional amount, the payment/performance risk may decrease or increase, respectively. In addition to these measures, the investment adviser monitors a variety of factors including cash flow assumptions, market activity and market sentiment as part of its ongoing process of assessing payment/performance risk.
5. Purchases and Sales of Investments.
Purchases and sales of securities (including the Underlying Fund shares), other than short-term securities and U.S. government securities, aggregated $8,776,623 and $8,428,468, respectively.
6. Fees and Other Transactions with Affiliates.
Management Fee. Fidelity Management & Research Company (the investment adviser) and its affiliates provide the Fund with investment management related services for which the Fund pays a monthly management fee. The management fee is the sum of an individual fund fee rate that is based on an annual rate of .15% of the Fund's average net assets and an annualized group fee rate that averaged .24% during the period. The group fee rate is based upon the average net assets of all the mutual funds advised by the investment adviser, including any mutual funds previously advised by the investment adviser that are currently advised by Fidelity SelectCo, LLC, an affiliate of the investment adviser. The group fee rate decreases as assets under management increase and increases as assets under management decrease. For the reporting period, the total annualized management fee rate was .39% of the Fund's average net assets.
Transfer Agent Fees. Fidelity Investments Institutional Operations Company, Inc., (FIIOC), an affiliate of the investment adviser, is the transfer, dividend disbursing and shareholder servicing agent for each class of the Fund. FIIOC receives account fees and asset-based fees that vary according to the account size and type of account of the shareholders of Balanced, except for Class K. FIIOC receives an asset-based fee of Class K's average net assets. FIIOC pays for typesetting, printing and mailing of shareholder reports, except proxy statements.
For the period, transfer agent fees for each class were as follows:
| | Amount | % of Class-Level Average Net Assets(a) |
| Balanced | $15,349 | .13 |
| Class K | 1,941 | .05 |
| | $17,290 | |
(a) Annualized
Accounting and Security Lending Fees. Fidelity Service Company, Inc. (FSC), an affiliate of the investment adviser, maintains the Fund's accounting records. The accounting fee is based on the level of average net assets for each month. Under a separate contract, FSC administers the security lending program. The security lending fee is based on the number and duration of lending transactions. For the period, the fees were equivalent to an annualized rate of .01%.
Brokerage Commissions. The Fund placed a portion of its portfolio transactions with brokerage firms which are affiliates of the investment adviser. Brokerage commissions are included in net realized gain (loss) and change in net unrealized appreciation (depreciation) in the Statement of Operations. The commissions paid to these affiliated firms were $210 for the period.
Interfund Trades. The Fund may purchase from or sell securities to other Fidelity Funds under procedures adopted by the Board. The procedures have been designed to ensure these interfund trades are executed in accordance with Rule 17a-7 of the 1940 Act. Interfund trades are included within the respective purchases and sales amounts shown in the Purchases and Sales of Investments note.
Other. During the period, the investment adviser reimbursed the Fund for certain losses in the amount of $5.
Prior Fiscal Year Exchanges In-Kind. During the prior period, the Fund completed an exchange in-kind with Fidelity Mortgage Backed Securities Central Fund. The Fund delivered investments, including accrued interest valued at $106,799, (which included $85 of unrealized depreciation), in exchange for 990 shares of Fidelity Mortgage Backed Securities Central Fund. The Fund generally did not recognize gain or loss for federal income tax purposes.
7. Committed Line of Credit.
The Fund participates with other funds managed by the investment adviser or an affiliate in a $4.25 billion credit facility (the "line of credit") to be utilized for temporary or emergency purposes to fund shareholder redemptions or for other short-term liquidity purposes. The Fund has agreed to pay commitment fees on its pro-rata portion of the line of credit, which amounted to $43 and is reflected in Miscellaneous expenses on the Statement of Operations. During the period, the Fund did not borrow on this line of credit.
8. Security Lending.
The Fund lends portfolio securities from time to time in order to earn additional income. For equity securities, a lending agent is used and may loan securities to certain qualified borrowers, including Fidelity Capital Markets (FCM), a broker-dealer affiliated with the Fund. On the settlement date of the loan, the Fund receives collateral (in the form of U.S. Treasury obligations, letters of credit and/or cash) against the loaned securities and maintains collateral in an amount not less than 100% of the market value of the loaned securities during the period of the loan. The market value of the loaned securities is determined at the close of business of the Fund and any additional required collateral is delivered to the Fund on the next business day. The Fund or borrower may terminate the loan at any time, and if the borrower defaults on its obligation to return the securities loaned because of insolvency or other reasons, the Fund may apply collateral received from the borrower against the obligation. The Fund may experience delays and costs in recovering the securities loaned. Any cash collateral received is maintained at the Fund's custodian and/or invested in cash equivalents and/or the Fidelity Securities Lending Cash Central Fund. The value of loaned securities and cash collateral at period end are disclosed on the Fund's Statement of Assets and Liabilities. The value of securities loaned to FCM at period end was $1,037. Security lending income represents the income earned on investing cash collateral, less rebates paid to borrowers and any lending agent fees associated with the loan, plus any premium payments received for lending certain types of securities. Security lending income is presented in the Statement of Operations as a component of interest income. Total security lending income during the period, presented in the Statement of Operations as a component of interest income, amounted to $32. Net income from the Fidelity Securities Lending Cash Central Fund during the period, presented in the Statement of Operations as a component of income from Fidelity Central Funds, amounted to $393 (including $14 from securities loaned to FCM).
9. Expense Reductions.
Commissions paid to certain brokers with whom the investment adviser, or its affiliates, places trades on behalf of the Fund include an amount in addition to trade execution, which may be rebated back to the Fund to offset certain expenses. This amount totaled $184 for the period. In addition, through arrangements with the Fund's custodian and each class' transfer agent, credits realized as a result of certain uninvested cash balances were used to reduce the Fund's expenses. During the period, these credits reduced the Fund's custody expenses by $18. During the period, credits reduced each class' transfer agent expense as noted in the table below.
| | Transfer Agent expense reduction |
| Balanced | $2 |
In addition, during the period the investment adviser reimbursed and/or waived a portion of fund-level operating expenses in the amount of $121.
10. Distributions to Shareholders.
Distributions to shareholders of each class were as follows:
| | Six months ended
February 28, 2019 | Year ended
August 31, 2018 |
| Distributions to shareholders | | |
| Balanced | $2,093,171 | $– |
| Class K | 758,433 | – |
| Total | $2,851,604 | $– |
| From net investment income | | |
| Balanced | $– | $359,979 |
| Class K | – | 139,452 |
| Total | $– | $499,431 |
| From net realized gain | | |
| Balanced | $– | $1,428,048 |
| Class K | – | 528,944 |
| Total | $– | $1,956,992 |
11. Share Transactions.
Share transactions for each class were as follows and may contain automatic conversions between classes or exchanges between affiliated funds:
| | Shares | Shares | Dollars | Dollars |
| | Six months ended February 28, 2019 | Year ended August 31, 2018 | Six months ended February 28, 2019 | Year ended August 31, 2018 |
| Balanced | | | | |
| Shares sold | 72,455 | 125,613 | $1,627,186 | $3,045,579 |
| Reinvestment of distributions | 88,943 | 71,987 | 1,985,852 | 1,701,887 |
| Shares redeemed | (95,669) | (151,447) | (2,114,452) | (3,668,283) |
| Net increase (decrease) | 65,729 | 46,153 | $1,498,586 | $1,079,183 |
| Class K | | | | |
| Shares sold | 27,003 | 46,606 | $604,919 | $1,131,393 |
| Reinvestment of distributions | 33,970 | 28,274 | 758,433 | 668,396 |
| Shares redeemed | (49,213) | (65,136) | (1,100,398) | (1,575,626) |
| Net increase (decrease) | 11,760 | 9,744 | $262,954 | $224,163 |
12. Other.
The Fund's organizational documents provide former and current trustees and officers with a limited indemnification against liabilities arising in connection with the performance of their duties to the Fund. In the normal course of business, the Fund may also enter into contracts that provide general indemnifications. The Fund's maximum exposure under these arrangements is unknown as this would be dependent on future claims that may be made against the Fund. The risk of material loss from such claims is considered remote.
Shareholder Expense Example
As a shareholder of the Fund, you incur two types of costs: (1) transaction costs and (2) ongoing costs, including management fees and other Fund expenses. This Example is intended to help you understand your ongoing costs (in dollars) of investing in the Fund and to compare these costs with the ongoing costs of investing in other mutual funds.
The Example is based on an investment of $1,000 invested at the beginning of the period and held for the entire period (September 1, 2018 to February 28, 2019).
Actual Expenses
The first line of the accompanying table for each class of the Fund provides information about actual account values and actual expenses. You may use the information in this line, together with the amount you invested, to estimate the expenses that you paid over the period. Simply divide your account value by $1,000.00 (for example, an $8,600 account value divided by $1,000.00 = 8.6), then multiply the result by the number in the first line for a class of the Fund under the heading entitled "Expenses Paid During Period" to estimate the expenses you paid on your account during this period. In addition, the Fund, as a shareholder in the underlying Fidelity Central Funds, will indirectly bear its pro-rata share of the fees and expenses incurred by the underlying Fidelity Central Funds. These fees and expenses are not included in the Fund's annualized expense ratio used to calculate the expense estimate in the table below.
Hypothetical Example for Comparison Purposes
The second line of the accompanying table for each class of the Fund provides information about hypothetical account values and hypothetical expenses based on a Class' actual expense ratio and an assumed rate of return of 5% per year before expenses, which is not the Class' actual return. The hypothetical account values and expenses may not be used to estimate the actual ending account balance or expenses you paid for the period. You may use this information to compare the ongoing costs of investing in the Fund and other funds. To do so, compare this 5% hypothetical example with the 5% hypothetical examples that appear in the shareholder reports of the other funds. In addition, the Fund, as a shareholder in the underlying Fidelity Central Funds, will indirectly bear its pro-rata share of the fees and expenses incurred by the underlying Fidelity Central Funds. These fees and expenses are not included in the Fund's annualized expense ratio used to calculate the expense estimate in the table below.
Please note that the expenses shown in the table are meant to highlight your ongoing costs only and do not reflect any transaction costs. Therefore, the second line of the table is useful in comparing ongoing costs only, and will not help you determine the relative total costs of owning different funds.
| | Annualized Expense Ratio-A | Beginning
Account Value
September 1, 2018 | Ending
Account Value
February 28, 2019 | Expenses Paid
During Period-B
September 1, 2018
to February 28, 2019 |
| Balanced | .53% | | | |
| Actual | | $1,000.00 | $973.40 | $2.59 |
| Hypothetical-C | | $1,000.00 | $1,022.17 | $2.66 |
| Class K | .45% | | | |
| Actual | | $1,000.00 | $973.90 | $2.20 |
| Hypothetical-C | | $1,000.00 | $1,022.56 | $2.26 |
A Annualized expense ratio reflects expenses net of applicable fee waivers.
B Expenses are equal to each Class' annualized expense ratio, multiplied by the average account value over the period, multiplied by 181/365 (to reflect the one-half year period). The fees and expenses of the underlying Fidelity Central Funds in which the Fund invests are not included in each Class' annualized expense ratio. In addition to the expenses noted above, the Fund also indirectly bears its proportional share of the expenses of the underlying Fidelity Central Funds. Annualized expenses of the underlying non-money market Fidelity Central Funds as of their most recent fiscal half year were less than .005%.
C 5% return per year before expenses
Board Approval of Investment Advisory Contracts and Management Fees
Fidelity Balanced Fund
Each year, the Board of Trustees, including the Independent Trustees (together, the Board), votes on the renewal of the management contract with Fidelity Management & Research Company (FMR) and the sub-advisory agreements (together, the Advisory Contracts) for the fund. FMR and the sub-advisers are referred to herein as the Investment Advisers. The Board, assisted by the advice of fund counsel and Independent Trustees' counsel, requests and considers a broad range of information relevant to the renewal of the Advisory Contracts throughout the year.
The Board meets regularly and, at each of its meetings, covers an extensive agenda of topics and materials and considers factors that are relevant to its annual consideration of the renewal of the fund's Advisory Contracts, including the services and support provided to the fund and its shareholders. The Board has established various standing committees (Committees), each composed of and chaired by Independent Trustees with varying backgrounds, to which the Board has assigned specific subject matter responsibilities in order to enhance effective decision-making by the Board. The Board, acting directly and through its Committees, requests and receives information concerning the annual consideration of the renewal of the fund's Advisory Contracts. The Board also meets as needed to review matters specifically related to the Board's annual consideration of the renewal of the Advisory Contracts. Members of the Board may also meet with trustees of other Fidelity funds through joint ad hoc committees to discuss certain matters relevant to all of the Fidelity funds.
At its January 2019 meeting, the Board unanimously determined to renew the fund's Advisory Contracts. In reaching its determination, the Board considered all factors it believed relevant, including (i) the nature, extent, and quality of the services to be provided to the fund and its shareholders (including the investment performance of the fund); (ii) the competitiveness of the fund's management fee and total expense ratio relative to peer funds; (iii) the total costs of the services to be provided by and the profits to be realized by Fidelity from its relationships with the fund; and (iv) the extent to which, if any, economies of scale exist and would be realized as the fund grows, and whether any economies of scale are appropriately shared with fund shareholders.
In considering whether to renew the Advisory Contracts for the fund, the Board reached a determination, with the assistance of fund counsel and Independent Trustees' counsel and through the exercise of its business judgment, that the renewal of the Advisory Contracts was in the best interests of the fund and its shareholders and that the compensation payable under the Advisory Contracts was fair and reasonable. The Board's decision to renew the Advisory Contracts was not based on any single factor, but rather was based on a comprehensive consideration of all the information provided to the Board at its meetings throughout the year. The Board, in reaching its determination to renew the Advisory Contracts, was aware that shareholders of the fund have a broad range of investment choices available to them, including a wide choice among funds offered by Fidelity's competitors, and that the fund's shareholders, who have the opportunity to review and weigh the disclosure provided by the fund in its prospectus and other public disclosures, have chosen to invest in this fund, which is part of the Fidelity family of funds.
Nature, Extent, and Quality of Services Provided. The Board considered Fidelity's staffing as it relates to the fund, including the backgrounds of investment personnel of Fidelity, and also considered the fund's investment objective, strategies, and related investment philosophy. The Independent Trustees also had discussions with senior management of Fidelity's investment operations and investment groups. The Board considered the structure of the investment personnel compensation program and whether this structure provides appropriate incentives to act in the best interests of the fund. Additionally, the Board considered the portfolio managers' investments, if any, in the funds that they manage.
Resources Dedicated to Investment Management and Support Services. The Board and the Fund Oversight and Research Committees reviewed the general qualifications and capabilities of Fidelity's investment staff, including its size, education, experience, and resources, as well as Fidelity's approach to recruiting, training, managing, and compensating investment personnel. The Board noted that Fidelity has continued to increase the resources devoted to non-U.S. offices, including expansion of Fidelity's global investment organization. The Board also noted that Fidelity's analysts have extensive resources, tools and capabilities that allow them to conduct sophisticated quantitative and fundamental analysis, as well as credit analysis of issuers, counterparties and guarantors. Further, the Board considered that Fidelity's investment professionals have sufficient access to global information and data so as to provide competitive investment results over time, and that those professionals also have access to sophisticated tools that permit them to assess portfolio construction and risk and performance attribution characteristics continuously, as well as to transmit new information and research conclusions rapidly around the world. Additionally, in its deliberations, the Board considered Fidelity's trading, risk management, compliance, and technology and operations capabilities and resources, which are integral parts of the investment management process.
Shareholder and Administrative Services. The Board considered (i) the nature, extent, quality, and cost of advisory, administrative, and shareholder services performed by the Investment Advisers and their affiliates under the Advisory Contracts and under separate agreements covering transfer agency, pricing and bookkeeping, and securities lending services for the fund; (ii) the nature and extent of the supervision of third party service providers, principally custodians, subcustodians, and pricing vendors; and (iii) the resources devoted to, and the record of compliance with, the fund's compliance policies and procedures. The Board also reviewed the allocation of fund brokerage, including allocations to brokers affiliated with the Investment Advisers, the use of brokerage commissions to pay fund expenses, and the use of "soft" commission dollars to pay for research services.
The Board noted that the growth of fund assets over time across the complex allows Fidelity to reinvest in the development of services designed to enhance the value and convenience of the Fidelity funds as investment vehicles. These services include 24-hour access to account information and market information through telephone representatives and over the Internet, investor education materials and asset allocation tools, and the expanded availability of Fidelity Investor Centers.
The Board noted that it and the boards of certain other Fidelity funds had formed an ad hoc Committee on Transfer Agency Fees to review the variety of transfer agency fee structures throughout the industry and Fidelity's competitive positioning with respect to industry participants.
Investment in a Large Fund Family. The Board considered the benefits to shareholders of investing in a Fidelity fund, including the benefits of investing in a fund that is part of a large family of funds offering a variety of investment disciplines and providing a large variety of mutual fund investor services. The Board noted that Fidelity had taken, or had made recommendations that resulted in the Fidelity funds taking, a number of actions over the previous year that benefited particular funds, including: (i) continuing to dedicate additional resources to Fidelity's investment research process, which includes meetings with management of issuers of securities in which the funds invest, and to the support of the senior management team that oversees asset management; (ii) continuing efforts to enhance Fidelity's global research capabilities; (iii) launching new funds and making other enhancements to meet client needs; (iv) launching new share classes of existing funds; (v) eliminating purchase minimums and broadening eligibility requirements for certain funds and share classes; (vi) reducing management fees and total expenses for certain growth equity funds and index funds; (vii) lowering expense caps for certain existing funds and classes, and converting certain voluntary expense caps to contractual caps, to reduce expenses borne by shareholders; (viii) eliminating short-term redemption fees for funds that had such fees; (ix) rationalizing product lines and gaining increased efficiencies from fund mergers and share class consolidations; (x) continuing to develop, acquire and implement systems and technology to improve services to the funds and shareholders, strengthen information security, and increase efficiency; and (xi) continuing to implement enhancements to further strengthen Fidelity's product line to increase investors' probability of success in achieving their investment goals, including retirement income goals.
Investment Performance. The Board considered whether the fund has operated in accordance with its investment objective, as well as its record of compliance with its investment restrictions and its performance history. The fund had portfolio manager changes July 2015, October 2015, October 2016, August 2018, and November 2018. The Board will continue to monitor closely the fund's performance, taking into account the portfolio manager changes.
The Board took into account discussions that occur at Board meetings throughout the year with representatives of the Investment Advisers about fund investment performance. In this regard the Board noted that as part of regularly scheduled fund reviews and other reports to the Board on fund performance, the Board considers annualized return information for the fund for different time periods, measured against an appropriate securities market index ("benchmark index") and a peer group of funds with similar objectives ("peer group"), if any. In its evaluation of fund investment performance, the Board gave particular attention to information indicating changes in performance of certain Fidelity funds for specific time periods and discussed with the Investment Advisers the reasons for any overperformance or underperformance.
In addition to reviewing absolute and relative fund performance, the Independent Trustees periodically consider the appropriateness of fund performance metrics in evaluating the results achieved. In general, the Independent Trustees believe that fund performance should be evaluated based on net performance (after fees and expenses) of both the highest performing and lowest performing fund share classes, where applicable, compared to appropriate benchmark indices, over appropriate time periods that may include full market cycles, and compared to peer groups, as applicable, over the same periods, taking into account relevant factors including the following: general market conditions; issuer-specific information; and fund cash flows and other factors.
The Independent Trustees recognize that shareholders evaluate performance on a net basis over their own holding periods, for which one-, three-, and five-year periods are often used as a proxy. For this reason, the performance information reviewed by the Board also included net cumulative total return information for the fund and an appropriate benchmark index and peer group for the most recent one-, three-, and five-year periods ended June 30, 2018, as shown below. Returns are shown compared to the 25th percentile (top of box, 75% beaten) and 75th percentile (bottom of box, 25% beaten) of the peer universe.
Fidelity Balanced Fund
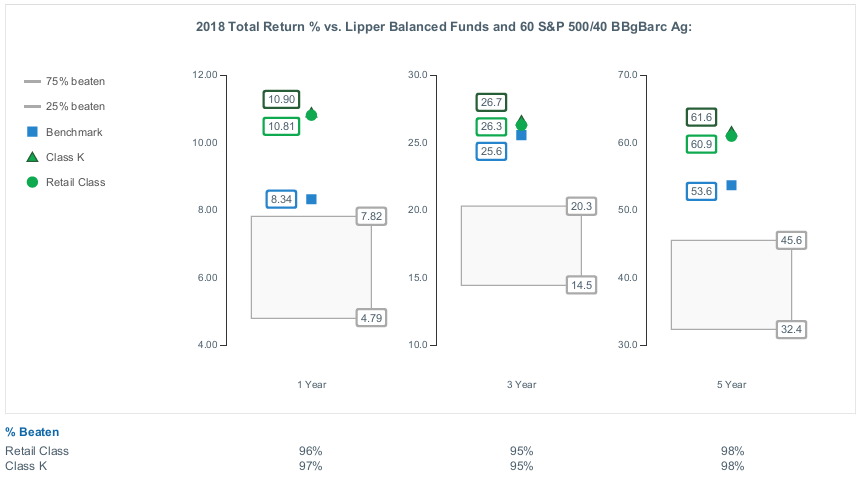
Based on its review, the Board concluded that the nature, extent, and quality of services provided to the fund under the Advisory Contracts should continue to benefit the shareholders of the fund.
Competitiveness of Management Fee and Total Expense Ratio. The Board considered the fund's management fee and total expense ratio compared to "mapped groups" of competitive funds and classes created for the purpose of facilitating the Trustees' competitive analysis of management fees and total expenses. Fidelity creates "mapped groups" by combining similar Lipper investment objective categories that have comparable investment mandates. Combining Lipper investment objective categories aids the Board's management fee and total expense ratio comparisons by broadening the competitive group used for comparison.
Management Fee. The Board considered two proprietary management fee comparisons for the 12-month periods (ended June 30 for 2018 and December 31 for prior periods) shown in basis points (BP) in the chart below. The group of Lipper funds used by the Board for management fee comparisons is referred to below as the "Total Mapped Group." The Total Mapped Group is broader than the Lipper peer group used by the Board for performance comparisons because the Total Mapped Group combines several Lipper investment objective categories while the Lipper peer group does not. The Total Mapped Group comparison focuses on a fund's standing in terms of gross management fees before expense reimbursements or caps relative to the total universe of funds with comparable investment mandates, regardless of whether their management fee structures also are comparable. Funds with comparable investment mandates offer exposure to similar types of securities. Funds with comparable management fee structures have similar management fee contractual arrangements (
e.g., flat rate charged for advisory services, all-inclusive fee rate,
etc.). "TMG %" represents the percentage of funds in the Total Mapped Group that had management fees that were lower than the fund's. For example, a hypothetical TMG % of 20% would mean that 80% of the funds in the Total Mapped Group had higher, and 20% had lower, management fees than the fund. The fund's actual TMG %s and the number of funds in the Total Mapped Group are in the chart below. The "Asset-Size Peer Group" (ASPG) comparison focuses on a fund's standing relative to a subset of non-Fidelity funds within the Total Mapped Group that are similar in size and management fee structure. For example, if a fund is in the first quartile of the ASPG, the fund's management fee ranks in the least expensive or lowest 25% of funds in the ASPG. The ASPG represents at least 15% of the funds in the Total Mapped Group with comparable asset size and management fee structures, subject to a minimum of 50 funds (or all funds in the Total Mapped Group if fewer than 50). Additional information, such as the ASPG quartile in which the fund's management fee rate ranked, is also included in the chart and was considered by the Board.
Fidelity Balanced Fund

The Board noted that the fund's management fee rate ranked below the median of its Total Mapped Group and below the median of its ASPG for the 12-month period ended June 30, 2018.
The Board noted that it and the boards of other Fidelity funds formed an ad hoc Committee on Group Fee, which meets periodically, to conduct an in-depth review of the "group fee" component of the management fee of funds with such management fee structures. The Committee's focus included the mechanics of the group fee, the competitive landscape of group fee structures, Fidelity funds with no group fee component and investment products not included in group fee assets. The Board also considered that, for funds subject to the group fee, FMR agreed to voluntarily waive fees over a specified period of time in amounts designed to account for assets converted from certain funds to certain collective investment trusts.
The Board also noted that, in 2013, the ad hoc Committee on Management Fees was formed to conduct an in-depth review of the management fee rates of Fidelity's active equity mutual funds. The Committee focused on the following areas: (i) standard fee structures; (ii) research consumption and trading evolution; (iii) management fee competitiveness/profitability by category; and (iv) factors that drive institutional pricing.
Based on its review, the Board concluded that the fund's management fee is fair and reasonable in light of the services that the fund receives and the other factors considered.
Total Expense Ratio. In its review of each class's total expense ratio, the Board considered the fund's management fee rate as well as other fund or class expenses, as applicable, such as transfer agent fees, pricing and bookkeeping fees, and custodial, legal, and audit fees. The Board also noted that Fidelity may agree to waive fees and expenses from time to time, and the extent to which, if any, it has done so for the fund. As part of its review, the Board also considered the current and historical total expense ratios of each class of the fund compared to competitive fund median expenses. Each class of the fund is compared to those funds and classes in the Total Mapped Group (used by the Board for management fee comparisons) that have a similar sales load structure.
The Board noted that the total expense ratio of each class ranked below the competitive median for the 12-month period ended June 30, 2018.
Fees Charged to Other Fidelity Clients. The Board also considered Fidelity fee structures and other information with respect to clients of Fidelity, such as other funds advised or subadvised by Fidelity, pension plan clients, and other institutional clients with similar mandates. The Board noted that a joint ad hoc committee created by it and the boards of other Fidelity funds periodically reviews and compares Fidelity's institutional investment advisory business with its business of providing services to the Fidelity funds and also noted the most recent findings of the committee. The Board noted that the committee's review included a consideration of the differences in services provided, fees charged, and costs incurred, as well as competition in the markets serving the different categories of clients.
Based on its review of total expense ratios and fees charged to other Fidelity clients, the Board concluded that the total expense ratio of each class of the fund was reasonable in light of the services that the fund and its shareholders receive and the other factors considered.
Costs of the Services and Profitability. The Board considered the revenues earned and the expenses incurred by Fidelity in conducting the business of developing, marketing, distributing, managing, administering and servicing the fund and servicing the fund's shareholders. The Board also considered the level of Fidelity's profits in respect of all the Fidelity funds.
On an annual basis, Fidelity presents to the Board information about the profitability of its relationships with the fund. Fidelity calculates profitability information for each fund, as well as aggregate profitability information for groups of Fidelity funds and all Fidelity funds, using a series of detailed revenue and cost allocation methodologies which originate with the books and records of Fidelity on which Fidelity's audited financial statements are based. The Audit Committee of the Board reviews any significant changes from the prior year's methodologies.
PricewaterhouseCoopers LLP (PwC), auditor to Fidelity and certain Fidelity funds, has been engaged annually by the Board as part of the Board's assessment of Fidelity's profitability analysis. PwC's engagement includes the review and assessment of the methodologies used by Fidelity in determining the revenues and expenses attributable to Fidelity's mutual fund business, and completion of agreed-upon procedures in respect of the mathematical accuracy of the fund profitability information and its conformity to established allocation methodologies. After considering PwC's reports issued under the engagement and information provided by Fidelity, the Board concluded that while other allocation methods may also be reasonable, Fidelity's profitability methodologies are reasonable in all material respects.
The Board also reviewed Fidelity's non-fund businesses and potential indirect benefits such businesses may have received as a result of their association with Fidelity's mutual fund business (i.e., fall-out benefits) as well as cases where Fidelity's affiliates may benefit from the fund's business. The Board noted that changes to fall-out benefits year-over-year reflect business developments at Fidelity's various businesses.
The Board considered the costs of the services provided by and the profits realized by Fidelity in connection with the operation of the fund and was satisfied that the profitability was not excessive.
Economies of Scale. The Board considered whether there have been economies of scale in respect of the management of the Fidelity funds, whether the Fidelity funds (including the fund) have appropriately benefited from any such economies of scale, and whether there is potential for realization of any further economies of scale. The Board considered the extent to which the fund will benefit from economies of scale as assets grow through increased services to the fund, through waivers or reimbursements, or through fee or expense ratio reductions. The Board also noted that a committee (the Economies of Scale Committee) created by it and the boards of other Fidelity funds periodically analyzes whether Fidelity attains economies of scale in respect of the management and servicing of the Fidelity funds, whether the Fidelity funds have appropriately benefited from such economies of scale, and whether there is potential for realization of any further economies of scale.
The Board recognized that the fund's management contract incorporates a "group fee" structure, which provides for lower group fee rates as total group assets increase, and for higher group fee rates as total group assets decrease (with "group assets" defined to include fund assets under FMR's management plus the assets of sector funds previously under FMR's management). FMR calculates the group fee rates based on a tiered asset "breakpoint" schedule that varies based on asset class. The Board considered that the group fee is designed to deliver the benefits of economies of scale to fund shareholders when total Fidelity fund assets increase, even if assets of any particular fund are unchanged or have declined, because some portion of Fidelity's costs are attributable to services provided to all Fidelity funds, and all funds benefit if those costs can be allocated among more assets. The Board concluded that, given the group fee structure, fund shareholders will benefit from lower management fees as group assets increase at the fund complex level, regardless of whether Fidelity achieves any such economies of scale.
The Board concluded, taking into account the analysis of the Economies of Scale Committee, that economies of scale, if any, are being appropriately shared between fund shareholders and Fidelity.
Additional Information Requested by the Board. In order to develop fully the factual basis for consideration of the Fidelity funds' advisory contracts, the Board requested and received additional information on certain topics, including: (i) fund performance trends, in particular the underperformance of certain funds, and Fidelity's long-term strategies for certain funds; (ii) Fidelity's fund profitability methodology, profitability trends for certain funds, and the impact of certain factors on fund profitability results; (iii) metrics for evaluating index fund and ETF performance and information about ETF trading characteristics; (iv) the methodology with respect to the evaluation of competitive fund data and peer group classifications and fee comparisons; (v) the expense structures for different funds and classes; (vi) information regarding other accounts managed by Fidelity, including collective investment trusts; and (vii) Fidelity's philosophies and strategies for evaluating funds and classes with lower or declining asset levels.
Based on its evaluation of all of the conclusions noted above, and after considering all factors it believed relevant, the Board concluded that the advisory fee arrangements are fair and reasonable, and that the fund's Advisory Contracts should be renewed.
BAL-SANN-0419
1.471161.121
Item 2.
Code of Ethics
Not applicable.
Item 3.
Audit Committee Financial Expert
Not applicable.
Item 4.
Principal Accountant Fees and Services
Not applicable.
Item 5.
Audit Committee of Listed Registrants
Not applicable.
Item 6.
Investments
(a)
Not applicable.
(b)
Not applicable
Item 7.
Disclosure of Proxy Voting Policies and Procedures for Closed-End Management Investment Companies
Not applicable.
Item 8.
Portfolio Managers of Closed-End Management Investment Companies
Not applicable.
Item 9.
Purchase of Equity Securities by Closed-End Management Investment Company and Affiliated Purchasers
Not applicable.
Item 10.
Submission of Matters to a Vote of Security Holders
There were no material changes to the procedures by which shareholders may recommend nominees to the Fidelity Puritan Trust’s Board of Trustees.
Item 11.
Controls and Procedures
(a)(i) The President and Treasurer and the Chief Financial Officer have concluded that the Fidelity Puritan Trust’s (the “Trust”) disclosure controls and procedures (as defined in Rule 30a-3(c) under the Investment Company Act) provide reasonable assurances that
material information relating to the Trust is made known to them by the appropriate persons, based on their evaluation of these controls and procedures as of a date within 90 days of the filing date of this report.
(a)(ii) There was no change in the Trust’s internal control over financial reporting (as defined in Rule 30a-3(d) under the Investment Company Act) that occurred during the period covered by this report that has materially affected, or is reasonably likely to materially affect, the Trust’s internal control over financial reporting.
Item 12.
Disclosure of Securities Lending Activities for Closed-End Management
Investment Companies
Not applicable.
Item 13.
Exhibits
| | |
(a) | (1) | Not applicable. |
(a) | (2) | Certification pursuant to Rule 30a-2(a) under the Investment Company Act of 1940 (17 CFR 270.30a-2(a)) is filed and attached hereto as Exhibit 99.CERT. |
(a) | (3) | Not applicable. |
(b) |
| Certification pursuant to Rule 30a-2(b) under the Investment Company Act of 1940 (17 CFR 270.30a-2(b)) is furnished and attached hereto as Exhibit 99.906CERT. |
SIGNATURES
Pursuant to the requirements of the Securities Exchange Act of 1934 and the Investment Company Act of 1940, the registrant has duly caused this report to be signed on its behalf by the undersigned, thereunto duly authorized.
Fidelity Puritan Trust
| |
By: | /s/Stacie M. Smith |
| Stacie M. Smith |
| President and Treasurer |
|
|
Date: | April 24, 2019 |
Pursuant to the requirements of the Securities Exchange Act of 1934 and the Investment Company Act of 1940, this report has been signed below by the following persons on behalf of the registrant and in the capacities and on the dates indicated.
| |
By: | /s/Stacie M. Smith |
| Stacie M. Smith |
| President and Treasurer |
|
|
Date: | April 24, 2019 |
| |
By: | /s/John J. Burke III |
| John J. Burke III |
| Chief Financial Officer |
|
|
Date: | April 24, 2019 |