| |
| UNITED STATES |
| SECURITIES AND EXCHANGE COMMISSION |
| Washington, D.C. 20549 |
| |
| FORM N-CSR |
| |
| CERTIFIED SHAREHOLDER REPORT OF REGISTERED |
| MANAGEMENT INVESTMENT COMPANIES |
| |
| Investment Company Act file number: (811- 00781) |
| | |
| Exact name of registrant as specified in charter: | The Putnam Fund for Growth and Income |
| |
| Address of principal executive offices: One Post Office Square, Boston, Massachusetts 02109 |
| | |
| Name and address of agent for service: | Beth S. Mazor, Vice President |
| | One Post Office Square |
| | Boston, Massachusetts 02109 |
| | |
| Copy to: | John W. Gerstmayr, Esq. |
| | Ropes & Gray LLP |
| | One International Place |
| | Boston, Massachusetts 02110 |
| |
| Registrant’s telephone number, including area code: (617) 292-1000 |
| | |
| Date of fiscal year end: October 31, 2009 | |
| |
| Date of reporting period: November 1, 2008 — April 30, 2009 |
Item 1. Report to Stockholders:
The following is a copy of the report transmitted to stockholders pursuant to Rule 30e-1 under the Investment Company Act of 1940:

Since 1937, when George Putnam created a prudent mix of stocks and bonds in a single, professionally managed portfolio, we have championed the wisdom of the balanced approach. Today, we offer a world of equity, fixed-income, multi-asset, and absolute-return portfolios so investors can pursue a range of financial goals. Our seasoned portfolio managers seek superior results over time, backed by original, fundamental research on a global scale. We believe in service excellence, in the value of experienced financial advice, and in putting clients first in everything we do.
In 1830, Massachusetts Supreme Judicial Court Justice Samuel Putnam established The Prudent Man Rule, a legal foundation for responsible money management.

THE PRUDENT MAN RULE
All that can be required of a trustee to invest is that he shall conduct himself faithfully and exercise a sound discretion. He is to observe how men of prudence, discretion, and intelligence manage their own affairs, not in regard to speculation, but in regard to the permanent disposition of their funds, considering the probable income, as well as the probable safety of the capital to be invested.

The Putnam
Fund for Growth
and Income
Semiannual Report
4 | 30 | 09
| |
| Message from the Trustees | 2 |
|
| About the fund | 4 |
|
| Performance snapshot | 6 |
|
| Interview with your fund’s Portfolio Manager | 7 |
|
| Performance in depth | 12 |
|
| Expenses | 14 |
|
| Portfolio turnover | 16 |
|
| Your fund’s management | 17 |
|
| Terms and definitions | 18 |
|
| Trustee approval of management contract | 19 |
|
| Other information for shareholders | 23 |
|
| Financial statements | 24 |
|
Message from the Trustees
Dear Fellow Shareholder:
Since the fourth quarter of 2007, investors have endured one of the most difficult downturns in decades, but there now seem to be early signs that the storm clouds may be starting to clear in the stock market. Although this downturn is far from over and we remain cautious, we are encouraged by a number of developments.
Before its climb was interrupted by profit taking in early May, the stock market experienced a two-month run-up from its March lows. Although many analysts agree that the stock market is in the process of bottoming out, they are careful to note that the market is fairly valued today and that it will require positive corporate earnings growth to continue its climb.
The outlook for the fixed-income market is less clear. Hundreds of billions of dollars in economic stimulus spending have increased the U.S. deficit, which may weaken demand for Treasuries. Corporate and municipal debt may fare slightly better.
Under President and CEO Robert L. Reynolds, Putnam Investments has instituted several changes in order to position Putnam mutual funds for a market recovery. In April, Walter C. Donovan, a 25-year investment industry veteran, joined Putnam as Chief Investment Officer. Mr. Donovan will lead a reinvigorated investment organization strengthened by the arrival during the past few months of several well-regarded senior portfolio managers, research analysts, and equity traders.
We also are pleased to announce that Ravi Akhoury has been elected to the Board of Trustees of the Putnam Funds and W. Thomas Stephens has rejoined the Board. From 1992 to 2007, Mr. Akhoury was Chairman and CEO of MacKay Shields, a multi-product investment management firm with over $40 billion in assets under management. He serves as advisor to New York Life Insurance Company, and previously was a member of its Executive Management Committee.
2
Mr. Stephens retired in December 2008 as Chairman and Chief Executive Officer of Boise Cascade, L.L.C., a paper, forest products, and timberland assets company. He is a Director of TransCanada Pipelines, Ltd., an energy infrastructure company. From 1997 to 2008, Mr. Stephens served on the Board of Trustees of the Putnam Funds. Until 2004, he also was a Director of Xcel Energy Incorporated, Qwest Communications, and Norske Canada, Inc.
We would like to take this opportunity to welcome new shareholders to the fund and to thank all of our investors for your continued confidence in Putnam.

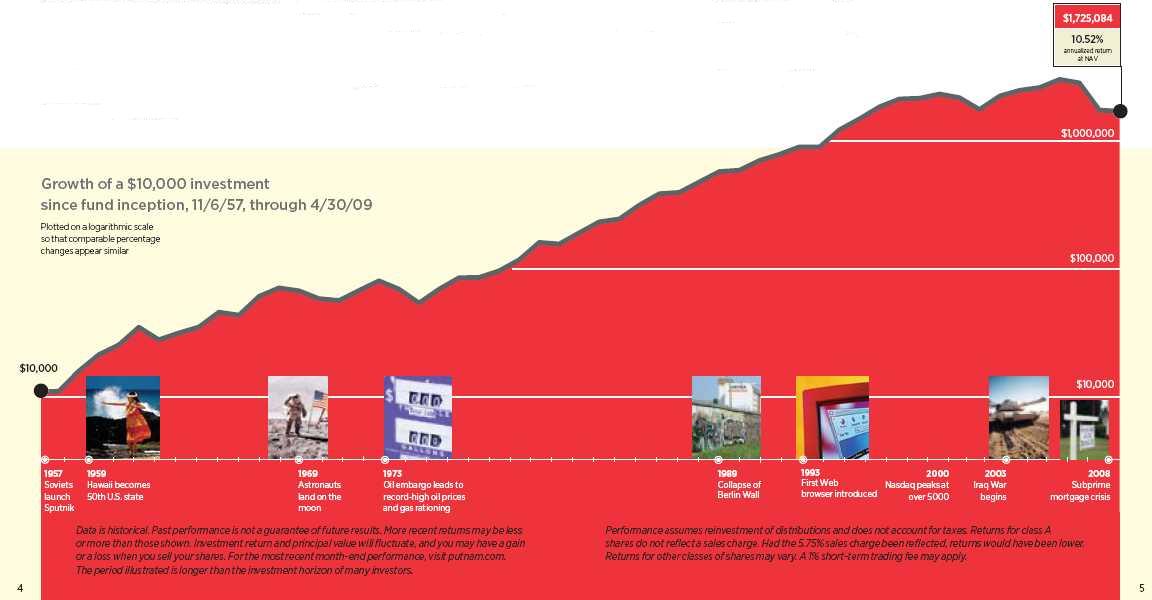
About the fund
Pursuing capital growth for over 50 years
In November 1957 — almost 20 years to the day after Putnam Investments was founded with the launch of The George Putnam Fund of Boston — Putnam launched its second mutual fund: The Putnam Fund for Growth and Income.
Putnam’s founders carefully debated the merits of adding a fund whose primary focus would be stock investments. They believed that the balanced approach of The George Putnam Fund of Boston, which owned a mix of stocks and bonds, was still the most prudent choice for most individuals. However, the advent of state tax-exempt bonds was making it more advantageous for some investors to balance their own portfolios. Furthermore, many financial advisors who worked with Putnam had been urging the firm to launch a common stock fund to meet this growing need.
The fund was launched in a favorable environment for stock investors. Confidence in stocks, which had been severely shaken by the 1929 crash and the Great Depression that followed, had finally been renewed by the early 1950s. Fueled by the optimism of new technologies and the race to space, the 1960s were generally good years for investors. Then came the stagflation-plagued 1970s when the stock market moved sideways for most of the decade.
The fund benefited from the rallies that dominated the 1980s and 1990s. There were bumps in the road, such as the recession of the early 1990s, and, more recently, the bear market of 2000–2002.
True to its roots, The Putnam Fund for Growth and Income continues to focus on long-term capital growth opportunities among leading large-cap companies, with equal attention to managing downside risk. We believe these strategies, which have proven successful for long-term investors in the fund, will continue to serve the fund well.
Value investing seeks underpriced stocks,
but there is no guarantee that a stock’s
price will rise.
Performance
snapshot
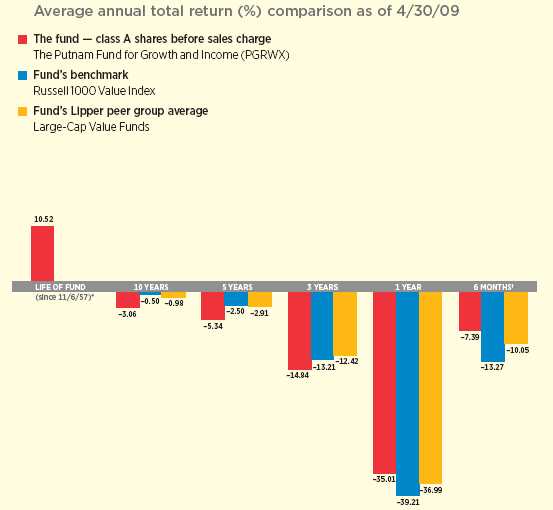
Current performance may be lower or higher than the quoted past performance, which cannot guarantee future results. Share price, principal value, and return will fluctuate, and you may have a gain or a loss when you sell your shares. Performance of class A shares assumes reinvestment of distributions and does not account for taxes. Fund returns in the bar chart do not reflect a sales charge of 5.75%; had they, returns would have been lower. See pages 7 and 12–14 for additional performance information. For a portion of the periods, this fund may have limited expenses, without which returns would have been lower. Due to market volatility, current performance may be higher or lower than performance shown. A 1% short-term trading fee may apply. To obtain the most recent month-end performance, visit putnam.com.
* The fund’s benchmark and Lipper category were not in existence at the time of the fund’s inception. The Russell 1000 Value Index commenced 12/31/78. The Lipper category commenced 12/31/59.
† Returns for the six-month period are not annualized, but cumulative.
6
Interview with your
fund’s Portfolio Manager
Robert Ewing
Robert, how did the fund perform over the six-month reporting period?
It was a challenging period for equity markets, which declined for most of the past six months. As difficult as the period was, though, I am pleased to report that The Putnam Fund for Growth and Income outperformed both its benchmark index and the average return of its Lipper peers. For the six-month period, the fund declined 7.39%, while its benchmark, the Russell 1000 Value Index, lost 13.27%, and the average large-cap value fund in the Lipper universe dropped 10.05%.
What were some of the factors that contributed to the stock market’s decline during that time?
Throughout the latter part of 2008, investors became extremely risk-averse, and as a result moved massive amounts of money out of stocks and into cash and U.S. Treasuries. At that time, the markets were beginning to fully grasp the scope of the difficulties facing the financial industry and the potential consequences for the economy as a whole. In anticipation of a severely deteriorating economy, businesses hit the brakes hard in late 2008 and early 2009, quickly reducing spending, payrolls, and inventories. Although the economy is clearly in the middle of a severe downturn, with gross domestic product [GDP] down sharply and
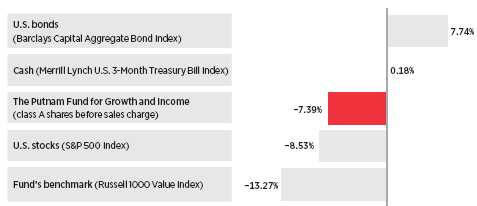
Broad market index and fund performance
This comparison shows your fund’s performance in the context of broad market indexes for the six months ended 4/30/09. See page 6 and pages 12–14 for additional fund performance information. Index descriptions can be found on page 18.
7
unemployment high, some of the other data we’ve seen so far generally has been less dire than anticipated. That’s not to say the news is good, but the worst-case scenarios that the markets were pricing in seem likely to be avoided.
How successful as a strategy has value investing been in this economic environment?
Over the last 50 years, undervalued stocks have typically appreciated more than the market as a whole, and I believe that over the long term, that trend will continue. But for much of 2007 and 2008, looking at valuation was not an effective means for picking stocks. Stocks that appeared the cheapest went on to post some of the biggest declines. Certainly, it’s been a challenging time for value investors, but I believe we’ve seen some recent evidence that valuation has started to matter again in the market, and in such an environment, the fund has the potential to perform well.
Which of the fund’s holdings contributed positively to performance?
Goldman Sachs was our top contributor. In September 2008, the company — along with Morgan Stanley, the only other surviving Wall Street investment bank — filed with the federal government to transform itself into a commercial bank holding company. The move meant the company would be subject to much tighter regulation and capital requirements — a move that at the time raised some eyebrows with a number of investors and analysts. We believed that in this environment the firm would face significant challenges, but that it could navigate them better than the competition. It is a thesis that seems to have been correct, and Goldman’s most recent earnings improved dramatically since late 2008.
Bank of America was another holding that helped returns relative to the benchmark. The company has had well-publicized difficulties integrating Merrill Lynch, which announced
Top 10 holdings
This table shows the fund’s top 10 holdings and the percentage of the fund’s net assets that each represented as of 4/30/09. Also shown is each holding’s market sector and the specific industry within that sector. Holdings will vary over time.
| | |
| HOLDING (percentage of fund’s net assets) | SECTOR | INDUSTRY |
|
| Exxon Mobil Corp. (4.9%) | Energy | Oil and gas |
| Chevron Corp. (3.0%) | Energy | Oil and gas |
| JPMorgan Chase & Co. (2.8%) | Financials | Banking |
| Pfizer, Inc. (2.5%) | Health care | Pharmaceuticals |
| General Electric Co. (2.4%) | Conglomerates | Conglomerates |
| AT&T, Inc.(2.3%) | Communication services | Regional Bells |
| Goldman Sachs Group, Inc. (The) (2.0%) | Financials | Investment banking/Brokerage |
| Johnson & Johnson (2.0%) | Health care | Pharmaceuticals |
| Verizon Communications, Inc. (1.9%) | Communication services | Regional Bells |
| Procter & Gamble Co. (The) (1.9%) | Consumer staples | Consumer goods |
8
significant losses after Bank of America announced its purchase in September 2008. The bank’s share prices plummeted, reflecting a belief that the company likely would be nationalized and existing shareholders would be wiped out. We believed that risk was overblown, and significantly increased our position. The stock has rallied substantially since its lows earlier this year.
Having an underweight position in General Electric also contributed to the fund’s relative performance. Although a number of the conglomerate’s business units faced challenges in 2008, GE Capital Finance, the company’s financial division, was of particular concern to the market. Its exposure to real-estate and credit card debt hammered profitability in the unit, and analysts have expressed uncertainty about the company’s forecasts for the next fiscal year.
I should also mention that a part of the fund’s outperformance versus the benchmark was due to some legal proceedings. Tyco (which the fund still holds) and Enron, having settled their respective class-action lawsuits, made payments that were distributed to the fund during the period.
Which holdings detracted from the fund’s relative returns?
Capital One was the fund’s biggest detractor. The company has credit card and banking operations, and as the economy and the financials sector deteriorated, Capital One was hurt on both fronts. Some investors believed that Capital One would need to raise more capital after the Fed [U.S. Federal Reserve] released the results of its much-anticipated stress test. This proved not to be the case, but those fears did nothing to improve investor sentiment for the stock, which declined in value over the period.
An underweight position in Wyeth also detracted from relative returns. Wyeth, a large pharmaceutical company, agreed to be acquired by competitor Pfizer during the period. Although I had been adding to
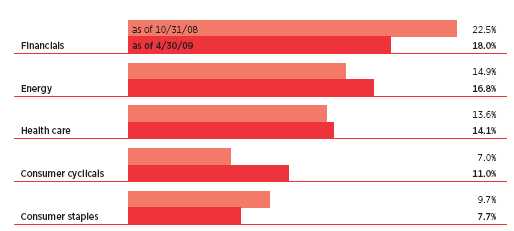
Comparison of top sector weightings
This chart shows how the fund’s top weightings have changed over the past six months. Weightings
are shown as a percentage of net assets. Holdings will vary over time.
9
the fund’s position, the fund was still underexposed when Pfizer’s offer was made public.
Textron was another underperforming holding. Textron is a diversified industrial business, and one of the company’s subsidiaries is Cessna, a business jet manufacturer. The Cessna division suffered during the period on two levels. First, jet sales declined significantly during the period as businesses curtailed expenses. Second, the firm has a large lending portfolio that provides financing for Cessna jet purchases, and the credit quality of the portfolio — which reflects the likelihood of payments being made —declined, while, at the same time, Cessna’s ability to make additional loans was impaired. It was a tough combination for the division and for Textron, and I sold the stock during the period.
What do you expect from the stock market and the fund in the coming months?
I’m optimistic that the worst of the recession is behind us. It’s clear that the federal government has been willing to take aggressive action to prevent the collapse of the credit markets and the financials sector, and there no longer appears to be widespread risk of businesses failing because of a lack of access to working capital. There will no doubt be winners and losers in what will likely be a prolonged recovery, but I believe the fears investors harbored of real systemic problems in the market have largely passed.
With this as a backdrop, I believe our analysts’ commitment to rigorous fundamental research will prove to be a particularly valuable asset. Our goal is first to out-analyze the competition, seeking to more thoroughly scrutinize widely available data, and second, to out-gather the competition by generating independent research that other asset managers may not have. This means talking to private companies and consultants, attending trade shows, and generally looking for any information the markets haven’t already factored in to stock prices. I believe that if we can continue to deliver on these objectives, and as some sense of normalcy begins to return to the markets, the fund potentially will be an attractive option for long-term stock investors.
Thank you, Robert, for your time and insights today.
IN THE NEWS
The Obama administration estimates a record $1.84 trillion budget deficit for 2009. The combination of higher government debt and stimulus spending has cooled investors’ attitudes toward Treasury bonds, whose prices have fallen more than 20% since the start of 2009, despite their safe-haven status. Historically, Treasury bonds have been among the investments most vulnerable to fears of rising inflation, which can result from increased government spending. Massive government stimulus often leads to higher prices for consumer goods because the Federal Reserve, in effect, prints more money to pay for the additional spending. This, in turn, can diminish the purchasing power of the dollar. Higher interest rates will push down Treasury prices because when interest rates rise, bond prices fall, and vice versa.
10
The views expressed in this report are exclusively those of Putnam Management. They are not meant as investment advice.
Please note that the holdings discussed in this report may not have been held by the fund for the entire period. Portfolio composition is subject to review in accordance with the fund’s investment strategy and may vary in the future. Current and future portfolio holdings are subject to risk.
Of special interest
We are pleased to report that the fund benefited during the period as a result of two court-ordered settlement distributions made to eligible holders of Enron Corporation and Tyco International Ltd. common stock. Enron’s stock became worthless in 2001 when it was determined that the company had defrauded shareholders by conspiring to conceal losses and inflate profits. The company declared bankruptcy in December 2001, and its assets were later sold off to recoup creditors. Shareholders who purchased Enron stock between September 9, 1997, and December 2, 2001, were eligible to participate in the settlement. The fund received $27,206,693 in December 2008, due to the Enron settlement. The fund also received $34,822,029 ($1,624,825 of which was the result of its merger with Putnam Classic Equity Fund) from the Tyco settlement in March 2009.
In addition, the fund’s quarterly dividend rate of $0.052 decreased to $0.044 per class A share effective March 2009 after a number of the portfolio’s holdings made cuts to their dividend payments. Other share classes experienced similar decreases.
11
Your fund’s performance
This section shows your fund’s performance, price, and distribution information for periods ended April 30, 2009, the end of the first half of its current fiscal year. In accordance with regulatory requirements for mutual funds, we also include performance as of the most recent calendar quarter-end and expense information taken from the fund’s current prospectus. Performance should always be considered in light of a fund’s investment strategy. Data represents past performance. Past performance does not guarantee future results. More recent returns may be less or more than those shown. Investment return and principal value will fluctuate, and you may have a gain or a loss when you sell your shares. Performance information does not reflect any deduction for taxes a shareholder may owe on fund distributions or on the redemption of fund shares. For the most recent month-end performance, please visit the Individual Investors section of putnam.com or call P utnam at 1-800-225-1581. Class Y shares are generally only available to corporate and institutional clients and clients in other approved programs. See the Terms and Definitions section in this report for definitions of the share classes offered by your fund.
Fund performance Total return for periods ended 4/30/09
| | | | | | | | | | |
| | Class A | Class B | Class C | Class M | Class R | Class Y |
| (inception dates) | (11/6/57) | (4/27/92) | (7/26/99) | (5/1/95) | (1/21/03) | (6/15/94) |
|
| | NAV | POP | NAV | CDSC | NAV | CDSC | NAV | POP | NAV | NAV |
|
| Annual average | | | | | | | | | | |
| (life of fund) | 10.52% | 10.40% | 9.51% | 9.51% | 9.69% | 9.69% | 9.79% | 9.71% | 10.24% | 10.60% |
|
| 10 years | –26.70 | –30.90 | –32.12 | –32.12 | –31.99 | –31.99 | –30.35 | –32.80 | –28.52 | –24.86 |
| Annual average | –3.06 | –3.63 | –3.80 | –3.80 | –3.78 | –3.78 | –3.55 | –3.90 | –3.30 | –2.82 |
|
| 5 years | –24.00 | –28.37 | –26.90 | –27.93 | –26.86 | –26.86 | –25.94 | –28.53 | –24.98 | –23.09 |
| Annual average | –5.34 | –6.46 | –6.07 | –6.34 | –6.06 | –6.06 | –5.83 | –6.50 | –5.59 | –5.12 |
|
| 3 years | –38.24 | –41.78 | –39.66 | –40.98 | –39.64 | –39.64 | –39.21 | –41.33 | –38.70 | –37.77 |
| Annual average | –14.84 | –16.50 | –15.50 | –16.12 | –15.49 | –15.49 | –15.29 | –16.28 | –15.05 | –14.62 |
|
| 1 year | –35.01 | –38.73 | –35.53 | –38.70 | –35.51 | –36.14 | –35.34 | –37.60 | –35.20 | –34.83 |
|
| 6 months | –7.39 | –12.76 | –7.84 | –12.39 | –7.82 | –8.73 | –7.72 | –10.92 | –7.55 | –7.34 |
|
Current performance may be lower or higher than the quoted past performance, which cannot guarantee future results. After-sales-charge returns (public offering price, or POP) for class A and M shares reflect a maximum 5.75% and 3.50% load, respectively. Class B share returns reflect the applicable contingent deferred sales charge (CDSC), which is 5% in the first year, declining to 1% in the sixth year, and is eliminated thereafter. Class C shares reflect a 1% CDSC for the first year that is eliminated thereafter. Class R and Y shares have no initial sales charge or CDSC. Performance for class B, C, M, R, and Y shares before their inception is derived from the historical performance of class A shares, adjusted for the applicable sales charge (or CDSC) and, except for class Y shares, the higher operating expenses for such shares.
Recent performance benefited from receipt of Enron Corporation and Tyco International Ltd. class action settlements pertaining to investments made prior to 2003.
For a portion of the periods, this fund may have limited expenses, without which returns would have been lower.
Due to market volatility, current performance may be higher or lower than performance shown.
A 1% short-term trading fee may be applied to shares exchanged or sold within 7 days of purchase.
12
Comparative index returns For periods ended 4/30/09
| | |
| | | Lipper Large-Cap Value Funds |
| | Russell 1000 Value Index | category average* |
|
| Annual average (life of fund) | —† | —† |
|
| 10 years | –4.86% | –8.25% |
| Annual average | –0.50 | –0.98 |
|
| 5 years | –11.88 | –13.45 |
| Annual average | –2.50 | –2.91 |
|
| 3 years | –34.62 | –32.69 |
| Annual average | –13.21 | –12.42 |
|
| 1 year | –39.21 | –36.99 |
|
| 6 months | –13.27 | –10.05 |
|
Index and Lipper results should be compared to fund performance at net asset value.
* Over the 6-month, 1-year, 3-year, 5-year, and 10-year periods ended 4/30/09, there were 596, 578, 491, 412, and 190 funds, respectively, in this Lipper category.
† The fund’s benchmark and Lipper category were not in existence at the time of the fund’s inception. The Russell 1000 Value Index commenced 12/31/78. The Lipper category commenced 12/31/59.
Fund price and distribution information For the six-month period ended 4/30/09
| | | | | | | | |
| Distributions | Class A | Class B | Class C | Class M | Class R | Class Y |
|
| Number | 2 | 2 | 2 | 2 | 2 | 2 |
|
| Income | $0.143 | $0.106 | $0.107 | $0.119 | $0.132 | $0.155 |
|
| Capital gains | — | — | — | — | — | — |
|
| Total | $0.143 | $0.106 | $0.107 | $0.119 | $0.132 | $0.155 |
|
| Share value | NAV | POP | NAV | NAV | NAV | POP | NAV | NAV |
|
| 10/31/08 | $10.09 | $10.71 | $9.91 | $10.05 | $10.01 | $10.37 | $10.04 | $10.12 |
|
| 4/30/09 | 9.19 | 9.75 | 9.02 | 9.15 | 9.11 | 9.44 | 9.14 | 9.21 |
|
| Current yield (end of period) | NAV | POP | NAV | NAV | NAV | POP | NAV | NAV |
|
| Current dividend rate 1 | 1.92% | 1.81% | 1.20% | 1.22% | 1.45% | 1.40% | 1.71% | 2.13% |
|
| Current 30-day SEC yield 2,3 | | | | | | | | |
| (with expense limitation) | N/A | 1.49 | 0.86 | 0.86 | N/A | 1.06 | 1.34 | 1.82 |
|
| Current 30-day SEC yield 3 | | | | | | | | |
| (without expense limitation) | N/A | 1.44 | 0.81 | 0.81 | N/A | 1.01 | 1.29 | 1.77 |
|
The classification of distributions, if any, is an estimate. Final distribution information will appear on your year-end tax forms.
1 Most recent distribution, excluding capital gains, annualized and divided by NAV or POP at end of period.
2 For a portion of the period, this fund may have limited expenses, without which yields would have been lower.
3 Based only on investment income and calculated using the maximum offering price for each share class, in accordance with SEC guidelines.
13
Fund performance as of most recent calendar quarter
Total return for periods ended 3/31/09
| | | | | | | | | | |
| | Class A | Class B | Class C | Class M | Class R | Class Y |
| (inception dates) | (11/6/57) | (4/27/92) | (7/26/99) | (5/1/95) | (1/21/03) | (6/15/94) |
|
| | NAV | POP | NAV | CDSC | NAV | CDSC | NAV | POP | NAV | NAV |
|
| Annual average | | | | | | | | | | |
| (life of fund) | 10.31% | 10.18% | 9.30% | 9.30% | 9.48% | 9.48% | 9.57% | 9.50% | 10.03% | 10.38% |
|
| 10 years | –29.72 | –33.77 | –34.82 | –34.82 | –34.78 | –34.78 | –33.21 | –35.54 | –31.47 | –28.00 |
| Annual average | –3.47 | –4.04 | –4.19 | –4.19 | –4.18 | –4.18 | –3.96 | –4.30 | –3.71 | –3.23 |
|
| 5 years | –33.18 | –37.01 | –35.64 | –36.55 | –35.65 | –35.65 | –34.87 | –37.15 | –34.04 | –32.40 |
| Annual average | –7.75 | –8.83 | –8.44 | –8.70 | –8.44 | –8.44 | –8.22 | –8.87 | –7.99 | –7.53 |
|
| 3 years | –43.54 | –46.79 | –44.82 | –46.03 | –44.83 | –44.83 | –44.44 | –46.39 | –43.96 | –43.17 |
| Annual average | –17.35 | –18.97 | –17.98 | –18.58 | –17.98 | –17.98 | –17.79 | –18.76 | –17.55 | –17.17 |
|
| 1 year | –38.45 | –42.00 | –38.92 | –41.93 | –38.96 | –39.56 | –38.81 | –40.94 | –38.63 | –38.35 |
|
| 6 months | –30.65 | –34.65 | –30.91 | –34.32 | –30.96 | –31.64 | –30.91 | –33.30 | –30.72 | –30.64 |
|
Fund’s annual operating expenses For the fiscal year ended 10/31/08
| | | | | | |
| | Class A | Class B | Class C | Class M | Class R | Class Y |
|
| Total annual fund operating expenses | 1.00% | 1.75% | 1.75% | 1.50% | 1.25% | 0.75% |
|
Expense information in this table is taken from the most recent prospectus, is subject to change, and may differ from that shown in the next section and in the financial highlights of this report. Expenses are shown as a percentage of average net assets.
Your fund’s expenses
As a mutual fund investor, you pay ongoing expenses, such as management fees, distribution fees (12b-1 fees), and other expenses. In the most recent six-month period, your fund limited these expenses; had it not done so, expenses would have been higher. Using the following information, you can estimate how these expenses affect your investment and compare them with the expenses of other funds. You may also pay one-time transaction expenses, including sales charges (loads) and redemption fees, which are not shown in this section and would have resulted in higher total expenses. For more information, see your fund’s prospectus or talk to your financial representative.
14
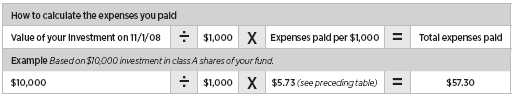
Review your fund’s expenses
The following table shows the expenses you would have paid on a $1,000 investment in The Putnam Fund for Growth and Income from November 1, 2008, to April 30, 2009. It also shows how much a $1,000 investment would be worth at the close of the period, assuming actual returns and expenses.
| | | | | | |
| | Class A | Class B | Class C | Class M | Class R | Class Y |
|
| Expenses paid per $1,000* | $5.73 | $9.29 | $9.29 | $8.10 | $6.92 | $4.54 |
|
| Ending value (after expenses) | $926.10 | $921.60 | $921.80 | $922.80 | $924.50 | $926.60 |
|
* Expenses for each share class are calculated using the fund’s annualized expense ratio for each class, which represents the ongoing expenses as a percentage of average net assets for the six months ended 4/30/09. The expense ratio may differ for each share class (see the last table in this section). Expenses are calculated by multiplying the expense ratio by the average account value for the period; then multiplying the result by the number of days in the period; and then dividing that result by the number of days in the year.
Estimate the expenses you paid
To estimate the ongoing expenses you paid for the six months ended April 30, 2009, use the following calculation method. To find the value of your investment on November 1, 2008, call Putnam at 1-800-225-1581.
Compare expenses using the SEC’s method
The Securities and Exchange Commission (SEC) has established guidelines to help investors assess fund expenses. Per these guidelines, the following table shows your fund’s expenses based on a $1,000 investment, assuming a hypothetical 5% annualized return. You can use this information to compare the ongoing expenses (but not transaction expenses or total costs) of investing in the fund with those of other funds. All mutual fund shareholder reports will provide this information to help you make this comparison. Please note that you cannot use this information to estimate your actual ending account balance and expenses paid during the period.
| | | | | | |
| | Class A | Class B | Class C | Class M | Class R | Class Y |
|
| Expenses paid per $1,000* | $6.01 | $9.74 | $9.74 | $8.50 | $7.25 | $4.76 |
|
| Ending value (after expenses) | $1,018.84 | $1,015.12 | $1,015.12 | $1,016.36 | $1,017.60 | $1,020.08 |
|
* Expenses for each share class are calculated using the fund’s annualized expense ratio for each class, which represents the ongoing expenses as a percentage of average net assets for the six months ended 4/30/09. The expense ratio may differ for each share class (see the last table in this section). Expenses are calculated by multiplying the expense ratio by the average account value for the period; then multiplying the result by the number of days in the period; and then dividing that result by the number of days in the year.
15
Compare expenses using industry averages
You can also compare your fund’s expenses with the average of its peer group, as defined by Lipper, an independent fund-rating agency that ranks funds relative to others that Lipper considers to have similar investment styles or objectives. The expense ratio for each share class shown indicates how much of your fund’s average net assets have been used to pay ongoing expenses during the period.
| | | | | | |
| | Class A | Class B | Class C | Class M | Class R | Class Y |
|
| Your fund’s annualized | | | | | | |
| expense ratio | 1.20% | 1.95% | 1.95% | 1.70% | 1.45% | 0.95% |
|
| Average annualized expense | | | | | | |
| ratio for Lipper peer group* | 1.23% | 1.98% | 1.98% | 1.73% | 1.48% | 0.98% |
|
* Putnam keeps fund expenses below the Lipper peer group average expense ratio by limiting our fund expenses if they exceed the Lipper average. The Lipper average is a simple average of front-end load funds in the peer group that excludes 12b-1 fees as well as any expense offset and brokerage/service arrangements that may reduce fund expenses. To facilitate the comparison in this presentation, Putnam has adjusted the Lipper average to reflect 12b-1 fees. Investors should note that the other funds in the peer group may be significantly smaller or larger than the fund, and that an asset-weighted average would likely be lower than the simple average. Also, the fund and Lipper report expense data at different times; the fund’s expense ratio shown here is annualized data for the most recent six-month period, while the quarterly updated Lipper average is based on the most recent fiscal year-end data available for the peer group funds as of 3/31/09.
Your fund’s portfolio turnover
Putnam funds are actively managed by experts who buy and sell securities based on intensive analysis of companies, industries, economies, and markets. Portfolio turnover is a measure of how often a fund’s managers buy and sell securities for your fund. A portfolio turnover of 100%, for example, means that the managers sold and replaced securities valued at 100% of a fund’s average portfolio value within a given period. Funds with high turnover may be more likely to generate capital gains that must be distributed to shareholders as taxable income. High turnover may also cause a fund to pay more brokerage commissions and other transaction costs, which may detract from performance.
You can use the following table to compare your fund’s turnover with the average turnover for funds in its Lipper category.
Turnover comparisons Percentage of holdings that change every year
| | | | | |
| | 2008 | 2007 | 2006 | 2005 | 2004 |
|
| The Putnam Fund for Growth | | | | | |
| and Income | 35% | 57% | 77% | 53% | 29% |
|
| Lipper Large-Cap Value Funds | | | | | |
| category average | 58% | 50% | 50% | 57% | 63% |
|
Turnover data for the fund is calculated based on the fund's fiscal-year period, which ends on October 31. Turnover data for the fund's Lipper category is calculated based on the average of the turnover of each fund in the category for its fiscal year ended during the indicated year. Fiscal years vary across funds in the Lipper category, which may limit the comparability of the fund's portfolio turnover rate to the Lipper average. Comparative data for 2008 is based on information available as of 12/31/08.
16
Your fund’s management
Your fund’s Portfolio Manager is Robert Ewing.
Portfolio management fund ownership
The following table shows how much the fund’s current Portfolio Manager has invested in the fund and in all Putnam mutual funds (in dollar ranges). Information shown is as of April 30, 2009, and April 30, 2008.
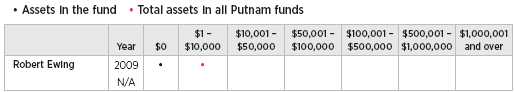
N/A indicates the individual was not a Portfolio Manager as of 4/30/08.
Trustee and Putnam employee fund ownership
As of April 30, 2009, all of the Trustees of the Putnam funds owned fund shares. The following table shows the approximate value of investments in the fund and all Putnam funds as of that date by the Trustees and Putnam employees. These amounts include investments by the Trustees’ and employees’ immediate family members and investments through retirement and deferred compensation plans.
| | |
| | Assets in the fund | Total assets in all Putnam funds |
|
| Trustees | $732,000 | $32,000,000 |
|
| Putnam employees | $6,252,000 | $339,000,000 |
|
Other Putnam funds managed by the Portfolio Manager
Robert Ewing is not a Portfolio Manager of any other Putnam mutual fund, although he may also manage other accounts and variable trust funds advised by Putnam Management or an affiliate.
17
Terms and definitions
Important terms
Total return shows how the value of the fund’s shares changed over time, assuming you held the shares through the entire period and reinvested all distributions in the fund.
Net asset value (NAV) is the price, or value, of one share of a mutual fund, without a sales charge. NAVs fluctuate with market conditions. NAV is calculated by dividing the net assets of each class of shares by the number of outstanding shares in the class.
Public offering price (POP) is the price of a mutual fund share plus the maximum sales charge levied at the time of purchase. POP performance figures shown here assume the 5.75% maximum sales charge for class A shares and 3.50% for class M shares.
Contingent deferred sales charge (CDSC) is generally a charge applied at the time of the redemption of class B or C shares and assumes redemption at the end of the period. Your fund’s class B CDSC declines from a 5% maximum during the first year to 1% during the sixth year. After the sixth year, the CDSC no longer applies. The CDSC for class C shares is 1% for one year after purchase.
Share classes
Class A shares are generally subject to an initial sales charge and no CDSC (except on certain redemptions of shares bought without an initial sales charge).
Class B shares are not subject to an initial sales charge. They may be subject to a CDSC.
Class C shares are not subject to an initial sales charge and are subject to a CDSC only if the shares are redeemed during the first year.
Class M shares have a lower initial sales charge and a higher 12b-1 fee than class A shares and no CDSC (except on certain redemptions of shares bought without an initial sales charge).
Class R shares are not subject to an initial sales charge or CDSC and are available only to certain defined contribution plans.
Class Y shares are not subject to an initial sales charge or CDSC, and carry no 12b-1 fee. They are generally only available to corporate and institutional clients and clients in other approved programs.
Comparative indexes
Barclays Capital Aggregate Bond Index is an unmanaged index of U.S. investment-grade fixed-income securities.
Merrill Lynch U.S. 3-Month Treasury Bill Index is an unmanaged index that seeks to measure the performance of U.S. Treasury bills available in the marketplace.
Russell 1000 Value Index is an unmanaged index of those companies in the large-cap Russell 1000 Index chosen for their value orientation.
S&P 500 Index is an unmanaged index of common stock performance.
Indexes assume reinvestment of all distributions and do not account for fees. Securities and performance of a fund and an index will differ. You cannot invest directly in an index.
Lipper is a third-party industry-ranking entity that ranks mutual funds. Its rankings do not reflect sales charges. Lipper rankings are based on total return at net asset value relative to other funds that have similar current investment styles or objectives as determined by Lipper. Lipper may change a fund’s category assignment at its discretion. Lipper category averages reflect performance trends for funds within a category.
18
Trustee approval of management contract
General conclusions
The Board of Trustees of the Putnam funds oversees the management of each fund and, as required by law, determines annually whether to approve the continuance of your fund’s management contract with Putnam Investment Management (“Putnam Management”). In this regard, the Board of Trustees, with the assistance of its Contract Committee consisting solely of Trustees who are not “interested persons” (as such term is defined in the Investment Company Act of 1940, as amended) of the Putnam funds (the “Independent Trustees”), requests and evaluates all information it deems reasonably necessary under the circumstances. Over the course of several months ending in June 2008, the Contract Committee met several times to consider the information provided by Putnam Management and other information developed with the assistance of the Board’s independent counsel and independent staff. The Contract Committee reviewed and discussed key aspects of this information with all of the Independent Trustees. The Contract Committee recommended, and the Independent Trustees approved, the continuance of your fund’s management contract, effective July 1, 2008.
The Independent Trustees’ approval was based on the following conclusions:
• That the fee schedule in effect for your fund represented reasonable compensation in light of the nature and quality of the services being provided to the fund, the fees paid by competitive funds and the costs incurred by Putnam Management in providing such services, and
• That this fee schedule represented an appropriate sharing between fund shareholders and Putnam Management of such economies of scale as may exist in the management of the fund at current asset levels.
These conclusions were based on a comprehensive consideration of all information provided to the Trustees, were subject to the continued application ofcertain expense reductions and waivers and other considerations noted below, and were not the result of any single factor. Some of the factors that figured particularly in the Trustees’ deliberations and how the Trustees considered these factors are described below, although individual Trustees may have evaluated the information presented differently, giving different weights to various factors. It is also important to recognize that the fee arrangements for your fund and the other Putnam funds are the result of many years of review and discussion between the Independent Trustees and Putnam Management, that certain aspects of such arrangements may receive greater scrutiny in some years than others, and that the Trustees’ conclusions may be based, in part, on their consideration of these same arrangements in prior years.
Management fee schedules and
categories; total expenses
The Trustees reviewed the management fee schedules in effect for all Putnam funds, including fee levels and breakpoints, and the assignment of funds to particular fee categories. In reviewing fees and expenses, the Trustees generally focused their attention on material changes in circumstances — for example, changes in a fund’s size or investment style, changes in Putnam Management’s operating costs or responsibilities, or changes in competitive practices in the mutual fund industry — that suggest that consideration of fee changes might be warranted. The Trustees concluded
19
that the circumstances did not warrant changes to the management fee structure of your fund, which had been carefully developed over the years, re-examined on many occasions and adjusted where appropriate. In this regard, the Trustees also noted that shareholders of your fund voted in 2007 to approve new management contracts containing an identical fee structure. The Trustees focused on two areas of particular interest, as discussed further below:
• Competitiveness. The Trustees reviewed comparative fee and expense information for competitive funds, which indicated that, in a custom peer group of competitive funds selected by Lipper Inc., your fund ranked in the 14th percentile in management fees and in the 17th percentile in total expenses (less any applicable 12b-1 fees) as of December 31, 2007 (the first percentile being the least expensive funds and the 100th percentile being the most expensive funds). (Because the fund’s custom peer group is smaller than the fund’s broad Lipper Inc. peer group, this expense information may differ from the Lipper peer expense information found elsewhere in this report.) The Trustees noted that expense ratios for a number of Putnam funds, which show the percentage of fund assets used to pay for management and administrative services, distribution (12b-1) fees and other expenses, h ad been increasing recently as a result of declining net assets and the natural operation of fee breakpoints.
The Trustees noted that the expense ratio increases described above were currently being controlled by expense limitations initially implemented in January 2004. The Trustees have received a commitment from Putnam Management and its parent company to continue this program through at least June 30, 2009. These expense limitations give effect to a commitment by Putnam Management that the expense ratio of each open-end fund would be no higher than the average expense ratio of the competitive funds included in the fund’s relevant Lipper universe (exclusive of any applicable 12b-1 charges in each case). The Trustees observed that this commitment to limit fund expenses has served shareholders well since its inception.
In order to ensure that the expenses of the Putnam funds continue to meet evolving competitive standards, the Trustees requested, and Putnam Management agreed, to extend for the twelve months beginning July 1, 2008, an additional expense limitation for certain funds at an amount equal to the average expense ratio (exclusive of 12b-1 charges) of a custom peer group of competitive funds selected by Lipper to correspond to the size of the fund. This additional expense limitation will be applied to those open-end funds that had above-average expense ratios (exclusive of 12b-1 charges) based on the custom peer group data for the period ended December 31, 2007. This additional expense limitation will not be applied to your fund because it had a below-average expense ratio relative to its custom peer group.
In addition, the Trustees devoted particular attention to analyzing the Putnam funds’ fees and expenses relative to those of competitors in fund complexes of comparable size and with a comparable mix of asset categories. The Trustees concluded that this analysis did not reveal any matters requiring further attention at the current time.
• Economies of scale. Your fund currently has the benefit of breakpoints in its management fee that provide shareholders with significant economies of scale, which means that the effective management fee rate of the fund (as a percentage of fund assets) declines as the fund grows in size and crosses specified asset thresholds. Conversely, if the fund shrinks in size — as has been the case for many Putnam funds in recent years — these breakpoints result in increasing fee levels. In recent years, the Trustees have examined the operation of the existing breakpoint structure during periods
20
of both growth and decline in asset levels. The Trustees concluded that the fee schedule in effect for your fund represented an appropriate sharing of economies of scale at current asset levels.
In connection with their review of the management fees and total expenses of the Putnam funds, the Trustees also reviewed the costs of the services to be provided and profits to be realized by Putnam Management and its affiliates from the relationship with the funds. This information included trends in revenues, expenses and profitability of Putnam Management and its affiliates relating to the investment management and distribution services provided to the funds. In this regard, the Trustees also reviewed an analysis of Putnam Management’s revenues, expenses and profitability with respect to the funds’ management contracts, allocated on a fund-by-fund basis.
Investment performance
The quality of the investment process provided by Putnam Management represented a major factor in the Trustees’ evaluation of the quality of services provided by Putnam Management under your fund’s management contract. The Trustees were assisted in their review of the Putnam funds’ investment process and performance by the work of the Investment Oversight Coordinating Committee of the Trustees and the Investment Oversight Committees of the Trustees, which had met on a regular monthly basis with the funds’ portfolio teams throughout the year. The Trustees concluded that Putnam Management generally provides a high-quality investment process — as measured by the experience and skills of the individuals assigned to the management of fund portfolios, the resources made available to such personnel, and in general the ability of Putnam Management to attract and retain high-quality personnel — but also recognized that this does not guarantee fa vorable investment results for every fund in every time period. The Trustees considered the investment performance of each fund over multiple time periods and considered information comparing each fund’s performance with various benchmarks and with the performance of competitive funds.
While the Trustees noted the satisfactory investment performance of certain Putnam funds, they considered the disappointing investment performance of many funds in recent periods, particularly over periods in 2007 and 2008. They discussed with senior management of Putnam Management the factors contributing to such underperformance and actions being taken to improve performance. The Trustees recognized that, in recent years, Putnam Management has taken steps to strengthen its investment personnel and processes to address areas of underperformance, including recent efforts to further centralize Putnam Management’s equity research function. In this regard, the Trustees took into consideration efforts by Putnam Management to improve its ability to assess and mitigate investment risk in individual funds, across asset classes, and across the complex as a whole. The Trustees indicated their intention to continue to monitor performance trends to assess the effectivenes s of these efforts and to evaluate whether additional changes to address areas of underperformance are warranted.
In the case of your fund, the Trustees considered that your fund’s class A share cumulative total return performance at net asset value was in the following percentiles of its Lipper Inc. peer group (Lipper Large-Cap Value Funds) for the one-year, three-year and five-year periods ended December 31, 2007 (the first percentile being the best-performing funds and the 100th percentile being the worst-performing funds):
| | | |
| One-year period | 96th | | |
| | |
| Three-year period | 94th | | |
| | |
| Five-year period | 96th | | |
| | |
21
(Because of the passage of time, these performance results may differ from the performance results for more recent periods shown elsewhere in this report.) Over the one-year, three-year, and five-year periods ended December 31, 2007, there were 515, 443, and 363 funds, respectively, in your fund’s Lipper peer group.* Past performance is no guarantee of future returns.
The Trustees noted the disappointing performance for your fund for the one-year, three-year, and five-year periods ended December 31, 2007. In this regard, the Trustees considered that, similar to the experience of certain other Putnam funds with exposure to the large-cap equity space, your fund’s performance would have been materially better over these periods but for the performance of a limited number of portfolio choices in the financial sector that experienced extreme distress in the market turmoil that began in the summer of 2007. In addition, following leadership and portfolio management team changes, Putnam Management continues to make efforts to enhance the strength of the Large Cap Equities team, and Putnam Management has centralized the equity research structure. These changes were made to strengthen the investment process and enhance the performance potential for Putnam funds with exposure to the large-cap equity space.
As a general matter, the Trustees believe that cooperative efforts between the Trustees and Putnam Management represent the most effective way to address investment performance problems. The Trustees noted that investors in the Putnam funds have, in effect, placed their trust in the Putnam organization, under the oversight of the funds’ Trustees, to make appropriate decisions regarding the management of the funds. Based on the responsiveness of Putnam Management in the recent past to Trustee concerns about investment performance, the Trustees concluded that it is preferable to seek change within Putnam Management to address performance shortcomings. In the Trustees’ view, the alternative of engaging a new investment adviser for an underperforming fund would entail significant disruptions and would not provide any greater assurance of improved investment performance.
Brokerage and soft-dollar allocations;
other benefits
The Trustees considered various potential benefits that Putnam Management may receive in connection with the services it provides under the management contract with your fund. These include benefits related to brokerage and soft-dollar allocations, whereby a portion of the commissions paid by a fund for brokerage may be used to acquire research services that may be useful to Putnam Management in managing the assets of the fund and of other clients. The Trustees considered changes made in 2008, at Putnam Management’s request, to the Putnam funds’ brokerage allocation policy, which expanded the permitted categories of brokerage and research services payable with soft dollars and increased the permitted soft dollar allocation to third-party services over what had been authorized in previous years. The Trustees indicated their continued intent to monitor the potential benefits associated with the allocation of fund brokerage and trends in industry practice to ensure that the principle of seeking “best price and execution” remains paramount in the portfolio trading process.
* The percentile rankings for your fund’s class A share annualized total return performance in the Lipper Large-Cap Value Funds category for the one-year, five-year, and ten-year periods ended March 31, 2009, were 35%, 91%, and 92%, respectively. Over the one-year, five-year, and ten-year periods ended March 31, 2009, your fund ranked 206 out of 589, 377 out of 415, and 174 out of 190 funds, respectively. Note that this more recent information was not available when the Trustees approved the continuance of your fund’s management contract.
22
The Trustees’ annual review of your fund’s management contract arrangements also included the review of its distributor’s contract and distribution plan with Putnam Retail Management Limited Partnership and the investor servicing agreement with Putnam Fiduciary Trust Company (“PFTC”), each of which provides benefits to affiliates of Putnam Management. In the case of the investor servicing agreement, the Trustees considered that certain shareholder servicing functions were shifted to a third-party service provider by PFTC in 2007.
Comparison of retail and institutional
fee schedules
The information examined by the Trustees as part of their annual contract review has included for many years information regarding fees charged by Putnam Management and its affiliates to institutional clients such as defined benefit pension plans, college endowments, etc. This information included comparisons of such fees with fees charged to the funds, as well as a detailed assessment of the differences in the services provided to these two types of clients. The Trustees observed, in this regard, that the differences in fee rates between institutional clients and mutual funds are by no means uniform when examined by individual asset sectors, suggesting that differences in the pricing of investment management services to these types of clients reflect to a substantial degree historical competitive forces operating in separate market places. The Trustees considered the fact that fee rates across different asset classes are typicall y higher on average for mutual funds than for institutional clients, as well as the differences between the services that Putnam Management provides to the Putnam funds and those that it provides to institutional clients of the firm, but did not rely on such comparisons to any significant extent in concluding that the management fees paid by your fund are reasonable.
Other information for shareholders
Important notice regarding delivery
of shareholder documents
In accordance with SEC regulations, Putnam sends a single copy of annual and semiannual shareholder reports, prospectuses, and proxy statements to Putnam shareholders who share the same address, unless a shareholder requests otherwise. If you prefer to receive your own copy of these documents, please call Putnam at 1-800-225-1581, and Putnam will begin sending individual copies within 30 days.
Proxy voting
Putnam is committed to managing our mutual funds in the best interests of our shareholders. The Putnam funds’ proxy voting guidelines and procedures, as well as information regarding how your fund voted proxies relating to portfolio securities during the 12-month period ended June 30, 2008, are available in the Individual Investors section of putnam.com, and on the SEC’s Web site, www.sec.gov. If you have questions about finding forms on the SEC’s Web site, you may call the SEC at 1-800-SEC-0330. You may also obtain the Putnam funds’ proxy voting guidelines and procedures at no charge by calling Putnam’s Shareholder Services at 1-800-225-1581.
Fund portfolio holdings
The fund will file a complete schedule of its portfolio holdings with the SEC for the first and third quarters of each fiscal year on Form N-Q. Shareholders may obtain the fund’s Forms N-Q on the SEC’s Web site at www.sec.gov. In addition, the fund’s Forms N-Q may be reviewed and copied at the SEC’s Public Reference Room in Washington, D.C. You may call the SEC at 1-800-SEC-0330 for information about the SEC’s Web site or the operation of the Public Reference Room.
23
Financial statements
A guide to financial statements
These sections of the report, as well as the accompanying Notes, constitute the fund’s financial statements.
The fund’s portfolio lists all the fund’s investments and their values as of the last day of the reporting period. Holdings are organized by asset type and industry sector, country, or state to show areas of concentration and diversification.
Statement of assets and liabilities shows how the fund’s net assets and share price are determined. All investment and noninvestment assets are added together. Any unpaid expenses and other liabilities are subtracted from this total. The result is divided by the number of shares to determine the net asset value per share, which is calculated separately for each class of shares. (For funds with preferred shares, the amount subtracted from total assets includes the liquidation preference of preferred shares.)
Statement of operations shows the fund’s net investment gain or loss. This is done by first adding up all the fund’s earnings — from dividends and interest income — and subtracting its operating expenses to determine net investment income (or loss). Then, any net gain or loss the fund realized on the sales of its holdings — as well as any unrealized gains or losses over the period — is added to or subtracted from the net investment result to determine the fund’s net gain or loss for the fiscal period.
Statement of changes in net assets shows how the fund’s net assets were affected by the fund’s net investment gain or loss, by distributions to shareholders, and by changes in the number of the fund’s shares. It lists distributions and their sources (net investment income or realized capital gains) over the current reporting period and the most recent fiscal year-end. The distributions listed here may not match the sources listed in the Statement of operations because the distributions are determined on a tax basis and may be paid in a different period from the one in which they were earned. Dividend sources are estimated at the time of declaration. Actual results may vary. Any non-taxable return of capital cannot be determined until final tax calculations are completed after the end of the fund’s fiscal year.
Financial highlights provide an overview of the fund’s investment results, per-share distributions, expense ratios, net investment income ratios, and portfolio turnover in one summary table, reflecting the five most recent reporting periods. In a semiannual report, the highlight table also includes the current reporting period.
24
The fund’s portfolio 4/30/09 (Unaudited)
| | |
| COMMON STOCKS (97.5%)* | Shares | Value |
|
| Advertising and marketing services (0.2%) | | |
| Omnicom Group, Inc. | 237,700 | $7,480,419 |
|
| | | 7,480,419 |
| Aerospace and defense (2.6%) | | |
| Boeing Co. (The) | 409,800 | 16,412,490 |
|
| L-3 Communications Holdings, Inc. | 190,800 | 14,529,420 |
|
| Lockheed Martin Corp. | 352,600 | 27,689,678 |
|
| Northrop Grumman Corp. | 499,800 | 24,165,330 |
|
| Raytheon Co. | 201,700 | 9,122,891 |
|
| United Technologies Corp. | 563,500 | 27,521,340 |
|
| | | 119,441,149 |
| Automotive (0.3%) | | |
| Ford Motor Co. † | 2,119,510 | 12,674,670 |
|
| | | 12,674,670 |
| Banking (7.6%) | | |
| Bank of America Corp. | 8,925,614 | 79,705,733 |
|
| Bank of New York Mellon Corp. (The) | 1,545,500 | 39,379,340 |
|
| Citigroup, Inc. S | 1,931,631 | 5,891,475 |
|
| JPMorgan Chase & Co. | 3,842,282 | 126,795,306 |
|
| PNC Financial Services Group, Inc. | 469,800 | 18,651,060 |
|
| U.S. Bancorp | 1,052,300 | 19,172,906 |
|
| Wells Fargo & Co. | 2,762,884 | 55,285,309 |
|
| | | 344,881,129 |
| Beverage (0.2%) | | |
| Coca-Cola Co. (The) | 258,900 | 11,145,645 |
|
| | | 11,145,645 |
| Biotechnology (1.6%) | | |
| Amgen, Inc. † | 1,308,700 | 63,432,689 |
|
| Genzyme Corp. † | 203,900 | 10,873,987 |
|
| | | 74,306,676 |
| Broadcasting (0.5%) | | |
| Liberty Media Corp. Class A † | 841,000 | 20,478,350 |
|
| | | 20,478,350 |
| Building materials (0.2%) | | |
| Masco Corp. | 752,500 | 6,667,150 |
|
| | | 6,667,150 |
| Cable television (1.2%) | | |
| Comcast Corp. Class A | 777,500 | 12,020,150 |
|
| DISH Network Corp. Class A † | 1,729,600 | 22,917,200 |
|
| Time Warner Cable, Inc. | 553,580 | 17,841,883 |
|
| | | 52,779,233 |
| Chemicals (2.2%) | | |
| Celanese Corp. Ser. A | 1,016,600 | 21,185,944 |
|
| Dow Chemical Co. (The) | 1,132,000 | 18,112,000 |
|
| E.I. du Pont de Nemours & Co. | 2,130,000 | 59,427,000 |
|
| | | 98,724,944 |
| Commercial and consumer services (0.5%) | | |
| Alliance Data Systems Corp. † | 514,600 | 21,546,302 |
|
| | | 21,546,302 |
25
| | |
| COMMON STOCKS (97.5%)* cont. | Shares | Value |
|
| Communications equipment (1.1%) | | |
| Cisco Systems, Inc. † | 1,404,157 | $27,128,313 |
|
| Nokia OYJ ADR (Finland) | 696,200 | 9,844,268 |
|
| Qualcomm, Inc. | 257,400 | 10,893,168 |
|
| | | 47,865,749 |
| Computers (3.1%) | | |
| Apple, Inc. † | 246,100 | 30,966,763 |
|
| EMC Corp. † | 2,200,900 | 27,577,277 |
|
| Hewlett-Packard Co. | 1,110,300 | 39,948,594 |
|
| IBM Corp. | 397,300 | 41,005,333 |
|
| | | 139,497,967 |
| Conglomerates (3.5%) | | |
| 3M Co. | 233,845 | 13,469,472 |
|
| General Electric Co. | 8,461,520 | 107,038,228 |
|
| Honeywell International, Inc. | 903,400 | 28,195,114 |
|
| Tyco International, Ltd. | 487,342 | 11,579,246 |
|
| | | 160,282,060 |
| Construction (0.3%) | | |
| Chicago Bridge & Iron Co., NV (Netherlands) † | 539,800 | 5,775,860 |
|
| Eagle Materials, Inc. | 230,300 | 6,402,340 |
|
| | | 12,178,200 |
| Consumer finance (0.9%) | | |
| American Express Co. | 730,600 | 18,425,732 |
|
| Capital One Financial Corp. | 1,433,900 | 24,003,486 |
|
| | | 42,429,218 |
| Consumer goods (3.9%) | | |
| Avon Products, Inc. | 617,700 | 14,058,852 |
|
| Clorox Co. | 320,266 | 17,950,909 |
|
| Colgate-Palmolive Co. | 177,000 | 10,443,000 |
|
| Energizer Holdings, Inc. † | 188,100 | 10,778,130 |
|
| Estee Lauder Cos., Inc. (The) Class A | 231,411 | 6,919,189 |
|
| Kimberly-Clark Corp. | 251,500 | 12,358,710 |
|
| Newell Rubbermaid, Inc. | 2,076,100 | 21,695,245 |
|
| Procter & Gamble Co. (The) | 1,711,700 | 84,626,448 |
|
| | | 178,830,483 |
| Electric utilities (3.9%) | | |
| American Electric Power Co., Inc. | 434,448 | 11,460,738 |
|
| Edison International | 1,147,400 | 32,712,374 |
|
| Entergy Corp. | 364,115 | 23,583,729 |
|
| Exelon Corp. | 625,823 | 28,869,215 |
|
| FirstEnergy Corp. | 302,900 | 12,388,610 |
|
| Great Plains Energy, Inc. | 636,900 | 9,215,943 |
|
| NV Energy, Inc. | 1,321,900 | 13,549,475 |
|
| PG&E Corp. | 1,189,200 | 44,143,104 |
|
| | | 175,923,188 |
| Electrical equipment (0.6%) | | |
| Emerson Electric Co. | 802,200 | 27,306,888 |
|
| | | 27,306,888 |
| Electronics (0.7%) | | |
| Micron Technology, Inc. † | 1,949,800 | 9,515,024 |
|
| Texas Instruments, Inc. | 1,187,300 | 21,442,638 |
|
| | | 30,957,662 |
26
| | |
| COMMON STOCKS (97.5%)* cont. | Shares | Value |
|
| Energy (oil field) (1.9%) | | |
| Global Industries, Ltd. † | 1,750,800 | $11,327,676 |
|
| Halliburton Co. | 683,200 | 13,814,304 |
|
| Schlumberger, Ltd. | 114,900 | 5,628,951 |
|
| Smith International, Inc. | 569,300 | 14,716,405 |
|
| Transocean, Ltd. (Switzerland) † | 197,700 | 13,340,796 |
|
| Weatherford International, Ltd. † | 1,681,400 | 27,961,682 |
|
| | | 86,789,814 |
| Food (1.7%) | | |
| General Mills, Inc. | 464,500 | 23,545,505 |
|
| Kraft Foods, Inc. Class A | 2,238,062 | 52,370,651 |
|
| | | 75,916,156 |
| Forest products and packaging (0.1%) | | |
| International Paper Co. | 522,200 | 6,611,052 |
|
| | | 6,611,052 |
| Health-care services (1.8%) | | |
| AmerisourceBergen Corp. | 949,100 | 31,927,724 |
|
| Cardinal Health, Inc. | 647,632 | 21,883,485 |
|
| McKesson Corp. | 342,000 | 12,654,000 |
|
| WellPoint, Inc. † | 347,900 | 14,876,204 |
|
| | | 81,341,413 |
| Homebuilding (1.3%) | | |
| Centex Corp. | 1,022,100 | 11,181,774 |
|
| D.R. Horton, Inc. | 1,134,300 | 14,802,615 |
|
| M.D.C. Holdings, Inc. | 225,500 | 7,707,590 |
|
| Pulte Homes, Inc. | 611,800 | 7,041,818 |
|
| Toll Brothers, Inc. † | 829,000 | 16,795,540 |
|
| | | 57,529,337 |
| Insurance (6.2%) | | |
| ACE, Ltd. | 1,150,000 | 53,268,000 |
|
| Aflac, Inc. | 1,095,100 | 31,637,439 |
|
| Allstate Corp. (The) | 1,260,900 | 29,416,797 |
|
| Berkshire Hathaway, Inc. Class B † | 11,032 | 33,813,080 |
|
| Chubb Corp. (The) | 527,275 | 20,537,361 |
|
| Everest Re Group, Ltd. | 438,920 | 32,760,989 |
|
| Fidelity National Title Group, Inc. Class A | 313,200 | 5,678,316 |
|
| Loews Corp. | 746,500 | 18,580,385 |
|
| Marsh & McLennan Cos., Inc. | 403,500 | 8,509,815 |
|
| MetLife, Inc. | 655,000 | 19,486,250 |
|
| Travelers Cos., Inc. (The) | 686,300 | 28,234,382 |
|
| | | 281,922,814 |
| Investment banking/Brokerage (3.2%) | | |
| Goldman Sachs Group, Inc. (The) | 710,593 | 91,311,201 |
|
| Legg Mason, Inc. | 235,000 | 4,716,450 |
|
| Morgan Stanley | 1,418,500 | 33,533,340 |
|
| State Street Corp. | 509,500 | 17,389,235 |
|
| | | 146,950,226 |
| Lodging/Tourism (0.9%) | | |
| Marriott International, Inc. Class A | 507,600 | 11,959,056 |
|
| Wyndham Worldwide Corp. | 2,408,080 | 28,126,374 |
|
| | | 40,085,430 |
27
| | |
| COMMON STOCKS (97.5%)* cont. | Shares | Value |
|
| Machinery (1.1%) | | |
| Caterpillar, Inc. | 499,000 | $17,754,420 |
|
| Cummins, Inc. | 268,900 | 9,142,600 |
|
| Deere (John) & Co. | 339,000 | 13,987,140 |
|
| Parker-Hannifin Corp. | 169,400 | 7,682,290 |
|
| | | 48,566,450 |
| Manufacturing (0.1%) | | |
| Eaton Corp. | 151,700 | 6,644,460 |
|
| | | 6,644,460 |
| Media (2.4%) | | |
| Time Warner, Inc. | 1,347,700 | 29,420,291 |
|
| Viacom, Inc. Class B † | 1,594,500 | 30,678,180 |
|
| Walt Disney Co. (The) | 2,260,500 | 49,504,950 |
|
| | | 109,603,421 |
| Medical technology (3.4%) | | |
| Baxter International, Inc. | 315,800 | 15,316,300 |
|
| Boston Scientific Corp. † | 5,981,987 | 50,308,511 |
|
| Covidien, Ltd. (Bermuda) | 590,667 | 19,480,198 |
|
| Hospira, Inc. † | 1,364,400 | 44,847,828 |
|
| Medtronic, Inc. | 799,800 | 25,593,600 |
|
| | | 155,546,437 |
| Metals (1.2%) | | |
| Freeport-McMoRan Copper & Gold, Inc. Class B | 579,000 | 24,694,350 |
|
| Nucor Corp. | 408,000 | 16,601,520 |
|
| Steel Dynamics, Inc. | 633,600 | 7,888,320 |
|
| United States Steel Corp. | 216,466 | 5,747,172 |
|
| | | 54,931,362 |
| Oil and gas (14.8%) | | |
| BP PLC ADR (United Kingdom) | 760,600 | 32,295,076 |
|
| Chevron Corp. | 2,048,700 | 135,419,070 |
|
| ConocoPhillips | 803,100 | 32,927,100 |
|
| EOG Resources, Inc. | 256,700 | 16,295,316 |
|
| Exxon Mobil Corp. | 3,303,695 | 220,257,346 |
|
| Hess Corp. | 284,541 | 15,590,001 |
|
| Marathon Oil Corp. | 1,738,900 | 51,645,330 |
|
| Newfield Exploration Co. † | 316,400 | 9,865,352 |
|
| Nexen, Inc. (Canada) | 1,145,600 | 21,880,960 |
|
| Noble Energy, Inc. | 264,600 | 15,016,050 |
|
| Occidental Petroleum Corp. | 1,159,600 | 65,273,884 |
|
| Total SA ADR (France) | 866,800 | 43,097,296 |
|
| Ultra Petroleum Corp. † | 332,200 | 14,218,160 |
|
| | | 673,780,941 |
| Pharmaceuticals (7.3%) | | |
| Abbott Laboratories | 516,400 | 21,611,340 |
|
| Johnson & Johnson | 1,733,300 | 90,755,588 |
|
| Merck & Co., Inc. | 1,193,200 | 28,923,168 |
|
| Pfizer, Inc. | 8,657,200 | 115,660,192 |
|
| Schering-Plough Corp. | 710,300 | 16,351,106 |
|
| Wyeth | 1,344,300 | 56,998,320 |
|
| | | 330,299,714 |
28
| | |
| COMMON STOCKS (97.5%)*cont. | Shares | Value |
|
| Power producers (0.2%) | | |
| AES Corp. (The) † | 1,409,400 | $9,964,458 |
|
| | | 9,964,458 |
| Regional Bells (4.3%) | | |
| AT&T, Inc. | 4,092,800 | 104,857,536 |
|
| Qwest Communications International, Inc. | 674,472 | 2,623,696 |
|
| Verizon Communications, Inc. | 2,897,559 | 87,911,940 |
|
| | | 195,393,172 |
| Retail (5.9%) | | |
| CVS Caremark Corp. | 1,123,600 | 35,708,008 |
|
| Gap, Inc. (The) | 1,197,000 | 18,601,380 |
|
| Home Depot, Inc. (The) | 854,150 | 22,481,228 |
|
| Kroger Co. | 451,100 | 9,752,782 |
|
| Lowe’s Cos., Inc. | 1,103,200 | 23,718,800 |
|
| Macy’s, Inc. | 2,434,100 | 33,298,488 |
|
| Nordstrom, Inc. | 884,900 | 20,025,287 |
|
| Staples, Inc. | 1,446,500 | 29,826,830 |
|
| TJX Cos., Inc. (The) | 1,285,800 | 35,963,826 |
|
| Wal-Mart Stores, Inc. | 774,900 | 39,054,960 |
|
| | | 268,431,589 |
| Semiconductor (0.4%) | | |
| Atmel Corp. † | 3,573,500 | 13,722,240 |
|
| Formfactor, Inc. † | 295,471 | 5,150,060 |
|
| | | 18,872,300 |
| Software (2.0%) | | |
| Electronic Arts, Inc. † | 757,000 | 15,404,950 |
|
| Microsoft Corp. | 2,198,400 | 44,539,584 |
|
| Parametric Technology Corp. † | 1,633,536 | 18,213,926 |
|
| Symantec Corp. † | 694,200 | 11,974,949 |
|
| | | 90,133,409 |
| Technology services (0.3%) | | |
| Accenture, Ltd. Class A | 400,300 | 11,780,829 |
|
| | | 11,780,829 |
| Telecommunications (0.6%) | | |
| America Movil SAB de CV ADR Ser. L (Mexico) | 312,200 | 10,255,770 |
|
| Sprint Nextel Corp. † | 3,528,755 | 15,385,372 |
|
| | | 25,641,142 |
| Tobacco (0.8%) | | |
| Altria Group, Inc. | 925,200 | 15,108,516 |
|
| Lorillard, Inc. | 360,800 | 22,777,304 |
|
| | | 37,885,820 |
| Transportation services (0.2%) | | |
| United Parcel Service, Inc. Class B | 195,100 | 10,211,534 |
|
| | | 10,211,534 |
| Waste Management (0.3%) | | |
| Waste Management, Inc. | 490,100 | 13,070,967 |
|
| | | 13,070,967 |
| Total common stocks (cost $5,030,967,808) | | $4,423,301,329 |
|
| |
| CONVERTIBLE PREFERRED STOCKS (0.4%)* | Shares | Value |
| Citigroup, Inc. Ser. T, 3.25% cv. pfd. | 374,142 | $11,808,857 |
|
| Freeport-McMoRan Copper & Gold, Inc. $6.75 cv. pfd. | 103,543 | 6,963,267 |
|
| Total convertible preferred stocks (cost $17,373,758) | | $18,772,124 |
29
| | |
| PREFERRED STOCKS (0.3%)* | Shares | Value |
|
| Citigroup, Inc. Ser. AA, 2.031% pfd. | 861,924 | $15,325,009 |
|
| Total preferred stocks (cost $12,191,656) | | $15,325,009 |
| |
| SHORT-TERM INVESTMENTS (1.9%)* | Principal amount/shares | Value |
|
| Short-term investments held as collateral for loaned | | |
| securities with a yield of 0.17%, due May 1, 2009 d | $6,760,032 | $6,760,000 |
|
| Putnam Money Market Liquidity Fund e | 79,753,998 | 79,753,998 |
|
| Total short-term investments (cost $86,513,998) | | $86,513,998 |
| |
| TOTAL INVESTMENTS | | |
|
| Total investments (cost $5,147,047,220) | | $4,543,912,460 |
* Percentages indicated are based on net assets of $4,538,179,534.
† Non-income-producing security.
d See Note 1 to the financial statements.
e See Note 5 to the financial statements regarding investments in Putnam Money Market Liquidity Fund.
S Securities on loan, in part or in entirety, at April 30, 2009.
ADR after the name of a foreign holding stands for American Depository Receipts representing ownership of foreign securities on deposit with a custodian bank.
In September 2006, the FASB issued Statement of Financial Accounting Standards No. 157, Fair Value Measurements (” SFAS 157” ). SFAS 157 is effective for financial statements issued for fiscal years beginning after November 15, 2007 and interim periods within those fiscal years. While the adoption of SFAS 157 does not have a material effect on the fund’s net asset value, it does require additional disclosures about fair value measurements. SFAS 157 establishes a three-level hierarchy for disclosure of fair value measurements. The valuation hierarchy is based upon the transparency of inputs to the valuation of the fund’s investments. The three levels are defined as follows:
Level 1 — Valuations based on quoted prices for identical securities in active markets.
Level 2 — Valuations based on quoted prices in markets that are not active or for which all significant inputs are observable, either directly or indirectly.
Level 3 — Valuations based on inputs that are unobservable and significant to the fair value measurement.
The following is a summary of the inputs used to value the fund’s net assets as of April 30, 2009:
| | |
| Valuation inputs | Investments in securities | Other financial instruments |
|
| Level 1 | $4,518,380,336 | $— |
|
| Level 2 | 25,532,124 | — |
|
| Level 3 | — | — |
|
| Total | $4,543,912,460 | $— |
Other financial instruments include futures, written options, TBA sale commitments, swaps and forward contracts which are valued at the unrealized appreciation/(depreciation) on the instrument.
The accompanying notes are an integral part of these financial statements.
30
Statement of assets and liabilities 4/30/09 (Unaudited)
| |
| ASSETS | |
|
| Investment in securities, at value, including $5,272,800 of | |
| securities on loan (Note 1): | |
| Unaffiliated issuers (identified cost $5,067,293,222) | $4,464,158,462 |
| Affiliated issuers (identified cost $79,753,998) (Note 5) | 79,753,998 |
|
| Dividends, interest and other receivables | 7,600,319 |
|
| Receivable for shares of the fund sold | 313,057 |
|
| Receivable for investments sold | 43,637,315 |
|
| Total assets | 4,595,463,151 |
|
| |
| LIABILITIES | |
|
| Payable for investments purchased | 27,657,472 |
|
| Payable for shares of the fund repurchased | 13,708,234 |
|
| Payable for compensation of Manager (Note 2) | 4,588,099 |
|
| Payable for investor servicing fees (Note 2) | 1,420,508 |
|
| Payable for custodian fees (Note 2) | 20,601 |
|
| Payable for Trustee compensation and expenses (Note 2) | 1,336,909 |
|
| Payable for administrative services (Note 2) | 9,875 |
|
| Payable for distribution fees (Note 2) | 1,049,857 |
|
| Collateral on securities loaned, at value (Note 1) | 6,760,000 |
|
| Other accrued expenses | 732,062 |
|
| Total liabilities | 57,283,617 |
| |
| Net assets | $4,538,179,534 |
|
| |
| REPRESENTED BY | |
|
| Paid-in capital (Unlimited shares authorized) (Notes 1, 4 and 8) | $8,368,681,829 |
|
| Undistributed net investment income (Notes 1 and 8) | 2,890,699 |
|
| Accumulated net realized loss on investments (Notes 1 and 8) | (3,230,258,234) |
|
| Net unrealized depreciation of investments (Note 8) | (603,134,760) |
|
| Total — Representing net assets applicable to capital shares outstanding | $4,538,179,534 |
|
| |
| COMPUTATION OF NET ASSET VALUE AND OFFERING PRICE | |
|
| Net asset value and redemption price per class A share | |
| ($4,051,384,346 divided by 441,030,306 shares) | $9.19 |
|
| Offering price per class A share (100/94.25 of $9.19)* | $9.75 |
|
| Net asset value and offering price per class B share ($230,995,591 divided by 25,597,924 shares)** | $9.02 |
|
| Net asset value and offering price per class C share ($33,288,105 divided by 3,636,816 shares)** | $9.15 |
|
| Net asset value and redemption price per class M share ($35,982,715 divided by 3,948,272 shares) | $9.11 |
|
| Offering price per class M share (100/96.50 of $9.11)* | $9.44 |
|
| Net asset value, offering price and redemption price per class R share | |
| ($2,906,276 divided by 317,952 shares) | $9.14 |
|
| Net asset value, offering price and redemption price per class Y share | |
| ($183,622,501 divided by 19,947,775 shares) | $9.21 |
|
* On single retail sales of less than $50,000. On sales of $50,000 or more the offering price is reduced.
** Redemption price per share is equal to net asset value less any applicable contingent deferred sales charge.
The accompanying notes are an integral part of these financial statements.
31
Statement of operations Six months ended 4/30/09 (Unaudited)
| |
| INVESTMENT INCOME | |
|
| Dividends (net of foreign tax of $213,629) | $74,321,480 |
|
| Interest (including interest income of $11,772 | |
| from investments in affiliated issuers) (Note 5) | 1,501,280 |
|
| Securities lending | 22,397 |
|
| Total investment income | 75,845,157 |
|
| |
| EXPENSES | |
|
| Compensation of Manager (Note 2) | 11,100,761 |
|
| Investor servicing fees (Note 2) | 9,618,767 |
|
| Custodian fees (Note 2) | 18,127 |
|
| Trustee compensation and expenses (Note 2) | 118,895 |
|
| Administrative services (Note 2) | 90,034 |
|
| Distribution fees — Class A (Note 2) | 4,940,132 |
|
| Distribution fees — Class B (Note 2) | 1,247,769 |
|
| Distribution fees — Class C (Note 2) | 158,000 |
|
| Distribution fees — Class M (Note 2) | 127,554 |
|
| Distribution fees — Class R (Note 2) | 6,526 |
|
| Other | 977,902 |
|
| Fees waived and reimbursed by Manager (Note 2) | (452,879) |
|
| Total expenses | 27,951,588 |
| | |
| Expense reduction (Note 2) | (285,114) |
|
| Net expenses | 27,666,474 |
| |
| Net investment income | 48,178,683 |
|
| |
| Net realized loss on investments (Notes 1 and 3) | (1,226,226,020) |
|
| Net unrealized appreciation of investments during the period | 689,514,131 |
|
| Net loss on investments | (536,711,889) |
| |
| Net decrease in net assets resulting from operations | $(488,533,206) |
|
The accompanying notes are an integral part of these financial statements.
32
Statement of changes in net assets
| | |
| DECREASE IN NET ASSETS | Six months ended 4/30/09* | Year ended 10/31/08 |
|
| Operations: | | |
| Net investment income | $48,178,683 | $155,487,974 |
|
| Net realized loss on investments | (1,226,226,020) | (1,704,560,436) |
|
| Net unrealized appreciation (depreciation) of investments | 689,514,131 | (3,012,557,496) |
|
| Net decrease in net assets resulting from operations | (488,533,206) | (4,561,629,958) |
|
| Distributions to shareholders (Note 1): | | |
| From ordinary income | | |
| Net investment income | | |
|
| Class A | (65,096,652) | (163,102,562) |
|
| Class B | (3,178,525) | (8,211,042) |
|
| Class C | (377,111) | (771,324) |
|
| Class M | (435,634) | (998,074) |
|
| Class R | (39,067) | (71,627) |
|
| Class Y | (4,338,402) | (22,257,960) |
|
| Net realized short-term gain on investments | | |
|
| Class A | — | (561,897,077) |
|
| Class B | — | (50,588,180) |
|
| Class C | — | (4,369,176) |
|
| Class M | — | (4,741,611) |
|
| Class R | — | (234,133) |
|
| Class Y | — | (61,554,945) |
|
| From net realized long-term gain on investments | | |
| Class A | — | (933,139,763) |
|
| Class B | — | (84,018,033) |
|
| Class C | — | (7,256,232) |
|
| Class M | — | (7,874,171) |
|
| Class R | — | (388,797) |
|
| Class Y | — | (102,217,128) |
|
| Redemption fees (Note 1) | 6,191 | 8,377 |
|
| Decrease from capital share transactions (Notes 4 and 8) | (704,220,929) | (942,803,282) |
|
| Total decrease in net assets | (1,266,213,335) | (7,518,116,698) |
|
| |
| NET ASSETS | | |
|
| Beginning of period | 5,804,392,869 | 13,322,509,567 |
|
| End of period (including undistributed net investment | | |
| income of $2,890,699 and $28,352,814, respectively) | $4,538,179,534 | $5,804,392,869 |
|
* Unaudited
The accompanying notes are an integral part of these financial statements.
33
Financial highlights (For a common share outstanding throughout the period)
| | | | | | | | | | | | | | |
| INVESTMENT OPERATIONS: | | LESS DISTRIBUTIONS: | | RATIOS AND SUPPLEMENTAL DATA: |
|
| | | | | | | | | | | | | Ratio | Ratio of net | |
| | | | Net realized | | | | | | | | | of expenses | investment | |
| | Net asset value, | | and unrealized | Total from | From net | From net | | | Net asset | Total return | Net assets, | to average | income (loss) | |
| | beginning | Net investment | gain (loss) on | investment | investment | realized gain on | Total | Redemption | value, end of | at net asset | end of period | net assets | to average net | Portfolio |
| Period ended | of period | income (loss) a,d | investments | operations | income | investments | distributions | fees e | period | value (%) b | (in thousands) | (%) c,d | assets (%) d | turnover (%) |
|
| Class A | | | | | | | | | | | | | | |
| April 30, 2009 ** | $10.09 | .09 | (.85) h, i | (.76) | (.14) | — | (.14) | — | $9.19 | (7.39) *h,i | $4,051,384 | .59 * | 1.06 * | 30.85 * |
| October 31, 2008 | 20.26 | .24 | (7.27) | (7.03) | (.31) | (2.83) | (3.14) | — | 10.09 | (40.22) | 4,754,294 | 1.00 | 1.71 | 34.50 |
| October 31, 2007 | 21.72 | .23 | 1.09 | 1.32 | (.20) | (2.58) | (2.78) | — | 20.26 | 6.47 | 10,937,114 | .92 | 1.14 | 57.06 |
| October 31, 2006 | 19.42 | .25 g | 2.69 | 2.94 | (.24) | (.40) | (.64) | — | 21.72 | 15.46 g | 11,854,129 | .87 g | 1.25 g | 76.75 |
| October 31, 2005 | 18.07 | .24 f | 1.38 | 1.62 | (.24) | (.03) | (.27) | — | 19.42 | 8.96 f | 11,616,127 | .89 | 1.26 f | 52.80 |
| October 31, 2004 | 16.57 | .22 | 1.53 | 1.75 | (.25) | — | (.25) | — | 18.07 | 10.63 | 12,154,652 | .92 | 1.25 | 29.44 |
|
| Class B | | | | | | | | | | | | | | |
| April 30, 2009 ** | $9.91 | .06 | (.84) h,i | (.78) | (.11) | — | (.11) | — | $9.02 | (7.84) *h,i | $230,996 | .97 * | .71 * | 30.85 * |
| October 31, 2008 | 19.94 | .13 | (7.14) | (7.01) | (.19) | (2.83) | (3.02) | — | 9.91 | (40.68) | 319,813 | 1.75 | .96 | 34.50 |
| October 31, 2007 | 21.40 | .08 | 1.07 | 1.15 | (.03) | (2.58) | (2.61) | — | 19.94 | 5.68 | 1,020,630 | 1.67 | .40 | 57.06 |
| October 31, 2006 | 19.13 | .11 g | 2.63 | 2.74 | (.07) | (.40) | (.47) | — | 21.40 | 14.61 g | 1,624,208 | 1.62 g | .56 g | 76.75 |
| October 31, 2005 | 17.80 | .10 f | 1.35 | 1.45 | (.09) | (.03) | (.12) | — | 19.13 | 8.15 f | 2,427,671 | 1.64 | .55 f | 52.80 |
| October 31, 2004 | 16.33 | .09 | 1.50 | 1.59 | (.12) | — | (.12) | — | 17.80 | 9.77 | 3,364,807 | 1.67 | .50 | 29.44 |
|
| Class C | | | | | | | | | | | | | | |
| April 30, 2009 ** | $10.05 | .06 | (.85) h,i | (.79) | (.11) | — | (.11) | — | $9.15 | (7.82) *h,i | $33,288 | .97 * | .68 * | 30.85 * |
| October 31, 2008 | 20.17 | .13 | (7.23) | (7.10) | (.19) | (2.83) | (3.02) | — | 10.05 | (40.64) | 36,166 | 1.75 | .96 | 34.50 |
| October 31, 2007 | 21.63 | .08 | 1.08 | 1.16 | (.04) | (2.58) | (2.62) | — | 20.17 | 5.66 | 85,618 | 1.67 | .39 | 57.06 |
| October 31, 2006 | 19.34 | .10 g | 2.67 | 2.77 | (.08) | (.40) | (.48) | — | 21.63 | 14.60 g | 94,553 | 1.62 g | .51 g | 76.75 |
| October 31, 2005 | 17.99 | .10 f | 1.37 | 1.47 | (.09) | (.03) | (.12) | — | 19.34 | 8.18 f | 97,924 | 1.64 | .52 f | 52.80 |
| October 31, 2004 | 16.50 | .09 | 1.52 | 1.61 | (.12) | — | (.12) | — | 17.99 | 9.76 | 109,312 | 1.67 | .50 | 29.44 |
|
| Class M | | | | | | | | | | | | | | |
| April 30, 2009 ** | $10.01 | .07 | (.85) h,i | (.78) | (.12) | — | (.12) | — | $9.11 | (7.72) *h,i | $35,983 | .84 * | .79 * | 30.85 * |
| October 31, 2008 | 20.11 | .17 | (7.21) | (7.04) | (.23) | (2.83) | (3.06) | — | 10.01 | (40.50) | 36,633 | 1.50 | 1.21 | 34.50 |
| October 31, 2007 | 21.57 | .13 | 1.08 | 1.21 | (.09) | (2.58) | (2.67) | — | 20.11 | 5.95 | 92,307 | 1.42 | .64 | 57.06 |
| October 31, 2006 | 19.29 | .16 g | 2.65 | 2.81 | (.13) | (.40) | (.53) | — | 21.57 | 14.86 g | 108,911 | 1.37 g | .77 g | 76.75 |
| October 31, 2005 | 17.95 | .15 f | 1.36 | 1.51 | (.14) | (.03) | (.17) | — | 19.29 | 8.41 f | 123,425 | 1.39 | .78 f | 52.80 |
| October 31, 2004 | 16.46 | .13 | 1.52 | 1.65 | (.16) | — | (.16) | — | 17.95 | 10.06 | 145,209 | 1.42 | .75 | 29.44 |
|
| Class R | | | | | | | | | | | | | | |
| April 30, 2009 ** | $10.04 | .08 | (.85) h,i | (.77) | (.13) | — | (.13) | — | $9.14 | (7.55) *h,i | $2,906 | .72 * | .92 * | 30.85 * |
| October 31, 2008 | 20.19 | .20 | (7.24) | (7.04) | (.28) | (2.83) | (3.11) | — | 10.04 | (40.38) | 2,905 | 1.25 | 1.44 | 34.50 |
| October 31, 2007 | 21.65 | .18 | 1.09 | 1.27 | (.15) | (2.58) | (2.73) | — | 20.19 | 6.23 | 1,717 | 1.17 | .87 | 57.06 |
| October 31, 2006 | 19.36 | .19 g | 2.69 | 2.88 | (.19) | (.40) | (.59) | — | 21.65 | 15.20 g | 1,278 | 1.12 g | .93 g | 76.75 |
| October 31, 2005 | 18.03 | .17 f | 1.40 | 1.57 | (.21) | (.03) | (.24) | — | 19.36 | 8.70 f | 729 | 1.14 | .90 f | 52.80 |
| October 31, 2004 | 16.58 | .18 | 1.50 | 1.68 | (.23) | — | (.23) | — | 18.03 | 10.20 | 191 | 1.17 | 1.00 | 29.44 |
|
| Class Y | | | | | | | | | | | | | | |
| April 30, 2009 ** | $10.12 | .11 | (.86) h,i | (.75) | (.16) | — | (.16) | — | $9.21 | (7.34) *h,i | $183,623 | .47 * | 1.37 * | 30.85 * |
| October 31, 2008 | 20.31 | .27 | (7.28) | (7.01) | (.35) | (2.83) | (3.18) | — | 10.12 | (40.06) | 654,582 | .75 | 1.96 | 34.50 |
| October 31, 2007 | 21.76 | .29 | 1.09 | 1.38 | (.25) | (2.58) | (2.83) | — | 20.31 | 6.78 | 1,185,123 | .67 | 1.39 | 57.06 |
| October 31, 2006 | 19.46 | .31 g | 2.68 | 2.99 | (.29) | (.40) | (.69) | — | 21.76 | 15.72 g | 1,318,906 | .62 g | 1.51 g | 76.75 |
| October 31, 2005 | 18.10 | .30 f | 1.38 | 1.68 | (.29) | (.03) | (.32) | — | 19.46 | 9.28 f | 1,323,254 | .64 | 1.54 f | 52.80 |
| October 31, 2004 | 16.61 | .26 | 1.53 | 1.79 | (.30) | — | (.30) | — | 18.10 | 10.81 | 1,744,446 | .67 | 1.49 | 29.44 |
|
See notes to financial highlights at the end of this section.
The accompanying notes are an integral part of these financial statements.
Financial highlights (Continued)
* Not annualized.
** Unaudited.
a Per share net investment income (loss) has been determined on the basis of the weighted average number of shares outstanding during the period.
b Total return assumes dividend reinvestment and does not reflect the effect of sales charges.
c Includes amounts paid through expense offset and brokerage/service arrangements (Note 2).
d Reflects an involuntary contractual expense limitation in effect during the period. For periods prior to April 30, 2009 certain fund expenses were waived in connection with investments in Putnam Prime Money Market Fund in effect during the period. As a result of such limitation and/or waivers, the expenses of each class reflect a reduction of the following amounts (Note 2):
| |
| | Percentage of |
| | average net assets |
|
| April 30, 2009 | 0.01% |
|
| October 31, 2008 | <0.01 |
|
| October 31, 2007 | <0.01 |
|
| October 31, 2006 | <0.01 |
|
| October 31, 2005 | <0.01 |
|
| October 31, 2004 | <0.01 |
|
e Amount represents less than $0.01 per share.
f Reflects a non-recurring accrual related to Putnam Management’s settlement with the SEC regarding brokerage allocation practices, which amounted to $0.01 per class share and 0.03% of average net assets.
g Reflects a non-recurring reimbursement from Putnam Investments relating to the calculation of certain amounts paid by the fund to Putnam in previous years for transfer agent services, which amounted to $0.01 per share and 0.03% of average net assets for the period ended October 31, 2006.
h Reflects a non-recurring litigation payment received by the fund from Enron Corporation which amounted to $0.05 per class share outstanding on December 29, 2008.
Without this payment, total return, for each class, for the six months ended April 30, 2009, would have been as follows:
| |
| | Total return |
| | at net asset value(%) |
|
| Class A | (8.00)% |
|
| Class B | (8.46) |
|
| Class C | (8.33) |
|
| Class M | (8.23) |
|
| Class R | (8.06) |
|
| Class Y | (8.04) |
|
The accompanying notes are an integral part of these financial statements.
36
Financial highlights (Continued)
i Reflects a non-recurring litigation payment received by the fund from Tyco International, Ltd. which amounted to $0.07 per class share outstanding on March 13, 2009.
Without this payment, total return, for each class, for the six months ended April 30, 2009, would have been as follows:
| |
| | Total return |
| | at net asset value (%) |
|
| Class A | (8.10)% |
|
| Class B | (8.56) |
|
| Class C | (8.53) |
|
| Class M | (8.43) |
|
| Class R | (8.26) |
|
| Class Y | (8.15) |
|
The accompanying notes are an integral part of these financial statements.
37
Notes to financial statements 4/30/09 (Unaudited)
Note 1: Significant accounting policies
The Putnam Fund for Growth and Income (the “fund”), a Massachusetts business trust, is registered under the Investment Company Act of 1940, as amended, as a diversified, open-end management investment company. The fund seeks capital growth and current income by investing primarily in a portfolio of common stocks that offer the potential for capital growth, current income or both.
The fund offers class A, class B, class C, class M, class R and class Y shares. Class A and class M shares are sold with a maximum front-end sales charge of 5.75% and 3.50%, respectively, and generally do not pay a contingent deferred sales charge. Class B shares, which convert to class A shares after approximately eight years, do not pay a front-end sales charge and are subject to a contingent deferred sales charge, if those shares are redeemed within six years of purchase. Class C shares have a one-year 1.00% contingent deferred sales charge and do not convert to class A shares. Class R shares, which are offered to qualified employee-benefit plans, are sold at net asset value. The expenses for class A, class B, class C, class M and class R shares may differ based on the distribution fee of each class, which is identified in Note 2. Class Y shares, which are sold at net asset value, are generally subject to the same expenses as class A, class B, class C, class M an d class R shares, but do not bear a distribution fee. Class Y shares are generally only available to corporate and institutional clients and clients in other approved programs.
A 1.00% redemption fee may apply on any shares that are redeemed (either by selling or exchanging into another fund) within 7 days of purchase. The redemption fee is accounted for as an addition to paid-in-capital.
Investment income, realized and unrealized gains and losses and expenses of the fund are borne pro-rata based on the relative net assets of each class to the total net assets of the fund, except that each class bears expenses unique to that class (including the distribution fees applicable to such classes). Each class votes as a class only with respect to its own distribution plan or other matters on which a class vote is required by law or determined by the Trustees. If the fund were liquidated, shares of each class would receive their pro-rata share of the net assets of the fund. In addition, the Trustees declare separate dividends on each class of shares.
In the normal course of business, the fund enters into contracts that may include agreements to indemnify another party under given circumstances. The fund’s maximum exposure under these arrangements is unknown as this would involve future claims that may be, but have not yet been, made against the fund. However, the fund’s management team expects the risk of material loss to be remote.
The following is a summary of significant accounting policies consistently followed by the fund in the preparation of its financial statements. The preparation of financial statements is in conformity with accounting principles generally accepted in the United States of America and requires management to make estimates and assumptions that affect the reported amounts of assets and liabilities in the financial statements and the reported amounts of increases and decreases in net assets from operations during the reporting period. Actual results could differ from those estimates.
A) Security valuation Investments for which market quotations are readily available are valued at the last reported sales price on their principal exchange, or official closing price for certain markets. If no sales are reported — as in the case of some securities traded over-the-counter — a security is valued at its last reported bid price. Many securities markets and exchanges outside the U.S. close prior to the close of the New York Stock Exchange and therefore the closing prices for securities in such markets or on such exchanges may not fully reflect events that occur after such close but before the close of the New York Stock Exchange. Accordingly, on certain days, the fund will fair value foreign equity securities taking into account multiple factors, including movements in the U.S. securities markets. The number of days on which fair value prices will be used will depend on market activity and it is possib le that fair value prices will be used by the fund to a significant extent. Securities quoted in foreign currencies, if any, are translated into U.S. dollars at the current exchange rate. To the extent a pricing service or dealer is unable to value a security or provides a valuation which Putnam Investment Management, LLC (“Putnam Management”), the fund’s manager, a wholly-owned subsidiary of Putnam Investments, LLC, does not believe accurately reflects the security’s fair value, the security will be valued at fair value by Putnam Management. Certain investments, including certain restricted and illiquid securities and derivatives, are also valued at fair value following procedures approved by the Trustees. Such valuations and procedures are reviewed periodically by the Trustees. The fair value of securities is generally determined as the amount that the fund could reasonably expect to realize from an orderly disposition of such securities over a reasonable period of time. By its nature, a fair value price is a good
38
faith estimate of the value of a security at a given point in time and does not reflect an actual market price, which may be different by a material amount.
B) Joint trading account Pursuant to an exemptive order from the Securities and Exchange Commission (the “SEC”), the fund may transfer uninvested cash balances, including cash collateral received under security lending arrangements, into a joint trading account along with the cash of other registered investment companies and certain other accounts managed by Putnam Management. These balances may be invested in issues of short-term investments having maturities of up to 397 days for collateral received under security lending arrangements and up to 90 days for other cash investments.
C) Repurchase agreements The fund, or any joint trading account, through its custodian, receives delivery of the underlying securities, the market value of which at the time of purchase is required to be in an amount at least equal to the resale price, including accrued interest. Collateral for certain tri-party repurchase agreements is held at the counterparty’s custodian in a segregated account for the benefit of the fund and the counterparty. Putnam Management is responsible for determining that the value of these underlying securities is at all times at least equal to the resale price, including accrued interest.
D) Security transactions and related investment income Security transactions are recorded on the trade date (the date the order to buy or sell is executed). Gains or losses on securities sold are determined on the identified cost basis.
Interest income is recorded on the accrual basis. Dividend income, net of applicable withholding taxes, is recognized on the ex-dividend date except that certain dividends from foreign securities, if any, are recognized as soon as the fund is informed of the ex-dividend date. Non-cash dividends, if any, are recorded at the fair market value of the securities received. Dividends representing a return of capital or capital gains, if any, are reflected as a reduction of cost and/or as a realized gain.
E) Securities lending The fund may lend securities, through its agents, to qualified borrowers in order to earn additional income. The loans are collateralized by cash and/or securities in an amount at least equal to the market value of the securities loaned. The market value of securities loaned is determined daily and any additional required collateral is allocated to the fund on the next business day. The risk of borrower default will be borne by the fund’s agents; the fund will bear the risk of loss with respect to the investment of the cash collateral. Income from securities lending is included in investment income on the Statement of operations. At April 30, 2009, the value of securities loaned amounted to $5,272,800. The fund received cash collateral of $6,760,000 which is pooled with collateral of other Putnam funds into 1 issue of short-term investment.
F) Federal taxes It is the policy of the fund to distribute all of its taxable income within the prescribed time and otherwise comply with the provisions of the Internal Revenue Code of 1986, as amended (the “Code”), applicable to regulated investment companies. It is also the intention of the fund to distribute an amount sufficient to avoid imposition of any excise tax under Section 4982 of the Code. The fund is subject to the provisions of FASB Interpretation No. 48, Accounting for Uncertainties in Income Taxes (“FIN 48”). FIN 48 sets forth a minimum threshold for financial statement recognition of the benefit of a tax position taken or expected to be taken in a tax return. The fund did not have any unrecognized tax benefits in the accompanying financial statements. No provision has been made for federal taxes on income, cap ital gains or unrealized appreciation on securities held nor for excise tax on income and capital gains. Each of the fund’s federal tax returns for the prior three fiscal years remains subject to examination by the Internal Revenue Service and state departments of revenue.
At October 31, 2008, the fund had a capital loss carryover of $1,671,083,826 available to the extent allowed by the Code to offset future net capital gain, if any. As a result of the December 26, 2008 merger, the fund acquired $155,391,209 in capital loss carryover from Putnam Classic Equity Fund. The amounts of the combined carryovers and the expiration dates are:
| | | |
| Loss Carryover | | Expiration | |
| |
| $143,317,196 | | October 31, 2015 | |
| |
| 1,683,157,839 | | October 31, 2016 | |
| |
Pursuant to federal income tax regulations applicable to regulated investment companies, the fund has elected to defer to its fiscal year ending October 31, 2009 $4,701,893 of losses acquired from the merger of Putnam Classic Equity Fund into the fund, which were recognized during the period November 1, 2008 to November 30, 2008.
The aggregate identified cost on a tax basis is $5,324,604,401, resulting in gross unrealized appreciation and depreciation of $370,612,199 and $1,151,304,140, respectively, or net unrealized depreciation of $780,691,941.
G) Distributions to shareholders Distributions to shareholders from net investment income are recorded by the fund on the ex-dividend date. Distributions from capital gains, if any, are recorded on the ex-dividend date and paid at least annually. The amount and
39
character of income and gains to be distributed are determined in accordance with income tax regulations, which may differ from generally accepted accounting principles. Dividend sources are estimated at the time of declaration. Actual results may vary. Any non-taxable return of capital cannot be determined until final tax calculations are completed after the end of the fund’s fiscal year. Reclassifications are made to the fund’s capital accounts to reflect income and gains available for distribution (or available capital loss carryovers) under income tax regulations.
Note 2: Management fee, administrative
services and other transactions
The fund pays Putnam Management for management and investment advisory services quarterly based on the average net assets of the fund. Such fee is based on the following annual rates: 0.65% of the first $500 million of average net assets, 0.55% of the next $500 million, 0.50% of the next $500 million, 0.45% of the next $5 billion, 0.425% of the next $5 billion, 0.405% of the next $5 billion, 0.39% of the next $5 billion, 0.38% of the next $5 billion, 0.37% of the next $5 billion, 0.36% of the next $5 billion, 0.35% of the next $5 billion, 0.34% of the next $5 billion, 0.33% of the next $8.5 billion and 0.32% thereafter.
Putnam Management has agreed to waive fees and reimburse expenses of the fund through June 30, 2009 to the extent necessary to ensure that the fund’s expenses do not exceed the simple average of the expenses of all front-end load funds viewed by Lipper, Inc. as having the same investment classification or objective as the fund. The expense reimbursement is based on a comparison of the fund’s expenses with the average annualized operating expenses of the funds in its Lipper peer group for each calendar quarter during the fund’s last fiscal year, excluding 12b-1 fees and without giving effect to any expense offset and brokerage/service arrangements that may reduce fund expenses. For the period ended April 30, 2009, Putnam Management waived $452,879 of its management fee from the fund.
The fund reimburses Putnam Management an allocated amount for the compensation and related expenses of certain officers of the fund and their staff who provide administrative services to the fund. The aggregate amount of all such reimbursements is determined annually by the Trustees.
Custodial functions for the fund’s assets were provided by State Street Bank and Trust Company (“State Street”). Custody fees are based on the fund’s asset level, the number of its security holdings and transaction volumes.
Putnam Investor Services, Inc., an affiliate of Putnam Management, provided investor servicing agent functions to the fund. Prior to December 31, 2008, these services were provided by Putnam Investor Services, a division of Putnam Fiduciary Trust Company (“PFTC”), which is an affiliate of Putnam Management. Putnam Investor Services, Inc. and Putnam Investor Services received fees for investor servicing, subject to certain limitations, based on the number of shareholder accounts in the fund and the level of defined contribution plan assets in the fund. The amounts incurred for investor servicing agent functions provided by affiliates of Putnam Management during the six months ended April 30, 2009 are included in Investor servicing fees in the Statement of operations.
The fund has entered into expense offset arrangements with PFTC and State Street whereby PFTC’s and State Street’s fees are reduced by credits allowed on cash balances. The fund also reduced expenses through brokerage/service arrangements. For the six months ended April 30, 2009, the fund’s expenses were reduced by $22,223 under the expense offset arrangements and by $262,891 under the brokerage/service arrangements.
Each independent Trustee of the fund receives an annual Trustee fee, of which $2,306, as a quarterly retainer, has been allocated to the fund, and an additional fee for each Trustees meeting attended. Trustees receive additional fees for attendance at certain committee meetings and industry seminars and for certain compliance-related matters. Trustees also are reimbursed for expenses they incur relating to their services as Trustees.
The fund has adopted a Trustee Fee Deferral Plan (the “Deferral Plan”) which allows the Trustees to defer the receipt of all or a portion of Trustees fees payable on or after July 1, 1995. The deferred fees remain invested in certain Putnam funds until distribution in accordance with the Deferral Plan.
The fund has adopted an unfunded noncontributory defined benefit pension plan (the “Pension Plan”) covering all Trustees of the fund who have served as a Trustee for at least five years and were first elected prior to 2004. Benefits under the Pension Plan are equal to 50% of the Trustee’s average annual attendance and retainer fees for the three years ended December 31, 2005. The retirement benefit is payable during a Trustee’s lifetime, beginning the year following retirement, for the number of years of service through December 31, 2006. Pension expense for the fund is included in Trustee compensation and expenses in the Statement of operations. Accrued pension liability is included in Payable for Trustee compensation and expenses in the Statement of assets and liabilities. The
40
Trustees have terminated the Pension Plan with respect to any Trustee first elected after 2003.
The fund has adopted distribution plans (the “Plans”) with respect to its class A, class B, class C, class M and class R shares pursuant to Rule 12b-1 under the Investment Company Act of 1940. The purpose of the Plans is to compensate Putnam Retail Management Limited Partnership, a wholly-owned subsidiary of Putnam Investments, LLC and Putnam Retail Management GP, Inc., for services provided and expenses incurred in distributing shares of the fund. The Plans provide for payments by the fund to Putnam Retail Management Limited Partnership at an annual rate of up to 0.35%, 1.00%, 1.00%, 1.00% and 1.00% of the average net assets attributable to class A, class B, class C, class M and class R shares, respectively. The Trustees have approved payment by the fund at an annual rate of 0.25%, 1.00%, 1.00%, 0.75% and 0.50% of the average net assets attributable to class A, class B, class C, class M and class R shares, respectively.
For the six months ended April 30, 2009, Putnam Retail Management Limited Partnership, acting as underwriter, received net commissions of $108,547 and $1,230 from the sale of class A and class M shares, respectively, and received $142,573 and $996 in contingent deferred sales charges from redemptions of class B and class C shares, respectively. A deferred sales charge of up to 1.00% and 0.65% is assessed on certain redemptions of class A and class M shares, respectively. For the six months ended April 30, 2009, Putnam Retail Management Limited Partnership, acting as underwriter, received $18,966 and no monies on class A and class M redemptions, respectively.
Note 3: Purchases and sales of securities
During the six months ended April 30, 2009, cost of purchases and proceeds from sales of investment securities other than short-term investments aggregated $1,438,369,174 and $2,406,729,439, respectively. There were no purchases or sales of U.S. government securities.
Note 4: Capital shares
At April 30, 2009, there was an unlimited number of shares of beneficial interest authorized. Transactions in capital shares were as follows:
| | | | |
| | Six months ended 4/30/09 | Year ended 10/31/08 |
|
| Class A | Shares | Amount | Shares | Amount |
|
| Shares sold | 11,446,569 | $100,251,566 | 24,230,642 | $351,702,050 |
|
| Shares issued in connection with | 6,943,634 | 59,552,849 | 97,632,725 | 1,547,063,799 |
| reinvestment of distributions | | | | |
|
| Shares issued in connection with | 25,535,070 | 229,631,796 | — | — |
| the merger of Putnam Classic | | | | |
| Equity Fund | | | | |
|
| | 43,925,273 | 389,436,211 | 121,863,367 | 1,898,765,849 |
|
| Shares repurchased | (73,929,285) | (636,934,884) | (190,686,712) | (2,689,994,334) |
|
| Net decrease | (30,004,012) | $(247,498,673) | (68,823,345) | $(791,228,485) |
|
| |
| | Six months ended 4/30/09 | Year ended 10/31/08 |
|
| Class B | Shares | Amount | Shares | Amount |
|
| Shares sold | 954,854 | $8,223,672 | 1,811,677 | $25,216,220 |
|
| Shares issued in connection with | 359,549 | 3,067,090 | 8,752,110 | 137,001,801 |
| reinvestment of distributions | | | | |
|
| Shares issued in connection with | 1,966,764 | 17,387,567 | — | — |
| the merger of Putnam Classic | | | | |
| Equity Fund | | | | |
|
| | 3,281,167 | 28,678,329 | 10,563,787 | 162,218,021 |
|
| Shares repurchased | (9,945,354) | (84,248,995) | (29,483,985) | (417,228,646) |
|
| Net decrease | (6,664,187) | $(55,570,666) | (18,920,198) | $(255,010,625) |
|
41
| | | | |
| | Six months ended 4/30/09 | Year ended 10/31/08 |
|
| Class C | Shares | Amount | Shares | Amount |
|
| Shares sold | 159,922 | $1,388,890 | 390,840 | $5,550,324 |
|
| Shares issued in connection with | 39,624 | 340,316 | 715,435 | 11,347,364 |
| reinvestment of distributions | | | | |
|
| Shares issued in connection with | 529,146 | 4,743,684 | — | — |
| the merger of Putnam Classic | | | | |
| Equity Fund | | | | |
|
| | 728,692 | 6,472,890 | 1,106,275 | 16,897,688 |
|
| Shares repurchased | (690,137) | (5,902,070) | (1,751,854) | (24,832,757) |
|
| Net increase (decrease) | 38,555 | $570,820 | (645,579) | $(7,935,069) |
|
| |
| | Six months ended 4/30/09 | Year ended 10/31/08 |
|
| Class M | Shares | Amount | Shares | Amount |
|
| Shares sold | 118,931 | $1,038,071 | 239,097 | $3,329,494 |
|
| Shares issued in connection with | 48,658 | 414,047 | 834,676 | 13,171,546 |
| reinvestment of distributions | | | | |
|
| Shares issued in connection with | 1,038,002 | 9,264,376 | — | — |
| the merger of Putnam Classic | | | | |
| Equity Fund | | | | |
|
| | 1,205,591 | 10,716,494 | 1,073,773 | 16,501,040 |
|
| Shares repurchased | (916,830) | (7,805,367) | (2,003,669) | (27,913,790) |
|
| Net increase (decrease) | 288,761 | $2,911,127 | (929,896) | $(11,412,750) |
|
| |
| | Six months ended 4/30/09 | Year ended 10/31/08 |
|
| Class R | Shares | Amount | Shares | Amount |
|
| Shares sold | 57,535 | $498,281 | 307,129 | $4,970,878 |
|
| Shares issued in connection with | 4,574 | 39,040 | 44,030 | 693,648 |
| reinvestment of distributions | | | | |
|
| Shares issued in connection with | 1,890 | 16,913 | — | — |
| the merger of Putnam Classic | | | | |
| Equity Fund | | | | |
|
| | 63,999 | 554,234 | 351,159 | 5,664,526 |
|
| Shares repurchased | (35,302) | (292,929) | (146,970) | (1,928,583) |
|
| Net increase | 28,697 | $261,305 | 204,189 | $3,735,943 |
|
| |
| | Six months ended 4/30/09 | Year ended 10/31/08 |
|
| Class Y | Shares | Amount | Shares | Amount |
|
| Shares sold | 3,620,285 | $32,341,019 | 18,601,502 | $258,011,100 |
|
| Shares issued in connection with | 499,333 | 4,337,869 | 11,754,293 | 186,023,687 |
| reinvestment of distributions | | | | |
|
| Shares issued in connection with | 276,772 | 2,494,381 | — | — |
| the merger of Putnam Classic | | | | |
| Equity Fund | | | | |
|
| | 4,396,390 | 39,173,269 | 30,355,795 | 444,034,787 |
|
| Shares repurchased | (49,135,491) | (444,068,111) | (24,029,121) | (324,987,083) |
|
| Net increase (decrease) | (44,739,101) | $(404,894,842) | 6,326,674 | $119,047,704 |
|
42
Note 5: Investment in Putnam Money Market
Liquidity Fund
The fund invested in Putnam Money Market Liquidity Fund, an open-end management investment company managed by Putnam Management. Investments in Putnam Money Market Liquidity Fund are valued at its closing net asset value each business day. Income distributions earned by the fund are recorded as interest income in the Statement of operations and totaled $11,772 for the period ended April 30, 2009. During the period ended April 30, 2009, cost of purchases and proceeds of sales of investments in Putnam Money Market Liquidity Fund aggregated $105,674,296 and $25,920,298, respectively. Management fees charged to Putnam Money Market Liquidity Fund have been waived by Putnam Management.
Note 6: Regulatory matters and litigation
In late 2003 and 2004, Putnam Management settled charges brought by the SEC and the Massachusetts Securities Division in connection with excessive short-term trading in Putnam funds. Distribution of payments from Putnam Management to certain open-end Putnam funds and their shareholders is expected to be completed in the next several months. These allegations and related matters have served as the general basis for certain lawsuits, including purported class action lawsuits against Putnam Management and, in a limited number of cases, some Putnam funds. Putnam Management believes that these lawsuits will have no material adverse effect on the funds or on Putnam Management’s ability to provide investment management services. In addition, Putnam Management has agreed to bear any costs incurred by the Putnam funds as a result of these matters.
Note 7: New accounting pronouncements
In March 2008, Statement of Financial Accounting Standards No. 161, Disclosures about Derivative Instruments and Hedging Activities (“SFAS 161”) — an amendment of FASB Statement No. 133, was issued and is effective for fiscal years and interim periods beginning after November 15, 2008. SFAS 161 requires enhanced disclosures about how and why an entity uses derivative instruments and how derivative instruments affect an entity’s financial position. Putnam Management is currently evaluating the impact the adoption of SFAS 161 will have on the fund’s financial statement disclosures.
In April 2009, FASB issued a new FASB Staff Position FSP FAS 157-4 which amends FASB Statement No. 157, Fair Value Measurements, and is effective for interim and annual periods ending after June 15, 2009. FSP FAS 157-4 provides additional guidance when the volume and level of activity for the asset or liability measured at fair value has significantly decreased. Additionally, FSP FAS 157-4 expands disclosure by reporting entities with respect to categories of assets and liabilities carried at fair value. Putnam Management believes applying the provisions of FSP FAS 157-4 will not have a material impact on the funds financial statements.
Note 8: Acquisition of Putnam Classic
Equity Fund
On December 26, 2008, the fund issued 25,535,070, 1,966,764, 529,146, 1,038,002, 1,890 and 276,772 class A, class B, class C, class M, class R and class Y shares, respectively, for 28,354,626, 2,136,827, 582,583, 1,143,728, 2,091 and 308,535 class A, class B, class C, class M, class R and class Y shares, respectively, of Putnam Classic Equity Fund to acquire that fund’s net assets in a tax-free exchange approved by the Trustees. The net assets of the fund and Putnam Classic Equity Fund on December 26, 2008, were $4,646,795,617 and $263,538,717, respectively. On December 26, 2008, Putnam Classic Equity Fund had distributions in excess of net investment income of $175,407, accumulated net realized loss of $158,000,178 and unrealized depreciation of $69,873,107. The aggregate net assets of the fund immediately following the acquisition were $4,910,334,334.
Information presented in the Statements of operations and changes in net assets reflect only operations of the Putnam Fund for Growth and Income.
The Putnam Classic Equity Fund’s November 30, 2008 shareholder report is available upon request.
Note 9: Market and credit risk
In the normal course of business, the fund trades financial instruments and enters into financial transactions where risk of potential loss exists due to changes in the market (market risk) or failure of the contracting party to the transaction to perform (credit risk). The fund may be exposed to additional credit risk that an institution or other entity with which the funds have unsettled or open transactions will default.
43
Services for shareholders
Investor services
Systematic investment plan Tell us how much you wish to invest regularly — weekly, semimonthly, or monthly — and the amount you choose will be transferred automatically from your checking or savings account. There’s no additional fee for this service, and you can suspend it at any time. This plan may be a great way to save for college expenses or to plan for your retirement.
Please note that regular investing does not guarantee a profit or protect against loss in a declining market. Before arranging a systematic investment plan, consider your financial ability to continue making purchases in periods when prices are low.
Systematic exchange You can make regular transfers from one Putnam fund to another Putnam fund. There are no additional fees for this service, and you can cancel or change your options at any time.
Dividends PLUS You can choose to have the dividend distributions from one of your Putnam funds automatically reinvested in another Putnam fund at no additional charge.
Free exchange privilege You can exchange money between Putnam funds free of charge, as long as they are the same class of shares. A signature guarantee is required if you are exchanging more than $500,000.
Reinstatement privilege If you’ve sold Putnam shares or received a check for a dividend or capital gain, you may reinvest the proceeds with Putnam within 90 days of the transaction and they will be reinvested at the fund’s current net asset value — with no sales charge. However, reinstatement of class B shares may have special tax consequences. Ask your financial or tax representative for details.
Check-writing service You have ready access to many Putnam accounts. It’s as simple as writing a check, and there are no special fees or service charges. For more information about the check-writing service, call Putnam or visit our Web site.
Dollar cost averaging When you’re investing for long-term goals, it’s time, not timing, that counts. Investing on a systematic basis is a better strategy than trying to figure out when the markets will go up or down. This means investing the same amount of money regularly over a long period. This method of investing is called dollar cost averaging. When a fund’s share price declines, your investment dollars buy more shares at lower prices. When it increases, they buy fewer shares. Over time, you will pay a lower average price per share.
For more information
Visit the Individual Investors section at putnam.com A secure section of our Web site contains complete information on your account, including balances and transactions, updated daily. You may also conduct transactions, such as exchanges, additional investments, and address changes. Log on today to get your password.
Call us toll free at 1-800-225-1581 Ask a helpful Putnam representative or your financial advisor for details about any of these or other services, or see your prospectus.
44
Fund information
Founded over 70 years ago, Putnam Investments was built around the concept that a balance between risk and reward is the hallmark of a well-rounded financial program. We manage over 100 mutual funds across income, value, blend, growth, asset allocation, absolute return, and global sector categories.
| | |
| Investment Manager | George Putnam, III | Beth S. Mazor |
| Putnam Investment | Robert L. Reynolds | Vice President |
| Management, LLC | W. Thomas Stephens | |
| One Post Office Square | Richard B. Worley | James P. Pappas |
| Boston, MA 02109 | | Vice President |
| | Officers | |
| Marketing Services | Charles E. Haldeman, Jr. | Francis J. McNamara, III |
| Putnam Retail Management | President | Vice President and |
| One Post Office Square | | Chief Legal Officer |
| Boston, MA 02109 | Charles E. Porter | |
| Executive Vice President, | Robert R. Leveille |
| Custodian | Principal Executive Officer, | Vice President and |
| State Street Bank and | Associate Treasurer and | Chief Compliance Officer |
| Trust Company | Compliance Liaison | |
| | Mark C. Trenchard |
| Legal Counsel | Jonathan S. Horwitz | Vice President and |
| Ropes & Gray LLP | Senior Vice President | BSA Compliance Officer |
| | and Treasurer | |
| Trustees | | Judith Cohen |
| John A. Hill, Chairman | Steven D. Krichmar | Vice President, Clerk and |
| Jameson A. Baxter, | Vice President and | Assistant Treasurer |
| Vice Chairman | Principal Financial Officer | |
| Ravi Akhoury | | Wanda M. McManus |
| Charles B. Curtis | Janet C. Smith | Vice President, Senior Associate |
| Robert J. Darretta | Vice President, Principal | Treasurer and Assistant Clerk |
| Myra R. Drucker | Accounting Officer and | |
| Charles E. Haldeman, Jr. | Assistant Treasurer | Nancy E. Florek |
| Paul L. Joskow | | Vice President, Assistant Clerk, |
| Elizabeth T. Kennan | Susan G. Malloy | Assistant Treasurer and |
| Kenneth R. Leibler | Vice President and | Proxy Manager |
| Robert E. Patterson | Assistant Treasurer | |
| | |
This report is for the information of shareholders of The Putnam Fund for Growth and Income. It may also be used as sales literature when preceded or accompanied by the current prospectus, the most recent copy of Putnam’s Quarterly Performance Summary, and Putnam’s Quarterly Ranking Summary. For more recent performance, please visit putnam.com. Investors should carefully consider the investment objective, risks, charges, and expenses of a fund, which are described in its prospectus. For this and other information or to request a prospectus, call 1-800-225-1581 toll free. Please read the prospectus carefully before investing. The fund’s Statement of Additional Information contains additional information about the fund’s Trustees and is available without charge upon request by calling 1-800-225-1581.

Item 2. Code of Ethics:
Not applicable
Item 3. Audit Committee Financial Expert:
Not applicable
Item 4. Principal Accountant Fees and Services:
Not applicable
Item 5. Audit Committee of Listed Registrants
Not applicable
Item 6. Schedule of Investments:
The registrant’s schedule of investments in unaffiliated issuers is included in the report to shareholders in Item 1 above.
Item 7. Disclosure of Proxy Voting Policies and Procedures For Closed-End Management Investment Companies:
Not applicable
Item 8. Portfolio Managers of Closed-End Investment Companies
Not Applicable
Item 9. Purchases of Equity Securities by Closed-End Management Investment Companies and Affiliated Purchasers:
Not applicable
Item 10. Submission of Matters to a Vote of Security Holders:
Not applicable
Item 11. Controls and Procedures:
(a) The registrant's principal executive officer and principal financial officer have concluded, based on their evaluation of the effectiveness of the design and operation of the registrant's disclosure controls and procedures as of a date within 90 days of the filing date of this report, that the design and operation of such procedures are generally effective to provide reasonable assurance that information required to be disclosed by the registrant in this report is recorded, processed, summarized and reported within the time periods specified in the Commission's rules and forms.
(b) Changes in internal control over financial reporting: Not applicable
Item 12. Exhibits:
(a)(1) Not applicable
(a)(2) Separate certifications for the principal executive officer and principal financial officer of the registrant as required by Rule 30a-2(a) under the Investment Company Act of 1940, as amended, are filed herewith.
(b) The certifications required by Rule 30a-2(b) under the Investment Company Act of 1940, as amended, are filed herewith.
SIGNATURES
Pursuant to the requirements of the Securities Exchange Act of 1934 and the Investment Company Act of 1940, the registrant has duly caused this report to be signed on its behalf by the undersigned, thereunto duly authorized.
The Putnam Fund for Growth and Income
By (Signature and Title):
/s/Janet C. Smith
Janet C. Smith
Principal Accounting Officer
Date: June 26, 2009
Pursuant to the requirements of the Securities Exchange Act of 1934 and the Investment Company Act of 1940, this report has been signed below by the following persons on behalf of the registrant and in the capacities and on the dates indicated.
By (Signature and Title):
/s/Charles E. Porter
Charles E. Porter
Principal Executive Officer
Date: June 26, 2009
By (Signature and Title):
/s/Steven D. Krichmar
Steven D. Krichmar
Principal Financial Officer
Date: June 26, 2009