| |
| UNITED STATES |
| SECURITIES AND EXCHANGE COMMISSION |
| Washington, D.C. 20549 |
| |
| FORM N-CSR |
| |
| CERTIFIED SHAREHOLDER REPORT OF REGISTERED |
| MANAGEMENT INVESTMENT COMPANIES |
| |
| Investment Company Act file number: (811- 00781) | |
| | |
| Exact name of registrant as specified in charter: | The Putnam Fund for Growth and Income |
| |
| Address of principal executive offices: One Post Office Square, Boston, Massachusetts 02109 |
| | |
| Name and address of agent for service: | Beth S. Mazor, Vice President |
| | One Post Office Square |
| | Boston, Massachusetts 02109 |
| |
| Copy to: | John W. Gerstmayr, Esq. |
| | Ropes & Gray LLP |
| | One International Place |
| | Boston, Massachusetts 02110 |
| |
| Registrant’s telephone number, including area code: | (617) 292-1000 |
| | |
| Date of fiscal year end: October 31, 2010 | |
| |
| Date of reporting period: November 1, 2009 — April 30, 2010 |
Item 1. Report to Stockholders:
The following is a copy of the report transmitted to stockholders pursuant to Rule 30e-1 under the Investment Company Act of 1940:

The Putnam
Fund for Growth
and Income
Semiannual report
4 | 30 | 10
| |
| Message from the Trustees | 1 |
| About the fund | 2 |
| Performance snapshot | 4 |
| Interview with your fund’s portfolio manager | 5 |
| Your fund’s performance | 10 |
| Your fund’s expenses | 12 |
| Terms and definitions | 14 |
| Other information for shareholders | 15 |
| Financial statements | 16 |
| Shareholder meeting results | 38 |
Message from the Trustees
Dear Fellow Shareholder:
Volatility returned to global equity markets this spring. This change was to be expected after the remarkable advances of the past year, but the headlines from Europe added fuel.
If 2009 can be characterized as a rebound from the liquidity crisis, the investment environment for 2010 is shaping up to be somewhat more difficult, one that requires analysis, insight, innovation, and expertise.
These attributes form the very core of Putnam’s analytic, active-management approach, which seeks to weather short-term periods of market dislocation, while preparing for the expected return of a more positive investing environment. With volatility rising in fixed-income markets, bond investors should benefit from active management as well.
We would like to thank all shareholders who took the time to vote by proxy on a number of issues, including shareholder-friendly management fee changes, which went into effect earlier this year. We would also like to welcome new shareholders to the fund, and thank all of our investors for your continued confidence in Putnam.
Respectfully yours,

About the fund
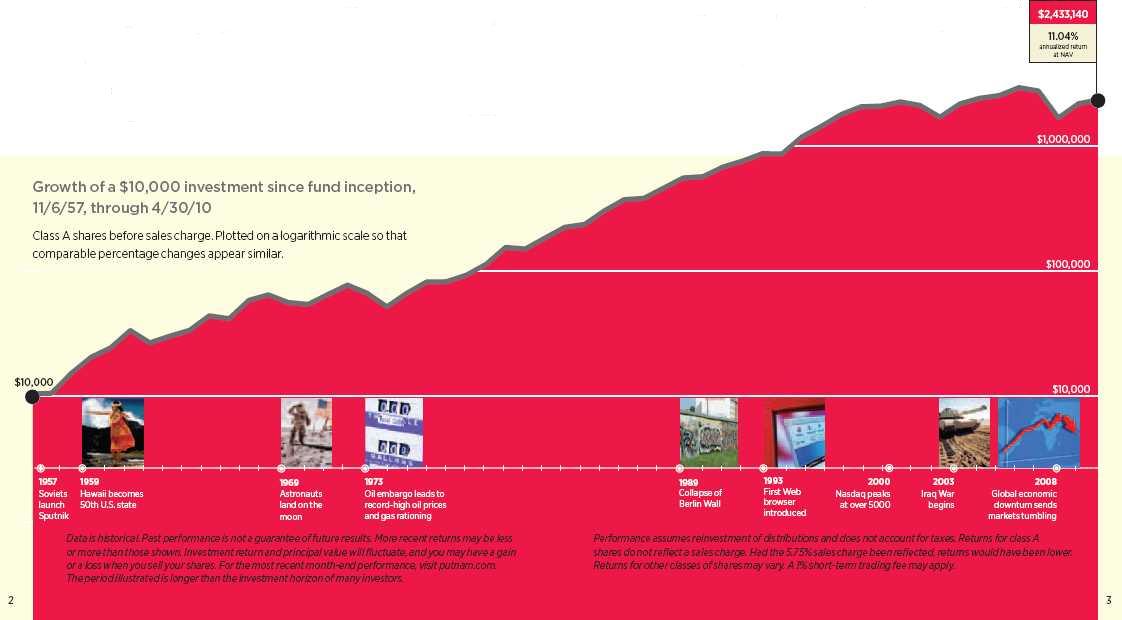
Pursuing capital growth for over 50 years
In November 1957 — almost 20 years to the day after Putnam Investments was founded with the launch of The George Putnam Fund of Boston — Putnam launched its second mutual fund: The Putnam Fund for Growth and Income.
Putnam’s founders carefully debated the merits of adding a fund whose primary focus would be stock investments. They believed that the balanced approach of The George Putnam Fund of Boston, which owned a mix of stocks and bonds, was still the most prudent choice for most individuals. However, the advent of state tax-exempt bonds was making it more advantageous for some investors to balance their own portfolios. Furthermore, many financial advisors who worked with Putnam had been urging the firm to launch a common stock fund to meet this growing need.
The fund was launched in a favorable environment for stock investors. Confidence in stocks, which had been severely shaken by the 1929 crash and the Great Depression that followed, had finally been renewed by the early 1950s. Fueled by the optimism of new technologies and the race to space, the 1960s were generally good years for investors. Then came the stagflation-plagued 1970s when the stock market moved sideways for most of the decade.
The fund benefited from the rallies that dominated the 1980s and 1990s. There were bumps in the road, such as the recession of the early 1990s, and, more recently, the bear markets of 2000–2002 and 2007–2009.
True to its roots, The Putnam Fund for Growth and Income continues to focus on long-term capital growth opportunities among leading large-cap companies, with appropriate attention to managing downside risk. We believe these strategies, which have proven successful for long-term investors in the fund, will continue to serve the fund well.
Consider these risks before investing:
Value investing seeks underpriced stocks, but there is no guarantee that a stock’s price will rise. The use of derivatives involves special risks and may result in losses.
Performance
snapshot
Annualized total return (%) comparison as of 4/30/10
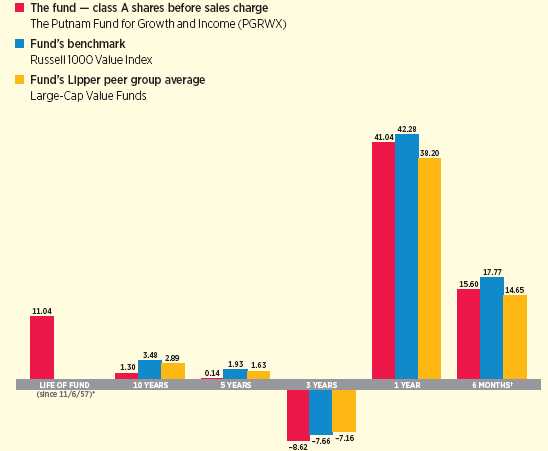
Current performance may be lower or higher than the quoted past performance, which cannot guarantee future results. Share price, principal value, and return will fluctuate, and you may have a gain or a loss when you sell your shares. Performance of class A shares assumes reinvestment of distributions and does not account for taxes. Fund returns in the bar chart do not reflect a sales charge of 5.75%; had they, returns would have been lower. See pages 5 and 10–12 for additional performance information. For a portion of the periods, this fund may have limited expenses, without which returns would have been lower. A 1% short-term trading fee may apply. To obtain the most recent month-end performance, visit putnam.com.
* The fund’s benchmark, the Russell 1000 Value Index, and the fund’s Lipper peer group were introduced on 12/31/78 and 12/31/59, respectively, which post-date the inception date of the fund’s class A shares.
† Returns for the six-month period are not annualized, but cumulative.
4
Interview with your
fund’s portfolio manager
Robert Ewing
Robert, stock market volatility edged higher
in recent months. How did The Putnam Fund
for Growth and Income perform?
I am pleased to report that despite the market volatility, the fund’s class A shares delivered a strong 15.60% gain over the six-month period ended April 30, 2010, the first half of its fiscal year. This performance was slightly behind the 17.77% advance of its benchmark index, the Russell 1000 Value Index, but ahead of the 14.65% return posted by its Lipper peer group.
What was behind the market’s
recent volatility?
After the extremely strong stock market rally in 2009, investors may have been predisposed to some nervousness, and there were a number of events that played into those fears. In the United States, Congress labored over — and eventually passed — a sweeping health-care reform bill. Not long after, as the legislative focus turned to financial-industry reform, the government brought civil and criminal charges against banking giant Goldman Sachs, sending shockwaves through that industry. There was a discussion about whether the U.S. economic recovery might moderate. And a full-blown crisis of confidence emerged in Europe when Greece appeared unlikely to meet its debt obligations. In a sign of the severity of the crisis, the sovereign debt of Greece, Spain, and Portugal were ultimately downgraded by rating agencies that cited political, economic, and budgetary conditions.
What ultimately drove returns higher?
Stocks were propelled by growing evidence that — in the United States at least — the economic recovery appears to be taking hold. And corporate earnings have been very strong. In the first quarter of 2010, with nearly all of the

This comparison shows your fund’s performance in the context of broad market indexes for the six months ended 4/30/10. See pages 4 and 10–12 for additional fund performance information. Index descriptions can be found on page 14.
5
S&P 500 companies reporting, earnings have increased by an average of 51% over the prior year, with 68% of companies beating analysts’ expectations. Companies that undertook aggressive cost-cutting during the economic downturn have added to their bottom lines. Now many of those firms are experiencing rising sales, which are essential to sustained, long-term growth.
What was your investment strategy during
the period, and which areas of the market or
companies were particularly beneficial for
the fund?
The fund seeks capital appreciation by investing in stocks that are generally thought of as being less expensive than the overall market. Tactically, my approach has several components. I look for stocks that I believe are inexpensive. I also look for stocks that have good fundamental stories that offer a potential catalytic event, such as a new product or a merger. And the hope is, through rigorous fundamental research, we learn something about these companies that other investors haven’t discovered. Our goal is to have a more complete research mosaic than our competitors.
The fund received gains from a wide variety of sectors. As of April 30, for example, the ten-largest contributors to performance included companies in the airline, energy, media, telecommunications, hotel, and beverage industries. UAL, or United Airlines, was a top performer that we later sold in order to take profits. Wyndham Worldwide, Coca-Cola Enterprises, and Emerson Electric also contributed to the fund’s gains for the period.
However, as “active” managers, we have the flexibility to not own a stock that is included in our benchmark index — or to own less of it than the index. This was the case with Exxon Mobil during the period, and our decision to underweight the energy giant was the single-biggest contributor to relative performance. The largest component of the Russell 1000 Value Index, Exxon performed poorly on an absolute basis as commodity prices were fairly stagnant during the period. After the close of the period, our decision to underweight Exxon was even more important as oil stocks declined broadly with the news of British Petroleum’s Gulf Coast spill. Another stock we underweighted successfully was AT&T, which experienced
Sector allocations as of 4/30/10
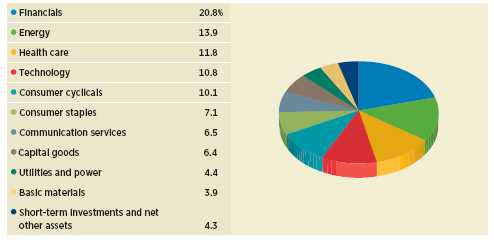
Allocations are represented as a percentage of the fund’s net assets. Holdings and allocations may vary over time.
6
“Stocks were propelled by growing
evidence that — in the United States
at least — the economic recovery
appears to be taking hold.”
Robert Ewing
pricing and subscriber growth pressures during the period.
Which stocks detracted from performance?
Our biggest detractor for the period was Baxter International, which lowered its 2010 earnings outlook following the passage of the health-care reform legislation and weakness in its blood-plasma products business.
Another unforeseen detractor was Transocean, the offshore drilling company involved in the Gulf Coast oil spill that started with an explosion on an offshore rig on April 20. We continue to own Transocean. As of the end of April, we believed the decline in the stock had more than adequately discounted the ultimate costs the company could face. Moreover, the company’s insurance should cover a large portion of the lost revenues and costs associated with the accident.
Not holding Boeing hurt performance on a relative basis versus the Russell Index. Shares of the aerospace company performed well during the period thanks to the economic recovery and enthusiasm for its new 787 Dreamliner commercial aircraft. Similarly, the fund’s underexposure to GE, whose shares performed well thanks to the improving economy, also held back performance.
The fund has large concentrations in financial
and energy stocks. What opportunities do you
see in these areas?
The portfolio has a significant concentration in financials — slightly bigger than our peers, but it is below benchmark weightings. There are three key reasons for the fund’s exposure to financials. First, for the most part, financial companies have repaired their balance sheets and from a capital point of view are much more resilient than two years ago. Second, they are beneficiaries of the domestic, cyclical economic recovery. Third, across a broad range of measurements, the stocks are inexpensive relative to the broader market. This is particularly true of the big banks and capital market participants.
Top 10 holdings
| | |
| HOLDING (percentage of fund’s net assets) | SECTOR | INDUSTRY |
|
| Chevron Corp. (3.1%) | Energy | Oil and gas |
| Bank of America Corp. (3.0%) | Financials | Banking |
| Pfizer, Inc. (2.9%) | Health care | Pharmaceuticals |
| JPMorgan Chase & Co. (2.6%) | Financials | Banking |
| Exxon Mobil Corp. (2.5%) | Energy | Oil and gas |
| Wells Fargo & Co. (2.2%) | Financials | Banking |
| AT&T, Inc. (1.9%) | Communication services | Regional Bells |
| General Electric Co. (1.7%) | Conglomerates | Conglomerates |
| Occidental Petroleum Corp. (1.4%) | Energy | Oil and gas |
| Microsoft Corp. (1.2%) | Technology | Software |
This table shows the fund’s top 10 holdings and the percentage of the fund’s net assets that each represented as of 4/30/10. Short-term holdings are excluded. Holdings will vary over time.
7
Bank of America and JPMorgan are good examples. Both companies possess strong franchises nationally and should benefit from a recovery in consumer spending and borrowing. In my view, investors have overreacted to the regulatory uncertainty surrounding financial reform — uncertainty that will soon be resolved with the passage of legislation — and as a result of investor reactions, both stocks trade at what I believe are attractive valuations.
Energy stocks are also exposed to the cyclical improvement in the economy. As the U.S. and global economies improve, it should benefit the energy sector. Putnam has considerable research expertise in the energy sector, so I believe it is also an area where we can add value through stock selection.
What is your outlook for the fund?
I would describe my outlook as carefully constructive. The fund is positioned with a modestly pro-cyclical tilt — that is, with the belief that U.S. and global economies will continue to expand.
It’s important to bear in mind that some secular challenges remain, including sovereign debt issues in Europe. We expect the current volatility storm to dissipate well before a full-blown global credit crisis erupts. Yet the consequences of a new credit crisis, however unlikely, would be significant, and will be factored into our near-term investment decisions. Strategies that preserve exposure to a rising market still make sense, given our expectation of ongoing recovery and expansion. But steps to reduce volatility and downside risk also seem timely.
I am also mindful of the pullback in U.S. monetary stimulus that is now taking place one year after these emergency programs were put in place. And from a long-term view, we’re likely to see inflationary pressures building as the pace of economic growth quickens.
That said, I do feel that we are in the early stages of a robust cyclical recovery in the global economy, and I believe that will be good for equity valuations. As always, the fund’s focus will be on finding those stocks that I believe are inexpensive relative to the
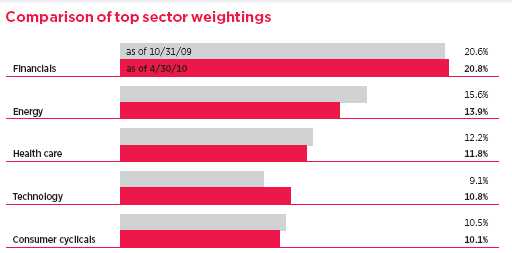
This chart shows how the fund’s top weightings have changed over the past six months. Weightings are shown as a percentage of net assets. Holdings will vary over time.
8
market, and where I believe we have an information edge.
Thank you, Robert, for your time and
insights today.
The views expressed in this report are exclusively those of Putnam Management. They are not meant as investment advice.
Please note that the holdings discussed in this report may not have been held by the fund for the entire period. Portfolio composition is subject to review in accordance with the fund’s investment strategy and may vary in the future. Current and future portfolio holdings are subject to risk.

Portfolio Manager Robert Ewing is Head of U.S. Equity at Putnam. He has a B.S. in Finance and Economics from Boston College. A CFA charterholder, he joined Putnam in 2008 and has been in the investment industry since 1990.
IN THE NEWS
The first-quarter earnings season was much better than expected. With virtually all of the S&P 500 companies reporting, 68% have beaten earnings analysts’ expectations, according to Standard & Poor’s. In a typical quarter, 61% of companies beat estimates. Both top-line (sales) and bottom-line earnings (profits) are coming in above expectations. Companies that undertook aggressive cost-cutting during the economic downturn have added to their bottom lines. Now many of those firms are experiencing rising sales, which is essential to sustained, long-term growth.
9
Your fund’s performance
This section shows your fund’s performance, price, and distribution information for periods ended April 30, 2010, the end of the first half of its current fiscal year. In accordance with regulatory requirements for mutual funds, we also include performance as of the most recent calendar quarter-end and expense information taken from the fund’s current prospectus. Performance should always be considered in light of a fund’s investment strategy. Data represents past performance. Past performance does not guarantee future results. More recent returns may be less or more than those shown. Investment return and principal value will fluctuate, and you may have a gain or a loss when you sell your shares. Performance information does not reflect any deduction for taxes a shareholder may owe on fund distributions or on the redemption of fund shares. For the most recent month-end performance, please visit the Individual Investors section at putnam .com or call Putnam at 1-800-225-1581. Class Y shares are generally only available to corporate and institutional clients and clients in other approved programs. See the Terms and Definitions section in this report for definitions of the share classes offered by your fund.
Fund performance Total return for periods ended 4/30/10
| | | | | | | | | | |
| | Class A | Class B | Class C | Class M | Class R | Class Y |
| (inception dates) | (11/6/57) | (4/27/92) | (7/26/99) | (5/1/95) | (1/21/03) | (6/15/94) |
|
| | NAV | POP | NAV | CDSC | NAV | CDSC | NAV | POP | NAV | NAV |
|
| Annual average | | | | | | | | | | |
| (life of fund) | 11.04% | 10.91% | 10.03% | 10.03% | 10.20% | 10.20% | 10.31% | 10.23% | 10.76% | 11.12% |
|
| 10 years | 13.76 | 7.21 | 5.50 | 5.50 | 5.50 | 5.50 | 8.16 | 4.38 | 10.96 | 16.63 |
| Annual average | 1.30 | 0.70 | 0.54 | 0.54 | 0.54 | 0.54 | 0.79 | 0.43 | 1.05 | 1.55 |
|
| 5 years | 0.72 | –5.08 | –3.07 | –4.44 | –3.08 | –3.08 | –1.84 | –5.27 | –0.58 | 1.96 |
| Annual average | 0.14 | –1.04 | –0.62 | –0.90 | –0.62 | –0.62 | –0.37 | –1.08 | –0.12 | 0.39 |
|
| 3 years | –23.69 | –28.07 | –25.41 | –27.25 | –25.43 | –25.43 | –24.84 | –27.47 | –24.25 | –23.13 |
| Annual average | –8.62 | –10.40 | –9.31 | –10.06 | –9.32 | –9.32 | –9.08 | –10.15 | –8.84 | –8.40 |
|
| 1 year | 41.04 | 32.94 | 40.11 | 35.11 | 40.00 | 39.00 | 40.39 | 35.48 | 40.74 | 41.40 |
|
| 6 months | 15.60 | 8.96 | 15.17 | 10.17 | 15.16 | 14.16 | 15.26 | 11.24 | 15.46 | 15.80 |
|
Current performance may be lower or higher than the quoted past performance, which cannot guarantee future results. After-sales-charge returns (public offering price, or POP) for class A and M shares reflect a maximum 5.75% and 3.50% load, respectively. Class B share returns reflect the applicable contingent deferred sales charge (CDSC), which is 5% in the first year, declining to 1% in the sixth year, and is eliminated thereafter. Class C shares reflect a 1% CDSC for the first year that is eliminated thereafter. Class R and Y shares have no initial sales charge or CDSC. Performance for class B, C, M, R, and Y shares before their inception is derived from the historical performance of class A shares, adjusted for the applicable sales charge (or CDSC) and, except for class Y shares, the higher operating expenses for such shares.
Performance benefited from receipt of an Enron Class Action Settlement pertaining to investments made prior to 2002.
Performance benefited from receipt of a Tyco International, Ltd. class action settlement pertaining to investments made prior to 2003.
For a portion of the periods, this fund may have limited expenses, without which returns would have been lower.
A 1% short-term trading fee may be applied to shares exchanged or sold within 7 days of purchase.
10
Comparative index returns For periods ended 4/30/10
| | |
| | | Lipper Large-Cap Value Funds |
| | Russell 1000 Value Index | category average* |
|
| Annual average (life of fund) | —† | —† |
|
| 10 years | 40.83% | 34.45% |
| Annual average | 3.48 | 2.89 |
|
| 5 years | 10.05 | 8.69 |
| Annual average | 1.93 | 1.63 |
|
| 3 years | –21.27 | –19.81 |
| Annual average | –7.66 | –7.16 |
|
| 1 year | 42.28 | 38.20 |
|
| 6 months | 17.77 | 14.65 |
|
Index and Lipper results should be compared to fund performance at net asset value.
* Over the 6-month, 1-year, 3-year, 5-year, and 10-year periods ended 4/30/10, there were 551, 539, 487, 424, and 198 funds, respectively, in this Lipper category.
† The fund’s benchmark, the Russell 1000 Value Index, and the fund’s Lipper peer group were introduced on 12/31/78 and 12/31/59, respectively, which post-date the inception date of the fund’s class A shares.
Fund price and distribution information For the six-month period ended 4/30/10
| | | | | | | | |
| Distributions | Class A | Class B | Class C | Class M | Class R | Class Y |
|
| Number | 3 | 3 | 3 | 3 | 3 | 3 |
|
| Income | $0.056 | $0.011 | $0.012 | $0.026 | $0.042 | $0.070 |
|
| Capital gains | — | — | — | — | — | — |
|
| Total | $0.056 | $0.011 | $0.012 | $0.026 | $0.042 | $0.070 |
|
| Share value | NAV | POP | NAV | NAV | NAV | POP | NAV | NAV |
|
| 10/31/09 | $11.15 | $11.83 | $10.95 | $11.10 | $11.06 | $11.46 | $11.09 | $11.17 |
|
| 4/30/10 | 12.83 | 13.61 | 12.60 | 12.77 | 12.72 | 13.18 | 12.76 | 12.86 |
|
| Current yield (end of period) | NAV | POP | NAV | NAV | NAV | POP | NAV | NAV |
|
| Current dividend rate 1 | 0.69% | 0.65% | 0.10% | 0.13% | 0.31% | 0.30% | 0.50% | 0.87% |
|
| Current 30-day SEC yield 2 | N/A | 0.74 | 0.04 | 0.04 | N/A | 0.28 | 0.54 | 1.04 |
|
The classification of distributions, if any, is an estimate. Final distribution information will appear on your year-end tax forms.
1 Most recent distribution, excluding capital gains, annualized and divided by NAV or POP at end of period.
2 Based only on investment income and calculated using the maximum offering price for each share class, in accordance with SEC guidelines.
11
Fund performance as of most recent calendar quarter
Total return for periods ended 3/31/10
| | | | | | | | | | |
| | Class A | Class B | Class C | Class M | Class R | Class Y |
| (inception dates) | (11/6/57) | (4/27/92) | (7/26/99) | (5/1/95) | (1/21/03) | (6/15/94) |
|
| | NAV | POP | NAV | CDSC | NAV | CDSC | NAV | POP | NAV | NAV |
|
| Annual average | | | | | | | | | | |
| (life of fund) | 11.03% | 10.90% | 10.01% | 10.01% | 10.19% | 10.19% | 10.30% | 10.22% | 10.75% | 11.11% |
|
| 10 years | 12.43 | 5.96 | 4.22 | 4.22 | 4.23 | 4.23 | 6.92 | 3.17 | 9.61 | 15.18 |
| Annual average | 1.18 | 0.58 | 0.41 | 0.41 | 0.42 | 0.42 | 0.67 | 0.31 | 0.92 | 1.42 |
|
| 5 years | –3.05 | –8.65 | –6.69 | –8.01 | –6.70 | –6.70 | –5.47 | –8.79 | –4.32 | –1.94 |
| Annual average | –0.62 | –1.79 | –1.38 | –1.66 | –1.38 | –1.38 | –1.12 | –1.82 | –0.88 | –0.39 |
|
| 3 years | –21.73 | –26.22 | –23.52 | –25.41 | –23.48 | –23.48 | –22.91 | –25.60 | –22.34 | –21.19 |
| Annual average | –7.84 | –9.64 | –8.55 | –9.31 | –8.53 | –8.53 | –8.31 | –9.39 | –8.08 | –7.63 |
|
| 1 year | 55.22 | 46.34 | 54.05 | 49.05 | 54.08 | 53.08 | 54.58 | 49.10 | 54.79 | 55.64 |
|
| 6 months | 10.69 | 4.34 | 10.29 | 5.29 | 10.24 | 9.24 | 10.41 | 6.58 | 10.53 | 10.80 |
|
Your fund’s expenses
As a mutual fund investor, you pay ongoing expenses, such as management fees, distribution fees (12b-1 fees), and other expenses. Using the following information, you can estimate how these expenses affect your investment and compare them with the expenses of other funds. You may also pay one-time transaction expenses, including sales charges (loads) and redemption fees, which are not shown in this section and would have resulted in higher total expenses. For more information, see your fund’s prospectus or talk to your financial representative.
Expense ratios
| | | | | | |
| | Class A | Class B | Class C | Class M | Class R | Class Y |
|
| Total annual operating expenses for the fiscal year | | | | | | |
| ended 10/31/09* | 1.16% | 1.91% | 1.91% | 1.66% | 1.41% | 0.91% |
|
| Annualized expense ratio for the six-month period | | | | | | |
| ended 4/30/10 | 1.16% | 1.91% | 1.91% | 1.66% | 1.41% | 0.91% |
|
Fiscal-year expense information in this table is taken from the most recent prospectus, is subject to change, and may differ from that shown for the annualized expense ratio and in the financial highlights of this report. Expenses are shown as a percentage of average net assets.
* Reflects expenses under a new management contract and a new expense arrangement.
12
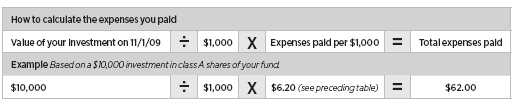
Expenses per $1,000
The following table shows the expenses you would have paid on a $1,000 investment in The Putnam Fund for Growth and Income from November 1, 2009, to April 30, 2010. It also shows how much a $1,000 investment would be worth at the close of the period, assuming actual returns and expenses.
| | | | | | |
| | Class A | Class B | Class C | Class M | Class R | Class Y |
|
| Expenses paid per $1,000*† | $6.20 | $10.19 | $10.19 | $8.86 | $7.53 | $4.87 |
|
| Ending value (after expenses) | $1,156.00 | $1,151.70 | $1,151.60 | $1,152.60 | $1,154.60 | $1,158.00 |
|
* Expenses for each share class are calculated using the fund’s annualized expense ratio for each class, which represents the ongoing expenses as a percentage of average net assets for the six months ended 4/30/10. The expense ratio may differ for each share class.
† Expenses are calculated by multiplying the expense ratio by the average account value for the period; then multiplying the result by the number of days in the period; and then dividing that result by the number of days in the year.
Estimate the expenses you paid
To estimate the ongoing expenses you paid for the six months ended April 30, 2010, use the following calculation method. To find the value of your investment on November 1, 2009, call Putnam at 1-800-225-1581.
Compare expenses using the SEC’s method
The Securities and Exchange Commission (SEC) has established guidelines to help investors assess fund expenses. Per these guidelines, the following table shows your fund’s expenses based on a $1,000 investment, assuming a hypothetical 5% annualized return. You can use this information to compare the ongoing expenses (but not transaction expenses or total costs) of investing in the fund with those of other funds. All mutual fund shareholder reports will provide this information to help you make this comparison. Please note that you cannot use this information to estimate your actual ending account balance and expenses paid during the period.
| | | | | | |
| | Class A | Class B | Class C | Class M | Class R | Class Y |
|
| Expenses paid per $1,000*† | $5.81 | $9.54 | $9.54 | $8.30 | $7.05 | $4.56 |
|
| Ending value (after expenses) | $1,019.04 | $1,015.32 | $1,015.32 | $1,016.56 | $1,017.80 | $1,020.28 |
|
* Expenses for each share class are calculated using the fund’s annualized expense ratio for each class, which represents the ongoing expenses as a percentage of average net assets for the six months ended 4/30/10. The expense ratio may differ for each share class.
† Expenses are calculated by multiplying the expense ratio by the average account value for the period; then multiplying the result by the number of days in the period; and then dividing that result by the number of days in the year.
13
Terms and definitions
Important terms
Total return shows how the value of the fund’s shares changed over time, assuming you held the shares through the entire period and reinvested all distributions in the fund.
Net asset value (NAV) is the price, or value, of one share of a mutual fund, without a sales charge. NAVs fluctuate with market conditions. NAV is calculated by dividing the net assets of each class of shares by the number of outstanding shares in the class.
Public offering price (POP) is the price of a mutual fund share plus the maximum sales charge levied at the time of purchase. POP performance figures shown here assume the 5.75% maximum sales charge for class A shares and 3.50% for class M shares.
Contingent deferred sales charge (CDSC) is generally a charge applied at the time of the redemption of class B or C shares and assumes redemption at the end of the period. Your fund’s class B CDSC declines from a 5% maximum during the first year to 1% during the sixth year. After the sixth year, the CDSC no longer applies. The CDSC for class C shares is 1% for one year after purchase.
Current yield is the annual rate of return earned from dividends or interest of an investment. Current yield is expressed as a percentage of the price of a security, fund share, or principal investment.
Share classes
Class A shares are generally subject to an initial sales charge and no CDSC (except on certain redemptions of shares bought without an initial sales charge).
Class B shares are not subject to an initial sales charge. They may be subject to a CDSC.
Class C shares are not subject to an initial sales charge and are subject to a CDSC only if the shares are redeemed during the first year.
Class M shares have a lower initial sales charge and a higher 12b-1 fee than class A shares and no CDSC (except on certain redemptions of shares bought without an initial sales charge).
Class R shares are not subject to an initial sales charge or CDSC and are available only to certain defined contribution plans.
Class Y shares are not subject to an initial sales charge or CDSC, and carry no 12b-1 fee. They are generally only available to corporate and institutional clients and clients in other approved programs.
Comparative indexes
Barclays Capital Aggregate Bond Index is an unmanaged index of U.S. investment-grade fixed-income securities.
BofA (Bank of America) Merrill Lynch U.S. 3-Month Treasury Bill Index is an unmanaged index that seeks to measure the performance of U.S. Treasury bills available in the marketplace.
Russell 1000 Value Index is an unmanaged index of those companies in the large-cap Russell 1000 Index chosen for their value orientation.
S&P 500 Index is an unmanaged index of common stock performance.
Indexes assume reinvestment of all distributions and do not account for fees. Securities and performance of a fund and an index will differ. You cannot invest directly in an index.
Lipper is a third-party industry-ranking entity that ranks mutual funds. Its rankings do not reflect sales charges. Lipper rankings are based on total return at net asset value relative to other funds that have similar current investment styles or objectives as determined by Lipper. Lipper may change a fund’s category at its discretion. Lipper category averages reflect performance trends for funds within a category.
14
Other information for shareholders
Important notice regarding delivery
of shareholder documents
In accordance with SEC regulations, Putnam sends a single copy of annual and semiannual shareholder reports, prospectuses, and proxy statements to Putnam shareholders who share the same address, unless a shareholder requests otherwise. If you prefer to receive your own copy of these documents, please call Putnam at 1-800-225-1581, and Putnam will begin sending individual copies within 30 days.
Proxy voting
Putnam is committed to managing our mutual funds in the best interests of our shareholders. The Putnam funds’ proxy voting guidelines and procedures, as well as information regarding how your fund voted proxies relating to portfolio securities during the 12-month period ended June 30, 2009, are available in the Individual Investors section of putnam.com, and on the SEC’s Web site, www.sec.gov. If you have questions about finding forms on the SEC’s Web site, you may call the SEC at 1-800-SEC-0330. You may also obtain the Putnam funds’ proxy voting guidelines and procedures at no charge by calling Putnam’s Shareholder Services at 1-800-225-1581.
Fund portfolio holdings
The fund will file a complete schedule of its portfolio holdings with the SEC for the first and third quarters of each fiscal year on Form N-Q. Shareholders may obtain the fund’s Forms N-Q on the SEC’s Web site at www.sec.gov. In addition, the fund’s Forms N-Q may be reviewed and copied at the SEC’s Public Reference Room in Washington, D.C. You may call the SEC at 1-800-SEC-0330 for information about the SEC’s Web site or the operation of the Public Reference Room.
Trustee and employee
fund ownership
Putnam employees and members of the Board of Trustees place their faith, confidence, and, most importantly, investment dollars in Putnam mutual funds. As of April 30, 2010, Putnam employees had approximately $347,000,000 and the Trustees had approximately $49,000,000 invested in Putnam mutual funds. These amounts include investments by the Trustees’ and employees’ immediate family members as well as investments through retirement and deferred compensation plans.
15
Financial statements
A guide to financial statements
These sections of the report, as well as the accompanying Notes, constitute the fund’s financial statements.
The fund’s portfolio lists all the fund’s investments and their values as of the last day of the reporting period. Holdings are organized by asset type and industry sector, country, or state to show areas of concentration and diversification.
Statement of assets and liabilities shows how the fund’s net assets and share price are determined. All investment and non-investment assets are added together. Any unpaid expenses and other liabilities are subtracted from this total. The result is divided by the number of shares to determine the net asset value per share, which is calculated separately for each class of shares. (For funds with preferred shares, the amount subtracted from total assets includes the liquidation preference of preferred shares.)
Statement of operations shows the fund’s net investment gain or loss. This is done by first adding up all the fund’s earnings — from dividends and interest income — and subtracting its operating expenses to determine net investment income (or loss). Then, any net gain or loss the fund realized on the sales of its holdings — as well as any unrealized gains or losses over the period — is added to or subtracted from the net investment result to determine the fund’s net gain or loss for the fiscal period.
Statement of changes in net assets shows how the fund’s net assets were affected by the fund’s net investment gain or loss, by distributions to shareholders, and by changes in the number of the fund’s shares. It lists distributions and their sources (net investment income or realized capital gains) over the current reporting period and the most recent fiscal year-end. The distributions listed here may not match the sources listed in the Statement of operations because the distributions are determined on a tax basis and may be paid in a different period from the one in which they were earned. Dividend sources are estimated at the time of declaration. Actual results may vary. Any non-taxable return of capital cannot be determined until final tax calculations are completed after the end of the fund’s fiscal year.
Financial highlights provide an overview of the fund’s investment results, per-share distributions, expense ratios, net investment income ratios, and portfolio turnover in one summary table, reflecting the five most recent reporting periods. In a semiannual report, the highlights table also includes the current reporting period.
16
The fund’s portfolio 4/30/10 (Unaudited)
| | |
| COMMON STOCKS (97.9%)* | Shares | Value |
|
| Advertising and marketing services (0.3%) | | |
| Omnicom Group, Inc. | 416,500 | $17,767,890 |
|
| | | 17,767,890 |
| Aerospace and defense (3.7%) | | |
| Empresa Brasileira de Aeronautica SA (Embraer) ADR (Brazil) † S | 453,400 | 10,917,872 |
|
| Goodrich Corp. S | 328,400 | 24,360,712 |
|
| L-3 Communications Holdings, Inc. | 212,800 | 19,911,696 |
|
| Lockheed Martin Corp. S | 95,800 | 8,132,462 |
|
| Northrop Grumman Corp. | 276,600 | 18,761,778 |
|
| Precision Castparts Corp. S | 49,000 | 6,288,660 |
|
| Raytheon Co. S | 965,700 | 56,300,310 |
|
| United Technologies Corp. | 732,100 | 54,870,895 |
|
| | | 199,544,385 |
| Automotive (0.1%) | | |
| Hertz Global Holdings, Inc. † | 295,762 | 4,276,719 |
|
| | | 4,276,719 |
| Banking (11.2%) | | |
| Bank of America Corp. | 9,234,394 | 164,649,245 |
|
| Bank of New York Mellon Corp. (The) S | 1,834,600 | 57,111,098 |
|
| JPMorgan Chase & Co. | 3,312,082 | 141,028,452 |
|
| PNC Financial Services Group, Inc. S | 459,500 | 30,882,995 |
|
| State Street Corp. S | 1,200,800 | 52,234,800 |
|
| SunTrust Banks, Inc. S | 372,675 | 11,031,180 |
|
| U.S. Bancorp S | 1,029,300 | 27,554,361 |
|
| Wells Fargo & Co. S | 3,549,279 | 117,516,628 |
|
| | | 602,008,759 |
| Beverage (0.5%) | | |
| Coca-Cola Co. (The) S | 350,500 | 18,734,225 |
|
| Coca-Cola Enterprises, Inc. | 387,800 | 10,753,694 |
|
| | | 29,487,919 |
| Biotechnology (0.7%) | | |
| Amgen, Inc. † S | 406,000 | 23,288,160 |
|
| Genzyme Corp. † S | 287,400 | 15,301,176 |
|
| | | 38,589,336 |
| Broadcasting (0.9%) | | |
| CBS Corp. Class B S | 544,253 | 8,822,341 |
|
| DISH Network Corp. Class A | 1,691,800 | 37,473,370 |
|
| | | 46,295,711 |
| Building materials (0.3%) | | |
| Masco Corp. S | 494,800 | 8,030,604 |
|
| Owens Corning, Inc. † S | 163,400 | 5,683,052 |
|
| | | 13,713,656 |
| Cable television (2.7%) | | |
| Comcast Corp. Class A S | 3,122,600 | 61,640,124 |
|
| DIRECTV Class A † | 1,327,125 | 48,081,739 |
|
| Time Warner Cable, Inc. S | 612,880 | 34,474,500 |
|
| | | 144,196,363 |
| Chemicals (1.9%) | | |
| Dow Chemical Co. (The) S | 2,065,800 | 63,688,614 |
|
| E.I. du Pont de Nemours & Co. S | 1,012,800 | 40,349,952 |
|
| | | 104,038,566 |
17
| | |
| COMMON STOCKS (97.9%)* cont. | Shares | Value |
|
| Combined utilities (0.5%) | | |
| El Paso Corp. | 2,119,100 | $25,641,110 |
|
| | | 25,641,110 |
| Commercial and consumer services (0.3%) | | |
| Alliance Data Systems Corp. † S | 181,500 | 13,623,390 |
|
| | | 13,623,390 |
| Communications equipment (2.3%) | | |
| Cisco Systems, Inc. † S | 2,157,557 | 58,081,434 |
|
| Harris Corp. S | 290,700 | 14,965,236 |
|
| Motorola, Inc. † S | 4,366,400 | 30,870,448 |
|
| Qualcomm, Inc. | 586,600 | 22,724,884 |
|
| | | 126,642,002 |
| Computers (2.7%) | | |
| EMC Corp. † | 2,431,500 | 46,222,815 |
|
| Hewlett-Packard Co. | 1,024,300 | 53,232,871 |
|
| IBM Corp. S | 267,200 | 34,468,800 |
|
| Lexmark International, Inc. Class A † S | 347,700 | 12,882,285 |
|
| | | 146,806,771 |
| Conglomerates (2.8%) | | |
| 3M Co. | 134,445 | 11,921,238 |
|
| General Electric Co. | 4,811,320 | 90,741,495 |
|
| SPX Corp. S | 177,400 | 12,396,712 |
|
| Tyco International, Ltd. S | 958,142 | 37,166,328 |
|
| | | 152,225,773 |
| Consumer finance (0.5%) | | |
| American Express Co. S | 253,400 | 11,686,808 |
|
| Capital One Financial Corp. S | 313,900 | 13,626,399 |
|
| | | 25,313,207 |
| Consumer goods (1.6%) | | |
| Estee Lauder Cos., Inc. (The) Class A S | 226,311 | 14,918,421 |
|
| Kimberly-Clark Corp. | 269,800 | 16,527,948 |
|
| Newell Rubbermaid, Inc. S | 495,200 | 8,453,064 |
|
| Procter & Gamble Co. (The) | 713,900 | 44,376,024 |
|
| | | 84,275,457 |
| Consumer services (0.4%) | | |
| Avis Budget Group, Inc. † S | 1,371,800 | 20,741,616 |
|
| | | 20,741,616 |
| Electric utilities (3.8%) | | |
| Ameren Corp. S | 595,100 | 15,448,796 |
|
| American Electric Power Co., Inc. | 1,003,848 | 34,431,986 |
|
| CMS Energy Corp. | 509,500 | 8,284,470 |
|
| Edison International S | 948,800 | 32,610,256 |
|
| Entergy Corp. S | 288,115 | 23,420,868 |
|
| Exelon Corp. | 175,623 | 7,655,407 |
|
| Great Plains Energy, Inc. | 805,141 | 15,563,376 |
|
| NV Energy, Inc. S | 1,293,000 | 16,149,570 |
|
| PG&E Corp. S | 1,163,200 | 50,948,160 |
|
| | | 204,512,889 |
| Electrical equipment (0.8%) | | |
| Emerson Electric Co. S | 784,600 | 40,979,658 |
|
| | | 40,979,658 |
18
| | |
| COMMON STOCKS (97.9%)* cont. | Shares | Value |
|
| Electronics (1.3%) | | |
| Integrated Device Technology, Inc. † | 1,309,641 | $8,656,727 |
|
| Intersil Corp. Class A S | 527,900 | 7,855,152 |
|
| Micron Technology, Inc. † S | 1,280,200 | 11,969,870 |
|
| Texas Instruments, Inc. S | 1,518,300 | 39,490,983 |
|
| | | 67,972,732 |
| Energy (oil field) (2.4%) | | |
| Halliburton Co. S | 813,600 | 24,936,840 |
|
| National-Oilwell Varco, Inc. | 244,900 | 10,782,947 |
|
| Schlumberger, Ltd. S | 327,300 | 23,375,766 |
|
| Smith International, Inc. | 755,600 | 36,087,456 |
|
| Transocean, Ltd. (Switzerland) † | 287,900 | 20,858,355 |
|
| Weatherford International, Ltd. (Switzerland) † | 693,478 | 12,558,887 |
|
| | | 128,600,251 |
| Energy (other) (0.2%) | | |
| First Solar, Inc. † S | 84,700 | 12,158,685 |
|
| | | 12,158,685 |
| Engineering and construction (0.4%) | | |
| Fluor Corp. S | 410,100 | 21,669,684 |
|
| | | 21,669,684 |
| Environmental (0.4%) | | |
| Foster Wheeler AG (Switzerland) † S | 782,700 | 23,465,346 |
|
| | | 23,465,346 |
| Financial (0.3%) | | |
| AerCap Holdings NV (Netherlands) † | 636,900 | 8,789,220 |
|
| MGIC Investment Corp. † S | 620,590 | 6,472,754 |
|
| | | 15,261,974 |
| Food (1.3%) | | |
| Dean Foods Co. † S | 875,800 | 13,750,060 |
|
| General Mills, Inc. | 144,600 | 10,292,628 |
|
| Kellogg Co. S | 316,500 | 17,388,510 |
|
| Kraft Foods, Inc. Class A S | 1,051,362 | 31,120,315 |
|
| | | 72,551,513 |
| Health-care services (2.2%) | | |
| Aetna, Inc. | 1,095,600 | 32,374,980 |
|
| CIGNA Corp. | 588,600 | 18,870,516 |
|
| McKesson Corp. | 379,100 | 24,569,471 |
|
| Omnicare, Inc. S | 484,700 | 13,469,813 |
|
| WellPoint, Inc. † | 586,600 | 31,559,080 |
|
| | | 120,843,860 |
| Homebuilding (0.9%) | | |
| D.R. Horton, Inc. S | 892,800 | 13,115,232 |
|
| Pulte Group, Inc. † S | 1,433,007 | 18,758,062 |
|
| Toll Brothers, Inc. † S | 690,900 | 15,593,613 |
|
| | | 47,466,907 |
| Insurance (7.0%) | | |
| ACE, Ltd. S | 1,061,200 | 56,445,228 |
|
| Aflac, Inc. S | 938,100 | 47,805,576 |
|
| Allstate Corp. (The) | 642,800 | 21,000,276 |
|
| Assured Guaranty, Ltd. (Bermuda) | 993,080 | 21,400,874 |
|
| Chubb Corp. (The) | 440,675 | 23,298,487 |
|
| Everest Re Group, Ltd. S | 429,320 | 32,907,378 |
|
| Hartford Financial Services Group, Inc. (The) S | 881,700 | 25,190,169 |
|
19
| | |
| COMMON STOCKS (97.9%)* cont. | Shares | Value |
|
| Insurance cont. | | |
| Loews Corp. | 288,300 | $10,736,292 |
|
| Marsh & McLennan Cos., Inc. S | 851,100 | 20,613,642 |
|
| MetLife, Inc. S | 432,000 | 19,690,560 |
|
| Prudential Financial, Inc. | 231,000 | 14,682,360 |
|
| RenaissanceRe Holdings, Ltd. S | 203,800 | 11,402,610 |
|
| Travelers Cos., Inc. (The) | 1,113,500 | 56,498,990 |
|
| XL Capital, Ltd. Class A S | 981,300 | 17,467,140 |
|
| | | 379,139,582 |
| Investment banking/Brokerage (1.5%) | | |
| Goldman Sachs Group, Inc. (The) | 328,393 | 47,682,664 |
|
| Morgan Stanley S | 1,022,200 | 30,890,884 |
|
| | | 78,573,548 |
| Lodging/Tourism (0.7%) | | |
| Wyndham Worldwide Corp. S | 1,411,680 | 37,847,141 |
|
| | | 37,847,141 |
| Machinery (1.0%) | | |
| Bucyrus International, Inc. Class A | 211,300 | 13,314,013 |
|
| Deere (John) & Co. | 120,100 | 7,184,382 |
|
| Lonking Holdings, Ltd. (China) | 7,801,000 | 5,822,251 |
|
| Parker Hannifin Corp. S | 388,600 | 26,883,348 |
|
| | | 53,203,994 |
| Media (2.4%) | | |
| Time Warner, Inc. | 1,846,800 | 61,092,144 |
|
| Viacom, Inc. Class B † | 1,137,300 | 40,180,809 |
|
| Walt Disney Co. (The) S | 747,700 | 27,545,268 |
|
| | | 128,818,221 |
| Medical technology (2.9%) | | |
| Baxter International, Inc. | 813,400 | 38,408,748 |
|
| Boston Scientific Corp. † | 3,133,087 | 21,555,639 |
|
| Covidien PLC (Ireland) S | 540,067 | 25,917,815 |
|
| Hospira, Inc. † S | 283,200 | 15,233,328 |
|
| Medtronic, Inc. S | 895,000 | 39,102,550 |
|
| St. Jude Medical, Inc. † | 455,800 | 18,605,756 |
|
| | | 158,823,836 |
| Metals (1.8%) | | |
| Alcoa, Inc. S | 1,475,200 | 19,826,688 |
|
| Freeport-McMoRan Copper & Gold, Inc. Class B S | 266,500 | 20,128,745 |
|
| Newmont Mining Corp. S | 177,400 | 9,948,592 |
|
| Nucor Corp. S | 379,600 | 17,203,472 |
|
| Steel Dynamics, Inc. S | 1,123,500 | 17,650,185 |
|
| United States Steel Corp. S | 230,166 | 12,580,874 |
|
| | | 97,338,556 |
| Oil and gas (11.3%) | | |
| Anadarko Petroleum Corp. | 523,200 | 32,522,112 |
|
| BP PLC ADR (United Kingdom) | 142,000 | 7,405,300 |
|
| Chevron Corp. S | 2,070,800 | 168,645,952 |
|
| ConocoPhillips S | 465,600 | 27,558,864 |
|
| EOG Resources, Inc. S | 246,700 | 27,660,004 |
|
| Exxon Mobil Corp. S | 1,992,195 | 135,170,431 |
|
| Marathon Oil Corp. S | 444,600 | 14,293,890 |
|
20
| | |
| COMMON STOCKS (97.9%)* cont. | Shares | Value |
|
| Oil and gas cont. | | |
| Newfield Exploration Co. † S | 236,800 | $13,779,392 |
|
| Nexen, Inc. (Canada) S | 1,025,275 | 24,893,677 |
|
| Occidental Petroleum Corp. | 836,914 | 74,200,795 |
|
| Royal Dutch Shell PLC ADR (United Kingdom) S | 356,400 | 22,364,100 |
|
| Total SA ADR (France) | 412,700 | 22,442,626 |
|
| XTO Energy, Inc. | 845,200 | 40,163,904 |
|
| | | 611,101,047 |
| Pharmaceuticals (5.9%) | | |
| Abbott Laboratories | 1,083,100 | 55,411,396 |
|
| Johnson & Johnson | 676,400 | 43,492,520 |
|
| Merck & Co., Inc. | 1,871,291 | 65,570,037 |
|
| Pfizer, Inc. | 9,324,545 | 155,906,392 |
|
| | | 320,380,345 |
| Power producers (0.1%) | | |
| AES Corp. (The) † | 611,300 | 7,054,402 |
|
| | | 7,054,402 |
| Publishing (0.2%) | | |
| R. R. Donnelley & Sons Co. S | 630,000 | 13,538,700 |
|
| | | 13,538,700 |
| Real estate (0.1%) | | |
| Chimera Investment Corp. R | 1,395,400 | 5,679,278 |
|
| | | 5,679,278 |
| Regional Bells (3.2%) | | |
| AT&T, Inc. S | 3,981,200 | 103,750,072 |
|
| Verizon Communications, Inc. S | 2,313,759 | 66,844,498 |
|
| | | 170,594,570 |
| Restaurants (0.5%) | | |
| McDonald’s Corp. S | 401,700 | 28,356,003 |
|
| | | 28,356,003 |
| Retail (4.7%) | | |
| CVS Caremark Corp. | 1,484,200 | 54,811,506 |
|
| Home Depot, Inc. (The) S | 926,650 | 32,664,413 |
|
| Lowe’s Cos., Inc. | 943,900 | 25,598,568 |
|
| Macy’s, Inc. | 971,400 | 22,536,480 |
|
| Nordstrom, Inc. S | 383,400 | 15,845,922 |
|
| Staples, Inc. S | 667,400 | 15,703,922 |
|
| Target Corp. | 492,400 | 28,002,788 |
|
| TJX Cos., Inc. (The) S | 196,600 | 9,110,444 |
|
| Wal-Mart Stores, Inc. | 821,400 | 44,068,110 |
|
| Walgreen Co. S | 191,900 | 6,745,285 |
|
| | | 255,087,438 |
| Schools (0.6%) | | |
| Apollo Group, Inc. Class A † S | 529,400 | 30,392,854 |
|
| | | 30,392,854 |
| Semiconductor (1.8%) | | |
| ASM Holding NV (NY Reg Shares) (Netherlands) | 499,200 | 16,303,872 |
|
| Atmel Corp. † S | 3,908,600 | 21,262,784 |
|
| Formfactor, Inc. † S | 439,850 | 6,602,149 |
|
| KLA-Tencor Corp. S | 613,800 | 20,906,028 |
|
| Lam Research Corp. † S | 589,000 | 23,883,950 |
|
| Novellus Systems, Inc. † | 304,900 | 7,988,380 |
|
| | | 96,947,163 |
21
| | |
| COMMON STOCKS (97.9%)* cont. | Shares | Value |
|
| Shipping (0.1%) | | |
| Nordic American Tanker Shipping (Bermuda) S | 177,600 | $5,548,224 |
|
| | | 5,548,224 |
| Software (2.4%) | | |
| CA, Inc. S | 679,500 | 15,499,395 |
|
| Electronic Arts, Inc. † S | 939,200 | 18,192,304 |
|
| Longtop Financial Technologies Ltd. ADR (China) † S | 354,400 | 12,194,904 |
|
| Microsoft Corp. | 2,194,600 | 67,023,084 |
|
| Oracle Corp. S | 541,700 | 13,997,528 |
|
| | | 126,907,215 |
| Technology services (0.3%) | | |
| Yahoo!, Inc. † | 1,054,700 | 17,434,191 |
|
| | | 17,434,191 |
| Telecommunications (0.6%) | | |
| Sprint Nextel Corp. † | 4,178,900 | 17,760,325 |
|
| Vodafone Group PLC ADR (United Kingdom) | 742,700 | 16,487,940 |
|
| | | 34,248,265 |
| Textiles (0.3%) | | |
| Hanesbrands, Inc. † | 563,300 | 16,037,151 |
|
| | | 16,037,151 |
| Tobacco (1.0%) | | |
| Altria Group, Inc. S | 779,000 | 16,507,010 |
|
| Philip Morris International, Inc. | 778,600 | 38,213,684 |
|
| | | 54,720,694 |
| Waste Management (0.1%) | | |
| Waste Management, Inc. S | 230,700 | 8,000,676 |
|
| | | 8,000,676 |
| Total common stocks (cost $4,237,145,253) | | $5,286,445,223 |
| |
| |
| INVESTMENT COMPANIES (0.3%)* | Shares | Value |
|
| KKR Private Equity Investors LP (Unit) | 1,415,977 | $17,235,890 |
|
| Total investment companies (cost $9,291,675) | | $17,235,890 |
| |
| |
| CONVERTIBLE PREFERRED STOCKS (0.2%)* | Shares | Value |
|
| Freeport-McMoRan Copper & Gold, Inc. $6.75 cv. pfd. | 103,543 | $10,859,072 |
|
| Total convertible preferred stocks (cost $8,136,197) | | $10,859,072 |
| |
| |
| CONVERTIBLE BONDS AND NOTES (0.2%)* | Principal amount | Value |
|
| Ford Motor Co. cv. sr. unsec. notes 4 1/4s, 2016 | $6,695,000 | $10,408,047 |
|
| Total convertible bonds and notes (cost $6,695,000) | | $10,408,047 |
| |
| |
| SHORT-TERM INVESTMENTS (20.1%)* | Principal amount/shares | Value |
|
| Short-term investments held as collateral for loaned | | |
| securities with yields ranging from 0.16% to 0.28% and due | | |
| dates ranging from May 3, 2010 to June 21, 2010 d | $1,014,151,550 | $1,014,010,095 |
|
| Putnam Money Market Liquidity Fund e | 71,491,939 | 71,491,939 |
|
| Total short-term investments (cost $1,085,502,034) | | $1,085,502,034 |
| |
| |
| TOTAL INVESTMENTS | | |
|
| Total investments (cost $5,346,770,159) | | $6,410,450,266 |
22
Key to holding’s abbreviations
| |
| ADR | American Depository Receipts |
Notes to the fund’s portfolio
The Notes to the fund’s portfolio are for the reporting period ended April 30, 2010.
* Percentages indicated are based on net assets of $5,398,616,349.
† Non-income-producing security.
d See Note 1 to the financial statements regarding securities lending.
e See Note 5 to the financial statements regarding investments in Putnam Money Market Liquidity Fund.
R Real Estate Investment Trust.
S Securities on loan, in part or in entirety, at the close of the reporting period.
ADR after the name of a foreign holding represents ownership of foreign securities on deposit with a custodian bank.
The dates shown on debt obligations are the original maturity dates.
Accounting Standards Codification ASC 820 Fair Value Measurements and Disclosures (ASC 820) establishes a three-level hierarchy for disclosure of fair value measurements. The valuation hierarchy is based upon the transparency of inputs to the valuation of the fund’s investments. The three levels are defined as follows:
Level 1 — Valuations based on quoted prices for identical securities in active markets.
Level 2 — Valuations based on quoted prices in markets that are not active or for which all significant inputs are observable, either directly or indirectly.
Level 3 — Valuations based on inputs that are unobservable and significant to the fair value measurement.
The following is a summary of the inputs used to value the fund’s net assets as of the close of the reporting period:
| | | |
| | | Valuation inputs | |
|
| Investments in securities: | Level 1 | Level 2 | Level 3 |
|
| Common stocks: | | | |
|
| Basic materials | $201,377,122 | $— | $— |
|
| Capital goods | 341,041,492 | 5,822,251 | — |
|
| Communication services | 349,039,198 | — | — |
|
| Conglomerates | 152,225,773 | — | — |
|
| Consumer cyclicals | 532,916,133 | — | — |
|
| Consumer staples | 382,082,847 | — | — |
|
| Energy | 751,859,983 | — | — |
|
| Financials | 1,105,976,348 | — | — |
|
| Health care | 638,637,377 | — | — |
|
| Technology | 582,710,074 | — | — |
|
| Transportation | 5,548,224 | — | — |
|
| Utilities and power | 237,208,401 | — | — |
|
| Total common stocks | 5,280,622,972 | 5,822,251 | — |
| | | | |
| Convertible bonds and notes | — | 10,408,047 | — |
|
| Convertible preferred stocks | — | 10,859,072 | — |
|
| Investment Companies | — | 17,235,890 | — |
|
| Short-term investments | 71,491,939 | 1,014,010,095 | — |
|
| Totals by level | $5,352,114,911 | $1,058,335,355 | $— |
The accompanying notes are an integral part of these financial statements.
23
| |
| Statement of assets and liabilities 4/30/10 (Unaudited) | |
|
| |
| ASSETS | |
|
| Investment in securities, at value, including $979,875,112 of securities on loan (Note 1): | |
| Unaffiliated issuers (identified cost $5,275,278,220) | $6,338,958,327 |
| Affiliated issuers (identified cost $71,491,939) (Note 5) | 71,491,939 |
|
| Dividends, interest and other receivables | 5,812,264 |
|
| Receivable for shares of the fund sold | 769,947 |
|
| Receivable for investments sold | 160,568,100 |
|
| Total assets | 6,577,600,577 |
| |
| LIABILITIES | |
|
| Payable for investments purchased | 149,488,359 |
|
| Payable for shares of the fund repurchased | 8,478,920 |
|
| Payable for compensation of Manager (Note 2) | 2,176,270 |
|
| Payable for custodian fees (Note 2) | 15,255 |
|
| Payable for investor servicing fees (Note 2) | 1,356,432 |
|
| Payable for Trustee compensation and expenses (Note 2) | 1,514,167 |
|
| Payable for administrative services (Note 2) | 16,679 |
|
| Payable for distribution fees (Note 2) | 1,284,746 |
|
| Collateral on securities loaned, at value (Note 1) | 1,014,010,095 |
|
| Other accrued expenses | 643,305 |
|
| Total liabilities | 1,178,984,228 |
| |
| Net assets | $5,398,616,349 |
|
| REPRESENTED BY | |
|
| Paid-in capital (Unlimited shares authorized) (Notes 1 and 4) | $7,482,053,144 |
|
| Undistributed net investment income (Note 1) | 1,820,050 |
|
| Accumulated net realized loss on investments and foreign currency transactions (Note 1) | (3,148,936,952) |
|
| Net unrealized appreciation of investments | 1,063,680,107 |
|
| Total — Representing net assets applicable to capital shares outstanding | $5,398,616,349 |
| |
| |
| COMPUTATION OF NET ASSET VALUE AND OFFERING PRICE | |
|
| Net asset value and redemption price per class A share | |
| ($5,028,115,842 divided by 392,002,726 shares) | $12.83 |
|
| Offering price per class A share (100/94.25 of $12.83)* | $13.61 |
|
| Net asset value and offering price per class B share ($201,506,120 divided by 15,998,235 shares)** | $12.60 |
|
| Net asset value and offering price per class C share ($40,711,657 divided by 3,187,125 shares)** | $12.77 |
|
| Net asset value and redemption price per class M share ($41,857,067 divided by 3,290,142 shares) | $12.72 |
|
| Offering price per class M share (100/96.50 of $12.72)* | $13.18 |
|
| Net asset value, offering price and redemption price per class R share | |
| ($3,858,145 divided by 302,406 shares) | $12.76 |
|
| Net asset value, offering price and redemption price per class Y share | |
| ($82,567,518 divided by 6,422,863 shares) | $12.86 |
|
* On single retail sales of less than $50,000. On sales of $50,000 or more the offering price is reduced.
** Redemption price per share is equal to net asset value less any applicable contingent deferred sales charge.
The accompanying notes are an integral part of these financial statements.
24
| |
| Statement of operations Six months ended 4/30/10 (Unaudited) | |
| |
| |
| INVESTMENT INCOME | |
|
| Dividends (net of foreign tax of $150,468) | $55,621,699 |
|
| Interest (including interest income of $69,219 from investments in affiliated issuers) (Note 5) | 203,890 |
|
| Securities lending | 563,209 |
|
| Total investment income | 56,388,798 |
| |
| EXPENSES | |
|
| Compensation of Manager (Note 2) | 12,690,002 |
|
| Investor servicing fees (Note 2) | 9,836,562 |
|
| Custodian fees (Note 2) | 24,311 |
|
| Trustee compensation and expenses (Note 2) | 198,429 |
|
| Administrative services (Note 2) | 142,217 |
|
| Distribution fees — Class A (Note 2) | 6,086,342 |
|
| Distribution fees — Class B (Note 2) | 1,090,350 |
|
| Distribution fees — Class C (Note 2) | 196,886 |
|
| Distribution fees — Class M (Note 2) | 153,991 |
|
| Distribution fees — Class R (Note 2) | 9,424 |
|
| Other | 949,012 |
|
| Total expenses | 31,377,526 |
| | |
| Expense reduction (Note 2) | (285,133) |
|
| Net expenses | 31,092,393 |
| |
| Net investment income | 25,296,405 |
|
| Net realized gain on investments (Notes 1 and 3) | 254,720,201 |
|
| Net realized gain on foreign currency transactions (Note 1) | 243 |
|
| Net unrealized appreciation of investments during the period | 480,115,015 |
|
| Net gain on investments | 734,835,459 |
| |
| Net increase in net assets resulting from operations | $760,131,864 |
|
The accompanying notes are an integral part of these financial statements.
25
| | |
| Statement of changes in net assets | | |
|
| |
| INCREASE (DECREASE) IN NET ASSETS | Six months ended 4/30/10* | Year ended 10/31/09 |
|
| Operations: | | |
| Net investment income | $25,296,405 | $71,886,451 |
|
| Net realized gain (loss) on investments and | | |
| foreign currency transactions | 254,720,444 | (1,479,900,173) |
|
| Net unrealized appreciation of investments | 480,115,015 | 1,876,213,983 |
|
| Net increase in net assets resulting from operations | 760,131,864 | 468,200,261 |
|
| Distributions to shareholders (Note 1): | | |
| From ordinary income | | |
| Net investment income | | |
|
| Class A | (22,649,090) | (90,145,820) |
|
| Class B | (208,806) | (3,663,949) |
|
| Class C | (39,489) | (453,407) |
|
| Class M | (89,429) | (562,791) |
|
| Class R | (13,297) | (54,302) |
|
| Class Y | (476,244) | (5,391,607) |
|
| From return of capital | | |
| Class A | — | (323,833) |
|
| Class B | — | (13,162) |
|
| Class C | — | (1,629) |
|
| Class M | — | (2,022) |
|
| Class R | — | (195) |
|
| Class Y | — | (19,368) |
|
| Increase in capital from settlement payments | — | 36,043 |
|
| Redemption fees (Note 1) | 1,004 | 4,752 |
|
| Decrease from capital share transactions (Notes 4 and 7) | (356,039,536) | (1,154,002,468) |
|
| Total increase (decrease) in net assets | 380,616,977 | (786,393,497) |
| |
| NET ASSETS | | |
| Beginning of period | 5,017,999,372 | 5,804,392,869 |
|
| End of period (including undistributed net investment | | |
| income of $1,820,050 and $—, respectively) | $5,398,616,349 | $5,017,999,372 |
|
* Unaudited
The accompanying notes are an integral part of these financial statements.
26
|
| This page left blank intentionally. |
27
Financial highlights (For a common share outstanding throughout the period)
| | | | | | | | | | | | | | | | |
| INVESTMENT OPERATIONS: | | | | LESS DISTRIBUTIONS: | | | | | | | RATIOS AND SUPPLEMENTAL DATA: | |
|
| | | | | | | | | | | | | | | Ratio | Ratio of net | |
| | Net asset | | Net realized | | | | From | | | Non- | | | Net assets, | of expenses | investment | |
| | value, | Net | and unrealized | Total from | From net | From net | return | | | recurring | Net asset | Total return | end of | to average | income (loss) | Portfolio |
| | beginning | investment | gain (loss) on | investment | investment | realized gain | of | Total | Redemption | reim- | value, end | at net asset | period (in | net assets | to average | turnover |
| Period ended | of period | income (loss) a | investments | operations | income | on investments | capital | distributions | fees e | bursements | of period | value (%) b | thousands) | (%) c | net assets (%) | (%) |
|
| CLASS A | | | | | | | | | | | | | | | | |
| April 30, 2010 ** | $11.15 | .06 | 1.68 | 1.74 | (.06) | — | — | (.06) | — | — | $12.83 | 15.60 * | $5,028,116 | .57 * | .50 * | 22.68 * |
| October 31, 2009 | 10.09 | .15 | 1.11 h,i | 1.26 | (.20) | — | — e | (.20) | — | — e,j | 11.15 | 12.99 h,i | 4,631,517 | 1.21 d | 1.52 d | 57.42 |
| October 31, 2008 | 20.26 | .24 | (7.27) | (7.03) | (.31) | (2.83) | — | (3.14) | — | — | 10.09 | (40.22) | 4,754,294 | 1.00 d | 1.71 d | 34.50 |
| October 31, 2007 | 21.72 | .23 | 1.09 | 1.32 | (.20) | (2.58) | — | (2.78) | — | — | 20.26 | 6.47 | 10,937,114 | .92 d | 1.14 d | 57.06 |
| October 31, 2006 | 19.42 | .25 g | 2.69 | 2.94 | (.24) | (.40) | — | (.64) | — | — | 21.72 | 15.46 g | 11,854,129 | .87 d,g | 1.25 d,g | 76.75 |
| October 31, 2005 | 18.07 | .24 f | 1.38 | 1.62 | (.24) | (.03) | — | (.27) | — | — | 19.42 | 8.96 f | 11,616,127 | .89 d | 1.26 d,f | 52.80 |
|
| CLASS B | | | | | | | | | | | | | | | | |
| April 30, 2010 ** | $10.95 | .02 | 1.64 | 1.66 | (.01) | — | — | (.01) | — | — | $12.60 | 15.17 * | $201,506 | .95 * | .14 * | 22.68 * |
| October 31, 2009 | 9.91 | .08 | 1.09 h,i | 1.17 | (.13) | — | — e | (.13) | — | — e,j | 10.95 | 12.11 h,i | 226,198 | 1.96 d | .85 d | 57.42 |
| October 31, 2008 | 19.94 | .13 | (7.14) | (7.01) | (.19) | (2.83) | — | (3.02) | — | — | 9.91 | (40.68) | 319,813 | 1.75 d | .96 d | 34.50 |
| October 31, 2007 | 21.40 | .08 | 1.07 | 1.15 | (.03) | (2.58) | — | (2.61) | — | — | 19.94 | 5.68 | 1,020,630 | 1.67 d | .40 d | 57.06 |
| October 31, 2006 | 19.13 | .11 g | 2.63 | 2.74 | (.07) | (.40) | — | (.47) | — | — | 21.40 | 14.61 g | 1,624,208 | 1.62 d,g | .56 d,g | 76.75 |
| October 31, 2005 | 17.80 | .10 f | 1.35 | 1.45 | (.09) | (.03) | — | (.12) | — | — | 19.13 | 8.15 f | 2,427,671 | 1.64 d | .55 d,f | 52.80 |
|
| CLASS C | | | | | | | | | | | | | | | | |
| April 30, 2010 ** | $11.10 | .01 | 1.67 | 1.68 | (.01) | — | — | (.01) | — | — | $12.77 | 15.16 * | $40,712 | .95 * | .12 * | 22.68 * |
| October 31, 2009 | 10.05 | .07 | 1.11 h,i | 1.18 | (.13) | — | — e | (.13) | — | — e,j | 11.10 | 12.07 h,i | 37,309 | 1.96 d | .76 d | 57.42 |
| October 31, 2008 | 20.17 | .13 | (7.23) | (7.10) | (.19) | (2.83) | — | (3.02) | — | — | 10.05 | (40.64) | 36,166 | 1.75 d | .96 d | 34.50 |
| October 31, 2007 | 21.63 | .08 | 1.08 | 1.16 | (.04) | (2.58) | — | (2.62) | — | — | 20.17 | 5.66 | 85,618 | 1.67 d | .39 d | 57.06 |
| October 31, 2006 | 19.34 | .10 g | 2.67 | 2.77 | (.08) | (.40) | — | (.48) | — | — | 21.63 | 14.60 g | 94,553 | 1.62 d,g | .51 d,g | 76.75 |
| October 31, 2005 | 17.99 | .10 f | 1.37 | 1.47 | (.09) | (.03) | — | (.12) | — | — | 19.34 | 8.18 f | 97,924 | 1.64 d | .52 d,f | 52.80 |
|
| CLASS M | | | | | | | | | | | | | | | | |
| April 30, 2010 ** | $11.06 | .03 | 1.66 | 1.69 | (.03) | — | — | (.03) | — | — | $12.72 | 15.26 * | $41,857 | .82 * | .25 * | 22.68 * |
| October 31, 2009 | 10.01 | .10 | 1.10 h,i | 1.20 | (.15) | — | — e | (.15) | — | — e,j | 11.06 | 12.40 h,i | 39,681 | 1.71 d | 1.00 d | 57.42 |
| October 31, 2008 | 20.11 | .17 | (7.21) | (7.04) | (.23) | (2.83) | — | (3.06) | — | — | 10.01 | (40.50) | 36,633 | 1.50 d | 1.21 d | 34.50 |
| October 31, 2007 | 21.57 | .13 | 1.08 | 1.21 | (.09) | (2.58) | — | (2.67) | — | — | 20.11 | 5.95 | 92,307 | 1.42 d | .64 d | 57.06 |
| October 31, 2006 | 19.29 | .16 g | 2.65 | 2.81 | (.13) | (.40) | — | (.53) | — | — | 21.57 | 14.86 g | 108,911 | 1.37 d,g | .77 d,g | 76.75 |
| October 31, 2005 | 17.95 | .15 f | 1.36 | 1.51 | (.14) | (.03) | — | (.17) | — | — | 19.29 | 8.41 f | 123,425 | 1.39 d | .78 d,f | 52.80 |
|
| CLASS R | | | | | | | | | | | | | | | | |
| April 30, 2010 ** | $11.09 | .05 | 1.66 | 1.71 | (.04) | — | — | (.04) | — | — | $12.76 | 15.46 * | $3,858 | .70 * | .37 * | 22.68 * |
| October 31, 2009 | 10.04 | .12 | 1.11 h,i | 1.23 | (.18) | — | — e | (.18) | — | — e,j | 11.09 | 12.69 h,i | 3,579 | 1.46 d | 1.21 d | 57.42 |
| October 31, 2008 | 20.19 | .20 | (7.24) | (7.04) | (.28) | (2.83) | — | (3.11) | — | — | 10.04 | (40.38) | 2,905 | 1.25 d | 1.44 d | 34.50 |
| October 31, 2007 | 21.65 | .18 | 1.09 | 1.27 | (.15) | (2.58) | — | (2.73) | — | — | 20.19 | 6.23 | 1,717 | 1.17 d | .87 d | 57.06 |
| October 31, 2006 | 19.36 | .19 g | 2.69 | 2.88 | (.19) | (.40) | — | (.59) | — | — | 21.65 | 15.20 g | 1,278 | 1.12 d,g | .93 d,g | 76.75 |
| October 31, 2005 | 18.03 | .17 f | 1.40 | 1.57 | (.21) | (.03) | — | (.24) | — | — | 19.36 | 8.70 f | 729 | 1.14 d | .90 d,f | 52.80 |
|
| CLASS Y | | | | | | | | | | | | | | | | |
| April 30, 2010 ** | $11.17 | .08 | 1.68 | 1.76 | (.07) | — | — | (.07) | — | — | $12.86 | 15.80 * | $82,568 | .45 * | .62 * | 22.68 * |
| October 31, 2009 | 10.12 | .20 | 1.08 h,i | 1.28 | (.23) | — | — e | (.23) | — | — e,j | 11.17 | 13.15 h,i | 79,716 | .96 d | 2.37 d | 57.42 |
| October 31, 2008 | 20.31 | .27 | (7.28) | (7.01) | (.35) | (2.83) | — | (3.18) | — | — | 10.12 | (40.06) | 654,582 | .75 d | 1.96 d | 34.50 |
| October 31, 2007 | 21.76 | .29 | 1.09 | 1.38 | (.25) | (2.58) | — | (2.83) | — | — | 20.31 | 6.78 | 1,185,123 | .67 d | 1.39 d | 57.06 |
| October 31, 2006 | 19.46 | .31 g | 2.68 | 2.99 | (.29) | (.40) | — | (.69) | — | — | 21.76 | 15.72 g | 1,318,906 | .62 d,g | 1.51 d,g | 76.75 |
| October 31, 2005 | 18.10 | .30 f | 1.38 | 1.68 | (.29) | (.03) | — | (.32) | — | — | 19.46 | 9.28 f | 1,323,254 | .64 d | 1.54 d,f | 52.80 |
|
See notes to financial highlights at the end of this section.
The accompanying notes are an integral part of these financial statements.
Financial highlights (Continued)
* Not annualized.
** Unaudited.
a Per share net investment income (loss) has been determined on the basis of the weighted average number of shares outstanding during the period.
b Total return assumes dividend reinvestment and does not reflect the effect of sales charges.
c Includes amounts paid through expense offset and brokerage/service arrangements (Note 2).
d Reflects an involuntary contractual expense limitation in effect during the period. For periods prior to October 31, 2009, certain fund expenses were waived in connection with investments in Putnam Prime Money Market Fund. As a result of such limitation and/or waivers, the expenses of each class reflect a reduction of the following amounts (Note 2):
| |
| | Percentage of |
| | average net assets |
|
| October 31, 2009 | 0.02% |
|
| October 31, 2008 | < 0.01 |
|
| October 31, 2007 | < 0.01 |
|
| October 31, 2006 | < 0.01 |
|
| October 31, 2005 | < 0.01 |
|
e Amount represents less than $0.01 per share.
f Reflects a non-recurring accrual related to Putnam Management’s settlement with the SEC regarding brokerage allocation practices, which amounted to $0.01 per share and 0.03% of average net assets.
g Reflects a non-recurring reimbursement from Putnam Investments relating to the calculation of certain amounts paid by the fund to Putnam in previous years for transfer agent services, which amounted to $0.01 per share and 0.03% of average net assets for the period ended October 31, 2006.
h Reflects a non-recurring litigation payment received by the fund from Enron Corporation which amounted to $0.05 per share outstanding on December 29, 2008. This payment resulted in an increase to total returns of 0.51% for the year ended October 31, 2009.
i Reflects a non-recurring litigation payment received by the fund from Tyco International, Ltd. which amounted to $0.07 per share outstanding on March 13, 2009. This payment resulted in an increase to total returns of 0.71% for the year ended October 31, 2009.
j Reflects a non-recurring reimbursement pursuant to a settlement between the SEC and Bear Stearns & Co., Inc. and Bear Stearns Securities Corp., which amounted to less than $0.01 per share outstanding as of May 21, 2009.
The accompanying notes are an integral part of these financial statements.
30
Notes to financial statements 4/30/10 (Unaudited)
Note 1: Significant accounting policies
The Putnam Fund for Growth and Income (the fund) is a Massachusetts business trust, which is registered under the Investment Company Act of 1940, as amended, as a diversified, open-end management investment company. The fund seeks capital growth and current income by investing primarily in a portfolio of common stocks that offer the potential for capital growth, current income or both.
The fund offers class A, class B, class C, class M, class R and class Y shares. Class A and class M shares are sold with a maximum front-end sales charge of 5.75% and 3.50%, respectively, and generally do not pay a contingent deferred sales charge. Class B shares, which convert to class A shares after approximately eight years, do not pay a front-end sales charge and are subject to a contingent deferred sales charge, if those shares are redeemed within six years of purchase. Class C shares have a one-year 1.00% contingent deferred sales charge and do not convert to class A shares. Class R shares, which are offered to qualified employee-benefit plans, are sold at net asset value. The expenses for class A, class B, class C, class M and class R shares may differ based on the distribution fee of each class, which is identified in Note 2. Class Y shares, which are sold at net asset value, are generally subject to the same expenses as class A, class B, class C, class M and class R shares, but do not bear a distribution fee. Class Y shares are generally only available to corporate and institutional clients and clients in other approved programs.
A 1.00% redemption fee may apply on any shares that are redeemed (either by selling or exchanging into another fund) within 7 days of purchase. The redemption fee is accounted for as an addition to paid-in-capital.
Investment income, realized and unrealized gains and losses and expenses of the fund are borne pro-rata based on the relative net assets of each class to the total net assets of the fund, except that each class bears expenses unique to that class (including the distribution fees applicable to such classes). Each class votes as a class only with respect to its own distribution plan or other matters on which a class vote is required by law or determined by the Trustees. If the fund were liquidated, shares of each class would receive their pro-rata share of the net assets of the fund. In addition, the Trustees declare separate dividends on each class of shares.
In the normal course of business, the fund enters into contracts that may include agreements to indemnify another party under given circumstances. The fund’s maximum exposure under these arrangements is unknown as this would involve future claims that may be, but have not yet been, made against the fund. However, the fund’s management team expects the risk of material loss to be remote.
The following is a summary of significant accounting policies consistently followed by the fund in the preparation of its financial statements. The preparation of financial statements is in conformity with accounting principles generally accepted in the United States of America and requires management to make estimates and assumptions that affect the reported amounts of assets and liabilities in the financial statements and the reported amounts of increases and decreases in net assets from operations during the period from November 1, 2009 through April 30, 2010 (the reporting period). Actual results could differ from those estimates. Subsequent events after the Statement of assets and liabilities date through the date that the financial statements were issued, June 10, 2010, have been evaluated in the preparation of the financial statements.
A) Security valuation Investments for which market quotations are readily available are valued at the last reported sales price on their principal exchange, or official closing price for certain markets. If no sales are reported — as in the case of some securities traded over-the-counter — a security is valued at its last reported bid price. Market quotations are not considered to be readily available for certain debt obligations; such investments are valued on the basis of valuations furnished by an independent pricing service approved by the Trustees or dealers selected by Putnam Investment Management, LLC (Putnam Management), the fund’s manager, an indirect wholly-owned subsidiary of Putnam Investments, LLC. Such services or dealers determine valuations for normal institutional-size trading units of such securities using methods based on market transactions for comparable securities and vario us relationships, generally recognized by institutional traders, between securities (which considers such factors as security prices, yields, maturities and ratings). Many securities markets and exchanges outside the U.S. close prior to the close of the New York Stock Exchange and therefore the closing prices for securities in such markets or on such exchanges may not fully reflect events that occur after such close but before the close of the New York Stock Exchange. Accordingly, on certain days, the fund will fair value foreign equity securities taking into account multiple factors, including movements in the U.S. securities markets. The number of days on which fair value prices will be used will depend on market activity and it is possible that fair value prices will be used by the fund to a significant extent. At the close of the reporting period, fair value pricing was used for certain foreign securities in
31
the portfolio. Securities quoted in foreign currencies, if any, are translated into U.S. dollars at the current exchange rate. To the extent a pricing service or dealer is unable to value a security or provides a valuation that Putnam Management does not believe accurately reflects the security’s fair value, the security will be valued at fair value by Putnam Management. Certain investments, including certain restricted and illiquid securities and derivatives, are also valued at fair value following procedures approved by the Trustees. Such valuations and procedures are reviewed periodically by the Trustees. The fair value of securities is generally determined as the amount that the fund could reasonably expect to realize from an orderly disposition of such securities over a reasonable period of time. By its nature, a fair value price is a good faith estimate of the value of a security in a current sale and does not reflect an actual market price, which may be different by a material amount.
B) Joint trading account Pursuant to an exemptive order from the Securities and Exchange Commission (the SEC), the fund may transfer uninvested cash balances, including cash collateral received under security lending arrangements, into a joint trading account along with the cash of other registered investment companies and certain other accounts managed by Putnam Management. These balances may be invested in issues of short-term investments having maturities of up to 397 days for collateral received under security lending arrangements and up to 90 days for other cash investments.
C) Security transactions and related investment income Security transactions are recorded on the trade date (the date the order to buy or sell is executed). Gains or losses on securities sold are determined on the identified cost basis.
Interest income is recorded on the accrual basis. Dividend income, net of applicable withholding taxes, is recognized on the ex-dividend date except that certain dividends from foreign securities, if any, are recognized as soon as the fund is informed of the ex-dividend date. Non-cash dividends, if any, are recorded at the fair market value of the securities received. Dividends representing a return of capital or capital gains, if any, are reflected as a reduction of cost and/or as a realized gain.
D) Foreign currency translation The accounting records of the fund are maintained in U.S. dollars. The market value of foreign securities, currency holdings, and other assets and liabilities is recorded in the books and records of the fund after translation to U.S. dollars based on the exchange rates on that day. The cost of each security is determined using historical exchange rates. Income and withholding taxes are translated at prevailing exchange rates when earned or incurred. The fund does not isolate that portion of realized or unrealized gains or losses resulting from changes in the foreign exchange rate on investments from fluctuations arising from changes in the market prices of the securities. Such gains and losses are included with the net realized and unrealized gain or loss on investments. Net realized gains and losses on foreign currency transactions represent net realized exchange gains or losse s on closed forward currency contracts, disposition of foreign currencies, currency gains and losses realized between the trade and settlement dates on securities transactions and the difference between the amount of investment income and foreign withholding taxes recorded on the fund’s books and the U.S. dollar equivalent amounts actually received or paid. Net unrealized appreciation and depreciation of assets and liabilities in foreign currencies arise from changes in the value of open forward currency contracts and assets and liabilities other than investments at the period end, resulting from changes in the exchange rate. Investments in foreign securities involve certain risks, including those related to economic instability, unfavorable political developments, and currency fluctuations, not present with domestic investments.
E) Securities lending The fund may lend securities, through its agents, to qualified borrowers in order to earn additional income. The loans are collateralized by cash and/or securities in an amount at least equal to the market value of the securities loaned. The market value of securities loaned is determined daily and any additional required collateral is allocated to the fund on the next business day. The risk of borrower default will be borne by the fund’s agents; the fund will bear the risk of loss with respect to the investment of the cash collateral. Income from securities lending is included in investment income on the Statement of operations. At the close of the reporting period, the value of securities loaned amounted to $985,239,212. Certain of these securities were sold prior to the close of the reporting period and are included in the Receivable for securities sold on the Statement of assets and liabilities. The fund received cash collateral of $1,014,010,095 which is pooled with collateral of other Putnam funds into 44 issues of short-term investments.
F) Federal taxes It is the policy of the fund to distribute all of its taxable income within the prescribed time and otherwise comply with the provisions of the Internal Revenue Code of 1986, as amended (the Code), applicable to regulated investment companies. It is also the intention of the fund to distribute an amount sufficient to avoid imposition of any excise tax under Section 4982 of the Code. The fund is subject to the provisions of Accounting Standards Codification ASC 740 Income Taxes (ASC 740). ASC 740 sets forth a minimum threshold for financial statement recognition of the benefit of a tax position taken or expected to be taken in a tax return. The fund did
32
not have any unrecognized tax benefits in the accompanying financial statements. No provision has been made for federal taxes on income, capital gains or unrealized appreciation on securities held nor for excise tax on income and capital gains. Each of the fund’s federal tax returns for the prior three fiscal years remains subject to examination by the Internal Revenue Service and state departments of revenue.
At October 31, 2009, the fund had a capital loss carryover of $3,244,395,156 available to the extent allowed by the Code to offset future net capital gain, if any. This amount includes $125,896,419 of capital loss carryover acquired in connection with the acquisition of Putnam Classic Equity Fund, but does not include $80,274,993 of additional capital loss carryover acquired in connection with the acquisition, which the fund will be unable to use due to limitations imposed by the Code. The amounts of the combined carryovers and the expiration dates are:
| |
| Loss Carryover | Expiration |
|
| $97,434,236 | October 31, 2015 |
|
| 1,682,349,172 | October 31, 2016 |
|
| 1,464,611,748 | October 31, 2017 |
|
The aggregate identified cost on a tax basis is $5,506,032,399, resulting in gross unrealized appreciation and depreciation of $1,068,547,340 and $164,129,473, respectively, or net unrealized appreciation of $904,417,867.
G) Distributions to shareholders Distributions to shareholders from net investment income are recorded by the fund on the ex-dividend date. Distributions from capital gains, if any, are recorded on the ex-dividend date and paid at least annually. The amount and character of income and gains to be distributed are determined in accordance with income tax regulations, which may differ from generally accepted accounting principles. Dividend sources are estimated at the time of declaration. Actual results may vary. Any non-taxable return of capital cannot be determined until final tax calculations are completed after the end of the fund’s fiscal year. Reclassifications are made to the fund’s capital accounts to reflect income and gains available for distribution (or available capital loss carryovers) under income tax regulations.
Note 2: Management fee, administrative services and other transactions
Effective January 1, 2010, the fund pays Putnam Management a management fee (based on the fund’s average net assets and computed and paid monthly) at annual rates that may vary based on the average of the aggregate net assets of most open-end funds, as defined in the fund’s management contract, sponsored by Putnam Management. Such annual rates may vary as follows: 0.63% of the first $5 billion, 0.58% of the next $5 billion, 0.53% of the next $10 billion, 0.48% of the next $10 billion, 0.43% of the next $50 billion, 0.41% of the next $50 billion, 0.40% of the next $100 billion, and 0.395% of any excess thereafter.
Prior to January 1, 2010, the fund paid Putnam Management for management and investment advisory services quarterly based on the average net assets of the fund. Such fee was based on the following annual rates: 0.65% of the first $500 million of average net assets, 0.55% of the next $500 million, 0.50% of the next $500 million, 0.45% of the next $5 billion, 0.425% of the next $5 billion, 0.405% of the next $5 billion, 0.39% of the next $5 billion, 0.38% of the next $5 billion, 0.37% of the next $5 billion, 0.36% of the next $5 billion, 0.35% of the next $5 billion, 0.34% of the next $5 billion, 0.33% of the next $8.5 billion and 0.32% thereafter.
Effective August 1, 2009 through July 31, 2010, Putnam Management has contractually agreed to reimburse the fund’s expenses to the extent necessary to limit the cumulative expenses of the fund, exclusive of brokerage, interest, taxes, investment-related expenses, extraordinary expenses and payments under the fund’s investor servicing contract, investment management contract and distribution plans, on a fiscal year-to-date basis (or from August 1, 2009 through the fund’s next fiscal year end, as applicable), to an annual rate of 0.20% of the fund’s average net assets over such fiscal year-to-date period (or since August 1, 2009, as applicable). During the reporting period, the fund’s expenses were not reduced as a result of this limit.
Effective February 28, 2010, Putnam Investments Limited (PIL), an affiliate of Putnam Management, is authorized by the Trustees to manage a separate portion of the assets of the fund as determined by Putnam Management from time to time. Putnam Management pays a quarterly sub-management fee to PIL for its services at an annual rate of 0.35% of the average net assets of the portion of the fund managed by PIL.
The fund reimburses Putnam Management an allocated amount for the compensation and related expenses of certain officers of the fund and their staff who provide administrative services to the fund. The aggregate amount of all such reimbursements is determined annually by the Trustees.
33
Custodial functions for the fund’s assets are provided by State Street Bank and Trust Company (State Street). Custody fees are based on the fund’s asset level, the number of its security holdings and transaction volumes.
Putnam Investor Services, Inc., an affiliate of Putnam Management, provided investor servicing agent functions to the fund. Putnam Investor Services, Inc. received fees for investor servicing, subject to certain limitations, based on the fund’s retail asset level, the number of shareholder accounts in the fund and the level of defined contribution plan assets in the fund. The amounts incurred for investor servicing agent functions during the reporting period are included in Investor servicing fees in the Statement of operations.
The fund has entered into expense offset arrangements with Putnam Investor Services, Inc. and State Street whereby Putnam Investor Services, Inc.’s and State Street’s fees are reduced by credits allowed on cash balances. The fund also reduced expenses through brokerage/service arrangements. For the reporting period, the fund’s expenses were reduced by $6,623 under the expense offset arrangements and by $278,510 under the brokerage/ service arrangements.
Each independent Trustee of the fund receives an annual Trustee fee, of which $3,798, as a quarterly retainer, has been allocated to the fund, and an additional fee for each Trustees meeting attended. Trustees receive additional fees for attendance at certain committee meetings and industry seminars and for certain compliance-related matters. Trustees also are reimbursed for expenses they incur relating to their services as Trustees.
The fund has adopted a Trustee Fee Deferral Plan (the Deferral Plan) which allows the Trustees to defer the receipt of all or a portion of Trustees fees payable on or after July 1, 1995. The deferred fees remain invested in certain Putnam funds until distribution in accordance with the Deferral Plan.
The fund has adopted an unfunded noncontributory defined benefit pension plan (the Pension Plan) covering all Trustees of the fund who have served as a Trustee for at least five years and were first elected prior to 2004. Benefits under the Pension Plan are equal to 50% of the Trustee’s average annual attendance and retainer fees for the three years ended December 31, 2005. The retirement benefit is payable during a Trustee’s lifetime, beginning the year following retirement, for the number of years of service through December 31, 2006. Pension expense for the fund is included in Trustee compensation and expenses in the Statement of operations. Accrued pension liability is included in Payable for Trustee compensation and expenses in the Statement of assets and liabilities. The Trustees have terminated the Pension Plan with respect to any Trustee first elected after 2003.
The fund has adopted distribution plans (the Plans) with respect to its class A, class B, class C, class M and class R shares pursuant to Rule 12b-1 under the Investment Company Act of 1940. The purpose of the Plans is to compensate Putnam Retail Management Limited Partnership, a wholly-owned subsidiary of Putnam Investments, LLC and Putnam Retail Management GP, Inc., for services provided and expenses incurred in distributing shares of the fund. The Plans provide for payments by the fund to Putnam Retail Management Limited Partnership at an annual rate of up to 0.35%, 1.00%, 1.00%, 1.00% and 1.00% of the average net assets attributable to class A, class B, class C, class M and class R shares, respectively. The Trustees have approved payment by the fund at an annual rate of 0.25%, 1.00%, 1.00%, 0.75% and 0.50% of the average net assets attributable to class A, class B, class C, class M and class R shares, respectively.
For the reporting period, Putnam Retail Management Limited Partnership, acting as underwriter, received net commissions of $113,737 and $967 from the sale of class A and class M shares, respectively, and received $76,697 and $54 in contingent deferred sales charges from redemptions of class B and class C shares, respectively. A deferred sales charge of up to 1.00% and 0.65% is assessed on certain redemptions of class A and class M shares, respectively. For the reporting period, Putnam Retail Management Limited Partnership, acting as underwriter, received $14 and no monies on class A and class M redemptions, respectively.
Note 3: Purchases and sales of securities
During the reporting period, cost of purchases and proceeds from sales of investment securities other than short-term investments aggregated $1,166,525,480 and $1,471,857,620, respectively. There were no purchases or sales of U.S. government securities.
Note 4: Capital shares
At the close of the reporting period, there was an unlimited number of shares of beneficial interest authorized. Transactions in capital shares were as follows:
34
| | | | |
| | Six months ended 4/30/10 | Year ended 10/31/09 |
|
| Class A | Shares | Amount | Shares | Amount |
|
| Shares sold | 7,724,918 | $94,362,364 | 20,488,512 | $197,581,735 |
|
| Shares issued in connection with | | | | |
| reinvestment of distributions | 1,712,926 | 20,719,848 | 9,156,295 | 82,754,518 |
|
| Shares issued in connection with the | | | | |
| merger of Putnam Classic Equity Fund | — | — | 25,535,070 | 229,631,796 |
|
| | 9,437,844 | 115,082,212 | 55,179,877 | 509,968,049 |
|
| Shares repurchased | (32,959,235) | (400,671,107) | (110,690,078) | (1,023,585,684) |
|
| Net decrease | (23,521,391) | $(285,588,895) | (55,510,201) | $(513,617,635) |
|
| |
| | Six months ended 4/30/10 | Year ended 10/31/09 |
|
| Class B | Shares | Amount | Shares | Amount |
|
| Shares sold | 575,549 | $6,906,415 | 1,518,592 | $14,076,664 |
|
| Shares issued in connection with | | | | |
| reinvestment of distributions | 17,068 | 202,470 | 408,005 | 3,551,105 |
|
| Shares issued in connection with the | | | | |
| merger of Putnam Classic Equity Fund | — | — | 1,966,764 | 17,387,567 |
|
| | 592,617 | 7,108,885 | 3,893,361 | 35,015,336 |
|
| Shares repurchased | (5,260,473) | (63,223,438) | (15,489,381) | (141,563,304) |
|
| Net decrease | (4,667,856) | $(56,114,553) | (11,596,020) | $(106,547,968) |
|
| |
| | Six months ended 4/30/10 | Year ended 10/31/09 |
|
| Class C | Shares | Amount | Shares | Amount |
|
| Shares sold | 177,702 | $2,142,966 | 278,158 | $2,635,288 |
|
| Shares issued in connection with | | | | |
| reinvestment of distributions | 2,957 | 35,704 | 46,586 | 410,829 |
|
| Shares issued in connection with the | | | | |
| merger of Putnam Classic Equity Fund | — | — | 529,146 | 4,743,684 |
|
| | 180,659 | 2,178,670 | 853,890 | 7,789,801 |
|
| Shares repurchased | (354,287) | (4,284,570) | (1,091,398) | (10,084,834) |
|
| Net decrease | (173,628) | $(2,105,900) | (237,508) | $(2,295,033) |
|
| |
| | Six months ended 4/30/10 | Year ended 10/31/09 |
|
| Class M | Shares | Amount | Shares | Amount |
|
| Shares sold | 59,798 | $724,547 | 182,008 | $1,697,179 |
|
| Shares issued in connection with | | | | |
| reinvestment of distributions | 7,039 | 84,583 | 60,545 | 536,233 |
|
| Shares issued in connection with the | | | | |
| merger of Putnam Classic Equity Fund | — | — | 1,038,002 | 9,264,376 |
|
| | 66,837 | 809,130 | 1,280,555 | 11,497,788 |
|
| Shares repurchased | (365,859) | (4,394,529) | (1,350,902) | (12,245,496) |
|
| Net decrease | (299,022) | $(3,585,399) | (70,347) | $(747,708) |
|
35
| | | | |
| | Six months ended 4/30/10 | Year ended 10/31/09 |
|
| Class R | Shares | Amount | Shares | Amount |
|
| Shares sold | 37,253 | $448,543 | 91,765 | $844,353 |
|
| Shares issued in connection with | | | | |
| reinvestment of distributions | 1,105 | 13,297 | 6,058 | 54,470 |
|
| Shares issued in connection with the | | | | |
| merger of Putnam Classic Equity Fund | — | — | 1,890 | 16,913 |
|
| | 38,358 | 461,840 | 99,713 | 915,736 |
|
| Shares repurchased | (58,745) | (709,173) | (66,175) | (623,011) |
|
| Net increase (decrease) | (20,387) | $(247,333) | 33,538 | $292,725 |
|
| |
| | Six months ended 4/30/10 | Year ended 10/31/09 |
|
| Class Y | Shares | Amount | Shares | Amount |
|
| Shares sold | 529,349 | $6,483,940 | 4,597,378 | $42,251,173 |
|
| Shares issued in connection with | | | | |
| reinvestment of distributions | 38,479 | 466,072 | 603,015 | 5,405,640 |
|
| Shares issued in connection with the | | | | |
| merger of Putnam Classic Equity Fund | — | — | 276,772 | 2,494,381 |
|
| | 567,828 | 6,950,012 | 5,477,165 | 50,151,194 |
|
| Shares repurchased | (1,281,436) | (15,347,468) | (63,027,570) | (581,238,043) |
|
| Net decrease | (713,608) | $(8,397,456) | (57,550,405) | $(531,086,849) |
|
Note 5: Investment in Putnam Money Market Liquidity Fund
The fund invested in Putnam Money Market Liquidity Fund, an open-end management investment company managed by Putnam Management. Investments in Putnam Money Market Liquidity Fund are valued at its closing net asset value each business day. Income distributions earned by the fund are recorded as interest income in the Statement of operations and totaled $69,219 for the reporting period. During the reporting period, cost of purchases and proceeds of sales of investments in Putnam Money Market Liquidity Fund aggregated $471,335,081 and $486,048,817, respectively. Management fees charged to Putnam Money Market Liquidity Fund have been waived by Putnam Management.
Note 6: Regulatory matters and litigation
In late 2003 and 2004, Putnam Management settled charges brought by the SEC and the Massachusetts Securities Division in connection with excessive short-term trading in Putnam funds. Distribution of payments from Putnam Management to certain open-end Putnam funds and their shareholders is expected to be completed in the next several months. These allegations and related matters have served as the general basis for certain lawsuits, including purported class action lawsuits against Putnam Management and, in a limited number of cases, some Putnam funds. Putnam Management believes that these lawsuits will have no material adverse effect on the funds or on Putnam Management’s ability to provide investment management services. In addition, Putnam Management has agreed to bear any costs incurred by the Putnam funds as a result of these matters.
Note 7: Acquisition of Putnam Classic Equity Fund
On December 26, 2008, the fund issued 25,535,070, 1,966,764, 529,146, 1,038,002, 1,890, and 276,772 class A, class B, class C, class M, class R and class Y shares, respectively, for 28,354,626, 2,136,827, 582,583, 1,143,728, 2,091, and 308,535 class A, class B, class C, class M, class R and class Y shares respectively, of Putnam Classic Equity Fund to acquire that fund’s net assets in a tax-free exchange approved by the Trustees. The net assets of the fund and Putnam Classic Equity Fund on December 26, 2008, were $4,646,795,617 and $263,538,717, respectively. On December 26, 2008, Putnam Classic Equity Fund had distributions in excess of net investment income of $175,407, accumulated net realized loss of $158,000,178 and unrealized depreciation of $69,873,107. The aggregate net assets of the fund immediately following the acquisition were $4,910,334,334.
36
Information presented in the Statement of operations and changes in net assets reflect only the operations of the Putnam Fund for Growth and Income.
The Putnam Classic Equity Fund’s November 30, 2008 shareholder report is available upon request.
Note 8: Market and credit risk
In the normal course of business, the fund trades financial instruments and enters into financial transactions where risk of potential loss exists due to changes in the market (market risk) or failure of the contracting party to the transaction to perform (credit risk). The fund may be exposed to additional credit risk that an institution or other entity with which the fund has unsettled or open transactions will default.
37
Shareholder meeting results (Unaudited)
November 19, 2009 meeting
| | |
| At the meeting, each of the nominees for Trustees was elected, as follows: | |
| | Votes for | Votes withheld |
|
| Ravi Akhoury | 358,281,066 | 15,347,069 |
|
| Jameson A. Baxter | 358,744,364 | 14,883,771 |
|
| Charles B. Curtis | 358,319,641 | 15,308,494 |
|
| Robert J. Darretta | 358,636,964 | 14,991,171 |
|
| Myra R. Drucker | 358,596,906 | 15,031,229 |
|
| John A. Hill | 358,361,384 | 15,266,751 |
|
| Paul L. Joskow | 358,720,944 | 14,907,191 |
|
| Elizabeth T. Kennan | 358,122,160 | 15,505,975 |
|
| Kenneth R. Leibler | 358,535,013 | 15,093,122 |
|
| Robert E. Patterson | 358,514,172 | 15,113,963 |
|
| George Putnam, III | 358,355,274 | 15,272,861 |
|
| Robert L. Reynolds | 358,857,679 | 14,770,456 |
|
| W. Thomas Stephens | 358,681,569 | 14,946,566 |
|
| Richard B. Worley | 358,736,322 | 14,891,813 |
|
A proposal to approve a new management contract between the fund and Putnam Management was approved as follows:
| | | |
| Votes for | Votes against | Abstentions | Broker non-votes |
|
| 240,006,077 | 10,137,066 | 10,441,744 | 113,043,248 |
|
A proposal to amend the fund’s agreement and declaration of trust with respect to duration of the trust was approved as follows:
| | | |
| Votes for | Votes against | Abstentions | Broker non-votes |
|
| 240,840,665 | 9,039,957 | 10,704,265 | 113,043,248 |
|
A proposal to amend the fund’s agreement and declaration of trust with respect to redemption at the option of the trust was approved as follows:
| | | |
| Votes for | Votes against | Abstentions | Broker non-votes |
|
| 237,845,552 | 11,424,853 | 11,314,482 | 113,043,248 |
|
All tabulations are rounded to the nearest whole number.
38
Services for shareholders
Investor services
Systematic investment plan Tell us how much you wish to invest regularly — weekly, semimonthly, or monthly — and the amount you choose will be transferred automatically from your checking or savings account. There’s no additional fee for this service, and you can suspend it at any time. This plan may be a great way to save for college expenses or to plan for your retirement.
Please note that regular investing does not guarantee a profit or protect against loss in a declining market. Before arranging a systematic investment plan, consider your financial ability to continue making purchases in periods when prices are low.
Systematic exchange You can make regular transfers from one Putnam fund to another Putnam fund. There are no additional fees for this service, and you can cancel or change your options at any time.
Dividends PLUS You can choose to have the dividend distributions from one of your Putnam funds automatically reinvested in another Putnam fund at no additional charge.
Free exchange privilege You can exchange money between Putnam funds free of charge, as long as they are the same class of shares. A signature guarantee is required if you are exchanging more than $500,000.
Reinstatement privilege If you’ve sold Putnam shares or received a check for a dividend or capital gain, you may reinvest the proceeds with Putnam within 90 days of the transaction and they will be reinvested at the fund’s current net asset value — with no sales charge. However, reinstatement of class B shares may have special tax consequences. Ask your financial or tax representative for details.
Check-writing service You have ready access to many Putnam accounts. It’s as simple as writing a check, and there are no special fees or service charges. For more information about the check-writing service, call Putnam or visit our Web site.
Dollar cost averaging When you’re investing for long-term goals, it’s time, not timing, that counts. Investing on a systematic basis is a better strategy than trying to figure out when the markets will go up or down. This means investing the same amount of money regularly over a long period. This method of investing is called dollar cost averaging. When a fund’s share price declines, your investment dollars buy more shares at lower prices. When it increases, they buy fewer shares. Over time, you will pay a lower average price per share.
For more information
Visit the Individual Investors section at putnam.com A secure section of our Web site contains complete information on your account, including balances and transactions, updated daily. You may also conduct transactions, such as exchanges, additional investments, and address changes. Log on today to get your password.
Call us toll free at 1-800-225-1581 Ask a helpful Putnam representative or your financial advisor for details about any of these or other services, or see your prospectus.
39
The Putnam family of funds
The following is a list of Putnam’s open-end mutual funds offered to the public. Investors should carefully consider the investment objective, risks, charges, and expenses of a fund before investing. For a prospectus , or a summary prospectus if available, containing this and other information for any Putnam fund or product, call your financial advisor at 1-800-225-1581 and ask for a prospectus. Please read the prospectus carefully before investing.
| |
| Growth | Value |
| Growth Opportunities Fund | Convertible Income-Growth Trust |
| International Growth Fund* ** | Equity Income Fund |
| New Opportunities Fund | The George Putnam Fund of Boston |
| Small Cap Growth Fund* | The Putnam Fund for Growth and Income |
| Vista Fund | International Value Fund* †† |
| Voyager Fund | Mid Cap Value Fund |
| Small Cap Value Fund* |
| Blend | |
| Asia Pacific Equity Fund* | Income |
| Capital Opportunities Fund* | American Government Income Fund |
| Capital Spectrum Fund‡ | Diversified Income Trust |
| Emerging Markets Equity Fund* | Floating Rate Income Fund |
| Equity Spectrum Fund‡ | Global Income Trust* |
| Europe Equity Fund* | High Yield Advantage Fund* |
| Global Equity Fund* | High Yield Trust* |
| International Capital Opportunities Fund* | Income Fund |
| International Equity Fund* | Money Market Fund† |
| Investors Fund | U.S. Government Income Trust |
| Research Fund | |
* A 1% redemption fee on total assets redeemed or exchanged within 90 days of purchase may be imposed for all share classes of these funds.
† An investment in a money market fund is not insured or guaranteed by the Federal Deposit Insurance Corporation or any other government agency. Although the fund seeks to preserve the value of your investment at $1.00 per share, it is possible to lose money by investing in the fund.
** Prior to January 1, 2010, the fund was known as Putnam International New Opportunities Fund.
†† Prior to January 1, 2010, the fund was known as Putnam International Growth and Income Fund.
40
Tax-free income
AMT-Free Municipal Fund
Tax Exempt Income Fund
Tax Exempt Money Market Fund†
Tax-Free High Yield Fund
State tax-free income funds:
Arizona, California, Massachusetts, Michigan, Minnesota, New Jersey, New York, Ohio, and Pennsylvania
Absolute Return
Absolute Return 100 Fund
Absolute Return 300 Fund
Absolute Return 500 Fund
Absolute Return 700 Fund
Global Sector*
Global Consumer Fund
Global Energy Fund
Global Financials Fund
Global Health Care Fund
Global Industrials Fund
Global Natural Resources Fund
Global Sector Fund
Global Technology Fund
Global Telecommunications Fund
Global Utilities Fund
Asset allocation
Income Strategies Fund
Putnam Asset Allocation Funds — three investment portfolios that spread your money across a variety of stocks, bonds, and money market investments.
The three portfolios:
Asset Allocation: Balanced Portfolio
Asset Allocation: Conservative Portfolio
Asset Allocation: Growth Portfolio
Putnam RetirementReady®
Putnam RetirementReady Funds — 10 investment portfolios that offer diversification among stocks, bonds, and money market instruments and adjust to become more conservative over time based on a target date for withdrawing assets.
The 10 funds:
Putnam RetirementReady 2050 Fund
Putnam RetirementReady 2045 Fund
Putnam RetirementReady 2040 Fund
Putnam RetirementReady 2035 Fund
Putnam RetirementReady 2030 Fund
Putnam RetirementReady 2025 Fund
Putnam RetirementReady 2020 Fund
Putnam RetirementReady 2015 Fund
Putnam RetirementReady 2010 Fund
Putnam RetirementReady Maturity Fund
‡ A 1% redemption fee on total assets redeemed or exchanged within 30 days of purchase may be imposed for all share classes of these funds.
With the exception of money market funds, a 1% redemption fee may be applied to shares exchanged or sold within 7 days of purchase (90 days, for certain funds).
Check your account balances and the most recent month-end performance in the Individual Investors section at putnam.com.
41
Fund information
Founded over 70 years ago, Putnam Investments was built around the concept that a balance between risk and reward is the hallmark of a well-rounded financial program. We manage over 100 funds across income, value, blend, growth, asset allocation, absolute return, and global sector categories.
| | |
| Investment Manager | George Putnam, III | James P. Pappas |
| Putnam Investment | Robert L. Reynolds | Vice President |
| Management, LLC | W. Thomas Stephens | |
| One Post Office Square | Richard B. Worley | Francis J. McNamara, III |
| Boston, MA 02109 | | Vice President and |
| | Officers | Chief Legal Officer |
| Investment Sub-Manager | Robert L. Reynolds | |
| Putnam Investments Limited | President | Robert R. Leveille |
| 57–59 St James’s Street | | Vice President and |
| London, England SW1A 1LD | Jonathan S. Horwitz | Chief Compliance Officer |
| | Executive Vice President, | |
| Marketing Services | Principal Executive | Mark C. Trenchard |
| Putnam Retail Management | Officer, Treasurer and | Vice President and |
| One Post Office Square | Compliance Liaison | BSA Compliance Officer |
| Boston, MA 02109 | | |
| Charles E. Porter | Judith Cohen |
| Custodian | Senior Advisor to the Trustees | Vice President, Clerk and |
| State Street Bank | | Assistant Treasurer |
| and Trust Company | Steven D. Krichmar | |
| Vice President and | Wanda M. McManus |
| Legal Counsel | Principal Financial Officer | Vice President, Senior Associate |
| Ropes & Gray LLP | | Treasurer and Assistant Clerk |
| | Janet C. Smith | |
| Trustees | Vice President, Principal | Nancy E. Florek |
| John A. Hill, Chairman | Accounting Officer and | Vice President, Assistant Clerk, |
| Jameson A. Baxter, | Assistant Treasurer | Assistant Treasurer and |
| Vice Chairman | | Proxy Manager |
| Ravi Akhoury | Susan G. Malloy | |
| Charles B. Curtis | Vice President and | |
| Robert J. Darretta | Assistant Treasurer | |
| Myra R. Drucker | | |
| Paul L. Joskow | Beth S. Mazor | |
| Elizabeth T. Kennan | Vice President | |
| Kenneth R. Leibler | | |
| Robert E. Patterson | | |
| | |
42
This report is for the information of shareholders of The Putnam Fund for Growth and Income. It may also be used as sales literature when preceded or accompanied by the current prospectus, the most recent copy of Putnam’s Quarterly Performance Summary, and Putnam’s Quarterly Ranking Summary. For more recent performance, please visit putnam.com. Investors should carefully consider the investment objective, risks, charges, and expenses of a fund, which are described in its prospectus. For this and other information or to request a prospectus, or a summary prospectus if available, call 1-800-225-1581 toll free. Please read the prospectus carefully before investing. The fund’s Statement of Additional Information contains additional information about the fund’s Trustees and is available without charge upon request by calling 1-800-225-1581.
43
|
| This page left blank intentionally. |
44
��
Item 2. Code of Ethics:
Not applicable
Item 3. Audit Committee Financial Expert:
Not applicable
Item 4. Principal Accountant Fees and Services:
Not applicable
Item 5. Audit Committee of Listed Registrants
Not applicable
Item 6. Schedule of Investments:
The registrant’s schedule of investments in unaffiliated issuers is included in the report to shareholders in Item 1 above.
Item 7. Disclosure of Proxy Voting Policies and Procedures For Closed- End Management Investment Companies:
Not applicable
Item 8. Portfolio Managers of Closed- End Investment Companies
Not Applicable
Item 9. Purchases of Equity Securities by Closed-End Management Investment Companies and Affiliated Purchasers:
Not applicable
Item 10. Submission of Matters to a Vote of Security Holders:
Not applicable
Item 11. Controls and Procedures:
(a) The registrant's principal executive officer and principal financial officer have concluded, based on their evaluation of the effectiveness of the design and operation of the registrant's disclosure controls and procedures as of a date within 90 days of the filing date of this report, that the design and operation of such procedures are generally effective to provide reasonable assurance that information required to be disclosed by the registrant in this report is recorded, processed, summarized and reported within the time periods specified in the Commission's rules and forms.
(b) Changes in internal control over financial reporting: Not applicable
Item 12. Exhibits:
(a)(1) Not applicable
(a)(2) Separate certifications for the principal executive officer and principal financial officer of the registrant as required by Rule 30a-2(a) under the Investment Company Act of 1940, as amended, are filed herewith.
(b) The certifications required by Rule 30a-2(b) under the Investment Company Act of 1940, as amended, are filed herewith.
The Putnam Fund for Growth and Income
By (Signature and Title):
/s/Janet C. Smith
Janet C. Smith
Principal Accounting Officer
Date: June 28, 2010
Pursuant to the requirements of the Securities Exchange Act of 1934 and the Investment Company Act of 1940, this report has been signed below by the following persons on behalf of the registrant and in the capacities and on the dates indicated.
By (Signature and Title):
/s/Jonathan S. Horwitz
Jonathan S. Horwitz
Principal Executive Officer
Date: June 28, 2010
By (Signature and Title):
/s/Steven D. Krichmar
Steven D. Krichmar
Principal Financial Officer
Date: June 28, 2010