| | |
| UNITED STATES
SECURITIES AND EXCHANGE COMMISSION |
| | |
| CERTIFIED SHAREHOLDER REPORT OF REGISTERED
MANAGEMENT INVESTMENT COMPANIES
|
| | |
| Investment Company Act file number: | (811-00781) |
| | |
| Exact name of registrant as specified in charter: | The Putnam Fund for Growth and Income |
| | |
| Address of principal executive offices: | One Post Office Square, Boston, Massachusetts 02109 |
| | |
| Name and address of agent for service: | Robert T. Burns, Vice President
One Post Office Square
Boston, Massachusetts 02109 |
| | |
| Copy to: | John W. Gerstmayr, Esq.
Ropes & Gray LLP
800 Boylston Street
Boston, Massachusetts 02199-3600 |
| | |
| Registrant’s telephone number, including area code: | (617) 292-1000 |
| | |
| Date of fiscal year end: | October 31, 2013 |
| | |
| Date of reporting period: | November 1, 2012 — April 30, 2013 |
| | |
|
Item 1. Report to Stockholders: | |
| | |
| The following is a copy of the report transmitted to stockholders pursuant to Rule 30e-1 under the Investment Company Act of 1940: | |

The Putnam
Fund for Growth
and Income
Semiannual report
4 | 30 | 13
| | |
| Message from the Trustees | 1 | |
| |
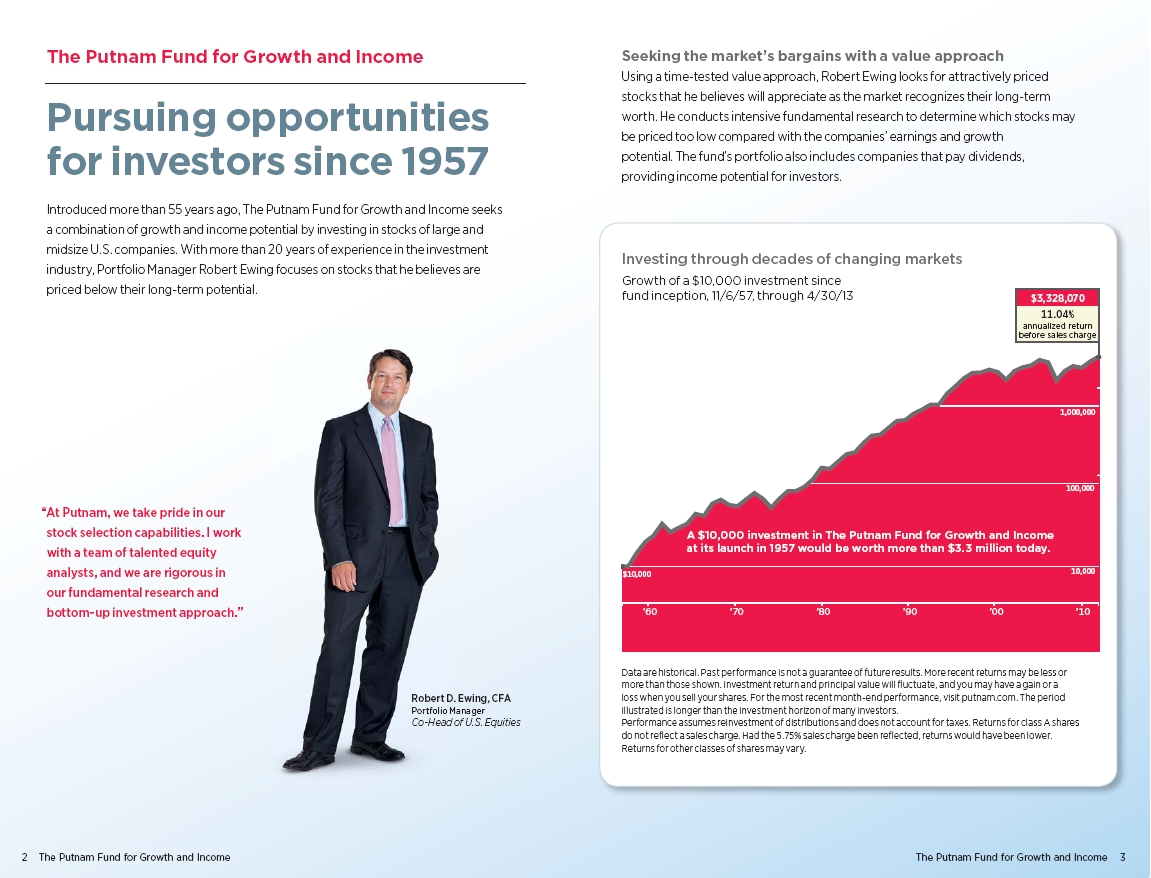
| About the fund | 2 | |
| |
| Performance snapshot | 4 | |
| |
| Interview with your fund’s portfolio manager | 5 | |
| |
| Your fund’s performance | 10 | |
| |
| Your fund’s expenses | 12 | |
| |
| Terms and definitions | 14 | |
| |
| Other information for shareholders | 15 | |
| |
| Financial statements | 16 | |
| |
Consider these risks before investing: Value stocks may fail to rebound, and the market may not favor value-style investing. Income provided by the fund may be reduced by changes in the dividend policies of, and the capital resources available at, the companies in which the fund invests. The prices of stocks in the fund’s portfolio may fall or fail to rise over extended periods of time for a variety of reasons, including both general financial market conditions and factors related to a specific company or industry. You can lose money by investing in the fund.
Message from the Trustees
Dear Fellow Shareholder:
Equities around the world have generally demonstrated a positive trend in early 2013. However, after a strong 2012, fixed-income markets have been facing challenges and increased volatility in 2013.
Supportive macroeconomic data, notably better housing and employment data in the United States, and the coordinated stimulative monetary policies of central banks around the world are helping to boost equity values, although investor confidence remains tempered. Markets continue to confront a variety of macroeconomic and fiscal challenges worldwide — from budget concerns in the United States to the eurozone’s debt-related troubles.
Investor apprehension today can be linked to the heightened volatility that has challenged markets for over a decade. In this fundamentally changed environment, Putnam’s equity and fixed-income teams are focused on integrating innovative investing ideas into our more time-tested, traditional strategies. It is also important to rely on the guidance of your financial advisor, who can help ensure that your portfolio matches your individual goals and tolerance for risk.
We would like to extend a welcome to new shareholders of the fund and to thank you for investing with Putnam.


Current performance may be lower or higher than the quoted past performance, which cannot guarantee future results. Share price, principal value, and return will fluctuate, and you may have a gain or a loss when you sell your shares. Performance of class A shares assumes reinvestment of distributions and does not account for taxes. Fund returns in the bar chart do not reflect a sales charge of 5.75%; had they, returns would have been lower. See pages 3, 5, and 10–12 for additional performance information. For a portion of the periods, the fund had expense limitations, without which returns would have been lower. To obtain the most recent month-end performance, visit putnam.com.
* The fund’s benchmark, the Russell 1000 Value Index, and the fund’s Lipper peer group were introduced on 12/31/78 and 12/31/59, respectively, which post-date the inception of the fund’s class A shares.
† Returns for the six-month period are not annualized, but cumulative.
| |
| 4 | The Putnam Fund for Growth and Income |
Interview with your fund’s portfolio manager

How were conditions for stock market investors during the six months ended April 30, 2013?
With the exception of some turbulence around the time of the U.S. presidential election in November, the stock market delivered solid, relatively steady gains for the period. Investors appeared to be much less distracted by macroeconomic worries, and their renewed enthusiasm for stocks fueled a market rally. In the closing months of the period, major indexes reached new milestones. In fact, on the final day of the period, the S&P 500 Index, a broad measure of stock market performance, closed at an all-time high.
Have you been surprised by the magnitude of the rally?
I do not find it surprising that the market has advanced considerably. However, the rally had some unusual characteristics. Specifically, we saw stocks in defensive sectors outperform more economically sensitive, or “cyclical,” stocks. This is not typical of strong-performing equity markets. It is unusual for defensive stocks — those with less earnings volatility than the market overall, sometimes referred to as “safe” stocks — to outperform in such a strong market.
While the leading sectors included some cyclical categories, such as technology and consumer discretionary, other top performers were health-care and consumer
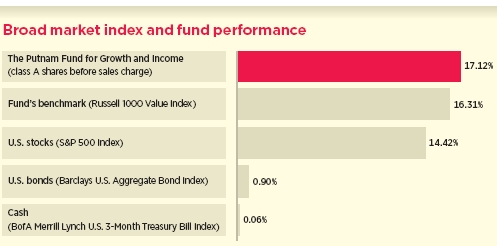
This comparison shows your fund’s performance in the context of broad market indexes for the six months ended 4/30/13. See pages 3, 4, and 10–12 for additional fund performance information. Index descriptions can be found on pages 14–15.
| |
| The Putnam Fund for Growth and Income | 5 |
staples — defensive areas that we wouldn’t expect to fare so well. This suggests that, while investors were returning to stocks, they may have been doing so in a more conservative, cautious manner.
How did the fund perform in this environment?
Despite the fact that I had positioned the portfolio with a pro-cyclical focus, the fund delivered a solid positive return that exceeded the average return for funds in its Lipper peer group and its benchmark, the Russell 1000 Value Index. In addition, 65% of the fund’s outperformance was due to stock selection rather than sector weightings. With our rigorous fundamental research, we aim for performance that is stock-driven, so I am pleased with the results for the period.
Within the fund’s portfolio, what strategies or stocks drove returns for the period?
As active fund managers, we have the flexibility to not own a stock that is included in our benchmark index — or to own less of it than the index. During the period, fund performance was helped by our decision to maintain a smaller position than the benchmark in General Electric. We were concerned that the company’s exposure to international markets, particularly struggling European economies, would detract from its financial performance. Similarly, the fund’s underweight position in energy giant Exxon Mobil also contributed positively to performance for the period.
A notable out-of-benchmark contributor was Cabot Oil & Gas, an independent oil and gas company. Cabot has been growing its production at an extraordinarily rapid rate, and company earnings have exceeded
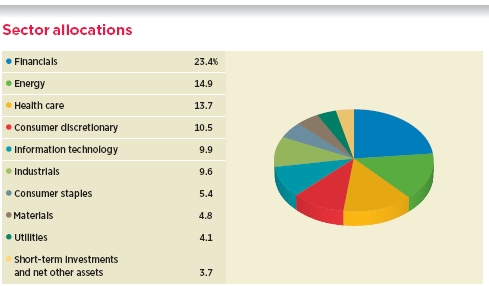
Allocations are represented as a percentage of the fund’s net assets as of 4/30/13. Short-term assets and net other assets, if any, represent the market value weights of cash, derivatives, short-term securities, and other unclassified assets in the portfolio. Summary information may differ from the portfolio schedule included in the financial statements due to the inclusion of derivative securities, any interest accruals, the exclusion of as-of trades, if any, and the use of different classifications of securities for presentation purposes. Holdings and allocations may vary over time.
| |
| 6 | The Putnam Fund for Growth and Income |
analyst expectations. Investing, especially when taking a value approach, often requires a great deal of patience. This has certainly been the case with Hewlett-Packard, a company whose stock has struggled for some time as sales of personal computers have declined sharply. During the period, this stock was one of the fund’s top contributors as the market favored larger, more established technology companies. In addition, the stock’s valuation, which had been at extremely low levels, rose during the period.

Could you discuss some stocks that detracted from returns versus the benchmark?
The top detractor was Apple, an out-of-benchmark stock that was among the top performers in the fund’s previous fiscal year. Creator of such iconic products as the iPhone and iPad, Apple is one of the world’s largest companies, and its stock had an impressive multi-year run, reaching a record high of $705 per share in September 2012. The stock has since stumbled, primarily as a result of a deceleration in Apple’s business and investor concerns about its ability to continue delivering innovative products.
Weakening gold prices have hurt the stock of Barrick Gold, a gold-mining company and one of the top detractors for the period. At the same time, flat and declining prices in the energy sector hurt the stock of oil and gas company Royal Dutch Shell.
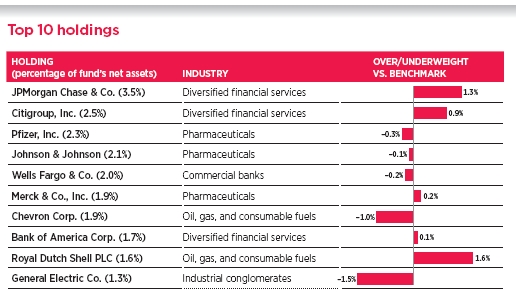
This table shows the fund’s top 10 individual holdings and the percentage of the fund’s net assets that each represented as of 4/30/13. Short-term holdings, derivatives, and TBA commitments, if any, are excluded. Holdings may vary over time.
| |
| The Putnam Fund for Growth and Income | 7 |
Also detracting from the fund’s performance was our decision to avoid the stock of Berkshire Hathaway, the holding company led by Warren Buffett. Although it performed well during the period, this stock trades at a premium to book value, and I generally prefer to seek individual companies for the fund’s portfolio rather than investing in a conglomerate that manages such a wide range of businesses.
What is your outlook for stock market investing in the coming months?
While the market’s momentum has been encouraging, I believe we are unlikely to see equity returns continue upward in a straight line, and the remainder of 2013 will not be without its variations and risks. It is worth remembering that in the past several years, we saw rallies that quickly turned downward. While I don’t necessarily expect this to happen, we remain vigilant to the possibility that the equity advance could take a pause in the months ahead. I remain optimistic about investment opportunities, particularly in the cyclical areas that I believe have not performed as well as they should have, and I continue to maintain the fund’s pro-cyclical focus.
In terms of the economy, I believe we are in the middle stages of the recovery. In the early stages, we typically see companies in cyclical sectors outperforming the rest of the market and rebounding from their lows with huge earnings growth rates. In what appears to be the middle stages of the recovery, earnings growth rates have converged and stocks are behaving more independently from each other. Investment opportunities are less obvious in this environment, which makes our research-intensive, active management approach even more important.
Thank you, Bob, for your time and insights today.
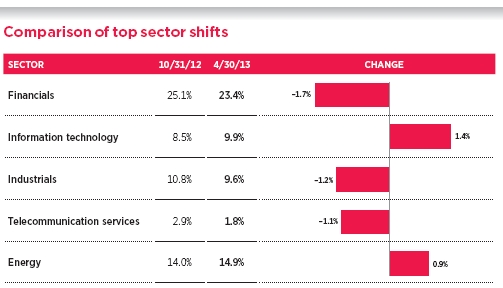
This chart shows the fund’s largest allocation shifts, by percentage, over the past six months. Allocations are represented as a percentage of the fund’s net assets. Current period summary information may differ from the portfolio schedule included in the financial statements due to the inclusion of derivative securities, any interest accruals, the exclusion of as-of trades, if any, and the use of different classifications of securities for presentation purposes. Holdings and allocations may vary over time.
| |
| 8 | The Putnam Fund for Growth and Income |
The views expressed in this report are exclusively those of Putnam Management and are subject to change. They are not meant as investment advice.
Please note that the holdings discussed in this report may not have been held by the fund for the entire period. Portfolio composition is subject to review in accordance with the fund’s investment strategy and may vary in the future. Current and future portfolio holdings are subject to risk.
Portfolio Manager Robert D. Ewing is Co-Head of U.S. Equities at Putnam. He has a B.S. in Finance and Economics from Boston College. A CFA charterholder, he joined Putnam in 2008 and has been in the investment industry since 1990.
IN THE NEWS
The economic outlook for major industrialized nations is slowly improving, with the United States and Japan leading the way, according to a report by the Organisation for Economic Co-operation and Development (OECD). Economic expansion is also taking place in most major countries around the world, including the 17-nation eurozone, where Germany’s economy is growing and stabilization is occurring in Italy and France. Growth also is solidifying in Japan, whose new government has launched efforts to bring the country’s long-stagnant economy back to life through various stimulus efforts, and growth is picking up in China, where an economic hard landing has been avoided. The OECD sees growth weakening in India and normal, “around trend” growth taking place in Russia, Brazil, and the United Kingdom. Meanwhile, the World Trade Organization (WTO) has cut its overall 2013 forecast for global trade volume growth to 3.3% from 4.5%. Global trade grew by 2% in 2012, the second-worst figure since this economic statistic began to be tracked in 1981, according to the WTO. The worst trade figure came in 2009 during the global economic crisis.
| |
| The Putnam Fund for Growth and Income | 9 |
Your fund’s performance
This section shows your fund’s performance, price, and distribution information for periods ended April 30, 2013, the end of the first half of its current fiscal year. In accordance with regulatory requirements for mutual funds, we also include performance information as of the most recent calendar quarter-end and expense information taken from the fund’s current prospectus. Performance should always be considered in light of a fund’s investment strategy. Data represent past performance. Past performance does not guarantee future results. More recent returns may be less or more than those shown. Investment return and principal value will fluctuate, and you may have a gain or a loss when you sell your shares. Performance information does not reflect any deduction for taxes a shareholder may owe on fund distributions or on the redemption of fund shares. For the most recent month-end performance, please visit the Individual Investors section at putnam.com or call Putnam at 1-800-225-1581. Class R, class R5, class R6, and class Y shares are not available to all investors. See the Terms and Definitions section in this report for definitions of the share classes offered by your fund.
Fund performance Total return for periods ended 4/30/13
| | | | | | | | | | | | |
| | Class A | Class B | Class C | Class M | Class R | Class R5 | Class R6 | Class Y |
| (inception dates) | (11/6/57) | (4/27/92) | (7/26/99) | (5/1/95) | (1/21/03) | (7/2/12) | (7/2/12) | (6/15/94) |
|
| | Before | After | | | | | Before | After | Net | Net | Net | Net |
| sales | sales | Before | After | Before | After | sales | sales | asset | asset | asset | asset |
| charge | charge | CDSC | CDSC | CDSC | CDSC | charge | charge | value | value | value | value |
|
| Annual average | | | | | | | | | | | | |
| (life of fund) | 11.04% | 10.92% | 10.03% | 10.03% | 10.20% | 10.20% | 10.31% | 10.24% | 10.76% | 11.13% | 11.13% | 11.13% |
|
| 10 years | 82.63 | 72.12 | 69.31 | 69.31 | 69.47 | 69.47 | 73.74 | 67.66 | 78.06 | 87.42 | 87.55 | 87.19 |
| Annual average | 6.21 | 5.58 | 5.41 | 5.41 | 5.42 | 5.42 | 5.68 | 5.30 | 5.94 | 6.48 | 6.49 | 6.47 |
|
| 5 years | 25.39 | 18.18 | 20.82 | 18.82 | 20.84 | 20.84 | 22.37 | 18.09 | 23.84 | 27.17 | 27.26 | 27.02 |
| Annual average | 4.63 | 3.40 | 3.85 | 3.51 | 3.86 | 3.86 | 4.12 | 3.38 | 4.37 | 4.93 | 4.94 | 4.90 |
|
| 3 years | 36.78 | 28.92 | 33.74 | 30.74 | 33.82 | 33.82 | 34.79 | 30.07 | 35.78 | 38.00 | 38.09 | 37.83 |
| Annual average | 11.01 | 8.84 | 10.18 | 9.35 | 10.20 | 10.20 | 10.46 | 9.16 | 10.73 | 11.33 | 11.36 | 11.29 |
|
| 1 year | 20.54 | 13.61 | 19.72 | 14.72 | 19.66 | 18.66 | 19.97 | 15.77 | 20.28 | 21.03 | 21.11 | 20.88 |
|
| 6 months | 17.12 | 10.39 | 16.71 | 11.71 | 16.70 | 15.70 | 16.84 | 12.75 | 16.99 | 17.44 | 17.50 | 17.31 |
|
Current performance may be lower or higher than the quoted past performance, which cannot guarantee future results. After-sales-charge returns for class A and M shares reflect the deduction of the maximum 5.75% and 3.50% sales charge, respectively, levied at the time of purchase. Class B share returns after contingent deferred sales charge (CDSC) reflect the applicable CDSC, which is 5% in the first year, declining over time to 1% in the sixth year, and is eliminated thereafter. Class C share returns after CDSC reflect a 1% CDSC for the first year that is eliminated thereafter. Class R, R5, R6, and Y shares have no initial sales charge or CDSC. Performance for class B, C, M, R, and Y shares before their inception is derived from the historical performance of class A shares, adjusted for the applicable sales charge (or CDSC) and the higher operating expenses for such shares, except for class Y shares, for which 12b-1 fees are not applicable. Performance for class R5 and R6 shares prior to their inception is derived from the historical performance of class Y shares and has not been adjusted for the lower investor servicing fees applicable to class R5 and R6 shares; had it, returns would have been higher.
Recent performance may have benefited from one or more legal settlements.
For a portion of the periods, the fund had expense limitations, without which returns would have been lower.
Class B share performance does not reflect conversion to class A shares.
| |
| 10 | The Putnam Fund for Growth and Income |
Comparative index returns For periods ended 4/30/13
| | |
| | | Lipper Large-Cap Value |
| | Russell 1000 Value Index | Funds category average* |
|
| Annual average (life of fund) | —† | —† |
|
| 10 years | 124.49% | 107.62% |
| Annual average | 8.42 | 7.51 |
|
| 5 years | 22.66 | 19.19 |
| Annual average | 4.17 | 3.52 |
|
| 3 years | 41.81 | 35.19 |
| Annual average | 12.35 | 10.54 |
|
| 1 year | 21.80 | 18.41 |
|
| 6 months | 16.31 | 15.25 |
|
Index and Lipper results should be compared with fund performance before sales charge, before CDSC, or at net asset value.
* Over the 6-month, 1-year, 3-year, 5-year, and 10-year periods ended 4/30/13, there were 492, 478, 414, 363, and 232 funds, respectively, in this Lipper category.
† The fund’s benchmark, the Russell 1000 Value Index, and the fund’s Lipper peer group were introduced on 12/31/78 and 12/31/59, respectively, which post-date the inception of the fund’s class A shares.
Fund price and distribution information For the six-month period ended 4/30/13
| | | | | | | | | | |
| Distributions | Class A | Class B | Class C | Class M | Class R | Class R5 | Class R6 | Class Y |
|
| Number | 2 | 2 | 2 | 2 | 2 | 2 | 2 | 2 |
|
| Income | $0.139 | $0.081 | $0.083 | $0.102 | $0.119 | $0.168 | $0.176 | $0.159 |
|
| Capital gains | — | — | — | — | — | — | — | — |
|
| Total | $0.139 | $0.081 | $0.083 | $0.102 | $0.119 | $0.168 | $0.176 | $0.159 |
|
| | Before | After | Net | Net | Before | After | Net | Net | Net | Net |
| | sales | sales | asset | asset | sales | sales | asset | asset | asset | asset |
| Share value | charge | charge | value | value | charge | charge | value | value | value | value |
|
| 10/31/12 | $14.51 | $15.40 | $14.25 | $14.45 | $14.39 | $14.91 | $14.43 | $14.54 | $14.54 | $14.54 |
|
| 4/30/13 | 16.84 | 17.87 | 16.54 | 16.77 | 16.70 | 17.31 | 16.75 | 16.89 | 16.89 | 16.88 |
|
| | Before | After | Net | Net | Before | After | Net | Net | Net | Net |
| Current rate | sales | sales | asset | asset | sales | sales | asset | asset | asset | asset |
| (end of period) | charge | charge | value | value | charge | charge | value | value | value | value |
|
| Current | | | | | | | | | | |
| dividend rate 1 | 1.12% | 1.05% | 0.41% | 0.43% | 0.67% | 0.65% | 0.96% | 1.47% | 1.56% | 1.35% |
|
| Current 30-day | | | | | | | | | | |
| SEC yield 2 | N/A | 1.00 | 0.33 | 0.34 | N/A | 0.56 | 0.82 | 1.41 | 1.51 | 1.32 |
|
The classification of distributions, if any, is an estimate. Before-sales-charge share value and current dividend rate for class A and M shares, if applicable, do not take into account any sales charge levied at the time of purchase. After-sales-charge share value, current dividend rate, and current 30-day SEC yield, if applicable, are calculated assuming that the maximum sales charge (5.75% for class A shares and 3.50% for class M shares) was levied at the time of purchase. Final distribution information will appear on your year-end tax forms.
1 Most recent distribution, excluding capital gains, annualized and divided by the fund’s share price before or after sales charge at period-end.
2 Based only on investment income and calculated using the maximum offering price for each share class, in accordance with SEC guidelines.
| |
| The Putnam Fund for Growth and Income | 11 |
Fund performance as of most recent calendar quarter
Total return for periods ended 3/31/13
| | | | | | | | | | | | |
| | Class A | Class B | Class C | Class M | Class R | Class R5 | Class R6 | Class Y |
| (inception dates) | (11/6/57) | (4/27/92) | (7/26/99) | (5/1/95) | (1/21/03) | (7/2/12) | (7/2/12) | (6/15/94) |
|
| | Before | After | | | | | Before | After | Net | Net | Net | Net |
| sales | sales | Before | After | Before | After | sales | sales | asset | asset | asset | asset |
| charge | charge | CDSC | CDSC | CDSC | CDSC | charge | charge | value | value | value | value |
|
| Annual average | | | | | | | | | | | | |
| (life of fund) | 11.01% | 10.89% | 10.01% | 10.01% | 10.18% | 10.18% | 10.29% | 10.22% | 10.73% | 11.11% | 11.11% | 11.11% |
|
| 10 years | 94.67 | 83.48 | 80.47 | 80.47 | 80.67 | 80.67 | 85.12 | 78.64 | 89.78 | 99.80 | 99.93 | 99.55 |
| Annual average | 6.89 | 6.26 | 6.08 | 6.08 | 6.09 | 6.09 | 6.35 | 5.97 | 6.62 | 7.17 | 7.17 | 7.15 |
|
| 5 years | 29.83 | 22.37 | 24.98 | 22.98 | 25.03 | 25.03 | 26.64 | 22.21 | 28.15 | 31.59 | 31.68 | 31.43 |
| Annual average | 5.36 | 4.12 | 4.56 | 4.22 | 4.57 | 4.57 | 4.84 | 4.09 | 5.09 | 5.64 | 5.66 | 5.62 |
|
| 3 years | 35.90 | 28.09 | 32.84 | 29.84 | 32.94 | 32.94 | 33.89 | 29.20 | 34.90 | 37.14 | 37.23 | 36.97 |
| Annual average | 10.77 | 8.60 | 9.93 | 9.10 | 9.95 | 9.95 | 10.22 | 8.92 | 10.49 | 11.10 | 11.13 | 11.06 |
|
| 1 year | 16.21 | 9.53 | 15.34 | 10.34 | 15.42 | 14.42 | 15.70 | 11.65 | 15.94 | 16.62 | 16.70 | 16.48 |
|
| 6 months | 15.14 | 8.52 | 14.77 | 9.77 | 14.79 | 13.79 | 14.92 | 10.90 | 15.01 | 15.48 | 15.53 | 15.34 |
|
See the discussion following the Fund performance table on page 10 for information about the calculation of fund performance.
Your fund’s expenses
As a mutual fund investor, you pay ongoing expenses, such as management fees, distribution fees (12b-1 fees), and other expenses. Using the following information, you can estimate how these expenses affect your investment and compare them with the expenses of other funds. You may also pay one-time transaction expenses, including sales charges (loads) and redemption fees, which are not shown in this section and would have resulted in higher total expenses. For more information, see your fund’s prospectus or talk to your financial representative.
Expense ratios
| | | | | | | | |
| | Class A | Class B | Class C | Class M | Class R | Class R5 | Class R6 | Class Y |
|
| Total annual operating expenses for | | | | | | | | |
| the fiscal year ended 10/31/12 | 1.10% | 1.85% | 1.85% | 1.60% | 1.35% | 0.68%* | 0.58%* | 0.85% |
|
| Annualized expense ratio for the | | | | | | | | |
| six-month period ended 4/30/13 | 1.07% | 1.82% | 1.82% | 1.57% | 1.32% | 0.68% | 0.58% | 0.82% |
|
Fiscal-year expense information in this table is taken from the most recent prospectus, is subject to change, and may differ from that shown for the annualized expense ratio and in the financial highlights of this report. Expenses are shown as a percentage of average net assets.
* Other expenses for class R5 and R6 shares have been annualized.
| |
| 12 | The Putnam Fund for Growth and Income |
Expenses per $1,000
The following table shows the expenses you would have paid on a $1,000 investment in the fund from November 1, 2012, to April 30, 2013. It also shows how much a $1,000 investment would be worth at the close of the period, assuming actual returns and expenses.
| | | | | | | | |
| | Class A | Class B | Class C | Class M | Class R | Class R5 | Class R6 | Class Y |
|
| Expenses paid per $1,000*† | $5.76 | $9.78 | $9.78 | $8.44 | $7.10 | $3.67 | $3.13 | $4.42 |
|
| Ending value (after expenses) | $1,171.20 | $1,167.10 | $1,167.00 | $1,168.40 | $1,169.90 | $1,174.40 | $1,175.00 | $1,173.10 |
|
* Expenses for each share class are calculated using the fund’s annualized expense ratio for each class, which represents the ongoing expenses as a percentage of average net assets for the six months ended 4/30/13. The expense ratio may differ for each share class.
† Expenses are calculated by multiplying the expense ratio by the average account value for the period; then multiplying the result by the number of days in the period; and then dividing that result by the number of days in the year.
Estimate the expenses you paid
To estimate the ongoing expenses you paid for the six months ended April 30, 2013, use the following calculation method. To find the value of your investment on November 1, 2012, call Putnam at 1-800-225-1581.

Compare expenses using the SEC’s method
The Securities and Exchange Commission (SEC) has established guidelines to help investors assess fund expenses. Per these guidelines, the following table shows your fund’s expenses based on a $1,000 investment, assuming a hypothetical 5% annualized return. You can use this information to compare the ongoing expenses (but not transaction expenses or total costs) of investing in the fund with those of other funds. All mutual fund shareholder reports will provide this information to help you make this comparison. Please note that you cannot use this information to estimate your actual ending account balance and expenses paid during the period.
| | | | | | | | |
| | Class A | Class B | Class C | Class M | Class R | Class R5 | Class R6 | Class Y |
|
| Expenses paid per $1,000*† | $5.36 | $9.10 | $9.10 | $7.85 | $6.61 | $3.41 | $2.91 | $4.11 |
|
| Ending value (after expenses) | $1,019.49 | $1,015.77 | $1,015.77 | $1,017.01 | $1,018.25 | $1,021.42 | $1,021.92 | $1,020.73 |
|
* Expenses for each share class are calculated using the fund’s annualized expense ratio for each class, which represents the ongoing expenses as a percentage of average net assets for the six months ended 4/30/13. The expense ratio may differ for each share class.
† Expenses are calculated by multiplying the expense ratio by the average account value for the period; then multiplying the result by the number of days in the period; and then dividing that result by the number of days in the year.
| |
| The Putnam Fund for Growth and Income | 13 |
Terms and definitions
Important terms
Total return shows how the value of the fund’s shares changed over time, assuming you held the shares through the entire period and reinvested all distributions in the fund.
Before sales charge, or net asset value, is the price, or value, of one share of a mutual fund, without a sales charge. Before-sales-charge figures fluctuate with market conditions, and are calculated by dividing the net assets of each class of shares by the number of outstanding shares in the class.
After sales charge is the price of a mutual fund share plus the maximum sales charge levied at the time of purchase. After-sales-charge performance figures shown here assume the 5.75% maximum sales charge for class A shares and 3.50% for class M shares.
Contingent deferred sales charge (CDSC) is generally a charge applied at the time of the redemption of class B or C shares and assumes redemption at the end of the period. Your fund’s class B CDSC declines over time from a 5% maximum during the first year to 1% during the sixth year. After the sixth year, the CDSC no longer applies. The CDSC for class C shares is 1% for one year after purchase.
Current yield is the annual rate of return earned from dividends or interest of an investment. Current yield is expressed as a percentage of the price of a security, fund share, or principal investment.
Share classes
Class A shares are generally subject to an initial sales charge and no CDSC (except on certain redemptions of shares bought without an initial sales charge).
Class B shares are not subject to an initial sales charge. They may be subject to a CDSC.
Class C shares are not subject to an initial sales charge and are subject to a CDSC only if the shares are redeemed during the first year.
Class M shares have a lower initial sales charge and a higher 12b-1 fee than class A shares and no CDSC (except on certain redemptions of shares bought without an initial sales charge).
Class R shares are not subject to an initial sales charge or CDSC and are available only to certain defined contribution plans.
Class R5 shares and class R6 shares are not subject to an initial sales charge or CDSC, and carry no 12b-1 fee. They are only available to employer-sponsored retirement plans.
Class Y shares are not subject to an initial sales charge or CDSC, and carry no 12b-1 fee. They are generally only available to corporate and institutional clients and clients in other approved programs.
Comparative indexes
Barclays U.S. Aggregate Bond Index is an unmanaged index of U.S. investment-grade fixed-income securities.
BofA (Bank of America) Merrill Lynch U.S. 3-Month Treasury Bill Index is an unmanaged index that seeks to measure the performance of U.S. Treasury bills available in the marketplace.
Russell 1000 Value Index is an unmanaged index of those companies in the large-cap Russell 1000 Index chosen for their value orientation.
S&P 500 Index is an unmanaged index of common stock performance.
Indexes assume reinvestment of all distributions and do not account for fees. Securities and performance of a fund and an index will differ. You cannot invest directly in an index.
| |
| 14 | The Putnam Fund for Growth and Income |
Lipper is a third-party industry-ranking entity that ranks mutual funds. Its rankings do not reflect sales charges. Lipper rankings are based on total return at net asset value relative to other funds that have similar current investment styles or objectives as determined by Lipper. Lipper may change a fund’s category assignment at its discretion. Lipper category averages reflect performance trends for funds within a category.
Other information for shareholders
Important notice regarding delivery of shareholder documents
In accordance with Securities and Exchange Commission (SEC) regulations, Putnam sends a single copy of annual and semiannual shareholder reports, prospectuses, and proxy statements to Putnam shareholders who share the same address, unless a shareholder requests otherwise. If you prefer to receive your own copy of these documents, please call Putnam at 1-800-225-1581, and Putnam will begin sending individual copies within 30 days.
Proxy voting
Putnam is committed to managing our mutual funds in the best interests of our shareholders. The Putnam funds’ proxy voting guidelines and procedures, as well as information regarding how your fund voted proxies relating to portfolio securities during the 12-month period ended June 30, 2012, are available in the Individual Investors section of putnam.com, and on the SEC’s website, www.sec.gov. If you have questions about finding forms on the SEC’s website, you may call the SEC at 1-800-SEC-0330. You may also obtain the Putnam funds’ proxy voting guidelines and procedures at no charge by calling Putnam’s Shareholder Services at 1-800-225-1581.
Fund portfolio holdings
The fund will file a complete schedule of its portfolio holdings with the SEC for the first and third quarters of each fiscal year on Form N-Q. Shareholders may obtain the fund’s Forms N-Q on the SEC’s website at www.sec.gov. In addition, the fund’s Forms N-Q may be reviewed and copied at the SEC’s Public Reference Room in Washington, D.C. You may call the SEC at 1-800-SEC-0330 for information about the SEC’s website or the operation of the Public Reference Room.
Trustee and employee fund ownership
Putnam employees and members of the Board of Trustees place their faith, confidence, and, most importantly, investment dollars in Putnam mutual funds. As of April 30, 2013, Putnam employees had approximately $381,000,000 and the Trustees had approximately $91,000,000 invested in Putnam mutual funds. These amounts include investments by the Trustees’ and employees’ immediate family members as well as investments through retirement and deferred compensation plans.
| |
| The Putnam Fund for Growth and Income | 15 |
Financial statements
A guide to financial statements
These sections of the report, as well as the accompanying Notes, constitute the fund’s financial statements.
The fund’s portfolio lists all the fund’s investments and their values as of the last day of the reporting period. Holdings are organized by asset type and industry sector, country, or state to show areas of concentration and diversification.
Statement of assets and liabilities shows how the fund’s net assets and share price are determined. All investment and non-investment assets are added together. Any unpaid expenses and other liabilities are subtracted from this total. The result is divided by the number of shares to determine the net asset value per share, which is calculated separately for each class of shares. (For funds with preferred shares, the amount subtracted from total assets includes the liquidation preference of preferred shares.)
Statement of operations shows the fund’s net investment gain or loss. This is done by first adding up all the fund’s earnings — from dividends and interest income — and subtracting its operating expenses to determine net investment income (or loss). Then, any net gain or loss the fund realized on the sales of its holdings — as well as any unrealized gains or losses over the period — is added to or subtracted from the net investment result to determine the fund’s net gain or loss for the fiscal period.
Statement of changes in net assets shows how the fund’s net assets were affected by the fund’s net investment gain or loss, by distributions to shareholders, and by changes in the number of the fund’s shares. It lists distributions and their sources (net investment income or realized capital gains) over the current reporting period and the most recent fiscal year-end. The distributions listed here may not match the sources listed in the Statement of operations because the distributions are determined on a tax basis and may be paid in a different period from the one in which they were earned. Dividend sources are estimated at the time of declaration. Actual results may vary. Any non-taxable return of capital cannot be determined until final tax calculations are completed after the end of the fund’s fiscal year.
Financial highlights provide an overview of the fund’s investment results, per-share distributions, expense ratios, net investment income ratios, and portfolio turnover in one summary table, reflecting the five most recent reporting periods. In a semiannual report, the highlights table also includes the current reporting period.
| |
| 16 | The Putnam Fund for Growth and Income |
The fund’s portfolio 4/30/13 (Unaudited)
| | |
| COMMON STOCKS (97.7%)* | Shares | Value |
|
| Aerospace and defense (4.9%) | | |
| Boeing Co. (The) | 109,100 | $9,972,831 |
|
| Embraer SA ADR (Brazil) S | 273,800 | 9,563,834 |
|
| General Dynamics Corp. | 465,900 | 34,457,964 |
|
| Honeywell International, Inc. | 860,700 | 63,295,878 |
|
| L-3 Communications Holdings, Inc. | 431,900 | 35,091,875 |
|
| Northrop Grumman Corp. | 542,900 | 41,119,246 |
|
| United Technologies Corp. | 507,900 | 46,366,191 |
|
| | | 239,867,819 |
| Air freight and logistics (0.2%) | | |
| FedEx Corp. | 94,000 | 8,836,940 |
|
| | | 8,836,940 |
| Airlines (0.6%) | | |
| Delta Air Lines, Inc. † | 1,070,300 | 18,344,942 |
|
| Japan Airlines Co., Ltd. (Japan) † | 271,300 | 13,747,982 |
|
| | | 32,092,924 |
| Auto components (1.1%) | | |
| American Axle & Manufacturing Holdings, Inc. † S | 220,960 | 2,954,235 |
|
| Johnson Controls, Inc. | 861,600 | 30,164,616 |
|
| TRW Automotive Holdings Corp. † | 131,600 | 7,905,212 |
|
| Valeo SA (France) | 199,595 | 11,614,157 |
|
| | | 52,638,220 |
| Automobiles (0.6%) | | |
| Ford Motor Co. | 1,459,400 | 20,008,374 |
|
| General Motors Co. † | 330,200 | 10,183,368 |
|
| | | 30,191,742 |
| Beverages (1.0%) | | |
| Coca-Cola Enterprises, Inc. | 592,800 | 21,714,264 |
|
| Dr. Pepper Snapple Group, Inc. | 403,900 | 19,722,437 |
|
| PepsiCo, Inc. | 120,300 | 9,921,141 |
|
| | | 51,357,842 |
| Biotechnology (—%) | | |
| Cubist Pharmaceuticals, Inc. † | 36,792 | 1,689,489 |
|
| | | 1,689,489 |
| Building products (—%) | | |
| Owens Corning, Inc. † | 42,417 | 1,784,059 |
|
| | | 1,784,059 |
| Capital markets (4.5%) | | |
| Bank of New York Mellon Corp. (The) | 342,600 | 9,668,172 |
|
| Blackstone Group LP (The) | 713,300 | 14,658,315 |
|
| Charles Schwab Corp. (The) | 1,435,000 | 24,337,600 |
|
| Goldman Sachs Group, Inc. (The) | 268,593 | 39,233,380 |
|
| KKR & Co. LP | 1,293,077 | 27,154,617 |
|
| Morgan Stanley | 2,423,800 | 53,687,170 |
|
| State Street Corp. | 836,000 | 48,880,920 |
|
| | | 217,620,174 |
| Chemicals (2.4%) | | |
| Celanese Corp. Ser. A | 200,700 | 9,916,587 |
|
| Dow Chemical Co. (The) S | 1,007,100 | 34,150,761 |
|
| E.I. du Pont de Nemours & Co. | 220,400 | 12,014,004 |
|
| HB Fuller Co. | 256,600 | 9,725,140 |
|
| Huntsman Corp. | 269,000 | 5,073,340 |
|
| |
| The Putnam Fund for Growth and Income | 17 |
| | |
| COMMON STOCKS (97.7%)* cont. | Shares | Value |
|
| Chemicals cont. | | |
| LyondellBasell Industries NV Class A | 522,400 | $31,709,680 |
|
| Tronox, Ltd. Class A | 693,065 | 14,235,555 |
|
| | | 116,825,067 |
| Commercial banks (3.5%) | | |
| Barclays PLC (United Kingdom) | 2,072,863 | 9,215,139 |
|
| Fifth Third Bancorp | 1,114,000 | 18,971,420 |
|
| First Horizon National Corp. | 462,800 | 4,813,120 |
|
| Investors Bancorp, Inc. | 527,400 | 10,442,520 |
|
| KeyCorp | 595,100 | 5,933,147 |
|
| U.S. Bancorp | 703,400 | 23,409,152 |
|
| Wells Fargo & Co. | 2,601,679 | 98,811,768 |
|
| | | 171,596,266 |
| Commercial services and supplies (1.0%) | | |
| ADT Corp. (The) † | 363,821 | 15,877,148 |
|
| Pitney Bowes, Inc. | 602,800 | 8,240,276 |
|
| Tyco International, Ltd. | 740,042 | 23,770,149 |
|
| | | 47,887,573 |
| Communications equipment (2.1%) | | |
| Arris Group, Inc. † | 562,100 | 9,280,271 |
|
| Cisco Systems, Inc. | 2,564,457 | 53,648,440 |
|
| Polycom, Inc. † | 2,164,900 | 22,731,450 |
|
| Qualcomm, Inc. | 278,400 | 17,155,008 |
|
| | | 102,815,169 |
| Computers and peripherals (3.1%) | | |
| Apple, Inc. | 129,700 | 57,424,675 |
|
| Fusion-io, Inc. † S | 314,600 | 5,908,188 |
|
| Gemalto NV (Netherlands) | 80,534 | 6,591,058 |
|
| Hewlett-Packard Co. S | 2,410,600 | 49,658,360 |
|
| NetApp, Inc. † | 313,600 | 10,941,504 |
|
| SanDisk Corp. † | 420,700 | 22,061,508 |
|
| | | 152,585,293 |
| Construction and engineering (0.3%) | | |
| KBR, Inc. | 457,100 | 13,749,568 |
|
| | | 13,749,568 |
| Consumer finance (0.5%) | | |
| Capital One Financial Corp. | 448,038 | 25,887,636 |
|
| | | 25,887,636 |
| Containers and packaging (0.2%) | | |
| MeadWestvaco Corp. | 263,400 | 9,082,032 |
|
| | | 9,082,032 |
| Diversified consumer services (0.2%) | | |
| ITT Educational Services, Inc. † S | 465,624 | 8,525,575 |
|
| | | 8,525,575 |
| Diversified financial services (8.1%) | | |
| Bank of America Corp. | 6,671,594 | 82,127,322 |
|
| Citigroup, Inc. | 2,627,580 | 122,602,883 |
|
| CME Group, Inc. | 358,400 | 21,812,224 |
|
| JPMorgan Chase & Co. | 3,450,882 | 169,127,727 |
|
| | | 395,670,156 |
| Diversified telecommunication services (1.3%) | | |
| AT&T, Inc. | 626,800 | 23,479,928 |
|
| Verizon Communications, Inc. S | 763,959 | 41,185,030 |
|
| | | 64,664,958 |
| |
| 18 | The Putnam Fund for Growth and Income |
| | |
| COMMON STOCKS (97.7%)* cont. | Shares | Value |
|
| Electric utilities (1.7%) | | |
| Edison International | 288,000 | $15,494,400 |
|
| FirstEnergy Corp. | 628,300 | 29,278,780 |
|
| Great Plains Energy, Inc. | 566,541 | 13,670,634 |
|
| NextEra Energy, Inc. | 150,000 | 12,304,500 |
|
| PPL Corp. S | 304,300 | 10,157,534 |
|
| | | 80,905,848 |
| Electrical equipment (0.2%) | | |
| Eaton Corp PLC | 122,300 | 7,510,443 |
|
| | | 7,510,443 |
| Electronic equipment, instruments, and components (0.4%) | | |
| Corning, Inc. | 1,276,400 | 18,507,800 |
|
| | | 18,507,800 |
| Energy equipment and services (3.8%) | | |
| Cameron International Corp. † | 201,200 | 12,383,860 |
|
| Halliburton Co. | 1,350,700 | 57,769,439 |
|
| McDermott International, Inc. † | 1,359,400 | 14,518,392 |
|
| Nabors Industries, Ltd. | 1,404,400 | 20,771,076 |
|
| Oil States International, Inc. † | 141,100 | 12,608,696 |
|
| Petrofac, Ltd. (United Kingdom) | 311,424 | 6,541,929 |
|
| Schlumberger, Ltd. | 263,839 | 19,637,537 |
|
| Transocean, Ltd. (Switzerland) † | 262,900 | 13,531,463 |
|
| Weatherford International, Ltd. † S | 2,128,655 | 27,225,497 |
|
| | | 184,987,889 |
| Food and staples retail (1.7%) | | |
| CVS Caremark Corp. | 575,000 | 33,453,500 |
|
| Kroger Co. (The) | 485,700 | 16,698,366 |
|
| Walgreen Co. | 685,600 | 33,944,056 |
|
| | | 84,095,922 |
| Food products (0.5%) | | |
| Hillshire Brands Co. | 438,620 | 15,750,844 |
|
| Kellogg Co. | 113,400 | 7,375,536 |
|
| Pinnacle Foods, Inc. † S | 120,990 | 2,888,031 |
|
| | | 26,014,411 |
| Health-care equipment and supplies (2.1%) | | |
| Baxter International, Inc. | 685,100 | 47,867,937 |
|
| Covidien PLC | 628,572 | 40,128,036 |
|
| St. Jude Medical, Inc. S | 332,200 | 13,693,284 |
|
| | | 101,689,257 |
| Health-care providers and services (3.3%) | | |
| Aetna, Inc. S | 691,400 | 39,714,016 |
|
| CIGNA Corp. | 292,500 | 19,354,725 |
|
| Emeritus Corp. † | 285,700 | 7,342,490 |
|
| Express Scripts Holding Co. † | 161,600 | 9,594,192 |
|
| Humana, Inc. | 372,000 | 27,568,920 |
|
| UnitedHealth Group, Inc. | 963,600 | 57,748,548 |
|
| | | 161,322,891 |
| Hotels, restaurants, and leisure (0.2%) | | |
| McDonald’s Corp. | 110,800 | 11,317,112 |
|
| | | 11,317,112 |
| Household products (0.5%) | | |
| Procter & Gamble Co. (The) | 348,800 | 26,777,376 |
|
| | | 26,777,376 |
| |
| The Putnam Fund for Growth and Income | 19 |
| | |
| COMMON STOCKS (97.7%)* cont. | Shares | Value |
|
| Independent power producers and energy traders (1.1%) | | |
| Calpine Corp. † | 1,622,926 | $35,266,182 |
|
| NRG Energy, Inc. S | 693,700 | 19,333,419 |
|
| | | 54,599,601 |
| Industrial conglomerates (1.3%) | | |
| General Electric Co. | 2,922,820 | 65,149,658 |
|
| | | 65,149,658 |
| Insurance (6.8%) | | |
| ACE, Ltd. | 319,000 | 28,435,660 |
|
| Aflac, Inc. | 281,300 | 15,313,972 |
|
| Allstate Corp. (The) | 1,063,700 | 52,397,862 |
|
| American International Group, Inc. † | 738,925 | 30,606,274 |
|
| Assured Guaranty, Ltd. | 590,980 | 12,191,917 |
|
| Chubb Corp. (The) | 107,675 | 9,482,937 |
|
| Everest Re Group, Ltd. | 94,320 | 12,732,257 |
|
| Hartford Financial Services Group, Inc. (The) | 1,219,600 | 34,258,564 |
|
| Lincoln National Corp. S | 606,400 | 20,623,664 |
|
| Marsh & McLennan Cos., Inc. | 251,000 | 9,540,510 |
|
| MetLife, Inc. | 1,547,987 | 60,356,013 |
|
| Prudential Financial, Inc. | 244,900 | 14,796,858 |
|
| Prudential PLC (United Kingdom) | 968,062 | 16,623,940 |
|
| XL Group PLC | 480,300 | 14,956,542 |
|
| | | 332,316,970 |
| Internet software and services (0.2%) | | |
| Yahoo!, Inc. † | 404,600 | 10,005,758 |
|
| | | 10,005,758 |
| IT Services (0.8%) | | |
| Computer Sciences Corp. | 152,000 | 7,121,200 |
|
| Fidelity National Information Services, Inc. | 182,500 | 7,674,125 |
|
| IBM Corp. | 55,300 | 11,200,462 |
|
| Total Systems Services, Inc. | 595,200 | 14,058,624 |
|
| | | 40,054,411 |
| Leisure equipment and products (0.4%) | | |
| Hasbro, Inc. S | 262,800 | 12,448,836 |
|
| LeapFrog Enterprises, Inc. † S | 692,600 | 6,191,844 |
|
| | | 18,640,680 |
| Machinery (0.9%) | | |
| Ingersoll-Rand PLC | 225,400 | 12,126,520 |
|
| Joy Global, Inc. S | 436,600 | 24,676,632 |
|
| Stanley Black & Decker, Inc. | 118,700 | 8,879,947 |
|
| | | 45,683,099 |
| Marine (0.2%) | | |
| Kirby Corp. † S | 120,300 | 9,009,267 |
|
| | | 9,009,267 |
| Media (4.5%) | | |
| CBS Corp. Class B | 213,100 | 9,755,718 |
|
| Comcast Corp. Class A | 1,409,900 | 58,228,870 |
|
| DISH Network Corp. Class A | 1,202,100 | 47,110,299 |
|
| Liberty Global, Inc. Ser. C † | 174,300 | 11,791,395 |
|
| Time Warner Cable, Inc. | 180,380 | 16,935,878 |
|
| Time Warner, Inc. | 712,900 | 42,617,162 |
|
| Viacom, Inc. Class B | 316,700 | 20,265,633 |
|
| Walt Disney Co. (The) | 192,200 | 12,077,848 |
|
| | | 218,782,803 |
|
| 20 The Putnam Fund for Growth and Income |
| | |
| COMMON STOCKS (97.7%)* cont. | Shares | Value |
|
| Metals and mining (1.8%) | | |
| Barrick Gold Corp. (Canada) | 781,500 | $15,403,365 |
|
| Freeport-McMoRan Copper & Gold, Inc. Class B (Indonesia) | 1,257,038 | 38,251,666 |
|
| Goldcorp, Inc. (Canada) | 168,700 | 4,990,146 |
|
| Newmont Mining Corp. | 106,000 | 3,434,400 |
|
| Nucor Corp. S | 200,300 | 8,737,086 |
|
| Rio Tinto PLC (United Kingdom) | 158,742 | 7,202,388 |
|
| ThyssenKrupp AG (Germany) † | 441,756 | 7,991,940 |
|
| | | 86,010,991 |
| Multi-utilities (1.3%) | | |
| Ameren Corp. | 736,000 | 26,680,000 |
|
| CMS Energy Corp. S | 271,100 | 8,116,734 |
|
| National Grid PLC (United Kingdom) | 784,916 | 10,003,037 |
|
| PG&E Corp. | 413,400 | 20,025,096 |
|
| | | 64,824,867 |
| Multiline retail (1.1%) | | |
| J.C. Penney Co., Inc. S | 330,900 | 5,433,378 |
|
| Macy’s, Inc. | 495,800 | 22,112,680 |
|
| Target Corp. | 377,800 | 26,657,568 |
|
| | | 54,203,626 |
| Office electronics (0.3%) | | |
| Xerox Corp. | 1,506,300 | 12,924,054 |
|
| | | 12,924,054 |
| Oil, gas, and consumable fuels (11.1%) | | |
| Anadarko Petroleum Corp. | 233,600 | 19,799,936 |
|
| Apache Corp. | 203,022 | 14,999,265 |
|
| Cabot Oil & Gas Corp. | 421,600 | 28,689,880 |
|
| Chevron Corp. | 745,500 | 90,958,455 |
|
| ConocoPhillips | 229,700 | 13,885,365 |
|
| CONSOL Energy, Inc. | 210,400 | 7,077,856 |
|
| Energen Corp. | 131,500 | 6,235,730 |
|
| Exxon Mobil Corp. | 533,092 | 47,439,857 |
|
| Gulfport Energy Corp. † | 312,200 | 16,293,718 |
|
| Hess Corp. | 246,800 | 17,814,024 |
|
| Marathon Oil Corp. | 1,561,800 | 51,024,006 |
|
| Noble Energy, Inc. | 197,000 | 22,318,130 |
|
| Nordic American Tankers, Ltd. (Norway) | 609,800 | 5,433,318 |
|
| Occidental Petroleum Corp. | 702,414 | 62,697,474 |
|
| Royal Dutch Shell PLC ADR (United Kingdom) | 1,145,599 | 77,866,364 |
|
| Southwestern Energy Co. † | 891,400 | 33,356,188 |
|
| Suncor Energy, Inc. (Canada) | 370,064 | 11,537,754 |
|
| Total SA ADR (France) | 308,600 | 15,504,064 |
|
| | | 542,931,384 |
| Paper and forest products (0.5%) | | |
| International Paper Co. | 483,400 | 22,710,132 |
|
| | | 22,710,132 |
| Personal products (0.2%) | | |
| Herbalife, Ltd. S | 264,600 | 10,507,266 |
|
| | | 10,507,266 |
| Pharmaceuticals (8.3%) | | |
| AbbVie, Inc. | 443,900 | 20,441,595 |
|
| Actavis, Inc. † | 130,100 | 13,755,473 |
|
| |
| The Putnam Fund for Growth and Income | 21 |
| | |
| COMMON STOCKS (97.7%)* cont. | Shares | Value |
|
| Pharmaceuticals cont. | | |
| Eli Lilly & Co. | 577,000 | $31,954,260 |
|
| Johnson & Johnson | 1,176,400 | 100,264,572 |
|
| Merck & Co., Inc. | 1,978,091 | 92,970,277 |
|
| Pfizer, Inc. | 3,885,845 | 112,961,514 |
|
| Sanofi ADR (France) S | 207,300 | 11,059,455 |
|
| Shire PLC ADR (United Kingdom) S | 130,700 | 12,238,748 |
|
| Teva Pharmaceutical Industries, Ltd. ADR (Israel) S | 238,200 | 9,120,678 |
|
| | | 404,766,572 |
| Real estate investment trusts (REITs) (0.1%) | | |
| Equity Lifestyle Properties, Inc. | 66,100 | 5,370,625 |
|
| | | 5,370,625 |
| Semiconductors and semiconductor equipment (2.0%) | | |
| Intel Corp. S | 909,500 | 21,782,525 |
|
| Lam Research Corp. † | 388,550 | 17,958,781 |
|
| Micron Technology, Inc. † S | 783,300 | 7,378,686 |
|
| Samsung Electronics Co., Ltd. (South Korea) | 12,613 | 17,408,299 |
|
| SK Hynix, Inc. (South Korea) † | 464,220 | 12,603,449 |
|
| Texas Instruments, Inc. | 341,200 | 12,354,852 |
|
| Xilinx, Inc. | 192,200 | 7,286,302 |
|
| | | 96,772,894 |
| Software (1.1%) | | |
| Microsoft Corp. | 1,223,400 | 40,494,540 |
|
| Oracle Corp. | 338,000 | 11,079,640 |
|
| | | 51,574,180 |
| Specialty retail (1.9%) | | |
| American Eagle Outfitters, Inc. | 614,100 | 11,944,245 |
|
| Bed Bath & Beyond, Inc. † | 390,100 | 26,838,880 |
|
| Best Buy Co., Inc. S | 302,600 | 7,864,574 |
|
| Lowe’s Cos., Inc. | 558,700 | 21,465,254 |
|
| Office Depot, Inc. † | 5,042,100 | 19,462,506 |
|
| Staples, Inc. S | 574,600 | 7,607,704 |
|
| | | 95,183,163 |
| Tobacco (1.3%) | | |
| Altria Group, Inc. | 540,900 | 19,748,259 |
|
| Lorillard, Inc. S | 178,300 | 7,647,287 |
|
| Philip Morris International, Inc. | 378,700 | 36,199,933 |
|
| | | 63,595,479 |
| Trading companies and distributors (0.1%) | | |
| Rexel SA (France) | 196,384 | 4,322,174 |
|
| | | 4,322,174 |
| Wireless telecommunication services (0.4%) | | |
| Vodafone Group PLC ADR (United Kingdom) | 693,700 | 21,220,284 |
|
| | | 21,220,284 |
| | | |
| Total common stocks (cost $4,055,212,329) | | $4,779,657,389 |
|
| |
| CONVERTIBLE PREFERRED STOCKS (0.3%)* | Shares | Value |
|
| General Motors Co. Ser. B, $2.375 cv. pfd. | 315,309 | $14,661,869 |
|
| Total convertible preferred stocks (cost $10,591,296) | | $14,661,869 |
|
| 22 The Putnam Fund for Growth and Income |
| | | | |
| WARRANTS (0.1%)*† | Expiration | Strike | | |
| | date | price | Warrants | Value |
|
| HRT Participacoes EM Petroleo | | | | |
| SA 144A (Brazil) | 4/4/16 | $0.00001 | 1,999,969 | $4,351,019 |
|
| Total warrants (cost $4,512,047) | | | | $4,351,019 |
| | |
| SHORT-TERM INVESTMENTS (6.4%)* | Principal amount/shares | Value |
|
| Putnam Cash Collateral Pool, LLC 0.18% d | 221,551,313 | $221,551,313 |
|
| Putnam Short Term Investment Fund 0.04% L | 88,709,358 | 88,709,358 |
|
| U.S. Treasury Bills with an effective yield of 0.13%, | | |
| January 9, 2014 | $260,000 | 259,831 |
|
| U.S. Treasury Bills with effective yields ranging from 0.16% | | |
| to 0.18%, October 17, 2013 | 1,668,000 | 1,667,393 |
|
| Total short-term investments (cost $312,187,083) | | $312,187,895 |
|
| |
| TOTAL INVESTMENTS | | |
|
| Total investments (cost $4,382,502,755) | | $5,110,858,172 |
Key to holding’s abbreviations
ADR American Depository Receipts: represents ownership of foreign securities on deposit with a custodian bank
Notes to the fund’s portfolio
Unless noted otherwise, the notes to the fund’s portfolio are for the close of the fund’s reporting period, which ran from November 1, 2012 through April 30, 2013 (the reporting period). Within the following notes to the portfolio, references to “ASC 820” represent Accounting Standards Codification ASC 820 Fair Value Measurements and Disclosures and references to “OTC”, if any, represent over-the-counter.
* Percentages indicated are based on net assets of $4,890,165,418.
† Non-income-producing security.
d Affiliated company. See Note 1 to the financial statements regarding securities lending. The rate quoted in the security description is the annualized 7-day yield of the fund at the close of the reporting period.
L Affiliated company (Note 6). The rate quoted in the security description is the annualized 7-day yield of the fund at the close of the reporting period.
S Security on loan, in part or in entirety, at the close of the reporting period (Note 1).
144A after the name of an issuer represents securities exempt from registration under Rule 144A under the Securities Act of 1933, as amended. These securities may be resold in transactions exempt from registration, normally to qualified institutional buyers.
| | | | | | |
| OTC TOTAL RETURN SWAP CONTRACTS OUTSTANDING at 4/30/13 (Unaudited) | |
| | |
| | | | | Fixed payments | Total return | Unrealized |
| Swap counterparty/ | Termination | | received (paid) by | received by | appreciation/ |
| Notional amount | date | | fund per annum | or paid by fund | (depreciation) |
|
|
| Goldman Sachs International | | | | | |
| shares | 485,799 | 8/16/13 | | (1 month USD- | EMC Corp. | $(318,571) |
| | | | | LIBOR-BBA plus | | |
| | | | | 0.40%) | | |
|
| shares | 78,188 | 8/16/13 | | 1 month USD- | VMware, Inc. | 621,210 |
| | | | | LIBOR-BBA minus | | |
| | | | | 0.35% | | |
|
| |
| The Putnam Fund for Growth and Income | 23 |
| | | | | | |
| OTC TOTAL RETURN SWAP CONTRACTS OUTSTANDING at 4/30/13 (Unaudited) cont. | |
| |
| | | | | Fixed payments | Total return | Unrealized |
| Swap counterparty/ | Termination | | received (paid) by | received by | appreciation/ |
| Notional amount | date | | fund per annum | or paid by fund | (depreciation) |
|
| Goldman Sachs International cont. | | | | | |
| shares | $851,194 | 8/16/13 | | (1 month USD- | EMC Corp. | $(558,185) |
| | | | | LIBOR-BBA plus | | |
| | | | | 40 bp) | | |
|
| shares | 137,553 | 8/16/13 | | 1 month USD- | VMware, Inc. | 1,093,004 |
| | | | | LIBOR-BBA minus | | |
| | | | | 35 bp | | |
|
| Total | | | | | | $837,458 |
ASC 820 establishes a three-level hierarchy for disclosure of fair value measurements. The valuation hierarchy is based upon the transparency of inputs to the valuation of the fund’s investments. The three levels are defined as follows:
Level 1: Valuations based on quoted prices for identical securities in active markets.
Level 2: Valuations based on quoted prices in markets that are not active or for which all significant inputs are observable, either directly or indirectly.
Level 3: Valuations based on inputs that are unobservable and significant to the fair value measurement.
The following is a summary of the inputs used to value the fund’s net assets as of the close of the reporting period:
| | | |
| | | Valuation inputs | |
|
| Investments in securities: | Level 1 | Level 2 | Level 3 |
|
| Common stocks: | | | |
|
| Consumer discretionary | $477,868,764 | $11,614,157 | $— |
|
| Consumer staples | 262,348,296 | — | — |
|
| Energy | 721,377,344 | 6,541,929 | — |
|
| Financials | 1,122,622,748 | 25,839,079 | — |
|
| Health care | 669,468,209 | — | — |
|
| Industrials | 471,571,350 | 4,322,174 | — |
|
| Information technology | 478,648,501 | 6,591,058 | — |
|
| Materials | 219,433,894 | 15,194,328 | — |
|
| Telecommunication services | 85,885,242 | — | — |
|
| Utilities | 190,327,279 | 10,003,037 | — |
|
| Total common stocks | 4,699,551,627 | 80,105,762 | — |
| | | | |
| Convertible preferred stocks | — | 14,661,869 | — |
|
| Warrants | — | 4,351,019 | — |
|
| Short-term investments | 88,709,358 | 223,478,537 | — |
|
| Totals by level | $4,788,260,985 | $322,597,187 | $— |
| | | | |
| | | Valuation inputs | |
|
| Other financial instruments: | Level 1 | Level 2 | Level 3 |
|
| Total return swap contracts | $— | $837,458 | $— |
|
| Totals by level | $— | $837,458 | $— |
The accompanying notes are an integral part of these financial statements.
The accompanying notes are an integral part of these financial statements.
|
| 24 The Putnam Fund for Growth and Income |
Statement of assets and liabilities 4/30/13 (Unaudited)
| |
| ASSETS | |
|
| Investment in securities, at value, including $214,462,103 of securities on loan (Note 1): | |
| Unaffiliated issuers (identified cost $4,072,242,084) | $4,800,597,501 |
| Affiliated issuers (identified cost $310,260,671) (Notes 1 and 6) | 310,260,671 |
|
| Cash | 244,523 |
|
| Foreign currency (cost $8) (Note 1) | 8 |
|
| Dividends, interest and other receivables | 19,241,281 |
|
| Receivable for shares of the fund sold | 914,917 |
|
| Receivable for investments sold | 41,804,311 |
|
| Unrealized appreciation on OTC swap contracts (Note 1) | 1,714,214 |
|
| Total assets | 5,174,777,426 |
| |
| LIABILITIES | |
|
| Payable for investments purchased | 51,180,412 |
|
| Payable for shares of the fund repurchased | 4,513,838 |
|
| Payable for compensation of Manager (Note 2) | 1,903,942 |
|
| Payable for custodian fees (Note 2) | 18,162 |
|
| Payable for investor servicing fees (Note 2) | 1,043,825 |
|
| Payable for Trustee compensation and expenses (Note 2) | 1,906,754 |
|
| Payable for administrative services (Note 2) | 8,867 |
|
| Payable for distribution fees (Note 2) | 1,074,156 |
|
| Unrealized depreciation on OTC swap contracts (Note 1) | 876,756 |
|
| Collateral on securities loaned, at value (Note 1) | 221,551,313 |
|
| Other accrued expenses | 533,983 |
|
| Total liabilities | 284,612,008 |
| | |
| Net assets | $4,890,165,418 |
|
| |
| REPRESENTED BY | |
|
| Paid-in capital (Unlimited shares authorized) (Notes 1 and 4) | $5,721,789,569 |
|
| Undistributed net investment income (Note 1) | 1,038,060 |
|
| Accumulated net realized loss on investments and foreign currency transactions (Note 1) | (1,561,847,771) |
|
| Net unrealized appreciation of investments | 729,185,560 |
|
| Total — Representing net assets applicable to capital shares outstanding | $4,890,165,418 |
(Continued on next page)
| | |
| | The Putnam Fund for Growth and Income | 25 |
Statement of assets and liabilities (Continued)
| |
| COMPUTATION OF NET ASSET VALUE AND OFFERING PRICE | |
|
| Net asset value and redemption price per class A share | |
| ($4,663,643,105 divided by 276,913,387 shares) | $16.84 |
|
| Offering price per class A share (100/94.25 of $16.84)* | $17.87 |
|
| Net asset value and offering price per class B share ($92,485,330 divided by 5,592,528 shares)** | $16.54 |
|
| Net asset value and offering price per class C share ($42,148,774 divided by 2,513,546 shares)** | $16.77 |
|
| Net asset value and redemption price per class M share ($33,652,208 divided by 2,014,911 shares) | $16.70 |
|
| Offering price per class M share (100/96.50 of $16.70)* | $17.31 |
|
| Net asset value, offering price and redemption price per class R share | |
| ($3,632,179 divided by 216,827 shares) | $16.75 |
|
| Net asset value, offering price and redemption price per class R5 share | |
| ($12,570 divided by 744 shares)† | $16.89 |
|
| Net asset value, offering price and redemption price per class R6 share | |
| ($16,747,780 divided by 991,455 shares) | $16.89 |
|
| Net asset value, offering price and redemption price per class Y share | |
| ($37,843,472 divided by 2,241,951 shares) | $16.88 |
|
* On single retail sales of less than $50,000. On sales of $50,000 or more the offering price is reduced.
** Redemption price per share is equal to net asset value less any applicable contingent deferred sales charge.
† Net asset value may not recalculate due to rounding of fractional shares.
The accompanying notes are an integral part of these financial statements.
|
| 26 The Putnam Fund for Growth and Income |
Statement of operations Six months ended 4/30/13 (Unaudited)
| |
| INVESTMENT INCOME | |
|
| Dividends (net of foreign tax of $464,500) | $57,241,607 |
|
| Interest (including interest income of $32,988 from investments in affiliated issuers) (Note 6) | 34,509 |
|
| Securities lending (Note 1) | 1,052,638 |
|
| Total investment income | 58,328,754 |
| |
| EXPENSES | |
|
| Compensation of Manager (Note 2) | 11,093,764 |
|
| Investor servicing fees (Note 2) | 6,699,397 |
|
| Custodian fees (Note 2) | 26,459 |
|
| Trustee compensation and expenses (Note 2) | 251,880 |
|
| Distribution fees (Note 2) | 6,246,285 |
|
| Administrative services (Note 2) | 82,767 |
|
| Other | 612,305 |
|
| Total expenses | 25,012,857 |
| | |
| Expense reduction (Note 2) | (159,409) |
|
| Net expenses | 24,853,448 |
| | |
| Net investment income | 33,475,306 |
|
| |
| Net realized gain on investments (Notes 1 and 3) | 308,839,355 |
|
| Net realized loss on swap contracts (Note 1) | (632,319) |
|
| Net realized gain on foreign currency transactions (Note 1) | 11,905 |
|
| Net unrealized depreciation of assets and liabilities in foreign currencies during the period | (8,893) |
|
| Net unrealized appreciation of investments and swap contracts during the period | 393,325,190 |
|
| Net gain on investments | 701,535,238 |
| | |
| Net increase in net assets resulting from operations | $735,010,544 |
|
The accompanying notes are an integral part of these financial statements.
| |
| The Putnam Fund for Growth and Income | 27 |
Statement of changes in net assets
| | |
| INCREASE IN NET ASSETS | Six months ended 4/30/13* | Year ended 10/31/12 |
|
| Operations: | | |
| Net investment income | $33,475,306 | $68,325,237 |
|
| Net realized gain on investments | | |
| and foreign currency transactions | 308,218,941 | 346,486,184 |
|
| Net unrealized appreciation of investments and assets | | |
| and liabilities in foreign currencies | 393,316,297 | 213,748,319 |
|
| Net increase in net assets resulting from operations | 735,010,544 | 628,559,740 |
|
| Distributions to shareholders (Note 1): | | |
| From ordinary income | | |
| Net investment income | | |
|
| Class A | (39,584,581) | (68,349,542) |
|
| Class B | (494,835) | (904,433) |
|
| Class C | (210,265) | (325,159) |
|
| Class M | (211,099) | (367,758) |
|
| Class R | (25,148) | (45,998) |
|
| Class R5 | (124) | (42) |
|
| Class R6 | (130) | (43) |
|
| Class Y | (516,065) | (797,314) |
|
| Decrease from capital share transactions (Note 4) | (246,333,246) | (517,267,352) |
|
| Total increase in net assets | 447,635,051 | 40,502,099 |
| |
| NET ASSETS | | |
|
| Beginning of period | 4,442,530,367 | 4,402,028,268 |
|
| End of period (including undistributed net investment | | |
| income of $1,038,060 and $8,605,001, respectively) | $4,890,165,418 | $4,442,530,367 |
|
* Unaudited
The accompanying notes are an integral part of these financial statements.
|
| 28 The Putnam Fund for Growth and Income |
|
| This page left blank intentionally. |
|
| The Putnam Fund for Growth and Income 29 |
Financial highlights (For a common share outstanding throughout the period)
| | | | | | | | | | | | | | | | |
| INVESTMENT OPERATIONS: | | | | LESS DISTRIBUTIONS: | | | | | | | RATIOS AND SUPPLEMENTAL DATA: | |
|
| | | | | | | | | | | | | | | | Ratio | |
| | Net asset | Net | Net realized | | From | From | | | | | | | | Ratio | of net investment | |
| | value, | investment | and unrealized | Total from | net | net realized | From | | | | | | Net assets, | of expenses | income (loss) | |
| | beginning | income | gain (loss) | investment | investment | gain | return | Total | Redemption | Non-recurring | Net asset value, | Total return at net | end of period | to average | to average | Portfolio |
| Period ended | of period | (loss) a | on investments | operations | income | on investments | of capital | distributions | fees | reimbursements | end of period | asset value (%) b | (in thousands) | net assets (%) c | net assets (%) | turnover (%) |
|
| Class A | | | | | | | | | | | | | | | | |
| April 30, 2013** | $14.51 | .11 | 2.36 | 2.47 | (.14) | — | — | (.14) | — | — | $16.84 | 17.12* | $4,663,643 | .53* | .73* | 22* |
| October 31, 2012 | 12.79 | .21 | 1.73 | 1.94 | (.22) | — | — | (.22) | — | — | 14.51 | 15.33 | 4,232,973 | 1.10 | 1.57 | 34 |
| October 31, 2011 | 12.56 | .16 | .21 | .37 | (.15) | — | — | (.15) | — | .01 d | 12.79 | 2.99 | 4,176,494 | 1.10 | 1.17 | 45 |
| October 31, 2010 | 11.15 | .12 | 1.40 | 1.52 | (.11) | — | — | (.11) | — e | — | 12.56 | 13.65 | 4,607,805 | 1.16 | .99 | 48 |
| October 31, 2009 | 10.09 | .15 | 1.11 f,g | 1.26 | (.20) | — | — e | (.20) | — e | — e,h | 11.15 | 12.99 f,g | 4,631,517 | 1.21 i | 1.52 i | 57 |
| October 31, 2008 | 20.26 | .24 | (7.27) | (7.03) | (.31) | (2.83) | — | (3.14) | — e | — | 10.09 | (40.22) | 4,754,294 | 1.00 i | 1.71 i | 35 |
|
| Class B | | | | | | | | | | | | | | | | |
| April 30, 2013** | $14.25 | .06 | 2.31 | 2.37 | (.08) | — | — | (.08) | — | — | $16.54 | 16.71* | $92,485 | .90* | .37* | 22* |
| October 31, 2012 | 12.56 | .11 | 1.70 | 1.81 | (.12) | — | — | (.12) | — | — | 14.25 | 14.50 | 91,289 | 1.85 | .84 | 34 |
| October 31, 2011 | 12.34 | .06 | .19 | .25 | (.04) | — | — | (.04) | — | .01 d | 12.56 | 2.14 | 108,621 | 1.85 | .41 | 45 |
| October 31, 2010 | 10.95 | .03 | 1.38 | 1.41 | (.02) | — | — | (.02) | — e | — | 12.34 | 12.85 | 159,231 | 1.91 | .27 | 48 |
| October 31, 2009 | 9.91 | .08 | 1.09 f,g | 1.17 | (.13) | — | — e | (.13) | — e | — e,h | 10.95 | 12.11 f,g | 226,198 | 1.96 i | .85 i | 57 |
| October 31, 2008 | 19.94 | .13 | (7.14) | (7.01) | (.19) | (2.83) | — | (3.02) | — e | — | 9.91 | (40.68) | 319,813 | 1.75 i | .96 i | 35 |
|
| Class C | | | | | | | | | | | | | | | | |
| April 30, 2013** | $14.45 | .06 | 2.34 | 2.40 | (.08) | — | — | (.08) | — | — | $16.77 | 16.70* | $42,149 | .90* | .36* | 22* |
| October 31, 2012 | 12.74 | .11 | 1.72 | 1.83 | (.12) | — | — | (.12) | — | — | 14.45 | 14.46 | 36,561 | 1.85 | .82 | 34 |
| October 31, 2011 | 12.51 | .06 | .21 | .27 | (.05) | — | — | (.05) | — | .01 d | 12.74 | 2.21 | 36,035 | 1.85 | .42 | 45 |
| October 31, 2010 | 11.10 | .03 | 1.40 | 1.43 | (.02) | — | — | (.02) | — e | — | 12.51 | 12.88 | 37,264 | 1.91 | .24 | 48 |
| October 31, 2009 | 10.05 | .07 | 1.11 f,g | 1.18 | (.13) | — | — e | (.13) | — e | — e,h | 11.10 | 12.07 f,g | 37,309 | 1.96 i | .76 i | 57 |
| October 31, 2008 | 20.17 | .13 | (7.23) | (7.10) | (.19) | (2.83) | — | (3.02) | — e | — | 10.05 | (40.64) | 36,166 | 1.75 i | .96 i | 35 |
|
| Class M | | | | | | | | | | | | | | | | |
| April 30, 2013** | $14.39 | .07 | 2.34 | 2.41 | (.10) | — | — | (.10) | — | — | $16.70 | 16.84* | $33,652 | .78* | .49* | 22* |
| October 31, 2012 | 12.69 | .15 | 1.70 | 1.85 | (.15) | — | — | (.15) | — | — | 14.39 | 14.72 | 30,627 | 1.60 | 1.08 | 34 |
| October 31, 2011 | 12.46 | .09 | .21 | .30 | (.08) | — | — | (.08) | — | .01 d | 12.69 | 2.48 | 33,357 | 1.60 | .67 | 45 |
| October 31, 2010 | 11.06 | .06 | 1.39 | 1.45 | (.05) | — | — | (.05) | — e | — | 12.46 | 13.09 | 38,209 | 1.66 | .49 | 48 |
| October 31, 2009 | 10.01 | .10 | 1.10 f,g | 1.20 | (.15) | — | — e | (.15) | — e | — e,h | 11.06 | 12.40 f,g | 39,681 | 1.71 i | 1.00 i | 57 |
| October 31, 2008 | 20.11 | .17 | (7.21) | (7.04) | (.23) | (2.83) | — | (3.06) | — e | — | 10.01 | (40.50) | 36,633 | 1.50 i | 1.21 i | 35 |
|
| Class R | | | | | | | | | | | | | | | | |
| April 30, 2013** | $14.43 | .10 | 2.34 | 2.44 | (.12) | — | — | (.12) | — | — | $16.75 | 16.99* | $3,632 | .65* | .63* | 22* |
| October 31, 2012 | 12.72 | .18 | 1.72 | 1.90 | (.19) | — | — | (.19) | — | — | 14.43 | 15.06 | 3,446 | 1.35 | 1.31 | 34 |
| October 31, 2011 | 12.50 | .12 | .20 | .32 | (.11) | — | — | (.11) | — | .01 d | 12.72 | 2.65 | 3,151 | 1.35 | .92 | 45 |
| October 31, 2010 | 11.09 | .09 | 1.40 | 1.49 | (.08) | — | — | (.08) | — e | — | 12.50 | 13.45 | 3,554 | 1.41 | .74 | 48 |
| October 31, 2009 | 10.04 | .12 | 1.11 f,g | 1.23 | (.18) | — | — e | (.18) | — e | — e,h | 11.09 | 12.69 f,g | 3,579 | 1.46 i | 1.21 i | 57 |
| October 31, 2008 | 20.19 | .20 | (7.24) | (7.04) | (.28) | (2.83) | — | (3.11) | — e | — | 10.04 | (40.38) | 2,905 | 1.25 i | 1.44 i | 35 |
|
| Class R5 | | | | | | | | | | | | | | | | |
| April 30, 2013** | $14.54 | .14 | 2.38 | 2.52 | (.17) | — | — | (.17) | — | — | $16.89 | 17.44* | $13 | .33* | .92* | 22* |
| October 31, 2012† | 13.64 | .08 | .88 | .96 | (.06) | — | — | (.06) | — | — | 14.54 | 7.01* | 11 | .22* | .53* | 34 |
|
| Class R6 | | | | | | | | | | | | | | | | |
| April 30, 2013** | $14.54 | .06 | 2.47 | 2.53 | (.18) | — | — | (.18) | — | — | $16.89 | 17.50* | $17 | .29* | .35* | 22* |
| October 31, 2012† | 13.64 | .08 | .88 | .96 | (.06) | — | — | (.06) | — | — | 14.54 | 7.02* | 11 | .19* | .57* | 34 |
|
See notes to financial highlights at the end of this section.
The accompanying notes are an integral part of these financial statements.
| | |
| 30 The Putnam Fund for Growth and Income | The Putnam Fund for Growth and Income | 31 |
Financial highlights (Continued)
| | | | | | | | | | | | | | | | |
| INVESTMENT OPERATIONS: | | | | LESS DISTRIBUTIONS: | | | | | | | RATIOS AND SUPPLEMENTAL DATA: | |
|
| | | | | | | | | | | | | | | | Ratio | |
| | Net asset | Net | Net realized | | From | From | | | | | | | | Ratio | of net investment | |
| | value, | investment | and unrealized | Total from | net | net realized | From | | | | | | Net assets, | of expenses | income (loss) | |
| | beginning | income | gain (loss) | investment | investment | gain | return | Total | Redemption | Non-recurring | Net asset value, | Total return at net | end of period | to average | to average | Portfolio |
| Period ended | of period | (loss) a | on investments | operations | income | on investments | of capital | distributions | fees | reimbursements | end of period | asset value (%) b | (in thousands) | net assets (%) c | net assets (%) | turnover (%) |
|
| Class Y | | | | | | | | | | | | | | | | |
| April 30, 2013** | $14.54 | .14 | 2.36 | 2.50 | (.16) | — | — | (.16) | — | — | $16.88 | 17.31* | $37,843 | .40* | .89* | 22* |
| October 31, 2012 | 12.82 | .25 | 1.72 | 1.97 | (.25) | — | — | (.25) | — | — | 14.54 | 15.59 | 47,613 | .85 | 1.82 | 34 |
| October 31, 2011 | 12.59 | .20 | .20 | .40 | (.18) | — | — | (.18) | — | .01 d | 12.82 | 3.26 | 44,370 | .85 | 1.45 | 45 |
| October 31, 2010 | 11.17 | .15 | 1.41 | 1.56 | (.14) | — | — | (.14) | — e | — | 12.59 | 13.99 | 74,376 | .91 | 1.24 | 48 |
| October 31, 2009 | 10.12 | .20 | 1.08 f,g | 1.28 | (.23) | — | — e | (.23) | — e | — e,h | 11.17 | 13.15 f,g | 79,716 | .96 i | 2.37 i | 57 |
| October 31, 2008 | 20.31 | .27 | (7.28) | (7.01) | (.35) | (2.83) | — | (3.18) | — e | — | 10.12 | (40.06) | 654,582 | .75 i | 1.96 i | 35 |
|
* Not annualized.
** Unaudited.
† For the period July 3, 2012 (commencement of operations) to October 31, 2012.
a Per share net investment income (loss) has been determined on the basis of the weighted average number of shares outstanding during the period.
b Total return assumes dividend reinvestment and does not reflect the effect of sales charges.
c Includes amounts paid through expense offset and brokerage/service arrangements (Note 2).
d Reflects a non-recurring reimbursement related to restitution amounts in connection with a distribution plan approved by the Securities and Exchange Commission (the SEC) which amounted to $0.01 per share outstanding on July 21, 2011. Also reflects a non-recurring reimbursement related to short-term trading related lawsuits, which amounted to less than $0.01 per share outstanding on May 11, 2011.
e Amount represents less than $0.01 per share.
f Reflects a non-recurring litigation payment received by the fund from Enron Corporation which amounted to $0.05 per share outstanding on December 29, 2008. This payment resulted in an increase to total returns of 0.51% for the year ended October 31, 2009.
g Reflects a non-recurring litigation payment received by the fund from Tyco International, Ltd. which amounted to $0.07 per share outstanding on March 13, 2009. This payment resulted in an increase to total returns of 0.71% for the year ended October 31, 2009.
h Reflects a non-recurring reimbursement pursuant to a settlement between the SEC and Bear Stearns & Co., Inc. and Bear Stearns Securities Corp., which amounted to less than $0.01 per share outstanding as of May 21, 2009.
i Reflects an involuntary contractual expense limitation in effect during the period. For periods prior to October 31, 2009, certain fund expenses were waived in connection with investments in Putnam Prime Money Market Fund. As a result of such limitation and/or waivers, the expenses of each class reflect a reduction of the following amounts:
| |
| | Percentage of |
| | average net assets |
|
| October 31, 2009 | 0.02% |
|
| October 31, 2008 | <0.01 |
|
The accompanying notes are an integral part of these financial statements.
| | |
| 32 The Putnam Fund for Growth and Income | The Putnam Fund for Growth and Income | 33 |
Notes to financial statements 4/30/13 (Unaudited)
Within the following Notes to financial statements, references to “State Street” represent State Street Bank and Trust Company, references to “the SEC” represent the Securities and Exchange Commission, references to “Putnam Management” represent Putnam Investment Management, LLC, the fund’s manager, an indirect wholly-owned subsidiary of Putnam Investments, LLC and references to “OTC”, if any, represent over-the-counter. Unless otherwise noted, the “reporting period” represents the period from November 1, 2012 through April 30, 2013.
The Putnam Fund for Growth and Income (the fund) is a Massachusetts business trust, which is registered under the Investment Company Act of 1940, as amended, as a diversified open-end management investment company. The investment objective of the fund is to seek capital growth and current income by investing mainly in common stocks of large U.S. companies, with a focus on value stocks that offer the potential for capital growth, current income, or both. Value stocks are issued by companies that we believe are currently undervalued by the market.
The fund offers class A, class B, class C, class M, class R, class R5, class R6 and class Y shares. Class A and class M shares are sold with a maximum front-end sales charge of 5.75% and 3.50%, respectively, and generally do not pay a contingent deferred sales charge. Class B shares, which convert to class A shares after approximately eight years, do not pay a front-end sales charge and are subject to a contingent deferred sales charge if those shares are redeemed within six years of purchase. Class C shares have a one-year 1.00% contingent deferred sales charge and do not convert to class A shares. Class R shares, which are not available to all investors, are sold at net asset value. The expenses for class A, class B, class C, class M and class R shares may differ based on the distribution fee of each class, which is identified in Note 2. Class R5, class R6 and class Y shares, which are sold at net asset value, are generally subject to the same expenses as class A, class B, class C, class M and class R shares, but do not bear a distribution fee and in the case of class R5 and class R6 shares, bear a lower investor servicing fee, which is identified in Note 2. Class R5, class R6 and class Y shares are not available to all investors.
In the normal course of business, the fund enters into contracts that may include agreements to indemnify another party under given circumstances. The fund’s maximum exposure under these arrangements is unknown as this would involve future claims that may be, but have not yet been, made against the fund. However, the fund’s management team expects the risk of material loss to be remote.
Note 1: Significant accounting policies
The following is a summary of significant accounting policies consistently followed by the fund in the preparation of its financial statements. The preparation of financial statements is in conformity with accounting principles generally accepted in the United States of America and requires management to make estimates and assumptions that affect the reported amounts of assets and liabilities in the financial statements and the reported amounts of increases and decreases in net assets from operations. Actual results could differ from those estimates. Subsequent events after the Statement of assets and liabilities date through the date that the financial statements were issued have been evaluated in the preparation of the financial statements.
Investment income, realized and unrealized gains and losses and expenses of the fund are borne pro-rata based on the relative net assets of each class to the total net assets of the fund, except that each class bears expenses unique to that class (including the distribution fees applicable to such classes). Each class votes as a class only with respect to its own distribution plan or other matters on which a class vote is required by law or determined by the Trustees. If the fund were liquidated, shares of each class would receive their pro-rata share of the net assets of the fund. In addition, the Trustees declare separate dividends on each class of shares.
Security valuation Investments for which market quotations are readily available are valued at the last reported sales price on their principal exchange, or official closing price for certain markets, and are classified as Level 1 securities under Accounting Standards Codification ASC 820 Fair Value Measurements and Disclosures (ASC 820). If no sales are reported, as in the case of some securities that are traded OTC, a security is valued at its last reported bid price and is generally categorized as a Level 2 security.
Investments in open-end investment companies (excluding exchange traded funds), if any, which can be classified as Level 1 or Level 2 securities, are based on their net asset value. The net asset value of such investment companies equals the total value of their assets less their liabilities and divided by the number of their outstanding shares.
Many securities markets and exchanges outside the U.S. close prior to the close of the New York Stock Exchange and therefore the closing prices for securities in such markets or on such exchanges may not fully reflect events that occur after such close but before the close of the New York Stock Exchange. Accordingly, on certain days,
|
| 34 The Putnam Fund for Growth and Income |
the fund will fair value foreign equity securities taking into account multiple factors including movements in the U.S. securities markets, currency valuations and comparisons to the valuation of American Depository Receipts, exchange-traded funds and futures contracts. These securities, which would generally be classified as Level 1 securities, will be transferred to Level 2 of the fair value hierarchy when they are valued at fair value. The number of days on which fair value prices will be used will depend on market activity and it is possible that fair value prices will be used by the fund to a significant extent. At the close of the reporting period, fair value pricing was used for certain foreign securities in the portfolio. Securities quoted in foreign currencies, if any, are translated into U.S. dollars at the current exchange rate.
To the extent a pricing service or dealer is unable to value a security or provides a valuation that Putnam Management does not believe accurately reflects the security’s fair value, the security will be valued at fair value by Putnam Management. Certain investments, including certain restricted and illiquid securities and derivatives, are also valued at fair value following procedures approved by the Trustees. These valuations consider such factors as significant market or specific security events such as interest rate or credit quality changes, various relationships with other securities, discount rates, U.S. Treasury, U.S. swap and credit yields, index levels, convexity exposures and recovery rates. These securities are classified as Level 2 or as Level 3 depending on the priority of the significant inputs.
Such valuations and procedures are reviewed periodically by the Trustees. The fair value of securities is generally determined as the amount that the fund could reasonably expect to realize from an orderly disposition of such securities over a reasonable period of time. By its nature, a fair value price is a good faith estimate of the value of a security in a current sale and does not reflect an actual market price, which may be different by a material amount.
Security transactions and related investment income Security transactions are recorded on the trade date (the date the order to buy or sell is executed). Gains or losses on securities sold are determined on the identified cost basis.
Interest income, net of any applicable withholding taxes, is recorded on the accrual basis. Dividend income, net of any applicable withholding taxes, is recognized on the ex-dividend date except that certain dividends from foreign securities, if any, are recognized as soon as the fund is informed of the ex-dividend date. Non-cash dividends, if any, are recorded at the fair market value of the securities received. Dividends representing a return of capital or capital gains, if any, are reflected as a reduction of cost and/or as a realized gain.
Foreign currency translation The accounting records of the fund are maintained in U.S. dollars. The market value of foreign securities, currency holdings, and other assets and liabilities is recorded in the books and records of the fund after translation to U.S. dollars based on the exchange rates on that day. The cost of each security is determined using historical exchange rates. Income and withholding taxes are translated at prevailing exchange rates when earned or incurred. The fund does not isolate that portion of realized or unrealized gains or losses resulting from changes in the foreign exchange rate on investments from fluctuations arising from changes in the market prices of the securities. Such gains and losses are included with the net realized and unrealized gain or loss on investments. Net realized gains and losses on foreign currency transactions represent net realized exchange gains or losses on closed forward currency contracts, disposition of foreign currencies, currency gains and losses realized between the trade and settlement dates on securities transactions and the difference between the amount of investment income and foreign withholding taxes recorded on the fund’s books and the U.S. dollar equivalent amounts actually received or paid. Net unrealized appreciation and depreciation of assets and liabilities in foreign currencies arise from changes in the value of open forward currency contracts and assets and liabilities other than investments at the period end, resulting from changes in the exchange rate.
Total return swap contracts The fund entered into OTC total return swap contracts, which are arrangements to exchange a market linked return for a periodic payment, both based on a notional principal amount, to hedge risk in a security it owns.
To the extent that the total return of the security, index or other financial measure underlying the transaction exceeds or falls short of the offsetting interest rate obligation, the fund will receive a payment from or make a payment to the counterparty. OTC total return swap contracts are marked to market daily based upon quotations from an independent pricing service or market makers and the change, if any, is recorded as an unrealized gain or loss. Payments received or made are recorded as realized gains or losses. Certain OTC total return swap contracts may include extended effective dates. Payments related to these swap contracts are accrued based on the terms of the contract. The fund could be exposed to credit or market risk due to unfavorable changes in the fluctuation of interest rates or in the price of the underlying security or index, the possibility that there is no liquid market for these agreements or that the counterparty may default on its obligation to perform. The fund’s maximum risk of loss from counterparty risk is the fair value of the contract. This risk may be mitigated by having a master
| |
| The Putnam Fund for Growth and Income | 35 |
netting arrangement between the fund and the counterparty. Risk of loss may exceed amounts recognized on the Statement of assets and liabilities.
OTC total return swap contracts outstanding at period end, if any, are listed after the fund’s portfolio. For the fund’s average notional amount, see Note 5.
Master agreements The fund is a party to ISDA (International Swaps and Derivatives Association, Inc.) Master Agreements (Master Agreements) with certain counterparties that govern OTC derivative and foreign exchange contracts entered into from time to time. The Master Agreements may contain provisions regarding, among other things, the parties’ general obligations, representations, agreements, collateral requirements, events of default and early termination. With respect to certain counterparties, in accordance with the terms of the Master Agreements, collateral posted to the fund is held in a segregated account by the fund’s custodian and with respect to those amounts which can be sold or repledged, are presented in the fund’s portfolio.
Collateral pledged by the fund is segregated by the fund’s custodian and identified in the fund’s portfolio. Collateral can be in the form of cash or debt securities issued by the U.S. Government or related agencies or other securities as agreed to by the fund and the applicable counterparty. Collateral requirements are determined based on the fund’s net position with each counterparty.
Termination events applicable to the fund may occur upon a decline in the fund’s net assets below a specified threshold over a certain period of time. Termination events applicable to counterparties may occur upon a decline in the counterparty’s long-term and short-term credit ratings below a specified level. In each case, upon occurrence, the other party may elect to terminate early and cause settlement of all derivative and foreign exchange contracts outstanding, including the payment of any losses and costs resulting from such early termination, as reasonably determined by the terminating party. Any decision by one or more of the fund’s counterparties to elect early termination could impact the fund’s future derivative activity.
At the close of the reporting period, the fund did not have a net liability position on open derivative contracts subject to the Master Agreements. Collateral posted by the fund for these agreements totaled $601,251.
Securities lending The fund may lend securities, through its agent, to qualified borrowers in order to earn additional income. The loans are collateralized by cash in an amount at least equal to the market value of the securities loaned. The market value of securities loaned is determined daily and any additional required collateral is allocated to the fund on the next business day. The risk of borrower default will be borne by the fund’s agent; the fund will bear the risk of loss with respect to the investment of the cash collateral. Income from securities lending is included in investment income on the Statement of operations. Cash collateral is invested in Putnam Cash Collateral Pool, LLC, a limited liability company managed by an affiliate of Putnam Management. Investments in Putnam Cash Collateral Pool, LLC are valued at its closing net asset value each business day. There are no management fees charged to Putnam Cash Collateral Pool, LLC. At the close of the reporting period, the value of securities loaned amounted to $217,040,374. Certain of these securities were sold prior to the close of the reporting period and are included in Receivable for investments sold on the Statement of assets and liabilities. The fund received cash collateral of $221,551,313.
Interfund lending The fund, along with other Putnam funds, may participate in an interfund lending program pursuant to an exemptive order issued by the SEC. This program allows the fund to borrow from or lend to other Putnam funds that permit such transactions. Interfund lending transactions are subject to each fund’s investment policies and borrowing and lending limits. Interest earned or paid on the interfund lending transaction will be based on the average of certain current market rates. During the reporting period, the fund did not utilize the program.
Line of credit The fund participates, along with other Putnam funds, in a $315 million unsecured committed line of credit and a $185 million unsecured uncommitted line of credit, both provided by State Street. Borrowings may be made for temporary or emergency purposes, including the funding of shareholder redemption requests and trade settlements. Interest is charged to the fund based on the fund’s borrowing at a rate equal to the Federal Funds rate plus 1.25% for the committed line of credit and the Federal Funds rate plus 1.30% for the uncommitted line of credit. A closing fee equal to 0.02% of the committed line of credit and $50,000 for the uncommitted line of credit has been paid by the participating funds. In addition, a commitment fee of 0.11% per annum on any unutilized portion of the committed line of credit is allocated to the participating funds based on their relative net assets and paid quarterly. During the reporting period, the fund had no borrowings against these arrangements.
Federal taxes It is the policy of the fund to distribute all of its taxable income within the prescribed time period and otherwise comply with the provisions of the Internal Revenue Code of 1986, as amended (the Code), applicable to regulated investment companies. It is also the intention of the fund to distribute an amount sufficient to avoid imposition of any excise tax under Section 4982 of the Code.
|
| 36 The Putnam Fund for Growth and Income |
The fund is subject to the provisions of Accounting Standards Codification ASC 740 Income Taxes (ASC 740). ASC 740 sets forth a minimum threshold for financial statement recognition of the benefit of a tax position taken or expected to be taken in a tax return. The fund did not have a liability to record for any unrecognized tax benefits in the accompanying financial statements. No provision has been made for federal taxes on income, capital gains or unrealized appreciation on securities held nor for excise tax on income and capital gains. Each of the fund’s federal tax returns for the prior three fiscal years remains subject to examination by the Internal Revenue Service.
The fund may also be subject to taxes imposed by governments of countries in which it invests. Such taxes are generally based on either income or gains earned or repatriated. The fund accrues and applies such taxes to net investment income, net realized gains and net unrealized gains as income and/or capital gains are earned. In some cases, the fund may be entitled to reclaim all or a portion of such taxes, and such reclaim amounts, if any, are reflected as an asset on the fund’s books. In many cases, however, the fund may not receive such amounts for an extended period of time, depending on the country of investment.
At October 31, 2012, the fund had a capital loss carryover of $1,800,765,175 available to the extent allowed by the Code to offset future net capital gain, if any. The amounts of the carryovers and the expiration dates are:
| | | |
| Loss carryover |
|
| Short-term | Long-term | Total | Expiration |
|
| $42,693,273 | $— | $42,693,273 | October 31, 2015 |
|
| 293,460,154 | — | 293,460,154 | October 31, 2016 |
|
| 1,464,611,748 | — | 1,464,611,748 | October 31, 2017 |
|
Under the Regulated Investment Company Modernization Act of 2010, the fund will be permitted to carry forward capital losses incurred in taxable years beginning after December 22, 2010 for an unlimited period. However, any losses incurred will be required to be utilized prior to the losses incurred in pre-enactment tax years. As a result of this ordering rule, pre-enactment capital loss carryforwards may be more likely to expire unused. Additionally, post-enactment capital losses that are carried forward will retain their character as either short-term or long-term capital losses rather than being considered all short-term as under previous law.
The aggregate identified cost on a tax basis is $4,451,804,292, resulting in gross unrealized appreciation and depreciation of $817,634,198 and $158,580,318, respectively, or net unrealized appreciation of $659,053,880.
Distributions to shareholders Distributions to shareholders from net investment income are recorded by the fund on the ex-dividend date. Distributions from capital gains, if any, are recorded on the ex-dividend date and paid at least annually. The amount and character of income and gains to be distributed are determined in accordance with income tax regulations, which may differ from generally accepted accounting principles. Dividend sources are estimated at the time of declaration. Actual results may vary. Any non-taxable return of capital cannot be determined until final tax calculations are completed after the end of the fund’s fiscal year. Reclassifications are made to the fund’s capital accounts to reflect income and gains available for distribution (or available capital loss carryovers) under income tax regulations.
Note 2: Management fee, administrative services and other transactions
The fund pays Putnam Management a management fee (based on the fund’s average net assets and computed and paid monthly) at annual rates that may vary based on the average of the aggregate net assets of most open-end funds, as defined in the fund’s management contract, sponsored by Putnam Management. Such annual rates may vary as follows:
| | | | |
| 0.630% | of the first $5 billion, | | 0.430% | of the next $50 billion, |
| |
|
| 0.580% | of the next $5 billion, | | 0.410% | of the next $50 billion, |
| |
|
| 0.530% | of the next $10 billion, | | 0.400% | of the next $100 billion and |
| |
|
| 0.480% | of the next $10 billion, | | 0.395% | of any excess thereafter. |
| |
|
Putnam Management has contractually agreed, through June 30, 2013, to waive fees or reimburse the fund’s expenses to the extent necessary to limit the cumulative expenses of the fund, exclusive of brokerage, interest, taxes, investment-related expenses, extraordinary expenses, acquired fund fees and expenses and payments under the fund’s investor servicing contract, investment management contract and distribution plans, on a fiscal
| |
| The Putnam Fund for Growth and Income | 37 |
year-to-date basis to an annual rate of 0.20% of the fund’s average net assets over such fiscal year-to-date period. During the reporting period, the fund’s expenses were not reduced as a result of this limit.
Putnam Investments Limited (PIL), an affiliate of Putnam Management, is authorized by the Trustees to manage a separate portion of the assets of the fund as determined by Putnam Management from time to time. Putnam Management pays a quarterly sub-management fee to PIL for its services at an annual rate of 0.35% of the average net assets of the portion of the fund managed by PIL.
The fund reimburses Putnam Management an allocated amount for the compensation and related expenses of certain officers of the fund and their staff who provide administrative services to the fund. The aggregate amount of all such reimbursements is determined annually by the Trustees.
Custodial functions for the fund’s assets are provided by State Street. Custody fees are based on the fund’s asset level, the number of its security holdings and transaction volumes.
Putnam Investor Services, Inc., an affiliate of Putnam Management, provides investor servicing agent functions to the fund. Putnam Investor Services, Inc. received fees for investor servicing (except for Class R5 and R6 shares) based on the fund’s retail asset level, the number of shareholder accounts in the fund and the level of defined contribution plan assets in the fund. Class R5 shares pay a monthly fee based on the average net assets of class R5 shares at an annual rate of 0.15%. Class R6 shares pay a monthly fee based on the average net assets of class R6 shares at an annual rate of 0.05%. Investor servicing fees will not exceed an annual rate of 0.32% of the fund’s average net assets. During the reporting period, the expenses for each class of shares related to investor servicing fees were as follows:
| | | | |
| Class A | $6,388,666 | | Class R5 | 9 |
| |
|
| Class B | 133,389 | | Class R6 | 683 |
| |
|
| Class C | 56,598 | | Class Y | 69,068 |
| |
|
| Class M | 46,093 | | Total | $6,699,397 |
| |
|
| Class R | 4,891 | | | |
| | |
The fund has entered into expense offset arrangements with Putnam Investor Services, Inc. and State Street whereby Putnam Investor Services, Inc.’s and State Street’s fees are reduced by credits allowed on cash balances. The fund also reduced expenses through brokerage/service arrangements. For the reporting period, the fund’s expenses were reduced by $5,779 under the expense offset arrangements and by $153,630 under the brokerage/service arrangements.
Each independent Trustee of the fund receives an annual Trustee fee, of which $3,525, as a quarterly retainer, has been allocated to the fund, and an additional fee for each Trustees meeting attended. Trustees also are reimbursed for expenses they incur relating to their services as Trustees.
The fund has adopted a Trustee Fee Deferral Plan (the Deferral Plan) which allows the Trustees to defer the receipt of all or a portion of Trustees fees payable on or after July 1, 1995. The deferred fees remain invested in certain Putnam funds until distribution in accordance with the Deferral Plan.
The fund has adopted an unfunded noncontributory defined benefit pension plan (the Pension Plan) covering all Trustees of the fund who have served as a Trustee for at least five years and were first elected prior to 2004. Benefits under the Pension Plan are equal to 50% of the Trustee’s average annual attendance and retainer fees for the three years ended December 31, 2005. The retirement benefit is payable during a Trustee’s lifetime, beginning the year following retirement, for the number of years of service through December 31, 2006. Pension expense for the fund is included in Trustee compensation and expenses in the Statement of operations. Accrued pension liability is included in Payable for Trustee compensation and expenses in the Statement of assets and liabilities. The Trustees have terminated the Pension Plan with respect to any Trustee first elected after 2003.
The fund has adopted distribution plans (the Plans) with respect to its class A, class B, class C, class M and class R shares pursuant to Rule 12b–1 under the Investment Company Act of 1940. The purpose of the Plans is to compensate Putnam Retail Management Limited Partnership, an indirect wholly-owned subsidiary of Putnam Investments, LLC, for services provided and expenses incurred in distributing shares of the fund. The Plans provide for payments by the fund to Putnam Retail Management Limited Partnership at an annual rate of up to 0.35%, 1.00%, 1.00%, 1.00% and 1.00% of the average net assets attributable to class A, class B, class C, class M and class R shares, respectively. The Trustees have approved payment by the fund at an annual rate of 0.25%, 1.00%, 1.00%, 0.75% and 0.50% of
|
| 38 The Putnam Fund for Growth and Income |
the average net assets attributable to class A, class B, class C, class M and class R shares, respectively. During the reporting period, the class specific expenses related to distribution fees were as follows:
| | | | |
| Class A | $5,469,118 | | Class M | 118,398 |
| |
|
| Class B | 456,434 | | Class R | 8,371 |
| |
|
| Class C | 193,964 | | Total | $6,246,285 |
| |
|
For the reporting period, Putnam Retail Management Limited Partnership, acting as underwriter, received net commissions of $122,772 and $813 from the sale of class A and class M shares, respectively, and received $35,769 and $492 in contingent deferred sales charges from redemptions of class B and class C shares, respectively.
A deferred sales charge of up to 1.00% and 0.65% is assessed on certain redemptions of class A and class M shares, respectively. For the reporting period, Putnam Retail Management Limited Partnership, acting as underwriter, received $18 and no monies on class A and class M redemptions, respectively.
Note 3: Purchases and sales of securities
During the reporting period, cost of purchases and proceeds from sales of investment securities other than short-term investments aggregated $1,015,442,319 and $1,309,113,316, respectively. There were no purchases or proceeds from sales of long-term U.S. government securities.
Note 4: Capital shares
At the close of the reporting period, there was an unlimited number of shares of beneficial interest authorized. Transactions in capital shares were as follows:
| | | | |
| | Six months ended 4/30/13 | Year ended 10/31/12 |
|
| Class A | Shares | Amount | Shares | Amount |
|
| Shares sold | 3,443,687 | $53,704,526 | 6,620,813 | $90,248,499 |
|
| Shares issued in connection with | | | | |
| reinvestment of distributions | 2,368,767 | 35,986,994 | 4,644,183 | 61,677,615 |
|
| | 5,812,454 | 89,691,520 | 11,264,996 | 151,926,114 |
|
| Shares repurchased | (20,708,077) | (320,525,168) | (45,951,277) | (626,395,445) |
|
| Net decrease | (14,895,623) | $(230,833,648) | (34,686,281) | $(474,469,331) |
|
| |
| | Six months ended 4/30/13 | Year ended 10/31/12 |
|
| Class B | Shares | Amount | Shares | Amount |
|
| Shares sold | 290,270 | $4,419,590 | 618,650 | $8,333,165 |
|
| Shares issued in connection with | | | | |
| reinvestment of distributions | 32,714 | 481,160 | 68,391 | 874,379 |
|
| | 322,984 | 4,900,750 | 687,041 | 9,207,544 |
|
| Shares repurchased | (1,138,851) | (17,476,751) | (2,923,409) | (39,263,129) |
|
| Net decrease | (815,867) | $(12,576,001) | (2,236,368) | $(30,055,585) |
|
| |
| | Six months ended 4/30/13 | Year ended 10/31/12 |
|
| Class C | Shares | Amount | Shares | Amount |
|
| Shares sold | 221,601 | $3,416,997 | 287,914 | $3,921,802 |
|
| Shares issued in connection with | | | | |
| reinvestment of distributions | 13,277 | 198,418 | 23,476 | 305,134 |
|
| | 234,878 | 3,615,415 | 311,390 | 4,226,936 |
|
| Shares repurchased | (252,379) | (3,908,995) | (608,753) | (8,259,660) |
|
| Net decrease | (17,501) | $(293,580) | (297,363) | $(4,032,724) |
|
|
| The Putnam Fund for Growth and Income 39 |
| | | | |
| | Six months ended 4/30/13 | Year ended 10/31/12 |
|
| Class M | Shares | Amount | Shares | Amount |
|
| Shares sold | 39,455 | $607,625 | 65,937 | $878,877 |
|
| Shares issued in connection with | | | | |
| reinvestment of distributions | 13,675 | 204,683 | 27,069 | 352,721 |
|
| | 53,130 | 812,308 | 93,006 | 1,231,598 |
|
| Shares repurchased | (166,979) | (2,548,275) | (593,007) | (8,000,994) |
|
| Net decrease | (113,849) | $(1,735,967) | (500,001) | $(6,769,396) |
|
| |
| | Six months ended 4/30/13 | Year ended 10/31/12 |
|
| Class R | Shares | Amount | Shares | Amount |
|
| Shares sold | 41,450 | $652,164 | 34,141 | $461,282 |
|
| Shares issued in connection with | | | | |
| reinvestment of distributions | 1,659 | 25,144 | 3,488 | 45,950 |
|
| | 43,109 | 677,308 | 37,629 | 507,232 |
|
| Shares repurchased | (65,118) | (985,984) | (46,451) | (643,389) |
|
| Net decrease | (22,009) | $(308,676) | (8,822) | $(136,157) |
|
| |
| | | | For the period 7/3/12 |
| | | | (commencement of operations) |
| | Six months ended 4/30/13 | to 10/31/12 |
|
| Class R5 | Shares | Amount | Shares | Amount |
|
| Shares sold | — | $— | 733 | $10,000 |
|
| Shares issued in connection with | | | | |
| reinvestment of distributions | 8 | 124 | 3 | 42 |
|
| | 8 | 124 | 736 | 10,042 |
|
| Shares repurchased | — | — | — | — |
|
| Net increase | 8 | $124 | 736 | $10,042 |
|
| |
| | | | For the period 7/3/12 |
| | | | (commencement of operations) |
| | Six months ended 4/30/13 | to 10/31/12 |
|
| Class R6 | Shares | Amount | Shares | Amount |
|
| Shares sold | 998,126 | $16,520,768 | 733 | $10,000 |
|
| Shares issued in connection with | | | | |
| reinvestment of distributions | 8 | 130 | 3 | 43 |
|
| | 998,134 | 16,520,898 | 736 | 10,043 |
|
| Shares repurchased | (7,415) | (123,707) | — | — |
|
| Net increase | 990,719 | $16,397,191 | 736 | $10,043 |
|
| |
| | Six months ended 4/30/13 | Year ended 10/31/12 |
|
| Class Y | Shares | Amount | Shares | Amount |
|
| Shares sold | 222,597 | $3,472,802 | 793,917 | $11,264,890 |
|
| Shares issued in connection with | | | | |
| reinvestment of distributions | 32,338 | 493,500 | 57,330 | 762,552 |
|
| | 254,935 | 3,966,302 | 851,247 | 12,027,442 |
|
| Shares repurchased | (1,287,859) | (20,948,991) | (1,037,367) | (13,851,686) |
|
| Net decrease | (1,032,924) | $(16,982,689) | (186,120) | $(1,824,244) |
|
|
| 40 The Putnam Fund for Growth and Income |
At the close of the reporting period, Putnam Investments, LLC owned the following class shares of the fund:
| | | |
| | Shares | Percentage of ownership | Value |
|
| Class R5 | 744 | 100% | 12,570 |
|
| Class R6 | 745 | 0.08 | 12,583 |
|
Note 5: Summary of derivative activity
The average volume of activity for the reporting period for any derivative type that was held during the period is listed below and was as follows:
| |
| OTC total return swap contracts (notional) | $48,100,000 |
|
The following is a summary of the market values of derivative instruments as of the close of the reporting period:
Market values of derivative instruments as of the close of the reporting period
| | | | |
| | Asset derivatives | | |
|
| Derivatives not | | | | |
| accounted for as | Statement of | | Statement of | |
| hedging instruments | assets and | | assets and | |
| under ASC 815 | liabilities location | Market value | liabilities location | Market value |
|
| | Investments, | | | |
| Equity contracts | Receivables | $6,065,233 | Payables | $876,756 |
|
| Total | | $6,065,233 | | $876,756 |
|
The following is a summary of realized and change in unrealized gains or losses of derivative instruments on the Statement of operations for the reporting period (see Note 1):
Amount of realized gain or (loss) on derivatives recognized in net gain or (loss) on investments
| | | |
| Derivatives not accounted for as hedging | | | |
| instruments under ASC 815 | | Swaps | Total |
|
| Equity Contracts | | $(632,319) | $(632,319) |
|
| Total | | $(632,319) | $(632,319) |
|
Change in unrealized appreciation or (depreciation) on derivatives recognized in net gain or (loss) on investments
| | | |
| Derivatives not accounted for as hedging | | | |
| instruments under ASC 815 | Warrants | Swaps | Total |
|
| Equity contracts | $(161,028) | $1,629,007 | $1,467,979 |
|
| Total | $(161,028) | $1,629,007 | $1,467,979 |
|
Note 6: Transactions with affiliated issuers
Transactions during the reporting period with any company which is under common ownership or control, or with companies in which the fund owned at least 5% of the voting securities, were as follows:
| | | | | |
| | Market value at | | | | Market value |
| | the beginning | | | | at the end of |
| | of the reporting | | | Investment | the reporting |
| Name of affiliate | period | Purchase cost | Sale proceeds | income | period |
|
| Putnam Money Market | | | | | |
| Liquidity Fund* | $44,421,874 | $231,125,028 | $275,546,902 | $24,517 | $— |
|
| Putnam Short Term | | | | | |
| Investment Fund* | $— | 246,793,086 | 158,083,728 | 8,471 | 88,709,358 |
|
| Totals | $44,421,874 | $477,918,114 | $433,630,630 | $32,988 | $88,709,358 |
|
* Management fees charged to Putnam Money Market Liquidity Fund and Putnam Short Term Investment Fund have been waived by Putnam Management.
| |
| The Putnam Fund for Growth and Income | 41 |
Note 7: Market, credit and other risks
In the normal course of business, the fund trades financial instruments and enters into financial transactions where risk of potential loss exists due to changes in the market (market risk) or failure of the contracting party to the transaction to perform (credit risk). The fund may be exposed to additional credit risk that an institution or other entity with which the fund has unsettled or open transactions will default. Investments in foreign securities involve certain risks, including those related to economic instability, unfavorable political developments, and currency fluctuations.
Note 8: New accounting pronouncement
In January 2013, ASU 2013-01, “Clarifying the Scope of Disclosures about Offsetting Assets and Liabilities,” amended ASU No. 2011-11, “Disclosures about Offsetting Assets and Liabilities.” The ASUs create new disclosure requirements requiring entities to disclose both gross and net information for derivatives and other financial instruments that are either offset in the Statement of assets and liabilities or subject to an enforceable master netting arrangement or similar agreement. The disclosure requirements are effective for annual reporting periods beginning on or after January 1, 2013 and interim periods within those annual periods. Putnam Management is currently evaluating the application of ASU 2013-01 and ASU 2011-11 and their impact, if any, on the fund’s financial statements.
|
| 42 The Putnam Fund for Growth and Income |
The Putnam family of funds
The following is a list of Putnam’s open-end mutual funds offered to the public. Investors should carefully consider the investment objective, risks, charges, and expenses of a fund before investing. For a prospectus, or a summary prospectus if available, containing this and other information for any Putnam fund or product, call your financial advisor at 1-800-225-1581 and ask for a prospectus. Please read the prospectus carefully before investing.
| |
| Growth | Income |
| Growth Opportunities Fund | American Government Income Fund |
| International Growth Fund | Diversified Income Trust |
| Multi-Cap Growth Fund | Floating Rate Income Fund |
| Small Cap Growth Fund | Global Income Trust |
| Voyager Fund | High Yield Advantage Fund |
| | High Yield Trust |
| Blend | Income Fund |
| Asia Pacific Equity Fund | Money Market Fund* |
| Capital Opportunities Fund | Short Duration Income Fund |
| Capital Spectrum Fund | U.S. Government Income Trust |
| Emerging Markets Equity Fund | |
| Equity Spectrum Fund | Tax-free income |
| Europe Equity Fund | AMT-Free Municipal Fund |
| Global Equity Fund | Tax Exempt Income Fund |
| International Capital Opportunities Fund | Tax Exempt Money Market Fund* |
| International Equity Fund | Tax-Free High Yield Fund |
| Investors Fund | |
| Multi-Cap Core Fund | State tax-free income funds: |
| Research Fund | Arizona, California, Massachusetts, Michigan, |
| | Minnesota, New Jersey, New York, Ohio, |
| Value | and Pennsylvania. |
| Convertible Securities Fund | |
| Equity Income Fund | Absolute Return |
| George Putnam Balanced Fund | Absolute Return 100 Fund® |
| The Putnam Fund for Growth and Income | Absolute Return 300 Fund® |
| International Value Fund | Absolute Return 500 Fund® |
| Multi-Cap Value Fund | Absolute Return 700 Fund® |
| Small Cap Value Fund | |
| |
* An investment in a money market fund is not insured or guaranteed by the Federal Deposit Insurance Corporation or any other government agency. Although the fund seeks to preserve the value of your investment at $1.00 per share, it is possible to lose money by investing in the fund.
|
| The Putnam Fund for Growth and Income 43 |
| |
| Global Sector | Putnam RetirementReady® Funds — portfolios |
| Global Consumer Fund | with automatically adjusting allocations to |
| Global Energy Fund | stocks, bonds, and money market instruments, |
| Global Financials Fund | becoming more conservative over time. |
| Global Health Care Fund | |
| Global Industrials Fund | RetirementReady 2055 Fund |
| Global Natural Resources Fund | RetirementReady 2050 Fund |
| Global Sector Fund | RetirementReady 2045 Fund |
| Global Technology Fund | RetirementReady 2040 Fund |
| Global Telecommunications Fund | RetirementReady 2035 Fund |
| Global Utilities Fund | RetirementReady 2030 Fund |
| RetirementReady 2025 Fund |
| Asset Allocation | RetirementReady 2020 Fund |
| Putnam Global Asset Allocation Funds — | RetirementReady 2015 Fund |
| portfolios with allocations to stocks, bonds, | |
| and money market instruments that are | Putnam Retirement Income Lifestyle |
| adjusted dynamically within specified ranges | Funds — portfolios with managed |
| as market conditions change. | allocations to stocks, bonds, and money |
| | market investments to generate |
| Dynamic Asset Allocation Balanced Fund | retirement income. |
| Dynamic Asset Allocation | |
| Conservative Fund | Retirement Income Fund Lifestyle 1 |
| Dynamic Asset Allocation Growth Fund | Retirement Income Fund Lifestyle 2 |
| Dynamic Risk Allocation Fund | Retirement Income Fund Lifestyle 3 |
A short-term trading fee of 1% may apply to redemptions or exchanges from certain funds within the time period specified in the fund's prospectus.
Check your account balances and the most recent month-end performance in the Individual Investors section at putnam.com.
|
| 44 The Putnam Fund for Growth and Income |
Fund information
Founded over 75 years ago, Putnam Investments was built around the concept that a balance between risk and reward is the hallmark of a well-rounded financial program. We manage over 100 funds across income, value, blend, growth, asset allocation, absolute return, and global sector categories.
| | |
| Investment Manager | Trustees | Robert T. Burns |
| Putnam Investment | Jameson A. Baxter, Chair | Vice President and |
| Management, LLC | Liaquat Ahamed | Chief Legal Officer |
| One Post Office Square | Ravi Akhoury | |
| Boston, MA 02109 | Barbara M. Baumann | Robert R. Leveille |
| | Charles B. Curtis | Vice President and |
| Investment Sub-Manager | Robert J. Darretta | Chief Compliance Officer |
| Putnam Investments Limited | Katinka Domotorffy | |
| 57–59 St James’s Street | John A. Hill | Michael J. Higgins |
| London, England SW1A 1LD | Paul L. Joskow | Vice President and Treasurer |
| Elizabeth T. Kennan | |
| Marketing Services | Kenneth R. Leibler | Janet C. Smith |
| Putnam Retail Management | Robert E. Patterson | Vice President, |
| One Post Office Square | George Putnam, III | Principal Accounting Officer, |
| Boston, MA 02109 | Robert L. Reynolds | and Assistant Treasurer |
| W. Thomas Stephens | |
| Custodian | | Susan G. Malloy |
| State Street Bank | Officers | Vice President and |
| and Trust Company | Robert L. Reynolds | Assistant Treasurer |
| President | |
| Legal Counsel | | James P. Pappas |
| Ropes & Gray LLP | Jonathan S. Horwitz | Vice President |
| Executive Vice President, | |
| | Principal Executive Officer, and | Mark C. Trenchard |
| | Compliance Liaison | Vice President and |
| | | BSA Compliance Officer |
| | Steven D. Krichmar | |
| | Vice President and | Nancy E. Florek |
| | Principal Financial Officer | Vice President, Proxy |
| | | Manager, Assistant Clerk, and |
| | | Associate Treasurer |
This report is for the information of shareholders of The Putnam Fund for Growth and Income. It may also be used as sales literature when preceded or accompanied by the current prospectus, the most recent copy of Putnam’s Quarterly Performance Summary, and Putnam’s Quarterly Ranking Summary. For more recent performance, please visit putnam.com. Investors should carefully consider the investment objectives, risks, charges, and expenses of a fund, which are described in its prospectus. For this and other information or to request a prospectus or summary prospectus, call 1-800-225-1581 toll free. Please read the prospectus carefully before investing. The fund’s Statement of Additional Information contains additional information about the fund’s Trustees and is available without charge upon request by calling 1-800-225-1581.

| |
| Item 3. Audit Committee Financial Expert: |
| |
| Item 4. Principal Accountant Fees and Services: |
| |
| Item 5. Audit Committee of Listed Registrants |
| |
| Item 6. Schedule of Investments: |
| |
| The registrant’s schedule of investments in unaffiliated issuers is included in the report to shareholders in Item 1 above. |
| |
| Item 7. Disclosure of Proxy Voting Policies and Procedures For Closed-End Management Investment Companies: |
| |
| Item 8. Portfolio Managers of Closed-End Investment Companies |
| |
| Item 9. Purchases of Equity Securities by Closed-End Management Investment Companies and Affiliated Purchasers: |
| |
| Item 10. Submission of Matters to a Vote of Security Holders: |
| |
| Item 11. Controls and Procedures: |
| |
| (a) The registrant’s principal executive officer and principal financial officer have concluded, based on their evaluation of the effectiveness of the design and operation of the registrant’s disclosure controls and procedures as of a date within 90 days of the filing date of this report, that the design and operation of such procedures are generally effective to provide reasonable assurance that information required to be disclosed by the registrant in this report is recorded, processed, summarized and reported within the time periods specified in the Commission’s rules and forms. |
| |
| (b) Changes in internal control over financial reporting: Not applicable |
| |
| (a)(2) Separate certifications for the principal executive officer and principal financial officer of the registrant as required by Rule 30a-2(a) under the Investment Company Act of 1940, as amended, are filed herewith. |
| |
| (b) The certifications required by Rule 30a-2(b) under the Investment Company Act of 1940, as amended, are filed herewith. |
| |
| The Putnam Fund for Growth and Income |
| |
| By (Signature and Title): |
| |
| /s/Janet C. Smith
Janet C. Smith
Principal Accounting Officer
|
| |
| Pursuant to the requirements of the Securities Exchange Act of 1934 and the Investment Company Act of 1940, this report has been signed below by the following persons on behalf of the registrant and in the capacities and on the dates indicated. |
| |
| By (Signature and Title): |
| |
| /s/Jonathan S. Horwitz
Jonathan S. Horwitz
Principal Executive Officer
|
| |
| By (Signature and Title): |
| |
| /s/Steven D. Krichmar
Steven D. Krichmar
Principal Financial Officer
|