| | |
| UNITED STATES
SECURITIES AND EXCHANGE COMMISSION |
| | |
| CERTIFIED SHAREHOLDER REPORT OF REGISTERED
MANAGEMENT INVESTMENT COMPANIES
|
| | |
| Investment Company Act file number: | (811-00781) |
| | |
| Exact name of registrant as specified in charter: | The Putnam Fund for Growth and Income |
| | |
| Address of principal executive offices: | One Post Office Square, Boston, Massachusetts 02109 |
| | |
| Name and address of agent for service: | Robert T. Burns, Vice President
One Post Office Square
Boston, Massachusetts 02109 |
| | |
| Copy to: | John W. Gerstmayr, Esq.
Ropes & Gray LLP
800 Boylston Street
Boston, Massachusetts 02199-3600 |
| | |
| Registrant’s telephone number, including area code: | (617) 292-1000 |
| | |
| Date of fiscal year end: | October 31, 2012 |
| | |
| Date of reporting period: | November 1, 2011 — April 30, 2012 |
| | |
|
Item 1. Report to Stockholders: | |
| | |
| The following is a copy of the report transmitted to stockholders pursuant to Rule 30e-1 under the Investment Company Act of 1940: | |
The Putnam
Fund for Growth
and Income
Semiannual report
4 | 30 | 12
| | | |
| Message from the Trustees | 1 | | |
| | |
| About the fund | 2 | | |
| | |
| Performance snapshot | 4 | | |
| | |
| Interview with your fund’s portfolio manager | 5 | | |
| | |
| Your fund’s performance | 10 | | |
| | |
| Your fund’s expenses | 12 | | |
| | |
| Terms and definitions | 14 | | |
| | |
| Other information for shareholders | 15 | | |
| | |
| Financial statements | 16 | | |
| | |
Consider these risks before investing: Value stocks may fail to rebound, and the market may not favor value-style investing. Income provided by the fund may be reduced by changes in the dividend policies of, and the capital resources available at, the companies in which the fund invests. The prices of stocks may fall or fail to rise over extended periods of time for a variety of reasons, including both general financial market conditions and factors related to a specific issuer or industry.
Message from the Trustees
Dear Fellow Shareholder:
Since the start of 2012, the economic picture and market performance worldwide have been mixed and volatile, punctuated by periodic worries over Europe’s unresolved sovereign-debt troubles and China’s efforts to maintain its robust economic growth. The U.S. economy has shown signs of gathering steam, but continues to face the dual headwinds of tepid jobs growth and a burgeoning federal debt.
Putnam’s portfolio managers and analysts are trained to uncover opportunities that often emerge in this type of environment, while also seeking to guard against downside risk. During these times, your financial advisor also can be a valuable resource, helping you to maintain a long-term focus and a balanced investment approach.
In other news, please join us in welcoming the return of Elizabeth T. Kennan to the Board of Trustees. Dr. Kennan, who served as a Trustee from 1992 until 2010, has rejoined the Board, effective January 1, 2012. Dr. Kennan is a Partner of Cambus-Kenneth Farm (thoroughbred horse breeding and general farming), and is also President Emeritus of Mount Holyoke College.
We would also like to take this opportunity to welcome new shareholders to the fund and to thank all of our investors for your continued confidence in Putnam.

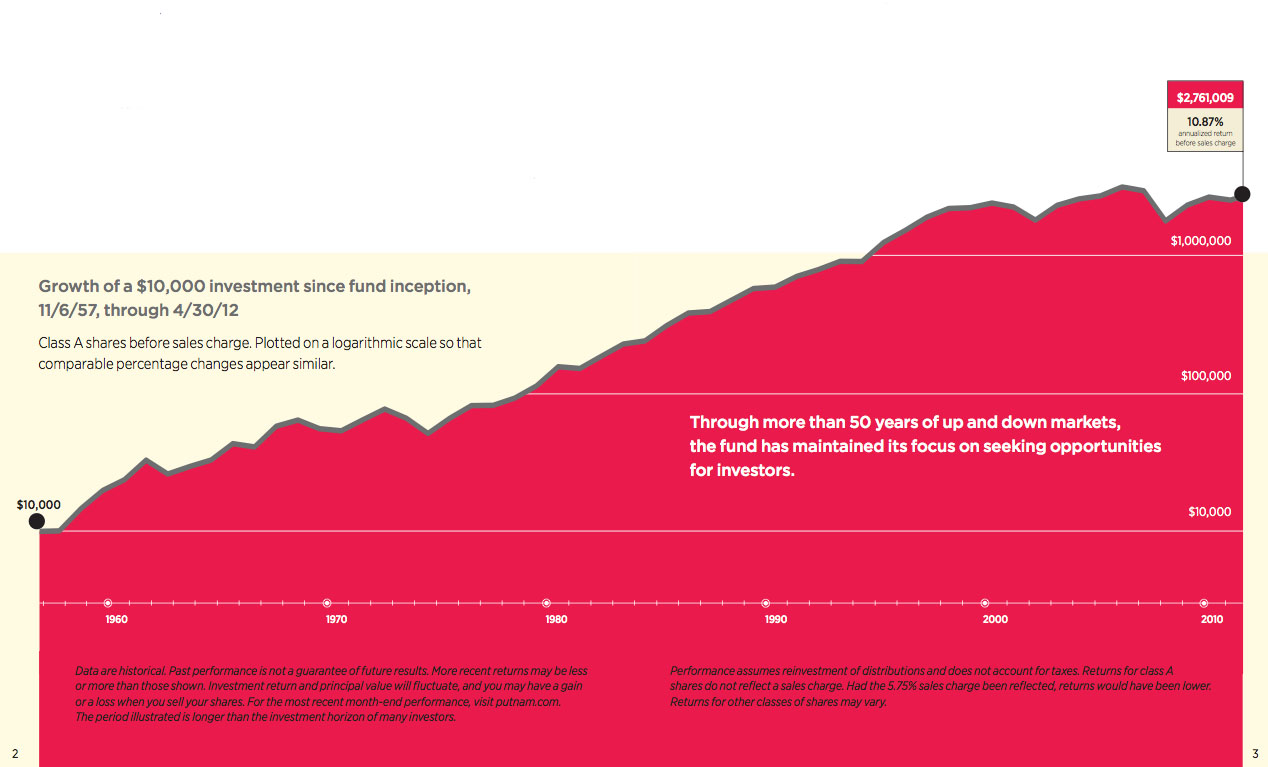
About the fund
Pursuing capital growth for over 50 years
In November 1957 — almost 20 years to the day after Putnam Investments was founded with the launch of The George Putnam Fund of Boston — Putnam launched its second mutual fund: The Putnam Fund for Growth and Income.
Putnam’s founders carefully debated the merits of adding a fund whose primary focus would be stock investments. They believed that the balanced approach of The George Putnam Fund of Boston, which owned a mix of stocks and bonds, was still the most prudent choice for most individuals. However, the advent of state tax-exempt bonds was making it more advantageous for some investors to balance their own portfolios. Furthermore, many financial advisors had been urging Putnam to introduce a stock fund to meet this growing need.
The fund was launched in a favorable environment for stock investors. Confidence in stocks, which had been severely shaken by the 1929 crash and the Great Depression that followed, had finally been renewed by the early 1950s. Fueled by the optimism of new technologies and the race to space, the 1960s were generally good years for investors. Then came the stagflation-plagued 1970s when the stock market moved sideways for most of the decade.
The fund benefited from the rallies that dominated the 1980s and 1990s. There were bumps in the road, such as the recession of the early 1990s, and, more recently, the bear markets of 2000–2002 and 2007–2009.
True to its roots, the fund continues to focus on long-term growth opportunities among large companies, with appropriate attention to managing downside risk.

Current performance may be lower or higher than the quoted past performance, which cannot guarantee future results. Share price, principal value, and return will fluctuate, and you may have a gain or a loss when you sell your shares. Performance of class A shares assumes reinvestment of distributions and does not account for taxes. Fund returns in the bar chart do not reflect a sales charge of 5.75%; had they, returns would have been lower. See pages 5 and 10–12 for additional performance information. For a portion of the periods, the fund had expense limitations, without which returns would have been lower. To obtain the most recent month-end performance, visit putnam.com.
* The fund’s benchmark, the Russell 1000 Value Index, and the fund’s Lipper peer group were introduced on 12/31/78 and 12/31/59, respectively, which post-date the inception of the fund’s class A shares.
† Returns for the six-month period are not annualized, but cumulative.
4
Interview with your fund’s portfolio manager

Bob, what can you tell us about the investing environment for the six months ended April 30, 2012?
After a volatile and challenging 2011, conditions became significantly less turbulent during this six-month period. Investors worldwide began to feel a bit more confident about the prospects for continued global economic growth, and they appeared to be less preoccupied with macroeconomic issues. With the exception of the first and final months of the period — which were fairly volatile — U.S. stocks staged an impressive recovery. In the first three months of 2012, stocks posted their strongest first-quarter gains in over a decade. The largest advances were from stocks of cyclical companies, which tend to perform better in an improving economy. Cyclical stocks had struggled through most of last year, as investors — nervous about weakening economic growth — favored more defensive stocks, which are often perceived as a safe haven. As investor confidence improved, we were pleased to see more economically sensitive stocks — such as those of financial companies — among the top performers.
The fund outperformed both its benchmark and its Lipper peer group average for the period. What was your strategy for positioning the fund?
The fund performed well because of our pro-cyclical focus. We had positioned the
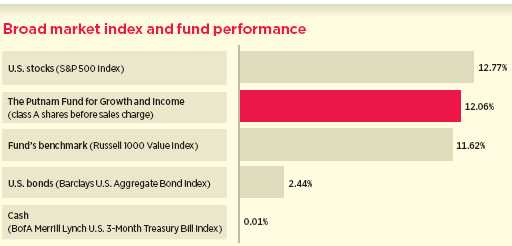
This comparison shows your fund’s performance in the context of broad market indexes for the six months ended 4/30/12. See pages 4 and 10–12 for additional fund performance information. Index descriptions can be found on page 14.
5
portfolio with a bias toward companies that should benefit from an improving economy, and we placed less emphasis on defensive stocks. We believed that this strategy would pay off once investors began to worry less about issues affecting the broader world markets and focused on individual companies, their fundamental strengths, and their growth potential. From a sector perspective, the three that performed best were cyclical: consumer discretionary, financials, and industrials. Among the weaker-performing sectors were consumer staples and utilities, which are typically more defensive in nature. The fund had underweight exposure to these sectors compared to its benchmark, which helped relative performance.
I am also pleased to report that the fund’s outperformance was due in large part to our stock selection in almost every sector — defensive or cyclical. For example, even though the fund had an underweight position in the consumer staples sector, that portion of the portfolio did well because we owned stocks that performed well. Our stock selection struggled somewhat in the energy sector. As natural gas prices declined dramatically, the energy sector was volatile and a poor performer. In this environment, the most defensive energy stocks performed best, and the fund did not have significant exposure to them.
Within the fund’s portfolio, what strategies or stocks drove returns for the period?
As active fund managers, we have the flexibility to not own a stock that is included in our benchmark index — or to own less of it than the index. During the period, fund performance was helped by our decision to maintain a smaller position versus our benchmark in Procter & Gamble. This stock struggled as the consumer products company dealt with heightened competition and lost some of its market share, and it was beneficial to have minimal exposure to it. Also contributing to the fund’s performance was our decision to not hold the stock of Berkshire Hathaway, the holding company engaged in a diverse range of businesses under the leadership of CEO Warren Buffet. We viewed
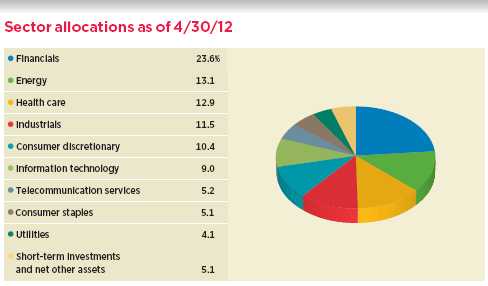
Allocations are represented as a percentage of the fund’s net assets. Summary information may differ from the portfolio schedule included in the financial statements due to the inclusion of derivative securities and the exclusion of as-of trades, if any. Holdings and allocations may vary over time.
6
this as a defensive stock that we believed would not outperform in a recovering market.

We also have the flexibility to invest in stocks that are not in our benchmark at all, and several of the period’s top performers fall into this category. Among them was the stock of Apple, one of the world’s largest companies and the creator of such iconic products as the iPhone and iPad. As a rapidly growing technology company, Apple may not be considered by some investors to be a value stock. However, an important component of a value investing strategy is targeting stocks that are attractively priced. Based on our analysis and measurements such as its price-to-earnings ratio, we believed that Apple stock was inexpensive enough to include in the fund’s portfolio.
Microsoft was another out-of-benchmark stock that was among the portfolio highlights for the period. Although this software giant has a mature business model, it continues to deliver solid revenue growth for an attractive share price, in our view. Its stock performed well during the period, due in part to enthusiasm about the upcoming release of the company’s Windows 8 operating system. Finally, the fund’s overweight position in bank holding company Wells Fargo was a contributor to performance as confidence in the U.S. financial system improved. As one of the biggest mortgage lenders in the country, Wells Fargo has also benefited from an increase in mortgage refinancing activity.
Which stocks held back performance?
The fund’s position in Hess, a global energy company, dampened performance for the period. Hess felt the effects of volatility in the energy sector as natural gas prices
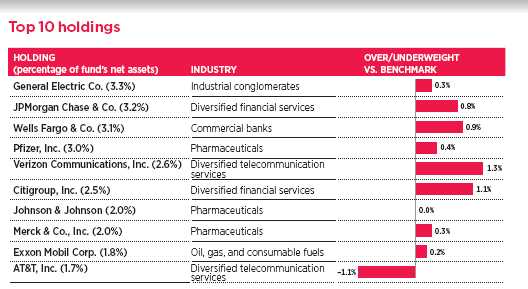
This table shows the fund’s top 10 holdings by percentage of the fund’s net assets as of 4/30/12. Short-term holdings are excluded. Holdings will vary over time.
7
plummeted. In addition, Hess announced that its oil production would fall short of its 2012 target. Another detractor was Baxter International, a health-care equipment and supplies company. The stock faced two headwinds during the period: As a defensive stock, it was not favored by investors in the pro-cyclical environment, and the company was dealing with declining revenue growth.
Another disappointment for the period was the stock of Unisys, a global information technology company that has been struggling with weaker overall revenue growth. By late April, however, Unisys stock began to rebound, and it remained in the portfolio at period-end, as did the fund’s positions in Hess and Baxter International.
What is your outlook for the markets and the fund?
My general view has not changed since the close of the fund’s fiscal year six months ago. I believe we will continue to see a slow but self-sustaining global economic recovery, and stocks across many sectors should continue to offer attractive investment opportunities. However, any discussion of outlook must take into account the market’s recent rally — stocks have rebounded nearly 30% since their lows in October 2011. In light of this, I would characterize my outlook as slightly less enthusiastic, and consequently I have made some adjustments to manage risk in the portfolio.
One of the biggest positives for the stock market has been the strength of U.S. corporate earnings. Since 2007, corporate costs have been pared back, inventories have been aggressively managed, and debt has been refinanced at historically low interest rates. Many companies have built up substantial reserves of cash to carry them through tough times. However, while earnings growth remains strong — we just wrapped up another powerful earnings season — it is beginning to decelerate. And in the coming year, we believe earnings growth is likely to be more modest. In a less-robust environment,

This chart shows the fund’s largest allocation shifts, by percentage, over the past six months. Weightings are shown as a percentage of net assets. Summary information may differ from the portfolio schedule included in the financial statements due to the inclusion of derivative securities and the exclusion of as-of trades, if any. Holdings will vary over time.
8
it is important to be cautious and selective in your investment choices, which is exactly how we approach our stock selection for the fund’s portfolio.
Thank you, Bob, for your time and insights today.
The views expressed in this report are exclusively those of Putnam Management and are subject to change. They are not meant as investment advice.
Please note that the holdings discussed in this report may not have been held by the fund for the entire period. Portfolio composition is subject to review in accordance with the fund’s investment strategy and may vary in the future. Current and future portfolio holdings are subject to risk.
Portfolio Manager Robert D. Ewing is Co-Head of U.S. Equities at Putnam. He has a B.S. in Finance and Economics from Boston College. A CFA charterholder, he joined Putnam in 2008 and has been in the investment industry since 1990.
IN THE NEWS
Gasoline prices have dropped in recent weeks from the year-to-date high of $3.94 reached on April 2. As of June 4, 2012, the average price of a gallon of regular gasoline fell to $3.61, the U.S. Energy Information Administration reported. Driving the price declines were waning concerns over Iran’s nuclear program as well as sluggish demand from slow-growing economies in the United States and Europe. Meanwhile, the crude oil supply situation has improved, with some refineries that were slated for closure now coming back online. The recent drop in prices at the pump has led analysts to recalibrate their price predictions for the summer driving season. Just months ago, some predicted that gas prices could shoot above $4 a gallon and reach $5 by the summer. Now those price increases appear unlikely. Because high gas prices can hinder economic growth, falling prices could help by putting more money back into consumers’ pockets.
9
Your fund’s performance
This section shows your fund’s performance, price, and distribution information for periods ended April 30, 2012, the end of the first half of its current fiscal year. In accordance with regulatory requirements for mutual funds, we also include expense information taken from the fund’s current prospectus. Performance should always be considered in light of a fund’s investment strategy. Data represent past performance. Past performance does not guarantee future results. More recent returns may be less or more than those shown. Investment return and principal value will fluctuate, and you may have a gain or a loss when you sell your shares. Performance information does not reflect any deduction for taxes a shareholder may owe on fund distributions or on the redemption of fund shares. For the most recent month-end performance, please visit the Individual Investors section at putnam.com or call Putnam at 1-800-225-1581. Class R and class Y shares are not available to all investors. See the Terms and Definitions section in this report for definitions of the share classes offered by your fund.
Fund performance Total return for periods ended 4/30/12
| | | | | | | | | | |
| | Class A | Class B | Class C | Class M | Class R | Class Y |
| (inception dates) | (11/6/57) | (4/27/92) | (7/26/99) | (5/1/95) | (1/21/03) | (6/15/94) |
|
| | Before | After | | | | | Before | After | Net | Net |
| | sales | sales | Before | After | Before | After | sales | sales | asset | asset |
| | charge | charge | CDSC | CDSC | CDSC | CDSC | charge | charge | value | value |
|
| Annual average | | | | | | | | | | |
| (life of fund) | 10.87% | 10.75% | 9.86% | 9.86% | 10.04% | 10.04% | 10.14% | 10.07% | 10.59% | 10.96% |
|
| 10 years | 29.20 | 21.76 | 19.78 | 19.78 | 19.87 | 19.87 | 22.85 | 18.54 | 25.99 | 32.45 |
| Annual average | 2.60 | 1.99 | 1.82 | 1.82 | 1.83 | 1.83 | 2.08 | 1.72 | 2.34 | 2.85 |
|
| 5 years | –13.40 | –18.38 | –16.67 | –18.03 | –16.60 | –16.60 | –15.55 | –18.51 | –14.49 | –12.35 |
| Annual average | –2.84 | –3.98 | –3.58 | –3.90 | –3.57 | –3.57 | –3.32 | –4.01 | –3.08 | –2.60 |
|
| 3 years | 60.05 | 50.86 | 56.52 | 53.52 | 56.57 | 56.57 | 57.73 | 52.22 | 58.88 | 61.23 |
| Annual average | 16.97 | 14.69 | 16.11 | 15.36 | 16.12 | 16.12 | 16.40 | 15.03 | 16.69 | 17.26 |
|
| 1 year | –1.77 | –7.45 | –2.53 | –7.37 | –2.47 | –3.44 | –2.30 | –5.73 | –2.04 | –1.51 |
|
| 6 months | 12.06 | 5.62 | 11.62 | 6.62 | 11.63 | 10.63 | 11.73 | 7.82 | 11.92 | 12.17 |
|
Current performance may be lower or higher than the quoted past performance, which cannot guarantee future results. After-sales-charge returns for class A and M shares reflect the deduction of the maximum 5.75% and 3.50% sales charge, respectively, levied at the time of purchase. Class B share returns after contingent deferred sales charge (CDSC) reflect the applicable CDSC, which is 5% in the first year, declining over time to 1% in the sixth year, and is eliminated thereafter. Class C share returns after CDSC reflect a 1% CDSC for the first year that is eliminated thereafter. Class R and Y shares have no initial sales charge or CDSC. Performance for class B, C, M, R, and Y shares before their inception is derived from the historical performance of class A shares, adjusted for the applicable sales charge (or CDSC) and the higher operating expenses for such shares, except for class Y shares, for which 12b-1 fees are not applicable.
Recent performance may have benefited from one or more legal settlements.
For a portion of the periods, the fund had expense limitations, without which returns would have been lower.
Class B share performance does not reflect conversion to class A shares.
10
Comparative index returns For periods ended 4/30/12
| | |
| | | Lipper Large-Cap Value Funds |
| | Russell 1000 Value Index | category average* |
|
| Annual average (life of fund) | —† | —† |
|
| 10 years | 60.32% | 48.37% |
| Annual average | 4.83 | 3.97 |
|
| 5 years | –8.33 | –7.88 |
| Annual average | –1.73 | –1.70 |
|
| 3 years | 65.65 | 57.31 |
| Annual average | 18.32 | 16.27 |
|
| 1 year | 1.03 | –0.48 |
|
| 6 months | 11.62 | 11.18 |
|
Index and Lipper results should be compared with fund performance before sales charge, before CDSC, or at net asset value.
* Over the 6-month, 1-year, 3-year, 5-year, and 10-year periods ended 4/30/12, there were 540, 527, 469, 418, and 252 funds, respectively, in this Lipper category.
† The fund’s benchmark, the Russell 1000 Value Index, and the fund’s Lipper peer group were introduced on 12/31/78 and 12/31/59, respectively, which post-date the inception of the fund’s class A shares.
Fund price and distribution information For the six-month period ended 4/30/12
| | | | | | | | |
| Distributions | Class A | Class B | Class C | Class M | Class R | Class Y |
|
| Number | 2 | 2 | 2 | 2 | 2 | 2 |
|
| Income | $0.130 | $0.080 | $0.082 | $0.098 | $0.114 | $0.146 |
|
| Capital gains | — | — | — | — | — | — |
|
| Total | $0.130 | $0.080 | $0.082 | $0.098 | $0.114 | $0.146 |
|
| | Before | After | Net | Net | Before | After | Net | Net |
| | sales | sales | asset | asset | sales | sales | asset | asset |
| Share value | charge | charge | value | value | charge | charge | value | value |
|
| 10/31/11 | $12.79 | $13.57 | $12.56 | $12.74 | $12.69 | $13.15 | $12.72 | $12.82 |
|
| 4/30/12 | 14.19 | 15.06 | 13.93 | 14.13 | 14.07 | 14.58 | 14.11 | 14.22 |
|
| | Before | After | Net | Net | Before | After | Net | Net |
| | sales | sales | asset | asset | sales | sales | asset | asset |
| Current yield (end of period) | charge | charge | value | value | charge | charge | value | value |
|
| Current dividend rate 1 | 1.21% | 1.14%�� | 0.49% | 0.51% | 0.74% | 0.71% | 0.96% | 1.43% |
|
| Current 30-day SEC yield 2 | N/A | 1.18 | 0.51 | 0.51 | N/A | 0.73 | 1.00 | 1.49 |
|
1 Most recent distribution, excluding capital gains, annualized and divided by the fund’s share price before or after sales charge at period-end.
2 Based only on investment income and calculated using the maximum offering price for each share class, in accordance with SEC guidelines.
The classification of distributions, if any, is an estimate. Before-sales-charge share value and current dividend rate for class A and M shares, if applicable, do not take into account any sales charge levied at the time of purchase. After-sales-charge share value, current dividend rate, and current 30-day SEC yield, if applicable, are calculated assuming that the maximum sales charge (5.75% for class A shares and 3.50% for class M shares) was levied at the time of purchase. Final distribution information will appear on your year-end tax forms.
11
Fund performance as of most recent calendar quarter
Total return for periods ended 3/31/12
| | | | | | | | | | |
| | Class A | Class B | Class C | Class M | Class R | Class Y |
| (inception dates) | (11/6/57) | (4/27/92) | (7/26/99) | (5/1/95) | (1/21/03) | (6/15/94) |
|
| | Before | After | | | | | Before | After | Net | Net |
| | sales | sales | Before | After | Before | After | sales | sales | asset | asset |
| | charge | charge | CDSC | CDSC | CDSC | CDSC | charge | charge | value | value |
|
| Annual average | | | | | | | | | | |
| (life of fund) | 10.92% | 10.80% | 9.91% | 9.91% | 10.09% | 10.09% | 10.19% | 10.12% | 10.64% | 11.01% |
|
| 10 years | 24.43 | 17.25 | 15.32 | 15.32 | 15.30 | 15.30 | 18.22 | 14.10 | 21.29 | 27.50 |
| Annual average | 2.21 | 1.60 | 1.44 | 1.44 | 1.43 | 1.43 | 1.69 | 1.33 | 1.95 | 2.46 |
|
| 5 years | –8.47 | –13.71 | –11.91 | –13.34 | –11.87 | –11.87 | –10.79 | –13.90 | –9.64 | –7.32 |
| Annual average | –1.75 | –2.91 | –2.50 | –2.82 | –2.50 | –2.50 | –2.26 | –2.95 | –2.01 | –1.51 |
|
| 3 years | 81.52 | 71.14 | 77.43 | 74.43 | 77.46 | 77.46 | 78.88 | 72.55 | 80.11 | 83.03 |
| Annual average | 21.99 | 19.61 | 21.06 | 20.38 | 21.07 | 21.07 | 21.39 | 19.94 | 21.67 | 22.32 |
|
| 1 year | 2.40 | –3.46 | 1.61 | –3.39 | 1.62 | 0.62 | 1.82 | –1.78 | 2.15 | 2.67 |
|
| 6 months | 28.42 | 21.06 | 27.88 | 22.87 | 27.77 | 26.77 | 27.95 | 23.46 | 28.12 | 28.50 |
|
Your fund’s expenses
As a mutual fund investor, you pay ongoing expenses, such as management fees, distribution fees (12b-1 fees), and other expenses. Using the following information, you can estimate how these expenses affect your investment and compare them with the expenses of other funds. You may also pay one-time transaction expenses, including sales charges (loads) and redemption fees, which are not shown in this section and would have resulted in higher total expenses. For more information, see your fund’s prospectus or talk to your financial representative.
Expense ratios
| | | | | | |
| | Class A | Class B | Class C | Class M | Class R | Class Y |
|
| Total annual operating expenses for the fiscal year | | | | | | |
| ended 10/31/11 | 1.10% | 1.85% | 1.85% | 1.60% | 1.35% | 0.85% |
|
| Annualized expense ratio for the six-month period | | | | | | |
| ended 4/30/12 | 1.11% | 1.86% | 1.86% | 1.61% | 1.36% | 0.86% |
|
Fiscal-year expense information in this table is taken from the most recent prospectus, is subject to change, and may differ from that shown for the annualized expense ratio and in the financial highlights of this report. Expenses are shown as a percentage of average net assets.
12
Expenses per $1,000
The following table shows the expenses you would have paid on a $1,000 investment in the fund from November 1, 2011, to April 30, 2012. It also shows how much a $1,000 investment would be worth at the close of the period, assuming actual returns and expenses.
| | | | | | |
| | Class A | Class B | Class C | Class M | Class R | Class Y |
|
| Expenses paid per $1,000*† | $5.85 | $9.79 | $9.79 | $8.48 | $7.17 | $4.54 |
|
| Ending value (after expenses) | $1,120.60 | $1,116.20 | $1,116.30 | $1,117.30 | $1,119.20 | $1,121.70 |
|
* Expenses for each share class are calculated using the fund’s annualized expense ratio for each class, which represents the ongoing expenses as a percentage of average net assets for the six months ended 4/30/12. The expense ratio may differ for each share class.
† Expenses are calculated by multiplying the expense ratio by the average account value for the period; then multiplying the result by the number of days in the period; and then dividing that result by the number of days in the year.
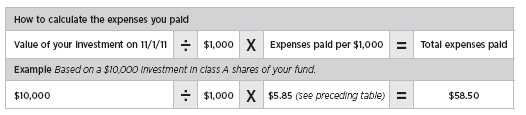
Estimate the expenses you paid
To estimate the ongoing expenses you paid for the six months ended April 30, 2012, use the following calculation method. To find the value of your investment on November 1, 2011, call Putnam at 1-800-225-1581.
Compare expenses using the SEC’s method
The Securities and Exchange Commission (SEC) has established guidelines to help investors assess fund expenses. Per these guidelines, the following table shows your fund’s expenses based on a $1,000 investment, assuming a hypothetical 5% annualized return. You can use this information to compare the ongoing expenses (but not transaction expenses or total costs) of investing in the fund with those of other funds. All mutual fund shareholder reports will provide this information to help you make this comparison. Please note that you cannot use this information to estimate your actual ending account balance and expenses paid during the period.
| | | | | | |
| | Class A | Class B | Class C | Class M | Class R | Class Y |
|
| Expenses paid per $1,000*† | $5.57 | $9.32 | $9.32 | $8.07 | $6.82 | $4.32 |
|
| Ending value (after expenses) | $1,019.34 | $1,015.61 | $1,015.61 | $1,016.86 | $1,018.10 | $1,020.59 |
|
* Expenses for each share class are calculated using the fund’s annualized expense ratio for each class, which represents the ongoing expenses as a percentage of average net assets for the six months ended 4/30/12. The expense ratio may differ for each share class.
† Expenses are calculated by multiplying the expense ratio by the average account value for the period; then multiplying the result by the number of days in the period; and then dividing that result by the number of days in the year.
13
Terms and definitions
Important terms
Total return shows how the value of the fund’s shares changed over time, assuming you held the shares through the entire period and reinvested all distributions in the fund.
Before sales charge, or net asset value, is the price, or value, of one share of a mutual fund, without a sales charge. Before-sales-charge figures fluctuate with market conditions, and are calculated by dividing the net assets of each class of shares by the number of outstanding shares in the class.
After sales charge is the price of a mutual fund share plus the maximum sales charge levied at the time of purchase. After-sales-charge performance figures shown here assume the 4.00% maximum sales charge for class A shares and 3.25% for class M shares.
Contingent deferred sales charge (CDSC) is generally a charge applied at the time of the redemption of class B or C shares and assumes redemption at the end of the period. Your fund’s class B CDSC declines over time from a 5% maximum during the first year to 1% during the sixth year. After the sixth year, the CDSC no longer applies. The CDSC for class C shares is 1% for one year after purchase.
Current yield is the annual rate of return earned from dividends or interest of an investment. Current yield is expressed as a percentage of the price of a security, fund share, or principal investment.
Share classes
Class A shares are generally subject to an initial sales charge and no CDSC (except on certain redemptions of shares bought without an initial sales charge).
Class B shares are not subject to an initial sales charge. They may be subject to a CDSC.
Class C shares are not subject to an initial sales charge and are subject to a CDSC only if the shares are redeemed during the first year.
Class M shares have a lower initial sales charge and a higher 12b-1 fee than class A shares and no CDSC (except on certain redemptions of shares bought without an initial sales charge).
Class R shares are not subject to an initial sales charge or CDSC and are available only to certain defined contribution plans.
Class Y shares are not subject to an initial sales charge or CDSC, and carry no 12b-1 fee. They are generally only available to corporate and institutional clients and clients in other approved programs.
Comparative indexes
Barclays U.S. Aggregate Bond Index is an unmanaged index of U.S. investment-grade fixed-income securities.
BofA (Bank of America) Merrill Lynch U.S. 3-Month Treasury Bill Index is an unmanaged index that seeks to measure the performance of U.S. Treasury bills available in the marketplace.
Russell 1000 Value Index is an unmanaged index of those companies in the large-cap Russell 1000 Index chosen for their value orientation.
S&P 500 Index is an unmanaged index of common stock performance.
Indexes assume reinvestment of all distributions and do not account for fees. Securities and performance of a fund and an index will differ. You cannot invest directly in an index.
Lipper is a third-party industry-ranking entity that ranks mutual funds. Its rankings do not reflect sales charges. Lipper rankings are based on total return at net asset value relative to other funds that have similar current investment styles or objectives as determined by Lipper. Lipper may change a fund’s category assignment at its discretion. Lipper category averages reflect performance trends for funds within a category.
14
Other information for shareholders
Important notice regarding delivery of shareholder documents
In accordance with Securities and Exchange Commission (SEC) regulations, Putnam sends a single copy of annual and semiannual shareholder reports, prospectuses, and proxy statements to Putnam shareholders who share the same address, unless a shareholder requests otherwise. If you prefer to receive your own copy of these documents, please call Putnam at 1-800-225-1581, and Putnam will begin sending individual copies within 30 days.
Proxy voting
Putnam is committed to managing our mutual funds in the best interests of our shareholders. The Putnam funds’ proxy voting guidelines and procedures, as well as information regarding how your fund voted proxies relating to portfolio securities during the 12-month period ended June 30, 2011, are available in the Individual Investors section of putnam.com, and on the SEC’s website, www.sec.gov. If you have questions about finding forms on the SEC’s website, you may call the SEC at 1-800-SEC-0330. You may also obtain the Putnam funds’ proxy voting guidelines and procedures at no charge by calling Putnam’s Shareholder Services at 1-800-225-1581.
Fund portfolio holdings
The fund will file a complete schedule of its portfolio holdings with the SEC for the first and third quarters of each fiscal year on Form N-Q. Shareholders may obtain the fund’s Forms N-Q on the SEC’s website at www.sec.gov. In addition, the fund’s Forms N-Q may be reviewed and copied at the SEC’s Public Reference Room in Washington, D.C. You may call the SEC at 1-800-SEC-0330 for information about the SEC’s website or the operation of the Public Reference Room.
Trustee and employee fund ownership
Putnam employees and members of the Board of Trustees place their faith, confidence, and, most importantly, investment dollars in Putnam mutual funds. As of April 30, 2012, Putnam employees had approximately $350,000,000 and the Trustees had approximately $80,000,000 invested in Putnam mutual funds. These amounts include investments by the Trustees’ and employees’ immediate family members as well as investments through retirement and deferred compensation plans.
15
Financial statements
A guide to financial statements
These sections of the report, as well as the accompanying Notes, constitute the fund’s financial statements.
The fund’s portfolio lists all the fund’s investments and their values as of the last day of the reporting period. Holdings are organized by asset type and industry sector, country, or state to show areas of concentration and diversification.
Statement of assets and liabilities shows how the fund’s net assets and share price are determined. All investment and non-investment assets are added together. Any unpaid expenses and other liabilities are subtracted from this total. The result is divided by the number of shares to determine the net asset value per share, which is calculated separately for each class of shares. (For funds with preferred shares, the amount subtracted from total assets includes the liquidation preference of preferred shares.)
Statement of operations shows the fund’s net investment gain or loss. This is done by first adding up all the fund’s earnings — from dividends and interest income — and subtracting its operating expenses to determine net investment income (or loss). Then, any net gain or loss the fund realized on the sales of its holdings — as well as any unrealized gains or losses over the period — is added to or subtracted from the net investment result to determine the fund’s net gain or loss for the fiscal period.
Statement of changes in net assets shows how the fund’s net assets were affected by the fund’s net investment gain or loss, by distributions to shareholders, and by changes in the number of the fund’s shares. It lists distributions and their sources (net investment income or realized capital gains) over the current reporting period and the most recent fiscal year-end. The distributions listed here may not match the sources listed in the Statement of operations because the distributions are determined on a tax basis and may be paid in a different period from the one in which they were earned. Dividend sources are estimated at the time of declaration. Actual results may vary. Any non-taxable return of capital cannot be determined until final tax calculations are completed after the end of the fund’s fiscal year.
Financial highlights provide an overview of the fund’s investment results, per-share distributions, expense ratios, net investment income ratios, and portfolio turnover in one summary table, reflecting the five most recent reporting periods. In a semiannual report, the highlights table also includes the current reporting period.
16
The fund’s portfolio 4/30/12 (Unaudited)
| | |
| COMMON STOCKS (98.5%)* | Shares | Value |
|
| Aerospace and defense (4.5%) | | |
| Embraer SA ADR (Brazil) | 944,400 | $32,714,016 |
|
| General Dynamics Corp. | 128,200 | 8,653,500 |
|
| Honeywell International, Inc. | 1,092,600 | 66,277,116 |
|
| L-3 Communications Holdings, Inc. | 261,600 | 19,238,064 |
|
| Northrop Grumman Corp. | 530,900 | 33,595,352 |
|
| United Technologies Corp. | 568,000 | 46,371,520 |
|
| | | 206,849,568 |
| Air freight and logistics (0.2%) | | |
| FedEx Corp. S | 103,500 | 9,132,840 |
|
| | | 9,132,840 |
| Airlines (0.3%) | | |
| Delta Air Lines, Inc. † | 1,081,500 | 11,853,240 |
|
| | | 11,853,240 |
| Auto components (0.5%) | | |
| American Axle & Manufacturing Holdings, Inc. † S | 1,221,700 | 11,838,273 |
|
| Johnson Controls, Inc. S | 360,800 | 11,534,776 |
|
| | | 23,373,049 |
| Automobiles (0.4%) | | |
| Ford Motor Co. | 1,474,800 | 16,635,744 |
|
| | | 16,635,744 |
| Beverages (0.8%) | | |
| Beam, Inc. | 73,400 | 4,167,652 |
|
| Coca-Cola Enterprises, Inc. | 1,060,200 | 31,933,224 |
|
| | | 36,100,876 |
| Biotechnology (0.4%) | | |
| Amgen, Inc. | 136,000 | 9,670,960 |
|
| Cubist Pharmaceuticals, Inc. † | 65,900 | 2,786,252 |
|
| Dendreon Corp. † S | 379,300 | 4,418,845 |
|
| | | 16,876,057 |
| Building products (0.4%) | | |
| Fortune Brands Home & Security, Inc. † | 444,519 | 10,108,362 |
|
| Owens Corning, Inc. † S | 263,700 | 9,058,095 |
|
| | | 19,166,457 |
| Capital markets (4.4%) | | |
| Bank of New York Mellon Corp. (The) S | 885,400 | 20,939,710 |
|
| Blackstone Group LP (The) | 909,100 | 12,327,396 |
|
| Charles Schwab Corp. (The) | 821,000 | 11,740,300 |
|
| Goldman Sachs Group, Inc. (The) | 425,893 | 49,041,579 |
|
| KKR & Co. LP | 780,577 | 11,021,747 |
|
| Legg Mason, Inc. | 325,200 | 8,477,964 |
|
| Morgan Stanley | 1,805,600 | 31,200,768 |
|
| State Street Corp. | 1,247,000 | 57,636,340 |
|
| | | 202,385,804 |
| Chemicals (1.9%) | | |
| Celanese Corp. Ser. A | 203,000 | 9,837,380 |
|
| Dow Chemical Co. (The) S | 1,304,900 | 44,210,012 |
|
| E.I. du Pont de Nemours & Co. | 243,200 | 13,001,472 |
|
| LyondellBasell Industries NV Class A (Netherlands) | 474,100 | 19,807,898 |
|
| Tronox, Inc. † | 12,453 | 2,330,579 |
|
| | | 89,187,341 |
17
| | |
| COMMON STOCKS (98.5%)* cont. | Shares | Value |
|
| Commercial banks (4.7%) | | |
| Fifth Third Bancorp | 1,125,900 | $16,021,557 |
|
| First Horizon National Corp. | 1,081,600 | 9,929,088 |
|
| KeyCorp | 601,400 | 4,835,256 |
|
| SunTrust Banks, Inc. | 335,000 | 8,133,800 |
|
| U.S. Bancorp | 1,049,700 | 33,768,849 |
|
| Wells Fargo & Co. | 4,314,079 | 144,219,661 |
|
| | | 216,908,211 |
| Communications equipment (2.2%) | | |
| Cisco Systems, Inc. | 3,466,457 | 69,849,109 |
|
| Juniper Networks, Inc. † | 586,300 | 12,564,409 |
|
| Polycom, Inc. † | 780,000 | 10,350,600 |
|
| Qualcomm, Inc. | 149,600 | 9,550,464 |
|
| | | 102,314,582 |
| Computers and peripherals (2.2%) | | |
| Apple, Inc. † | 69,000 | 40,312,560 |
|
| Hewlett-Packard Co. | 1,928,400 | 47,747,184 |
|
| SanDisk Corp. † | 403,400 | 14,929,834 |
|
| | | 102,989,578 |
| Construction and engineering (0.7%) | | |
| Fluor Corp. S | 313,800 | 18,121,950 |
|
| KBR, Inc. | 395,500 | 13,391,630 |
|
| | | 31,513,580 |
| Consumer finance (0.4%) | | |
| Capital One Financial Corp. | 293,500 | 16,283,380 |
|
| | | 16,283,380 |
| Diversified consumer services (0.1%) | | |
| Apollo Group, Inc. Class A † S | 165,300 | 5,821,866 |
|
| | | 5,821,866 |
| Diversified financial services (7.1%) | | |
| Bank of America Corp. | 7,688,217 | 62,351,440 |
|
| Citigroup, Inc. | 3,457,380 | 114,231,835 |
|
| JPMorgan Chase & Co. | 3,419,882 | 146,986,528 |
|
| | | 323,569,803 |
| Diversified telecommunication services (4.9%) | | |
| AT&T, Inc. S | 2,325,000 | 76,515,750 |
|
| CenturyLink, Inc. S | 769,800 | 29,683,488 |
|
| Verizon Communications, Inc. | 2,964,759 | 119,716,968 |
|
| | | 225,916,206 |
| Electric utilities (1.6%) | | |
| Edison International | 596,000 | 26,229,960 |
|
| Entergy Corp. | 239,115 | 15,676,379 |
|
| FirstEnergy Corp. S | 198,800 | 9,307,816 |
|
| Great Plains Energy, Inc. S | 688,341 | 14,055,923 |
|
| PPL Corp. | 335,400 | 9,173,190 |
|
| | | 74,443,268 |
| Electronic equipment, instruments, and components (0.4%) | | |
| Corning, Inc. S | 678,600 | 9,737,910 |
|
| TE Connectivity, Ltd. (Switzerland) | 197,200 | 7,189,912 |
|
| | | 16,927,822 |
18
| | |
| COMMON STOCKS (98.5%)* cont. | Shares | Value |
|
| Energy equipment and services (2.7%) | | |
| Baker Hughes, Inc. S | 379,800 | $16,752,978 |
|
| Cameron International Corp. † | 474,400 | 24,313,000 |
|
| Halliburton Co. | 243,200 | 8,322,304 |
|
| Oil States International, Inc. † | 93,500 | 7,440,730 |
|
| Schlumberger, Ltd. | 477,739 | 35,419,569 |
|
| Transocean, Ltd. (Switzerland) | 379,500 | 19,123,005 |
|
| Weatherford International, Ltd. (Switzerland) † | 831,895 | 11,871,142 |
|
| | | 123,242,728 |
| Food and staples retail (1.0%) | | |
| CVS Caremark Corp. | 687,500 | 30,676,250 |
|
| Wal-Mart Stores, Inc. S | 293,600 | 17,295,976 |
|
| | | 47,972,226 |
| Food products (0.6%) | | |
| Post Holdings, Inc. † | 170,300 | 5,066,425 |
|
| Sara Lee Corp. | 935,100 | 20,609,604 |
|
| | | 25,676,029 |
| Health-care equipment and supplies (2.8%) | | |
| Baxter International, Inc. | 980,500 | 54,329,505 |
|
| Boston Scientific Corp. † | 1,516,087 | 9,490,705 |
|
| Covidien PLC (Ireland) | 601,972 | 33,246,914 |
|
| St. Jude Medical, Inc. | 234,300 | 9,072,096 |
|
| Stryker Corp. | 377,400 | 20,594,718 |
|
| | | 126,733,938 |
| Health-care providers and services (2.2%) | | |
| Aetna, Inc. | 995,400 | 43,837,416 |
|
| CIGNA Corp. | 696,600 | 32,203,818 |
|
| Lincare Holdings, Inc. | 307,300 | 7,498,120 |
|
| WellPoint, Inc. | 226,200 | 15,340,884 |
|
| | | 98,880,238 |
| Hotels, restaurants, and leisure (0.6%) | | |
| Carnival Corp. S | 365,100 | 11,862,099 |
|
| Vail Resorts, Inc. S | 162,300 | 6,618,594 |
|
| Wyndham Worldwide Corp. | 197,380 | 9,936,109 |
|
| | | 28,416,802 |
| Household durables (0.8%) | | |
| D.R. Horton, Inc. S | 820,200 | 13,410,270 |
|
| Jarden Corp. | 132,100 | 5,538,953 |
|
| Newell Rubbermaid, Inc. | 1,034,600 | 18,829,720 |
|
| | | 37,778,943 |
| Household products (0.7%) | | |
| Colgate-Palmolive Co. | 46,500 | 4,600,710 |
|
| Procter & Gamble Co. (The) | 438,300 | 27,893,412 |
|
| | | 32,494,122 |
| Independent power producers and energy traders (0.9%) | | |
| AES Corp. (The) † | 2,221,900 | 27,818,188 |
|
| Calpine Corp. † | 786,700 | 14,750,625 |
|
| | | 42,568,813 |
| Industrial conglomerates (4.7%) | | |
| General Electric Co. | 7,615,020 | 149,102,092 |
|
| Tyco International, Ltd. | 1,194,842 | 67,066,481 |
|
| | | 216,168,573 |
19
| | |
| COMMON STOCKS (98.5%)* cont. | Shares | Value |
|
| Insurance (6.8%) | | |
| ACE, Ltd. | 406,900 | $30,912,193 |
|
| Aflac, Inc. | 965,600 | 43,490,624 |
|
| Allstate Corp. (The) | 1,864,600 | 62,147,118 |
|
| Assured Guaranty, Ltd. (Bermuda) | 1,088,080 | 15,428,974 |
|
| Chubb Corp. (The) S | 194,575 | 14,217,595 |
|
| Everest Re Group, Ltd. | 187,620 | 18,593,142 |
|
| Hartford Financial Services Group, Inc. (The) S | 1,314,800 | 27,019,140 |
|
| Marsh & McLennan Cos., Inc. | 253,700 | 8,486,265 |
|
| MetLife, Inc. | 1,404,187 | 50,592,858 |
|
| Prudential Financial, Inc. | 307,500 | 18,616,050 |
|
| XL Group PLC | 930,500 | 20,015,055 |
|
| | | 309,519,014 |
| IT Services (0.5%) | | |
| IBM Corp. S | 55,700 | 11,534,356 |
|
| Unisys Corp. † | 510,212 | 9,520,556 |
|
| | | 21,054,912 |
| Leisure equipment and products (0.3%) | | |
| Hasbro, Inc. | 388,100 | 14,258,794 |
|
| | | 14,258,794 |
| Machinery (0.5%) | | |
| Stanley Black & Decker, Inc. | 157,200 | 11,500,752 |
|
| Timken Co. | 176,300 | 9,962,713 |
|
| | | 21,463,465 |
| Media (4.4%) | | |
| Comcast Corp. Class A | 1,949,300 | 59,122,269 |
|
| DISH Network Corp. Class A | 494,900 | 15,821,953 |
|
| Interpublic Group of Companies, Inc. (The) | 1,490,300 | 17,600,443 |
|
| News Corp. Class A S | 957,100 | 18,759,160 |
|
| Time Warner Cable, Inc. | 182,180 | 14,656,381 |
|
| Time Warner, Inc. | 1,336,500 | 50,065,290 |
|
| Walt Disney Co. (The) S | 619,200 | 26,693,712 |
|
| | | 202,719,208 |
| Metals and mining (1.4%) | | |
| Alcoa, Inc. | 675,200 | 6,569,696 |
|
| Barrick Gold Corp. (Canada) | 184,000 | 7,443,073 |
|
| Freeport-McMoRan Copper & Gold, Inc. Class B (Indonesia) | 583,438 | 22,345,675 |
|
| Nucor Corp. S | 317,300 | 12,441,333 |
|
| Rio Tinto PLC (United Kingdom) | 214,871 | 11,969,611 |
|
| U.S. Steel Corp. S | 155,900 | 4,416,647 |
|
| | | 65,186,035 |
| Multiline retail (0.9%) | | |
| Macy’s, Inc. | 283,900 | 11,645,578 |
|
| Target Corp. | 488,400 | 28,297,896 |
|
| | | 39,943,474 |
| Multi-utilities (1.6%) | | |
| Ameren Corp. | 856,300 | 28,078,077 |
|
| CMS Energy Corp. | 350,000 | 8,046,500 |
|
| National Grid PLC (United Kingdom) | 883,144 | 9,538,307 |
|
| PG&E Corp. S | 577,400 | 25,509,532 |
|
| | | 71,172,416 |
20
| | |
| COMMON STOCKS (98.5%)* cont. | Shares | Value |
|
| Oil, gas, and consumable fuels (10.3%) | | |
| Anadarko Petroleum Corp. | 141,400 | $10,351,894 |
|
| Apache Corp. | 416,022 | 39,913,151 |
|
| BP PLC ADR (United Kingdom) | 154,816 | 6,720,563 |
|
| Cabot Oil & Gas Corp. Class A | 445,800 | 15,665,412 |
|
| Chevron Corp. | 693,200 | 73,867,392 |
|
| ConocoPhillips | 244,600 | 17,520,698 |
|
| CONSOL Energy, Inc. S | 209,900 | 6,977,076 |
|
| Energen Corp. | 132,900 | 6,961,302 |
|
| Exxon Mobil Corp. | 955,292 | 82,479,911 |
|
| Hess Corp. | 755,800 | 39,407,412 |
|
| Marathon Oil Corp. | 1,538,400 | 45,136,656 |
|
| Noble Energy, Inc. | 373,000 | 37,046,360 |
|
| Nordic American Tankers, Ltd. (Norway) S | 328,900 | 4,775,628 |
|
| Occidental Petroleum Corp. | 177,914 | 16,229,315 |
|
| Royal Dutch Shell PLC ADR (United Kingdom) | 632,309 | 45,235,386 |
|
| Southwestern Energy Co. † S | 347,600 | 10,977,208 |
|
| Total SA ADR (France) S | 371,500 | 17,872,865 |
|
| | | 477,138,229 |
| Paper and forest products (0.4%) | | |
| International Paper Co. | 488,500 | 16,271,935 |
|
| | | 16,271,935 |
| Personal products (0.3%) | | |
| Avon Products, Inc. | 695,800 | 15,029,280 |
|
| | | 15,029,280 |
| Pharmaceuticals (7.6%) | | |
| Abbott Laboratories | 209,500 | 13,001,570 |
|
| Johnson & Johnson | 1,427,900 | 92,942,011 |
|
| Merck & Co., Inc. | 2,311,291 | 90,695,059 |
|
| Pfizer, Inc. | 5,970,945 | 136,913,769 |
|
| Teva Pharmaceutical Industries, Ltd. ADR (Israel) | 299,100 | 13,680,834 |
|
| | | 347,233,243 |
| Real estate investment trusts (REITs) (0.3%) | | |
| Chimera Investment Corp. | 2,300,200 | 6,647,578 |
|
| MFA Financial, Inc. | 1,237,100 | 9,129,798 |
|
| | | 15,777,376 |
| Road and rail (0.3%) | | |
| Hertz Global Holdings, Inc. † | 804,300 | 12,394,263 |
|
| | | 12,394,263 |
| Semiconductors and semiconductor equipment (1.5%) | | |
| Advanced Micro Devices, Inc. † S | 2,061,500 | 15,172,640 |
|
| Intel Corp. | 697,000 | 19,794,800 |
|
| Lam Research Corp. † S | 156,700 | 6,526,555 |
|
| Novellus Systems, Inc. † | 189,200 | 8,845,100 |
|
| Texas Instruments, Inc. | 560,200 | 17,892,788 |
|
| | | 68,231,883 |
| Software (2.2%) | | |
| Microsoft Corp. | 2,363,800 | 75,688,876 |
|
| Oracle Corp. | 830,000 | 24,393,700 |
|
| | | 100,082,576 |
21
| | | |
| COMMON STOCKS (98.5%)* cont. | | Shares | Value |
|
| Specialty retail (2.1%) | | | |
| American Eagle Outfitters, Inc. | | 1,028,800 | $18,528,688 |
|
| Best Buy Co., Inc. S | | 719,500 | 15,879,365 |
|
| Lowe’s Cos., Inc. | | 1,415,000 | 44,530,050 |
|
| Office Depot, Inc. † S | | 3,601,600 | 10,948,864 |
|
| Staples, Inc. S | | 433,600 | 6,677,440 |
|
| | | | 96,564,407 |
| Tobacco (1.7%) | | | |
| Altria Group, Inc. S | | 461,400 | 14,861,694 |
|
| Lorillard, Inc. | | 178,400 | 24,135,736 |
|
| Philip Morris International, Inc. | | 436,800 | 39,097,968 |
|
| | | | 78,095,398 |
| Wireless telecommunication services (0.3%) | | | |
| Vodafone Group PLC ADR (United Kingdom) S | | 519,400 | 14,454,902 |
|
| | | | 14,454,902 |
| | | | |
| Total common stocks (cost $4,054,985,684) | | | $4,514,772,494 |
|
| |
| CONVERTIBLE PREFERRED STOCKS (0.3%)* | | Shares | Value |
|
| General Motors Co. Ser. B, $2.375 cv. pfd. | | 315,309 | $12,316,758 |
|
| Total convertible preferred stocks (cost $10,591,296) | | | $12,316,758 |
|
| |
| PURCHASED OPTIONS | Expiration date/ | Contract | |
| OUTSTANDING (—%)* | strike price | amount | Value |
|
| Pfizer, Inc. (Put) | May-12/$22.00 | 1,198,130 | $203,682 |
|
| Total purchased options outstanding (cost $275,570) | | | $203,682 |
|
| |
| SHORT-TERM INVESTMENTS (6.7%)* | | Shares | Value |
|
| Putnam Cash Collateral Pool, LLC 0.20% d | | 242,295,260 | $242,295,260 |
|
| Putnam Money Market Liquidity Fund 0.10% e | | 66,429,407 | 66,429,407 |
|
| Total short-term investments (cost $308,724,667) | | | $308,724,667 |
|
| |
| TOTAL INVESTMENTS | | | |
|
| Total investments (cost $4,374,577,217) | | | $4,836,017,601 |
Key to holding’s abbreviations
ADR American Depository Receipts: represents ownership of foreign securities on deposit with a custodian bank
Notes to the fund’s portfolio
Unless noted otherwise, the notes to the fund’s portfolio are for the close of the fund’s reporting period, which ran from November 1, 2011 through April 30, 2012 (the reporting period). Within the following notes to the portfolio, references to “ASC 820” represent Accounting Standards Codification ASC 820 Fair Value Measurements and Disclosures.
* Percentages indicated are based on net assets of $4,583,356,641.
† Non-income-producing security.
d See Note 1 to the financial statements regarding securities lending. The rate quoted in the security description is the annualized 7-day yield of the fund at the close of the reporting period.
e See Note 6 to the financial statements regarding investments in Putnam Money Market Liquidity Fund. The rate quoted in the security description is the annualized 7-day yield of the fund at the close of the reporting period.
S Security on loan, in part or in entirety, at the close of the reporting period.
22
ASC 820 establishes a three-level hierarchy for disclosure of fair value measurements. The valuation hierarchy is based upon the transparency of inputs to the valuation of the fund’s investments. The three levels are defined as follows:
Level 1: Valuations based on quoted prices for identical securities in active markets.
Level 2: Valuations based on quoted prices in markets that are not active or for which all significant inputs are observable, either directly or indirectly.
Level 3: Valuations based on inputs that are unobservable and significant to the fair value measurement.
The following is a summary of the inputs used to value the fund’s net assets as of the close of the reporting period:
| | | |
| | | Valuation inputs | |
|
| Investments in securities: | Level 1 | Level 2 | Level 3 |
|
| Common stocks: | | | |
|
| Consumer discretionary | $465,512,287 | $— | $— |
|
| Consumer staples | 235,367,931 | — | — |
|
| Energy | 600,380,957 | — | — |
|
| Financials | 1,084,443,588 | — | — |
|
| Health care | 589,723,476 | — | — |
|
| Industrials | 528,541,986 | — | — |
|
| Information technology | 411,601,353 | — | — |
|
| Materials | 170,645,311 | — | — |
|
| Telecommunication services | 240,371,108 | — | — |
|
| Utilities | 188,184,497 | — | — |
|
| Total common stocks | 4,514,772,494 | — | — |
| | | | |
| Convertible preferred stocks | — | 12,316,758 | — |
|
| Purchased options outstanding | — | 203,682 | — |
|
| Short-term investments | 66,429,407 | 242,295,260 | — |
|
| Totals by level | $4,581,201,901 | $254,815,700 | $— |
The accompanying notes are an integral part of these financial statements.
23
Statement of assets and liabilities 4/30/12 (Unaudited)
| |
| ASSETS | |
|
| Investment in securities, at value, including $235,378,590 of securities on loan (Note 1): | |
| Unaffiliated issuers (identified cost $4,065,852,550) | $4,527,292,934 |
| Affiliated issuers (identified cost $308,724,667) (Notes 1 and 6) | 308,724,667 |
|
| Dividends, interest and other receivables | 6,063,011 |
|
| Receivable for shares of the fund sold | 599,757 |
|
| Receivable for investments sold | 3,237,751 |
|
| Total assets | 4,845,918,120 |
| |
| LIABILITIES | |
|
| Payable for investments purchased | 8,364,738 |
|
| Payable for shares of the fund repurchased | 5,733,928 |
|
| Payable for compensation of Manager (Note 2) | 1,815,680 |
|
| Payable for investor servicing fees (Note 2) | 1,055,791 |
|
| Payable for custodian fees (Note 2) | 17,375 |
|
| Payable for Trustee compensation and expenses (Note 2) | 1,670,165 |
|
| Payable for administrative services (Note 2) | 52,199 |
|
| Payable for distribution fees (Note 2) | 1,028,319 |
|
| Collateral on securities loaned, at value (Note 1) | 242,295,260 |
|
| Other accrued expenses | 528,024 |
|
| Total liabilities | 262,561,479 |
| | |
| Net assets | $4,583,356,641 |
|
| |
| REPRESENTED BY | |
|
| Paid-in capital (Unlimited shares authorized) (Notes 1 and 4) | $6,201,851,959 |
|
| Undistributed net investment income (Note 1) | 2,580,024 |
|
| Accumulated net realized loss on investments and foreign currency transactions (Note 1) | (2,082,515,726) |
|
| Net unrealized appreciation of investments | 461,440,384 |
|
| Total — Representing net assets applicable to capital shares outstanding | $4,583,356,641 |
| |
| COMPUTATION OF NET ASSET VALUE AND OFFERING PRICE | |
|
| Net asset value and redemption price per class A share | |
| ($4,365,527,566 divided by 307,720,406 shares) | $14.19 |
|
| Offering price per class A share (100/94.25 of $14.19)* | $15.06 |
|
| Net asset value and offering price per class B share ($100,429,508 divided by 7,208,062 shares)** | $13.93 |
|
| Net asset value and offering price per class C share ($38,228,608 divided by 2,706,084 shares)** | $14.13 |
|
| Net asset value and redemption price per class M share ($33,108,730 divided by 2,353,148 shares) | $14.07 |
|
| Offering price per class M share (100/96.50 of $14.07)* | $14.58 |
|
| Net asset value, offering price and redemption price per class R share | |
| ($3,526,214 divided by 249,904 shares) | $14.11 |
|
| Net asset value, offering price and redemption price per class Y share | |
| ($42,536,015 divided by 2,991,590 shares) | $14.22 |
|
* On single retail sales of less than $50,000. On sales of $50,000 or more the offering price is reduced.
** Redemption price per share is equal to net asset value less any applicable contingent deferred sales charge.
The accompanying notes are an integral part of these financial statements.
24
Statement of operations Six months ended 4/30/12 (Unaudited)
| |
| INVESTMENT INCOME | |
|
| Dividends (net of foreign tax of $478,175) | $59,792,751 |
|
| Interest (including interest income of $20,276 from investments in affiliated issuers) (Note 6) | 20,691 |
|
| Securities lending (Note 1) | 390,641 |
|
| Total investment income | 60,204,083 |
| |
| EXPENSES | |
|
| Compensation of Manager (Note 2) | 10,800,212 |
|
| Investor servicing fees (Note 2) | 7,375,932 |
|
| Custodian fees (Note 2) | 19,733 |
|
| Trustee compensation and expenses (Note 2) | 201,193 |
|
| Administrative services (Note 2) | 84,439 |
|
| Distribution fees — Class A (Note 2) | 5,297,932 |
|
| Distribution fees — Class B (Note 2) | 522,235 |
|
| Distribution fees — Class C (Note 2) | 183,495 |
|
| Distribution fees — Class M (Note 2) | 123,791 |
|
| Distribution fees — Class R (Note 2) | 8,296 |
|
| Other | 640,102 |
|
| Total expenses | 25,257,360 |
|
| Expense reduction (Note 2) | (234,910) |
|
| Net expenses | 25,022,450 |
| | |
| Net investment income | 35,181,633 |
|
| |
| Net realized gain on investments (Notes 1 and 3) | 133,357,374 |
|
| Net realized gain on foreign currency transactions (Note 1) | 6,250 |
|
| Net unrealized appreciation of investments during the period | 339,319,440 |
|
| Net gain on investments | 472,683,064 |
| | |
| Net increase in net assets resulting from operations | $507,864,697 |
|
The accompanying notes are an integral part of these financial statements.
25
Statement of changes in net assets
| | |
| INCREASE (DECREASE) IN NET ASSETS | Six months ended 4/30/12* | Year ended 10/31/11 |
|
| Operations: | | |
| Net investment income | $35,181,633 | $55,932,573 |
|
| Net realized gain on investments | | |
| and foreign currency transactions | 133,363,624 | 584,047,107 |
|
| Net unrealized appreciation (depreciation) of investments | 339,319,440 | (467,501,278) |
|
| Net increase in net assets resulting from operations | 507,864,697 | 172,478,402 |
|
| Distributions to shareholders (Note 1): | | |
| From ordinary income | | |
| Net investment income | | |
|
| Class A | (41,365,279) | (51,130,098) |
|
| Class B | (648,460) | (467,457) |
|
| Class C | (228,598) | (132,685) |
|
| Class M | (247,560) | (224,970) |
|
| Class R | (28,093) | (30,264) |
|
| Class Y | (480,126) | (732,673) |
|
| Increase in capital from settlement payments (Note 8) | — | 2,193,206 |
|
| Decrease from capital share transactions (Note 4) | (283,538,208) | (640,363,565) |
|
| Total increase (decrease) in net assets | 181,328,373 | (518,410,104) |
| |
| NET ASSETS | | |
|
| Beginning of period | 4,402,028,268 | 4,920,438,372 |
|
| End of period (including undistributed net investment | | |
| income of $2,580,024 and $10,396,507, respectively) | $4,583,356,641 | $4,402,028,268 |
|
* Unaudited
The accompanying notes are an integral part of these financial statements.
26
|
| This page left blank intentionally. |
27
Financial highlights (For a common share outstanding throughout the period)
| | | | | | | | | | | | | | | | |
| INVESTMENT OPERATIONS: | | LESS DISTRIBUTIONS: | | RATIOS AND SUPPLEMENTAL DATA: |
|
| | | | | | | | | | | | | | | | Ratio | |
| | Net asset | Net | Net realized | | From | From | | | | | | | | Ratio | of net investment | |
| | value, | investment | and unrealized | Total from | net | net realized | From | | | | | | Net assets, | of expenses | income (loss) | |
| | beginning | income | gain (loss) | investment | investment | gain | return | Total | Redemption | Non-recurring | Net asset value, | Total return at | net end of period | to average | to average | Portfolio |
| Period ended | of period | (loss) a | on investments | operations | income | on investments | of capital | distributions | fees | reimbursements | end of period | asset value (%) b | (in thousands) | net assets (%) c | net assets (%) | turnover (%) |
|
| Class A | | | | | | | | | | | | | | | | |
| April 30, 2012** | $12.79 | .11 | 1.42 | 1.53 | (.13) | — | — | (.13) | — | — | $14.19 | 12.06* | $4,365,528 | .55* | .80* | 14* |
| October 31, 2011 | 12.56 | .16 | .21 | .37 | (.15) | — | — | (.15) | — | .01 d | 12.79 | 2.99 | 4,176,494 | 1.10 | 1.17 | 45 |
| October 31, 2010 | 11.15 | .12 | 1.40 | 1.52 | (.11) | — | — | (.11) | — e | — | 12.56 | 13.65 | 4,607,805 | 1.16 | .99 | 48 |
| October 31, 2009 | 10.09 | .15 | 1.11 f,g | 1.26 | (.20) | — | — e | (.20) | — e | — e,h | 11.15 | 12.99 f,g | 4,631,517 | 1.21 i | 1.52 i | 57 |
| October 31, 2008 | 20.26 | .24 | (7.27) | (7.03) | (.31) | (2.83) | — | (3.14) | — e | — | 10.09 | (40.22) | 4,754,294 | 1.00 i | 1.71 i | 35 |
| October 31, 2007 | 21.72 | .23 | 1.09 | 1.32 | (.20) | (2.58) | — | (2.78) | — e | — | 20.26 | 6.47 | 10,937,114 | .92 i | 1.14 i | 57 |
|
| Class B | | | | | | | | | | | | | | | | |
| April 30, 2012** | $12.56 | .06 | 1.39 | 1.45 | (.08) | — | — | (.08) | — | — | $13.93 | 11.62* | $100,430 | .92* | .44* | 14* |
| October 31, 2011 | 12.34 | .06 | .19 | .25 | (.04) | — | — | (.04) | — | .01 d | 12.56 | 2.14 | 108,621 | 1.85 | .41 | 45 |
| October 31, 2010 | 10.95 | .03 | 1.38 | 1.41 | (.02) | — | — | (.02) | — e | — | 12.34 | 12.85 | 159,231 | 1.91 | .27 | 48 |
| October 31, 2009 | 9.91 | .08 | 1.09 f,g | 1.17 | (.13) | — | — e | (.13) | — e | — e,h | 10.95 | 12.11 f,g | 226,198 | 1.96 i | .85 i | 57 |
| October 31, 2008 | 19.94 | .13 | (7.14) | (7.01) | (.19) | (2.83) | — | (3.02) | — e | — | 9.91 | (40.68) | 319,813 | 1.75 i | .96 i | 35 |
| October 31, 2007 | 21.40 | .08 | 1.07 | 1.15 | (.03) | (2.58) | — | (2.61) | — e | — | 19.94 | 5.68 | 1,020,630 | 1.67 i | .40 i | 57 |
|
| Class C | | | | | | | | | | | | | | | | |
| April 30, 2012** | $12.74 | .06 | 1.41 | 1.47 | (.08) | — | — | (.08) | — | — | $14.13 | 11.63* | $38,229 | .92* | .43* | 14* |
| October 31, 2011 | 12.51 | .06 | .21 | .27 | (.05) | — | — | (.05) | — | .01 d | 12.74 | 2.21 | 36,035 | 1.85 | .42 | 45 |
| October 31, 2010 | 11.10 | .03 | 1.40 | 1.43 | (.02) | — | — | (.02) | — e | — | 12.51 | 12.88 | 37,264 | 1.91 | .24 | 48 |
| October 31, 2009 | 10.05 | .07 | 1.11 f,g | 1.18 | (.13) | — | — e | (.13) | — e | — e,h | 11.10 | 12.07 f,g | 37,309 | 1.96 i | .76 i | 57 |
| October 31, 2008 | 20.17 | .13 | (7.23) | (7.10) | (.19) | (2.83) | — | (3.02) | — e | — | 10.05 | (40.64) | 36,166 | 1.75 i | .96 i | 35 |
| October 31, 2007 | 21.63 | .08 | 1.08 | 1.16 | (.04) | (2.58) | — | (2.62) | — e | — | 20.17 | 5.66 | 85,618 | 1.67 i | .39 i | 57 |
|
| Class M | | | | | | | | | | | | | | | | |
| April 30, 2012** | $12.69 | .07 | 1.41 | 1.48 | (.10) | — | — | (.10) | — | — | $14.07 | 11.73* | $33,109 | .80* | .55* | 14* |
| October 31, 2011 | 12.46 | .09 | .21 | .30 | (.08) | — | — | (.08) | — | .01 d | 12.69 | 2.48 | 33,357 | 1.60 | .67 | 45 |
| October 31, 2010 | 11.06 | .06 | 1.39 | 1.45 | (.05) | — | — | (.05) | — e | — | 12.46 | 13.09 | 38,209 | 1.66 | .49 | 48 |
| October 31, 2009 | 10.01 | .10 | 1.10 f,g | 1.20 | (.15) | — | — e | (.15) | — e | — e,h | 11.06 | 12.40 f,g | 39,681 | 1.71 i | 1.00 i | 57 |
| October 31, 2008 | 20.11 | .17 | (7.21) | (7.04) | (.23) | (2.83) | — | (3.06) | — e | — | 10.01 | (40.50) | 36,633 | 1.50 i | 1.21 i | 35 |
| October 31, 2007 | 21.57 | .13 | 1.08 | 1.21 | (.09) | (2.58) | — | (2.67) | — e | — | 20.11 | 5.95 | 92,307 | 1.42 i | .64 i | 57 |
|
| Class R | | | | | | | | | | | | | | | | |
| April 30, 2012** | $12.72 | .09 | 1.41 | 1.50 | (.11) | — | — | (.11) | — | — | $14.11 | 11.92* | $3,526 | .68* | .67* | 14* |
| October 31, 2011 | 12.50 | .12 | .20 | .32 | (.11) | — | — | (.11) | — | .01 d | 12.72 | 2.65 | 3,151 | 1.35 | .92 | 45 |
| October 31, 2010 | 11.09 | .09 | 1.40 | 1.49 | (.08) | — | — | (.08) | — e | — | 12.50 | 13.45 | 3,554 | 1.41 | .74 | 48 |
| October 31, 2009 | 10.04 | .12 | 1.11 f,g | 1.23 | (.18) | — | — e | (.18) | — e | — e,h | 11.09 | 12.69 f,g | 3,579 | 1.46 i | 1.21 i | 57 |
| October 31, 2008 | 20.19 | .20 | (7.24) | (7.04) | (.28) | (2.83) | — | (3.11) | — e | — | 10.04 | (40.38) | 2,905 | 1.25 i | 1.44 i | 35 |
| October 31, 2007 | 21.65 | .18 | 1.09 | 1.27 | (.15) | (2.58) | — | (2.73) | — e | — | 20.19 | 6.23 | 1,717 | 1.17 i | .87 i | 57 |
|
| Class Y | | | | | | | | | | | | | | | | |
| April 30, 2012** | $12.82 | .13 | 1.42 | 1.55 | (.15) | — | — | (.15) | — | — | $14.22 | 12.17* | $42,536 | .43* | .94* | 14* |
| October 31, 2011 | 12.59 | .20 | .20 | .40 | (.18) | — | — | (.18) | — | .01 d | 12.82 | 3.26 | 44,370 | .85 | 1.45 | 45 |
| October 31, 2010 | 11.17 | .15 | 1.41 | 1.56 | (.14) | — | — | (.14) | — e | — | 12.59 | 13.99 | 74,376 | .91 | 1.24 | 48 |
| October 31, 2009 | 10.12 | .20 | 1.08 f,g | 1.28 | (.23) | — | — e | (.23) | — e | — e,h | 11.17 | 13.15 f,g | 79,716 | .96 i | 2.37 i | 57 |
| October 31, 2008 | 20.31 | .27 | (7.28) | (7.01) | (.35) | (2.83) | — | (3.18) | — e | — | 10.12 | (40.06) | 654,582 | .75 i | 1.96 i | 35 |
| October 31, 2007 | 21.76 | .29 | 1.09 | 1.38 | (.25) | (2.58) | — | (2.83) | — e | — | 20.31 | 6.78 | 1,185,123 | .67 i | 1.39 i | 57 |
|
See notes to financial highlights at the end of this section.
The accompanying notes are an integral part of these financial statements.
Financial highlights (Continued)
* Not annualized.
** Unaudited.
a Per share net investment income (loss) has been determined on the basis of the weighted average number of shares outstanding during the period.
b Total return assumes dividend reinvestment and does not reflect the effect of sales charges.
c Includes amounts paid through expense offset and brokerage/service arrangements (Note 2).
d Reflects a non-recurring reimbursement related to restitution amounts in connection with a distribution plan approved by the Securities and Exchange Commission (the SEC) which amounted to $0.01 per share outstanding on July 21, 2011. Also reflects a non-recurring reimbursement related to short-term trading related lawsuits, which amounted to less than $0.01 per share outstanding on May 11, 2011 (Note 8).
e Amount represents less than $0.01 per share.
f Reflects a non-recurring litigation payment received by the fund from Enron Corporation which amounted to $0.05 per share outstanding on December 29, 2008. This payment resulted in an increase to total returns of 0.51% for the year ended October 31, 2009.
g Reflects a non-recurring litigation payment received by the fund from Tyco International, Ltd. which amounted to $0.07 per share outstanding on March 13, 2009. This payment resulted in an increase to total returns of 0.71% for the year ended October 31, 2009.
h Reflects a non-recurring reimbursement pursuant to a settlement between the SEC and Bear Stearns & Co., Inc. and Bear Stearns Securities Corp., which amounted to less than $0.01 per share outstanding as of May 21, 2009.
i Reflects an involuntary contractual expense limitation in effect during the period. For periods prior to October 31, 2009, certain fund expenses were waived in connection with investments in Putnam Prime Money Market Fund. As a result of such limitation and/or waivers, the expenses of each class reflect a reduction of the following amounts:
| |
| | Percentage of |
| | average net assets |
|
| October 31, 2009 | 0.02% |
|
| October 31, 2008 | <0.01 |
|
| October 31, 2007 | <0.01 |
|
The accompanying notes are an integral part of these financial statements.
30
Notes to financial statements 4/30/12 (Unaudited)
Within the following Notes to financial statements, references to “State Street” represent State Street Bank and Trust Company, references to “the SEC” represent the Securities and Exchange Commission and references to “Putnam Management” represent Putnam Investment Management, LLC, the fund’s manager, an indirect wholly-owned subsidiary of Putnam Investments, LLC. Unless otherwise noted, the “reporting period” represents the period from November 1, 2011 through April 30, 2012.
The Putnam Fund for Growth and Income (the fund) is a Massachusetts business trust, which is registered under the Investment Company Act of 1940, as amended, as a diversified open-end management investment company. The investment objective of the fund is to seek capital growth and current income. The fund invests mainly in common stocks of large U.S. companies, with a focus on value stocks that offer the potential for capital growth, current income, or both.
The fund offers class A, class B, class C, class M, class R and class Y shares. Class A and class M shares are sold with a maximum front-end sales charge of 5.75% and 3.50%, respectively, and generally do not pay a contingent deferred sales charge. Class B shares, which convert to class A shares after approximately eight years, do not pay a front-end sales charge and are subject to a contingent deferred sales charge if those shares are redeemed within six years of purchase. Class C shares have a one-year 1.00% contingent deferred sales charge and do not convert to class A shares. Class R shares, which are not available to all investors, are sold at net asset value. The expenses for class A, class B, class C, class M and class R shares may differ based on the distribution fee of each class, which is identified in Note 2. Class Y shares, which are sold at net asset value, are generally subject to the same expenses as class A, class B, class C, class M and class R shares, but do not bear a distribution fee. Class Y shares are not available to all investors.
In the normal course of business, the fund enters into contracts that may include agreements to indemnify another party under given circumstances. The fund’s maximum exposure under these arrangements is unknown as this would involve future claims that may be, but have not yet been, made against the fund. However, the fund’s management team expects the risk of material loss to be remote.
Note 1: Significant accounting policies
The following is a summary of significant accounting policies consistently followed by the fund in the preparation of its financial statements. The preparation of financial statements is in conformity with accounting principles generally accepted in the United States of America and requires management to make estimates and assumptions that affect the reported amounts of assets and liabilities in the financial statements and the reported amounts of increases and decreases in net assets from operations. Actual results could differ from those estimates. Subsequent events after the Statement of assets and liabilities date through the date that the financial statements were issued have been evaluated in the preparation of the financial statements.
Investment income, realized and unrealized gains and losses and expenses of the fund are borne pro-rata based on the relative net assets of each class to the total net assets of the fund, except that each class bears expenses unique to that class (including the distribution fees applicable to such classes). Each class votes as a class only with respect to its own distribution plan or other matters on which a class vote is required by law or determined by the Trustees. If the fund were liquidated, shares of each class would receive their pro-rata share of the net assets of the fund. In addition, the Trustees declare separate dividends on each class of shares.
Security valuation Investments for which market quotations are readily available are valued at the last reported sales price on their principal exchange, or official closing price for certain markets, and are classified as Level 1 securities. If no sales are reported, as in the case of some securities traded over-the-counter, a security is valued at its last reported bid price and is generally categorized as a Level 2 security.
Investments in other open-end investment companies (excluding exchange traded funds), which are classified as Level 1 securities, are based on their net asset value. The net asset value of an investment company equals the total value of its assets less its liabilities and divided by the number of its outstanding shares. Shares are only valued as of the close of regular trading on the New York Stock Exchange each day that the exchange is open.
Many securities markets and exchanges outside the U.S. close prior to the close of the New York Stock Exchange and therefore the closing prices for securities in such markets or on such exchanges may not fully reflect events that occur after such close but before the close of the New York Stock Exchange. Accordingly, on certain days, the fund will fair value foreign equity securities taking into account multiple factors including movements in the
31
U.S. securities markets, currency valuations and comparisons to the valuation of American Depository Receipts, exchange-traded funds and futures contracts. These securities, which will generally represent a transfer from a Level 1 to a Level 2 security, will be classified as Level 2. The number of days on which fair value prices will be used will depend on market activity and it is possible that fair value prices will be used by the fund to a significant extent. Securities quoted in foreign currencies, if any, are translated into U.S. dollars at the current exchange rate.
To the extent a pricing service or dealer is unable to value a security or provides a valuation that Putnam Management does not believe accurately reflects the security’s fair value, the security will be valued at fair value by Putnam Management. Certain investments, including certain restricted and illiquid securities and derivatives, are also valued at fair value following procedures approved by the Trustees. These valuations consider such factors as significant market or specific security events such as interest rate or credit quality changes, various relationships with other securities, discount rates, U.S. Treasury, U.S. swap and credit yields, index levels, convexity exposures and recovery rates. These securities are classified as Level 2 or as Level 3 depending on the priority of the significant inputs.
Such valuations and procedures are reviewed periodically by the Trustees. The fair value of securities is generally determined as the amount that the fund could reasonably expect to realize from an orderly disposition of such securities over a reasonable period of time. By its nature, a fair value price is a good faith estimate of the value of a security in a current sale and does not reflect an actual market price, which may be different by a material amount.
Security transactions and related investment income Security transactions are recorded on the trade date (the date the order to buy or sell is executed). Gains or losses on securities sold are determined on the identified cost basis.
Interest income is recorded on the accrual basis. Dividend income, net of applicable withholding taxes, is recognized on the ex-dividend date except that certain dividends from foreign securities, if any, are recognized as soon as the fund is informed of the ex-dividend date. Non-cash dividends, if any, are recorded at the fair market value of the securities received. Dividends representing a return of capital or capital gains, if any, are reflected as a reduction of cost and/or as a realized gain.
Foreign currency translation The accounting records of the fund are maintained in U.S. dollars. The market value of foreign securities, currency holdings, and other assets and liabilities is recorded in the books and records of the fund after translation to U.S. dollars based on the exchange rates on that day. The cost of each security is determined using historical exchange rates. Income and withholding taxes are translated at prevailing exchange rates when earned or incurred. The fund does not isolate that portion of realized or unrealized gains or losses resulting from changes in the foreign exchange rate on investments from fluctuations arising from changes in the market prices of the securities. Such gains and losses are included with the net realized and unrealized gain or loss on investments. Net realized gains and losses on foreign currency transactions represent net realized exchange gains or losses on closed forward currency contracts, disposition of foreign currencies, currency gains and losses realized between the trade and settlement dates on securities transactions and the difference between the amount of investment income and foreign withholding taxes recorded on the fund’s books and the U.S. dollar equivalent amounts actually received or paid. Net unrealized appreciation and depreciation of assets and liabilities in foreign currencies arise from changes in the value of open forward currency contracts and assets and liabilities other than investments at the period end, resulting from changes in the exchange rate.
Options contracts The fund uses options contracts to hedge against changes in values of securities it owns, owned or expects to own.
The potential risk to the fund is that the change in value of options contracts may not correspond to the change in value of the hedged instruments. In addition, losses may arise from changes in the value of the underlying instruments if there is an illiquid secondary market for the contracts, if interest or exchange rates move unexpectedly or if the counterparty to the contract is unable to perform. Realized gains and losses on purchased options are included in realized gains and losses on investment securities. If a written call option is exercised, the premium originally received is recorded as an addition to sales proceeds. If a written put option is exercised, the premium originally received is recorded as a reduction to the cost of investments.
Exchange traded options are valued at the last sale price or, if no sales are reported, the last bid price for purchased options and the last ask price for written options. Options traded over-the-counter are valued using prices supplied by dealers.
Written option contracts outstanding at period end, if any, are listed after the fund’s portfolio. The fund had an average contract amount of approximately 500,000 on purchased options contracts for the reporting period.
32
Master agreements The fund is a party to ISDA (International Swaps and Derivatives Association, Inc.) Master Agreements (Master Agreements) with certain counterparties that govern over-the-counter derivative and foreign exchange contracts entered into from time to time. The Master Agreements may contain provisions regarding, among other things, the parties’ general obligations, representations, agreements, collateral requirements, events of default and early termination. With respect to certain counterparties, in accordance with the terms of the Master Agreements, collateral posted to the fund is held in a segregated account by the fund’s custodian and with respect to those amounts which can be sold or repledged, are presented in the fund’s portfolio.
Collateral pledged by the fund is segregated by the fund’s custodian and identified in the fund’s portfolio. Collateral can be in the form of cash or debt securities issued by the U.S. Government or related agencies or other securities as agreed to by the fund and the applicable counterparty. Collateral requirements are determined based on the fund’s net position with each counterparty.
Termination events applicable to the fund may occur upon a decline in the fund’s net assets below a specified threshold over a certain period of time. Termination events applicable to counterparties may occur upon a decline in the counterparty’s long-term and short-term credit ratings below a specified level. In each case, upon occurrence, the other party may elect to terminate early and cause settlement of all derivative and foreign exchange contracts outstanding, including the payment of any losses and costs resulting from such early termination, as reasonably determined by the terminating party. Any decision by one or more of the fund’s counterparties to elect early termination could impact the fund’s future derivative activity.
At the close of the reporting period, the fund did not have a net liability position on derivative contracts subject to the Master Agreements.
Securities lending The fund may lend securities, through its agent, to qualified borrowers in order to earn additional income. The loans are collateralized by cash in an amount at least equal to the market value of the securities loaned. The market value of securities loaned is determined daily and any additional required collateral is allocated to the fund on the next business day. The risk of borrower default will be borne by the fund’s agent; the fund will bear the risk of loss with respect to the investment of the cash collateral. Income from securities lending is included in investment income on the Statement of operations. Cash collateral is invested in Putnam Cash Collateral Pool, LLC, a limited liability company managed by an affiliate of Putnam Management. Investments in Putnam Cash Collateral Pool, LLC are valued at its closing net asset value each business day. There are no management fees charged to Putnam Cash Collateral Pool, LLC. At the close of the reporting period, the value of securities loaned amounted to $235,378,590 and the fund received cash collateral of $242,295,260.
Interfund lending The fund, along with other Putnam funds, may participate in an interfund lending program pursuant to an exemptive order issued by the SEC. This program allows the fund to borrow from or lend to other Putnam funds that permit such transactions. Interfund lending transactions are subject to each fund’s investment policies and borrowing and lending limits. Interest earned or paid on the interfund lending transaction will be based on the average of certain current market rates. During the reporting period, the fund did not utilize the program.
Line of credit The fund participates, along with other Putnam funds, in a $325 million unsecured committed line of credit and a $185 million unsecured uncommitted line of credit, both provided by State Street. Borrowings may be made for temporary or emergency purposes, including the funding of shareholder redemption requests and trade settlements. Interest is charged to the fund based on the fund’s borrowing at a rate equal to the Federal Funds rate plus 1.25% for the committed line of credit and the Federal Funds rate plus 1.30% for the uncommitted line of credit. A closing fee equal to 0.02% of the committed line of credit and $50,000 for the uncommitted line of credit has been paid by the participating funds. In addition, a commitment fee of 0.13% per annum on any unutilized portion of the committed line of credit is allocated to the participating funds based on their relative net assets and paid quarterly. During the reporting period, the fund had no borrowings against these arrangements.
Federal taxes It is the policy of the fund to distribute all of its taxable income within the prescribed time period and otherwise comply with the provisions of the Internal Revenue Code of 1986, as amended (the Code), applicable to regulated investment companies. It is also the intention of the fund to distribute an amount sufficient to avoid imposition of any excise tax under Section 4982 of the Code.
The fund is subject to the provisions of Accounting Standards Codification ASC 740 Income Taxes (ASC 740). ASC 740 sets forth a minimum threshold for financial statement recognition of the benefit of a tax position taken or expected to be taken in a tax return. The fund did not have a liability to record for any unrecognized tax benefits in the accompanying financial statements. No provision has been made for federal taxes on income, capital gains or
33
unrealized appreciation on securities held nor for excise tax on income and capital gains. Each of the fund’s federal tax returns for the prior three fiscal years remains subject to examination by the Internal Revenue Service.
The fund may also be subject to taxes imposed by governments of countries in which it invests. Such taxes are generally based on either income or gains earned or repatriated. The fund accrues and applies such taxes to net investment income, net realized gains and net unrealized gains as income and/or capital gains are earned. In some cases, the fund may be entitled to reclaim all or a portion of such taxes, and such reclaim amounts, if any, are reflected as an asset on the fund’s books. In many cases, however, the fund may not receive such amounts for an extended period of time, depending on the country of investment.
At October 31, 2011, the fund had a capital loss carryover of $2,112,870,267 available to the extent allowed by the Code to offset future net capital gain, if any. The amounts of the carryovers and the expiration dates are:
| | | |
| Loss carryover |
|
| Short-term | Long-term | Total | Expiration |
|
| $56,924,364 | $— | $56,924,364 | October 31, 2015 |
|
| 591,334,155 | — | 591,334,155 | October 31, 2016 |
|
| 1,464,611,748 | — | 1,464,611,748 | October 31, 2017 |
|
The aggregate identified cost on a tax basis is $4,477,586,299, resulting in gross unrealized appreciation and depreciation of $622,021,837 and $263,590,535, respectively, or net unrealized appreciation of $358,431,302.
Distributions to shareholders Distributions to shareholders from net investment income are recorded by the fund on the ex-dividend date. Distributions from capital gains, if any, are recorded on the ex-dividend date and paid at least annually. The amount and character of income and gains to be distributed are determined in accordance with income tax regulations, which may differ from generally accepted accounting principles. Dividend sources are estimated at the time of declaration. Actual results may vary. Any non-taxable return of capital cannot be determined until final tax calculations are completed after the end of the fund’s fiscal year. Reclassifications are made to the fund’s capital accounts to reflect income and gains available for distribution (or available capital loss carryovers) under income tax regulations.
Note 2: Management fee, administrative services and other transactions
The fund pays Putnam Management a management fee (based on the fund’s average net assets and computed and paid monthly) at annual rates that may vary based on the average of the aggregate net assets of most open-end funds, as defined in the fund’s management contract, sponsored by Putnam Management. Such annual rates may vary as follows:
| |
| 0.630% | of the first $5 billion, |
| 0.580% | of the next $5 billion, |
| 0.530% | of the next $10 billion, |
| 0.480% | of the next $10 billion, |
| 0.430% | of the next $50 billion, |
| 0.410% | of the next $50 billion, |
| 0.400% | of the next $100 billion and |
| 0.395% | of any excess thereafter. |
Putnam Management has contractually agreed, through June 30, 2012, to waive fees or reimburse the fund’s expenses to the extent necessary to limit the cumulative expenses of the fund, exclusive of brokerage, interest, taxes, investment-related expenses, extraordinary expenses and payments under the fund’s investor servicing contract, investment management contract and distribution plans, on a fiscal year-to-date basis to an annual rate of 0.20% of the fund’s average net assets over such fiscal year-to-date period. During the reporting period, the fund’s expenses were not reduced as a result of this limit.
Putnam Investments Limited (PIL), an affiliate of Putnam Management, is authorized by the Trustees to manage a separate portion of the assets of the fund as determined by Putnam Management from time to time. Putnam Management pays a quarterly sub-management fee to PIL for its services at an annual rate of 0.35% of the average net assets of the portion of the fund managed by PIL.
34
The fund reimburses Putnam Management an allocated amount for the compensation and related expenses of certain officers of the fund and their staff who provide administrative services to the fund. The aggregate amount of all such reimbursements is determined annually by the Trustees.
Custodial functions for the fund’s assets are provided by State Street. Custody fees are based on the fund’s asset level, the number of its security holdings and transaction volumes.
Putnam Investor Services, Inc., an affiliate of Putnam Management, provides investor servicing agent functions to the fund. Putnam Investor Services, Inc. received fees for investor servicing based on the fund’s retail asset level, the number of shareholder accounts in the fund and the level of defined contribution plan assets in the fund. Investor servicing fees will not exceed an annual rate of 0.32% of the fund’s average net assets. Prior to March 1, 2012, investor servicing fees could not exceed an annual rate of 0.375% of the fund’s average net assets. The amounts incurred for investor servicing agent functions during the reporting period are included in Investor servicing fees in the Statement of operations.
The fund has entered into expense offset arrangements with Putnam Investor Services, Inc. and State Street whereby Putnam Investor Services, Inc.’s and State Street’s fees are reduced by credits allowed on cash balances. The fund also reduced expenses through brokerage/service arrangements. For the reporting period, the fund’s expenses were reduced by $5,269 under the expense offset arrangements and by $229,641 under the brokerage/service arrangements.
Each independent Trustee of the fund receives an annual Trustee fee, of which $3,613, as a quarterly retainer, has been allocated to the fund, and an additional fee for each Trustees meeting attended. Trustees also are reimbursed for expenses they incur relating to their services as Trustees.
The fund has adopted a Trustee Fee Deferral Plan (the Deferral Plan) which allows the Trustees to defer the receipt of all or a portion of Trustees fees payable on or after July 1, 1995. The deferred fees remain invested in certain Putnam funds until distribution in accordance with the Deferral Plan.
The fund has adopted an unfunded noncontributory defined benefit pension plan (the Pension Plan) covering all Trustees of the fund who have served as a Trustee for at least five years and were first elected prior to 2004. Benefits under the Pension Plan are equal to 50% of the Trustee’s average annual attendance and retainer fees for the three years ended December 31, 2005. The retirement benefit is payable during a Trustee’s lifetime, beginning the year following retirement, for the number of years of service through December 31, 2006. Pension expense for the fund is included in Trustee compensation and expenses in the Statement of operations. Accrued pension liability is included in Payable for Trustee compensation and expenses in the Statement of assets and liabilities. The Trustees have terminated the Pension Plan with respect to any Trustee first elected after 2003.
The fund has adopted distribution plans (the Plans) with respect to its class A, class B, class C, class M and class R shares pursuant to Rule 12b–1 under the Investment Company Act of 1940. The purpose of the Plans is to compensate Putnam Retail Management Limited Partnership, a wholly-owned subsidiary of Putnam Investments, LLC and Putnam Retail Management GP, Inc., for services provided and expenses incurred in distributing shares of the fund. The Plans provide for payments by the fund to Putnam Retail Management Limited Partnership at an annual rate of up to 0.35%, 1.00%, 1.00%, 1.00% and 1.00% of the average net assets attributable to class A, class B, class C, class M and class R shares, respectively. The Trustees have approved payment by the fund at an annual rate of 0.25%, 1.00%, 1.00%, 0.75% and 0.50% of the average net assets attributable to class A, class B, class C, class M and class R shares, respectively.
For the reporting period, Putnam Retail Management Limited Partnership, acting as underwriter, received net commissions of $87,092 and $549 from the sale of class A and class M shares, respectively, and received $49,652 and $2,156 in contingent deferred sales charges from redemptions of class B and class C shares, respectively.
A deferred sales charge of up to 1.00% and 0.65% is assessed on certain redemptions of class A and class M shares, respectively. For the reporting period, Putnam Retail Management Limited Partnership, acting as underwriter, received $75 and no monies on class A and class M redemptions, respectively.
Note 3: Purchases and sales of securities
During the reporting period, cost of purchases and proceeds from sales of investment securities other than short-term investments aggregated $630,630,018 and $911,185,787, respectively. There were no purchases or proceeds from sales of long-term U.S. government securities.
35
Note 4: Capital shares
At the close of the reporting period, there was an unlimited number of shares of beneficial interest authorized.
Transactions in capital shares were as follows:
| | | | |
| | Six months ended 4/30/12 | Year ended 10/31/11 |
|
| Class A | Shares | Amount | Shares | Amount |
|
| Shares sold | 3,721,877 | $50,154,430 | 8,921,188 | $120,383,482 |
|
| Shares issued in connection with | | | | |
| reinvestment of distributions | 2,888,763 | 37,306,261 | 3,516,498 | 45,884,613 |
|
| | 6,610,640 | 87,460,691 | 12,437,686 | 166,268,095 |
|
| Shares repurchased | (25,385,525) | (340,503,372) | (52,738,582) | (708,368,834) |
|
| Net decrease | (18,774,885) | $(253,042,681) | (40,300,896) | $(542,100,739) |
|
| |
| | Six months ended 4/30/12 | Year ended 10/31/11 |
|
| Class B | Shares | Amount | Shares | Amount |
|
| Shares sold | 278,523 | $3,695,729 | 659,991 | $8,726,805 |
|
| Shares issued in connection with | | | | |
| reinvestment of distributions | 50,249 | 626,243 | 35,549 | 449,315 |
|
| | 328,772 | 4,321,972 | 695,540 | 9,176,120 |
|
| Shares repurchased | (1,765,473) | (23,503,361) | (4,959,094) | (66,033,399) |
|
| Net decrease | (1,436,701) | $(19,181,389) | (4,263,554) | $(56,857,279) |
|
| |
| | Six months ended 4/30/12 | Year ended 10/31/11 |
|
| Class C | Shares | Amount | Shares | Amount |
|
| Shares sold | 189,923 | $2,563,851 | 384,807 | $5,011,051 |
|
| Shares issued in connection with | | | | |
| reinvestment of distributions | 16,950 | 214,653 | 9,641 | 122,792 |
|
| | 206,873 | 2,778,504 | 394,448 | 5,133,843 |
|
| Shares repurchased | (329,199) | (4,385,620) | (544,888) | (7,251,857) |
|
| Net decrease | (122,326) | $(1,607,116) | (150,440) | $(2,118,014) |
|
| |
| | Six months ended 4/30/12 | Year ended 10/31/11 |
|
| Class M | Shares | Amount | Shares | Amount |
|
| Shares sold | 41,323 | $538,908 | 93,933 | $1,232,524 |
|
| Shares issued in connection with | | | | |
| reinvestment of distributions | 18,688 | 237,062 | 16,644 | 214,103 |
|
| | 60,011 | 775,970 | 110,577 | 1,446,627 |
|
| Shares repurchased | (335,624) | (4,475,528) | (548,199) | (7,345,711) |
|
| Net decrease | (275,613) | $(3,699,558) | (437,622) | $(5,899,084) |
|
36
| | | | |
| | Six months ended 4/30/12 | Year ended 10/31/11 |
|
| Class R | Shares | Amount | Shares | Amount |
|
| Shares sold | 21,666 | $289,680 | 37,738 | $505,658 |
|
| Shares issued in connection with | | | | |
| reinvestment of distributions | 2,192 | 28,064 | 2,331 | 30,240 |
|
| | 23,858 | 317,744 | 40,069 | 535,898 |
|
| Shares repurchased | (21,612) | (296,820) | (76,847) | (1,040,633) |
|
| Net increase (decrease) | 2,246 | $20,924 | (36,778) | $(504,735) |
|
| |
| | Six months ended 4/30/12 | Year ended 10/31/11 |
|
| Class Y | Shares | Amount | Shares | Amount |
|
| Shares sold | 229,711 | $3,145,509 | 948,203 | $13,104,539 |
|
| Shares issued in connection with | | | | |
| reinvestment of distributions | 35,560 | 459,682 | 53,858 | 705,084 |
|
| | 265,271 | 3,605,191 | 1,002,061 | 13,809,623 |
|
| Shares repurchased | (734,676) | (9,633,579) | (3,448,242) | (46,693,337) |
|
| Net decrease | (469,405) | $(6,028,388) | (2,446,181) | $(32,883,714) |
|
Note 5: Summary of derivative activity
The following is a summary of the market values of derivative instruments as of the close of the reporting period:
Market values of derivative instruments as of the close of the reporting period
| | | | |
| | Asset derivatives | Liability derivatives |
|
| Derivatives not | | | | |
| accounted for as | Statement of | | Statement of | |
| hedging instruments | assets and | | assets and | |
| under ASC 815 | liabilities location | Market value | liabilities location | Market value |
|
| Equity contracts | Investments | $203,682 | Payables | $— |
|
| Total | | $203,682 | | $— |
|
The following is a summary of change in unrealized gains or losses of derivative instruments on the Statement of operations for the reporting period (see Note 1) (there were no realized gains or losses on derivative instruments):
Change in unrealized appreciation or (depreciation) on derivatives recognized in net gain or (loss) on investments
| | |
| Derivatives not accounted for as hedging | | |
| instruments under ASC 815 | Options | Total |
|
| Equity contracts | $(71,888) | $(71,888) |
|
| Total | $(71,888) | $(71,888) |
|
Note 6: Investment in Putnam Money Market Liquidity Fund
The fund invested in Putnam Money Market Liquidity Fund, an open-end management investment company managed by Putnam Management. Investments in Putnam Money Market Liquidity Fund are valued at its closing net asset value each business day. Income distributions earned by the fund are recorded as interest income in the Statement of operations and totaled $20,276 for the reporting period. During the reporting period, cost of purchases and proceeds of sales of investments in Putnam Money Market Liquidity Fund aggregated $300,696,855 and $279,061,860, respectively. Management fees charged to Putnam Money Market Liquidity Fund have been waived by Putnam Management.
37
Note 7: Market, credit and other risks
In the normal course of business, the fund trades financial instruments and enters into financial transactions where risk of potential loss exists due to changes in the market (market risk) or failure of the contracting party to the transaction to perform (credit risk). The fund may be exposed to additional credit risk that an institution or other entity with which the fund has unsettled or open transactions will default. Investments in foreign securities involve certain risks, including those related to economic instability, unfavorable political developments, and currency fluctuations, not present with domestic investments.
Note 8: Regulatory matters and litigation
In late 2003 and 2004, Putnam Management settled charges brought by the SEC and the Massachusetts Securities Division in connection with excessive short-term trading in Putnam funds. In July 2011, the fund recorded a receivable of $2,152,407 related to restitution amounts in connection with a distribution plan approved by the SEC. This amount is reported in the Increase in capital from settlement payments line on the Statement of changes in net assets. These allegations and related matters have served as the general basis for certain lawsuits, including purported class action lawsuits against Putnam Management and, in a limited number of cases, some Putnam funds. In May 2011, the fund received a payment of $40,799 related to settlement of those lawsuits. This amount is reported in the Increase in capital from settlement payments line on the Statement of changes in net assets. Putnam Management has agreed to bear any costs incurred by the Putnam funds as a result of these matters.
Note 9: New accounting pronouncements
In May 2011, the Financial Accounting Standards Board (FASB) issued Accounting Standards Update (ASU) 2011–04 “Fair Value Measurements and Disclosures (Topic 820) — Amendments to Achieve Common Fair Value Measurement and Disclosure Requirements in U.S. GAAP and IFRS”. ASU 2011–04 amends FASB Topic 820 “Fair Value Measurement” and seeks to develop common requirements for measuring fair value and for disclosing information about fair value measurements in accordance with GAAP. ASU 2011–04 is effective for fiscal years and interim periods beginning after December 15, 2011. The application of ASU 2011–04 will not have a material impact on the fund’s financial statements.
In December 2011, the FASB issued ASU No. 2011–11 “Disclosures about Offsetting Assets and Liabilities”. The update creates new disclosure requirements requiring entities to disclose both gross and net information for derivatives and other financial instruments that are either offset in the Statement of assets and liabilities or subject to an enforceable master netting arrangement or similar agreement. The disclosure requirements are effective for annual reporting periods beginning on or after January 1, 2013 and interim periods within those annual periods. Putnam Management is currently evaluating the application of ASU 2011–11 and its impact, if any, on the fund’s financial statements.
38
The Putnam family of funds
The following is a list of Putnam’s open-end mutual funds offered to the public. Investors should carefully consider the investment objective, risks, charges, and expenses of a fund before investing. For a prospectus, or a summary prospectus if available, containing this and other information for any Putnam fund or product, call your financial advisor at 1-800-225-1581 and ask for a prospectus. Please read the prospectus carefully before investing.
| |
| Growth | Income |
| Growth Opportunities Fund | American Government Income Fund |
| International Growth Fund | Diversified Income Trust |
| Multi-Cap Growth Fund | Floating Rate Income Fund |
| Small Cap Growth Fund | Global Income Trust |
| Voyager Fund | High Yield Advantage Fund |
| | High Yield Trust |
| Blend | Income Fund |
| Asia Pacific Equity Fund | Money Market Fund* |
| Capital Opportunities Fund | Short Duration Income Fund |
| Capital Spectrum Fund | U.S. Government Income Trust |
| Emerging Markets Equity Fund | |
| Equity Spectrum Fund | Tax-free income |
| Europe Equity Fund | AMT-Free Municipal Fund |
| Global Equity Fund | Tax Exempt Income Fund |
| International Capital Opportunities Fund | Tax Exempt Money Market Fund* |
| International Equity Fund | Tax-Free High Yield Fund |
| Investors Fund | |
| Multi-Cap Core Fund | State tax-free income funds: |
| Research Fund | Arizona, California, Massachusetts, Michigan, |
| | Minnesota, New Jersey, New York, Ohio, |
| Value | and Pennsylvania. |
| Convertible Securities Fund | |
| Equity Income Fund | Absolute Return |
| George Putnam Balanced Fund | Absolute Return 100 Fund |
| The Putnam Fund for Growth and Income | Absolute Return 300 Fund |
| International Value Fund | Absolute Return 500 Fund |
| Multi-Cap Value Fund | Absolute Return 700 Fund |
| Small Cap Value Fund | |
* An investment in a money market fund is not insured or guaranteed by the Federal Deposit Insurance Corporation or any other government agency. Although the fund seeks to preserve the value of your investment at $1.00 per share, it is possible to lose money by investing in the fund.
39
| |
| Global Sector | Putnam RetirementReady Funds — portfolios |
| Global Consumer Fund | with automatically adjusting allocations to |
| Global Energy Fund | stocks, bonds, and money market instruments, |
| Global Financials Fund | becoming more conservative over time. |
| Global Health Care Fund | |
| Global Industrials Fund | RetirementReady 2055 Fund |
| Global Natural Resources Fund | RetirementReady 2050 Fund |
| Global Sector Fund | RetirementReady 2045 Fund |
| Global Technology Fund | RetirementReady 2040 Fund |
| Global Telecommunications Fund | RetirementReady 2035 Fund |
| Global Utilities Fund | RetirementReady 2030 Fund |
| | RetirementReady 2025 Fund |
| Asset Allocation | RetirementReady 2020 Fund |
| Putnam Global Asset Allocation Funds — | RetirementReady 2015 Fund |
| portfolios with allocations to stocks, bonds, | |
| and money market instruments that are | Putnam Retirement Income Lifestyle |
| adjusted dynamically within specified ranges | Funds — portfolios with managed |
| as market conditions change. | allocations to stocks, bonds, and money |
| Dynamic Asset Allocation Balanced Fund | market investments to generate |
| Prior to November 30, 2011, this fund was known as | retirement income. |
| Putnam Asset Allocation: Balanced Portfolio. | |
| Dynamic Asset Allocation | Retirement Income Fund Lifestyle 1 |
| Conservative Fund | Prior to June 16, 2011, this fund was known as |
| Prior to November 30, 2011, this fund was known as | Putnam RetirementReady Maturity Fund. |
| Putnam Asset Allocation: Conservative Portfolio. | |
| Dynamic Asset Allocation Growth Fund | Retirement Income Fund Lifestyle 2 |
| Prior to November 30, 2011, this fund was known as | Retirement Income Fund Lifestyle 3 |
| Putnam Asset Allocation: Growth Portfolio. | Prior to June 16, 2011, this fund was known as |
| Dynamic Risk Allocation Fund | Putnam Income Strategies Fund. |
| |
| |
A short-term trading fee of 1% may apply to redemptions or exchanges from certain funds within the time period specified in the fund's prospectus.
Check your account balances and the most recent month-end performance in the Individual Investors section at putnam.com.
40
Services for shareholders
Investor services
Systematic investment plan Tell us how much you wish to invest regularly — weekly, semimonthly, or monthly — and the amount you choose will be transferred automatically from your checking or savings account. There’s no additional fee for this service, and you can suspend it at any time. This plan may be a great way to save for college expenses or to plan for your retirement.
Please note that regular investing does not guarantee a profit or protect against loss in a declining market. Before arranging a systematic investment plan, consider your financial ability to continue making purchases in periods when prices are low.
Systematic exchange You can make regular transfers from one Putnam fund to another Putnam fund. There are no additional fees for this service, and you can cancel or change your options at any time.
Dividends PLUS You can choose to have the dividend distributions from one of your Putnam funds automatically reinvested in another Putnam fund at no additional charge.
Free exchange privilege You can exchange money between Putnam funds free of charge, as long as they are the same class of shares. A signature guarantee is required if you are exchanging more than $500,000. The fund reserves the right to revise or terminate the exchange privilege.
Reinstatement privilege If you’ve sold Putnam shares or received a check for a dividend or capital gain, you may reinvest the proceeds with Putnam within 90 days of the transaction and they will be reinvested at the fund’s current net asset value — with no sales charge. However, reinstatement of class B shares may have special tax consequences. Ask your financial or tax representative for details.
Check-writing service You have ready access to many Putnam accounts. It’s as simple as writing a check, and there are no special fees or service charges. For more information about the check-writing service, call Putnam or visit our website.
Dollar cost averaging When you’re investing for long-term goals, it’s time, not timing, that counts. Investing on a systematic basis is a better strategy than trying to figure out when the markets will go up or down. This means investing the same amount of money regularly over a long period. This method of investing is called dollar cost averaging. When a fund’s share price declines, your investment dollars buy more shares at lower prices. When it increases, they buy fewer shares. Over time, you will pay a lower average price per share.
For more information
Visit the Individual Investors section at putnam.com A secure section of our website contains complete information on your account, including balances and transactions, updated daily. You may also conduct transactions, such as exchanges, additional investments, and address changes. Log on today to get your password.
Call us toll free at 1-800-225-1581 Ask a helpful Putnam representative or your financial advisor for details about any of these or other services, or see your prospectus.
41
Putnam’s commitment to confidentiality
In order to conduct business with our shareholders, we must obtain certain personal information such as account holders’ names, addresses, Social Security numbers, and dates of birth. Using this information, we are able to maintain accurate records of accounts and transactions.
It is our policy to protect the confidentiality of our shareholder information, whether or not a shareholder currently owns shares of our funds. In particular, it is our policy not to sell information about you or your accounts to outside marketing firms. We have safeguards in place designed to prevent unauthorized access to our computer systems and procedures to protect personal information from unauthorized use.
Within the Putnam organization, your information is shared with those who need it to service your account or provide you with information about other Putnam products or services. Under certain circumstances, we must also share account information with outside vendors who provide services to us, such as mailings and proxy solicitations. In these cases, the service providers enter into confidentiality agreements with us, and we provide only the information necessary to process transactions and perform other services related to your account. It is also our policy to share account information with your financial advisor, if you've provided us with information about your advisor and that person is listed on your Putnam account.
If you would like clarification about our confidentiality policies or have any questions or concerns, please don't hesitate to contact us at 1-800-225-1581, Monday through Friday, 8:00 a.m. to 8:00 p.m. Eastern Time.
42
Fund information
Founded 75 years ago, Putnam Investments was built around the concept that a balance between risk and reward is the hallmark of a well-rounded financial program. We manage over 100 funds across income, value, blend, growth, asset allocation, absolute return, and global sector categories.
| | |
| Investment Manager | Paul L. Joskow | Mark C. Trenchard |
| Putnam Investment | Elizabeth T. Kennan | Vice President and |
| Management, LLC | Kenneth R. Leibler | BSA Compliance Officer |
| One Post Office Square | Robert E. Patterson | |
| Boston, MA 02109 | George Putnam, III | Robert T. Burns |
| | Robert L. Reynolds | Vice President and |
| Investment Sub-Manager | W. Thomas Stephens | Chief Legal Officer |
| Putnam Investments Limited | | |
| 57–59 St James’s Street | Officers | James P. Pappas |
| London, England SW1A 1LD | Robert L. Reynolds | Vice President |
| | President | |
| Marketing Services | | Judith Cohen |
| Putnam Retail Management | Jonathan S. Horwitz | Vice President, Clerk and |
| One Post Office Square | Executive Vice President, | Assistant Treasurer |
| Boston, MA 02109 | Principal Executive Officer, | |
| | Treasurer and | Michael Higgins |
| Custodian | Compliance Liaison | Vice President, Senior Associate |
| State Street Bank | | Treasurer and Assistant Clerk |
| and Trust Company | Steven D. Krichmar | |
| | Vice President and | Nancy E. Florek |
| Legal Counsel | Principal Financial Officer | Vice President, Assistant Clerk, |
| Ropes & Gray LLP | | Assistant Treasurer and |
| | Janet C. Smith | Proxy Manager |
| Trustees | Vice President, | |
| Jameson A. Baxter, Chair | Assistant Treasurer and | Susan G. Malloy |
| Ravi Akhoury | Principal Accounting Officer | Vice President and |
| Barbara M. Baumann | | Assistant Treasurer |
| Charles B. Curtis | Robert R. Leveille | |
| Robert J. Darretta | Vice President and | |
| John A. Hill | Chief Compliance Officer | |
| | | |
43
This report is for the information of shareholders of The Putnam Fund for Growth and Income. It may also be used as sales literature when preceded or accompanied by the current prospectus, the most recent copy of Putnam’s Quarterly Performance Summary, and Putnam’s Quarterly Ranking Summary. For more recent performance, please visit putnam.com. Investors should carefully consider the investment objectives, risks, charges, and expenses of a fund, which are described in its prospectus. For this and other information or to request a prospectus or summary prospectus, call 1-800-225-1581 toll free. Please read the prospectus carefully before investing. The fund’s Statement of Additional Information contains additional information about the fund’s Trustees and is available without charge upon request by calling 1-800-225-1581.
44
| |
| Item 3. Audit Committee Financial Expert: |
| |
| Item 4. Principal Accountant Fees and Services: |
| |
| Item 5. Audit Committee of Listed Registrants |
| |
| Item 6. Schedule of Investments: |
| |
| The registrant’s schedule of investments in unaffiliated issuers is included in the report to shareholders in Item 1 above. |
| |
| Item 7. Disclosure of Proxy Voting Policies and Procedures For Closed-End Management Investment Companies: |
| |
| Item 8. Portfolio Managers of Closed-End Investment Companies |
| |
| Item 9. Purchases of Equity Securities by Closed-End Management Investment Companies and Affiliated Purchasers: |
| |
| Item 10. Submission of Matters to a Vote of Security Holders: |
| |
| Item 11. Controls and Procedures: |
| |
| (a) The registrant’s principal executive officer and principal financial officer have concluded, based on their evaluation of the effectiveness of the design and operation of the registrant’s disclosure controls and procedures as of a date within 90 days of the filing date of this report, that the design and operation of such procedures are generally effective to provide reasonable assurance that information required to be disclosed by the registrant in this report is recorded, processed, summarized and reported within the time periods specified in the Commission’s rules and forms. |
| |
| (b) Changes in internal control over financial reporting: Not applicable |
| |
| (a)(2) Separate certifications for the principal executive officer and principal financial officer of the registrant as required by Rule 30a-2(a) under the Investment Company Act of 1940, as amended, are filed herewith. |
| |
| (b) The certifications required by Rule 30a-2(b) under the Investment Company Act of 1940, as amended, are filed herewith. |
| |
| The Putnam Fund for Growth and Income |
| |
| By (Signature and Title): |
| |
| /s/Janet C. Smith
Janet C. Smith
Principal Accounting Officer
|
| |
| Pursuant to the requirements of the Securities Exchange Act of 1934 and the Investment Company Act of 1940, this report has been signed below by the following persons on behalf of the registrant and in the capacities and on the dates indicated. |
| |
| By (Signature and Title): |
| |
| /s/Jonathan S. Horwitz
Jonathan S. Horwitz
Principal Executive Officer
|
| |
| By (Signature and Title): |
| |
| /s/Steven D. Krichmar
Steven D. Krichmar
Principal Financial Officer
|