| | |
| UNITED STATES
SECURITIES AND EXCHANGE COMMISSION |
| | |
| CERTIFIED SHAREHOLDER REPORT OF REGISTERED
MANAGEMENT INVESTMENT COMPANIES
|
| | |
| Investment Company Act file number: | (811-00781) |
| | |
| Exact name of registrant as specified in charter: | The Putnam Fund for Growth and Income |
| | |
| Address of principal executive offices: | One Post Office Square, Boston, Massachusetts 02109 |
| | |
| Name and address of agent for service: | Robert T. Burns, Vice President
One Post Office Square
Boston, Massachusetts 02109 |
| | |
| Copy to: | John W. Gerstmayr, Esq.
Ropes & Gray LLP
800 Boylston Street
Boston, Massachusetts 02199-3600 |
| | |
| Registrant’s telephone number, including area code: | (617) 292-1000 |
| | |
| Date of fiscal year end: | October 31, 2014 |
| | |
| Date of reporting period: | November 1, 2013 — April 30, 2014 |
| | |
|
Item 1. Report to Stockholders: | |
| | |
| The following is a copy of the report transmitted to stockholders pursuant to Rule 30e-1 under the Investment Company Act of 1940: | |
The Putnam
Fund for Growth
and Income
Semiannual report
4 | 30 | 14
| | | |
| Message from the Trustees | 1 | | |
| | |
| About the fund | 2 | | |
| | |
| Performance snapshot | 4 | | |
| | |
| Interview with your fund’s portfolio manager | 5 | | |
| | |
| Your fund’s performance | 10 | | |
| | |
| Your fund’s expenses | 12 | | |
| | |
| Terms and definitions | 14 | | |
| | |
| Other information for shareholders | 15 | | |
| | |
| Financial statements | 16 | | |
| | |
| Shareholder meeting results | 43 | | |
| | |
Consider these risks before investing: Value stocks may fail to rebound, and the market may not favor value-style investing. Income provided by the fund may be reduced by changes in the dividend policies of, and the capital resources available at, the companies in which the fund invests. Stock prices may fall or fail to rise over time for several reasons, including general financial market conditions and factors related to a specific issuer or industry. You can lose money by investing in the fund.
Message from the Trustees
Dear Fellow Shareholder:
Global stock markets continue to advance, albeit at a slower pace than in 2013, as the recovery in economies around the world progresses.
In the United States, recent improvements in the vital areas of employment, manufacturing, and consumer sales appear to have returned the economy to its upward trajectory. Likewise, capital spending by businesses — a key variable needed to support continued economic expansion — has risen. This strength, along with the leadership transition at the Federal Reserve, has fueled debate about future monetary policy.
In this environment, we believe Putnam’s commitment to active fundamental research and new ways of thinking can serve the best interests of investors. We are pleased to report that this commitment has played a positive role in investment performance. Barron’s has ranked Putnam second among 55 fund families based on total return across asset classes for the five years ending in December 2013.
We also believe that it is worthwhile to meet with your financial advisor periodically to discuss the range of strategies that Putnam offers. Your advisor can help you assess your individual needs, time horizon, and risk tolerance — crucial considerations as you work toward your investment goals.

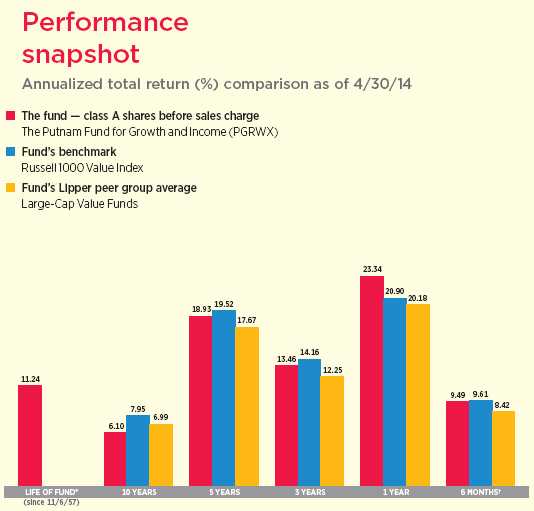
Current performance may be lower or higher than the quoted past performance, which cannot guarantee future results. Share price, principal value, and return will fluctuate, and you may have a gain or a loss when you sell your shares. Performance of class A shares assumes reinvestment of distributions and does not account for taxes. Fund returns in the bar chart do not reflect a sales charge of 5.75%; had they, returns would have been lower. See pages 3, 5, and 10–12 for additional performance information. For a portion of the periods, the fund had expense limitations, without which returns would have been lower. To obtain the most recent month-end performance, visit putnam.com.
* The fund’s benchmark, the Russell 1000 Value Index, and the fund’s Lipper peer group were introduced on 12/31/78 and 12/31/59, respectively, which post-date the inception of the fund’s class A shares.
† Returns for the six-month period are not annualized, but cumulative.
| |
| 4 The Putnam Fund for Growth and Income |
Interview with your fund’s portfolio manager

Bob, what can you tell us about conditions for stock market investors during the six months ended April 30, 2014?
The market continued its solid advance over the six months, although stocks endured a bit of turbulence. In the first two months of the period, November and December 2013, stocks continued their impressive rally — they had already achieved and surpassed their all-time highs several times throughout 2013. As the year came to a close, stocks delivered their best annual performance since the 1990s, and investors appeared to be much less distracted by macroeconomic worries.
In January, however, the S&P 500 Index, a broad measure of U.S. stock performance, had its sharpest one-month decline since May 2012 as investors grew nervous about volatility in emerging markets and disappointing U.S. economic data. Markets remained choppy for the next few months, but delivered gains for the period overall.
How did the fund perform during the period?
The fund delivered a solid positive return that slightly underperformed its benchmark, the Russell 1000 Value Index. I am pleased to report that the fund’s performance exceeded the average return for funds in its Lipper peer group, Large-Cap Value Funds. Within the portfolio, I have been emphasizing areas where stocks may have more growth characteristics, such as technology, and have
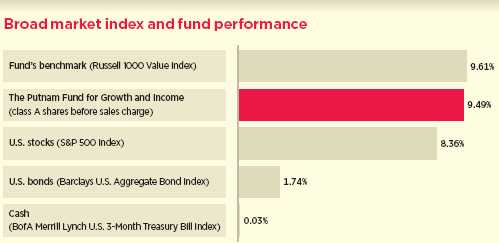
This comparison shows your fund’s performance in the context of broad market indexes for the six months ended 4/30/14. See pages 3–4 and 10–12 for additional fund performance information. Index descriptions can be found on page 14.
| |
| The Putnam Fund for Growth and Income 5 |
avoided areas where I believe stocks are too expensive, such as higher-yielding dividend payers like utilities.
Can you provide some examples of stocks that helped performance?
The biggest contributor to performance for the period was AstraZeneca, a global biopharmaceutical company headquartered in London. The stock had been performing well due to the company’s strong financial performance and building investor enthusiasm for its pipeline of drugs in development. However, the most significant boost to its stock price came just before the close of the period, in late April, when U.S. pharmaceutical company Pfizer announced a takeover bid for AstraZeneca.
Another top contributor to fund performance was the stock of Delta Air Lines. The company has been focused on capacity discipline, which essentially means working to ensure that its flights are full. The changing ownership structure of the airline industry as a whole has also provided better pricing characteristics, with fewer competitors controlling a bigger stake. This, combined with ancillary revenue from initiatives such as baggage fees, has improved Delta’s business model and profitability.
As active fund managers, we have the flexibility to not own a stock that is included in our benchmark index — or to own less of it than the index. During the period, fund performance was helped by our decision to maintain a smaller position in AT&T than the benchmark. We were concerned that intensifying competitive pressure would hurt AT&T’s stock price, and that has played out over the past six months.
Finally, Halliburton, one of the top performers for the previous fiscal year, was also a highlight over the past six months. The company provides products and services for
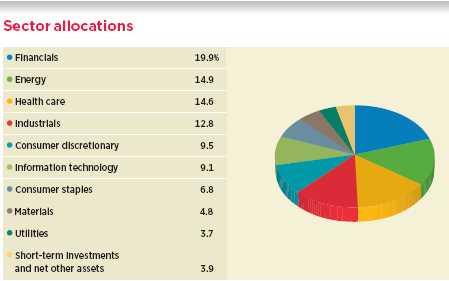
Allocations are shown as a percentage of the fund’s net assets as of 4/30/14. Short-term investments and net other assets, if any, represent the market value weights of cash, derivatives, short-term securities, and other unclassified assets in the portfolio. Summary information may differ from the portfolio schedule included in the financial statements due to the inclusion of derivative securities, any interest accruals, the exclusion of as-of trades, if any, and the use of different classifications of securities for presentation purposes. Holdings and allocations may vary over time.
| |
| 6 The Putnam Fund for Growth and Income |
oil and natural gas exploration and development. Margins have improved for Halliburton’s pressure pumping business, and increased exploration and production activity has boosted demand for Halliburton’s products.

Could you discuss some stocks that detracted from returns relative to the benchmark?
A top detractor was the stock of office supply retailer Office Depot. The company completed its merger with Office Max in late 2013 — a development that was viewed as positive, enabling the company to cut costs, streamline, and improve its business fundamentals. However, the stock still struggled due to concerns about the longer-term outlook for office-supply retailing as a whole. Many believe its growth prospects are weak due to competition, especially from online retailers.
Another retailer, Bed Bath & Beyond, was also a disappointment for the period. The company’s sales were weak, due in large part to the harsh winter weather in many parts of the country, which kept shoppers away. The company has also struggled in its efforts to develop promotional strategies for attracting customers, particularly in light of online competitors.
ITT Educational Services, a provider of post-secondary degree programs, also dampened fund performance for the period. The stock struggled largely in response to an investigation into lending practices of third-party providers of student loans.

This table shows the fund’s top 10 holdings by percentage of the fund’s net assets as of 4/30/14. Short-term holdings and derivatives, if any, are excluded. Holdings may vary over time.
| |
| The Putnam Fund for Growth and Income 7 |
What is your outlook for stock market investing as the fund enters the second half of its fiscal year?
At this time last year, my outlook for stocks was slightly more constructive than it is today. This is mainly due to the fact that the market was so strong in 2013 and stocks are a bit more expensive now. U.S. stock performance in 2013 was a top-quartile outcome by historic measures, and, in my opinion, we should not expect that to continue.
Valuations today are about in the middle of their historic range. Typically, if you buy stocks when they are inexpensive, you can expect a better-than-average rate of return. If you buy stocks when they are expensive, you should expect a below-average rate of return. Today, with stocks at average valuations, our expectation should be for average returns in 2014. While I seek to keep the average valuation of portfolio holdings at an optimum level, I do not have rigid, deep-value selection criteria or a yield requirement, which enables me to consider stocks with subtle growth characteristics when the market favors them.
Business was weak for many companies due to the harsh winter weather, but perhaps it has resulted in pent-up demand that will lead to opportunities in the coming months. Recent economic growth was at a lower level than most investors expected, but I believe there may be greater potential for the economy to accelerate in the months ahead. Despite some disappointments in economic data in the early months of 2014, we remain optimistic about an improving U.S. economy, with housing and employment trends suggesting a solid backdrop for growth in 2014. I believe stocks in many sectors still have room to advance, even if returns are likely to be more modest overall.
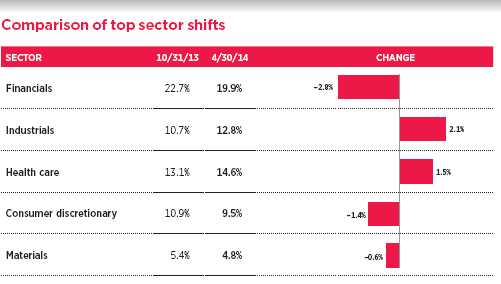
This chart shows the fund’s largest allocation shifts, by percentage, over the past six months. Allocations are shown as a percentage of the fund’s net assets. Current period summary information may differ from the portfolio schedule included in the financial statements due to the inclusion of derivative securities, any interest accruals, the exclusion of as-of trades, if any, and the use of different classifications of securities for presentation purposes. Holdings and allocations may vary over time.
| |
| 8 The Putnam Fund for Growth and Income |
Thank you, Bob, for your time and insights.
The views expressed in this report are exclusively those of Putnam Management and are subject to change. They are not meant as investment advice.
Please note that the holdings discussed in this report may not have been held by the fund for the entire period. Portfolio composition is subject to review in accordance with the fund’s investment strategy and may vary in the future. Current and future portfolio holdings are subject to risk.
Portfolio Manager Robert D. Ewing is Co-Head of U.S. Equities at Putnam. He has a B.S. in Finance and Economics from Boston College. He joined Putnam in 2008 and has been in the investment industry since 1990.
IN THE NEWS
An anticipated boom in capital spending by U.S. businesses may provide the nation’s economy with a much-needed boost in 2014. Capital expenditures this year are expected to increase by 10.3% among manufacturing companies and 10.8% among non-manufacturers, according to a recent forecast by the Business Survey Committee of the Institute for Supply Management (ISM). A rise in business investment — upgrading factories and industrial buildings, as well as buying new equipment and machinery — could provide a major catalyst to economic and corporate earnings growth. Since the 2008 financial crisis, most companies with extra cash have deployed it to repair balance sheets or have returned it to shareholders through stock buybacks or higher dividends. Today, some investors would rather see companies devote that capital to expand their operations.
| |
| The Putnam Fund for Growth and Income 9 |
Your fund’s performance
This section shows your fund’s performance, price, and distribution information for periods ended April 30, 2014, the end of the first half of its current fiscal year. In accordance with regulatory requirements for mutual funds, we also include performance information as of the most recent calendar quarter-end and expense information taken from the fund’s current prospectus. Performance should always be considered in light of a fund’s investment strategy. Data represent past performance. Past performance does not guarantee future results. More recent returns may be less or more than those shown. Investment return and principal value will fluctuate, and you may have a gain or a loss when you sell your shares. Performance information does not reflect any deduction for taxes a shareholder may owe on fund distributions or on the redemption of fund shares. For the most recent month-end performance, please visit the Individual Investors section at putnam.com or call Putnam at 1-800-225-1581. Class R, R5, R6, and class Y shares are not available to all investors. See the Terms and Definitions section in this report for definitions of the share classes offered by your fund.
Fund performance Total return for periods ended 4/30/14
| | | | | | | | | | | | |
| | Class A | Class B | Class C | Class M | Class R | Class R5 | Class R6 | Class Y |
| (inception dates) | (11/6/57) | (4/27/92) | (7/26/99) | (5/1/95) | (1/21/03) | (7/2/12) | (7/2/12) | (6/15/94) |
|
| | Before | After | | | | | Before | After | Net | Net | Net | Net |
| | sales | sales | Before | After | Before | After | sales | sales | asset | asset | asset | asset |
| | charge | charge | CDSC | CDSC | CDSC | CDSC | charge | charge | value | value | value | value |
|
| Annual average | | | | | | | | | | | | |
| (life of fund) | 11.24% | 11.13% | 11.08% | 11.08% | 10.41% | 10.41% | 10.52% | 10.45% | 10.96% | 11.35% | 11.35% | 11.34% |
|
| 10 years | 80.84 | 70.44 | 70.12 | 70.12 | 67.69 | 67.69 | 71.96 | 65.94 | 76.36 | 85.81 | 86.03 | 85.34 |
| Annual average | 6.10 | 5.48 | 5.46 | 5.46 | 5.31 | 5.31 | 5.57 | 5.20 | 5.84 | 6.39 | 6.40 | 6.36 |
|
| 5 years | 137.96 | 124.27 | 129.38 | 127.38 | 129.28 | 129.28 | 132.18 | 124.05 | 135.10 | 141.59 | 141.88 | 140.98 |
| Annual average | 18.93 | 17.53 | 18.06 | 17.86 | 18.05 | 18.05 | 18.35 | 17.51 | 18.64 | 19.29 | 19.32 | 19.23 |
|
| 3 years | 46.04 | 37.64 | 42.83 | 39.83 | 42.82 | 42.82 | 43.82 | 38.78 | 44.95 | 47.58 | 47.75 | 47.21 |
| Annual average | 13.46 | 11.24 | 12.62 | 11.82 | 12.62 | 12.62 | 12.88 | 11.54 | 13.17 | 13.85 | 13.90 | 13.76 |
|
| 1 year | 23.34 | 16.25 | 22.40 | 17.40 | 22.38 | 21.38 | 22.69 | 18.40 | 23.02 | 23.81 | 23.87 | 23.65 |
|
| 6 months | 9.49 | 3.20 | 9.14 | 4.14 | 9.09 | 8.09 | 9.20 | 5.38 | 9.34 | 9.70 | 9.75 | 9.67 |
|
Current performance may be lower or higher than the quoted past performance, which cannot guarantee future results. After-sales-charge returns for class A and M shares reflect the deduction of the maximum 5.75% and 3.50% sales charge, respectively, levied at the time of purchase. Class B share returns after contingent deferred sales charge (CDSC) reflect the applicable CDSC, which is 5% in the first year, declining over time to 1% in the sixth year, and is eliminated thereafter. Class C share returns after CDSC reflect a 1% CDSC for the first year that is eliminated thereafter. Class R, R5, R6, and Y shares have no initial sales charge or CDSC. Performance for class B, C, M, R, and Y shares before their inception is derived from the historical performance of class A shares, adjusted for the applicable sales charge (or CDSC) and the higher operating expenses for such shares, except for class Y shares, for which 12b-1 fees are not applicable. Performance for class R5 and R6 shares prior to their inception is derived from the historical performance of class Y shares and has not been adjusted for the lower investor servicing fees applicable to class R5 and R6 shares; had it, returns would have been higher.
Recent performance may have benefited from one or more legal settlements.
For a portion of the periods, the fund had expense limitations, without which returns would have been lower.
Class B share performance reflects conversion to class A shares after eight years.
| |
| 10 The Putnam Fund for Growth and Income |
Comparative index returns For periods ended 4/30/14
| | |
| | | Lipper Large-Cap Value |
| | Russell 1000 Value Index | Funds category average* |
|
| Annual average (life of fund) | —† | —† |
|
| 10 years | 114.94% | 97.80% |
| Annual average | 7.95 | 6.99 |
|
| 5 years | 143.92 | 126.05 |
| Annual average | 19.52 | 17.67 |
|
| 3 years | 48.77 | 41.56 |
| Annual average | 14.16 | 12.25 |
|
| 1 year | 20.90 | 20.18 |
|
| 6 months | 9.61 | 8.42 |
|
Index and Lipper results should be compared with fund performance before sales charge, before CDSC, or at net asset value.
* Over the 6-month, 1-year, 3-year, 5-year, and 10-year periods ended 4/30/14, there were 482, 470, 417, 360, and 238 funds, respectively, in this Lipper category.
† The fund’s benchmark, the Russell 1000 Value Index, and the fund’s Lipper peer group were introduced on 12/31/78 and 12/31/59, respectively, which post-date the inception of the fund’s class A shares.
Fund price and distribution information For the six-month period ended 4/30/14
| | | | | | | | | | |
| Distributions | Class A | Class B | Class C | Class M | Class R | Class R5 | Class R6 | Class Y |
|
| Number | 2 | 2 | 2 | 2 | 2 | 2 | 2 | 2 |
|
| Income | $0.124 | $0.050 | $0.054 | $0.076 | $0.097 | $0.156 | $0.165 | $0.149 |
|
| Capital gains | — | — | — | — | — | — | — | — |
|
| Total | $0.124 | $0.050 | $0.054 | $0.076 | $0.097 | $0.156 | $0.165 | $0.149 |
|
| | Before | After | Net | Net | Before | After | Net | Net | Net | Net |
| | sales | sales | asset | asset | sales | sales | asset | asset | asset | asset |
| Share value | charge | charge | value | value | charge | charge | value | value | value | value |
|
| 10/31/13 | $18.87 | $20.02 | $18.52 | $18.78 | $18.71 | $19.39 | $18.77 | $18.93 | $18.92 | $18.91 |
|
| 4/30/14 | 20.53 | 21.78 | 20.16 | 20.43 | 20.35 | 21.09 | 20.42 | 20.60 | 20.59 | 20.58 |
|
| | Before | After | Net | Net | Before | After | Net | Net | Net | Net |
| Current rate | sales | sales | asset | asset | sales | sales | asset | asset | asset | asset |
| (end of period) | charge | charge | value | value | charge | charge | value | value | value | value |
|
| Current | | | | | | | | | | |
| dividend rate 1 | 0.92% | 0.86% | 0.18% | 0.22% | 0.43% | 0.42% | 0.65% | 1.22% | 1.32% | 1.17% |
|
| Current 30-day | | | | | | | | | | |
| SEC yield 2 | N/A | 1.02 | 0.35 | 0.35 | N/A | 0.58 | 0.84 | 1.31 | 1.47 | 1.33 |
|
The classification of distributions, if any, is an estimate. Before-sales-charge share value and current dividend rate for class A and M shares, if applicable, do not take into account any sales charge levied at the time of purchase. After-sales-charge share value, current dividend rate, and current 30-day SEC yield, if applicable, are calculated assuming that the maximum sales charge (5.75% for class A shares and 3.50% for class M shares) was levied at the time of purchase. Final distribution information will appear on your year-end tax forms.
1 Most recent distribution, including any return of capital and excluding capital gains, annualized and divided by share price before or after sales charge at period-end.
2 Based only on investment income and calculated using the maximum offering price for each share class, in accordance with SEC guidelines.
| |
| The Putnam Fund for Growth and Income 11 |
Fund performance as of most recent calendar quarter
Total return for periods ended 3/31/14
| | | | | | | | | | | | |
| | | | | | | | | | | | |
| | Class A | Class B | Class C | Class M | Class R | Class R5 | Class R6 | Class Y |
| (inception dates) | (11/6/57) | (4/27/92) | (7/26/99) | (5/1/95) | (1/21/03) | (7/2/12) | (7/2/12) | (6/15/94) |
|
| | Before | After | | | | | Before | After | Net | Net | Net | Net |
| | sales | sales | Before | After | Before | After | sales | sales | asset | asset | asset | asset |
| | charge | charge | CDSC | CDSC | CDSC | CDSC | charge | charge | value | value | value | value |
|
| Annual average | | | | | | | | | | | | |
| (life of fund) | 11.24% | 11.13% | 11.08% | 11.08% | 10.41% | 10.41% | 10.52% | 10.45% | 10.96% | 11.35% | 11.35% | 11.34% |
|
| 10 years | 75.87 | 65.75 | 65.57 | 65.57 | 63.23 | 63.23 | 67.37 | 61.51 | 71.50 | 80.73 | 80.94 | 80.27 |
| Annual average | 5.81 | 5.18 | 5.17 | 5.17 | 5.02 | 5.02 | 5.29 | 4.91 | 5.54 | 6.10 | 6.11 | 6.07 |
|
| 5 years | 163.19 | 148.06 | 153.40 | 151.40 | 153.66 | 153.66 | 156.98 | 147.99 | 159.99 | 167.34 | 167.66 | 166.67 |
| Annual average | 21.35 | 19.93 | 20.44 | 20.25 | 20.46 | 20.46 | 20.78 | 19.92 | 21.06 | 21.73 | 21.76 | 21.67 |
|
| 3 years | 48.47 | 39.94 | 45.12 | 42.12 | 45.25 | 45.25 | 46.27 | 41.15 | 47.45 | 49.96 | 50.14 | 49.58 |
| Annual average | 14.08 | 11.85 | 13.22 | 12.43 | 13.25 | 13.25 | 13.52 | 12.18 | 13.82 | 14.46 | 14.51 | 14.36 |
|
| 1 year | 24.77 | 17.59 | 23.83 | 18.83 | 23.84 | 22.84 | 24.17 | 19.82 | 24.51 | 25.25 | 25.31 | 25.09 |
|
| 6 months | 12.90 | 6.40 | 12.47 | 7.47 | 12.48 | 11.48 | 12.61 | 8.66 | 12.75 | 13.04 | 13.10 | 13.01 |
|
See the discussion following the Fund performance table on page 10 for information about the calculation of fund performance.
Your fund’s expenses
As a mutual fund investor, you pay ongoing expenses, such as management fees, distribution fees (12b-1 fees), and other expenses. Using the following information, you can estimate how these expenses affect your investment and compare them with the expenses of other funds. You may also pay one-time transaction expenses, including sales charges (loads) and redemption fees, which are not shown in this section and would have resulted in higher total expenses. For more information, see your fund’s prospectus or talk to your financial representative.
Expense ratios
| | | | | | | | |
| | Class A | Class B | Class C | Class M | Class R | Class R5 | Class R6 | Class Y |
|
| Total annual operating expenses for | | | | | | | | |
| the fiscal year ended 10/31/13 | 1.04% | 1.79% | 1.79% | 1.54% | 1.29% | 0.67% | 0.57% | 0.79% |
|
| Annualized expense ratio for the | | | | | | | | |
| six-month period ended 4/30/14 | 0.99% | 1.74% | 1.74% | 1.49% | 1.24% | 0.67% | 0.57% | 0.74% |
|
Fiscal-year expense information in this table is taken from the most recent prospectus, is subject to change, and may differ from that shown for the annualized expense ratio and in the financial highlights of this report.
Expenses are shown as a percentage of average net assets.
| |
| 12 The Putnam Fund for Growth and Income |
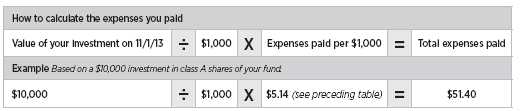
Expenses per $1,000
The following table shows the expenses you would have paid on a $1,000 investment in the fund from November 1, 2013, to April 30, 2014. It also shows how much a $1,000 investment would be worth at the close of the period, assuming actual returns and expenses.
| | | | | | | | |
| | Class A | Class B | Class C | Class M | Class R | Class R5 | Class R6 | Class Y |
|
| Expenses paid per $1,000*† | $5.14 | $9.02 | $9.02 | $7.73 | $6.44 | $3.48 | $2.96 | $3.85 |
|
| Ending value (after expenses) | $1,094.90 | $1,091.40 | $1,090.90 | $1,092.00 | $1,093.40 | $1,097.00 | $1,097.50 | $1,096.70 |
|
* Expenses for each share class are calculated using the fund’s annualized expense ratio for each class, which represents the ongoing expenses as a percentage of average net assets for the six months ended 4/30/14. The expense ratio may differ for each share class.
† Expenses are calculated by multiplying the expense ratio by the average account value for the period; then multiplying the result by the number of days in the period; and then dividing that result by the number of days in the year.
Estimate the expenses you paid
To estimate the ongoing expenses you paid for the six months ended April 30, 2014, use the following calculation method. To find the value of your investment on November 1, 2013, call Putnam at 1-800-225-1581.
Compare expenses using the SEC’s method
The Securities and Exchange Commission (SEC) has established guidelines to help investors assess fund expenses. Per these guidelines, the following table shows your fund’s expenses based on a $1,000 investment, assuming a hypothetical 5% annualized return. You can use this information to compare the ongoing expenses (but not transaction expenses or total costs) of investing in the fund with those of other funds. All mutual fund shareholder reports will provide this information to help you make this comparison. Please note that you cannot use this information to estimate your actual ending account balance and expenses paid during the period.
| | | | | | | | |
| | Class A | Class B | Class C | Class M | Class R | Class R5 | Class R6 | Class Y |
|
| Expenses paid per $1,000*† | $4.96 | $8.70 | $8.70 | $7.45 | $6.21 | $3.36 | $2.86 | $3.71 |
|
| Ending value (after expenses) | $1,019.89 | $1,016.17 | $1,016.17 | $1,017.41 | $1,018.65 | $1,021.47 | $1,021.97 | $1,021.12 |
|
* Expenses for each share class are calculated using the fund’s annualized expense ratio for each class, which represents the ongoing expenses as a percentage of average net assets for the six months ended 4/30/14. The expense ratio may differ for each share class.
† Expenses are calculated by multiplying the expense ratio by the average account value for the six-month period; then multiplying the result by the number of days in the six-month period; and then dividing that result by the number of days in the year.
| |
| The Putnam Fund for Growth and Income 13 |
Terms and definitions
Important terms
Total return shows how the value of the fund’s shares changed over time, assuming you held the shares through the entire period and reinvested all distributions in the fund.
Before sales charge, or net asset value, is the price, or value, of one share of a mutual fund, without a sales charge. Before-sales-charge figures fluctuate with market conditions, and are calculated by dividing the net assets of each class of shares by the number of outstanding shares in the class.
After sales charge is the price of a mutual fund share plus the maximum sales charge levied at the time of purchase. After-sales-charge performance figures shown here assume the 5.75% maximum sales charge for class A shares and 3.50% for class M shares.
Contingent deferred sales charge (CDSC) is generally a charge applied at the time of the redemption of class B or C shares and assumes redemption at the end of the period. Your fund’s class B CDSC declines over time from a 5% maximum during the first year to 1% during the sixth year. After the sixth year, the CDSC no longer applies. The CDSC for class C shares is 1% for one year after purchase.
Current rate is the annual rate of return earned from dividends or interest of an investment. Current rate is expressed as a percentage of the price of a security, fund share, or principal investment.
Share classes
Class A shares are generally subject to an initial sales charge and no CDSC (except on certain redemptions of shares bought without an initial sales charge).
Class B shares are not subject to an initial sales charge. They may be subject to a CDSC.
Class C shares are not subject to an initial sales charge and are subject to a CDSC only if the shares are redeemed during the first year.
Class M shares have a lower initial sales charge and a higher 12b-1 fee than class A shares and no CDSC (except on certain redemptions of shares bought without an initial sales charge).
Class R shares are not subject to an initial sales charge or CDSC and are available only to certain employer-sponsored retirement plans.
Class R5 shares and class R6 shares are not subject to an initial sales charge or CDSC, and carry no 12b-1 fee. They are only available to employer-sponsored retirement plans.
Class Y shares are not subject to an initial sales charge or CDSC, and carry no 12b-1 fee. They are generally only available to corporate and institutional clients and clients in other approved programs.
Comparative indexes
Barclays U.S. Aggregate Bond Index is an unmanaged index of U.S. investment-grade fixed-income securities.
BofA Merrill Lynch U.S. 3-Month Treasury Bill Index is an unmanaged index that seeks to measure the performance of U.S. Treasury bills available in the marketplace.
Russell 1000 Value Index is an unmanaged index of those companies in the large-cap Russell 1000 Index chosen for their value orientation.
S&P 500 Index is an unmanaged index of common stock performance.
Indexes assume reinvestment of all distributions and do not account for fees. Securities and performance of a fund and an index will differ. You cannot invest directly in an index.
Lipper is a third-party industry-ranking entity that ranks mutual funds. Its rankings do not reflect sales charges. Lipper rankings
| |
| 14 The Putnam Fund for Growth and Income |
are based on total return at net asset value relative to other funds that have similar current investment styles or objectives as determined by Lipper. Lipper may change a fund’s category assignment at its discretion. Lipper category averages reflect performance trends for funds within a category.
Other information for shareholders
Important notice regarding delivery of shareholder documents
In accordance with Securities and Exchange Commission (SEC) regulations, Putnam sends a single copy of annual and semiannual shareholder reports, prospectuses, and proxy statements to Putnam shareholders who share the same address, unless a shareholder requests otherwise. If you prefer to receive your own copy of these documents, please call Putnam at 1-800-225-1581, and Putnam will begin sending individual copies within 30 days.
Proxy voting
Putnam is committed to managing our mutual funds in the best interests of our shareholders. The Putnam funds’ proxy voting guidelines and procedures, as well as information regarding how your fund voted proxies relating to portfolio securities during the 12-month period ended June 30, 2013, are available in the Individual Investors section of putnam.com, and on the SEC’s website, www.sec.gov. If you have questions about finding forms on the SEC’s website, you may call the SEC at 1-800-SEC-0330. You may also obtain the Putnam funds’ proxy voting guidelines and procedures at no charge by calling Putnam’s Shareholder Services at 1-800-225-1581.
Fund portfolio holdings
The fund will file a complete schedule of its portfolio holdings with the SEC for the first and third quarters of each fiscal year on Form N-Q. Shareholders may obtain the fund’s Forms N-Q on the SEC’s website at www.sec.gov. In addition, the fund’s Forms N-Q may be reviewed and copied at the SEC’s Public Reference Room in Washington, D.C. You may call the SEC at 1-800-SEC-0330 for information about the SEC’s website or the operation of the Public Reference Room.
Trustee and employee fund ownership
Putnam employees and members of the Board of Trustees place their faith, confidence, and, most importantly, investment dollars in Putnam mutual funds. As of April 30, 2014, Putnam employees had approximately $458,000,000 and the Trustees had approximately $110,000,000 invested in Putnam mutual funds. These amounts include investments by the Trustees’ and employees’ immediate family members as well as investments through retirement and deferred compensation plans.
| |
| The Putnam Fund for Growth and Income 15 |
Financial statements
A guide to financial statements
These sections of the report, as well as the accompanying Notes, constitute the fund’s financial statements.
The fund’s portfolio lists all the fund’s investments and their values as of the last day of the reporting period. Holdings are organized by asset type and industry sector, country, or state to show areas of concentration and diversification.
Statement of assets and liabilities shows how the fund’s net assets and share price are determined. All investment and non-investment assets are added together. Any unpaid expenses and other liabilities are subtracted from this total. The result is divided by the number of shares to determine the net asset value per share, which is calculated separately for each class of shares. (For funds with preferred shares, the amount subtracted from total assets includes the liquidation preference of preferred shares.)
Statement of operations shows the fund’s net investment gain or loss. This is done by first adding up all the fund’s earnings — from dividends and interest income — and subtracting its operating expenses to determine net investment income (or loss). Then, any net gain or loss the fund realized on the sales of its holdings — as well as any unrealized gains or losses over the period — is added to or subtracted from the net investment result to determine the fund’s net gain or loss for the fiscal period.
Statement of changes in net assets shows how the fund’s net assets were affected by the fund’s net investment gain or loss, by distributions to shareholders, and by changes in the number of the fund’s shares. It lists distributions and their sources (net investment income or realized capital gains) over the current reporting period and the most recent fiscal year-end. The distributions listed here may not match the sources listed in the Statement of operations because the distributions are determined on a tax basis and may be paid in a different period from the one in which they were earned. Dividend sources are estimated at the time of declaration. Actual results may vary. Any non-taxable return of capital cannot be determined until final tax calculations are completed after the end of the fund’s fiscal year.
Financial highlights provide an overview of the fund’s investment results, per-share distributions, expense ratios, net investment income ratios, and portfolio turnover in one summary table, reflecting the five most recent reporting periods. In a semiannual report, the highlights table also includes the current reporting period.
| |
| 16 The Putnam Fund for Growth and Income |
The fund’s portfolio 4/30/14 (Unaudited)
| | |
| COMMON STOCKS (97.7%)* | Shares | Value |
|
| Aerospace and defense (5.9%) | | |
| Airbus Group NV (France) | 590,366 | $40,650,044 |
|
| Embraer SA ADR (Brazil) S | 403,000 | 13,863,200 |
|
| General Dynamics Corp. | 401,500 | 43,944,175 |
|
| Honeywell International, Inc. | 670,300 | 62,270,870 |
|
| L-3 Communications Holdings, Inc. | 259,500 | 29,938,515 |
|
| Northrop Grumman Corp. | 460,800 | 55,991,808 |
|
| Raytheon Co. | 330,800 | 31,584,784 |
|
| Rockwell Collins, Inc. | 104,200 | 8,091,130 |
|
| United Technologies Corp. | 362,800 | 42,930,124 |
|
| | 329,264,650 |
| Airlines (1.5%) | | |
| American Airlines Group, Inc. † | 536,000 | 18,797,520 |
|
| Delta Air Lines, Inc. | 1,347,800 | 49,639,474 |
|
| Japan Airlines Co., Ltd. (Japan) UR | 291,000 | 15,057,022 |
|
| | 83,494,016 |
| Auto components (0.6%) | | |
| Dana Holding Corp. | 374,500 | 7,928,165 |
|
| Johnson Controls, Inc. | 266,600 | 12,034,324 |
|
| TRW Automotive Holdings Corp. † | 134,200 | 10,782,970 |
|
| | 30,745,459 |
| Automobiles (0.9%) | | |
| Ford Motor Co. S | 713,800 | 11,527,870 |
|
| General Motors Co. | 1,123,900 | 38,752,072 |
|
| | 50,279,942 |
| Banks (8.8%) | | |
| Bank of America Corp. | 5,033,394 | 76,205,585 |
|
| Citigroup, Inc. | 2,337,180 | 111,974,294 |
|
| Commerzbank AG (Germany) † | 278,672 | 4,960,611 |
|
| Fifth Third Bancorp | 544,200 | 11,215,962 |
|
| JPMorgan Chase & Co. | 2,777,846 | 155,503,819 |
|
| UniCredit SpA (Italy) | 1,138,142 | 10,207,068 |
|
| Wells Fargo & Co. | 2,381,979 | 118,241,438 |
|
| | 488,308,777 |
| Beverages (1.1%) | | |
| Coca-Cola Enterprises, Inc. | 235,600 | 10,705,664 |
|
| Dr. Pepper Snapple Group, Inc. | 263,200 | 14,586,544 |
|
| PepsiCo, Inc. | 416,500 | 35,773,185 |
|
| | 61,065,393 |
| Building products (0.2%) | | |
| Allegion PLC (Ireland) | 244,700 | 12,075,945 |
|
| | 12,075,945 |
| Capital markets (4.0%) | | |
| Carlyle Group LP (The) (Partnership shares) | 849,300 | 27,245,544 |
|
| Charles Schwab Corp. (The) | 1,435,000 | 38,099,250 |
|
| Goldman Sachs Group, Inc. (The) | 192,493 | 30,764,231 |
|
| Greenhill & Co., Inc. S | 324,900 | 16,293,735 |
|
| KKR & Co. LP | 1,134,377 | 25,761,702 |
|
| Morgan Stanley | 1,382,100 | 42,748,353 |
|
| State Street Corp. | 591,900 | 38,213,064 |
|
| | | 219,125,879 |
| |
| The Putnam Fund for Growth and Income 17 |
| | |
| COMMON STOCKS (97.7%)* cont. | Shares | Value |
|
| Chemicals (3.0%) | | |
| Agrium, Inc. (Canada) | 232,100 | $22,297,847 |
|
| Axiall Corp. | 197,700 | 9,212,820 |
|
| Dow Chemical Co. (The) | 1,174,500 | 58,607,550 |
|
| Huntsman Corp. | 683,400 | 17,119,170 |
|
| LyondellBasell Industries NV Class A | 320,700 | 29,664,750 |
|
| Potash Corp. of Saskatchewan, Inc. (Canada) S | 557,400 | 20,155,584 |
|
| Symrise AG (Germany) | 163,981 | 8,283,565 |
|
| | 165,341,286 |
| Commercial services and supplies (0.7%) | | |
| ADT Corp. (The) S | 305,421 | 9,235,931 |
|
| Tyco International, Ltd. | 664,142 | 27,163,408 |
|
| | 36,399,339 |
| Communications equipment (1.5%) | | |
| Cisco Systems, Inc. | 2,743,957 | 63,412,846 |
|
| Qualcomm, Inc. | 232,600 | 18,307,946 |
|
| | 81,720,792 |
| Construction and engineering (0.1%) | | |
| KBR, Inc. | 226,900 | 5,756,453 |
|
| | 5,756,453 |
| Consumer finance (0.5%) | | |
| Capital One Financial Corp. | 406,038 | 30,006,208 |
|
| | 30,006,208 |
| Containers and packaging (0.2%) | | |
| MeadWestvaco Corp. | 303,500 | 11,857,745 |
|
| | 11,857,745 |
| Diversified consumer services (0.3%) | | |
| ITT Educational Services, Inc. † S | 538,400 | 14,536,800 |
|
| | 14,536,800 |
| Diversified financial services (0.5%) | | |
| CME Group, Inc. | 407,800 | 28,705,042 |
|
| | 28,705,042 |
| Diversified telecommunication services (0.9%) | | |
| AT&T, Inc. S | 643,800 | 22,983,660 |
|
| Verizon Communications, Inc. | 556,914 | 26,024,591 |
|
| | 49,008,251 |
| Electric utilities (1.4%) | | |
| American Electric Power Co., Inc. | 226,500 | 12,187,965 |
|
| Edison International | 378,000 | 21,379,680 |
|
| FirstEnergy Corp. | 833,200 | 28,120,500 |
|
| NextEra Energy, Inc. | 173,400 | 17,313,990 |
|
| | 79,002,135 |
| Electrical equipment (0.5%) | | |
| Eaton Corp PLC | 299,200 | 21,733,888 |
|
| Schneider Electric SA (France) S | 63,496 | 5,967,616 |
|
| | 27,701,504 |
| Electronic equipment, instruments, and components (0.3%) | | |
| Corning, Inc. | 852,500 | 17,825,775 |
|
| | 17,825,775 |
| Energy equipment and services (2.5%) | | |
| Ezion Holdings, Ltd. (Singapore) | 3,489,600 | 6,336,323 |
|
| Halliburton Co. | 1,033,500 | 65,182,845 |
|
| Oil States International, Inc. † | 149,000 | 14,473,860 |
|
| Petrofac, Ltd. (United Kingdom) | 581,607 | 14,316,223 |
|
| |
| 18 The Putnam Fund for Growth and Income |
| | |
| COMMON STOCKS (97.7%)* cont. | Shares | Value |
|
| Energy equipment and services cont. | | |
| Rowan Cos. PLC Class A † | 287,400 | $8,886,408 |
|
| Schlumberger, Ltd. | 284,339 | 28,874,625 |
|
| | 138,070,284 |
| Food and staples retail (1.4%) | | |
| CVS Caremark Corp. | 1,084,400 | 78,857,568 |
|
| | 78,857,568 |
| Food products (1.8%) | | |
| Hillshire Brands Co. (The) | 438,620 | 15,636,803 |
|
| Kellogg Co. | 407,000 | 27,199,810 |
|
| Kraft Foods Group, Inc. | 257,600 | 14,647,136 |
|
| Mead Johnson Nutrition Co. | 167,400 | 14,774,724 |
|
| Mondelez International, Inc. Class A | 760,900 | 27,126,085 |
|
| | 99,384,558 |
| Health-care equipment and supplies (2.4%) | | |
| Baxter International, Inc. | 805,600 | 58,639,624 |
|
| Covidien PLC | 192,372 | 13,706,505 |
|
| St. Jude Medical, Inc. | 521,600 | 33,105,952 |
|
| Zimmer Holdings, Inc. | 262,400 | 25,400,320 |
|
| | 130,852,401 |
| Health-care providers and services (1.9%) | | |
| Aetna, Inc. | 546,600 | 39,054,570 |
|
| Catamaran Corp. † | 242,500 | 9,154,375 |
|
| Community Health Systems, Inc. † | 288,500 | 10,931,265 |
|
| LifePoint Hospitals, Inc. † | 200,900 | 11,234,328 |
|
| UnitedHealth Group, Inc. | 437,600 | 32,837,504 |
|
| | 103,212,042 |
| Hotels, restaurants, and leisure (0.7%) | | |
| Intrawest Resorts Holdings, Inc. † | 509,699 | 5,779,987 |
|
| Marriott International, Inc. Class A S | 333,800 | 19,337,034 |
|
| Penn National Gaming, Inc. † | 471,236 | 5,258,994 |
|
| Vail Resorts, Inc. | 157,100 | 10,876,033 |
|
| | 41,252,048 |
| Household durables (0.8%) | | |
| PulteGroup, Inc. | 933,600 | 17,168,904 |
|
| Whirlpool Corp. | 180,900 | 27,746,442 |
|
| |
| Household products (0.4%) | | 44,915,346 |
| Procter & Gamble Co. (The) | 238,600 | 19,696,430 |
|
| | 19,696,430 |
| Independent power and renewable electricity producers (1.3%) | | |
| Calpine Corp. † | 1,757,517 | 40,299,865 |
|
| NRG Energy, Inc. | 948,600 | 31,038,192 |
|
| | 71,338,057 |
| Industrial conglomerates (2.5%) | | |
| General Electric Co. | 3,091,420 | 83,128,284 |
|
| Siemens AG (Germany) | 403,382 | 53,179,530 |
|
| | 136,307,814 |
| Insurance (4.9%) | | |
| ACE, Ltd. | 197,000 | 20,157,040 |
|
| Allstate Corp. (The) | 262,200 | 14,932,290 |
|
| American International Group, Inc. | 1,148,225 | 61,005,194 |
|
| Assured Guaranty, Ltd. | 357,580 | 8,549,738 |
|
| Chubb Corp. (The) | 87,275 | 8,036,282 |
|
| |
| The Putnam Fund for Growth and Income 19 |
| | |
| COMMON STOCKS (97.7%)* cont. | Shares | Value |
|
| Insurance cont. | | |
| Everest Re Group, Ltd. | 56,020 | $8,852,841 |
|
| Hartford Financial Services Group, Inc. (The) | 1,412,800 | 50,677,136 |
|
| MetLife, Inc. | 1,242,087 | 65,023,254 |
|
| Prudential Financial, Inc. | 160,100 | 12,916,868 |
|
| Prudential PLC (United Kingdom) | 984,988 | 22,656,216 |
|
| | 272,806,859 |
| Internet and catalog retail (0.1%) | | |
| Bigfoot GmbH (acquired 8/2/13, cost $2,571,898) (Private) | | |
| (Brazil) † ΔΔ F | 117 | 1,746,526 |
|
| Zalando AG (acquired 9/30/13, cost $5,246,296) (Private) | | |
| (Germany) † ΔΔF | 234 | 5,300,187 |
|
| | 7,046,713 |
| Internet software and services (0.5%) | | |
| Google, Inc. Class A † | 11,791 | 6,306,770 |
|
| Google, Inc. Class C † | 11,791 | 6,209,848 |
|
| Yahoo!, Inc. † | 452,000 | 16,249,400 |
|
| | 28,766,018 |
| IT Services (0.7%) | | |
| Computer Sciences Corp. | 307,500 | 18,197,850 |
|
| Fidelity National Information Services, Inc. | 150,500 | 8,041,215 |
|
| Xerox Corp. | 951,900 | 11,508,471 |
|
| | 37,747,536 |
| Machinery (0.8%) | | |
| Caterpillar, Inc. | 181,300 | 19,109,020 |
|
| Joy Global, Inc. S | 328,400 | 19,828,792 |
|
| TriMas Corp. † | 166,031 | 5,953,872 |
|
| | 44,891,684 |
| Media (3.2%) | | |
| CBS Corp. Class B (non-voting shares) | 712,100 | 41,130,896 |
|
| Comcast Corp. Class A | 810,800 | 41,967,008 |
|
| DIRECTV † | 176,600 | 13,704,160 |
|
| DISH Network Corp. Class A † | 376,900 | 21,430,534 |
|
| Liberty Global PLC Ser. C (United Kingdom) † | 865,900 | 33,276,537 |
|
| Time Warner Cable, Inc. | 117,680 | 16,647,013 |
|
| WPP PLC (United Kingdom) | 415,230 | 8,965,230 |
|
| | 177,121,378 |
| Metals and mining (1.1%) | | |
| Barrick Gold Corp. (Canada) | 781,500 | 13,652,805 |
|
| BHP Billiton, Ltd. (Australia) | 424,362 | 14,947,904 |
|
| Freeport-McMoRan Copper & Gold, Inc. (Indonesia) | 851,238 | 29,257,050 |
|
| Goldcorp, Inc. (Toronto Exchange) (Canada) | 168,700 | 4,170,264 |
|
| | 62,028,023 |
| Multi-utilities (1.0%) | | |
| Ameren Corp. | 437,600 | 18,077,256 |
|
| CMS Energy Corp. | 271,100 | 8,217,041 |
|
| National Grid PLC (United Kingdom) | 812,784 | 11,535,413 |
|
| PG&E Corp. | 413,400 | 18,842,772 |
|
| | 56,672,482 |
| Multiline retail (0.6%) | | |
| Macy’s, Inc. | 363,800 | 20,893,034 |
|
| Target Corp. | 175,600 | 10,843,300 |
|
| | | 31,736,334 |
|
| 20 The Putnam Fund for Growth and Income |
| | |
| COMMON STOCKS (97.7%)* cont. | Shares | Value |
|
| Oil, gas, and consumable fuels (12.4%) | | |
| Anadarko Petroleum Corp. | 180,600 | $17,883,012 |
|
| Cabot Oil & Gas Corp. | 841,400 | 33,050,192 |
|
| Cameco Corp. (Canada) | 256,300 | 5,455,480 |
|
| Cheniere Energy, Inc. † | 151,200 | 8,535,240 |
|
| Chevron Corp. | 559,300 | 70,203,336 |
|
| CONSOL Energy, Inc. | 210,400 | 9,364,904 |
|
| EnCana Corp. (Canada) | 435,926 | 10,098,226 |
|
| Energen Corp. | 95,500 | 7,440,405 |
|
| Energy Transfer Equity LP | 391,000 | 18,216,690 |
|
| EP Energy Corp. Class A † S | 847,710 | 16,471,005 |
|
| Exxon Mobil Corp. | 1,242,992 | 127,294,811 |
|
| Gulfport Energy Corp. † | 334,400 | 24,635,248 |
|
| Kodiak Oil & Gas Corp. † | 2,036,600 | 25,885,186 |
|
| Marathon Oil Corp. | 1,496,000 | 54,080,400 |
|
| MPLX LP (Partnership shares) | 190,100 | 10,290,113 |
|
| Nordic American Tankers, Ltd. (Norway) S | 870,800 | 7,515,004 |
|
| Occidental Petroleum Corp. | 351,914 | 33,695,766 |
|
| QEP Resources, Inc. | 1,194,200 | 36,649,998 |
|
| Royal Dutch Shell PLC ADR (United Kingdom) | 1,559,528 | 122,797,235 |
|
| Southwestern Energy Co. † | 318,100 | 15,230,628 |
|
| Suncor Energy, Inc. (Canada) | 874,182 | 33,721,468 |
|
| | 688,514,347 |
| Paper and forest products (0.5%) | | |
| International Paper Co. | 544,000 | 25,377,600 |
|
| | 25,377,600 |
| Personal products (0.5%) | | |
| Coty, Inc. Class A | 1,689,145 | 27,110,777 |
|
| | 27,110,777 |
| Pharmaceuticals (10.3%) | | |
| AbbVie, Inc. | 504,900 | 26,295,186 |
|
| Actavis PLC † | 182,600 | 37,310,658 |
|
| AstraZeneca PLC ADR (United Kingdom) S | 964,300 | 76,227,915 |
|
| Bristol-Myers Squibb Co. | 425,000 | 21,288,250 |
|
| Eli Lilly & Co. | 752,300 | 44,460,930 |
|
| Johnson & Johnson | 763,600 | 77,345,044 |
|
| Merck & Co., Inc. | 1,560,991 | 91,411,633 |
|
| Pfizer, Inc. | 2,902,434 | 90,788,136 |
|
| Sanofi ADR (France) S | 563,400 | 30,310,920 |
|
| Shire PLC ADR (United Kingdom) S | 130,700 | 22,447,725 |
|
| Teva Pharmaceutical Industries, Ltd. ADR (Israel) | 620,300 | 30,307,858 |
|
| Zoetis, Inc. | 813,938 | 24,629,764 |
|
| | 572,824,019 |
| Professional services (0.2%) | | |
| Nielsen Holdings NV | 251,500 | 11,807,925 |
|
| | 11,807,925 |
| Real estate investment trusts (REITs) (0.9%) | | |
| Altisource Residential Corp. (Virgin Islands) | 492,434 | 13,847,244 |
|
| American Tower Corp. | 242,900 | 20,287,008 |
|
| Equity Lifestyle Properties, Inc. | 374,600 | 15,684,502 |
|
| | | 49,818,754 |
| |
| The Putnam Fund for Growth and Income 21 |
| | |
| COMMON STOCKS (97.7%)* cont. | Shares | Value |
|
| Semiconductors and semiconductor equipment (2.3%) | | |
| Avago Technologies, Ltd. | 173,800 | $11,036,300 |
|
| Fairchild Semiconductor International, Inc. † | 768,400 | 9,781,732 |
|
| Intel Corp. | 909,500 | 24,274,555 |
|
| Lam Research Corp. † | 400,950 | 23,098,730 |
|
| Micron Technology, Inc. † | 1,474,900 | 38,524,388 |
|
| Samsung Electronics Co., Ltd. (South Korea) | 15,636 | 20,379,457 |
|
| | 127,095,162 |
| Software (1.5%) | | |
| Microsoft Corp. | 877,200 | 35,438,880 |
|
| Oracle Corp. | 1,210,800 | 49,497,504 |
|
| | 84,936,384 |
| Specialty retail (2.4%) | | |
| American Eagle Outfitters, Inc. S | 712,300 | 8,234,188 |
|
| Bed Bath & Beyond, Inc. † | 410,900 | 25,529,217 |
|
| Gap, Inc. (The) | 343,900 | 13,515,270 |
|
| GNC Holdings, Inc. Class A | 236,700 | 10,651,500 |
|
| Home Depot, Inc. (The) | 339,500 | 26,993,645 |
|
| Office Depot, Inc. † | 5,641,900 | 23,075,371 |
|
| Select Comfort Corp. † | 258,900 | 4,763,760 |
|
| Tile Shop Holdings, Inc. † S | 774,700 | 10,919,397 |
|
| WH Smith PLC (United Kingdom) | 407,520 | 7,552,290 |
|
| | 131,234,638 |
| Technology hardware, storage, and peripherals (2.3%) | | |
| Apple, Inc. | 114,700 | 67,683,323 |
|
| Hewlett-Packard Co. | 783,300 | 25,895,898 |
|
| NetApp, Inc. | 245,700 | 8,749,377 |
|
| SanDisk Corp. | 127,900 | 10,867,663 |
|
| Western Digital Corp. | 149,700 | 13,193,061 |
|
| | 126,389,322 |
| Thrifts and mortgage finance (0.3%) | | |
| Radian Group, Inc. S | 1,223,900 | 17,110,122 |
|
| |
| Tobacco (1.6%) | | 17,110,122 |
| Altria Group, Inc. | 1,175,700 | 47,157,327 |
|
| Philip Morris International, Inc. | 504,800 | 43,125,064 |
|
| | 90,282,391 |
| Trading companies and distributors (0.3%) | | |
| WESCO International, Inc. † | 217,200 | 19,065,816 |
|
| | 19,065,816 |
| Wireless telecommunication services (0.7%) | | |
| Vodafone Group PLC ADR (United Kingdom) | 1,021,722 | 38,784,567 |
|
| | | 38,784,567 |
| | | |
| Total common stocks (cost $4,345,471,368) | | $5,415,276,790 |
|
| 22 The Putnam Fund for Growth and Income |
| | |
| SHORT-TERM INVESTMENTS (5.5%)* | Principal amount/shares | Value |
|
| Putnam Cash Collateral Pool, LLC 0.18% d | 177,548,925 | $177,548,925 |
|
| Putnam Short Term Investment Fund 0.06% L | 127,331,716 | 127,331,716 |
|
| U.S. Treasury Bills with an effective yield of 0.13%, May 29, 2014 | $1,141,000 | 1,140,886 |
|
| U.S. Treasury Bills with an effective yield of 0.12%, | | |
| February 5, 2015 Δ | 315,000 | 314,829 |
|
| U.S. Treasury Bills with an effective yield of 0.10%, | | |
| January 8, 2015 Δ | 696,000 | 695,744 |
|
| Total short-term investments (cost $307,031,735) | | $307,032,100 |
| |
| |
| TOTAL INVESTMENTS | | |
|
| Total investments (cost $4,652,503,103) | | $5,722,308,890 |
Key to holding’s abbreviations
| |
| ADR | American Depository Receipts: represents ownership of foreign securities on deposit with a custodian bank |
Notes to the fund’s portfolio
Unless noted otherwise, the notes to the fund’s portfolio are for the close of the fund’s reporting period, which ran from November 1, 2013 through April 30, 2014 (the reporting period). Within the following notes to the portfolio, references to “ASC 820” represent Accounting Standards Codification 820 Fair Value Measurements and Disclosures and references to “OTC”, if any, represent over-the-counter.
* Percentages indicated are based on net assets of $5,541,641,490.
† Non-income-producing security.
ΔΔ Security is restricted with regard to public resale. The total fair value of this security and any other restricted securities (excluding 144A securities), if any, held at the close of the reporting period was $7,046,713, or 0.1% of net assets.
Δ This security, in part or in entirety, was pledged and segregated with the custodian for collateral on certain derivative contracts at the close of the reporting period.
d Affiliated company. See Note 1 to the financial statements regarding securities lending. The rate quoted in the security description is the annualized 7-day yield of the fund at the close of the reporting period.
F Security is valued at fair value following procedures approved by the Trustees. Securities may be classified as Level 2 or Level 3 for ASC 820 based on the securities’ valuation inputs. At the close of the reporting period, fair value pricing was also used for certain foreign securities in the portfolio (Note 1).
L Affiliated company (Note 5). The rate quoted in the security description is the annualized 7-day yield of the fund at the close of the reporting period.
S Security on loan, in part or in entirety, at the close of the reporting period (Note 1).
UR At the reporting period end, 74,100 shares owned by the fund were not formally entered on the company’s shareholder register, due to local restrictions and foreign ownership. While the fund has full title to these unregistered shares, these shares do not carry voting rights.
At the close of the reporting period, the fund maintained liquid assets totaling $177,352 to cover certain derivatives contracts.
|
| The Putnam Fund for Growth and Income 23 |
| | | | | | | |
| OTC TOTAL RETURN SWAP CONTRACTS OUTSTANDING at 4/30/14 (Unaudited) | |
| | | Upfront | | | Payments | Total return | |
| Swap counterparty/ | premium | Termination | | received (paid) by | received by | Unrealized |
| Notional amount | received (paid) | date | | fund per annum | or paid by fund | depreciation |
|
| Bank of America N.A. | | | | | | |
| shares | 67,134 | $— | 5/6/14 | | (3 month USD- | BofA MLTR GOLD | $(88,309) |
| | | | | | LIBOR-BBA plus | Index | |
| | | | | | 0.48%) | | |
|
| shares | 59,546 | — | 5/6/14 | | (3 month USD- | BofA MLTR GOLD | (78,328) |
| | | | | | LIBOR-BBA plus | Index | |
| | | | | | 0.48%) | | |
|
| Total | | $— | | | | | $(166,637) |
ASC 820 establishes a three-level hierarchy for disclosure of fair value measurements. The valuation hierarchy is based upon the transparency of inputs to the valuation of the fund’s investments. The three levels are defined as follows:
Level 1: Valuations based on quoted prices for identical securities in active markets.
Level 2: Valuations based on quoted prices in markets that are not active or for which all significant inputs are observable, either directly or indirectly.
Level 3: Valuations based on inputs that are unobservable and significant to the fair value measurement.
The following is a summary of the inputs used to value the fund’s net assets as of the close of the reporting period:
| | | |
| | | Valuation inputs |
|
| Investments in securities: | Level 1 | Level 2 | Level 3 |
|
| Common stocks*: | | | |
|
| Consumer discretionary | $505,304,425 | $16,517,520 | $7,046,713 |
|
| Consumer staples | 376,397,117 | — | — |
|
| Energy | 805,932,085 | 20,652,546 | — |
|
| Financials | 1,068,057,746 | 37,823,895 | — |
|
| Health care | 806,888,462 | — | — |
|
| Industrials | 591,910,934 | 114,854,212 | — |
|
| Information technology | 484,101,532 | 20,379,457 | — |
|
| Materials | 241,373,185 | 23,231,469 | — |
|
| Telecommunication services | 87,792,818 | — | — |
|
| Utilities | 195,477,261 | 11,535,413 | — |
|
| Total common stocks | 5,163,235,565 | 244,994,512 | 7,046,713 |
| | | | |
| Short-term investments | 127,331,716 | 179,700,384 | — |
|
| Totals by level | $5,290,567,281 | $424,694,896 | $7,046,713 |
| | | |
| | | Valuation inputs |
|
| Other financial instruments: | Level 1 | Level 2 | Level 3 |
|
| Total return swap contracts | $— | $(166,637) | $— |
|
| Totals by level | $— | $(166,637) | $— |
* Common stock classifications are presented at the sector level, which may differ from the fund’s portfolio presentation.
At the start and close of the reporting period, Level 3 investments in securities were not considered a significant portion of the fund’s portfolio.
The accompanying notes are an integral part of these financial statements.
|
| 24 The Putnam Fund for Growth and Income |
Statement of assets and liabilities 4/30/14 (Unaudited)
| |
| ASSETS | |
|
| Investment in securities, at value, including $176,083,659 of securities on loan (Note 1): | |
| Unaffiliated issuers (identified cost $4,347,622,462) | $5,417,428,249 |
| Affiliated issuers (identified cost $304,880,641) (Notes 1 and 5) | 304,880,641 |
|
| Dividends, interest and other receivables | 5,785,706 |
|
| Receivable for shares of the fund sold | 1,256,056 |
|
| Prepaid assets | 57,974 |
|
| Total assets | 5,729,408,626 |
| |
| LIABILITIES | |
|
| Payable for shares of the fund repurchased | 2,723,237 |
|
| Payable for compensation of Manager (Note 2) | 2,127,565 |
|
| Payable for custodian fees (Note 2) | 30,458 |
|
| Payable for investor servicing fees (Note 2) | 862,299 |
|
| Payable for Trustee compensation and expenses (Note 2) | 2,137,700 |
|
| Payable for administrative services (Note 2) | 17,440 |
|
| Payable for distribution fees (Note 2) | 1,220,295 |
|
| Unrealized depreciation on OTC swap contracts (Note 1) | 166,637 |
|
| Collateral on securities loaned, at value (Note 1) | 177,548,925 |
|
| Other accrued expenses | 932,580 |
|
| Total liabilities | 187,767,136 |
| | |
| Net assets | $5,541,641,490 |
|
| |
| REPRESENTED BY | |
|
| Paid-in capital (Unlimited shares authorized) (Notes 1 and 4) | $5,338,262,810 |
|
| Undistributed net investment income (Note 1) | 22,105,692 |
|
| Accumulated net realized loss on investments and foreign currency transactions (Note 1) | (888,376,212) |
|
| Net unrealized appreciation of investments and assets and liabilities in foreign currencies | 1,069,649,200 |
|
| Total — Representing net assets applicable to capital shares outstanding | $5,541,641,490 |
| (Continued on next page) | |
|
| The Putnam Fund for Growth and Income 25 |
Statement of assets and liabilities (Continued)
| |
| COMPUTATION OF NET ASSET VALUE AND OFFERING PRICE | |
|
| Net asset value and redemption price per class A share | |
| ($5,282,714,938 divided by 257,337,777 shares) | $20.53 |
|
| Offering price per class A share (100/94.25 of $20.53)* | $21.78 |
|
| Net asset value and offering price per class B share ($92,963,164 divided by 4,612,197 shares)** | $20.16 |
|
| Net asset value and offering price per class C share ($54,549,555 divided by 2,669,696 shares)** | $20.43 |
|
| Net asset value and redemption price per class M share ($37,748,259 divided by 1,854,575 shares) | $20.35 |
|
| Offering price per class M share (100/96.50 of $20.35)* | $21.09 |
|
| Net asset value, offering price and redemption price per class R share | |
| ($3,707,056 divided by 181,536 shares) | $20.42 |
|
| Net asset value, offering price and redemption price per class R5 share | |
| ($15,557 divided by 755 shares)† | $20.60 |
|
| Net asset value, offering price and redemption price per class R6 share | |
| ($19,185,706 divided by 931,855 shares) | $20.59 |
|
| Net asset value, offering price and redemption price per class Y share | |
| ($50,757,255 divided by 2,466,771 shares) | $20.58 |
|
* On single retail sales of less than $50,000. On sales of $50,000 or more the offering price is reduced.
** Redemption price per share is equal to net asset value less any applicable contingent deferred sales charge.
† Net asset value may not recalculate due to rounding of fractional shares.
The accompanying notes are an integral part of these financial statements.
|
| 26 The Putnam Fund for Growth and Income |
Statement of operations Six months ended 4/30/14 (Unaudited)
| |
| INVESTMENT INCOME | |
|
| Dividends (net of foreign tax of $595,063) | $77,898,275 |
|
| Interest (including interest income of $53,550 from investments in affiliated issuers) (Note 5) | 54,826 |
|
| Securities lending (Note 1) | 722,105 |
|
| Total investment income | 78,675,206 |
| |
| EXPENSES | |
|
| Compensation of Manager (Note 2) | 12,719,882 |
|
| Investor servicing fees (Note 2) | 5,850,294 |
|
| Custodian fees (Note 2) | 40,558 |
|
| Trustee compensation and expenses (Note 2) | 194,951 |
|
| Distribution fees (Note 2) | 7,275,297 |
|
| Administrative services (Note 2) | 82,950 |
|
| Other | 1,037,720 |
|
| Total expenses | 27,201,652 |
| | |
| Expense reduction (Note 2) | (148,392) |
|
| Net expenses | 27,053,260 |
| | |
| Net investment income | 51,621,946 |
|
| |
| Net realized gain on investments (Notes 1 and 3) | 261,206,463 |
|
| Net realized gain on swap contracts (Note 1) | 864,732 |
|
| Net realized loss on foreign currency transactions (Note 1) | (47,461) |
|
| Net unrealized appreciation of assets and liabilities in foreign currencies during the period | 10,249 |
|
| Net unrealized appreciation of investments and swap contracts during the period | 176,675,318 |
|
| Net gain on investments | 438,709,301 |
| | |
| Net increase in net assets resulting from operations | $490,331,247 |
|
The accompanying notes are an integral part of these financial statements.
| |
| The Putnam Fund for Growth and Income 27 |
Statement of changes in net assets
| | |
| INCREASE IN NET ASSETS | Six months ended 4/30/14* | Year ended 10/31/13 |
|
| Operations: | | |
| Net investment income | $51,621,946 | $63,713,107 |
|
| Net realized gain on investments | | |
| and foreign currency transactions | 262,023,734 | 717,592,387 |
|
| Net unrealized appreciation of investments and assets | | |
| and liabilities in foreign currencies | 176,685,567 | 557,094,370 |
|
| Net increase in net assets resulting from operations | 490,331,247 | 1,338,399,864 |
|
| Distributions to shareholders (Note 1): | | |
| From ordinary income | | |
| Net investment income | | |
|
| Class A | (32,485,938) | (65,083,848) |
|
| Class B | (247,478) | (643,626) |
|
| Class C | (140,223) | (286,353) |
|
| Class M | (145,111) | (311,377) |
|
| Class R | (19,070) | (40,373) |
|
| Class R5 | (117) | (217) |
|
| Class R6 | (155,348) | (132,226) |
|
| Class Y | (356,137) | (786,661) |
|
| Decrease from capital share transactions (Note 4) | (186,229,903) | (442,555,982) |
|
| Total increase in net assets | 270,551,922 | 828,559,201 |
| |
| NET ASSETS | | |
|
| Beginning of period | 5,271,089,568 | 4,442,530,367 |
|
| End of period (including undistributed net investment | | |
| income of $22,105,692 and $4,033,168, respectively) | $5,541,641,490 | $5,271,089,568 |
|
* Unaudited.
The accompanying notes are an integral part of these financial statements.
|
| 28 The Putnam Fund for Growth and Income |
|
| This page left blank intentionally. |
|
| The Putnam Fund for Growth and Income 29 |
Financial highlights (For a common share outstanding throughout the period)
| | | | | | | | | | | | | | | |
| INVESTMENT OPERATIONS: | | LESS DISTRIBUTIONS: | RATIOS AND SUPPLEMENTAL DATA: |
|
| | | | | | | | | | | | | | | Ratio | |
| | Net asset | | Net realized | | | | | | | | | | Ratio | of net investment | |
| | value, | | and unrealized | Total from | From | | | | | | Total return | Net assets, | of expenses | income (loss) | |
| | beginning | Net investment | gain (loss) | investment | net investment | From | Total | Redemption | Non-recurring | Net asset value, | at net asset | end of period | to average | to average | Portfolio |
| Period ended | of period | income (loss) a | on investments | operations | income | return of capital | distributions | fees | reimbursements | end of period | value (%) b | (in thousands) | net assets (%) c | net assets (%) | turnover (%) |
|
| Class A | | | | | | | | | | | | | | | |
| April 30, 2014** | $18.87 | .19 d | 1.59 | 1.78 | (.12) | — | (.12) | — | — | $20.53 | 9.49* | $5,282,715 | .49* | .96*d | 19* |
| October 31, 2013 | 14.51 | .22 | 4.37 | 4.59 | (.23) | — | (.23) | — | — | 18.87 | 31.93 | 5,024,361 | 1.04 | 1.33 | 52 |
| October 31, 2012 | 12.79 | .21 | 1.73 | 1.94 | (.22) | — | (.22) | — | — | 14.51 | 15.33 | 4,232,973 | 1.10 | 1.57 | 34 |
| October 31, 2011 | 12.56 | .16 | .21 | .37 | (.15) | — | (.15) | — | .01 e | 12.79 | 2.99 | 4,176,494 | 1.10 | 1.17 | 45 |
| October 31, 2010 | 11.15 | .12 | 1.40 | 1.52 | (.11) | — | (.11) | — f | — | 12.56 | 13.65 | 4,607,805 | 1.16 | .99 | 48 |
| October 31, 2009 | 10.09 | .15 | 1.11 g,h | 1.26 | (.20) | — f | (.20) | — f | — f,i | 11.15 | 12.99 g,h | 4,631,517 | 1.21 j | 1.52 j | 57 |
|
| Class B | | | | | | | | | | | | | | | |
| April 30, 2014** | $18.52 | .11 d | 1.58 | 1.69 | (.05) | — | (.05) | — | — | $20.16 | 9.14* | $92,963 | .86* | .59*d | 19* |
| October 31, 2013 | 14.25 | .10 | 4.28 | 4.38 | (.11) | — | (.11) | — | — | 18.52 | 30.89 | 95,272 | 1.79 | .60 | 52 |
| October 31, 2012 | 12.56 | .11 | 1.70 | 1.81 | (.12) | — | (.12) | — | — | 14.25 | 14.50 | 91,289 | 1.85 | .84 | 34 |
| October 31, 2011 | 12.34 | .06 | .19 | .25 | (.04) | — | (.04) | — | .01 e | 12.56 | 2.14 | 108,621 | 1.85 | .41 | 45 |
| October 31, 2010 | 10.95 | .03 | 1.38 | 1.41 | (.02) | — | (.02) | — f | — | 12.34 | 12.85 | 159,231 | 1.91 | .27 | 48 |
| October 31, 2009 | 9.91 | .08 | 1.09 g,h | 1.17 | (.13) | — f | (.13) | — f | — f,i | 10.95 | 12.11 g,h | 226,198 | 1.96 j | .85 j | 57 |
|
| Class C | | | | | | | | | | | | | | | |
| April 30, 2014** | $18.78 | .12 d | 1.58 | 1.70 | (.05) | — | (.05) | — | — | $20.43 | 9.09* | $54,550 | .86* | .59*d | 19* |
| October 31, 2013 | 14.45 | .09 | 4.35 | 4.44 | (.11) | — | (.11) | — | — | 18.78 | 30.91 | 48,304 | 1.79 | .56 | 52 |
| October 31, 2012 | 12.74 | .11 | 1.72 | 1.83 | (.12) | — | (.12) | — | — | 14.45 | 14.46 | 36,561 | 1.85 | .82 | 34 |
| October 31, 2011 | 12.51 | .06 | .21 | .27 | (.05) | — | (.05) | — | .01 e | 12.74 | 2.21 | 36,035 | 1.85 | .42 | 45 |
| October 31, 2010 | 11.10 | .03 | 1.40 | 1.43 | (.02) | — | (.02) | — f | — | 12.51 | 12.88 | 37,264 | 1.91 | .24 | 48 |
| October 31, 2009 | 10.05 | .07 | 1.11 g,h | 1.18 | (.13) | — f | (.13) | — f | — f,i | 11.10 | 12.07 g,h | 37,309 | 1.96 j | .76 j | 57 |
|
| Class M | | | | | | | | | | | | | | | |
| April 30, 2014** | $18.71 | .14 d | 1.58 | 1.72 | (.08) | — | (.08) | — | — | $20.35 | 9.20* | $37,748 | .74* | .72*d | 19* |
| October 31, 2013 | 14.39 | .14 | 4.33 | 4.47 | (.15) | — | (.15) | — | — | 18.71 | 31.29 | 36,125 | 1.54 | .83 | 52 |
| October 31, 2012 | 12.69 | .15 | 1.70 | 1.85 | (.15) | — | (.15) | — | — | 14.39 | 14.72 | 30,627 | 1.60 | 1.08 | 34 |
| October 31, 2011 | 12.46 | .09 | .21 | .30 | (.08) | — | (.08) | — | .01 e | 12.69 | 2.48 | 33,357 | 1.60 | .67 | 45 |
| October 31, 2010 | 11.06 | .06 | 1.39 | 1.45 | (.05) | — | (.05) | — f | — | 12.46 | 13.09 | 38,209 | 1.66 | .49 | 48 |
| October 31, 2009 | 10.01 | .10 | 1.10 g,h | 1.20 | (.15) | — f | (.15) | — f | — f,i | 11.06 | 12.40 g,h | 39,681 | 1.71 j | 1.00 j | 57 |
|
| Class R | | | | | | | | | | | | | | | |
| April 30, 2014** | $18.77 | .16 d | 1.59 | 1.75 | (.10) | — | (.10) | — | — | $20.42 | 9.34* | $3,707 | .62* | .82*d | 19* |
| October 31, 2013 | 14.43 | .18 | 4.35 | 4.53 | (.19) | — | (.19) | — | — | 18.77 | 31.63 | 4,082 | 1.29 | 1.09 | 52 |
| October 31, 2012 | 12.72 | .18 | 1.72 | 1.90 | (.19) | — | (.19) | — | — | 14.43 | 15.06 | 3,446 | 1.35 | 1.31 | 34 |
| October 31, 2011 | 12.50 | .12 | .20 | .32 | (.11) | — | (.11) | — | .01 e | 12.72 | 2.65 | 3,151 | 1.35 | .92 | 45 |
| October 31, 2010 | 11.09 | .09 | 1.40 | 1.49 | (.08) | — | (.08) | — f | — | 12.50 | 13.45 | 3,554 | 1.41 | .74 | 48 |
| October 31, 2009 | 10.04 | .12 | 1.11 g,h | 1.23 | (.18) | — f | (.18) | — f | — f,i | 11.09 | 12.69 g,h | 3,579 | 1.46 j | 1.21 j | 57 |
|
| Class R5 | | | | | | | | | | | | | | | |
| April 30, 2014** | $18.93 | .22 d | 1.61 | 1.83 | (.16) | — | (.16) | — | — | $20.60 | 9.70* | $16 | .33* | 1.12*d | 19* |
| October 31, 2013 | 14.54 | .29 | 4.39 | 4.68 | (.29) | — | (.29) | — | — | 18.93 | 32.55 | 14 | .67 | 1.68 | 52 |
| October 31, 2012† | 13.64 | .08 | .88 | .96 | (.06) | — | (.06) | — | — | 14.54 | 7.01* | 11 | .22* | .53* | 34 |
|
| Class R6 | | | | | | | | | | | | | | | |
| April 30, 2014** | $18.92 | .23 d | 1.61 | 1.84 | (.17) | — | (.17) | — | — | $20.59 | 9.75* | $19,186 | .28* | 1.17*d | 19* |
| October 31, 2013 | 14.54 | .27 | 4.42 | 4.69 | (.31) | — | (.31) | — | — | 18.92 | 32.62 | 18,293 | .57 | 1.49 | 52 |
| October 31, 2012† | 13.64 | .08 | .88 | .96 | (.06) | — | (.06) | — | — | 14.54 | 7.02* | 11 | .19* | .57* | 34 |
|
See notes to financial highlights at the end of this section.
The accompanying notes are an integral part of these financial statements.
| | |
| 30 The Putnam Fund for Growth and Income | The Putnam Fund for Growth and Income 31 |
Financial highlights (Continued)
| | | | | | | | | | | | | | | |
| INVESTMENT OPERATIONS: | | LESS DISTRIBUTIONS: | | RATIOS AND SUPPLEMENTAL DATA: |
|
| | | | | | | | | | | | | | | Ratio | |
| | Net asset | | Net realized | | | | | | | | | | Ratio | of net investment | |
| | value, | | and unrealized | Total from | From | | | | | | Total return | Net assets, | of expenses | income (loss) | |
| | beginning | Net investment | gain (loss) | investment | net investment | From | Total | Redemption | Non-recurring | Net asset value, | at net asset | end of period | to average | to average | Portfolio |
| Period ended | of period | income (loss) a | on investments | operations | income | return of capital | distributions | fees | reimbursements | end of period | value (%) b | (in thousands) | net assets (%) c | net assets (%) | turnover (%) |
|
| Class Y | | | | | | | | | | | | | | | |
| April 30, 2014** | $18.91 | .22 d | 1.60 | 1.82 | (.15) | — | (.15) | — | — | $20.58 | 9.67* | $50,757 | .37* | 1.09*d | 19* |
| October 31, 2013 | 14.54 | .27 | 4.37 | 4.64 | (.27) | — | (.27) | — | — | 18.91 | 32.26 | 44,639 | .79 | 1.63 | 52 |
| October 31, 2012 | 12.82 | .25 | 1.72 | 1.97 | (.25) | — | (.25) | — | — | 14.54 | 15.59 | 47,613 | .85 | 1.82 | 34 |
| October 31, 2011 | 12.59 | .20 | .20 | .40 | (.18) | — | (.18) | — | .01 e | 12.82 | 3.26 | 44,370 | .85 | 1.45 | 45 |
| October 31, 2010 | 11.17 | .15 | 1.41 | 1.56 | (.14) | — | (.14) | — f | — | 12.59 | 13.99 | 74,376 | .91 | 1.24 | 48 |
| October 31, 2009 | 10.12 | .20 | 1.08 g,h | 1.28 | (.23) | — f | (.23) | — f | — f,i | 11.17 | 13.15 g,h | 79,716 | .96 j | 2.37 j | 57 |
|
* Not annualized.
** Unaudited.
† For the period July 3, 2012 (commencement of operations) to October 31, 2012.
a Per share net investment income (loss) has been determined on the basis of the weighted average number of shares outstanding during the period.
b Total return assumes dividend reinvestment and does not reflect the effect of sales charges.
c Includes amounts paid through expense offset and brokerage/service arrangements (Note 2). Also excludes acquired fund fees, if any.
d Reflects a dividend received by the fund from a single issuer which amounted to the following amounts:
| | |
| | | Percentage of |
| | Per share | average net assets |
|
| Class A | $0.07 | 0.36% |
|
| Class B | 0.07 | 0.36 |
|
| Class C | 0.07 | 0.36 |
|
| Class M | 0.07 | 0.36 |
|
| Class R | 0.07 | 0.34 |
|
| Class R5 | 0.07 | 0.36 |
|
| Class R6 | 0.07 | 0.36 |
|
| Class Y | 0.07 | 0.36 |
|
e Reflects a non-recurring reimbursement related to restitution amounts in connection with a distribution plan approved by the Securities and Exchange Commission (the SEC) which amounted to $0.01 per share outstanding on July 21, 2011. Also reflects a non-recurring reimbursement related to short-term trading related lawsuits, which amounted to less than $0.01 per share outstanding on May 11, 2011.
f Amount represents less than $0.01 per share.
g Reflects a non-recurring litigation payment received by the fund from Enron Corporation which amounted to $0.05 per share outstanding on December 29, 2008. This payment resulted in an increase to total returns of 0.51% for the year ended October 31, 2009.
h Reflects a non-recurring litigation payment received by the fund from Tyco International, Ltd. which amounted to $0.07 per share outstanding on March 13, 2009. This payment resulted in an increase to total returns of 0.71% for the year ended October 31, 2009.
i Reflects a non-recurring reimbursement pursuant to a settlement between the SEC and Bear Stearns & Co., Inc. and Bear Stearns Securities Corp., which amounted to less than $0.01 per share outstanding as of May 21, 2009.
j Reflects an involuntary contractual expense limitation in effect during the period. As a result of such limitation the expenses of each class reflect a reduction of 0.02% of average net assets as of October 31, 2009.
| |
| The accompanying notes are an integral part of these financial statements. | The accompanying notes are an integral part of these financial statements. |
| | |
| 32 The Putnam Fund for Growth and Income | The Putnam Fund for Growth and Income 33 |
Notes to financial statements 4/30/14 (Unaudited)
Within the following Notes to financial statements, references to “State Street” represent State Street Bank and Trust Company, references to “the SEC” represent the Securities and Exchange Commission, references to “Putnam Management” represent Putnam Investment Management, LLC, the fund’s manager, an indirect wholly-owned subsidiary of Putnam Investments, LLC and references to “OTC”, if any, represent over-the-counter. Unless otherwise noted, the “reporting period” represents the period from November 1, 2013 through April 30, 2014.
The Putnam Fund for Growth and Income (the fund) is a Massachusetts business trust, which is registered under the Investment Company Act of 1940, as amended, as a diversified open-end management investment company. The investment objective of the fund is to seek capital growth and current income by investing mainly in common stocks of large U.S. companies, with a focus on value stocks that offer the potential for capital growth, current income, or both. Value stocks are issued by companies that Putnam Management believes are currently undervalued by the market.
The fund offers class A, class B, class C, class M, class R, class R5, class R6 and class Y shares. Class A and class M shares are sold with a maximum front-end sales charge of 5.75% and 3.50%, respectively, and generally do not pay a contingent deferred sales charge. Class B shares, which convert to class A shares after approximately eight years, do not pay a front-end sales charge and are subject to a contingent deferred sales charge if those shares are redeemed within six years of purchase. Class C shares have a one-year 1.00% contingent deferred sales charge and do not convert to class A shares. Class R shares, which are not available to all investors, are sold at net asset value. The expenses for class A, class B, class C, class M and class R shares may differ based on the distribution fee of each class, which is identified in Note 2. Class R5, class R6 and class Y shares, which are sold at net asset value, are generally subject to the same expenses as class A, class B, class C, class M and class R shares, but do not bear a distribution fee and in the case of class R5 and class R6 shares, bear a lower investor servicing fee, which is identified in Note 2. Class R5, class R6 and class Y shares are not available to all investors.
In the normal course of business, the fund enters into contracts that may include agreements to indemnify another party under given circumstances. The fund’s maximum exposure under these arrangements is unknown as this would involve future claims that may be, but have not yet been, made against the fund. However, the fund’s management team expects the risk of material loss to be remote.
Note 1: Significant accounting policies
The following is a summary of significant accounting policies consistently followed by the fund in the preparation of its financial statements. The preparation of financial statements is in conformity with accounting principles generally accepted in the United States of America and requires management to make estimates and assumptions that affect the reported amounts of assets and liabilities in the financial statements and the reported amounts of increases and decreases in net assets from operations. Actual results could differ from those estimates. Subsequent events after the Statement of assets and liabilities date through the date that the financial statements were issued have been evaluated in the preparation of the financial statements.
Investment income, realized and unrealized gains and losses and expenses of the fund are borne pro-rata based on the relative net assets of each class to the total net assets of the fund, except that each class bears expenses unique to that class (including the distribution fees applicable to such classes). Each class votes as a class only with respect to its own distribution plan or other matters on which a class vote is required by law or determined by the Trustees. If the fund were liquidated, shares of each class would receive their pro-rata share of the net assets of the fund. In addition, the Trustees declare separate dividends on each class of shares.
Security valuation Investments for which market quotations are readily available are valued at the last reported sales price on their principal exchange, or official closing price for certain markets, and are classified as Level 1 securities under Accounting Standards Codification 820 Fair Value Measurements and Disclosures (ASC 820). If no sales are reported, as in the case of some securities that are traded OTC, a security is valued at its last reported bid price and is generally categorized as a Level 2 security.
Investments in open-end investment companies (excluding exchange traded funds), if any, which can be classified as Level 1 or Level 2 securities, are valued based on their net asset value. The net asset value of such investment companies equals the total value of their assets less their liabilities and divided by the number of their outstanding shares.
|
| 34 The Putnam Fund for Growth and Income |
Market quotations are not considered to be readily available for certain debt obligations and other investments; such investments are valued on the basis of valuations furnished by an independent pricing service approved by the Trustees or dealers selected by Putnam Management. Such services or dealers determine valuations for normal institutional-size trading units of such securities using methods based on market transactions for comparable securities and various relationships, generally recognized by institutional traders, between securities (which consider such factors as security prices, yields, maturities and ratings). These securities will generally be categorized as Level 2. Short-term securities with remaining maturities of 60 days or less may be valued at amortized cost, which approximates fair value and are classified as Level 2 securities.
Many securities markets and exchanges outside the U.S. close prior to the close of the New York Stock Exchange and therefore the closing prices for securities in such markets or on such exchanges may not fully reflect events that occur after such close but before the close of the New York Stock Exchange. Accordingly, on certain days, the fund will fair value foreign equity securities taking into account multiple factors including movements in the U.S. securities markets, currency valuations and comparisons to the valuation of American Depository Receipts, exchange-traded funds and futures contracts. These securities, which would generally be classified as Level 1 securities, will be transferred to Level 2 of the fair value hierarchy when they are valued at fair value. The number of days on which fair value prices will be used will depend on market activity and it is possible that fair value prices will be used by the fund to a significant extent. At the close of the reporting period, fair value pricing was used for certain foreign securities in the portfolio. Securities quoted in foreign currencies, if any, are translated into U.S. dollars at the current exchange rate.
To the extent a pricing service or dealer is unable to value a security or provides a valuation that Putnam Management does not believe accurately reflects the security’s fair value, the security will be valued at fair value by Putnam Management in accordance with policies and procedures approved by the Trustees. Certain investments, including certain restricted and illiquid securities and derivatives, are also valued at fair value following procedures approved by the Trustees. These valuations consider such factors as significant market or specific security events such as interest rate or credit quality changes, various relationships with other securities, discount rates, U.S. Treasury, U.S. swap and credit yields, index levels, convexity exposures and recovery rates. These securities are classified as Level 2 or as Level 3 depending on the priority of the significant inputs.
Such valuations and procedures are reviewed periodically by the Trustees. The fair value of securities is generally determined as the amount that the fund could reasonably expect to realize from an orderly disposition of such securities over a reasonable period of time. By its nature, a fair value price is a good faith estimate of the value of a security in a current sale and does not reflect an actual market price, which may be different by a material amount.
Security transactions and related investment income Security transactions are recorded on the trade date (the date the order to buy or sell is executed). Gains or losses on securities sold are determined on the identified cost basis.
Interest income, net of any applicable withholding taxes, is recorded on the accrual basis. Dividend income, net of any applicable withholding taxes, is recognized on the ex-dividend date except that certain dividends from foreign securities, if any, are recognized as soon as the fund is informed of the ex-dividend date. Non-cash dividends, if any, are recorded at the fair value of the securities received. Dividends representing a return of capital or capital gains, if any, are reflected as a reduction of cost and/or as a realized gain.
Foreign currency translation The accounting records of the fund are maintained in U.S. dollars. The fair value of foreign securities, currency holdings, and other assets and liabilities is recorded in the books and records of the fund after translation to U.S. dollars based on the exchange rates on that day. The cost of each security is determined using historical exchange rates. Income and withholding taxes are translated at prevailing exchange rates when earned or incurred. The fund does not isolate that portion of realized or unrealized gains or losses resulting from changes in the foreign exchange rate on investments from fluctuations arising from changes in the market prices of the securities. Such gains and losses are included with the net realized and unrealized gain or loss on investments. Net realized gains and losses on foreign currency transactions represent net realized exchange gains or losses on closed forward currency contracts, disposition of foreign currencies, currency gains and losses realized between the trade and settlement dates on securities transactions and the difference between the amount of investment income and foreign withholding taxes recorded on the fund’s books and the U.S. dollar equivalent amounts actually received or paid. Net unrealized appreciation and depreciation of assets and liabilities in foreign currencies arise from changes in the value of open forward currency contracts and assets and liabilities other than investments at the period end, resulting from changes in the exchange rate.
|
| The Putnam Fund for Growth and Income 35 |
Total return swap contracts The fund entered into OTC total return swap contracts, which are arrangements to exchange a market linked return for a periodic payment, both based on a notional principal amount, to gain exposure to certain sectors or industries.
To the extent that the total return of the security, index or other financial measure underlying the transaction exceeds or falls short of the offsetting interest rate obligation, the fund will receive a payment from or make a payment to the counterparty. OTC total return swap contracts are marked to market daily based upon quotations from an independent pricing service or market makers and the change, if any, is recorded as an unrealized gain or loss. Payments received or made are recorded as realized gains or losses. Certain OTC total return swap contracts may include extended effective dates. Payments related to these swap contracts are accrued based on the terms of the contract. The fund could be exposed to credit or market risk due to unfavorable changes in the fluctuation of interest rates or in the price of the underlying security or index, the possibility that there is no liquid market for these agreements or that the counterparty may default on its obligation to perform. The fund’s maximum risk of loss from counterparty risk is the fair value of the contract. This risk may be mitigated by having a master netting arrangement between the fund and the counterparty. Risk of loss may exceed amounts recognized on the Statement of assets and liabilities.
OTC total return swap contracts outstanding, including their respective notional amounts at period end, if any, are listed after the fund’s portfolio.
Master agreements The fund is a party to ISDA (International Swaps and Derivatives Association, Inc.) Master Agreements (Master Agreements) with certain counterparties that govern OTC derivative and foreign exchange contracts entered into from time to time. The Master Agreements may contain provisions regarding, among other things, the parties’ general obligations, representations, agreements, collateral requirements, events of default and early termination. With respect to certain counterparties, in accordance with the terms of the Master Agreements, collateral posted to the fund is held in a segregated account by the fund’s custodian and with respect to those amounts which can be sold or repledged, are presented in the fund’s portfolio.
Collateral pledged by the fund is segregated by the fund’s custodian and identified in the fund’s portfolio. Collateral can be in the form of cash or debt securities issued by the U.S. Government or related agencies or other securities as agreed to by the fund and the applicable counterparty. Collateral requirements are determined based on the fund’s net position with each counterparty.
Termination events applicable to the fund may occur upon a decline in the fund’s net assets below a specified threshold over a certain period of time. Termination events applicable to counterparties may occur upon a decline in the counterparty’s long-term and short-term credit ratings below a specified level. In each case, upon occurrence, the other party may elect to terminate early and cause settlement of all derivative and foreign exchange contracts outstanding, including the payment of any losses and costs resulting from such early termination, as reasonably determined by the terminating party. Any decision by one or more of the fund’s counterparties to elect early termination could impact the fund’s future derivative activity.
At the close of the reporting period, the fund had a net liability position of $166,637 on open derivative contracts subject to the Master Agreements. Collateral posted by the fund at period end for these agreements totaled $229,863 and may include amounts related to unsettled agreements.
Securities lending The fund may lend securities, through its agent, to qualified borrowers in order to earn additional income. The loans are collateralized by cash in an amount at least equal to the fair value of the securities loaned. The fair value of securities loaned is determined daily and any additional required collateral is allocated to the fund on the next business day. The risk of borrower default will be borne by the fund’s agent; the fund will bear the risk of loss with respect to the investment of the cash collateral. Income from securities lending is included in investment income on the Statement of operations. Cash collateral is invested in Putnam Cash Collateral Pool, LLC, a limited liability company managed by an affiliate of Putnam Management. Investments in Putnam Cash Collateral Pool, LLC are valued at its closing net asset value each business day. There are no management fees charged to Putnam Cash Collateral Pool, LLC. At the close of the reporting period, the fund received cash collateral of $177,548,925 and the value of securities loaned amounted to $176,083,659.
Interfund lending The fund, along with other Putnam funds, may participate in an interfund lending program pursuant to an exemptive order issued by the SEC. This program allows the fund to borrow from or lend to other Putnam funds that permit such transactions. Interfund lending transactions are subject to each fund’s investment policies and borrowing and lending limits. Interest earned or paid on the interfund lending transaction will be based on the average of certain current market rates. During the reporting period, the fund did not utilize the program.
|
| 36 The Putnam Fund for Growth and Income |
Line of credit The fund participates, along with other Putnam funds, in a $315 million unsecured committed line of credit and a $185 million unsecured uncommitted line of credit, both provided by State Street. Borrowings may be made for temporary or emergency purposes, including the funding of shareholder redemption requests and trade settlements. Interest is charged to the fund based on the fund’s borrowing at a rate equal to the Federal Funds rate plus 1.25% for the committed line of credit and the Federal Funds rate plus 1.30% for the uncommitted line of credit. A closing fee equal to 0.02% of the committed line of credit and $50,000 for the uncommitted line of credit has been paid by the participating funds. In addition, a commitment fee of 0.11% per annum on any unutilized portion of the committed line of credit is allocated to the participating funds based on their relative net assets and paid quarterly. During the reporting period, the fund had no borrowings against these arrangements.
Federal taxes It is the policy of the fund to distribute all of its taxable income within the prescribed time period and otherwise comply with the provisions of the Internal Revenue Code of 1986, as amended (the Code), applicable to regulated investment companies. It is also the intention of the fund to distribute an amount sufficient to avoid imposition of any excise tax under Section 4982 of the Code.
The fund is subject to the provisions of Accounting Standards Codification 740 Income Taxes (ASC 740). ASC 740 sets forth a minimum threshold for financial statement recognition of the benefit of a tax position taken or expected to be taken in a tax return. The fund did not have a liability to record for any unrecognized tax benefits in the accompanying financial statements. No provision has been made for federal taxes on income, capital gains or unrealized appreciation on securities held nor for excise tax on income and capital gains. Each of the fund’s federal tax returns for the prior three fiscal years remains subject to examination by the Internal Revenue Service.
The fund may also be subject to taxes imposed by governments of countries in which it invests. Such taxes are generally based on either income or gains earned or repatriated. The fund accrues and applies such taxes to net investment income, net realized gains and net unrealized gains as income and/or capital gains are earned. In some cases, the fund may be entitled to reclaim all or a portion of such taxes, and such reclaim amounts, if any, are reflected as an asset on the fund’s books. In many cases, however, the fund may not receive such amounts for an extended period of time, depending on the country of investment.
At October 31, 2013, the fund had a capital loss carryover of $1,100,085,230 available to the extent allowed by the Code to offset future net capital gain, if any. The amounts of the carryovers and the expiration dates are:
| | | |
| | Loss carryover | |
|
| Short-term | Long-term | Total | Expiration |
|
| $28,462,182 | N/A | $28,462,182 | October 31, 2015 |
|
| 12,074,013 | N/A | 12,074,013 | October 31, 2016 |
|
| 1,059,549,035 | N/A | 1,059,549,035 | October 31, 2017 |
|
Under the Regulated Investment Company Modernization Act of 2010, the fund will be permitted to carry forward capital losses incurred in taxable years beginning after December 22, 2010 for an unlimited period. However, any losses incurred will be required to be utilized prior to the losses incurred in pre-enactment tax years. As a result of this ordering rule, pre-enactment capital loss carryforwards may be more likely to expire unused. Additionally, post-enactment capital losses that are carried forward will retain their character as either short-term or long-term capital losses rather than being considered all short-term as under previous law.
The aggregate identified cost on a tax basis is $4,702,977,877, resulting in gross unrealized appreciation and depreciation of $1,098,897,955 and $79,566,942, respectively, or net unrealized appreciation of $1,019,331,013.
Distributions to shareholders Distributions to shareholders from net investment income are recorded by the fund on the ex-dividend date. Distributions from capital gains, if any, are recorded on the ex-dividend date and paid at least annually. The amount and character of income and gains to be distributed are determined in accordance with income tax regulations, which may differ from generally accepted accounting principles. Dividend sources are estimated at the time of declaration. Actual results may vary. Any non-taxable return of capital cannot be determined until final tax calculations are completed after the end of the fund’s fiscal year. Reclassifications are made to the fund’s capital accounts to reflect income and gains available for distribution (or available capital loss carryovers) under income tax regulations.
| |
| The Putnam Fund for Growth and Income 37 |
Note 2: Management fee, administrative services and other transactions
The fund pays Putnam Management a management fee (based on the fund’s average net assets and computed and paid monthly) at annual rates that may vary based on the average of the aggregate net assets of most open-end funds, as defined in the fund’s management contract, sponsored by Putnam Management. Such annual rates may vary as follows:
| | | | |
| 0.630% | of the first $5 billion, | | 0.430% | of the next $50 billion, |
| |
|
| 0.580% | of the next $5 billion, | | 0.410% | of the next $50 billion, |
| |
|
| 0.530% | of the next $10 billion, | | 0.400% | of the next $100 billion and |
| |
|
| 0.480% | of the next $10 billion, | | 0.395% | of any excess thereafter. |
| |
|
The fund’s shareholders approved the fund’s current management contract with Putnam Management effective February 27, 2014. Shareholders were asked to approve the fund’s management contract following the death on October 8, 2013 of The Honourable Paul G. Desmarais, who had controlled directly and indirectly a majority of the voting shares of Power Corporation of Canada, the ultimate parent company of Putnam Management. The substantive terms of the management contract, including terms relating to fees, are identical to the terms of the fund’s previous management contract and reflect the rates provided in the table above.
Putnam Management has contractually agreed, through June 30, 2014, to waive fees or reimburse the fund’s expenses to the extent necessary to limit the cumulative expenses of the fund, exclusive of brokerage, interest, taxes, investment-related expenses, extraordinary expenses, acquired fund fees and expenses and payments under the fund’s investor servicing contract, investment management contract and distribution plans, on a fiscal year-to-date basis to an annual rate of 0.20% of the fund’s average net assets over such fiscal year-to-date period. During the reporting period, the fund’s expenses were not reduced as a result of this limit.
Putnam Investments Limited (PIL), an affiliate of Putnam Management, is authorized by the Trustees to manage a separate portion of the assets of the fund as determined by Putnam Management from time to time. Putnam Management pays a quarterly sub-management fee to PIL for its services at an annual rate of 0.35% of the average net assets of the portion of the fund managed by PIL.
The fund reimburses Putnam Management an allocated amount for the compensation and related expenses of certain officers of the fund and their staff who provide administrative services to the fund. The aggregate amount of all such reimbursements is determined annually by the Trustees.
Custodial functions for the fund’s assets are provided by State Street. Custody fees are based on the fund’s asset level, the number of its security holdings and transaction volumes.
Putnam Investor Services, Inc., an affiliate of Putnam Management, provides investor servicing agent functions to the fund. Putnam Investor Services, Inc. received fees for investor servicing (except for Class R5 and R6 shares) based on the fund’s retail asset level, the number of shareholder accounts in the fund and the level of defined contribution plan assets in the fund. Class R5 shares pay a monthly fee based on the average net assets of class R5 shares at an annual rate of 0.15%. Class R6 shares pay a monthly fee based on the average net assets of class R6 shares at an annual rate of 0.05%. Investor servicing fees will not exceed an annual rate of 0.32% of the fund’s average net assets. During the reporting period, the expenses for each class of shares related to investor servicing fees were as follows:
| | | | |
| Class A | $5,591,275 | | Class R5 | 11 |
| |
|
| Class B | 102,825 | | Class R6 | 4,665 |
| |
|
| Class C | 55,759 | | Class Y | 51,390 |
| |
|
| Class M | 40,277 | | Total | $5,850,294 |
| |
|
| Class R | 4,092 | | | |
| | |
The fund has entered into expense offset arrangements with Putnam Investor Services, Inc. and State Street whereby Putnam Investor Services, Inc.’s and State Street’s fees are reduced by credits allowed on cash balances. The fund also reduced expenses through brokerage/service arrangements. For the reporting period, the fund’s expenses were reduced by $4,625 under the expense offset arrangements and by $143,767 under the brokerage/ service arrangements.
|
| 38 The Putnam Fund for Growth and Income |
Each independent Trustee of the fund receives an annual Trustee fee, of which $3,356, as a quarterly retainer, has been allocated to the fund, and an additional fee for each Trustees meeting attended. Trustees also are reimbursed for expenses they incur relating to their services as Trustees.
The fund has adopted a Trustee Fee Deferral Plan (the Deferral Plan) which allows the Trustees to defer the receipt of all or a portion of Trustees fees payable on or after July 1, 1995. The deferred fees remain invested in certain Putnam funds until distribution in accordance with the Deferral Plan.
The fund has adopted an unfunded noncontributory defined benefit pension plan (the Pension Plan) covering all Trustees of the fund who have served as a Trustee for at least five years and were first elected prior to 2004. Benefits under the Pension Plan are equal to 50% of the Trustee’s average annual attendance and retainer fees for the three years ended December 31, 2005. The retirement benefit is payable during a Trustee’s lifetime, beginning the year following retirement, for the number of years of service through December 31, 2006. Pension expense for the fund is included in Trustee compensation and expenses in the Statement of operations. Accrued pension liability is included in Payable for Trustee compensation and expenses in the Statement of assets and liabilities. The Trustees have terminated the Pension Plan with respect to any Trustee first elected after 2003.
The fund has adopted distribution plans (the Plans) with respect to its class A, class B, class C, class M and class R shares pursuant to Rule 12b–1 under the Investment Company Act of 1940. The purpose of the Plans is to compensate Putnam Retail Management Limited Partnership, an indirect wholly-owned subsidiary of Putnam Investments, LLC, for services provided and expenses incurred in distributing shares of the fund. The Plans provide for payments by the fund to Putnam Retail Management Limited Partnership at an annual rate of up to 0.35%, 1.00%, 1.00%, 1.00% and 1.00% of the average net assets attributable to class A, class B, class C, class M and class R shares, respectively. The Trustees have approved payment by the fund at an annual rate of 0.25%, 1.00%, 1.00%, 0.75% and 0.50% of the average net assets attributable to class A, class B, class C, class M and class R shares, respectively. During the reporting period, the class specific expenses related to distribution fees were as follows:
| | | | |
| Class A | $6,401,199 | | Class M | 138,370 |
| |
|
| Class B | 470,780 | | Class R | 9,354 |
| |
|
| Class C | 255,594 | | Total | $7,275,297 |
| |
|
For the reporting period, Putnam Retail Management Limited Partnership, acting as underwriter, received net commissions of $154,728 and $590 from the sale of class A and class M shares, respectively, and received $25,230 and $1,012 in contingent deferred sales charges from redemptions of class B and class C shares, respectively.
A deferred sales charge of up to 1.00% and 0.65% is assessed on certain redemptions of class A and class M shares, respectively. For the reporting period, Putnam Retail Management Limited Partnership, acting as underwriter, received $44 and no monies on class A and class M redemptions, respectively.
Note 3: Purchases and sales of securities
During the reporting period, cost of purchases and proceeds from sales of investment securities other than short-term investments aggregated $999,350,556 and $1,163,347,288, respectively. There were no purchases or proceeds from sales of long-term U.S. government securities.
Note 4: Capital shares
At the close of the reporting period, there was an unlimited number of shares of beneficial interest authorized. Transactions in capital shares were as follows:
| | | | |
| | Six months ended 4/30/14 | Year ended 10/31/13 |
|
| Class A | Shares | Amount | Shares | Amount |
|
| Shares sold | 2,686,069 | $52,995,596 | 6,154,436 | $102,188,254 |
|
| Shares issued in connection with | | | | |
| reinvestment of distributions | 1,532,188 | 29,667,133 | 3,674,623 | 59,249,205 |
|
| | 4,218,257 | 82,662,729 | 9,829,059 | 161,437,459 |
|
| Shares repurchased | (13,177,012) | (259,775,039) | (35,341,537) | (581,802,635) |
|
| Net decrease | (8,958,755) | $(177,112,310) | (25,512,478) | $(420,365,176) |
|
|
| The Putnam Fund for Growth and Income 39 |
| | | | |
| | Six months ended 4/30/14 | Year ended 10/31/13 |
|
| Class B | Shares | Amount | Shares | Amount |
|
| Shares sold | 238,586 | $4,623,940 | 549,696 | $8,990,253 |
|
| Shares issued in connection with | | | | |
| reinvestment of distributions | 12,748 | 240,577 | 40,986 | 625,966 |
|
| | 251,334 | 4,864,517 | 590,682 | 9,616,219 |
|
| Shares repurchased | (782,090) | (15,128,705) | (1,856,124) | (30,047,227) |
|
| Net decrease | (530,756) | $(10,264,188) | (1,265,442) | $(20,431,008) |
|
| |
| | Six months ended 4/30/14 | Year ended 10/31/13 |
|
| Class C | Shares | Amount | Shares | Amount |
|
| Shares sold | 240,780 | $4,738,145 | 439,718 | $7,316,329 |
|
| Shares issued in connection with | | | | |
| reinvestment of distributions | 6,877 | 131,773 | 17,333 | 270,337 |
|
| | 247,657 | 4,869,918 | 457,051 | 7,586,666 |
|
| Shares repurchased | (149,777) | (2,940,805) | (416,282) | (6,840,353) |
|
| Net increase | 97,880 | $1,929,113 | 40,769 | $746,313 |
|
| |
| | Six months ended 4/30/14 | Year ended 10/31/13 |
|
| Class M | Shares | Amount | Shares | Amount |
|
| Shares sold | 26,256 | $510,845 | 60,525 | $980,313 |
|
| Shares issued in connection with | | | | |
| reinvestment of distributions | 7,385 | 141,366 | 19,201 | 302,335 |
|
| | 33,641 | 652,211 | 79,726 | 1,282,648 |
|
| Shares repurchased | (110,050) | (2,163,765) | (277,502) | (4,501,534) |
|
| Net decrease | (76,409) | $(1,511,554) | (197,776) | $(3,218,886) |
|
| |
| | Six months ended 4/30/14 | Year ended 10/31/13 |
|
| Class R | Shares | Amount | Shares | Amount |
|
| Shares sold | 14,823 | $292,012 | 58,110 | $951,923 |
|
| Shares issued in connection with | | | | |
| reinvestment of distributions | 992 | 19,066 | 2,518 | 40,365 |
|
| | 15,815 | 311,078 | 60,628 | 992,288 |
|
| Shares repurchased | (51,813) | (1,013,684) | (81,930) | (1,284,706) |
|
| Net decrease | (35,998) | $(702,606) | (21,302) | $(292,418) |
|
| |
| | Six months ended 4/30/14 | Year ended 10/31/13 |
|
| Class R5 | Shares | Amount | Shares | Amount |
|
| Shares sold | — | $— | — | $— |
|
| Shares issued in connection with | | | | |
| reinvestment of distributions | 6 | 117 | 13 | 217 |
|
| | 6 | 117 | 13 | 217 |
|
| Shares repurchased | — | — | — | — |
|
| Net increase | 6 | $117 | 13 | $217 |
|
|
| 40 The Putnam Fund for Growth and Income |
| | | | |
| | Six months ended 4/30/14 | Year ended 10/31/13 |
|
| Class R6 | Shares | Amount | Shares | Amount |
|
| Shares sold | 22,294 | $440,635 | 1,022,456 | $16,954,448 |
|
| Shares issued in connection with | | | | |
| reinvestment of distributions | 7,992 | 155,348 | 7,408 | 132,226 |
|
| | 30,286 | 595,983 | 1,029,864 | 17,086,674 |
|
| Shares repurchased | (65,087) | (1,278,552) | (63,944) | (1,134,636) |
|
| Net increase (decrease) | (34,801) | $(682,569) | 965,920 | $15,952,038 |
|
| |
| | Six months ended 4/30/14 | Year ended 10/31/13 |
|
| Class Y | Shares | Amount | Shares | Amount |
|
| Shares sold | 347,473 | $6,876,887 | 598,538 | $10,157,040 |
|
| Shares issued in connection with | | | | |
| reinvestment of distributions | 16,840 | 327,122 | 46,362 | 744,095 |
|
| | 364,313 | 7,204,009 | 644,900 | 10,901,135 |
|
| Shares repurchased | (257,839) | (5,089,915) | (1,559,478) | (25,848,197) |
|
| Net increase (decrease) | 106,474 | $2,114,094 | (914,578) | $(14,947,062) |
|
At the close of the reporting period, Putnam Investments, LLC owned the following shares of the fund:
| | | |
| | Shares | Percentage of ownership | Value |
|
| Class R5 | 755 | 100% | $15,557 |
|
| Class R6 | 757 | 0.08 | 15,587 |
|
Note 5: Affiliated transactions
Transactions during the reporting period with Putnam Short Term Investment Fund, which is under common ownership and control, were as follows:
| | | | | |
| | Fair value at | | | | Fair value at |
| | the beginning | | | | the end of |
| | of the reporting | | | Investment | the reporting |
| Name of affiliate | period | Purchase cost | Sale proceeds | income | period |
|
| Putnam Short Term | | | | | |
| Investment Fund* | $156,499,916 | $410,175,077 | $439,343,277 | $53,550 | $127,331,716 |
|
* Management fees charged to Putnam Short Term Investment Fund have been waived by Putnam Management.
Note 6: Market, credit and other risks
In the normal course of business, the fund trades financial instruments and enters into financial transactions where risk of potential loss exists due to changes in the market (market risk) or failure of the contracting party to the transaction to perform (credit risk). The fund may be exposed to additional credit risk that an institution or other entity with which the fund has unsettled or open transactions will default. Investments in foreign securities involve certain risks, including those related to economic instability, unfavorable political developments, and currency fluctuations.
Note 7: Summary of derivative activity
The volume of activity for the reporting period for any derivative type that was held during the period is listed below and was as follows based on an average of the holdings at the end of each fiscal quarter:
| |
| OTC total return swap contracts (notional) | $19,100,000 |
|
| Warrants (number of warrants) | 1,200,000 |
|
| |
| The Putnam Fund for Growth and Income 41 |
The following is a summary of the fair value of derivative instruments as of the close of the reporting period:
Fair value of derivative instruments as of the close of the reporting period
| | | | |
| | Asset derivatives | Liability derivatives |
|
| Derivatives not | | | | |
| accounted for as | Statement of | | Statement of | |
| hedging instruments | assets and | | assets and | |
| under ASC 815 | liabilities location | Fair value | liabilities location | Fair value |
|
| Equity contracts | Receivables | $— | Payables | $166,637 |
|
| Total | | $— | | $166,637 |
|
The following is a summary of realized and change in unrealized gains or losses of derivative instruments on the Statement of operations for the reporting period (see Note 1):
Amount of realized gain or (loss) on derivatives recognized in net gain or (loss) on investments
| | | |
| Derivatives not accounted for as hedging | | | |
| instruments under ASC 815 | Warrants | Swaps | Total |
|
| Equity contracts | $(3,237,886) | $864,732 | $(2,373,154) |
|
| Total | $(3,237,886) | $864,732 | $(2,373,154) |
|
Change in unrealized appreciation or (depreciation) on derivatives recognized in net gain or (loss) on investments
| | | |
| Derivatives not accounted for as hedging | | | |
| instruments under ASC 815 | Warrants | Swaps | Total |
|
| Equity contracts | $3,576,817 | $(1,532,864) | $2,043,953 |
|
| Total | $3,576,817 | $(1,532,864) | $2,043,953 |
|
Note 8: Offsetting of financial and derivative assets and liabilities
The following table summarizes any derivatives, repurchase agreements and reverse repurchase agreements, at the end of the reporting period, that are subject to an enforceable master netting agreement or similar agreement. For securities lending transactions or borrowing transactions associated with securities sold short, see Note 1, if any. For financial reporting purposes, the fund does not offset financial assets and financial liabilities that are subject to the master netting agreements in the Statement of assets and liabilities.
| | |
| | Bank of America N.A. | Total |
|
| Assets: | | |
|
| OTC Total return swap contracts*# | $— | $— |
|
| Total Assets | $— | $— |
|
| Liabilities: | | |
|
| OTC Total return swap contracts*# | $166,637 | $166,637 |
|
| Total Liabilities | $166,637 | $166,637 |
|
| Total Financial and Derivative Net Assets | $(166,637) | $(166,637) |
|
| Total collateral received (pledged)†## | $(166,637) | $(166,637) |
|
| Net amount | $— | $— |
|
*Excludes premiums, if any. Included in unrealized appreciation and depreciation on OTC swap contracts on the Statement of assets and liabilities.
†Additional collateral may be required from certain brokers based on individual agreements.
#Covered by master netting agreement. (Note 1)
##Any over-collateralization of total financial and derivative net assets is not shown. Collateral may include amounts related to unsettled agreements.
|
| 42 The Putnam Fund for Growth and Income |
Shareholder meeting results (Unaudited)
February 27, 2014 special meeting
At the meeting, each of the nominees for Trustees was elected, as follows:
| | |
| | Votes for | Votes withheld |
|
| Liaquat Ahamed | 183,435,641 | 8,077,386 |
|
| Ravi Akhoury | 183,530,114 | 7,982,912 |
|
| Barbara M. Baumann | 184,537,016 | 6,976,011 |
|
| Jameson A. Baxter | 184,322,899 | 7,190,128 |
|
| Charles B. Curtis | 184,107,296 | 7,405,731 |
|
| Robert J. Darretta | 184,395,029 | 7,117,998 |
|
| Katinka Domotorffy | 184,073,343 | 7,439,684 |
|
| John A. Hill | 184,250,859 | 7,262,168 |
|
| Paul L. Joskow | 184,419,386 | 7,093,641 |
|
| Kenneth R. Leibler | 184,506,264 | 7,006,763 |
|
| Robert E. Patterson | 184,382,425 | 7,130,602 |
|
| George Putnam, III | 184,295,515 | 7,217,512 |
|
| Robert L. Reynolds | 184,416,500 | 7,096,527 |
|
| W. Thomas Stephens | 183,993,327 | 7,519,700 |
|
A proposal to approve a new management contract between the fund and Putnam Management was approved as follows:
| | | |
| Votes | Votes | | Broker |
| for | against | Abstentions | non-votes |
|
| 143,037,390 | 5,377,184 | 9,205,408 | 33,893,045 |
|
A proposal to adopt an Amended and Restated Declaration of Trust was approved, as follows:
| | | |
| Votes | Votes | | Broker |
| for | against | Abstentions | non-votes |
|
| 142,313,123 | 5,374,011 | 9,932,847 | 33,893,045 |
|
All tabulations are rounded to the nearest whole number.
|
| The Putnam Fund for Growth and Income 43 |
Services for shareholders
Investor services
Systematic investment plan Tell us how much you wish to invest regularly — weekly, semimonthly, or monthly — and the amount you choose will be transferred automatically from your checking or savings account. There’s no additional fee for this service, and you can suspend it at any time. This plan may be a great way to save for college expenses or to plan for your retirement.
Please note that regular investing does not guarantee a profit or protect against loss in a declining market. Before arranging a systematic investment plan, consider your financial ability to continue making purchases in periods when prices are low.
Systematic exchange You can make regular transfers from one Putnam fund to another Putnam fund. There are no additional fees for this service, and you can cancel or change your options at any time.
Dividends PLUS You can choose to have the dividend distributions from one of your Putnam funds automatically reinvested in another Putnam fund at no additional charge.
Free exchange privilege You can exchange money between Putnam funds free of charge, as long as they are the same class of shares. A signature guarantee is required if you are exchanging more than $500,000. The fund reserves the right to revise or terminate the exchange privilege.
Reinstatement privilege If you’ve sold Putnam shares or received a check for a dividend or capital gain, you may reinvest the proceeds with Putnam within 90 days of the transaction and they will be reinvested at the fund’s current net asset value — with no sales charge. However, reinstatement of class B shares may have special tax consequences. Ask your financial or tax representative for details.
Check-writing service You have ready access to many Putnam accounts. It’s as simple as writing a check, and there are no special fees or service charges. For more information about the check-writing service, call Putnam or visit our website.
Dollar cost averaging When you’re investing for long-term goals, it’s time, not timing, that counts. Investing on a systematic basis is a better strategy than trying to figure out when the markets will go up or down. This means investing the same amount of money regularly over a long period. This method of investing is called dollar cost averaging. When a fund’s share price declines, your investment dollars buy more shares at lower prices. When it increases, they buy fewer shares. Over time, you will pay a lower average price per share.
For more information
Visit the Individual Investors section at putnam.com A secure section of our website contains complete information on your account, including balances and transactions, updated daily. You may also conduct transactions, such as exchanges, additional investments, and address changes. Log on today to get your password.
Call us toll free at 1-800-225-1581 Ask a helpful Putnam representative or your financial advisor for details about any of these or other services, or see your prospectus.
|
| 44 The Putnam Fund for Growth and Income |
Fund information
Founded over 75 years ago, Putnam Investments was built around the concept that a balance between risk and reward is the hallmark of a well-rounded financial program. We manage over 100 funds across income, value, blend, growth, asset allocation, absolute return, and global sector categories.
| | |
| Investment Manager | Trustees | Robert T. Burns |
| Putnam Investment | Jameson A. Baxter, Chair | Vice President and |
| Management, LLC | Liaquat Ahamed | Chief Legal Officer |
| One Post Office Square | Ravi Akhoury | |
| Boston, MA 02109 | Barbara M. Baumann | Robert R. Leveille |
| | Charles B. Curtis | Vice President and |
| Investment Sub-Manager | Robert J. Darretta | Chief Compliance Officer |
| Putnam Investments Limited | Katinka Domotorffy | |
| 57–59 St James’s Street | John A. Hill | Michael J. Higgins |
| London, England SW1A 1LD | Paul L. Joskow | Vice President, Treasurer, |
| | Kenneth R. Leibler | and Clerk |
| Marketing Services | Robert E. Patterson | |
| Putnam Retail Management | George Putnam, III | Janet C. Smith |
| One Post Office Square | Robert L. Reynolds | Vice President, |
| Boston, MA 02109 | W. Thomas Stephens | Principal Accounting Officer, |
| | | and Assistant Treasurer |
| Custodian | Officers | |
| State Street Bank | Robert L. Reynolds | Susan G. Malloy |
| and Trust Company | President | Vice President and |
| | Assistant Treasurer |
| Legal Counsel | Jonathan S. Horwitz | |
| Ropes & Gray LLP | Executive Vice President, | James P. Pappas |
| Principal Executive Officer, and | Vice President |
| | Compliance Liaison | |
| | | Mark C. Trenchard |
| | Steven D. Krichmar | Vice President and |
| | Vice President and | BSA Compliance Officer |
| Principal Financial Officer | |
| | | Nancy E. Florek |
| | | Vice President, Director of |
| | | Proxy Voting and Corporate |
| | | Governance, Assistant Clerk, |
| | | and Associate Treasurer |
This report is for the information of shareholders of The Putnam Fund for Growth and Income. It may also be used as sales literature when preceded or accompanied by the current prospectus, the most recent copy of Putnam’s Quarterly Performance Summary, and Putnam’s Quarterly Ranking Summary. For more recent performance, please visit putnam.com. Investors should carefully consider the investment objectives, risks, charges, and expenses of a fund, which are described in its prospectus. For this and other information or to request a prospectus or summary prospectus, call 1-800-225-1581 toll free. Please read the prospectus carefully before investing. The fund’s Statement of Additional Information contains additional information about the fund’s Trustees and is available without charge upon request by calling 1-800-225-1581.
| |
| Item 3. Audit Committee Financial Expert: |
| |
| Item 4. Principal Accountant Fees and Services: |
| |
| Item 5. Audit Committee of Listed Registrants |
| |
| Item 6. Schedule of Investments: |
| |
| The registrant’s schedule of investments in unaffiliated issuers is included in the report to shareholders in Item 1 above. |
| |
| Item 7. Disclosure of Proxy Voting Policies and Procedures For Closed-End Management Investment Companies: |
| |
| Item 8. Portfolio Managers of Closed-End Investment Companies |
| |
| Item 9. Purchases of Equity Securities by Closed-End Management Investment Companies and Affiliated Purchasers: |
| |
| Item 10. Submission of Matters to a Vote of Security Holders: |
| |
| Item 11. Controls and Procedures: |
| |
| (a) The registrant’s principal executive officer and principal financial officer have concluded, based on their evaluation of the effectiveness of the design and operation of the registrant’s disclosure controls and procedures as of a date within 90 days of the filing date of this report, that the design and operation of such procedures are generally effective to provide reasonable assurance that information required to be disclosed by the registrant in this report is recorded, processed, summarized and reported within the time periods specified in the Commission’s rules and forms. |
| |
| (b) Changes in internal control over financial reporting: Not applicable |
| |
| (a)(2) Separate certifications for the principal executive officer and principal financial officer of the registrant as required by Rule 30a-2(a) under the Investment Company Act of 1940, as amended, are filed herewith. |
| |
| (b) The certifications required by Rule 30a-2(b) under the Investment Company Act of 1940, as amended, are filed herewith. |
| |
| The Putnam Fund for Growth and Income |
| |
| By (Signature and Title): |
| |
| /s/Janet C. Smith
Janet C. Smith
Principal Accounting Officer
|
| |
| Pursuant to the requirements of the Securities Exchange Act of 1934 and the Investment Company Act of 1940, this report has been signed below by the following persons on behalf of the registrant and in the capacities and on the dates indicated. |
| |
| By (Signature and Title): |
| |
| /s/Jonathan S. Horwitz
Jonathan S. Horwitz
Principal Executive Officer
|
| |
| By (Signature and Title): |
| |
| /s/Steven D. Krichmar
Steven D. Krichmar
Principal Financial Officer
|