| | |
| UNITED STATES
SECURITIES AND EXCHANGE COMMISSION |
| | |
| CERTIFIED SHAREHOLDER REPORT OF REGISTERED
MANAGEMENT INVESTMENT COMPANIES
|
| | |
| Investment Company Act file number: | (811-00781) |
| | |
| Exact name of registrant as specified in charter: | The Putnam Fund for Growth and Income |
| | |
| Address of principal executive offices: | One Post Office Square, Boston, Massachusetts 02109 |
| | |
| Name and address of agent for service: | Robert T. Burns, Vice President
One Post Office Square
Boston, Massachusetts 02109 |
| | |
| Copy to: | John W. Gerstmayr, Esq.
Ropes & Gray LLP
800 Boylston Street
Boston, Massachusetts 02199-3600 |
| | |
| Registrant’s telephone number, including area code: | (617) 292-1000 |
| | |
| Date of fiscal year end: | October 31, 2013 |
| | |
| Date of reporting period : | November 1, 2012 — October 31, 2013 |
| | |
|
Item 1. Report to Stockholders: | |
| | |
| The following is a copy of the report transmitted to stockholders pursuant to Rule 30e-1 under the Investment Company Act of 1940: | |

The Putnam
Fund for Growth
and Income
Annual report
10 | 31 | 13
| | |
| Message from the Trustees | 1 | |
| |
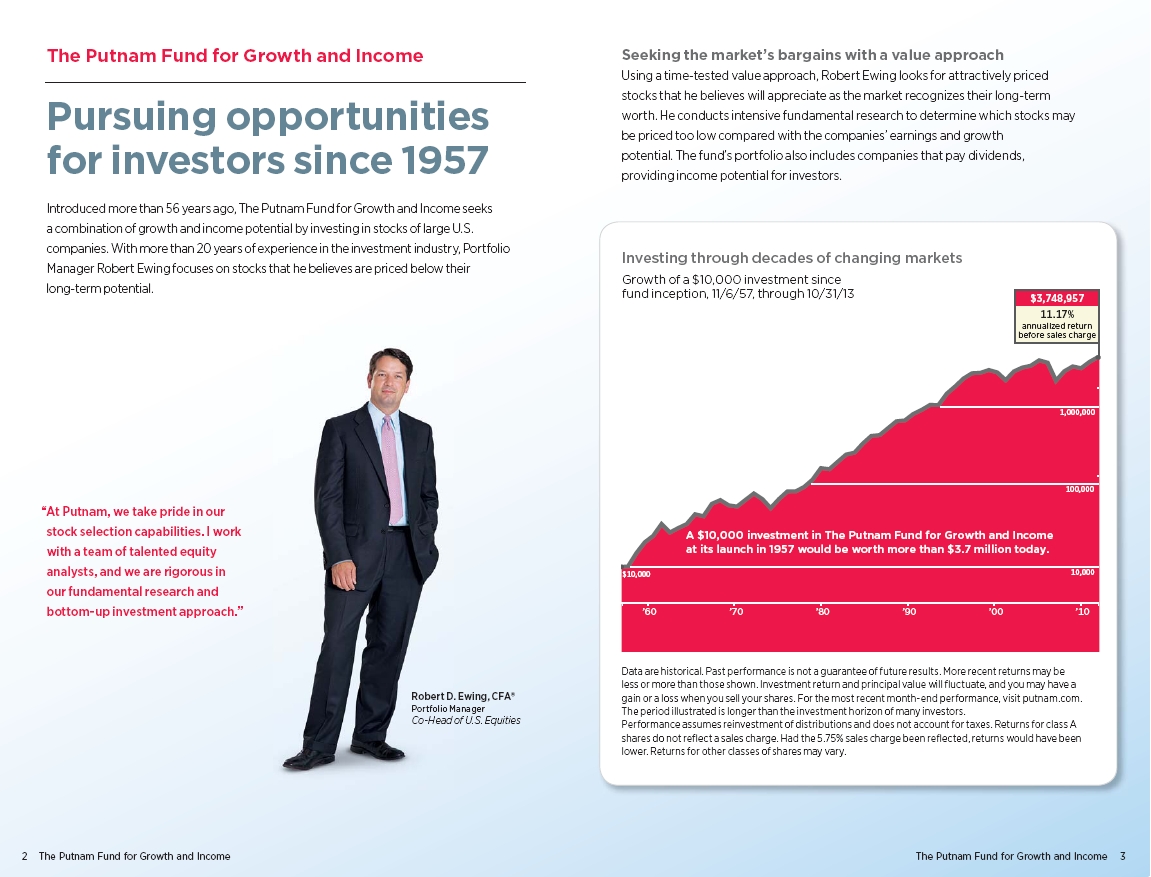
| About the fund | 2 | |
| |
| Performance snapshot | 4 | |
| |
| Interview with your fund’s portfolio manager | 5 | |
| |
| Your fund’s performance | 10 | |
| |
| Your fund’s expenses | 13 | |
| |
| Terms and definitions | 15 | |
| |
| Other information for shareholders | 16 | |
| |
| Important notice regarding Putnam’s privacy policy | 17 | |
| |
| Trustee approval of management contract | 18 | |
| |
| Financial statements | 24 | |
| |
| Federal tax information | 49 | |
| |
| About the Trustees | 50 | |
| |
| Officers | 52 | |
| |
Consider these risks before investing: Value stocks may fail to rebound, and the market may not favor value-style investing. Income provided by the fund may be reduced by changes in the dividend policies of, and the capital resources available at, the companies in which the fund invests. Stock prices may fall or fail to rise over time for several reasons, including general financial market conditions and factors related to a specific issuer or industry. You can lose money by investing in the fund.
Message from the Trustees
Dear Fellow Shareholder:
In the final months of 2013, we continue to see business conditions as generally positive for well-diversified investment portfolios. Financial markets have shown surprising resilience in the face of recent headwinds, most notably the confrontation over the federal budget and debt ceiling, which took a toll on the economy during October. With Congressional negotiations now continuing into 2014, there is hope that lawmakers may reach an agreement beneficial to the economy, even as investors remain alert to the risk of additional disruption.
Fortunately, equity markets have easily overcome recent obstacles. Supported by generally solid corporate earnings and healthy balance sheets, stock market gains to this point are far above the long-term average for a single year. International stocks have also performed well, particularly in Europe and Japan. While bonds have lagged behind stocks, many fixed-income sectors have advanced, reminding investors of the need for flexible and selective approaches. The sting of rising interest rates has been felt primarily by Treasuries and other government bonds.
At Putnam, we believe markets in flux can often provide the best opportunity for realizing the benefits of financial advice and active portfolio management. An experienced advisor can help investors stay focused on their long-term goals without getting distracted by daily economic and political events. Challenging times also call for innovative and alternative investment strategies managed by experts. In seeking returns for fund shareholders, Putnam’s investment professionals engage in fundamental research, active investing, and risk management strategies.
We would like to welcome new shareholders of the fund and to thank you for investing with Putnam. We would also like to extend our thanks to Elizabeth Kennan, who has retired from the Board of Trustees, for her 20 years of dedicated service.

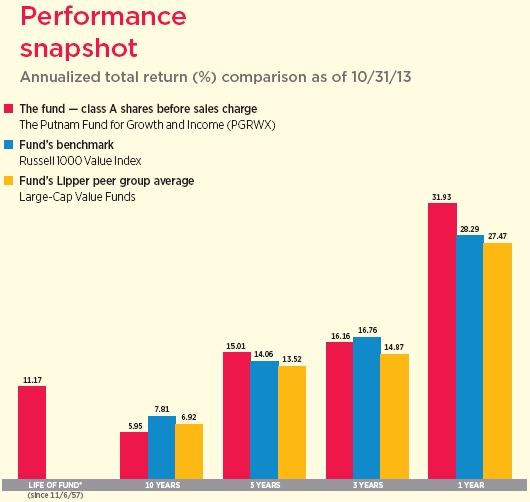
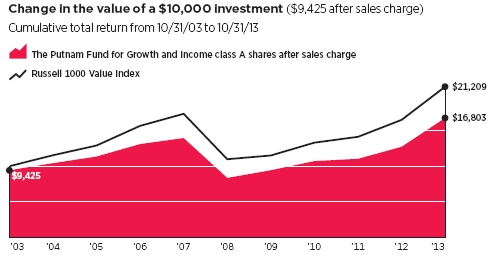
Current performance may be lower or higher than the quoted past performance, which cannot guarantee future results. Share price, principal value, and return will fluctuate, and you may have a gain or a loss when you sell your shares. Performance of class A shares assumes reinvestment of distributions and does not account for taxes. Fund returns in the bar chart do not reflect a sales charge of 5.75%; had they, returns would have been lower. See pages 3, 5, and 10–12 for additional performance information. For a portion of the periods, the fund had expense limitations, without which returns would have been lower. To obtain the most recent month-end performance, visit putnam.com.
* The fund’s benchmark, the Russell 1000 Value Index, and the fund’s Lipper peer group were introduced on 12/31/78 and 12/31/59, respectively, which post-date the inception of the fund’s class A shares.
| |
| 4 | The Putnam Fund for Growth and Income |
Interview with your fund’s portfolio manager

Bob, how would you describe conditions for investors during the 12 months ended October 31, 2013?
In terms of overall stock market performance, it was a remarkable 12 months, with major market indexes delivering solid double-digit returns. The S&P 500 Index, a broad measure of U.S. stock performance, achieved and surpassed its all-time high several times during the period. Investors appeared to be much less distracted by macroeconomic worries, and their renewed enthusiasm for stocks fueled a sustained market rally.
Stocks had some bouts of turbulence during the period, particularly in the second half, when uncertainty escalated over the Federal Reserve’s plan to taper its asset-purchase program, which is designed to stimulate the economy. Stocks also declined in response to the congressional budget debate, which led to a 16-day partial shutdown of the federal government in October.
How did the fund perform during the period?
The fund delivered a solid positive return that exceeded that of its benchmark, the Russell 1000 Value Index, as well as the average return for funds in its Lipper peer group. I’m particularly pleased that we achieved these results in a balanced way, through a combination of stock selection and sector weightings. As always, I was fortunate to have a talented team of equity analysts supporting my research.
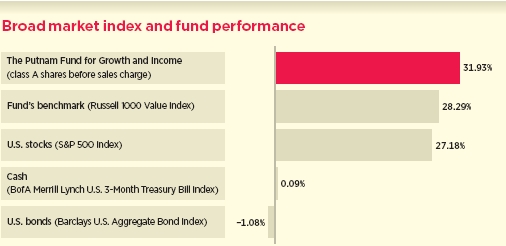
This comparison shows your fund’s performance in the context of broad market indexes for the 12 months ended 10/31/13. See pages 3, 4, and 10–12 for additional fund performance information. Index descriptions can be found on pages 15–16.
| |
| The Putnam Fund for Growth and Income | 5 |
Also helping performance was my pro-cyclical focus. I had positioned the portfolio with a bias toward more economically sensitive companies — those that we expected to benefit from an improving economy. Although it took longer than usual for these types of stocks to rebound, they ultimately were strong performers for the period. In terms of dividend-paying stocks, my decision to favor dividend growth potential over dividend yield was also beneficial. That is, companies with the potential to grow their dividends tended to perform better than companies already paying high dividends.
What were some examples of stocks that helped performance?
One of the portfolio highlights for the period was Halliburton, a company that provides products and services for oil and natural gas exploration and development. The stock, which was quite inexpensive at the start of the period, performed well as margins improved for Halliburton’s pressure pumping business. The company also benefited from increased exploration and production activity, which boosted demand for its products.
Another top contributor to fund performance was the stock of Delta Air Lines. The company — and the airline industry as a whole — has been focused on capacity discipline, which essentially means working to ensure that its flights are full. This, combined with ancillary revenue from initiatives such as baggage fees, has improved Delta’s business model and profitability.
Also worth mentioning is Hewlett-Packard, a company whose stock has struggled considerably as demand has declined sharply for its key products — personal computers and printers. During the period, however, this stock was one of the fund’s top contributors as the market favored larger, more established
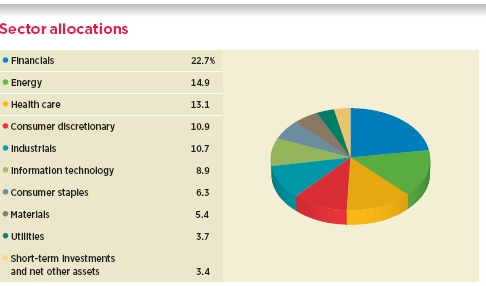
Allocations are shown as a percentage of the fund’s net assets as of 10/31/13. Short-term investments and net other assets, if any, represent the market value weights of cash, derivatives, short-term securities, and other unclassified assets in the portfolio. Summary information may differ from the portfolio schedule included in the financial statements due to the inclusion of derivative securities, any interest accruals, the exclusion of as-of trades, if any, and the use of different classifications of securities for presentation purposes. Holdings and allocations may vary over time.
| |
| 6 | The Putnam Fund for Growth and Income |
technology companies. In addition, the stock’s valuation, which had been at extremely low levels, rose during the period.

Could you discuss some stocks that detracted from returns relative to the benchmark?
The top detractor was Apple, an out-of-benchmark stock that was among the top performers in the fund’s previous fiscal year. Creator of such iconic products as the iPhone and iPad, Apple is one of the world’s largest companies, and its stock had an impressive multi-year run, reaching a record high of $705 per share in September 2012. Since then, the stock has struggled and it now trades at much lower levels, due in large part to investor concerns about the company’s ability to continue delivering innovative products.
Weakening gold prices and higher operating expenses hurt the stock of Barrick Gold, a gold-mining company. Gold tends to thrive in periods of uncertainty or inflationary pressure — both of which were largely missing during the past 12 months. Also, a slowdown in activity across the mining industry had a negative impact on fund holding Joy Global, a mining equipment company. Another detractor for the period was oil and gas company Royal Dutch Shell, which felt the effects of flat and declining prices in the energy sector.
As the fund begins a new fiscal year, what is your outlook?
Earlier in 2013, I characterized the fund as being constructive and pro-cyclical, poised to take advantage of attractively low valuations

This table shows the fund’s top 10 holdings by percentage of the fund’s net assets as of 10/31/13. Short-term holdings and derivatives, if any, are excluded. Holdings may vary over time.
| |
| The Putnam Fund for Growth and Income | 7 |
and a recovering stock market. Today, I would temper that and say that the portfolio positioning is more balanced. As the market has rallied, valuations have become increasingly more similar across the market, and there are fewer exploitable opportunities.
My approach in constructing the portfolio is less thematic, with a more intense focus on individual company fundamentals as opposed to broad sector themes. I am emphasizing areas where stocks may have more growth characteristics, such as technology, and I’m avoiding areas where I believe stocks are too expensive, such as higher-yielding dividend payers like utilities. In fact, when I look at many defensive stocks — those with less earnings volatility than the market overall, sometimes referred to as “safe” stocks — I find their valuations to be pretty demanding; that is, they are expensive.
While the market’s momentum has been encouraging, I believe we are unlikely to see equity returns continue upward in a straight line, and the months ahead will not be without their variations and risks. In a less robust environment such as this, it is important to be cautious and selective in your investment choices and to incorporate rigorous fundamental research — which is exactly how we approach our stock selection for the fund’s portfolio.
Thank you, Bob, for your time and insights today.
The views expressed in this report are exclusively those of Putnam Management and are subject to change. They are not meant as investment advice.
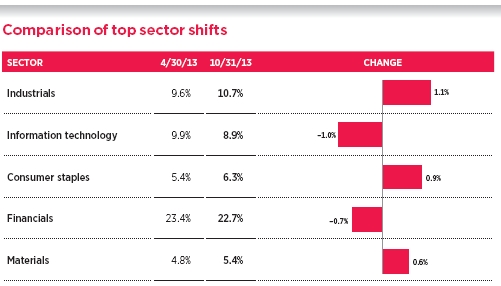
This chart shows the fund’s largest allocation shifts, by percentage, over the past six months. Allocations are shown as a percentage of the fund’s net assets. Current period summary information may differ from the portfolio schedule included in the financial statements due to the inclusion of derivative securities, any interest accruals, the exclusion of as-of trades, if any, and the use of different classifications of securities for presentation purposes. Holdings and allocations may vary over time.
| |
| 8 | The Putnam Fund for Growth and Income |
Please note that the holdings discussed in this report may not have been held by the fund for the entire period. Portfolio composition is subject to review in accordance with the fund’s investment strategy and may vary in the future. Current and future portfolio holdings are subject to risk.
Portfolio Manager Robert D. Ewing is Co-Head of U.S. Equities at Putnam. He has a B.S. in Finance and Economics from Boston College. A CFA charterholder, he joined Putnam in 2008 and has been in the investment industry since 1990.
IN THE NEWS
With stocks rallying and interest rates increasingly volatile, investors are pouring money into equity-based mutual funds. For the first nine months of 2013, inflows into stock funds more than quadrupled, compared with the same time period in 2012, according to the Strategic Insight Monthly Fund Industry Review. U.S. equity funds attracted over $168 billion versus $31 billion during the first three quarters of 2012, while international stock funds garnered over $163 billion in comparison with nearly $50 billion a year ago. Investors are on track in 2013 to invest the most money in equity mutual funds since 2000, according to investment research firm TrimTabs. Meanwhile, fixed-income investors have tapped the brakes, with year-to-date inflows of about $27 billion as of September 30, down from over $290 billion a year ago.
| |
| The Putnam Fund for Growth and Income | 9 |
Your fund’s performance
This section shows your fund’s performance, price, and distribution information for periods ended October 31, 2013, the end of its most recent fiscal year. In accordance with regulatory requirements for mutual funds, we also include performance information as of the most recent calendar quarter-end and expense information taken from the fund’s current prospectus. Performance should always be considered in light of a fund’s investment strategy. Data represent past performance. Past performance does not guarantee future results. More recent returns may be less or more than those shown. Investment return and principal value will fluctuate, and you may have a gain or a loss when you sell your shares. Performance information does not reflect any deduction for taxes a shareholder may owe on fund distributions or on the redemption of fund shares. For the most recent month-end performance, please visit the Individual Investors section at putnam.com or call Putnam at 1-800-225-1581. Class R, class R5, class R6, and class Y shares are not available to all investors. See the Terms and Definitions section in this report for definitions of the share classes offered by your fund.
Fund performance Total return for periods ended 10/31/13
| | | | | | | | | | | | |
| | Class A | Class B | Class C | Class M | Class R | Class R5 | Class R6 | Class Y |
| (inception dates) | (11/6/57) | (4/27/92) | (7/26/99) | (5/1/95) | (1/21/03) | (7/2/12) | (7/2/12) | (6/15/94) |
|
| | Before | After | | | | | Before | After | Net | Net | Net | Net |
| sales | sales | Before | After | Before | After | sales | sales | asset | asset | asset | asset |
| charge | charge | CDSC | CDSC | CDSC | CDSC | charge | charge | value | value | value | value |
|
| Annual average | | | | | | | | | | | | |
| (life of fund) | 11.17% | 11.05% | 10.16% | 10.16% | 10.33% | 10.33% | 10.45% | 10.38% | 10.89% | 11.27% | 11.27% | 11.26% |
|
| 10 years | 78.28 | 68.03 | 65.22 | 65.22 | 65.33 | 65.33 | 69.52 | 63.59 | 73.71 | 83.04 | 83.17 | 82.63 |
| Annual average | 5.95 | 5.33 | 5.15 | 5.15 | 5.16 | 5.16 | 5.42 | 5.05 | 5.68 | 6.23 | 6.24 | 6.21 |
|
| 5 years | 101.25 | 89.68 | 93.68 | 91.68 | 93.73 | 93.73 | 96.21 | 89.34 | 98.77 | 104.07 | 104.21 | 103.61 |
| Annual average | 15.01 | 13.66 | 14.13 | 13.90 | 14.14 | 14.14 | 14.43 | 13.62 | 14.73 | 15.33 | 15.35 | 15.28 |
|
| 3 years | 56.72 | 47.71 | 53.08 | 50.08 | 53.15 | 53.15 | 54.35 | 48.95 | 55.48 | 58.21 | 58.32 | 57.86 |
| Annual average | 16.16 | 13.89 | 15.25 | 14.49 | 15.27 | 15.27 | 15.57 | 14.20 | 15.85 | 16.52 | 16.55 | 16.44 |
|
| 1 year | 31.93 | 24.35 | 30.89 | 25.89 | 30.91 | 29.91 | 31.29 | 26.69 | 31.63 | 32.55 | 32.62 | 32.26 |
|
Current performance may be lower or higher than the quoted past performance, which cannot guarantee future results. After-sales-charge returns for class A and M shares reflect the deduction of the maximum 5.75% and 3.50% sales charge, respectively, levied at the time of purchase. Class B share returns after contingent deferred sales charge (CDSC) reflect the applicable CDSC, which is 5% in the first year, declining over time to 1% in the sixth year, and is eliminated thereafter. Class C share returns after CDSC reflect a 1% CDSC for the first year that is eliminated thereafter. Class R, R5, R6, and Y shares have no initial sales charge or CDSC. Performance for class B, C, M, R, and Y shares before their inception is derived from the historical performance of class A shares, adjusted for the applicable sales charge (or CDSC) and the higher operating expenses for such shares, except for class Y shares, for which 12b-1 fees are not applicable. Performance for class R5 and R6 shares prior to their inception is derived from the historical performance of class Y shares and has not been adjusted for the lower investor servicing fees applicable to class R5 and R6 shares; had it, returns would have been higher.
Recent performance may have benefited from one or more legal settlements.
For a portion of the periods, the fund had expense limitations, without which returns would have been lower.
Class B share performance does not reflect conversion to class A shares.
| |
| 10 | The Putnam Fund for Growth and Income |
Comparative index returns For periods ended 10/31/13
| | |
| | | Lipper Large-Cap Value |
| | Russell 1000 Value Index | Funds category average* |
|
| Annual average (life of fund) | —† | —† |
|
| 10 years | 112.09% | 96.48% |
| Annual average | 7.81 | 6.92 |
|
| 5 years | 93.01 | 88.93 |
| Annual average | 14.06 | 13.52 |
|
| 3 years | 59.20 | 51.69 |
| Annual average | 16.76 | 14.87 |
|
| 1 year | 28.29 | 27.47 |
|
Index and Lipper results should be compared with fund performance before sales charge, before CDSC, or at net asset value.
* Over the 1-year, 3-year, 5-year, and 10-year periods ended 10/31/13, there were 469, 413, 361, and 233 funds, respectively, in this Lipper category.
† The fund’s benchmark, the Russell 1000 Value Index, and the fund’s Lipper peer group were introduced on 12/31/78 and 12/31/59, respectively, which post-date the inception of the fund’s class A shares.
Past performance does not indicate future results. At the end of the same time period, a $10,000 investment in the fund’s class B and class C shares would have been valued at $16,522 and $16,533, respectively, and no contingent deferred sales charges would apply. A $10,000 investment in the fund’s class M shares ($9,650 after sales charge) would have been valued at $16,359. A $10,000 investment in the fund’s class R, class R5, class R6, and class Y shares would have been valued at $17,371, $18,304, $18,317, and $18,263, respectively.
| |
| The Putnam Fund for Growth and Income | 11 |
Fund price and distribution information For the 12-month period ended 10/31/13
| | | | | | | | | | |
| Distributions | Class A | Class B | Class C | Class M | Class R | Class R5 | Class R6 | Class Y |
|
| Number | 4 | 4 | 4 | 4 | 4 | 4 | 4 | 4 |
|
| Income | $0.233 | $0.109 | $0.113 | $0.153 | $0.191 | $0.293 | $0.311 | $0.274 |
|
| Capital gains | — | — | — | — | — | — | — | — |
|
| Total | $0.233 | $0.109 | $0.113 | $0.153 | $0.191 | $0.293 | $0.311 | $0.274 |
|
| | Before | After | Net | Net | Before | After | Net | Net | Net | Net |
| | sales | sales | asset | asset | sales | sales | asset | asset | asset | asset |
| Share value | charge | charge | value | value | charge | charge | value | value | value | value |
|
| 10/31/12 | $14.51 | $15.40 | $14.25 | $14.45 | $14.39 | $14.91 | $14.43 | $14.54 | $14.54 | $14.54 |
|
| 10/31/13 | 18.87 | 20.02 | 18.52 | 18.78 | 18.71 | 19.39 | 18.77 | 18.93 | 18.92 | 18.91 |
|
| | Before | After | Net | Net | Before | After | Net | Net | Net | Net |
| Current rate | sales | sales | asset | asset | sales | sales | asset | asset | asset | asset |
| (end of period) | charge | charge | value | value | charge | charge | value | value | value | value |
|
| Current | | | | | | | | | | |
| dividend rate 1 | 1.00% | 0.94% | 0.30% | 0.30% | 0.53% | 0.52% | 0.77% | 1.31% | 1.42% | 1.23% |
|
| Current 30-day | | | | | | | | | | |
| SEC yield 2 | N/A | 0.99 | 0.31 | 0.31 | N/A | 0.54 | 0.80 | 1.33 | 1.47 | 1.29 |
|
The classification of distributions, if any, is an estimate. Before-sales-charge share value and current dividend rate for class A and M shares, if applicable, do not take into account any sales charge levied at the time of purchase. After-sales-charge share value, current dividend rate, and current 30-day SEC yield, if applicable, are calculated assuming that the maximum sales charge (5.75% for class A shares and 3.50% for class M shares) was levied at the time of purchase. Final distribution information will appear on your year-end tax forms.
1 Most recent distribution, including any return of capital and excluding capital gains, annualized and divided by the fund’s share price before or after sales charge at period-end.
2 Based only on investment income and calculated using the maximum offering price for each share class, in accordance with SEC guidelines.
Fund performance as of most recent calendar quarter
Total return for periods ended 9/30/13
| | | | | | | | | | | | |
| | Class A | Class B | Class C | Class M | Class R | Class R5 | Class R6 | Class Y |
| (inception dates) | (11/6/57) | (4/27/92) | (7/26/99) | (5/1/95) | (1/21/03) | (7/2/12) | (7/2/12) | (6/15/94) |
|
| | Before | After | | | | | Before | After | Net | Net | Net | Net |
| sales | sales | Before | After | Before | After | sales | sales | asset | asset | asset | asset |
| charge | charge | CDSC | CDSC | CDSC | CDSC | charge | charge | value | value | value | value |
|
| Annual average | | | | | | | | | | | | |
| (life of fund) | 11.11% | 10.99% | 10.11% | 10.11% | 10.27% | 10.27% | 10.39% | 10.32% | 10.83% | 11.21% | 11.21% | 11.20% |
|
| 10 years | 80.86 | 70.47 | 67.69 | 67.69 | 67.82 | 67.82 | 72.07 | 66.05 | 76.39 | 85.81 | 85.94 | 85.39 |
| Annual average | 6.10 | 5.48 | 5.31 | 5.31 | 5.31 | 5.31 | 5.58 | 5.20 | 5.84 | 6.39 | 6.40 | 6.37 |
|
| 5 years | 61.69 | 52.39 | 55.67 | 53.67 | 55.69 | 55.69 | 57.68 | 52.16 | 59.75 | 64.05 | 64.16 | 63.67 |
| Annual average | 10.09 | 8.79 | 9.26 | 8.97 | 9.26 | 9.26 | 9.54 | 8.76 | 9.82 | 10.41 | 10.42 | 10.36 |
|
| 3 years | 54.81 | 45.91 | 51.42 | 48.42 | 51.43 | 51.43 | 52.62 | 47.27 | 53.78 | 56.42 | 56.52 | 56.06 |
| Annual average | 15.68 | 13.42 | 14.83 | 14.07 | 14.83 | 14.83 | 15.13 | 13.77 | 15.42 | 16.08 | 16.11 | 15.99 |
|
| 1 year | 27.25 | 19.93 | 26.37 | 21.37 | 26.38 | 25.38 | 26.73 | 22.29 | 27.01 | 27.95 | 28.02 | 27.66 |
|
See the discussion following the Fund performance table on page 10 for information about the calculation of fund performance.
| |
| 12 | The Putnam Fund for Growth and Income |
Your fund’s expenses
As a mutual fund investor, you pay ongoing expenses, such as management fees, distribution fees (12b-1 fees), and other expenses. Using the following information, you can estimate how these expenses affect your investment and compare them with the expenses of other funds. You may also pay one-time transaction expenses, including sales charges (loads) and redemption fees, which are not shown in this section and would have resulted in higher total expenses. For more information, see your fund’s prospectus or talk to your financial representative.
Expense ratios
| | | | | | | | |
| | Class A | Class B | Class C | Class M | Class R | Class R5 | Class R6 | Class Y |
|
| Total annual operating expenses for | | | | | | | | |
| the fiscal year ended 10/31/12 | 1.10% | 1.85% | 1.85% | 1.60% | 1.35% | 0.68%* | 0.58%* | 0.85% |
|
| Annualized expense ratio | | | | | | | | |
| for the six-month period | | | | | | | | |
| ended 10/31/13† | 1.02% | 1.77% | 1.77% | 1.52% | 1.27% | 0.67% | 0.57% | 0.77% |
|
Fiscal-year expense information in this table is taken from the most recent prospectus, is subject to change, and may differ from that shown for the annualized expense ratio and in the financial highlights of this report. Expenses are shown as a percentage of average net assets.
* Other expenses for class R5 and R6 shares have been annualized.
† For the fund’s most recent fiscal half year; may differ from expense ratios based on one-year data in the financial highlights.
Expenses per $1,000
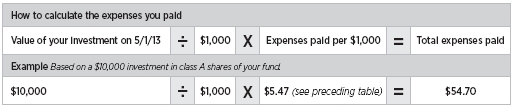
The following table shows the expenses you would have paid on a $1,000 investment in the fund from May 1, 2013, to October 31, 2013. It also shows how much a $1,000 investment would be worth at the close of the period, assuming actual returns and expenses.
| | | | | | | | |
| | Class A | Class B | Class C | Class M | Class R | Class R5 | Class R6 | Class Y |
|
| Expenses paid per $1,000*† | $5.47 | $9.46 | $9.47 | $8.14 | $6.80 | $3.59 | $3.06 | $4.13 |
|
| Ending value (after expenses) | $1,126.50 | $1,121.50 | $1,121.80 | $1,123.60 | $1,125.20 | $1,128.60 | $1,128.70 | $1,127.50 |
|
* Expenses for each share class are calculated using the fund’s annualized expense ratio for each class, which represents the ongoing expenses as a percentage of average net assets for the six months ended 10/31/13. The expense ratio may differ for each share class.
† Expenses are calculated by multiplying the expense ratio by the average account value for the period; then multiplying the result by the number of days in the period; and then dividing that result by the number of days in the year.
| |
| The Putnam Fund for Growth and Income | 13 |
Estimate the expenses you paid
To estimate the ongoing expenses you paid for the six months ended October 31, 2013, use the following calculation method. To find the value of your investment on May 1, 2013, call Putnam at 1-800-225-1581.
Compare expenses using the SEC’s method
The Securities and Exchange Commission (SEC) has established guidelines to help investors assess fund expenses. Per these guidelines, the following table shows your fund’s expenses based on a $1,000 investment, assuming a hypothetical 5% annualized return. You can use this information to compare the ongoing expenses (but not transaction expenses or total costs) of investing in the fund with those of other funds. All mutual fund shareholder reports will provide this information to help you make this comparison. Please note that you cannot use this information to estimate your actual ending account balance and expenses paid during the period.
| | | | | | | | |
| | Class A | Class B | Class C | Class M | Class R | Class R5 | Class R6 | Class Y |
|
| Expenses paid per $1,000*† | $5.19 | $9.00 | $9.00 | $7.73 | $6.46 | $3.41 | $2.91 | $3.92 |
|
| Ending value (after expenses) | $1,020.06 | $1,016.28 | $1,016.28 | $1,017.54 | $1,018.80 | $1,021.83 | $1,022.33 | $1,021.32 |
|
* Expenses for each share class are calculated using the fund’s annualized expense ratio for each class, which represents the ongoing expenses as a percentage of average net assets for the six months ended 10/31/13. The expense ratio may differ for each share class.
† Expenses are calculated by multiplying the expense ratio by the average account value for the six-month period; then multiplying the result by the number of days in the six-month period; and then dividing that result by the number of days in the year.
| |
| 14 | The Putnam Fund for Growth and Income |
Terms and definitions
Important terms
Total return shows how the value of the fund’s shares changed over time, assuming you held the shares through the entire period and reinvested all distributions in the fund.
Before sales charge, or net asset value, is the price, or value, of one share of a mutual fund, without a sales charge. Before-sales-charge figures fluctuate with market conditions, and are calculated by dividing the net assets of each class of shares by the number of outstanding shares in the class.
After sales charge is the price of a mutual fund share plus the maximum sales charge levied at the time of purchase. After-sales-charge performance figures shown here assume the 5.75% maximum sales charge for class A shares and 3.50% for class M shares.
Contingent deferred sales charge (CDSC) is generally a charge applied at the time of the redemption of class B or C shares and assumes redemption at the end of the period. Your fund’s class B CDSC declines over time from a 5% maximum during the first year to 1% during the sixth year. After the sixth year, the CDSC no longer applies. The CDSC for class C shares is 1% for one year after purchase.
Current rate is the annual rate of return earned from dividends or interest of an investment. Current rate is expressed as a percentage of the price of a security, fund share, or principal investment.
Share classes
Class A shares are generally subject to an initial sales charge and no CDSC (except on certain redemptions of shares bought without an initial sales charge).
Class B shares are not subject to an initial sales charge. They may be subject to a CDSC.
Class C shares are not subject to an initial sales charge and are subject to a CDSC only if the shares are redeemed during the first year.
Class M shares have a lower initial sales charge and a higher 12b-1 fee than class A shares and no CDSC (except on certain redemptions of shares bought without an initial sales charge).
Class R shares are not subject to an initial sales charge or CDSC and are available only to certain defined contribution plans.
Class R5 shares and class R6 shares are not subject to an initial sales charge or CDSC, and carry no 12b-1 fee. They are only available to employer-sponsored retirement plans.
Class Y shares are not subject to an initial sales charge or CDSC, and carry no 12b-1 fee. They are generally only available to corporate and institutional clients and clients in other approved programs.
Comparative indexes
Barclays U.S. Aggregate Bond Index is an unmanaged index of U.S. investment-grade fixed-income securities.
BofA Merrill Lynch U.S. 3-Month Treasury Bill Index is an unmanaged index that seeks to measure the performance of U.S. Treasury bills available in the marketplace.
Russell 1000 Value Index is an unmanaged index of those companies in the large-cap Russell 1000 Index chosen for their value orientation.
S&P 500 Index is an unmanaged index of common stock performance.
Indexes assume reinvestment of all distributions and do not account for fees. Securities and performance of a fund and an index will differ. You cannot invest directly in an index.
| |
| The Putnam Fund for Growth and Income | 15 |
Lipper is a third-party industry-ranking entity that ranks mutual funds. Its rankings do not reflect sales charges. Lipper rankings are based on total return at net asset value relative to other funds that have similar current investment styles or objectives as determined by Lipper. Lipper may change a fund’s category assignment at its discretion. Lipper category averages reflect performance trends for funds within a category.
Other information for shareholders
Proxy voting
Putnam is committed to managing our mutual funds in the best interests of our shareholders. The Putnam funds’ proxy voting guidelines and procedures, as well as information regarding how your fund voted proxies relating to portfolio securities during the 12-month period ended June 30, 2013, are available in the Individual Investors section of putnam.com, and on the Securities and Exchange Commission (SEC) website, www.sec.gov. If you have questions about finding forms on the SEC’s website, you may call the SEC at 1-800-SEC-0330. You may also obtain the Putnam funds’ proxy voting guidelines and procedures at no charge by calling Putnam’s Shareholder Services at 1-800-225-1581.
Fund portfolio holdings
The fund will file a complete schedule of its portfolio holdings with the SEC for the first and third quarters of each fiscal year on Form N-Q. Shareholders may obtain the fund’s Forms N-Q on the SEC’s website at www.sec.gov. In addition, the fund’s Forms N-Q may be reviewed and copied at the SEC’s Public Reference Room in Washington, D.C. You may call the SEC at 1-800-SEC-0330 for information about the SEC’s website or the operation of the Public Reference Room.
Trustee and employee fund ownership
Putnam employees and members of the Board of Trustees place their faith, confidence, and, most importantly, investment dollars in Putnam mutual funds. As of October 31, 2013, Putnam employees had approximately $414,000,000 and the Trustees had approximately $99,000,000 invested in Putnam mutual funds. These amounts include investments by the Trustees’ and employees’ immediate family members as well as investments through retirement and deferred compensation plans.
| |
| 16 | The Putnam Fund for Growth and Income |
Important notice regarding Putnam’s privacy policy
In order to conduct business with our shareholders, we must obtain certain personal information such as account holders’ names, addresses, Social Security numbers, and dates of birth. Using this information, we are able to maintain accurate records of accounts and transactions.
It is our policy to protect the confidentiality of our shareholder information, whether or not a shareholder currently owns shares of our funds. In particular, it is our policy not to sell information about you or your accounts to outside marketing firms. We have safeguards in place designed to prevent unauthorized access to our computer systems and procedures to protect personal information from unauthorized use.
Under certain circumstances, we must share account information with outside vendors who provide services to us, such as mailings and proxy solicitations. In these cases, the service providers enter into confidentiality agreements with us, and we provide only the information necessary to process transactions and perform other services related to your account. Finally, it is our policy to share account information with your financial representative, if you’ve listed one on your Putnam account.
| |
| The Putnam Fund for Growth and Income | 17 |
Trustee approval of management contract
General conclusions
The Board of Trustees of the Putnam funds oversees the management of each fund and, as required by law, determines annually whether to approve the continuance of your fund’s management contract with Putnam Investment Management (“Putnam Management”) and the sub-management contract with respect to your fund between Putnam Management and its affiliate, Putnam Investments Limited (“PIL”). The Board of Trustees, with the assistance of its Contract Committee, requests and evaluates all information it deems reasonably necessary under the circumstances in connection with its annual contract review. The Contract Committee consists solely of Trustees who are not “interested persons” (as this term is defined in the Investment Company Act of 1940, as amended (the “1940 Act”)) of the Putnam funds (“Independent Trustees”).
At the outset of the review process, members of the Board’s independent staff and independent legal counsel met with representatives of Putnam Management to review the annual contract review materials furnished to the Contract Committee during the course of the previous year’s review and to discuss possible changes in these materials that might be necessary or desirable for the coming year. Following these discussions and in consultation with the Contract Committee, the Independent Trustees’ independent legal counsel requested that Putnam Management furnish specified information, together with any additional information that Putnam Management considered relevant, to the Contract Committee. Over the course of several months ending in June 2013, the Contract Committee met on a number of occasions with representatives of Putnam Management, and separately in executive session, to consider the information that Putnam Management provided. Throughout this process, the Contract Committee was assisted by the members of the Board’s independent staff and by independent legal counsel for the Putnam funds and the Independent Trustees.
In May 2013, the Contract Committee met in executive session to discuss and consider its preliminary recommendations with respect to the continuance of the contracts. At the Trustees’ June 20, 2013 meeting, the Contract Committee met in executive session with the other Independent Trustees to review a summary of the key financial data that the Contract Committee considered in the course of its review. The Contract Committee then presented its written report, which summarized the key factors that the Committee had considered and set forth its final recommendations. The Contract Committee then recommended, and the Independent Trustees approved, the continuance of your fund’s management and sub-management contracts, effective July 1, 2013, subject to certain changes in the sub-management contract noted below. (Because PIL is an affiliate of Putnam Management and Putnam Management remains fully responsible for all services provided by PIL, the Trustees have not evaluated PIL as a separate entity, and all subsequent references to Putnam Management below should be deemed to include reference to PIL as necessary or appropriate in the context.)
The Independent Trustees’ approval was based on the following conclusions:
• That the fee schedule in effect for your fund represented reasonable compensation in light of the nature and quality of the services being provided to the fund, the fees paid by competitive funds, and the costs incurred by Putnam Management in providing services to the fund, and
• That the fee schedule represented an appropriate sharing between fund shareholders and Putnam Management of
| |
| 18 | The Putnam Fund for Growth and Income |
such economies of scale as may exist in the management of the fund at current asset levels.
These conclusions were based on a comprehensive consideration of all information provided to the Trustees and were not the result of any single factor. Some of the factors that figured particularly in the Trustees’ deliberations and how the Trustees considered these factors are described below, although individual Trustees may have evaluated the information presented differently, giving different weights to various factors. It is also important to recognize that the management arrangements for your fund and the other Putnam funds are the result of many years of review and discussion between the Independent Trustees and Putnam Management, that some aspects of the arrangements may receive greater scrutiny in some years than others, and that the Trustees’ conclusions may be based, in part, on their consideration of fee arrangements in previous years. For example, with some minor exceptions, the current fee arrangements in the management contracts for the Putnam funds were implemented at the beginning of 2010 following extensive review and discussion by the Trustees, as well as approval by shareholders.
As noted above, the Trustees considered administrative revisions to your fund’s sub-management contract. Putnam Management recommended that the sub-management contract be revised to reduce the sub-management fee that Putnam Management pays to PIL with respect to the portion of the portfolios of certain funds, but not your fund, that may be allocated to PIL from time to time. The Independent Trustees’ approval of this recommendation was based on their conclusion that these changes would have no practical effect on Putnam Management’s continued responsibility for the management of these funds or the costs borne by fund shareholders and would not result in any reduction in the nature and quality of services provided to the funds.
Management fee schedules and total expenses
The Trustees reviewed the management fee schedules in effect for all Putnam funds, including fee levels and breakpoints. The Trustees also reviewed the total expenses of each Putnam fund, recognizing that in most cases management fees represented the major, but not the sole, determinant of total costs to shareholders.
In reviewing fees and expenses, the Trustees generally focus their attention on material changes in circumstances — for example, changes in assets under management, changes in a fund’s investment style, changes in Putnam Management’s operating costs or profitability, or changes in competitive practices in the mutual fund industry — that suggest that consideration of fee changes might be warranted. The Trustees concluded that the circumstances did not warrant changes to the management fee structure of your fund.
Under its management contract, your fund has the benefit of breakpoints in its management fee schedule that provide shareholders with economies of scale in the form of reduced fee levels as assets under management in the Putnam family of funds increase. The Trustees concluded that the fee schedule in effect for your fund represented an appropriate sharing of economies of scale between fund shareholders and Putnam Management.
As in the past, the Trustees also focused on the competitiveness of each fund’s total expense ratio. In order to ensure that expenses of the Putnam funds continue to meet competitive standards, the Trustees and Putnam Management have implemented certain expense limitations. These expense limitations were: (i) a contractual expense limitation applicable to all retail open-end funds of 32 basis points on investor servicing fees and expenses and (ii) a contractual expense limitation applicable to all open-end funds of 20 basis points on so-called “other expenses” (i.e., all expenses
| |
| The Putnam Fund for Growth and Income | 19 |
exclusive of management fees, investor servicing fees, distribution fees, investment-related expenses, interest, taxes, brokerage commissions, extraordinary expenses and acquired fund fees and expenses). These expense limitations serve in particular to maintain competitive expense levels for funds with large numbers of small shareholder accounts and funds with relatively small net assets. Most funds had sufficiently low expenses that these expense limitations did not apply. However, in the case of your fund, the first of the expense limitations applied during its fiscal year ending in 2012. Putnam Management’s support for these expense limitations was an important factor in the Trustees’ decision to approve the continuance of your fund’s management and sub-management contracts.
The Trustees reviewed comparative fee and expense information for a custom group of competitive funds selected by Lipper Inc. This comparative information included your fund’s percentile ranking for effective management fees and total expenses (excluding any applicable 12b-1 fee), which provides a general indication of your fund’s relative standing. In the custom peer group, your fund ranked in the 1st quintile in effective management fees (determined for your fund and the other funds in the custom peer group based on fund asset size and the applicable contractual management fee schedule) and in the 3rd quintile in total expenses (excluding any applicable 12b-1 fees) as of December 31, 2012 (the first quintile representing the least expensive funds and the fifth quintile the most expensive funds). The fee and expense data reported by Lipper as of December 31, 2012 reflected the most recent fiscal year-end data available in Lipper’s database at that time.
In connection with their review of the management fees and total expenses of the Putnam funds, the Trustees also reviewed the costs of the services provided and the profits realized by Putnam Management and its affiliates from their contractual relationships with the funds. This information included trends in revenues, expenses and profitability of Putnam Management and its affiliates relating to the investment management, investor servicing and distribution services provided to the funds. In this regard, the Trustees also reviewed an analysis of Putnam Management’s revenues, expenses and profitability, allocated on a fund-by-fund basis, with respect to the funds’ management, distribution, and investor servicing contracts. For each fund, the analysis presented information about revenues, expenses and profitability for each of the agreements separately and for the agreements taken together on a combined basis. The Trustees concluded that, at current asset levels, the fee schedules in place represented reasonable compensation for the services being provided and represented an appropriate sharing of such economies of scale as may exist in the management of the Putnam funds at that time.
The information examined by the Trustees as part of their annual contract review for the Putnam funds has included for many years information regarding fees charged by Putnam Management and its affiliates to institutional clients such as defined benefit pension plans, college endowments, and the like. This information included comparisons of those fees with fees charged to the funds, as well as an assessment of the differences in the services provided to these different types of clients. The Trustees observed that the differences in fee rates between institutional clients and mutual funds are by no means uniform when examined by individual asset sectors, suggesting that differences in the pricing of investment management services to these types of clients may reflect historical competitive forces operating in separate markets. The Trustees considered the fact that in many cases fee rates across different asset classes are higher on average for mutual funds than for institutional clients, as well as the differences between the services
|
| 20 The Putnam Fund for Growth and Income |
that Putnam Management provides to the Putnam funds and those that it provides to its institutional clients. The Trustees did not rely on these comparisons to any significant extent in concluding that the management fees paid by your fund are reasonable.
Investment performance
The quality of the investment process provided by Putnam Management represented a major factor in the Trustees’ evaluation of the quality of services provided by Putnam Management under your fund’s management contract. The Trustees were assisted in their review of the Putnam funds’ investment process and performance by the work of the investment oversight committees of the Trustees, which meet on a regular basis with the funds’ portfolio teams and with the Chief Investment Officer and other senior members of Putnam Management’s Investment Division throughout the year. The Trustees concluded that Putnam Management generally provides a high-quality investment process — based on the experience and skills of the individuals assigned to the management of fund portfolios, the resources made available to them, and in general Putnam Management’s ability to attract and retain high-quality personnel — but also recognized that this does not guarantee favorable investment results for every fund in every time period.
The Trustees considered that 2012 was a year of strong competitive performance for many of the Putnam funds, with only a relatively small number of exceptions. They noted that this strong performance was exemplified by the fact that the Putnam funds were recognized by Barron’s as the best performing mutual fund complex for 2012 — the second time in four years that Putnam Management has achieved this distinction for the Putnam funds. They also noted, however, the disappointing investment performance of some funds for periods ended December 31, 2012 and considered information provided by Putnam Management regarding the factors contributing to the underperformance and actions being taken to improve the performance of these particular funds. The Trustees indicated their intention to continue to monitor performance trends to assess the effectiveness of these efforts and to evaluate whether additional actions to address areas of underperformance are warranted.
For purposes of evaluating investment performance, the Trustees generally focus on competitive industry rankings for the one-year, three-year, and five-year periods. For a number of Putnam funds with relatively unique investment mandates, the Trustees evaluated performance based on comparisons of their total returns with the returns of selected investment benchmarks or targeted returns. In the case of your fund, the Trustees considered that its class A share cumulative total return performance at net asset value was in the following quartiles of its Lipper Inc. peer group (Lipper Large-Cap Value Funds) for the one-year, three-year and five-year periods ended December 31, 2012 (the first quartile representing the best-performing funds and the fourth quartile the worst-performing funds):
| |
| One-year period | 1st |
|
| Three-year period | 2nd |
|
| Five-year period | 2nd |
|
For the one-year period ended December 31, 2012, your fund’s performance was in the top decile of its Lipper Inc. peer group. Over the one-year, three-year and five-year periods ended December 31, 2012, there were 472, 412 and 353 funds, respectively, in your fund’s Lipper peer group. (When considering performance information, shareholders should be mindful that past performance is not a guarantee of future results.)
Brokerage and soft-dollar allocations; investor servicing
The Trustees considered various potential benefits that Putnam Management may
| |
| The Putnam Fund for Growth and Income | 21 |
receive in connection with the services it provides under the management contract with your fund. These include benefits related to brokerage allocation and the use of soft dollars, whereby a portion of the commissions paid by a fund for brokerage may be used to acquire research services that are expected to be useful to Putnam Management in managing the assets of the fund and of other clients. Subject to policies established by the Trustees, soft dollars generated by these means are used primarily to acquire brokerage and research services that enhance Putnam Management’s investment capabilities and supplement Putnam Management’s internal research efforts. However, the Trustees noted that a portion of available soft dollars continues to be used to pay fund expenses. The Trustees indicated their continued intent to monitor regulatory and industry developments in this area with the assistance of their Brokerage Committee and also indicated their continued intent to monitor the allocation of the Putnam funds’ brokerage in order to ensure that the principle of seeking best price and execution remains paramount in the portfolio trading process.
Putnam Management may also receive benefits from payments that the funds make to Putnam Management’s affiliates for investor or distribution services. In conjunction with the annual review of your fund’s management and sub-management contracts, the Trustees reviewed your fund’s investor servicing agreement with Putnam Investor Services, Inc. (“PSERV”) and its distributor’s contracts and distribution plans with Putnam Retail Management Limited Partnership (“PRM”), both of which are affiliates of Putnam Management. The Trustees concluded that the fees payable by the funds to PSERV and PRM, as applicable, for such services are reasonable in relation to the nature and quality of such services, the fees paid by competitive funds, and the costs incurred by PSERV and PRM, as applicable, in providing such services.
Consideration of your fund’s interim management contract and the continuance of the fund’s sub-management contract
Following the Trustees’ approval of the continuance of your fund’s management and sub-management contracts, on October 8, 2013, The Honourable Paul G. Desmarais passed away. Mr. Desmarais, both directly and though holding companies, controlled a majority of the voting shares of Power Corporation of Canada, the ultimate parent company of Putnam Management. Upon his death, Mr. Desmarais’ voting control of shares of Power Corporation of Canada was transferred to The Desmarais Family Residuary Trust (the “Transfer”). As a technical matter, the Transfer may have constituted an “assignment” within the meaning of the Investment Company Act of 1940, causing the fund’s existing management and sub-management contracts to terminate automatically. On October 18, 2013, the Trustees approved your fund’s interim management contract and the continuance of your fund’s sub-management contract to address this possibility and to avoid disruption of investment advisory and other services provided to your fund. At a subsequent meeting on November 22, 2013, the Trustees, including all of the Independent Trustees, approved new definitive management contracts between the Putnam funds and Putnam Management and determined to recommend their approval to the shareholders of the Putnam funds at a shareholder meeting to be held in early 2014.
In considering whether to approve your fund’s interim management contract and new definitive management contract and the continuance of your fund’s sub-management contract, the Trustees took into account that they had most recently approved the annual continuation of the fund’s previous management and sub-management contracts at their meeting in June 2013, as described above.
|
| 22 The Putnam Fund for Growth and Income |
The Trustees considered that the terms of the interim management contract and new definitive management contract were identical to the previous management contract, except for the effective dates and initial terms and for certain non-substantive changes. They also considered that the sub-management contract was identical to the previous sub-management contract, except for the effective dates and initial terms. Because the proposed contracts were substantially identical to the previous versions of these contracts approved by the Trustees at their June 2013 meeting, the Trustees relied to a considerable extent on their prior approval of these contracts. In addition, the Trustees considered a number other factors relating to the Transfer, including, but not limited to, the following:
• Information about the operations of The Desmarais Family Residuary Trust, including that Paul Desmarais, Jr. and André Desmarais, Mr. Desmarais’ sons, were expected to exercise, jointly, voting control over the Power Corporation of Canada shares controlled by The Desmarais Family Residuary Trust.
• That Paul Desmarais, Jr. and André Desmarais had been playing active managerial roles at Power Corporation of Canada, with responsibility for the oversight of Power Corporation of Canada’s subsidiaries, including Putnam Investments, since Power Corporation of Canada had acquired Putnam Investments in 2007, including serving as Directors of Putnam Investments, and that the Transfer would not affect their responsibilities as officers of Power Corporation of Canada.
• The intention expressed by representatives of Power Corporation of Canada and its subsidiaries, Power Financial Corporation and Great-West Lifeco, that there would be no change to the operations or management of Putnam Investments, to Putnam Management’s management of the funds or to investment, advisory and other services provided to the funds by Putnam Management and its affiliates as a result of the Transfer.
• Putnam Management’s assurances that, following the Transfer, Putnam Management would continue to provide the same level of services to each fund and that the Transfer will not have an adverse impact on the ability of Putnam Management and its affiliates to continue to provide high quality investment advisory and other services to the funds.
• Putnam Management’s assurances that there are no current plans to make any changes to the operations of the funds, existing management fees, expense limitations, distribution arrangements, or the quality of any services provided to the funds or their shareholders, as a result of the Transfer.
• The benefits that the funds have received and may potentially receive as a result of Putnam Management being a member of the Power Corporation of Canada group of companies, which promotes the stability of the Putnam organization.
| |
| The Putnam Fund for Growth and Income | 23 |
Financial statements
A note about your fund’s auditors
A non-U.S. member firm in PricewaterhouseCoopers LLP’s (“PwC”) global network of firms has an investment in certain non-U.S. funds now affiliated with Putnam Investments as a result of the July 2013 acquisition of the funds’ advisor by Putnam’s parent company, Great-West Lifeco Inc. The investment consists of pension plan assets for the benefit of the member firm’s personnel. The investment is inconsistent with the requirements of the Securities and Exchange Commission’s auditor independence rules. Your fund has been informed by PwC that to address this issue, the member firm is in the process of selecting different advisors not affiliated with Putnam to manage the relevant pension plans and transferring the plans’ assets to such advisors. None of the member firm’s personnel is on the PwC audit team for your fund, and none of the members of the audit team participates in the member firm’s pension plans. Based on its knowledge of the facts and its experience with PwC, the Audit and Compliance Committee of your fund’s Board of Trustees concluded that the investment by the PwC member firm would not affect PwC’s ability to render an objective audit opinion to your fund. Based on this conclusion and consideration of the potential risks that the disruption of a change of auditors could present, the Audit and Compliance Committee determined that PwC should continue to act as auditors for your fund.
These sections of the report, as well as the accompanying Notes, preceded by the Report of Independent Registered Public Accounting Firm, constitute the fund’s financial statements.
The fund’s portfolio lists all the fund’s investments and their values as of the last day of the reporting period. Holdings are organized by asset type and industry sector, country, or state to show areas of concentration and diversification.
Statement of assets and liabilities shows how the fund’s net assets and share price are determined. All investment and non-investment assets are added together. Any unpaid expenses and other liabilities are subtracted from this total. The result is divided by the number of shares to determine the net asset value per share, which is calculated separately for each class of shares. (For funds with preferred shares, the amount subtracted from total assets includes the liquidation preference of preferred shares.)
Statement of operations shows the fund’s net investment gain or loss. This is done by first adding up all the fund’s earnings — from dividends and interest income — and subtracting its operating expenses to determine net investment income (or loss). Then, any net gain or loss the fund realized on the sales of its holdings — as well as any unrealized gains or losses over the period — is added to or subtracted from the net investment result to determine the fund’s net gain or loss for the fiscal year.
Statement of changes in net assets shows how the fund’s net assets were affected by the fund’s net investment gain or loss, by distributions to shareholders, and by changes in the number of the fund’s shares. It lists distributions and their sources (net investment income or realized capital gains) over the current reporting period and the most recent fiscal year-end. The distributions listed here may not match the sources listed in the Statement of operations because the distributions are determined on a tax basis and may be paid in a different period from the one in which they were earned.
Financial highlights provide an overview of the fund’s investment results, per-share distributions, expense ratios, net investment income ratios, and portfolio turnover in one summary table, reflecting the five most recent reporting periods. In a semiannual report, the highlights table also includes the current reporting period.
|
| 24 The Putnam Fund for Growth and Income |
Report of Independent Registered Public Accounting Firm
To the Trustees and Shareholders of
The Putnam Fund for Growth and Income:
In our opinion, the accompanying statement of assets and liabilities, including the portfolio, and the related statements of operations and of changes in net assets and the financial highlights present fairly, in all material respects, the financial position of The Putnam Fund for Growth and Income (the “fund”) at October 31, 2013, and the results of its operations, the changes in its net assets and the financial highlights for each of the periods indicated, in conformity with accounting principles generally accepted in the United States of America. These financial statements and financial highlights (hereafter referred to as “financial statements”) are the responsibility of the fund’s management. Our responsibility is to express an opinion on these financial statements based on our audits. We conducted our audits of these financial statements in accordance with the standards of the Public Company Accounting Oversight Board (United States). Those standards require that we plan and perform the audit to obtain reasonable assurance about whether the financial statements are free of material misstatement. An audit includes examining, on a test basis, evidence supporting the amounts and disclosures in the financial statements, assessing the accounting principles used and significant estimates made by management, and evaluating the overall financial statement presentation. We believe that our audits, which included confirmation of investments owned at October 31, 2013 by correspondence with the custodian, brokers, and transfer agent, provide a reasonable basis for our opinion.
PricewaterhouseCoopers LLP
Boston, Massachusetts
December 10, 2013
| |
| The Putnam Fund for Growth and Income | 25 |
The fund’s portfolio 10/31/13
| | |
| COMMON STOCKS (97.4%)* | Shares | Value |
|
| Aerospace and defense (5.4%) | | |
| Embraer SA ADR (Brazil) S | 403,000 | $11,844,170 |
|
| European Aeronautic Defence and Space Co. NV (France) | 590,366 | 40,532,073 |
|
| General Dynamics Corp. | 90,300 | 7,822,689 |
|
| Honeywell International, Inc. | 649,700 | 56,348,481 |
|
| L-3 Communications Holdings, Inc. | 402,900 | 40,471,305 |
|
| Northrop Grumman Corp. | 449,400 | 48,314,994 |
|
| Raytheon Co. S | 425,300 | 35,031,961 |
|
| United Technologies Corp. | 402,500 | 42,765,625 |
|
| | | 283,131,298 |
| Airlines (1.0%) | | |
| Delta Air Lines, Inc. | 1,347,800 | 35,554,964 |
|
| Japan Airlines Co., Ltd. (Japan) UR | 291,000 | 16,957,490 |
|
| | | 52,512,454 |
| Auto components (0.8%) | | |
| Johnson Controls, Inc. | 559,100 | 25,802,465 |
|
| TRW Automotive Holdings Corp. † | 183,800 | 13,805,218 |
|
| | | 39,607,683 |
| Automobiles (0.9%) | | |
| Ford Motor Co. | 902,200 | 15,436,642 |
|
| General Motors Co. † | 919,400 | 33,971,830 |
|
| | | 49,408,472 |
| Beverages (1.5%) | | |
| Beam, Inc. | 257,300 | 17,316,290 |
|
| Coca-Cola Co. (The) | 273,700 | 10,830,309 |
|
| Coca-Cola Enterprises, Inc. | 621,000 | 25,914,330 |
|
| Dr. Pepper Snapple Group, Inc. | 519,500 | 24,598,325 |
|
| | | 78,659,254 |
| Capital markets (4.5%) | | |
| Blackstone Group LP (The) | 461,200 | 12,120,336 |
|
| Carlyle Group LP (The) (Partnership shares) | 741,100 | 22,914,812 |
|
| Charles Schwab Corp. (The) | 1,435,000 | 32,502,750 |
|
| Goldman Sachs Group, Inc. (The) | 219,593 | 35,323,730 |
|
| Greenhill & Co., Inc. S | 255,800 | 13,122,540 |
|
| KKR & Co. LP | 1,134,377 | 24,899,575 |
|
| Morgan Stanley | 1,836,000 | 52,748,280 |
|
| State Street Corp. | 615,400 | 43,121,078 |
|
| | | 236,753,101 |
| Chemicals (3.1%) | | |
| Agrium, Inc. (Canada) S | 247,900 | 21,150,828 |
|
| Celanese Corp. Ser. A | 304,400 | 17,049,444 |
|
| Dow Chemical Co. (The) | 988,400 | 39,012,148 |
|
| HB Fuller Co. S | 189,300 | 9,061,791 |
|
| Huntsman Corp. | 868,100 | 20,157,282 |
|
| LyondellBasell Industries NV Class A | 701,600 | 52,339,360 |
|
| OCI Partners LP † | 256,471 | 5,732,127 |
|
| | | 164,502,980 |
| Commercial banks (3.1%) | | |
| Barclays PLC (United Kingdom) | 2,591,078 | 10,950,425 |
|
| Commerzbank AG (Germany) † | 505,335 | 6,494,150 |
|
| Fifth Third Bancorp | 544,200 | 10,356,126 |
|
|
| 26 The Putnam Fund for Growth and Income |
| | |
| COMMON STOCKS (97.4%)* cont. | Shares | Value |
|
| Commercial banks cont. | | |
| Investors Bancorp, Inc. | 527,400 | $12,504,654 |
|
| KeyCorp | 869,600 | 10,896,088 |
|
| U.S. Bancorp | 419,500 | 15,672,520 |
|
| UniCredit SpA (Italy) | 765,043 | 5,747,062 |
|
| Wells Fargo & Co. | 2,130,279 | 90,941,611 |
|
| | | 163,562,636 |
| Commercial services and supplies (0.7%) | | |
| ADT Corp. (The) † S | 305,421 | 13,246,109 |
|
| Tyco International, Ltd. | 664,142 | 24,274,390 |
|
| | | 37,520,499 |
| Communications equipment (2.4%) | | |
| Cisco Systems, Inc. | 4,235,857 | 95,306,783 |
|
| Polycom, Inc. † | 943,900 | 9,816,560 |
|
| Qualcomm, Inc. | 334,700 | 23,251,609 |
|
| | | 128,374,952 |
| Computers and peripherals (1.5%) | | |
| Apple, Inc. | 81,300 | 42,467,055 |
|
| Hewlett-Packard Co. | 783,300 | 19,089,021 |
|
| NetApp, Inc. S | 245,700 | 9,535,617 |
|
| SanDisk Corp. S | 127,900 | 8,889,050 |
|
| | | 79,980,743 |
| Construction and engineering (0.1%) | | |
| KBR, Inc. | 226,900 | 7,837,126 |
|
| | | 7,837,126 |
| Construction materials (0.1%) | | |
| Buzzi Unicem SpA (Italy) | 475,647 | 8,241,592 |
|
| | | 8,241,592 |
| Consumer finance (0.6%) | | |
| Capital One Financial Corp. | 448,038 | 30,766,769 |
|
| | | 30,766,769 |
| Containers and packaging (0.2%) | | |
| MeadWestvaco Corp. | 303,500 | 10,576,975 |
|
| | | 10,576,975 |
| Diversified consumer services (0.4%) | | |
| ITT Educational Services, Inc. † S | 485,900 | 19,494,308 |
|
| | | 19,494,308 |
| Diversified financial services (7.6%) | | |
| Bank of America Corp. | 6,039,694 | 84,314,128 |
|
| Citigroup, Inc. | 2,608,080 | 127,222,142 |
|
| CME Group, Inc. | 407,800 | 30,262,838 |
|
| JPMorgan Chase & Co. | 3,109,046 | 160,240,231 |
|
| | | 402,039,339 |
| Diversified telecommunication services (0.5%) | | |
| AT&T, Inc. S | 380,000 | 13,756,000 |
|
| Verizon Communications, Inc. S | 262,459 | 13,256,804 |
|
| | | 27,012,804 |
| Electric utilities (1.6%) | | |
| American Electric Power Co., Inc. | 226,500 | 10,609,260 |
|
| Edison International | 378,000 | 18,533,340 |
|
| FirstEnergy Corp. | 833,200 | 31,553,284 |
|
| NextEra Energy, Inc. | 194,700 | 16,500,825 |
|
| PPL Corp. | 254,800 | 7,804,524 |
|
| | | 85,001,233 |
| |
| The Putnam Fund for Growth and Income | 27 |
| | |
| COMMON STOCKS (97.4%)* cont. | Shares | Value |
|
| Electrical equipment (0.1%) | | |
| Schneider Electric SA (France) | 63,496 | $5,339,130 |
|
| | | 5,339,130 |
| Electronic equipment, instruments, and components (0.3%) | | |
| Corning, Inc. S | 852,500 | 14,569,225 |
|
| | | 14,569,225 |
| Energy equipment and services (3.3%) | | |
| Baker Hughes, Inc. | 360,100 | 20,918,209 |
|
| Cameron International Corp. † | 167,700 | 9,200,022 |
|
| Ezion Holdings, Ltd. (Singapore) | 2,908,000 | 5,243,858 |
|
| Halliburton Co. | 1,007,900 | 53,448,937 |
|
| McDermott International, Inc. † S | 694,500 | 4,910,115 |
|
| Nabors Industries, Ltd. | 829,000 | 14,490,920 |
|
| Oil States International, Inc. † | 149,000 | 16,185,870 |
|
| Petrofac, Ltd. (United Kingdom) | 528,787 | 12,374,583 |
|
| Schlumberger, Ltd. | 313,239 | 29,356,759 |
|
| Transocean, Ltd. (Switzerland) S | 215,200 | 10,129,464 |
|
| | | 176,258,737 |
| Food and staples retail (1.0%) | | |
| CVS Caremark Corp. | 853,700 | 53,151,362 |
|
| | | 53,151,362 |
| Food products (1.4%) | | |
| Hillshire Brands Co. | 438,620 | 14,399,895 |
|
| Kellogg Co. | 131,100 | 8,292,075 |
|
| Kraft Foods Group, Inc. | 257,600 | 14,008,288 |
|
| Mead Johnson Nutrition Co. | 127,900 | 10,444,314 |
|
| Mondelez International, Inc. Class A | 760,900 | 25,596,676 |
|
| | | 72,741,248 |
| Health-care equipment and supplies (2.1%) | | |
| Baxter International, Inc. | 805,600 | 53,064,872 |
|
| Covidien PLC | 595,272 | 38,162,888 |
|
| St. Jude Medical, Inc. | 332,200 | 19,064,958 |
|
| | | 110,292,718 |
| Health-care providers and services (2.5%) | | |
| Aetna, Inc. | 668,600 | 41,921,220 |
|
| Catamaran Corp. † | 432,800 | 20,324,288 |
|
| CIGNA Corp. | 132,800 | 10,222,944 |
|
| Emeritus Corp. † | 350,100 | 6,707,916 |
|
| Express Scripts Holding Co. † | 239,800 | 14,992,296 |
|
| UnitedHealth Group, Inc. | 532,000 | 36,314,320 |
|
| | | 130,482,984 |
| Hotels, restaurants, and leisure (0.7%) | | |
| Carnival Corp. S | 522,200 | 18,094,230 |
|
| Marriott International, Inc. Class A | 359,000 | 16,183,720 |
|
| | | 34,277,950 |
| Household durables (0.7%) | | |
| PulteGroup, Inc. | 933,600 | 16,478,040 |
|
| Whirlpool Corp. | 138,300 | 20,193,183 |
|
| | | 36,671,223 |
| Household products (0.4%) | | |
| Procter & Gamble Co. (The) | 281,900 | 22,763,425 |
|
| | | 22,763,425 |
|
| 28 The Putnam Fund for Growth and Income |
| | |
| COMMON STOCKS (97.4%)* cont. | Shares | Value |
|
| Independent power producers and energy traders (1.1%) | | |
| Calpine Corp. † | 1,757,517 | $35,449,118 |
|
| NRG Energy, Inc. S | 878,200 | 25,055,046 |
|
| | | 60,504,164 |
| Industrial conglomerates (1.7%) | | |
| General Electric Co. | 1,811,620 | 47,355,747 |
|
| Siemens AG (Germany) | 337,331 | 43,170,581 |
|
| | | 90,526,328 |
| Insurance (5.8%) | | |
| ACE, Ltd. | 197,000 | 18,801,680 |
|
| Allstate Corp. (The) | 300,800 | 15,960,448 |
|
| American International Group, Inc. | 1,148,225 | 59,305,821 |
|
| Assured Guaranty, Ltd. | 590,980 | 12,115,090 |
|
| Chubb Corp. (The) | 87,275 | 8,036,282 |
|
| Everest Re Group, Ltd. | 56,020 | 8,612,515 |
|
| Hartford Financial Services Group, Inc. (The) | 1,174,600 | 39,584,020 |
|
| Lincoln National Corp. S | 606,400 | 27,536,624 |
|
| MetLife, Inc. | 1,564,987 | 74,039,535 |
|
| Prudential Financial, Inc. | 244,900 | 19,932,411 |
|
| Prudential PLC (United Kingdom) | 984,988 | 20,151,704 |
|
| | | 304,076,130 |
| Internet and catalog retail (0.1%) | | |
| Bigfoot GmbH (acquired 8/2/13, cost $2,571,898) (Private) | | |
| (Brazil) FΔΔ† | 117 | 1,971,467 |
|
| Zalando GmbH (acquired 9/30/13, cost $5,246,296) (Private) | | |
| (Germany) FΔΔ† | 117 | 4,475,499 |
|
| | | 6,446,966 |
| Internet software and services (0.5%) | | |
| Google, Inc. Class A † | 11,791 | 12,151,569 |
|
| Yahoo!, Inc. † | 452,000 | 14,884,360 |
|
| | | 27,035,929 |
| IT Services (0.4%) | | |
| Computer Sciences Corp. | 307,500 | 15,147,450 |
|
| Fidelity National Information Services, Inc. | 150,500 | 7,336,875 |
|
| | | 22,484,325 |
| Machinery (1.2%) | | |
| AGCO Corp. | 136,900 | 7,992,222 |
|
| Ingersoll-Rand PLC | 316,200 | 21,352,986 |
|
| Joy Global, Inc. S | 436,600 | 24,777,050 |
|
| Stanley Black & Decker, Inc. | 87,800 | 6,944,102 |
|
| TriMas Corp. † | 94,931 | 3,594,088 |
|
| | | 64,660,448 |
| Marine (0.1%) | | |
| Kirby Corp. † | 89,700 | 7,937,553 |
|
| | | 7,937,553 |
| Media (4.1%) | | |
| CBS Corp. Class B | 839,000 | 49,618,460 |
|
| Comcast Corp. Class A | 563,800 | 26,825,604 |
|
| DISH Network Corp. Class A | 409,800 | 19,752,360 |
|
| Liberty Global PLC Ser. C (United Kingdom) † | 304,400 | 22,787,384 |
|
| Time Warner Cable, Inc. | 117,680 | 14,139,252 |
|
| Time Warner, Inc. | 348,400 | 23,949,016 |
|
| Viacom, Inc. Class B | 444,100 | 36,989,089 |
|
|
| The Putnam Fund for Growth and Income 29 |
| | |
| COMMON STOCKS (97.4%)* cont. | Shares | Value |
|
| Media cont. | | |
| Walt Disney Co. (The) S | 158,400 | $10,864,656 |
|
| WPP PLC (United Kingdom) | 415,230 | 8,852,312 |
|
| | | 213,778,133 |
| Metals and mining (1.3%) | | |
| Barrick Gold Corp. (Canada) | 781,500 | 15,153,285 |
|
| Freeport-McMoRan Copper & Gold, Inc. (Indonesia) | 851,238 | 31,291,509 |
|
| Goldcorp, Inc. (Canada) | 168,700 | 4,290,041 |
|
| Newmont Mining Corp. | 106,000 | 2,889,560 |
|
| Nucor Corp. S | 266,000 | 13,770,820 |
|
| | | 67,395,215 |
| Multi-utilities (1.0%) | | |
| Ameren Corp. | 437,600 | 15,832,368 |
|
| CMS Energy Corp. S | 271,100 | 7,444,406 |
|
| National Grid PLC (United Kingdom) | 812,784 | 10,240,424 |
|
| PG&E Corp. | 413,400 | 17,300,790 |
|
| | | 50,817,988 |
| Multiline retail (1.0%) | | |
| Macy’s, Inc. | 662,300 | 30,538,653 |
|
| Target Corp. | 335,100 | 21,711,129 |
|
| | | 52,249,782 |
| Office electronics (0.2%) | | |
| Xerox Corp. | 1,227,600 | 12,202,344 |
|
| | | 12,202,344 |
| Oil, gas, and consumable fuels (11.5%) | | |
| Anadarko Petroleum Corp. | 379,300 | 36,143,497 |
|
| Cabot Oil & Gas Corp. | 800,900 | 28,287,788 |
|
| Cameco Corp. (Canada) | 354,700 | 6,732,377 |
|
| Chevron Corp. | 741,500 | 88,950,340 |
|
| CONSOL Energy, Inc. | 210,400 | 7,679,600 |
|
| EnCana Corp. (Canada) | 434,300 | 7,780,870 |
|
| Energen Corp. | 95,500 | 7,479,560 |
|
| Energy Transfer Equity L.P. | 243,100 | 16,431,129 |
|
| Exxon Mobil Corp. | 899,192 | 80,585,587 |
|
| Gulfport Energy Corp. † | 251,800 | 14,778,140 |
|
| HRT Participacoes em Petroleo SA (Brazil) † | 1,107,000 | 326,141 |
|
| Kodiak Oil & Gas Corp. † | 1,226,800 | 15,911,596 |
|
| Marathon Oil Corp. | 1,684,800 | 59,406,048 |
|
| Nordic American Tankers, Ltd. (Norway) S | 870,800 | 7,105,728 |
|
| Occidental Petroleum Corp. | 497,314 | 47,781,929 |
|
| QEP Resources, Inc. | 1,124,400 | 37,172,664 |
|
| Royal Dutch Shell PLC ADR (United Kingdom) | 1,473,670 | 98,234,842 |
|
| Southwestern Energy Co. † | 415,700 | 15,472,354 |
|
| Suncor Energy, Inc. (Canada) | 864,210 | 31,405,473 |
|
| | | 607,665,663 |
| Paper and forest products (0.5%) | | |
| International Paper Co. | 544,000 | 24,267,840 |
|
| | | 24,267,840 |
| Personal products (0.5%) | | |
| Coty, Inc. Class A | 1,689,145 | 25,979,050 |
|
| | | 25,979,050 |
|
| 30 The Putnam Fund for Growth and Income |
| | |
| COMMON STOCKS (97.4%)* cont. | Shares | Value |
|
| Pharmaceuticals (8.6%) | | |
| AbbVie, Inc. | 443,900 | $21,506,955 |
|
| Actavis PLC † | 169,700 | 26,232,226 |
|
| AstraZeneca PLC ADR (United Kingdom) S | 888,500 | 46,966,110 |
|
| Eli Lilly & Co. | 636,700 | 31,720,394 |
|
| Johnson & Johnson | 877,100 | 81,228,231 |
|
| Merck & Co., Inc. | 1,560,991 | 70,385,084 |
|
| Pfizer, Inc. | 2,922,634 | 89,666,411 |
|
| Sanofi ADR (France) S | 563,400 | 30,130,632 |
|
| Shire PLC ADR (United Kingdom) | 130,700 | 17,396,170 |
|
| Teva Pharmaceutical Industries, Ltd. ADR (Israel) S | 285,900 | 10,604,031 |
|
| Zoetis, Inc. | 813,938 | 25,769,277 |
|
| | | 451,605,521 |
| Real estate investment trusts (REITs) (0.6%) | | |
| American Homes 4 Rent Class A † | 322,800 | 4,996,944 |
|
| American Tower Corp. | 242,900 | 19,274,115 |
|
| Equity Lifestyle Properties, Inc. | 222,500 | 8,452,775 |
|
| | | 32,723,834 |
| Semiconductors and semiconductor equipment (2.3%) | | |
| Fairchild Semiconductor International, Inc. † | 768,400 | 9,735,628 |
|
| Intel Corp. S | 909,500 | 22,219,085 |
|
| Lam Research Corp. † | 452,350 | 24,530,941 |
|
| Magnachip Semiconductor Corp. (South Korea) † | 508,700 | 9,507,603 |
|
| Maxim Integrated Products, Inc. | 266,500 | 7,915,050 |
|
| Micron Technology, Inc. † | 1,508,700 | 26,673,816 |
|
| Samsung Electronics Co., Ltd. (South Korea) | 13,833 | 19,104,733 |
|
| | | 119,686,856 |
| Software (1.2%) | | |
| Microsoft Corp. | 877,200 | 31,009,020 |
|
| Oracle Corp. | 941,300 | 31,533,550 |
|
| | | 62,542,570 |
| Specialty retail (2.3%) | | |
| American Eagle Outfitters, Inc. S | 614,100 | 9,512,409 |
|
| Bed Bath & Beyond, Inc. † S | 321,000 | 24,819,720 |
|
| Best Buy Co., Inc. | 185,600 | 7,943,680 |
|
| Home Depot, Inc. (The) | 339,500 | 26,443,655 |
|
| Lowe’s Cos., Inc. | 118,856 | 5,916,652 |
|
| Office Depot, Inc. † S | 6,120,600 | 34,214,154 |
|
| Select Comfort Corp. † S | 258,900 | 4,743,048 |
|
| WH Smith PLC (United Kingdom) S | 407,520 | 5,872,653 |
|
| | | 119,465,971 |
| Thrifts and mortgage finance (0.3%) | | |
| Radian Group, Inc. S | 969,900 | 14,131,443 |
|
| | | 14,131,443 |
| Tobacco (1.6%) | | |
| Altria Group, Inc. | 1,038,800 | 38,674,524 |
|
| Philip Morris International, Inc. | 484,300 | 43,160,816 |
|
| | | 81,835,340 |
| Trading companies and distributors (0.3%) | | |
| WESCO International, Inc. † S | 181,900 | 15,545,174 |
|
| | | 15,545,174 |
| |
| The Putnam Fund for Growth and Income | 31 |
| | |
| COMMON STOCKS (97.4%)* cont. | Shares | Value |
|
| Wireless telecommunication services (0.7%) | | |
| Vodafone Group PLC ADR (United Kingdom) | 983,200 | $36,201,424 |
|
| | | 36,201,424 |
| | | |
| Total common stocks (cost $4,238,124,395) | | $5,133,298,211 |
| | | | |
| WARRANTS (—%)*† | Expiration | Strike | | |
| | date | price | Warrants | Value |
|
| HRT Participacoes EM Petroleo | | | | |
| SA 144A (Brazil) | 4/4/16 | $0.00001 | 2,098,210 | $622,852 |
|
| Total warrants (cost $4,199,669) | | | | $622,852 |
| | |
| SHORT-TERM INVESTMENTS (9.6%)* | Principal amount/shares | Value |
|
| Putnam Cash Collateral Pool, LLC 0.15% d | 347,587,770 | $347,587,770 |
|
| Putnam Short Term Investment Fund 0.07% L | 156,499,916 | 156,499,916 |
|
| SSgA Prime Money Market Fund 0.02% P | 2,460,000 | 2,460,000 |
|
| U.S. Treasury Bills with an effective yield of 0.13%, May 29, 2014 | $1,141,000 | 1,140,553 |
|
| U.S. Treasury Bills with effective yields ranging from 0.10% | | |
| to 0.11%, April 3, 2014 | 958,000 | 957,766 |
|
| Total short-term investments (cost $508,645,399) | | $508,646,005 |
|
| |
| TOTAL INVESTMENTS | | |
|
| Total investments (cost $4,750,969,463) | | $5,642,567,068 |
Key to holding’s abbreviations
ADR American Depository Receipts: represents ownership of foreign securities on deposit with a custodian bank
Notes to the fund’s portfolio
Unless noted otherwise, the notes to the fund’s portfolio are for the close of the fund’s reporting period, which ran from November 1, 2012 through October 31, 2013 (the reporting period). Within the following notes to the portfolio, references to “ASC 820” represent Accounting Standards Codification 820 Fair Value Measurements and Disclosures and references to “OTC”, if any, represent over-the-counter.
* Percentages indicated are based on net assets of $5,271,089,568.
† Non-income-producing security.
ΔΔ Security is restricted with regard to public resale. The total market value of this security and any other restricted securities (excluding 144A securities), if any, held at the close of the reporting period was $6,446,966, or 0.1% of net assets.
d Affiliated company. See Note 1 to the financial statements regarding securities lending. The rate quoted in the security description is the annualized 7-day yield of the fund at the close of the reporting period.
F Is valued at fair value following procedures approved by the Trustees. Securities may be classified as Level 2 or Level 3 for ASC 820 based on the securities’ valuation inputs. At the close of the reporting period, fair value pricing was also used for certain foreign securities in the portfolio (Note 1).
L Affiliated company (Note 5). The rate quoted in the security description is the annualized 7-day yield of the fund at the close of the reporting period.
P Security was pledged, or purchased with cash that was pledged, to the fund for collateral on certain derivatives contracts. The rate quoted in the security description is the annualized 7-day yield of the fund at the close of the reporting period (Note 1).
S Security on loan, in part or in entirety, at the close of the reporting period (Note 1).
|
| 32 The Putnam Fund for Growth and Income |
UR At the reporting period end, 48,600 shares owned by the fund were not formally entered on the company’s shareholder register, due to local restrictions and foreign ownership. While the fund has full title to these unregistered shares, these shares do not carry voting rights and, until 2014, are not eligible for receipt of dividends.
144A after the name of an issuer represents securities exempt from registration under Rule 144A under the Securities Act of 1933, as amended. These securities may be resold in transactions exempt from registration, normally to qualified institutional buyers.
| | | | | | | |
| OTC TOTAL RETURN SWAP CONTRACTS OUTSTANDING at 10/31/13 | | |
| | | Upfront | | | Payments received | Total return | |
| Swap counterparty/ | premium | Termination | | (paid) by fund | received by | Unrealized |
| Notional amount | received (paid) | date | | per annum | or paid by fund | appreciation |
|
| Bank of America N.A. | | | | | | |
| | $67,134 | $— | 5/6/14 | | (3 month USD- | BofA MLTR GOLD | $200,981 |
| | | | | | LIBOR-BBA plus | Index | |
| | | | | | 0.48%) | | |
|
| | 59,546 | — | 5/6/14 | | (3 month USD- | BofA MLTR GOLD | 178,264 |
| | | | | | LIBOR-BBA plus | Index | |
| | | | | | 0.48%) | | |
|
| Deutsche Bank AG | | | | | | |
| baskets | 199,621 | — | 7/1/14 | | (3 month USD- | A basket | 986,982 |
| | | | | | LIBOR-BBA plus | (DBPTCABL) of | |
| | | | | | 0.35%) | common stocks | |
|
| Total | | $— | | | | | $1,366,227 |
| |
| The Putnam Fund for Growth and Income | 33 |
ASC 820 establishes a three-level hierarchy for disclosure of fair value measurements. The valuation hierarchy is based upon the transparency of inputs to the valuation of the fund’s investments. The three levels are defined as follows:
Level 1: Valuations based on quoted prices for identical securities in active markets.
Level 2: Valuations based on quoted prices in markets that are not active or for which all significant inputs are observable, either directly or indirectly.
Level 3: Valuations based on inputs that are unobservable and significant to the fair value measurement.
The following is a summary of the inputs used to value the fund’s net assets as of the close of the reporting period:
| | | |
| | Valuation inputs |
|
| Investments in securities: | Level 1 | Level 2 | Level 3 |
|
| Common stocks:* | | | |
|
| Consumer discretionary | $550,228,557 | $14,724,965 | $6,446,966 |
|
| Consumer staples | 335,129,679 | — | — |
|
| Energy | 771,549,817 | 12,374,583 | — |
|
| Financials | 1,140,709,911 | 43,343,341 | — |
|
| Health care | 692,381,223 | — | — |
|
| Industrials | 475,968,226 | 89,041,784 | — |
|
| Information technology | 466,876,944 | — | — |
|
| Materials | 266,743,010 | 8,241,592 | — |
|
| Telecommunication services | 63,214,228 | — | — |
|
| Utilities | 186,082,961 | 10,240,424 | — |
|
| Total common stocks | 4,948,884,556 | 177,966,689 | 6,446,966 |
| | | | |
| Warrants | — | 622,852 | — |
|
| Short-term investments | 158,959,916 | 349,686,089 | — |
|
| Totals by level | $5,107,844,472 | $528,275,630 | $6,446,966 |
| | | | |
| | Valuation inputs |
|
| Other financial instruments: | Level 1 | Level 2 | Level 3 |
|
| Total return swap contracts | $— | $1,366,227 | $— |
|
| Totals by level | $— | $1,366,227 | $— |
* Common stock classifications are presented at the sector level, which may differ from the fund’s portfolio presentation.
At the start and close of the reporting period, Level 3 investments in securities were not considered a significant portion of the fund’s portfolio.
The accompanying notes are an integral part of these financial statements.
|
| 34 The Putnam Fund for Growth and Income |
Statement of assets and liabilities 10/31/13
| |
| ASSETS | |
|
| Investment in securities, at value, including $322,150,167 of securities on loan (Note 1): | |
| Unaffiliated issuers (identified cost $4,246,881,777) | $5,138,479,382 |
| Affiliated issuers (identified cost $504,087,686) (Notes 1 and 5) | 504,087,686 |
|
| Foreign currency (cost $2) (Note 1) | 2 |
|
| Dividends, interest and other receivables | 4,557,696 |
|
| Receivable for shares of the fund sold | 733,422 |
|
| Receivable for investments sold | 67,299,119 |
|
| Unrealized appreciation on OTC swap contracts (Note 1) | 1,366,227 |
|
| Total assets | 5,716,523,534 |
| | |
| LIABILITIES | |
|
| Payable to custodian | 1,909,323 |
|
| Payable for investments purchased | 82,879,315 |
|
| Payable for shares of the fund repurchased | 2,555,323 |
|
| Payable for compensation of Manager (Note 2) | 2,108,663 |
|
| Payable for investor servicing fees (Note 2) | 1,994,970 |
|
| Payable for custodian fees (Note 2) | 29,908 |
|
| Payable for Trustee compensation and expenses (Note 2) | 2,082,152 |
|
| Payable for administrative services (Note 2) | 18,852 |
|
| Payable for distribution fees (Note 2) | 1,198,885 |
|
| Collateral on securities loaned, at value (Note 1) | 347,587,770 |
|
| Collateral on certain derivative contracts, at value (Note 1) | 2,460,000 |
|
| Other accrued expenses | 608,805 |
|
| Total liabilities | 445,433,966 |
| |
| Net assets | $5,271,089,568 |
|
| |
| REPRESENTED BY | |
|
| Paid-in capital (Unlimited shares authorized) (Notes 1 and 4) | $5,524,492,713 |
|
| Undistributed net investment income (Note 1) | 4,033,168 |
|
| Accumulated net realized loss on investments and foreign currency transactions (Note 1) | (1,150,399,946) |
|
| Net unrealized appreciation of investments and assets and liabilities in foreign currencies | 892,963,633 |
|
| Total — Representing net assets applicable to capital shares outstanding | $5,271,089,568 |
| | |
| COMPUTATION OF NET ASSET VALUE AND OFFERING PRICE | |
|
| Net asset value and redemption price per class A share | |
| ($5,024,360,947 divided by 266,296,532 shares) | $18.87 |
|
| Offering price per class A share (100/94.25 of $18.87)* | $20.02 |
|
| Net asset value and offering price per class B share ($95,271,547 divided by 5,142,953 shares)** | $18.52 |
|
| Net asset value and offering price per class C share ($48,304,182 divided by 2,571,816 shares)** | $18.78 |
|
| Net asset value and redemption price per class M share ($36,125,127 divided by 1,930,984 shares) | $18.71 |
|
| Offering price per class M share (100/96.50 of $18.71)* | $19.39 |
|
| Net asset value, offering price and redemption price per class R share | |
| ($4,082,225 divided by 217,534 shares) | $18.77 |
|
| Net asset value, offering price and redemption price per class R5 share | |
| ($14,187 divided by 749 shares)† | $18.93 |
|
| Net asset value, offering price and redemption price per class R6 share | |
| ($18,292,585 divided by 966,656 shares) | $18.92 |
|
| Net asset value, offering price and redemption price per class Y share | |
| ($44,638,768 divided by 2,360,297 shares) | $18.91 |
|
* On single retail sales of less than $50,000. On sales of $50,000 or more the offering price is reduced.
** Redemption price per share is equal to net asset value less any applicable contingent deferred sales charge.
† Net asset value may not recalculate due to rounding of fractional shares.
The accompanying notes are an integral part of these financial statements.
| |
| The Putnam Fund for Growth and Income | 35 |
Statement of operations Year ended 10/31/13
| |
| INVESTMENT INCOME | |
|
| Dividends (net of foreign tax of $884,866) | $113,177,994 |
|
| Interest (including interest income of $67,393 from investments in affiliated issuers) (Note 5) | 71,633 |
|
| Securities lending (Note 1) | 1,728,642 |
|
| Total investment income | 114,978,269 |
| |
| EXPENSES | |
|
| Compensation of Manager (Note 2) | 23,381,751 |
|
| Investor servicing fees (Note 2) | 13,022,534 |
|
| Custodian fees (Note 2) | 78,075 |
|
| Trustee compensation and expenses (Note 2) | 434,194 |
|
| Distribution fees (Note 2) | 13,202,472 |
|
| Administrative services (Note 2) | 138,464 |
|
| Other | 1,289,060 |
|
| Total expenses | 51,546,550 |
| | |
| Expense reduction (Note 2) | (281,388) |
|
| Net expenses | 51,265,162 |
| | |
| Net investment income | 63,713,107 |
|
| |
| Net realized gain on investments (Notes 1 and 3) | 715,925,331 |
|
| Net realized gain on swap contracts (Note 1) | 1,690,583 |
|
| Net realized loss on foreign currency transactions (Note 1) | (23,527) |
|
| Net unrealized depreciation of assets and liabilities in foreign currencies during the year | (1,777) |
|
| Net unrealized appreciation of investments and swap contracts during the year | 557,096,147 |
|
| Net gain on investments | 1,274,686,757 |
| | |
| Net increase in net assets resulting from operations | $1,338,399,864 |
|
The accompanying notes are an integral part of these financial statements.
|
| 36 The Putnam Fund for Growth and Income |
Statement of changes in net assets
| | |
| INCREASE IN NET ASSETS | Year ended 10/31/13 | Year ended 10/31/12 |
|
| Operations: | | |
| Net investment income | $63,713,107 | $68,325,237 |
|
| Net realized gain on investments | | |
| and foreign currency transactions | 717,592,387 | 346,486,184 |
|
| Net unrealized appreciation of investments and assets | | |
| and liabilities in foreign currencies | 557,094,370 | 213,748,319 |
|
| Net increase in net assets resulting from operations | 1,338,399,864 | 628,559,740 |
|
| Distributions to shareholders (Note 1): | | |
| From ordinary income | | |
| Net investment income | | |
|
| Class A | (65,083,848) | (68,349,542) |
|
| Class B | (643,626) | (904,433) |
|
| Class C | (286,353) | (325,159) |
|
| Class M | (311,377) | (367,758) |
|
| Class R | (40,373) | (45,998) |
|
| Class R5 | (217) | (42) |
|
| Class R6 | (132,226) | (43) |
|
| Class Y | (786,661) | (797,314) |
|
| Decrease from capital share transactions (Note 4) | (442,555,982) | (517,267,352) |
|
| Total increase in net assets | 828,559,201 | 40,502,099 |
| |
| NET ASSETS | | |
|
| Beginning of year | 4,442,530,367 | 4,402,028,268 |
|
| End of year (including undistributed net investment income | | |
| of $4,033,168 and $8,605,001, respectively) | $5,271,089,568 | $4,442,530,367 |
|
The accompanying notes are an integral part of these financial statements.
| |
| The Putnam Fund for Growth and Income | 37 |
Financial highlights (For a common share outstanding throughout the period)
| | | | | | | | | | | | | | | | |
| INVESTMENT OPERATIONS: | | | | LESS DISTRIBUTIONS: | | | | | | | RATIOS AND SUPPLEMENTAL DATA: | |
|
| | | | | | | | | | | | | | | | Ratio | |
| | Net asset | Net | Net realized | | From | From | | | | | | | | Ratio | of net investment | |
| | value, | investment | and unrealized | Total from | net | net realized | From | | | | | | Net assets, | of expenses | income (loss) | |
| | beginning | income | gain (loss) | investment | investment | gain | return | Total | Redemption | Non-recurring | Net asset value, | Total return at net | end of period | to average | to average | Portfolio |
| Period ended | of period | (loss) a | on investments | operations | income | on investments | of capital | distributions | fees | reimbursements | end of period | asset value (%) b | (in thousands) | net assets (%) c | net assets (%) | turnover (%) |
|
| Class A | | | | | | | | | | | | | | | | |
| October 31, 2013 | $14.51 | .22 | 4.37 | 4.59 | (.23) | — | — | (.23) | — | — | $18.87 | 31.93 | $5,024,361 | 1.04 | 1.33 | 52 |
| October 31, 2012 | 12.79 | .21 | 1.73 | 1.94 | (.22) | — | — | (.22) | — | — | 14.51 | 15.33 | 4,232,973 | 1.10 | 1.57 | 34 |
| October 31, 2011 | 12.56 | .16 | .21 | .37 | (.15) | — | — | (.15) | — | .01 d | 12.79 | 2.99 | 4,176,494 | 1.10 | 1.17 | 45 |
| October 31, 2010 | 11.15 | .12 | 1.40 | 1.52 | (.11) | — | — | (.11) | — e | — | 12.56 | 13.65 | 4,607,805 | 1.16 | .99 | 48 |
| October 31, 2009 | 10.09 | .15 | 1.11 f,g | 1.26 | (.20) | — | — e | (.20) | — e | — e,h | 11.15 | 12.99 f,g | 4,631,517 | 1.21 i | 1.52 i | 57 |
|
| Class B | | | | | | | | | | | | | | | | |
| October 31, 2013 | $14.25 | .10 | 4.28 | 4.38 | (.11) | — | — | (.11) | — | — | $18.52 | 30.89 | $95,272 | 1.79 | .60 | 52 |
| October 31, 2012 | 12.56 | .11 | 1.70 | 1.81 | (.12) | — | — | (.12) | — | — | 14.25 | 14.50 | 91,289 | 1.85 | .84 | 34 |
| October 31, 2011 | 12.34 | .06 | .19 | .25 | (.04) | — | — | (.04) | — | .01 d | 12.56 | 2.14 | 108,621 | 1.85 | .41 | 45 |
| October 31, 2010 | 10.95 | .03 | 1.38 | 1.41 | (.02) | — | — | (.02) | — e | — | 12.34 | 12.85 | 159,231 | 1.91 | .27 | 48 |
| October 31, 2009 | 9.91 | .08 | 1.09 f,g | 1.17 | (.13) | — | — e | (.13) | — e | — e,h | 10.95 | 12.11 f,g | 226,198 | 1.96 i | .85 i | 57 |
|
| Class C | | | | | | | | | | | | | | | | |
| October 31, 2013 | $14.45 | .09 | 4.35 | 4.44 | (.11) | — | — | (.11) | — | — | $18.78 | 30.91 | $48,304 | 1.79 | .56 | 52 |
| October 31, 2012 | 12.74 | .11 | 1.72 | 1.83 | (.12) | — | — | (.12) | — | — | 14.45 | 14.46 | 36,561 | 1.85 | .82 | 34 |
| October 31, 2011 | 12.51 | .06 | .21 | .27 | (.05) | — | — | (.05) | — | .01 d | 12.74 | 2.21 | 36,035 | 1.85 | .42 | 45 |
| October 31, 2010 | 11.10 | .03 | 1.40 | 1.43 | (.02) | — | — | (.02) | — e | — | 12.51 | 12.88 | 37,264 | 1.91 | .24 | 48 |
| October 31, 2009 | 10.05 | .07 | 1.11 f,g | 1.18 | (.13) | — | — e | (.13) | — e | — e,h | 11.10 | 12.07 f,g | 37,309 | 1.96 i | .76 i | 57 |
|
| Class M | | | | | | | | | | | | | | | | |
| October 31, 2013 | $14.39 | .14 | 4.33 | 4.47 | (.15) | — | — | (.15) | — | — | $18.71 | 31.29 | $36,125 | 1.54 | .83 | 52 |
| October 31, 2012 | 12.69 | .15 | 1.70 | 1.85 | (.15) | — | — | (.15) | — | — | 14.39 | 14.72 | 30,627 | 1.60 | 1.08 | 34 |
| October 31, 2011 | 12.46 | .09 | .21 | .30 | (.08) | — | — | (.08) | — | .01 d | 12.69 | 2.48 | 33,357 | 1.60 | .67 | 45 |
| October 31, 2010 | 11.06 | .06 | 1.39 | 1.45 | (.05) | — | — | (.05) | — e | — | 12.46 | 13.09 | 38,209 | 1.66 | .49 | 48 |
| October 31, 2009 | 10.01 | .10 | 1.10 f,g | 1.20 | (.15) | — | — e | (.15) | — e | — e,h | 11.06 | 12.40 f,g | 39,681 | 1.71 i | 1.00 i | 57 |
|
| Class R | | | | | | | | | | | | | | | | |
| October 31, 2013 | $14.43 | .18 | 4.35 | 4.53 | (.19) | — | — | (.19) | — | — | $18.77 | 31.63 | $4,082 | 1.29 | 1.09 | 52 |
| October 31, 2012 | 12.72 | .18 | 1.72 | 1.90 | (.19) | — | — | (.19) | — | — | 14.43 | 15.06 | 3,446 | 1.35 | 1.31 | 34 |
| October 31, 2011 | 12.50 | .12 | .20 | .32 | (.11) | — | — | (.11) | — | .01 d | 12.72 | 2.65 | 3,151 | 1.35 | .92 | 45 |
| October 31, 2010 | 11.09 | .09 | 1.40 | 1.49 | (.08) | — | — | (.08) | — e | — | 12.50 | 13.45 | 3,554 | 1.41 | .74 | 48 |
| October 31, 2009 | 10.04 | .12 | 1.11 f,g | 1.23 | (.18) | — | — e | (.18) | — e | — e,h | 11.09 | 12.69 f,g | 3,579 | 1.46 i | 1.21 i | 57 |
|
| Class R5 | | | | | | | | | | | | | | | | |
| October 31, 2013 | $14.54 | .29 | 4.39 | 4.68 | (.29) | — | — | (.29) | — | — | $18.93 | 32.55 | $14 | .67 | 1.68 | 52 |
| October 31, 2012† | 13.64 | .08 | .88 | .96 | (.06) | — | — | (.06) | — | — | 14.54 | 7.01* | 11 | .22* | .53* | 34 |
|
| Class R6 | | | | | | | | | | | | | | | | |
| October 31, 2013 | $14.54 | .27 | 4.42 | 4.69 | (.31) | — | — | (.31) | — | — | $18.92 | 32.62 | $18,293 | .57 | 1.49 | 52 |
| October 31, 2012† | 13.64 | .08 | .88 | .96 | (.06) | — | — | (.06) | — | — | 14.54 | 7.02* | 11 | .19* | .57* | 34 |
|
| Class Y | | | | | | | | | | | | | | | | |
| October 31, 2013 | $14.54 | .27 | 4.37 | 4.64 | (.27) | — | — | (.27) | — | — | $18.91 | 32.26 | $44,639 | .79 | 1.63 | 52 |
| October 31, 2012 | 12.82 | .25 | 1.72 | 1.97 | (.25) | — | — | (.25) | — | — | 14.54 | 15.59 | 47,613 | .85 | 1.82 | 34 |
| October 31, 2011 | 12.59 | .20 | .20 | .40 | (.18) | — | — | (.18) | — | .01 d | 12.82 | 3.26 | 44,370 | .85 | 1.45 | 45 |
| October 31, 2010 | 11.17 | .15 | 1.41 | 1.56 | (.14) | — | — | (.14) | — e | — | 12.59 | 13.99 | 74,376 | .91 | 1.24 | 48 |
| October 31, 2009 | 10.12 | .20 | 1.08 f,g | 1.28 | (.23) | — | — e | (.23) | — e | — e,h | 11.17 | 13.15 f,g | 79,716 | .96 i | 2.37 i | 57 |
|
See notes to financial highlights at the end of this section.
The accompanying notes are an integral part of these financial statements.
| |
| 38 The Putnam Fund for Growth and Income | The Putnam Fund for Growth and Income 39 |
Financial highlights (Continued)
* Not annualized.
† For the period July 3, 2012 (commencement of operations) to October 31, 2012.
a Per share net investment income (loss) has been determined on the basis of the weighted average number of shares outstanding during the period.
b Total return assumes dividend reinvestment and does not reflect the effect of sales charges.
c Includes amounts paid through expense offset and brokerage/service arrangements (Note 2).
d Reflects a non-recurring reimbursement related to restitution amounts in connection with a distribution plan approved by the Securities and Exchange Commission (the SEC) which amounted to $0.01 per share outstanding on July 21, 2011. Also reflects a non-recurring reimbursement related to short-term trading related lawsuits, which amounted to less than $0.01 per share outstanding on May 11, 2011.
e Amount represents less than $0.01 per share.
f Reflects a non-recurring litigation payment received by the fund from Enron Corporation which amounted to $0.05 per share outstanding on December 29, 2008. This payment resulted in an increase to total returns of 0.51% for the year ended October 31, 2009.
g Reflects a non-recurring litigation payment received by the fund from Tyco International, Ltd. which amounted to $0.07 per share outstanding on March 13, 2009. This payment resulted in an increase to total returns of 0.71% for the year ended October 31, 2009.
h Reflects a non-recurring reimbursement pursuant to a settlement between the SEC and Bear Stearns & Co., Inc. and Bear Stearns Securities Corp., which amounted to less than $0.01 per share outstanding as of May 21, 2009.
i Reflects an involuntary contractual expense limitation in effect during the period. As a result of such limitation the expenses of each class reflect a reduction of 0.02% of average net assets as of October 31, 2009.
The accompanying notes are an integral part of these financial statements.
Notes to financial statements 10/31/13
Within the following Notes to financial statements, references to “State Street” represent State Street Bank and Trust Company, references to “the SEC” represent the Securities and Exchange Commission, references to “Putnam Management” represent Putnam Investment Management, LLC, the fund’s manager, an indirect wholly-owned subsidiary of Putnam Investments, LLC and references to “OTC”, if any, represent over-the-counter. Unless otherwise noted, the “reporting period” represents the period from November 1, 2012 through October 31, 2013.
The Putnam Fund for Growth and Income (the fund) is a Massachusetts business trust, which is registered under the Investment Company Act of 1940, as amended, as a diversified open-end management investment company. The investment objective of the fund is to seek capital growth and current income by investing mainly in common stocks of large U.S. companies, with a focus on value stocks that offer the potential for capital growth, current income, or both. Value stocks are issued by companies that Putnam Management believes are currently undervalued by the market.
The fund offers class A, class B, class C, class M, class R, class R5, class R6 and class Y shares. Class A and class M shares are sold with a maximum front-end sales charge of 5.75% and 3.50%, respectively, and generally do not pay a contingent deferred sales charge. Class B shares, which convert to class A shares after approximately eight years, do not pay a front-end sales charge and are subject to a contingent deferred sales charge if those shares are redeemed within six years of purchase. Class C shares have a one-year 1.00% contingent deferred sales charge and do not convert to class A shares. Class R shares, which are not available to all investors, are sold at net asset value. The expenses for class A, class B, class C, class M and class R shares may differ based on the distribution fee of each class, which is identified in Note 2. Class R5, class R6 and class Y shares, which are sold at net asset value, are generally subject to the same expenses as class A, class B, class C, class M and class R shares, but do not bear a distribution fee and in the case of class R5 and class R6 shares, bear a lower investor servicing fee, which is identified in Note 2. Class R5, class R6 and class Y shares are not available to all investors.
|
| 40 The Putnam Fund for Growth and Income |
In the normal course of business, the fund enters into contracts that may include agreements to indemnify another party under given circumstances. The fund’s maximum exposure under these arrangements is unknown as this would involve future claims that may be, but have not yet been, made against the fund. However, the fund’s management team expects the risk of material loss to be remote.
Note 1: Significant accounting policies
The following is a summary of significant accounting policies consistently followed by the fund in the preparation of its financial statements. The preparation of financial statements is in conformity with accounting principles generally accepted in the United States of America and requires management to make estimates and assumptions that affect the reported amounts of assets and liabilities in the financial statements and the reported amounts of increases and decreases in net assets from operations. Actual results could differ from those estimates. Subsequent events after the Statement of assets and liabilities date through the date that the financial statements were issued have been evaluated in the preparation of the financial statements.
Investment income, realized and unrealized gains and losses and expenses of the fund are borne pro-rata based on the relative net assets of each class to the total net assets of the fund, except that each class bears expenses unique to that class (including the distribution fees applicable to such classes). Each class votes as a class only with respect to its own distribution plan or other matters on which a class vote is required by law or determined by the Trustees. If the fund were liquidated, shares of each class would receive their pro-rata share of the net assets of the fund. In addition, the Trustees declare separate dividends on each class of shares.
Security valuation Investments for which market quotations are readily available are valued at the last reported sales price on their principal exchange, or official closing price for certain markets, and are classified as Level 1 securities under Accounting Standards Codification 820 Fair Value Measurements and Disclosures (ASC 820). If no sales are reported, as in the case of some securities that are traded OTC, a security is valued at its last reported bid price and is generally categorized as a Level 2 security.
Investments in open-end investment companies (excluding exchange traded funds), if any, which can be classified as Level 1 or Level 2 securities, are valued based on their net asset value. The net asset value of such investment companies equals the total value of their assets less their liabilities and divided by the number of their outstanding shares.
Many securities markets and exchanges outside the U.S. close prior to the close of the New York Stock Exchange and therefore the closing prices for securities in such markets or on such exchanges may not fully reflect events that occur after such close but before the close of the New York Stock Exchange. Accordingly, on certain days, the fund will fair value foreign equity securities taking into account multiple factors including movements in the U.S. securities markets, currency valuations and comparisons to the valuation of American Depository Receipts, exchange-traded funds and futures contracts. These securities, which would generally be classified as Level 1 securities, will be transferred to Level 2 of the fair value hierarchy when they are valued at fair value. The number of days on which fair value prices will be used will depend on market activity and it is possible that fair value prices will be used by the fund to a significant extent. At the close of the reporting period, fair value pricing was used for certain foreign securities in the portfolio. Securities quoted in foreign currencies, if any, are translated into U.S. dollars at the current exchange rate.
To the extent a pricing service or dealer is unable to value a security or provides a valuation that Putnam Management does not believe accurately reflects the security’s fair value, the security will be valued at fair value by Putnam Management in accordance with policies and procedures approved by the Trustees. Certain investments, including certain restricted and illiquid securities and derivatives, are also valued at fair value following procedures approved by the Trustees. These valuations consider such factors as significant market or specific security events such as interest rate or credit quality changes, various relationships with other securities, discount rates, U.S. Treasury, U.S. swap and credit yields, index levels, convexity exposures and recovery rates. These securities are classified as Level 2 or as Level 3 depending on the priority of the significant inputs.
Such valuations and procedures are reviewed periodically by the Trustees. The fair value of securities is generally determined as the amount that the fund could reasonably expect to realize from an orderly disposition of such securities over a reasonable period of time. By its nature, a fair value price is a good faith estimate of the value of a security in a current sale and does not reflect an actual market price, which may be different by a material amount.
Security transactions and related investment income Security transactions are recorded on the trade date (the date the order to buy or sell is executed). Gains or losses on securities sold are determined on the identified cost basis.
| |
| The Putnam Fund for Growth and Income | 41 |
Interest income, net of any applicable withholding taxes, is recorded on the accrual basis. Dividend income, net of any applicable withholding taxes, is recognized on the ex-dividend date except that certain dividends from foreign securities, if any, are recognized as soon as the fund is informed of the ex-dividend date. Non-cash dividends, if any, are recorded at the fair market value of the securities received. Dividends representing a return of capital or capital gains, if any, are reflected as a reduction of cost and/or as a realized gain.
Foreign currency translation The accounting records of the fund are maintained in U.S. dollars. The market value of foreign securities, currency holdings, and other assets and liabilities is recorded in the books and records of the fund after translation to U.S. dollars based on the exchange rates on that day. The cost of each security is determined using historical exchange rates. Income and withholding taxes are translated at prevailing exchange rates when earned or incurred. The fund does not isolate that portion of realized or unrealized gains or losses resulting from changes in the foreign exchange rate on investments from fluctuations arising from changes in the market prices of the securities. Such gains and losses are included with the net realized and unrealized gain or loss on investments. Net realized gains and losses on foreign currency transactions represent net realized exchange gains or losses on closed forward currency contracts, disposition of foreign currencies, currency gains and losses realized between the trade and settlement dates on securities transactions and the difference between the amount of investment income and foreign withholding taxes recorded on the fund’s books and the U.S. dollar equivalent amounts actually received or paid. Net unrealized appreciation and depreciation of assets and liabilities in foreign currencies arise from changes in the value of open forward currency contracts and assets and liabilities other than investments at the period end, resulting from changes in the exchange rate.
Total return swap contracts The fund entered into OTC total return swap contracts, which are arrangements to exchange a market linked return for a periodic payment, both based on a notional principal amount, to hedge risk in a security it owns.
To the extent that the total return of the security, index or other financial measure underlying the transaction exceeds or falls short of the offsetting interest rate obligation, the fund will receive a payment from or make a payment to the counterparty. OTC total return swap contracts are marked to market daily based upon quotations from an independent pricing service or market makers and the change, if any, is recorded as an unrealized gain or loss. Payments received or made are recorded as realized gains or losses. Certain OTC total return swap contracts may include extended effective dates. Payments related to these swap contracts are accrued based on the terms of the contract. The fund could be exposed to credit or market risk due to unfavorable changes in the fluctuation of interest rates or in the price of the underlying security or index, the possibility that there is no liquid market for these agreements or that the counterparty may default on its obligation to perform. The fund’s maximum risk of loss from counterparty risk is the fair value of the contract. This risk may be mitigated by having a master netting arrangement between the fund and the counterparty. Risk of loss may exceed amounts recognized on the Statement of assets and liabilities.
OTC total return swap contracts outstanding, including their respective notional amounts at period end, if any, are listed after the fund’s portfolio.
Master agreements The fund is a party to ISDA (International Swaps and Derivatives Association, Inc.) Master Agreements (Master Agreements) with certain counterparties that govern OTC derivative and foreign exchange contracts entered into from time to time. The Master Agreements may contain provisions regarding, among other things, the parties’ general obligations, representations, agreements, collateral requirements, events of default and early termination. With respect to certain counterparties, in accordance with the terms of the Master Agreements, collateral posted to the fund is held in a segregated account by the fund’s custodian and with respect to those amounts which can be sold or repledged, are presented in the fund’s portfolio.
Collateral pledged by the fund is segregated by the fund’s custodian and identified in the fund’s portfolio. Collateral can be in the form of cash or debt securities issued by the U.S. Government or related agencies or other securities as agreed to by the fund and the applicable counterparty. Collateral requirements are determined based on the fund’s net position with each counterparty.
Termination events applicable to the fund may occur upon a decline in the fund’s net assets below a specified threshold over a certain period of time. Termination events applicable to counterparties may occur upon a decline in the counterparty’s long-term and short-term credit ratings below a specified level. In each case, upon occurrence, the other party may elect to terminate early and cause settlement of all derivative and foreign exchange contracts outstanding, including the payment of any losses and costs resulting from such early termination, as reasonably determined by the terminating party. Any decision by one or more of the fund’s counterparties to elect early termination could impact the fund’s future derivative activity.
|
| 42 The Putnam Fund for Growth and Income |
At the close of the reporting period, the fund did not have a net liability position on open derivative contracts subject to the Master Agreements.
Securities lending The fund may lend securities, through its agent, to qualified borrowers in order to earn additional income. The loans are collateralized by cash in an amount at least equal to the market value of the securities loaned. The market value of securities loaned is determined daily and any additional required collateral is allocated to the fund on the next business day. The risk of borrower default will be borne by the fund’s agent; the fund will bear the risk of loss with respect to the investment of the cash collateral. Income from securities lending is included in investment income on the Statement of operations. Cash collateral is invested in Putnam Cash Collateral Pool, LLC, a limited liability company managed by an affiliate of Putnam Management. Investments in Putnam Cash Collateral Pool, LLC are valued at its closing net asset value each business day. There are no management fees charged to Putnam Cash Collateral Pool, LLC. At the close of the reporting period, the value of securities loaned amounted to $338,206,192. Certain of these securities were sold prior to the close of the reporting period and are included in Receivable for investments sold on the Statement of assets and liabilities. The fund received cash collateral of $347,587,770.
Interfund lending The fund, along with other Putnam funds, may participate in an interfund lending program pursuant to an exemptive order issued by the SEC. This program allows the fund to borrow from or lend to other Putnam funds that permit such transactions. Interfund lending transactions are subject to each fund’s investment policies and borrowing and lending limits. Interest earned or paid on the interfund lending transaction will be based on the average of certain current market rates. During the reporting period, the fund did not utilize the program.
Line of credit The fund participates, along with other Putnam funds, in a $315 million unsecured committed line of credit and a $185 million unsecured uncommitted line of credit, both provided by State Street. Borrowings may be made for temporary or emergency purposes, including the funding of shareholder redemption requests and trade settlements. Interest is charged to the fund based on the fund’s borrowing at a rate equal to the Federal Funds rate plus 1.25% for the committed line of credit and the Federal Funds rate plus 1.30% for the uncommitted line of credit. A closing fee equal to 0.02% of the committed line of credit and $50,000 for the uncommitted line of credit has been paid by the participating funds. In addition, a commitment fee of 0.11% per annum on any unutilized portion of the committed line of credit is allocated to the participating funds based on their relative net assets and paid quarterly. During the reporting period, the fund had no borrowings against these arrangements.
Federal taxes It is the policy of the fund to distribute all of its taxable income within the prescribed time period and otherwise comply with the provisions of the Internal Revenue Code of 1986, as amended (the Code), applicable to regulated investment companies. It is also the intention of the fund to distribute an amount sufficient to avoid imposition of any excise tax under Section 4982 of the Code.
The fund is subject to the provisions of Accounting Standards Codification 740 Income Taxes (ASC 740). ASC 740 sets forth a minimum threshold for financial statement recognition of the benefit of a tax position taken or expected to be taken in a tax return. The fund did not have a liability to record for any unrecognized tax benefits in the accompanying financial statements. No provision has been made for federal taxes on income, capital gains or unrealized appreciation on securities held nor for excise tax on income and capital gains. Each of the fund’s federal tax returns for the prior three fiscal years remains subject to examination by the Internal Revenue Service.
The fund may also be subject to taxes imposed by governments of countries in which it invests. Such taxes are generally based on either income or gains earned or repatriated. The fund accrues and applies such taxes to net investment income, net realized gains and net unrealized gains as income and/or capital gains are earned. In some cases, the fund may be entitled to reclaim all or a portion of such taxes, and such reclaim amounts, if any, are reflected as an asset on the fund’s books. In many cases, however, the fund may not receive such amounts for an extended period of time, depending on the country of investment.
At October 31, 2013, the fund had a capital loss carryover of $1,100,085,230 available to the extent allowed by the Code to offset future net capital gain, if any. The amounts of the carryovers and the expiration dates are:
| | | |
| | Loss carryover | |
|
| Short-term | Long-term | Total | Expiration |
|
| $28,462,182 | N/A | $28,462,182 | October 31, 2015 |
|
| 12,074,013 | N/A | 12,074,013 | October 31, 2016 |
|
| 1,059,549,035 | N/A | 1,059,549,035 | October 31, 2017 |
|
|
| The Putnam Fund for Growth and Income 43 |
Under the Regulated Investment Company Modernization Act of 2010, the fund will be permitted to carry forward capital losses incurred in taxable years beginning after December 22, 2010 for an unlimited period. However, any losses incurred will be required to be utilized prior to the losses incurred in pre-enactment tax years. As a result of this ordering rule, pre-enactment capital loss carryforwards may be more likely to expire unused. Additionally, post-enactment capital losses that are carried forward will retain their character as either short-term or long-term capital losses rather than being considered all short-term as under previous law.
Distributions to shareholders Distributions to shareholders from net investment income are recorded by the fund on the ex-dividend date. Distributions from capital gains, if any, are recorded on the ex-dividend date and paid at least annually. The amount and character of income and gains to be distributed are determined in accordance with income tax regulations, which may differ from generally accepted accounting principles. These differences include temporary and/or permanent differences from losses on wash sale transactions, from realized built-in losses, from income on swap contracts, and from partnership income. Reclassifications are made to the fund’s capital accounts to reflect income and gains available for distribution (or available capital loss carryovers) under income tax regulations. At the close of the reporting period, the fund reclassified $1,000,259 to decrease undistributed net investment income, $1,074,120 to decrease paid-in-capital and $2,074,379 to decrease accumulated net realized loss.
The tax basis components of distributable earnings and the federal tax cost as of the close of the reporting period were as follows:
| |
| Unrealized Appreciation | $946,206,533 |
| Unrealized Depreciation | (105,083,702) |
|
| Net Unrealized Appreciation | 841,122,831 |
| Undistributed Ordinary Income | 5,399,396 |
| Capital Loss Carryforward | (1,100,085,230) |
| Cost for federal income tax purposes | $4,801,444,237 |
Note 2: Management fee, administrative services and other transactions
The fund pays Putnam Management a management fee (based on the fund’s average net assets and computed and paid monthly) at annual rates that may vary based on the average of the aggregate net assets of most open-end funds, as defined in the fund’s management contract, sponsored by Putnam Management. Such annual rates may vary as follows:
| | | | |
| 0.630% | of the first $5 billion, | | 0.430% | of the next $50 billion, |
| |
|
| 0.580% | of the next $5 billion, | | 0.410% | of the next $50 billion, |
| |
|
| 0.530% | of the next $10 billion, | | 0.400% | of the next $100 billion and |
| |
|
| 0.480% | of the next $10 billion, | | 0.395% | of any excess thereafter. |
| |
|
Following the death on October 8, 2013 of The Honourable Paul G. Desmarais, who controlled directly and indirectly a majority of the voting shares of Power Corporation of Canada, the ultimate parent company of Putnam Management, the Trustees of the fund approved an interim management contract with Putnam Management. Consistent with Rule 15a–4 under the Investment Company Act of 1940, the interim management contract will remain in effect until the earlier to occur of (i) approval by the fund’s shareholders of a new management contract and (ii) March 7, 2014. Except with respect to termination, the substantive terms of the interim management contract, including terms relating to fees payable to Putnam Management, are identical to the terms of the fund’s previous management contract with Putnam Management. The Trustees of the fund also approved the continuance, effective October 8, 2013, of the sub-management contract between Putnam Management and Putnam Investments Limited (PIL) described below, for a term no longer than March 7, 2014. The Trustees of the fund have called a shareholder meeting for February 27, 2014, at which shareholders of the fund will consider approval of a proposed new management contract between the fund and Putnam Management. The substantive terms of the proposed new management contract, including terms relating to fees, are identical to the terms of the fund’s previous management contract.
Putnam Management has contractually agreed, through June 30, 2014, to waive fees or reimburse the fund’s expenses to the extent necessary to limit the cumulative expenses of the fund, exclusive of brokerage, interest, taxes, investment-related expenses, extraordinary expenses, acquired fund fees and expenses and payments under the fund’s investor servicing contract, investment management contract and distribution plans, on a fiscal
|
| 44 The Putnam Fund for Growth and Income |
year-to-date basis to an annual rate of 0.20% of the fund’s average net assets over such fiscal year-to-date period. During the reporting period, the fund’s expenses were not reduced as a result of this limit. This expense limitation remains in place under the interim management contract described above.
PIL, an affiliate of Putnam Management, is authorized by the Trustees to manage a separate portion of the assets of the fund as determined by Putnam Management from time to time. Putnam Management pays a quarterly sub-management fee to PIL for its services at an annual rate of 0.35% of the average net assets of the portion of the fund managed by PIL.
The fund reimburses Putnam Management an allocated amount for the compensation and related expenses of certain officers of the fund and their staff who provide administrative services to the fund. The aggregate amount of all such reimbursements is determined annually by the Trustees.
Custodial functions for the fund’s assets are provided by State Street. Custody fees are based on the fund’s asset level, the number of its security holdings and transaction volumes.
Putnam Investor Services, Inc., an affiliate of Putnam Management, provides investor servicing agent functions to the fund. Putnam Investor Services, Inc. received fees for investor servicing (except for Class R5 and R6 shares) based on the fund’s retail asset level, the number of shareholder accounts in the fund and the level of defined contribution plan assets in the fund. Class R5 shares pay a monthly fee based on the average net assets of class R5 shares at an annual rate of 0.15%. Class R6 shares pay a monthly fee based on the average net assets of class R6 shares at an annual rate of 0.05%. Investor servicing fees will not exceed an annual rate of 0.32% of the fund’s average net assets. During the reporting period, the expenses for each class of shares related to investor servicing fees were as follows:
| | | | |
| Class A | $12,432,698 | | Class R5 | 19 |
| |
|
| Class B | 250,505 | | Class R6 | 5,073 |
| |
|
| Class C | 113,067 | | Class Y | 121,833 |
| |
|
| Class M | 89,737 | | Total | $13,022,534 |
| |
|
| Class R | 9,602 | | | |
| | |
The fund has entered into expense offset arrangements with Putnam Investor Services, Inc. and State Street whereby Putnam Investor Services, Inc.’s and State Street’s fees are reduced by credits allowed on cash balances. The fund also reduced expenses through brokerage/service arrangements. For the reporting period, the fund’s expenses were reduced by $8,606 under the expense offset arrangements and by $272,782 under the brokerage/service arrangements.
Each independent Trustee of the fund receives an annual Trustee fee, of which $3,495, as a quarterly retainer, has been allocated to the fund, and an additional fee for each Trustees meeting attended. Trustees also are reimbursed for expenses they incur relating to their services as Trustees.
The fund has adopted a Trustee Fee Deferral Plan (the Deferral Plan) which allows the Trustees to defer the receipt of all or a portion of Trustees fees payable on or after July 1, 1995. The deferred fees remain invested in certain Putnam funds until distribution in accordance with the Deferral Plan.
The fund has adopted an unfunded noncontributory defined benefit pension plan (the Pension Plan) covering all Trustees of the fund who have served as a Trustee for at least five years and were first elected prior to 2004. Benefits under the Pension Plan are equal to 50% of the Trustee’s average annual attendance and retainer fees for the three years ended December 31, 2005. The retirement benefit is payable during a Trustee’s lifetime, beginning the year following retirement, for the number of years of service through December 31, 2006. Pension expense for the fund is included in Trustee compensation and expenses in the Statement of operations. Accrued pension liability is included in Payable for Trustee compensation and expenses in the Statement of assets and liabilities. The Trustees have terminated the Pension Plan with respect to any Trustee first elected after 2003.
The fund has adopted distribution plans (the Plans) with respect to its class A, class B, class C, class M and class R shares pursuant to Rule 12b–1 under the Investment Company Act of 1940. The purpose of the Plans is to compensate Putnam Retail Management Limited Partnership, an indirect wholly-owned subsidiary of Putnam Investments, LLC, for services provided and expenses incurred in distributing shares of the fund. The Plans provide for payments by the fund to Putnam Retail Management Limited Partnership at an annual rate of up to 0.35%, 1.00%, 1.00%, 1.00% and 1.00% of the average net assets attributable to class A, class B, class C, class M and class R shares, respectively. The Trustees have approved payment by the fund at an annual rate of 0.25%, 1.00%, 1.00%, 0.75% and 0.50%
|
| The Putnam Fund for Growth and Income 45 |
of the average net assets attributable to class A, class B, class C, class M and class R shares, respectively. During the reporting period, the class specific expenses related to distribution fees were as follows:
| | | | |
| Class A | $11,583,609 | | Class M | 250,425 |
| |
|
| Class B | 928,608 | | Class R | 17,919 |
| |
|
| Class C | 421,911 | | Total | $13,202,472 |
| |
|
For the reporting period, Putnam Retail Management Limited Partnership, acting as underwriter, received net commissions of $237,958 and $1,372 from the sale of class A and class M shares, respectively, and received $64,413 and $612 in contingent deferred sales charges from redemptions of class B and class C shares, respectively.
A deferred sales charge of up to 1.00% and 0.65% is assessed on certain redemptions of class A and class M shares, respectively. For the reporting period, Putnam Retail Management Limited Partnership, acting as underwriter, received $39 and no monies on class A and class M redemptions, respectively.
Note 3: Purchases and sales of securities
During the reporting period, cost of purchases and proceeds from sales of investment securities other than short-term investments aggregated $2,442,179,471 and $2,957,339,257, respectively. There were no purchases or proceeds from sales of long-term U.S. government securities.
Note 4: Capital shares
At the close of the reporting period, there was an unlimited number of shares of beneficial interest authorized. Transactions in capital shares were as follows:
| | | | |
| | Year ended 10/31/13 | Year ended 10/31/12 |
|
| Class A | Shares | Amount | Shares | Amount |
|
| Shares sold | 6,154,436 | $102,188,254 | 6,620,813 | $90,248,499 |
|
| Shares issued in connection with | | | | |
| reinvestment of distributions | 3,674,623 | 59,249,205 | 4,644,183 | 61,677,615 |
|
| | 9,829,059 | 161,437,459 | 11,264,996 | 151,926,114 |
|
| Shares repurchased | (35,341,537) | (581,802,635) | (45,951,277) | (626,395,445) |
|
| Net decrease | (25,512,478) | $(420,365,176) | (34,686,281) | $(474,469,331) |
|
| |
| | Year ended 10/31/13 | Year ended 10/31/12 |
|
| Class B | Shares | Amount | Shares | Amount |
|
| Shares sold | 549,696 | $8,990,253 | 618,650 | $8,333,165 |
|
| Shares issued in connection with | | | | |
| reinvestment of distributions | 40,986 | 625,966 | 68,391 | 874,379 |
|
| | 590,682 | 9,616,219 | 687,041 | 9,207,544 |
|
| Shares repurchased | (1,856,124) | (30,047,227) | (2,923,409) | (39,263,129) |
|
| Net decrease | (1,265,442) | $(20,431,008) | (2,236,368) | $(30,055,585) |
|
| |
| | Year ended 10/31/13 | Year ended 10/31/12 |
|
| Class C | Shares | Amount | Shares | Amount |
|
| Shares sold | 439,718 | $7,316,329 | 287,914 | $3,921,802 |
|
| Shares issued in connection with | | | | |
| reinvestment of distributions | 17,333 | 270,337 | 23,476 | 305,134 |
|
| | 457,051 | 7,586,666 | 311,390 | 4,226,936 |
|
| Shares repurchased | (416,282) | (6,840,353) | (608,753) | (8,259,660) |
|
| Net increase (decrease) | 40,769 | $746,313 | (297,363) | $(4,032,724) |
|
|
| 46 The Putnam Fund for Growth and Income |
| | | | |
| | Year ended 10/31/13 | Year ended 10/31/12 |
|
| Class M | Shares | Amount | Shares | Amount |
|
| Shares sold | 60,525 | $980,313 | 65,937 | $878,877 |
|
| Shares issued in connection with | | | | |
| reinvestment of distributions | 19,201 | 302,335 | 27,069 | 352,721 |
|
| | 79,726 | 1,282,648 | 93,006 | 1,231,598 |
|
| Shares repurchased | (277,502) | (4,501,534) | (593,007) | (8,000,994) |
|
| Net decrease | (197,776) | $(3,218,886) | (500,001) | $(6,769,396) |
|
| |
| | Year ended 10/31/13 | Year ended 10/31/12 |
|
| Class R | Shares | Amount | Shares | Amount |
|
| Shares sold | 58,110 | $951,923 | 34,141 | $461,282 |
|
| Shares issued in connection with | | | | |
| reinvestment of distributions | 2,518 | 40,365 | 3,488 | 45,950 |
|
| | 60,628 | 992,288 | 37,629 | 507,232 |
|
| Shares repurchased | (81,930) | (1,284,706) | (46,451) | (643,389) |
|
| Net decrease | (21,302) | $(292,418) | (8,822) | $(136,157) |
|
| |
| | | | For the period 7/3/12 |
| | | | (commencement of operations) |
| | Year ended 10/31/13 | to 10/31/12 |
|
| Class R5 | Shares | Amount | Shares | Amount |
|
| Shares sold | — | $— | 733 | $10,000 |
|
| Shares issued in connection with | | | | |
| reinvestment of distributions | 13 | 217 | 3 | 42 |
|
| | 13 | 217 | 736 | 10,042 |
|
| Shares repurchased | — | — | — | — |
|
| Net increase | 13 | $217 | 736 | $10,042 |
|
| |
| | | | For the period 7/3/12 |
| | | | (commencement of operations) |
| | Year ended 10/31/13 | to 10/31/12 |
|
| Class R6 | Shares | Amount | Shares | Amount |
|
| Shares sold | 1,022,456 | $16,954,448 | 733 | $10,000 |
|
| Shares issued in connection with | | | | |
| reinvestment of distributions | 7,408 | 132,226 | 3 | 43 |
|
| | 1,029,864 | 17,086,674 | 736 | 10,043 |
|
| Shares repurchased | (63,944) | (1,134,636) | — | — |
|
| Net increase | 965,920 | $15,952,038 | 736 | $10,043 |
|
| |
| | Year ended 10/31/13 | Year ended 10/31/12 |
|
| Class Y | Shares | Amount | Shares | Amount |
|
| Shares sold | 598,538 | $10,157,040 | 793,917 | $11,264,890 |
|
| Shares issued in connection with | | | | |
| reinvestment of distributions | 46,362 | 744,095 | 57,330 | 762,552 |
|
| | 644,900 | 10,901,135 | 851,247 | 12,027,442 |
|
| Shares repurchased | (1,559,478) | (25,848,197) | (1,037,367) | (13,851,686) |
|
| Net decrease | (914,578) | $(14,947,062) | (186,120) | $(1,824,244) |
|
|
| The Putnam Fund for Growth and Income 47 |
At the close of the reporting period, Putnam Investments, LLC owned the following shares of the fund:
| | | |
| | Shares | Percentage of ownership | Value |
|
| Class R5 | 749 | 100% | $14,187 |
|
| Class R6 | 750 | 0.08 | 14,190 |
|
Note 5: Affiliated transactions
Transactions during the reporting period with Putnam Money Market Liquidity Fund and Putnam Short Term Investment Fund, which are under common ownership or control, were as follows:
| | | | | |
| | Market value at | | | | Market value |
| | the beginning | | | | at the end of |
| | of the reporting | | | Investment | the reporting |
| Name of affiliate | period | Purchase cost | Sale proceeds | income | period |
|
| Putnam Money Market | | | | | |
| Liquidity Fund* | $44,421,874 | $231,125,028 | $275,546,902 | $24,517 | $— |
|
| Putnam Short Term | | | | | |
| Investment Fund* | — | 737,886,547 | 581,386,631 | 42,876 | 156,499,916 |
|
| Totals | $44,421,874 | $969,011,575 | $856,933,533 | $67,393 | $156,499,916 |
|
* Management fees charged to Putnam Money Market Liquidity Fund and Putnam Short Term Investment Fund have been waived by Putnam Management.
Note 6: Market, credit and other risks
In the normal course of business, the fund trades financial instruments and enters into financial transactions where risk of potential loss exists due to changes in the market (market risk) or failure of the contracting party to the transaction to perform (credit risk). The fund may be exposed to additional credit risk that an institution or other entity with which the fund has unsettled or open transactions will default. Investments in foreign securities involve certain risks, including those related to economic instability, unfavorable political developments, and currency fluctuations.
Note 7: Summary of derivative activity
The volume of activity for the reporting period for any derivative type that was held during the period is listed below and was as follows based on an average of the holdings at the end of each fiscal quarter:
| |
| OTC total return swap contracts (notional) | $30,700,000 |
|
| Warrants (number of warrants) | 1,400,000 |
|
The following is a summary of the market values of derivative instruments as of the close of the reporting period:
Market values of derivative instruments as of the close of the reporting period
| | |
| Derivatives not accounted for as hedging | Asset derivatives | Liability derivatives |
| instruments under ASC 815 | Market value | Market value |
|
| Equity contracts | $1,989,079 | $— |
|
| Total | $1,989,079 | $— |
|
The following is a summary of realized and change in unrealized gains or losses of derivative instruments on the Statement of operations for the reporting period (see Note 1):
Amount of realized gain or (loss) on derivatives recognized in net gain or (loss) on investments
| | | |
| Derivatives not accounted for as hedging | | | |
| instruments under ASC 815 | Warrants | Swaps | Total |
|
| Equity contracts | $(222,971) | $1,690,583 | $1,467,612 |
|
| Total | $(222,971) | $1,690,583 | $1,467,612 |
|
|
| 48 The Putnam Fund for Growth and Income |
Change in unrealized appreciation or (depreciation) on derivatives recognized in net gain or (loss) on investments
| | | |
| Derivatives not accounted for as hedging | | | |
| instruments under ASC 815 | Warrants | Swaps | Total |
|
| Equity contracts | $(3,576,817) | $2,157,776 | $(1,419,041) |
|
| Total | $(3,576,817) | $2,157,776 | $(1,419,041) |
|
Note 8: New accounting pronouncement
In January 2013, ASU 2013–01, “Clarifying the Scope of Disclosures about Offsetting Assets and Liabilities,” amended ASU No. 2011–11, “Disclosures about Offsetting Assets and Liabilities.” The ASUs create new disclosure requirements requiring entities to disclose both gross and net information for derivatives and other financial instruments that are either offset in the Statement of assets and liabilities or subject to an enforceable master netting arrangement or similar agreement. The disclosure requirements are effective for annual reporting periods beginning on or after January 1, 2013 and interim periods within those annual periods. Putnam Management is currently evaluating the application of ASUs 2013–01 and 2011–11 and their impact, if any, on the fund’s financial statements.
Federal tax information (Unaudited)
The fund designated 100.00% of ordinary income distributions as qualifying for the dividends received deduction for corporations.
For the reporting period, the fund hereby designates 100.00%, or the maximum amount allowable, of its taxable ordinary income distributions as qualified dividends taxed at the individual net capital gain rates.
For the reporting period, pursuant to §871(k) of the Internal Revenue Code, the fund hereby designates $41,780 of distributions paid as qualifying to be taxed as interest-related dividends, and no monies to be taxed as short-term capital gain dividends for nonresident alien shareholders.
The Form 1099 that will be mailed to you in January 2014 will show the tax status of all distributions paid to your account in calendar 2013.
|
| The Putnam Fund for Growth and Income 49 |
About the Trustees
Independent Trustees

|
| 50 The Putnam Fund for Growth and Income |

* Mr. Reynolds is an “interested person” (as defined in the Investment Company Act of 1940) of the fund and Putnam Investments. He is President and Chief Executive Officer of Putnam Investments, as well as the President of your fund and each of the other Putnam funds.
The address of each Trustee is One Post Office Square, Boston, MA 02109.
As of October 31, 2013, there were 116 Putnam funds. All Trustees serve as Trustees of all Putnam funds.
Each Trustee serves for an indefinite term, until his or her resignation, retirement at age 75, removal, or death.
| |
| The Putnam Fund for Growth and Income | 51 |
Officers
In addition to Robert L. Reynolds, the other officers of the fund are shown below:
| |
| Jonathan S. Horwitz (Born 1955) | Janet C. Smith (Born 1965) |
| Executive Vice President, Principal Executive | Vice President, Principal Accounting Officer, |
| Officer, and Compliance Liaison | and Assistant Treasurer |
| Since 2004 | Since 2007 |
| | Director of Fund Administration Services, |
| Steven D. Krichmar (Born 1958) | Putnam Investments and Putnam Management |
| Vice President and Principal Financial Officer | |
| Since 2002 | Susan G. Malloy (Born 1957) |
| Chief of Operations, Putnam Investments and | Vice President and Assistant Treasurer |
| Putnam Management | Since 2007 |
| | Director of Accounting & Control Services, |
| Robert T. Burns (Born 1961) | Putnam Investments and Putnam Management |
| Vice President and Chief Legal Officer | |
| Since 2011 | James P. Pappas (Born 1953) |
| General Counsel, Putnam Investments, Putnam | Vice President |
| Management, and Putnam Retail Management | Since 2004 |
| | Director of Trustee Relations, |
| Robert R. Leveille (Born 1969) | Putnam Investments and Putnam Management |
| Vice President and Chief Compliance Officer | |
| Since 2007 | Mark C. Trenchard (Born 1962) |
| Chief Compliance Officer, Putnam Investments, | Vice President and BSA Compliance Officer |
| Putnam Management, and Putnam Retail | Since 2002 |
| Management | Director of Operational Compliance, |
| | Putnam Investments and Putnam |
| Michael J. Higgins (Born 1976) | Retail Management |
| Vice President, Treasurer, and Clerk | |
| Since 2010 | Nancy E. Florek (Born 1957) |
| Manager of Finance, Dunkin’ Brands (2008– | Vice President, Director of Proxy Voting and |
| 2010); Senior Financial Analyst, Old Mutual Asset | Corporate Governance, Assistant Clerk, |
| Management (2007–2008); Senior Financial | and Associate Treasurer |
| Analyst, Putnam Investments (1999–2007) | Since 2000 |
The principal occupations of the officers for the past five years have been with the employers as shown above, although in some cases they have held different positions with such employers. The address of each Officer is One Post Office Square, Boston, MA 02109.
|
| 52 The Putnam Fund for Growth and Income |
Fund information
Founded over 75 years ago, Putnam Investments was built around the concept that a balance between risk and reward is the hallmark of a well-rounded financial program. We manage over 100 funds across income, value, blend, growth, asset allocation, absolute return, and global sector categories.
| | |
| Investment Manager | Trustees | Robert R. Leveille |
| Putnam Investment | Jameson A. Baxter, Chair | Vice President and |
| Management, LLC | Liaquat Ahamed | Chief Compliance Officer |
| One Post Office Square | Ravi Akhoury | |
| Boston, MA 02109 | Barbara M. Baumann | Michael J. Higgins |
| | Charles B. Curtis | Vice President, Treasurer, |
| Investment Sub-Manager | Robert J. Darretta | and Clerk |
| Putnam Investments Limited | Katinka Domotorffy | |
| 57–59 St James’s Street | John A. Hill | Janet C. Smith |
| London, England SW1A 1LD | Paul L. Joskow | Vice President, |
| | Kenneth R. Leibler | Principal Accounting Officer, |
| Marketing Services | Robert E. Patterson | and Assistant Treasurer |
| Putnam Retail Management | George Putnam, III | |
| One Post Office Square | Robert L. Reynolds | Susan G. Malloy |
| Boston, MA 02109 | W. Thomas Stephens | Vice President and |
| | | Assistant Treasurer |
| Custodian | Officers | |
| State Street Bank | Robert L. Reynolds | James P. Pappas |
| and Trust Company | President | Vice President |
| | | |
| Legal Counsel | Jonathan S. Horwitz | Mark C. Trenchard |
| Ropes & Gray LLP | Executive Vice President, | Vice President and |
| | Principal Executive Officer, and | BSA Compliance Officer |
| Auditors | Compliance Liaison | |
| PricewaterhouseCoopers LLP | | Nancy E. Florek |
| | Steven D. Krichmar | Vice President, Director of |
| | Vice President and | Proxy Voting and Corporate |
| | Principal Financial Officer | Governance, Assistant Clerk, |
| | | and Associate Treasurer |
| | Robert T. Burns | |
| | Vice President and | |
| | Chief Legal Officer | |
This report is for the information of shareholders of The Putnam Fund for Growth and Income. It may also be used as sales literature when preceded or accompanied by the current prospectus, the most recent copy of Putnam’s Quarterly Performance Summary, and Putnam’s Quarterly Ranking Summary. For more recent performance, please visit putnam.com. Investors should carefully consider the investment objectives, risks, charges, and expenses of a fund, which are described in its prospectus. For this and other information or to request a prospectus or summary prospectus, call 1-800-225-1581 toll free. Please read the prospectus carefully before investing. The fund’s Statement of Additional Information contains additional information about the fund’s Trustees and is available without charge upon request by calling 1-800-225-1581.

| |
| (a) The fund’s principal executive, financial and accounting officers are employees of Putnam Investment Management, LLC, the Fund’s investment manager. As such they are subject to a comprehensive Code of Ethics adopted and administered by Putnam Investments which is designed to protect the interests of the firm and its clients. The Fund has adopted a Code of Ethics which incorporates the Code of Ethics of Putnam Investments with respect to all of its officers and Trustees who are employees of Putnam Investment Management, LLC. For this reason, the Fund has not adopted a separate code of ethics governing its principal executive, financial and accounting officers. |
| |
| (c) In July 2013, the Code of Ethics of Putnam Investment Management, LLC was amended. The changes to the Code of Ethics were as follows: (i) eliminating the requirement for employees to hold their shares of Putnam mutual funds for specified periods of time, (ii) removing the requirement to preclear transactions in certain kinds of exchange-traded funds and exchange-traded notes, although reporting of all such instruments remains required; (iii) eliminating the excessive trading rule related to employee transactions in securities requiring preclearance under the Code; (iv) adding provisions related to monitoring of employee trading; (v) changing from a set number of shares to a set dollar value of stock of mid- and large-cap companies on the Restricted List that can be purchased or sold; (vi) adding a requirement starting in March 2014 for employees to generally use certain approved brokers that provide Putnam with an electronic feed of transactions and statements for their personal brokerage accounts; and (vii) certain other changes. |
| |
| Item 3. Audit Committee Financial Expert: |
| |
| The Funds’ Audit and Compliance Committee is comprised solely of Trustees who are “independent” (as such term has been defined by the Securities and Exchange Commission (“SEC”) in regulations implementing Section 407 of the Sarbanes-Oxley Act (the “Regulations”)). The Trustees believe that each of the members of the Audit and Compliance Committee also possess a combination of knowledge and experience with respect to financial accounting matters, as well as other attributes, that qualify them for service on the Committee. In addition, the Trustees have determined that each of Mr. Leibler, Mr. Hill, Mr. Darretta and Ms. Baumann qualifies as an “audit committee financial expert” (as such term has been defined by the Regulations) based on their review of his or her pertinent experience and education. The SEC has stated that the designation or identification of a person as an audit committee financial expert pursuant to this Item 3 of Form N-CSR does not impose on such person any duties, obligations or liability that are greater than the duties, obligations and liability imposed on such person as a member of the Audit and Compliance Committee and the Board of Trustees in the absence of such designation or identification. |
| |
| Item 4. Principal Accountant Fees and Services: |
| |
| The following table presents fees billed in each of the last two fiscal years for services rendered to the fund by the fund’s independent auditor: |
| | | | | |
| Fiscal year ended | Audit Fees | Audit-Related Fees | Tax Fees | All Other Fees |
|
|
| | | | | |
| October 31, 2013 | $207,333 | $ — | $8,083 | $ — |
| October 31, 2012 | $234,489 | $ — | $8,407 | $8,735 |
| |
| For the fiscal years ended October 31, 2013 and October 31, 2012, the fund’s independent auditor billed aggregate non-audit fees in the amounts of $158,083 and $256,651 respectively, to the fund, Putnam Management and any entity controlling, controlled by or under common control with Putnam Management that provides ongoing services to the fund. |
| |
| Audit Fees represent fees billed for the fund’s last two fiscal years relating to the audit and review of the financial statements included in annual reports and registration statements, and other services that are normally provided in connection with statutory and regulatory filings or engagements. |
| |
| Audit-Related Fees represent fees billed in the fund’s last two fiscal years for services traditionally performed by the fund’s auditor, including accounting consultation for proposed transactions or concerning financial accounting and reporting standards and other audit or attest services not required by statute or regulation. |
| |
| Tax Fees represent fees billed in the fund’s last two fiscal years for tax compliance, tax planning and tax advice services. Tax planning and tax advice services include assistance with tax audits, employee benefit plans and requests for rulings or technical advice from taxing authorities. |
| |
| All Other Fees represent fees billed for services relating to an analysis of fund profitability |
| |
| Pre-Approval Policies of the Audit and Compliance Committee. The Audit and Compliance Committee of the Putnam funds has determined that, as a matter of policy, all work performed for the funds by the funds’ independent auditors will be pre-approved by the Committee itself and thus will generally not be subject to pre-approval procedures. |
| |
| The Audit and Compliance Committee also has adopted a policy to pre-approve the engagement by Putnam Management and certain of its affiliates of the funds’ independent auditors, even in circumstances where pre-approval is not required by applicable law. Any such requests by Putnam Management or certain of its affiliates are typically submitted in writing to the Committee and explain, among other things, the nature of the proposed engagement, the estimated fees, and why this work should be performed by that particular audit firm as opposed to another one. In reviewing such requests, the Committee considers, among other things, whether the provision of such services by the audit firm are compatible with the independence of the audit firm. |
| |
| The following table presents fees billed by the fund’s independent auditor for services required to be approved pursuant to paragraph (c)(7)(ii) of Rule 2-01 of Regulation S-X. |
| | | | | |
| Fiscal year ended | Audit-Related Fees | Tax Fees | All Other Fees | Total Non-Audit Fees |
|
|
| | | | | |
| October 31, 2013 | $ — | $150,000 | $ — | $ — |
| | | | | |
| October 31, 2012 | $ — | $122,500 | $ — | $ — |
| |
| Item 5. Audit Committee of Listed Registrants |
| |
| Item 6. Schedule of Investments: |
| |
| The registrant’s schedule of investments in unaffiliated issuers is included in the report to shareholders in Item 1 above. |
| |
| Item 7. Disclosure of Proxy Voting Policies and Procedures For Closed-End Management Investment Companies: |
| |
| Item 8. Portfolio Managers of Closed-End Investment Companies |
| |
| Item 9. Purchases of Equity Securities by Closed-End Management Investment Companies and Affiliated Purchasers: |
| |
| Item 10. Submission of Matters to a Vote of Security Holders: |
| |
| Item 11. Controls and Procedures: |
| |
| (a) The registrant’s principal executive officer and principal financial officer have concluded, based on their evaluation of the effectiveness of the design and operation of the registrant’s disclosure controls and procedures as of a date within 90 days of the filing date of this report, that the design and operation of such procedures are generally effective to provide reasonable assurance that information required to be disclosed by the registrant in this report is recorded, processed, summarized and reported within the time periods specified in the Commission’s rules and forms. |
| |
| (b) Changes in internal control over financial reporting: Not applicable |
| |
| (a)(1) The Code of Ethics of The Putnam Funds, which incorporates the Code of Ethics of Putnam Investments, is filed herewith. |
| |
| (a)(2) Separate certifications for the principal executive officer and principal financial officer of the registrant as required by Rule 30a-2(a) under the Investment Company Act of 1940, as amended, are filed herewith. |
| |
| (b) The certifications required by Rule 30a-2(b) under the Investment Company Act of 1940, as amended, are filed herewith. |
| |
| Pursuant to the requirements of the Securities Exchange Act of 1934 and the Investment Company Act of 1940, the registrant has duly caused this report to be signed on its behalf by the undersigned, thereunto duly authorized. |
| |
| The Putnam Fund for Growth and Income |
| |
| By (Signature and Title): |
| |
| /s/Janet C. Smith
Janet C. Smith
Principal Accounting Officer
|
| |
| Pursuant to the requirements of the Securities Exchange Act of 1934 and the Investment Company Act of 1940, this report has been signed below by the following persons on behalf of the registrant and in the capacities and on the dates indicated. |
| |
| By (Signature and Title): |
| |
| /s/Jonathan S. Horwitz
Jonathan S. Horwitz
Principal Executive Officer
|
| |
| By (Signature and Title): |
| |
| /s/Steven D. Krichmar
Steven D. Krichmar
Principal Financial Officer
|