CERTIFIED SHAREHOLDER REPORT OF REGISTERED MANAGEMENT INVESTMENT COMPANIES
Investment Company Act file number:
(811-00781)
Exact name of registrant as specified in charter:
The Putnam Fund for Growth and Income
Address of principal executive offices:
One Post Office Square, Boston, Massachusetts 02109
Name and address of agent for service:
Robert T. Burns, Vice President One Post Office Square Boston, Massachusetts 02109
Copy to:
Bryan Chegwidden, Esq. Ropes & Gray LLP 1211 Avenue of the Americas New York, New York 10036
Registrant’s telephone number, including area code:
(617) 292-1000
Date of fiscal year end:
October 31, 2014
Date of reporting period :
November 1, 2013 — October 31, 2014
Item 1. Report to Stockholders:
The following is a copy of the report transmitted to stockholders pursuant to Rule 30e-1 under the Investment Company Act of 1940:
The Putnam Fund for Growth and Income
The Putnam Fund for Growth and Income
Annual report 10 | 31 | 14
Message from the Trustees
1
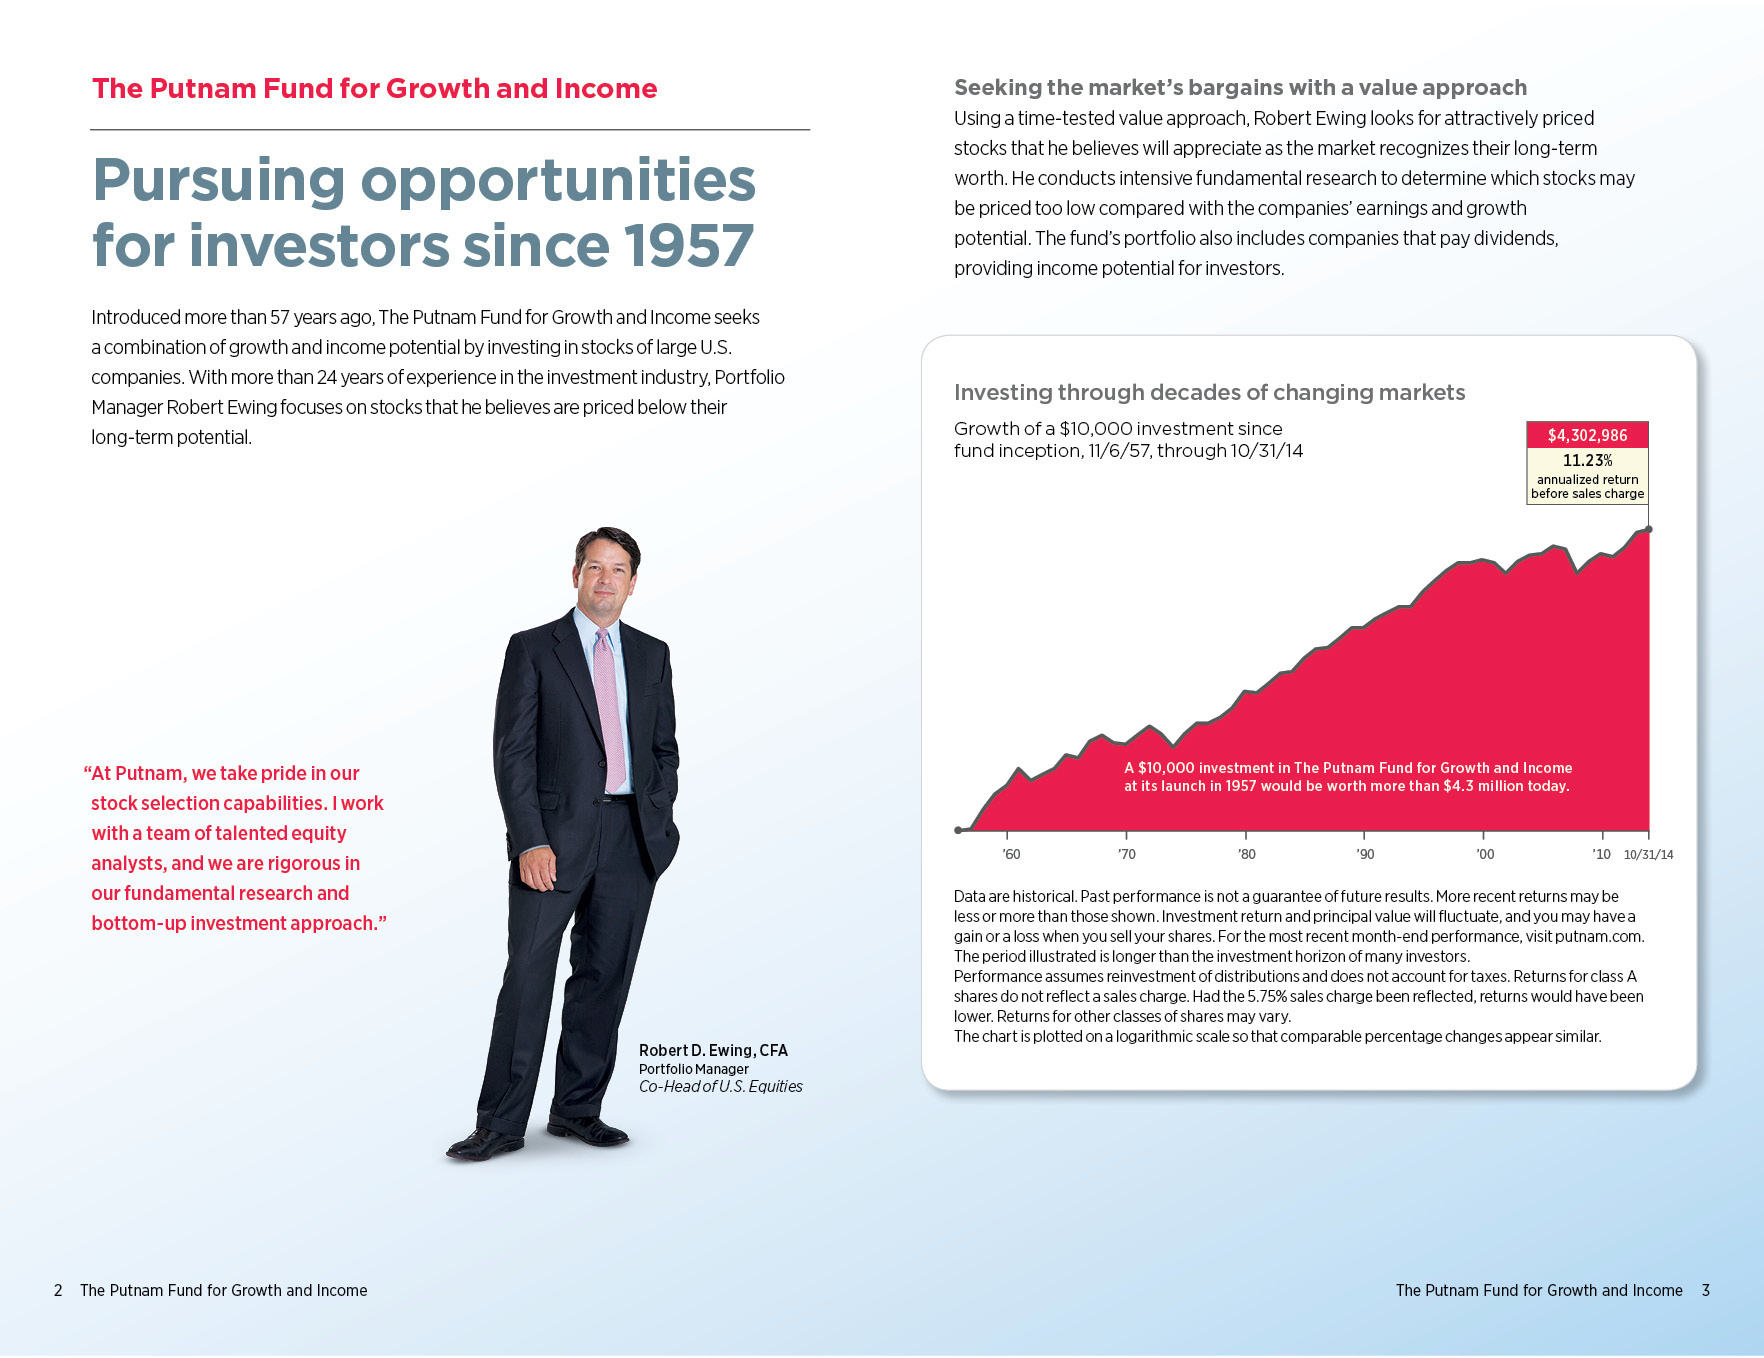
About the fund
2
Performance snapshot
4
Interview with your fund’s portfolio manager
5
Your fund’s performance
10
Your fund’s expenses
13
Terms and definitions
15
Other information for shareholders
16
Important notice regarding Putnam’s privacy policy
17
Trustee approval of management contract
18
Financial statements
23
Federal tax information
51
Shareholder meeting results
52
About the Trustees
53
Officers
55
Consider these risks before investing: Value stocks may fail to rebound, and the market may not favor value-style investing. Income provided by the fund may be reduced by changes in the dividend policies of, and the capital resources available at, the companies in which the fund invests. Stock prices may fall or fail to rise over time for several reasons, including general financial market conditions and factors related to a specific issuer or industry. You can lose money by investing in the fund.
Message from the Trustees
Dear Fellow Shareholder:
The U.S. economic recovery has been steadily gaining momentum all year, thanks to positive developments in the key areas of employment, corporate earnings, consumer spending, and energy costs. With the U.S. midterm elections behind us, major stock market indexes achieved record highs in early November.
In October, the nation’s unemployment rate dropped to the lowest level since July 2008. Moreover, third-quarter earnings left investors feeling more confident about equity values and the overall health of corporations. For fixed-income markets, the outlook is more muted. The U.S. Federal Reserve ended its record bond-buying stimulus program in October, and appears to be on track to raise short-term interest rates in mid-2015.
While hardly booming, the U.S. economy has nevertheless emerged as a pillar of strength in the global economy. Meanwhile, the rest of the world may need to do more to nurture growth. Central banks in Europe, Japan, and China have recently augmented their stimulus policies, intending to shore up faltering recoveries. While risks have emerged, it is important to note that markets encountering adversity can still harbor investment potential.
As we head into the new year, it may be an appropriate time for you to meet with your financial advisor to ensure that your portfolio is properly diversified and aligned with your objectives and risk tolerance. Putnam offers a wide range of strategies for all environments, as well as new ways of thinking about building portfolios for today’s markets.
As always, thank you for investing with Putnam.
Respectfully yours,
Robert L. Reynolds President and Chief Executive Officer Putnam Investments
Jameson A. Baxter Chair, Board of Trustees
December 10, 2014
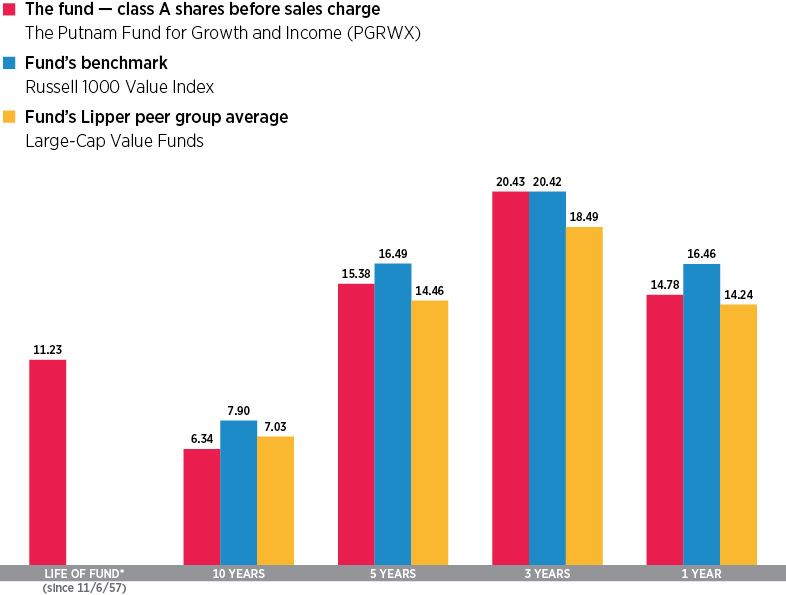
Performance snapshot
Annualized total return (%) comparison as of 10/31/14
Current performance may be lower or higher than the quoted past performance, which cannot guarantee future results. Share price, principal value, and return will fluctuate, and you may have a gain or a loss when you sell your shares. Performance of class A shares assumes reinvestment of distributions and does not account for taxes. Fund returns in the bar chart do not reflect a sales charge of 5.75%; had they, returns would have been lower. See pages 3, 5, and 10–12 for additional performance information. For a portion of the periods, the fund had expense limitations, without which returns would have been lower. To obtain the most recent month-end performance, visit putnam.com.
*The fund’s benchmark, the Russell 1000 Value Index, and the fund’s Lipper peer group were introduced on 12/31/78 and 12/31/59, respectively, which post-date the inception of the fund’s class A shares.
4 The Putnam Fund for Growth and Income
Interview with your fund’s portfolio manager
Robert D. Ewing, CFA
Bob, what can you tell us about the investing environment during the 12-month reporting period ended October 31, 2014?
In describing conditions for this period, I would point out two notable themes. First, stocks delivered a double-digit gain, even after a remarkable multiyear advance for the market. Second, through most of the 12 months, there was a surprising lack of volatility, in our view. For extended periods, stock market indexes didn’t move much more than 1% in either direction, and it has been three years since we’ve seen a statistical correction in the market — that is, a decline of 10% or more from its peak.
While the market was generally calm, there were a few episodes of turbulence, including a sharp decline in October when investors grew worried about global geopolitical tensions and slowing growth in Europe and China. Volatility, as measured by the VIX Index, escalated through mid-October, but calmed down by month-end. In fact, the S&P 500 Index — a broad measure of U.S. stock performance — closed at a new record high on October 31, its 35th record close of the calendar year.
In such a strong market environment, does it become more challenging to find attractively priced stocks?
Yes, it can be more of a challenge. Valuations for stocks are now in the top half of their average historic range. They aren’t extreme by any means, but stocks are more expensive
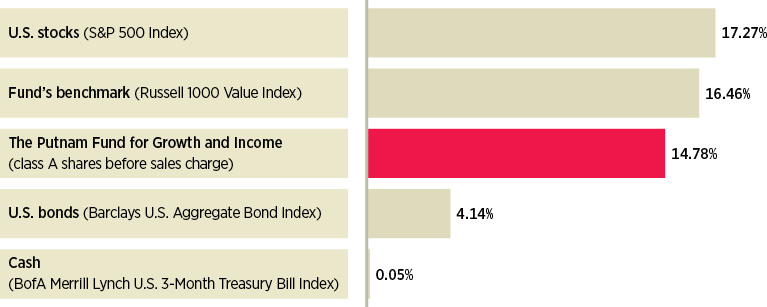
Broad market index and fund performance
This comparison shows your fund’s performance in the context of broad market indexes for the 12 months ended 10/31/14. See pages 3, 4, and 10–12 for additional fund performance information. Index descriptions can be found on page 15.
The Putnam Fund for Growth and Income 5
than they have been in recent years. There were not as many opportunities to capitalize on compellingly low prices. At the same time, in our view, there were no broad themes driving stock performance. In an environment like this, it is important to be selective in your investment choices and to incorporate rigorous fundamental research — which is exactly how we approached our stock selection for the fund’s portfolio.
How did the fund perform during the period?
The fund delivered a solid positive return, and its performance for the 12-month period exceeded the average return for funds in its Lipper peer group, Large-Cap Value Funds. However, the fund underperformed its benchmark, the Russell 1000 Value Index. This was due in part to the fund’s international investments, which represent a small portion of the portfolio. Weakness in markets outside the United States dampened returns relative to the fund’s benchmark, which does not have any international exposure. Our stock selection was particularly strong in the health-care and consumer staples sectors, as well as in capital goods, which is a subsector of industrials. The fund’s consumer discretionary and energy holdings were weaker.
Could you provide some examples of stocks that helped performance?
The top contributor for the period was the stock of Alibaba Group Holding, the China-based e-commerce company whose $25 billion initial public offering was the largest in history. The stock price soared in the aftermath of its IPO in September, and in early November, the company announced strong sales growth in its first financial reporting as a public company. We had been researching and following Alibaba for a while, and our analysts’ extensive knowledge
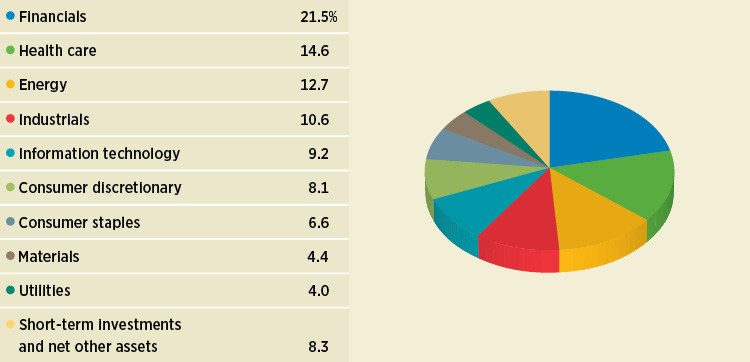
Sector allocations
Allocations are shown as a percentage of the fund’s net assets as of 10/31/14. Short-term investments and net other assets, if any, represent the market value weights of cash, derivatives, short-term securities, and other unclassified assets in the portfolio. Summary information may differ from the portfolio schedule included in the financial statements due to the inclusion of derivative securities, any interest accruals, the exclusion of as-of trades, if any, and the use of different classifications of securities for presentation purposes. Holdings and allocations may vary over time.
6 The Putnam Fund for Growth and Income
“In terms of stock market performance, I would say that we are in the later innings of the ballgame.”
Bob Ewing
of the company in advance of the IPO proved beneficial.
As active fund managers, we have the flexibility to not own a stock that is included in our benchmark index — or to own less of it than the benchmark. During the period, fund performance was helped by our decision to maintain a smaller position in AT&T than the benchmark. We were concerned that intensifying competitive pressure would hurt AT&T’s stock price, and that played out over the period.
Similarly, the fund benefited from our decision to own an out-of-benchmark stock — that of AstraZeneca, a global biopharmaceutical company. The stock has advanced due to the company’s strong financial performance and building investor enthusiasm for its pipeline of drugs in development. Also helping the stock price was the fact that AstraZeneca was viewed as a potential acquisition target. In fact, one of its biggest gains came in April when U.S. pharmaceutical company Pfizer announced a takeover bid for AstraZeneca.
Could you discuss some stocks that detracted from returns relative to the benchmark?
The top detractor was ITT Educational Services, a for-profit education company. The stock struggled as new enrollments declined and the company was pressured by regulatory scrutiny of its loan programs. A delay by the company in reporting its financial results also had a negative impact on the stock price. Although regulatory issues have burdened ITT — and the for-profit education industry as a whole — for a while, we believe it is a temporary setback and that the stock
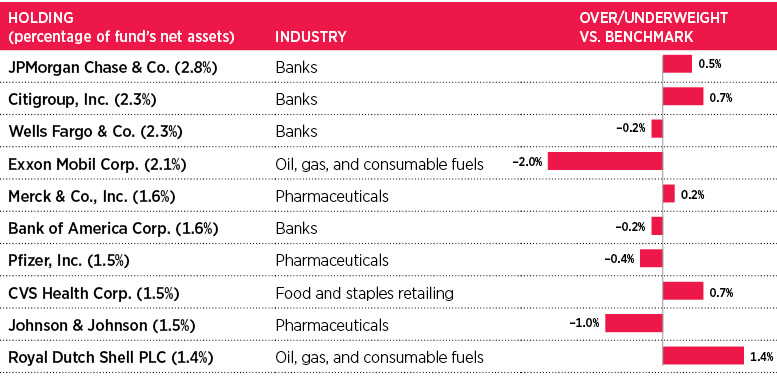
Top 10 holdings
This table shows the fund’s top 10 holdings by percentage of the fund’s net assets as of 10/31/14. Short-term holdings and derivatives, if any, are excluded. Holdings may vary over time.
The Putnam Fund for Growth and Income 7
remains an attractive opportunity over the longer term. ITT remained in the portfolio at the close of the period.
The stock of QEP Resources also dampened performance for the period. This oil and gas exploration and production company was pressured mainly by steadily declining energy prices in the second half of 2014. Another drag on performance came from our decision to maintain an underweight position, relative to the benchmark, in Intel. We were concerned that rapidly declining desktop computer demand would hurt Intel, whose core business is producing chips for desktop PCs. However, desktop sales were stronger than expected and Intel’s stock performed well for the period.
The fund increased its dividend. Would you explain the factors behind that?
The fund pays a quarterly dividend, which largely reflects the degree to which companies in the portfolio are paying dividends. As business conditions and balance sheets have improved, a greater number of companies have elected to pay dividends. The increase in income from companies in the fund’s portfolio has enabled the fund to increase its dividend from $0.047 per class A share to $0.055. Other share classes had similar increases.
As the fund begins a new fiscal year, what is your outlook?
In terms of stock market performance, I would say that we are in the later innings of the ballgame. That is, as we add yet another 12-month gain to the market’s impressive multiyear rally, we believe a downturn becomes more likely, and it is time to consider more defensive strategies. Last year, I was positioning the portfolio with a focus on stocks with growth characteristics. Today, I am proceeding with more caution
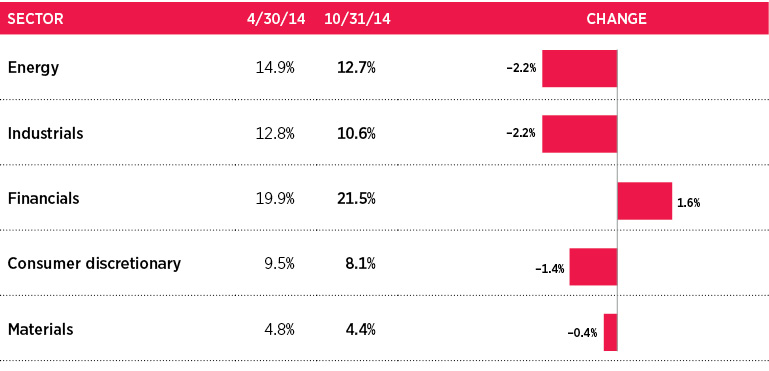
Comparison of top sector shifts
This chart shows the fund’s largest allocation shifts, by percentage, over the past six months. Allocations are shown as a percentage of the fund’s net assets. Current period summary information may differ from the portfolio schedule included in the financial statements due to the inclusion of derivative securities, any interest accruals, the exclusion of as-of trades, if any, and the use of different classifications of securities for presentation purposes. Holdings and allocations may vary over time.
8 The Putnam Fund for Growth and Income
and placing slightly more emphasis on capital preservation.
We believe it is likely that we will see lower returns from U.S. stocks going forward, but there are still a number of factors that could boost their performance. The U.S. economy is accelerating — not rapidly, but at a measured pace. And I believe it’s likely that revenue and profit data for businesses will continue to develop favorably. At this point, it appears that third-quarter earnings growth for U.S. corporations could reach 10%, which is impressive. With this relatively solid foundation for the U.S. economy and businesses, I believe stocks in many sectors still have room to advance.
Thank you, Bob, for your time and insights today.
The views expressed in this report are exclusively those of Putnam Management and are subject to change. They are not meant as investment advice.
Please note that the holdings discussed in this report may not have been held by the fund for the entire period. Portfolio composition is subject to review in accordance with the fund’s investment strategy and may vary in the future. Current and future portfolio holdings are subject to risk.
Portfolio Manager Robert D. Ewing is Co-Head of U.S. Equities at Putnam. He has a B.S. in Finance and Economics from Boston College. He joined Putnam in 2008 and has been in the investment industry since 1990.
IN THE NEWS
In the aftermath of November’s U.S. elections, it’s worth noting that U.S. stocks have gained during every six-month period following midterm votes since 1940. During the past 74 years, 18 midterm elections have been held. In every instance, stocks, as measured by the S&P 500 Index*, have delivered a positive return for the November 1–April 30 period. Gains have often been significant, with stocks delivering an average 17.91% return. The biggest advance of 26.88% took place in 1970–1971. The second biggest return — 26.57% — occurred in 1942–1943. The lowest return was 0.75% in 1946–1947. Why has the market consistently advanced following every midterm election, despite varying economic conditions across these periods? Many market observers believe that it comes down to clarity — in other words, each instance might be considered a “relief rally,” as election-related uncertainty tends to diminish.
*Returns for 1966 and earlier based on Ibbotson U.S. Large Stock Total Return Extended Index.
The Putnam Fund for Growth and Income 9
Your fund’s performance
This section shows your fund’s performance, price, and distribution information for periods ended October 31, 2014, the end of its most recent fiscal year. In accordance with regulatory requirements for mutual funds, we also include performance information as of the most recent calendar quarter-end and expense information taken from the fund’s current prospectus. Performance should always be considered in light of a fund’s investment strategy. Data represent past performance. Past performance does not guarantee future results. More recent returns may be less or more than those shown. Investment return and principal value will fluctuate, and you may have a gain or a loss when you sell your shares. Performance information does not reflect any deduction for taxes a shareholder may owe on fund distributions or on the redemption of fund shares. For the most recent month-end performance, please visit the Individual Investors section at putnam.com or call Putnam at 1-800-225-1581. Class R, R5, R6, and Y shares are not available to all investors. See the Terms and Definitions section in this report for definitions of the share classes offered by your fund.
Fund performance Total return for periods ended 10/31/14
Class A
Class B
Class C
Class M
Class R
Class R5
Class R6
Class Y
(inception dates)
(11/6/57)
(4/27/92)
(7/26/99)
(5/1/95)
(1/21/03)
(7/2/12)
(7/2/12)
(6/15/94)
Before sales charge
After sales charge
Before CDSC
After CDSC
Before CDSC
After CDSC
Before sales charge
After sales charge
Net asset value
Net asset value
Net asset value
Net asset value
Annual average
(life of fund)
11.23%
11.11%
11.07%
11.07%
10.40%
10.40%
10.51%
10.44%
10.95%
11.34%
11.34%
11.33%
10 years
84.98
74.34
74.13
74.13
71.68
71.68
75.95
69.79
80.44
90.37
90.52
89.69
Annual average
6.34
5.72
5.70
5.70
5.55
5.55
5.81
5.44
6.08
6.65
6.66
6.61
5 years
104.44
92.69
96.88
94.88
97.02
97.02
99.39
92.41
101.90
107.85
108.02
107.11
Annual average
15.38
14.02
14.51
14.28
14.53
14.53
14.80
13.98
15.09
15.76
15.78
15.68
3 years
74.65
64.61
70.80
67.80
70.77
70.77
72.04
66.02
73.36
76.58
76.72
75.95
Annual average
20.43
18.07
19.54
18.83
19.53
19.53
19.82
18.41
20.13
20.87
20.90
20.72
1 year
14.78
8.18
13.97
8.97
13.97
12.97
14.23
10.23
14.46
15.25
15.26
15.09
Current performance may be lower or higher than the quoted past performance, which cannot guarantee future results. After-sales-charge returns for class A and M shares reflect the deduction of the maximum 5.75% and 3.50% sales charge, respectively, levied at the time of purchase. Class B share returns after contingent deferred sales charge (CDSC) reflect the applicable CDSC, which is 5% in the first year, declining over time to 1% in the sixth year, and is eliminated thereafter. Class C share returns after CDSC reflect a 1% CDSC for the first year that is eliminated thereafter. Class R, R5, R6, and Y shares have no initial sales charge or CDSC. Performance for class B, C, M, R, and Y shares before their inception is derived from the historical performance of class A shares, adjusted for the applicable sales charge (or CDSC) and the higher operating expenses for such shares, except for class Y shares, for which 12b-1 fees are not applicable. Performance for class R5 and R6 shares prior to their inception is derived from the historical performance of class Y shares and has not been adjusted for the lower investor servicing fees applicable to class R5 and R6 shares; had it, returns would have been higher.
Recent performance may have benefited from one or more legal settlements.
For a portion of the periods, the fund had expense limitations, without which returns would have been lower.
Class B share performance reflects conversion to class A shares after eight years.
10 The Putnam Fund for Growth and Income
Comparative index returns For periods ended 10/31/14
Russell 1000 Value Index
Lipper Large-Cap Value Funds category average*
Annual average (life of fund)
—†
—†
10 years
113.93%
98.40%
Annual average
7.90
7.03
5 years
114.52
96.87
Annual average
16.49
14.46
3 years
74.64
66.53
Annual average
20.42
18.49
1 year
16.46
14.24
Index and Lipper results should be compared with fund performance before sales charge, before CDSC, or at net asset value.
*Over the 1-year, 3-year, 5-year, and 10-year periods ended 10/31/14, there were 483, 424, 377, and 261 funds, respectively, in this Lipper category.
†The fund’s benchmark, the Russell 1000 Value Index, and the fund’s Lipper peer group were introduced on 12/31/78 and 12/31/59, respectively, which post-date the inception of the fund’s class A shares.
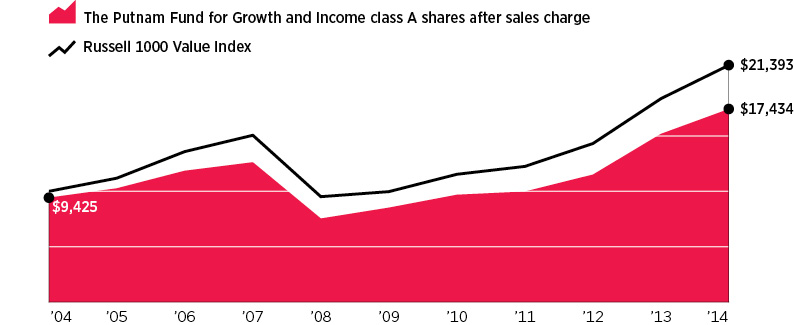
Change in the value of a $10,000 investment ($9,425 after sales charge)
Cumulative total return from 10/31/04 to 10/31/14
Past performance does not indicate future results. At the end of the same time period, a $10,000 investment in the fund’s class B and class C shares would have been valued at $17,413 and $17,168, respectively, and no contingent deferred sales charges would apply. A $10,000 investment in the fund’s class M shares ($9,650 after sales charge) would have been valued at $16,979. A $10,000 investment in the fund’s class R, R5, R6, and Y shares would have been valued at $18,044, $19,037, $19,052, and $18,969, respectively.
The Putnam Fund for Growth and Income 11
Fund price and distribution information For the 12-month period ended 10/31/14
Distributions
Class A
Class B
Class C
Class M
Class R
Class R5
Class R6
Class Y
Number
4
4
4
4
4
4
4
4
Income
$0.234
$0.081
$0.087
$0.133
$0.183
$0.277
$0.317
$0.286
Capital gains
—
—
—
—
—
—
—
—
Total
$0.234
$0.081
$0.087
$0.133
$0.183
$0.277
$0.317
$0.286
Share value
Before sales charge
After sales charge
Net asset value
Net asset value
Before sales charge
After sales charge
Net asset value
Net asset value
Net asset value
Net asset value
10/31/13
$18.87
$20.02
$18.52
$18.78
$18.71
$19.39
$18.77
$18.93
$18.92
$18.91
10/31/14
21.41
22.72
21.02
21.31
21.23
22.00
21.29
21.52
21.47
21.46
Current rate (end of period)
Before sales charge
After sales charge
Net asset value
Net asset value
Before sales charge
After sales charge
Net asset value
Net asset value
Net asset value
Net asset value
Current dividend rate 1
1.03%
0.97%
0.29%
0.28%
0.53%
0.51%
0.79%
0.93%
1.42%
1.29%
Current 30-day SEC yield 2
N/A
0.92
0.27
0.27
N/A
0.49
0.74
1.22
1.36
1.22
The classification of distributions, if any, is an estimate. Before-sales-charge share value and current dividend rate for class A and M shares, if applicable, do not take into account any sales charge levied at the time of purchase. After-sales-charge share value, current dividend rate, and current 30-day SEC yield, if applicable, are calculated assuming that the maximum sales charge (5.75% for class A shares and 3.50% for class M shares) was levied at the time of purchase. Final distribution information will appear on your year-end tax forms.
1Most recent distribution, including any return of capital and excluding capital gains, annualized and divided by share price before or after sales charge at period-end.
2Based only on investment income and calculated using the maximum offering price for each share class, in accordance with SEC guidelines.
Fund performance as of most recent calendar quarter Total return for periods ended 9/30/14
Class A
Class B
Class C
Class M
Class R
Class R5
Class R6
Class Y
(inception dates)
(11/6/57)
(4/27/92)
(7/26/99)
(5/1/95)
(1/21/03)
(7/2/12)
(7/2/12)
(6/15/94)
Before sales charge
After sales charge
Before CDSC
After CDSC
Before CDSC
After CDSC
Before sales charge
After sales charge
Net asset value
Net asset value
Net asset value
Net asset value
Annual average
(life of fund)
11.22%
11.11%
11.06%
11.06%
10.39%
10.39%
10.51%
10.44%
10.94%
11.33%
11.33%
11.32%
10 years
84.36
73.76
73.37
73.37
71.00
71.00
75.34
69.20
79.81
89.75
89.89
89.06
Annual average
6.31
5.68
5.66
5.66
5.51
5.51
5.78
5.40
6.04
6.61
6.62
6.58
5 years
95.98
84.71
88.78
86.78
88.76
88.76
91.17
84.47
93.59
99.28
99.43
98.56
Annual average
14.40
13.06
13.55
13.31
13.55
13.55
13.84
13.03
14.12
14.79
14.80
14.70
3 years
94.42
83.24
90.03
87.03
89.94
89.94
91.43
84.73
92.86
96.52
96.67
95.81
Annual average
24.81
22.37
23.86
23.21
23.84
23.84
24.17
22.70
24.47
25.26
25.29
25.11
1 year
17.88
11.10
17.03
12.03
16.99
15.99
17.27
13.16
17.56
18.35
18.37
18.20
See the discussion following the fund performance table on page 10 for information about the calculation of fund performance.
12 The Putnam Fund for Growth and Income
Your fund’s expenses
As a mutual fund investor, you pay ongoing expenses, such as management fees, distribution fees (12b-1 fees), and other expenses. Using the following information, you can estimate how these expenses affect your investment and compare them with the expenses of other funds. You may also pay one-time transaction expenses, including sales charges (loads) and redemption fees, which are not shown in this section and would have resulted in higher total expenses. For more information, see your fund’s prospectus or talk to your financial representative.
Expense ratios
Class A
Class B
Class C
Class M
Class R
Class R5
Class R6
Class Y
Total annual operating expenses for the fiscal year ended 10/31/13
1.04%
1.79%
1.79%
1.54%
1.29%
0.67%
0.57%
0.79%
Annualized expense ratio for the six-month period ended 10/31/14*
0.95%
1.70%
1.70%
1.45%
1.20%
0.65%
0.55%
0.70%
Fiscal-year expense information in this table is taken from the most recent prospectus, is subject to change, and may differ from that shown for the annualized expense ratio and in the financial highlights of this report.
Expenses are shown as a percentage of average net assets.
*For the fund’s most recent fiscal half year; may differ from expense ratios based on one-year data in the financial highlights.
Expenses per $1,000
The following table shows the expenses you would have paid on a $1,000 investment in the fund from May 1, 2014, to October 31, 2014. It also shows how much a $1,000 investment would be worth at the close of the period, assuming actual returns and expenses.
Class A
Class B
Class C
Class M
Class R
Class R5
Class R6
Class Y
Expenses paid per $1,000*†
$4.90
$8.76
$8.76
$7.48
$6.19
$3.36
$2.84
$3.62
Ending value (after expenses)
$1,048.30
$1,044.20
$1,044.70
$1,046.10
$1,046.80
$1,050.60
$1,050.20
$1,049.50
*Expenses for each share class are calculated using the fund’s annualized expense ratio for each class, which represents the ongoing expenses as a percentage of average net assets for the six months ended 10/31/14. The expense ratio may differ for each share class.
†Expenses are calculated by multiplying the expense ratio by the average account value for the period; then multiplying the result by the number of days in the period; and then dividing that result by the number of days in the year.
The Putnam Fund for Growth and Income 13
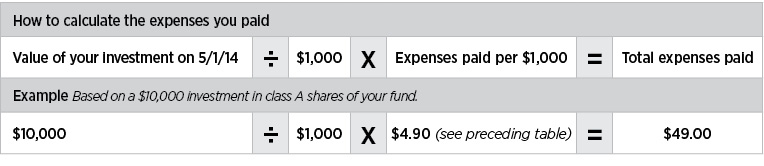
Estimate the expenses you paid
To estimate the ongoing expenses you paid for the six months ended October 31, 2014, use the following calculation method. To find the value of your investment on May 1, 2014, call Putnam at 1-800-225-1581.
Compare expenses using the SEC’s method
The Securities and Exchange Commission (SEC) has established guidelines to help investors assess fund expenses. Per these guidelines, the following table shows your fund’s expenses based on a $1,000 investment, assuming a hypothetical 5% annualized return. You can use this information to compare the ongoing expenses (but not transaction expenses or total costs) of investing in the fund with those of other funds. All mutual fund shareholder reports will provide this information to help you make this comparison. Please note that you cannot use this information to estimate your actual ending account balance and expenses paid during the period.
Class A
Class B
Class C
Class M
Class R
Class R5
Class R6
Class Y
Expenses paid per $1,000*†
$4.84
$8.64
$8.64
$7.37
$6.11
$3.31
$2.80
$3.57
Ending value (after expenses)
$1,020.42
$1,016.64
$1,016.64
$1,017.90
$1,019.16
$1,021.93
$1,022.43
$1,021.68
*Expenses for each share class are calculated using the fund’s annualized expense ratio for each class, which represents the ongoing expenses as a percentage of average net assets for the six months ended 10/31/14. The expense ratio may differ for each share class.
†Expenses are calculated by multiplying the expense ratio by the average account value for the six-month period; then multiplying the result by the number of days in the six-month period; and then dividing that result by the number of days in the year.
14 The Putnam Fund for Growth and Income
Terms and definitions
Important terms
Total return shows how the value of the fund’s shares changed over time, assuming you held the shares through the entire period and reinvested all distributions in the fund.
Before sales charge, or net asset value, is the price, or value, of one share of a mutual fund, without a sales charge. Before-sales-charge figures fluctuate with market conditions, and are calculated by dividing the net assets of each class of shares by the number of outstanding shares in the class.
After sales charge is the price of a mutual fund share plus the maximum sales charge levied at the time of purchase. After-sales-charge performance figures shown here assume the 5.75% maximum sales charge for class A shares and 3.50% for class M shares.
Contingent deferred sales charge (CDSC) is generally a charge applied at the time of the redemption of class B or C shares and assumes redemption at the end of the period. Your fund’s class B CDSC declines over time from a 5% maximum during the first year to 1% during the sixth year. After the sixth year, the CDSC no longer applies. The CDSC for class C shares is 1% for one year after purchase.
Current rate is the annual rate of return earned from dividends or interest of an investment. Current rate is expressed as a percentage of the price of a security, fund share, or principal investment.
Share classes
Class A shares are generally subject to an initial sales charge and no CDSC (except on certain redemptions of shares bought without an initial sales charge).
Class B shares are not subject to an initial sales charge and may be subject to a CDSC.
Class C shares are not subject to an initial sales charge and are subject to a CDSC only if the shares are redeemed during the first year.
Class M shares have a lower initial sales charge and a higher 12b-1 fee than class A shares and no CDSC (except on certain redemptions of shares bought without an initial sales charge).
Class R shares are not subject to an initial sales charge or CDSC and are available only to certain employer-sponsored retirement plans.
Class R5 and R6 shares are not subject to an initial sales charge or CDSC, and carry no 12b-1 fee. They are only available to employer-sponsored retirement plans.
Class Y shares are not subject to an initial sales charge or CDSC, and carry no 12b-1 fee. They are generally only available to corporate and institutional clients and clients in other approved programs.
Comparative indexes
Barclays U.S. Aggregate Bond Index is an unmanaged index of U.S. investment-grade fixed-income securities.
BofA Merrill Lynch U.S. 3-Month Treasury Bill Index is an unmanaged index that seeks to measure the performance of U.S. Treasury bills available in the marketplace.
Russell 1000 Value Index is an unmanaged index of those companies in the large-cap Russell 1000 Index chosen for their value orientation.
S&P 500 Index is an unmanaged index of common stock performance.
Indexes assume reinvestment of all distributions and do not account for fees. Securities and performance of a fund and an index will differ. You cannot invest directly in an index.
Lipper is a third-party industry-ranking entity that ranks mutual funds. Its rankings do not reflect sales charges. Lipper rankings are based
The Putnam Fund for Growth and Income 15
on total return at net asset value relative to other funds that have similar current investment styles or objectives as determined by Lipper. Lipper may change a fund’s category assignment at its discretion. Lipper category averages reflect performance trends for funds within a category.
Other information for shareholders
Proxy voting
Putnam is committed to managing our mutual funds in the best interests of our shareholders. The Putnam funds’ proxy voting guidelines and procedures, as well as information regarding how your fund voted proxies relating to portfolio securities during the 12-month period ended June 30, 2014, are available in the Individual Investors section of putnam.com, and on the Securities and Exchange Commission (SEC) website, www.sec.gov. If you have questions about finding forms on the SEC’s website, you may call the SEC at 1-800-SEC-0330. You may also obtain the Putnam funds’ proxy voting guidelines and procedures at no charge by calling Putnam’s Shareholder Services at 1-800-225-1581.
Fund portfolio holdings
The fund will file a complete schedule of its portfolio holdings with the SEC for the first and third quarters of each fiscal year on Form N-Q. Shareholders may obtain the fund’s Form N-Q on the SEC’s website at www.sec.gov. In addition, the fund’s Form N-Q may be reviewed and copied at the SEC’s Public Reference Room in Washington, D.C. You may call the SEC at 1-800-SEC-0330 for information about the SEC’s website or the operation of the Public Reference Room.
Trustee and employee fund ownership
Putnam employees and members of the Board of Trustees place their faith, confidence, and, most importantly, investment dollars in Putnam mutual funds. As of October 31, 2014, Putnam employees had approximately $494,000,000 and the Trustees had approximately $139,000,000 invested in Putnam mutual funds. These amounts include investments by the Trustees’ and employees’ immediate family members as well as investments through retirement and deferred compensation plans.
16 The Putnam Fund for Growth and Income
Important notice regarding Putnam’s privacy policy
In order to conduct business with our shareholders, we must obtain certain personal information such as account holders’ names, addresses, Social Security numbers, and dates of birth. Using this information, we are able to maintain accurate records of accounts and transactions.
It is our policy to protect the confidentiality of our shareholder information, whether or not a shareholder currently owns shares of our funds. In particular, it is our policy not to sell information about you or your accounts to outside marketing firms. We have safeguards in place designed to prevent unauthorized access to our computer systems and procedures to protect personal information from unauthorized use.
Under certain circumstances, we must share account information with outside vendors who provide services to us, such as mailings and proxy solicitations. In these cases, the service providers enter into confidentiality agreements with us, and we provide only the information necessary to process transactions and perform other services related to your account. Finally, it is our policy to share account information with your financial representative, if you’ve listed one on your Putnam account.
The Putnam Fund for Growth and Income 17
Trustee approval of management contract
General conclusions
The Board of Trustees of the Putnam funds oversees the management of each fund and, as required by law, determines annually whether to approve the continuance of your fund’s management contract with Putnam Investment Management, LLC (“Putnam Management”) and the sub-management contract with respect to your fund between Putnam Management and its affiliate, Putnam Investments Limited (“PIL”). The Board of Trustees, with the assistance of its Contract Committee, requests and evaluates all information it deems reasonably necessary under the circumstances in connection with its annual contract review. The Contract Committee consists solely of Trustees who are not “interested persons” (as this term is defined in the Investment Company Act of 1940, as amended (the “1940 Act”)) of the Putnam funds (“Independent Trustees”).
At the outset of the review process, members of the Board’s independent staff and independent legal counsel met with representatives of Putnam Management to review the annual contract review materials furnished to the Contract Committee during the course of the previous year’s review and to discuss possible changes in these materials that might be necessary or desirable for the coming year. Following these discussions and in consultation with the Contract Committee, the Independent Trustees’ independent legal counsel requested that Putnam Management furnish specified information, together with any additional information that Putnam Management considered relevant, to the Contract Committee. Over the course of several months ending in June 2014, the Contract Committee met on a number of occasions with representatives of Putnam Management, and separately in executive session, to consider the information that Putnam Management provided, as well as supplemental information provided in response to additional requests made by the Contract Committee. Throughout this process, the Contract Committee was assisted by the members of the Board’s independent staff and by independent legal counsel for the Putnam funds and the Independent Trustees.
In May 2014, the Contract Committee met in executive session to discuss and consider its preliminary recommendations with respect to the continuance of the contracts. At the Trustees’ June 20, 2014 meeting, the Contract Committee met in executive session with the other Independent Trustees to review a summary of the key financial, performance and other data that the Contract Committee considered in the course of its review. The Contract Committee then presented its written report, which summarized the key factors that the Committee had considered and set forth its final recommendations. The Contract Committee then recommended, and the Independent Trustees approved, the continuance of your fund’s management and sub-management contracts, effective July 1, 2014. (Because PIL is an affiliate of Putnam Management and Putnam Management remains fully responsible for all services provided by PIL, the Trustees have not attempted to evaluate PIL as a separate entity, and all subsequent references to Putnam Management below should be deemed to include reference to PIL as necessary or appropriate in the context.)
The Independent Trustees’ approval was based on the following conclusions:
•That the fee schedule in effect for your fund represented reasonable compensation in light of the nature and quality of the services being provided to the fund, the fees paid by competitive funds, and the costs incurred by Putnam Management in providing services to the fund; and
18 The Putnam Fund for Growth and Income
•That the fee schedule in effect for your fund represented an appropriate sharing between fund shareholders and Putnam Management of such economies of scale as may exist in the management of the fund at current asset levels.
These conclusions were based on a comprehensive consideration of all information provided to the Trustees and were not the result of any single factor. Some of the factors that figured particularly in the Trustees’ deliberations and how the Trustees considered these factors are described below, although individual Trustees may have evaluated the information presented differently, giving different weights to various factors. It is also important to recognize that the management arrangements for your fund and the other Putnam funds are the result of many years of review and discussion between the Independent Trustees and Putnam Management, that some aspects of the arrangements may receive greater scrutiny in some years than others, and that the Trustees’ conclusions may be based, in part, on their consideration of fee arrangements in previous years. For example, with some minor exceptions, the current fee arrangements under the management contracts for the Putnam funds were implemented at the beginning of 2010 following extensive review by the Contract Committee and discussions with representatives of Putnam Management, as well as approval by shareholders. Shareholders also voted overwhelmingly to approve these fee arrangements in early 2014, when they were asked to approve new management contracts (with the same fees and substantially identical other provisions) following the possible termination of the previous management contracts as a result of the death of the Honorable Paul G. Desmarais. (Mr. Desmarais, both directly and through holding companies, controlled a majority of the voting shares of Power Corporation of Canada, which (directly and indirectly) is the majority owner of Putnam Management. Mr. Desmarais’ voting control of shares of Power Corporation of Canada was transferred to The Desmarais Family Residuary Trust upon his death and this transfer, as a technical matter, may have constituted an “assignment” within the meaning of the 1940 Act, causing the Putnam funds’ management contracts to terminate automatically.)
Management fee schedules and total expenses
The Trustees reviewed the management fee schedules in effect for all Putnam funds, including fee levels and breakpoints. The Trustees also reviewed the total expenses of each Putnam fund, recognizing that in most cases management fees represented the major, but not the sole, determinant of total costs to shareholders.
In reviewing fees and expenses, the Trustees generally focus their attention on material changes in circumstances — for example, changes in assets under management, changes in a fund’s investment style, changes in Putnam Management’s operating costs or profitability, or changes in competitive practices in the mutual fund industry — that suggest that consideration of fee changes might be warranted. The Trustees concluded that the circumstances did not warrant changes to the management fee structure of your fund.
Under its management contract, your fund has the benefit of breakpoints in its management fee schedule that provide shareholders with economies of scale in the form of reduced fee levels as assets under management in the Putnam family of funds increase. The Trustees concluded that the fee schedule in effect for your fund represented an appropriate sharing of economies of scale between fund shareholders and Putnam Management.
As in the past, the Trustees also focused on the competitiveness of each fund’s total expense ratio. In order to ensure that expenses of the Putnam funds continue to meet competitive standards, the Trustees and Putnam
The Putnam Fund for Growth and Income 19
Management have implemented certain expense limitations. These expense limitations were: (i) a contractual expense limitation applicable to all retail open-end funds of 32 basis points on investor servicing fees and expenses and (ii) a contractual expense limitation applicable to all open-end funds of 20 basis points on so-called “other expenses” (i.e., all expenses exclusive of management fees, investor servicing fees, distribution fees, investment-related expenses, interest, taxes, brokerage commissions, extraordinary expenses and acquired fund fees and expenses). These expense limitations serve in particular to maintain competitive expense levels for funds with large numbers of small shareholder accounts and funds with relatively small net assets. Most funds, including your fund, had sufficiently low expenses that these expense limitations did not apply. Putnam Management’s support for these expense limitation arrangements was an important factor in the Trustees’ decision to approve the continuance of your fund’s management and sub-management contracts.
The Trustees reviewed comparative fee and expense information for a custom group of competitive funds selected by Lipper Inc. (“Lipper”). This comparative information included your fund’s percentile ranking for effective management fees and total expenses (excluding any applicable 12b-1 fee), which provides a general indication of your fund’s relative standing. In the custom peer group, your fund ranked in the first quintile in effective management fees (determined for your fund and the other funds in the custom peer group based on fund asset size and the applicable contractual management fee schedule) and in the third quintile in total expenses (excluding any applicable 12b-1 fees) as of December 31, 2013 (the first quintile representing the least expensive funds and the fifth quintile the most expensive funds). The fee and expense data reported by Lipper as of December 31, 2013 reflected the most recent fiscal year-end data available in Lipper’s database at that time.
In connection with their review of the management fees and total expenses of the Putnam funds, the Trustees also reviewed the costs of the services provided and the profits realized by Putnam Management and its affiliates from their contractual relationships with the funds. This information included trends in revenues, expenses and profitability of Putnam Management and its affiliates relating to the investment management, investor servicing and distribution services provided to the funds. In this regard, the Trustees also reviewed an analysis of Putnam Management’s revenues, expenses and profitability, allocated on a fund-by-fund basis, with respect to the funds’ management, distribution, and investor servicing contracts. For each fund, the analysis presented information about revenues, expenses and profitability for each of the agreements separately and for the agreements taken together on a combined basis. The Trustees concluded that, at current asset levels, the fee schedules in place represented reasonable compensation for the services being provided and represented an appropriate sharing of such economies of scale as may exist in the management of the Putnam funds at that time.
The information examined by the Trustees as part of their annual contract review for the Putnam funds has included for many years information regarding fees charged by Putnam Management and its affiliates to institutional clients such as defined benefit pension plans, college endowments, and the like. This information included comparisons of those fees with fees charged to the Putnam funds, as well as an assessment of the differences in the services provided to these different types of clients. The Trustees observed that the differences in fee rates between institutional clients and mutual funds are by no means uniform when examined by individual asset sectors, suggesting that
20 The Putnam Fund for Growth and Income
differences in the pricing of investment management services to these types of clients may reflect historical competitive forces operating in separate markets. The Trustees considered the fact that in many cases fee rates across different asset classes are higher on average for mutual funds than for institutional clients, as well as the differences between the services that Putnam Management provides to the Putnam funds and those that it provides to its institutional clients. The Trustees did not rely on these comparisons to any significant extent in concluding that the management fees paid by your fund are reasonable.
Investment performance
The quality of the investment process provided by Putnam Management represented a major factor in the Trustees’ evaluation of the quality of services provided by Putnam Management under your fund’s management contract. The Trustees were assisted in their review of the Putnam funds’ investment process and performance by the work of the investment oversight committees of the Trustees, which meet on a regular basis with the funds’ portfolio teams and with the Chief Investment Officer and other senior members of Putnam Management’s Investment Division throughout the year. The Trustees concluded that Putnam Management generally provides a high-quality investment process — based on the experience and skills of the individuals assigned to the management of fund portfolios, the resources made available to them, and in general Putnam Management’s ability to attract and retain high-quality personnel — but also recognized that this does not guarantee favorable investment results for every fund in every time period.
The Trustees considered that 2013 was a year of strong competitive performance for many of the Putnam funds, with only a relatively small number of exceptions. They noted that this strong performance was exemplified by the fact that the Putnam funds were recognized by Barron’s as the second-best performing mutual fund complex for both 2013 and the five-year period ended December 31, 2013. They also noted, however, the disappointing investment performance of some funds for periods ended December 31, 2013 and considered information provided by Putnam Management regarding the factors contributing to the underperformance and actions being taken to improve the performance of these particular funds. The Trustees indicated their intention to continue to monitor performance trends to assess the effectiveness of these efforts and to evaluate whether additional actions to address areas of underperformance are warranted. For purposes of evaluating investment performance, the Trustees generally focus on competitive industry rankings for the one-year, three-year and five-year periods. For a number of Putnam funds with relatively unique investment mandates for which meaningful competitive performance rankings are not considered available, the Trustees evaluated performance based on comparisons of fund returns with the returns of selected investment benchmarks. In the case of your fund, the Trustees considered that its class A share cumulative total return performance at net asset value was in the following quartiles of its Lipper peer group (Lipper Large-Cap Value Funds) for the one-year, three-year and five-year periods ended December 31, 2013 (the first quartile representing the best-performing funds and the fourth quartile the worst-performing funds):
One-year period
1st
Three-year period
2nd
Five-year period
1st
Over the one-year, three-year and five-year periods ended December 31, 2013, there were 472, 417 and 368 funds, respectively, in your fund’s Lipper peer group. (When considering performance information, shareholders should be mindful that past performance is not a guarantee of future results.)
The Putnam Fund for Growth and Income 21
Brokerage and soft-dollar allocations; investor servicing
The Trustees considered various potential benefits that Putnam Management may receive in connection with the services it provides under the management contract with your fund. These include benefits related to brokerage allocation and the use of soft dollars, whereby a portion of the commissions paid by a fund for brokerage may be used to acquire research services that are expected to be useful to Putnam Management in managing the assets of the fund and of other clients. Subject to policies established by the Trustees, soft dollars generated by these means are used primarily to acquire brokerage and research services that enhance Putnam Management’s investment capabilities and supplement Putnam Management’s internal research efforts. However, the Trustees noted that a portion of available soft dollars continues to be used to pay fund expenses. The Trustees indicated their continued intent to monitor regulatory and industry developments in this area with the assistance of their Brokerage Committee and also indicated their continued intent to monitor the allocation of the Putnam funds’ brokerage in order to ensure that the principle of seeking best price and execution remains paramount in the portfolio trading process.
Putnam Management may also receive benefits from payments that the funds make to Putnam Management’s affiliates for investor or distribution services. In conjunction with the annual review of your fund’s management and sub-management contracts, the Trustees reviewed your fund’s investor servicing agreement with Putnam Investor Services, Inc. (“PSERV”) and its distributor’s contracts and distribution plans with Putnam Retail Management Limited Partnership (“PRM”), both of which are affiliates of Putnam Management. The Trustees concluded that the fees payable by the funds to PSERV and PRM, as applicable, for such services are reasonable in relation to the nature and quality of such services, the fees paid by competitive funds, and the costs incurred by PSERV and PRM, as applicable, in providing such services.
22 The Putnam Fund for Growth and Income
Financial statements
A note about your fund’s auditors
Between July 18, 2013 and December 16, 2013, which included a portion of your fund’s fiscal year, a non-U.S. member firm in PricewaterhouseCoopers LLP’s (“PwC”) global network of firms had an investment in certain non-U.S. funds that became affiliated with Putnam Investments as a result of the acquisition of the funds’ advisor by Putnam’s parent company, Great-West Lifeco Inc. The investment consisted of pension plan assets for the benefit of the member firm’s personnel. This investment is inconsistent with the SEC’s independence rules applicable to auditors. Although upon the disposition of the investment by the member firm on December 16, 2013, PwC and its affiliates took all necessary steps to eliminate this issue, the requirements of the SEC’s independence rules were not met for your fund’s fiscal year because the SEC’s rules require an audit firm to be independent for the entire fiscal year under audit. Based on its knowledge of the facts and its experience with PwC, the Audit and Compliance Committee of your fund’s Board of Trustees concluded that the investment by the PwC member firm would not affect PwC’s ability to render an objective audit opinion to your fund. Based on this conclusion and consideration of the potential risks that the disruption of a change of auditor could present, the Audit and Compliance Committee determined that PwC should continue to act as auditor for your fund.
These sections of the report, as well as the accompanying Notes, preceded by the Report of Independent Registered Public Accounting Firm, constitute the fund’s financial statements.
The fund’s portfolio lists all the fund’s investments and their values as of the last day of the reporting period. Holdings are organized by asset type and industry sector, country, or state to show areas of concentration and diversification.
Statement of assets and liabilities shows how the fund’s net assets and share price are determined. All investment and non-investment assets are added together. Any unpaid expenses and other liabilities are subtracted from this total. The result is divided by the number of shares to determine the net asset value per share, which is calculated separately for each class of shares. (For funds with preferred shares, the amount subtracted from total assets includes the liquidation preference of preferred shares.)
Statement of operations shows the fund’s net investment gain or loss. This is done by first adding up all the fund’s earnings — from dividends and interest income — and subtracting its operating expenses to determine net investment income (or loss). Then, any net gain or loss the fund realized on the sales of its holdings — as well as any unrealized gains or losses over the period — is added to or subtracted from the net investment result to determine the fund’s net gain or loss for the fiscal year.
Statement of changes in net assets shows how the fund’s net assets were affected by the fund’s net investment gain or loss, by distributions to shareholders, and by changes in the number of the fund’s shares. It lists distributions and their sources (net investment income or realized capital gains) over the current reporting period and the most recent fiscal year-end. The distributions listed here may not match the sources listed in the Statement of operations because the distributions are determined on a tax basis and may be paid in a different period from the one in which they were earned.
Financial highlights provide an overview of the fund’s investment results, per-share distributions, expense ratios, net investment income ratios, and portfolio turnover in one summary table, reflecting the five most recent reporting periods. In a semiannual report, the highlights table also includes the current reporting period.
The Putnam Fund for Growth and Income 23
Report of Independent Registered Public Accounting Firm
To the Trustees and Shareholders of The Putnam Fund for Growth and Income:
In our opinion, the accompanying statement of assets and liabilities, including the portfolio, and the related statements of operations and of changes in net assets and the financial highlights present fairly, in all material respects, the financial position of The Putnam Fund for Growth and Income (the “fund”) at October 31, 2014, and the results of its operations, the changes in its net assets and the financial highlights for each of the periods indicated, in conformity with accounting principles generally accepted in the United States of America. These financial statements and financial highlights (hereafter referred to as “financial statements”) are the responsibility of the fund’s management. Our responsibility is to express an opinion on these financial statements based on our audits. We conducted our audits of these financial statements in accordance with the standards of the Public Company Accounting Oversight Board (United States). Those standards require that we plan and perform the audit to obtain reasonable assurance about whether the financial statements are free of material misstatement. An audit includes examining, on a test basis, evidence supporting the amounts and disclosures in the financial statements, assessing the accounting principles used and significant estimates made by management, and evaluating the overall financial statement presentation. We believe that our audits, which included confirmation of investments owned at October 31, 2014 by correspondence with the custodian, brokers, and transfer agent, provide a reasonable basis for our opinion.
PricewaterhouseCoopers LLP Boston, Massachusetts December 10, 2014
24 The Putnam Fund for Growth and Income
The fund’s portfolio 10/31/14
COMMON STOCKS (93.3%)*
Shares
Value
Aerospace and defense (6.0%)
Airbus Group NV (France)
314,603
$18,766,052
Embraer SA ADR (Brazil) S
227,300
8,782,872
General Dynamics Corp.
382,000
53,388,320
Honeywell International, Inc.
640,200
61,536,024
L-3 Communications Holdings, Inc.
398,200
48,365,372
Northrop Grumman Corp.
464,100
64,027,236
Raytheon Co.
329,100
34,186,908
Rockwell Collins, Inc.
144,000
12,117,600
United Technologies Corp.
344,200
36,829,400
337,999,784
Airlines (1.1%)
American Airlines Group, Inc. S
573,600
23,718,360
Delta Air Lines, Inc.
543,500
21,865,005
Japan Airlines Co., Ltd. (Japan) UR
579,000
15,402,199
60,985,564
Auto components (0.4%)
Dana Holding Corp. S
372,600
7,623,396
Johnson Controls, Inc.
265,200
12,530,700
20,154,096
Automobiles (0.6%)
Ford Motor Co.
710,200
10,006,718
General Motors Co.
727,600
22,846,640
32,853,358
Banks (9.9%)
Bank of America Corp.
5,098,894
87,497,021
Citigroup, Inc.
2,430,580
130,108,947
Fifth Third Bancorp
837,100
16,733,629
JPMorgan Chase & Co.
2,548,746
154,148,158
Regions Financial Corp.
2,768,000
27,486,240
SVB Financial Group †
80,465
9,011,275
Wells Fargo & Co.
2,435,679
129,310,198
554,295,468
Beverages (0.9%)
Coca-Cola Enterprises, Inc.
387,400
16,793,790
Dr. Pepper Snapple Group, Inc.
81,600
5,650,800
PepsiCo, Inc.
301,900
29,033,723
51,478,313
Biotechnology (0.2%)
Gilead Sciences, Inc. †
97,000
10,864,000
10,864,000
Capital markets (4.0%)
Carlyle Group LP (The)
830,347
23,050,433
Charles Schwab Corp. (The)
1,246,800
35,745,756
E*Trade Financial Corp. †
268,900
5,996,470
Goldman Sachs Group, Inc. (The)
132,893
25,248,341
Greenhill & Co., Inc. S
285,900
12,865,500
KKR & Co. LP
1,128,577
24,332,120
Morgan Stanley
1,308,800
45,742,560
State Street Corp.
551,800
41,638,828
WisdomTree Investments, Inc. † S
708,300
10,447,425
225,067,433
The Putnam Fund for Growth and Income 25
COMMON STOCKS (93.3%)* cont.
Shares
Value
Chemicals (2.5%)
Axiall Corp. S
318,700
$12,843,610
CF Industries Holdings, Inc.
60,700
15,782,000
Dow Chemical Co. (The)
1,068,100
52,764,140
Huntsman Corp.
811,700
19,805,480
Linde AG (Germany)
69,691
12,851,093
Monsanto Co.
171,700
19,752,368
Symrise AG (Germany)
163,149
9,174,702
142,973,393
Commercial services and supplies (0.8%)
ADT Corp. (The) S
303,821
10,888,945
Tyco International, Ltd.
762,742
32,744,514
43,633,459
Communications equipment (0.6%)
Cisco Systems, Inc.
1,356,257
33,187,609
33,187,609
Consumer finance (0.6%)
Capital One Financial Corp.
403,938
33,433,948
33,433,948
Containers and packaging (0.8%)
MeadWestvaco Corp.
384,900
17,001,033
Packaging Corp. of America
347,500
25,047,800
42,048,833
Diversified consumer services (0.1%)
ITT Educational Services, Inc. † S
616,249
6,230,277
6,230,277
Diversified financial services (0.8%)
CBOE Holdings, Inc.
225,100
13,267,394
CME Group, Inc.
369,900
31,001,319
44,268,713
Diversified telecommunication services (1.2%)
AT&T, Inc. S
547,200
19,064,448
Verizon Communications, Inc.
975,614
49,024,604
68,089,052
Electric utilities (1.7%)
American Electric Power Co., Inc.
225,400
13,149,836
Edison International
376,100
23,536,338
Exelon Corp.
1,191,000
43,578,690
NextEra Energy, Inc.
172,500
17,287,950
97,552,814
Electrical equipment (0.5%)
Eaton Corp PLC
371,700
25,420,563
25,420,563
Electronic equipment, instruments, and components (0.3%)
Corning, Inc.
747,100
15,263,253
15,263,253
Energy equipment and services (1.8%)
Aker Solutions ASA 144A (Norway) †
524,355
3,397,255
Ezion Holdings, Ltd. (Singapore) S
6,999,920
8,227,508
Halliburton Co.
737,200
40,649,208
Oil States International, Inc. †
148,200
8,853,468
Schlumberger, Ltd.
293,739
28,980,290
Transocean, Ltd. (Switzerland) S
432,900
12,913,407
103,021,136
26 The Putnam Fund for Growth and Income
COMMON STOCKS (93.3%)*cont.
Shares
Value
Food and staples retail (1.9%)
CVS Health Corp.
986,800
$84,677,308
Wal-Mart Stores, Inc.
310,200
23,658,954
108,336,262
Food products (2.0%)
Hershey Co. (The)
265,000
25,416,150
Kellogg Co.
440,500
28,174,380
Kraft Foods Group, Inc.
287,900
16,223,165
Mead Johnson Nutrition Co.
166,600
16,545,046
Mondelez International, Inc. Class A
757,000
26,691,820
113,050,561
Health-care equipment and supplies (3.2%)
Abbott Laboratories
410,600
17,898,054
Baxter International, Inc.
708,500
49,694,190
Covidien PLC
155,472
14,371,832
Medtronic, Inc.
670,000
45,667,200
St. Jude Medical, Inc.
365,500
23,454,135
Zimmer Holdings, Inc.
261,100
29,044,764
180,130,175
Health-care providers and services (1.2%)
Catamaran Corp. †
196,000
9,343,320
CIGNA Corp.
181,800
18,101,826
HCA Holdings, Inc. †
255,500
17,897,775
UnitedHealth Group, Inc.
201,900
19,182,519
64,525,440
Hotels, restaurants, and leisure (1.1%)
Hilton Worldwide Holdings, Inc. †
1,024,100
25,848,284
Intrawest Resorts Holdings, Inc. †
471,489
5,016,643
Penn National Gaming, Inc. †
1,321,736
17,301,524
Vail Resorts, Inc.
156,300
13,498,068
61,664,519
Household durables (0.9%)
PulteGroup, Inc.
928,900
17,825,591
Whirlpool Corp.
180,000
30,969,000
48,794,591
Household products (0.3%)
Colgate-Palmolive Co.
170,300
11,389,664
Energizer Holdings, Inc.
49,300
6,046,645
17,436,309
Independent power and renewable electricity producers (1.4%)
Zalando SE (acquired 9/30/13, cost $5,246,454) (Germany) † ΔΔ F S
218,790
4,565,042
6,142,625
Internet software and services (0.8%)
Alibaba Group Holding, Ltd. ADR (China) † S
140,000
13,804,000
Google, Inc. Class C †
55,091
30,800,276
44,604,276
IT Services (0.5%)
Computer Sciences Corp.
278,700
16,833,480
Fidelity National Information Services, Inc.
149,700
8,740,983
25,574,463
Media (2.8%)
CBS Corp. Class B (non-voting shares)
356,300
19,318,586
Comcast Corp. Class A S
806,700
44,650,845
DISH Network Corp. Class A †
375,000
23,868,750
Liberty Global PLC Ser. C (United Kingdom)
873,400
38,840,098
Time Warner, Inc.
262,600
20,868,822
WPP PLC (United Kingdom)
390,545
7,609,516
155,156,617
Metals and mining (0.9%)
Barrick Gold Corp. (Canada)
674,000
8,000,380
BHP Billiton, Ltd. (Australia)
422,207
12,617,568
Freeport-McMoRan, Inc. (Indonesia)
846,938
24,137,733
Goldcorp, Inc. (Canada)
167,800
3,151,284
Newmont Mining Corp.
222,000
4,164,720
52,071,685
Multi-utilities (0.9%)
Ameren Corp.
435,400
18,434,836
CMS Energy Corp.
269,700
8,811,099
PG&E Corp. S
411,300
20,696,616
47,942,551
Multiline retail (0.4%)
Macy’s, Inc.
362,000
20,930,840
20,930,840
Oil, gas, and consumable fuels (10.9%)
Anadarko Petroleum Corp.
159,700
14,657,266
Cabot Oil & Gas Corp.
837,100
26,033,810
Cheniere Energy, Inc. †
150,400
11,280,000
Chevron Corp.
526,200
63,117,690
CONSOL Energy, Inc.
476,400
17,531,520
EnCana Corp. (Canada)
808,026
15,055,717
Energen Corp.
147,400
9,978,980
28 The Putnam Fund for Growth and Income
COMMON STOCKS (93.3%)*cont.
Shares
Value
Oil, gas, and consumable fuels cont.
EOG Resources, Inc.
158,100
$15,027,405
EP Energy Corp. Class A † S
900,010
13,140,146
Exxon Mobil Corp.
1,190,392
115,122,810
Gaztransport Et Technigaz SA (France)
136,463
7,635,535
Gulfport Energy Corp. †
435,700
21,863,426
Kodiak Oil & Gas Corp. †
2,026,300
21,863,777
Marathon Oil Corp.
1,173,600
41,545,440
MPLX LP
189,100
12,609,188
Noble Energy, Inc.
115,200
6,638,976
Nordic American Tankers, Ltd. (Norway) S
866,400
7,321,080
Occidental Petroleum Corp.
224,814
19,992,709
Peabody Energy Corp.
1,063,500
11,092,305
QEP Resources, Inc.
1,188,100
29,785,667
Royal Dutch Shell PLC ADR (United Kingdom) S
1,113,728
79,954,533
Scorpio Tankers, Inc. S
1,689,800
14,751,954
Southwestern Energy Co. †
316,500
10,289,415
Suncor Energy, Inc. (Canada)
670,682
23,814,998
610,104,347
Paper and forest products (0.2%)
Louisiana-Pacific Corp. † S
784,500
11,453,700
11,453,700
Personal products (0.7%)
Avon Products, Inc. S
1,155,000
12,012,000
Coty, Inc. Class A †
1,680,545
27,897,047
39,909,047
Pharmaceuticals (10.1%)
AbbVie, Inc.
481,300
30,543,298
Actavis PLC †
184,400
44,761,256
AstraZeneca PLC ADR (United Kingdom) S
961,700
70,146,398
Bristol-Myers Squibb Co.
671,100
39,051,309
Eli Lilly & Co.
668,500
44,341,605
Johnson & Johnson
759,700
81,880,466
Merck & Co., Inc.
1,553,091
89,986,093
Pfizer, Inc.
2,887,734
86,487,633
Sanofi ADR (France)
505,800
23,388,192
Teva Pharmaceutical Industries, Ltd. ADR (Israel) S
417,100
23,553,637
Zoetis, Inc.
809,838
30,093,580
564,233,467
Real estate investment trusts (REITs) (0.8%)
Altisource Residential Corp.
489,934
11,376,267
American Tower Corp.
209,000
20,377,500
Equity Lifestyle Properties, Inc.
318,000
15,613,800
47,367,567
Semiconductors and semiconductor equipment (2.3%)
Fairchild Semiconductor International, Inc. † S
551,400
8,463,990
Intel Corp. S
1,401,800
47,675,218
Lam Research Corp.
432,750
33,693,915
Micron Technology, Inc. †
1,120,400
37,074,036
126,907,159
The Putnam Fund for Growth and Income 29
COMMON STOCKS (93.3%)*cont.
Shares
Value
Software (2.0%)
Microsoft Corp.
1,009,800
$47,410,110
Oracle Corp.
1,339,400
52,303,570
TiVo, Inc. †
862,100
11,250,405
110,964,085
Specialty retail (1.8%)
Bed Bath & Beyond, Inc. † S
268,300
18,067,322
Gap, Inc. (The)
526,100
19,933,929
Home Depot, Inc. (The)
212,300
20,703,496
Michaels Cos., Inc. (The) †
666,000
12,174,480
Office Depot, Inc. †
2,731,500
14,258,430
Tile Shop Holdings, Inc. † S
1,188,500
10,232,985
WH Smith PLC (United Kingdom)
405,451
7,296,752
102,667,394
Technology hardware, storage, and peripherals (2.8%)
Apple, Inc.
555,600
60,004,800
Hewlett-Packard Co.
721,100
25,873,068
NetApp, Inc.
244,500
10,464,600
QLogic Corp. †
962,600
11,368,306
Samsung Electronics Co., Ltd. (South Korea)
15,571
18,124,619
SanDisk Corp. S
213,200
20,070,648
Western Digital Corp.
123,800
12,178,206
158,084,247
Thrifts and mortgage finance (0.6%)
Radian Group, Inc. S
2,089,055
35,200,577
35,200,577
Tobacco (0.7%)
Philip Morris International, Inc.
439,400
39,110,994
39,110,994
Wireless telecommunication services (0.5%)
Vodafone Group PLC ADR (United Kingdom)
795,022
26,410,632
26,410,632
Total common stocks (cost $4,281,298,887)
$5,218,880,375
INVESTMENT COMPANIES (0.7%)*
Shares
Value
Vanguard MSCI Emerging Markets ETF S
983,400
$41,932,176
Total investment companies (cost $42,826,646)
$41,932,176
CONVERTIBLE PREFERRED STOCKS (0.1%)*
Shares
Value
American Tower Corp. Ser. A, $5.25 cv. pfd. R
36,952
$3,958,483
Total convertible preferred stocks (cost $3,695,200)
$3,958,483
SHORT-TERM INVESTMENTS (11.7%)*
Principal amount/shares
Value
Putnam Cash Collateral Pool, LLC 0.18% d
Shares 321,582,012
$321,582,012
Putnam Money Market Liquidity Fund 0.07% L
Shares 5,482,224
5,482,224
Putnam Short Term Investment Fund 0.09% L
Shares 324,163,340
324,163,340
U.S. Treasury Bills with an effective yield of 0.12%, February 5, 2015 Δ
$315,000
314,984
U.S. Treasury Bills with effective yields ranging from 0.01% to 0.02%, January 15, 2015 Δ
1,010,000
1,009,970
30 The Putnam Fund for Growth and Income
SHORT-TERM INVESTMENTS (11.7%)*cont.
Principal amount/shares
Value
U.S. Treasury Bills with effective yields ranging from 0.01% to 0.10%, January 8, 2015 Δ
$1,131,000
$1,130,980
U.S. Treasury Bills with effective yields ranging from zero % to 0.01%, December 18, 2014 Δ
463,000
462,995
U.S. Treasury Bills with an effective yield of 0.01%, December 11, 2014 Δ
80,000
79,999
U.S. Treasury Bills with an effective yield of zero %, December 4, 2014 Δ
1,270,000
1,269,996
Total short-term investments (cost $655,496,280)
$655,496,500
TOTAL INVESTMENTS
Total investments (cost $4,983,317,013)
$5,920,267,534
Key to holding’s abbreviations
ADR American Depository Receipts: represents ownership of foreign securities on deposit with a custodian bank
ETF Exchange Traded Fund
Notes to the fund’s portfolio
Unless noted otherwise, the notes to the fund’s portfolio are for the close of the fund’s reporting period, which ran from November 1, 2013 through October 31, 2014 (the reporting period). Within the following notes to the portfolio, references to “ASC 820” represent Accounting Standards Codification 820 Fair Value Measurements and Disclosures and references to “OTC”, if any, represent over-the-counter.
*
Percentages indicated are based on net assets of $5,593,904,764.
†
Non-income-producing security.
ΔΔ
Security is restricted with regard to public resale. The total fair value of this security and any other restricted securities (excluding 144A securities), if any, held at the close of the reporting period was $6,142,625, or 0.1% of net assets.
Δ
This security, in part or in entirety, was pledged and segregated with the custodian for collateral on certain derivative contracts at the close of the reporting period.
d
Affiliated company. See Note 1 to the financial statements regarding securities lending. The rate quoted in the security description is the annualized 7-day yield of the fund at the close of the reporting period.
F
Security is valued at fair value following procedures approved by the Trustees. Securities may be classified as Level 2 or Level 3 for ASC 820 based on the securities’ valuation inputs (Note 1).
L
Affiliated company (Note 5). The rate quoted in the security description is the annualized 7-day yield of the fund at the close of the reporting period.
R
Real Estate Investment Trust.
S
Security on loan, in part or in entirety, at the close of the reporting period (Note 1).
UR
At the reporting period end, 72,600 shares owned by the fund were not formally entered on the company’s shareholder register, due to local restrictions on foreign ownership. While the fund has full title to these unregistered shares, these shares do not carry voting rights.
At the close of the reporting period, the fund maintained liquid assets totaling $4,020,823 to cover certain derivatives contracts.
Debt obligations are considered secured unless otherwise indicated.
144A after the name of an issuer represents securities exempt from registration under Rule 144A under the Securities Act of 1933, as amended. These securities may be resold in transactions exempt from registration, normally to qualified institutional buyers.
The Putnam Fund for Growth and Income 31
FORWARD CURRENCY CONTRACTS at 10/31/14 (aggregate face value $95,103,567)
Counterparty
Currency
Contract type
Delivery date
Value
Aggregate face value
Unrealized appreciation/ (depreciation)
Credit Suisse International
British Pound
Sell
12/17/14
$60,240,379
$59,893,132
$(347,247)
Euro
Sell
12/17/14
34,518,890
35,210,435
691,545
Total
$344,298
OTC TOTAL RETURN SWAP CONTRACTS OUTSTANDING at 10/31/14
Swap counterparty/ Notional amount
Upfront premium received (paid)
Termination date
Payments received (paid) by fund per annum
Total return received by or paid by fund
Unrealized appreciation/ (depreciation)
Bank of America N.A.
shares
126,680
$—
5/6/15
(3 month USD-LIBOR-BBA plus 0.48%)
BofA MLTR GOLD Index
$(4,012,574)
Total
$—
$(4,012,574)
32 The Putnam Fund for Growth and Income
ASC 820 establishes a three-level hierarchy for disclosure of fair value measurements. The valuation hierarchy is based upon the transparency of inputs to the valuation of the fund’s investments. The three levels are defined as follows:
Level 1: Valuations based on quoted prices for identical securities in active markets.
Level 2: Valuations based on quoted prices in markets that are not active or for which all significant inputs are observable, either directly or indirectly.
Level 3: Valuations based on inputs that are unobservable and significant to the fair value measurement.
The following is a summary of the inputs used to value the fund’s net assets as of the close of the reporting period:
Valuation inputs
Investments in securities:
Level 1
Level 2
Level 3
Common stocks*:
Consumer discretionary
$448,451,692
$4,565,042
$1,577,583
Consumer staples
369,321,486
—
—
Energy
713,125,483
—
—
Financials
1,189,240,571
—
—
Health care
819,753,082
—
—
Industrials
592,642,296
—
—
Information technology
514,585,092
—
—
Materials
248,547,611
—
—
Telecommunication services
94,499,684
—
—
Utilities
222,570,753
—
—
Total common stocks
5,212,737,750
4,565,042
1,577,583
Convertible preferred stocks
—
3,958,483
—
Investment companies
41,932,176
—
—
Short-term investments
329,645,564
325,850,936
—
Totals by level
$5,584,315,490
$334,374,461
$1,577,583
Valuation inputs
Other financial instruments:
Level 1
Level 2
Level 3
Forward currency contracts
$—
$344,298
$—
Total return swap contracts
—
(4,012,574)
—
Totals by level
$—
$(3,668,276)
$—
*Common stock classifications are presented at the sector level, which may differ from the fund’s portfolio presentation.
During the reporting period, transfers within the fair value hierarchy (other than certain transfers involving non-U.S. equity securities as described in Note 1) did not represent, in the aggregate, more than 1% of the fund’s net assets measured as of the end of the period.
At the start and close of the reporting period, Level 3 investments in securities represented less than 1% of the fund’s net assets and were not considered a significant portion of the fund’s portfolio.
The accompanying notes are an integral part of these financial statements.
The Putnam Fund for Growth and Income 33
Statement of assets and liabilities 10/31/14
ASSETS
Investment in securities, at value, including $311,048,132 of securities on loan (Note 1):
Affiliated issuers (identified cost $651,227,576) (Notes 1 and 5)
651,227,576
Foreign currency (cost $13) (Note 1)
12
Dividends, interest and other receivables
5,184,757
Receivable for shares of the fund sold
954,031
Receivable for investments sold
45,200,878
Unrealized appreciation on forward currency contracts (Note 1)
691,545
Prepaid assets
39,860
Total assets
5,972,338,617
LIABILITIES
Payable to custodian
2,380,016
Payable for investments purchased
38,521,151
Payable for shares of the fund repurchased
3,483,286
Payable for compensation of Manager (Note 2)
2,157,269
Payable for custodian fees (Note 2)
32,709
Payable for investor servicing fees (Note 2)
1,785,843
Payable for Trustee compensation and expenses (Note 2)
2,208,175
Payable for administrative services (Note 2)
15,428
Payable for distribution fees (Note 2)
1,238,404
Unrealized depreciation on OTC swap contracts (Note 1)
4,012,574
Unrealized depreciation on forward currency contracts (Note 1)
347,247
Collateral on securities loaned, at value (Note 1)
321,582,012
Other accrued expenses
669,739
Total liabilities
378,433,853
Net assets
$5,593,904,764
REPRESENTED BY
Paid-in capital (Unlimited shares authorized) (Notes 1 and 4)
$5,155,667,302
Undistributed net investment income (Note 1)
22,573,924
Accumulated net realized loss on investments and foreign currency transactions (Note 1)
(517,616,204)
Net unrealized appreciation of investments and assets and liabilities in foreign currencies
933,279,742
Total — Representing net assets applicable to capital shares outstanding
$5,593,904,764
(Continued on next page)
The accompanying notes are an integral part of these financial statements.
34 The Putnam Fund for Growth and Income
Statement of assets and liabilities (Continued)
COMPUTATION OF NET ASSET VALUE AND OFFERING PRICE
Net asset value and redemption price per class A share ($5,322,463,779 divided by 248,595,211 shares)
$21.41
Offering price per class A share (100/94.25 of $21.41)*
$22.72
Net asset value and offering price per class B share ($90,424,687 divided by 4,301,942 shares)**
$21.02
Net asset value and offering price per class C share ($58,083,669 divided by 2,726,054 shares)**
$21.31
Net asset value and redemption price per class M share ($37,565,954 divided by 1,769,691 shares)
$21.23
Offering price per class M share (100/96.50 of $21.23)*
$22.00
Net asset value, offering price and redemption price per class R share ($3,851,785 divided by 180,881 shares)
$21.29
Net asset value, offering price and redemption price per class R5 share ($16,346 divided by 760 shares)†
$21.52
Net asset value, offering price and redemption price per class R6 share ($19,726,954 divided by 918,620 shares)
$21.47
Net asset value, offering price and redemption price per class Y share ($61,771,590 divided by 2,878,386 shares)
$21.46
*
On single retail sales of less than $50,000. On sales of $50,000 or more the offering price is reduced.
**
Redemption price per share is equal to net asset value less any applicable contingent deferred sales charge.
†
Net asset value may not recalculate due to rounding of fractional shares.
The accompanying notes are an integral part of these financial statements.
The Putnam Fund for Growth and Income 35
Statement of operations Year ended 10/31/14
INVESTMENT INCOME
Dividends (net of foreign tax of $1,502,377)
$136,312,034
Interest (including interest income of $122,771 from investments in affiliated issuers) (Note 5)
125,136
Securities lending (Note 1)
1,707,383
Total investment income
138,144,553
EXPENSES
Compensation of Manager (Note 2)
25,984,443
Investor servicing fees (Note 2)
11,475,604
Custodian fees (Note 2)
90,415
Trustee compensation and expenses (Note 2)
318,054
Distribution fees (Note 2)
14,903,476
Administrative services (Note 2)
135,560
Other
1,706,720
Total expenses
54,614,272
Expense reduction (Note 2)
(284,531)
Net expenses
54,329,741
Net investment income
83,814,812
Net realized gain on investments (Notes 1 and 3)
628,572,026
Net realized gain on swap contracts (Note 1)
1,521,874
Net realized loss on foreign currency transactions (Note 1)
(60,376)
Net unrealized appreciation of assets and liabilities in foreign currencies during the year
341,994
Net unrealized appreciation of investments and swap contracts during the year
39,974,115
Net gain on investments
670,349,633
Net increase in net assets resulting from operations
$754,164,445
The accompanying notes are an integral part of these financial statements.
36 The Putnam Fund for Growth and Income
Statement of changes in net assets
INCREASE IN NET ASSETS
Year ended 10/31/14
Year ended 10/31/13
Operations:
Net investment income
$83,814,812
$63,713,107
Net realized gain on investments and foreign currency transactions
630,033,524
717,592,387
Net unrealized appreciation of investments and assets and liabilities in foreign currencies
40,316,109
557,094,370
Net increase in net assets resulting from operations
754,164,445
1,338,399,864
Distributions to shareholders (Note 1):
From ordinary income
Net investment income
Class A
(60,308,154)
(65,083,848)
Class B
(384,347)
(643,626)
Class C
(229,125)
(286,353)
Class M
(248,118)
(311,377)
Class R
(34,943)
(40,373)
Class R5
(209)
(217)
Class R6
(297,302)
(132,226)
Class Y
(718,886)
(786,661)
Decrease from capital share transactions (Note 4)
(369,128,165)
(442,555,982)
Total increase in net assets
322,815,196
828,559,201
NET ASSETS
Beginning of year
5,271,089,568
4,442,530,367
End of year (including undistributed net investment income of $22,573,924 and $4,033,168, respectively)
$5,593,904,764
$5,271,089,568
The accompanying notes are an integral part of these financial statements.
The Putnam Fund for Growth and Income 37
Financial highlights (For a common share outstanding throughout the period)
INVESTMENT OPERATIONS:
LESS DISTRIBUTIONS:
RATIOS AND SUPPLEMENTAL DATA:
Period ended
Net asset value, beginning of period
Net investment income (loss)a
Net realized and unrealized gain (loss) on investments
Total from investment operations
From net investment income
Total distributions
Redemption fees
Non-recurring reimbursements
Net asset value, end of period
Total return at net asset value (%)b
Net assets, end of period (in thousands)
Ratio of expenses to average net assets (%)c
Ratio of net investment income (loss) to average net assets (%)
Portfolio turnover (%)
Class A
October 31, 2014
$18.87
.31
2.46
2.77
(.23)
(.23)
—
—
$21.41
14.78
$5,322,464
.97
1.54
41
October 31, 2013
14.51
.22
4.37
4.59
(.23)
(.23)
—
—
18.87
31.93
5,024,361
1.04
1.33
52
October 31, 2012
12.79
.21
1.73
1.94
(.22)
(.22)
—
—
14.51
15.33
4,232,973
1.10
1.57
34
October 31, 2011
12.56
.16
.21
.37
(.15)
(.15)
—
.01d
12.79
2.99
4,176,494
1.10
1.17
45
October 31, 2010
11.15
.12
1.40
1.52
(.11)
(.11)
—e
—
12.56
13.65
4,607,805
1.16
.99
48
Class B
October 31, 2014
$18.52
.16
2.42
2.58
(.08)
(.08)
—
—
$21.02
13.97
$90,425
1.72
.81
41
October 31, 2013
14.25
.10
4.28
4.38
(.11)
(.11)
—
—
18.52
30.89
95,272
1.79
.60
52
October 31, 2012
12.56
.11
1.70
1.81
(.12)
(.12)
—
—
14.25
14.50
91,289
1.85
.84
34
October 31, 2011
12.34
.06
.19
.25
(.04)
(.04)
—
.01d
12.56
2.14
108,621
1.85
.41
45
October 31, 2010
10.95
.03
1.38
1.41
(.02)
(.02)
—e
—
12.34
12.85
159,231
1.91
.27
48
Class C
October 31, 2014
$18.78
.16
2.46
2.62
(.09)
(.09)
—
—
$21.31
13.97
$58,084
1.72
.77
41
October 31, 2013
14.45
.09
4.35
4.44
(.11)
(.11)
—
—
18.78
30.91
48,304
1.79
.56
52
October 31, 2012
12.74
.11
1.72
1.83
(.12)
(.12)
—
—
14.45
14.46
36,561
1.85
.82
34
October 31, 2011
12.51
.06
.21
.27
(.05)
(.05)
—
.01d
12.74
2.21
36,035
1.85
.42
45
October 31, 2010
11.10
.03
1.40
1.43
(.02)
(.02)
—e
—
12.51
12.88
37,264
1.91
.24
48
Class M
October 31, 2014
$18.71
.21
2.44
2.65
(.13)
(.13)
—
—
$21.23
14.23
$37,566
1.47
1.05
41
October 31, 2013
14.39
.14
4.33
4.47
(.15)
(.15)
—
—
18.71
31.29
36,125
1.54
.83
52
October 31, 2012
12.69
.15
1.70
1.85
(.15)
(.15)
—
—
14.39
14.72
30,627
1.60
1.08
34
October 31, 2011
12.46
.09
.21
.30
(.08)
(.08)
—
.01d
12.69
2.48
33,357
1.60
.67
45
October 31, 2010
11.06
.06
1.39
1.45
(.05)
(.05)
—e
—
12.46
13.09
38,209
1.66
.49
48
Class R
October 31, 2014
$18.77
.26
2.44
2.70
(.18)
(.18)
—
—
$21.29
14.46
$3,852
1.22
1.28
41
October 31, 2013
14.43
.18
4.35
4.53
(.19)
(.19)
—
—
18.77
31.63
4,082
1.29
1.09
52
October 31, 2012
12.72
.18
1.72
1.90
(.19)
(.19)
—
—
14.43
15.06
3,446
1.35
1.31
34
October 31, 2011
12.50
.12
.20
.32
(.11)
(.11)
—
.01d
12.72
2.65
3,151
1.35
.92
45
October 31, 2010
11.09
.09
1.40
1.49
(.08)
(.08)
—e
—
12.50
13.45
3,554
1.41
.74
48
Class R5
October 31, 2014
$18.93
.35
2.52
2.87
(.28)
(.28)
—
—
$21.52
15.25
$16
.66
1.67
41
October 31, 2013
14.54
.29
4.39
4.68
(.29)
(.29)
—
—
18.93
32.55
14
.67
1.68
52
October 31, 2012†
13.64
.08
.88
.96
(.06)
(.06)
—
—
14.54
7.01*
11
.22*
.53*
34
Class R6
October 31, 2014
$18.92
.40
2.47
2.87
(.32)
(.32)
—
—
$21.47
15.26
$19,727
.56
1.94
41
October 31, 2013
14.54
.27
4.42
4.69
(.31)
(.31)
—
—
18.92
32.62
18,293
.57
1.49
52
October 31, 2012†
13.64
.08
.88
.96
(.06)
(.06)
—
—
14.54
7.02*
11
.19*
.57*
34
Class Y
October 31, 2014
$18.91
.36
2.48
2.84
(.29)
(.29)
—
—
$21.46
15.09
$61,772
.72
1.75
41
October 31, 2013
14.54
.27
4.37
4.64
(.27)
(.27)
—
—
18.91
32.26
44,639
.79
1.63
52
October 31, 2012
12.82
.25
1.72
1.97
(.25)
(.25)
—
—
14.54
15.59
47,613
.85
1.82
34
October 31, 2011
12.59
.20
.20
.40
(.18)
(.18)
—
.01d
12.82
3.26
44,370
.85
1.45
45
October 31, 2010
11.17
.15
1.41
1.56
(.14)
(.14)
—e
—
12.59
13.99
74,376
.91
1.24
48
See notes to financial highlights at the end of this section.
The accompanying notes are an integral part of these financial statements.
38
The Putnam Fund for Growth and Income
The Putnam Fund for Growth and Income
39
Financial highlights (Continued)
*Not annualized.
†For the period July 3, 2012 (commencement of operations) to October 31, 2012.
a Per share net investment income (loss) has been determined on the basis of the weighted average number of shares outstanding during the period.
b Total return assumes dividend reinvestment and does not reflect the effect of sales charges.
c Includes amounts paid through expense offset and brokerage/service arrangements, if any (Note 2). Also excludes acquired fund fees, if any.
d Reflects a non-recurring reimbursement related to restitution amounts in connection with a distribution plan approved by the Securities and Exchange Commission (the SEC) which amounted to $0.01 per share outstanding on July 21, 2011. Also reflects a non-recurring reimbursement related to short-term trading related lawsuits, which amounted to less than $0.01 per share outstanding on May 11, 2011.
e Amount represents less than $0.01 per share.
The accompanying notes are an integral part of these financial statements.
40 The Putnam Fund for Growth and Income
Notes to financial statements 10/31/14
Within the following Notes to financial statements, references to “State Street” represent State Street Bank and Trust Company, references to “the SEC” represent the Securities and Exchange Commission, references to “Putnam Management” represent Putnam Investment Management, LLC, the fund’s manager, an indirect wholly-owned subsidiary of Putnam Investments, LLC and references to “OTC”, if any, represent over-the-counter. Unless otherwise noted, the “reporting period” represents the period from November 1, 2013 through October 31, 2014.
The Putnam Fund for Growth and Income (the fund) is a Massachusetts business trust, which is registered under the Investment Company Act of 1940, as amended, as a diversified open-end management investment company. The goal of the fund is to seek capital growth and current income by investing mainly in common stocks of large U.S. companies, with a focus on value stocks that offer the potential for capital growth, current income, or both. Value stocks are issued by companies that Putnam Management believes are currently undervalued by the market.
The fund offers class A, class B, class C, class M, class R, class R5, class R6 and class Y shares. Class A and class M shares are sold with a maximum front-end sales charge of 5.75% and 3.50%, respectively, and generally do not pay a contingent deferred sales charge. Class B shares, which convert to class A shares after approximately eight years, do not pay a front-end sales charge and are subject to a contingent deferred sales charge if those shares are redeemed within six years of purchase. Class C shares have a one-year 1.00% contingent deferred sales charge and do not convert to class A shares. Class R shares, which are not available to all investors, are sold at net asset value. The expenses for class A, class B, class C, class M and class R shares may differ based on the distribution fee of each class, which is identified in Note 2. Class R5, class R6 and class Y shares, which are sold at net asset value, are generally subject to the same expenses as class A, class B, class C, class M and class R shares, but do not bear a distribution fee and in the case of class R5 and class R6 shares, bear a lower investor servicing fee, which is identified in Note 2. Class R5, class R6 and class Y shares are not available to all investors.
In the normal course of business, the fund enters into contracts that may include agreements to indemnify another party under given circumstances. The fund’s maximum exposure under these arrangements is unknown as this would involve future claims that may be, but have not yet been, made against the fund. However, the fund’s management team expects the risk of material loss to be remote.
Note 1: Significant accounting policies
The following is a summary of significant accounting policies consistently followed by the fund in the preparation of its financial statements. The preparation of financial statements is in conformity with accounting principles generally accepted in the United States of America and requires management to make estimates and assumptions that affect the reported amounts of assets and liabilities in the financial statements and the reported amounts of increases and decreases in net assets from operations. Actual results could differ from those estimates. Subsequent events after the Statement of assets and liabilities date through the date that the financial statements were issued have been evaluated in the preparation of the financial statements.
Investment income, realized and unrealized gains and losses and expenses of the fund are borne pro-rata based on the relative net assets of each class to the total net assets of the fund, except that each class bears expenses unique to that class (including the distribution fees applicable to such classes). Each class votes as a class only with respect to its own distribution plan or other matters on which a class vote is required by law or determined by the Trustees. If the fund were liquidated, shares of each class would receive their pro-rata share of the net assets of the fund. In addition, the Trustees declare separate dividends on each class of shares.
Security valuation Investments for which market quotations are readily available are valued at the last reported sales price on their principal exchange, or official closing price for certain markets, and are classified as Level 1 securities under Accounting Standards Codification 820 Fair Value Measurements and Disclosures (ASC 820). If no sales are reported, as in the case of some securities that are traded OTC, a security is valued at its last reported bid price and is generally categorized as a Level 2 security.
Investments in open-end investment companies (excluding exchange traded funds), if any, which can be classified as Level 1 or Level 2 securities, are valued based on their net asset value. The net asset value of such investment companies equals the total value of their assets less their liabilities and divided by the number of their outstanding shares.
Market quotations are not considered to be readily available for certain debt obligations and other investments; such investments are valued on the basis of valuations furnished by an independent pricing service approved
The Putnam Fund for Growth and Income 41
by the Trustees or dealers selected by Putnam Management. Such services or dealers determine valuations for normal institutional-size trading units of such securities using methods based on market transactions for comparable securities and various relationships, generally recognized by institutional traders, between securities (which consider such factors as security prices, yields, maturities and ratings). These securities will generally be categorized as Level 2. Short-term securities with remaining maturities of 60 days or less may be valued at amortized cost, which approximates fair value and are classified as Level 2 securities.
Many securities markets and exchanges outside the U.S. close prior to the close of the New York Stock Exchange and therefore the closing prices for securities in such markets or on such exchanges may not fully reflect events that occur after such close but before the close of the New York Stock Exchange. Accordingly, on certain days, the fund will fair value foreign equity securities taking into account multiple factors including movements in the U.S. securities markets, currency valuations and comparisons to the valuation of American Depository Receipts, exchange-traded funds and futures contracts. These securities, which would generally be classified as Level 1 securities, will be transferred to Level 2 of the fair value hierarchy when they are valued at fair value. The number of days on which fair value prices will be used will depend on market activity and it is possible that fair value prices will be used by the fund to a significant extent. Securities quoted in foreign currencies, if any, are translated into U.S. dollars at the current exchange rate.
To the extent a pricing service or dealer is unable to value a security or provides a valuation that Putnam Management does not believe accurately reflects the security’s fair value, the security will be valued at fair value by Putnam Management in accordance with policies and procedures approved by the Trustees. Certain investments, including certain restricted and illiquid securities and derivatives, are also valued at fair value following procedures approved by the Trustees. These valuations consider such factors as significant market or specific security events such as interest rate or credit quality changes, various relationships with other securities, discount rates, U.S. Treasury, U.S. swap and credit yields, index levels, convexity exposures and recovery rates. These securities are classified as Level 2 or as Level 3 depending on the priority of the significant inputs.
Such valuations and procedures are reviewed periodically by the Trustees. The fair value of securities is generally determined as the amount that the fund could reasonably expect to realize from an orderly disposition of such securities over a reasonable period of time. By its nature, a fair value price is a good faith estimate of the value of a security in a current sale and does not reflect an actual market price, which may be different by a material amount.
Security transactions and related investment income Security transactions are recorded on the trade date (the date the order to buy or sell is executed). Gains or losses on securities sold are determined on the identified cost basis.
Interest income, net of any applicable withholding taxes, is recorded on the accrual basis. Dividend income, net of any applicable withholding taxes, is recognized on the ex-dividend date except that certain dividends from foreign securities, if any, are recognized as soon as the fund is informed of the ex-dividend date. Non-cash dividends, if any, are recorded at the fair value of the securities received. Dividends representing a return of capital or capital gains, if any, are reflected as a reduction of cost and/or as a realized gain. All premiums/discounts are amortized/accreted on a yield-to-maturity basis.
Foreign currency translation The accounting records of the fund are maintained in U.S. dollars. The fair value of foreign securities, currency holdings, and other assets and liabilities is recorded in the books and records of the fund after translation to U.S. dollars based on the exchange rates on that day. The cost of each security is determined using historical exchange rates. Income and withholding taxes are translated at prevailing exchange rates when earned or incurred. The fund does not isolate that portion of realized or unrealized gains or losses resulting from changes in the foreign exchange rate on investments from fluctuations arising from changes in the market prices of the securities. Such gains and losses are included with the net realized and unrealized gain or loss on investments. Net realized gains and losses on foreign currency transactions represent net realized exchange gains or losses on closed forward currency contracts, disposition of foreign currencies, currency gains and losses realized between the trade and settlement dates on securities transactions and the difference between the amount of investment income and foreign withholding taxes recorded on the fund’s books and the U.S. dollar equivalent amounts actually received or paid. Net unrealized appreciation and depreciation of assets and liabilities in foreign currencies arise from changes in the value of open forward currency contracts and assets and liabilities other than investments at the period end, resulting from changes in the exchange rate.
Forward currency contracts The fund buys and sells forward currency contracts, which are agreements between two parties to buy and sell currencies at a set price on a future date. These contracts are used to hedge foreign exchange risk.
42 The Putnam Fund for Growth and Income
The U.S. dollar value of forward currency contracts is determined using current forward currency exchange rates supplied by a quotation service. The fair value of the contract will fluctuate with changes in currency exchange rates. The contract is marked to market daily and the change in fair value is recorded as an unrealized gain or loss. The fund records a realized gain or loss equal to the difference between the value of the contract at the time it was opened and the value at the time it was closed when the contract matures or by delivery of the currency. The fund could be exposed to risk if the value of the currency changes unfavorably, if the counterparties to the contracts are unable to meet the terms of their contracts or if the fund is unable to enter into a closing position. Risks may exceed amounts recognized on the Statement of assets and liabilities.
Forward currency contracts outstanding at period end, if any, are listed after the fund’s portfolio.
Total return swap contracts The fund entered into OTC total return swap contracts, which are arrangements to exchange a market linked return for a periodic payment, both based on a notional principal amount, to gain exposure to specific sectors or industries.
To the extent that the total return of the security, index or other financial measure underlying the transaction exceeds or falls short of the offsetting interest rate obligation, the fund will receive a payment from or make a payment to the counterparty. OTC total return swap contracts are marked to market daily based upon quotations from an independent pricing service or market makers and the change, if any, is recorded as an unrealized gain or loss. Payments received or made are recorded as realized gains or losses. Certain OTC total return swap contracts may include extended effective dates. Payments related to these swap contracts are accrued based on the terms of the contract. The fund could be exposed to credit or market risk due to unfavorable changes in the fluctuation of interest rates or in the price of the underlying security or index, the possibility that there is no liquid market for these agreements or that the counterparty may default on its obligation to perform. The fund’s maximum risk of loss from counterparty risk is the fair value of the contract. This risk may be mitigated by having a master netting arrangement between the fund and the counterparty. Risk of loss may exceed amounts recognized on the Statement of assets and liabilities.
OTC total return swap contracts outstanding, including their respective notional amounts at period end, if any, are listed after the fund’s portfolio.
Master agreements The fund is a party to ISDA (International Swaps and Derivatives Association, Inc.) Master Agreements (Master Agreements) with certain counterparties that govern OTC derivative and foreign exchange contracts entered into from time to time. The Master Agreements may contain provisions regarding, among other things, the parties’ general obligations, representations, agreements, collateral requirements, events of default and early termination. With respect to certain counterparties, in accordance with the terms of the Master Agreements, collateral posted to the fund is held in a segregated account by the fund’s custodian and with respect to those amounts which can be sold or repledged, is presented in the fund’s portfolio.
Collateral pledged by the fund is segregated by the fund’s custodian and identified in the fund’s portfolio. Collateral can be in the form of cash or debt securities issued by the U.S. Government or related agencies or other securities as agreed to by the fund and the applicable counterparty. Collateral requirements are determined based on the fund’s net position with each counterparty.
Termination events applicable to the fund may occur upon a decline in the fund’s net assets below a specified threshold over a certain period of time. Termination events applicable to counterparties may occur upon a decline in the counterparty’s long-term and short-term credit ratings below a specified level. In each case, upon occurrence, the other party may elect to terminate early and cause settlement of all derivative and foreign exchange contracts outstanding, including the payment of any losses and costs resulting from such early termination, as reasonably determined by the terminating party. Any decision by one or more of the fund’s counterparties to elect early termination could impact the fund’s future derivative activity.
At the close of the reporting period, the fund had a net liability position of $4,012,574 on open derivative contracts subject to the Master Agreements. Collateral posted by the fund at period end for these agreements totaled $3,229,000 and may include amounts related to unsettled agreements.
Securities lending The fund may lend securities, through its agent, to qualified borrowers in order to earn additional income. The loans are collateralized by cash in an amount at least equal to the fair value of the securities loaned. The fair value of securities loaned is determined daily and any additional required collateral is allocated to the fund on the next business day. The risk of borrower default will be borne by the fund’s agent; the fund will bear the risk of loss with respect to the investment of the cash collateral. Income from securities lending is included in investment income on the Statement of operations. Cash collateral is invested in Putnam Cash Collateral Pool, LLC, a limited
The Putnam Fund for Growth and Income 43
liability company managed by an affiliate of Putnam Management. Investments in Putnam Cash Collateral Pool, LLC are valued at its closing net asset value each business day. There are no management fees charged to Putnam Cash Collateral Pool, LLC. At the close of the reporting period, the fund received cash collateral of $321,582,012 and the value of securities loaned amounted to $323,825,962. Certain of these securities were sold prior to the close of the reporting period and are included in Receivable for investments sold on the Statement of assets and liabilities.
Interfund lending The fund, along with other Putnam funds, may participate in an interfund lending program pursuant to an exemptive order issued by the SEC. This program allows the fund to borrow from or lend to other Putnam funds that permit such transactions. Interfund lending transactions are subject to each fund’s investment policies and borrowing and lending limits. Interest earned or paid on the interfund lending transaction will be based on the average of certain current market rates. During the reporting period, the fund did not utilize the program.
Lines of credit The fund participates, along with other Putnam funds, in a $392.5 million unsecured committed line of credit and a $235.5 million unsecured uncommitted line of credit, both provided by State Street. Borrowings may be made for temporary or emergency purposes, including the funding of shareholder redemption requests and trade settlements. Interest is charged to the fund based on the fund’s borrowing at a rate equal to the Federal Funds rate plus 1.25% for the committed line of credit and the Federal Funds rate plus 1.30% for the uncommitted line of credit. A closing fee equal to 0.04% of the committed line of credit and 0.04% of the uncommitted line of credit has been paid by the participating funds. In addition, a commitment fee of 0.11% per annum on any unutilized portion of the committed line of credit is allocated to the participating funds based on their relative net assets and paid quarterly. During the reporting period, the fund had no borrowings against these arrangements.
Federal taxes It is the policy of the fund to distribute all of its taxable income within the prescribed time period and otherwise comply with the provisions of the Internal Revenue Code of 1986, as amended (the Code), applicable to regulated investment companies. It is also the intention of the fund to distribute an amount sufficient to avoid imposition of any excise tax under Section 4982 of the Code.
The fund is subject to the provisions of Accounting Standards Codification 740 Income Taxes (ASC 740). ASC 740 sets forth a minimum threshold for financial statement recognition of the benefit of a tax position taken or expected to be taken in a tax return. The fund did not have a liability to record for any unrecognized tax benefits in the accompanying financial statements. No provision has been made for federal taxes on income, capital gains or unrealized appreciation on securities held nor for excise tax on income and capital gains. Each of the fund’s federal tax returns for the prior three fiscal years remains subject to examination by the Internal Revenue Service.
The fund may also be subject to taxes imposed by governments of countries in which it invests. Such taxes are generally based on either income or gains earned or repatriated. The fund accrues and applies such taxes to net investment income, net realized gains and net unrealized gains as income and/or capital gains are earned. In some cases, the fund may be entitled to reclaim all or a portion of such taxes, and such reclaim amounts, if any, are reflected as an asset on the fund’s books. In many cases, however, the fund may not receive such amounts for an extended period of time, depending on the country of investment.
At October 31, 2014, the fund had a capital loss carryover of $469,383,585 available to the extent allowed by the Code to offset future net capital gain, if any. The amounts of the carryovers and the expiration dates are:
Loss carryover
Short-term
Long-term
Total
Expiration
$14,231,091
N/A
$14,231,091
October 31, 2015
12,074,013
N/A
12,074,013
October 31, 2016
443,078,481
N/A
443,078,481
October 31, 2017
Under the Regulated Investment Company Modernization Act of 2010, the fund will be permitted to carry forward capital losses incurred in taxable years beginning after December 22, 2010 for an unlimited period. However, any losses incurred will be required to be utilized prior to the losses incurred in pre-enactment tax years. As a result of this ordering rule, pre-enactment capital loss carryforwards may be more likely to expire unused. Additionally, post-enactment capital losses that are carried forward will retain their character as either short-term or long-term capital losses rather than being considered all short-term as under previous law.
Distributions to shareholders Distributions to shareholders from net investment income are recorded by the fund on the ex-dividend date. Distributions from capital gains, if any, are recorded on the ex-dividend date and paid at
44 The Putnam Fund for Growth and Income
least annually. The amount and character of income and gains to be distributed are determined in accordance with income tax regulations, which may differ from generally accepted accounting principles. These differences include temporary and/or permanent differences from losses on wash sale transactions, from income on swap contracts, and from partnership income. Reclassifications are made to the fund’s capital accounts to reflect income and gains available for distribution (or available capital loss carryovers) under income tax regulations. At the close of the reporting period, the fund reclassified $3,052,972 to decrease undistributed net investment income, $302,754 to increase paid-in-capital and $2,750,218 to decrease accumulated net realized loss.
The tax basis components of distributable earnings and the federal tax cost as of the close of the reporting period were as follows:
Unrealized appreciation
$1,019,920,690
Unrealized depreciation
(131,098,677)
Net unrealized appreciation
888,822,013
Undistributed ordinary income
18,905,648
Capital loss carryforward
(469,383,585)
Cost for federal income tax purposes
$5,031,445,521
Note 2: Management fee, administrative services and other transactions
The fund pays Putnam Management a management fee (based on the fund’s average net assets and computed and paid monthly) at annual rates that may vary based on the average of the aggregate net assets of most open-end funds, as defined in the fund’s management contract, sponsored by Putnam Management. Such annual rates may vary as follows:
0.630%
of the first $5 billion,
0.580%
of the next $5 billion,
0.530%
of the next $10 billion,
0.480%
of the next $10 billion,
0.430%
of the next $50 billion,
0.410%
of the next $50 billion,
0.400%
of the next $100 billion and
0.395%
of any excess thereafter.
The fund’s shareholders approved the fund’s current management contract with Putnam Management effective February 27, 2014. Shareholders were asked to approve the fund’s management contract following the death on October 8, 2013 of The Honourable Paul G. Desmarais, who had controlled directly and indirectly a majority of the voting shares of Power Corporation of Canada, the ultimate parent company of Putnam Management. The substantive terms of the management contract, including terms relating to fees, are identical to the terms of the fund’s previous management contract and reflect the rates provided in the table above.
Putnam Management has contractually agreed, through June 30, 2015, to waive fees or reimburse the fund’s expenses to the extent necessary to limit the cumulative expenses of the fund, exclusive of brokerage, interest, taxes, investment-related expenses, extraordinary expenses, acquired fund fees and expenses and payments under the fund’s investor servicing contract, investment management contract and distribution plans, on a fiscal year-to-date basis to an annual rate of 0.20% of the fund’s average net assets over such fiscal year-to-date period. During the reporting period, the fund’s expenses were not reduced as a result of this limit.
Putnam Investments Limited (PIL), an affiliate of Putnam Management, is authorized by the Trustees to manage a separate portion of the assets of the fund as determined by Putnam Management from time to time. Putnam Management pays a quarterly sub-management fee to PIL for its services at an annual rate of 0.35% of the average net assets of the portion of the fund managed by PIL.
The fund reimburses Putnam Management an allocated amount for the compensation and related expenses of certain officers of the fund and their staff who provide administrative services to the fund. The aggregate amount of all such reimbursements is determined annually by the Trustees.
Custodial functions for the fund’s assets are provided by State Street. Custody fees are based on the fund’s asset level, the number of its security holdings and transaction volumes.
Putnam Investor Services, Inc., an affiliate of Putnam Management, provides investor servicing agent functions to the fund. Putnam Investor Services, Inc. received fees for investor servicing (except for class R5 and R6 shares) based on the fund’s retail asset level, the number of shareholder accounts in the fund and the level of defined contribution plan assets in the fund. Class R5 shares pay a monthly fee based on the average net assets of class R5 shares at an annual rate of 0.15%. Class R6 shares pay a monthly fee based on the average net assets of class R6
The Putnam Fund for Growth and Income 45
shares at an annual rate of 0.05%. Investor servicing fees will not exceed an annual rate of 0.32% of the fund’s average net assets. During the reporting period, the expenses for each class of shares related to investor servicing fees were as follows:
Class A
$10,963,659
Class B
195,247
Class C
112,679
Class M
78,412
Class R
7,947
Class R5
38
Class R6
9,584
Class Y
108,038
Total
$11,475,604
The fund has entered into expense offset arrangements with Putnam Investor Services, Inc. and State Street whereby Putnam Investor Services, Inc.’s and State Street’s fees are reduced by credits allowed on cash balances. The fund also reduced expenses through brokerage/service arrangements. For the reporting period, the fund’s expenses were reduced by $8,629 under the expense offset arrangements and by $275,902 under the brokerage/service arrangements.
Each Independent Trustee of the fund receives an annual Trustee fee, of which $3,203, as a quarterly retainer, has been allocated to the fund, and an additional fee for each Trustees meeting attended. Trustees also are reimbursed for expenses they incur relating to their services as Trustees.
The fund has adopted a Trustee Fee Deferral Plan (the Deferral Plan) which allows the Trustees to defer the receipt of all or a portion of Trustees fees payable on or after July 1, 1995. The deferred fees remain invested in certain Putnam funds until distribution in accordance with the Deferral Plan.
The fund has adopted an unfunded noncontributory defined benefit pension plan (the Pension Plan) covering all Trustees of the fund who have served as a Trustee for at least five years and were first elected prior to 2004. Benefits under the Pension Plan are equal to 50% of the Trustee’s average annual attendance and retainer fees for the three years ended December 31, 2005. The retirement benefit is payable during a Trustee’s lifetime, beginning the year following retirement, for the number of years of service through December 31, 2006. Pension expense for the fund is included in Trustee compensation and expenses in the Statement of operations. Accrued pension liability is included in Payable for Trustee compensation and expenses in the Statement of assets and liabilities. The Trustees have terminated the Pension Plan with respect to any Trustee first elected after 2003.
The fund has adopted distribution plans (the Plans) with respect to its class A, class B, class C, class M and class R shares pursuant to Rule 12b–1 under the Investment Company Act of 1940. The purpose of the Plans is to compensate Putnam Retail Management Limited Partnership, an indirect wholly-owned subsidiary of Putnam Investments, LLC, for services provided and expenses incurred in distributing shares of the fund. The Plans provide for payments by the fund to Putnam Retail Management Limited Partnership at an annual rate of up to 0.35%, 1.00%, 1.00%, 1.00% and 1.00% of the average net assets attributable to class A, class B, class C, class M and class R shares, respectively. The Trustees have approved payment by the fund at an annual rate of 0.25%, 1.00%, 1.00%, 0.75% and 0.50% of the average net assets attributable to class A, class B, class C, class M and class R shares, respectively. During the reporting period, the class specific expenses related to distribution fees were as follows:
Class A
$13,128,551
Class B
933,628
Class C
540,672
Class M
281,616
Class R
19,009
Total
$14,903,476
For the reporting period, Putnam Retail Management Limited Partnership, acting as underwriter, received net commissions of $292,577 and $979 from the sale of class A and class M shares, respectively, and received $45,238 and $1,413 in contingent deferred sales charges from redemptions of class B and class C shares, respectively.
A deferred sales charge of up to 1.00% and 0.65% is assessed on certain redemptions of class A and class M shares, respectively. For the reporting period, Putnam Retail Management Limited Partnership, acting as underwriter, received $111 and no monies on class A and class M redemptions, respectively.
46 The Putnam Fund for Growth and Income
Note 3: Purchases and sales of securities
During the reporting period, cost of purchases and proceeds from sales, excluding short-term investments were as follows:
Cost of purchases
Proceeds from sales
Investments in securities (Long-term)
$2,203,824,757
$2,750,815,639
U.S. government securities (Long-term)
—
—
Total
$2,203,824,757
$2,750,815,639
Note 4: Capital shares
At the close of the reporting period, there was an unlimited number of shares of beneficial interest authorized. Transactions in capital shares were as follows:
Year ended 10/31/14
Year ended 10/31/13
Class A
Shares
Amount
Shares
Amount
Shares sold
4,926,540
$100,158,706
6,154,436
$102,188,254
Shares issued in connection with reinvestment of distributions
2,725,752
55,102,816
3,674,623
59,249,205
7,652,292
155,261,522
9,829,059
161,437,459
Shares repurchased
(25,353,613)
(516,736,553)
(35,341,537)
(581,802,635)
Net decrease
(17,701,321)
$(361,475,031)
(25,512,478)
$(420,365,176)
Year ended 10/31/14
Year ended 10/31/13
Class B
Shares
Amount
Shares
Amount
Shares sold
435,572
$8,689,360
549,696
$8,990,253
Shares issued in connection with reinvestment of distributions
19,058
372,677
40,986
625,966
454,630
9,062,037
590,682
9,616,219
Shares repurchased
(1,295,641)
(25,720,276)
(1,856,124)
(30,047,227)
Net decrease
(841,011)
$(16,658,239)
(1,265,442)
$(20,431,008)
Year ended 10/31/14
Year ended 10/31/13
Class C
Shares
Amount
Shares
Amount
Shares sold
450,042
$9,125,977
439,718
$7,316,329
Shares issued in connection with reinvestment of distributions
10,803
215,043
17,333
270,337
460,845
9,341,020
457,051
7,586,666
Shares repurchased
(306,607)
(6,236,587)
(416,282)
(6,840,353)
Net increase
154,238
$3,104,433
40,769
$746,313
Year ended 10/31/14
Year ended 10/31/13
Class M
Shares
Amount
Shares
Amount
Shares sold
47,263
$950,354
60,525
$980,313
Shares issued in connection with reinvestment of distributions
12,142
241,902
19,201
302,335
59,405
1,192,256
79,726
1,282,648
Shares repurchased
(220,698)
(4,470,629)
(277,502)
(4,501,534)
Net decrease
(161,293)
$(3,278,373)
(197,776)
$(3,218,886)
The Putnam Fund for Growth and Income 47
Year ended 10/31/14
Year ended 10/31/13
Class R
Shares
Amount
Shares
Amount
Shares sold
28,118
$567,780
58,110
$951,923
Shares issued in connection with reinvestment of distributions
1,741
34,936
2,518
40,365
29,859
602,716
60,628
992,288
Shares repurchased
(66,512)
(1,322,168)
(81,930)
(1,284,706)
Net decrease
(36,653)
$(719,452)
(21,302)
$(292,418)
Year ended 10/31/14
Year ended 10/31/13
Class R5
Shares
Amount
Shares
Amount
Shares sold
3,550
$76,245
—
$—
Shares issued in connection with reinvestment of distributions
10
209
13
217
3,560
76,454
13
217
Shares repurchased
(3,549)
(75,075)
—
—
Net increase
11
$1,379
13
$217
Year ended 10/31/14
Year ended 10/31/13
Class R6
Shares
Amount
Shares
Amount
Shares sold
54,172
$1,120,908
1,022,456
$16,954,448
Shares issued in connection with reinvestment of distributions
14,637
297,302
7,408
132,226
68,809
1,418,210
1,029,864
17,086,674
Shares repurchased
(116,845)
(2,380,550)
(63,944)
(1,134,636)
Net increase (decrease)
(48,036)
$(962,340)
965,920
$15,952,038
Year ended 10/31/14
Year ended 10/31/13
Class Y
Shares
Amount
Shares
Amount
Shares sold
986,930
$20,430,044
598,538
$10,157,040
Shares issued in connection with reinvestment of distributions
32,291
657,239
46,362
744,095
1,019,221
21,087,283
644,900
10,901,135
Shares repurchased
(501,132)
(10,227,825)
(1,559,478)
(25,848,197)
Net increase (decrease)
518,089
$10,859,458
(914,578)
$(14,947,062)
At the close of the reporting period, Putnam Investments, LLC owned the following class shares of the fund:
Shares owned
Percentage of ownership
Value
Class R5
760
100%
$16,346
Class R6
762
0.1%
$16,360
48 The Putnam Fund for Growth and Income
Note 5: Affiliated transactions
Transactions during the reporting period with Putnam Money Market Liquidity Fund and Putnam Short Term Investment Fund, which are under common ownership or control, were as follows:
Name of affiliate
Fair value at the beginning of the reporting period
Purchase cost
Sale proceeds
Investment income
Fair value at the end of the reporting period
Putnam Money Market Liquidity Fund*
$—
$21,378,176
$15,895,952
$430
$5,482,224
Putnam Short Term Investment Fund*
156,499,916
1,013,891,050
846,227,626
122,341
324,163,340
Totals
$156,499,916
$1,035,269,226
$862,123,578
$122,771
$329,645,564
*Management fees charged to Putnam Money Market Liquidity Fund and Putnam Short Term Investment Fund have been waived by Putnam Management.
Note 6: Market, credit and other risks
In the normal course of business, the fund trades financial instruments and enters into financial transactions where risk of potential loss exists due to changes in the market (market risk) or failure of the contracting party to the transaction to perform (credit risk). The fund may be exposed to additional credit risk that an institution or other entity with which the fund has unsettled or open transactions will default. Investments in foreign securities involve certain risks, including those related to economic instability, unfavorable political developments, and currency fluctuations.
Note 7: Summary of derivative activity
The volume of activity for the reporting period for any derivative type that was held during the period is listed below and was as follows based on an average of the holdings at the end of each fiscal quarter:
Forward currency contracts (contract amount)
$21,900,000
OTC total return swap contracts (notional)
$15,900,000
Warrants (number of warrants)
650,000
The following is a summary of the fair value of derivative instruments as of the close of the reporting period:
Fair value of derivative instruments as of the close of the reporting period
Asset derivatives
Liability derivatives
Derivatives not accounted for as hedging instruments under ASC 815
Statement of assets and liabilities location
Fair value
Statement of assets and liabilities location
Fair value
Foreign exchange contracts
Receivables
$691,545
Payables
$347,247
Equity contracts
Receivables
—
Payables
4,012,574
Total
$691,545
$4,359,821
The following is a summary of realized and change in unrealized gains or losses of derivative instruments on the Statement of operations for the reporting period (see Note 1):
Amount of realized gain or (loss) on derivatives recognized in net gain or (loss) on investments
Derivatives not accounted for as hedging instruments under ASC 815
Warrants
Swaps
Total
Equity contracts
$(3,237,886)
$1,521,874
$(1,716,012)
Total
$(3,237,886)
$1,521,874
$(1,716,012)
The Putnam Fund for Growth and Income 49
Change in unrealized appreciation or (depreciation) on derivatives recognized in net gain or (loss) on investments
Derivatives not accounted for as hedging instruments under ASC 815
Warrants
Forward currency contracts
Swaps
Total
Foreign exchange contracts
$—
$344,298
$—
$344,298
Equity contracts
3,576,817
—
(5,378,801)
$(1,801,984)
Total
$3,576,817
$344,298
$(5,378,801)
$(1,457,686)
Note 8: Offsetting of financial and derivative assets and liabilities
The following table summarizes any derivatives, repurchase agreements and reverse repurchase agreements, at the end of the reporting period, that are subject to an enforceable master netting agreement or similar agreement. For securities lending transactions or borrowing transactions associated with securities sold short, if any, see Note 1. For financial reporting purposes, the fund does not offset financial assets and financial liabilities that are subject to the master netting agreements in the Statement of assets and liabilities.
Bank of America N.A.
Credit Suisse International
Total
Assets:
OTC Total return swap contracts*#
$—
$—
$—
Forward currency contracts#
—
691,545
691,545
Total Assets
$—
$691,545
$691,545
Liabilities:
OTC Total return swap contracts*#
$4,012,574
$—
4,012,574
Forward currency contracts#
—
347,247
347,247
Total Liabilities
$4,012,574
$347,247
$4,359,821
Total Financial and Derivative Net Assets
$(4,012,574)
$344,298
$(3,668,276)
Total collateral received (pledged)†##
$(2,579,000)
$(650,000)
Net amount
$(1,433,574)
$994,298
*
Excludes premiums, if any. Included in unrealized appreciation and depreciation on OTC swap contracts on the Statement of assets and liabilities.
†
Additional collateral may be required from certain brokers based on individual agreements.
#
Covered by master netting agreement (Note 1).
##
Any over-collateralization of total financial and derivative net assets is not shown. Collateral may include amounts related to unsettled agreements.
50 The Putnam Fund for Growth and Income
Federal tax information (Unaudited)
The fund designated 100.00% of ordinary income distributions as qualifying for the dividends received deduction for corporations.
For the reporting period, the fund hereby designates 100.00%, or the maximum amount allowable, of its taxable ordinary income distributions as qualified dividends taxed at the individual net capital gain rates.
For the reporting period, pursuant to §871(k) of the Internal Revenue Code, the fund hereby designates $58,880 of distributions paid as qualifying to be taxed as interest-related dividends, and no monies to be taxed as short-term capital gain dividends for nonresident alien shareholders.
The Form 1099 that will be mailed to you in January 2015 will show the tax status of all distributions paid to your account in calendar 2014.
The Putnam Fund for Growth and Income 51
Shareholder meeting results (Unaudited)
February 27, 2014 special meeting
At the meeting, each of the nominees for Trustees was elected, as follows:
Votes for
Votes withheld
Liaquat Ahamed
183,435,641
8,077,386
Ravi Akhoury
183,530,114
7,982,912
Barbara M. Baumann
184,537,016
6,976,011
Jameson A. Baxter
184,322,899
7,190,128
Charles B. Curtis
184,107,296
7,405,731
Robert J. Darretta
184,395,029
7,117,998
Katinka Domotorffy
184,073,343
7,439,684
John A. Hill
184,250,859
7,262,168
Paul L. Joskow
184,419,386
7,093,641
Kenneth R. Leibler
184,506,264
7,006,763
Robert E. Patterson
184,382,425
7,130,602
George Putnam, III
184,295,515
7,217,512
Robert L. Reynolds
184,416,500
7,096,527
W. Thomas Stephens
183,993,327
7,519,700
A proposal to approve a new management contract between the fund and Putnam Management was approved as follows:
Votes for
Votes against
Abstentions
Broker non-votes
143,037,390
5,377,184
9,205,408
33,893,045
A proposal to adopt an Amended and Restated Declaration of Trust was approved, as follows:
Votes for
Votes against
Abstentions
Broker non-votes
142,313,123
5,374,011
9,932,847
33,893,045
All tabulations are rounded to the nearest whole number.
52 The Putnam Fund for Growth and Income
About the Trustees
Independent Trustees
Liaquat Ahamed
Born 1952, Trustee since 2012
Principal occupations during past five years: Pulitzer Prize-winning author of Lords of Finance: The Bankers Who Broke the World, whose articles on economics have appeared in such publications as the New York Times, Foreign Affairs, and the Financial Times. Director of Aspen Insurance Co., a New York Stock Exchange company, and Chair of the Aspen Board’s Investment Committee. Trustee of the Brookings Institution and Chair of its Investment Committee.
Other directorships: The Rohatyn Group, an emerging-market fund complex that manages money for institutions
Ravi Akhoury
Born 1947, Trustee since 2009
Principal occupations during past five years: Trustee of American India Foundation and of the Rubin Museum. From 1992 to 2007, was Chairman and CEO of MacKay Shields, a multi-product investment management firm.
Other directorships: RAGE Frameworks, Inc., a private software company; English Helper, Inc., a private software company
Barbara M. Baumann
Born 1955, Trustee since 2010
Principal occupations during past five years: President and Owner of Cross Creek Energy Corporation, a strategic consultant to domestic energy firms and direct investor in energy projects. Current Board member of The Denver Foundation. Former Chair and current Board member of Girls Incorporated of Metro Denver. Member of the Finance Committee, the Children’s Hospital of Colorado.
Other directorships: Buckeye Partners, L.P., a publicly traded master limited partnership focused on pipeline transport, storage, and distribution of petroleum products; Devon Energy Corporation, a leading independent natural gas and oil exploration and production company
Jameson A. Baxter
Born 1943, Trustee since 1994, Vice Chair from 2005 to 2011, and Chair since 2011
Principal occupations during past five years: President of Baxter Associates, Inc., a private investment firm. Chair of Mutual Fund Directors Forum. Chair Emeritus of the Board of Trustees of Mount Holyoke College. Director of the Adirondack Land Trust and Trustee of the Nature Conservancy’s Adirondack Chapter.
Charles B. Curtis
Born 1940, Trustee since 2001
Principal occupations during past five years: Senior Advisor to the Center for Strategic and International Studies. President Emeritus and former President and Chief Operating Officer of the Nuclear Threat Initiative, a private foundation dealing with national security issues. Member of the Council on Foreign Relations and U.S. State Department International Security Advisory Board.
Robert J. Darretta
Born 1946, Trustee since 2007
Principal occupations during past five years: From 2009 until 2012, served as Health Care Industry Advisor to Permira, a global private equity firm. Until April 2007, was Vice Chairman of the Board of Directors of Johnson & Johnson. Served as Johnson & Johnson’s Chief Financial Officer for a decade.
Other directorships: UnitedHealth Group, a diversified health-care company
Katinka Domotorffy
Born 1975, Trustee since 2012
Principal occupations during past five years: Voting member of the Investment Committees of the Anne Ray Charitable Trust and Margaret A. Cargill Foundation, part of the Margaret A. Cargill Philanthropies. Until 2011, Partner, Chief Investment Officer, and Global Head of Quantitative Investment Strategies at Goldman Sachs Asset Management.
Other directorships: Reach Out and Read of Greater New York, an organization dedicated to promoting childhood literacy
John A. Hill
Born 1942, Trustee since 1985 and Chairman from 2000 to 2011
Principal occupations during past five years: Founder and Vice-Chairman of First Reserve Corporation, the leading private equity buyout firm focused on the worldwide energy industry. Trustee and Chairman of the Board of Trustees of Sarah Lawrence College. Member of the Advisory Board of the Millstein Center for Global Markets and Corporate Ownership at The Columbia University Law School.
Other directorships: Devon Energy Corporation, a leading independent natural gas and oil exploration and production company
The Putnam Fund for Growth and Income 53
Paul L. Joskow
Born 1947, Trustee since 1997
Principal occupations during past five years: Economist and President of the Alfred P. Sloan Foundation, a philanthropic institution focused primarily on research and education on issues related to science, technology, and economic performance. Elizabeth and James Killian Professor of Economics, Emeritus at the Massachusetts Institute of Technology (MIT). Prior to 2007, served as the Director of the Center for Energy and Environmental Policy Research at MIT.
Other directorships: Yale University; Exelon Corporation, an energy company focused on power services; Boston Symphony Orchestra; Prior to April 2013, served as Director of TransCanada Corporation and TransCanada Pipelines Ltd., energy companies focused on natural gas transmission, oil pipelines and power services
Kenneth R. Leibler
Born 1949, Trustee since 2006
Principal occupations during past five years: Founder and former Chairman of Boston Options Exchange, an electronic marketplace for the trading of derivative securities. Serves on the Board of Trustees of Beth Israel Deaconess Hospital in Boston, Massachusetts. Director of Beth Israel Deaconess Care Organization. Until November 2010, director of Ruder Finn Group, a global communications and advertising firm.
Other directorships: Northeast Utilities, which operates New England’s largest energy delivery system
Robert E. Patterson
Born 1945, Trustee since 1984
Principal occupations during past five years: Co-Chairman of Cabot Properties, Inc., a private equity firm investing in commercial real estate, and Chairman of its Investment Committee. Past Chairman and Trustee of the Joslin Diabetes Center.
George Putnam, III
Born 1951, Trustee since 1984
Principal occupations during past five years: Chairman of New Generation Research, Inc., a publisher of financial advisory and other research services. Founder and President of New Generation Advisors, LLC, a registered investment advisor to private funds. Director of The Boston Family Office, LLC, a registered investment advisor.
W. Thomas Stephens
Born 1942, Trustee from 1997 to 2008 and since 2009
Principal occupations during past five years: Retired as Chairman and Chief Executive Officer of Boise Cascade, LLC, a paper, forest products, and timberland assets company, in December 2008. Prior to 2010, Director of Boise Inc., a manufacturer of paper and packaging products.
Other directorships: TransCanada Pipelines Ltd., an energy infrastructure company
Interested Trustee
Robert L. Reynolds*
Born 1952, Trustee since 2008 and President of the Putnam Funds since 2009
Principal occupations during past five years: President and Chief Executive Officer of Putnam Investments since 2008 and, since 2014, President and Chief Executive Officer of Great-West Financial, a financial services company that provides retirement savings plans, life insurance, and annuity and executive benefits products, and of Great-West Lifeco U.S. Inc., a holding company that owns Putnam Investments and Great-West Financial. Prior to joining Putnam Investments, served as Vice Chairman and Chief Operating Officer of Fidelity Investments from 2000 to 2007.
*Mr. Reynolds is an “interested person” (as defined in the Investment Company Act of 1940) of the fund and Putnam Investments. He is President and Chief Executive Officer of Putnam Investments, as well as the President of your fund and each of the other Putnam funds.
The address of each Trustee is One Post Office Square, Boston, MA 02109.
As of October 31, 2014, there were 116 Putnam funds. All Trustees serve as Trustees of all Putnam funds.
Each Trustee serves for an indefinite term, until his or her resignation, retirement at age 75, removal, or death.
54 The Putnam Fund for Growth and Income
Officers
In addition to Robert L. Reynolds, the other officers of the fund are shown below:
Jonathan S. Horwitz (Born 1955)
Executive Vice President, Principal Executive Officer, and Compliance Liaison
Since 2004
Steven D. Krichmar (Born 1958)
Vice President and Principal Financial Officer
Since 2002
Chief of Operations, Putnam Investments and Putnam Management
Robert T. Burns (Born 1961)
Vice President and Chief Legal Officer
Since 2011
General Counsel, Putnam Investments, Putnam Management, and Putnam Retail Management
Manager of Finance, Dunkin’ Brands (2008–2010); Senior Financial Analyst, Old Mutual Asset Management (2007–2008); Senior Financial Analyst, Putnam Investments (1999–2007)
Janet C. Smith (Born 1965)
Vice President, Principal Accounting Officer, and Assistant Treasurer
Since 2007
Director of Fund Administration Services, Putnam Investments and Putnam Management
Susan G. Malloy (Born 1957)
Vice President and Assistant Treasurer
Since 2007
Director of Accounting & Control Services, Putnam Investments and Putnam Management
James P. Pappas (Born 1953)
Vice President
Since 2004
Director of Trustee Relations, Putnam Investments and Putnam Management
Mark C. Trenchard (Born 1962)
Vice President and BSA Compliance Officer
Since 2002
Director of Operational Compliance, Putnam Investments and Putnam Retail Management
Nancy E. Florek (Born 1957)
Vice President, Director of Proxy Voting and Corporate Governance, Assistant Clerk, and Associate Treasurer
Since 2000
The principal occupations of the officers for the past five years have been with the employers as shown above, although in some cases they have held different positions with such employers. The address of each officer is One Post Office Square, Boston, MA 02109.
The Putnam Fund for Growth and Income 55
Putnam family of funds
The following is a list of Putnam’s open-end mutual funds offered to the public. Investors should carefully consider the investment objective, risks, charges, and expenses of a fund before investing. For a prospectus, or a summary prospectus if available, containing this and other information for any Putnam fund or product, contact your financial advisor or call Putnam Investor Services at 1-800-225-1581. Please read the prospectus carefully before investing.
Growth
Growth Opportunities Fund
International Growth Fund
Multi-Cap Growth Fund
Small Cap Growth Fund
Voyager Fund
Blend
Asia Pacific Equity Fund
Capital Opportunities Fund
Capital Spectrum Fund
Emerging Markets Equity Fund
Equity Spectrum Fund
Europe Equity Fund
Global Equity Fund
International Capital Opportunities Fund
International Equity Fund
Investors Fund
Low Volatility Equity Fund
Multi-Cap Core Fund
Research Fund
Strategic Volatility Equity Fund
Value
Convertible Securities Fund
Equity Income Fund
Global Dividend Fund
The Putnam Fund for Growth and Income
International Value Fund
Multi-Cap Value Fund
Small Cap Value Fund
Income
American Government Income Fund
Diversified Income Trust
Emerging Markets Income Fund
Floating Rate Income Fund
Global Income Trust
High Yield Advantage Fund
High Yield Trust
Income Fund
Money Market Fund*
Short Duration Income Fund
U.S. Government Income Trust
Tax-free Income
AMT-Free Municipal Fund
Intermediate-Term Municipal Income Fund
Short-Term Municipal Income Fund
Tax Exempt Income Fund
Tax Exempt Money Market Fund*
Tax-Free High Yield Fund
State tax-free income funds†:
Arizona, California, Massachusetts, Michigan, Minnesota, New Jersey, New York, Ohio, and Pennsylvania.
* An investment in a money market fund is not insured or guaranteed by the Federal Deposit Insurance Corporation or any other government agency. Although the fund seeks to preserve the value of your investment at $1.00 per share, it is possible to lose money by investing in the fund.
†Not available in all states.
56 The Putnam Fund for Growth and Income
Absolute Return
Absolute Return 100 Fund®
Absolute Return 300 Fund®
Absolute Return 500 Fund®
Absolute Return 700 Fund®
Global Sector
Global Consumer Fund
Global Energy Fund
Global Financials Fund
Global Health Care Fund
Global Industrials Fund
Global Natural Resources Fund
Global Sector Fund
Global Technology Fund
Global Telecommunications Fund
Global Utilities Fund
Asset Allocation
George Putnam Balanced Fund
Global Asset Allocation Funds — four investment portfolios that spread your money across a variety of stocks, bonds, and money market instruments.
Dynamic Asset Allocation Balanced Fund
Dynamic Asset Allocation Conservative Fund
Dynamic Asset Allocation Growth Fund
Dynamic Risk Allocation Fund
Retirement Income Lifestyle Funds — portfolios with managed allocations to stocks, bonds, and money market investments to generate retirement income.
Retirement Income Fund Lifestyle 1
Retirement Income Fund Lifestyle 2
Retirement Income Fund Lifestyle 3
RetirementReady® Funds — portfolios with adjusting allocations to stocks, bonds, and money market instruments, becoming more conservative over time.
RetirementReady® 2055 Fund
RetirementReady® 2050 Fund
RetirementReady® 2045 Fund
RetirementReady® 2040 Fund
RetirementReady® 2035 Fund
RetirementReady® 2030 Fund
RetirementReady® 2025 Fund
RetirementReady® 2020 Fund
RetirementReady® 2015 Fund
Check your account balances and the most recent month-end performance in the Individual Investors section at putnam.com.
The Putnam Fund for Growth and Income 57
Services for shareholders
Investor services
Systematic investment plan Tell us how much you wish to invest regularly — weekly, semimonthly, or monthly — and the amount you choose will be transferred automatically from your checking or savings account. There’s no additional fee for this service, and you can suspend it at any time. This plan may be a great way to save for college expenses or to plan for your retirement.
Please note that regular investing does not guarantee a profit or protect against loss in a declining market. Before arranging a systematic investment plan, consider your financial ability to continue making purchases in periods when prices are low.
Systematic exchange You can make regular transfers from one Putnam fund to another Putnam fund. There are no additional fees for this service, and you can cancel or change your options at any time.
Dividends PLUS You can choose to have the dividend distributions from one of your Putnam funds automatically reinvested in another Putnam fund at no additional charge.
Free exchange privilege You can exchange money between Putnam funds free of charge, as long as they are the same class of shares. A signature guarantee is required if you are exchanging more than $500,000. The fund reserves the right to revise or terminate the exchange privilege.
Reinstatement privilege If you’ve sold Putnam shares or received a check for a dividend or capital gain, you may reinvest the proceeds with Putnam within 90 days of the transaction and they will be reinvested at the fund’s current net asset value — with no sales charge. However, reinstatement of class B shares may have special tax consequences. Ask your financial or tax representative for details.
Check-writing service You have ready access to many Putnam accounts. It’s as simple as writing a check, and there are no special fees or service charges. For more information about the check-writing service, call Putnam or visit our website.
Dollar cost averaging When you’re investing for long-term goals, it’s time, not timing, that counts. Investing on a systematic basis is a better strategy than trying to figure out when the markets will go up or down. This means investing the same amount of money regularly over a long period. This method of investing is called dollar cost averaging. When a fund’s share price declines, your investment dollars buy more shares at lower prices. When it increases, they buy fewer shares. Over time, you will pay a lower average price per share.
For more information
Visit the Individual Investors section at putnam.com A secure section of our website contains complete information on your account, including balances and transactions, updated daily. You may also conduct transactions, such as exchanges, additional investments, and address changes. Log on today to get your password.
Call us toll free at 1-800-225-1581 Ask a helpful Putnam representative or your financial advisor for details about any of these or other services, or see your prospectus.
58 The Putnam Fund for Growth and Income
Fund information
Founded over 75 years ago, Putnam Investments was built around the concept that a balance between risk and reward is the hallmark of a well-rounded financial program. We manage over 100 funds across income, value, blend, growth, asset allocation, absolute return, and global sector categories.
Investment Manager
Putnam Investment Management, LLC One Post Office Square Boston, MA 02109
Investment Sub-Manager
Putnam Investments Limited 57–59 St James’s Street London, England SW1A 1LD
Marketing Services
Putnam Retail Management One Post Office Square Boston, MA 02109
Custodian
State Street Bank and Trust Company
Legal Counsel
Ropes & Gray LLP
Auditor
PricewaterhouseCoopers LLP
Trustees
Jameson A. Baxter, Chair Liaquat Ahamed Ravi Akhoury Barbara M. Baumann Charles B. Curtis Robert J. Darretta Katinka Domotorffy John A. Hill Paul L. Joskow Kenneth R. Leibler Robert E. Patterson George Putnam, III Robert L. Reynolds W. Thomas Stephens
Officers
Robert L. Reynolds President
Jonathan S. Horwitz Executive Vice President, Principal Executive Officer, and Compliance Liaison
Steven D. Krichmar Vice President and Principal Financial Officer
Robert T. Burns Vice President and Chief Legal Officer
Robert R. Leveille Vice President and Chief Compliance Officer
Michael J. Higgins Vice President, Treasurer, and Clerk
Janet C. Smith Vice President, Principal Accounting Officer, and Assistant Treasurer
Susan G. Malloy Vice President and Assistant Treasurer
James P. Pappas Vice President
Mark C. Trenchard Vice President and BSA Compliance Officer
Nancy E. Florek Vice President, Director of Proxy Voting and Corporate Governance, Assistant Clerk, and Associate Treasurer
The Putnam Fund for Growth and Income 59
This report is for the information of shareholders of The Putnam Fund for Growth and Income. It may also be used as sales literature when preceded or accompanied by the current prospectus, the most recent copy of Putnam’s Quarterly Performance Summary, and Putnam’s Quarterly Ranking Summary. For more recent performance, please visit putnam.com. Investors should carefully consider the investment objectives, risks, charges, and expenses of a fund, which are described in its prospectus. For this and other information or to request a prospectus or summary prospectus, call 1-800-225-1581 toll free. Please read the prospectus carefully before investing. The fund’s Statement of Additional Information contains additional information about the fund’s Trustees and is available without charge upon request by calling 1-800-225-1581.
60 The Putnam Fund for Growth and Income
Item 2. Code of Ethics:
(a) The fund’s principal executive, financial and accounting officers are employees of Putnam Investment Management, LLC, the Fund’s investment manager. As such they are subject to a comprehensive Code of Ethics adopted and administered by Putnam Investments which is designed to protect the interests of the firm and its clients. The Fund has adopted a Code of Ethics which incorporates the Code of Ethics of Putnam Investments with respect to all of its officers and Trustees who are employees of Putnam Investment Management, LLC. For this reason, the Fund has not adopted a separate code of ethics governing its principal executive, financial and accounting officers.
(c) In July 2013, the Code of Ethics of Putnam Investment Management, LLC was amended. The changes to the Code of Ethics were as follows: (i) eliminating the requirement for employees to hold their shares of Putnam mutual funds for specified periods of time, (ii) removing the requirement to preclear transactions in certain kinds of exchange-traded funds and exchange-traded notes, although reporting of all such instruments remains required; (iii) eliminating the excessive trading rule related to employee transactions in securities requiring preclearance under the Code; (iv) adding provisions related to monitoring of employee trading; (v) changing from a set number of shares to a set dollar value of stock of mid- and large-cap companies on the Restricted List that can be purchased or sold; (vi) adding a requirement starting in March 2014 for employees to generally use certain approved brokers that provide Putnam with an electronic feed of transactions and statements for their personal brokerage accounts; and (vii) certain other changes.
Item 3. Audit Committee Financial Expert:
The Funds’ Audit and Compliance Committee is comprised solely of Trustees who are “independent” (as such term has been defined by the Securities and Exchange Commission (“SEC”) in regulations implementing Section 407 of the Sarbanes-Oxley Act (the “Regulations”)). The Trustees believe that each of the members of the Audit and Compliance Committee also possess a combination of knowledge and experience with respect to financial accounting matters, as well as other attributes, that qualify them for service on the Committee. In addition, the Trustees have determined that each of Mr. Leibler, Mr. Hill, Mr. Darretta, and Ms. Baumann qualifies as an “audit committee financial expert” (as such term has been defined by the Regulations) based on their review of his or her pertinent experience and education. The SEC has stated, and the funds’ amended and restated agreement and Declaration of Trust provides, that the designation or identification of a person as an audit committee financial expert pursuant to this Item 3 of Form N-CSR does not impose on such person any duties, obligations or liability that are greater than the duties, obligations and liability imposed on such person as a member of the Audit and Compliance Committee and the Board of Trustees in the absence of such designation or identification.
Item 4. Principal Accountant Fees and Services:
The following table presents fees billed in each of the last two fiscal years for services rendered to the fund by the fund’s independent auditor:
Fiscal year ended
Audit Fees
Audit-Related Fees
Tax Fees
All Other Fees
October 31, 2014
$201,188
$ —
$8,470
$ —
October 31, 2013
$207,333
$ —
$8,083
$ —
For the fiscal years ended October 31, 2014 and October 31, 2013, the fund’s independent auditor billed aggregate non-audit fees in the amounts of $584,644 and $158,083 respectively, to the fund, Putnam Management and any entity controlling, controlled by or under common control with Putnam Management that provides ongoing services to the fund.
Audit Fees represent fees billed for the fund’s last two fiscal years relating to the audit and review of the financial statements included in annual reports and registration statements, and other services that are normally provided in connection with statutory and regulatory filings or engagements.
Audit-Related Fees represent fees billed in the fund’s last two fiscal years for services traditionally performed by the fund’s auditor, including accounting consultation for proposed transactions or concerning financial accounting and reporting standards and other audit or attest services not required by statute or regulation.
Tax Fees represent fees billed in the fund’s last two fiscal years for tax compliance, tax planning and tax advice services. Tax planning and tax advice services include assistance with tax audits, employee benefit plans and requests for rulings or technical advice from taxing authorities.
Pre-Approval Policies of the Audit and Compliance Committee. The Audit and Compliance Committee of the Putnam funds has determined that, as a matter of policy, all work performed for the funds by the funds’ independent auditors will be pre-approved by the Committee itself and thus will generally not be subject to pre-approval procedures.
The Audit and Compliance Committee also has adopted a policy to pre-approve the engagement by Putnam Management and certain of its affiliates of the funds’ independent auditors, even in circumstances where pre-approval is not required by applicable law. Any such requests by Putnam Management or certain of its affiliates are typically submitted in writing to the Committee and explain, among other things, the nature of the proposed engagement, the estimated fees, and why this work should be performed by that particular audit firm as opposed to another one. In reviewing such requests, the Committee considers, among other things, whether the provision of such services by the audit firm are compatible with the independence of the audit firm.
The following table presents fees billed by the fund’s independent auditor for services required to be approved pursuant to paragraph (c)(7)(ii) of Rule 2-01 of Regulation S-X.
Fiscal year ended
Audit-Related Fees
Tax Fees
All Other Fees
Total Non-Audit Fees
October 31, 2014
$ —
$576,174
$ —
$ —
October 31, 2013
$ —
$150,000
$ —
$ —
Item 5. Audit Committee of Listed Registrants
Not applicable
Item 6. Schedule of Investments:
The registrant’s schedule of investments in unaffiliated issuers is included in the report to shareholders in Item 1 above.
Item 7. Disclosure of Proxy Voting Policies and Procedures For Closed-End Management Investment Companies:
Not applicable
Item 8. Portfolio Managers of Closed-End Investment Companies
Not Applicable
Item 9. Purchases of Equity Securities by Closed-End Management Investment Companies and Affiliated Purchasers:
Not applicable
Item 10. Submission of Matters to a Vote of Security Holders:
Not applicable
Item 11. Controls and Procedures:
(a) The registrant’s principal executive officer and principal financial officer have concluded, based on their evaluation of the effectiveness of the design and operation of the registrant’s disclosure controls and procedures as of a date within 90 days of the filing date of this report, that the design and operation of such procedures are generally effective to provide reasonable assurance that information required to be disclosed by the registrant in this report is recorded, processed, summarized and reported within the time periods specified in the Commission’s rules and forms.
(b) Changes in internal control over financial reporting: Not applicable
Item 12. Exhibits:
(a)(1) The Code of Ethics of The Putnam Funds, which incorporates the Code of Ethics of Putnam Investments, is filed herewith.
(a)(2) Separate certifications for the principal executive officer and principal financial officer of the registrant as required by Rule 30a-2(a) under the Investment Company Act of 1940, as amended, are filed herewith.
(b) The certifications required by Rule 30a-2(b) under the Investment Company Act of 1940, as amended, are filed herewith.
SIGNATURES
Pursuant to the requirements of the Securities Exchange Act of 1934 and the Investment Company Act of 1940, the registrant has duly caused this report to be signed on its behalf by the undersigned, thereunto duly authorized.
The Putnam Fund for Growth and Income
By (Signature and Title):
/s/ Janet C. Smith Janet C. Smith Principal Accounting Officer
Date: December 29, 2014
Pursuant to the requirements of the Securities Exchange Act of 1934 and the Investment Company Act of 1940, this report has been signed below by the following persons on behalf of the registrant and in the capacities and on the dates indicated.
By (Signature and Title):
/s/ Jonathan S. Horwitz Jonathan S. Horwitz Principal Executive Officer
Date: December 29, 2014
By (Signature and Title):
/s/ Steven D. Krichmar Steven D. Krichmar Principal Financial Officer
Date: December 29, 2014
We use cookies on this site to provide a more responsive and personalized service. Continuing to browse, clicking I Agree, or closing this banner indicates agreement. See our Cookie Policy for more information.