| | |
| UNITED STATES
SECURITIES AND EXCHANGE COMMISSION |
| | |
| CERTIFIED SHAREHOLDER REPORT OF REGISTERED
MANAGEMENT INVESTMENT COMPANIES
|
| | |
| Investment Company Act file number: | (811-00781) |
| | |
| Exact name of registrant as specified in charter: | The Putnam Fund for Growth and Income |
| | |
| Address of principal executive offices: | One Post Office Square, Boston, Massachusetts 02109 |
| | |
| Name and address of agent for service: | Robert T. Burns, Vice President
One Post Office Square
Boston, Massachusetts 02109 |
| | |
| Copy to: | Bryan Chegwidden, Esq.
Ropes & Gray LLP
1211 Avenue of the Americas
New York, New York 10036 |
| | |
| Registrant's telephone number, including area code: | (617) 292-1000 |
| | |
| Date of fiscal year end: | October 31, 2016 |
| | |
| Date of reporting period : | November 1, 2015 — October 31, 2016 |
| | |
|
Item 1. Report to Stockholders: | |
| | |
| The following is a copy of the report transmitted to stockholders pursuant to Rule 30e-1 under the Investment Company Act of 1940: | |
The Putnam
Fund for Growth
and Income
Annual report
10 | 31 | 16
| | |
| Message from the Trustees | 1 | |
| |
| Interview with your fund’s portfolio manager | 3 | |
| |
| Your fund’s performance | 8 | |
| |
| Your fund’s expenses | 11 | |
| |
| Terms and definitions | 13 | |
| |
| Other information for shareholders | 14 | |
| |
| Important notice regarding Putnam’s privacy policy | 15 | |
| |
| Trustee approval of management contract | 16 | |
| |
| Financial statements | 21 | |
| |
| Federal tax information | 49 | |
| |
| About the Trustees | 50 | |
| |
| Officers | 52 | |
Consider these risks before investing: Value stocks may fail to rebound, and the market may not favor value-style investing. Income provided by the fund may be reduced by changes in the dividend policies of, and the capital resources available at, the companies in which the fund invests. Stock prices may fall or fail to rise over time for several reasons, including general financial market conditions and factors related to a specific company or industry. You can lose money by investing in the fund.
Message from the Trustees
December 9, 2016
Dear Fellow Shareholder:
The U.S. presidential election is now behind us, but the transitional period in Washington, D.C., may bring bouts of volatility to the financial markets. Election campaigns are often followed by uncertainty regarding the new administration, and new presidents may seek to make legislative changes to economic policies.
If recent history is a worthy guide, we believe it is important for investors to remain well diversified, maintain a long-term view, and not overreact to volatile markets. To help ensure that your portfolio is aligned with your individual goals, time horizon, and tolerance for risk, we believe it is a good idea to speak regularly with your financial advisor.
In today’s environment, we favor the investment approach practiced at Putnam — active strategies based on fundamental research. Putnam portfolio managers, backed by a network of global analysts, bring years of experience to navigating changing market conditions and pursuing investment opportunities. In the following pages, you will find an overview of your fund’s performance for the reporting period ended October 31, 2016, as well as an outlook for the coming months.
Thank you for investing with Putnam.

Performance history as of 10/31/16
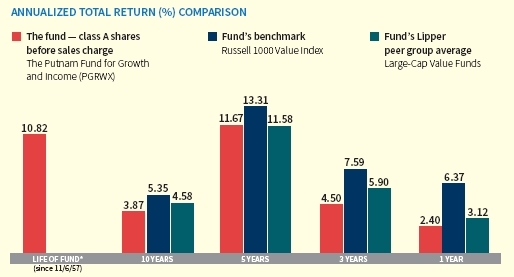
Current performance may be lower or higher than the quoted past performance, which cannot guarantee future results. Share price, principal value, and return will fluctuate, and you may have a gain or a loss when you sell your shares. Performance of class A shares assumes reinvestment of distributions and does not account for taxes. Fund returns in the bar chart do not reflect a sales charge of 5.75%; had they, returns would have been lower. See below and pages 8–10 for additional performance information. For a portion of the periods, the fund had expense limitations, without which returns would have been lower. To obtain the most recent month-end performance, visit putnam.com.
* The fund’s benchmark, the Russell 1000 Value Index, and the fund’s Lipper peer group were introduced on 12/31/78 and 12/31/59, respectively, which post-date the inception of the fund’s class A shares.

This comparison shows your fund’s performance in the context of broad market indexes for the 12 months ended 10/31/16. See above and pages 8–10 for additional fund performance information. Index descriptions can be found on page 13.
|
| 2 The Putnam Fund for Growth and Income |
Interview with your fund’s portfolio manager
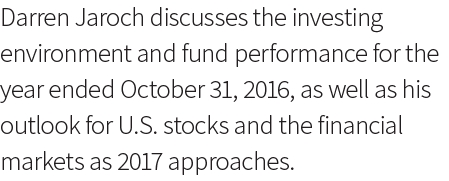

Darren has a B.A. from Hartwick College. He joined Putnam in 1999 and has been in the investment industry since 1996.
In addition to Darren Jaroch, your fund is managed by Assistant Portfolio Manager Walter D. Scully, CPA. Walter has an M.B.A. from the University of Chicago Booth School of Business and a B.S. from the Ohio State University. He has been in the investment industry since he joined Putnam in 1996.
Darren, could you tell us about the investing environment for the 12-month reporting period ended October 31, 2016?
In the early months of the period, which began in November 2015, the U.S. stock market took investors on a turbulent ride. As the 2015 calendar year came to a close, U.S. stocks posted their weakest annual results since the global financial crisis. January and February 2016 marked the worst-ever start to a year in terms of stock performance, as investors’ concern escalated over China’s slowing economy, and oil and commodity prices plummeted even further than they already had in 2015. We saw a tremendous amount of volatility, but I don’t believe conditions were nearly as bad as were being priced into the market. Companies began announcing earnings in the midst of all this and, not surprisingly, few of them delivered optimistic outlooks, which further contributed to the market’s downward spiral.
After a low point in mid-February, stocks staged a remarkable rebound. As recession fears subsided and oil prices stabilized, turbulence eased and the S&P 500 Index gained 6.78% in March, marking its best monthly return in
|
| The Putnam Fund for Growth and Income 3 |
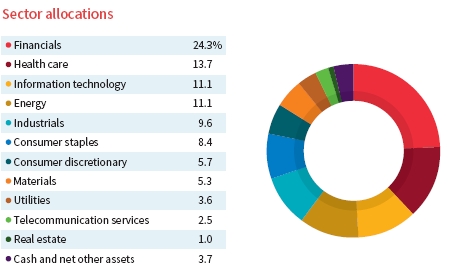
Allocations are shown as a percentage of the fund’s net assets as of 10/31/16. Cash and net other assets, if any, represent the market value weights of cash, derivatives, short-term securities, and other unclassified assets in the portfolio. Summary information may differ from the portfolio schedule included in the financial statements due to the inclusion of derivative securities, any interest accruals, the exclusion of as-of trades, if any, the use of different classifications of securities for presentation purposes, and rounding. Holdings and allocations may vary over time.
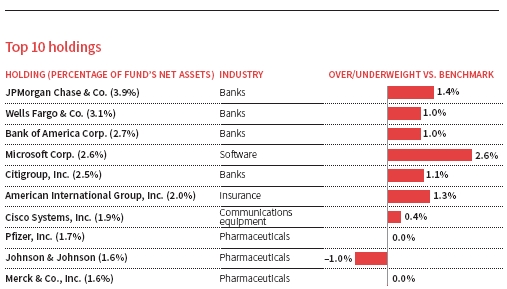
This table shows the fund’s top 10 holdings by percentage of the fund’s net assets as of 10/31/16. Short-term investments and derivatives, if any, are excluded. Holdings may vary over time.
|
| 4 The Putnam Fund for Growth and Income |
five months and the start of a relatively calm few months for the markets. In late June, however, market volatility spiked again, largely in response to the Brexit decision by United Kingdom voters to leave the European Union. U.S. stock prices plummeted more than 5% in the two days after the vote, followed by a dramatic three-day recovery. U.S. stocks continued to advance, but performance was weaker in the final two months of the reporting period, as uncertainty surrounding the November presidential election and the likelihood of a Federal Reserve interest-rate hike by year-end weighed on investor sentiment.
How did the fund perform during the reporting period?
The fund ended the period with a return of 2.40%, underperforming its benchmark, the Russell 1000 Value Index, which gained 6.37%, and the average return of 3.12% for funds in its Lipper peer group, Large-Cap Value Funds. It was a challenging environment for many of the value-style stocks in the fund’s portfolio. As interest rates remained low, stocks that benefit in a low-rate environment continued to perform well. These included so-called “bond proxies” — stocks that offer high yields and are favored by investors who are seeking income. We continued to believe these stocks were too expensive, and they were not a significant weighting in the portfolio. At the same time, the fund was focused on stocks in the financials sector on the expectation that they would benefit from rising interest rates. While that strategy did not pay off during this annual period, I believe financial stocks may represent an attractive investment opportunity in the months ahead, particularly if we see an interest-rate hike from the Federal Reserve.
Could you provide some examples of stocks that helped performance relative to the benchmark during the period?
Throughout the fund’s previous fiscal year ended October 31, 2015, many of the weakest-performing fund holdings were stocks of companies in the energy sector, as oil prices plummeted to historic lows. During this annual reporting period, however, we saw a sharp reversal in that trend. Stocks in the energy sector rebounded from the extraordinarily cheap levels we saw at the start of the period. One of the beneficiaries was the top contributor to fund performance for the period — Royal Dutch Shell, an independent oil and gas company.

The fund’s investment in Computer Sciences, a global provider of information technology [IT] services, was also a notable contributor to fund returns for the period. A key factor in its stock price advance was the announcement that Computer Sciences would be merging with the IT services businesses of Hewlett-Packard Enterprise. We believe this is a positive development that provides Computer Sciences with the scale it needs to compete and succeed in the IT sector.
Another performance highlight was the fund’s position in Microsoft. The technology company’s stock was lifted by better-than-expected earnings, and in late October, its share price reached an all-time high, due in large part to the success of Microsoft’s relatively new cloud computing business.
Could you discuss some stocks that detracted from returns relative to the benchmark?
Although many energy stocks helped fund performance for the annual reporting period, some notable detractors were from the energy sector. Examples include Calpine, a provider of electricity and natural gas, and Devon Energy, an oil exploration and production
|
| The Putnam Fund for Growth and Income 5 |
company. For Devon, the negative impact on fund performance was due to the decision to trim the fund’s position in this stock before the recovery in oil prices. It is worth noting, however, that those assets were shifted into Pioneer Natural Resources, which was among the top contributors to performance for the period. Devon Energy was no longer held at the end of the period.
Fund performance was also dampened by a position in Teva Pharmaceutical Industries, a global developer and marketer of specialty medicines. Teva stock, which was not part of the fund’s benchmark, struggled during the period due to increasing uncertainty about the growth potential of its generics business. In addition, one of the company’s key products, Copaxone, a multiple sclerosis drug, is facing patent challenges that could have a negative impact on Teva’s future growth potential.
What role did derivatives play in the portfolio during the reporting period?
Although derivative investments were not a significant part of the portfolio, they did affect performance during the period. Specifically, forward currency contracts, which were used to attempt to hedge foreign exchange risk, had a positive impact on performance.
What is your overall view of the U.S. equity market, and where do you see opportunities in the months ahead?
In our view, the U.S. stock market as a whole seems overvalued at this point. We have seen relatively low levels of volatility for stocks, but a number of issues could cause disruptions, including the aftermath of the U.S. presidential election and concerns about the impact of a new administration on markets and economic policies.
Fortunately, I see significant opportunities in certain areas of the market, where I believe recent underperformance is unjustified. The most promising opportunities, in my view, are in cyclical sectors such as technology, consumer discretionary, and financials.
My focus in this environment — and in all markets — is on companies that I believe are doing the right things fundamentally. I will continue with my intensive, bottom-up research, actively positioning the portfolio for what I believe will be a rebound in today’s undervalued stocks.
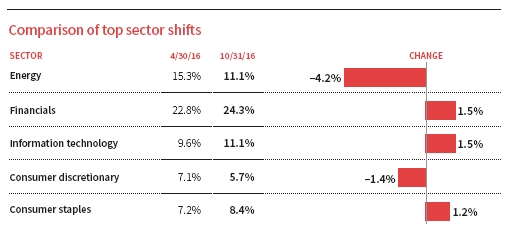
This chart shows the fund’s largest allocation shifts, by percentage, over the past six months. Allocations are shown as a percentage of the fund’s net assets. Current period summary information may differ from the portfolio schedule included in the financial statements due to the inclusion of derivative securities, any interest accruals, the exclusion of as-of trades, if any, the use of different classifications of securities for presentation purposes, and rounding. Holdings and allocations may vary over time.
|
| 6 The Putnam Fund for Growth and Income |
Thank you, Darren, for your time and insights today.
The views expressed in this report are exclusively those of Putnam Management and are subject to change. They are not meant as investment advice.
Please note that the holdings discussed in this report may not have been held by the fund for the entire period. Portfolio composition is subject to review in accordance with the fund’s investment strategy and may vary in the future. Current and future portfolio holdings are subject to risk.
|
| The Putnam Fund for Growth and Income 7 |
Your fund’s performance
This section shows your fund’s performance, price, and distribution information for periods ended October 31, 2016, the end of its most recent fiscal year. In accordance with regulatory requirements for mutual funds, we also include performance information as of the most recent calendar quarter-end and expense information taken from the fund’s current prospectus. Performance should always be considered in light of a fund’s investment strategy. Data represent past performance. Past performance does not guarantee future results. More recent returns may be less or more than those shown. Investment return and principal value will fluctuate, and you may have a gain or a loss when you sell your shares. Performance information does not reflect any deduction for taxes a shareholder may owe on fund distributions or on the redemption of fund shares. For the most recent month-end performance, please visit the Individual Investors section at putnam.com or call Putnam at 1-800-225-1581. Class R, R6, and Y shares are not available to all investors. See the Terms and Definitions section in this report for definitions of the share classes offered by your fund.
Fund performance Total return for periods ended 10/31/16
| | | | | | | | |
| | Annual average | | Annual | | Annual | | Annual | |
| | (life of fund) | 10 years | average | 5 years | average | 3 years | average | 1 year |
|
| Class A (11/6/57) | | | | | | | | |
| Before sales charge | 10.82% | 46.16% | 3.87% | 73.62% | 11.67% | 14.10% | 4.50% | 2.40% |
|
| After sales charge | 10.71 | 37.75 | 3.25 | 63.64 | 10.35 | 7.54 | 2.45 | –3.49 |
|
| Class B (4/27/92) | | | | | | | | |
| Before CDSC | 10.66 | 37.57 | 3.24 | 67.26 | 10.84 | 11.60 | 3.73 | 1.66 |
|
| After CDSC | 10.66 | 37.57 | 3.24 | 65.26 | 10.57 | 8.60 | 2.79 | –3.34 |
|
| Class C (7/26/99) | | | | | | | | |
| Before CDSC | 9.99 | 35.61 | 3.09 | 67.23 | 10.83 | 11.60 | 3.73 | 1.64 |
|
| After CDSC | 9.99 | 35.61 | 3.09 | 67.23 | 10.83 | 11.60 | 3.73 | 0.64 |
|
| Class M (5/1/95) | | | | | | | | |
| Before sales charge | 10.11 | 39.08 | 3.35 | 69.35 | 11.11 | 12.44 | 3.99 | 1.94 |
|
| After sales charge | 10.04 | 34.21 | 2.99 | 63.42 | 10.32 | 8.51 | 2.76 | –1.62 |
|
| Class R (1/21/03) | | | | | | | | |
| Net asset value | 10.54 | 42.58 | 3.61 | 71.54 | 11.40 | 13.26 | 4.24 | 2.19 |
|
| Class R6 (7/2/12) | | | | | | | | |
| Net asset value | 10.94 | 50.98 | 4.21 | 77.10 | 12.11 | 15.51 | 4.92 | 2.81 |
|
| Class Y (6/15/94) | | | | | | | | |
| Net asset value | 10.92 | 49.90 | 4.13 | 75.84 | 11.95 | 15.02 | 4.77 | 2.71 |
|
Current performance may be lower or higher than the quoted past performance, which cannot guarantee future results. After-sales-charge returns for class A and M shares reflect the deduction of the maximum 5.75% and 3.50% sales charge, respectively, levied at the time of purchase. Class B share returns after contingent deferred sales charge (CDSC) reflect the applicable CDSC, which is 5% in the first year, declining over time to 1% in the sixth year, and is eliminated thereafter. Class C share returns after CDSC reflect a 1% CDSC for the first year that is eliminated thereafter. Class R, R6, and Y shares have no initial sales charge or CDSC. Performance for class B, C, M, R, and Y shares before their inception is derived from the historical performance of class A shares, adjusted for the applicable sales charge (or CDSC) and the higher operating expenses for such shares, except for class Y shares, for which 12b-1 fees are not applicable. Performance for class R6 shares prior to their inception is derived from the historical performance of class Y shares and has not been adjusted for the lower investor servicing fees applicable to class R6 shares; had it, returns would have been higher.
Recent performance may have benefited from one or more legal settlements.
For a portion of the periods, the fund had expense limitations, without which returns would have been lower.
Class B share performance reflects conversion to class A shares after eight years.
| |
| 8 The Putnam Fund for Growth and Income |
Comparative index returns For periods ended 10/31/16
| | | | | | | | |
| | Annual average | | Annual | | Annual | | Annual | |
| | (life of fund) | 10 years | average | 5 years | average | 3 years | average | 1 year |
|
| Russell 1000 | | | | | | | | |
| Value Index | —† | 68.37% | 5.35% | 86.75% | 13.31% | 24.53% | 7.59% | 6.37% |
|
| Lipper Large-Cap | | | | | | | | |
| Value Funds | —† | 57.72 | 4.58 | 73.25 | 11.58 | 18.85 | 5.90 | 3.12 |
| category average* | | | | | | | | |
Index and Lipper results should be compared with fund performance before sales charge, before CDSC, or at net asset value.
* Over the 1-year, 3-year, 5-year and 10-year periods ended 10/31/16, there were 491, 421, 376, and 262 funds, respectively, in this Lipper category.
† The fund’s benchmark, the Russell 1000 Value Index, and the fund’s Lipper peer group were introduced on 12/31/78 and 12/31/59, respectively, which post-date the inception of the fund’s class A shares.

Past performance does not indicate future results. At the end of the same time period, a $10,000 investment in the fund’s class B and C shares would have been valued at $13,757 and $13,561, respectively, and no contingent deferred sales charges would apply. A $10,000 investment in the fund’s class M shares ($9,650 after sales charge) would have been valued at $13,421. A $10,000 investment in the fund’s class R, R6, and Y shares would have been valued at $14,258, $15,098 and $14,990, respectively.
|
| The Putnam Fund for Growth and Income 9 |
Fund price and distribution information For the 12-month period ended 10/31/16
| | | | | | | | | |
| Distributions | Class A | Class B | Class C | Class M | Class R | Class R6 | Class Y |
|
| Number | 4 | 4 | 4 | 4 | 4 | 4 | 4 |
|
| Income | $0.305 | $0.155 | $0.155 | $0.203 | $0.252 | $0.385 | $0.357 |
|
| Capital gains | — | — | — | — | — | — | — |
|
| Total | $0.305 | $0.155 | $0.155 | $0.203 | $0.252 | $0.385 | $0.357 |
|
| | Before | After | Net | Net | Before | After | Net | Net | Net |
| | sales | sales | asset | asset | sales | sales | asset | asset | asset |
| Share value | charge | charge | value | value | charge | charge | value | value | value |
|
| 10/31/15 | $20.48 | $21.73 | $20.10 | $20.38 | $20.30 | $21.04 | $20.37 | $20.54 | $20.52 |
|
| 10/31/16 | 20.65 | 21.91 | 20.27 | 20.55 | 20.48 | 21.22 | 20.55 | 20.71 | 20.70 |
|
| | Before | After | Net | Net | Before | After | Net | Net | Net |
| | sales | sales | asset | asset | sales | sales | asset | asset | asset |
| Current rate (end of period) | charge | charge | value | value | charge | charge | value | value | value |
|
| Current dividend rate 1 | 1.07% | 1.00% | 0.30% | 0.29% | 0.53% | 0.51% | 0.84% | 1.47% | 1.33% |
|
| Current 30-day SEC yield 2 | N/A | 1.24 | 0.57 | 0.57 | N/A | 0.79 | 1.07 | 1.68 | 1.57 |
The classification of distributions, if any, is an estimate. Before-sales-charge share value and current dividend rate for class A and M shares, if applicable, do not take into account any sales charge levied at the time of purchase. After-sales-charge share value, current dividend rate, and current 30-day SEC yield, if applicable, are calculated assuming that the maximum sales charge (5.75% for class A shares and 3.50% for class M shares) was levied at the time of purchase. Final distribution information will appear on your year-end tax forms.
1 Most recent distribution, including any return of capital and excluding capital gains, annualized and divided by share price before or after sales charge at period-end.
2 Based only on investment income and calculated using the maximum offering price for each share class, in accordance with SEC guidelines.
Fund performance as of most recent calendar quarter Total return for periods ended 9/30/16
| | | | | | | | |
| | Annual average | | Annual | | Annual | | Annual | |
| | (life of fund) | 10 years | average | 5 years | average | 3 years | average | 1 year |
|
| Class A (11/6/57) | | | | | | | | |
| Before sales charge | 10.86% | 52.13% | 4.28% | 97.83% | 14.62% | 19.95% | 6.25% | 11.26% |
|
| After sales charge | 10.74 | 43.38 | 3.67 | 86.46 | 13.27 | 13.05 | 4.17 | 4.86 |
|
| Class B (4/27/92) | | | | | | | | |
| Before CDSC | 10.70 | 43.22 | 3.66 | 90.47 | 13.75 | 17.29 | 5.46 | 10.45 |
|
| After CDSC | 10.70 | 43.22 | 3.66 | 88.47 | 13.51 | 14.29 | 4.55 | 5.45 |
|
| Class C (7/26/99) | | | | | | | | |
| Before CDSC | 10.02 | 41.11 | 3.50 | 90.40 | 13.75 | 17.28 | 5.46 | 10.47 |
|
| After CDSC | 10.02 | 41.11 | 3.50 | 90.40 | 13.75 | 17.28 | 5.46 | 9.47 |
|
| Class M (5/1/95) | | | | | | | | |
| Before sales charge | 10.14 | 44.67 | 3.76 | 92.83 | 14.03 | 18.13 | 5.71 | 10.72 |
|
| After sales charge | 10.08 | 39.60 | 3.39 | 86.08 | 13.22 | 13.99 | 4.46 | 6.85 |
|
| Class R (1/21/03) | | | | | | | | |
| Net asset value | 10.58 | 48.36 | 4.02 | 95.25 | 14.32 | 19.03 | 5.98 | 11.02 |
|
| Class R6 (7/2/12) | | | | | | | | |
| Net asset value | 10.97 | 57.13 | 4.62 | 101.72 | 15.07 | 21.41 | 6.68 | 11.73 |
|
| Class Y (6/15/94) | | | | | | | | |
| Net asset value | 10.96 | 55.94 | 4.54 | 100.19 | 14.89 | 20.84 | 6.51 | 11.52 |
|
See the discussion following the fund performance table on page 8 for information about the calculation of fund performance.
|
| 10 The Putnam Fund for Growth and Income |
Your fund’s expenses
As a mutual fund investor, you pay ongoing expenses, such as management fees, distribution fees (12b-1 fees), and other expenses. Using the following information, you can estimate how these expenses affect your investment and compare them with the expenses of other funds. You may also pay one-time transaction expenses, including sales charges (loads) and redemption fees, which are not shown in this section and would have resulted in higher total expenses. For more information, see your fund’s prospectus or talk to your financial representative.
Expense ratios
| | | | | | | |
| | Class A | Class B | Class C | Class M | Class R | Class R6 | Class Y |
|
| Total annual operating expenses for | | | | | | | |
| the fiscal year ended 10/31/15 | 0.94% | 1.69% | 1.69% | 1.44% | 1.19% | 0.55% | 0.69% |
|
| Annualized expense ratio for the | | | | | | | |
| six-month period ended 10/31/16* | 0.95% | 1.70% | 1.70% | 1.45% | 1.20% | 0.56% | 0.70% |
Fiscal-year expense information in this table is taken from the most recent prospectus, is subject to change, and may differ from that shown for the annualized expense ratio and in the financial highlights of this report.
Expenses are shown as a percentage of average net assets.
* Expense ratios for each class are for the fund’s most recent fiscal half year. As a result of this, ratios may differ from expense ratios based on one-year data in the financial highlights.
Expenses per $1,000
The following table shows the expenses you would have paid on a $1,000 investment in each class of the fund from 5/1/16 to 10/31/16. It also shows how much a $1,000 investment would be worth at the close of the period, assuming actual returns and expenses.
| | | | | | | |
| | Class A | Class B | Class C | Class M | Class R | Class R6 | Class Y |
|
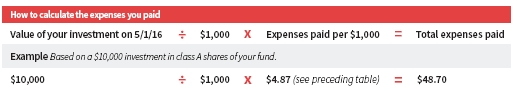
| Expenses paid per $1,000*† | $4.87 | $8.69 | $8.69 | $7.42 | $6.14 | $2.87 | $3.59 |
|
| Ending value (after expenses) | $1,038.10 | $1,034.30 | $1,034.40 | $1,035.70 | $1,036.80 | $1,040.10 | $1,039.90 |
* Expenses for each share class are calculated using the fund’s annualized expense ratio for each class, which represents the ongoing expenses as a percentage of average net assets for the six months ended 10/31/16. The expense ratio may differ for each share class.
† Expenses are calculated by multiplying the expense ratio by the average account value for the period; then multiplying the result by the number of days in the period; and then dividing that result by the number of days in the year.
|
| The Putnam Fund for Growth and Income 11 |
Estimate the expenses you paid
To estimate the ongoing expenses you paid for the six months ended 10/31/16, use the following calculation method. To find the value of your investment on 5/1/16, call Putnam at 1-800-225-1581.
Compare expenses using the SEC’s method
The Securities and Exchange Commission (SEC) has established guidelines to help investors assess fund expenses. Per these guidelines, the following table shows your fund’s expenses based on a $1,000 investment, assuming a hypothetical 5% annualized return. You can use this information to compare the ongoing expenses (but not transaction expenses or total costs) of investing in the fund with those of other funds. All mutual fund shareholder reports will provide this information to help you make this comparison. Please note that you cannot use this information to estimate your actual ending account balance and expenses paid during the period.
| | | | | | | |
| | Class A | Class B | Class C | Class M | Class R | Class R6 | Class Y |
|
| Expenses paid per $1,000*† | $4.82 | $8.62 | $8.62 | $7.35 | $6.09 | $2.85 | $3.56 |
|
| Ending value (after expenses) | $1,020.36 | $1,016.59 | $1,016.59 | $1,017.85 | $1,019.10 | $1,022.32 | $1,021.62 |
* Expenses for each share class are calculated using the fund’s annualized expense ratio for each class, which represents the ongoing expenses as a percentage of average net assets for the six months ended 10/31/16. The expense ratio may differ for each share class.
† Expenses are calculated by multiplying the expense ratio by the average account value for the six-month period; then multiplying the result by the number of days in the six-month period; and then dividing that result by the number of days in the year.
|
| 12 The Putnam Fund for Growth and Income |
Terms and definitions
Important terms
Total return shows how the value of the fund’s shares changed over time, assuming you held the shares through the entire period and reinvested all distributions in the fund.
Before sales charge, or net asset value, is the price, or value, of one share of a mutual fund, without a sales charge. Before-sales-charge figures fluctuate with market conditions, and are calculated by dividing the net assets of each class of shares by the number of outstanding shares in the class.
After sales charge is the price of a mutual fund share plus the maximum sales charge levied at the time of purchase. After-sales-charge performance figures shown here assume the 5.75% maximum sales charge for class A shares and 3.50% for class M shares.
Contingent deferred sales charge (CDSC) is generally a charge applied at the time of the redemption of class B or C shares and assumes redemption at the end of the period. Your fund’s class B CDSC declines over time from a 5% maximum during the first year to 1% during the sixth year. After the sixth year, the CDSC no longer applies. The CDSC for class C shares is 1% for one year after purchase.
Current rate is the annual rate of return earned from dividends or interest of an investment. Current rate is expressed as a percentage of the price of a security, fund share, or principal investment.
Share classes
Class A shares are generally subject to an initial sales charge and no CDSC (except on certain redemptions of shares bought without an initial sales charge).
Class B shares are not subject to an initial sales charge and may be subject to a CDSC.
Class C shares are not subject to an initial sales charge and are subject to a CDSC only if the shares are redeemed during the first year.
Class M shares have a lower initial sales charge and a higher 12b-1 fee than class A shares and no CDSC.
Class R shares are not subject to an initial sales charge or CDSC and are only available to employer-sponsored retirement plans.
Class R6 shares are not subject to an initial sales charge or CDSC, and carry no 12b-1 fee. They are only available to employer-sponsored retirement plans.
Class Y shares are not subject to an initial sales charge or CDSC, and carry no 12b-1 fee. They are generally only available to corporate and institutional clients and clients in other approved programs.
Comparative indexes
Bloomberg Barclays U.S. Aggregate Bond Index is an unmanaged index of U.S. investment-grade fixed-income securities.
BofA Merrill Lynch U.S. 3-Month Treasury Bill Index is an unmanaged index that seeks to measure the performance of U.S. Treasury bills available in the marketplace.
Russell 1000 Value Index is an unmanaged index of those companies in the large-cap Russell 1000 Index chosen for their value orientation.
S&P 500 Index is an unmanaged index of common stock performance.
Indexes assume reinvestment of all distributions and do not account for fees. Securities and performance of a fund and an index will differ. You cannot invest directly in an index.
Frank Russell Company is the source and owner of the trademarks, service marks, and copyrights related to the Russell Indexes. Russell® is a trademark of Frank Russell Company.
|
| The Putnam Fund for Growth and Income 13 |
Lipper is a third-party industry-ranking entity that ranks mutual funds. Its rankings do not reflect sales charges. Lipper rankings are based on total return at net asset value relative to other funds that have similar current investment styles or objectives as determined by Lipper. Lipper may change a fund’s category assignment at its discretion. Lipper category averages reflect performance trends for funds within a category.
Other information for shareholders
Proxy voting
Putnam is committed to managing our mutual funds in the best interests of our shareholders. The Putnam funds’ proxy voting guidelines and procedures, as well as information regarding how your fund voted proxies relating to portfolio securities during the 12-month period ended June 30, 2016, are available in the Individual Investors section of putnam.com, and on the Securities and Exchange Commission (SEC) website, www.sec.gov. If you have questions about finding forms on the SEC’s website, you may call the SEC at 1-800-SEC-0330. You may also obtain the Putnam funds’ proxy voting guidelines and procedures at no charge by calling Putnam’s Shareholder Services at 1-800-225-1581.
Fund portfolio holdings
The fund will file a complete schedule of its portfolio holdings with the SEC for the first and third quarters of each fiscal year on Form N-Q. Shareholders may obtain the fund’s Form N-Q on the SEC’s website at www.sec.gov. In addition, the fund’s Form N-Q may be reviewed and copied at the SEC’s Public Reference Room in Washington, D.C. You may call the SEC at 1-800-SEC-0330 for information about the SEC’s website or the operation of the Public Reference Room.
Trustee and employee fund ownership
Putnam employees and members of the Board of Trustees place their faith, confidence, and, most importantly, investment dollars in Putnam mutual funds. As of October 31, 2016, Putnam employees had approximately $492,000,000 and the Trustees had approximately $132,000,000 invested in Putnam mutual funds. These amounts include investments by the Trustees’ and employees’ immediate family members as well as investments through retirement and deferred compensation plans.
|
| 14 The Putnam Fund for Growth and Income |
Important notice regarding Putnam’s privacy policy
In order to conduct business with our shareholders, we must obtain certain personal information such as account holders’ names, addresses, Social Security numbers, and dates of birth. Using this information, we are able to maintain accurate records of accounts and transactions.
It is our policy to protect the confidentiality of our shareholder information, whether or not a shareholder currently owns shares of our funds. In particular, it is our policy not to sell information about you or your accounts to outside marketing firms. We have safeguards in place designed to prevent unauthorized access to our computer systems and procedures to protect personal information from unauthorized use.
Under certain circumstances, we must share account information with outside vendors who provide services to us, such as mailings and proxy solicitations. In these cases, the service providers enter into confidentiality agreements with us, and we provide only the information necessary to process transactions and perform other services related to your account. Finally, it is our policy to share account information with your financial representative, if you’ve listed one on your Putnam account.
|
| The Putnam Fund for Growth and Income 15 |
Trustee approval of management contract
General conclusions
The Board of Trustees of The Putnam Funds oversees the management of each fund and, as required by law, determines annually whether to approve the continuance of your fund’s management contract with Putnam Investment Management, LLC (“Putnam Management”) and the sub-management contract with respect to your fund between Putnam Management and its affiliate, Putnam Investments Limited (“PIL”). The Board, with the assistance of its Contract Committee, requests and evaluates all information it deems reasonably necessary under the circumstances in connection with its annual contract review. The Contract Committee consists solely of Trustees who are not “interested persons” (as this term is defined in the Investment Company Act of 1940, as amended (the “1940 Act”)) of The Putnam Funds (“Independent Trustees”).
At the outset of the review process, members of the Board’s independent staff and independent legal counsel discussed with representatives of Putnam Management the annual contract review materials furnished to the Contract Committee during the course of the previous year’s review, identifying possible changes in these materials that might be necessary or desirable for the coming year. Following these discussions and in consultation with the Contract Committee, the Independent Trustees’ independent legal counsel requested that Putnam Management and its affiliates furnish specified information, together with any additional information that Putnam Management considered relevant, to the Contract Committee. Over the course of several months ending in June 2016, the Contract Committee met on a number of occasions with representatives of Putnam Management, and separately in executive session, to consider the information that Putnam Management provided, as well as supplemental information provided in response to an additional request made by the Contract Committee. Throughout this process, the Contract Committee was assisted by the members of the Board’s independent staff and by independent legal counsel for The Putnam Funds and the Independent Trustees.
In May 2016, the Contract Committee met in executive session to discuss and consider its recommendations with respect to the continuance of the contracts. At the Trustees’ June 24, 2016 meeting, the Contract Committee met in executive session with the other Independent Trustees to review a summary of the key financial, performance and other data that the Contract Committee considered in the course of its review. The Contract Committee then presented its written report, which summarized the key factors that the Committee had considered and set forth its recommendations. The Contract Committee then recommended, and the Independent Trustees approved, the continuance of your fund’s management and sub-management contracts, effective July 1, 2016. (Because PIL is an affiliate of Putnam Management and Putnam Management remains fully responsible for all services provided by PIL, the Trustees have not attempted to evaluate PIL as a separate entity, and all subsequent references to Putnam Management below should be deemed to include reference to PIL as necessary or appropriate in the context.)
The Independent Trustees’ approval was based on the following conclusions:
• That the fee schedule in effect for your fund represented reasonable compensation in light of the nature and quality of the services being provided to the fund, the fees paid by competitive funds, the costs incurred by Putnam Management in providing services to the fund, and the continued application of certain reductions and waivers noted below; and
• That the fee schedule in effect for your fund represented an appropriate sharing between fund shareholders and Putnam Management of such economies of scale as may exist in the management of the fund at current asset levels.
These conclusions were based on a comprehensive consideration of all information provided to the Trustees and were not the result of any single factor. Some of the factors that figured particularly in the Trustees’ deliberations and how the Trustees considered these factors are described below, although individual Trustees may have evaluated the information presented differently, giving different weights to various factors. It is also important to recognize that the management arrangements for your fund and the other Putnam funds are the result of many years of review and discussion between the Independent Trustees and Putnam Management, that some aspects of the arrangements may receive greater scrutiny
|
| 16 The Putnam Fund for Growth and Income |
in some years than others, and that the Trustees’ conclusions may be based, in part, on their consideration of fee arrangements in previous years. For example, with some minor exceptions, the funds’ current fee arrangements under the management contracts were first implemented at the beginning of 2010 following extensive review by the Contract Committee and discussions with representatives of Putnam Management, as well as approval by shareholders.
Management fee schedules and total expenses
The Trustees reviewed the management fee schedules in effect for all Putnam funds, including fee levels and breakpoints. The Trustees also reviewed the total expenses of each Putnam fund, recognizing that in most cases management fees represented the major, but not the sole, determinant of total costs to shareholders. (In a few instances, funds have implemented so-called “all-in” management fees covering substantially all routine fund operating costs.)
In reviewing fees and expenses, the Trustees generally focus their attention on material changes in circumstances — for example, changes in assets under management, changes in a fund’s investment style, changes in Putnam Management’s operating costs or profitability, or changes in competitive practices in the mutual fund industry — that suggest that consideration of fee changes might be warranted. The Trustees concluded that the circumstances did not indicate that changes to the management fee structure for your fund would be appropriate at this time.
Under its management contract, your fund has the benefit of breakpoints in its management fee schedule that provide shareholders with economies of scale in the form of reduced fee rates as assets under management in the Putnam family of funds increase. The Trustees concluded that the fee schedule in effect for your fund represented an appropriate sharing of economies of scale between fund shareholders and Putnam Management.
As in the past, the Trustees also focused on the competitiveness of each fund’s total expense ratio. In order to support the effort to have fund expenses meet competitive standards, the Trustees and Putnam Management have implemented certain expense limitations that were in effect during your fund’s fiscal year ending in 2015. These expense limitations were: (i) a contractual expense limitation applicable to specified retail open-end funds, including your fund, of 32 basis points on investor servicing fees and expenses and (ii) a contractual expense limitation applicable to specified open-end funds, including your fund, of 20 basis points on so-called “other expenses” (i.e., all expenses exclusive of management fees, distribution fees, investor servicing fees, investment-related expenses, interest, taxes, brokerage commissions, acquired fund fees and expenses and extraordinary expenses). These expense limitations attempt to maintain competitive expense levels for the funds. Most funds, including your fund, had sufficiently low expenses that these expense limitations were not operative during their fiscal years ending in 2015. Putnam Management has agreed to maintain these expense limitations until at least February 28, 2018 and to reduce the contractual expense limitation on investor servicing fees and expenses from 32 basis points to 25 basis points effective September 1, 2016. Putnam Management’s support for these expense limitation arrangements was an important factor in the Trustees’ decision to approve the continuance of your fund’s management and sub-management contracts.
The Trustees reviewed comparative fee and expense information for a custom group of competitive funds selected by Broadridge Financial Solutions, Inc. (“Broadridge”). This comparative information included your fund’s percentile ranking for effective management fees and total expenses (excluding any applicable 12b-1 fee), which provides a general indication of your fund’s relative standing. In the custom peer group, your fund ranked in the first quintile in effective management fees (determined for your fund and the other funds in the custom peer group based on fund asset size and the applicable contractual management fee schedule) and in the first quintile in total expenses (excluding any applicable 12b-1 fees) as of December 31, 2015. The first quintile represents the least expensive funds and the fifth quintile the most expensive funds. The fee and expense data reported by Broadridge as of December 31, 2015 reflected the most recent fiscal year-end data available in Broadridge’s database at that time.
In connection with their review of fund management fees and total expenses, the Trustees also reviewed the costs of the services provided and the profits realized by Putnam Management and its affiliates from their contractual relationships with the funds. This information included trends
|
| The Putnam Fund for Growth and Income 17 |
in revenues, expenses and profitability of Putnam Management and its affiliates relating to the investment management, investor servicing and distribution services provided to the funds. In this regard, the Trustees also reviewed an analysis of Putnam Management’s revenues, expenses and profitability, allocated on a fund-by-fund basis, with respect to the funds’ management, distribution, and investor servicing contracts. For each fund, the analysis presented information about revenues, expenses and profitability for each of the agreements separately and for the agreements taken together on a combined basis. The Trustees concluded that, at current asset levels, the fee schedules in place represented reasonable compensation for the services being provided and represented an appropriate sharing between fund shareholders and Putnam Management of such economies of scale as may exist in the management of the Putnam funds at that time.
The information examined by the Trustees as part of their annual contract review for the Putnam funds included information regarding fees charged by Putnam Management and its affiliates to institutional clients such as defined benefit pension plans, college endowments, sub-advised third-party mutual funds, and the like. This information included comparisons of those fees with fees charged to the Putnam funds, as well as an assessment of the differences in the services provided to these different types of clients. The Trustees observed that the differences in fee rates between these clients and the Putnam funds are by no means uniform when examined by individual asset sectors, suggesting that differences in the pricing of investment management services to these types of clients may reflect, among other things, historical competitive forces operating in separate markets. The Trustees considered the fact that in many cases fee rates across different asset classes are higher on average for mutual funds than for institutional clients, as well as the differences between the services that Putnam Management provides to the Putnam funds and those that it provides to its other clients. The Trustees did not rely on these comparisons to any significant extent in concluding that the management fees paid by your fund are reasonable.
Investment performance
The quality of the investment process provided by Putnam Management represented a major factor in the Trustees’ evaluation of the quality of services provided by Putnam Management under your fund’s management contract. The Trustees were assisted in their review of the Putnam funds’ investment process and performance by the work of the investment oversight committees of the Trustees, which meet on a regular basis with the funds’ portfolio teams and with the Chief Investment Officer and other senior members of Putnam Management’s Investment Division throughout the year. The Trustees concluded that Putnam Management generally provides a high-quality investment process — based on the experience and skills of the individuals assigned to the management of fund portfolios, the resources made available to them, and in general Putnam Management’s ability to attract and retain high-quality personnel — but also recognized that this does not guarantee favorable investment results for every fund in every time period.
The Trustees considered that 2015 was a year of mixed performance results for the Putnam funds, with generally strong results for the international equity, global sector and global asset allocation funds, but generally disappointing results for the U.S. and small-cap equity, Spectrum and fixed income funds. They noted that the longer-term performance of the Putnam funds generally continued to be strong, exemplified by the fact that the Putnam funds were ranked by the Barron’s/Lipper Fund Families survey as the 18th-best performing mutual fund complex out of 58 complexes for the five-year period ended December 31, 2015. They also noted, however, the disappointing investment performance of some funds for periods ended December 31, 2015 and considered information provided by Putnam Management regarding the factors contributing to the underperformance and actions being taken to improve the performance of these particular funds. The Trustees indicated their intention to continue to monitor performance trends to assess the effectiveness of these efforts and to evaluate whether additional actions to address areas of underperformance are warranted.
For purposes of evaluating investment performance, the Trustees generally focus on a competitive industry ranking of each fund’s total net return over a one-year, three-year and five-year period. For a number of Putnam funds with relatively unique investment mandates for which meaningful competitive performance rankings are not considered to be available, the Trustees evaluated performance based on their total gross and net returns and, in most cases,
|
| 18 The Putnam Fund for Growth and Income |
comparisons of those returns with the returns of selected investment benchmarks. In the case of your fund, the Trustees considered that its class A share cumulative total return performance at net asset value was in the following quartiles of its Lipper Inc. (“Lipper”) peer group (Lipper Large-Cap Value Funds) for the one-year, three-year and five-year periods ended December 31, 2015 (the first quartile representing the best-performing funds and the fourth quartile the worst-performing funds):
| |
| One-year period | 4th |
|
| Three-year period | 3rd |
|
| Five-year period | 3rd |
|
Over the one-year, three-year and five-year periods ended December 31, 2015, there were 513, 455 and 409 funds, respectively, in your fund’s Lipper peer group. (When considering performance information, shareholders should be mindful that past performance is not a guarantee of future results.) The Trustees expressed concern about your fund’s fourth quartile performance over the one-year period ended December 31, 2015 and considered the circumstances that may have contributed to this disappointing performance. The Trustees considered Putnam Management’s observation that the fund’s underperformance over the one-year period was due in significant part to security selection within the utilities and energy sectors. The Trustees also considered Putnam Management’s view that the fund’s performance in 2015 was attributable to the fund’s relative emphasis on investing in securities that the fund’s portfolio manager believed were undervalued by the market, which detracted from the fund’s performance at a time when value-based investment strategies generally underperformed growth-based investment strategies.
The Trustees considered that Putnam Management remained confident in the fund’s portfolio manager and his investment process. The Trustees also considered Putnam Management’s continued efforts to support fund performance through initiatives including structuring compensation for portfolio managers and research analysts to enhance accountability for fund performance, emphasizing accountability in the portfolio management process, and affirming its commitment to a fundamental-driven approach to investing. The Trustees noted further that Putnam Management continued to strengthen its fundamental research capabilities by adding new investment personnel.
As a general matter, the Trustees believe that cooperative efforts between the Trustees and Putnam Management represent the most effective way to address investment performance issues that may arise from time to time. The Trustees noted that investors in the Putnam funds have, in effect, placed their trust in the Putnam organization, under the oversight of the funds’ Trustees, to make appropriate decisions regarding the management of the funds. Based on past responsiveness of Putnam Management to Trustee concerns about investment performance, the Trustees concluded that it is preferable to seek change within Putnam Management to address performance shortcomings. In the Trustees’ view, the alternative of engaging a new investment adviser for an underperforming fund would entail significant disruptions and would not likely provide any greater assurance of improved investment performance.
Brokerage and soft-dollar allocations; investor servicing
The Trustees considered various potential benefits that Putnam Management may receive in connection with the services it provides under the management contract with your fund. These include benefits related to brokerage allocation and the use of soft dollars, whereby a portion of the commissions paid by a fund for brokerage may be used to acquire research services that are expected to be useful to Putnam Management in managing the assets of the fund and of other clients. Subject to policies established by the Trustees, soft dollars generated by these means are used primarily to acquire brokerage and research services (including third-party research and market data) that enhance Putnam Management’s investment capabilities and supplement Putnam Management’s internal research efforts. However, the Trustees noted that a portion of available soft dollars continues to be used to pay fund expenses. The Trustees indicated their continued intent to monitor regulatory and industry developments in this area with the assistance of their Brokerage Committee and also indicated their continued intent to monitor the allocation of the Putnam funds’ brokerage in order to ensure that the principle of seeking best price and execution remains paramount in the portfolio trading process.
|
| The Putnam Fund for Growth and Income 19 |
Putnam Management may also receive benefits from payments that the funds make to Putnam Management’s affiliates for investor or distribution services. In conjunction with the annual review of your fund’s management and sub-management contracts, the Trustees reviewed your fund’s investor servicing agreement with Putnam Investor Services, Inc. (“PSERV”) and its distributor’s contracts and distribution plans with Putnam Retail Management Limited Partnership (“PRM”), both of which are affiliates of Putnam Management. The Trustees concluded that the fees payable by the funds to PSERV and PRM, as applicable, for such services are reasonable in relation to the nature and quality of such services, the fees paid by competitive funds, and the costs incurred by PSERV and PRM, as applicable, in providing such services.
|
| 20 The Putnam Fund for Growth and Income |
Financial statements
These sections of the report, as well as the accompanying Notes, preceded by the Report of Independent Registered Public Accounting Firm, constitute the fund’s financial statements.
The fund’s portfolio lists all the fund’s investments and their values as of the last day of the reporting period. Holdings are organized by asset type and industry sector, country, or state to show areas of concentration and diversification.
Statement of assets and liabilities shows how the fund’s net assets and share price are determined. All investment and non-investment assets are added together. Any unpaid expenses and other liabilities are subtracted from this total. The result is divided by the number of shares to determine the net asset value per share, which is calculated separately for each class of shares. (For funds with preferred shares, the amount subtracted from total assets includes the liquidation preference of preferred shares.)
Statement of operations shows the fund’s net investment gain or loss. This is done by first adding up all the fund’s earnings — from dividends and interest income — and subtracting its operating expenses to determine net investment income (or loss). Then, any net gain or loss the fund realized on the sales of its holdings — as well as any unrealized gains or losses over the period — is added to or subtracted from the net investment result to determine the fund’s net gain or loss for the fiscal year.
Statement of changes in net assets shows how the fund’s net assets were affected by the fund’s net investment gain or loss, by distributions to shareholders, and by changes in the number of the fund’s shares. It lists distributions and their sources (net investment income or realized capital gains) over the current reporting period and the most recent fiscal year-end. The distributions listed here may not match the sources listed in the Statement of operations because the distributions are determined on a tax basis and may be paid in a different period from the one in which they were earned.
Financial highlights provide an overview of the fund’s investment results, per-share distributions, expense ratios, net investment income ratios, and portfolio turnover in one summary table, reflecting the five most recent reporting periods. In a semiannual report, the highlights table also includes the current reporting period.
|
| The Putnam Fund for Growth and Income 21 |
Report of Independent Registered Public Accounting Firm
To the Trustees and Shareholders of
The Putnam Fund for Growth and Income:
In our opinion, the accompanying statement of assets and liabilities, including the portfolio, and the related statements of operations and of changes in net assets and the financial highlights present fairly, in all material respects, the financial position of The Putnam Fund for Growth and Income (the “fund”) at October 31, 2016, and the results of its operations, the changes in its net assets and the financial highlights for each of the periods indicated, in conformity with accounting principles generally accepted in the United States of America. These financial statements and financial highlights (hereafter referred to as “financial statements”) are the responsibility of the fund’s management. Our responsibility is to express an opinion on these financial statements based on our audits. We conducted our audits of these financial statements in accordance with the standards of the Public Company Accounting Oversight Board (United States). Those standards require that we plan and perform the audit to obtain reasonable assurance about whether the financial statements are free of material misstatement. An audit includes examining, on a test basis, evidence supporting the amounts and disclosures in the financial statements, assessing the accounting principles used and significant estimates made by management, and evaluating the overall financial statement presentation. We believe that our audits, which included confirmation of investments at October 31, 2016 by correspondence with the custodian, brokers, transfer agent, and the application of alternative auditing procedures where securities purchased had not been received, provide a reasonable basis for our opinion.
PricewaterhouseCoopers LLP
Boston, Massachusetts
December 9, 2016
|
| 22 The Putnam Fund for Growth and Income |
The fund’s portfolio 10/31/16
| | |
| COMMON STOCKS (96.2%)* | Shares | Value |
|
| Aerospace and defense (4.8%) | | |
|
| Airbus Group SE (France) | 494,999 | $29,424,313 |
|
| Embraer SA ADR (Brazil) | 311,000 | 6,652,290 |
|
| General Dynamics Corp. | 295,300 | 44,513,522 |
|
| L-3 Communications Holdings, Inc. | 170,900 | 23,403,046 |
|
| Northrop Grumman Corp. | 281,100 | 64,371,900 |
|
| Raytheon Co. | 209,100 | 28,565,151 |
|
| United Technologies Corp. | 283,000 | 28,922,600 |
|
| | | 225,852,822 |
|
| Air freight and logistics (0.7%) | | |
|
| United Parcel Service, Inc. Class B | 309,200 | 33,319,392 |
|
| | | 33,319,392 |
|
| Airlines (0.5%) | | |
|
| Southwest Airlines Co. | 631,600 | 25,295,580 |
|
| | | 25,295,580 |
|
| Auto components (0.1%) | | |
|
| Adient PLC (Ireland) † | 102,887 | 4,682,387 |
|
| | | 4,682,387 |
|
| Automobiles (0.1%) | | |
|
| General Motors Co. | 218,400 | 6,901,440 |
|
| | | 6,901,440 |
|
| Banks (12.2%) | | |
|
| Bank of America Corp. | 7,762,694 | 128,084,451 |
|
| Citigroup, Inc. | 2,380,680 | 117,010,422 |
|
| JPMorgan Chase & Co. | 2,652,346 | 183,701,484 |
|
| Wells Fargo & Co. | 3,116,779 | 143,403,002 |
|
| | | 572,199,359 |
|
| Beverages (2.6%) | | |
|
| Dr. Pepper Snapple Group, Inc. | 324,400 | 28,479,076 |
|
| Molson Coors Brewing Co. Class B | 266,000 | 27,613,460 |
|
| PepsiCo, Inc. | 595,500 | 63,837,600 |
|
| | | 119,930,136 |
|
| Biotechnology (0.5%) | | |
|
| Gilead Sciences, Inc. | 338,800 | 24,945,844 |
|
| | | 24,945,844 |
|
| Building products (0.9%) | | |
|
| Johnson Controls International PLC | 1,028,878 | 41,484,361 |
|
| | | 41,484,361 |
|
| Capital markets (4.7%) | | |
|
| AllianceBernstein Holding LP | 573,400 | 12,500,120 |
|
| Charles Schwab Corp. (The) | 1,099,100 | 34,841,470 |
|
| Goldman Sachs Group, Inc. (The) | 239,193 | 42,633,760 |
|
| KKR & Co. LP | 2,544,896 | 36,112,074 |
|
| Morgan Stanley | 1,575,600 | 52,892,892 |
|
| State Street Corp. | 567,200 | 39,823,112 |
|
| | | 218,803,428 |
|
| Chemicals (3.5%) | | |
|
| Air Products & Chemicals, Inc. | 142,300 | 18,985,666 |
|
| Axalta Coating Systems, Ltd. † | 558,497 | 14,029,445 |
|
|
| The Putnam Fund for Growth and Income 23 |
| | |
| COMMON STOCKS (96.2%)* cont. | Shares | Value |
|
| Chemicals cont. | | |
|
| CF Industries Holdings, Inc. | 885,000 | $21,248,850 |
|
| Dow Chemical Co. (The) S | 636,200 | 34,233,922 |
|
| E.I. du Pont de Nemours & Co. | 468,500 | 32,228,115 |
|
| Ingevity Corp. † | 279,000 | 11,550,600 |
|
| Monsanto Co. | 208,300 | 20,990,391 |
|
| Symrise AG (Germany) | 123,142 | 8,450,050 |
|
| | | 161,717,039 |
|
| Commercial services and supplies (0.2%) | | |
|
| Stericycle, Inc. † | 127,300 | 10,195,457 |
|
| | | 10,195,457 |
|
| Communications equipment (1.9%) | | |
|
| Cisco Systems, Inc. | 2,967,457 | 91,041,581 |
|
| | | 91,041,581 |
|
| Consumer finance (1.2%) | | |
|
| Capital One Financial Corp. | 327,500 | 24,248,100 |
|
| Synchrony Financial | 1,048,900 | 29,988,051 |
|
| | | 54,236,151 |
|
| Containers and packaging (0.7%) | | |
|
| Ball Corp. | 344,400 | 26,542,908 |
|
| Graphic Packaging Holding Co. | 568,200 | 7,102,500 |
|
| | | 33,645,408 |
|
| Distributors (0.3%) | | |
|
| LKQ Corp. † | 398,000 | 12,847,440 |
|
| | | 12,847,440 |
|
| Diversified financial services (0.2%) | | |
|
| Gores Holdings, Inc. Class A † S | 696,300 | 7,930,857 |
|
| | | 7,930,857 |
|
| Diversified telecommunication services (1.3%) | | |
|
| AT&T, Inc. S | 1,703,400 | 62,668,086 |
|
| | | 62,668,086 |
|
| Electric utilities (2.2%) | | |
|
| American Electric Power Co., Inc. | 269,000 | 17,441,960 |
|
| Edison International | 239,800 | 17,620,504 |
|
| Exelon Corp. | 1,413,000 | 48,140,910 |
|
| PG&E Corp. | 325,400 | 20,213,848 |
|
| | | 103,417,222 |
|
| Energy equipment and services (1.6%) | | |
|
| Halliburton Co. | 856,300 | 39,389,800 |
|
| Schlumberger, Ltd. | 444,339 | 34,760,640 |
|
| | | 74,150,440 |
|
| Equity real estate investment trusts (REITs) (1.0%) | | |
|
| American Tower Corp. | 141,400 | 16,570,666 |
|
| Gaming and Leisure Properties, Inc. | 872,508 | 28,644,438 |
|
| | | 45,215,104 |
|
| Food and staples retail (1.7%) | | |
|
| CVS Health Corp. | 166,300 | 13,985,830 |
|
| Kroger Co. (The) | 814,400 | 25,230,112 |
|
| Walgreens Boots Alliance, Inc. | 515,800 | 42,672,134 |
|
| | | 81,888,076 |
|
| 24 The Putnam Fund for Growth and Income |
| | |
| COMMON STOCKS (96.2%)* cont. | Shares | Value |
|
| Food products (1.7%) | | |
|
| JM Smucker Co. (The) | 197,500 | $25,933,725 |
|
| Kraft Heinz Co. (The) | 522,000 | 46,431,900 |
|
| Mead Johnson Nutrition Co. | 89,100 | 6,662,007 |
|
| | | 79,027,632 |
|
| Health-care equipment and supplies (3.1%) | | |
|
| Abbott Laboratories | 450,600 | 17,681,544 |
|
| Baxter International, Inc. | 204,300 | 9,722,637 |
|
| Becton Dickinson and Co. | 231,000 | 38,787,210 |
|
| C.R. Bard, Inc. | 133,900 | 29,013,452 |
|
| Danaher Corp. | 248,500 | 19,519,675 |
|
| Medtronic PLC | 387,631 | 31,793,495 |
|
| | | 146,518,013 |
|
| Health-care providers and services (0.8%) | | |
|
| Cardinal Health, Inc. | 173,800 | 11,938,322 |
|
| Cigna Corp. | 76,500 | 9,090,495 |
|
| UnitedHealth Group, Inc. | 104,200 | 14,726,586 |
|
| | | 35,755,403 |
|
| Hotels, restaurants, and leisure (1.1%) | | |
|
| Hilton Worldwide Holdings, Inc. | 1,452,700 | 32,831,020 |
|
| Penn National Gaming, Inc. † | 1,562,736 | 20,206,176 |
|
| | | 53,037,196 |
|
| Household durables (0.3%) | | |
|
| PulteGroup, Inc. | 651,900 | 12,125,340 |
|
| | | 12,125,340 |
|
| Household products (0.8%) | | |
|
| Colgate-Palmolive Co. | 331,400 | 23,648,704 |
|
| Procter & Gamble Co. (The) | 158,874 | 13,790,263 |
|
| | | 37,438,967 |
|
| Independent power and renewable electricity producers (1.3%) | | |
|
| Calpine Corp. † | 2,960,017 | 35,224,202 |
|
| NRG Energy, Inc. | 2,613,800 | 27,784,694 |
|
| | | 63,008,896 |
|
| Industrial conglomerates (1.7%) | | |
|
| General Electric Co. | 1,457,420 | 42,410,922 |
|
| Honeywell International, Inc. | 338,800 | 37,159,584 |
|
| | | 79,570,506 |
|
| Insurance (5.3%) | | |
|
| American International Group, Inc. | 1,533,125 | 94,593,813 |
|
| Assured Guaranty, Ltd. | 1,160,380 | 34,683,758 |
|
| Chubb, Ltd. | 230,300 | 29,248,100 |
|
| Hartford Financial Services Group, Inc. (The) | 1,060,400 | 46,774,244 |
|
| MetLife, Inc. | 414,487 | 19,464,310 |
|
| Prudential PLC (United Kingdom) | 1,487,020 | 24,289,415 |
|
| | | 249,053,640 |
|
| Internet and direct marketing retail (—%) | | |
|
| FabFurnish GmbH (acquired 8/2/13, cost $52) (Private) (Brazil) †ΔΔF | 78 | 64 |
|
| Global Fashion Group SA (acquired 8/2/13, cost $2,567,154) (Private) | | |
| (Brazil) †ΔΔF | 60,600 | 428,441 |
|
|
| The Putnam Fund for Growth and Income 25 |
| | |
| COMMON STOCKS (96.2%)* cont. | Shares | Value |
|
| Internet and direct marketing retail cont. | | |
|
| New Bigfoot Other Assets GmbH (acquired 8/2/13, cost $52) (Private) | | |
| (Brazil) †ΔΔF | 39 | $32 |
|
| New Middle East Other Assets GmbH (acquired 8/2/13, cost $21) (Private) | | |
| (Brazil) †ΔΔF | 16 | 13 |
|
| | | 428,550 |
|
| Internet software and services (1.1%) | | |
|
| Alphabet, Inc. Class C † | 64,680 | 50,744,047 |
|
| | | 50,744,047 |
|
| IT Services (1.6%) | | |
|
| Computer Sciences Corp. | 822,300 | 44,774,235 |
|
| Fidelity National Information Services, Inc. | 393,200 | 29,065,344 |
|
| | | 73,839,579 |
|
| Life sciences tools and services (0.3%) | | |
|
| Agilent Technologies, Inc. | 289,900 | 12,630,943 |
|
| | | 12,630,943 |
|
| Media (2.3%) | | |
|
| Charter Communications, Inc. Class A † | 44,751 | 11,182,827 |
|
| Comcast Corp. Class A | 544,700 | 33,673,354 |
|
| DISH Network Corp. Class A † | 298,200 | 17,462,592 |
|
| Liberty Global PLC Ser. C (United Kingdom) † | 556,900 | 17,709,420 |
|
| Time Warner, Inc. | 314,300 | 27,969,557 |
|
| | | 107,997,750 |
|
| Metals and mining (1.0%) | | |
|
| BHP Billiton, Ltd. (Australia) | 1,843,760 | 32,289,801 |
|
| Newmont Mining Corp. | 381,800 | 14,141,872 |
|
| | | 46,431,673 |
|
| Multiline retail (0.5%) | | |
|
| Target Corp. | 358,200 | 24,619,086 |
|
| | | 24,619,086 |
|
| Oil, gas, and consumable fuels (9.5%) | | |
|
| Anadarko Petroleum Corp. | 453,400 | 26,950,099 |
|
| Cenovus Energy, Inc. (Canada) | 690,700 | 9,964,247 |
|
| Cheniere Energy, Inc. † | 377,600 | 14,235,520 |
|
| Chevron Corp. | 162,600 | 17,032,350 |
|
| Concho Resources, Inc. † S | 117,400 | 14,902,756 |
|
| ConocoPhillips | 1,299,300 | 56,454,585 |
|
| Diamondback Energy, Inc. † | 157,875 | 14,412,409 |
|
| Energen Corp. | 203,700 | 10,211,481 |
|
| EOG Resources, Inc. | 374,800 | 33,889,416 |
|
| Exxon Mobil Corp. | 432,392 | 36,026,901 |
|
| Gulfport Energy Corp. † | 523,500 | 12,621,585 |
|
| Marathon Oil Corp. | 1,278,400 | 16,849,312 |
|
| Pioneer Natural Resources Co. | 224,300 | 40,154,186 |
|
| Range Resources Corp. | 395,500 | 13,363,945 |
|
| Royal Dutch Shell PLC ADR Class A (United Kingdom) | 1,289,014 | 64,205,787 |
|
| Scorpio Tankers, Inc. | 2,954,200 | 11,314,586 |
|
| Suncor Energy, Inc. (Canada) | 1,133,745 | 34,021,648 |
|
| Total SA ADR (France) S | 395,299 | 18,871,574 |
|
| | | 445,482,387 |
|
| 26 The Putnam Fund for Growth and Income |
| | |
| COMMON STOCKS (96.2%)* cont. | Shares | Value |
|
| Paper and forest products (0.2%) | | |
|
| Boise Cascade Co. † | 426,300 | $8,206,275 |
|
| | | 8,206,275 |
|
| Personal products (1.0%) | | |
|
| Coty, Inc. Class A † | 879,767 | 20,225,843 |
|
| Edgewell Personal Care Co. † | 329,968 | 24,879,587 |
|
| | | 45,105,430 |
|
| Pharmaceuticals (8.9%) | | |
|
| Allergan PLC † | 149,700 | 31,278,318 |
|
| AstraZeneca PLC ADR (United Kingdom) S | 1,334,600 | 37,795,872 |
|
| Bristol-Myers Squibb Co. | 301,300 | 15,339,183 |
|
| Eli Lilly & Co. | 528,500 | 39,024,440 |
|
| Johnson & Johnson | 643,100 | 74,593,169 |
|
| Merck & Co., Inc. | 1,249,791 | 73,387,728 |
|
| Perrigo Co. PLC S | 100,200 | 8,335,638 |
|
| Pfizer, Inc. | 2,487,834 | 78,889,216 |
|
| Sanofi ADR (France) S | 496,900 | 19,324,441 |
|
| Teva Pharmaceutical Industries, Ltd. ADR (Israel) | 676,800 | 28,926,432 |
|
| Zoetis, Inc. | 213,038 | 10,183,216 |
|
| | | 417,077,653 |
|
| Road and rail (0.7%) | | |
|
| Union Pacific Corp. | 370,700 | 32,688,326 |
|
| | | 32,688,326 |
|
| Semiconductors and semiconductor equipment (2.0%) | | |
|
| Applied Materials, Inc. | 732,600 | 21,304,008 |
|
| Intel Corp. | 943,500 | 32,899,845 |
|
| Micron Technology, Inc. † | 1,529,900 | 26,253,084 |
|
| NXP Semiconductor NV † | 95,700 | 9,570,000 |
|
| Versum Materials, Inc. † | 71,150 | 1,615,105 |
|
| | | 91,642,042 |
|
| Software (2.9%) | | |
|
| Microsoft Corp. | 1,996,100 | 119,606,312 |
|
| Oracle Corp. | 386,800 | 14,860,856 |
|
| | | 134,467,168 |
|
| Specialty retail (0.6%) | | |
|
| Home Depot, Inc. (The) | 169,400 | 20,668,494 |
|
| Michaels Cos., Inc. (The) † | 372,400 | 8,658,300 |
|
| | | 29,326,794 |
|
| Technology hardware, storage, and peripherals (1.7%) | | |
|
| Apple, Inc. | 584,400 | 66,352,776 |
|
| HP, Inc. | 880,900 | 12,764,241 |
|
| | | 79,117,017 |
|
| Textiles, apparel, and luxury goods (0.3%) | | |
|
| Hanesbrands, Inc. | 560,200 | 14,397,140 |
|
| | | 14,397,140 |
|
| Thrifts and mortgage finance (0.7%) | | |
|
| Radian Group, Inc. | 2,485,355 | 33,775,974 |
|
| | | 33,775,974 |
|
| Tobacco (0.7%) | | |
|
| Philip Morris International, Inc. | 324,700 | 31,314,068 |
|
| | | 31,314,068 |
|
| The Putnam Fund for Growth and Income 27 |
| | | |
| COMMON STOCKS (96.2%)* cont. | | Shares | Value |
|
| Wireless telecommunication services (1.2%) | | | |
|
| T-Mobile US, Inc. † | | 656,900 | $32,667,637 |
|
| Vodafone Group PLC ADR (United Kingdom) S | | 797,822 | 22,211,364 |
|
| | | | 54,879,001 |
|
| Total common stocks (cost $4,115,106,895) | | | $4,502,074,106 |
|
| |
| CONVERTIBLE PREFERRED STOCKS (—%)* | | Shares | Value |
|
| Global Fashion Group SA zero % cv. pfd. (acquired 7/11/16, cost $309,232) | | |
| (Brazil) (Private) †ΔΔF | | 40,826 | $306,995 |
|
| Total convertible preferred stocks (cost $309,232) | | | $306,995 |
|
| |
| | Principal amount/ | |
| SHORT-TERM INVESTMENTS (7.5%)* | | shares | Value |
|
| Putnam Cash Collateral Pool, LLC 0.74% d | Shares | 172,943,150 | $172,943,150 |
|
| Putnam Short Term Investment Fund 0.50% L | Shares | 167,134,484 | 167,134,484 |
|
| State Street Institutional Liquid Reserves Fund Trust | | | |
| Class 0.38% P | Shares | 9,510,000 | 9,510,000 |
|
| U.S. Treasury Bills 0.291%, 11/10/16 | | $170,000 | 169,995 |
|
| U.S. Treasury Bills 0.163%, 11/3/16 | | 140,000 | 139,999 |
|
| Total short-term investments (cost $349,897,621) | | | $349,897,628 |
|
| |
| TOTAL INVESTMENTS | | | |
|
| Total investments (cost $4,465,313,748) | | | $4,852,278,729 |
|
Key to holding’s abbreviations
ADR American Depository Receipts: represents ownership of foreign securities on deposit with a custodian bank
Notes to the fund’s portfolio
Unless noted otherwise, the notes to the fund’s portfolio are for the close of the fund’s reporting period, which ran from November 1, 2015 through October 31, 2016 (the reporting period). Within the following notes to the portfolio, references to “ASC 820” represent Accounting Standards Codification 820 Fair Value Measurements and Disclosures and references to “OTC”, if any, represent over-the-counter.
* Percentages indicated are based on net assets of $4,680,601,548.
† This security is non-income-producing.
ΔΔ This security is restricted with regard to public resale. The total fair value of this security and any other restricted securities (excluding 144A securities), if any, held at the close of the reporting period was $735,545, or less than 0.1% of net assets.
d Affiliated company. See Notes 1 and 5 to the financial statements regarding securities lending. The rate quoted in the security description is the annualized 7-day yield of the fund at the close of the reporting period.
F This security is valued by Putnam Management at fair value following procedures approved by the Trustees. Securities may be classified as Level 2 or Level 3 for ASC 820 based on the securities’ valuation inputs. At the close of the reporting period, fair value pricing was also used for certain foreign securities in the portfolio (Note 1).
L Affiliated company (Note 5). The rate quoted in the security description is the annualized 7-day yield of the fund at the close of the reporting period.
P This security was pledged, or purchased with cash that was pledged, to the fund for collateral on certain derivative contracts. The rate quoted in the security description is the annualized 7-day yield of the fund at the close of the reporting period (Note 1).
S Security on loan, in part or in entirety, at the close of the reporting period (Note 1).
|
| 28 The Putnam Fund for Growth and Income |
Unless otherwise noted, the rates quoted in Short-term investments security descriptions represent the weighted average yield to maturity.
The dates shown on debt obligations are the original maturity dates.
| | | | | | |
| FORWARD CURRENCY CONTRACTS at 10/31/16 (aggregate face value $154,421,120) | |
|
| | | Contract | Delivery | | Aggregate | Unrealized |
| Counterparty | Currency | type | date | Value | face value | appreciation |
|
| Credit Suisse International | | | | | |
|
| | British Pound | Sell | 12/21/16 | $93,474,657 | $101,314,115 | $7,839,458 |
|
| | Euro | Sell | 12/21/16 | 20,725,194 | 21,079,557 | 354,363 |
|
| JPMorgan Chase Bank N.A. | | | | | |
|
| | Euro | Sell | 12/21/16 | 31,487,495 | 32,027,448 | 539,953 |
|
| Total | | | | | | $8,733,774 |
|
|
| The Putnam Fund for Growth and Income 29 |
ASC 820 establishes a three-level hierarchy for disclosure of fair value measurements. The valuation hierarchy is based upon the transparency of inputs to the valuation of the fund’s investments. The three levels are defined as follows:
Level 1: Valuations based on quoted prices for identical securities in active markets.
Level 2: Valuations based on quoted prices in markets that are not active or for which all significant inputs are observable, either directly or indirectly.
Level 3: Valuations based on inputs that are unobservable and significant to the fair value measurement.
The following is a summary of the inputs used to value the fund’s net assets as of the close of the reporting period:
| | | |
| | | Valuation inputs | |
|
| Investments in securities: | Level 1 | Level 2 | Level 3 |
|
| Common stocks *: | | | |
|
| Consumer discretionary | $265,934,573 | $— | $428,550 |
|
| Consumer staples | 394,704,309 | — | — |
|
| Energy | 519,632,827 | — | — |
|
| Financials | 1,135,999,409 | — | — |
|
| Health care | 636,927,856 | — | — |
|
| Industrials | 448,406,444 | — | — |
|
| Information technology | 520,851,434 | — | — |
|
| Materials | 217,710,594 | 32,289,801 | — |
|
| Real estate | 45,215,104 | — | — |
|
| Telecommunication services | 117,547,087 | — | — |
|
| Utilities | 166,426,118 | — | — |
|
| Total common stocks | 4,469,355,755 | 32,289,801 | 428,550 |
| | | |
| Convertible preferred stocks | — | — | 306,995 |
|
| Short-term investments | 176,644,484 | 173,253,144 | — |
|
| Totals by level | $4,646,000,239 | $205,542,945 | $735,545 |
| |
| | | Valuation inputs | |
|
| Other financial instruments: | Level 1 | Level 2 | Level 3 |
|
| Forward currency contracts | $— | $8,733,774 | $— |
|
| Totals by level | $— | $8,733,774 | $— |
* Common stock classifications are presented at the sector level, which may differ from the fund’s portfolio presentation.
During the reporting period, transfers within the fair value hierarchy, if any (other than certain transfers involving non-U.S. equity securities as described in Note 1), did not represent, in the aggregate, more than 1% of the fund’s net assets measured as of the end of the period. Transfers are accounted for using the end of period pricing valuation method.
At the start and close of the reporting period, Level 3 investments in securities represented less than 1% of the fund’s net assets and were not considered a significant portion of the fund’s portfolio.
The accompanying notes are an integral part of these financial statements.
|
| 30 The Putnam Fund for Growth and Income |
Statement of assets and liabilities 10/31/16
| |
| ASSETS | |
|
| Investment in securities, at value, including $168,745,721 of securities on loan (Note 1): | |
| Unaffiliated issuers (identified cost $4,125,236,114) | $4,512,201,095 |
| Affiliated issuers (identified cost $340,077,634) (Notes 1 and 5) | 340,077,634 |
|
| Dividends, interest and other receivables | 9,051,331 |
|
| Receivable for shares of the fund sold | 1,442,240 |
|
| Receivable for investments sold | 40,659,064 |
|
| Unrealized appreciation on forward currency contracts (Note 1) | 8,733,774 |
|
| Prepaid assets | 39,625 |
|
| Total assets | 4,912,204,763 |
|
| |
| LIABILITIES | |
|
| Payable for investments purchased | 36,576,512 |
|
| Payable for shares of the fund repurchased | 5,411,689 |
|
| Payable for compensation of Manager (Note 2) | 1,914,240 |
|
| Payable for custodian fees (Note 2) | 39,872 |
|
| Payable for investor servicing fees (Note 2) | 1,259,920 |
|
| Payable for Trustee compensation and expenses (Note 2) | 2,264,967 |
|
| Payable for administrative services (Note 2) | 8,829 |
|
| Payable for distribution fees (Note 2) | 1,068,755 |
|
| Distributions payable to shareholders | 91 |
|
| Collateral on securities loaned, at value (Note 1) | 172,943,150 |
|
| Collateral on certain derivative contracts, at value (Note 1) | 9,510,000 |
|
| Other accrued expenses | 605,190 |
|
| Total liabilities | 231,603,215 |
|
| Net assets | $4,680,601,548 |
|
| |
| REPRESENTED BY | |
|
| Paid-in capital (Unlimited shares authorized) (Notes 1 and 4) | $4,442,065,789 |
|
| Undistributed net investment income (Note 1) | 17,347,545 |
|
| Accumulated net realized loss on investments and foreign currency transactions (Note 1) | (174,510,762) |
|
| Net unrealized appreciation of investments and assets and liabilities in foreign currencies | 395,698,976 |
|
| Total — Representing net assets applicable to capital shares outstanding | $4,680,601,548 |
|
(Continued on next page)
|
| The Putnam Fund for Growth and Income 31 |
Statement of assets and liabilities cont.
| |
| COMPUTATION OF NET ASSET VALUE AND OFFERING PRICE | |
|
| Net asset value and redemption price per class A share | |
| ($4,448,379,681 divided by 215,393,375 shares) | $20.65 |
|
| Offering price per class A share (100/94.25 of $20.65)* | $21.91 |
|
| Net asset value and offering price per class B share ($60,109,748 divided by 2,965,013 shares)** | $20.27 |
|
| Net asset value and offering price per class C share ($52,282,412 divided by 2,544,101 shares)** | $20.55 |
|
| Net asset value and redemption price per class M share ($27,060,261 divided by 1,321,543 shares) | $20.48 |
|
| Offering price per class M share (100/96.50 of $20.48)* | $21.22 |
|
| Net asset value, offering price and redemption price per class R share | |
| ($1,096,187 divided by 53,345 shares) | $20.55 |
|
| Net asset value, offering price and redemption price per class R6 share | |
| ($20,014,926 divided by 966,339 shares) | $20.71 |
|
| Net asset value, offering price and redemption price per class Y share | |
| ($71,658,333 divided by 3,462,415 shares) | $20.70 |
|
*On single retail sales of less than $50,000. On sales of $50,000 or more the offering price is reduced.
**Redemption price per share is equal to net asset value less any applicable contingent deferred sales charge.
The accompanying notes are an integral part of these financial statements.
|
| 32 The Putnam Fund for Growth and Income |
Statement of operations Year ended 10/31/16
| |
| INVESTMENT INCOME | |
|
| Dividends (net of foreign tax of $1,160,733) | $107,975,383 |
|
| Interest (including interest income of $598,147 from investments in affiliated issuers) (Note 5) | 604,881 |
|
| Securities lending (net of expenses) (Notes 1 and 5) | 1,360,306 |
|
| Total investment income | 109,940,570 |
|
| |
| EXPENSES | |
|
| Compensation of Manager (Note 2) | 22,295,262 |
|
| Investor servicing fees (Note 2) | 9,175,277 |
|
| Custodian fees (Note 2) | 78,666 |
|
| Trustee compensation and expenses (Note 2) | 351,133 |
|
| Distribution fees (Note 2) | 12,562,372 |
|
| Administrative services (Note 2) | 130,274 |
|
| Other | 1,327,233 |
|
| Fees waived and reimbursed by Manager (Note 2) | (64,975) |
|
| Total expenses | 45,855,242 |
|
| Expense reduction (Note 2) | (323,945) |
|
| Net expenses | 45,531,297 |
|
| Net investment income | 64,409,273 |
|
| Net realized gain on investments (Notes 1 and 3) | 74,226,868 |
|
| Net realized gain on foreign currency transactions (Note 1) | 15,212,160 |
|
| Net unrealized appreciation of assets and liabilities in foreign currencies during the year | 7,731,073 |
|
| Net unrealized depreciation of investments during the year | (60,097,281) |
|
| Net gain on investments | 37,072,820 |
|
| Net increase in net assets resulting from operations | $101,482,093 |
|
The accompanying notes are an integral part of these financial statements.
|
| The Putnam Fund for Growth and Income 33 |
Statement of changes in net assets
| | |
| DECREASE IN NET ASSETS | Year ended 10/31/16 | Year ended 10/31/15 |
|
| Operations | | |
|
| Net investment income | $64,409,273 | $63,294,533 |
|
| Net realized gain on investments | | |
| and foreign currency transactions | 89,439,028 | 271,662,955 |
|
| Net unrealized depreciation of investments and assets | | |
| and liabilities in foreign currencies | (52,366,208) | (485,214,558) |
|
| Net increase (decrease) in net assets resulting | | |
| from operations | 101,482,093 | (150,257,070) |
|
| Distributions to shareholders (Note 1): | | |
| From ordinary income | | |
| Net investment income | | |
|
| Class A | (68,916,052) | (76,189,298) |
|
| Class B | (543,674) | (630,152) |
|
| Class C | (427,383) | (437,339) |
|
| Class M | (310,775) | (355,504) |
|
| Class R | (14,654) | (37,994) |
|
| Class R5 | (120) | (288) |
|
| Class R6 | (389,707) | (378,425) |
|
| Class Y | (1,160,423) | (1,115,747) |
|
| Decrease from capital share transactions (Note 4) | (371,217,781) | (342,402,923) |
|
| Total decrease in net assets | (341,498,476) | (571,804,740) |
|
| NET ASSETS | | |
|
| Beginning of year | 5,022,100,024 | 5,593,904,764 |
|
| End of year (including undistributed net investment income | | |
| of $17,347,545 and $12,343,147, respectively) | $4,680,601,548 | $5,022,100,024 |
The accompanying notes are an integral part of these financial statements.
|
| 34 The Putnam Fund for Growth and Income |
|
| This page left blank intentionally. |
|
| The Putnam Fund for Growth and Income 35 |
Financial highlights (For a common share outstanding throughout the period)
| | | | | | | | | | | | |
| | INVESTMENT OPERATIONS | LESS DISTRIBUTIONS | RATIOS AND SUPPLEMENTAL DATA | |
| |
|
| | | | | | | | | | | | Ratio | |
| | | | Net realized | | | | | | | | of net investment | |
| | Net asset value, | | and unrealized | Total from | From | | | Total return | Net assets, | Ratio of expenses | income (loss) | |
| | beginning | Net investment | gain (loss) | investment | net investment | Total | Net asset value, | at net asset value | end of period | to average | to average | Portfolio |
| Period ended | of period | income (loss) a | on investments | operations | income | distributions | end of period | (%) b | (in thousands) | net assets (%) c | net assets (%) | turnover (%) |
|
| Class A | | | | | | | | | | | | |
|
| October 31, 2016 | $20.48 | .28 | .20 | .48 | (.31) | (.31) | $20.65 | 2.40 | $4,448,380 | .96d | 1.39d | 42 |
|
| October 31, 2015 | 21.41 | .25 | (.87) | (.62) | (.31) | (.31) | 20.48 | (2.92) | 4,769,942 | .94 | 1.19 | 36 |
|
| October 31, 2014 | 18.87 | .31 | 2.46 | 2.77 | (.23) | (.23) | 21.41 | 14.78 | 5,322,464 | .97 | 1.54 | 41 |
|
| October 31, 2013 | 14.51 | .22 | 4.37 | 4.59 | (.23) | (.23) | 18.87 | 31.93 | 5,024,361 | 1.04 | 1.33 | 52 |
|
| October 31, 2012 | 12.79 | .21 | 1.73 | 1.94 | (.22) | (.22) | 14.51 | 15.33 | 4,232,973 | 1.10 | 1.57 | 34 |
|
| Class B | | | | | | | | | | | | |
|
| October 31, 2016 | $20.10 | .13 | .20 | .33 | (.16) | (.16) | $20.27 | 1.66 | $60,110 | 1.71d | .64d | 42 |
|
| October 31, 2015 | 21.02 | .09 | (.86) | (.77) | (.15) | (.15) | 20.10 | (3.68) | 73,968 | 1.69 | .44 | 36 |
|
| October 31, 2014 | 18.52 | .16 | 2.42 | 2.58 | (.08) | (.08) | 21.02 | 13.97 | 90,425 | 1.72 | .81 | 41 |
|
| October 31, 2013 | 14.25 | .10 | 4.28 | 4.38 | (.11) | (.11) | 18.52 | 30.89 | 95,272 | 1.79 | .60 | 52 |
|
| October 31, 2012 | 12.56 | .11 | 1.70 | 1.81 | (.12) | (.12) | 14.25 | 14.50 | 91,289 | 1.85 | .84 | 34 |
|
| Class C | | | | | | | | | | | | |
|
| October 31, 2016 | $20.38 | .13 | .20 | .33 | (.16) | (.16) | $20.55 | 1.64 | $52,282 | 1.71d | .64d | 42 |
|
| October 31, 2015 | 21.31 | .09 | (.86) | (.77) | (.16) | (.16) | 20.38 | (3.65) | 57,312 | 1.69 | .43 | 36 |
|
| October 31, 2014 | 18.78 | .16 | 2.46 | 2.62 | (.09) | (.09) | 21.31 | 13.97 | 58,084 | 1.72 | .77 | 41 |
|
| October 31, 2013 | 14.45 | .09 | 4.35 | 4.44 | (.11) | (.11) | 18.78 | 30.91 | 48,304 | 1.79 | .56 | 52 |
|
| October 31, 2012 | 12.74 | .11 | 1.72 | 1.83 | (.12) | (.12) | 14.45 | 14.46 | 36,561 | 1.85 | .82 | 34 |
|
| Class M | | | | | | | | | | | | |
|
| October 31, 2016 | $20.30 | .18 | .20 | .38 | (.20) | (.20) | $20.48 | 1.94 | $27,060 | 1.46d | .89d | 42 |
|
| October 31, 2015 | 21.23 | .15 | (.87) | (.72) | (.21) | (.21) | 20.30 | (3.44) | 32,830 | 1.44 | .69 | 36 |
|
| October 31, 2014 | 18.71 | .21 | 2.44 | 2.65 | (.13) | (.13) | 21.23 | 14.23 | 37,566 | 1.47 | 1.05 | 41 |
|
| October 31, 2013 | 14.39 | .14 | 4.33 | 4.47 | (.15) | (.15) | 18.71 | 31.29 | 36,125 | 1.54 | .83 | 52 |
|
| October 31, 2012 | 12.69 | .15 | 1.70 | 1.85 | (.15) | (.15) | 14.39 | 14.72 | 30,627 | 1.60 | 1.08 | 34 |
|
| Class R | | | | | | | | | | | | |
|
| October 31, 2016 | $20.37 | .23 | .20 | .43 | (.25) | (.25) | $20.55 | 2.19 | $1,096 | 1.21d | 1.14d | 42 |
|
| October 31, 2015 | 21.29 | .21 | (.88) | (.67) | (.25) | (.25) | 20.37 | (3.17) | 1,213 | 1.19 | .97 | 36 |
|
| October 31, 2014 | 18.77 | .26 | 2.44 | 2.70 | (.18) | (.18) | 21.29 | 14.46 | 3,852 | 1.22 | 1.28 | 41 |
|
| October 31, 2013 | 14.43 | .18 | 4.35 | 4.53 | (.19) | (.19) | 18.77 | 31.63 | 4,082 | 1.29 | 1.09 | 52 |
|
| October 31, 2012 | 12.72 | .18 | 1.72 | 1.90 | (.19) | (.19) | 14.43 | 15.06 | 3,446 | 1.35 | 1.31 | 34 |
|
| Class R6 | | | | | | | | | | | | |
|
| October 31, 2016 | $20.54 | .36 | .20 | .56 | (.39) | (.39) | $20.71 | 2.81 | $20,015 | .56d | 1.78d | 42 |
|
| October 31, 2015 | 21.47 | .34 | (.87) | (.53) | (.40) | (.40) | 20.54 | (2.52) | 21,346 | .55 | 1.57 | 36 |
|
| October 31, 2014 | 18.92 | .40 | 2.47 | 2.87 | (.32) | (.32) | 21.47 | 15.26 | 19,727 | .56 | 1.94 | 41 |
|
| October 31, 2013 | 14.54 | .27 | 4.42 | 4.69 | (.31) | (.31) | 18.92 | 32.62 | 18,293 | .57 | 1.49 | 52 |
|
| October 31, 2012† | 13.64 | .08 | .88 | .96 | (.06) | (.06) | 14.54 | 7.02* | 11 | .19* | .57* | 34 |
|
| Class Y | | | | | | | | | | | | |
|
| October 31, 2016 | $20.52 | .33 | .21 | .54 | (.36) | (.36) | $20.70 | 2.71 | $71,658 | .71d | 1.64d | 42 |
|
| October 31, 2015 | 21.46 | .31 | (.88) | (.57) | (.37) | (.37) | 20.52 | (2.70) | 65,473 | .69 | 1.43 | 36 |
|
| October 31, 2014 | 18.91 | .36 | 2.48 | 2.84 | (.29) | (.29) | 21.46 | 15.09 | 61,772 | .72 | 1.75 | 41 |
|
| October 31, 2013 | 14.54 | .27 | 4.37 | 4.64 | (.27) | (.27) | 18.91 | 32.26 | 44,639 | .79 | 1.63 | 52 |
|
| October 31, 2012 | 12.82 | .25 | 1.72 | 1.97 | (.25) | (.25) | 14.54 | 15.59 | 47,613 | .85 | 1.82 | 34 |
|
See notes to financial highlights at the end of this section.
The accompanying notes are an integral part of these financial statements.
| |
| 36 The Putnam Fund for Growth and Income | The Putnam Fund for Growth and Income 37 |
Financial highlights cont.
* Not annualized.
† For the period July 3, 2012 (commencement of operations) to October 31, 2012.
a Per share net investment income (loss) has been determined on the basis of the weighted average number of shares outstanding during the period.
b Total return assumes dividend reinvestment and does not reflect the effect of sales charges.
c Includes amounts paid through expense offset and brokerage/service arrangements, if any (Note 2). Also excludes acquired fund fees, if any.
d Reflects a voluntary waiver of certain fund expenses in effect during the period. As a result of such waivers, the expenses of each class reflect a reduction of less than 0.01% as a percentage of average net assets (Note 2).
The accompanying notes are an integral part of these financial statements.
|
| 38 The Putnam Fund for Growth and Income |
Notes to financial statements 10/31/16
Within the following Notes to financial statements, references to “State Street” represent State Street Bank and Trust Company, references to “the SEC” represent the Securities and Exchange Commission, references to “Putnam Management” represent Putnam Investment Management, LLC, the fund’s manager, an indirect wholly-owned subsidiary of Putnam Investments, LLC and references to “OTC”, if any, represent over-the-counter. Unless otherwise noted, the “reporting period” represents the period from November 1, 2015 through October 31, 2016.
The Putnam Fund for Growth and Income (the fund) is a Massachusetts business trust, which is registered under the Investment Company Act of 1940, as amended, as a diversified open-end management investment company. The goal of the fund is to seek capital growth and current income. The fund invests mainly in common stocks of large U.S. companies, with a focus on value stocks that offer the potential for capital growth, current income, or both. Value stocks are issued by companies that Putnam Management believes are currently undervalued by the market. If Putnam Management is correct and other investors ultimately recognize the value of the company, the price of its stock may rise. Putnam Management may consider, among other factors, a company’s valuation, financial strength, growth potential, competitive position in its industry, projected future earnings, cash flows and dividends when deciding whether to buy or sell investments.
The fund offers class A, class B, class C, class M, class R, class R6 and class Y shares. Class A and class M shares are sold with a maximum front-end sales charge of 5.75% and 3.50%, respectively. Class A shares generally are not subject to a contingent deferred sales charge, and class M, class R, class R6 and class Y shares are not subject to a contingent deferred sales charge. Class B shares, which convert to class A shares after approximately eight years, are not subject to a front-end sales charge and are subject to a contingent deferred sales charge if those shares are redeemed within six years of purchase. Class C shares are subject to a one-year 1.00% contingent deferred sales charge and do not convert to class A shares. Class R shares, which are not available to all investors, are sold at net asset value. The expenses for class A, class B, class C, class M and class R shares may differ based on the distribution fee of each class, which is identified in Note 2. Class R6 and class Y shares, which are sold at net asset value, are generally subject to the same expenses as class A, class B, class C, class M and class R shares, but do not bear a distribution fee and in the case of class R6 shares, bear a lower investor servicing fee, which is identified in Note 2. Class R6 and class Y shares are not available to all investors. Effective February 1, 2016, the fund has terminated its class R5 shares.
In the normal course of business, the fund enters into contracts that may include agreements to indemnify another party under given circumstances. The fund’s maximum exposure under these arrangements is unknown as this would involve future claims that may be, but have not yet been, made against the fund. However, the fund’s management team expects the risk of material loss to be remote.
The fund has entered into contractual arrangements with an investment adviser, administrator, distributor, shareholder servicing agent and custodian, who each provide services to the fund. Unless expressly stated otherwise, shareholders are not parties to, or intended beneficiaries of these contractual arrangements, and these contractual arrangements are not intended to create any shareholder right to enforce them against the service providers or to seek any remedy under them against the service providers, either directly or on behalf of the fund.
Under the fund’s Declaration of Trust, any claims asserted against or on behalf of the Putnam Funds, including claims against Trustees and Officers, must be brought in state and federal courts located within the Commonwealth of Massachusetts.
Note 1: Significant accounting policies
The following is a summary of significant accounting policies consistently followed by the fund in the preparation of its financial statements. The preparation of financial statements is in conformity with accounting principles generally accepted in the United States of America and requires management to make estimates and assumptions that affect the reported amounts of assets and liabilities in the financial statements and the reported amounts of increases and decreases in net assets from operations. Actual results could differ from those estimates. Subsequent events after the Statement of assets and liabilities date through the date that the financial statements were issued have been evaluated in the preparation of the financial statements.
Investment income, realized and unrealized gains and losses and expenses of the fund are borne pro-rata based on the relative net assets of each class to the total net assets of the fund, except that each class bears expenses unique to that class (including the distribution fees applicable to such classes). Each class votes as a class only with respect to its own distribution plan or other matters on which a class vote is required by law or determined
|
| The Putnam Fund for Growth and Income 39 |
by the Trustees. If the fund were liquidated, shares of each class would receive their pro-rata share of the net assets of the fund. In addition, the Trustees declare separate dividends on each class of shares.
Security valuation Portfolio securities and other investments are valued using policies and procedures adopted by the Board of Trustees. The Trustees have formed a Pricing Committee to oversee the implementation of these procedures and have delegated responsibility for valuing the fund’s assets in accordance with these procedures to Putnam Management. Putnam Management has established an internal Valuation Committee that is responsible for making fair value determinations, evaluating the effectiveness of the pricing policies of the fund and reporting to the Pricing Committee.
Investments for which market quotations are readily available are valued at the last reported sales price on their principal exchange, or official closing price for certain markets, and are classified as Level 1 securities under Accounting Standards Codification 820 Fair Value Measurements and Disclosures (ASC 820). If no sales are reported, as in the case of some securities that are traded OTC, a security is valued at its last reported bid price and is generally categorized as a Level 2 security.
Investments in open-end investment companies (excluding exchange-traded funds), if any, which can be classified as Level 1 or Level 2 securities, are valued based on their net asset value. The net asset value of such investment companies equals the total value of their assets less their liabilities and divided by the number of their outstanding shares.
Market quotations are not considered to be readily available for certain debt obligations (including short-term investments with remaining maturities of 60 days or less) and other investments; such investments are valued on the basis of valuations furnished by an independent pricing service approved by the Trustees or dealers selected by Putnam Management. Such services or dealers determine valuations for normal institutional-size trading units of such securities using methods based on market transactions for comparable securities and various relationships, generally recognized by institutional traders, between securities (which consider such factors as security prices, yields, maturities and ratings). These securities will generally be categorized as Level 2.
Many securities markets and exchanges outside the U.S. close prior to the scheduled close of the New York Stock Exchange and therefore the closing prices for securities in such markets or on such exchanges may not fully reflect events that occur after such close but before the scheduled close of the New York Stock Exchange. Accordingly, on certain days, the fund will fair value certain foreign equity securities taking into account multiple factors including movements in the U.S. securities markets, currency valuations and comparisons to the valuation of American Depository Receipts, exchange-traded funds and futures contracts. The foreign equity securities, which would generally be classified as Level 1 securities, will be transferred to Level 2 of the fair value hierarchy when they are valued at fair value. The number of days on which fair value prices will be used will depend on market activity and it is possible that fair value prices will be used by the fund to a significant extent. At the close of the reporting period, fair value pricing was used for certain foreign securities in the portfolio. Securities quoted in foreign currencies, if any, are translated into U.S. dollars at the current exchange rate.
To the extent a pricing service or dealer is unable to value a security or provides a valuation that Putnam Management does not believe accurately reflects the security’s fair value, the security will be valued at fair value by Putnam Management in accordance with policies and procedures approved by the Trustees. Certain investments, including certain restricted and illiquid securities and derivatives, are also valued at fair value following procedures approved by the Trustees. These valuations consider such factors as significant market or specific security events such as interest rate or credit quality changes, various relationships with other securities, discount rates, U.S. Treasury, U.S. swap and credit yields, index levels, convexity exposures, recovery rates, sales and other multiples and resale restrictions. These securities are classified as Level 2 or as Level 3 depending on the priority of the significant inputs.
To assess the continuing appropriateness of fair valuations, the Valuation Committee reviews and affirms the reasonableness of such valuations on a regular basis after considering all relevant information that is reasonably available. Such valuations and procedures are reviewed periodically by the Trustees. The fair value of securities is generally determined as the amount that the fund could reasonably expect to realize from an orderly disposition of such securities over a reasonable period of time. By its nature, a fair value price is a good faith estimate of the value of a security in a current sale and does not reflect an actual market price, which may be different by a material amount.
Security transactions and related investment income Security transactions are recorded on the trade date (the date the order to buy or sell is executed). Gains or losses on securities sold are determined on the identified cost basis.
|
| 40 The Putnam Fund for Growth and Income |
Interest income, net of any applicable withholding taxes, is recorded on the accrual basis. Dividend income, net of any applicable withholding taxes, is recognized on the ex-dividend date except that certain dividends from foreign securities, if any, are recognized as soon as the fund is informed of the ex-dividend date. Non-cash dividends, if any, are recorded at the fair value of the securities received. Dividends representing a return of capital or capital gains, if any, are reflected as a reduction of cost and/or as a realized gain. All premiums/discounts are amortized/accreted on a yield-to-maturity basis.
Foreign currency translation The accounting records of the fund are maintained in U.S. dollars. The fair value of foreign securities, currency holdings, and other assets and liabilities is recorded in the books and records of the fund after translation to U.S. dollars based on the exchange rates on that day. The cost of each security is determined using historical exchange rates. Income and withholding taxes are translated at prevailing exchange rates when earned or incurred. The fund does not isolate that portion of realized or unrealized gains or losses resulting from changes in the foreign exchange rate on investments from fluctuations arising from changes in the market prices of the securities. Such gains and losses are included with the net realized and unrealized gain or loss on investments. Net realized gains and losses on foreign currency transactions represent net realized exchange gains or losses on closed forward currency contracts, disposition of foreign currencies, currency gains and losses realized between the trade and settlement dates on securities transactions and the difference between the amount of investment income and foreign withholding taxes recorded on the fund’s books and the U.S. dollar equivalent amounts actually received or paid. Net unrealized appreciation and depreciation of assets and liabilities in foreign currencies arise from changes in the value of open forward currency contracts and assets and liabilities other than investments at the period end, resulting from changes in the exchange rate.
Forward currency contracts The fund buys and sells forward currency contracts, which are agreements between two parties to buy and sell currencies at a set price on a future date. These contracts are used to hedge foreign exchange risk.
The U.S. dollar value of forward currency contracts is determined using current forward currency exchange rates supplied by a quotation service. The fair value of the contract will fluctuate with changes in currency exchange rates. The contract is marked to market daily and the change in fair value is recorded as an unrealized gain or loss. The fund records a realized gain or loss equal to the difference between the value of the contract at the time it was opened and the value at the time it was closed when the contract matures or by delivery of the currency. The fund could be exposed to risk if the value of the currency changes unfavorably, if the counterparties to the contracts are unable to meet the terms of their contracts or if the fund is unable to enter into a closing position. Risks may exceed amounts recognized on the Statement of assets and liabilities.
Forward currency contracts outstanding at period end, if any, are listed after the fund’s portfolio.
Master agreements The fund is a party to ISDA (International Swaps and Derivatives Association, Inc.) Master Agreements (Master Agreements) with certain counterparties that govern OTC derivative and foreign exchange contracts entered into from time to time. The Master Agreements may contain provisions regarding, among other things, the parties’ general obligations, representations, agreements, collateral requirements, events of default and early termination. With respect to certain counterparties, in accordance with the terms of the Master Agreements, collateral posted to the fund is held in a segregated account by the fund’s custodian and, with respect to those amounts which can be sold or repledged, is presented in the fund’s portfolio.
Collateral pledged by the fund is segregated by the fund’s custodian and identified in the fund’s portfolio. Collateral can be in the form of cash or debt securities issued by the U.S. Government or related agencies or other securities as agreed to by the fund and the applicable counterparty. Collateral requirements are determined based on the fund’s net position with each counterparty.
Termination events applicable to the fund may occur upon a decline in the fund’s net assets below a specified threshold over a certain period of time. Termination events applicable to counterparties may occur upon a decline in the counterparty’s long-term and short-term credit ratings below a specified level. In each case, upon occurrence, the other party may elect to terminate early and cause settlement of all derivative and foreign exchange contracts outstanding, including the payment of any losses and costs resulting from such early termination, as reasonably determined by the terminating party. Any decision by one or more of the fund’s counterparties to elect early termination could impact the fund’s future derivative activity.
At the close of the reporting period, the fund did not have a net liability position on open derivative contracts subject to the Master Agreements.
Securities lending The fund may lend securities, through its agent, to qualified borrowers in order to earn additional income. The loans are collateralized by cash in an amount at least equal to the fair value of the
|
| The Putnam Fund for Growth and Income 41 |
securities loaned. The fair value of securities loaned is determined daily and any additional required collateral is allocated to the fund on the next business day. The remaining maturities of the securities lending transactions are considered overnight and continuous. The risk of borrower default will be borne by the fund’s agent; the fund will bear the risk of loss with respect to the investment of the cash collateral. Income from securities lending, net of expenses, is included in investment income on the Statement of operations. Cash collateral is invested in Putnam Cash Collateral Pool, LLC, a limited liability company managed by an affiliate of Putnam Management. Investments in Putnam Cash Collateral Pool, LLC are valued at its closing net asset value each business day. There are no management fees charged to Putnam Cash Collateral Pool, LLC. At the close of the reporting period, the fund received cash collateral of $172,943,150 and the value of securities loaned amounted to $168,745,721.
Interfund lending The fund, along with other Putnam funds, may participate in an interfund lending program pursuant to an exemptive order issued by the SEC. This program allows the fund to borrow from or lend to other Putnam funds that permit such transactions. Interfund lending transactions are subject to each fund’s investment policies and borrowing and lending limits. Interest earned or paid on the interfund lending transaction will be based on the average of certain current market rates. During the reporting period, the fund did not utilize the program.
Lines of credit The fund participates, along with other Putnam funds, in a $317.5 million unsecured committed line of credit and a $235.5 million unsecured uncommitted line of credit, both provided by State Street. Prior to September 22, 2016, the fund participated in a $392.5 million syndicated unsecured committed line of credit provided by State Street ($292.5 million) and Northern Trust Company ($100 million) and the same unsecured uncommitted line of credit. Borrowings may be made for temporary or emergency purposes, including the funding of shareholder redemption requests and trade settlements. Interest is charged to the fund based on the fund’s borrowing at a rate equal to the higher of (1) the Federal Funds rate and (2) the overnight LIBOR plus 1.25% for the committed line of credit and the Federal Funds rate plus 1.30% for the uncommitted line of credit. A closing fee equal to 0.04% of the committed line of credit plus a $25,000 flat fee (0.04% prior to September 22, 2016) and 0.04% of the uncommitted line of credit has been paid by the participating funds. In addition, a commitment fee of 0.21% (0.16% prior to September 22, 2016) per annum on any unutilized portion of the committed line of credit is allocated to the participating funds based on their relative net assets and paid quarterly. During the reporting period, the fund had no borrowings against these arrangements.
Federal taxes It is the policy of the fund to distribute all of its taxable income within the prescribed time period and otherwise comply with the provisions of the Internal Revenue Code of 1986, as amended (the Code), applicable to regulated investment companies. It is also the intention of the fund to distribute an amount sufficient to avoid imposition of any excise tax under Section 4982 of the Code.
The fund is subject to the provisions of Accounting Standards Codification 740 Income Taxes (ASC 740). ASC 740 sets forth a minimum threshold for financial statement recognition of the benefit of a tax position taken or expected to be taken in a tax return. The fund did not have a liability to record for any unrecognized tax benefits in the accompanying financial statements. No provision has been made for federal taxes on income, capital gains or unrealized appreciation on securities held nor for excise tax on income and capital gains. Each of the fund’s federal tax returns for the prior three fiscal years remains subject to examination by the Internal Revenue Service.
The fund may also be subject to taxes imposed by governments of countries in which it invests. Such taxes are generally based on either income or gains earned or repatriated. The fund accrues and applies such taxes to net investment income, net realized gains and net unrealized gains as income and/or capital gains are earned. In some cases, the fund may be entitled to reclaim all or a portion of such taxes, and such reclaim amounts, if any, are reflected as an asset on the fund’s books. In many cases, however, the fund may not receive such amounts for an extended period of time, depending on the country of investment.
At October 31, 2016, the fund had a capital loss carryover of $130,619,620 available to the extent allowed by the Code to offset future net capital gain, if any. For any carryover, the amount of the carryover and that carryover’s expiration date is:
| | | |
| | Loss carryover | |
|
| Short-term | Long-term | Total | Expiration |
|
| $130,619,620 | N/A | $130,619,620 | October 31, 2017 |
|
Under the Regulated Investment Company Modernization Act of 2010, the fund will be permitted to carry forward capital losses incurred in taxable years beginning after December 22, 2010 for an unlimited period. However, any
|
| 42 The Putnam Fund for Growth and Income |
losses incurred will be required to be utilized prior to the losses incurred in pre-enactment tax years. As a result of this ordering rule, pre-enactment capital loss carryforwards may be more likely to expire unused. Additionally, post-enactment capital losses that are carried forward will retain their character as either short-term or long-term capital losses rather than being considered all short-term as under previous law.
Distributions to shareholders Distributions to shareholders from net investment income are recorded by the fund on the ex-dividend date. Distributions from capital gains, if any, are recorded on the ex-dividend date and paid at least annually. The amount and character of income and gains to be distributed are determined in accordance with income tax regulations, which may differ from generally accepted accounting principles. These differences include temporary and/or permanent differences from losses on wash sale transactions, from foreign currency gains and losses, from partnership income and from corporate action adjustment to basis and income. Reclassifications are made to the fund’s capital accounts to reflect income and gains available for distribution (or available capital loss carryovers) under income tax regulations. At the close of the reporting period, the fund reclassified $12,357,913 to increase undistributed net investment income, $47,239 to increase paid-in capital and $12,405,152 to increase accumulated net realized loss.
The tax basis components of distributable earnings and the federal tax cost as of the close of the reporting period were as follows:
| |
| Unrealized appreciation | $628,808,366 |
|
| Unrealized depreciation | (285,722,394) |
|
| Net unrealized appreciation | 343,085,972 |
|
| Undistributed ordinary income | 26,081,410 |
|
| Capital loss carryforward | (130,619,620) |
|
| Cost for federal tax income tax purposes | $4,509,192,757 |
Note 2: Management fee, administrative services and other transactions
The fund pays Putnam Management a management fee (based on the fund’s average net assets and computed and paid monthly) at annual rates that may vary based on the average of the aggregate net assets of all open-end mutual funds sponsored by Putnam Management (excluding net assets of funds that are invested in, or that are invested in by, other Putnam funds to the extent necessary to avoid “double counting” of those assets). Such annual rates may vary as follows:
| | | | |
| 0.630% | of the first $5 billion, | | 0.430% | of the next $50 billion, |
| |
|
| 0.580% | of the next $5 billion, | | 0.410% | of the next $50 billion, |
| |
|
| 0.530% | of the next $10 billion, | | 0.400% | of the next $100 billion and |
| |
|
| 0.480% | of the next $10 billion, | | 0.395% | of any excess thereafter. |
| |
|
For the reporting period, the management fee represented an effective rate (excluding the impact from any expense waivers in effect) of 0.475% of the fund’s average net assets.
Putnam Management has contractually agreed, through February 28, 2018, to waive fees or reimburse the fund’s expenses to the extent necessary to limit the cumulative expenses of the fund, exclusive of brokerage, interest, taxes, investment-related expenses, extraordinary expenses, acquired fund fees and expenses and payments under the fund’s investor servicing contract, investment management contract and distribution plans, on a fiscal year-to-date basis to an annual rate of 0.20% of the fund’s average net assets over such fiscal year-to-date period. During the reporting period, the fund’s expenses were not reduced as a result of this limit.
Putnam Management may from time to time voluntarily undertake to waive fees and/or reimburse certain fund expenses. Any such waiver or reimbursement would be voluntary and may be modified or discontinued by Putnam Management at any time without notice. For the reporting period, Putnam Management voluntarily waived $64,975.
Putnam Investments Limited (PIL), an affiliate of Putnam Management, is authorized by the Trustees to manage a separate portion of the assets of the fund as determined by Putnam Management from time to time. PIL did not manage any portion of the assets of the fund during the reporting period. If Putnam Management were to engage the services of PIL, Putnam Management would pay a quarterly sub-management fee to PIL for its services at an annual rate of 0.35% of the average net assets of the portion of the fund managed by PIL.
|
| The Putnam Fund for Growth and Income 43 |
The fund reimburses Putnam Management an allocated amount for the compensation and related expenses of certain officers of the fund and their staff who provide administrative services to the fund. The aggregate amount of all such reimbursements is determined annually by the Trustees.
Custodial functions for the fund’s assets are provided by State Street. Custody fees are based on the fund’s asset level, the number of its security holdings and transaction volumes.
Putnam Investor Services, Inc., an affiliate of Putnam Management, provides investor servicing agent functions to the fund. Putnam Investor Services, Inc. received fees for investor servicing for class A, class B, class C, class M, class R, and class Y shares that included (1) a per account fee for each direct and underlying non-defined contribution account (“retail account”) of the fund; (2) a specified rate of the fund’s assets attributable to defined contribution plan accounts; and (3) a specified rate based on the average net assets in retail accounts. Putnam Investor Services has agreed that the aggregate investor servicing fees for each fund’s retail and defined contribution accounts for these share classes will not exceed an annual rate of 0.25% of the fund’s average assets attributable to such accounts.
Prior to September 1, 2016, Putnam Investor Services, Inc. received fees for investor servicing for class A, class B, class C, class M, class R, and class Y shares that included (1) a per account fee for each retail account of the fund and each of the other funds in its specified category, which was totaled and then allocated to each fund in the category based on its average daily net assets; (2) a specified rate of the fund’s assets attributable to defined contribution plan accounts; and (3) a specified rate based on the average net assets in retail accounts. Prior to September 1, 2016, Putnam Investor Services had agreed that the aggregate investor servicing fees for each fund’s retail and defined contribution accounts for these share classes would not exceed an annual rate of 0.320% of the fund’s average assets attributable to such accounts.
Class R5 shares paid a monthly fee based on the average net assets of class R5 shares at an annual rate of 0.15%. Effective February 1, 2016, the fund has terminated its class R5 shares.
Class R6 shares paid a monthly fee based on the average net assets of class R6 shares at an annual rate of 0.05%.
During the reporting period, the expenses for each class of shares related to investor servicing fees were as follows:
| | | | |
| Class A | $8,745,953 | | Class R5 | 6 |
| |
|
| Class B | 127,052 | | Class R6 | 10,066 |
| |
|
| Class C | 105,201 | | Class Y | 127,658 |
| |
|
| Class M | 57,076 | | Total | $9,175,277 |
| | |
| Class R | 2,265 | | | |
The fund has entered into expense offset arrangements with Putnam Investor Services, Inc. and State Street whereby Putnam Investor Services, Inc.’s and State Street’s fees are reduced by credits allowed on cash balances. The fund also reduced expenses through brokerage/service arrangements. For the reporting period, the fund’s expenses were reduced by $7,648 under the expense offset arrangements and by $316,297 under the brokerage/ service arrangements.
Each Independent Trustee of the fund receives an annual Trustee fee, of which $3,658, as a quarterly retainer, has been allocated to the fund, and an additional fee for each Trustees meeting attended. Trustees also are reimbursed for expenses they incur relating to their services as Trustees.
The fund has adopted a Trustee Fee Deferral Plan (the Deferral Plan) which allows the Trustees to defer the receipt of all or a portion of Trustees fees payable on or after July 1, 1995. The deferred fees remain invested in certain Putnam funds until distribution in accordance with the Deferral Plan.
The fund has adopted an unfunded noncontributory defined benefit pension plan (the Pension Plan) covering all Trustees of the fund who have served as a Trustee for at least five years and were first elected prior to 2004. Benefits under the Pension Plan are equal to 50% of the Trustee’s average annual attendance and retainer fees for the three years ended December 31, 2005. The retirement benefit is payable during a Trustee’s lifetime, beginning the year following retirement, for the number of years of service through December 31, 2006. Pension expense for the fund is included in Trustee compensation and expenses in the Statement of operations. Accrued pension liability is included in Payable for Trustee compensation and expenses in the Statement of assets and liabilities. The Trustees have terminated the Pension Plan with respect to any Trustee first elected after 2003.
|
| 44 The Putnam Fund for Growth and Income |
The fund has adopted distribution plans (the Plans) with respect to its class A, class B, class C, class M and class R shares pursuant to Rule 12b–1 under the Investment Company Act of 1940. The purpose of the Plans is to compensate Putnam Retail Management Limited Partnership, an indirect wholly-owned subsidiary of Putnam Investments, LLC, for services provided and expenses incurred in distributing shares of the fund. The Plans provide for payments by the fund to Putnam Retail Management Limited Partnership at an annual rate of up to 0.35%, 1.00%, 1.00%, 1.00% and 1.00% of the average net assets attributable to class A, class B, class C, class M and class R shares, respectively. The Trustees have approved payment by the fund at an annual rate of 0.25%, 1.00%, 1.00%, 0.75% and 0.50% of the average net assets attributable to class A, class B, class C, class M and class R shares, respectively. During the reporting period, the class specific expenses related to distribution fees were as follows:
| | | | |
| Class A | $11,155,637 | | Class M | 217,843 |
| |
|
| Class B | 646,855 | | Class R | 5,766 |
| |
|
| Class C | 536,271 | | Total | $12,562,372 |
| | |
For the reporting period, Putnam Retail Management Limited Partnership, acting as underwriter, received net commissions of $170,705 and $1,340 from the sale of class A and class M shares, respectively, and received $37,276 and $335 in contingent deferred sales charges from redemptions of class B and class C shares, respectively.
A deferred sales charge of up to 1.00% is assessed on certain redemptions of class A shares. For the reporting period, Putnam Retail Management Limited Partnership, acting as underwriter, received $140 on class A redemptions.
Note 3: Purchases and sales of securities
During the reporting period, the cost of purchases and the proceeds from sales, excluding short-term investments, were as follows:
| | |
| | Cost of purchases | Proceeds from sales |
|
| Investments in securities (Long-term) | $1,909,679,595 | $2,188,680,551 |
|
| U.S. government securities (Long-term) | — | — |
|
| Total | $1,909,679,595 | $2,188,680,551 |
|
The fund may purchase or sell investments from or to other Putnam funds in the ordinary course of business, which can reduce the fund’s transaction costs, at prices determined in accordance with SEC requirements and policies approved by the Trustees. During the reporting period, purchases or sales of long-term securities from or to other Putnam funds, if any, did not represent more than 5% of the fund’s total cost of purchases and/or total proceeds from sales.
Note 4: Capital shares
At the close of the reporting period, there were an unlimited number of shares of beneficial interest authorized. Transactions in capital shares were as follows:
| | | | |
| | YEAR ENDED 10/31/16 | YEAR ENDED 10/31/15 |
|
| Class A | Shares | Amount | Shares | Amount |
|
| Shares sold | 3,098,451 | $61,055,604 | 3,836,200 | $81,725,883 |
|
| Shares issued in connection with | | | | |
| reinvestment of distributions | 3,217,968 | 63,281,459 | 3,290,492 | 69,795,468 |
|
| | 6,316,419 | 124,337,063 | 7,126,692 | 151,521,351 |
|
| Shares repurchased | (23,853,619) | (474,406,197) | (22,791,328) | (486,281,004) |
|
| Net decrease | (17,537,200) | $(350,069,134) | (15,664,636) | $(334,759,653) |
|
| The Putnam Fund for Growth and Income 45 |
| | | | |
| | YEAR ENDED 10/31/16 | YEAR ENDED 10/31/15 |
| Class B | Shares | Amount | Shares | Amount |
|
| Shares sold | 251,748 | $4,880,549 | 383,358 | $8,045,239 |
|
| Shares issued in connection with | | | | |
| reinvestment of distributions | 27,126 | 520,696 | 29,106 | 608,181 |
|
| | 278,874 | 5,401,245 | 412,464 | 8,653,420 |
|
| Shares repurchased | (993,277) | (19,234,759) | (1,034,990) | (21,763,842) |
|
| Net decrease | (714,403) | $(13,833,514) | (622,526) | $(13,110,422) |
| | | |
| |
| | YEAR ENDED 10/31/16 | YEAR ENDED 10/31/15 |
| Class C | Shares | Amount | Shares | Amount |
|
| Shares sold | 343,485 | $6,735,765 | 418,348 | $8,952,333 |
|
| Shares issued in connection with | | | | |
| reinvestment of distributions | 20,517 | 399,522 | 19,422 | 411,386 |
|
| | 364,002 | 7,135,287 | 437,770 | 9,363,719 |
|
| Shares repurchased | (632,634) | (12,508,167) | (351,091) | (7,426,848) |
|
| Net increase (decrease) | (268,632) | $(5,372,880) | 86,679 | $1,936,871 |
| | | |
| |
| | YEAR ENDED 10/31/16 | YEAR ENDED 10/31/15 |
| Class M | Shares | Amount | Shares | Amount |
|
| Shares sold | 34,833 | $666,771 | 39,501 | $836,983 |
|
| Shares issued in connection with | | | | |
| reinvestment of distributions | 15,627 | 303,525 | 16,469 | 347,036 |
|
| | 50,460 | 970,296 | 55,970 | 1,184,019 |
|
| Shares repurchased | (346,006) | (6,794,170) | (208,572) | (4,418,899) |
|
| Net decrease | (295,546) | $(5,823,874) | (152,602) | $(3,234,880) |
| | | |
| |
| | YEAR ENDED 10/31/16 | YEAR ENDED 10/31/15 |
| Class R | Shares | Amount | Shares | Amount |
|
| Shares sold | 7,318 | $144,935 | 21,928 | $463,854 |
|
| Shares issued in connection with | | | | |
| reinvestment of distributions | 749 | 14,620 | 1,687 | 35,816 |
|
| | 8,067 | 159,555 | 23,615 | 499,670 |
|
| Shares repurchased | (14,245) | (287,965) | (144,973) | (2,985,337) |
|
| Net decrease | (6,178) | $(128,410) | (121,358) | $(2,485,667) |
| | | |
| |
| | PERIOD ENDED 10/31/16* | YEAR ENDED 10/31/15 |
| Class R5 | Shares | Amount | Shares | Amount |
|
| Shares sold | — | $— | — | $— |
|
| Shares issued in connection with | | | | |
| reinvestment of distributions | 6 | 120 | 13 | 288 |
|
| | 6 | 120 | 13 | 288 |
|
| Shares repurchased | (779) | (14,393) | — | — |
|
| Net increase (decrease) | (773) | $(14,273) | 13 | $288 |
|
| 46 The Putnam Fund for Growth and Income |
| | | | |
| | YEAR ENDED 10/31/16 | YEAR ENDED 10/31/15 |
| Class R6 | Shares | Amount | Shares | Amount |
|
| Shares sold | 49,575 | $964,470 | 208,341 | $4,441,200 |
|
| Shares issued in connection with | | | | |
| reinvestment of distributions | 19,748 | 389,707 | 17,827 | 378,425 |
|
| | 69,323 | 1,354,177 | 226,168 | 4,819,625 |
|
| Shares repurchased | (142,300) | (2,850,765) | (105,472) | (2,258,136) |
|
| Net increase (decrease) | (72,977) | $(1,496,588) | 120,696 | $2,561,489 |
| | | |
| |
| | YEAR ENDED 10/31/16 | YEAR ENDED 10/31/15 |
| Class Y | Shares | Amount | Shares | Amount |
|
| Shares sold | 1,127,545 | $22,593,913 | 848,049 | $18,130,692 |
|
| Shares issued in connection with | | | | |
| reinvestment of distributions | 52,365 | 1,033,423 | 47,045 | 998,760 |
|
| | 1,179,910 | 23,627,336 | 895,094 | 19,129,452 |
|
| Shares repurchased | (907,538) | (18,106,444) | (583,437) | (12,440,401) |
|
| Net increase | 272,372 | $5,520,892 | 311,657 | $6,689,051 |
* Effective February 1, 2016, the fund has terminated its class R5 shares.
At the close of the reporting period, Putnam Investments, LLC owned the following shares of the fund:
| | | |
| | Shares Owned | Percentage of ownership | Value |
|
| Class R6 | 792 | 0.1% | $16,402 |
Note 5: Affiliated transactions
Transactions during the reporting period with any company which is under common ownership or control were as follows:
| | | | | |
| | Fair value at the | | | | Fair value at |
| | beginning of the | | | Investment | the end of the |
| Name of affiliate | reporting period | Purchase cost | Sale proceeds | income | reporting period |
|
| Putnam Cash Collateral | | | | | |
| Pool, LLC* | $149,487,907 | $1,471,399,650 | $1,447,944,407 | $742,362 | $172,943,150 |
|
| Putnam Short Term | | | | | |
| Investment Fund** | 217,802,220 | 745,193,604 | 795,861,340 | 598,147 | 167,134,484 |
|
| Totals | $367,290,127 | $2,216,593,254 | $2,243,805,747 | $1,340,509 | $340,077,634 |
* No management fees are charged to Putnam Cash Collateral Pool, LLC (See Note 1).
** Management fees charged to Putnam Short Term Investment Fund have been waived by Putnam Management.
Note 6: Market, credit and other risks
In the normal course of business, the fund trades financial instruments and enters into financial transactions where risk of potential loss exists due to changes in the market (market risk) or failure of the contracting party to the transaction to perform (credit risk). The fund may be exposed to additional credit risk that an institution or other entity with which the fund has unsettled or open transactions will default. Investments in foreign securities involve certain risks, including those related to economic instability, unfavorable political developments, and currency fluctuations.
Note 7: Summary of derivative activity
The volume of activity for the reporting period for any derivative type that was held during the period is listed below and was based on an average of the holdings at the end of each fiscal quarter:
| |
| Forward currency contracts (contract amount) | $161,900,000 |
|
|
| The Putnam Fund for Growth and Income 47 |
The following is a summary of the fair value of derivative instruments as of the close of the reporting period:
| | | | |
| Fair value of derivative instruments as of the close of the reporting period | |
|
| | ASSET DERIVATIVES | LIABILITY DERIVATIVES |
|
| Derivatives not | | | | |
| accounted for as | Statement of | | Statement of | |
| hedging instruments | assets and | | assets and | |
| under ASC 815 | liabilities location | Fair value | liabilities location | Fair value |
|
| Foreign exchange | | | | |
| contracts | Receivables | $8,733,774 | Payables | $— |
|
| Total | | $8,733,774 | | $— |
The following is a summary of realized and change in unrealized gains or losses of derivative instruments in the Statement of operations for the reporting period (see Note 1):
| | |
| Amount of realized gain or (loss) on derivatives recognized in net gain or (loss) on investments |
|
| Derivatives not accounted for as hedging | Forward currency | |
| instruments under ASC 815 | contracts | Total |
|
| Foreign exchange contracts | $15,187,326 | $15,187,326 |
|
| Total | $15,187,326 | $15,187,326 |
| | |
| Change in unrealized appreciation or (depreciation) on derivatives recognized in net gain or (loss) |
| on investments | | |
|
| Derivatives not accounted for as hedging | Forward currency | |
| instruments under ASC 815 | contracts | Total |
|
| Foreign exchange contracts | $7,730,075 | $7,730,075 |
|
| Total | $7,730,075 | $7,730,075 |
Note 8: Offsetting of financial and derivative assets and liabilities
The following table summarizes any derivatives, repurchase agreements and reverse repurchase agreements, at the end of the reporting period, that are subject to an enforceable master netting agreement or similar agreement. For securities lending transactions or borrowing transactions associated with securities sold short, if any, see Note 1. For financial reporting purposes, the fund does not offset financial assets and financial liabilities that are subject to the master netting agreements in the Statement of assets and liabilities.
| | | | | | | |
| | ASSETS | LIABILITIES | | | |
|
| | | | | | Total | | |
| | | | | | Financial | Total | |
| | Forward | | Forward | | and | collateral | |
| | currency | Total | currency | Total | Derivative | received | Net |
| | contracts# | Assets | contracts# | Liabilities | Net Assets | (pledged)†## | amount |
|
| Credit Suisse International | $8,193,821 | $8,193,821 | $— | $— | $8,193,821 | $8,193,821 | $— |
|
| |
| JPMorgan Chase Bank N.A. | 539,953 | $539,953 | $— | $— | $539,953 | $539,953 | $— |
|
| Total | $8,733,774 | $8,733,774 | $— | $— | $8,733,774 | | |
† Additional collateral may be required from certain brokers based on individual agreements.
# Covered by master netting agreement (Note 1).
## Any over-collateralization of total financial and derivative net assets is not shown. Collateral may include amounts related to unsettled agreements.
|
| 48 The Putnam Fund for Growth and Income |
Note 9: New pronouncements
In October 2016, the SEC adopted amendments to rules under the Investment Company Act of 1940 (“final rules”) intended to modernize the reporting and disclosure of information by registered investment companies. The final rules amend Regulation S-X and require funds to provide standardized, enhanced derivative disclosure in fund financial statements in a format designed for individual investors. The amendments to Regulation S-X also update the disclosures for other investments and investments in, and advances to affiliates and amend the rules regarding the general form and content of fund financial statements. The compliance date for the amendments to Regulation S-X is August 1, 2017. Putnam Management is currently evaluating the amendments and their impact, if any, on the fund’s financial statements.
Federal tax information (Unaudited)
The fund designated 90.84% of ordinary income distributions as qualifying for the dividends received deduction for corporations.
For the reporting period, the fund hereby designates 100.00%, or the maximum amount allowable, of its taxable ordinary income distributions as qualified dividends taxed at the individual net capital gain rates.
For the reporting period, pursuant to §871(k) of the Internal Revenue Code, the fund hereby designates $332,746 of distributions paid as qualifying to be taxed as interest-related dividends, and no monies to be taxed as short-term capital gain dividends for nonresident alien shareholders.
The Form 1099 that will be mailed to you in January 2017 will show the tax status of all distributions paid to your account in calendar 2016.
|
| The Putnam Fund for Growth and Income 49 |

| |
| | 50 The Putnam Fund for Growth and Income |

* Mr. Reynolds is an “interested person” (as defined in the Investment Company Act of 1940) of the fund and Putnam Investments. He is President and Chief Executive Officer of Putnam Investments, as well as the President of your fund and each of the other Putnam funds.
The address of each Trustee is One Post Office Square, Boston, MA 02109.
As of October 31, 2016, there were 115 Putnam funds. All Trustees serve as Trustees of all Putnam funds.
Each Trustee serves for an indefinite term, until his or her resignation, retirement at age 75, removal, or death.
|
| The Putnam Fund for Growth and Income 51 |
Officers
In addition to Robert L. Reynolds, the other officers of the fund are shown below:
| |
| Jonathan S. Horwitz (Born 1955) | Janet C. Smith (Born 1965) |
| Executive Vice President, Principal Executive Officer, | Vice President, Principal Financial Officer, Principal |
| and Compliance Liaison | Accounting Officer, and Assistant Treasurer |
| Since 2004 | Since 2007 |
| | Director of Fund Administration Services, |
| Robert T. Burns (Born 1961) | Putnam Investments and Putnam Management |
| Vice President and Chief Legal Officer | |
| Since 2011 | Susan G. Malloy (Born 1957) |
| General Counsel, Putnam Investments, | Vice President and Assistant Treasurer |
| Putnam Management, and Putnam Retail Management | Since 2007 |
| | Director of Accounting & Control Services, |
| James F. Clark (Born 1974) | Putnam Investments and Putnam Management |
| Vice President and Chief Compliance Officer | |
| Since 2016 | Mark C. Trenchard (Born 1962) |
| Chief Compliance Officer, Putnam Investments | Vice President and BSA Compliance Officer |
| and Putnam Management | Since 2002 |
| | Director of Operational Compliance, Putnam |
| Michael J. Higgins (Born 1976) | Investments and Putnam Retail Management |
| Vice President, Treasurer, and Clerk | |
| Since 2010 | Nancy E. Florek (Born 1957) |
| | Vice President, Director of Proxy Voting and Corporate |
| | Governance, Assistant Clerk, and Associate Treasurer |
| | Since 2000 |
The principal occupations of the officers for the past five years have been with the employers as shown above, although in some cases they have held different positions with such employers. The address of each officer is One Post Office Square, Boston, MA 02109.
|
| 52 The Putnam Fund for Growth and Income |
Fund information
Founded over 75 years ago, Putnam Investments was built around the concept that a balance between risk and reward is the hallmark of a well-rounded financial program. We manage over 100 funds across income, value, blend, growth, asset allocation, absolute return, and global sector categories.
| | |
| Investment Manager | Trustees | James F. Clark |
| Putnam Investment | Jameson A. Baxter, Chair | Vice President and |
| Management, LLC | Kenneth R. Leibler, Vice Chair | Chief Compliance Officer |
| One Post Office Square | Liaquat Ahamed | |
| Boston, MA 02109 | Ravi Akhoury | Michael J. Higgins |
| | Barbara M. Baumann | Vice President, Treasurer, |
| Investment Sub-Advisor | Robert J. Darretta | and Clerk |
| Putnam Investments Limited | Katinka Domotorffy | |
| 57–59 St James’s Street | John A. Hill | Janet C. Smith |
| London, England SW1A 1LD | Paul L. Joskow | Vice President, |
| | Robert E. Patterson | Principal Financial Officer, |
| Marketing Services | George Putnam, III | Principal Accounting Officer, |
| Putnam Retail Management | Robert L. Reynolds | and Assistant Treasurer |
| One Post Office Square | W. Thomas Stephens | |
| Boston, MA 02109 | | Susan G. Malloy |
| | Officers | Vice President and |
| Custodian | Robert L. Reynolds | Assistant Treasurer |
| State Street Bank | President | |
| and Trust Company | | Mark C. Trenchard |
| | Jonathan S. Horwitz | Vice President and |
| Legal Counsel | Principal Executive Officer, and | BSA Compliance Officer |
| Ropes & Gray LLP | Compliance Liaison | |
| | Nancy E. Florek |
| Independent Registered | Robert T. Burns | Vice President, Director of |
| Public Accounting Firm | Vice President and | Proxy Voting and Corporate |
| PricewaterhouseCoopers LLP | Chief Legal Officer | Governance, Assistant Clerk, |
| | | and Associate Treasurer |
| | | |
This report is for the information of shareholders of The Putnam Fund for Growth and Income. It may also be used as sales literature when preceded or accompanied by the current prospectus, the most recent copy of Putnam’s Quarterly Performance Summary, and Putnam’s Quarterly Ranking Summary. For more recent performance, please visit putnam.com. Investors should carefully consider the investment objectives, risks, charges, and expenses of a fund, which are described in its prospectus. For this and other information or to request a prospectus or summary prospectus, call 1-800-225-1581 toll free. Please read the prospectus carefully before investing. The fund’s Statement of Additional Information contains additional information about the fund’s Trustees and is available without charge upon request by calling 1-800-225-1581.

| |
| (a) The fund's principal executive, financial and accounting officers are employees of Putnam Investment Management, LLC, the Fund's investment manager. As such they are subject to a comprehensive Code of Ethics adopted and administered by Putnam Investments which is designed to protect the interests of the firm and its clients. The Fund has adopted a Code of Ethics which incorporates the Code of Ethics of Putnam Investments with respect to all of its officers and Trustees who are employees of Putnam Investment Management, LLC. For this reason, the Fund has not adopted a separate code of ethics governing its principal executive, financial and accounting officers. |
| |
| (c) In November 2015, the Code of Ethics of Putnam Investment Management, LLC was amended. The key changes to the Code of Ethics are as follows: (i) Non-Access Persons are no longer required to pre-clear their trades, (ii) a new provision governing conflicts of interest has been added, (iii) modifying certain provisions of the pre-clearance requirements, Contra-Trading Rule and 60-Day Short-Term Rule, (iv) modifying and adding language relating to reporting of unethical or illegal acts, including anti-retaliation provision, and (v) certain other changes. |
| |
| Item 3. Audit Committee Financial Expert: |
| |
| The Funds' Audit, Compliance and Distributions Committee is comprised solely of Trustees who are “independent” (as such term has been defined by the Securities and Exchange Commission (“SEC”) in regulations implementing Section 407 of the Sarbanes-Oxley Act (the “Regulations”)). The Trustees believe that each of the members of the Audit, Compliance and Distributions Committee also possess a combination of knowledge and experience with respect to financial accounting matters, as well as other attributes, that qualify them for service on the Committee. In addition, the Trustees have determined that each of Mr. Darretta, Mr. Patterson, Mr. Hill, and Ms. Baumann qualifies as an “audit committee financial expert” (as such term has been defined by the Regulations) based on their review of his or her pertinent experience and education. The SEC has stated, and the funds' amended and restated agreement and Declaration of Trust provides, that the designation or identification of a person as an audit committee financial expert pursuant to this Item 3 of Form N-CSR does not impose on such person any duties, obligations or liability that are greater than the duties, obligations and liability imposed on such person as a member of the Audit, Compliance and Distribution Committee and the Board of Trustees in the absence of such designation or identification. |
| |
| Item 4. Principal Accountant Fees and Services: |
| |
| The following table presents fees billed in each of the last two fiscal years for services rendered to the fund by the fund's independent auditor: |
| | | | | |
| Fiscal year ended | Audit Fees | Audit-Related Fees | Tax Fees | All Other Fees |
|
|
| | | | | |
| October 31, 2016 | $207,572 | $ — | $8,917 | $ — |
| October 31, 2015 | $200,776 | $ — | $8,657 | $ — |
| |
| For the fiscal years ended October 31, 2016 and October 31, 2015, the fund's independent auditor billed aggregate non-audit fees in the amounts of $568,670 and $869,644 respectively, to the fund, Putnam Management and any entity controlling, controlled by or under common control with Putnam Management that provides ongoing services to the fund. |
| |
| Audit Fees represent fees billed for the fund's last two fiscal years relating to the audit and review of the financial statements included in annual reports and registration statements, and other services that are normally provided in connection with statutory and regulatory filings or engagements. |
| |
| Audit-Related Fees represent fees billed in the fund's last two fiscal years for services traditionally performed by the fund's auditor, including accounting consultation for proposed transactions or concerning financial accounting and reporting standards and other audit or attest services not required by statute or regulation. |
| |
| Tax Fees represent fees billed in the fund's last two fiscal years for tax compliance, tax planning and tax advice services. Tax planning and tax advice services include assistance with tax audits, employee benefit plans and requests for rulings or technical advice from taxing authorities. |
| |
| Pre-Approval Policies of the Audit, Compliance and Distributions Committee. The Audit, Compliance and Distributions Committee of the Putnam funds has determined that, as a matter of policy, all work performed for the funds by the funds' independent auditors will be pre-approved by the Committee itself and thus will generally not be subject to pre-approval procedures. |
| |
| The Audit, Compliance and Distributions Committee also has adopted a policy to pre-approve the engagement by Putnam Management and certain of its affiliates of the funds' independent auditors, even in circumstances where pre-approval is not required by applicable law. Any such requests by Putnam Management or certain of its affiliates are typically submitted in writing to the Committee and explain, among other things, the nature of the proposed engagement, the estimated fees, and why this work should be performed by that particular audit firm as opposed to another one. In reviewing such requests, the Committee considers, among other things, whether the provision of such services by the audit firm are compatible with the independence of the audit firm. |
| |
| The following table presents fees billed by the fund's independent auditor for services required to be approved pursuant to paragraph (c)(7)(ii) of Rule 2-01 of Regulation S-X. |
| | | | | |
| Fiscal year ended | Audit-Related Fees | Tax Fees | All Other Fees | Total Non-Audit Fees |
|
|
| | | | | |
| October 31, 2016 | $ — | $559,753 | $ — | $ — |
| | | | | |
| October 31, 2015 | $ — | $860,987 | $ — | $ — |
| |
| Item 5. Audit Committee of Listed Registrants |
| |
| Item 6. Schedule of Investments: |
| |
| The registrant's schedule of investments in unaffiliated issuers is included in the report to shareholders in Item 1 above. |
| |
| Item 7. Disclosure of Proxy Voting Policies and Procedures For Closed-End Management Investment Companies: |
| |
| Item 8. Portfolio Managers of Closed-End Investment Companies |
| |
| Item 9. Purchases of Equity Securities by Closed-End Management Investment Companies and Affiliated Purchasers: |
| |
| Item 10. Submission of Matters to a Vote of Security Holders: |
| |
| Item 11. Controls and Procedures: |
| |
| (a) The registrant's principal executive officer and principal financial officer have concluded, based on their evaluation of the effectiveness of the design and operation of the registrant's disclosure controls and procedures as of a date within 90 days of the filing date of this report, that the design and operation of such procedures are generally effective to provide reasonable assurance that information required to be disclosed by the registrant in this report is recorded, processed, summarized and reported within the time periods specified in the Commission's rules and forms. |
| |
| (b) Changes in internal control over financial reporting: Not applicable |
| |
| (a)(1) The Code of Ethics of The Putnam Funds, which incorporates the Code of Ethics of Putnam Investments, is filed herewith. |
| |
| (a)(2) Separate certifications for the principal executive officer and principal financial officer of the registrant as required by Rule 30a-2(a) under the Investment Company Act of 1940, as amended, are filed herewith. |
| |
| (b) The certifications required by Rule 30a-2(b) under the Investment Company Act of 1940, as amended, are filed herewith. |
| |
| Pursuant to the requirements of the Securities Exchange Act of 1934 and the Investment Company Act of 1940, the registrant has duly caused this report to be signed on its behalf by the undersigned, thereunto duly authorized. |
| |
| The Putnam Fund for Growth and Income |
| |
| By (Signature and Title): |
| |
| /s/ Janet C. Smith
Janet C. Smith
Principal Accounting Officer
|
| |
| Pursuant to the requirements of the Securities Exchange Act of 1934 and the Investment Company Act of 1940, this report has been signed below by the following persons on behalf of the registrant and in the capacities and on the dates indicated. |
| |
| By (Signature and Title): |
| |
| /s/ Jonathan S. Horwitz
Jonathan S. Horwitz
Principal Executive Officer
|
| |
| By (Signature and Title): |
| |
| /s/ Janet C. Smith
Janet C. Smith
Principal Financial Officer
|