UNITED STATES SECURITIES AND EXCHANGE COMMISSION |
Washington, D.C. 20549 |
FORM N-CSR |
CERTIFIED SHAREHOLDER REPORT OF REGISTERED MANAGEMENT INVESTMENT COMPANIES |
Investment Company Act file number: | (811-00159) |
Exact name of registrant as specified in charter: | Putnam Investors Fund |
Address of principal executive offices: | One Post Office Square, Boston, Massachusetts 02109 |
Name and address of agent for service: | Robert T. Burns, Vice President One Post Office Square Boston, Massachusetts 02109 |
Copy to: | Bryan Chegwidden, Esq. Ropes & Gray LLP 1211 Avenue of the Americas New York, New York 10036 |
Registrant’s telephone number, including area code: | (617) 292-1000 |
Date of fiscal year end: | July 31, 2015 |
Date of reporting period: | August 1, 2014 – January 31, 2015 |
Item 1. Report to Stockholders: |
The following is a copy of the report transmitted to stockholders pursuant to Rule 30e-1 under the Investment Company Act of 1940: |
Putnam
Investors
Fund
Semiannual report
1 | 31 | 15
Message from the Trustees | 1 |
About the fund | 2 |
Performance snapshot | 4 |
Interview with your fund’s portfolio manager | 5 |
Your fund’s performance | 10 |
Your fund’s expenses | 12 |
Terms and definitions | 14 |
Other information for shareholders | 15 |
Financial statements | 16 |
Consider these risks before investing: Growth stocks may be more susceptible to earnings disappointments, and value stocks may fail to rebound. Stock prices may fall or fail to rise over time for several reasons, including general financial market conditions and factors related to a specific issuer or industry. You can lose money by investing in the fund.
Message from the Trustees
Dear Fellow Shareholder:
The U.S. economic recovery is gaining steam, with three consecutive quarters of positive GDP growth, accelerated hiring, and rising consumer confidence, which recently hit multi-year highs. U.S. markets, however, have experienced some turbulence since the start of the year.
Cheaper energy prices benefit consumers and many businesses, but the sharp decline in oil prices has also fostered uncertainty. A stronger U.S. dollar may hurt profits for many large multinational companies headquartered in the United States that rely on exports for growth. In addition, investors appear to be anticipating when the Federal Reserve will begin raising interest rates. Overseas growth, meanwhile, remains tepid at best.
In an economically uncertain environment, it can be worthwhile to consider a range of investment opportunities. Putnam invests across many asset classes and pursues flexible strategies that seek out opportunities for growth or income with careful awareness of risk. Our experienced equity and fixed-income teams employ new ways of thinking and integrate innovative investment ideas into time-tested, traditional strategies. In today’s environment, it is also important to rely on your financial advisor, who can ensure your portfolio matches your individual goals and tolerance for risk.
As always, thank you for investing with Putnam.
Respectfully yours,
Robert L. Reynolds
President and Chief Executive Officer
Putnam Investments
Jameson A. Baxter
Chair, Board of Trustees
March 10, 2015
Performance
snapshot
Annualized total return (%) comparison as of 1/31/15
Current performance may be lower or higher than the quoted past performance, which cannot guarantee future results. Share price, principal value, and return will fluctuate, and you may have a gain or a loss when you sell your shares. Performance of class A shares assumes reinvestment of distributions and does not account for taxes. Fund returns in the bar chart do not reflect a sales charge of 5.75%; had they, returns would have been lower. See pages 5 and 10–12 for additional performance information. For a portion of the periods, the fund had expense limitations, without which returns would have been lower. To obtain the most recent month-end performance, visit putnam.com.
*The fund’s benchmark and Lipper category, the S&P 500 Index and Lipper Large-Cap Core Funds category, were introduced on 3/4/57 and 12/31/59, respectively, which post-date the inception of the fund’s class A shares.
†Returns for the six-month period are not annualized, but cumulative.
4 Investors Fund
Interview with your fund’s portfolio manager
Gerard P. Sullivan |
Jerry, how would you describe conditions for stock market investors during the six-month reporting period ended January 31, 2015?
The period began favorably for the U.S. stock market, but overall, investors experienced a rather bumpy ride. After a tranquil start in August and gains through the end of the summer, stock market performance began to get choppy in the fall. In October, stocks declined nearly 10% in response to global geopolitical tensions, slowing growth in Europe and China, and falling oil prices.
Although it felt painful at the time, I believe that pullback was relatively mild, and the market’s subsequent snapback — its V-shaped rebound — from its mid-October lows was about as sharp as I have ever seen. Stocks recovered dramatically, dipped again in early December, then surged to new record highs as 2014 came to a close. With the exception of energy, stocks in most sectors made impressive rebounds. We saw some powerful gains, especially in health care and certain parts of retail and industrials. However, in January 2015, the final month of the reporting period, stocks struggled again as investors became worried about disappointing corporate earnings reports and the potential for weaker-than-expected economic growth in the United States. For the month of January, the S&P 500 Index, a broad measure of stock market performance and the fund’s benchmark, declined more than 3%.
Broad market index and fund performance
This comparison shows your fund’s performance in the context of broad market indexes for the six months ended 1/31/15. See pages 4 and 10–12 for additional fund performance information. Index descriptions can be found on page 14.
Investors Fund 5
How did the fund perform for the period?
The fund delivered a positive return, but underperformed its benchmark, the S&P 500 Index. However, the fund’s return for the period was better than the average return for funds in its Lipper peer group, Large-Cap Core Funds.
Within the fund’s portfolio, what were some stocks that had a negative effect on performance for the six-month period?
A major theme for the financial markets during this time was plunging energy prices. The price of oil dropped more than 50% from June to December, when it hit a five-year low. The decline was largely in response to greater oil supplies combined with reduced energy demand. Although lower oil prices put more money into U.S. consumers’ pockets, they had a negative effect on most stocks in the energy sector and were a primary cause of the market’s volatility. The surplus of oil and massive price weakness hurt the stocks of many energy companies, particularly those that specialize in exploration and production [E&P].
This trend is clearly reflected in the fund’s results for the six-month period. The top five detractors from performance versus the benchmark were stocks of businesses that are directly influenced by the price of oil. They included QEP Resources, an oil and gas E&P company; Nabors Industries, which services and contracts rigs for oil and gas drilling; FMSA Holdings, which provides sand-based solutions to enhance productivity of oil and gas wells; Continental Resources, an oil and gas E&P company; and Trinity Industries, which provides products and services to energy companies. At the close of the period, QEP Resources and Continental Resources were no longer in the portfolio.
Sector allocations
Allocations are shown as a percentage of the fund’s net assets as of 1/31/15. Cash and net other assets, if any, represent the market value weights of cash, derivatives, short-term securities, and other unclassified assets in the portfolio. Summary information may differ from the portfolio schedule included in the financial statements due to the inclusion of derivative securities, any interest accruals, the exclusion of as-of trades, if any, and the use of different classifications of securities for presentation purposes. Holdings and allocations may vary over time.
6 Investors Fund
“The period began favorably for
the U.S. stock market, but overall,
investors experienced a rather bumpy
ride.”
Jerry Sullivan
Could you discuss some holdings that helped fund performance for the period?
The top contributor to performance relative to the benchmark was the stock of Alibaba Group Holding, a China-based e-commerce company whose $25 billion initial public offering [IPO] was the largest in history. We had been researching and following Alibaba for a while, and our analysts’ extensive knowledge of the company in advance of the IPO proved beneficial.
Another highlight for the period was the stock of Southwest Airlines. Southwest’s share price advanced considerably as the company reported strong revenue and increased passenger traffic, both of which surpassed that of many competitors.
The stock of CVS Health, the second-largest drugstore chain in the United States, was the third-best-performing fund holding for the period. The company has benefited from growing prescription volume and increased revenue from its pharmacy benefits management business.
What are your thoughts on the energy sector as the fund enters the second half of its fiscal year?
In light of the steep declines, we are studying the balance sheets and cost structures of energy companies to determine which of them we believe can hold up through the downturn. In particular, we’re researching the drilling companies and the potential impact of plunging oil prices on their profitability. I think that current oil prices could remain with us for a while, and production is likely to slow. Some
Top 10 holdings
This table shows the fund’s top 10 holdings by percentage of the fund’s net assets as of 1/31/15. Short-term holdings and derivatives, if any, are excluded. Holdings may vary over time.
Investors Fund 7
of the more leveraged players, many of them private companies, may suffer, and the next big move in the energy sector could be due to consolidation. We may see more acquisitions, both on the E&P side and the services side.
Besides energy, what sectors of the market interest you today?
Certain pockets of the industrials sector remain interesting to me. Aerospace and defense stocks have done well and are mostly immune to the recent volatility in commodities. In addition, we believe many of these companies have solid capital allocation strategies and healthy balance sheets, which can lead to strong earnings growth potential. Also in industrials, many airline stocks have performed well as a result of restructuring and consolidation across the industry. There are fewer companies, less competition for market share, and a focus on generating ancillary revenues. Airline stocks declined sharply in the October market downturn, but then bounced back dramatically. They have also benefited from lower oil prices, and although airline stocks are more expensive than they have been in a while, I believe many are still attractively valued.
Another interesting area has been the retail sector, particularly the discount retailers, which have been beneficiaries of the weakness in oil prices. The lower gasoline prices and lower costs for home heating oil have had a meaningful positive impact on the budgets of most American households, allowing them more discretionary spending, and this in turn has helped earnings for retail businesses.
What are some risks and opportunities for stock market investors in the coming months?
I believe a key risk for 2015 lies with large multinational companies — those that source much of their earnings from overseas, where the economies and currencies are considerably weaker than they are in the
Comparison of top sector shifts
This chart shows the fund’s largest allocation shifts, by percentage, over the past six months. Allocations are shown as a percentage of the fund’s net assets. Current period summary information may differ from the portfolio schedule included in the financial statements due to the inclusion of derivative securities, any interest accruals, the exclusion of as-of trades, if any, and the use of different classifications of securities for presentation purposes. Holdings and allocations may vary over time.
8 Investors Fund
United States. The U.S. economy has been relatively strong, and we’re seeing improvements in key areas such as employment and consumer sentiment. As for corporate profitability, I believe we may still see high single-digit or even low double-digit earnings growth this year. I also believe that many stocks are likely to benefit from the same factors that have driven the market for several years, such as solid corporate earnings and a strengthening housing market.
Thanks, Jerry, for your time and insights.
The views expressed in this report are exclusively those of Putnam Management and are subject to change. They are not meant as investment advice.
Please note that the holdings discussed in this report may not have been held by the fund for the entire period. Portfolio composition is subject to review in accordance with the fund’s investment strategy and may vary in the future. Current and future portfolio holdings are subject to risk.
Portfolio Manager Gerard P. Sullivan has an M.B.A. from the Columbia University Graduate School of Business and a B.A. from Columbia University. Jerry joined Putnam in 2008 and has been in the investment industry since 1982.
IN THE NEWS
How can an increase in the unemployment rate — to 5.7% in January 2015 from 5.6% in December 2014 — mean good news? The answer: More than one million people entered the workforce in January — which includes those actively seeking work. This is good news because it appeared that many people had abandoned looking for a job altogether in the wake of the Great Recession. That’s changing. The labor participation rate ticked up to 62.9% in January from 62.7% in December, according to the Bureau of Labor Statistics (BLS). Many believe that, for the economic recovery to continue, more people who have been sitting on the sidelines will need to reenter the labor market, even though they may not land a job right away. The BLS also noted that 257,000 jobs were added in January, slightly above expectations. More importantly, figures from previous months were revised higher: There were 329,000 additional jobs in December and an even more impressive 423,000 jobs in November. The BLS also reported a gain in average hourly earnings, which rose 0.5% in January after declining slightly in December. Wage growth might be luring people back to the workforce, particularly within lower-paying industries such as retail.
Investors Fund 9
Your fund’s performance |
This section shows your fund’s performance, price, and distribution information for periods ended January 31, 2015, the end of the first half of its current fiscal year. In accordance with regulatory requirements for mutual funds, we also include performance information as of the most recent calendar quarter-end and expense information taken from the fund’s current prospectus. Performance should always be considered in light of a fund’s investment strategy. Data represent past performance. Past performance does not guarantee future results. More recent returns may be less or more than those shown. Investment return and principal value will fluctuate, and you may have a gain or a loss when you sell your shares. Performance information does not reflect any deduction for taxes a shareholder may owe on fund distributions or on the redemption of fund shares. For the most recent month-end performance, please visit the Individual Investors section at putnam.com or call Putnam at 1-800-225-1581. Class R, R5, R6, and Y shares are not available to all investors. See the Terms and Definitions section in this report for definitions of the share classes offered by your fund. |
Fund performance Total return for periods ended 1/31/15
Class A | Class B | Class C | Class M | Class R | Class R5 | Class R6 | Class Y | |||||
(inception dates) | (12/1/25) | (3/1/93) | (7/26/99) | (12/2/94) | (1/21/03) | (7/2/12) | (7/2/12) | (1/7/97) | ||||
Before sales charge | After sales charge | Before CDSC | After CDSC | Before CDSC | After CDSC | Before sales charge | After sales charge | Net | Net | Net | Net | |
Annual average | ||||||||||||
(life of fund) | 9.27% | 9.20% | 9.17% | 9.17% | 8.45% | 8.45% | 8.52% | 8.48% | 9.00% | 9.33% | 9.33% | 9.32% |
10 years | 85.31 | 74.66 | 74.34 | 74.34 | 71.93 | 71.93 | 76.22 | 70.05 | 80.80 | 90.55 | 90.99 | 89.95 |
Annual average | 6.36 | 5.73 | 5.72 | 5.72 | 5.57 | 5.57 | 5.83 | 5.45 | 6.10 | 6.66 | 6.68 | 6.63 |
5 years | 105.14 | 93.34 | 97.65 | 95.65 | 97.61 | 97.61 | 100.05 | 93.05 | 102.63 | 108.34 | 108.82 | 107.69 |
Annual average | 15.45 | 14.09 | 14.60 | 14.37 | 14.59 | 14.59 | 14.88 | 14.06 | 15.17 | 15.81 | 15.87 | 15.74 |
3 years | 64.63 | 55.16 | 60.93 | 57.93 | 60.95 | 60.95 | 62.16 | 56.49 | 63.40 | 66.30 | 66.69 | 65.78 |
Annual average | 18.08 | 15.77 | 17.19 | 16.45 | 17.19 | 17.19 | 17.49 | 16.10 | 17.78 | 18.48 | 18.57 | 18.35 |
1 year | 13.61 | 7.08 | 12.76 | 7.76 | 12.80 | 11.80 | 13.06 | 9.11 | 13.34 | 14.02 | 14.06 | 13.89 |
6 months | 3.09 | –2.84 | 2.69 | –2.31 | 2.72 | 1.72 | 2.81 | –0.79 | 2.95 | 3.27 | 3.32 | 3.18 |
Current performance may be lower or higher than the quoted past performance, which cannot guarantee future results. After-sales-charge returns for class A and M shares reflect the deduction of the maximum 5.75% and 3.50% sales charge, respectively, levied at the time of purchase. Class B share returns after contingent deferred sales charge (CDSC) reflect the applicable CDSC, which is 5% in the first year, declining over time to 1% in the sixth year, and is eliminated thereafter. Class C share returns after CDSC reflect a 1% CDSC for the first year that is eliminated thereafter. Class R, R5, R6, and Y shares have no initial sales charge or CDSC. Performance for class B, C, M, R, and Y shares before their inception is derived from the historical performance of class A shares, adjusted for the applicable sales charge (or CDSC) and the higher operating expenses for such shares, except for class Y shares, for which 12b-1 fees are not applicable. Performance for class R5 and R6 shares prior to their inception is derived from the historical performance of class Y shares and has not been adjusted for the lower investor servicing fees applicable to class R5 and R6 shares; had it, returns would have been higher.
Recent performance may have benefited from one or more legal settlements.
For a portion of the periods, the fund had expense limitations, without which returns would have been lower.
Class B share performance reflects conversion to class A shares after eight years.
10 Investors Fund
Comparative index returns For periods ended 1/31/15
S&P 500 Index | Lipper Large-Cap Core Funds category average* | |
Annual average (life of fund) | —† | —† |
10 years | 108.25% | 96.56% |
Annual average | 7.61 | 6.93 |
5 years | 106.41 | 92.49 |
Annual average | 15.60 | 13.94 |
3 years | 62.09 | 56.34 |
Annual average | 17.47 | 16.02 |
1 year | 14.22 | 11.71 |
6 months | 4.37 | 3.00 |
Index and Lipper results should be compared with fund performance before sales charge, before CDSC, or at net asset value.
*Over the 6-month, 1-year, 3-year, 5-year, and 10-year periods ended 1/31/15, there were 872, 859, 758, 694, and 485 funds, respectively, in this Lipper category.
† The fund’s benchmark and Lipper category, the S&P 500 Index and Lipper Large-Cap Core Funds category, were introduced on 3/4/57 and 12/31/59, respectively, which post-date the inception of the fund’s class A shares.
Fund price and distribution information For the six-month period ended 1/31/15
Distributions | Class A | Class B | Class C | Class M | Class R | Class R5 | Class R6 | Class Y | ||
Number | 1 | 1 | 1 | 1 | 1 | 1 | 1 | 1 | ||
Income | $0.198 | $0.052 | $0.077 | $0.103 | $0.158 | $0.262 | $0.282 | $0.261 | ||
Capital gains | — | — | — | — | — | — | — | — | ||
Total | $0.198 | $0.052 | $0.077 | $0.103 | $0.158 | $0.262 | $0.282 | $0.261 | ||
Share value | Before | After | Net asset | Net asset | Before | After | Net asset | Net asset | Net asset | Net asset |
7/31/14 | $20.73 | $21.99 | $18.58 | $19.59 | $19.52 | $20.23 | $20.39 | $21.12 | $21.13 | $21.06 |
1/31/15 | 21.18 | 22.47 | 19.03 | 20.05 | 19.97 | 20.69 | 20.84 | 21.56 | 21.56 | 21.48 |
The classification of distributions, if any, is an estimate. Before-sales-charge share value and current dividend rate for class A and M shares, if applicable, do not take into account any sales charge levied at the time of purchase. After-sales-charge share value, current dividend rate, and current 30-day SEC yield, if applicable, are calculated assuming that the maximum sales charge (5.75% for class A shares and 3.50% for class M shares) was levied at the time of purchase. Final distribution information will appear on your year-end tax forms.
Investors Fund 11
Fund performance as of most recent calendar quarter Total return for periods ended 12/31/14
Class A | Class B | Class C | Class M | Class R | Class R5 | Class R6 | Class Y | |||||
(inception dates) | (12/1/25) | (3/1/93) | (7/26/99) | (12/2/94) | (1/21/03) | (7/2/12) | (7/2/12) | (1/7/97) | ||||
Before sales charge | After sales charge | Before CDSC | After CDSC | Before CDSC | After CDSC | Before sales charge | After sales charge | Net | Net | Net | Net | |
Annual average | ||||||||||||
(life of fund) | 9.32% | 9.25% | 9.22% | 9.22% | 8.50% | 8.50% | 8.57% | 8.53% | 9.05% | 9.38% | 9.38% | 9.37% |
10 years | 87.89 | 77.09 | 76.77 | 76.77 | 74.15 | 74.15 | 78.53 | 72.28 | 83.17 | 93.23 | 93.59 | 92.64 |
Annual average | 6.51 | 5.88 | 5.86 | 5.86 | 5.70 | 5.70 | 5.97 | 5.59 | 6.24 | 6.81 | 6.83 | 6.78 |
5 years | 103.92 | 92.20 | 96.55 | 94.55 | 96.50 | 96.50 | 98.81 | 91.85 | 101.53 | 107.19 | 107.58 | 106.56 |
Annual average | 15.32 | 13.96 | 14.47 | 14.24 | 14.47 | 14.47 | 14.73 | 13.92 | 15.04 | 15.68 | 15.73 | 15.61 |
3 years | 79.08 | 68.79 | 75.08 | 72.08 | 75.18 | 75.18 | 76.34 | 70.17 | 77.74 | 81.03 | 81.36 | 80.48 |
Annual average | 21.44 | 19.06 | 20.53 | 19.83 | 20.55 | 20.55 | 20.81 | 19.39 | 21.13 | 21.87 | 21.95 | 21.75 |
1 year | 13.77 | 7.23 | 12.93 | 7.93 | 12.88 | 11.88 | 13.15 | 9.18 | 13.46 | 14.17 | 14.22 | 14.05 |
6 months | 5.32 | –0.74 | 4.95 | –0.05 | 4.97 | 3.97 | 5.07 | 1.39 | 5.22 | 5.57 | 5.57 | 5.49 |
See the discussion following the fund performance table on page 10 for information about the calculation of fund performance.
Your fund’s expenses |
As a mutual fund investor, you pay ongoing expenses, such as management fees, distribution fees (12b-1 fees), and other expenses. Using the following information, you can estimate how these expenses affect your investment and compare them with the expenses of other funds. You may also pay one-time transaction expenses, including sales charges (loads) and redemption fees, which are not shown in this section and would have resulted in higher total expenses. For more information, see your fund’s prospectus or talk to your financial representative. |
Expense ratios
Class A | Class B | Class C | Class M | Class R | Class R5 | Class R6 | Class Y | |
Total annual operating expenses for the fiscal year ended 7/31/14 | 1.08% | 1.83% | 1.83% | 1.58% | 1.33% | 0.76% | 0.66% | 0.83% |
Annualized expense ratio for the six-month period ended 1/31/15 | 1.04% | 1.79% | 1.79% | 1.54% | 1.29% | 0.74% | 0.64% | 0.79% |
Fiscal-year expense information in this table is taken from the most recent prospectus, is subject to change, and may differ from that shown for the annualized expense ratio and in the financial highlights of this report.
Expenses are shown as a percentage of average net assets.
12 Investors Fund
Expenses per $1,000
The following table shows the expenses you would have paid on a $1,000 investment in the fund from August 1, 2014, to January 31, 2015. It also shows how much a $1,000 investment would be worth at the close of the period, assuming actual returns and expenses.
Class A | Class B | Class C | Class M | Class R | Class R5 | Class R6 | Class Y | |
Expenses paid per $1,000*† | $5.32 | $9.14 | $9.15 | $7.87 | $6.60 | $3.79 | $3.28 | $4.05 |
Ending value (after expenses) | $1,030.90 | $1,026.90 | $1,027.20 | $1,028.10 | $1,029.50 | $1,032.70 | $1,033.20 | $1,031.80 |
*Expenses for each share class are calculated using the fund’s annualized expense ratio for each class, which represents the ongoing expenses as a percentage of average net assets for the six months ended 1/31/15. The expense ratio may differ for each share class.
†Expenses are calculated by multiplying the expense ratio by the average account value for the period; then multiplying the result by the number of days in the period; and then dividing that result by the number of days in the year.
Estimate the expenses you paid |
To estimate the ongoing expenses you paid for the six months ended January 31, 2015, use the following calculation method. To find the value of your investment on August 1, 2014, call Putnam at 1-800-225-1581. |
Compare expenses using the SEC’s method
The Securities and Exchange Commission (SEC) has established guidelines to help investors assess fund expenses. Per these guidelines, the following table shows your fund’s expenses based on a $1,000 investment, assuming a hypothetical 5% annualized return. You can use this information to compare the ongoing expenses (but not transaction expenses or total costs) of investing in the fund with those of other funds. All mutual fund shareholder reports will provide this information to help you make this comparison. Please note that you cannot use this information to estimate your actual ending account balance and expenses paid during the period.
Class A | Class B | Class C | Class M | Class R | Class R5 | Class R6 | Class Y | |
Expenses paid per $1,000*† | $5.30 | $9.10 | $9.10 | $7.83 | $6.56 | $3.77 | $3.26 | $4.02 |
Ending value (after expenses) | $1,019.96 | $1,016.18 | $1,016.18 | $1,017.44 | $1,018.70 | $1,021.48 | $1,021.98 | $1,021.22 |
*Expenses for each share class are calculated using the fund’s annualized expense ratio for each class, which represents the ongoing expenses as a percentage of average net assets for the six months ended 1/31/15. The expense ratio may differ for each share class.
†Expenses are calculated by multiplying the expense ratio by the average account value for the six-month period; then multiplying the result by the number of days in the six-month period; and then dividing that result by the number of days in the year.
Investors Fund 13
Terms and definitions
Important terms
Total return shows how the value of the fund’s shares changed over time, assuming you held the shares through the entire period and reinvested all distributions in the fund.
Before sales charge, or net asset value, is the price, or value, of one share of a mutual fund, without a sales charge. Before-sales-charge figures fluctuate with market conditions, and are calculated by dividing the net assets of each class of shares by the number of outstanding shares in the class.
After sales charge is the price of a mutual fund share plus the maximum sales charge levied at the time of purchase. After-sales-charge performance figures shown here assume the 5.75% maximum sales charge for class A shares and 3.50% for class M shares.
Contingent deferred sales charge (CDSC) is generally a charge applied at the time of the redemption of class B or C shares and assumes redemption at the end of the period. Your fund’s class B CDSC declines over time from a 5% maximum during the first year to 1% during the sixth year. After the sixth year, the CDSC no longer applies. The CDSC for class C shares is 1% for one year after purchase.
Share classes
Class A shares are generally subject to an initial sales charge and no CDSC (except on certain redemptions of shares bought without an initial sales charge).
Class B shares are not subject to an initial sales charge and may be subject to a CDSC.
Class C shares are not subject to an initial sales charge and are subject to a CDSC only if the shares are redeemed during the first year.
Class M shares have a lower initial sales charge and a higher 12b-1 fee than class A shares and no CDSC (except on certain redemptions of shares bought without an initial sales charge).
Class R shares are not subject to an initial sales charge or CDSC and are available only to certain employer-sponsored retirement plans.
Class R5 and R6 shares are not subject to an initial sales charge or CDSC, and carry no 12b-1 fee. They are only available to employer-sponsored retirement plans.
Class Y shares are not subject to an initial sales charge or CDSC, and carry no 12b-1 fee. They are generally only available to corporate and institutional clients and clients in other approved programs.
Comparative indexes
Barclays U.S. Aggregate Bond Index is an unmanaged index of U.S. investment-grade fixed-income securities.
BofA Merrill Lynch U.S. 3-Month Treasury Bill Index is an unmanaged index that seeks to measure the performance of U.S. Treasury bills available in the marketplace.
S&P 500 Index is an unmanaged index of common stock performance.
Indexes assume reinvestment of all distributions and do not account for fees. Securities and performance of a fund and an index will differ. You cannot invest directly in an index.
Lipper is a third-party industry-ranking entity that ranks mutual funds. Its rankings do not reflect sales charges. Lipper rankings are based on total return at net asset value relative to other funds that have similar current investment styles or objectives as determined by Lipper. Lipper may change a fund’s category assignment at its discretion. Lipper category averages reflect performance trends for funds within a category.
14 Investors Fund
Other information for shareholders
Important notice regarding delivery of shareholder documents
In accordance with Securities and Exchange Commission (SEC) regulations, Putnam sends a single copy of annual and semiannual shareholder reports, prospectuses, and proxy statements to Putnam shareholders who share the same address, unless a shareholder requests otherwise. If you prefer to receive your own copy of these documents, please call Putnam at 1-800-225-1581, and Putnam will begin sending individual copies within 30 days.
Proxy voting
Putnam is committed to managing our mutual funds in the best interests of our shareholders. The Putnam funds’ proxy voting guidelines and procedures, as well as information regarding how your fund voted proxies relating to portfolio securities during the 12-month period ended June 30, 2014, are available in the Individual Investors section of putnam.com, and on the SEC’s website, www.sec.gov. If you have questions about finding forms on the SEC’s website, you may call the SEC at 1-800-SEC-0330. You may also obtain the Putnam funds’ proxy voting guidelines and procedures at no charge by calling Putnam’s Shareholder Services at 1-800-225-1581.
Fund portfolio holdings
The fund will file a complete schedule of its portfolio holdings with the SEC for the first and third quarters of each fiscal year on Form N-Q. Shareholders may obtain the fund’s Form N-Q on the SEC’s website at www.sec.gov. In addition, the fund’s Form N-Q may be reviewed and copied at the SEC’s Public Reference Room in Washington, D.C. You may call the SEC at 1-800-SEC-0330 for information about the SEC’s website or the operation of the Public Reference Room.
Trustee and employee fund ownership
Putnam employees and members of the Board of Trustees place their faith, confidence, and, most importantly, investment dollars in Putnam mutual funds. As of January 31, 2015, Putnam employees had approximately $470,000,000 and the Trustees had approximately $138,000,000 invested in Putnam mutual funds. These amounts include investments by the Trustees’ and employees’ immediate family members as well as investments through retirement and deferred compensation plans.
Investors Fund 15
Financial statements
A guide to financial statements
These sections of the report, as well as the accompanying Notes, constitute the fund’s financial statements.
The fund’s portfolio lists all the fund’s investments and their values as of the last day of the reporting period. Holdings are organized by asset type and industry sector, country, or state to show areas of concentration and diversification.
Statement of assets and liabilities shows how the fund’s net assets and share price are determined. All investment and non-investment assets are added together. Any unpaid expenses and other liabilities are subtracted from this total. The result is divided by the number of shares to determine the net asset value per share, which is calculated separately for each class of shares. (For funds with preferred shares, the amount subtracted from total assets includes the liquidation preference of preferred shares.)
Statement of operations shows the fund’s net investment gain or loss. This is done by first adding up all the fund’s earnings — from dividends and interest income — and subtracting its operating expenses to determine net investment income (or loss). Then, any net gain or loss the fund realized on the sales of its holdings — as well as any unrealized gains or losses over the period — is added to or subtracted from the net investment result to determine the fund’s net gain or loss for the fiscal period.
Statement of changes in net assets shows how the fund’s net assets were affected by the fund’s net investment gain or loss, by distributions to shareholders, and by changes in the number of the fund’s shares. It lists distributions and their sources (net investment income or realized capital gains) over the current reporting period and the most recent fiscal year-end. The distributions listed here may not match the sources listed in the Statement of operations because the distributions are determined on a tax basis and may be paid in a different period from the one in which they were earned. Dividend sources are estimated at the time of declaration. Actual results may vary. Any non-taxable return of capital cannot be determined until final tax calculations are completed after the end of the fund’s fiscal year.
Financial highlights provide an overview of the fund’s investment results, per-share distributions, expense ratios, net investment income ratios, and portfolio turnover in one summary table, reflecting the five most recent reporting periods. In a semiannual report, the highlights table also includes the current reporting period.
16 Investors Fund
The fund’s portfolio 1/31/15 (Unaudited)
COMMON STOCKS (98.9%)* | Shares | Value | |
Aerospace and defense (3.7%) | |||
Airbus Group NV (France) | 59,802 | $3,184,476 | |
General Dynamics Corp. | 118,100 | 15,732,101 | |
Honeywell International, Inc. | 108,430 | 10,600,117 | |
L-3 Communications Holdings, Inc. | 71,045 | 8,747,060 | |
Northrop Grumman Corp. | 105,700 | 16,589,615 | |
TransDigm Group, Inc. | 13,300 | 2,733,549 | |
United Technologies Corp. | 70,300 | 8,069,034 | |
65,655,952 | |||
Air freight and logistics (0.3%) | |||
FedEx Corp. | 26,500 | 4,481,415 | |
4,481,415 | |||
Airlines (1.4%) | |||
Alaska Air Group, Inc. | 41,100 | 2,789,457 | |
Copa Holdings SA Class A (Panama) | 12,600 | 1,354,626 | |
Delta Air Lines, Inc. | 115,100 | 5,445,381 | |
Southwest Airlines Co. | 275,500 | 12,447,090 | |
Spirit Airlines, Inc. † | 24,300 | 1,801,602 | |
23,838,156 | |||
Auto components (1.1%) | |||
Dana Holding Corp. S | 113,700 | 2,372,919 | |
Lear Corp. | 51,200 | 5,137,920 | |
Magna International, Inc. (Canada) | 38,500 | 3,696,770 | |
TRW Automotive Holdings Corp. † | 80,711 | 8,326,954 | |
19,534,563 | |||
Automobiles (0.4%) | |||
Ford Motor Co. | 502,400 | 7,390,304 | |
7,390,304 | |||
Banks (6.4%) | |||
Bank of America Corp. | 1,053,542 | 15,961,161 | |
Citigroup, Inc. | 335,517 | 15,752,523 | |
JPMorgan Chase & Co. | 716,273 | 38,950,926 | |
PNC Financial Services Group, Inc. | 72,700 | 6,146,058 | |
Regions Financial Corp. | 246,800 | 2,147,160 | |
Wells Fargo & Co. | 693,498 | 36,006,416 | |
114,964,244 | |||
Beverages (2.3%) | |||
Coca-Cola Co. (The) | 115,300 | 4,746,901 | |
Coca-Cola Enterprises, Inc. | 116,200 | 4,892,020 | |
Dr. Pepper Snapple Group, Inc. | 120,400 | 9,303,308 | |
Monster Beverage Corp. † | 29,300 | 3,426,635 | |
PepsiCo, Inc. | 202,200 | 18,962,316 | |
41,331,180 | |||
Biotechnology (3.8%) | |||
Amgen, Inc. | 116,200 | 17,692,612 | |
Biogen Idec, Inc. † | 30,600 | 11,908,296 | |
Celgene Corp. † S | 164,100 | 19,554,156 | |
Gilead Sciences, Inc. † | 174,000 | 18,240,420 | |
67,395,484 |
Investors Fund 17
COMMON STOCKS (98.9%)* cont. | Shares | Value | |
Capital markets (3.6%) | |||
Ameriprise Financial, Inc. | 71,700 | $8,958,198 | |
Apollo Global Management, LLC Class A | 148,300 | 3,688,221 | |
Artisan Partners Asset Management, Inc. Class A | 59,294 | 2,862,121 | |
Carlyle Group LP (The) | 126,253 | 3,320,454 | |
Charles Schwab Corp. (The) | 141,900 | 3,686,562 | |
Goldman Sachs Group, Inc. (The) | 91,100 | 15,706,551 | |
KKR & Co. LP | 150,200 | 3,606,302 | |
Legg Mason, Inc. S | 75,500 | 4,185,720 | |
Morgan Stanley | 249,700 | 8,442,357 | |
State Street Corp. | 128,400 | 9,181,884 | |
63,638,370 | |||
Chemicals (2.3%) | |||
Albemarle Corp. | 34,600 | 1,669,796 | |
Axalta Coating Systems, Ltd. † | 78,318 | 2,010,423 | |
Axiall Corp. | 50,200 | 2,221,350 | |
CF Industries Holdings, Inc. | 15,600 | 4,763,928 | |
Dow Chemical Co. (The) | 139,043 | 6,279,182 | |
Huntsman Corp. | 214,900 | 4,719,204 | |
LyondellBasell Industries NV Class A | 78,100 | 6,176,929 | |
Monsanto Co. | 55,200 | 6,512,496 | |
Sherwin-Williams Co. (The) | 23,800 | 6,456,226 | |
40,809,534 | |||
Commercial services and supplies (0.5%) | |||
Cintas Corp. | 77,100 | 6,067,770 | |
KAR Auction Services, Inc. | 65,862 | 2,246,553 | |
MiX Telematics, Ltd. ADR (South Africa) † | 152,333 | 894,195 | |
9,208,518 | |||
Communications equipment (1.9%) | |||
Cisco Systems, Inc. | 707,500 | 18,653,238 | |
Juniper Networks, Inc. | 108,700 | 2,470,751 | |
QUALCOMM, Inc. | 194,200 | 12,129,732 | |
33,253,721 | |||
Construction materials (0.2%) | |||
CaesarStone Sdot-Yam, Ltd. (Israel) S | 54,619 | 3,391,840 | |
3,391,840 | |||
Consumer finance (1.3%) | |||
American Express Co. | 56,700 | 4,575,123 | |
Capital One Financial Corp. | 106,800 | 7,818,828 | |
Discover Financial Services | 178,400 | 9,701,392 | |
22,095,343 | |||
Containers and packaging (0.4%) | |||
Ball Corp. | 44,600 | 2,824,518 | |
Berry Plastics Group, Inc. † | 105,600 | 3,571,392 | |
6,395,910 | |||
Diversified consumer services (0.1%) | |||
Weight Watchers International, Inc. † S | 103,400 | 1,712,304 | |
1,712,304 | |||
Diversified financial services (0.6%) | |||
Berkshire Hathaway, Inc. Class B † | 44,280 | 6,372,335 | |
Voya Financial, Inc. | 101,900 | 3,975,119 | |
10,347,454 |
18 Investors Fund
COMMON STOCKS (98.9%)* cont. | Shares | Value | |
Diversified telecommunication services (1.5%) | |||
AT&T, Inc. | 189,805 | $6,248,381 | |
CenturyLink, Inc. | 56,500 | 2,100,105 | |
Iridium Communications, Inc. † S | 321,548 | 2,736,373 | |
Verizon Communications, Inc. | 335,521 | 15,336,665 | |
26,421,524 | |||
Electric utilities (1.0%) | |||
Entergy Corp. | 97,000 | 8,488,470 | |
Exelon Corp. S | 235,500 | 8,487,420 | |
16,975,890 | |||
Electrical equipment (0.1%) | |||
Generac Holdings, Inc. † S | 60,400 | 2,641,896 | |
2,641,896 | |||
Electronic equipment, instruments, and components (0.6%) | |||
CDW Corp. of Delaware | 88,568 | 3,034,340 | |
Corning, Inc. | 313,700 | 7,456,649 | |
10,490,989 | |||
Energy equipment and services (1.6%) | |||
FMSA Holdings, Inc. † S | 281,474 | 1,460,850 | |
Halliburton Co. | 170,300 | 6,810,297 | |
Helmerich & Payne, Inc. | 31,100 | 1,852,316 | |
Nabors Industries, Ltd. | 212,800 | 2,449,328 | |
Schlumberger, Ltd. | 197,224 | 16,249,285 | |
28,822,076 | |||
Food and staples retail (3.5%) | |||
Costco Wholesale Corp. | 53,200 | 7,607,068 | |
CVS Health Corp. | 263,910 | 25,905,406 | |
Kroger Co. (The) | 201,600 | 13,920,480 | |
Wal-Mart Stores, Inc. | 115,000 | 9,772,700 | |
Walgreens Boots Alliance, Inc. | 59,400 | 4,380,750 | |
61,586,404 | |||
Food products (0.9%) | |||
Amira Nature Foods, Ltd. (United Arab Emirates) † S | 167,206 | 2,080,043 | |
Archer-Daniels-Midland Co. | 94,700 | 4,415,861 | |
Bunge, Ltd. | 28,300 | 2,533,699 | |
Keurig Green Mountain, Inc. | 28,200 | 3,456,192 | |
Pinnacle Foods, Inc. | 82,800 | 2,978,316 | |
15,464,111 | |||
Gas utilities (0.2%) | |||
UGI Corp. | 88,300 | 3,266,217 | |
3,266,217 | |||
Health-care equipment and supplies (1.9%) | |||
Becton Dickinson and Co. | 28,100 | 3,880,048 | |
C.R. Bard, Inc. | 26,000 | 4,446,780 | |
Edwards Lifesciences Corp. † | 38,000 | 4,763,300 | |
Halyard Health, Inc. † S | 4,375 | 194,994 | |
Medtronic PLC | 227,323 | 16,230,862 | |
St. Jude Medical, Inc. | 55,200 | 3,636,024 | |
33,152,008 | |||
Health-care providers and services (3.2%) | |||
Aetna, Inc. | 66,300 | 6,087,666 | |
AmerisourceBergen Corp. | 63,700 | 6,054,685 | |
Anthem, Inc. | 66,900 | 9,028,824 |
Investors Fund 19
COMMON STOCKS (98.9%)*cont. | Shares | Value | |
Health-care providers and services cont. | |||
Cardinal Health, Inc. | 97,600 | $8,119,344 | |
Cigna Corp. | 45,900 | 4,903,497 | |
Express Scripts Holding Co. † | 38,700 | 3,123,477 | |
HCA Holdings, Inc. † | 105,500 | 7,469,400 | |
Humana, Inc. | 33,300 | 4,876,452 | |
UnitedHealth Group, Inc. | 69,800 | 7,416,250 | |
57,079,595 | |||
Hotels, restaurants, and leisure (1.8%) | |||
Carrols Restaurant Group, Inc. † | 331,534 | 2,639,011 | |
Hilton Worldwide Holdings, Inc. † | 131,222 | 3,407,835 | |
Intrawest Resorts Holdings, Inc. † | 91,172 | 920,837 | |
Las Vegas Sands Corp. | 113,000 | 6,143,810 | |
McDonald’s Corp. | 52,500 | 4,853,100 | |
Penn National Gaming, Inc. † | 300,100 | 4,492,497 | |
Restaurant Brands International LP (Units) (Canada) † S | 797 | 29,228 | |
Restaurant Brands International, Inc. (Canada) † | 78,903 | 3,051,968 | |
Wyndham Worldwide Corp. | 45,400 | 3,804,066 | |
Yum! Brands, Inc. | 42,400 | 3,064,672 | |
32,407,024 | |||
Household durables (0.5%) | |||
New Home Co., Inc. (The) † | 193,047 | 2,720,032 | |
WCI Communities, Inc. † S | 72,330 | 1,396,692 | |
Whirlpool Corp. | 21,200 | 4,220,496 | |
8,337,220 | |||
Household products (0.9%) | |||
Energizer Holdings, Inc. | 38,600 | 4,941,186 | |
Procter & Gamble Co. (The) | 123,700 | 10,426,673 | |
15,367,859 | |||
Independent power and renewable electricity producers (0.4%) | |||
AES Corp. | 160,062 | 1,955,958 | |
NRG Energy, Inc. | 222,000 | 5,474,520 | |
7,430,478 | |||
Industrial conglomerates (1.8%) | |||
3M Co. S | 104,400 | 16,944,120 | |
General Electric Co. | 412,400 | 9,852,236 | |
Siemens AG (Germany) S | 40,462 | 4,249,875 | |
31,046,231 | |||
Insurance (2.9%) | |||
Allstate Corp. (The) | 89,000 | 6,211,310 | |
American International Group, Inc. | 274,350 | 13,407,485 | |
Assured Guaranty, Ltd. | 118,300 | 2,888,886 | |
Chubb Corp. (The) | 35,700 | 3,495,030 | |
Genworth Financial, Inc. Class A † | 162,100 | 1,131,458 | |
Hartford Financial Services Group, Inc. (The) | 73,000 | 2,839,700 | |
Lincoln National Corp. S | 106,700 | 5,332,866 | |
MetLife, Inc. | 115,466 | 5,369,169 | |
Prudential PLC (United Kingdom) | 109,878 | 2,672,741 | |
Travelers Cos., Inc. (The) | 76,200 | 7,834,884 | |
51,183,529 |
20 Investors Fund
COMMON STOCKS (98.9%)* cont. | Shares | Value | |
Internet and catalog retail (0.9%) | |||
Amazon.com, Inc. † | 15,900 | $5,637,027 | |
Expedia, Inc. | 43,800 | 3,763,734 | |
FabFurnish GmbH (acquired 8/2/13, cost $31) (Private) (Brazil) †ΔΔ F | 23 | 19 | |
Global Fashion Holding SA (acquired 8/2/13, cost $1,535,904) (Private) (Brazil) †ΔΔ F | 36,256 | 851,090 | |
New Bigfoot Other Assets GmbH (acquired 8/2/13, cost $31) (Private) (Brazil) †ΔΔ F | 23 | 19 | |
New Middle East Other Assets GmbH (acquired 8/2/13, cost $12) (Private) (Brazil) †ΔΔ F | 9 | 8 | |
Priceline Group, Inc. (The) † | 5,700 | 5,754,036 | |
16,005,933 | |||
Internet software and services (2.8%) | |||
Alibaba Group Holding, Ltd. ADR (China) † S | 130,300 | 11,607,124 | |
AOL, Inc. † | 88,500 | 3,827,625 | |
eBay, Inc. † | 73,700 | 3,906,100 | |
Facebook, Inc. Class A † | 105,400 | 8,000,914 | |
Google, Inc. Class C † | 31,694 | 16,941,077 | |
Yahoo!, Inc. † | 122,200 | 5,375,578 | |
49,658,418 | |||
IT Services (2.7%) | |||
Automatic Data Processing, Inc. | 42,400 | 3,499,272 | |
Computer Sciences Corp. | 134,000 | 8,131,120 | |
DST Systems, Inc. | 39,331 | 3,803,308 | |
IBM Corp. S | 83,200 | 12,755,392 | |
MasterCard, Inc. Class A | 73,400 | 6,021,002 | |
Visa, Inc. Class A | 32,500 | 8,284,575 | |
Xerox Corp. | 340,500 | 4,484,385 | |
46,979,054 | |||
Leisure products (0.2%) | |||
Malibu Boats, Inc. Class A † S | 161,179 | 3,516,926 | |
3,516,926 | |||
Life sciences tools and services (0.2%) | |||
Agilent Technologies, Inc. | 75,800 | 2,862,966 | |
2,862,966 | |||
Machinery (1.0%) | |||
Caterpillar, Inc. S | 74,700 | 5,973,759 | |
Deere & Co. | 52,200 | 4,446,918 | |
Parker Hannifin Corp. | 25,400 | 2,958,084 | |
Trinity Industries, Inc. S | 144,400 | 3,822,268 | |
17,201,029 | |||
Media (2.9%) | |||
Comcast Corp. Class A | 274,600 | 14,593,617 | |
DIRECTV † | 59,400 | 5,065,632 | |
DISH Network Corp. Class A † | 58,900 | 4,143,615 | |
SFX Entertainment, Inc. † S | 170,251 | 560,126 | |
Time Warner Cable, Inc. | 36,200 | 4,927,906 | |
Time Warner, Inc. | 118,900 | 9,265,877 | |
Time, Inc. | 17,725 | 443,834 | |
Walt Disney Co. (The) | 141,000 | 12,825,360 | |
51,825,967 |
Investors Fund 21
COMMON STOCKS (98.9%)* cont. | Shares | Value | |
Metals and mining (0.2%) | |||
Freeport-McMoRan, Inc. (Indonesia) | 112,500 | $1,891,125 | |
United States Steel Corp. S | 77,200 | 1,886,768 | |
3,777,893 | |||
Multi-utilities (0.3%) | |||
Public Service Enterprise Group, Inc. | 119,300 | 5,091,724 | |
5,091,724 | |||
Multiline retail (1.3%) | |||
Dollar General Corp. † | 26,500 | 1,777,090 | |
Kohl’s Corp. | 67,000 | 4,001,240 | |
Macy’s, Inc. | 146,100 | 9,332,868 | |
Target Corp. | 111,500 | 8,207,515 | |
23,318,713 | |||
Oil, gas, and consumable fuels (6.0%) | |||
Anadarko Petroleum Corp. | 67,000 | 5,477,250 | |
Apache Corp. | 72,500 | 4,536,325 | |
Chevron Corp. | 46,300 | 4,747,139 | |
Devon Energy Corp. | 79,200 | 4,773,384 | |
EOG Resources, Inc. | 119,500 | 10,639,085 | |
Exxon Mobil Corp. | 310,525 | 27,146,096 | |
Hess Corp. | 49,900 | 3,367,751 | |
JP Energy Partners LP † | 128,800 | 1,594,544 | |
Memorial Resource Development Corp. † | 413,175 | 7,912,301 | |
Occidental Petroleum Corp. | 104,800 | 8,384,000 | |
Rice Midstream Partners LP † | 196,751 | 2,756,482 | |
Royal Dutch Shell PLC ADR (United Kingdom) | 77,100 | 4,737,795 | |
Suncor Energy, Inc. (Canada) | 116,500 | 3,472,865 | |
Total SA ADR (France) | 121,200 | 6,243,012 | |
USD Partners LP † | 208,404 | 2,721,756 | |
Valero Energy Corp. | 133,800 | 7,075,344 | |
105,585,129 | |||
Paper and forest products (0.3%) | |||
International Paper Co. | 94,900 | 4,997,434 | |
4,997,434 | |||
Personal products (0.7%) | |||
Avon Products, Inc. S | 540,900 | 4,186,566 | |
Coty, Inc. Class A † | 311,720 | 5,928,914 | |
Estee Lauder Cos., Inc. (The) Class A | 43,000 | 3,035,370 | |
13,150,850 | |||
Pharmaceuticals (6.0%) | |||
AbbVie, Inc. | 138,400 | 8,352,440 | |
Actavis PLC † | 27,600 | 7,356,504 | |
Eli Lilly & Co. | 68,000 | 4,896,000 | |
Jazz Pharmaceuticals PLC † S | 21,332 | 3,612,361 | |
Johnson & Johnson | 252,000 | 25,235,280 | |
Merck & Co., Inc. | 314,300 | 18,946,004 | |
Mylan, Inc. † | 65,900 | 3,502,585 | |
Pfizer, Inc. | 771,426 | 24,107,063 | |
Shire PLC ADR (United Kingdom) | 27,900 | 6,117,354 | |
Zoetis, Inc. | 90,400 | 3,862,792 | |
105,988,383 |
22 Investors Fund
COMMON STOCKS (98.9%)* cont. | Shares | Value | |
Real estate investment trusts (REITs) (0.7%) | |||
American Tower Corp. R | 26,500 | $2,569,175 | |
Armada Hoffler Properties, Inc. R | 512,244 | 5,465,643 | |
Hannon Armstrong Sustainable Infrastructure Capital, Inc. R | 137,336 | 1,881,503 | |
Kimco Realty Corp. R | 114,300 | 3,160,395 | |
13,076,716 | |||
Road and rail (1.0%) | |||
Union Pacific Corp. | 144,300 | 16,913,403 | |
16,913,403 | |||
Semiconductors and semiconductor equipment (3.0%) | |||
Broadcom Corp. Class A | 64,100 | 2,720,084 | |
Intel Corp. | 508,100 | 16,787,624 | |
Lam Research Corp. | 65,000 | 4,968,600 | |
Marvell Technology Group, Ltd. | 228,700 | 3,542,563 | |
Maxim Integrated Products, Inc. | 79,300 | 2,624,037 | |
Micron Technology, Inc. † | 309,300 | 9,051,665 | |
NVIDIA Corp. | 196,900 | 3,781,465 | |
Texas Instruments, Inc. | 166,400 | 8,894,080 | |
52,370,118 | |||
Software (4.6%) | |||
Activision Blizzard, Inc. | 111,400 | 2,327,703 | |
Cadence Design Systems, Inc. † S | 120,500 | 2,167,795 | |
Electronic Arts, Inc. † | 116,300 | 6,380,218 | |
Microsoft Corp. | 851,300 | 34,392,520 | |
Oracle Corp. | 614,700 | 25,749,783 | |
Symantec Corp. | 228,000 | 5,647,560 | |
TiVo, Inc. † | 358,300 | 3,747,818 | |
80,413,397 | |||
Specialty retail (3.1%) | |||
Bed Bath & Beyond, Inc. † | 60,500 | 4,523,585 | |
Best Buy Co., Inc. | 134,000 | 4,716,800 | |
Gap, Inc. (The) | 132,500 | 5,457,675 | |
Home Depot, Inc. (The) | 145,900 | 15,234,878 | |
Lowe’s Cos., Inc. | 153,600 | 10,407,936 | |
Michaels Cos., Inc. (The) † | 223,378 | 5,763,152 | |
Select Comfort Corp. † S | 144,576 | 4,314,148 | |
TJX Cos., Inc. (The) | 68,600 | 4,523,484 | |
54,941,658 | |||
Technology hardware, storage, and peripherals (6.1%) | |||
Apple, Inc. | 621,369 | 72,799,589 | |
EMC Corp. | 404,200 | 10,480,906 | |
Hewlett-Packard Co. | 272,092 | 9,830,684 | |
NetApp, Inc. | 54,300 | 2,052,540 | |
SanDisk Corp. | 66,599 | 5,055,530 | |
Western Digital Corp. | 93,300 | 9,071,559 | |
109,290,808 | |||
Textiles, apparel, and luxury goods (0.8%) | |||
Hanesbrands, Inc. | 25,700 | 2,862,466 | |
Michael Kors Holdings, Ltd. † | 40,200 | 2,845,758 | |
NIKE, Inc. Class B | 63,000 | 5,811,750 | |
Tumi Holdings, Inc. † S | 90,900 | 2,060,703 | |
13,580,677 |
Investors Fund 23
COMMON STOCKS (98.9%)* cont. | Shares | Value | |
Tobacco (0.8%) | |||
Lorillard, Inc. | 79,200 | $5,196,312 | |
Philip Morris International, Inc. | 107,169 | 8,599,241 | |
13,795,553 | |||
Trading companies and distributors (0.2%) | |||
United Rentals, Inc. † | 40,600 | 3,363,710 | |
3,363,710 | |||
Total common stocks (cost $1,436,008,348) |
|
CONVERTIBLE PREFERRED STOCKS (0.3%)* | Shares | Value | |
American Tower Corp. Ser. A, $5.25 cv. pfd. R | 16,754 | $1,817,809 | |
Iridium Communications, Inc. 144A $7.00 cv. pfd. | 27,936 | 2,938,518 | |
Total convertible preferred stocks (cost $4,469,000) |
|
SHORT-TERM INVESTMENTS (6.1%)* | Shares | Value | |
Putnam Cash Collateral Pool, LLC 0.19% d | 86,637,528 | $86,637,528 | |
Putnam Short Term Investment Fund 0.10% L | 20,329,034 | 20,329,034 | |
Total short-term investments (cost $106,966,562) |
|
TOTAL INVESTMENTS | ||
Total investments (cost $1,547,443,910) | $1,856,546,691 |
| ||
ADR | American Depository Receipts: represents ownership of foreign securities on deposit with a custodian bank |
Notes to the fund’s portfolio | |
Unless noted otherwise, the notes to the fund’s portfolio are for the close of the fund’s reporting period, which ran from August 1, 2014 through January 31, 2015 (the reporting period). Within the following notes to the portfolio, references to “ASC 820” represent Accounting Standards Codification 820 Fair Value Measurements and Disclosures and references to “OTC”, if any, represent over-the-counter. | |
* | Percentages indicated are based on net assets of $1,764,782,501. |
† | This security is non-income-producing. |
ΔΔ | This security is restricted with regard to public resale. The total fair value of this security and any other restricted securities (excluding 144A securities), if any, held at the close of the reporting period was $851,136, or less than 0.1% of net assets. |
d | Affiliated company. See Note 1 to the financial statements regarding securities lending. The rate quoted in the security description is the annualized 7-day yield of the fund at the close of the reporting period. |
F | This security is valued at fair value following procedures approved by the Trustees. Securities may be classified as Level 2 or Level 3 for ASC 820 based on the securities’ valuation inputs. At the close of the reporting period, fair value pricing was also used for certain foreign securities in the portfolio (Note 1). |
L | Affiliated company (Note 5). The rate quoted in the security description is the annualized 7-day yield of the fund at the close of the reporting period. |
R | Real Estate Investment Trust. |
S | Security on loan, in part or in entirety, at the close of the reporting period (Note 1). |
At the close of the reporting period, the fund maintained liquid assets totaling $183,985 to cover the settlement of certain securities. | |
144A after the name of an issuer represents securities exempt from registration under Rule 144A under the Securities Act of 1933, as amended. These securities may be resold in transactions exempt from registration, normally to qualified institutional buyers. |
24 Investors Fund
ASC 820 establishes a three-level hierarchy for disclosure of fair value measurements. The valuation hierarchy is based upon the transparency of inputs to the valuation of the fund’s investments. The three levels are defined as follows: | |
Level 1: Valuations based on quoted prices for identical securities in active markets. | |
Level 2: Valuations based on quoted prices in markets that are not active or for which all significant inputs are observable, either directly or indirectly. | |
Level 3: Valuations based on inputs that are unobservable and significant to the fair value measurement. | |
The following is a summary of the inputs used to value the fund’s net assets as of the close of the reporting period: |
Valuation inputs | ||||
Investments in securities: | Level 1 | Level 2 | Level 3 | |
Common stocks*: | ||||
Consumer discretionary | $231,720,153 | $— | $851,136 | |
Consumer staples | 160,695,957 | — | — | |
Energy | 134,407,205 | — | — | |
Financials | 272,632,915 | 2,672,741 | — | |
Health care | 266,478,436 | — | — | |
Industrials | 166,915,959 | 7,434,351 | — | |
Information technology | 382,456,505 | — | — | |
Materials | 59,372,611 | — | — | |
Telecommunication services | 26,421,524 | — | — | |
Utilities | 32,764,309 | — | — | |
Total common stocks | 1,733,865,574 | 10,107,092 | 851,136 | |
Convertible preferred stocks | — | 4,756,327 | — | |
Short-term investments | 20,329,034 | 86,637,528 | — | |
Totals by level | $1,754,194,608 | $101,500,947 | $851,136 | |
*Common stock classifications are presented at the sector level, which may differ from the fund’s portfolio presentation. | ||||
During the reporting period, transfers within the fair value hierarchy, if any, (other than certain transfers involving non-U.S. equity securities as described in Note 1) did not represent, in the aggregate, more than 1% of the fund’s net assets measured as of the end of the period. | ||||
At the start and close of the reporting period, Level 3 investments in securities represented less than 1% of the fund’s net assets and were not considered a significant portion of the fund’s portfolio. |
The accompanying notes are an integral part of these financial statements.
Investors Fund 25
Statement of assets and liabilities 1/31/15 (Unaudited) | ||
ASSETS | ||
Investment in securities, at value, including $83,507,108 of securities on loan (Note 1): | ||
Unaffiliated issuers (identified cost $1,440,477,348) | $1,749,580,129 | |
Affiliated issuers (identified cost $106,966,562) (Notes 1 and 5) | 106,966,562 | |
Dividends, interest and other receivables | 1,900,569 | |
Receivable for shares of the fund sold | 960,532 | |
Receivable for investments sold | 28,478,332 | |
Prepaid assets | 59,664 | |
Total assets | 1,887,945,788 | |
LIABILITIES | ||
Payable for investments purchased | 31,060,818 | |
Payable for shares of the fund repurchased | 2,593,129 | |
Payable for compensation of Manager (Note 2) | 837,075 | |
Payable for custodian fees (Note 2) | 7,338 | |
Payable for investor servicing fees (Note 2) | 586,610 | |
Payable for Trustee compensation and expenses (Note 2) | 781,590 | |
Payable for administrative services (Note 2) | 15,177 | |
Payable for distribution fees (Note 2) | 429,308 | |
Collateral on securities loaned, at value (Note 1) | 86,637,528 | |
Other accrued expenses | 214,714 | |
Total liabilities | 123,163,287 | |
Net assets | $1,764,782,501 | |
REPRESENTED BY | ||
Paid-in capital (Unlimited shares authorized) (Notes 1 and 4) | $1,965,690,637 | |
Undistributed net investment income (Note 1) | 6,405,978 | |
Accumulated net realized loss on investments and foreign currency transactions (Note 1) | (516,415,297) | |
Net unrealized appreciation of investments and assets and liabilities in foreign currencies | 309,101,183 | |
Total — Representing net assets applicable to capital shares outstanding | $1,764,782,501 | |
(Continued on next page) |
The accompanying notes are an integral part of these financial statements.
26 Investors Fund
Statement of assets and liabilities (Continued) | ||
COMPUTATION OF NET ASSET VALUE AND OFFERING PRICE | ||
Net asset value and redemption price per class A share ($1,538,150,818 divided by 72,621,362 shares) | $21.18 | |
Offering price per class A share (100/94.25 of $21.18)* | $22.47 | |
Net asset value and offering price per class B share ($45,454,340 divided by 2,388,875 shares)** | $19.03 | |
Net asset value and offering price per class C share ($47,265,236 divided by 2,357,948 shares)** | $20.05 | |
Net asset value and redemption price per class M share ($22,487,518 divided by 1,126,207 shares) | $19.97 | |
Offering price per class M share (100/96.50 of $19.97)* | $20.69 | |
Net asset value, offering price and redemption price per class R share ($4,206,581 divided by 201,872 shares) | $20.84 | |
Net asset value, offering price and redemption price per class R5 share ($16,013 divided by 743 shares) † | $21.56 | |
Net asset value, offering price and redemption price per class R6 share ($16,484,992 divided by 764,767 shares) | $21.56 | |
Net asset value, offering price and redemption price per class Y share ($90,717,003 divided by 4,222,876 shares) | $21.48 | |
* | On single retail sales of less than $50,000. On sales of $50,000 or more the offering price is reduced. | |
** | Redemption price per share is equal to net asset value less any applicable contingent deferred sales charge. | |
† | Net asset value may not recalculate due to rounding of fractional shares. |
The accompanying notes are an integral part of these financial statements.
Investors Fund 27
Statement of operations Six months ended 1/31/15 (Unaudited) | ||
INVESTMENT INCOME | ||
Dividends (net of foreign tax of $48,050) | $16,162,033 | |
Interest (including interest income of $4,878 from investments in affiliated issuers) (Note 5) | 4,878 | |
Securities lending (Note 1) | 405,584 | |
Total investment income | 16,572,495 | |
EXPENSES | ||
Compensation of Manager (Note 2) | 4,901,284 | |
Investor servicing fees (Note 2) | 1,755,107 | |
Custodian fees (Note 2) | 14,115 | |
Trustee compensation and expenses (Note 2) | 10,947 | |
Distribution fees (Note 2) | 2,516,201 | |
Administrative services (Note 2) | 26,779 | |
Other | 280,513 | |
Total expenses | 9,504,946 | |
Expense reduction (Note 2) | (16,139) | |
Net expenses | 9,488,807 | |
Net investment income | 7,083,688 | |
Net realized gain on investments (Notes 1 and 3) | 68,132,026 | |
Net realized loss on foreign currency transactions (Note 1) | (16,076) | |
Net unrealized depreciation of assets and liabilities in foreign currencies during the period | (1,323) | |
Net unrealized depreciation of investments during the period | (23,130,582) | |
Net gain on investments | 44,984,045 | |
Net increase in net assets resulting from operations | $52,067,733 |
The accompanying notes are an integral part of these financial statements.
28 Investors Fund
Statement of changes in net assets | |||
INCREASE IN NET ASSETS | Six months ended 1/31/15* | Year ended 7/31/14 | |
Operations: | |||
Net investment income | $7,083,688 | $17,159,906 | |
Net realized gain on investments and foreign currency transactions | 68,115,950 | 186,142,441 | |
Net unrealized appreciation (depreciation) of investments and assets and liabilities in foreign currencies | (23,131,905) | 76,151,329 | |
Net increase in net assets resulting from operations | 52,067,733 | 279,453,676 | |
Distributions to shareholders (Note 1): | |||
From ordinary income | |||
Net investment income | |||
Class A | (14,318,664) | (15,977,939) | |
Class B | (127,600) | (277,220) | |
Class C | (173,071) | (191,363) | |
Class M | (116,965) | (163,349) | |
Class R | (30,106) | (31,904) | |
Class R5 | (192) | (199) | |
Class R6 | (211,123) | (217,723) | |
Class Y | (1,130,210) | (726,120) | |
Increase (decrease) from capital share transactions (Note 4) | 24,914,904 | (95,692,631) | |
Total increase in net assets | 60,874,706 | 166,175,228 | |
NET ASSETS | |||
Beginning of period | 1,703,907,795 | 1,537,732,567 | |
End of period (including undistributed net investment income of $6,405,978 and $15,430,221, respectively) | $1,764,782,501 | $1,703,907,795 | |
* | Unaudited. |
The accompanying notes are an integral part of these financial statements.
Investors Fund 29
Financial highlights (For a common share outstanding throughout the period)
INVESTMENT OPERATIONS: | LESS DISTRIBUTIONS: | RATIOS AND SUPPLEMENTAL DATA: | ||||||||||||
Period ended | Net asset value, beginning of period | Net investment income (loss)a | Net realized and unrealized gain (loss) on investments | Total from investment operations | From | Total | Redemption | Non-recurring reimbursements | Net asset value, end of period | Total return at net asset value (%)b | Net assets, end of period (in thousands) | Ratio of expenses to average net assets (%)c | Ratio of | Portfolio turnover (%) |
Class A | ||||||||||||||
January 31, 2015** | $20.73 | .09 | .56 | .65 | (.20) | (.20) | — | — | $21.18 | 3.09* | $1,538,151 | .52* | .42* | 23* |
July 31, 2014 | 17.64 | .21 | 3.09 | 3.30 | (.21) | (.21) | — | — | 20.73 | 18.84 | 1,508,086 | 1.08 | 1.09 | 63 |
July 31, 2013 | 13.89 | .20 | 3.70 | 3.90 | (.15) | (.15) | — | — | 17.64 | 28.29 | 1,364,640 | 1.14 | 1.28 | 77 |
July 31, 2012 | 13.12 | .14 | .76 | .90 | (.13) | (.13) | — | —d,e | 13.89 | 6.95 | 1,191,455 | 1.20 | 1.11 | 49 |
July 31, 2011 | 11.15 | .11 | 1.95 | 2.06 | (.09) | (.09) | — | —d,f | 13.12 | 18.54 | 1,264,410 | 1.18 | .86 | 65 |
July 31, 2010 | 10.04 | .08 | 1.18 | 1.26 | (.15) | (.15) | —d | — | 11.15 | 12.59 | 1,252,067 | 1.27 | .72 | 97 |
Class B | ||||||||||||||
January 31, 2015** | $18.58 | .01 | .49 | .50 | (.05) | (.05) | — | — | $19.03 | 2.69* | $45,454 | .90* | .04* | 23* |
July 31, 2014 | 15.84 | .06 | 2.77 | 2.83 | (.09) | (.09) | — | — | 18.58 | 17.93 | 47,935 | 1.83 | .35 | 63 |
July 31, 2013 | 12.48 | .08 | 3.32 | 3.40 | (.04) | (.04) | — | — | 15.84 | 27.35 | 51,200 | 1.89 | .55 | 77 |
July 31, 2012 | 11.79 | .04 | .68 | .72 | (.03) | (.03) | — | —d,e | 12.48 | 6.09 | 52,017 | 1.95 | .38 | 49 |
July 31, 2011 | 10.01 | .01 | 1.77 | 1.78 | — | — | — | —d,f | 11.79 | 17.78 | 66,615 | 1.93 | .12 | 65 |
July 31, 2010 | 9.02 | —d | 1.07 | 1.07 | (.08) | (.08) | —d | — | 10.01 | 11.81 | 82,483 | 2.02 | (.01) | 97 |
Class C | ||||||||||||||
January 31, 2015** | $19.59 | .01 | .53 | .54 | (.08) | (.08) | — | — | $20.05 | 2.72* | $47,265 | .90* | .03* | 23* |
July 31, 2014 | 16.70 | .06 | 2.93 | 2.99 | (.10) | (.10) | — | — | 19.59 | 17.93 | 40,199 | 1.83 | .33 | 63 |
July 31, 2013 | 13.16 | .08 | 3.50 | 3.58 | (.04) | (.04) | — | — | 16.70 | 27.31 | 34,080 | 1.89 | .53 | 77 |
July 31, 2012 | 12.43 | .04 | .72 | .76 | (.03) | (.03) | — | —d,e | 13.16 | 6.14 | 30,509 | 1.95 | .37 | 49 |
July 31, 2011 | 10.56 | .01 | 1.87 | 1.88 | (.01) | (.01) | — | —d,f | 12.43 | 17.76 | 33,041 | 1.93 | .11 | 65 |
July 31, 2010 | 9.53 | —d | 1.11 | 1.11 | (.08) | (.08) | —d | — | 10.56 | 11.67 | 32,969 | 2.02 | (.03) | 97 |
Class M | ||||||||||||||
January 31, 2015** | $19.52 | .03 | .52 | .55 | (.10) | (.10) | — | — | $19.97 | 2.81* | $22,488 | .77* | .16* | 23* |
July 31, 2014 | 16.63 | .11 | 2.91 | 3.02 | (.13) | (.13) | — | — | 19.52 | 18.26 | 22,649 | 1.58 | .59 | 63 |
July 31, 2013 | 13.10 | .11 | 3.50 | 3.61 | (.08) | (.08) | — | — | 16.63 | 27.67 | 20,852 | 1.64 | .78 | 77 |
July 31, 2012 | 12.38 | .08 | .70 | .78 | (.06) | (.06) | — | —d,e | 13.10 | 6.37 | 18,740 | 1.70 | .62 | 49 |
July 31, 2011 | 10.52 | .04 | 1.86 | 1.90 | (.04) | (.04) | — | —d,f | 12.38 | 18.04 | 20,483 | 1.68 | .36 | 65 |
July 31, 2010 | 9.49 | .02 | 1.12 | 1.14 | (.11) | (.11) | —d | — | 10.52 | 11.99 | 20,818 | 1.77 | .22 | 97 |
Class R | ||||||||||||||
January 31, 2015** | $20.39 | .06 | .55 | .61 | (.16) | (.16) | — | — | $20.84 | 2.95* | $4,207 | .65* | .28* | 23* |
July 31, 2014 | 17.37 | .16 | 3.04 | 3.20 | (.18) | (.18) | — | — | 20.39 | 18.53 | 3,641 | 1.33 | .83 | 63 |
July 31, 2013 | 13.68 | .15 | 3.66 | 3.81 | (.12) | (.12) | — | — | 17.37 | 28.03 | 2,871 | 1.39 | 1.00 | 77 |
July 31, 2012 | 12.95 | .11 | .73 | .84 | (.11) | (.11) | — | —d,e | 13.68 | 6.59 | 2,053 | 1.45 | .86 | 49 |
July 31, 2011 | 11.00 | .08 | 1.94 | 2.02 | (.07) | (.07) | — | —d,f | 12.95 | 18.35 | 1,423 | 1.43 | .60 | 65 |
July 31, 2010 | 9.91 | .05 | 1.17 | 1.22 | (.13) | (.13) | —d | — | 11.00 | 12.34 | 1,410 | 1.52 | .46 | 97 |
Class R5 | ||||||||||||||
January 31, 2015** | $21.12 | .13 | .57 | .70 | (.26) | (.26) | — | — | $21.56 | 3.27* | $16 | .37* | .57* | 23* |
July 31, 2014 | 17.97 | .28 | 3.15 | 3.43 | (.28) | (.28) | — | — | 21.12 | 19.21 | 16 | .76 | 1.40 | 63 |
July 31, 2013 | 14.10 | .26 | 3.77 | 4.03 | (.16) | (.16) | — | — | 17.97 | 28.85 | 13 | .76 | 1.64 | 77 �� |
July 31, 2012 † | 13.97 | .01 | .12 | .13 | — | — | — | — | 14.10 | .93* | 10 | .06* | .08* | 49 |
Class R6 | ||||||||||||||
January 31, 2015** | $21.13 | .13 | .58 | .71 | (.28) | (.28) | — | — | $21.56 | 3.32* | $16,485 | .32* | .62* | 23* |
July 31, 2014 | 17.98 | .30 | 3.15 | 3.45 | (.30) | (.30) | — | — | 21.13 | 19.32 | 15,633 | .66 | 1.51 | 63 |
July 31, 2013 | 14.10 | .23g | 3.82 | 4.05 | (.17) | (.17) | — | — | 17.98 | 28.98 | 13,890 | .66 | 1.32g | 77 |
July 31, 2012 † | 13.97 | .01 | .12 | .13 | — | — | — | — | 14.10 | .93* | 10 | .05* | .08* | 49 |
See notes to financial highlights at the end of this section.
30 | Investors Fund | Investors Fund | 31 |
Financial highlights (Continued)
INVESTMENT OPERATIONS: | LESS DISTRIBUTIONS: | RATIOS AND SUPPLEMENTAL DATA: | ||||||||||||
Period ended | Net asset value, beginning of period | Net investment income (loss)a | Net realized and unrealized gain (loss) on investments | Total from investment operations | From | Total | Redemption | Non-recurring reimbursements | Net asset value, end of period | Total return at net asset value (%)b | Net assets, end of period (in thousands) | Ratio of expenses to average net assets (%)c | Ratio of | Portfolio turnover (%) |
Class Y | ||||||||||||||
January 31, 2015** | $21.06 | .12 | .56 | .68 | (.26) | (.26) | — | — | $21.48 | 3.18* | $90,717 | .40* | .53* | 23* |
July 31, 2014 | 17.91 | .26 | 3.14 | 3.40 | (.25) | (.25) | — | — | 21.06 | 19.15 | 65,749 | .83 | 1.33 | 63 |
July 31, 2013 | 14.10 | .24 | 3.76 | 4.00 | (.19) | (.19) | — | — | 17.91 | 28.63 | 50,187 | .89 | 1.54 | 77 |
July 31, 2012 | 13.32 | .18 | .76 | .94 | (.16) | (.16) | — | —d,e | 14.10 | 7.21 | 44,865 | .95 | 1.35 | 49 |
July 31, 2011 | 11.32 | .14 | 1.98 | 2.12 | (.12) | (.12) | — | —d,f | 13.32 | 18.82 | 40,316 | .93 | 1.10 | 65 |
July 31, 2010 | 10.18 | .11 | 1.21 | 1.32 | (.18) | (.18) | —d | — | 11.32 | 12.96 | 33,725 | 1.02 | 1.02 | 97 |
* Not annualized.
** Unaudited.
† For the period July 3, 2012 (commencement of operations) to July 31, 2012.
a Per share net investment income (loss) has been determined on the basis of the weighted average number of shares outstanding during the period.
b Total return assumes dividend reinvestment and does not reflect the effect of sales charges.
c Includes amounts paid through expense offset and/or brokerage/service arrangements, if any (Note 2). Also excludes acquired fund fees and expenses, if any.
d Amount represents less than $0.01 per share.
e Reflects a non-recurring reimbursement pursuant to a settlement between the Securities and Exchange Commission (the SEC) and Southwest Securities, Inc. (SWS) which amounted to less than $0.01 per share outstanding on August 22, 2011.
f Reflects a non-recurring reimbursement related to restitution payments in connection with a distribution plan approved by the SEC which amounted to less than $0.01 per share outstanding on July 21, 2011. Also reflects a non-recurring reimbursement related to short-term trading related lawsuits, which amounted to less than $0.01 per share outstanding on May 11, 2011.
g The net investment income ratio and per share amount shown for the period ending July 31, 2013 may not correspond with the expected class specific differences for the period due to the timing of subscriptions into the class.
The accompanying notes are an integral part of these financial statements.
32 | Investors Fund | Investors Fund | 33 |
Notes to financial statements 1/31/15 (Unaudited)
Within the following Notes to financial statements, references to “State Street” represent State Street Bank and Trust Company, references to “the SEC” represent the Securities and Exchange Commission, references to “Putnam Management” represent Putnam Investment Management, LLC, the fund’s manager, an indirect wholly-owned subsidiary of Putnam Investments, LLC and references to “OTC”, if any, represent over-the-counter. Unless otherwise noted, the “reporting period” represents the period from August 1, 2014 through January 31, 2015.
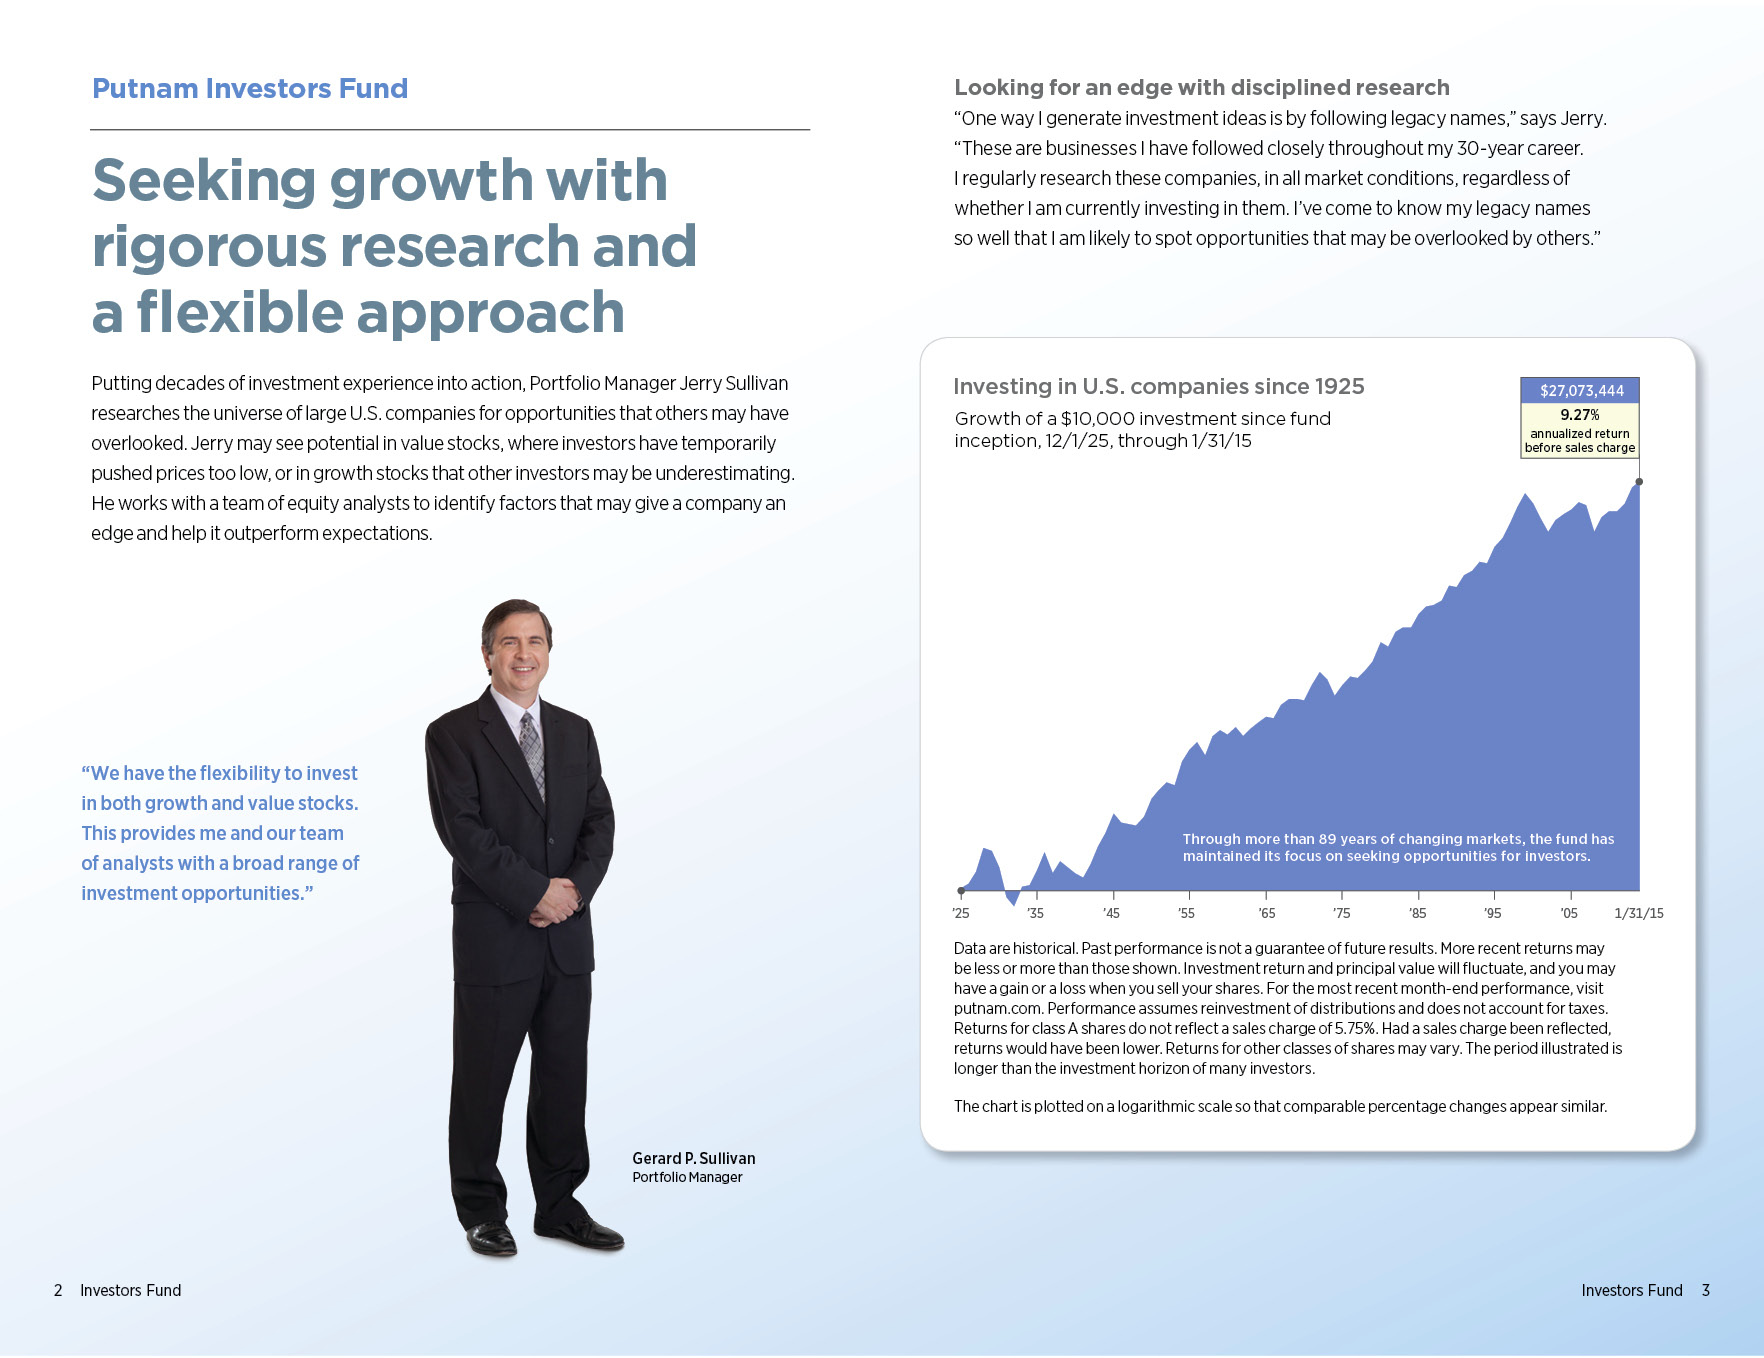
Putnam Investors Fund (the fund) is a Massachusetts business trust, which is registered under the Investment Company Act of 1940, as amended, as a diversified open-end management investment company. The goal of the fund is to seek long-term growth of capital and any increased income that results from this growth. The fund invests mainly in common stocks (growth or value stocks or both) of large U.S. companies that Putnam Management believes have favorable investment potential. For example, the fund may purchase stocks of companies with stock prices that reflect a value lower than that which Putnam Management places on the company. Putnam Management may also consider other factors that Putnam Management believes will cause the stock price to rise and may consider, among other factors, a company’s valuation, financial strength, growth potential, competitive position in its industry, projected future earnings, cash flows and dividends when deciding whether to buy or sell investments.
The fund offers class A, class B, class C, class M, class R, class R5, class R6 and class Y shares. Class A and class M shares are sold with a maximum front-end sales charge of 5.75% and 3.50%, respectively, and generally do not pay a contingent deferred sales charge. Class B shares, which convert to class A shares after approximately eight years, do not pay a front-end sales charge and are subject to a contingent deferred sales charge if those shares are redeemed within six years of purchase. Class C shares have a one-year 1.00% contingent deferred sales charge and do not convert to class A shares. Class R shares, which are not available to all investors, are sold at net asset value. The expenses for class A, class B, class C, class M and class R shares may differ based on the distribution fee of each class, which is identified in Note 2. Class R5, class R6 and class Y shares, which are sold at net asset value, are generally subject to the same expenses as class A, class B, class C, class M and class R shares, but do not bear a distribution fee and in the case of class R5 and class R6 shares, bear a lower investor servicing fee, which is identified in Note 2. Class R5, class R6 and class Y shares are not available to all investors.
In the normal course of business, the fund enters into contracts that may include agreements to indemnify another party under given circumstances. The fund’s maximum exposure under these arrangements is unknown as this would involve future claims that may be, but have not yet been, made against the fund. However, the fund’s management team expects the risk of material loss to be remote.
Note 1: Significant accounting policies
The following is a summary of significant accounting policies consistently followed by the fund in the preparation of its financial statements. The preparation of financial statements is in conformity with accounting principles generally accepted in the United States of America and requires management to make estimates and assumptions that affect the reported amounts of assets and liabilities in the financial statements and the reported amounts of increases and decreases in net assets from operations. Actual results could differ from those estimates. Subsequent events after the Statement of assets and liabilities date through the date that the financial statements were issued have been evaluated in the preparation of the financial statements.
Investment income, realized and unrealized gains and losses and expenses of the fund are borne pro-rata based on the relative net assets of each class to the total net assets of the fund, except that each class bears expenses unique to that class (including the distribution fees applicable to such classes). Each class votes as a class only with respect to its own distribution plan or other matters on which a class vote is required by law or determined by the Trustees. If the fund were liquidated, shares of each class would receive their pro-rata share of the net assets of the fund. In addition, the Trustees declare separate dividends on each class of shares.
Security valuation Portfolio securities and other investments are valued using policies and procedures adopted by the Board of Trustees. The Trustees have formed a Pricing Committee to oversee the implementation of these procedures and has delegated responsibility for valuing the fund’s assets in accordance with these procedures to Putnam Management. Putnam Management has established an internal Valuation Committee that is responsible for making fair value determinations, evaluating the effectiveness of the pricing policies of the fund and reporting to the Pricing Committee.
Investments for which market quotations are readily available are valued at the last reported sales price on their principal exchange, or official closing price for certain markets, and are classified as Level 1 securities under
34 Investors Fund
Accounting Standards Codification 820 Fair Value Measurements and Disclosures (ASC 820). If no sales are reported, as in the case of some securities that are traded OTC, a security is valued at its last reported bid price and is generally categorized as a Level 2 security.
Investments in open-end investment companies (excluding exchange-traded funds), if any, which can be classified as Level 1 or Level 2 securities, are valued based on their net asset value. The net asset value of such investment companies equals the total value of their assets less their liabilities and divided by the number of their outstanding shares.
Many securities markets and exchanges outside the U.S. close prior to the close of the New York Stock Exchange and therefore the closing prices for securities in such markets or on such exchanges may not fully reflect events that occur after such close but before the close of the New York Stock Exchange. Accordingly, on certain days, the fund will fair value foreign equity securities taking into account multiple factors including movements in the U.S. securities markets, currency valuations and comparisons to the valuation of American Depository Receipts, exchange-traded funds and futures contracts. These securities, which would generally be classified as Level 1 securities, will be transferred to Level 2 of the fair value hierarchy when they are valued at fair value. The number of days on which fair value prices will be used will depend on market activity and it is possible that fair value prices will be used by the fund to a significant extent. At the close of the reporting period, fair value pricing was used for certain foreign securities in the portfolio. Securities quoted in foreign currencies, if any, are translated into U.S. dollars at the current exchange rate. Short-term securities with remaining maturities of 60 days or less may be valued at amortized cost, which approximates fair value, and are classified as Level 2 securities.
To the extent a pricing service or dealer is unable to value a security or provides a valuation that Putnam Management does not believe accurately reflects the security’s fair value, the security will be valued at fair value by Putnam Management in accordance with policies and procedures approved by the Trustees. Certain investments, including certain restricted and illiquid securities and derivatives, are also valued at fair value following procedures approved by the Trustees. These valuations consider such factors as significant market or specific security events such as interest rate or credit quality changes, various relationships with other securities, discount rates, U.S. Treasury, U.S. swap and credit yields, index levels, convexity exposures, recovery rates, sales and other multiples and resale restrictions. These securities are classified as Level 2 or as Level 3 depending on the priority of the significant inputs.
To assess the continuing appropriateness of fair valuations, the Valuation Committee reviews and affirms the reasonableness of such valuations on a regular basis after considering all relevant information that is reasonably available. Such valuations and procedures are reviewed periodically by the Trustees. The fair value of securities is generally determined as the amount that the fund could reasonably expect to realize from an orderly disposition of such securities over a reasonable period of time. By its nature, a fair value price is a good faith estimate of the value of a security in a current sale and does not reflect an actual market price, which may be different by a material amount.
Security transactions and related investment income Security transactions are recorded on the trade date (the date the order to buy or sell is executed). Gains or losses on securities sold are determined on the identified cost basis.
Interest income, net of any applicable withholding taxes, is recorded on the accrual basis. Dividend income, net of any applicable withholding taxes, is recognized on the ex-dividend date except that certain dividends from foreign securities, if any, are recognized as soon as the fund is informed of the ex-dividend date. Non-cash dividends, if any, are recorded at the fair value of the securities received. Dividends representing a return of capital or capital gains, if any, are reflected as a reduction of cost and/or as a realized gain.
Foreign currency translation The accounting records of the fund are maintained in U.S. dollars. The fair value of foreign securities, currency holdings, and other assets and liabilities is recorded in the books and records of the fund after translation to U.S. dollars based on the exchange rates on that day. The cost of each security is determined using historical exchange rates. Income and withholding taxes are translated at prevailing exchange rates when earned or incurred. The fund does not isolate that portion of realized or unrealized gains or losses resulting from changes in the foreign exchange rate on investments from fluctuations arising from changes in the market prices of the securities. Such gains and losses are included with the net realized and unrealized gain or loss on investments. Net realized gains and losses on foreign currency transactions represent net realized exchange gains or losses on closed forward currency contracts, disposition of foreign currencies, currency gains and losses realized between the trade and settlement dates on securities transactions and the difference between the amount of investment income and foreign withholding taxes recorded on the fund’s books and the U.S. dollar equivalent amounts actually received or paid. Net unrealized appreciation and depreciation of assets and liabilities in foreign
Investors Fund 35
currencies arise from changes in the value of open forward currency contracts and assets and liabilities other than investments at the period end, resulting from changes in the exchange rate.
Securities lending The fund may lend securities, through its agent, to qualified borrowers in order to earn additional income. The loans are collateralized by cash in an amount at least equal to the fair value of the securities loaned. The fair value of securities loaned is determined daily and any additional required collateral is allocated to the fund on the next business day. The risk of borrower default will be borne by the fund’s agent; the fund will bear the risk of loss with respect to the investment of the cash collateral. Income from securities lending is included in investment income on the Statement of operations. Cash collateral is invested in Putnam Cash Collateral Pool, LLC, a limited liability company managed by an affiliate of Putnam Management. Investments in Putnam Cash Collateral Pool, LLC are valued at its closing net asset value each business day. There are no management fees charged to Putnam Cash Collateral Pool, LLC. At the close of the reporting period, the fund received cash collateral of $86,637,528 and the value of securities loaned amounted to $83,507,108.
Interfund lending The fund, along with other Putnam funds, may participate in an interfund lending program pursuant to an exemptive order issued by the SEC. This program allows the fund to borrow from or lend to other Putnam funds that permit such transactions. Interfund lending transactions are subject to each fund’s investment policies and borrowing and lending limits. Interest earned or paid on the interfund lending transaction will be based on the average of certain current market rates. During the reporting period, the fund did not utilize the program.
Lines of credit The fund participates, along with other Putnam funds, in a $392.5 million unsecured committed line of credit and a $235.5 million unsecured uncommitted line of credit, both provided by State Street. Borrowings may be made for temporary or emergency purposes, including the funding of shareholder redemption requests and trade settlements. Interest is charged to the fund based on the fund’s borrowing at a rate equal to the Federal Funds rate plus 1.25% for the committed line of credit and the Federal Funds rate plus 1.30% for the uncommitted line of credit. A closing fee equal to 0.04% of the committed line of credit and 0.04% of the uncommitted line of credit has been paid by the participating funds. In addition, a commitment fee of 0.11% per annum on any unutilized portion of the committed line of credit is allocated to the participating funds based on their relative net assets and paid quarterly. During the reporting period, the fund had no borrowings against these arrangements.
Federal taxes It is the policy of the fund to distribute all of its taxable income within the prescribed time period and otherwise comply with the provisions of the Internal Revenue Code of 1986, as amended (the Code), applicable to regulated investment companies. It is also the intention of the fund to distribute an amount sufficient to avoid imposition of any excise tax under Section 4982 of the Code.
The fund is subject to the provisions of Accounting Standards Codification 740 Income Taxes (ASC 740). ASC 740 sets forth a minimum threshold for financial statement recognition of the benefit of a tax position taken or expected to be taken in a tax return. The fund did not have a liability to record for any unrecognized tax benefits in the accompanying financial statements. No provision has been made for federal taxes on income, capital gains or unrealized appreciation on securities held nor for excise tax on income and capital gains. Each of the fund’s federal tax returns for the prior three fiscal years remains subject to examination by the Internal Revenue Service.
The fund may also be subject to taxes imposed by governments of countries in which it invests. Such taxes are generally based on either income or gains earned or repatriated. The fund accrues and applies such taxes to net investment income, net realized gains and net unrealized gains as income and/or capital gains are earned. In some cases, the fund may be entitled to reclaim all or a portion of such taxes, and such reclaim amounts, if any, are reflected as an asset on the fund’s books. In many cases, however, the fund may not receive such amounts for an extended period of time, depending on the country of investment.
At July 31, 2014, the fund had a capital loss carryover of $584,628,143 available to the extent allowed by the Code to offset future net capital gain, if any. The amounts of the carryovers and the expiration dates are:
Loss carryover | |||
Short-term | Long-term | Total | Expiration |
$4,191,893 | N/A | $4,191,893 | July 31, 2015 |
24,339,890 | N/A | 24,339,890 | July 31, 2016 |
297,455,620 | N/A | 297,455,620 | July 31, 2017 |
258,640,740 | N/A | 258,640,740 | July 31, 2018 |
36 Investors Fund
Under the Regulated Investment Company Modernization Act of 2010, the fund will be permitted to carry forward capital losses incurred in taxable years beginning after December 22, 2010 for an unlimited period. However, any losses incurred will be required to be utilized prior to the losses incurred in pre-enactment tax years. As a result of this ordering rule, pre-enactment capital loss carryforwards may be more likely to expire unused. Additionally, post-enactment capital losses that are carried forward will retain their character as either short-term or long-term capital losses rather than being considered all short-term as under previous law.
The aggregate identified cost on a tax basis is $1,547,727,374, resulting in gross unrealized appreciation and depreciation of $390,389,483 and $81,570,166, respectively, or net unrealized appreciation of $308,819,317.
Distributions to shareholders Distributions to shareholders from net investment income are recorded by the fund on the ex-dividend date. Distributions from capital gains, if any, are recorded on the ex-dividend date and paid at least annually. The amount and character of income and gains to be distributed are determined in accordance with income tax regulations, which may differ from generally accepted accounting principles. Dividend sources are estimated at the time of declaration. Actual results may vary. Any non-taxable return of capital cannot be determined until final tax calculations are completed after the end of the fund’s fiscal year. Reclassifications are made to the fund’s capital accounts to reflect income and gains available for distribution (or available capital loss carryovers) under income tax regulations.
Note 2: Management fee, administrative services and other transactions
The fund pays Putnam Management a management fee (based on the fund’s average net assets and computed and paid monthly) at annual rates that may vary based on the average of the aggregate net assets of most open-end funds, as defined in the fund’s management contract, sponsored by Putnam Management. Such annual rates may vary as follows:
0.710% | of the first $5 billion, |
0.660% | of the next $5 billion, |
0.610% | of the next $10 billion, |
0.560% | of the next $10 billion, |
0.510% | of the next $50 billion, |
0.490% | of the next $50 billion, |
0.480% | of the next $100 billion and |
0.475% | of any excess thereafter. |
Putnam Management has contractually agreed, through June 30, 2015, to waive fees or reimburse the fund’s expenses to the extent necessary to limit the cumulative expenses of the fund, exclusive of brokerage, interest, taxes, investment-related expenses, extraordinary expenses, acquired fund fees and expenses and payments under the fund’s investor servicing contract, investment management contract and distribution plans, on a fiscal year-to-date basis to an annual rate of 0.20% of the fund’s average net assets over such fiscal year-to-date period. During the reporting period, the fund’s expenses were not reduced as a result of this limit.
Putnam Investments Limited (PIL), an affiliate of Putnam Management, is authorized by the Trustees to manage a separate portion of the assets of the fund as determined by Putnam Management from time to time. Putnam Management pays a quarterly sub-management fee to PIL for its services at an annual rate of 0.35% of the average net assets of the portion of the fund managed by PIL.
The fund reimburses Putnam Management an allocated amount for the compensation and related expenses of certain officers of the fund and their staff who provide administrative services to the fund. The aggregate amount of all such reimbursements is determined annually by the Trustees.
Custodial functions for the fund’s assets are provided by State Street. Custody fees are based on the fund’s asset level, the number of its security holdings and transaction volumes.
Putnam Investor Services, Inc., an affiliate of Putnam Management, provides investor servicing agent functions to the fund. Putnam Investor Services, Inc. received fees for investor servicing (except for class R5 and R6 shares) based on the fund’s retail asset level, the number of shareholder accounts in the fund and the level of defined contribution plan assets in the fund. Class R5 shares pay a monthly fee based on the average net assets of class R5 shares at an annual rate of 0.15%. Class R6 shares pay a monthly fee based on the average net assets of class R6 shares at an annual rate of 0.05%. Investor servicing fees will not exceed an annual rate of 0.32% of the fund’s
Investors Fund 37
average net assets. During the reporting period, the expenses for each class of shares related to investor servicing fees were as follows:
Class A | $1,548,924 |
Class B | 47,302 |
Class C | 44,059 |
Class M | 23,056 |
Class R | 4,048 |
Class R5 | 12 |
Class R6 | 4,095 |
Class Y | 83,611 |
Total | $1,755,107 |
The fund has entered into expense offset arrangements with Putnam Investor Services, Inc. and State Street whereby Putnam Investor Services, Inc.’s and State Street’s fees are reduced by credits allowed on cash balances. The fund also reduced expenses through brokerage/service arrangements. For the reporting period, the fund’s expenses were reduced by $1,651 under the expense offset arrangements and by $14,488 under the brokerage/service arrangements.
Each Independent Trustee of the fund receives an annual Trustee fee, of which $1,023, as a quarterly retainer, has been allocated to the fund, and an additional fee for each Trustees meeting attended. Trustees also are reimbursed for expenses they incur relating to their services as Trustees.
The fund has adopted a Trustee Fee Deferral Plan (the Deferral Plan) which allows the Trustees to defer the receipt of all or a portion of Trustees fees payable on or after July 1, 1995. The deferred fees remain invested in certain Putnam funds until distribution in accordance with the Deferral Plan.
The fund has adopted an unfunded noncontributory defined benefit pension plan (the Pension Plan) covering all Trustees of the fund who have served as a Trustee for at least five years and were first elected prior to 2004. Benefits under the Pension Plan are equal to 50% of the Trustee’s average annual attendance and retainer fees for the three years ended December 31, 2005. The retirement benefit is payable during a Trustee’s lifetime, beginning the year following retirement, for the number of years of service through December 31, 2006. Pension expense for the fund is included in Trustee compensation and expenses in the Statement of operations. Accrued pension liability is included in Payable for Trustee compensation and expenses in the Statement of assets and liabilities. The Trustees have terminated the Pension Plan with respect to any Trustee first elected after 2003.
The fund has adopted distribution plans (the Plans) with respect to its class A, class B, class C, class M and class R shares pursuant to Rule 12b–1 under the Investment Company Act of 1940. The purpose of the Plans is to compensate Putnam Retail Management Limited Partnership, an indirect wholly-owned subsidiary of Putnam Investments, LLC, for services provided and expenses incurred in distributing shares of the fund. The Plans provide for payments by the fund to Putnam Retail Management Limited Partnership at an annual rate of up to 0.35%, 1.00%, 1.00%, 1.00% and 1.00% of the average net assets attributable to class A, class B, class C, class M and class R shares, respectively. The Trustees have approved payment by the fund at an annual rate of 0.25%, 1.00%, 1.00%, 0.75% and 0.50% of the average net assets attributable to class A, class B, class C, class M and class R shares, respectively. During the reporting period, the class specific expenses related to distribution fees were as follows:
Class A | $1,956,588 |
Class B | 239,087 |
Class C | 222,893 |
Class M | 87,410 |
Class R | 10,223 |
Total | $2,516,201 |
For the reporting period, Putnam Retail Management Limited Partnership, acting as underwriter, received net commissions of $64,694 and $2,267 from the sale of class A and class M shares, respectively, and received $11,980 and $638 in contingent deferred sales charges from redemptions of class B and class C shares, respectively.
A deferred sales charge of up to 1.00% and 0.65% is assessed on certain redemptions of class A and class M shares, respectively. For the reporting period, Putnam Retail Management Limited Partnership, acting as underwriter, received no monies on class A and class M redemptions.
38 Investors Fund
Note 3: Purchases and sales of securities
During the reporting period, cost of purchases and proceeds from sales, excluding short-term investments were as follows:
Cost of purchases | Proceeds from sales | |
Investments in securities (Long-term) | $430,914,656 | $410,894,312 |
U.S. government securities (Long-term) | — | — |
Total | $430,914,656 | $410,894,312 |
Note 4: Capital shares
At the close of the reporting period, there were an unlimited number of shares of beneficial interest authorized. Transactions in capital shares were as follows:
Six months ended 1/31/15 | Year ended 7/31/14 | |||
Class A | Shares | Amount | Shares | Amount |
Shares sold | 3,100,848 | $66,423,362 | 2,713,783 | $52,508,388 |
Shares issued in connection with reinvestment of distributions | 595,843 | 13,156,258 | 775,256 | 14,652,339 |
3,696,691 | 79,579,620 | 3,489,039 | 67,160,727 | |
Shares repurchased | (3,812,711) | (81,769,058) | (8,096,374) | (156,278,695) |
Net decrease | (116,020) | $(2,189,438) | (4,607,335) | $(89,117,968) |
Six months ended 1/31/15 | Year ended 7/31/14 | |||
Class B | Shares | Amount | Shares | Amount |
Shares sold | 136,065 | $2,621,393 | 206,569 | $3,543,783 |
Shares issued in connection with reinvestment of distributions | 6,208 | 123,296 | 15,642 | 266,227 |
142,273 | 2,744,689 | 222,211 | 3,810,010 | |
Shares repurchased | (333,475) | (6,385,721) | (874,894) | (15,061,763) |
Net decrease | (191,202) | $(3,641,032) | (652,683) | $(11,251,753) |
Six months ended 1/31/15 | Year ended 7/31/14 | |||
Class C | Shares | Amount | Shares | Amount |
Shares sold | 407,116 | $8,263,012 | 236,564 | $4,356,831 |
Shares issued in connection with reinvestment of distributions | 7,367 | 154,201 | 9,943 | 178,478 |
414,483 | 8,417,213 | 246,507 | 4,535,309 | |
Shares repurchased | (108,184) | (2,187,941) | (235,306) | (4,312,507) |
Net increase | 306,299 | $6,229,272 | 11,201 | $222,802 |
Six months ended 1/31/15 | Year ended 7/31/14 | |||
Class M | Shares | Amount | Shares | Amount |
Shares sold | 24,660 | $494,370 | 36,892 | $665,650 |
Shares issued in connection with reinvestment of distributions | 5,419 | 112,922 | 8,848 | 157,943 |
30,079 | 607,292 | 45,740 | 823,593 | |
Shares repurchased | (64,338) | (1,301,366) | (139,014) | (2,508,628) |
Net decrease | (34,259) | $(694,074) | (93,274) | $(1,685,035) |
Investors Fund 39
Six months ended 1/31/15 | Year ended 7/31/14 | |||
Class R | Shares | Amount | Shares | Amount |
Shares sold | 48,512 | $1,010,986 | 44,837 | $841,475 |
Shares issued in connection with reinvestment of distributions | 1,247 | 27,108 | 1,621 | 30,160 |
49,759 | 1,038,094 | 46,458 | 871,635 | |
Shares repurchased | (26,474) | (569,338) | (33,161) | (631,564) |
Net increase | 23,285 | $468,756 | 13,297 | $240,071 |
Six months ended 1/31/15 | Year ended 7/31/14 | |||
Class R5 | Shares | Amount | Shares | Amount |
Shares sold | — | $— | — | $— |
Shares issued in connection with reinvestment of distributions | 9 | 192 | 10 | 199 |
9 | 192 | 10 | 199 | |
Shares repurchased | — | — | — | — |
Net increase | 9 | $192 | 10 | $199 |
Six months ended 1/31/15 | Year ended 7/31/14 | |||
Class R6 | Shares | Amount | Shares | Amount |
Shares sold | 43,030 | $935,062 | 38,648 | $768,128 |
Shares issued in connection with reinvestment of distributions | 9,400 | 211,123 | 11,334 | 217,723 |
52,430 | 1,146,185 | 49,982 | 985,851 | |
Shares repurchased | (27,390) | (598,191) | (82,748) | (1,591,785) |
Net increase (decrease) | 25,040 | $547,994 | (32,766) | $(605,934) |
Six months ended 1/31/15 | Year ended 7/31/14 | |||
Class Y | Shares | Amount | Shares | Amount |
Shares sold | 1,858,631 | $40,619,953 | 652,398 | $12,996,720 |
Shares issued in connection with reinvestment of distributions | 47,316 | 1,059,403 | 36,575 | 700,770 |
1,905,947 | 41,679,356 | 688,973 | 13,697,490 | |
Shares repurchased | (805,277) | (17,486,122) | (368,796) | (7,192,503) |
Net increase | 1,100,670 | $24,193,234 | 320,177 | $6,504,987 |
At the close of the reporting period, Putnam Investments, LLC owned the following shares of the fund:
Shares owned | Percentage of ownership | Value | |
Class R5 | 743 | 100.00% | $16,013 |
Class R6 | 744 | 0.10 | 16,041 |
40 Investors Fund
Note 5: Affiliated transactions
Transactions during the reporting period with Putnam Short Term Investment Fund, which is under common ownership and control, were as follows:
Name of affiliate | Fair value at the beginning of the reporting period | Purchase cost | Sale proceeds | Investment income | Fair value at the end of the reporting period |
Putnam Short Term Investment Fund* | $6,519,342 | $119,699,129 | $105,889,437 | $4,878 | $20,329,034 |
*Management fees charged to Putnam Short Term Investment Fund have been waived by Putnam Management.
Note 6: Market, credit and other risks
In the normal course of business, the fund trades financial instruments and enters into financial transactions where risk of potential loss exists due to changes in the market (market risk) or failure of the contracting party to the transaction to perform (credit risk). The fund may be exposed to additional credit risk that an institution or other entity with which the fund has unsettled or open transactions will default. Investments in foreign securities involve certain risks, including those related to economic instability, unfavorable political developments, and currency fluctuations.
Investors Fund 41
Putnam family of funds
The following is a list of Putnam’s open-end mutual funds offered to the public. Investors should carefully consider the investment objective, risks, charges, and expenses of a fund before investing. For a prospectus, or a summary prospectus if available, containing this and other information for any Putnam fund or product, contact your financial advisor or call Putnam Investor Services at 1-800-225-1581. Please read the prospectus carefully before investing.
Growth
Growth Opportunities Fund
International Growth Fund
Multi-Cap Growth Fund
Small Cap Growth Fund
Voyager Fund
Blend
Asia Pacific Equity Fund
Capital Opportunities Fund
Capital Spectrum Fund
Emerging Markets Equity Fund
Equity Spectrum Fund
Europe Equity Fund
Global Equity Fund
International Capital Opportunities Fund
International Equity Fund
Investors Fund
Low Volatility Equity Fund
Multi-Cap Core Fund
Research Fund
Strategic Volatility Equity Fund
Value
Convertible Securities Fund
Equity Income Fund
Global Dividend Fund
The Putnam Fund for Growth and Income
International Value Fund
Multi-Cap Value Fund
Small Cap Value Fund
Income
American Government Income Fund
Diversified Income Trust
Emerging Markets Income Fund
Floating Rate Income Fund
Global Income Trust
High Yield Advantage Fund
High Yield Trust
Income Fund
Money Market Fund*
Short Duration Income Fund
U.S. Government Income Trust
Tax-free Income
AMT-Free Municipal Fund
Intermediate-Term Municipal Income Fund
Short-Term Municipal Income Fund
Tax Exempt Income Fund
Tax Exempt Money Market Fund*
Tax-Free High Yield Fund
State tax-free income funds†:
Arizona, California, Massachusetts, Michigan, Minnesota, New Jersey, New York, Ohio, and Pennsylvania.
* An investment in a money market fund is not insured or guaranteed by the Federal Deposit Insurance Corporation or any other government agency. Although the fund seeks to preserve the value of your investment at $1.00 per share, it is possible to lose money by investing in the fund.
† Not available in all states.
42 Investors Fund
Absolute Return
Absolute Return 100 Fund®
Absolute Return 300 Fund®
Absolute Return 500 Fund®
Absolute Return 700 Fund®
Global Sector
Global Consumer Fund
Global Energy Fund
Global Financials Fund
Global Health Care Fund
Global Industrials Fund
Global Natural Resources Fund
Global Sector Fund
Global Technology Fund
Global Telecommunications Fund
Global Utilities Fund
Asset Allocation
George Putnam Balanced Fund
Global Asset Allocation Funds — four investment portfolios that spread your money across a variety of stocks, bonds, and money market instruments.
Dynamic Asset Allocation Balanced Fund
Dynamic Asset Allocation Conservative Fund
Dynamic Asset Allocation Growth Fund
Dynamic Risk Allocation Fund
Retirement Income Lifestyle Funds — portfolios with managed allocations to stocks, bonds, and money market investments to generate retirement income.
Retirement Income Fund Lifestyle 1
Retirement Income Fund Lifestyle 2
Retirement Income Fund Lifestyle 3
RetirementReady® Funds — portfolios with adjusting allocations to stocks, bonds, and money market instruments, becoming more conservative over time.
RetirementReady® 2055 Fund
RetirementReady® 2050 Fund
RetirementReady® 2045 Fund
RetirementReady® 2040 Fund
RetirementReady® 2035 Fund
RetirementReady® 2030 Fund
RetirementReady® 2025 Fund
RetirementReady® 2020 Fund
RetirementReady® 2015 Fund
Check your account balances and the most recent month-end performance in the Individual Investors section at putnam.com.
Investors Fund 43
Services for shareholders
Investor services
Systematic investment plan Tell us how much you wish to invest regularly — weekly, semimonthly, or monthly — and the amount you choose will be transferred automatically from your checking or savings account. There’s no additional fee for this service, and you can suspend it at any time. This plan may be a great way to save for college expenses or to plan for your retirement.
Please note that regular investing does not guarantee a profit or protect against loss in a declining market. Before arranging a systematic investment plan, consider your financial ability to continue making purchases in periods when prices are low.
Systematic exchange You can make regular transfers from one Putnam fund to another Putnam fund. There are no additional fees for this service, and you can cancel or change your options at any time.
Dividends PLUS You can choose to have the dividend distributions from one of your Putnam funds automatically reinvested in another Putnam fund at no additional charge.
Free exchange privilege You can exchange money between Putnam funds free of charge, as long as they are the same class of shares. A signature guarantee is required if you are exchanging more than $500,000. The fund reserves the right to revise or terminate the exchange privilege.
Reinstatement privilege If you’ve sold Putnam shares or received a check for a dividend or capital gain, you may reinvest the proceeds with Putnam within 90 days of the transaction and they will be reinvested at the fund’s current net asset value — with no sales charge. However, reinstatement of class B shares may have special tax consequences. Ask your financial or tax representative for details.
Check-writing service You have ready access to many Putnam accounts. It’s as simple as writing a check, and there are no special fees or service charges. For more information about the check-writing service, call Putnam or visit our website.
Dollar cost averaging When you’re investing for long-term goals, it’s time, not timing, that counts. Investing on a systematic basis is a better strategy than trying to figure out when the markets will go up or down. This means investing the same amount of money regularly over a long period. This method of investing is called dollar cost averaging. When a fund’s share price declines, your investment dollars buy more shares at lower prices. When it increases, they buy fewer shares. Over time, you will pay a lower average price per share.
For more information
Visit the Individual Investors section at putnam.com A secure section of our website contains complete information on your account, including balances and transactions, updated daily. You may also conduct transactions, such as exchanges, additional investments, and address changes. Log on today to get your password.
Call us toll free at 1-800-225-1581 Ask a helpful Putnam representative or your financial advisor for details about any of these or other services, or see your prospectus.
44 Investors Fund
Fund information
Founded over 75 years ago, Putnam Investments was built around the concept that a balance between risk and reward is the hallmark of a well-rounded financial program. We manage over 100 funds across income, value, blend, growth, asset allocation, absolute return, and global sector categories.
Investment Manager
Putnam Investment
Management, LLC
One Post Office Square
Boston, MA 02109
Investment Sub-Manager
Putnam Investments Limited
57–59 St James’s Street
London, England SW1A 1LD
Marketing Services
Putnam Retail Management
One Post Office Square
Boston, MA 02109
Custodian
State Street Bank
and Trust Company
Legal Counsel
Ropes & Gray LLP
Trustees
Jameson A. Baxter, Chair
Liaquat Ahamed
Ravi Akhoury
Barbara M. Baumann
Charles B. Curtis
Robert J. Darretta
Katinka Domotorffy
John A. Hill
Paul L. Joskow
Kenneth R. Leibler
Robert E. Patterson
George Putnam, III
Robert L. Reynolds
W. Thomas Stephens
Officers
Robert L. Reynolds
President
Jonathan S. Horwitz
Executive Vice President,
Principal Executive Officer, and
Compliance Liaison
Steven D. Krichmar
Vice President and
Principal Financial Officer
Robert T. Burns
Vice President and
Chief Legal Officer
Robert R. Leveille
Vice President and
Chief Compliance Officer
Michael J. Higgins
Vice President, Treasurer,
and Clerk
Janet C. Smith
Vice President,
Principal Accounting Officer,
and Assistant Treasurer
Susan G. Malloy
Vice President and
Assistant Treasurer
James P. Pappas
Vice President
Mark C. Trenchard
Vice President and
BSA Compliance Officer
Nancy E. Florek
Vice President, Director of
Proxy Voting and Corporate
Governance, Assistant Clerk,
and Associate Treasurer
This report is for the information of shareholders of Putnam Investors Fund. It may also be used as sales literature when preceded or accompanied by the current prospectus, the most recent copy of Putnam’s Quarterly Performance Summary, and Putnam’s Quarterly Ranking Summary. For more recent performance, please visit putnam.com. Investors should carefully consider the investment objectives, risks, charges, and expenses of a fund, which are described in its prospectus. For this and other information or to request a prospectus or summary prospectus, call 1-800-225-1581 toll free. Please read the prospectus carefully before investing. The fund’s Statement of Additional Information contains additional information about the fund’s Trustees and is available without charge upon request by calling 1-800-225-1581.
Item 2. Code of Ethics: |
Not applicable |
Item 3. Audit Committee Financial Expert: |
Not applicable |
Item 4. Principal Accountant Fees and Services: |
Not applicable |
Item 5. Audit Committee of Listed Registrants |
Not applicable |
Item 6. Schedule of Investments: |
The registrant’s schedule of investments in unaffiliated issuers is included in the report to shareholders in Item 1 above. |
Item 7. Disclosure of Proxy Voting Policies and Procedures For Closed-End Management Investment Companies: |
Not applicable |
Item 8. Portfolio Managers of Closed-End Investment Companies |
Not Applicable |
Item 9. Purchases of Equity Securities by Closed-End Management Investment Companies and Affiliated Purchasers: |
Not applicable |
Item 10. Submission of Matters to a Vote of Security Holders: |
Not applicable |
Item 11. Controls and Procedures: |
(a) The registrant’s principal executive officer and principal financial officer have concluded, based on their evaluation of the effectiveness of the design and operation of the registrant’s disclosure controls and procedures as of a date within 90 days of the filing date of this report, that the design and operation of such procedures are generally effective to provide reasonable assurance that information required to be disclosed by the registrant in this report is recorded, processed, summarized and reported within the time periods specified in the Commission’s rules and forms. |
(b) Changes in internal control over financial reporting: Not applicable |
Item 12. Exhibits: |
(a)(1) Not applicable |
(a)(2) Separate certifications for the principal executive officer and principal financial officer of the registrant as required by Rule 30a-2(a) under the Investment Company Act of 1940, as amended, are filed herewith. |
(b) The certifications required by Rule 30a-2(b) under the Investment Company Act of 1940, as amended, are filed herewith. |
Putnam Investors Fund |
By (Signature and Title): |
/s/ Janet C. Smith Janet C. Smith Principal Accounting Officer |
Date: March 31, 2015 |
Pursuant to the requirements of the Securities Exchange Act of 1934 and the Investment Company Act of 1940, this report has been signed below by the following persons on behalf of the registrant and in the capacities and on the dates indicated. |
By (Signature and Title): |
/s/ Jonathan S. Horwitz Jonathan S. Horwitz Principal Executive Officer |
Date: March 31, 2015 |
By (Signature and Title): |
/s/ Steven D. Krichmar Steven D. Krichmar Principal Financial Officer |
Date: March 31, 2015 |