| | |
| UNITED STATES
SECURITIES AND EXCHANGE COMMISSION |
| | |
| CERTIFIED SHAREHOLDER REPORT OF REGISTERED
MANAGEMENT INVESTMENT COMPANIES
|
| | |
| Investment Company Act file number: | (811-00159) |
| | |
| Exact name of registrant as specified in charter: | Putnam Investors Fund |
| | |
| Address of principal executive offices: | One Post Office Square, Boston, Massachusetts 02109 |
| | |
| Name and address of agent for service: | Robert T. Burns, Vice President
One Post Office Square
Boston, Massachusetts 02109 |
| | |
| Copy to: | Bryan Chegwidden, Esq.
Ropes & Gray LLP
1211 Avenue of the Americas
New York, New York 10036 |
| | |
| Registrant's telephone number, including area code: | (617) 292-1000 |
| | |
| Date of fiscal year end: | July 31, 2016 |
| | |
| Date of reporting period: | August 1, 2015 — January 31, 2016 |
| | |
|
Item 1. Report to Stockholders: | |
| | |
| The following is a copy of the report transmitted to stockholders pursuant to Rule 30e-1 under the Investment Company Act of 1940: | |
Putnam
Investors
Fund
Semiannual report
1 | 31 | 16
| | | |
| Message from the Trustees | 1 | | |
| | |
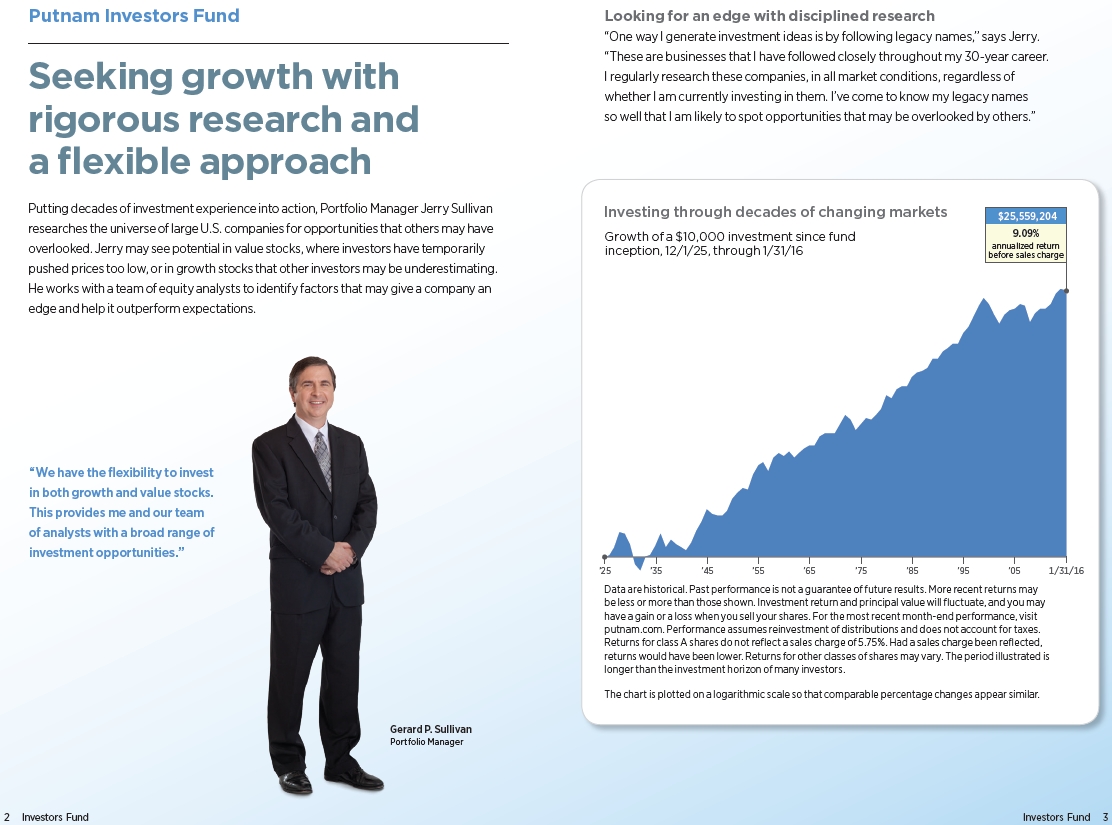
| About the fund | 2 | | |
| | |
| Performance snapshot | 4 | | |
| | |
| Interview with your fund’s portfolio manager | 5 | | |
| | |
| Your fund’s performance | 10 | | |
| | |
| Your fund’s expenses | 12 | | |
| | |
| Terms and definitions | 14 | | |
| | |
| Other information for shareholders | 15 | | |
| | |
| Financial statements | 16 | | |
| | |
Consider these risks before investing: Growth stocks may be more susceptible to earnings disappointments, and value stocks may fail to rebound. Stock prices may fall or fail to rise over time for several reasons, including general financial market conditions and factors related to a specific issuer or industry. You can lose money by investing in the fund.
Message from the Trustees
Dear Fellow Shareholder:
In markets around the world, 2016 began with a sharp downturn, driven mainly by fears of weak global growth. Equity and fixed-income markets are again showing some of the negative trends seen during late summer of 2015. Generally speaking, only high-quality bonds appear to be weathering the storm. Of course, as in any downturn, attractive valuation opportunities may be emerging.
While economic growth may be muted in many parts of the world, notably in China and in emerging markets, the U.S. economy appears to be among the more resilient. The unemployment rate has fallen below 5%, with some signs of moderate wage growth and solid housing market conditions. Low energy prices, while a negative for energy companies, mean more money in consumers’ pockets, helping to buoy consumption. Moreover, divergent economic policies among central banks around the globe may create potential opportunities for capturing growth.
Although no one can predict where markets will head going forward, Putnam’s experienced portfolio managers are actively seeking fundamental insights to maneuver in all types of conditions, relying on a proprietary global research framework to help guide their investment decisions. The interview on the following pages provides an overview of your fund’s performance for the reporting period ended January 31, 2016, as well as an outlook for the coming months.
For questions on market turbulence, it may be helpful for you to consult your financial advisor to ensure that your portfolio is aligned with your investment goals, time horizon, and risk tolerance.
As always, thank you for investing with Putnam.

Current performance may be lower or higher than the quoted past performance, which cannot guarantee future results. Share price, principal value, and return will fluctuate, and you may have a gain or a loss when you sell your shares. Performance of class A shares assumes reinvestment of distributions and does not account for taxes. Fund returns in the bar chart do not reflect a sales charge of 5.75%; had they, returns would have been lower. See pages 3, 5, and 10–12 for additional performance information. For a portion of the periods, the fund had expense limitations, without which returns would have been lower. To obtain the most recent month-end performance, visit putnam.com.
* The fund’s benchmark and Lipper category, the S&P 500 Index and Lipper Large-Cap Core Funds category, were introduced on 3/4/57 and 12/31/59, respectively, which post-date the inception of the fund’s class A shares.
† Returns for the six-month period are not annualized, but cumulative.
Interview with your fund’s portfolio manager

Jerry, how would you describe conditions for stock market investors during the six-month reporting period?
The period began in August 2015 — a month that marked a turning point for U.S. stock performance. After a rather uneventful first half of 2015, in which stock returns were flat to modestly positive, the market’s multi-quarter advance came to a sudden halt with significant declines. The turbulence peaked in late August with some of the biggest swings in the history of the market, including a historic 1,000-point intraday plunge for the Dow Jones Industrial Average on August 24. For the first time since 2011, major U.S. stock market indexes experienced a correction, defined as a decline of 10% or more from a recent high.
The August downturn was due in large part to concerns about an economic slowdown in China, the world’s second-largest economy and a key driver of growth across world markets. Stocks recovered from their August lows, and the U.S. market delivered its strongest October return in four years. Although stocks continued to advance through the close of the year, markets remained unsettled, and 2015 became the weakest year for U.S. stock performance since the 2008 global financial crisis. Conditions certainly didn’t improve with the start of 2016. Volatility and investor anxiety escalated dramatically in the final
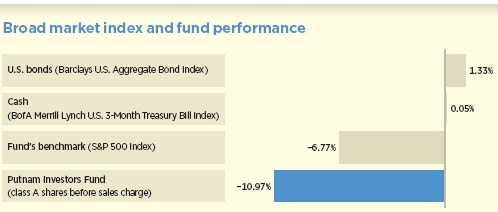
This comparison shows your fund’s performance in the context of broad market indexes for the six months ended 1/31/16. See pages 3–4 and 10–12 for additional fund performance information. Index descriptions can be found on page 14.
month of the reporting period, and the S&P 500 Index, a common measure of U.S. stock market performance, posted one of its worst-ever January losses, declining 5.07% for the month.
How did the fund perform for the period?
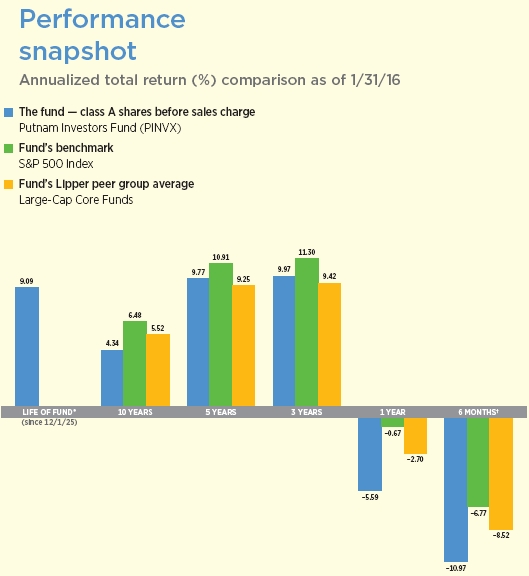
It was a challenging six months for the fund, which returned –10.97%. The fund underperformed its benchmark, the S&P 500 Index, which returned –6.77%, and the average return of –8.52% for funds in its Lipper peer group, Large-Cap Core Funds.
Could you discuss some stocks or strategies that detracted from returns relative to the benchmark?
The top detractor from performance for the period was AMAG Pharmaceuticals, a drug company specializing in maternal health, anemia, and cancer supportive care. The stock declined as investors became concerned about competitive pressure on one of AMAG’s products, Makena, a drug designed to prevent preterm birth.
Also detracting from performance were stocks of businesses that are directly influenced by the price of oil, including NRG Energy, a provider of energy products and services in power markets in the United States. Sharp declines in oil prices continued to challenge financial markets across the globe during the period. After plunging more than 50% in 2014, oil prices remained turbulent through the close of 2015, and in the early weeks of 2016, they declined more than 25%. In 2015, energy was the worst-performing S&P 500 sector, with stocks declining 23.55% as tumbling crude oil prices continued to crush the earnings of energy companies.
One strategy that dampened returns versus the benchmark was my decision to maintain underweight positions in two stocks that performed very well for the

Allocations are shown as a percentage of the fund’s net assets as of 1/31/16. Cash and net other assets, if any, represent the market value weights of cash, derivatives, short-term securities, and other unclassified assets in the portfolio. Summary information may differ from the portfolio schedule included in the financial statements due to the inclusion of derivative securities, any interest accruals, the exclusion of as-of trades, if any, and the use of different classifications of securities for presentation purposes. Holdings and allocations may vary over time.
period — Facebook and Amazon.com. In my view, these stocks were quite expensive, and I chose to put greater emphasis on holdings that I believed offered more attractive risk/reward profiles.

Could you provide some examples of stocks or strategies that helped performance?
Aerospace and defense stocks were also among the portfolio highlights — most notably Northrop Grumman, one of the top contributors to relative performance for the period. In my view, this is a well-managed company that has delivered strong earnings and appears to be poised to benefit from an increase in defense spending by the U.S. government.
The challenges in the energy sector are also reflected in the fund’s contributors. For example, performance was helped by my decision to avoid The Williams Companies, an energy infrastructure company focused on the natural gas markets whose stock performed poorly during the period. Similarly, my decision to maintain an underweight position in energy company Kinder Morgan was beneficial.
Other portfolio highlights for the period included Activision Blizzard, a developer and publisher of video games, and NVIDIA, a “visual computing” company that offers specialized platforms for a number of markets, including gaming and automotive businesses.

This table shows the fund’s top 10 holdings by percentage of the fund’s net assets as of 1/31/16. Short-term investments and derivatives, if any, are excluded. Holdings may vary over time.
As you look ahead to the second half of the fund’s fiscal year, how are you approaching stocks in the battered energy and basic materials sectors?
Investing in these sectors requires diligent research and patience because any meaningful rebounds could still be one or two years away. Oil prices may stabilize in 2016, but a long-term perspective is vital, and I continue to focus on companies with decent balance sheets and cost structures. In basic materials, it is quite challenging to find opportunities due to oversupply for many commodities. We believe a long-term view is essential here as well, and we will be watching for stabilization in commodity prices, especially those of metals.
In December 2015, the U.S. Federal Reserve raised short-term interest rates for the first time in almost a decade. Could this be disruptive to the U.S. stock market?
I am not particularly concerned about the impact of this rate hike on U.S. stocks. In fact, I believe it may eventually have a positive effect on investor sentiment, as it indicates the Fed’s belief that our economy is strong enough to support it. We were at unnaturally low rates for a very long time, and I believe the markets should be able to absorb this rate hike without much disruption. It is also worth noting that the December hike was a relatively modest increase of 0.25%. As long as the pace of future increases is measured, I believe it may even be beneficial for stocks in 2016.
What is your outlook for the markets and economy in months ahead?
I believe it is quite likely that turbulence may remain as we face a few headwinds, including concerns over oil prices and struggling emerging markets, especially slowing growth in China. Also, we have entered a presidential election year in the United States, which may bring downside volatility.
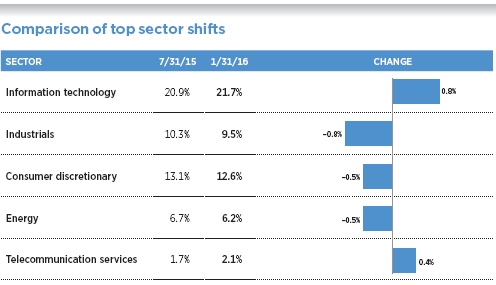
This chart shows the fund’s largest allocation shifts, by percentage, over the past six months. Allocations are shown as a percentage of the fund’s net assets. Current period summary information may differ from the portfolio schedule included in the financial statements due to the inclusion of derivative securities, any interest accruals, the exclusion of as-of trades, if any, and the use of different classifications of securities for presentation purposes. Holdings and allocations may vary over time.
Earnings growth was quite a struggle for U.S. businesses in 2015. There were considerable declines in the basic materials sector, but above all, plunging oil prices crushed the earnings of energy companies. I believe oil price volatility will continue to be a drag on energy earnings in the first half of 2016, and perhaps through the end of the year. In sectors outside of energy, however, I see potential for earnings improvement.
Beyond earnings, I believe we have some good news. The U.S. economy has strengthened, unemployment is at its lowest rate in years, and consumer spending has increased, thanks in part to lower commodity costs.
Thank you, Jerry, for your time and insights.
The views expressed in this report are exclusively those of Putnam Management and are subject to change. They are not meant as investment advice.
Please note that the holdings discussed in this report may not have been held by the fund for the entire period. Portfolio composition is subject to review in accordance with the fund’s investment strategy and may vary in the future. Current and future portfolio holdings are subject to risk.
Portfolio Manager Gerard P. Sullivan has an M.B.A. from the Columbia University Graduate School of Business and a B.A. from Columbia University. Jerry joined Putnam in 2008 and has been in the investment industry since 1982.
IN THE NEWS
The world may be awash in more oil than previously thought — and low oil prices may remain with us for the near term, according to the International Energy Agency (IEA). In January, the per-barrel price of crude dropped below $30, hitting a 12-year low. As Organization of Petroleum Exporting Countries (OPEC) members Iran and Iraq boost oil production and global demand growth slows, supply may exceed consumption by an average of 1.75 million barrels a day in the first six months of 2016, compared with the IEA’s estimate in January of 1.5 million barrels per day. The excess in supply could swell even further if OPEC adds output, the Paris-based IEA noted in its February market report. In January, Iran ramped up oil production following the removal of international oil sanctions, Iraqi volumes notched a record high, and Saudi Arabia, OPEC’s largest producer, “turned up the taps,” the IEA said. For 2016, the IEA has lowered its global oil demand estimates by 100,000 barrels per day, leaving the level of growth for this year unchanged at 1.2 million barrels per day.
Your fund’s performance
This section shows your fund’s performance, price, and distribution information for periods ended January 31, 2016, the end of the first half of its current fiscal year. In accordance with regulatory requirements for mutual funds, we also include performance information as of the most recent calendar quarter-end and expense information taken from the fund’s current prospectus. Performance should always be considered in light of a fund’s investment strategy. Data represent past performance. Past performance does not guarantee future results. More recent returns may be less or more than those shown. Investment return and principal value will fluctuate, and you may have a gain or a loss when you sell your shares. Performance information does not reflect any deduction for taxes a shareholder may owe on fund distributions or on the redemption of fund shares. For the most recent month-end performance, please visit the Individual Investors section at putnam.com or call Putnam at 1-800-225-1581. Class R, R6, and Y shares are not available to all investors. See the Terms and Definitions section in this report for definitions of the share classes offered by your fund.
Fund performance Total return for periods ended 1/31/16
| | | | | | | | | | | | |
| | Class A | Class B | Class C | Class M | Class R | Class R5 | Class R6 | Class Y |
| (inception dates) | (12/1/25) | (3/1/93) | (7/26/99) | (12/2/94) | (1/21/03) | (7/2/12) | (7/2/12) | (1/7/97) |
|
| | Before | After | | | | | Before | After | Net | Net | Net | Net |
| | sales | sales | Before | After | Before | After | sales | sales | asset | asset | asset | asset |
| | charge | charge | CDSC | CDSC | CDSC | CDSC | charge | charge | value | value | value | value |
|
| Annual average | | | | | | | | | | | | |
| (life of fund) | 9.09% | 9.02% | 8.99% | 8.99% | 8.27% | 8.27% | 8.35% | 8.30% | 8.82% | 9.15% | 9.16% | 9.15% |
|
| 10 years | 52.97 | 44.17 | 43.85 | 43.85 | 41.77 | 41.77 | 45.39 | 40.30 | 49.16 | 57.56 | 57.85 | 56.82 |
| Annual average | 4.34 | 3.73 | 3.70 | 3.70 | 3.55 | 3.55 | 3.81 | 3.44 | 4.08 | 4.65 | 4.67 | 4.60 |
|
| 5 years | 59.41 | 50.24 | 53.57 | 51.57 | 53.41 | 53.41 | 55.44 | 50.00 | 57.35 | 62.18 | 62.48 | 61.41 |
| Annual average | 9.77 | 8.48 | 8.96 | 8.67 | 8.94 | 8.94 | 9.22 | 8.45 | 9.49 | 10.15 | 10.19 | 10.05 |
|
| 3 years | 32.99 | 25.35 | 30.05 | 27.05 | 30.03 | 30.03 | 31.04 | 26.45 | 31.95 | 34.51 | 34.71 | 34.00 |
| Annual average | 9.97 | 7.82 | 9.15 | 8.31 | 9.15 | 9.15 | 9.43 | 8.14 | 9.68 | 10.39 | 10.44 | 10.25 |
|
| 1 year | –5.59 | –11.02 | –6.30 | –10.95 | –6.35 | –7.28 | –6.09 | –9.38 | –5.88 | –5.21 | –5.26 | –5.36 |
|
| 6 months | –10.97 | –16.09 | –11.29 | –15.69 | –11.35 | –12.23 | –11.21 | –14.31 | –11.12 | –10.76 | –10.80 | –10.88 |
|
Current performance may be lower or higher than the quoted past performance, which cannot guarantee future results. After-sales-charge returns for class A and M shares reflect the deduction of the maximum 5.75% and 3.50% sales charge, respectively, levied at the time of purchase. Class B share returns after contingent deferred sales charge (CDSC) reflect the applicable CDSC, which is 5% in the first year, declining over time to 1% in the sixth year, and is eliminated thereafter. Class C share returns after CDSC reflect a 1% CDSC for the first year that is eliminated thereafter. Class R, R5, R6, and Y shares have no initial sales charge or CDSC. Performance for class B, C, M, R, and Y shares before their inception is derived from the historical performance of class A shares, adjusted for the applicable sales charge (or CDSC) and the higher operating expenses for such shares, except for class Y shares, for which 12b-1 fees are not applicable. Performance for class R5 and R6 shares prior to their inception is derived from the historical performance of class Y shares and has not been adjusted for the lower investor servicing fees applicable to class R5 and R6 shares; had it, returns would have been higher.
Recent performance may have benefited from one or more legal settlements.
For a portion of the periods, the fund had expense limitations, without which returns would have been lower.
Class B share performance reflects conversion to class A shares after eight years.
Comparative index returns For periods ended 1/31/16
| | |
| | | Lipper Large-Cap Core |
| | S&P 500 Index | Funds category average* |
|
| Annual average (life of fund) | —† | —† |
|
| 10 years | 87.41% | 72.25% |
| Annual average | 6.48 | 5.52 |
|
| 5 years | 67.80 | 56.02 |
| Annual average | 10.91 | 9.25 |
|
| 3 years | 37.88 | 31.13 |
| Annual average | 11.30 | 9.42 |
|
| 1 year | –0.67 | –2.70 |
|
| 6 months | –6.77 | –8.52 |
|
Index and Lipper results should be compared with fund performance before sales charge, before CDSC, or at net asset value.
* Over the 6-month, 1-year, 3-year, 5-year and 10-year periods ended 1/31/16, there were 901, 877, 792, 706, and 515 funds, respectively, in this Lipper category.
† The fund’s benchmark and Lipper category, the S&P 500 Index and Lipper Large-Cap Core Funds category, were introduced on 3/4/57 and 12/31/59, respectively, which post-date the inception of the fund’s class A shares.
Fund price and distribution information For the six-month period ended 1/31/16
| | | | | | | | |
| Distributions | Class A | Class B | Class C | Class M | Class R | Class R5 | Class R6 | Class Y |
|
| Number | 1 | 1 | 1 | 1 | 1 | 1 | 1 | 1 |
|
| Income | $0.310 | $0.153 | $0.192 | $0.210 | $0.212 | $0.376 | $0.398 | $0.378 |
|
| Capital gains | — | — | — | — | — | — | — | — |
|
| Total | $0.310 | $0.153 | $0.192 | $0.210 | $0.212 | $0.376 | $0.398 | $0.378 |
|
| | Before | After | Net | Net | Before | After | Net | Net | Net | Net |
| | sales | sales | asset | asset | sales | sales | asset | asset | asset | asset |
| Share value | charge | charge | value | value | charge | charge | value | value | value | value |
|
| 7/31/15 | $22.46 | $23.83 | $20.10 | $21.18 | $21.12 | $21.89 | $22.07 | $22.90 | $22.90 | $22.81 |
|
| 1/31/16 | 19.71 | 20.91 | 17.69 | 18.60 | 18.56 | 19.23 | 19.42 | 20.09 | 20.06 | 19.98 |
|
The classification of distributions, if any, is an estimate. Before-sales-charge share value and current dividend rate for class A and M shares, if applicable, do not take into account any sales charge levied at the time of purchase. After-sales-charge share value, current dividend rate, and current 30-day SEC yield, if applicable, are calculated assuming that the maximum sales charge (5.75% for class A shares and 3.50% for class M shares) was levied at the time of purchase. Final distribution information will appear on your year-end tax forms.
Fund performance as of most recent calendar quarter
Total return for periods ended 12/31/15
| | | | | | | | | | | | |
| | Class A | Class B | Class C | Class M | Class R | Class R5 | Class R6 | Class Y |
| (inception dates) | (12/1/25) | (3/1/93) | (7/26/99) | (12/2/94) | (1/21/03) | (7/2/12) | (7/2/12) | (1/7/97) |
|
| | Before | After | | | | | Before | After | Net | Net | Net | Net |
| | sales | sales | Before | After | Before | After | sales | sales | asset | asset | asset | asset |
| | charge | charge | CDSC | CDSC | CDSC | CDSC | charge | charge | value | value | value | value |
|
| Annual average | | | | | | | | | | | | |
| (life of fund) | 9.18% | 9.11% | 9.08% | 9.08% | 8.36% | 8.36% | 8.43% | 8.39% | 8.91% | 9.24% | 9.24% | 9.24% |
|
| 10 years | 68.31 | 58.63 | 58.43 | 58.43 | 56.09 | 56.09 | 60.08 | 54.48 | 64.11 | 73.38 | 73.71 | 72.62 |
| Annual average | 5.34 | 4.72 | 4.71 | 4.71 | 4.55 | 4.55 | 4.82 | 4.44 | 5.08 | 5.66 | 5.68 | 5.61 |
|
| 5 years | 74.25 | 64.23 | 67.87 | 65.87 | 67.83 | 67.83 | 70.01 | 64.06 | 72.13 | 77.31 | 77.65 | 76.53 |
| Annual average | 11.75 | 10.43 | 10.92 | 10.65 | 10.91 | 10.91 | 11.20 | 10.41 | 11.47 | 12.14 | 12.18 | 12.04 |
|
| 3 years | 49.75 | 41.14 | 46.44 | 43.44 | 46.38 | 46.38 | 47.51 | 42.34 | 48.55 | 51.39 | 51.62 | 50.89 |
| Annual average | 14.41 | 12.17 | 13.56 | 12.78 | 13.54 | 13.54 | 13.83 | 12.49 | 14.10 | 14.82 | 14.88 | 14.70 |
|
| 1 year | –2.53 | –8.14 | –3.25 | –8.05 | –3.23 | –4.19 | –2.97 | –6.37 | –2.79 | –2.15 | –2.15 | –2.29 |
|
| 6 months | –3.76 | –9.30 | –4.12 | –8.88 | –4.11 | –5.06 | –3.99 | –7.35 | –3.90 | –3.54 | –3.57 | –3.63 |
|
See the discussion following the fund performance table on page 10 for information about the calculation of fund performance.
Your fund’s expenses
As a mutual fund investor, you pay ongoing expenses, such as management fees, distribution fees (12b-1 fees), and other expenses. Using the following information, you can estimate how these expenses affect your investment and compare them with the expenses of other funds. You may also pay one-time transaction expenses, including sales charges (loads) and redemption fees, which are not shown in this section and would have resulted in higher total expenses. For more information, see your fund’s prospectus or talk to your financial representative.
Expense ratios
| | | | | | | | |
| | Class A | Class B | Class C | Class M | Class R | Class R5 | Class R6 | Class Y |
|
| Total annual operating expenses | | | | | | | | |
| for the fiscal year ended 7/31/15 | 1.03% | 1.78% | 1.78% | 1.53% | 1.28% | 0.74% | 0.64% | 0.78% |
|
| Annualized expense ratio for the | | | | | | | | |
| six-month period ended 1/31/16 | 1.05% | 1.80% | 1.80% | 1.55% | 1.30% | 0.75% | 0.65% | 0.80% |
|
Fiscal-year expense information in this table is taken from the most recent prospectus, is subject to change, and may differ from that shown for the annualized expense ratio and in the financial highlights of this report.
Expenses are shown as a percentage of average net assets.
Expenses per $1,000
The following table shows the expenses you would have paid on a $1,000 investment in each class of the fund from 8/1/15 to 1/31/16. It also shows how much a $1,000 investment would be worth at the close of the period, assuming actual returns and expenses.
| | | | | | | | |
| | Class A | Class B | Class C | Class M | Class R | Class R5 | Class R6 | Class Y |
|
| Expenses paid per $1,000*† | $4.99 | $8.54 | $8.54 | $7.36 | $6.17 | $3.57 | $3.09 | $3.80 |
|
| Ending value (after expenses) | $890.30 | $887.10 | $886.50 | $887.90 | $888.80 | $892.40 | $892.00 | $891.20 |
|
* Expenses for each share class are calculated using the fund’s annualized expense ratio for each class, which represents the ongoing expenses as a percentage of average net assets for the six months ended 1/31/16. The expense ratio may differ for each share class.
† Expenses are calculated by multiplying the expense ratio by the average account value for the period; then multiplying the result by the number of days in the period; and then dividing that result by the number of days in the year.
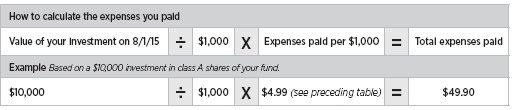
Estimate the expenses you paid
To estimate the ongoing expenses you paid for the six months ended 1/31/16, use the following calculation method. To find the value of your investment on 8/1/15, call Putnam at 1-800-225-1581.
Compare expenses using the SEC’s method
The Securities and Exchange Commission (SEC) has established guidelines to help investors assess fund expenses. Per these guidelines, the following table shows your fund’s expenses based on a $1,000 investment, assuming a hypothetical 5% annualized return. You can use this information to compare the ongoing expenses (but not transaction expenses or total costs) of investing in the fund with those of other funds. All mutual fund shareholder reports will provide this information to help you make this comparison. Please note that you cannot use this information to estimate your actual ending account balance and expenses paid during the period.
| | | | | | | | |
| | Class A | Class B | Class C | Class M | Class R | Class R5 | Class R6 | Class Y |
|
| Expenses paid per $1,000*† | $5.33 | $9.12 | $9.12 | $7.86 | $6.60 | $3.81 | $3.30 | $4.06 |
|
| Ending value (after expenses) | $1,019.86 | $1,016.09 | $1,016.09 | $1,017.34 | $1,018.60 | $1,021.37 | $1,021.87 | $1,021.11 |
|
* Expenses for each share class are calculated using the fund’s annualized expense ratio for each class, which represents the ongoing expenses as a percentage of average net assets for the six months ended 1/31/16. The expense ratio may differ for each share class.
† Expenses are calculated by multiplying the expense ratio by the average account value for the six-month period; then multiplying the result by the number of days in the six-month period; and then dividing that result by the number of days in the year.
Terms and definitions
Important terms
Total return shows how the value of the fund’s shares changed over time, assuming you held the shares through the entire period and reinvested all distributions in the fund.
Before sales charge, or net asset value, is the price, or value, of one share of a mutual fund, without a sales charge. Before-sales-charge figures fluctuate with market conditions, and are calculated by dividing the net assets of each class of shares by the number of outstanding shares in the class.
After sales charge is the price of a mutual fund share plus the maximum sales charge levied at the time of purchase. After-sales-charge performance figures shown here assume the 5.75% maximum sales charge for class A shares and 3.50% for class M shares.
Contingent deferred sales charge (CDSC) is generally a charge applied at the time of the redemption of class B or C shares and assumes redemption at the end of the period. Your fund’s class B CDSC declines over time from a 5% maximum during the first year to 1% during the sixth year. After the sixth year, the CDSC no longer applies. The CDSC for class C shares is 1% for one year after purchase.
Share classes
Class A shares are generally subject to an initial sales charge and no CDSC (except on certain redemptions of shares bought without an initial sales charge).
Class B shares are not subject to an initial sales charge and may be subject to a CDSC.
Class C shares are not subject to an initial sales charge and are subject to a CDSC only if the shares are redeemed during the first year.
Class M shares have a lower initial sales charge and a higher 12b-1 fee than class A shares and no CDSC.
Class R shares are not subject to an initial sales charge or CDSC and are available only to employer-sponsored retirement plans.
Class R5 and R6 shares are not subject to an initial sales charge or CDSC, and carry no 12b-1 fee. They are only available to employer-sponsored retirement plans.
Class Y shares are not subject to an initial sales charge or CDSC, and carry no 12b-1 fee. They are generally only available to corporate and institutional clients and clients in other approved programs.
Comparative indexes
Barclays U.S. Aggregate Bond Index is an unmanaged index of U.S. investment-grade fixed-income securities.
BofA Merrill Lynch U.S. 3-Month Treasury Bill Index is an unmanaged index that seeks to measure the performance of U.S. Treasury bills available in the marketplace.
S&P 500 Index is an unmanaged index of common stock performance.
Indexes assume reinvestment of all distributions and do not account for fees. Securities and performance of a fund and an index will differ. You cannot invest directly in an index.
Lipper is a third-party industry-ranking entity that ranks mutual funds. Its rankings do not reflect sales charges. Lipper rankings are based on total return at net asset value relative to other funds that have similar current investment styles or objectives as determined by Lipper. Lipper may change a fund’s category assignment at its discretion. Lipper category averages reflect performance trends for funds within a category.
Other information for shareholders
Important notice regarding delivery of shareholder documents
In accordance with Securities and Exchange Commission (SEC) regulations, Putnam sends a single copy of annual and semiannual shareholder reports, prospectuses, and proxy statements to Putnam shareholders who share the same address, unless a shareholder requests otherwise. If you prefer to receive your own copy of these documents, please call Putnam at 1-800-225-1581, and Putnam will begin sending individual copies within 30 days.
Proxy voting
Putnam is committed to managing our mutual funds in the best interests of our shareholders. The Putnam funds’ proxy voting guidelines and procedures, as well as information regarding how your fund voted proxies relating to portfolio securities during the 12-month period ended June 30, 2015, are available in the Individual Investors section of putnam.com, and on the SEC’s website, www.sec.gov. If you have questions about finding forms on the SEC’s website, you may call the SEC at 1-800-SEC-0330. You may also obtain the Putnam funds’ proxy voting guidelines and procedures at no charge by calling Putnam’s Shareholder Services at 1-800-225-1581.
Fund portfolio holdings
The fund will file a complete schedule of its portfolio holdings with the SEC for the first and third quarters of each fiscal year on Form N-Q. Shareholders may obtain the fund’s Form N-Q on the SEC’s website at www.sec.gov. In addition, the fund’s Form N-Q may be reviewed and copied at the SEC’s Public Reference Room in Washington, D.C. You may call the SEC at 1-800-SEC-0330 for information about the SEC’s website or the operation of the Public Reference Room.
Trustee and employee fund ownership
Putnam employees and members of the Board of Trustees place their faith, confidence, and, most importantly, investment dollars in Putnam mutual funds. As of January 31, 2016, Putnam employees had approximately $463,000,000 and the Trustees had approximately $124,000,000 invested in Putnam mutual funds. These amounts include investments by the Trustees’ and employees’ immediate family members as well as investments through retirement and deferred compensation plans.
Financial statements
A guide to financial statements
These sections of the report, as well as the accompanying Notes, constitute the fund’s financial statements.
The fund’s portfolio lists all the fund’s investments and their values as of the last day of the reporting period. Holdings are organized by asset type and industry sector, country, or state to show areas of concentration and diversification.
Statement of assets and liabilities shows how the fund’s net assets and share price are determined. All investment and non-investment assets are added together. Any unpaid expenses and other liabilities are subtracted from this total. The result is divided by the number of shares to determine the net asset value per share, which is calculated separately for each class of shares. (For funds with preferred shares, the amount subtracted from total assets includes the liquidation preference of preferred shares.)
Statement of operations shows the fund’s net investment gain or loss. This is done by first adding up all the fund’s earnings — from dividends and interest income — and subtracting its operating expenses to determine net investment income (or loss). Then, any net gain or loss the fund realized on the sales of its holdings — as well as any unrealized gains or losses over the period — is added to or subtracted from the net investment result to determine the fund’s net gain or loss for the fiscal period.
Statement of changes in net assets shows how the fund’s net assets were affected by the fund’s net investment gain or loss, by distributions to shareholders, and by changes in the number of the fund’s shares. It lists distributions and their sources (net investment income or realized capital gains) over the current reporting period and the most recent fiscal year-end. The distributions listed here may not match the sources listed in the Statement of operations because the distributions are determined on a tax basis and may be paid in a different period from the one in which they were earned. Dividend sources are estimated at the time of declaration. Actual results may vary. Any non-taxable return of capital cannot be determined until final tax calculations are completed after the end of the fund’s fiscal year.
Financial highlights provide an overview of the fund’s investment results, per-share distributions, expense ratios, net investment income ratios, and portfolio turnover in one summary table, reflecting the five most recent reporting periods. In a semiannual report, the highlights table also includes the current reporting period.
The fund’s portfolio 1/31/16 (Unaudited)
| | |
| COMMON STOCKS (98.0%)* | Shares | Value |
|
| Aerospace and defense (4.8%) | | |
| Boeing Co. (The) | 82,800 | $9,946,764 |
|
| General Dynamics Corp. | 62,448 | 8,353,669 |
|
| Honeywell International, Inc. | 82,730 | 8,537,736 |
|
| L-3 Communications Holdings, Inc. | 88,445 | 10,333,914 |
|
| Northrop Grumman Corp. | 115,400 | 21,355,924 |
|
| Raytheon Co. | 59,200 | 7,591,808 |
|
| Spirit AeroSystems Holdings, Inc. Class A † | 101,100 | 4,286,640 |
|
| TransDigm Group, Inc. † | 16,400 | 3,685,572 |
|
| United Technologies Corp. | 85,500 | 7,497,495 |
|
| | 81,589,522 |
| Airlines (1.1%) | | |
| Alaska Air Group, Inc. | 49,300 | 3,470,720 |
|
| American Airlines Group, Inc. | 71,100 | 2,772,189 |
|
| Southwest Airlines Co. | 285,600 | 10,744,272 |
|
| United Continental Holdings, Inc. † | 32,400 | 1,564,272 |
|
| | 18,551,453 |
| Auto components (0.7%) | | |
| Goodyear Tire & Rubber Co. (The) | 173,800 | 4,937,658 |
|
| Lear Corp. | 60,700 | 6,302,481 |
|
| | 11,240,139 |
| Automobiles (0.4%) | | |
| Fiat Chrysler Automobiles NV (United Kingdom) S | 180,900 | 1,273,536 |
|
| General Motors Co. | 212,100 | 6,286,644 |
|
| | 7,560,180 |
| Banks (7.8%) | | |
| Bank of America Corp. | 1,287,442 | 18,204,430 |
|
| Citigroup, Inc. | 394,217 | 16,785,760 |
|
| JPMorgan Chase & Co. | 785,373 | 46,729,694 |
|
| KeyCorp | 576,600 | 6,434,856 |
|
| PNC Financial Services Group, Inc. (The) | 75,400 | 6,533,410 |
|
| Regions Financial Corp. | 495,700 | 4,025,084 |
|
| Wells Fargo & Co. | 684,798 | 34,397,404 |
|
| | 133,110,638 |
| Beverages (2.6%) | | |
| Coca-Cola Enterprises, Inc. | 130,000 | 6,034,600 |
|
| Dr. Pepper Snapple Group, Inc. | 91,684 | 8,603,627 |
|
| Molson Coors Brewing Co. Class B | 109,702 | 9,925,837 |
|
| PepsiCo, Inc. | 205,400 | 20,396,220 |
|
| | 44,960,284 |
| Biotechnology (3.8%) | | |
| AMAG Pharmaceuticals, Inc. † | 95,905 | 2,197,184 |
|
| Amgen, Inc. | 141,900 | 21,672,387 |
|
| Biogen, Inc. † | 31,700 | 8,656,002 |
|
| Celgene Corp. † | 105,400 | 10,573,728 |
|
| Gilead Sciences, Inc. | 210,700 | 17,488,100 |
|
| United Therapeutics Corp. † | 25,500 | 3,141,090 |
|
| | | 63,728,491 |
| | |
| COMMON STOCKS (98.0%)* cont. | Shares | Value |
|
| Building products (0.3%) | | |
| CaesarStone Sdot-Yam, Ltd. (Israel) † | 54,619 | $2,053,128 |
|
| Masco Corp. | 88,900 | 2,346,071 |
|
| | 4,399,199 |
| Capital markets (3.0%) | | |
| Bank of New York Mellon Corp. (The) | 137,400 | 4,976,628 |
|
| Carlyle Group LP (The) | 263,379 | 3,603,025 |
|
| Goldman Sachs Group, Inc. (The) | 109,700 | 17,723,132 |
|
| KKR & Co. LP | 567,800 | 7,739,114 |
|
| Morgan Stanley | 372,600 | 9,642,888 |
|
| State Street Corp. | 133,100 | 7,417,663 |
|
| | 51,102,450 |
| Chemicals (2.1%) | | |
| Axalta Coating Systems, Ltd. † | 122,400 | 2,914,344 |
|
| CF Industries Holdings, Inc. | 101,100 | 3,033,000 |
|
| Dow Chemical Co. (The) | 239,143 | 10,044,006 |
|
| E.I. du Pont de Nemours & Co. | 102,600 | 5,413,176 |
|
| LyondellBasell Industries NV Class A | 91,200 | 7,110,864 |
|
| Sherwin-Williams Co. (The) | 17,100 | 4,371,957 |
|
| Symrise AG (Germany) | 37,859 | 2,442,722 |
|
| | 35,330,069 |
| Commercial services and supplies (0.3%) | | |
| KAR Auction Services, Inc. | 82,962 | 2,772,590 |
|
| MiX Telematics, Ltd. ADR (South Africa) | 152,333 | 594,099 |
|
| West Corp. | 91,700 | 1,660,687 |
|
| | 5,027,376 |
| Communications equipment (1.8%) | | |
| Cisco Systems, Inc. | 886,300 | 21,085,077 |
|
| QUALCOMM, Inc. | 203,100 | 9,208,554 |
|
| | 30,293,631 |
| Consumer finance (1.2%) | | |
| Capital One Financial Corp. | 110,700 | 7,264,134 |
|
| Discover Financial Services | 202,000 | 9,249,580 |
|
| Synchrony Financial † | 150,500 | 4,277,210 |
|
| | 20,790,924 |
| Containers and packaging (0.2%) | | |
| Sealed Air Corp. | 89,400 | 3,623,382 |
|
| | 3,623,382 |
| Diversified consumer services (0.3%) | | |
| Service Corp. International/US | 179,100 | 4,332,429 |
|
| | 4,332,429 |
| Diversified financial services (1.2%) | | |
| Berkshire Hathaway, Inc. Class B † | 32,080 | 4,163,022 |
|
| Capitol Acquisition Corp. III (Units) † | 179,750 | 1,752,563 |
|
| Easterly Acquisition Corp. (Units) † | 736,300 | 7,399,815 |
|
| Pace Holdings Corp. (Units) † | 360,718 | 3,607,180 |
|
| Voya Financial, Inc. | 105,600 | 3,229,248 |
|
| | 20,151,828 |
| Diversified telecommunication services (2.0%) | | |
| AT&T, Inc. | 313,352 | 11,299,473 |
|
| Iridium Communications, Inc. † S | 269,948 | 1,878,838 |
|
| Level 3 Communications, Inc. † | 60,400 | 2,948,124 |
|
| Verizon Communications, Inc. | 347,821 | 17,380,615 |
|
| | | 33,507,050 |
| | |
| COMMON STOCKS (98.0%)* cont. | Shares | Value |
|
| Electric utilities (1.5%) | | |
| Edison International | 91,100 | $5,629,980 |
|
| Entergy Corp. | 108,900 | 7,686,162 |
|
| Exelon Corp. | 264,800 | 7,830,136 |
|
| FirstEnergy Corp. | 147,700 | 4,882,962 |
|
| | 26,029,240 |
| Electronic equipment, instruments, and components (0.5%) | | |
| CDW Corp. of Delaware | 52,968 | 2,036,620 |
|
| Corning, Inc. | 325,200 | 6,051,972 |
|
| | 8,088,592 |
| Energy equipment and services (1.4%) | | |
| Cameron International Corp. † | 102,300 | 6,717,018 |
|
| Halliburton Co. | 130,500 | 4,148,595 |
|
| Nabors Industries, Ltd. | 257,700 | 1,896,672 |
|
| Schlumberger, Ltd. | 159,924 | 11,557,707 |
|
| | 24,319,992 |
| Food and staples retail (3.2%) | | |
| Costco Wholesale Corp. | 62,000 | 9,369,440 |
|
| CVS Health Corp. | 231,110 | 22,322,915 |
|
| Kroger Co. (The) | 367,700 | 14,270,437 |
|
| Wal-Mart Stores, Inc. | 119,200 | 7,910,112 |
|
| | 53,872,904 |
| Food products (0.8%) | | |
| Blue Buffalo Pet Products, Inc. † S | 129,218 | 2,199,290 |
|
| JM Smucker Co. (The) | 25,000 | 3,208,000 |
|
| Pinnacle Foods, Inc. | 105,400 | 4,520,606 |
|
| Tyson Foods, Inc. Class A | 56,400 | 3,009,504 |
|
| | 12,937,400 |
| Gas utilities (0.2%) | | |
| UGI Corp. | 108,500 | 3,689,000 |
|
| | 3,689,000 |
| Health-care equipment and supplies (0.7%) | | |
| Abbott Laboratories | 147,700 | 5,590,445 |
|
| Medtronic PLC | 81,523 | 6,189,226 |
|
| | 11,779,671 |
| Health-care providers and services (3.8%) | | |
| Aetna, Inc. | 75,300 | 7,668,552 |
|
| AmerisourceBergen Corp. | 66,000 | 5,910,960 |
|
| Anthem, Inc. | 50,300 | 6,563,647 |
|
| Cardinal Health, Inc. | 101,200 | 8,234,644 |
|
| Cigna Corp. | 40,300 | 5,384,080 |
|
| Express Scripts Holding Co. † | 54,300 | 3,902,541 |
|
| HCA Holdings, Inc. † | 121,600 | 8,460,928 |
|
| McKesson Corp. | 46,700 | 7,517,766 |
|
| UnitedHealth Group, Inc. | 98,500 | 11,343,260 |
|
| | 64,986,378 |
| Hotels, restaurants, and leisure (1.4%) | | |
| Del Taco Restaurants, Inc. † S | 251,500 | 2,432,005 |
|
| Hilton Worldwide Holdings, Inc. | 80,600 | 1,435,486 |
|
| McDonald’s Corp. | 80,500 | 9,964,290 |
|
| Penn National Gaming, Inc. † | 311,100 | 4,395,843 |
|
| Wyndham Worldwide Corp. | 47,100 | 3,056,790 |
|
| Yum! Brands, Inc. | 36,600 | 2,648,742 |
|
| | | 23,933,156 |
| | |
| COMMON STOCKS (98.0%)* cont. | Shares | Value |
|
| Household durables (0.2%) | | |
| New Home Co., Inc. (The) † S | 200,147 | $2,027,489 |
|
| WCI Communities, Inc. † | 102,100 | 2,137,974 |
|
| | 4,165,463 |
| Household products (0.9%) | | |
| Procter & Gamble Co. (The) | 180,100 | 14,712,369 |
|
| | 14,712,369 |
| Independent power and renewable electricity producers (0.2%) | | |
| NRG Energy, Inc. | 366,000 | 3,894,240 |
|
| | 3,894,240 |
| Industrial conglomerates (1.3%) | | |
| Danaher Corp. | 125,300 | 10,857,245 |
|
| General Electric Co. | 412,400 | 12,000,840 |
|
| | 22,858,085 |
| Insurance (2.8%) | | |
| American International Group, Inc. | 330,950 | 18,692,056 |
|
| Assured Guaranty, Ltd. | 122,700 | 2,917,806 |
|
| Hartford Financial Services Group, Inc. (The) | 125,300 | 5,034,554 |
|
| Lincoln National Corp. | 110,600 | 4,364,276 |
|
| MetLife, Inc. | 138,066 | 6,164,647 |
|
| Prudential PLC (United Kingdom) | 113,920 | 2,239,244 |
|
| Travelers Cos., Inc. (The) | 79,000 | 8,456,160 |
|
| | 47,868,743 |
| Internet and catalog retail (1.2%) | | |
| Amazon.com, Inc. † | 24,800 | 14,557,600 |
|
| FabFurnish GmbH (acquired 8/2/13, cost $31) (Private) (Brazil) †∆∆F | 23 | 19 |
|
| Global Fashion Holding SA (acquired 8/2/13, cost $1,535,904) | | |
| (Private) (Brazil) †∆∆F | 36,256 | 915,460 |
|
| New Bigfoot Other Assets GmbH (acquired 8/2/13, cost $31) | | |
| (Private) (Brazil) †∆∆F | 23 | 19 |
|
| New Middle East Other Assets GmbH (acquired 8/2/13, cost $12) | | |
| (Private) (Brazil) †∆∆F | 9 | 7 |
|
| Priceline Group, Inc. (The) † | 4,300 | 4,579,371 |
|
| | 20,052,476 |
| Internet software and services (4.4%) | | |
| Alibaba Group Holding, Ltd. ADR (China) † S | 38,600 | 2,587,358 |
|
| Alphabet, Inc. Class A † | 15,700 | 11,953,195 |
|
| Alphabet, Inc. Class C † | 50,894 | 37,811,697 |
|
| eBay, Inc. † | 267,800 | 6,282,588 |
|
| Facebook, Inc. Class A † | 126,000 | 14,138,460 |
|
| Yahoo!, Inc. † | 89,800 | 2,649,998 |
|
| | 75,423,296 |
| IT Services (3.4%) | | |
| Amdocs, Ltd. | 53,700 | 2,939,538 |
|
| Computer Sciences Corp. | 138,900 | 4,454,523 |
|
| CSRA, Inc. | 138,900 | 3,719,742 |
|
| Fidelity National Information Services, Inc. | 58,600 | 3,500,178 |
|
| IBM Corp. | 100,200 | 12,503,958 |
|
| MasterCard, Inc. Class A | 127,800 | 11,378,034 |
|
| PayPal Holdings, Inc. † | 119,600 | 4,322,344 |
|
| Visa, Inc. Class A | 134,800 | 10,041,252 |
|
| Xerox Corp. | 475,800 | 4,639,050 |
|
| | | 57,498,619 |
| | |
| COMMON STOCKS (98.0%)* cont. | Shares | Value |
|
| Leisure products (—%) | | |
| MCBC Holdings, Inc. † | 39,865 | $503,096 |
|
| | 503,096 |
| Life sciences tools and services (0.3%) | | |
| Agilent Technologies, Inc. | 107,000 | 4,028,550 |
|
| Waters Corp. † | 14,700 | 1,781,787 |
|
| | 5,810,337 |
| Machinery (1.0%) | | |
| Caterpillar, Inc. | 60,700 | 3,777,968 |
|
| Deere & Co. S | 105,100 | 8,093,751 |
|
| Trinity Industries, Inc. | 207,496 | 4,444,564 |
|
| | 16,316,283 |
| Media (3.1%) | | |
| Comcast Corp. Class A | 284,700 | 15,860,637 |
|
| DISH Network Corp. Class A † | 90,300 | 4,358,781 |
|
| Omnicom Group, Inc. | 76,700 | 5,625,945 |
|
| Time Warner Cable, Inc. | 37,500 | 6,825,375 |
|
| Time Warner, Inc. | 115,400 | 8,128,776 |
|
| Walt Disney Co. (The) | 117,300 | 11,239,686 |
|
| | 52,039,200 |
| Metals and mining (0.3%) | | |
| Freeport-McMoRan, Inc. (Indonesia) S | 116,600 | 536,360 |
|
| Nucor Corp. | 122,100 | 4,770,447 |
|
| | 5,306,807 |
| Multiline retail (1.2%) | | |
| Dollar General Corp. | 51,300 | 3,850,578 |
|
| Kohl’s Corp. | 83,100 | 4,134,225 |
|
| Macy’s, Inc. | 94,400 | 3,814,704 |
|
| Target Corp. | 127,300 | 9,219,066 |
|
| | 21,018,573 |
| Oil, gas, and consumable fuels (4.8%) | | |
| Anadarko Petroleum Corp. | 110,600 | 4,323,354 |
|
| ConocoPhillips | 128,700 | 5,029,596 |
|
| Energy Transfer Partners LP | 125,200 | 3,723,448 |
|
| Enterprise Products Partners LP | 146,800 | 3,509,988 |
|
| EOG Resources, Inc. | 53,100 | 3,771,162 |
|
| Exxon Mobil Corp. | 363,025 | 28,261,496 |
|
| Green Plains Partners LP | 297,487 | 4,346,285 |
|
| Gulfport Energy Corp. † | 72,300 | 2,136,465 |
|
| Kinder Morgan, Inc. | 59,400 | 977,130 |
|
| Memorial Resource Development Corp. † | 465,175 | 7,400,934 |
|
| Royal Dutch Shell PLC ADR Class A (United Kingdom) | 112,451 | 4,939,972 |
|
| Suncor Energy, Inc. (Canada) | 150,600 | 3,546,630 |
|
| Valero Energy Corp. | 138,700 | 9,413,569 |
|
| | 81,380,029 |
| Personal products (1.3%) | | |
| Avon Products, Inc. | 969,045 | 3,285,063 |
|
| Coty, Inc. Class A | 465,320 | 11,451,525 |
|
| Edgewell Personal Care Co. | 107,211 | 7,934,686 |
|
| | | 22,671,274 |
| | |
| COMMON STOCKS (98.0%)* cont. | Shares | Value |
|
| Pharmaceuticals (6.2%) | | |
| Allergan PLC † | 27,219 | $7,741,900 |
|
| Bristol-Myers Squibb Co. | 92,400 | 5,743,584 |
|
| Eli Lilly & Co. | 103,400 | 8,178,940 |
|
| Jazz Pharmaceuticals PLC † | 22,132 | 2,849,274 |
|
| Johnson & Johnson | 251,600 | 26,277,104 |
|
| Merck & Co., Inc. | 242,100 | 12,267,207 |
|
| Perrigo Co. PLC S | 64,500 | 9,325,410 |
|
| Pfizer, Inc. | 799,826 | 24,386,695 |
|
| Shire PLC ADR (United Kingdom) | 14,700 | 2,474,010 |
|
| Teva Pharmaceutical Industries, Ltd. ADR (Israel) | 89,439 | 5,498,710 |
|
| | 104,742,834 |
| Real estate investment trusts (REITs) (1.4%) | | |
| Armada Hoffler Properties, Inc. R | 531,044 | 5,719,344 |
|
| Easterly Government Properties, Inc. R | 536,744 | 9,564,778 |
|
| Hannon Armstrong Sustainable Infrastructure Capital, Inc. R | 142,436 | 2,556,726 |
|
| Kimco Realty Corp. R | 118,500 | 3,222,015 |
|
| Rayonier, Inc. R | 116,000 | 2,446,440 |
|
| | 23,509,303 |
| Road and rail (0.7%) | | |
| Union Pacific Corp. | 170,000 | 12,240,000 |
|
| | 12,240,000 |
| Semiconductors and semiconductor equipment (2.3%) | | |
| Avago Technologies, Ltd. | 30,300 | 4,051,413 |
|
| Intel Corp. | 481,600 | 14,939,232 |
|
| Lam Research Corp. | 48,200 | 3,460,278 |
|
| Marvell Technology Group, Ltd. | 237,100 | 2,098,335 |
|
| Micron Technology, Inc. † | 276,800 | 3,053,104 |
|
| NVIDIA Corp. | 204,100 | 5,978,089 |
|
| Texas Instruments, Inc. | 108,500 | 5,742,905 |
|
| | 39,323,356 |
| Software (4.8%) | | |
| Activision Blizzard, Inc. | 109,400 | 3,809,308 |
|
| Electronic Arts, Inc. † | 120,600 | 7,784,127 |
|
| Microsoft Corp. | 980,100 | 53,993,709 |
|
| Oracle Corp. | 356,534 | 12,945,750 |
|
| TubeMogul, Inc. † S | 212,140 | 2,390,818 |
|
| | 80,923,712 |
| Specialty retail (3.3%) | | |
| American Eagle Outfitters, Inc. S | 175,100 | 2,563,464 |
|
| Best Buy Co., Inc. S | 183,300 | 5,119,569 |
|
| Gap, Inc. (The) S | 159,800 | 3,950,256 |
|
| Home Depot, Inc. (The) | 165,000 | 20,750,400 |
|
| Lowe’s Cos., Inc. | 192,000 | 13,758,720 |
|
| Michaels Cos., Inc. (The) † | 189,178 | 4,124,080 |
|
| TJX Cos., Inc. (The) | 85,100 | 6,062,524 |
|
| | | 56,329,013 |
| | |
| COMMON STOCKS (98.0%)* cont. | Shares | Value |
|
| Technology hardware, storage, and peripherals (4.7%) | | |
| Apple, Inc. | 572,469 | $55,724,130 |
|
| EMC Corp. | 455,900 | 11,292,643 |
|
| Hewlett Packard Enterprise Co. | 337,992 | 4,650,770 |
|
| HP, Inc. | 337,992 | 3,281,902 |
|
| Western Digital Corp. | 96,700 | 4,639,666 |
|
| | 79,589,111 |
| Textiles, apparel, and luxury goods (0.7%) | | |
| NIKE, Inc. Class B | 203,600 | 12,625,236 |
|
| | 12,625,236 |
| Tobacco (0.4%) | | |
| Philip Morris International, Inc. | 75,200 | 6,768,752 |
|
| | | 6,768,752 |
| | | |
| Total common stocks (cost $1,551,911,603) | | $1,666,505,585 |
|
| |
| CONVERTIBLE PREFERRED STOCKS (0.9%)* | Shares | Value |
|
| Allergan PLC Ser. A, 5.50% cv. pfd. | 4,047 | $3,837,730 |
|
| American Tower Corp. $5.50 cv. pfd. R | 37,928 | 3,756,010 |
|
| Iridium Communications, Inc. 7.00% cv. pfd. | 27,936 | 2,507,256 |
|
| Teva Pharmaceutical Industries, Ltd. 7.00% cv. pfd. (Israel) † | 6,031 | 5,886,256 |
|
| Total convertible preferred stocks (cost $16,664,400) | | $15,987,252 |
|
| |
| SHORT-TERM INVESTMENTS (3.0%)* | Shares | Value |
|
| Putnam Cash Collateral Pool, LLC 0.53% d | 30,590,825 | $30,590,825 |
|
| Putnam Short Term Investment Fund 0.39% L | 21,092,709 | 21,092,709 |
|
| Total short-term investments (cost $51,683,534) | | $51,683,534 |
|
| |
| TOTAL INVESTMENTS | | |
|
| Total investments (cost $1,620,259,537) | | $1,734,176,371 |
Key to holding’s abbreviations
| |
| ADR | American Depository Receipts: represents ownership of foreign securities on deposit with a custodian bank |
Notes to the fund’s portfolio
Unless noted otherwise, the notes to the fund’s portfolio are for the close of the fund’s reporting period, which ran from August 1, 2015 through January 31, 2016 (the reporting period). Within the following notes to the portfolio, references to “ASC 820” represent Accounting Standards Codification 820 Fair Value Measurements and Disclosures and references to “OTC”, if any, represent over-the-counter.
* Percentages indicated are based on net assets of $1,700,830,312.
† This security is non-income-producing.
∆∆ This security is restricted with regard to public resale. The total fair value of this security and any other restricted securities (excluding 144A securities), if any, held at the close of the reporting period was $915,505, or 0.1% of net assets.
d Affiliated company. See Note 1 to the financial statements regarding securities lending. The rate quoted in the security description is the annualized 7-day yield of the fund at the close of the reporting period.
F This security is valued by Putnam Management at fair value following procedures approved by the Trustees. Securities may be classified as Level 2 or Level 3 for ASC 820 based on the securities’ valuation inputs. At the close of the reporting period, fair value pricing was also used for certain foreign securities in the portfolio (Note 1).
L Affiliated company (Note 5). The rate quoted in the security description is the annualized 7-day yield of the fund at the close of the reporting period.
R Real Estate Investment Trust.
S Security on loan, in part or in entirety, at the close of the reporting period (Note 1).
At the close of the reporting period, the fund maintained liquid assets totaling $67 to cover the settlement of certain securities.
ASC 820 establishes a three-level hierarchy for disclosure of fair value measurements. The valuation hierarchy is based upon the transparency of inputs to the valuation of the fund’s investments. The three levels are defined as follows:
Level 1: Valuations based on quoted prices for identical securities in active markets.
Level 2: Valuations based on quoted prices in markets that are not active or for which all significant inputs are observable, either directly or indirectly.
Level 3: Valuations based on inputs that are unobservable and significant to the fair value measurement.
The following is a summary of the inputs used to value the fund’s net assets as of the close of the reporting period:
| | | | |
| | | | | Valuation inputs | |
|
| Investments in securities: | | Level 1 | Level 2 | Level 3 |
|
| Common stocks*: | | | | |
|
| Consumer discretionary | | $212,883,456 | $— | $915,505 |
|
| Consumer staples | | 155,922,983 | — | — |
|
| Energy | | 105,700,021 | — | — |
|
| Financials | | 294,294,642 | 2,239,244 | — |
|
| Health care | | 251,047,711 | — | — |
|
| Industrials | | 160,981,918 | — | — |
|
| Information technology | | 371,140,317 | — | — |
|
| Materials | | 41,817,536 | 2,442,722 | — |
|
| Telecommunication services | | 33,507,050 | — | — |
|
| Utilities | | 33,612,480 | — | — |
|
| Total common stocks | | 1,660,908,114 | 4,681,966 | 915,505 |
| | | | | |
| Convertible preferred stocks | | — | 15,987,252 | — |
|
| Short-term investments | | 21,092,709 | 30,590,825 | — |
|
| Totals by level | | $1,682,000,823 | $51,260,043 | $915,505 |
* Common stock classifications are presented at the sector level, which may differ from the fund’s portfolio presentation.
During the reporting period, transfers within the fair value hierarchy, if any, (other than certain transfers involving non-U.S. equity securities as described in Note 1) did not represent, in the aggregate, more than 1% of the fund’s net assets measured as of the end of the period. Transfers are accounted for using the end of period pricing valuation method.
At the start and close of the reporting period, Level 3 investments in securities represented less than 1% of the fund’s net assets and were not considered a significant portion of the fund’s portfolio.
The accompanying notes are an integral part of these financial statements.
Statement of assets and liabilities 1/31/16 (Unaudited)
| |
| ASSETS | |
|
| Investment in securities, at value, including $30,386,961 of securities on loan (Note 1): | |
| Unaffiliated issuers (identified cost $1,568,576,003) | $1,682,492,837 |
| Affiliated issuers (identified cost $51,683,534) (Notes 1 and 5) | 51,683,534 |
|
| Dividends, interest and other receivables | 2,235,014 |
|
| Receivable for shares of the fund sold | 852,702 |
|
| Receivable for investments sold | 8,749,196 |
|
| Prepaid assets | 67,782 |
|
| Total assets | 1,746,081,065 |
| |
| LIABILITIES | |
|
| Payable for investments purchased | 7,610,589 |
|
| Payable for shares of the fund repurchased | 4,242,145 |
|
| Payable for compensation of Manager (Note 2) | 800,541 |
|
| Payable for custodian fees (Note 2) | 10,484 |
|
| Payable for investor servicing fees (Note 2) | 595,412 |
|
| Payable for Trustee compensation and expenses (Note 2) | 778,205 |
|
| Payable for administrative services (Note 2) | 17,436 |
|
| Payable for distribution fees (Note 2) | 377,254 |
|
| Collateral on securities loaned, at value (Note 1) | 30,590,825 |
|
| Other accrued expenses | 227,862 |
|
| Total liabilities | 45,250,753 |
| | |
| Net assets | $1,700,830,312 |
|
| |
| REPRESENTED BY | |
|
| Paid-in capital (Unlimited shares authorized) (Notes 1 and 4) | $2,036,221,885 |
|
| Distributions in excess of net investment income (Note 1) | (942,816) |
|
| Accumulated net realized loss on investments and foreign currency transactions (Note 1) | (448,363,222) |
|
| Net unrealized appreciation of investments and assets and liabilities in foreign currencies | 113,914,465 |
|
| Total — Representing net assets applicable to capital shares outstanding | $1,700,830,312 |
(Continued on next page)
Statement of assets and liabilities (Continued)
| |
| COMPUTATION OF NET ASSET VALUE AND OFFERING PRICE | |
|
| Net asset value and redemption price per class A share | |
| ($1,356,331,773 divided by 68,823,312 shares) | $19.71 |
|
| Offering price per class A share (100/94.25 of $19.71)* | $20.91 |
|
| Net asset value and offering price per class B share ($35,004,100 divided by 1,979,175 shares)** | $17.69 |
|
| Net asset value and offering price per class C share ($54,034,465 divided by 2,904,566 shares)** | $18.60 |
|
| Net asset value and redemption price per class M share ($20,410,326 divided by 1,099,651 shares) | $18.56 |
|
| Offering price per class M share (100/96.50 of $18.56)* | $19.23 |
|
| Net asset value, offering price and redemption price per class R share | |
| ($2,772,391 divided by 142,725 shares) | $19.42 |
|
| Net asset value, offering price and redemption price per class R5 share | |
| ($15,178 divided by 755 shares)† | $20.09 |
|
| Net asset value, offering price and redemption price per class R6 share | |
| ($16,791,892 divided by 837,045 shares) | $20.06 |
|
| Net asset value, offering price and redemption price per class Y share | |
| ($215,470,187 divided by 10,784,325 shares) | $19.98 |
|
* On single retail sales of less than $50,000. On sales of $50,000 or more the offering price is reduced.
** Redemption price per share is equal to net asset value less any applicable contingent deferred sales charge.
† Net asset value may not recalculate due to rounding of fractional shares.
The accompanying notes are an integral part of these financial statements.
Statement of operations Six months ended 1/31/16 (Unaudited)
| |
| INVESTMENT INCOME | |
|
| Dividends (net of foreign tax of $65,238) | $20,703,245 |
|
| Interest (including interest income of $22,255 from investments in affiliated issuers) (Note 5) | 27,123 |
|
| Securities lending (Note 1) | 76,965 |
|
| Total investment income | 20,807,333 |
| |
| EXPENSES | |
|
| Compensation of Manager (Note 2) | 5,075,700 |
|
| Investor servicing fees (Note 2) | 1,804,665 |
|
| Custodian fees (Note 2) | 11,352 |
|
| Trustee compensation and expenses (Note 2) | 70,331 |
|
| Distribution fees (Note 2) | 2,410,697 |
|
| Administrative services (Note 2) | 28,751 |
|
| Other | 329,436 |
|
| Total expenses | 9,730,932 |
| | |
| Expense reduction (Note 2) | (14,543) |
|
| Net expenses | 9,716,389 |
| | |
| Net investment income | 11,090,944 |
|
| |
| Net realized gain on investments (Notes 1 and 3) | 3,174,842 |
|
| Net realized loss on foreign currency transactions (Note 1) | (4,319) |
|
| Net unrealized depreciation of assets and liabilities in foreign currencies during the period | (378) |
|
| Net unrealized depreciation of investments during the period | (228,311,821) |
|
| Net loss on investments | (225,141,676) |
| | |
| Net decrease in net assets resulting from operations | $(214,050,732) |
|
The accompanying notes are an integral part of these financial statements.
Statement of changes in net assets
| | |
| INCREASE (DECREASE) IN NET ASSETS | Six months ended 1/31/16* | Year ended 7/31/15 |
|
| Operations: | | |
| Net investment income | $11,090,944 | $16,493,220 |
|
| Net realized gain on investments | | |
| and foreign currency transactions | 3,170,523 | 132,183,131 |
|
| Net unrealized appreciation (depreciation) of investments | | |
| and assets and liabilities in foreign currencies | (228,312,199) | 9,993,576 |
|
| Net increase (decrease) in net assets resulting | | |
| from operations | (214,050,732) | 158,669,927 |
|
| Distributions to shareholders (Note 1): | | |
| From ordinary income | | |
| Net investment income | | |
|
| Class A | (21,558,632) | (14,318,680) |
|
| Class B | (310,029) | (127,600) |
|
| Class C | (538,027) | (173,070) |
|
| Class M | (229,369) | (116,965) |
|
| Class R | (30,824) | (30,106) |
|
| Class R5 | (279) | (193) |
|
| Class R6 | (330,684) | (211,123) |
|
| Class Y | (4,041,460) | (1,130,271) |
|
| Increase (decrease) from capital share transactions (Note 4) | (15,906,409) | 111,357,043 |
|
| Total increase (decrease) in net assets | (256,996,445) | 253,918,962 |
| |
| NET ASSETS | | |
|
| Beginning of period | 1,957,826,757 | 1,703,907,795 |
|
| End of period (including distributions in excess of net | | |
| investment income of $942,816 and undistributed net | | |
| investment income of $15,005,544, respectively) | $1,700,830,312 | $1,957,826,757 |
|
* Unaudited.
The accompanying notes are an integral part of these financial statements.
|
| This page left blank intentionally. |
Financial highlights (For a common share outstanding throughout the period)
| | | | | | | | | | | | | |
| INVESTMENT OPERATIONS: | | | LESS DISTRIBUTIONS: | | | RATIOS AND SUPPLEMENTAL DATA: | |
|
| | | | | | | | | | | | | Ratio of net | |
| | | | | | | | | | | | Ratio | investment | |
| | Net asset | | Net realized | | | | Non- | | | | of expenses | income (loss) | |
| | value, | | and unrealized | Total from | From | | recurring | Net asset | Total return | Net assets, | to average | to average | Portfolio |
| | beginning | Net investment | gain (loss) | investment | net investment | Total | reimburse | value, end | at net asset | end of period | net assets | net assets | turnover |
| Period ended | of period | income (loss)a | on investments | operations | income | distributions | ments | of period | value (%)b | (in thousands) | (%)c | (%) | (%) |
|
| Class A | | | | | | | | | | | | | |
| January 31, 2016** | $22.46 | .13 | (2.57) | (2.44) | (.31) | (.31) | — | $19.71 | (10.97)* | $1,356,332 | .53* | .61* | 16* |
| July 31, 2015 | 20.73 | .20 | 1.73 | 1.93 | (.20) | (.20) | — | 22.46 | 9.32 | 1,590,907 | 1.03 | .92 | 44 |
| July 31, 2014 | 17.64 | .21 | 3.09 | 3.30 | (.21) | (.21) | — | 20.73 | 18.84 | 1,508,086 | 1.08 | 1.09 | 63 |
| July 31, 2013 | 13.89 | .20 | 3.70 | 3.90 | (.15) | (.15) | — | 17.64 | 28.29 | 1,364,640 | 1.14 | 1.28 | 77 |
| July 31, 2012 | 13.12 | .14 | .76 | .90 | (.13) | (.13) | —d,e | 13.89 | 6.95 | 1,191,455 | 1.20 | 1.11 | 49 |
| July 31, 2011 | 11.15 | .11 | 1.95 | 2.06 | (.09) | (.09) | —d,f | 13.12 | 18.54 | 1,264,410 | 1.18 | .86 | 65 |
|
| Class B | | | | | | | | | | | | | |
| January 31, 2016** | $20.10 | .04 | (2.30) | (2.26) | (.15) | (.15) | — | $17.69 | (11.29)* | $35,004 | .90* | .24* | 16* |
| July 31, 2015 | 18.58 | .03 | 1.54 | 1.57 | (.05) | (.05) | — | 20.10 | 8.46 | 42,998 | 1.78 | .18 | 44 |
| July 31, 2014 | 15.84 | .06 | 2.77 | 2.83 | (.09) | (.09) | — | 18.58 | 17.93 | 47,935 | 1.83 | .35 | 63 |
| July 31, 2013 | 12.48 | .08 | 3.32 | 3.40 | (.04) | (.04) | — | 15.84 | 27.35 | 51,200 | 1.89 | .55 | 77 |
| July 31, 2012 | 11.79 | .04 | .68 | .72 | (.03) | (.03) | —d,e | 12.48 | 6.09 | 52,017 | 1.95 | .38 | 49 |
| July 31, 2011 | 10.01 | .01 | 1.77 | 1.78 | — | — | —d,f | 11.79 | 17.78 | 66,615 | 1.93 | .12 | 65 |
|
| Class C | | | | | | | | | | | | | |
| January 31, 2016** | $21.18 | .04 | (2.43) | (2.39) | (.19) | (.19) | — | $18.60 | (11.35)* | $54,034 | .90* | .22* | 16* |
| July 31, 2015 | 19.59 | .03 | 1.64 | 1.67 | (.08) | (.08) | — | 21.18 | 8.51 | 52,357 | 1.78 | .16 | 44 |
| July 31, 2014 | 16.70 | .06 | 2.93 | 2.99 | (.10) | (.10) | — | 19.59 | 17.93 | 40,199 | 1.83 | .33 | 63 |
| July 31, 2013 | 13.16 | .08 | 3.50 | 3.58 | (.04) | (.04) | — | 16.70 | 27.31 | 34,080 | 1.89 | .53 | 77 |
| July 31, 2012 | 12.43 | .04 | .72 | .76 | (.03) | (.03) | —d,e | 13.16 | 6.14 | 30,509 | 1.95 | .37 | 49 |
| July 31, 2011 | 10.56 | .01 | 1.87 | 1.88 | (.01) | (.01) | —d,f | 12.43 | 17.76 | 33,041 | 1.93 | .11 | 65 |
|
| Class M | | | | | | | | | | | | | |
| January 31, 2016** | $21.12 | .07 | (2.42) | (2.35) | (.21) | (.21) | — | $18.56 | (11.21)* | $20,410 | .78* | .36* | 16* |
| July 31, 2015 | 19.52 | .09 | 1.61 | 1.70 | (.10) | (.10) | — | 21.12 | 8.73 | 23,661 | 1.53 | .42 | 44 |
| July 31, 2014 | 16.63 | .11 | 2.91 | 3.02 | (.13) | (.13) | — | 19.52 | 18.26 | 22,649 | 1.58 | .59 | 63 |
| July 31, 2013 | 13.10 | .11 | 3.50 | 3.61 | (.08) | (.08) | — | 16.63 | 27.67 | 20,852 | 1.64 | .78 | 77 |
| July 31, 2012 | 12.38 | .08 | .70 | .78 | (.06) | (.06) | —d,e | 13.10 | 6.37 | 18,740 | 1.70 | .62 | 49 |
| July 31, 2011 | 10.52 | .04 | 1.86 | 1.90 | (.04) | (.04) | —d,f | 12.38 | 18.04 | 20,483 | 1.68 | .36 | 65 |
|
| Class R | | | | | | | | | | | | | |
| January 31, 2016** | $22.07 | .11 | (2.55) | (2.44) | (.21) | (.21) | — | $19.42 | (11.12)* | $2,772 | .65* | .51* | 16* |
| July 31, 2015 | 20.39 | .14 | 1.70 | 1.84 | (.16) | (.16) | — | 22.07 | 9.03 | 4,559 | 1.28 | .66 | 44 |
| July 31, 2014 | 17.37 | .16 | 3.04 | 3.20 | (.18) | (.18) | — | 20.39 | 18.53 | 3,641 | 1.33 | .83 | 63 |
| July 31, 2013 | 13.68 | .15 | 3.66 | 3.81 | (.12) | (.12) | — | 17.37 | 28.03 | 2,871 | 1.39 | 1.00 | 77 |
| July 31, 2012 | 12.95 | .11 | .73 | .84 | (.11) | (.11) | —d,e | 13.68 | 6.59 | 2,053 | 1.45 | .86 | 49 |
| July 31, 2011 | 11.00 | .08 | 1.94 | 2.02 | (.07) | (.07) | —d,f | 12.95 | 18.35 | 1,423 | 1.43 | .60 | 65 |
|
| Class R5 | | | | | | | | | | | | | |
| January 31, 2016**# | $22.90 | .17 | (2.60) | (2.43) | (.38) | (.38) | — | $20.09 | (10.76)* | $15 | .38* | .76* | 16* |
| July 31, 2015 | 21.12 | .27 | 1.77 | 2.04 | (.26) | (.26) | — | 22.90 | 9.69 | 17 | .74 | 1.21 | 44 |
| July 31, 2014 | 17.97 | .28 | 3.15 | 3.43 | (.28) | (.28) | — | 21.12 | 19.21 | 16 | .76 | 1.40 | 63 |
| July 31, 2013 | 14.10 | .26 | 3.77 | 4.03 | (.16) | (.16) | — | 17.97 | 28.85 | 13 | .76 | 1.64 | 77 |
| July 31, 2012† | 13.97 | .01 | .12 | .13 | — | — | — | 14.10 | .93* | 10 | .06* | .08* | 49 |
|
See notes to financial highlights at the end of this section.
The accompanying notes are an integral part of these financial statements.
| | | |
| 30 | Investors Fund | Investors Fund | 31 |
Financial highlights (Continued)
| | | | | | | | | | | | | |
| INVESTMENT OPERATIONS: | | LESS DISTRIBUTIONS: | | | RATIOS AND SUPPLEMENTAL DATA: | |
|
| | | | | | | | | | | | | Ratio of net | |
| | | | | | | | | | | | Ratio | investment | |
| | Net asset | | Net realized | | | | Non- | | | | of expenses | income (loss) | |
| | value, | | and unrealized | Total from | From | | recurring | Net asset | Total return | Net assets, | to average | to average | Portfolio |
| | beginning | Net investment | gain (loss) | investment | net investment | Total | reimburse | value, end | at net asset | end of period | net assets | net assets | turnover |
| Period ended | of period | income (loss)a | on investments | operations | income | distributions | ments | of period | value (%)b | (in thousands) | (%)c | (%) | (%) |
|
| Class R6 | | | | | | | | | | | | | |
| January 31, 2016** | $22.90 | .17 | (2.61) | (2.44) | (.40) | (.40) | — | $20.06 | (10.80)* | $16,792 | .33* | .81* | 16* |
| July 31, 2015 | 21.13 | .29 | 1.76 | 2.05 | (.28) | (.28) | — | 22.90 | 9.74 | 19,178 | .64 | 1.31 | 44 |
| July 31, 2014 | 17.98 | .30 | 3.15 | 3.45 | (.30) | (.30) | — | 21.13 | 19.32 | 15,633 | .66 | 1.51 | 63 |
| July 31, 2013 | 14.10 | .23g | 3.82 | 4.05 | (.17) | (.17) | — | 17.98 | 28.98 | 13,890 | .66 | 1.32g | 77 |
| July 31, 2012† | 13.97 | .01 | .12 | .13 | — | — | — | 14.10 | .93* | 10 | .05* | .08* | 49 |
|
| Class Y | | | | | | | | | | | | | |
| January 31, 2016** | $22.81 | .16 | (2.61) | (2.45) | (.38) | (.38) | — | $19.98 | (10.88)* | $215,470 | .40* | .73* | 16* |
| July 31, 2015 | 21.06 | .25 | 1.76 | 2.01 | (.26) | (.26) | — | 22.81 | 9.57 | 224,149 | .78 | 1.10 | 44 |
| July 31, 2014 | 17.91 | .26 | 3.14 | 3.40 | (.25) | (.25) | — | 21.06 | 19.15 | 65,749 | .83 | 1.33 | 63 |
| July 31, 2013 | 14.10 | .24 | 3.76 | 4.00 | (.19) | (.19) | — | 17.91 | 28.63 | 50,187 | .89 | 1.54 | 77 |
| July 31, 2012 | 13.32 | .18 | .76 | .94 | (.16) | (.16) | —d,e | 14.10 | 7.21 | 44,865 | .95 | 1.35 | 49 |
| July 31, 2011 | 11.32 | .14 | 1.98 | 2.12 | (.12) | (.12) | —d,f | 13.32 | 18.82 | 40,316 | .93 | 1.10 | 65 |
|
* Not annualized.
** Unaudited.
† For the period July 3, 2012 (commencement of operations) to July 31, 2012.
# Effective February 1, 2016, the fund has liquidated its class R5 shares.
a Per share net investment income (loss) has been determined on the basis of the weighted average number of shares outstanding during the period.
b Total return assumes dividend reinvestment and does not reflect the effect of sales charges.
c Includes amounts paid through expense offset and/or brokerage/service arrangements, if any (Note 2). Also excludes acquired fund fees and expenses, if any.
d Amount represents less than $0.01 per share.
e Reflects a non-recurring reimbursement pursuant to a settlement between the Securities and Exchange Commission (the SEC) and Southwest Securities, Inc. (SWS) which amounted to less than $0.01 per share outstanding on August 22, 2011.
f Reflects a non-recurring reimbursement related to restitution payments in connection with a distribution plan approved by the SEC which amounted to less than $0.01 per share outstanding on July 21, 2011. Also reflects a non-recurring reimbursement related to short-term trading related lawsuits, which amounted to less than $0.01 per share outstanding on May 11, 2011.
g The net investment income ratio and per share amount shown for the period ending may not correspond with the expected class specific differences for the period due to the timing of subscriptions into the class.
| |
| The accompanying notes are an integral part of these financial statements. | The accompanying notes are an integral part of these financial statements. |
| | | |
| 32 | Investors Fund | Investors Fund | 33 |
Notes to financial statements 1/31/16 (Unaudited)
Within the following Notes to financial statements, references to “State Street” represent State Street Bank and Trust Company, references to “the SEC” represent the Securities and Exchange Commission, references to “Putnam Management” represent Putnam Investment Management, LLC, the fund’s manager, an indirect wholly-owned subsidiary of Putnam Investments, LLC and references to “OTC”, if any, represent over-the-counter. Unless otherwise noted, the “reporting period” represents the period from August 1, 2015 through January 31, 2016.
Putnam Investors Fund (the fund) is a Massachusetts business trust, which is registered under the Investment Company Act of 1940, as amended, as a diversified open-end management investment company. The goal of the fund is to seek long-term growth of capital and any increased income that results from this growth. The fund invests mainly in common stocks (growth or value stocks or both) of large U.S. companies that Putnam Management believes have favorable investment potential. For example, the fund may purchase stocks of companies with stock prices that reflect a value lower than that which Putnam Management places on the company. Putnam Management may also consider other factors that Putnam Management believes will cause the stock price to rise and may consider, among other factors, a company’s valuation, financial strength, growth potential, competitive position in its industry, projected future earnings, cash flows and dividends when deciding whether to buy or sell investments.
The fund offers class A, class B, class C, class M, class R, class R5, class R6 and class Y shares. Effective February 1, 2016, the fund has terminated its class R5 shares. Class A and class M shares are sold with a maximum front-end sales charge of 5.75% and 3.50%, respectively. Class A shares generally do not pay a contingent deferred sales charge and class M shares do not pay a contingent deferred sales charge. Prior to November 1, 2015, class M shares were able to pay a contingent deferred sales charge. Class B shares, which convert to class A shares after approximately eight years, do not pay a front-end sales charge and are subject to a contingent deferred sales charge if those shares are redeemed within six years of purchase. Class C shares have a one-year 1.00% contingent deferred sales charge and do not convert to class A shares. Class R shares, which are not available to all investors, are sold at net asset value. The expenses for class A, class B, class C, class M and class R shares may differ based on the distribution fee of each class, which is identified in Note 2. Class R5, class R6 and class Y shares, which are sold at net asset value, are generally subject to the same expenses as class A, class B, class C, class M and class R shares, but do not bear a distribution fee and in the case of class R5 and class R6 shares, bear a lower investor servicing fee, which is identified in Note 2. Class R5, class R6 and class Y shares are not available to all investors.
In the normal course of business, the fund enters into contracts that may include agreements to indemnify another party under given circumstances. The fund’s maximum exposure under these arrangements is unknown as this would involve future claims that may be, but have not yet been, made against the fund. However, the fund’s management team expects the risk of material loss to be remote.
Note 1: Significant accounting policies
The following is a summary of significant accounting policies consistently followed by the fund in the preparation of its financial statements. The preparation of financial statements is in conformity with accounting principles generally accepted in the United States of America and requires management to make estimates and assumptions that affect the reported amounts of assets and liabilities in the financial statements and the reported amounts of increases and decreases in net assets from operations. Actual results could differ from those estimates. Subsequent events after the Statement of assets and liabilities date through the date that the financial statements were issued have been evaluated in the preparation of the financial statements.
Investment income, realized and unrealized gains and losses and expenses of the fund are borne pro-rata based on the relative net assets of each class to the total net assets of the fund, except that each class bears expenses unique to that class (including the distribution fees applicable to such classes). Each class votes as a class only with respect to its own distribution plan or other matters on which a class vote is required by law or determined by the Trustees. If the fund were liquidated, shares of each class would receive their pro-rata share of the net assets of the fund. In addition, the Trustees declare separate dividends on each class of shares.
Security valuation Portfolio securities and other investments are valued using policies and procedures adopted by the Board of Trustees. The Trustees have formed a Pricing Committee to oversee the implementation of these procedures and have delegated responsibility for valuing the fund’s assets in accordance with these procedures to Putnam Management. Putnam Management has established an internal Valuation Committee that is responsible for making fair value determinations, evaluating the effectiveness of the pricing policies of the fund and reporting to the Pricing Committee.
Investments for which market quotations are readily available are valued at the last reported sales price on their principal exchange, or official closing price for certain markets, and are classified as Level 1 securities under Accounting Standards Codification 820 Fair Value Measurements and Disclosures (ASC 820). If no sales are reported, as in the case of some securities that are traded OTC, a security is valued at its last reported bid price and is generally categorized as a Level 2 security.
Investments in open-end investment companies (excluding exchange-traded funds), if any, which can be classified as Level 1 or Level 2 securities, are valued based on their net asset value. The net asset value of such investment companies equals the total value of their assets less their liabilities and divided by the number of their outstanding shares.
Many securities markets and exchanges outside the U.S. close prior to the close of the New York Stock Exchange and therefore the closing prices for securities in such markets or on such exchanges may not fully reflect events that occur after such close but before the close of the New York Stock Exchange. Accordingly, on certain days, the fund will fair value foreign equity securities taking into account multiple factors including movements in the U.S. securities markets, currency valuations and comparisons to the valuation of American Depository Receipts, exchange-traded funds and futures contracts. These securities, which would generally be classified as Level 1 securities, will be transferred to Level 2 of the fair value hierarchy when they are valued at fair value. The number of days on which fair value prices will be used will depend on market activity and it is possible that fair value prices will be used by the fund to a significant extent. At the close of the reporting period, fair value pricing was used for certain foreign securities in the portfolio. Securities quoted in foreign currencies, if any, are translated into U.S. dollars at the current exchange rate. Short-term securities with remaining maturities of 60 days or less may be valued at amortized cost, which approximates fair value, and are classified as Level 2 securities.
To the extent a pricing service or dealer is unable to value a security or provides a valuation that Putnam Management does not believe accurately reflects the security’s fair value, the security will be valued at fair value by Putnam Management in accordance with policies and procedures approved by the Trustees. Certain investments, including certain restricted and illiquid securities and derivatives, are also valued at fair value following procedures approved by the Trustees. These valuations consider such factors as significant market or specific security events such as interest rate or credit quality changes, various relationships with other securities, discount rates, U.S. Treasury, U.S. swap and credit yields, index levels, convexity exposures, recovery rates, sales and other multiples and resale restrictions. These securities are classified as Level 2 or as Level 3 depending on the priority of the significant inputs.
To assess the continuing appropriateness of fair valuations, the Valuation Committee reviews and affirms the reasonableness of such valuations on a regular basis after considering all relevant information that is reasonably available. Such valuations and procedures are reviewed periodically by the Trustees. The fair value of securities is generally determined as the amount that the fund could reasonably expect to realize from an orderly disposition of such securities over a reasonable period of time. By its nature, a fair value price is a good faith estimate of the value of a security in a current sale and does not reflect an actual market price, which may be different by a material amount.
Security transactions and related investment income Security transactions are recorded on the trade date (the date the order to buy or sell is executed). Gains or losses on securities sold are determined on the identified cost basis.
Interest income, net of any applicable withholding taxes, is recorded on the accrual basis. Dividend income, net of any applicable withholding taxes, is recognized on the ex-dividend date except that certain dividends from foreign securities, if any, are recognized as soon as the fund is informed of the ex-dividend date. Non-cash dividends, if any, are recorded at the fair value of the securities received. Dividends representing a return of capital or capital gains, if any, are reflected as a reduction of cost and/or as a realized gain.
Foreign currency translation The accounting records of the fund are maintained in U.S. dollars. The fair value of foreign securities, currency holdings, and other assets and liabilities is recorded in the books and records of the fund after translation to U.S. dollars based on the exchange rates on that day. The cost of each security is determined using historical exchange rates. Income and withholding taxes are translated at prevailing exchange rates when earned or incurred. The fund does not isolate that portion of realized or unrealized gains or losses resulting from changes in the foreign exchange rate on investments from fluctuations arising from changes in the market prices of the securities. Such gains and losses are included with the net realized and unrealized gain or loss on investments. Net realized gains and losses on foreign currency transactions represent net realized exchange gains or losses on closed forward currency contracts, disposition of foreign currencies, currency gains and losses realized between the trade and settlement dates on securities transactions and the difference between the amount of investment income and foreign withholding taxes recorded on the fund’s books and the U.S. dollar equivalent
amounts actually received or paid. Net unrealized appreciation and depreciation of assets and liabilities in foreign currencies arise from changes in the value of open forward currency contracts and assets and liabilities other than investments at the period end, resulting from changes in the exchange rate.
Securities lending The fund may lend securities, through its agent, to qualified borrowers in order to earn additional income. The loans are collateralized by cash in an amount at least equal to the fair value of the securities loaned. The fair value of securities loaned is determined daily and any additional required collateral is allocated to the fund on the next business day. The remaining maturities of the securities lending transactions are considered overnight and continuous. The risk of borrower default will be borne by the fund’s agent; the fund will bear the risk of loss with respect to the investment of the cash collateral. Income from securities lending is included in investment income on the Statement of operations. Cash collateral is invested in Putnam Cash Collateral Pool, LLC, a limited liability company managed by an affiliate of Putnam Management. Investments in Putnam Cash Collateral Pool, LLC are valued at its closing net asset value each business day. There are no management fees charged to Putnam Cash Collateral Pool, LLC. At the close of the reporting period, the fund received cash collateral of $30,590,825 and the value of securities loaned amounted to $30,386,961.
Interfund lending The fund, along with other Putnam funds, may participate in an interfund lending program pursuant to an exemptive order issued by the SEC. This program allows the fund to borrow from or lend to other Putnam funds that permit such transactions. Interfund lending transactions are subject to each fund’s investment policies and borrowing and lending limits. Interest earned or paid on the interfund lending transaction will be based on the average of certain current market rates. During the reporting period, the fund did not utilize the program.
Lines of credit The fund participates, along with other Putnam funds, in a $392.5 million syndicated unsecured committed line of credit provided by State Street ($292.5 million) and Northern Trust Company ($100 million) and a $235.5 million unsecured uncommitted line of credit provided by State Street. Borrowings may be made for temporary or emergency purposes, including the funding of shareholder redemption requests and trade settlements. Interest is charged to the fund based on the fund’s borrowing at a rate equal to the higher of (1) the Federal Funds rate and (2) the overnight LIBOR plus 1.25% for the committed line of credit and the Federal Funds rate plus 1.30% for the uncommitted line of credit. A closing fee equal to 0.04% of the committed line of credit and 0.04% of the uncommitted line of credit has been paid by the participating funds. In addition, a commitment fee of 0.16% per annum on any unutilized portion of the committed line of credit is allocated to the participating funds based on their relative net assets and paid quarterly. During the reporting period, the fund had no borrowings against these arrangements.
Federal taxes It is the policy of the fund to distribute all of its taxable income within the prescribed time period and otherwise comply with the provisions of the Internal Revenue Code of 1986, as amended (the Code), applicable to regulated investment companies. It is also the intention of the fund to distribute an amount sufficient to avoid imposition of any excise tax under Section 4982 of the Code.
The fund is subject to the provisions of Accounting Standards Codification 740 Income Taxes (ASC 740). ASC 740 sets forth a minimum threshold for financial statement recognition of the benefit of a tax position taken or expected to be taken in a tax return. The fund did not have a liability to record for any unrecognized tax benefits in the accompanying financial statements. No provision has been made for federal taxes on income, capital gains or unrealized appreciation on securities held nor for excise tax on income and capital gains. Each of the fund’s federal tax returns for the prior three fiscal years remains subject to examination by the Internal Revenue Service.
The fund may also be subject to taxes imposed by governments of countries in which it invests. Such taxes are generally based on either income or gains earned or repatriated. The fund accrues and applies such taxes to net investment income, net realized gains and net unrealized gains as income and/or capital gains are earned. In some cases, the fund may be entitled to reclaim all or a portion of such taxes, and such reclaim amounts, if any, are reflected as an asset on the fund’s books. In many cases, however, the fund may not receive such amounts for an extended period of time, depending on the country of investment.
At July 31, 2015, the fund had a capital loss carryover of $450,535,183 available to the extent allowed by the Code to offset future net capital gain, if any. The amounts of the carryovers and the expiration dates are:
| | | |
| Loss carryover |
|
| Short-term | Long-term | Total | Expiration |
|
| $12,333,142 | N/A | $12,333,142 | July 31, 2016 |
|
| 179,561,301 | N/A | 179,561,301 | July 31, 2017 |
|
| 258,640,740 | N/A | 258,640,740 | July 31, 2018 |
|
Under the Regulated Investment Company Modernization Act of 2010, the fund will be permitted to carry forward capital losses incurred in taxable years beginning after December 22, 2010 for an unlimited period. However, any losses incurred will be required to be utilized prior to the losses incurred in pre-enactment tax years. As a result of this ordering rule, pre-enactment capital loss carryforwards may be more likely to expire unused. Additionally, post-enactment capital losses that are carried forward will retain their character as either short-term or long-term capital losses rather than being considered all short-term as under previous law.
The aggregate identified cost on a tax basis is $1,621,258,099, resulting in gross unrealized appreciation and depreciation of $296,207,102 and $183,288,830, respectively, or net unrealized appreciation of $112,918,272.
Distributions to shareholders Distributions to shareholders from net investment income are recorded by the fund on the ex-dividend date. Distributions from capital gains, if any, are recorded on the ex-dividend date and paid at least annually. The amount and character of income and gains to be distributed are determined in accordance with income tax regulations, which may differ from generally accepted accounting principles. Dividend sources are estimated at the time of declaration. Actual results may vary. Any non-taxable return of capital cannot be determined until final tax calculations are completed after the end of the fund’s fiscal year. Reclassifications are made to the fund’s capital accounts to reflect income and gains available for distribution (or available capital loss carryovers) under income tax regulations.
Note 2: Management fee, administrative services and other transactions
The fund pays Putnam Management a management fee (based on the fund’s average net assets and computed and paid monthly) at annual rates that may vary based on the average of the aggregate net assets of most open-end funds, as defined in the fund’s management contract, sponsored by Putnam Management. Such annual rates may vary as follows:
| | | | |
| 0.710% | of the first $5 billion, | | 0.510% | of the next $50 billion, |
| |
|
| 0.660% | of the next $5 billion, | | 0.490% | of the next $50 billion, |
| |
|
| 0.610% | of the next $10 billion, | | 0.480% | of the next $100 billion and |
| |
|
| 0.560% | of the next $10 billion, | | 0.475% | of any excess thereafter. |
| |
|
Putnam Management has contractually agreed, through November 30, 2016, to waive fees or reimburse the fund’s expenses to the extent necessary to limit the cumulative expenses of the fund, exclusive of brokerage, interest, taxes, investment-related expenses, extraordinary expenses, acquired fund fees and expenses and payments under the fund’s investor servicing contract, investment management contract and distribution plans, on a fiscal year-to-date basis to an annual rate of 0.20% of the fund’s average net assets over such fiscal year-to-date period. During the reporting period, the fund’s expenses were not reduced as a result of this limit.
Putnam Investments Limited (PIL), an affiliate of Putnam Management, is authorized by the Trustees to manage a separate portion of the assets of the fund as determined by Putnam Management from time to time. Putnam Management pays a quarterly sub-management fee to PIL for its services at an annual rate of 0.35% of the average net assets of the portion of the fund managed by PIL.
The fund reimburses Putnam Management an allocated amount for the compensation and related expenses of certain officers of the fund and their staff who provide administrative services to the fund. The aggregate amount of all such reimbursements is determined annually by the Trustees.
Custodial functions for the fund’s assets are provided by State Street. Custody fees are based on the fund’s asset level, the number of its security holdings and transaction volumes.
Putnam Investor Services, Inc., an affiliate of Putnam Management, provides investor servicing agent functions to the fund. Putnam Investor Services, Inc. received fees for investor servicing (except for class R5 and R6 shares) that included (1) a per account fee for each direct and underlying non-defined contribution account (“retail account”) of the fund and each of the other funds in its specified category, which was totaled and then allocated to each fund in the category based on its average daily net assets; (2) a specified rate of the fund’s assets attributable to defined contribution plan accounts; and (3) a specified rate based on the average net assets in retail accounts. Putnam Investor Services has agreed that the aggregate investor servicing fees for each fund’s retail and defined contribution accounts will not exceed an annual rate of 0.320% of the fund’s average assets attributable to such accounts. Class R5 shares paid a monthly fee based on the average net assets of class R5 shares at an annual rate of 0.15%. Class R6 shares paid a monthly fee based on the average net assets of class R6 shares at an annual rate of 0.05%. During the reporting period, the expenses for each class of shares related to investor servicing fees were as follows:
| | | | |
| Class A | $1,463,391 | | Class R5 | 12 |
| |
|
| Class B | 38,439 | | Class R6 | 4,465 |
| |
|
| Class C | 52,913 | | Class Y | 220,451 |
| |
|
| Class M | 21,722 | | Total | $1,804,665 |
| |
|
| Class R | 3,272 | | | |
| | |
The fund has entered into expense offset arrangements with Putnam Investor Services, Inc. and State Street whereby Putnam Investor Services, Inc.’s and State Street’s fees are reduced by credits allowed on cash balances. The fund also reduced expenses through brokerage/service arrangements. For the reporting period, the fund’s expenses were reduced by $1,585 under the expense offset arrangements and by $12,958 under the brokerage/service arrangements.
Each Independent Trustee of the fund receives an annual Trustee fee, of which $1,278, as a quarterly retainer, has been allocated to the fund, and an additional fee for each Trustees meeting attended. Trustees also are reimbursed for expenses they incur relating to their services as Trustees.
The fund has adopted a Trustee Fee Deferral Plan (the Deferral Plan) which allows the Trustees to defer the receipt of all or a portion of Trustees fees payable on or after July 1, 1995. The deferred fees remain invested in certain Putnam funds until distribution in accordance with the Deferral Plan.
The fund has adopted an unfunded noncontributory defined benefit pension plan (the Pension Plan) covering all Trustees of the fund who have served as a Trustee for at least five years and were first elected prior to 2004. Benefits under the Pension Plan are equal to 50% of the Trustee’s average annual attendance and retainer fees for the three years ended December 31, 2005. The retirement benefit is payable during a Trustee’s lifetime, beginning the year following retirement, for the number of years of service through December 31, 2006. Pension expense for the fund is included in Trustee compensation and expenses in the Statement of operations. Accrued pension liability is included in Payable for Trustee compensation and expenses in the Statement of assets and liabilities. The Trustees have terminated the Pension Plan with respect to any Trustee first elected after 2003.
The fund has adopted distribution plans (the Plans) with respect to its class A, class B, class C, class M and class R shares pursuant to Rule 12b–1 under the Investment Company Act of 1940. The purpose of the Plans is to compensate Putnam Retail Management Limited Partnership, an indirect wholly-owned subsidiary of Putnam Investments, LLC, for services provided and expenses incurred in distributing shares of the fund. The Plans provide for payments by the fund to Putnam Retail Management Limited Partnership at an annual rate of up to 0.35%, 1.00%, 1.00%, 1.00% and 1.00% of the average net assets attributable to class A, class B, class C, class M and class R shares, respectively. The Trustees have approved payment by the fund at an annual rate of 0.25%, 1.00%, 1.00%, 0.75% and 0.50% of the average net assets attributable to class A, class B, class C, class M and class R shares, respectively. During the reporting period, the class specific expenses related to distribution fees were as follows:
| | | | |
| Class A | $1,856,453 | | Class M | 82,670 |
| |
|
| Class B | 195,136 | | Class R | 8,321 |
| |
|
| Class C | 268,117 | | Total | $2,410,697 |
| |
|
For the reporting period, Putnam Retail Management Limited Partnership, acting as underwriter, received net commissions of $47,466 and $480 from the sale of class A and class M shares, respectively, and received $13,123 and $2,112 in contingent deferred sales charges from redemptions of class B and class C shares, respectively.
A deferred sales charge of up to 1.00% and 0.65% (no longer applicable effective November 1, 2015) is assessed on certain redemptions of class A and class M shares, respectively. For the reporting period, Putnam Retail Management Limited Partnership, acting as underwriter, received $13 and no monies on class A and class M redemptions, respectively.
Note 3: Purchases and sales of securities
During the reporting period, the cost of purchases and the proceeds from sales, excluding short-term investments, were as follows:
| | |
| | Cost of purchases | Proceeds from sales |
|
| Investments in securities (Long-term) | $287,588,271 | $324,393,008 |
|
| U.S. government securities (Long-term) | — | — |
|
| Total | $287,588,271 | $324,393,008 |
|
The fund may purchase or sell investments from or to other Putnam funds in the ordinary course of business, which can reduce the fund’s transaction costs, at prices determined in accordance with SEC requirements and policies approved by the Trustees. During the reporting period, purchases or sales from or to other Putnam funds, if any, did not represent more than 5% of the fund’s total cost of purchases and/or total proceeds from sales.
Note 4: Capital shares
At the close of the reporting period, there were an unlimited number of shares of beneficial interest authorized. Transactions in capital shares were as follows:
| | | | |
| | Six months ended 1/31/16 | Year ended 7/31/15 |
|
| Class A | Shares | Amount | Shares | Amount |
|
| Shares sold | 2,202,312 | $46,683,069 | 5,519,710 | $120,530,707 |
|
| Shares issued in connection with | | | | |
| reinvestment of distributions | 930,393 | 19,919,717 | 595,846 | 13,156,274 |
|
| | 3,132,705 | 66,602,786 | 6,115,556 | 133,686,981 |
|
| Shares repurchased | (5,138,561) | (107,422,179) | (8,023,770) | (176,257,249) |
|
| Net decrease | (2,005,856) | $(40,819,393) | (1,908,214) | $(42,570,268) |
|
| |
| | Six months ended 1/31/16 | Year ended 7/31/15 |
|
| Class B | Shares | Amount | Shares | Amount |
|
| Shares sold | 83,691 | $1,575,102 | 245,127 | $4,810,367 |
|
| Shares issued in connection with | | | | |
| reinvestment of distributions | 15,727 | 302,590 | 6,208 | 123,296 |
|
| | 99,418 | 1,877,692 | 251,335 | 4,933,663 |
|
| Shares repurchased | (259,085) | (4,870,912) | (692,570) | (13,586,307) |
|
| Net decrease | (159,667) | $(2,993,220) | (441,235) | $(8,652,644) |
|
| |
| | Six months ended 1/31/16 | Year ended 7/31/15 |
|
| Class C | Shares | Amount | Shares | Amount |
|
| Shares sold | 660,873 | $13,113,412 | 645,034 | $13,298,751 |
|
| Shares issued in connection with | | | | |
| reinvestment of distributions | 24,557 | 496,797 | 7,367 | 154,200 |
|
| | 685,430 | 13,610,209 | 652,401 | 13,452,951 |
|
| Shares repurchased | (253,049) | (4,941,708) | (231,865) | (4,802,015) |
|
| Net increase | 432,381 | $8,668,501 | 420,536 | $8,650,936 |
|
| | | | |
| | Six months ended 1/31/16 | Year ended 7/31/15 |
|
| Class M | Shares | Amount | Shares | Amount |
|
| Shares sold | 21,943 | $430,406 | 65,505 | $1,359,216 |
|
| Shares issued in connection with | | | | |
| reinvestment of distributions | 10,955 | 221,081 | 5,419 | 112,922 |
|
| | 32,898 | 651,487 | 70,924 | 1,472,138 |
|
| Shares repurchased | (53,454) | (1,066,789) | (111,183) | (2,291,904) |
|
| Net decrease | (20,556) | $(415,302) | (40,259) | $(819,766) |
|
| |
| | Six months ended 1/31/16 | Year ended 7/31/15 |
|
| Class R | Shares | Amount | Shares | Amount |
|
| Shares sold | 10,061 | $208,495 | 82,858 | $1,764,128 |
|
| Shares issued in connection with | | | | |
| reinvestment of distributions | 1,388 | 29,301 | 1,247 | 27,108 |
|
| | 11,449 | 237,796 | 84,105 | 1,791,236 |
|
| Shares repurchased | (75,301) | (1,543,773) | (56,115) | (1,222,514) |
|
| Net increase (decrease) | (63,852) | $(1,305,977) | 27,990 | $568,722 |
|
| |
| | Six months ended 1/31/16 | Year ended 7/31/15 |
|
| Class R5 | Shares | Amount | Shares | Amount |
|
| Shares sold | — | $— | — | $— |
|
| Shares issued in connection with | | | | |
| reinvestment of distributions | 12 | 279 | 9 | 193 |
|
| | 12 | 279 | 9 | 193 |
|
| Shares repurchased | — | — | — | — |
|
| Net increase | 12 | $279 | 9 | $193 |
|
| |
| | Six months ended 1/31/16 | Year ended 7/31/15 |
|
| Class R6 | Shares | Amount | Shares | Amount |
|
| Shares sold | 18,073 | $385,831 | 149,723 | $3,358,233 |
|
| Shares issued in connection with | | | | |
| reinvestment of distributions | 15,183 | 330,684 | 9,400 | 211,123 |
|
| | 33,256 | 716,515 | 159,123 | 3,569,356 |
|
| Shares repurchased | (33,562) | (724,744) | (61,499) | (1,377,168) |
|
| Net increase (decrease) | (306) | $(8,229) | 97,624 | $2,192,188 |
|
| |
| | Six months ended 1/31/16 | Year ended 7/31/15 |
|
| Class Y | Shares | Amount | Shares | Amount |
|
| Shares sold | 2,111,058 | $45,399,793 | 8,279,940 | $186,913,268 |
|
| Shares issued in connection with | | | | |
| reinvestment of distributions | 172,719 | 3,748,000 | 47,319 | 1,059,464 |
|
| | 2,283,777 | 49,147,793 | 8,327,259 | 187,972,732 |
|
| Shares repurchased | (1,326,644) | (28,180,861) | (1,622,273) | (35,985,050) |
|
| Net increase | 957,133 | $20,966,932 | 6,704,986 | $151,987,682 |
|
At the close of the reporting period, Putnam Investments, LLC owned the following shares of the fund:
| | | |
| | Shares owned | Percentage of ownership | Value |
|
| Class R5 | 755 | 100.00% | $15,178 |
|
| Class R6 | 758 | 0.09 | 15,205 |
|
Note 5: Affiliated transactions
Transactions during the reporting period with Putnam Short Term Investment Fund, which is under common ownership and control, were as follows:
| | | | | |
| | Fair value at the | | | | Fair value at |
| | beginning of | | | | the end of |
| | the reporting | | | Investment | the reporting |
| Name of affiliate | period | Purchase cost | Sale proceeds | income | period |
|
| Putnam Short Term | | | | | |
| Investment Fund* | $15,773,109 | $123,056,024 | $117,736,424 | $22,255 | $21,092,709 |
|
* Management fees charged to Putnam Short Term Investment Fund have been waived by Putnam Management.
Note 6: Market, credit and other risks
In the normal course of business, the fund trades financial instruments and enters into financial transactions where risk of potential loss exists due to changes in the market (market risk) or failure of the contracting party to the transaction to perform (credit risk). The fund may be exposed to additional credit risk that an institution or other entity with which the fund has unsettled or open transactions will default. Investments in foreign securities involve certain risks, including those related to economic instability, unfavorable political developments, and currency fluctuations.
Putnam family of funds
The following is a list of Putnam’s open-end mutual funds offered to the public. Investors should carefully consider the investment objective, risks, charges, and expenses of a fund before investing. For a prospectus, or a summary prospectus if available, containing this and other information for any Putnam fund or product, contact your financial advisor or call Putnam Investor Services at 1-800-225-1581. Please read the prospectus carefully before investing.
| |
| Growth | International Value Fund |
| Growth Opportunities Fund | Multi-Cap Value Fund |
| International Growth Fund | Small Cap Value Fund |
| Multi-Cap Growth Fund | |
| Small Cap Growth Fund | Income |
| Voyager Fund | American Government Income Fund |
| | Diversified Income Trust |
| Blend | Emerging Markets Income Fund |
| Asia Pacific Equity Fund | Floating Rate Income Fund |
| Capital Opportunities Fund | Global Income Trust |
| Capital Spectrum Fund | High Yield Advantage Fund |
| Emerging Markets Equity Fund | High Yield Trust |
| Equity Spectrum Fund | Income Fund |
| Europe Equity Fund | Money Market Fund* |
| Global Equity Fund | Short Duration Income Fund |
| International Capital Opportunities Fund | U.S. Government Income Trust |
| International Equity Fund | |
| Investors Fund | Tax-free Income |
| Low Volatility Equity Fund | AMT-Free Municipal Fund |
| Multi-Cap Core Fund | Intermediate-Term Municipal Income Fund |
| Research Fund | Short-Term Municipal Income Fund |
| Strategic Volatility Equity Fund | Tax Exempt Income Fund |
| | Tax-Free High Yield Fund |
| Value | |
| Convertible Securities Fund | State tax-free income funds†: |
| Equity Income Fund | Arizona, California, Massachusetts, Michigan, |
| Global Dividend Fund | Minnesota, New Jersey, New York, Ohio, |
| The Putnam Fund for Growth and Income | and Pennsylvania. |
| |
| Absolute Return | Retirement Income Lifestyle Funds — |
| Absolute Return 100 Fund® | portfolios with managed allocations to |
| Absolute Return 300 Fund® | stocks, bonds, and money market |
| Absolute Return 500 Fund® | investments to generate retirement income. |
| Absolute Return 700 Fund® | |
| | Retirement Income Fund Lifestyle 1 |
| Global Sector | Retirement Income Fund Lifestyle 2 |
| Global Consumer Fund | Retirement Income Fund Lifestyle 3 |
| Global Energy Fund | |
| Global Financials Fund | RetirementReady® Funds — portfolios with |
| Global Health Care Fund | adjusting allocations to stocks, bonds, and |
| Global Industrials Fund | money market instruments, becoming more |
| Global Natural Resources Fund | conservative over time. |
| Global Sector Fund | |
| Global Technology Fund | RetirementReady® 2060 Fund |
| Global Telecommunications Fund | RetirementReady® 2055 Fund |
| Global Utilities Fund | RetirementReady® 2050 Fund |
| | RetirementReady® 2045 Fund |
| Asset Allocation | RetirementReady® 2040 Fund |
| George Putnam Balanced Fund | RetirementReady® 2035 Fund |
| | RetirementReady® 2030 Fund |
| Global Asset Allocation Funds — four | RetirementReady® 2025 Fund |
| investment portfolios that spread your | RetirementReady® 2020 Fund |
| money across a variety of stocks, bonds, and | |
| money market instruments. | |
| | |
| Dynamic Asset Allocation Balanced Fund | |
| Dynamic Asset Allocation Conservative Fund | |
| Dynamic Asset Allocation Growth Fund | |
| Dynamic Risk Allocation Fund | |
* An investment in a money market fund is not insured or guaranteed by the Federal Deposit Insurance Corporation or any other government agency. Although the fund seeks to preserve the value of your investment at $1.00 per share, it is possible to lose money by investing in the fund.
† Not available in all states.
Check your account balances and the most recent month-end performance in the Individual Investors section at putnam.com.
Services for shareholders
Investor services
Systematic investment plan Tell us how much you wish to invest regularly — weekly, semimonthly, or monthly — and the amount you choose will be transferred automatically from your checking or savings account. There’s no additional fee for this service, and you can suspend it at any time. This plan may be a great way to save for college expenses or to plan for your retirement.
Please note that regular investing does not guarantee a profit or protect against loss in a declining market. Before arranging a systematic investment plan, consider your financial ability to continue making purchases in periods when prices are low.
Systematic exchange You can make regular transfers from one Putnam fund to another Putnam fund. There are no additional fees for this service, and you can cancel or change your options at any time.
Dividends PLUS You can choose to have the dividend distributions from one of your Putnam funds automatically reinvested in another Putnam fund at no additional charge.
Free exchange privilege You can exchange money between Putnam funds free of charge, as long as they are the same class of shares. A signature guarantee is required if you are exchanging more than $500,000. The fund reserves the right to revise or terminate the exchange privilege.
Reinstatement privilege If you’ve sold Putnam shares or received a check for a dividend or capital gain, you may reinvest the proceeds with Putnam within 90 days of the transaction and they will be reinvested at the fund’s current net asset value — with no sales charge. However, reinstatement of class B shares may have special tax consequences. Ask your financial or tax representative for details.
Check-writing service You have ready access to many Putnam accounts. It’s as simple as writing a check, and there are no special fees or service charges. For more information about the check-writing service, call Putnam or visit our website.
Dollar cost averaging When you’re investing for long-term goals, it’s time, not timing, that counts. Investing on a systematic basis is a better strategy than trying to figure out when the markets will go up or down. This means investing the same amount of money regularly over a long period. This method of investing is called dollar cost averaging. When a fund’s share price declines, your investment dollars buy more shares at lower prices. When it increases, they buy fewer shares. Over time, you will pay a lower average price per share.
For more information
Visit the Individual Investors section at putnam.com A secure section of our website contains complete information on your account, including balances and transactions, updated daily. You may also conduct transactions, such as exchanges, additional investments, and address changes. Log on today to get your password.
Call us toll free at 1-800-225-1581 Ask a helpful Putnam representative or your financial advisor for details about any of these or other services, or see your prospectus.
Fund information
Founded over 75 years ago, Putnam Investments was built around the concept that a balance between risk and reward is the hallmark of a well-rounded financial program. We manage over 100 funds across income, value, blend, growth, asset allocation, absolute return, and global sector categories.
| | |
| Investment Manager | Trustees | Robert T. Burns |
| Putnam Investment | Jameson A. Baxter, Chair | Vice President and |
| Management, LLC | Liaquat Ahamed | Chief Legal Officer |
| One Post Office Square | Ravi Akhoury | |
| Boston, MA 02109 | Barbara M. Baumann | James F. Clark |
| | Robert J. Darretta | Chief Compliance Officer |
| Investment Sub-Manager | Katinka Domotorffy | |
| Putnam Investments Limited | John A. Hill | Michael J. Higgins |
| 57–59 St James’s Street | Paul L. Joskow | Vice President, Treasurer, |
| London, England SW1A 1LD | Kenneth R. Leibler | and Clerk |
| | Robert E. Patterson | |
| Marketing Services | George Putnam, III | Janet C. Smith |
| Putnam Retail Management | Robert L. Reynolds | Vice President, |
| One Post Office Square | W. Thomas Stephens | Principal Accounting Officer, |
| Boston, MA 02109 | | and Assistant Treasurer |
| | Officers | |
| Custodian | Robert L. Reynolds | Susan G. Malloy |
| State Street Bank | President | Vice President and |
| and Trust Company | | Assistant Treasurer |
| | Jonathan S. Horwitz | |
| Legal Counsel | Executive Vice President, | James P. Pappas |
| Ropes & Gray LLP | Principal Executive Officer, and | Vice President |
| | Compliance Liaison | |
| | | Mark C. Trenchard |
| | Steven D. Krichmar | Vice President and |
| | Vice President and | BSA Compliance Officer |
| | Principal Financial Officer | |
| | Nancy E. Florek |
| | | Vice President, Director of |
| | | Proxy Voting and Corporate |
| | | Governance, Assistant Clerk, |
| | | and Associate Treasurer |
This report is for the information of shareholders of Putnam Investors Fund. It may also be used as sales literature when preceded or accompanied by the current prospectus, the most recent copy of Putnam’s Quarterly Performance Summary, and Putnam’s Quarterly Ranking Summary. For more recent performance, please visit putnam.com. Investors should carefully consider the investment objectives, risks, charges, and expenses of a fund, which are described in its prospectus. For this and other information or to request a prospectus or summary prospectus, call 1-800-225-1581 toll free. Please read the prospectus carefully before investing. The fund’s Statement of Additional Information contains additional information about the fund’s Trustees and is available without charge upon request by calling 1-800-225-1581.

| |
| Item 3. Audit Committee Financial Expert: |
| |
| Item 4. Principal Accountant Fees and Services: |
| |
| Item 5. Audit Committee of Listed Registrants |
| |
| Item 6. Schedule of Investments: |
| |
| The registrant's schedule of investments in unaffiliated issuers is included in the report to shareholders in Item 1 above. |
| |
| Item 7. Disclosure of Proxy Voting Policies and Procedures For Closed-End Management Investment Companies: |
| |
| Item 8. Portfolio Managers of Closed-End Investment Companies |
| |
| Item 9. Purchases of Equity Securities by Closed-End Management Investment Companies and Affiliated Purchasers: |
| |
| Item 10. Submission of Matters to a Vote of Security Holders: |
| |
| Item 11. Controls and Procedures: |
| |
| (a) The registrant's principal executive officer and principal financial officer have concluded, based on their evaluation of the effectiveness of the design and operation of the registrant's disclosure controls and procedures as of a date within 90 days of the filing date of this report, that the design and operation of such procedures are generally effective to provide reasonable assurance that information required to be disclosed by the registrant in this report is recorded, processed, summarized and reported within the time periods specified in the Commission's rules and forms. |
| |
| (b) Changes in internal control over financial reporting: Not applicable |
| |
| (a)(2) Separate certifications for the principal executive officer and principal financial officer of the registrant as required by Rule 30a-2(a) under the Investment Company Act of 1940, as amended, are filed herewith. |
| |
| (b) The certifications required by Rule 30a-2(b) under the Investment Company Act of 1940, as amended, are filed herewith. |
| |
| By (Signature and Title): |
| |
| /s/ Janet C. Smith
Janet C. Smith
Principal Accounting Officer
|
| |
| Pursuant to the requirements of the Securities Exchange Act of 1934 and the Investment Company Act of 1940, this report has been signed below by the following persons on behalf of the registrant and in the capacities and on the dates indicated. |
| |
| By (Signature and Title): |
| |
| /s/ Jonathan S. Horwitz
Jonathan S. Horwitz
Principal Executive Officer
|
| |
| By (Signature and Title): |
| |
| /s/ Steven D. Krichmar
Steven D. Krichmar
Principal Financial Officer
|