UNITED STATES
SECURITIES AND EXCHANGE COMMISSION
Washington, D.C. 20549 |
| CERTIFIED SHAREHOLDER REPORT OF REGISTERED MANAGEMENT |
| INVESTMENT COMPANIES |
| Investment Company Act file number | | 811-5125 |
Dreyfus Variable Investment Fund
(Exact name of Registrant as specified in charter) |
c/o The Dreyfus Corporation
200 Park Avenue
New York, New York 10166
(Address of principal executive offices) (Zip code) |
Michael A. Rosenberg, Esq.
200 Park Avenue
New York, New York 10166
(Name and address of agent for service) |
| Registrant's telephone number, including area code: | | (212) 922-6000 |
| Date of fiscal year end: | | 12/31 | | |
| Date of reporting period: | | 12/31/08 | | |
| | | | | |
| Item 1. | | Reports to Stockholders. |
-2-
| | Dreyfus Variable
Investment Fund,
Appreciation Portfolio |
| | ANNUAL REPORT December 31, 2008 |

The views expressed in this report reflect those of the portfolio manager only through the end of the period covered and do not necessarily represent the views of Dreyfus or any other person in the Dreyfus organization.Any such views are subject to change at any time based upon market or other conditions and Dreyfus disclaims any responsibility to update such views. These views may not be relied on as investment advice and, because investment decisions for a Dreyfus portfolio are based on numerous factors, may not be relied on as an indication of trading intent on behalf of any Dreyfus portfolio.

| | Contents |
| |
| | THE PORTFOLIO |
| |
| 2 | A Letter from the CEO |
| |
| 3 | Discussion of Performance |
| |
| 6 | Portfolio Performance |
| |
| 8 | Understanding Your Portfolio’s Expenses |
| |
| 8 | Comparing Your Portfolio’s Expenses With Those of Other Funds |
| |
| 9 | Statement of Investments |
| |
| 12 | Statement of Assets and Liabilities |
| |
| 13 | Statement of Operations |
| |
| 14 | Statement of Changes in Net Assets |
| |
| 16 | Financial Highlights |
| |
| 18 | Notes to Financial Statements |
| |
| 27 | Report of Independent Registered Public Accounting Firm |
| |
| 28 | Important Tax Information |
| |
| 29 | Board Members Information |
| |
| 32 | Officers of the Fund |
| |
| | FOR MORE INFORMATION |
| |
| | Back Cover |
| |
Dreyfus Variable Investment Fund,
Appreciation Portfolio |
The Portfolio

A LETTER FROM THE CEO
Dear Shareholder: |
We present to you this annual report for Dreyfus Variable Investment Fund, Appreciation Portfolio, covering the 12-month period from January 1, 2008, through December 31, 2008.
2008 was the most difficult year in decades for the economy and stock market.A credit crunch that originated in 2007 in the U.S. sub-prime mortgage market exploded in mid-2008 into a global financial crisis, resulting in the failures of major financial institutions, a deep and prolonged recession and lower investment values across a broad range of asset classes. Governments and regulators throughout the world moved aggressively to curtail the damage, implementing unprecedented reductions of short-term interest rates, massive injections of liquidity into the banking system, government bailouts of struggling companies and plans for massive economic stimulus programs.
Although we expect the U.S. and global economies to remain weak until longstanding imbalances have worked their way out of the system, the financial markets currently appear to have priced in investors’ generally low expectations. In previous recessions, however, the markets have tended to anticipate economic improvement before it occurs, potentially leading to major rallies when few expected them.That’s why it makes sense to remain disciplined, maintain a long-term perspective and adopt a consistent asset allocation strategy that reflects one’s future goals and attitudes toward risk.As always, we urge you to consult with your financial advisor, who can recommend the course of action that is right for you.
For information about how the portfolio performed during the reporting period, as well as market perspectives, we have provided a Discussion of Performance given by the Portfolio Manager.
Thank you for your continued confidence and support.

Jonathan R. Baum
Chief Executive Officer
The Dreyfus Corporation
January 15, 2009 |
2

DISCUSSION OF PERFORMANCE
For the period of January 1, 2008, through December 31, 2008, as provided by Fayez Sarofim, of Fayez Sarofim & Co., Sub-Investment Adviser
Portfolio and Market Performance
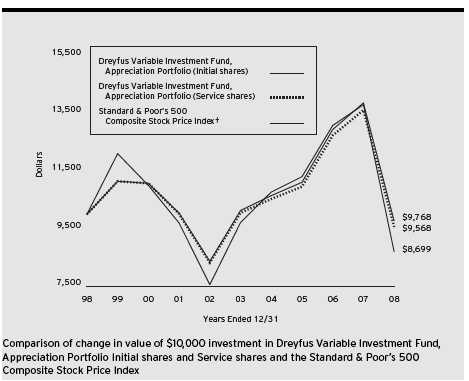
For the 12-month period ended December 31, 2008, Dreyfus Variable Investment Fund,Appreciation Portfolio’s Initial shares produced a total return of –29.55%, and its Service shares produced a total return of –29.72% .1 In comparison, the total return of the portfolio’s benchmark, the Standard & Poor’s 500 Composite Stock Price Index (“S&P 500 Index”), was –36.99% for the same period.2
2008 proved to be a highly challenging year for most investments, including large-cap stocks.A global economic slowdown and an intensifying financial crisis created a wave of selling pressure that produced negative returns in every economic sector represented in the S&P 500 Index. Although we are never satisfied with negative absolute returns, we nonetheless are pleased that the fund produced better results than its benchmark, which we attribute mainly to our longstanding focus on high-quality companies and an effective sector allocation strategy.
The Portfolio’s Investment Approach
The portfolio normally invests at least 80% of its assets in common stocks. The portfolio focuses on large, well-established multinational growth companies that have demonstrated sustained patterns of profitability, strong balance sheets, an expanding global presence and the potential to achieve predictable above-average earnings growth. We focus on purchasing reasonably priced growth stocks of fundamentally sound companies in economic sectors that we believe will expand over the next three to five years or longer.
Extreme Volatility Roiled the Financial Markets
After producing relatively modest declines over the first half of 2008, stocks tumbled during the second half, producing losses for the S&P 500 Index that have not been seen during a single calendar year since the early 1930s.The bear market was triggered by an intensification of a credit crisis that began in 2007 and mushroomed in September 2008
The Portfolio 3
| DISCUSSION OF PERFORMANCE (continued) |
with the failures of several major financial institutions.These developments exacerbated an ongoing economic slowdown, as lenders grew reluctant to extend credit even to some of their most trusted customers, causing consumer spending and business investment to decline sharply and commodity prices to retreat from previous record levels. In early December, the National Bureau of Economic Research confirmed that the U.S. economy was mired in its first recession since 2001.
Not surprisingly, the financial crisis was particularly hard on financial stocks, which posted greater losses, on average, than any of the S&P 500 Index’s other economic sectors. The industrials and consumer discretionary areas, which historically have been relatively sensitive to economic changes, also were among the more severely affected areas, as were businesses that tend to be sensitive to commodity prices, such as producers of energy and basic materials. Conversely, traditionally defensive areas, such as the health care and consumer staples sectors, generally posted more mild losses.
Avoiding Troubled Financial Companies
The portfolio’s focus on quality sheltered it from the full brunt of the bear market. Our security selection and sector allocation strategies were particularly effective in the financials sector, where we maintained a substantially underweighted position and were early in eliminating some of the financial giants at the epicenter of the financial crisis, including American International Group, Citigroup, Merrill Lynch & Co. and SunTrust Banks.
Instead, we focused on the traditionally defensive consumer staples sector, where overweighted exposure and strong stock selections helped the portfolio participate in relative strength among companies with positive cash flows, low debt levels and steady customer demand. Some of the portfolio’s better performers included brewer Anheuser-Busch, retailer Wal-Mart Stores and restaurant chain McDonald’s, all of which produced positive absolute returns in 2008. Other consumer staples holdings declined more modestly than market averages, including food giant Nestle, household goods producer Procter & Gamble and beverages leader Coca-Cola.The portfolio’s investments in the energy sector also fared relatively well, as integrated energy producers Exxon Mobil,
4
Chevron and ConocoPhillips held up better than most oil services and exploration-and-production specialists.
Of course, the portfolio also held its share of disappointments in 2008. For example, industrial giant General Electric suffered due to its exposure to the credit markets and slowing economy, and semiconductor maker Intel encountered softer demand for microchips.The fund also held no utilities or telecommunications services stocks, which generally produced above-average results.
Economic Weakness Likely to Persist
The stock market has remained volatile, staging a rally in the final month of the year that offset a portion of its earlier losses. However, we have maintained a defensive investment posture, as we expect the U.S. economy to continue to contract over the next several months.
Still, we remain optimistic over the longer term. The sharp decline in energy prices and an expected stimulus package from the federal government may put more cash in consumer’s pockets later in the year, while historically low interest rates could help reduce business costs. Therefore, we have remained invested in fundamentally strong large-cap companies that, in our analysis, could be among the first to rebound in an eventual market recovery.
January 15, 2009
The portfolio is only available as a funding vehicle under variable life insurance policies or variable annuity contracts issued by insurance companies. Individuals may not purchase shares of the portfolio directly. A variable annuity is an insurance contract issued by an insurance company that enables investors to accumulate assets on a tax-deferred basis for retirement or other long-term goals.The investment objective and policies of Dreyfus Variable Investment Fund, Appreciation Portfolio made available through insurance products may be similar to other funds/portfolios managed or advised by Dreyfus. However, the investment results of the portfolio may be higher or lower than, and may not be comparable to, those of any other Dreyfus fund/portfolio.
| 1 | | Total return includes reinvestment of dividends and any capital gains paid. Past performance is no |
| | | guarantee of future results. Share price and investment return fluctuate such that upon redemption, |
| | | portfolio shares may be worth more or less than their original cost.The portfolio’s performance does |
| | | not reflect the deduction of additional charges and expenses imposed in connection with investing |
| | | in variable insurance contracts, which will reduce returns. |
| 2 | | SOURCE: LIPPER INC. — Reflects monthly reinvestment of dividends and, where |
| | | applicable, capital gain distributions.The Standard & Poor’s 500 Composite Stock Price Index is |
| | | a widely accepted, unmanaged index of U.S. stock market performance. |
The Portfolio 5
PORTFOLIO PERFORMANCE
| Average Annual Total Returns as of 12/31/08 | | | | | | |
| | | 1 Year | | 5 Years | | 10 Years |
| |
| |
| |
|
| Initial shares | | (29.55)% | | (0.73)% | | (0.23)% |
| Service shares | | (29.72)% | | (0.98)% | | (0.44)% |
The data for Service shares includes the results of Initial shares for the period prior to December 31, 2000 (inception date of Service shares). Actual Service shares’ average annual total return and hypothetical growth results would have been lower. See notes below.
† Source: Lipper Inc.
Past performance is not predictive of future performance.The portfolio’s performance shown in the graph and table does not reflect the deduction of taxes that a shareholder would pay on portfolio distributions or the redemption of portfolio shares.
The portfolio’s performance does not reflect the deduction of additional charges and expenses imposed in connection with investing in variable insurance contracts which will reduce returns.
The above graph compares a $10,000 investment made in Initial and Service shares of Dreyfus Variable Investment Fund, Appreciation Portfolio on 12/31/98 to a $10,000 investment made in the Standard & Poor’s 500 Composite Stock Price Index (the “Index”) on that date.
6
The portfolio’s Initial shares are not subject to a Rule 12b-1 fee.The portfolio’s Service shares are subject to a 0.25% annual Rule 12b-1 fee.The performance figures for Service shares reflect the performance of the portfolio’s Initial shares from their inception date through December 30, 2000, and the performance of the portfolio’s Service shares from December 31, 2000 (inception date of Service shares) to December 31, 2008 (blended performance figures).The blended performance figures have not been adjusted to reflect the higher operating expenses of the Service shares. If these expenses had been reflected, the blended performance figures would have been lower. All dividends and capital gain distributions are reinvested.
The portfolio’s performance shown in the line graph takes into account all applicable portfolio fees and expenses.The Index is a widely accepted, unmanaged index of U.S. stock market performance. Unlike a mutual fund, the Index is not subject to charges, fees and other expenses. Investors cannot invest directly in any index. Further information relating to portfolio performance, including expense reimbursements, if applicable, is contained in the Financial Highlights section of the prospectus and elsewhere in this report.
The Portfolio 7
| | UNDERSTANDING YOUR
PORTFOLIO’S EXPENSES (Unaudited) |
As a mutual fund investor, you pay ongoing expenses, such as management fees and other expenses. Using the information below, you can estimate how these expenses affect your investment and compare them with the expenses of other funds.You also may pay one-time transaction expenses, including sales charges (loads) and redemption fees,which are not shown in this section and would have resulted in higher total expenses. For more information, see your portfolio’s prospectus or talk to your financial adviser.
Review your portfolio’s expenses
The table below shows the expenses you would have paid on a $1,000 investment in Dreyfus Variable Investment Fund,Appreciation Portfolio from July 1, 2008 to December 31, 2008. It also shows how much a $1,000 investment would be worth at the close of the period, assuming actual returns and expenses.
| | Expenses and Value of a $1,000 Investment
assuming actual returns for the six months ended December 31, 2008 |
| | | Initial Shares | | Service Shares |
| |
| |
|
| Expenses paid per $1,000† | | $ 3.66 | | $ 4.77 |
| Ending value (after expenses) | | $773.40 | | $772.50 |
COMPARING YOUR PORTFOLIO’S EXPENSES
WITH THOSE OF OTHER FUNDS (Unaudited) |
Using the SEC’s method to compare expenses
The Securities and Exchange Commission (SEC) has established guidelines to help investors assess fund expenses. Per these guidelines, the table below shows your portfolio’s expenses based on a $1,000 investment, assuming a hypothetical 5% annualized return. You can use this information to compare the ongoing expenses (but not transaction expenses or total cost) of investing in the portfolio with those of other funds. All mutual fund shareholder reports will provide this information to help you make this comparison. Please note that you cannot use this information to estimate your actual ending account balance and expenses paid during the period.
| | Expenses and Value of a $1,000 Investment
assuming a hypothetical 5% annualized return for the six months ended December 31, 2008 |
| | | Initial Shares | | Service Shares |
| |
| |
|
| Expenses paid per $1,000† | | $ 4.17 | | $ 5.43 |
| Ending value (after expenses) | | $1,021.01 | | $1,019.76 |
| | † Expenses are equal to the portfolio’s annualized expense ratio of .82% for Initial shares and 1.07% for Service shares,
multiplied by the average account value over the period, multiplied by 184/366 (to reflect the one-half year period). |
8
STATEMENT OF INVESTMENTS
December 31, 2008 |
| Common Stocks—98.7% | | Shares | | Value ($) |
| |
| |
|
| Beverages—9.9% | | | | |
| Coca-Cola | | 524,700 | | 23,753,169 |
| PepsiCo | | 220,900 | | 12,098,693 |
| | | | | 35,851,862 |
| Consumer Discretionary—9.0% | | | | |
| Christian Dior | | 72,700 a | | 4,067,522 |
| McDonald’s | | 178,700 | | 11,113,353 |
| McGraw-Hill | | 216,500 | | 5,020,635 |
| News, Cl. A | | 529,836 | | 4,816,209 |
| News, Cl. B | | 8,600 | | 82,388 |
| Polo Ralph Lauren | | 34,900 a | | 1,584,809 |
| Target | | 179,500 | | 6,198,135 |
| | | | | 32,883,051 |
| Consumer Staples—24.7% | | | | |
| Altria Group | | 542,000 | | 8,162,520 |
| Estee Lauder, Cl. A | | 56,800 | | 1,758,528 |
| Nestle, ADR | | 449,000 | | 17,825,300 |
| Philip Morris International | | 542,000 | | 23,582,420 |
| Procter & Gamble | | 319,200 | | 19,732,944 |
| SYSCO | | 87,400 | | 2,004,956 |
| Wal-Mart Stores | | 92,300 | | 5,174,338 |
| Walgreen | | 442,300 | | 10,911,541 |
| Whole Foods Market | | 61,200 a | | 577,728 |
| | | | | 89,730,275 |
| Energy—22.0% | | | | |
| Chevron | | 250,000 | | 18,492,500 |
| ConocoPhillips | | 187,800 | | 9,728,040 |
| Exxon Mobil | | 392,164 | | 31,306,452 |
| Halliburton | | 87,400 | | 1,588,932 |
| Occidental Petroleum | | 122,300 | | 7,336,777 |
| Royal Dutch Shell, Cl. A, ADR | | 72,200 | | 3,822,268 |
| Total, ADR | | 104,800 | | 5,795,440 |
| Transocean | | 36,675 b | | 1,732,894 |
| | | | | 79,803,303 |
| Financial—2.6% | | | | |
| American Express | | 95,600 | | 1,773,380 |
| Bank of America | | 200,716 | | 2,826,081 |
The Portfolio 9
| STATEMENT OF INVESTMENTS (continued) |
| Common Stocks (continued) | | Shares | | Value ($) |
| |
| |
|
| Financial (continued) | | | | |
| HSBC Holdings, ADR | | 43,700 a | | 2,126,879 |
| JPMorgan Chase & Co. | | 87,500 | | 2,758,875 |
| | | | | 9,485,215 |
| Health Care—11.6% | | | | |
| Abbott Laboratories | | 245,200 | | 13,086,324 |
| Johnson & Johnson | | 305,200 | | 18,260,116 |
| Medtronic | | 56,800 | | 1,784,656 |
| Merck & Co. | | 152,300 | | 4,629,920 |
| Roche Holding, ADR | | 55,900 | | 4,279,145 |
| | | | | 42,040,161 |
| Industrial—6.6% | | | | |
| Caterpillar | | 43,700 | | 1,952,079 |
| Emerson Electric | | 199,100 | | 7,289,051 |
| Fluor | | 69,800 | | 3,131,926 |
| General Dynamics | | 18,000 | | 1,036,620 |
| General Electric | | 447,300 | | 7,246,260 |
| United Technologies | | 64,000 | | 3,430,400 |
| | | | | 24,086,336 |
| Information Technology—10.3% | | | | |
| Apple | | 50,000 b | | 4,267,500 |
| Automatic Data Processing | | 94,800 | | 3,729,432 |
| Cisco Systems | | 222,200 b | | 3,621,860 |
| Intel | | 921,500 | | 13,509,190 |
| Microsoft | | 357,000 | | 6,940,080 |
| QUALCOMM | | 78,600 | | 2,816,238 |
| Texas Instruments | | 164,700 | | 2,556,144 |
| | | | | 37,440,444 |
| Materials—2.0% | | | | |
| Freeport-McMoRan Copper & Gold | | 25,000 | | 611,000 |
| Praxair | | 105,700 | | 6,274,352 |
| Rio Tinto, ADR | | 5,000 a | | 444,550 |
| | | | | 7,329,902 |
| Total Common Stocks | | | | |
| (cost $315,127,167) | | | | 358,650,549 |
10
| Other Investment—.6% | | Shares | | Value ($) |
| |
| |
|
| Registered Investment Company; | | | | |
| Dreyfus Institutional Preferred | | | | |
| Plus Money Market Fund | | | | |
| (cost $2,000,000) | | 2,000,000 c | | 2,000,000 |
| |
| |
|
| |
| Investment of Cash Collateral | | | | |
| for Securities Loaned—2.2% | | | | |
| |
| |
|
| Registered Investment Company; | | | | |
| Dreyfus Institutional Cash | | | | |
| Advantage Fund | | | | |
| (cost $8,054,859) | | 8,054,859 c | | 8,054,859 |
| |
| |
|
| |
| Total Investments (cost $325,182,026) | | 101.5% | | 368,705,408 |
| Liabilities, Less Cash and Receivables | | (1.5%) | | (5,316,926) |
| Net Assets | | 100.0% | | 363,388,482 |
| ADR—American Depository Receipts |
| a All or a portion of these securities are on loan. At December 31, 2008, the total market value of the portfolio’s |
| securities on loan is $7,792,022 and the total market value of the collateral held by the portfolio is $8,054,859. |
| b Non-income producing security. |
| c Investment in affiliated money market mutual fund. |
| Portfolio Summary (Unaudited)† | | | | |
| |
| | | Value (%) | | | | Value (%) |
| |
| |
| |
|
| Consumer Staples | | 24.7 | | Industrial | | 6.6 |
| Energy | | 22.0 | | Money Market Investments | | 2.8 |
| Health Care | | 11.6 | | Financial | | 2.6 |
| Information Technology | | 10.3 | | Materials | | 2.0 |
| Beverages | | 9.9 | | | | |
| Consumer Discretionary | | 9.0 | | | | 101.5 |
| |
| † Based on net assets. | | | | | | |
| See notes to financial statements. | | | | | | |
The Portfolio 11
STATEMENT OF ASSETS AND LIABILITIES
December 31, 2008 |
| | | Cost | | Value |
| |
| |
|
| Assets ($): | | | | |
| Investments in securities—See Statement | | | | |
| of Investments (including securities on loan, | | | | |
| valued at $7,792,022)—Note 1(c): | | | | |
| Unaffiliated issuers | | 315,127,167 | | 358,650,549 |
| Affiliated issuers | | 10,054,859 | | 10,054,859 |
| Cash | | | | 236,692 |
| Receivable for shares of Beneficial Interest subscribed | | | | 1,797,715 |
| Dividends and interest receivable | | | | 987,551 |
| Receivable for investment securities sold | | | | 263,839 |
| Prepaid expenses | | | | 33,272 |
| | | | | 372,024,477 |
| |
| |
|
| Liabilities ($): | | | | |
| Due to The Dreyfus Corporation and affiliates—Note 3(b) | | | | 182,507 |
| Due to Fayez Sarofim & Co. | | | | 74,362 |
| Liability for securities on loan—Note 1(c) | | | | 8,054,859 |
| Payable for shares of Beneficial Interest redeemed | | | | 194,234 |
| Interest payable—Note 2 | | | | 37,043 |
| Accrued expenses | | | | 92,990 |
| | | | | 8,635,995 |
| |
| |
|
| Net Assets ($) | | | | 363,388,482 |
| |
| |
|
| Composition of Net Assets ($): | | | | |
| Paid-in capital | | | | 284,588,914 |
| Accumulated undistributed investment income—net | | | | 9,101,859 |
| Accumulated net realized gain (loss) on investments | | | | 26,171,622 |
| Accumulated net unrealized appreciation (depreciation) | | | | |
| on investments and foreign currency transactions | | | | 43,526,087 |
| |
| |
|
| Net Assets ($) | | | | 363,388,482 |
| |
| |
|
| |
| |
| Net Asset Value Per Share | | | | |
| | | Initial Shares | | Service Shares |
| |
| |
|
| Net Assets ($) | | 274,782,083 | | 88,606,399 |
| Shares Outstanding | | 9,515,930 | | 3,087,806 |
| |
| |
|
| Net Asset Value Per Share ($) | | 28.88 | | 28.70 |
| See notes to financial statements. | | | | |
12
| STATEMENT OF OPERATIONS | | |
| Year Ended December 31, 2008 | | |
| |
|
| |
| |
| |
| |
| Investment Income ($): | | |
| Income: | | |
| Cash dividends (net of $218,533 foreign taxes withheld at source): | | |
| Unaffiliated issuers | | 13,256,826 |
| Affiliated issuers | | 79,129 |
| Income from securities lending | | 169,877 |
| Total Income | | 13,505,832 |
| Expenses: | | |
| Investment advisory fee—Note 3(a) | | 2,370,590 |
| Sub-investment advisory fee—Note 3(a) | | 1,470,590 |
| Distribution fees—Note 3(b) | | 269,613 |
| Prospectus and shareholders’ reports | | 118,737 |
| Professional fees | | 48,489 |
| Custodian fees—Note 3(b) | | 47,773 |
| Trustees’ fees and expenses—Note 3(c) | | 37,947 |
| Shareholder servicing costs—Note 3(b) | | 11,298 |
| Loan commitment fees—Note 2 | | 5,481 |
| Interest expense—Note 2 | | 2,525 |
| Miscellaneous | | 22,390 |
| Total Expenses | | 4,405,433 |
| Less—reduction in fees due to earnings credits—Note 1(c) | | (164) |
| Net Expenses | | 4,405,269 |
| Investment Income—Net | | 9,100,563 |
| |
|
| Realized and Unrealized Gain (Loss) on Investments—Note 4 ($): | | |
| Net realized gain (loss) on investments | | |
| and foreign currency transactions | | 26,188,537 |
| Net unrealized appreciation (depreciation) | | |
| on investments and foreign currency transactions | | (201,060,241) |
| Net Realized and Unrealized Gain (Loss) on Investments | | (174,871,704) |
| Net (Decrease) in Net Assets Resulting from Operations | | (165,771,141) |
| |
| See notes to financial statements. | | |
The Portfolio 13
STATEMENT OF CHANGES IN NET ASSETS
| | | Year Ended December 31, |
| | |
|
| | | 2008 | | 2007 |
| |
| |
|
| Operations ($): | | | | |
| Investment income—net | | 9,100,563 | | 11,118,540 |
| Net realized gain (loss) on investments | | 26,188,537 | | 56,502,140 |
| Net unrealized appreciation | | | | |
| (depreciation) on investments | | (201,060,241) | | (16,029,486) |
| Net Increase (Decrease) in Net Assets | | | | |
| Resulting from Operations | | (165,771,141) | | 51,591,194 |
| |
| |
|
| Dividends to Shareholders from ($): | | | | |
| Investment income—net: | | | | |
| Initial Shares | | (9,323,702) | | (10,305,011) |
| Service Shares | | (1,793,974) | | (1,592,630) |
| Net realized gain on investments: | | | | |
| Initial Shares | | (34,731,092) | | — |
| Service Shares | | (7,782,917) | | — |
| Total Dividends | | (53,631,685) | | (11,897,641) |
| |
| |
|
| Beneficial Interest Transactions ($): | | | | |
| Net proceeds from shares sold: | | | | |
| Initial Shares | | 28,676,825 | | 41,265,860 |
| Service Shares | | 26,240,401 | | 33,395,223 |
| Dividends reinvested: | | | | |
| Initial Shares | | 44,054,794 | | 10,305,011 |
| Service Shares | | 9,576,891 | | 1,592,630 |
| Cost of shares redeemed: | | | | |
| Initial Shares | | (194,271,606) | | (197,317,992) |
| Service Shares | | (21,914,014) | | (34,288,008) |
| Increase (Decrease) in Net Assets | | | | |
| from Beneficial Interest Transactions | | (107,636,709) | | (145,047,276) |
| Total Increase (Decrease) in Net Assets | | (327,039,535) | | (105,353,723) |
| |
| |
|
| Net Assets ($): | | | | |
| Beginning of Period | | 690,428,017 | | 795,781,740 |
| End of Period | | 363,388,482 | | 690,428,017 |
| Undistributed investment income—net | | 9,101,859 | | 11,117,042 |
14
| | | Year Ended December 31, |
| | |
|
| | | 2008 | | 2007 |
| |
| |
|
| Capital Share Transactions: | | | | |
| Initial Shares | | | | |
| Shares sold | | 851,136 | | 948,930 |
| Shares issued for dividends reinvested | | 1,140,366 | | 247,360 |
| Shares redeemed | | (5,170,023) | | (4,506,835) |
| Net Increase (Decrease) in Shares Outstanding | | (3,178,521) | | (3,310,545) |
| |
| |
|
| Service Shares | | | | |
| Shares sold | | 748,259 | | 754,362 |
| Shares issued for dividends reinvested | | 249,009 | | 38,386 |
| Shares redeemed | | (623,234) | | (790,386) |
| Net Increase (Decrease) in Shares Outstanding | | 374,034 | | 2,362 |
| |
| See notes to financial statements. | | | | |
The Portfolio 15
FINANCIAL HIGHLIGHTS
The following tables describe the performance for each share class for the fiscal periods indicated. All information (except portfolio turnover rate) reflects financial results for a single portfolio share.Total return shows how much your investment in the portfolio would have increased (or decreased) during each period, assuming you had reinvested all dividends and distributions.These figures have been derived from the portfolio’s financial statements.
| | | | | Year Ended December 31, | | |
| | |
| |
| |
|
| Initial Shares | | 2008 | | 2007 | | 2006 | | 2005 | | 2004 |
| |
| |
| |
| |
| |
|
| Per Share Data ($): | | | | | | | | | | |
| Net asset value, beginning of period | | 44.86 | | 42.55 | | 37.11 | | 35.56 | | 34.42 |
| Investment Operations: | | | | | | | | | | |
| Investment income—neta | | .67 | | .66 | | .61 | | .54 | | .56 |
| Net realized and unrealized gain | | | | | | | | | | |
| (loss) on investments | | (13.01) | | 2.32 | | 5.42 | | 1.02 | | 1.18 |
| Total from Investment Operations | | (12.34) | | 2.98 | | 6.03 | | 1.56 | | 1.74 |
| Distributions: | | | | | | | | | | |
| Dividends from investment income—net | | (.77) | | (.67) | | (.59) | | (.01) | | (.60) |
| Dividends from net realized | | | | | | | | | | |
| gain on investments | | (2.87) | | — | | — | | — | | — |
| Total Distributions | | (3.64) | | (.67) | | (.59) | | (.01) | | (.60) |
| Net asset value, end of period | | 28.88 | | 44.86 | | 42.55 | | 37.11 | | 35.56 |
| |
| |
| |
| |
| |
|
| Total Return (%) | | (29.55) | | 7.14 | | 16.48 | | 4.38 | | 5.05 |
| |
| |
| |
| |
| |
|
| Ratios/Supplemental Data (%): | | | | | | | | | | |
| Ratio of total expenses | | | | | | | | | | |
| to average net assets | | .81 | | .80 | | .82 | | .80 | | .79 |
| Ratio of net expenses | | | | | | | | | | |
| to average net assets | | .81b | | .80 | | .82b | | .80 | | .79 |
| Ratio of net investment income | | | | | | | | | | |
| to average net assets | | 1.82 | | 1.52 | | 1.58 | | 1.48 | | 1.60 |
| Portfolio Turnover Rate | | 3.41 | | 5.17 | | 3.86 | | 2.67 | | 1.64 |
| |
| |
| |
| |
| |
|
| Net Assets, end of period ($ x 1,000) | | 274,782 | | 569,422 | | 681,035 | | 683,667 | | 766,169 |
| a | | Based on average shares outstanding at each month end. |
| b | | Expense waivers and/or reimbursements amounted to less than .01%. |
| See notes to financial statements. |
16
| | | | | Year Ended December 31, | | |
| | |
| |
| |
|
| Service Shares | | 2008 | | 2007 | | 2006 | | 2005 | | 2004 |
| |
| |
| |
| |
| |
|
| Per Share Data ($): | | | | | | | | | | |
| Net asset value, beginning of period | | 44.59 | | 42.32 | | 36.92 | | 35.46 | | 34.31 |
| Investment Operations: | | | | | | | | | | |
| Investment income—neta | | .58 | | .56 | | .51 | | .45 | | .46 |
| Net realized and unrealized | | | | | | | | | | |
| gain (loss) on investments | | (12.94) | | 2.30 | | 5.41 | | 1.01 | | 1.19 |
| Total from Investment Operations | | (12.36) | | 2.86 | | 5.92 | | 1.46 | | 1.65 |
| Distributions: | | | | | | | | | | |
| Dividends from investment income—net | | (.66) | | (.59) | | (.52) | | — | | (.50) |
| Dividends from net realized | | | | | | | | | | |
| gain on investments | | (2.87) | | — | | — | | — | | — |
| Total Distributions | | (3.53) | | (.59) | | (.52) | | — | | (.50) |
| Net asset value, end of period | | 28.70 | | 44.59 | | 42.32 | | 36.92 | | 35.46 |
| |
| |
| |
| |
| |
|
| Total Return (%) | | (29.72) | | 6.85 | | 16.21 | | 4.12 | | 4.80 |
| |
| |
| |
| |
| |
|
| Ratios/Supplemental Data (%): | | | | | | | | | | |
| Ratio of total expenses | | | | | | | | | | |
| to average net assets | | 1.06 | | 1.05 | | 1.07 | | 1.05 | | 1.04 |
| Ratio of net expenses | | | | | | | | | | |
| to average net assets | | 1.06b | | 1.05 | | 1.07b | | 1.05 | | 1.04 |
| Ratio of net investment income | | | | | | | | | | |
| to average net assets | | 1.61 | | 1.27 | | 1.33 | | 1.24 | | 1.34 |
| Portfolio Turnover Rate | | 3.41 | | 5.17 | | 3.86 | | 2.67 | | 1.64 |
| |
| |
| |
| |
| |
|
| Net Assets, end of period ($ x 1,000) | | 88,606 | | 121,006 | | 114,746 | | 101,172 | | 80,529 |
| a | | Based on average shares outstanding at each month end. |
| b | | Expense waivers and/or reimbursements amounted to less than .01%. |
| See notes to financial statements. |
The Portfolio 17
NOTES TO FINANCIAL STATEMENTS
NOTE 1—Significant Accounting Policies:
Dreyfus Variable Investment Fund (the “fund”) is registered under the Investment Company Act of 1940, as amended (the “Act”), as an open-end management investment company, operating as a series company currently offering seven series, including the Appreciation Portfolio (the “portfolio”). The portfolio is only offered to separate accounts established by insurance companies to fund variable annuity contracts and variable life insurance policies.The portfolio is a diversified series. The portfolio’s investment objective is to provide long-term capital growth consistent with the preservation of capital. The Dreyfus Corporation (the “Manager” or “Dreyfus”), a wholly-owned subsidiary of The Bank of New York Mellon Corporation (“BNY Mellon”), serves as the portfolio’s investment adviser. Fayez Sarofim & Co. (“Sarofim & Co.”) serves as the portfolio’s sub-investment adviser.
Effective July 1, 2008, BNY Mellon reorganized and consolidated a number of its banking and trust company subsidiaries.As a result of the reorganization, any services previously provided to the portfolio by Mellon Bank, N.A. or Mellon Trust of New England, N.A. are now provided by The Bank of New York Mellon (formerly, The Bank of New York).
MBSC Securities Corporation (the “Distributor”), a wholly-owned subsidiary of Dreyfus, is the distributor of the portfolio’s shares, which are sold without a sales charge.The portfolio is authorized to issue an unlimited number of $.001 par value shares of Beneficial Interest in each of the following classes of shares: Initial and Service. Each class of shares has identical rights and privileges, except with respect to the distribution plan and the expenses borne by each class, the allocation of certain transfer agency costs and certain voting rights. Income, expenses (other than expenses attributable to a specific class), and realized and unrealized gains or losses on investments are allocated to each class of shares based on its relative net assets.
18
The fund accounts separately for the assets, liabilities and operations of each series. Expenses directly attributable to each series are charged to that series’ operations; expenses which are applicable to all series are allocated among them on a pro rata basis.
The portfolio’s financial statements are prepared in accordance with U.S. generally accepted accounting principles, which may require the use of management estimates and assumptions.Actual results could differ from those estimates.
The fund enters into contracts that contain a variety of indemnifica-tions.The portfolio’s maximum exposure under these arrangements is unknown. The portfolio does not anticipate recognizing any loss related to these arrangements.
(a) Portfolio valuation: Investments in securities are valued at the last sales price on the securities exchange or national securities market on which such securities are primarily traded. Securities listed on the National Market System for which market quotations are available are valued at the official closing price or, if there is no official closing price that day, at the last sales price. Securities not listed on an exchange or the national securities market, or securities for which there were no transactions, are valued at the average of the most recent bid and asked prices, except for open short positions, where the asked price is used for valuation purposes. Bid price is used when no asked price is available. Registered investment companies that are not traded on an exchange are valued at their net asset value.When market quotations or official closing pric es are not readily available, or are determined not to reflect accurately fair value, such as when the value of a security has been significantly affected by events after the close of the exchange or market on which the security is principally traded (for example, a foreign exchange or market), but before the portfolio calculates its net asset value, the portfolio may value these investments at fair value as
The Portfolio 19
| NOTES TO FINANCIAL STATEMENTS (continued) |
determined in accordance with the procedures approved by the Board of Trustees. Fair valuing of securities may be determined with the assistance of a pricing service using calculations based on indices of domestic securities and other appropriate indicators, such as prices of relevant ADRs and futures contracts. For other securities that are fair valued by the Board ofTrustees, certain factors may be considered such as: fundamental analytical data, the nature and duration of restrictions on disposition, an evaluation of the forces that influence the market in which the securities are purchased and sold and public trading in similar securities of the issuer or comparable issuers. Financial futures are valued at the last sales price. Investments denominated in foreign currencies are translated to U.S. dollars at the prevailing rates of exchange. Forward currency exchange contracts are valued at the forward rate.
The portfolio adopted Statement of Financial Accounting Standards No. 157 “Fair Value Measurements” (“FAS 157”). FAS 157 establishes an authoritative definition of fair value, sets out a framework for measuring fair value, and requires additional disclosures about fair value measurements.
Various inputs are used in determining the value of the portfolio’s investments relating to FAS 157.These inputs are summarized in the three broad levels listed below.
| | Level 1—quoted prices in active markets for identical securities.
Level 2—other significant observable inputs (including quoted
prices for similar securities, interest rates, prepayment speeds, credit
risk, etc.).
Level 3—significant unobservable inputs (including the portfolio’s
own assumptions in determining the fair value of investments). |
The inputs or methodology used for valuing securities are not necessarily an indication of the risk associated with investing in those securities.
20
The following is a summary of the inputs used as of December 31, 2008 in valuing the portfolio’s investments carried at fair value:
| | | Investments in | | Other Financial |
| Valuation Inputs | | Securities ($) | | Instruments ($)† |
| |
| |
|
| Level 1—Quoted Prices | | 346,600,963 | | 0 |
| Level 2—Other Significant | | | | |
| Observable Inputs | | 22,104,445 | | 0 |
| Level 3—Significant | | | | |
| Unobservable Inputs | | 0 | | 0 |
| Total | | 368,705,408 | | 0 |
| † | | Other financial instruments include derivative instruments, such as futures, forward currency |
| | | exchange contracts and swap contracts, which are valued at the unrealized appreciation |
| | | (depreciation) on the instrument and written options contracts which are shown at value. |
(b) Foreign currency transactions: The portfolio does not isolate that portion of the results of operations resulting from changes in foreign exchange rates on investments from the fluctuations arising from changes in market prices of securities held. Such fluctuations are included with the net realized and unrealized gain or loss on investments.
Net realized foreign exchange gains or losses arise from sales and maturities of short-term securities, sales of foreign currencies, currency gains or losses realized on securities transactions and the difference between the amounts of dividends, interest and foreign withholding taxes recorded on the portfolio’s books and the U.S. dollar equivalent of the amounts actually received or paid. Net unrealized foreign exchange gains and losses arise from changes in the value of assets and liabilities other than investments in securities, resulting from changes in exchange rates. Such gains and losses are included with net realized and unrealized gain or loss on investments.
(c) Securities transactions and investment income: Securities transactions are recorded on a trade date basis. Realized gains and losses
The Portfolio 21
| NOTES TO FINANCIAL STATEMENTS (continued) |
from securities transactions are recorded on the identified cost basis. Dividend income is recognized on the ex-dividend date and interest income, including, where applicable, accretion of discount and amortization of premium on investments, is recognized on the accrual basis.
The portfolio has arrangements with the custodian and cash management banks whereby the portfolio may receive earnings credits when positive cash balances are maintained, which are used to offset custody and cash management fees. For financial reporting purposes, the portfolio includes net earnings credits as an expense offset in the Statement of Operations.
Pursuant to a securities lending agreement with The Bank of New York Mellon, a subsidiary of BNY Mellon and an affiliate of Dreyfus, the portfolio may lend securities to qualified institutions. It is the portfolio’s policy that, at origination, all loans are secured by collateral of at least 102% of the value of U.S. securities loaned and 105% of the value of foreign securities loaned. Collateral equivalent to at least 100% of the market value of securities on loan is maintained at all times. Collateral is either in the form of cash, which can be invested in certain money market mutual funds managed by Dreyfus, U.S. Government and Agency securities or letters of credit.The portfolio is entitled to receive all income on securities loaned, in addition to income earned as a result of the lending transaction. Although each security loaned is fully collateralized, the portfolio bears the risk of delay in recovery of, or loss of rights in, the securities loaned should a borrower fail to return the securities in a timely manner. During the period ended December 31, 2008, The Bank of New York Mellon earned $72,804 from lending portfolio securities, pursuant to the securities lending agreement.
(d) Affiliated issuers: Investments in other investment companies advised by Dreyfus are defined as “affiliated” in the Act.
(e) Dividends to shareholders: Dividends are recorded on the ex-dividend date. Dividends from investment income-net and dividends from net realized capital gains are normally declared and paid annually, but
22
the portfolio may make distributions on a more frequent basis to comply with the distribution requirements of the Internal Revenue Code of 1986, as amended (the “Code”).To the extent that net realized capital gains can be offset by capital loss carryovers, it is the policy of the portfolio not to distribute such gains. Income and capital gain distributions are determined in accordance with income tax regulations, which may differ from U.S. generally accepted accounting principles.
(f) Federal income taxes: It is the policy of the portfolio to continue to qualify as a regulated investment company, if such qualification is in the best interests of its shareholders, by complying with the applicable provisions of the Code, and to make distributions of taxable income sufficient to relieve it from substantially all federal income and excise taxes.
As of and during the period ended December 31, 2008, the portfolio did not have any liabilities for any unrecognized tax positions.The portfolio recognizes interest and penalties, if any, related to unrecognized tax positions as income tax expense in the Statement of Operations. During the period, the portfolio did not incur any interest or penalties.
Each of the tax years in the four-year period ended December 31, 2008 remains subject to examination by the Internal Revenue Service and state taxing authorities.
At December 31, 2008, the components of accumulated earnings on a tax basis were as follows: ordinary income $9,225,592, undistributed capital gains $27,234,546 and unrealized appreciation $42,339,430.
The tax character of distributions paid to shareholders during the fiscal periods ended December 31, 2008 and December 31, 2007 were as follows: undistributed ordinary income $11,221,296 and $11,897,641 and long-term capital gains $42,410,389 and $0, respectively.
During the period ended December 31, 2008, as a result of permanent book to tax differences, primarily due to the tax treatment for foreign currency exchange gains and losses, the portfolio increased accumu-
The Portfolio 23
| NOTES TO FINANCIAL STATEMENTS (continued) |
lated undistributed investment income-net by $1,930 and decreased accumulated net realized gain (loss) on investments by the same amount. Net assets and net asset value per share were not affected by this reclassification.
NOTE 2—Bank Lines of Credit:
Prior to October 15, 2008, the portfolio participated with other Dreyfus-managed funds in a $350 million redemption credit facility. Effective October 15, 2008, the portfolio participates with other Dreyfus-managed funds in a $145 million redemption credit facility (the “Facility”) to be utilized for temporary or emergency purposes, including the financing of redemptions. In connection therewith, the portfolio has agreed to pay commitment fees on its pro rata portion of the Facility. Interest is charged to the portfolio based on prevailing market rates in effect at the time of borrowing.
The average daily amount of borrowings outstanding under the Facilities during the period ended December 31, 2008 was approximately $114,500, with a related weighted average annualized interest rate of 2.21% .
NOTE 3—Investment Advisory Fee, Sub-Investment Advisory Fee and Other Transactions With Affiliates:
(a) Pursuant to an Investment Advisory Agreement with Dreyfus, the investment advisory fee is based on the value of the portfolio’s average daily net assets and is computed at the following annual rates: .55% of the first $150 million; .50% of the next $150 million; and .375% over $300 million. The fee is payable monthly. Pursuant to a Sub-Investment Advisory Agreement with Sarofim & Co., the sub-investment advisory fee is based upon the value of the portfolio’s average daily net assets and is computed at the following annual rates: .20% of the first $150 million; ..25% of the next $150 million; and .375% over $300 million.The fee is payable monthly.
24
(b) Under the Distribution Plan (the “Plan”) adopted pursuant to Rule 12b-1 under the Act, Service shares pay the Distributor for distributing their shares, for servicing and/or maintaining Service shares shareholder accounts and for advertising and marketing for Service shares.The Plan provides for payments to be made at an annual rate of .25% of the value of the Service shares’ average daily net assets.The Distributor may make payments to Participating Insurance Companies and to brokers and dealers acting as principal underwriter for their variable insurance products.The fees payable under the Plan are payable without regard to actual expenses incurred. During the period ended December 31, 2008, Service shares were charged $269,613 pursuant to the Plan.
The portfolio compensates Dreyfus Transfer, Inc., a wholly-owned subsidiary of Dreyfus, under a transfer agency agreement for providing personnel and facilities to perform transfer agency services for the portfolio. During the period ended December 31, 2008, the portfolio was charged $1,285 pursuant to the transfer agency agreement.
The portfolio compensates The Bank of New York Mellon under a cash management agreement for performing cash management services related to portfolio subscriptions and redemptions. During the period ended December 31, 2008, the portfolio was charged $164 pursuant to the cash management agreement.
The portfolio compensates The Bank of New York Mellon under a custody agreement for providing custodial services for the portfolio. During the period ended December 31, 2008, the portfolio was charged $47,773 pursuant to the custody agreement.
During the period ended December 31, 2008, the portfolio was charged $5,403 for services performed by the Chief Compliance Officer.
The components of “Due to The Dreyfus Corporation and affiliates” in the Statement of Assets and Liabilities consist of: investment advi-
The Portfolio 25
| NOTES TO FINANCIAL STATEMENTS (continued) |
sory fees $150,591, Rule 12b-1 distribution plan fees $17,933, custodian fees $12,591, chief compliance officer fees $1,197 and transfer agency per account fees $195.
(c) Each Board member also serves as a Board member of other funds within the Dreyfus complex. Annual retainer fees and attendance fees are allocated to each fund based on net assets.
NOTE 4—Securities Transactions:
The aggregate amount of purchases and sales of investment securities, excluding short-term securities, during the period ended December 31, 2008, amounted to $17,500,208 and $170,427,062, respectively.
At December 31, 2008, the cost of investments for federal income tax purposes was $326,368,683; accordingly, accumulated net unrealized appreciation on investments was $42,336,725, consisting of $96,193,330 gross unrealized appreciation and $53,856,605 gross unrealized depreciation.
In March 2008, the Financial Accounting Standards Boards released Statement of Financial Accounting Standards No. 161, “Disclosures about Derivative Instruments and Hedging Activities” (“FAS 161”). FAS 161 requires qualitative disclosures about objectives and strategies for using derivatives, quantitative disclosures about fair value amounts of gains and losses on derivative instruments, and disclosures about credit-risk-related contingent features in derivative agreements. The application of FAS 161 is required for fiscal years and interim periods beginning after November 15, 2008.At this time, management is evaluating the implications of FAS 161 and its impact on the financial statements and the accompanying notes has not yet been determined.
26
REPORT OF INDEPENDENT REGISTERED
PUBLIC ACCOUNTING FIRM |
Shareholders and Board of Trustees
Dreyfus Variable Investment Fund, Appreciation Portfolio
We have audited the accompanying statement of assets and liabilities, including the statement of investments, of Dreyfus Variable Investment Fund, Appreciation Portfolio (one of the series comprising Dreyfus Variable Investment Fund) as of December 31, 2008, and the related statement of operations for the year then ended, the statement of changes in net assets for each of the two years in the period then ended, and financial highlights for each of the years indicated therein. These financial statements and financial highlights are the responsibility of the Fund’s management. Our responsibility is to express an opinion on these financial statements and financial highlights based on our audits. We conducted our audits in accordance with the standards of the Public Company Accounting Oversight Board (United States).Those standards require that we plan and perform the audit to obtain reasonable assurance about whether the financial statemen ts and financial highlights are free of material misstatement.We were not engaged to perform an audit of the Fund’s internal control over financial reporting. Our audits included consideration of internal control over financial reporting as a basis for designing audit procedures that are appropriate in the circumstances, but not for the purpose of expressing an opinion on the effectiveness of the Fund’s internal control over financial reporting. Accordingly, we express no such opinion. An audit also includes examining, on a test basis, evidence supporting the amounts and disclosures in the financial statements and financial highlights, assessing the accounting principles used and significant estimates made by management, and evaluating the overall financial statement presentation. Our procedures included confirmation of securities owned as of December 31, 2008 by correspondence with the custodian and others.We believe that our audits provide a reasonable basis for our opinion.
In our opinion, the financial statements and financial highlights referred to above present fairly, in all material respects, the financial position of DreyfusVariable Investment Fund,Appreciation Portfolio at December 31, 2008, the results of its operations for the year then ended, the changes in its net assets for each of the two years in the period then ended, and the financial highlights for each of the indicated years, in conformity with U. S. generally accepted accounting principles.
New York, New York
February 10, 2009 |
The Portfolio 27
IMPORTANT TAX INFORMATION (Unaudited)
For federal tax purposes, the portfolio hereby designates $2.8650 per share as a long-term capital gain distribution and $.0070 per share as a short-term capital gain distribution paid on March 26, 2008 and also the portfolio hereby designates 100% of the ordinary dividends paid during the fiscal year ended December 31, 2008 as qualifying for the corporate dividends received deduction. Shareholders will receive notification in January 2009 of the percentage applicable to the preparation of their 2008 income tax returns.
28
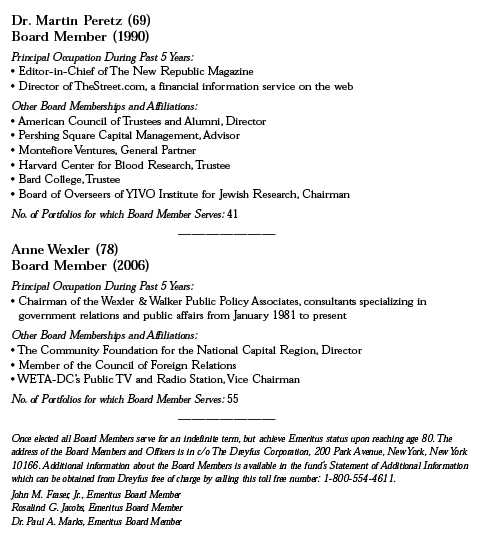
BOARD MEMBERS INFORMATION (Unaudited)

The Portfolio 29
BOARD MEMBERS INFORMATION (Unaudited) (continued)

30
The Portfolio 31
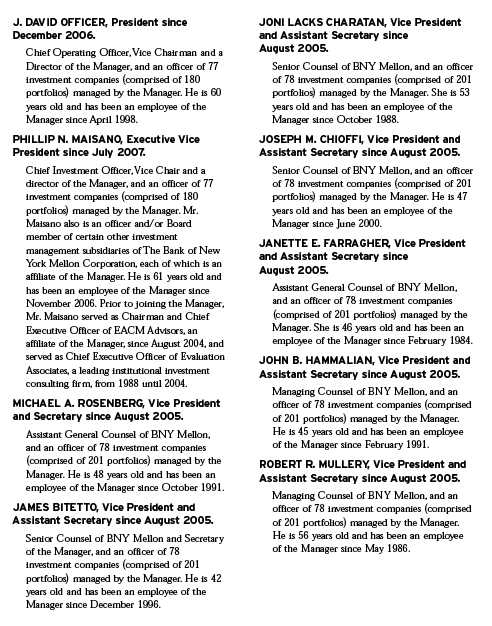
OFFICERS OF THE FUND (Unaudited)
32

The Portfolio 33
For More Information

Telephone 1-800-554-4611 or 516-338-3300
Mail The Dreyfus Family of Funds, 144 Glenn Curtiss Boulevard, Uniondale, NY 11556-0144 Attn: Investments Division
The portfolio files its complete schedule of portfolio holdings with the Securities and Exchange Commission (“SEC”) for the first and third quarters of each fiscal year on Form N-Q. The portfolio’s Forms N-Q are available on the SEC’s website at http://www.sec.gov and may be reviewed and copied at the SEC’s Public Reference Room in Washington, DC. Information on the operation of the Public Reference Room may be obtained by calling 1-800-SEC-0330.
A description of the policies and procedures that the portfolio uses to determine how to vote proxies relating to portfolio securities, and information regarding how the portfolio voted these proxies for the 12-month period ended June 30, 2008, is available at http://www.dreyfus.com and on the SEC’s website at http://www.sec.gov. The description of the policies and procedures is also available without charge, upon request, by calling 1-800-645-6561.

| © 2009 MBSC Securities Corporation |
| | Dreyfus Variable
Investment Fund,
Developing Leaders
Portfolio |
| | ANNUAL REPORT December 31, 2008 |

The views expressed in this report reflect those of the portfolio manager only through the end of the period covered and do not necessarily represent the views of Dreyfus or any other person in the Dreyfus organization.Any such views are subject to change at any time based upon market or other conditions and Dreyfus disclaims any responsibility to update such views. These views may not be relied on as investment advice and, because investment decisions for a Dreyfus portfolio are based on numerous factors, may not be relied on as an indication of trading intent on behalf of any Dreyfus portfolio.
| | Contents |
| |
| | THE PORTFOLIO |
| |
| 2 | A Letter from the CEO |
| |
| 3 | Discussion of Performance |
| |
| 6 | Portfolio Performance |
| |
| 8 | Understanding Your Portfolio’s Expenses |
| |
| 8 | Comparing Your Portfolio’s Expenses With Those of Other Funds |
| |
| 9 | Statement of Investments |
| |
| 18 | Statement of Assets and Liabilities |
| |
| 19 | Statement of Operations |
| |
| 20 | Statement of Changes in Net Assets |
| |
| 22 | Financial Highlights |
| |
| 24 | Notes to Financial Statements |
| |
| 33 | Report of Independent Registered Public Accounting Firm |
| |
| 34 | Important Tax Information |
| |
| 35 | Board Members Information |
| |
| 38 | Officers of the Fund |
| |
| | FOR MORE INFORMATION |
| |
| | Back Cover |
| |
Dreyfus Variable Investment Fund,
Developing Leaders Portfolio |
The Portfolio

A LETTER FROM THE CEO
Dear Shareholder: |
We present to you this annual report for Dreyfus Variable Investment Fund, Developing Leaders Portfolio covering the 12-month period from January 1, 2008, through December 31, 2008.
2008 was the most difficult year in decades for the economy and stock market.A credit crunch that originated in 2007 in the U.S. sub-prime mortgage market exploded in mid-2008 into a global financial crisis, resulting in the failures of major financial institutions, a deep and prolonged recession and lower investment values across a broad range of asset classes. Governments and regulators throughout the world moved aggressively to curtail the damage, implementing unprecedented reductions of short-term interest rates, massive injections of liquidity into the banking system, government bailouts of struggling companies and plans for massive economic stimulus programs.
Although we expect the U.S. and global economies to remain weak until longstanding imbalances have worked their way out of the system, the financial markets currently appear to have priced in investors’ generally low expectations. In previous recessions, however, the markets have tended to anticipate economic improvement before it occurs, potentially leading to major rallies when few expected them. That’s why it makes sense to remain disciplined, maintain a long-term perspective and adopt a consistent asset allocation strategy that reflects one’s future goals and attitudes toward risk. As always, we urge you to consult with your financial advisor, who can recommend the course of action that is right for you.
For information about how the portfolio performed during the reporting period, as well as market perspectives, we have provided a Discussion of Performance given by the Portfolio Managers.
Thank you for your continued confidence and support.
Jonathan R. Baum
Chief Executive Officer
The Dreyfus Corporation
January 15, 2009 |
2

DISCUSSION OF PERFORMANCE
For the period of January 1, 2008, through December 31, 2008, as provided by Oliver Buckley, Langton C. Garvin and Kristin Crawford, Portfolio Managers
Portfolio and Market Performance Overview
For the 12-month period ended December 31, 2008, DreyfusVariable Investment Fund, Developing Leaders Portfolio’s Initial shares produced a total return of –37.59%, and its Service shares produced a total return of –37.77% .1 In comparison, the Russell 2000 Index (the “Index”), the portfolio’s benchmark, produced a total return of –33.79% for the same period.2
After a choppy start to the year, stock markets plummeted during the second half of 2008 due to an intensifying financial crisis and slowing economic growth. All market capitalization ranges fell sharply, but small-cap stocks generally suffered slightly less precipitous declines than their larger-cap counterparts. The portfolio’s performance was negatively affected by several individual stock selections, which caused its returns to underperform the benchmark.
The Portfolio’s Investment Approach
We select small-cap stocks through a “bottom-up” approach that seeks to identify undervalued securities using a quantitative screening process. This process is driven by a proprietary quantitative model, which measures more than 40 stock characteristics to identify and rank stocks. Over time, we attempt to construct a portfolio that has exposure to industries and market capitalizations generally similar to the portfolio’s benchmark. Within each sector, we seek to overweight the most attractive stocks and underweight or not hold the stocks that have been ranked least attractive.
Investor Sentiment Overwhelmed Company Fundamentals
Rapidly changing economic and geopolitical forces produced exceptionally volatile market shifts during 2008. Over the first half of the year, robust global demand drove prices for petroleum and many other key industrial commodities sharply higher.At the same time, a credit crunch that began in 2007 produced massive losses for highly leveraged institutional investors, who were compelled to raise cash by selling their more liquid and creditworthy holdings, putting downward pressure on a broad
The Portfolio 3
| DISCUSSION OF PERFORMANCE (continued) |
range of financial assets. During these six months, although the portfolio’s value-related analytical factors correlated poorly with performance, momentum-related metrics worked reasonably well.
As the second half of 2008 unfolded, housing prices deflated, unemployment rates rose, credit markets seized, a number of major financial institutions teetered on the brink of insolvency and commodity prices plunged, forcing businesses and consumers to curtail spending and driving the U.S. economy deeper into recession. In the face of these developments, investors increasingly reacted to short-term events rather than investing on the basis of long-term company fundamentals.The portfolio’s momentum metrics began to subtract from its relative performance, while value factors worked only slightly better.As a result, our quantitative, bottom-up stock selection approach proved relatively ineffective during the second half of the year.
Deteriorating Economic Conditions Produced Disappointments
Most of the portfolio’s weaker holdings were caught up in the sweep of negative economic news, with particularly disappointing relative returns in the basic materials, energy and industrials sectors. Coal mining company Alpha Natural Resources fell along with other commodity stocks shortly after the portfolio initiated its position in June 2008. Offshore oil and gas services provider Trico Marine Services declined after a series of weaker-than-expected earnings announcements, and it lost additional ground when commodity prices plunged. Automobile anti-theft device maker LoJack, which was sold during the reporting period, was undermined by weak U.S. car sales. Other notably poor performers included information technology services provider COMSYS IT Partners, which was also sold during the reporting period; banking company Oriental Financial Group; beverage distributor Central European Distribution; and wireless communications company iPCS, all of which were hurt by deteriorating business conditions.
On a more positive note, several holdings outperformed their industry peers,with some contributing positively to the portfolio’s relative returns. Biotechnology developer ViroPharma rose sharply due to increasing revenues and new product development. Surgical equipment maker CONMED posted consistently higher earnings and revenues despite budget tightening by hospitals, enabling the stock to hold its ground. Business process outsourcing provider Sykes Enterprises achieved mild
4
gains on the strength of steadily rising revenues and better-than-expected earnings. Investment advisory firm Greenhill & Co., which was sold during the reporting period, advanced on the growth of its asset management business in the face of a steep downturn affecting much of the financial sector. Finally, alternative fuel systems designer Fuel Systems Solutions fell by a relatively mild margin compared to other automobile equipment makers by delivering stronger-than-predicted earnings and revenue increases.
Emphasizing Companies with Healthy Balance Sheets
As economic conditions deteriorated and credit availability tightened, we have taken steps in an attempt to cushion the portfolio from certain foreseeable market risks. As of year-end, we have emphasized investments in higher-quality companies that we believe offer good prospects for consistent profitability despite the recessionary environment.We also have focused on companies that exhibit relatively little sensitivity to tight credit markets because they hold little debt or have the ability to service their debt independently. By using our quantitative process to identify the individual stocks with attractive value, momentum and quality characteristics in each sector and industry, we believe we can position the portfolio to perform relatively well even in these challenging times.
January 15, 2009
The portfolio is only available as a funding vehicle under various life insurance policies or variable annuity contracts issued by insurance companies. Individuals may not purchase shares of the portfolio directly.A variable annuity is an insurance contract issued by an insurance company that enables investors to accumulate assets on a tax-deferred basis for retirement or other long-term goals. The investment objective and policies of Dreyfus Variable Investment Fund, Developing Leaders Portfolio made available through insurance products may be similar to other funds/portfolios managed or advised by Dreyfus. However, the investment results of the portfolio may be higher or lower than, and may not be comparable to, those of any other Dreyfus fund/portfolio.
| 1 | | Total return includes reinvestment of dividends and any capital gains paid. Past performance is no |
| | | guarantee of future results. Share price and investment return fluctuate such that upon redemption, |
| | | portfolio shares may be worth more or less than their original cost.The portfolio’s performance does |
| | | not reflect the deduction of additional charges and expenses imposed in connection with investing |
| | | in variable insurance contracts, which will reduce returns. Return figures provided reflect the |
| | | absorption of certain portfolio expenses by The Dreyfus Corporation pursuant to an agreement in |
| | | effect through May 1, 2009, at which time it may be extended, terminated or modified. Had |
| | | these expenses not been absorbed, the portfolio’s returns would have been lower. |
| 2 | | SOURCE: LIPPER INC. — Reflects reinvestment of dividends and, where applicable, capital |
| | | gain distributions.The Russell 2000 Index is an unmanaged index of small-cap stock performance |
| | | and is composed of the 2,000 smallest companies in the Russell 3000 Index.The Russell 3000 |
| | | Index is composed of the 3,000 largest U.S. companies based on total market capitalization. |
The Portfolio 5

| Average Annual Total Returns as of 12/31/08 | | | | |
| | | 1 Year | | 5 Years | | 10 Years |
| |
| |
| |
|
| Initial shares | | (37.59)% | | (7.46)% | | (0.55)% |
| Service shares | | (37.77)% | | (7.70)% | | (0.76)% |
The data for Service shares includes the results of Initial shares for the period prior to December 31, 2000 (inception date of Service shares). Actual Service shares’ average annual total return and hypothetical growth results would have been lower. See notes below.
† Source: Lipper Inc.
Past performance is not predictive of future performance.The portfolio’s performance shown in the graph and table does not reflect the deduction of taxes that a shareholder would pay on portfolio distributions or the redemption of portfolio shares.
The portfolio’s performance does not reflect the deduction of additional charges and expenses imposed in connection with investing in variable insurance contracts which will reduce returns.
The above graph compares a $10,000 investment made in Initial and Service shares of Dreyfus Variable Investment Fund, Developing Leaders Portfolio on 12/31/98 to a $10,000 investment made in the Russell 2000 Index (the “Index”) on that date.
6
The portfolio’s Initial shares are not subject to a Rule 12b-1 fee.The portfolio’s Service shares are subject to a 0.25% annual Rule 12b-1 fee.The performance figures for Service shares reflect the performance of the portfolio’s Initial shares from their inception date through December 30, 2000, and the performance of the portfolio’s Service shares from December 31, 2000 (inception date of Service shares) to December 31, 2008 (blended performance figures).The blended performance figures have not been adjusted to reflect the higher operating expenses of the Service shares. If these expenses had been reflected, the blended performance figures would have been lower. All dividends and capital gain distributions are reinvested.
The portfolio’s performance shown in the line graph takes into account all applicable portfolio fees and expenses.The Index is an unmanaged index and is composed of the 2,000 smallest companies in the Russell 3000 Index.The Russell 3000 Index is composed of 3,000 of the largest U.S. companies by market capitalization. Unlike a mutual fund, the Index is not subject to charges, fees and other expenses. Investors cannot invest directly in any index. Further information relating to portfolio performance, including expense reimbursements, if applicable, is contained in the Financial Highlights section of the prospectus and elsewhere in this report.
The Portfolio 7
UNDERSTANDING YOUR
PORTFOLIO’S EXPENSES (Unaudited) |
As a mutual fund investor, you pay ongoing expenses, such as management fees and other expenses. Using the information below, you can estimate how these expenses affect your investment and compare them with the expenses of other funds.You also may pay one-time transaction expenses, including sales charges (loads) and redemption fees,which are not shown in this section and would have resulted in higher total expenses. For more information, see your portfolio’s prospectus or talk to your financial adviser.
Review your portfolio’s expenses
The table below shows the expenses you would have paid on a $1,000 investment in Dreyfus Variable Investment Fund, Developing Leaders Portfolio from July 1, 2008 to December 31, 2008. It also shows how much a $1,000 investment would be worth at the close of the period, assuming actual returns and expenses.
| | Expenses and Value of a $1,000 Investment
assuming actual returns for the six months ended December 31, 2008 |
| | | Initial Shares | | Service Shares |
| |
| |
|
| Expenses paid per $1,000† | | $ 3.05 | | $ 4.10 |
| Ending value (after expenses) | | $683.80 | | $682.80 |
| | COMPARING YOUR PORTFOLIO’S EXPENSES
WITH THOSE OF OTHER FUNDS (Unaudited) |
Using the SEC’s method to compare expenses
The Securities and Exchange Commission (SEC) has established guidelines to help investors assess fund expenses. Per these guidelines, the table below shows your portfolio’s expenses based on a $1,000 investment, assuming a hypothetical 5% annualized return. You can use this information to compare the ongoing expenses (but not transaction expenses or total cost) of investing in the portfolio with those of other funds. All mutual fund shareholder reports will provide this information to help you make this comparison. Please note that you cannot use this information to estimate your actual ending account balance and expenses paid during the period.
| | Expenses and Value of a $1,000 Investment
assuming a hypothetical 5% annualized return for the six months ended December 31, 2008 |
| | | Initial Shares | | Service Shares |
| |
| |
|
| Expenses paid per $1,000† | | $ 3.66 | | $ 4.93 |
| Ending value (after expenses) | | $1,021.52 | | $1,020.26 |
| † Expenses are equal to the portfolio’s annualized expense ratio of .72% for Initial shares and .97% for Service shares, |
| multiplied by the average account value over the period, multiplied by 184/366 (to reflect the one-half year period). |
8
STATEMENT OF INVESTMENTS
December 31, 2008 |
| Common Stocks—99.4% | | Shares | | Value ($) |
| |
| |
|
| Commercial & Professional Services—8.1% | | | | |
| Anixter International | | 20,300 a | | 611,436 |
| Applied Industrial Technologies | | 36,400 a | | 688,688 |
| ATC Technology | | 15,100 b | | 220,913 |
| Beacon Roofing Supply | | 45,500 a,b | | 631,540 |
| Concur Technologies | | 16,200 a,b | | 531,684 |
| Cross Country Healthcare | | 84,900 a,b | | 746,271 |
| Gartner | | 35,800 a,b | | 638,314 |
| MPS Group | | 139,800 a,b | | 1,052,694 |
| MWI Veterinary Supply | | 6,500 b | | 175,240 |
| Nash Finch | | 12,800 a | | 574,592 |
| On Assignment | | 45,300 b | | 256,851 |
| PSS World Medical | | 35,800 a,b | | 673,756 |
| ScanSource | | 51,800 a,b | | 998,186 |
| School Specialty | | 11,400 a,b | | 217,968 |
| Standard Register | | 46,400 a | | 414,352 |
| Sykes Enterprises | | 97,700 b | | 1,868,024 |
| TeleTech Holdings | | 125,000 b | | 1,043,750 |
| Viad | | 25,500 | | 630,870 |
| VistaPrint | | 16,300 b | | 303,343 |
| Watson Wyatt Worldwide, Cl. A | | 3,600 a | | 172,152 |
| World Fuel Services | | 4,000 | | 148,000 |
| | | | | 12,598,624 |
| Communications—2.7% | | | | |
| iPCS | | 56,700 b | | 388,962 |
| NTELOS Holdings | | 59,700 | | 1,472,202 |
| Starent Networks | | 107,200 a,b | | 1,278,896 |
| Syniverse Holdings | | 36,000 b | | 429,840 |
| USA Mobility | | 45,500 b | | 526,435 |
| | | | | 4,096,335 |
| Consumer Durables—3.2% | | | | |
| Fossil | | 77,000 a,b | | 1,285,900 |
| Fuel Systems Solutions | | 33,200 a,b | | 1,087,632 |
| M/I Homes | | 15,300 | | 161,262 |
| Meritage Homes | | 12,000 b | | 146,040 |
| Mine Safety Appliances | | 7,800 | | 186,498 |
The Portfolio 9
| STATEMENT OF INVESTMENTS (continued) |
| Common Stocks (continued) | | Shares | | Value ($) |
| |
| |
|
| Consumer Durables (continued) | | | | |
| Polaris Industries | | 34,200 a | | 979,830 |
| WMS Industries | | 43,000 a,b | | 1,156,700 |
| | | | | 5,003,862 |
| Consumer Non-Durables—4.2% | | | | |
| American Greetings, Cl. A | | 89,500 | | 677,515 |
| Cal-Maine Foods | | 54,100 a | | 1,552,670 |
| Central European Distribution | | 23,600 b | | 464,920 |
| Chattem | | 5,500 a,b | | 393,415 |
| M & F Worldwide | | 40,600 a,b | | 627,270 |
| Oxford Industries | | 66,600 | | 584,082 |
| Perry Ellis International | | 58,300 b | | 369,622 |
| True Religion Apparel | | 26,200 b | | 325,928 |
| Universal | | 37,400 a | | 1,117,138 |
| Warnaco Group | | 15,600 b | | 306,228 |
| | | | | 6,418,788 |
| Consumer Services—3.4% | | | | |
| Bally Technologies | | 17,100 a,b | | 410,913 |
| Bidz.com | | 60,200 a,b | | 276,920 |
| Cox Radio, Cl. A | | 33,100 a,b | | 198,931 |
| Fisher Communications | | 5,100 a | | 105,264 |
| Jack in the Box | | 62,600 a,b | | 1,382,834 |
| P.F. Chang’s China Bistro | | 18,800 a,b | | 393,672 |
| Peet’s Coffee & Tea | | 24,500 b | | 569,625 |
| Pre-Paid Legal Services | | 27,600 a,b | | 1,029,204 |
| Priceline.com | | 10,800 a,b | | 795,420 |
| Red Robin Gourmet Burgers | | 10,100 b | | 169,983 |
| | | | | 5,332,766 |
| Electronic Technology—7.6% | | | | |
| Anaren | | 33,900 b | | 405,105 |
| Avocent | | 21,000 b | | 376,110 |
| Cognex | | 85,100 | | 1,259,480 |
| Comtech Telecommunications | | 6,500 b | | 297,830 |
| CTS | | 61,500 | | 338,865 |
| Daktronics | | 11,800 | | 110,448 |
| Dionex | | 16,900 b | | 757,965 |
| EMS Technologies | | 9,400 b | | 243,178 |
| Intevac | | 80,900 b | | 410,163 |
10
| Common Stocks (continued) | | Shares | | Value ($) |
| |
| |
|
| Electronic Technology (continued) | | | | |
| Methode Electronics | | 41,200 | | 277,688 |
| Multi-Fineline Electronix | | 50,200 a,b | | 586,838 |
| OmniVision Technologies | | 75,800 b | | 397,950 |
| Oplink Communications | | 61,400 b | | 528,040 |
| Orbital Sciences | | 91,900 b | | 1,794,807 |
| Pericom Semiconductor | | 147,900 b | | 810,492 |
| Polycom | | 38,000 b | | 513,380 |
| Rackable Systems | | 35,400 b | | 139,476 |
| Semtech | | 44,700 a,b | | 503,769 |
| Skyworks Solutions | | 93,600 a,b | | 518,544 |
| Standard Microsystems | | 13,900 b | | 227,126 |
| TTM Technologies | | 65,200 a,b | | 339,692 |
| Ultratech | | 15,500 b | | 185,380 |
| Volterra Semiconductor | | 94,900 a,b | | 678,535 |
| | | | | 11,700,861 |
| Energy Minerals—2.9% | | | | |
| Alpha Natural Resources | | 14,000 b | | 226,660 |
| Berry Petroleum, Cl. A | | 14,900 | | 112,644 |
| Carrizo Oil & Gas | | 26,500 a,b | | 426,650 |
| Comstock Resources | | 11,300 b | | 533,925 |
| Contango Oil & Gas | | 24,600 b | | 1,384,980 |
| Mariner Energy | | 73,300 b | | 747,660 |
| McMoRan Exploration | | 59,700 a,b | | 585,060 |
| Stone Energy | | 47,701 b | | 525,665 |
| | | | | 4,543,244 |
| Finance—19.2% | | | | |
| Amerisafe | | 38,100 b | | 782,193 |
| AmTrust Financial Services | | 67,000 | | 777,200 |
| Aspen Insurance Holdings | | 69,000 | | 1,673,250 |
| Banco Latinoamericano de Exportaciones, Cl. E | | 19,800 | | 284,328 |
| Bank Mutual | | 17,100 | | 197,334 |
| BankFinancial | | 15,900 | | 162,021 |
| Cash America International | | 8,200 | | 224,270 |
| Columbia Banking System | | 16,200 | | 193,266 |
| Community Bank System | | 22,100 | | 539,019 |
| Compass Diversified Holdings | | 93,900 | | 1,056,375 |
| CorVel | | 16,500 b | | 362,670 |
The Portfolio 11
| STATEMENT OF INVESTMENTS (continued) |
| Common Stocks (continued) | | Shares | | Value ($) |
| |
| |
|
| Finance (continued) | | | | |
| Delphi Financial Group, Cl. A | | 11,200 | | 206,528 |
| Dollar Financial | | 66,900 a,b | | 689,070 |
| EZCORP, Cl. A | | 55,900 b | | 850,239 |
| Financial Federal | | 8,200 a | | 190,814 |
| First BanCorp/Puerto Rico | | 64,500 | | 718,530 |
| First Financial Bancorp | | 66,300 | | 821,457 |
| First Merchants | | 20,400 | | 453,084 |
| FirstMerit | | 83,800 a | | 1,725,442 |
| Hercules Technology Growth Capital | | 51,743 | | 409,805 |
| Interactive Brokers Group, Cl. A | | 60,500 b | | 1,082,345 |
| IPC Holdings | | 9,300 | | 278,070 |
| Knight Capital Group, Cl. A | | 93,500 a,b | | 1,510,025 |
| National Penn Bancshares | | 125,128 a | | 1,815,607 |
| Northwest Bancorp | | 10,500 a | | 224,490 |
| Old National Bancorp | | 62,400 a | | 1,133,184 |
| Old Second Bancorp | | 50,900 a | | 590,440 |
| optionsXpress Holdings | | 54,000 | | 721,440 |
| Oriental Financial Group | | 92,600 | | 560,230 |
| Pacific Capital Bancorp | | 71,000 a | | 1,198,480 |
| Platinum Underwriters Holdings | | 54,500 | | 1,966,360 |
| PMA Capital, Cl. A | | 56,200 b | | 397,896 |
| Prospect Capital | | 23,100 a | | 276,507 |
| RSC Holdings | | 96,700 a,b | | 823,884 |
| Southside Bancshares | | 21,500 a | | 505,250 |
| Susquehanna Bancshares | | 95,400 a | | 1,517,814 |
| SVB Financial Group | | 36,800 a,b | | 965,264 |
| UMB Financial | | 4,500 | | 221,130 |
| Universal American Financial | | 28,400 b | | 250,488 |
| WesBanco | | 17,300 a | | 470,733 |
| World Acceptance | | 12,900 b | | 254,904 |
| WSFS Financial | | 14,200 | | 681,458 |
| | | | | 29,762,894 |
| Health Care Technology—11.5% | | | | |
| Alnylam Pharmaceuticals | | 16,000 a,b | | 395,680 |
| American Medical Systems Holdings | | 18,300 a,b | | 164,517 |
| American Oriental Bioengineering | | 85,700 a,b | | 581,903 |
12
| Common Stocks (continued) | | Shares | | Value ($) |
| |
| |
|
| Health Care Technology (continued) | | | | |
| Analogic | | 25,500 | | 695,640 |
| AngioDynamics | | 38,200 b | | 522,958 |
| BioMarin Pharmaceutical | | 47,400 a,b | | 843,720 |
| Bruker | | 116,200 a,b | | 469,448 |
| CONMED | | 61,900 b | | 1,481,886 |
| Cubist Pharmaceuticals | | 10,000 a,b | | 241,600 |
| Cyberonics | | 45,600 b | | 755,592 |
| Cynosure, Cl. A | | 84,672 b | | 773,055 |
| Facet Biotech | | 10,720 b | | 102,805 |
| Idera Pharmaceuticals | | 21,900 a,b | | 168,192 |
| Invacare | | 24,700 a | | 383,344 |
| Isis Pharmaceuticals | | 48,800 a,b | | 691,984 |
| Kensey Nash | | 31,200 b | | 605,592 |
| Martek Biosciences | | 61,000 a,b | | 1,848,910 |
| Merit Medical Systems | | 17,400 b | | 311,982 |
| Momenta Pharmaceuticals | | 131,400 a,b | | 1,524,240 |
| OSI Pharmaceuticals | | 15,900 a,b | | 620,895 |
| PDL BioPharma | | 53,600 | | 331,248 |
| Regeneron Pharmaceuticals | | 61,100 b | | 1,121,796 |
| Sirona Dental Systems | | 64,600 a,b | | 678,300 |
| Somanetics | | 15,800 b | | 260,858 |
| ViroPharma | | 138,600 a,b | | 1,804,572 |
| Vnus Medical Technologies | | 16,900 b | | 274,118 |
| Zoll Medical | | 8,900 b | | 168,121 |
| | | | | 17,822,956 |
| Industrial Services—3.0% | | | | |
| Dycom Industries | | 31,300 a,b | | 257,286 |
| EMCOR Group | | 46,700 a,b | | 1,047,481 |
| Gulf Island Fabrication | | 26,000 | | 374,660 |
| Lufkin Industries | | 8,100 | | 279,450 |
| Matrix Service | | 21,100 b | | 161,837 |
| Michael Baker | | 39,600 b | | 1,461,636 |
| Perini | | 30,800 b | | 720,104 |
| Petroleum Development | | 8,700 b | | 209,409 |
| Tetra Tech | | 4,400 b | | 106,260 |
| | | | | 4,618,123 |
The Portfolio 13
| STATEMENT OF INVESTMENTS (continued) |
| Common Stocks (continued) | | Shares | | Value ($) |
| |
| |
|
| Non-Energy Minerals—.3% | | | | |
| Worthington Industries | | 47,900 a | | 527,858 |
| Process Industries—5.1% | | | | |
| Andersons | | 6,700 a | | 110,416 |
| AptarGroup | | 22,100 | | 778,804 |
| CF Industries Holdings | | 4,500 | | 221,220 |
| Darling International | | 77,300 b | | 424,377 |
| Glatfelter | | 147,900 | | 1,375,470 |
| Grace (W.R.) & Co. | | 37,200 b | | 222,084 |
| GrafTech International | | 120,700 b | | 1,004,224 |
| H.B. Fuller | | 31,700 | | 510,687 |
| Innophos Holdings | | 58,500 | | 1,158,885 |
| Minerals Technologies | | 15,200 | | 621,680 |
| NewMarket | | 6,000 | | 209,460 |
| Olin | | 39,500 a | | 714,160 |
| Schulman (A.) | | 19,000 a | | 323,000 |
| Terra Industries | | 13,400 | | 223,378 |
| | | | | 7,897,845 |
| Producer Manufacturing—7.4% | | | | |
| A.O. Smith | | 41,300 | | 1,219,176 |
| Aaon | | 28,500 a | | 595,080 |
| Actuant, Cl. A | | 12,800 | | 243,456 |
| Acuity Brands | | 18,200 a | | 635,362 |
| Ampco-Pittsburgh | | 5,800 | | 125,860 |
| Baldor Electric | | 21,300 a | | 380,205 |
| Brady, Cl. A | | 4,400 | | 105,380 |
| Bucyrus International, Cl. A | | 10,700 | | 198,164 |
| Chart Industries | | 60,800 b | | 646,304 |
| CIRCOR International | | 27,100 | | 745,250 |
| Columbus McKinnon | | 20,800 b | | 283,920 |
| DXP Enterprises | | 23,800 b | | 347,718 |
| Energy Conversion Devices | | 23,400 a,b | | 589,914 |
| Gibraltar Industries | | 17,100 a | | 204,174 |
| Insteel Industries | | 68,900 | | 777,881 |
| Kadant | | 15,800 a,b | | 212,984 |
| Knoll | | 68,500 a | | 617,870 |
| L.B. Foster, Cl. A | | 33,000 a,b | | 1,032,240 |
| Mueller Industries | | 10,400 | | 260,832 |
14
| Common Stocks (continued) | | Shares | | Value ($) |
| |
| |
|
| Producer Manufacturing (continued) | | | | |
| NCI Building Systems | | 45,200 b | | 736,760 |
| Regal-Beloit | | 8,400 a | | 319,116 |
| Robbins & Myers | | 18,400 | | 297,528 |
| Tecumseh Products, Cl. A | | 23,700 a,b | | 227,046 |
| Tredegar | | 18,600 | | 338,148 |
| Wabtec | | 7,900 a | | 314,025 |
| | | | | 11,454,393 |
| Retail Trade—4.3% | | | | |
| Aeropostale | | 66,200 a,b | | 1,065,820 |
| America’s Car-Mart | | 30,700 b | | 423,967 |
| Big Lots | | 11,900 a,b | | 172,431 |
| Casey’s General Stores | | 11,200 a | | 255,024 |
| Children’s Place Retail Stores | | 30,700 a,b | | 665,576 |
| Great Atlantic & Pacific Tea | | 42,400 a,b | | 265,848 |
| Jo-Ann Stores | | 54,500 b | | 844,205 |
| JoS. A. Bank Clothiers | | 44,100 a,b | | 1,153,215 |
| Regis | | 16,300 | | 236,839 |
| Shoe Carnival | | 17,400 b | | 166,170 |
| Systemax | | 92,700 a | | 998,379 |
| Winn-Dixie Stores | | 27,000 a,b | | 434,700 |
| | | | | 6,682,174 |
| Technology Services—10.2% | | | | |
| Albany Molecular Research | | 81,800 b | | 796,732 |
| AMERIGROUP | | 45,000 a,b | | 1,328,400 |
| ANSYS | | 7,500 b | | 209,175 |
| Black Box | | 14,800 | | 386,576 |
| CACI International, Cl. A | | 20,900 b | | 942,381 |
| Centene | | 40,100 b | | 790,371 |
| HEALTHSOUTH | | 22,100 b | | 242,216 |
| InfoSpace | | 96,000 a | | 724,800 |
| JDA Software Group | | 95,900 b | | 1,259,167 |
| Kendle International | | 14,200 a,b | | 365,224 |
| Manhattan Associates | | 88,200 a,b | | 1,394,442 |
| Micros Systems | | 16,100 b | | 262,752 |
| Molina Healthcare | | 21,500 a,b | | 378,615 |
| Net 1 UEPS Technologies | | 36,900 b | | 505,530 |
| PAREXEL International | | 23,800 b | | 231,098 |
The Portfolio 15
| STATEMENT OF INVESTMENTS (continued) |
| Common Stocks (continued) | | Shares | | Value ($) |
| |
| |
|
| Technology Services (continued) | | | | |
| PharMerica | | 69,300 b | | 1,085,931 |
| Sohu.com | | 26,300 a,b | | 1,245,042 |
| SPSS | | 54,100 b | | 1,458,536 |
| Tyler Technologies | | 48,000 b | | 575,040 |
| VASCO Data Security International | | 45,300 a,b | | 467,949 |
| Vignette | | 97,100 b | | 913,711 |
| Wind River Systems | | 22,500 b | | 203,175 |
| | | | | 15,766,863 |
| Transportation—2.3% | | | | |
| Celadon Group | | 21,300 b | | 181,689 |
| Genco Shipping and Trading | | 11,500 a | | 170,200 |
| Knightsbridge Tankers | | 76,400 | | 1,119,260 |
| Nordic American Tanker Shipping | | 3,400 a | | 114,750 |
| Pacer International | | 106,900 a | | 1,114,967 |
| Saia | | 15,000 b | | 162,900 |
| Ship Finance International | | 40,500 a | | 447,525 |
| Werner Enterprises | | 17,000 | | 294,780 |
| | | | | 3,606,071 |
| Utilities—4.0% | | | | |
| CH Energy Group | | 13,700 a | | 704,043 |
| Cleco | | 15,000 a | | 342,450 |
| El Paso Electric | | 92,400 b | | 1,671,516 |
| Nicor | | 10,600 | | 368,244 |
| NorthWestern | | 14,200 | | 333,274 |
| Ormat Technologies | | 23,800 a | | 758,506 |
| Piedmont Natural Gas | | 55,200 a | | 1,748,184 |
| PNM Resources | | 20,500 | | 206,640 |
| | | | | 6,132,857 |
| Total Common Stocks | | | | |
| (cost $223,291,587) | | | | 153,966,514 |
| |
| |
|
| |
| Other Investment—.4% | | | | |
| |
| |
|
| Registered Investment Company; | | | | |
| Dreyfus Institutional Preferred | | | | |
| Plus Money Market Fund | | | | |
| (cost $590,000) | | 590,000 c | | 590,000 |
16
| Investment of Cash Collateral | | | | |
| for Securities Loaned—27.6% | | Shares | | Value ($) |
| |
| |
|
| Registered Investment Company; | | | | |
| Dreyfus Institutional Cash | | | | |
| Advantage Fund | | | | |
| (cost $42,728,074) | | 42,728,074 c | | 42,728,074 |
| |
| |
|
| |
| Total Investments (cost $266,609,661) | | 127.4% | | 197,284,588 |
| Liabilities, Less Cash and Receivables | | (27.4%) | | (42,430,917) |
| Net Assets | | 100.0% | | 154,853,671 |
| a All or a portion of these securities are on loan. At December 31, 2008, the total market value of the portfolio’s |
| securities on loan is $41,997,207 and the total market value of the collateral held by the portfolio is $42,728,074. |
| b Non-income producing security. |
| c Investment in affiliated money market mutual fund. |
| Portfolio Summary (Unaudited)† | | | | |
| |
| | | Value (%) | | | | Value (%) |
| |
| |
| |
|
| Money Market Investments | | 28.0 | | Consumer Non-Durables | | 4.2 |
| Finance | | 19.2 | | Utilities | | 4.0 |
| Health Care Technology | | 11.5 | | Consumer Services | | 3.4 |
| Technology Services | | 10.2 | | Consumer Durables | | 3.2 |
| Commercial & | | | | Industrial Services | | 3.0 |
| Professional Services | | 8.1 | | Energy Minerals | | 2.9 |
| Electronic Technology | | 7.6 | | Communications | | 2.7 |
| Producer Manufacturing | | 7.4 | | Transportation | | 2.3 |
| Process Industries | | 5.1 | | Non-Energy Minerals | | .3 |
| Retail Trade | | 4.3 | | | | 127.4 |
| |
| † Based on net assets. | | | | | | |
| See notes to financial statements. | | | | | | |
The Portfolio 17
STATEMENT OF ASSETS AND LIABILITIES
December 31, 2008 |
| | | Cost | | Value |
| |
| |
|
| Assets ($): | | | | |
| Investments in securities—See Statement | | | | |
| of Investments (including securities on loan, | | | | |
| valued at $41,997,207)—Note 1(b): | | | | |
| Unaffiliated issuers | | 223,291,587 | | 153,966,514 |
| Affiliated issuers | | 43,318,074 | | 43,318,074 |
| Cash | | | | 84,985 |
| Receivable for investment securities sold | | | | 201,548 |
| Dividends and interest receivable | | | | 194,344 |
| Receivable for shares of Beneficial Interest subscribed | | | | 3,400 |
| Prepaid expenses | | | | 8,186 |
| | | | | 197,777,051 |
| |
| |
|
| Liabilities ($): | | | | |
| Due to The Dreyfus Corporation and affiliates—Note 3(b) | | | | 38,093 |
| Liability for securities on loan—Note 1(b) | | | | 42,728,074 |
| Payable for shares of Beneficial Interest redeemed | | | | 26,332 |
| Interest payable—Note 2 | | | | 5,930 |
| Accrued expenses | | | | 124,951 |
| | | | | 42,923,380 |
| |
| |
|
| Net Assets ($) | | | | 154,853,671 |
| |
| |
|
| Composition of Net Assets ($): | | | | |
| Paid-in capital | | | | 295,849,722 |
| Accumulated undistributed investment income—net | | | | 2,481,906 |
| Accumulated net realized gain (loss) on investments | | | | (74,152,884) |
| Accumulated net unrealized appreciation | | | | |
| (depreciation) on investments | | | | (69,325,073) |
| |
| |
|
| Net Assets ($) | | | | 154,853,671 |
| |
| |
|
| |
| |
| Net Asset Value Per Share | | | | |
| | | Initial Shares | | Service Shares |
| |
| |
|
| Net Assets ($) | | 144,776,633 | | 10,077,038 |
| Shares Outstanding | | 7,617,217 | | 536,864 |
| |
| |
|
| Net Asset Value Per Share ($) | | 19.01 | | 18.77 |
| See notes to financial statements. | | | | |
18
| STATEMENT OF OPERATIONS | | |
| Year Ended December 31, 2008 | | |
| |
|
| |
| |
| |
| |
| Investment Income ($): | | |
| Income: | | |
| Cash dividends (net of $4,416 foreign taxes withheld at source): | | |
| Unaffiliated issuers | | 3,551,252 |
| Affiliated issuers | | 32,858 |
| Income from securities lending | | 1,120,451 |
| Total Income | | 4,704,561 |
| Expenses: | | |
| Investment advisory fee—Note 3(a) | | 2,069,321 |
| Prospectus and shareholders’ reports | | 97,356 |
| Professional fees | | 42,104 |
| Distribution fees—Note 3(b) | | 37,128 |
| Custodian fees—Note 3(b) | | 32,007 |
| Trustees’ fees and expenses—Note 3(c) | | 20,038 |
| Shareholder servicing costs—Note 3(b) | | 11,289 |
| Loan commitment fees—Note 2 | | 5,389 |
| Interest expense—Note 2 | | 1,268 |
| Miscellaneous | | 13,948 |
| Total Expenses | | 2,329,848 |
| Less—reduction in investment advisory fee due to undertaking—Note 3(a) | | (221,980) |
| Less—reduction in fees due to earnings credits—Note 1(b) | | (126) |
| Net Expenses | | 2,107,742 |
| Investment Income—Net | | 2,596,819 |
| |
|
| Realized and Unrealized Gain (Loss) on Investments—Note 4 ($): | | |
| Net realized gain (loss) on investments | | (71,013,847) |
| Net unrealized appreciation (depreciation) on investments | | (39,691,395) |
| Net Realized and Unrealized Gain (Loss) on Investments | | (110,705,242) |
| Net (Decrease) in Net Assets Resulting from Operations | | (108,108,423) |
| See notes to financial statements. | | |
The Portfolio 19
STATEMENT OF CHANGES IN NET ASSETS
| | | Year Ended December 31, |
| | |
|
| | | 2008 | | 2007 |
| |
| |
|
| Operations ($): | | | | |
| Investment income—net | | 2,596,819 | | 3,707,421 |
| Net realized gain (loss) on investments | | (71,013,847) | | 3,676,310 |
| Net unrealized appreciation | | | | |
| (depreciation) on investments | | (39,691,395) | | (66,170,150) |
| Net Increase (Decrease) in Net Assets | | | | |
| Resulting from Operations | | (108,108,423) | | (58,786,419) |
| |
| |
|
| Dividends to Shareholders from ($): | | | | |
| Investment income—net: | | | | |
| Initial Shares | | (3,233,743) | | (4,284,675) |
| Service Shares | | (84,738) | | (97,644) |
| Net realized gain on investments: | | | | |
| Initial Shares | | (19,376,168) | | (74,911,573) |
| Service Shares | | (821,738) | | (2,697,864) |
| Total Dividends | | (23,516,387) | | (81,991,756) |
| |
| |
|
| Beneficial Interest Transactions ($): | | | | |
| Net proceeds from shares sold: | | | | |
| Initial Shares | | 8,450,835 | | 16,144,677 |
| Service Shares | | 2,234,509 | | 3,462,954 |
| Dividends reinvested: | | | | |
| Initial Shares | | 22,609,911 | | 79,196,248 |
| Service Shares | | 906,476 | | 2,795,508 |
| Cost of shares redeemed: | | | | |
| Initial Shares | | (209,580,698)a | | (145,698,313) |
| Service Shares | | (3,887,841) | | (4,503,858) |
| Increase (Decrease) in Net Assets | | | | |
| from Beneficial Interest Transactions | | (179,266,808) | | (48,602,784) |
| Total Increase (Decrease) in Net Assets | | (310,891,618) | | (189,380,959) |
| |
| |
|
| Net Assets ($): | | | | |
| Beginning of Period | | 465,745,289 | | 655,126,248 |
| End of Period | | 154,853,671 | | 465,745,289 |
| Undistributed investment income—net | | 2,481,906 | | 3,313,210 |
| |
| a Includes redemption-in-kind amounting to $158,049,777. | | | | |
20
| | | Year Ended December 31, |
| | |
|
| | | 2008 | | 2007 |
| |
| |
|
| Capital Share Transactions: | | | | |
| Initial Shares | | | | |
| Shares sold | | 329,367 | | 442,684 |
| Shares issued for dividends reinvested | | 810,973 | | 2,190,161 |
| Shares redeemed | | (7,357,070) | | (3,870,813) |
| Net Increase (Decrease) in Shares Outstanding | | (6,216,730) | | (1,237,968) |
| |
| |
|
| Service Shares | | | | |
| Shares sold | | 85,389 | | 96,977 |
| Shares issued for dividends reinvested | | 32,855 | | 78,131 |
| Shares redeemed | | (154,285) | | (123,606) |
| Net Increase (Decrease) in Shares Outstanding | | (36,041) | | 51,502 |
| |
| See notes to financial statements. | | | | |
The Portfolio 21
FINANCIAL HIGHLIGHTS
The following tables describe the performance for each share class for the fiscal periods indicated. All information (except portfolio turnover rate) reflects financial results for a single portfolio share.Total return shows how much your investment in the portfolio would have increased (or decreased) during each period, assuming you had reinvested all dividends and distributions.These figures have been derived from the portfolio’s financial statements.
| | | | | Year Ended December 31, | | |
| | |
| |
| |
|
| Initial Shares | | 2008 | | 2007 | | 2006 | | 2005 | | 2004 |
| |
| |
| |
| |
| |
|
| Per Share Data ($): | | | | | | | | | | |
| Net asset value, beginning of period | | 32.34 | | 42.03 | | 43.96 | | 41.55 | | 37.39 |
| Investment Operations: | | | | | | | | | | |
| Investment income—neta | | .26 | | .24 | | .31 | | .18 | | .08 |
| Net realized and unrealized | | | | | | | | | | |
| gain (loss) on investments | | (11.87) | | (4.29) | | 1.56 | | 2.23 | | 4.16 |
| Total from Investment Operations | | (11.61) | | (4.05) | | 1.87 | | 2.41 | | 4.24 |
| Distributions: | | | | | | | | | | |
| Dividends from investment income—net | | (.25) | | (.31) | | (.18) | | — | | (.08) |
| Dividends from net realized | | | | | | | | | | |
| gain on investments | | (1.47) | | (5.33) | | (3.62) | | — | | — |
| Total Distributions | | (1.72) | | (5.64) | | (3.80) | | — | | (.08) |
| Net asset value, end of period | | 19.01 | | 32.34 | | 42.03 | | 43.96 | | 41.55 |
| |
| |
| |
| |
| |
|
| Total Return (%) | | (37.59) | | (11.06) | | 3.77 | | 5.80 | | 11.34 |
| |
| |
| |
| |
| |
|
| Ratios/Supplemental Data (%): | | | | | | | | | | |
| Ratio of total expenses | | | | | | | | | | |
| to average net assets | | .83 | | .81 | | .82 | | .81 | | .79 |
| Ratio of net expenses | | | | | | | | | | |
| to average net assets | | .75 | | .81 | | .82b | | .81b | | .79b |
| Ratio of net investment income | | | | | | | | | | |
| to average net assets | | .95 | | .66 | | .75 | | .43 | | .20 |
| Portfolio Turnover Rate | | 77.65 | | 90.75 | | 97.52 | | 67.11 | | 56.06 |
| |
| |
| |
| |
| |
|
| Net Assets, end of period ($ x 1,000) | | 144,777 | | 447,447 | | 633,459 | | 744,621 | | 788,943 |
| a | | Based on average shares outstanding at each month end. |
| b | | Expense waivers and/or reimbursements amounted to less than .01%. |
| See notes to financial statements. |
22
| | | | | Year Ended December 31, | | |
| | |
| |
| |
|
| Service Shares | | 2008 | | 2007 | | 2006 | | 2005 | | 2004 |
| |
| |
| |
| |
| |
|
| Per Share Data ($): | | | | | | | | | | |
| Net asset value, beginning of period | | 31.94 | | 41.56 | | 43.51 | | 41.22 | | 37.12 |
| Investment Operations: | | | | | | | | | | |
| Investment income (loss)—neta | | .20 | | .15 | | .21 | | .07 | | (.02) |
| Net realized and unrealized gain | | | | | | | | | | |
| (loss) on investments | | (11.75) | | (4.25) | | 1.53 | | 2.22 | | 4.12 |
| Total from Investment Operations | | (11.55) | | (4.10) | | 1.74 | | 2.29 | | 4.10 |
| Distributions: | | | | | | | | | | |
| Dividends from investment income—net | | (.15) | | (.19) | | (.07) | | — | | — |
| Dividends from net realized | | | | | | | | | | |
| gain on investments | | (1.47) | | (5.33) | | (3.62) | | — | | — |
| Total Distributions | | (1.62) | | (5.52) | | (3.69) | | — | | — |
| Net asset value, end of period | | 18.77 | | 31.94 | | 41.56 | | 43.51 | | 41.22 |
| |
| |
| |
| |
| |
|
| Total Return (%) | | (37.77) | | (11.28) | | 3.52 | | 5.56 | | 11.05 |
| |
| |
| |
| |
| |
|
| Ratios/Supplemental Data (%): | | | | | | | | | | |
| Ratio of total expenses | | | | | | | | | | |
| to average net assets | | 1.08 | | 1.06 | | 1.08 | | 1.06 | | 1.04 |
| Ratio of net expenses | | | | | | | | | | |
| to average net assets | | .99 | | 1.06 | | 1.08b | | 1.06b | | 1.04b |
| Ratio of net investment income | | | | | | | | | | |
| (loss) to average net assets | | .75 | | .42 | | .51 | | .18 | | (.04) |
| Portfolio Turnover Rate | | 77.65 | | 90.75 | | 97.52 | | 67.11 | | 56.06 |
| |
| |
| |
| |
| |
|
| Net Assets, end of period ($ x 1,000) | | 10,077 | | 18,299 | | 21,667 | | 22,759 | | 22,061 |
| a | | Based on average shares outstanding at each month end. |
| b | | Expense waivers and/or reimbursements amounted to less than .01%. |
| See notes to financial statements. |
The Portfolio 23
NOTES TO FINANCIAL STATEMENTS
NOTE 1—Significant Accounting Policies:
Dreyfus Variable Investment Fund (the “fund”) is registered under the Investment Company Act of 1940, as amended (the “Act”), as an open-end management investment company, operating as a series company currently offering seven series, including the Developing Leaders Portfolio (the “portfolio”). The portfolio is only offered to separate accounts established by insurance companies to fund variable annuity contracts and variable life insurance policies.The portfolio is a diversified series. The portfolio’s investment objective is capital growth. The Dreyfus Corporation (the “Manager” or “Dreyfus”), a wholly-owned subsidiary of The Bank of New York Mellon Corporation (“BNY Mellon”), serves as the portfolio’s investment adviser.
Effective July 1, 2008, BNY Mellon reorganized and consolidated a number of its banking and trust company subsidiaries. As a result of the reorganization, any services previously provided to the portfolio by Mellon Bank, N.A. or Mellon Trust of New England, N.A. are now provided by The Bank of NewYork Mellon (formerly,The Bank of New York).
MBSC Securities Corporation (the “Distributor”), a wholly-owned subsidiary of the Manager, is the distributor of the portfolio’s shares, which are sold without a sales charge. The portfolio is authorized to issue an unlimited number of $.001 par value shares of Beneficial Interest in the following classes of shares: Initial and Service. Each class of shares has identical rights and privileges, except with respect to the distribution plan and the expenses borne by each class, the allocation of certain transfer agency costs and certain voting rights. Income, expenses (other than expenses attributable to a specific class), and realized and unrealized gains or losses on investments are allocated to each class of shares based on its relative net assets.
The fund accounts separately for the assets, liabilities and operations of each series. Expenses directly attributable to each series are charged to that series’ operations; expenses which are applicable to all series are allocated among them on a pro rata basis.
24
The portfolio’s financial statements are prepared in accordance with U.S. generally accepted accounting principles, which may require the use of management estimates and assumptions.Actual results could differ from those estimates.
The fund enters into contracts that contain a variety of indemnifica-tions.The portfolio’s maximum exposure under these arrangements is unknown. The portfolio does not anticipate recognizing any loss related to these arrangements.
(a) Portfolio valuation: Investments in securities are valued at the last sales price on the securities exchange or national securities market on which such securities are primarily traded. Securities listed on the National Market System for which market quotations are available are valued at the official closing price or, if there is no official closing price that day, at the last sales price. Securities not listed on an exchange or the national securities market, or securities for which there were no transactions, are valued at the average of the most recent bid and asked prices, except for open short positions, where the asked price is used for valuation purposes. Bid price is used when no asked price is available. Registered investment companies that are not traded on an exchange are valued at their net asset value.When market quotations or official closing pric es are not readily available, or are determined not to reflect accurately fair value, such as when the value of a security has been significantly affected by events after the close of the exchange or market on which the security is principally traded (for example, a foreign exchange or market), but before the portfolio calculates its net asset value, the portfolio may value these investments at fair value as determined in accordance with the procedures approved by the Board ofTrustees. Fair valuing of securities may be determined with the assistance of a pricing service using calculations based on indices of domestic securities and other appropriate indicators, such as prices of relevant ADRs and futures contracts. For other securities that are fair valued by the Board ofTrustees, certain factors may be considered such
The Portfolio 25
| NOTES TO FINANCIAL STATEMENTS (continued) |
as: fundamental analytical data, the nature and duration of restrictions on disposition, an evaluation of the forces that influence the market in which the securities are purchased and sold, and public trading in similar securities of the issuer or comparable issuers. Financial futures are valued at the last sales price.
The portfolio adopted Statement of Financial Accounting Standards No. 157 “Fair Value Measurements” (“FAS 157”). FAS 157 establishes an authoritative definition of fair value, sets out a framework for measuring fair value, and requires additional disclosures about fair value measurements.
Various inputs are used in determining the value of the portfolio’s investments relating to FAS 157.These inputs are summarized in the three broad levels listed below.
| | Level 1—quoted prices in active markets for identical securities.
Level 2—other significant observable inputs (including quoted
prices for similar securities, interest rates, prepayment speeds, credit
risk, etc.).
Level 3—significant unobservable inputs (including the portfolio’s
own assumptions in determining the fair value of investments). |
The inputs or methodology used for valuing securities are not necessarily an indication of the risk associated with investing in those securities.
The following is a summary of the inputs used as of December 31, 2008 in valuing the portfolio’s investments carried at fair value:
| | | Investments in | | Other Financial |
| Valuation Inputs | | Securities ($) | | Instruments ($)† |
| |
| |
|
| Level 1—Quoted Prices | | 197,284,588 | | 0 |
| Level 2—Other Significant | | | | |
| Observable Inputs | | 0 | | 0 |
| Level 3—Significant | | | | |
| Unobservable Inputs | | 0 | | 0 |
| Total | | 197,284,588 | | 0 |
| † | | Other financial instruments include derivative instruments, such as futures, forward currency |
| | | exchange contracts and swap contracts, which are valued at the unrealized appreciation |
| | | (depreciation) on the instrument and written options contracts which are shown at value. |
26
(b) Securities transactions and investment income: Securities transactions are recorded on a trade date basis. Realized gains and losses from securities transactions are recorded on the identified cost basis. Dividend income is recognized on the ex-dividend date and interest income, including, where applicable, accretion of discount and amortization of premium on investments, is recognized on the accrual basis.
The portfolio has arrangements with the custodian and cash management banks whereby the portfolio may receive earnings credits when positive cash balances are maintained, which are used to offset custody and cash management fees. For financial reporting purposes, the portfolio includes net earnings credits as an expense offset in the Statement of Operations.
Pursuant to a securities lending agreement with The Bank of New York Mellon, a subsidiary of BNY Mellon and an affiliate of Dreyfus, the portfolio may lend securities to qualified institutions. It is the portfolio’s policy that, at origination, all loans are secured by collateral of at least 102% of the value of U.S. securities loaned and 105% of the value of foreign securities loaned. Collateral equivalent to at least 100% of the market value of securities on loan is maintained at all times. Collateral is either in the form of cash, which can be invested in certain money market mutual funds managed by the Manager, U.S. Government and Agency securities or letters of credit.The portfolio is entitled to receive all income on securities loaned, in addition to income earned as a result of the lending transaction. Although each security loaned is fully collateralized, the portfolio bears the risk of delay in recovery of, or loss of rights in , the securities loaned should a borrower fail to return the securities in a timely manner. During the period ended December 31, 2008, The Bank of New York Mellon earned $480,193, from lending portfolio securities, pursuant to the securities lending agreement.
(c) Affiliated issuers: Investments in other investment companies advised by the Manager are defined as “affiliated” in the Act.
The Portfolio 27
| NOTES TO FINANCIAL STATEMENTS (continued) |
(d) Dividends to shareholders: Dividends are recorded on the ex-dividend date. Dividends from investment income-net and dividends from net realized capital gains, if any, are normally declared and paid annually, but the portfolio may make distributions on a more frequent basis to comply with the distribution requirements of the Internal Revenue Code of 1986, as amended (the “Code”).To the extent that net realized capital gains can be offset by capital loss carryovers, it is the policy of the portfolio not to distribute such gains. Income and capital gain distributions are determined in accordance with income tax regulations, which may differ from U.S. generally accepted accounting principles.
(e) Federal income taxes: It is the policy of the portfolio to continue to qualify as a regulated investment company, if such qualification is in the best interests of its shareholders, by complying with the applicable provisions of the Code, and to make distributions of taxable income sufficient to relieve it from substantially all federal income and excise taxes.
As of and during the period ended December 31, 2008, the portfolio did not have any liabilities for any unrecognized tax positions.The portfolio recognizes interest and penalties, if any, related to unrecognized tax positions as income tax expense in the Statement of Operations. During the period, the portfolio did not incur any interest or penalties.
Each of the tax years in the four-year period ended December 31, 2008 remains subject to examination by the Internal Revenue Service and state taxing authorities.
At December 31, 2008, the components of accumulated earnings on a tax basis were as follows: undistributed ordinary income $2,481,906, accumulated capital losses $56,692,296 and unrealized depreciation $69,457,967. In addition, the portfolio had $17,327,694 of capital losses realized after October 31, 2008 which were deferred for tax purposes to the first day of the following fiscal year.
The accumulated capital loss carryover is available for federal income tax purposes to be applied against future net securities profits, if any, realized subsequent to December 31, 2008. If not applied, the carryover expires in fiscal 2016.
28
The tax character of distributions paid to shareholders during the fiscal periods ended December 31, 2008 and December 31, 2007, were as follows: ordinary income $9,843,199 and $4,382,319 and long-term capital gains $13,673,188 and $77,609,437, respectively.
During the period ended December 31, 2008, as a result of permanent book to tax differences, primarily due to the tax treatment for real estate investment trusts, net realized losses from redemptions-in-kind and dividend reclassification, the portfolio decreased accumulated undistributed investment income-net by $109,642, increased accumulated net realized gain (loss) on investments by $12,682,139 and decreased paid-in capital by $12,572,497. Net assets and net asset value per share were not affected by this reclassification.
NOTE 2—Bank Lines of Credit:
Prior to October 15, 2008, the portfolio participated with other Dreyfus-managed funds in a $350 million redemption credit facility. Effective October 15, 2008, the portfolio participates with other Dreyfus managed funds in a $145 million redemption credit facility (the “Facility”) to be utilized for temporary or emergency purposes, including the financing of redemptions. In connection therewith, the portfolio has agreed to pay commitment fees on its pro rata portion of the Facility. Interest is charged to the portfolio based on prevailing market rates in effect at the time of borrowing.
The average daily amount of borrowings outstanding under the Facilities during the period ended December 31, 2008, was approximately $40,400 with a related weighted average annualized interest rate of 3.14% .
NOTE 3—Investment Advisory Fee and Other Transactions With Affiliates:
(a) Pursuant to an Investment Advisory Agreement with the Manager, the investment advisory fee is computed at the annual rate of .75% of the value of the portfolio’s average daily net assets and is payable monthly.
The Portfolio 29
| NOTES TO FINANCIAL STATEMENTS (continued) |
The Manager has undertaken from January 1, 2008 through May 1, 2009 that, if the aggregate expenses, exclusive of shareholder servicing fees and Rule 12b-1 distribution plan fees, but including the investment advisory fee, exceed .75% of the value of the portfolio’s average daily net assets, the portfolio may deduct from the payment to be made to the Manager, or the Manager will bear, such excess expense. The reduction in investment advisory fee, pursuant to the undertaking, amounted to $221,980 during the period ended December 31, 2008.
(b) Under the Distribution Plan (the “Plan”) adopted pursuant to Rule 12b-1 under the Act, Service shares pay the Distributor for distributing their shares, for servicing and/or maintaining Service shares shareholder accounts and for advertising and marketing for Service shares.The Plan provides for payments to be made at an annual rate of .25% of the value of the Service shares’ average daily net assets.The Distributor may make payments to Participating Insurance Companies and to brokers and dealers acting as principal underwriter for their variable insurance products.The fees payable under the Plan are payable without regard to actual expenses incurred. During the period ended December 31, 2008, Service shares were charged $37,128 pursuant to the Plan.
The portfolio compensates Dreyfus Transfer, Inc., a wholly-owned subsidiary of the Manager, under a transfer agency agreement for providing personnel and facilities to perform transfer agency services for the portfolio. During the period ended December 31, 2008, the portfolio was charged $904 pursuant to the transfer agency agreement.
The portfolio compensates The Bank of New York Mellon under a cash management agreement for performing cash management services related to portfolio subscriptions and redemptions. During the period ended December 31, 2008, the portfolio was charged $126 pursuant to the cash management agreement.
30
The portfolio compensates The Bank of New York Mellon under a custody agreement for providing custodial services for the portfolio. During the period ended December 31, 2008, the portfolio was charged $32,007 pursuant to the custody agreement.
During the period ended December 31, 2008, the portfolio was charged $5,403 for services performed by the Chief Compliance Officer.
The components of “Due to The Dreyfus Corporation and affiliates” in the Statement of Assets and Liabilities consist of: investment advisory fees $92,985, Rule 12b-1 distribution plan fees $2,015, custodian fees $9,581, chief compliance officer fees $1,197 and transfer agency per account fees $155, which are offset against an expense reimbursement currently in effect in the amount of $67,840.
(c) Each Board member also serves as a Board member of other funds within the Dreyfus complex. Annual retainer fees and attendance fees are allocated to each fund based on net assets.
NOTE 4—Securities Transactions:
The aggregate amount of purchases and sales of investment securities, excluding short-term securities, during the period ended December 31, 2008, amounted to $215,765,143 and $425,802,336, respectively. Sales of investment securities include securities amounting to $158,049,777 delivered pursuant to a redemption-in-kind. The net realized loss of $12,665,761 on the redemption-in-kind will not be realized for tax purposes.
At December 31, 2008, the cost of investments for federal income tax purposes was $266,742,555; accordingly, accumulated net unrealized depreciation on investments was $69,457,967, consisting of $4,274,630 gross unrealized appreciation and $73,732,597 gross unrealized depreciation.
The Portfolio 31
| NOTES TO FINANCIAL STATEMENTS (continued) |
In March 2008, the Financial Accounting Standards Board released Statement of Financial Accounting Standards No. 161 “Disclosures about Derivative Instruments and Hedging Activities” (“FAS 161”). FAS 161 requires qualitative disclosures about objectives and strategies for using derivatives, quantitative disclosures about fair value amounts of gains and losses on derivative instruments and disclosures about credit-risk-related contingent features in derivative agreements. The application of FAS 161 is required for fiscal years and interim periods beginning after November 15, 2008.At this time, management is evaluating the implications of FAS 161 and its impact on the financial statements and the accompanying notes has not yet been determined.
32
REPORT OF INDEPENDENT REGISTERED
PUBLIC ACCOUNTING FIRM |
Shareholders and Board of Trustees
Dreyfus Variable Investment Fund, Developing Leaders Portfolio
We have audited the accompanying statement of assets and liabilities, including the statement of investments, of Dreyfus Variable Investment Fund, Developing Leaders Portfolio (one of the series comprising Dreyfus Variable Investment Fund) as of December 31, 2008, and the related statement of operations for the year then ended, the statement of changes in net assets for each of the two years in the period then ended, and financial highlights for each of the years indicated therein. These financial statements and financial highlights are the responsibility of the Fund’s management. Our responsibility is to express an opinion on these financial statements and financial highlights based on our audits.
We conducted our audits in accordance with the standards of the Public Company Accounting Oversight Board (United States).Those standards require that we plan and perform the audit to obtain reasonable assurance about whether the financial statements and financial highlights are free of material misstatement.We were not engaged to perform an audit of the Fund’s internal control over financial reporting. Our audits included consideration of internal control over financial reporting as a basis for designing audit procedures that are appropriate in the circumstances, but not for the purpose of expressing an opinion on the effectiveness of the Fund’s internal control over financial reporting. Accordingly, we express no such opinion.An audit also includes examining, on a test basis, evidence supporting the amounts and disclosures in the financial statements and financial highlights, assessing the accounting principles used and significa nt estimates made by management, and evaluating the overall financial statement presentation. Our procedures included confirmation of securities owned as of December 31, 2008 by correspondence with the custodian and others. We believe that our audits provide a reasonable basis for our opinion.
In our opinion, the financial statements and financial highlights referred to above present fairly, in all material respects, the financial position of Dreyfus Variable Investment Fund, Developing Leaders Portfolio at December 31, 2008, the results of its operations for the year then ended, the changes in its net assets for each of the two years in the period then ended, and the financial highlights for each of the indicated years, in conformity with U.S. generally accepted accounting principles.

New York, New York
February 10, 2009 |
The Portfolio 33
IMPORTANT TAX INFORMATION (Unaudited)
For federal tax purposes, the portfolio hereby designates $1.0000 per share as a long-term capital gain distribution and $.4740 per share as a short-term capital gain distribution paid on March 27, 2008 and also the portfolio hereby designates 72.77% of the ordinary dividends paid during the fiscal year ended December 31, 2008 as qualifying for the corporate dividends received deduction. Shareholders will receive notification in January 2009 of the percentage applicable to the preparation of their 2008 income tax returns.
34
BOARD MEMBERS INFORMATION (Unaudited)

The Portfolio 35
BOARD MEMBERS INFORMATION (Unaudited) (continued)

36

The Portfolio 37
OFFICERS OF THE FUND (Unaudited)

38

The Portfolio 39
NOTES
For More Information

Telephone 1-800-554-4611 or 516-338-3300
Mail The Dreyfus Family of Funds, 144 Glenn Curtiss Boulevard, Uniondale, NY 11556-0144 Attn: Investments Division
The portfolio files its complete schedule of portfolio holdings with the Securities and Exchange Commission (“SEC”) for the first and third quarters of each fiscal year on Form N-Q. The portfolio’s Forms N-Q are available on the SEC’s website at http://www.sec.gov and may be reviewed and copied at the SEC’s Public Reference Room in Washington, DC. Information on the operation of the Public Reference Room may be obtained by calling 1-800-SEC-0330.
A description of the policies and procedures that the portfolio uses to determine how to vote proxies relating to portfolio securities, and information regarding how the portfolio voted these proxies for the 12-month period ended June 30, 2008, is available at http://www.dreyfus.com and on the SEC’s website at http://www.sec.gov. The description of the policies and procedures is also available without charge, upon request, by calling 1-800-645-6561.

| © 2009 MBSC Securities Corporation |
| | Dreyfus Variable
Investment Fund,
Growth and Income
Portfolio |
| | ANNUAL REPORT December 31, 2008 |

The views expressed in this report reflect those of the portfolio manager only through the end of the period covered and do not necessarily represent the views of Dreyfus or any other person in the Dreyfus organization.Any such views are subject to change at any time based upon market or other conditions and Dreyfus disclaims any responsibility to update such views. These views may not be relied on as investment advice and, because investment decisions for a Dreyfus portfolio are based on numerous factors, may not be relied on as an indication of trading intent on behalf of any Dreyfus portfolio.

| | Contents |
| |
| | THE PORTFOLIO |
| |
| 2 | A Letter from the CEO |
| |
| 3 | Discussion of Performance |
| |
| 6 | Portfolio Performance |
| |
| 8 | Understanding Your Portfolio’s Expenses |
| |
| 8 | Comparing Your Portfolio’s Expenses With Those of Other Funds |
| |
| 9 | Statement of Investments |
| |
| 14 | Statement of Assets and Liabilities |
| |
| 15 | Statement of Operations |
| |
| 16 | Statement of Changes in Net Assets |
| |
| 18 | Financial Highlights |
| |
| 20 | Notes to Financial Statements |
| |
| 28 | Report of Independent Registered Public Accounting Firm |
| |
| 29 | Important Tax Information |
| |
| 30 | Board Members Information |
| |
| 33 | Officers of the Fund |
| |
| | FOR MORE INFORMATION |
| |
| | Back Cover |
| |
Dreyfus Variable Investment Fund,
Growth and Income Portfolio |
The Portfolio

Dear Shareholder:
We present to you this annual report for Dreyfus Variable Investment Fund, Growth and Income Portfolio, covering the 12-month period from January 1, 2008, through December 31, 2008.
2008 was the most difficult year in decades for the economy and stock market. A credit crunch that originated in 2007 in the U.S. sub-prime mortgage market exploded in mid-2008 into a global financial crisis, resulting in the failures of major financial institutions, a deep and prolonged recession and lower investment values across a broad range of asset classes. Governments and regulators throughout the world moved aggressively to curtail the damage, implementing unprecedented reductions of short-term interest rates, massive injections of liquidity into the banking system, government bailouts of struggling companies and plans for massive economic stimulus programs.
Although we expect the U.S. and global economies to remain weak until longstanding imbalances have worked their way out of the system, the financial markets currently appear to have priced in investors’ generally low expectations. In previous recessions, however, the markets have tended to anticipate economic improvement before it occurs, potentially leading to major rallies when few expected them.That’s why it makes sense to remain disciplined, maintain a long-term perspective and adopt a consistent asset allocation strategy that reflects one’s future goals and attitudes toward risk.As always, we urge you to consult with your financial advisor, who can recommend the course of action that is right for you.
For information about how the portfolio performed during the reporting period, as well as market perspectives, we have provided a Discussion of Performance.
Thank you for your continued confidence and support.

2

DISCUSSION OF PERFORMANCE
For the period of January 1, 2008, through December 31, 2008
Portfolio and Market Performance Overview
For the 12-month period ended December 31, 2008, Dreyfus Variable Investment Fund, Growth and Income Portfolio’s Initial shares achieved a –40.41% total return, and its Service shares achieved a total return of –40.53% .1 The portfolio’s benchmark, the Standard & Poor’s Composite 500 Index, returned –36.99% for the same period.2
Economic deterioration due to faltering credit markets,rising unemployment and declining home prices led to sharp declines among large-cap stocks during 2008. The portfolio underperformed its benchmark, mainly due to disappointing security selections in the information technology, energy and health care sectors.
On a separate note, effective January 6, 2009, Elizabeth Slover and John Bailer are the portfolio’s managers.
The Portfolio’s Investment Approach
To pursue the portfolio’s goal of seeking long-term capital growth, current income and growth of income consistent with reasonable investment risk, the portfolio invests primarily in stocks of domestic and foreign issuers. We employ a “growth style” of investing, seeking compa¬nies whose fundamental strengths suggest the potential to provide earnings growth over time, as well as focusing on dividend-paying stocks and other investments and investment techniques that provide income. We follow a consistent “bottom-up” approach that emphasizes individual stock selection. Income is generated primarily from dividend-paying stocks in which the portfolio may invest.
Economic Slump Led to Substantial Market Declines
After producing relatively modest declines over the first half of 2008, stocks tumbled during the second half, producing losses for the S&P 500 Index that have not been seen during a single calendar year since the early 1930s.The bear market was triggered by an intensification of a credit crisis that began in 2007 and mushroomed in September 2008 with the failures of several major financial institutions.These developments exacerbated an ongoing economic slowdown, as lenders grew reluctant to extend credit even to some of their most trusted customers,
The Portfolio 3
| DISCUSSION OF PERFORMANCE (continued) |
causing consumer spending and business investment to decline sharply and commodity prices to retreat from previous record levels. In late November, the National Bureau of Economic Research confirmed that the U.S. economy was mired in its first recession since 2001.
Security Selections Produced Sub-Par Results
In this challenging environment, our stock selection strategy generally detracted from the portfolio’s relative performance, especially in the information technology sector. Steep declines by industry giants Microsoft,Apple, Google and Cisco Systems were mirrored by MEMC Electronic Materials, and Electronic Arts, all of which encountered softer demand from consumers and businesses. In addition, silicon wafer producer MEMC suffered ongoing operating problems and concerns surrounding customers’ ability to finance future projects, while video game maker Electronic Arts was hurt by restructuring efforts, new product delays and currency devaluation. Apple was also adversely affected by rumors regarding the health of its CEO.
An increase in the portfolio’s allocation to energy stocks proved to be poorly timed,taking a toll on performance when historically high energy prices reversed course mid-year. Integrated oil producers Exxon Mobil and Chevron, exploration-and-production firm Ultra Petroleum and energy services company Schlumberger declined along with crude oil prices, and natural gas producer Chesapeake Energy’s stock price plummeted when natural gas prices halved as production outpaced demand. Chesapeake Energy was sold during the reporting period. Despite a strong contribution to relative performance from biotechnology company Gilead Sciences,the portfolio’s health care holdings generally lagged market averages, primarily due to poor results from specialty health care company Allergan and contract-research organization Pharmaceutical Product Development (PPD). PPD’s stock slid amid concerns regarding future orders and current backlogs in clinical trials.
On the other hand, substantially underweighted exposure to troubled financial stocks aided the portfolio’s results compared to the benchmark. Reduced exposure to the hard-hit machinery segment of the industrials sector produced favorable results, and an investment in Waste Management benefited from industry consolidation and a recent restructuring. Our focus on some of the better-performing consumer discretionary stocks bolstered the portfolio’s relative performance, as Wal-Mart Stores and Family Dollar Stores advanced when cost-con-
4
scious consumers turned to less expensive goods. Our position in Family Dollar Stores was sold during the reporting period. Positions in for-profit education companies Apollo Group and DeVry also supported the portfolio’s returns, as concerns regarding the availability of student loans weighed on the market price of these securities and provided the portfolio with attractive buying opportunities. Fortunate timing in the purchase of AT&T and the sale of Potash Corporation of Saskatchewan also helped boost the portfolio’s relative performance.
Maintaining a Focus on Quality
At the end of the reporting period, rising unemployment, declining industrial production and slumping housing markets continued to weigh on the U.S. economy. However, lower energy prices, expectations of a meaningful economic stimulus package from the federal government and news that large lenders might begin working with homeowners to prevent further foreclosures may soon provide a foundation for rebuilding consumer confidence and reinvigorating economic growth.
As 2009 begins, the portfolio’s new management team has continued to focus on companies whose fundamentals remain strong despite reduced growth expectations.We intend to continue our emphasis on higher-quality stocks that, in our judgment, are attractively priced, positioned to weather the current storm and poised to participate in an eventual market rebound.
January 15, 2009
The portfolio is only available as a funding vehicle under variable life insurance policies or variable annuity contracts issued by insurance companies. Individuals may not purchase shares of the portfolio directly. A variable annuity is an insurance contract issued by an insurance company that enables investors to accumulate assets on a tax-deferred basis for retirement or other long-term goals.The investment objective and policies of Dreyfus Variable Investment Fund, Growth and Income Portfolio made available through insurance products may be similar to other funds/portfolios managed or advised by Dreyfus. However, the investment results of the portfolio may be higher or lower than, and may not be comparable to, those of any other Dreyfus fund/portfolio.
| 1 | | Total return includes reinvestment of dividends and any capital gains paid. Past performance is no |
| | | guarantee of future results. Share price and investment return fluctuate such that upon redemption, |
| | | portfolio shares may be worth more or less than their original cost.The portfolio’s performance does |
| | | not reflect the deduction of additional charges and expenses imposed in connection with investing |
| | | in variable insurance contracts, which will reduce returns. |
| 2 | | SOURCE: LIPPER INC. — Reflects reinvestment of net dividends and, where applicable, |
| | | capital gain distributions.The Standard & Poor’s 500 Composite Stock Price Index is a widely |
| | | accepted, unmanaged index of U.S. stock market performance. |
The Portfolio 5
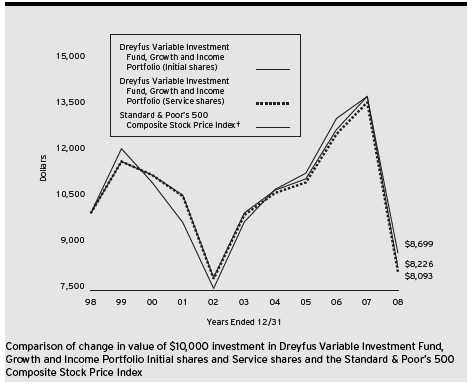
| Average Annual Total Returns as of 12/31/08 | | | | |
| | | 1 Year | | 5 Years | | 10 Years |
| |
| |
| |
|
| Initial shares | | (40.41)% | | (3.85)% | | (1.93)% |
| Service shares | | (40.53)% | | (4.03)% | | (2.09)% |
The data for Service shares includes the results of Initial shares for the period prior to December 31, 2000 (inception date of Service shares). Actual Service shares’ average annual total return and hypothetical growth results would have been lower. See notes below.
† Source: Lipper Inc.
Past performance is not predictive of future performance.The portfolio’s performance shown in the graph and table does not reflect the deduction of taxes that a shareholder would pay on portfolio distributions or the redemption of portfolio shares.
The portfolio’s performance does not reflect the deduction of additional charges and expenses imposed in connection with investing in variable insurance contracts which will reduce returns.
The above graph compares a $10,000 investment made in Initial and Service shares of Dreyfus Variable Investment Fund, Growth and Income Portfolio on 12/31/98 to a $10,000 investment made in the Standard & Poor’s 500 Composite Stock Price Index (the “Index”) on that date.
6
The portfolio’s Initial shares are not subject to a Rule 12b-1 fee.The portfolio’s Service shares are subject to a 0.25% annual Rule 12b-1 fee.The performance figures for Service shares reflect the performance of the portfolio’s Initial shares from their inception date through December 30, 2000, and the performance of the portfolio’s Service shares from December 31, 2000 (inception date of Service shares) to December 31, 2008 (blended performance figures).The performance figures for each share class reflect certain expense reimbursements, without which the performance of each share class would have been lower. In addition, the blended performance figures have not been adjusted to reflect the higher operating expenses of the Service shares. If these expenses had been reflected, the blended performance figures would have been lower. All dividends and capital gain distributions are reinvested.
The portfolio’s performance shown in the line graph takes into account all applicable portfolio fees and expenses (after any expense reimbursements).The Index is a widely accepted, unmanaged index of U.S. stock market performance. Unlike a mutual fund, the Index is not subject to charges, fees and other expenses. Investors cannot invest directly in any index. Further information relating to portfolio performance, including expense reimbursements, if applicable, is contained in the Financial Highlights section of the prospectus and elsewhere in this report.
The Portfolio 7
UNDERSTANDING YOUR
PORTFOLIO’S EXPENSES (Unaudited) |
As a mutual fund investor, you pay ongoing expenses, such as management fees and other expenses. Using the information below, you can estimate how these expenses affect your investment and compare them with the expenses of other funds.You also may pay one-time transaction expenses, including sales charges (loads) and redemption fees,which are not shown in this section and would have resulted in higher total expenses. For more information, see your portfolio’s prospectus or talk to your financial adviser.
Review your portfolio’s expenses
The table below shows the expenses you would have paid on a $1,000 investment in Dreyfus Variable Investment Fund, Growth and Income Portfolio from July 1, 2008 to December 31, 2008. It also shows how much a $1,000 investment would be worth at the close of the period, assuming actual returns and expenses.
| | Expenses and Value of a $1,000 Investment
assuming actual returns for the six months ended December 31, 2008 |
| | | Initial Shares | | Service Shares |
| |
| |
|
| Expenses paid per $1,000† | | $ 3.74 | | $ 4.78 |
| Ending value (after expenses) | | $670.40 | | $669.60 |
| | COMPARING YOUR PORTFOLIO’S EXPENSES
WITH THOSE OF OTHER FUNDS (Unaudited) |
Using the SEC’s method to compare expenses
The Securities and Exchange Commission (SEC) has established guidelines to help investors assess fund expenses. Per these guidelines, the table below shows your portfolio’s expenses based on a $1,000 investment, assuming a hypothetical 5% annualized return. You can use this information to compare the ongoing expenses (but not transaction expenses or total cost) of investing in the portfolio with those of other funds. All mutual fund shareholder reports will provide this information to help you make this comparison. Please note that you cannot use this information to estimate your actual ending account balance and expenses paid during the period.
| | Expenses and Value of a $1,000 Investment
assuming a hypothetical 5% annualized return for the six months ended December 31, 2008 |
| | | Initial Shares | | Service Shares |
| |
| |
|
| Expenses paid per $1,000† | | $ 4.52 | | $ 5.79 |
| Ending value (after expenses) | | $1,020.66 | | $1,019.41 |
| † Expenses are equal to the portfolio’s annualized expense ratio of .89% for Initial shares and 1.14% for Service shares, |
| multiplied by the average account value over the period, multiplied by 184/366 (to reflect the one-half year period). |
8
STATEMENT OF INVESTMENTS
December 31, 2008 |
| Common Stocks—98.3% | | Shares | | Value ($) |
| |
| |
|
| Consumer Discretionary—11.4% | | | | |
| Amazon.com | | 7,446 a | | 381,831 |
| Apollo Group, Cl. A | | 13,350 a,b | | 1,022,877 |
| Bed Bath & Beyond | | 9,536 a | | 242,405 |
| Best Buy | | 18,336 | | 515,425 |
| Carnival | | 27,392 | | 666,173 |
| DeVry | | 5,105 | | 293,078 |
| GameStop, Cl. A | | 12,205 a | | 264,360 |
| Gap | | 41,549 | | 556,341 |
| Home Depot | | 98,798 | | 2,274,330 |
| Johnson Controls | | 14,780 | | 268,405 |
| McDonald’s | | 3,580 | | 222,640 |
| News, Cl. A | | 119,010 | | 1,081,801 |
| Nordstrom | | 8,979 b | | 119,510 |
| Omnicom Group | | 14,310 | | 385,225 |
| Tiffany & Co. | | 9,113 | | 215,340 |
| Time Warner | | 65,760 | | 661,546 |
| Walt Disney | | 18,686 | | 423,985 |
| | | | | 9,595,272 |
| Consumer Staples—13.3% | | | | |
| Avon Products | | 26,681 | | 641,144 |
| Cadbury, ADR | | 9,520 | | 339,578 |
| Colgate-Palmolive | | 6,107 | | 418,574 |
| CVS Caremark | | 35,499 | | 1,020,241 |
| Dean Foods | | 20,964 a,b | | 376,723 |
| Estee Lauder, Cl. A | | 8,973 | | 277,804 |
| Kimberly-Clark | | 3,360 | | 177,206 |
| Kraft Foods, Cl. A | | 65,300 | | 1,753,305 |
| PepsiCo | | 22,170 | | 1,214,251 |
| Philip Morris International | | 35,435 | | 1,541,777 |
| Procter & Gamble | | 10,451 | | 646,081 |
| Safeway | | 25,685 | | 610,532 |
| Wal-Mart Stores | | 38,898 | | 2,180,622 |
| | | | | 11,197,838 |
The Portfolio 9
| STATEMENT OF INVESTMENTS (continued) |
| Common Stocks (continued) | | Shares | | Value ($) |
| |
| |
|
| Energy—11.9% | | | | |
| Apache | | 4,306 | | 320,926 |
| Chevron | | 34,518 | | 2,553,296 |
| Devon Energy | | 4,260 | | 279,925 |
| Exxon Mobil | | 36,026 | | 2,875,956 |
| Hess | | 2,944 | | 157,916 |
| Marathon Oil | | 8,100 | | 221,616 |
| Occidental Petroleum | | 27,010 | | 1,620,330 |
| Schlumberger | | 11,441 | | 484,297 |
| Ultra Petroleum | | 13,629 a | | 470,337 |
| XTO Energy | | 28,870 | | 1,018,245 |
| | | | | 10,002,844 |
| Exchange Traded Funds—.2% | | | | |
| Standard & Poor’s Depository Receipts (Tr. Ser. 1) | | 2,095 b | | 189,053 |
| Financial—13.8% | | | | |
| Aflac | | 4,520 | | 207,197 |
| Ameriprise Financial | | 8,130 | | 189,917 |
| Assurant | | 9,117 | | 273,510 |
| Bank of America | | 62,620 | | 881,690 |
| Charles Schwab | | 42,604 | | 688,907 |
| Chubb | | 13,450 | | 685,950 |
| Fidelity National Financial, Cl. A | | 34,620 | | 614,505 |
| Franklin Resources | | 13,610 | | 868,046 |
| Goldman Sachs Group | | 2,630 | | 221,946 |
| JPMorgan Chase & Co. | | 66,963 | | 2,111,343 |
| Marsh & McLennan Cos. | | 12,470 | | 302,647 |
| MetLife | | 18,850 | | 657,111 |
| Northern Trust | | 5,600 | | 291,984 |
| PNC Financial Services Group | | 12,950 | | 634,550 |
| Prudential Financial | | 3,950 | | 119,527 |
| Travelers Cos. | | 11,800 | | 533,360 |
| U.S. Bancorp | | 11,020 | | 275,610 |
| Unum Group | | 34,200 | | 636,120 |
| Wells Fargo & Co. | | 46,621 | | 1,374,387 |
| | | | | 11,568,307 |
| Health Care—12.8% | | | | |
| Abbott Laboratories | | 32,015 | | 1,708,641 |
| Allergan | | 14,808 | | 597,059 |
10
| Common Stocks (continued) | | Shares | | Value ($) |
| |
| |
|
| Health Care (continued) | | | | |
| AmerisourceBergen | | 6,420 | | 228,937 |
| Baxter International | | 4,030 | | 215,968 |
| BioMarin Pharmaceutical | | 34,296 a,b | | 610,469 |
| Covidien | | 16,148 | | 585,203 |
| Genentech | | 4,874 a | | 404,103 |
| Gilead Sciences | | 15,810 a | | 808,523 |
| Johnson & Johnson | | 9,957 | | 595,727 |
| Life Technologies | | 20,873 a | | 486,550 |
| Merck & Co. | | 21,850 | | 664,240 |
| Pfizer | | 122,049 | | 2,161,488 |
| Pharmaceutical Product Development | | 15,578 | | 451,918 |
| Shire, ADR | | 7,715 | | 345,478 |
| Wyeth | | 22,194 | | 832,497 |
| | | | | 10,696,801 |
| Industrial—8.1% | | | | |
| Delta Air Lines | | 14,767 a | | 169,230 |
| Dover | | 11,840 | | 389,773 |
| Eaton | | 8,060 | | 400,663 |
| Energy Conversion Devices | | 5,028 a,b | | 126,756 |
| FedEx | | 5,906 | | 378,870 |
| General Electric | | 74,980 | | 1,214,676 |
| Honeywell International | | 7,700 | | 252,791 |
| Lockheed Martin | | 3,830 | | 322,026 |
| Norfolk Southern | | 4,180 | | 196,669 |
| Union Pacific | | 14,267 | | 681,963 |
| Waste Management | | 80,608 b | | 2,671,349 |
| | | | | 6,804,766 |
| Information Technology—18.2% | | | | |
| Accenture, Cl. A | | 5,640 | | 184,936 |
| Activision Blizzard | | 21,813 a | | 188,464 |
| Adobe Systems | | 23,888 a | | 508,575 |
| Akamai Technologies | | 32,945 a | | 497,140 |
| Altera | | 38,953 | | 650,905 |
| Apple | | 8,294 a | | 707,893 |
| Autodesk | | 7,475 a | | 146,884 |
| Automatic Data Processing | | 5,680 | | 223,451 |
| Broadcom, Cl. A | | 22,331 a | | 378,957 |
The Portfolio 11
| STATEMENT OF INVESTMENTS (continued) |
| Common Stocks (continued) | | Shares | | Value ($) |
| |
| |
|
| Information Technology (continued) | | | | |
| Cisco Systems | | 110,681 a | | 1,804,100 |
| Electronic Arts | | 21,658 a | | 347,394 |
| EMC | | 60,705 a | | 635,581 |
| Google, Cl. A | | 2,323 a | | 714,671 |
| Hewlett-Packard | | 31,567 | | 1,145,566 |
| Intel | | 74,606 | | 1,093,724 |
| Juniper Networks | | 13,260 a | | 232,183 |
| KLA-Tencor | | 11,629 | | 253,396 |
| MEMC Electronic Materials | | 16,077 a | | 229,580 |
| Microsoft | | 126,245 | | 2,454,203 |
| Nokia, ADR | | 36,040 | | 562,224 |
| Oracle | | 35,866 a | | 635,904 |
| QUALCOMM | | 29,015 | | 1,039,607 |
| Visa, Cl. A | | 11,739 | | 615,711 |
| | | | | 15,251,049 |
| Materials—2.5% | | | | |
| Air Products & Chemicals | | 3,980 | | 200,075 |
| Dow Chemical | | 9,690 | | 146,222 |
| Freeport-McMoRan Copper & Gold | | 6,867 | | 167,829 |
| Monsanto | | 9,409 | | 661,923 |
| Packaging Corp. of America | | 30,610 | | 412,011 |
| Praxair | | 8,549 | | 507,469 |
| | | | | 2,095,529 |
| Telecommunication Services—2.5% | | | | |
| AT & T | | 57,064 | | 1,626,324 |
| Verizon Communications | | 2,950 | | 100,005 |
| Windstream | | 38,070 | | 350,244 |
| | | | | 2,076,573 |
| Utilities—3.6% | | | | |
| Entergy | | 12,190 | | 1,013,355 |
| Exelon | | 16,500 | | 917,565 |
| FPL Group | | 4,150 | | 208,870 |
| NRG Energy | | 12,280 a,b | | 286,492 |
12
| Common Stocks (continued) | | Shares | | Value ($) |
| |
| |
|
| Utilities (continued) | | | | |
| Questar | | 11,930 | | 389,992 |
| Southern | | 5,860 | | 216,820 |
| | | | | 3,033,094 |
| Total Common Stocks | | | | |
| (cost $93,194,426) | | | | 82,511,126 |
| |
| |
|
| |
| Other Investment—2.0% | | | | |
| |
| |
|
| Registered Investment Company; | | | | |
| Dreyfus Institutional Preferred | | | | |
| Plus Money Market Fund | | | | |
| (cost $1,664,000) | | 1,664,000 c | | 1,664,000 |
| |
| |
|
| |
| Investment of Cash Collateral | | | | |
| for Securities Loaned—5.7% | | | | |
| |
| |
|
| Registered Investment Company; | | | | |
| Dreyfus Institutional Cash Advantage Fund | | | | |
| (cost $4,809,058) | | 4,809,058 c | | 4,809,058 |
| |
| |
|
| Total Investments (cost $99,667,484) | | 106.0% | | 88,984,184 |
| Liabilities, Less Cash and Receivables | | (6.0%) | | (5,074,614) |
| Net Assets | | 100.0% | | 83,909,570 |
| ADR—American Depository Receipts |
| a Non-income producing security. |
| b All or a portion of these securities are on loan. At December 31, 2008, the total market value of the portfolio’s |
| securities on loan is $4,736,674 and the total market value of the collateral held by the portfolio is $4,809,058. |
| c Investment in affiliated money market mutual fund. |
| Portfolio Summary (Unaudited)† | | | | |
| |
| | | Value (%) | | | | Value (%) |
| |
| |
| |
|
| Information Technology | | 18.2 | | Money Market Investments | | 7.7 |
| Financial | | 13.8 | | Utilities | | 3.6 |
| Consumer Staples | | 13.3 | | Materials | | 2.5 |
| Health Care | | 12.8 | | Telecommunication Services | | 2.5 |
| Energy | | 11.9 | | Exchange Traded Funds | | .2 |
| Consumer Discretionary | | 11.4 | | | | |
| Industrial | | 8.1 | | | | 106.0 |
| |
| † Based on net assets. | | | | | | |
| See notes to financial statements. | | | | | | |
The Portfolio 13
STATEMENT OF ASSETS AND LIABILITIES
December 31, 2008 |
| | | Cost | | Value |
| |
| |
|
| Assets ($): | | | | |
| Investments in securities—See Statement | | | | |
| of Investments (including securities on loan, | | | | |
| valued at $4,736,674)—Note 1(b): | | | | |
| Unaffiliated issuers | | 93,194,426 | | 82,511,126 |
| Affiliated issuers | | 6,473,058 | | 6,473,058 |
| Cash | | | | 26,850 |
| Receivable for investment securities sold | | | | 264,058 |
| Dividends and interest receivable | | | | 176,322 |
| Receivable for shares of Beneficial Interest subscribed | | | | 8,857 |
| Prepaid expenses | | | | 9,151 |
| | | | | 89,469,422 |
| |
| |
|
| Liabilities ($): | | | | |
| Due to The Dreyfus Corporation and affiliates—Note 3(b) | | | | 60,258 |
| Liability for securities on loan—Note 1(b) | | | | 4,809,058 |
| Payable for investment securities purchased | | | | 597,834 |
| Payable for shares of Beneficial Interest redeemed | | | | 34,645 |
| Interest payable—Note 2 | | | | 422 |
| Accrued expenses | | | | 57,635 |
| | | | | 5,559,852 |
| |
| |
|
| Net Assets ($) | | | | 83,909,570 |
| |
| |
|
| Composition of Net Assets ($): | | | | |
| Paid-in capital | | | | 129,139,616 |
| Accumulated undistributed investment income—net | | | | 53,518 |
| Accumulated net realized gain (loss) on investments | | | | (34,600,264) |
| Accumulated net unrealized appreciation | | | | |
| (depreciation) on investments | | | | (10,683,300) |
| |
| |
|
| Net Assets ($) | | | | 83,909,570 |
| |
| |
|
| |
| |
| Net Asset Value Per Share | | | | |
| | | Initial Shares | | Service Shares |
| |
| |
|
| Net Assets ($) | | 73,919,449 | | 9,990,121 |
| Shares Outstanding | | 5,570,992 | | 752,469 |
| |
| |
|
| Net Asset Value Per Share ($) | | 13.27 | | 13.28 |
| |
| See notes to financial statements. | | | | |
14
| STATEMENT OF OPERATIONS | | |
| Year Ended December 31, 2008 | | |
| |
|
| |
| |
| |
| |
| Investment Income ($): | | |
| Income: | | |
| Cash dividends (net of $984 foreign taxes withheld at source): | | |
| Unaffiliated issuers | | 1,833,677 |
| Affiliated issuers | | 36,323 |
| Income from securities lending | | 55,769 |
| Total Income | | 1,925,769 |
| Expenses: | | |
| Investment advisory fee—Note 3(a) | | 959,249 |
| Professional fees | | 49,766 |
| Distribution fees—Note 3(b) | | 39,232 |
| Prospectus and shareholders’ reports | | 29,335 |
| Custodian fees—Note 3(b) | | 17,013 |
| Trustees’ fees and expenses—Note 3(c) | | 9,995 |
| Shareholder servicing costs—Note 3(b) | | 5,330 |
| Loan commitment fees—Note 2 | | 1,715 |
| Interest expense—Note 2 | | 488 |
| Miscellaneous | | 15,911 |
| Total Expenses | | 1,128,034 |
| Less—reduction in fees due to earnings credits—Note 1(b) | | (58) |
| Net Expenses | | 1,127,976 |
| Investment Income—Net | | 797,793 |
| |
|
| Realized and Unrealized Gain (Loss) on Investments—Note 4 ($): | | |
| Net realized gain (loss) on investments | | (34,499,965) |
| Net unrealized appreciation (depreciation) on investments | | (28,336,676) |
| Net Realized and Unrealized Gain (Loss) on Investments | | (62,836,641) |
| Net (Decrease) in Net Assets Resulting from Operations | | (62,038,848) |
| |
| See notes to financial statements. | | |
The Portfolio 15
STATEMENT OF CHANGES IN NET ASSETS
| | | Year Ended December 31, |
| | |
|
| | | 2008 | | 2007 |
| |
| |
|
| Operations ($): | | | | |
| Investment income—net | | 797,793 | | 1,329,860 |
| Net realized gain (loss) on investments | | (34,499,965) | | 16,655,032 |
| Net unrealized appreciation | | | | |
| (depreciation) on investments | | (28,336,676) | | (3,165,150) |
| Net Increase (Decrease) in Net Assets | | | | |
| Resulting from Operations | | (62,038,848) | | 14,819,742 |
| |
| |
|
| Dividends to Shareholders from ($): | | | | |
| Investment income—net: | | | | |
| Initial Shares | | (721,418) | | (1,208,144) |
| Service Shares | | (59,367) | | (123,297) |
| Net realized gain on investments: | | | | |
| Initial Shares | | (14,614,354) | | (7,523,230) |
| Service Shares | | (2,053,893) | | (929,607) |
| Total Dividends | | (17,449,032) | | (9,784,278) |
| |
| |
|
| Beneficial Interest Transactions ($): | | | | |
| Net proceeds from shares sold: | | | | |
| Initial Shares | | 3,027,013 | | 6,208,358 |
| Service Shares | | 576,939 | | 3,743,238 |
| Dividends reinvested: | | | | |
| Initial Shares | | 15,335,772 | | 8,731,374 |
| Service Shares | | 2,113,260 | | 1,052,904 |
| Cost of shares redeemed: | | | | |
| Initial Shares | | (24,079,608) | | (38,914,721) |
| Service Shares | | (4,315,709) | | (3,294,844) |
| Increase (Decrease) in Net Assets | | | | |
| from Beneficial Interest Transactions | | (7,342,333) | | (22,473,691) |
| Total Increase (Decrease) in Net Assets | | (86,830,213) | | (17,438,227) |
| |
| |
|
| Net Assets ($): | | | | |
| Beginning of Period | | 170,739,783 | | 188,178,010 |
| End of Period | | 83,909,570 | | 170,739,783 |
| Undistributed investment income—net | | 53,518 | | 45,337 |
16
| | | Year Ended December 31, |
| | |
|
| | | 2008 | | 2007 |
| |
| |
|
| Capital Share Transactions: | | | | |
| Initial Shares | | | | |
| Shares sold | | 165,341 | | 247,822 |
| Shares issued for dividends reinvested | | 787,447 | | 366,739 |
| Shares redeemed | | (1,260,108) | | (1,551,713) |
| Net Increase (Decrease) in Shares Outstanding | | (307,320) | | (937,152) |
| |
| |
|
| Service Shares | | | | |
| Shares sold | | 30,810 | | 149,883 |
| Shares issued for dividends reinvested | | 108,267 | | 44,252 |
| Shares redeemed | | (224,041) | | (131,541) |
| Net Increase (Decrease) in Shares Outstanding | | (84,964) | | 62,594 |
| See notes to financial statements. | | | | |
The Portfolio 17
FINANCIAL HIGHLIGHTS
The following tables describe the performance for each share class for the fiscal periods indicated. All information (except portfolio turnover rate) reflects financial results for a single portfolio share.Total return shows how much your investment in the portfolio would have increased (or decreased) during each period, assuming you had reinvested all dividends and distributions.These figures have been derived from the portfolio’s financial statements.
| | | | | Year Ended December 31, | | |
| | |
| |
| |
|
| Initial Shares | | 2008 | | 2007 | | 2006 | | 2005 | | 2004 |
| |
| |
| |
| |
| |
|
| Per Share Data ($): | | | | | | | | | | |
| Net asset value, beginning of period | | 25.42 | | 24.79 | | 21.82 | | 21.40 | | 20.16 |
| Investment Operations: | | | | | | | | | | |
| Investment income—neta | | .13 | | .19 | | .18 | | .28 | | .24 |
| Net realized and unrealized gain | | | | | | | | | | |
| (loss) on investments | | (9.53) | | 1.79 | | 2.97 | | .43 | | 1.25 |
| Total from Investment Operations | | (9.40) | | 1.98 | | 3.15 | | .71 | | 1.49 |
| Distributions: | | | | | | | | | | |
| Dividends from investment income—net | | (.13) | | (.19) | | (.18) | | (.29) | | (.25) |
| Dividends from net realized | | | | | | | | | | |
| gain on investments | | (2.62) | | (1.16) | | — | | — | | — |
| Total Distributions | | (2.75) | | (1.35) | | (.18) | | (.29) | | (.25) |
| Net asset value, end of period | | 13.27 | | 25.42 | | 24.79 | | 21.82 | | 21.40 |
| |
| |
| |
| |
| |
|
| Total Return (%) | | (40.41) | | 8.44 | | 14.51 | | 3.35 | | 7.47 |
| |
| |
| |
| |
| |
|
| Ratios/Supplemental Data (%): | | | | | | | | | | |
| Ratio of total expenses | | | | | | | | | | |
| to average net assets | | .85 | | .81 | | .84 | | .81 | | .82 |
| Ratio of net expenses | | | | | | | | | | |
| to average net assets | | .85b | | .81b | | .83 | | .81b | | .82b |
| Ratio of net investment income | | | | | | | | | | |
| to average net assets | | .66 | | .76 | | .78 | | 1.33 | | 1.21 |
| Portfolio Turnover Rate | | 134.81 | | 71.85 | | 124.50 | | 65.91 | | 52.74 |
| |
| |
| |
| |
| |
|
| Net Assets, end of period ($ x 1,000) | | 73,919 | | 149,445 | | 168,965 | | 183,903 | | 220,447 |
| a | | Based on average shares outstanding at each month end. |
| b | | Expense waivers and/or reimbursements amounted to less than .01%. |
| See notes to financial statements. |
18
| | | | | Year Ended December 31, | | |
| | |
| |
| |
|
| Service Shares | | 2008 | | 2007 | | 2006 | | 2005 | | 2004 |
| |
| |
| |
| |
| |
|
| Per Share Data ($): | | | | | | | | | | |
| Net asset value, beginning of period | | 25.43 | | 24.80 | | 21.83 | | 21.40 | | 20.15 |
| Investment Operations: | | | | | | | | | | |
| Investment income—neta | | .08 | | .14 | | .14 | | .24 | | .21 |
| Net realized and unrealized | | | | | | | | | | |
| gain (loss) on investments | | (9.53) | | 1.79 | | 2.97 | | .44 | | 1.24 |
| Total from Investment Operations | | (9.45) | | 1.93 | | 3.11 | | .68 | | 1.45 |
| Distributions: | | | | | | | | | | |
| Dividends from investment income—net | | (.08) | | (.14) | | (.14) | | (.25) | | (.20) |
| Dividends from net realized | | | | | | | | | | |
| gain on investments | | (2.62) | | (1.16) | | — | | — | | — |
| Total Distributions | | (2.70) | | (1.30) | | (.14) | | (.25) | | (.20) |
| Net asset value, end of period | | 13.28 | | 25.43 | | 24.80 | | 21.83 | | 21.40 |
| |
| |
| |
| |
| |
|
| Total Return (%) | | (40.53) | | 8.19 | | 14.31 | | 3.21 | | 7.22 |
| |
| |
| |
| |
| |
|
| Ratios/Supplemental Data (%): | | | | | | | | | | |
| Ratio of total expenses | | | | | | | | | | |
| to average net assets | | 1.10 | | 1.06 | | 1.09 | | 1.07 | | 1.07 |
| Ratio of net expenses | | | | | | | | | | |
| to average net assets | | 1.10b | | 1.00 | | 1.00 | | 1.00 | | 1.00 |
| Ratio of net investment income | | | | | | | | | | |
| to average net assets | | .40 | | .55 | | .61 | | 1.14 | | 1.05 |
| Portfolio Turnover Rate | | 134.81 | | 71.85 | | 124.50 | | 65.91 | | 52.74 |
| |
| |
| |
| |
| |
|
| Net Assets, end of period ($ x 1,000) | | 9,990 | | 21,294 | | 19,213 | | 20,241 | | 23,473 |
| a | | Based on average shares outstanding at each month end. |
| b | | Expense waivers and/or reimbursements amounted to less than .01%. |
| See notes to financial statements. |
The Portfolio 19
NOTES TO FINANCIAL STATEMENTS
NOTE 1—Significant Accounting Policies:
Dreyfus Variable Investment Fund (the “fund”) is registered under the Investment Company Act of 1940, as amended (the “Act”), as an open end management investment company, operating as a series company currently offering seven series, including the Growth and Income Portfolio (the “portfolio”). The portfolio is only offered to separate accounts established by insurance companies to fund variable annuity contracts and variable life insurance policies. The portfolio is a non-diversified series. The portfolio’s investment objective is to provide long-term capital growth, current income and growth of income, consistent with reasonable investment risk.The Dreyfus Corporation (the “Manager” or “Dreyfus”), a wholly-owned subsidiary of The Bank of New York Mellon Corporation (“BNY Mellon”), serves as the portfolio’s investment adviser.
Effective July 1,2008,BNY Mellon reorganized and consolidated a number of its banking and trust company subsidiaries.As a result of the reorganization, any services previously provided to the portfolio by Mellon Bank, N.A. or Mellon Trust of New England, N.A. are now provided by The Bank of NewYork Mellon (formerly,The Bank of NewYork).
MBSC Securities Corporation (the “Distributor”), a wholly-owned subsidiary of the Manager served as the distributor of the portfolio’s shares, which are sold without a sales charge. The portfolio is authorized to issue an unlimited number of $.001 par value shares of Beneficial Interest in each of the following classes of shares: Initial and Service. Each class of shares has identical rights and privileges, except with respect to the distribution plan and the expenses borne by each class the allocation of certain transfer agency cost and certain voting rights. Income, expenses (other than expenses attributable to a specific class), and realized and unrealized gains or losses on investments are allocated to each class of shares based on its relative net assets.
The fund accounts separately for the assets, liabilities and operations of each series. Expenses directly attributable to each series are charged to
20
that series’ operations; expenses which are applicable to all series are allocated among them on a pro rata basis.
The portfolio’s financial statements are prepared in accordance with U.S. generally accepted accounting principles, which may require the use of management estimates and assumptions.Actual results could differ from those estimates.
The fund enters into contracts that contain a variety of indemnifica-tions.The portfolio’s maximum exposure under these arrangements is unknown. The portfolio does not anticipate recognizing any loss related to these arrangements.
(a) Portfolio valuation: Investments in securities are valued at the last sales price on the securities exchange or national securities market on which such securities are primarily traded. Securities listed on the National Market System for which market quotations are available are valued at the official closing price or, if there is no official closing price that day, at the last sale price. Securities not listed on an exchange or the national securities market, or securities for which there were no transactions, are valued at the average of the most recent bid and asked prices, except for open short positions, where the asked price is used for valuation purposes. Bid price is used when no asked price is available. Registered investment companies that are not traded on an exchange are valued at their net asset value.When market quotations or official closing price s are not readily available, or are determined not to reflect accurately fair value, such as when the value of a security has been significantly affected by events after the close of the exchange or market on which the security is principally traded (for example, a foreign exchange or market), but before the portfolio calculates its net asset value, the portfolio may value these investments at fair value as determined in accordance with the procedures approved by the Board ofTrustees. Fair valuing of securities may be determined with the assistance of a pricing service using calculations based on indices of domestic securities and other appropriate indicators, such as prices of
The Portfolio 21
| NOTES TO FINANCIAL STATEMENTS (continued) |
relevant ADRs and futures contracts. For other securities that are fair valued by the Board ofTrustees, certain factors may be considered such as: fundamental analytical data, the nature and duration of restrictions on disposition, an evaluation of the forces that influence the market in which the securities are purchased and sold, and public trading in similar securities of the issuer or comparable issuers. Financial futures are valued at the last sales price.
The portfolio adopted Statement of Financial Accounting Standards No. 157 “Fair Value Measurements” (“FAS 157”). FAS 157 establishes an authoritative definition of fair value, sets out a framework for measuring fair value, and requires additional disclosures about fair value measurements.
Various inputs are used in determining the value of the portfolio’s investments relating to FAS 157.These inputs are summarized in the three broad levels listed below.
| | Level 1—quoted prices in active markets for identical securities.
Level 2—other significant observable inputs (including quoted
prices for similar securities, interest rates, prepayment speeds, credit
risk, etc.).
Level 3—significant unobservable inputs (including the portfolio’s
own assumptions in determining the fair value of investments). |
The inputs or methodology used for valuing securities are not necessarily an indication of the risk associated with investing in those securities.
The following is a summary of the inputs used as of December 31, 2008 in valuing the portfolio’s investments carried at fair value:
| | | Investments in | | Other Financial |
| Valuation Inputs | | Securities ($) | | Instruments ($)† |
| |
| |
|
| Level 1—Quoted Prices | | 88,984,184 | | 0 |
| Level 2—Other Significant | | | | |
| Observable Inputs | | 0 | | 0 |
| Level 3—Significant | | | | |
| Unobservable Inputs | | 0 | | 0 |
| Total | | 88,984,184 | | 0 |
| † | | Other financial instruments include derivative instruments, such as futures, forward currency |
| | | exchange contracts and swap contracts, which are valued at the unrealized appreciation |
| | | (depreciation) on the instrument and written options contracts which are shown at value. |
22
(b) Securities transactions and investment income: Securities transactions are recorded on a trade date basis. Realized gains and losses from securities transactions are recorded on the identified cost basis. Dividend income is recognized on the ex-dividend date and interest income, including, where applicable, accretion of discount and amortization of premium on investments, is recognized on the accrual basis.
The portfolio has arrangements with the custodian and cash management banks whereby the portfolio may receive earnings credits when positive cash balances are maintained, which are used to offset custody and cash management fees. For financial reporting purposes, the portfolio includes net earnings credits as an expense offset in the Statement of Operations.
Pursuant to a securities lending agreement withThe Bank of NewYork Mellon, a subsidiary of BNY Mellon and an affiliate of Dreyfus, the portfolio may lend securities to qualified institutions. It is the portfolio’s policy, that at origination, all loans are secured by collateral of at least 102% of the value of U.S. securities loaned and 105% of the value of foreign securities loaned. Collateral equivalent to at least 100% of the market value of securities on loan is maintained at all times. Collateral is either in the form of cash, which can be invested in certain money market mutual funds managed by the Manager, U.S. Government and Agency securities or letters of credit.The portfolio is entitled to receive all income on securities loaned, in addition to income earned as a result of the lending transaction. Although each security loaned is fully collateralized, the portfolio bears the risk of delay in recovery of, or loss of rights in, the securities loaned should a borrower fail to return the securities in a timely manner. During the period ended December 31, 2008, The Bank of New York Mellon earned $23,901 from lending portfolio securities, pursuant to the securities lending agreement.
(c) Affiliated issuers: Investments in other investment companies advised by the Manager are defined as “affiliated” in the Act.
(d) Dividends to shareholders: Dividends are recorded on the ex-dividend date.The portfolio declares and pays dividends from invest-
The Portfolio 23
| NOTES TO FINANCIAL STATEMENTS (continued) |
ment income-net on a quarterly basis. Dividends from net realized capital gains, if any, are normally declared and paid annually, but the portfolio may make distributions on a more frequent basis to comply with the distribution requirements of the Internal Revenue Code of 1986, as amended (the “Code”).To the extent that net realized capital gains can be offset by capital loss carryovers, it is the policy of the portfolio not to distribute such gains. Income and capital gain distributions are determined in accordance with income tax regulations, which may differ from U.S. generally accepted accounting principles.
(e) Federal income taxes: It is the policy of the portfolio to continue to qualify as a regulated investment company, if such qualification is in the best interests of its shareholders, by complying with the applicable provisions of the Code and to make distributions of taxable income sufficient to relieve it from substantially all federal income and excise taxes.
As of and during the period ended December 31, 2008, the portfolio did not have any liabilities for any unrecognized tax positions.The portfolio recognizes interest and penalties, if any, related to unrecognized tax positions as income tax expense in the Statement of Operations. During the period, the portfolio did not incur any interest or penalties.
Each of the tax years in the four-year period ended December 31, 2008, remains subject to examination by the Internal Revenue Service and state taxing authorities.
At December 31, 2008, the components of accumulated earnings on a tax basis were as follows: undistributed ordinary income $53,518, accumulated capital losses $27,760,538 and unrealized depreciation $12,171,280. In addition, the portfolio had $5,351,746 of capital losses realized after October 31, 2008, which were deferred for tax purposes to the first day of the following fiscal year.
The accumulated capital loss carryover is available for federal income tax purposes to be applied against future net securities profits, if any, realized subsequent to December 31, 2008. If not applied, the carryover expires in fiscal 2016.
24
The tax character of distributions paid to shareholders during the fiscal periods ended December 31, 2008 and December 31, 2007 were as follows: ordinary income $9,798,190 and $1,331,441 and long-term capital gains $7,650,842 and $8,452,837, respectively.
During the period ended December 31, 2008, as a result of permanent book to tax differences, primarily due to dividend reclassification, the portfolio decreased accumulated undistributed investment income-net by $8,827 and increased accumulated net realized gain (loss) on investments by the same amount. Net assets and net asset value per share were not affected by this reclassification.
NOTE 2—Bank Lines of Credit:
Prior to October 15, 2008, the portfolio participated with other Dreyfus managed funds in a $350 million redemption credit facility. Effective October 15, 2008, the portfolio participates with other Dreyfus-managed funds in a $145 million redemption credit facility (the “Facility”) to be utilized for temporary or emergency purposes, including the financing of redemptions. In connection therewith, the portfolio has agreed to pay commitment fees on its pro rata portion of the Facility. Interest is charged to the portfolio based on prevailing market rates in effect at the time of borrowing.
The average daily amount of borrowings outstanding under the Facilities during the period ended December 31, 2008 was approximately $15,300, with a related weighted average annualized interest rate of 3.19% .
NOTE 3—Investment Advisory Fee and Other Transactions With Affiliates:
(a) Pursuant to an Investment Advisory Agreement with the Manager, the investment advisory fee is computed at the annual rate of .75% of the value of the portfolios’ average daily net assets and is payable monthly.
The Portfolio 25
| NOTES TO FINANCIAL STATEMENTS (continued) |
(b) Under the Distribution Plan (the “Plan”) adopted pursuant to Rule 12b-1 under the Act, Service shares pay the Distributor for distributing their shares, for servicing and/or maintaining Service shares shareholder accounts and for advertising and marketing for Service shares.The Plan provides for payments to be made at an annual rate of .25% of the value of the Service shares’ average daily net assets.The Distributor may make payments to Participating Insurance Companies and to brokers and dealers acting as principal underwriter for their variable insurance products.The fees payable under the Plan are payable without regard to actual expenses incurred. During the period ended December 31, 2008, Service shares were charged $39,232 pursuant to the Plan.
The portfolio compensates Dreyfus Transfer, Inc., a wholly-owned subsidiary of the Manager, under a transfer agency agreement for providing personnel and facilities to perform transfer agency services for the portfolio. During the period ended December 31, 2008, the portfolio was charged $267 pursuant to the transfer agency agreement.
The portfolio compensates The Bank of New York Mellon under a cash management agreement for performing cash management services related to fund subscriptions and redemptions. During the period ended December 31, 2008, the portfolio was charged $58 pursuant to the cash management agreement.
The portfolio compensates The Bank of New York Mellon under a custody agreement for providing custodial services for the portfolio. During the period ended December 31, 2008, the portfolio was charged $17,013 pursuant to the custody agreement.
During the period ended December 31, 2008, the portfolio was charged $5,403 for services performed by the Chief Compliance Officer.
The components of “Due to The Dreyfus Corporation and affiliates” in the Statement of Assets and Liabilities consist of: investment advisory fees $51,967, Rule 12b-1 distribution plan fees $2,052, custodian fees $4,966, chief compliance officer fees $1,197 and transfer agency per account fees $76.
26
(c) Each Board member also serves as a Board member of other funds within the Dreyfus complex. Annual retainer fees and attendance fees are allocated to each fund based on net assets.
NOTE 4—Securities Transactions:
The aggregate amount of purchases and sales of investment securities, excluding short-term securities, during the period ended December 31, 2008, amounted to $172,060,306 and $197,367,217, respectively.
At December 31, 2008, the cost of investments for federal income tax purposes was $101,155,464; accordingly, accumulated net unrealized depreciation on investments was $12,171,280, consisting of $4,507,427 gross unrealized appreciation and $16,678,707 gross unrealized depreciation.
In March 2008, the Financial Accounting Standards Board released Statement of Financial Accounting Standards No. 161 “Disclosures about Derivative Instruments and Hedging Activities” (“FAS 161”). FAS 161 requires qualitative disclosures about objectives and strategies for using derivatives, quantitative disclosures about fair value amounts of gains and losses on derivative instruments and disclosures about credit-risk-related contingent features in derivative agreements. The application of FAS 161 is required for fiscal years and interim periods beginning after November 15, 2008.At this time, management is evaluating the implications of FAS 161 and its impact on the financial statements and the accompanying notes has not yet been determined.
The Portfolio 27
REPORT OF INDEPENDENT REGISTERED
PUBLIC ACCOUNTING FIRM |
Shareholders and Board of Trustees
Dreyfus Variable Investment Fund, Growth and Income Portfolio
We have audited the accompanying statement of assets and liabilities, including the statement of investments, of Dreyfus Variable Investment Fund, Growth and Income Portfolio (one of the series comprising Dreyfus Variable Investment Fund) as of December 31, 2008, and the related statement of operations for the year then ended, the statement of changes in net assets for each of the two years in the period then ended, and financial highlights for each of the years indicated therein. These financial statements and financial highlights are the responsibility of the Fund’s management. Our responsibility is to express an opinion on these financial statements and financial highlights based on our audits.
We conducted our audits in accordance with the standards of the Public Company Accounting Oversight Board (United States).Those standards require that we plan and perform the audit to obtain reasonable assurance about whether the financial statements and financial highlights are free of material misstatement.We were not engaged to perform an audit of the Fund’s internal control over financial reporting. Our audits included consideration of internal control over financial reporting as a basis for designing audit procedures that are appropriate in the circumstances, but not for the purpose of expressing an opinion on the effectiveness of the Fund’s internal control over financial reporting. Accordingly, we express no such opinion.An audit also includes examining, on a test basis, evidence supporting the amounts and disclosures in the financial statements and financial highlights, assessing the accounting principles used and significant estimates made by management, and evaluating the overall financial statement presentation. Our procedures included confirmation of securities owned as of December 31, 2008 by correspondence with the custodian and others. We believe that our audits provide a reasonable basis for our opinion.
In our opinion, the financial statements and financial highlights referred to above present fairly, in all material respects, the financial position of Dreyfus Variable Investment Fund, Growth and Income Portfolio at December 31, 2008, the results of its operations for the year then ended, the changes in its net assets for each of the two years in the period then ended, and the financial highlights for each of the indicated years, in conformity with U.S. generally accepted accounting principles.
New York, New York
February 10, 2009 |
28
IMPORTANT TAX INFORMATION (Unaudited)
For federal tax purposes, the portfolio hereby designates $1.2030 per share as a long-term capital gain distribution and $1.4170 per share as a short-term capital gain distribution paid on March 31, 2008 and also the portfolio hereby designates 31.12% of the ordinary dividends paid during the fiscal year ended December 31, 2008 as qualifying for the corporate dividends received deduction. Shareholders will receive notification in January 2009 of the percentage applicable to the preparation of their 2008 income tax returns.
The Portfolio 29
BOARD MEMBERS INFORMATION (Unaudited)

30
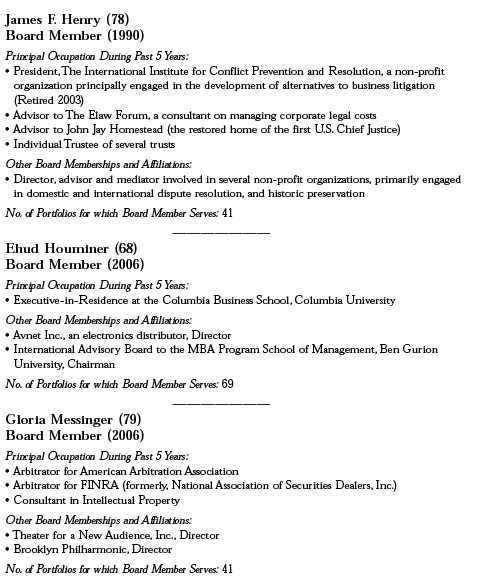
The Portfolio 31
BOARD MEMBERS INFORMATION (Unaudited) (continued)
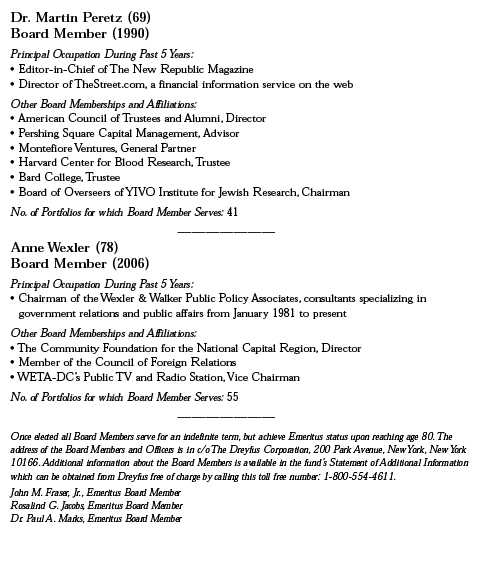
32
OFFICERS OF THE FUND (Unaudited)
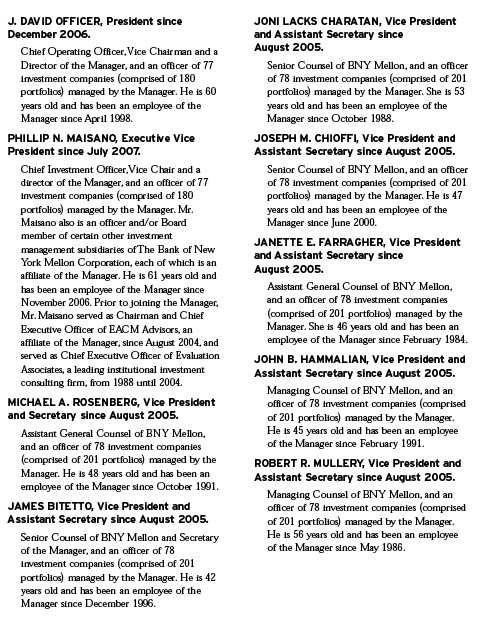
The Portfolio 33
OFFICERS OF THE FUND (Unaudited) (continued)
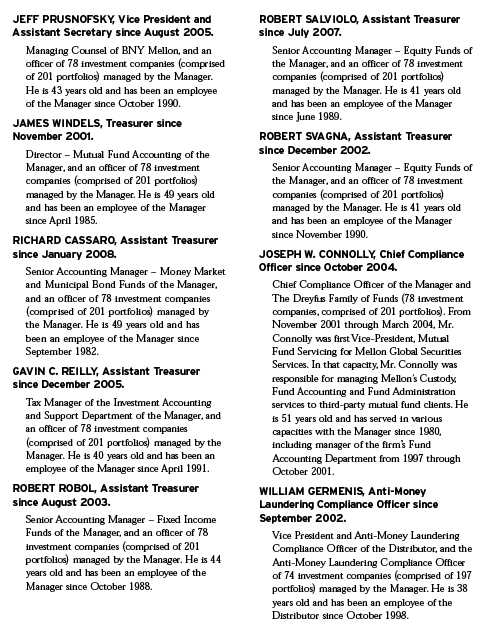
34
NOTES
For More Information

Telephone 1-800-554-4611 or 516-338-3300
Mail The Dreyfus Family of Funds, 144 Glenn Curtiss Boulevard, Uniondale, NY 11556-0144 Attn: Investments Division
The portfolio files its complete schedule of portfolio holdings with the Securities and Exchange Commission (“SEC”) for the first and third quarters of each fiscal year on Form N-Q. The portfolio’s Forms N-Q are available on the SEC’s website at http://www.sec.gov and may be reviewed and copied at the SEC’s Public Reference Room in Washington, DC. Information on the operation of the Public Reference Room may be obtained by calling 1-800-SEC-0330.
A description of the policies and procedures that the portfolio uses to determine how to vote proxies relating to portfolio securities, and information regarding how the portfolio voted these proxies for the 12-month period ended June 30, 2008, is available at http://www.dreyfus.com and on the SEC’s website at http://www.sec.gov. The description of the policies and procedures is also available without charge, upon request, by calling 1-800-645-6561.

| © 2009 MBSC Securities Corporation |
| | Dreyfus Variable
Investment Fund,
International
Equity Portfolio |
| | ANNUAL REPORT December 31, 2008 |

The views expressed in this report reflect those of the portfolio manager only through the end of the period covered and do not necessarily represent the views of Dreyfus or any other person in the Dreyfus organization.Any such views are subject to change at any time based upon market or other conditions and Dreyfus disclaims any responsibility to update such views. These views may not be relied on as investment advice and, because investment decisions for a Dreyfus portfolio are based on numerous factors, may not be relied on as an indication of trading intent on behalf of any Dreyfus portfolio.

| | Contents |
| |
| | THE PORTFOLIO |
| |
| 2 | A Letter from the CEO |
| |
| 3 | Discussion of Performance |
| |
| 6 | Portfolio Performance |
| |
| 8 | Understanding Your Portfolio’s Expenses |
| |
| 8 | Comparing Your Portfolio’s Expenses With Those of Other Funds |
| |
| 9 | Statement of Investments |
| |
| 14 | Statement of Assets and Liabilities |
| |
| 15 | Statement of Operations |
| |
| 16 | Statement of Changes in Net Assets |
| |
| 18 | Financial Highlights |
| |
| 20 | Notes to Financial Statements |
| |
| 31 | Report of Independent Registered Public Accounting Firm |
| |
| 32 | Important Tax Information |
| |
| 33 | Board Members Information |
| |
| 36 | Officers of the Fund |
| |
| | FOR MORE INFORMATION |
| |
| | Back Cover |
| |
Dreyfus Variable Investment Fund,
International Equity Portfolio |
The Portfolio

A LETTER FROM THE CEO
Dear Shareholder: |
We present to you this annual report for Dreyfus Variable Investment Fund, International Equity Portfolio, covering the 12-month period from January 1, 2008, through December 31, 2008.
2008 was the most difficult year in decades for the economy and stock market. A credit crunch that originated in 2007 in the U.S. sub-prime mortgage market exploded in mid-2008 into a global financial crisis, resulting in the failures of major financial institutions, a deep and prolonged recession and lower investment values across a broad range of asset classes. Governments and regulators throughout the world moved aggressively to curtail the damage, implementing unprecedented reductions of short-term interest rates, massive injections of liquidity into the banking system, government bailouts of struggling companies and plans for massive economic stimulus programs.
Although we expect the U.S. and global economies to remain weak until longstanding imbalances have worked their way out of the system, the financial markets currently appear to have priced in investors’ generally low expectations. In previous recessions, however, the markets have tended to anticipate economic improvement before it occurs, potentially leading to major rallies when few expected them. That’s why it makes sense to remain disciplined, maintain a long-term perspective and adopt a consistent asset allocation strategy that reflects one’s future goals and attitudes toward risk. As always, we urge you to consult with your financial advisor, who can recommend the course of action that is right for you.
For information about how the portfolio performed during the reporting period, as well as market perspectives, we have provided a Discussion of Performance given by the Portfolio Manager.
Thank you for your continued confidence and support.
Jonathan R. Baum
Chief Executive Officer
The Dreyfus Corporation
January 15, 2009 |
2

DISCUSSION OF PERFORMANCE
For the period of January 1, 2008, through December 31, 2008, as provided by Jonathan Bell, Portfolio Manager, Newton Capital Management Limited, Sub-Investment Adviser
Portfolio and Market Performance Overview
For the 12-month period ended December 31, 2008, Dreyfus Variable Investment Fund, International Equity Portfolio’s Initial shares produced a total return of –42.22%, and its Service shares produced a total return of –42.36% .1 This compares with a –43.38% total return from the portfolio’s benchmark, the Morgan Stanley Capital International Europe, Australasia, Far East Index (“MSCI EAFE Index”), for the same period.2
Stocks throughout the world declined sharply in 2008 due to a slowing global economy and an intensifying financial crisis.While we are never satisfied with negative absolute returns, we are pleased that the portfolio produced slightly higher returns than the MSCI EAFE Index, which we attribute to relatively strong results from the financials and telecommunications services sectors.
The Portfolio’s Investment Approach
The portfolio seeks capital growth by investing primarily in stocks of foreign companies. When choosing stocks, we consider trends in economic variables, such as gross domestic product, inflation and interest rates; investment themes, such as new technologies and globalization; the relative values of equities, bonds and cash; company fundamentals and long-term trends in currency movements. Within markets and sectors determined to be relatively attractive, we seek what we believe are attractively priced companies that possess a sustainable competitive advantage in their market or sector. Securities are generally sold when themes or strategies change, when we determine that the company’s prospects have changed, or when a stock becomes fully valued by the market.
Stocks Tumbled in Volatile Markets
Like most other asset classes, international stocks suffered in 2008 as a global economic downturn gained momentum and a credit crisis mushroomed into a financial crisis that nearly led to the collapse of the global banking system. A credit crunch that originated in 2007 in the U.S.
The Portfolio 3
| DISCUSSION OF PERFORMANCE (continued) |
sub-prime mortgage market sent repercussions throughout the world, producing massive losses among financial institutions with exposure to complex mortgage-related instruments. As major banks teetered on the edge of insolvency, lenders grew reluctant to extend credit, even to other banks. The resulting lack of financing undermined the financial health of some businesses, and highly leveraged institutional investors were forced to sell their more liquid and creditworthy holdings to meet margin calls and redemption requests. Meanwhile, collapsing global demand sparked a sharp reversal in commodity prices, which fell sharply from their previous highs over the second half of the year.
Financials and Telecommunications Stocks Supported Relative Performance
Every country and economic sector represented in the MSCI EAFE Index posted negative absolute returns in 2008. Not surprisingly, losses were especially severe among highly leveraged financial institutions, which stood at the epicenter of the crisis. However, the portfolio was spared the full brunt of the financial sector’s decline, as we had established underweighted exposure to such companies compared to the benchmark. In addition, our security selection strategy enabled the portfolio to avoid many of the more severely affected banks. The portfolio also achieved above-average returns in the telecommunications sector, where an overweighted position helped it participate more fully in the sector’s comparatively mild declines. Finally, we had trimmed the portfolio’s exposure to the emerging markets, which were particularly hard-hit by deteriorating investor sentiment and plummeting commodity prices.
The portfolio encountered disappointing relative performance in the energy sector, where we failed to anticipate the magnitude of slumping demand for oil, natural gas and coal. Exploration-and-production companies declined especially sharply, including Siberia-based Sibir Energy and Petrobras.We eliminated the portfolio’s position in Sibir Energy due to poor corporate governance, but we retained Petrobras, which we believe remains fundamentally sound. The utilities sector also detracted from returns due to an underweighted position in the better-performing sector and sharp declines among individual holdings, including Eon in Germany, which we sold due to its high debt levels.
Finally, the portfolio’s 2008 results were influenced by changes in currency exchange rates.Although Japan’s stock market performed poorly
4
in local currency terms, a strengthening yen made it one of the MSCI EAFE Index’s better-performing markets in U.S. dollar terms. As it became clear to us that nervous investors were repatriating monies into U.S. dollars, boosting their value, we increased the portfolio’s exposure to international companies with a strong presence in the United States, such as pharmaceutical developer GlaxoSmithKline, food giant Nestle and household goods maker Unilever.
Positioned to Weather the Storm
As of year-end, global economic conditions have remained weak, and the financial crisis has persisted despite aggressive measures adopted by many governments and central banks.Therefore, we have intensified our focus on markets and companies with attractive dividend yields and strong growth prospects that, in our analysis, are likely to hold up relatively well during a potentially deep and protracted downturn. We have found a number of such opportunities in Japan, where valuations appear particularly attractive, and among certain health care companies whose products remain in demand regardless of economic developments.
January 15, 2009
Investing in foreign companies involves special risks, including changes in currency rates, political, economic and social instability, a lack of comprehensive company information, differing auditing and legal standards and less market liquidity. An investment in this portfolio should be considered only as a supplement to an overall investment program.
The portfolio is only available as a funding vehicle under variable life insurance policies or variable annuity contracts issued by insurance companies. Individuals may not purchase shares of the portfolio directly. A variable annuity is an insurance contract issued by an insurance company that enables investors to accumulate assets on a tax-deferred basis for retirement or other long-term goals.The investment objective and policies of Dreyfus Variable Investment Fund, International Equity Portfolio made available through insurance products may be similar to other funds/portfolios managed or advised by Dreyfus. However, the investment results of the portfolio may be higher or lower than, and may not be comparable to, those of any other Dreyfus fund/portfolio.
| 1 | | Total return includes reinvestment of dividends and any capital gains paid. Past performance is no |
| | | guarantee of future results. Share price and investment return fluctuate such that upon redemption, |
| | | portfolio shares may be worth more or less than their original cost.The portfolio’s performance does |
| | | not reflect the deduction of additional charges and expenses imposed in connection with investing |
| | | in variable insurance contracts, which will reduce returns. |
| 2 | | SOURCE: LIPPER INC. — Reflects reinvestment of net dividends and, where applicable, |
| | | capital gain distributions.The Morgan Stanley Capital International Europe, Australasia, Far |
| | | East (MSCI EAFE) Index is an unmanaged index composed of a sample of companies |
| | | representative of the market structure of European and Pacific Basin countries. |
The Portfolio 5
PORTFOLIO PERFORMANCE
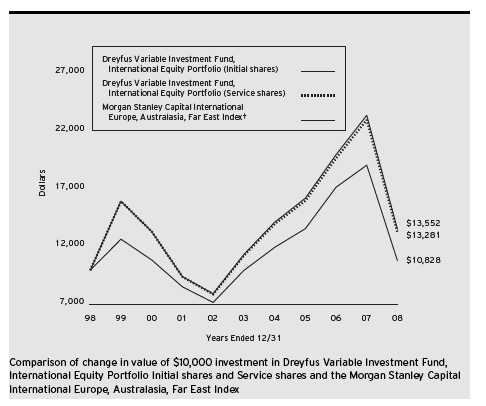
| Average Annual Total Returns as of 12/31/08 | | | | | | |
| | | 1 Year | | 5 Years | | 10 Years |
| |
| |
| |
|
| Initial shares | | (42.22)% | | 3.59% | | 3.09% |
| Service shares | | (42.36)% | | 3.33% | | 2.88% |
The data for Service shares includes the results of Initial shares for the period prior to December 31, 2000 (inception date of Service shares). Actual Service shares’ average annual total return and hypothetical growth results would have been lower. See notes below.
† Source: Lipper Inc.
Past performance is not predictive of future performance.The portfolio’s performance shown in the graph and table does not reflect the deduction of taxes that a shareholder would pay on portfolio distributions or the redemption of portfolio shares.
The portfolio’s performance does not reflect the deduction of additional charges and expenses imposed in connection with investing in variable insurance contracts which will reduce returns.
The above graph compares a $10,000 investment made in Initial and Service shares of Dreyfus Variable Investment Fund, International Equity Portfolio on 12/31/98 to a $10,000 investment made in the Morgan Stanley Capital International Europe, Australasia, Far East Index (the “Index”) on that date.
6
The portfolio’s Initial shares are not subject to a Rule 12b-1 fee.The portfolio’s Service shares are subject to a 0.25% annual Rule 12b-1 fee.The performance figures for Service shares reflect the performance of the portfolio’s Initial shares from their inception date through December 30, 2000, and the performance of the portfolio’s Service shares from December 31, 2000 (inception date of Service shares) to December 31, 2008 (blended performance figures).The blended performance figures have not been adjusted to reflect the higher operating expenses of the Service shares. If these expenses had been reflected, the blended performance figures would have been lower. All dividends and capital gain distributions are reinvested.
The portfolio’s performance shown in the line graph takes into account all applicable portfolio fees and expenses.The Index is an unmanaged index composed of a sample of companies representative of the market structure of European and Pacific Basin countries and includes net dividends reinvested. Unlike a mutual fund, the Index is not subject to charges, fees and other expenses. Investors cannot invest directly in any index. Further information relating to portfolio performance, including expense reimbursements, if applicable, is contained in the Financial Highlights section of the prospectus and elsewhere in this report.
The Portfolio 7
UNDERSTANDING YOUR
PORTFOLIO’S EXPENSES (Unaudited) |
As a mutual fund investor, you pay ongoing expenses, such as management fees and other expenses. Using the information below, you can estimate how these expenses affect your investment and compare them with the expenses of other funds.You also may pay one-time transaction expenses, including sales charges (loads) and redemption fees,which are not shown in this section and would have resulted in higher total expenses. For more information, see your portfolio’s prospectus or talk to your financial adviser.
Review your portfolio’s expenses
The table below shows the expenses you would have paid on a $1,000 investment in Dreyfus Variable Investment Fund, International Equity Portfolio from July 1, 2008 to December 31, 2008. It also shows how much a $1,000 investment would be worth at the close of the period, assuming actual returns and expenses.
| | Expenses and Value of a $1,000 Investment
assuming actual returns for the six months ended December 31, 2008 |
| | | Initial Shares | | Service Shares |
| |
| |
|
| Expenses paid per $1,000† | | $ 4.60 | | $ 5.62 |
| Ending value (after expenses) | | $619.20 | | $618.70 |
COMPARING YOUR PORTFOLIO’S EXPENSES
WITH THOSE OF OTHER FUNDS (Unaudited) |
Using the SEC’s method to compare expenses
The Securities and Exchange Commission (SEC) has established guidelines to help investors assess fund expenses. Per these guidelines, the table below shows your portfolio’s expenses based on a $1,000 investment, assuming a hypothetical 5% annualized return. You can use this information to compare the ongoing expenses (but not transaction expenses or total cost) of investing in the portfolio with those of other funds. All mutual fund shareholder reports will provide this information to help you make this comparison. Please note that you cannot use this information to estimate your actual ending account balance and expenses paid during the period.
| | Expenses and Value of a $1,000 Investment
assuming a hypothetical 5% annualized return for the six months ended December 31, 2008 |
| | | Initial Shares | | Service Shares |
| |
| |
|
| Expenses paid per $1,000† | | $ 5.74 | | $ 7.00 |
| Ending value (after expenses) | | $1,019.46 | | $1,018.20 |
| † Expenses are equal to the portfolio’s annualized expense ratio of 1.13% for Initial shares and 1.38% for Service |
| shares, multiplied by the average account value over the period, multiplied by 184/366 (to reflect the one-half |
| year period). |
8
STATEMENT OF INVESTMENTS
December 31, 2008 |
| Common Stocks—96.1% | | Shares | | Value ($) |
| |
| |
|
| Australia—3.5% | | | | |
| Newcrest Mining | | 23,447 | | 556,094 |
| QBE Insurance Group | | 27,623 | | 502,119 |
| Telstra | | 245,075 | | 656,214 |
| | | | | 1,714,427 |
| Austria—.7% | | | | |
| Strabag | | 14,934 | | 336,295 |
| Brazil—5.0% | | | | |
| All America Latina Logistica (Units) | | 27,136 | | 116,364 |
| Cia de Bebidas das Americas | | | | |
| (AmBev), ADR (Preferred) | | 7,828 | | 346,859 |
| Cia Vale do Rio Doce, ADR | | 49,893 | | 604,204 |
| Global Village Telecom Holding | | 20,600 a | | 224,109 |
| Petroleo Brasileiro (Preferred), ADR | | 27,939 | | 570,235 |
| Tele Norte Leste Participacoes, ADR | | 42,018 | | 584,891 |
| | | | | 2,446,662 |
| Canada—.7% | | | | |
| Oncolytics Biotech | | 133,935 a | | 161,655 |
| Suncor Energy | | 8,432 | | 162,015 |
| | | | | 323,670 |
| China—.3% | | | | |
| Harbin Power Equipment, Cl. H | | 190,000 | | 159,073 |
| Finland—.6% | | | | |
| Elisa | | 18,535 | | 316,904 |
| France—4.1% | | | | |
| Air Liquide | | 4,185 | | 380,745 |
| Alstom | | 8,738 | | 509,899 |
| GDF SUEZ | | 9,188 a | | 451,162 |
| Thales | | 16,471 | | 682,972 |
| | | | | 2,024,778 |
The Portfolio 9
| STATEMENT OF INVESTMENTS (continued) |
| Common Stocks (continued) | | Shares | | Value ($) |
| |
| |
|
| Germany—6.7% | | | | |
| Bayer | | 13,283 | | 767,179 |
| Deutsche Boerse | | 6,754 | | 476,930 |
| Deutsche Telekom | | 36,075 | | 539,069 |
| Fresenius Medical Care & Co. | | 9,068 | | 419,871 |
| K+S | | 14,335 | | 796,455 |
| Symrise | | 20,909 | | 290,064 |
| | | | | 3,289,568 |
| Hong Kong—3.0% | | | | |
| China Resources Land | | 234,000 | | 289,707 |
| Huabao International Holdings | | 595,000 | | 391,239 |
| Jardine Matheson Holdings | | 42,000 | | 778,747 |
| | | | | 1,459,693 |
| Ireland—.7% | | | | |
| CRH | | 12,994 | | 326,929 |
| Japan—24.8% | | | | |
| Bank of Yokohama | | 218,000 | | 1,289,498 |
| Canon | | 11,200 | | 351,585 |
| Daiwa Securities Group | | 81,000 | | 482,717 |
| East Japan Railway | | 86 | | 671,645 |
| Ibiden | | 16,200 | | 333,956 |
| Japan Tobacco | | 343 | | 1,135,811 |
| KDDI | | 151 | | 1,075,481 |
| Konami | | 20,000 | | 514,890 |
| Mitsubishi | | 23,000 | | 322,884 |
| Nintendo | | 2,300 | | 883,648 |
| Nippon Telegraph & Telephone | | 88 | | 472,956 |
| Nissan Motor | | 134,200 | | 486,073 |
| NTT Urban Development | | 393 | | 424,021 |
| Rohm | | 9,700 | | 489,806 |
| Sawai Pharmaceutical | | 8,100 | | 401,010 |
| Secom | | 9,000 | | 463,578 |
10
| Common Stocks (continued) | | Shares | | Value ($) |
| |
| |
|
| Japan (continued) | | | | |
| Seven & I Holdings | | 18,600 | | 637,231 |
| Shimamura | | 3,800 | | 293,997 |
| Takeda Pharmaceutical | | 11,500 | | 596,533 |
| Yamada Denki | | 11,390 | | 790,714 |
| | | | | 12,118,034 |
| Luxembourg—.8% | | | | |
| Millicom International Cellular | | 8,703 | | 395,643 |
| Malaysia—1.1% | | | | |
| Bursa Malaysia | | 131,700 | | 197,099 |
| Telekom Malaysia | | 399,600 | | 356,776 |
| | | | | 553,875 |
| Netherlands—3.3% | | | | |
| Koninklijke Ahold | | 59,518 | | 727,222 |
| Unilever | | 37,325 | | 899,660 |
| | | | | 1,626,882 |
| Norway—2.0% | | | | |
| StatoilHydro | | 44,357 | | 721,535 |
| Subsea 7 | | 42,056 a | | 243,251 |
| | | | | 964,786 |
| Peru—1.0% | | | | |
| Credicorp | | 9,467 | | 472,971 |
| Russia—.5% | | | | |
| Gazprom, ADR | | 7,775 | | 110,794 |
| Sistema, GDR | | 24,463 | | 134,546 |
| | | | | 245,340 |
| Singapore—.6% | | | | |
| DBS Group (Rights) | | 22,500 a | | 46,851 |
| DBS Group Holdings | | 45,000 | | 262,988 |
| | | | | 309,839 |
| South Africa—1.2% | | | | |
| Gold Fields | | 60,813 | | 604,512 |
The Portfolio 11
| STATEMENT OF INVESTMENTS (continued) |
| Common Stocks (continued) | | Shares | | Value ($) |
| |
| |
|
| South Korea—.8% | | | | |
| LG Telecom | | 51,739 | | 406,318 |
| Switzerland—14.2% | | | | |
| ABB | | 25,056 a | | 366,771 |
| Actelion | | 10,048 a | | 560,766 |
| Bank Sarasin & Cie, Cl. B | | 12,500 | | 369,944 |
| Credit Suisse Group | | 12,282 | | 328,874 |
| Lonza Group | | 3,565 | | 326,740 |
| Nestle | | 34,100 | | 1,332,795 |
| Novartis | | 18,664 | | 924,125 |
| Roche Holding | | 8,970 | | 1,369,498 |
| Syngenta | | 1,883 | | 354,539 |
| Verwalt & Privat-Bank | | 2,136 | | 280,960 |
| Zurich Financial Services | | 3,394 | | 723,858 |
| | | | | 6,938,870 |
| Thailand—.9% | | | | |
| Bangkok Bank | | 150,100 | | 307,483 |
| Bank of Ayudhya | | 497,400 | | 137,921 |
| | | | | 445,404 |
| United Kingdom—19.6% | | | | |
| Admiral Group | | 17,869 | | 233,790 |
| Anglo American | | 13,626 | | 302,874 |
| BAE Systems | | 103,184 | | 558,920 |
| BP | | 170,482 | | 1,289,283 |
| British American Tobacco | | 22,283 | | 576,674 |
| Cable & Wireless | | 416,046 | | 936,138 |
| GlaxoSmithKline | | 31,619 | | 583,937 |
| ICAP | | 115,494 | | 477,399 |
| Prudential | | 65,281 | | 390,918 |
| Royal Dutch Shell, Cl. B | | 21,247 | | 527,257 |
12
| Common Stocks (continued) | | Shares | | Value ($) |
| |
| |
|
| United Kingdom (continued) | | | | |
| Smith & Nephew | | 56,042 | | 353,319 |
| St. James’s Place | | 70,108 | | 179,420 |
| Standard Chartered | | 79,009 | | 993,960 |
| Tesco | | 92,165 | | 477,038 |
| Venture Production | | 55,456 | | 339,459 |
| Vodafone Group | | 703,643 | | 1,406,214 |
| | | | | 9,626,600 |
| |
| |
|
| |
| Total Investments (cost $58,829,698) | | 96.1% | | 47,107,073 |
| Cash and Receivables (Net) | | 3.9% | | 1,892,399 |
| Net Assets | | 100.0% | | 48,999,472 |
| |
| ADR—American Depository Receipts | | | | |
| GDR—Global Depository Receipts | | | | |
| a Non-income producing security. | | | | |
| Portfolio Summary (Unaudited)† | | | | |
| |
| | | Value (%) | | | | Value (%) |
| |
| |
| |
|
| Financial | | 18.0 | | Consumer Services | | 7.6 |
| Telecommunications | | 15.3 | | Utilities | | 4.6 |
| Consumer Goods | | 12.6 | | Oil & Gas | | 4.4 |
| Health Care | | 11.0 | | Technology | | 2.5 |
| Materials | | 10.2 | | | | |
| Industrial | | 9.9 | | | | 96.1 |
| |
| † Based on net assets. | | | | | | |
| See notes to financial statements. | | | | | | |
The Portfolio 13
STATEMENT OF ASSETS AND LIABILITIES
December 31, 2008 |
| | | Cost | | Value |
| |
| |
|
| Assets ($): | | | | |
| Investments in securities—See Statement of Investments | | 58,829,698 | | 47,107,073 |
| Cash | | | | 420,303 |
| Receivable for investment securities sold | | | | 1,848,097 |
| Unrealized appreciation on forward currency | | | | |
| exchange contracts—Note 4 | | | | 393,820 |
| Dividends and interest receivable | | | | 174,648 |
| Receivable for shares of Beneficial Interest subscribed | | | | 13,051 |
| Prepaid expenses | | | | 2,876 |
| | | | | 49,959,868 |
| |
| |
|
| Liabilities ($): | | | | |
| Due to The Dreyfus Corporation and affiliates—Note 3(b) | | | | 70,362 |
| Payable for investment securities purchased | | | | 770,067 |
| Unrealized depreciation on forward currency | | | | |
| exchange contracts—Note 4 | | | | 50,955 |
| Payable for shares of Beneficial Interest redeemed | | | | 24,330 |
| Accrued expenses | | | | 44,682 |
| | | | | 960,396 |
| |
| |
|
| Net Assets ($) | | | | 48,999,472 |
| |
| |
|
| Composition of Net Assets ($): | | | | |
| Paid-in capital | | | | 72,475,409 |
| Accumulated undistributed investment income—net | | | | 1,517,506 |
| Accumulated net realized gain (loss) on investments | | | | (13,583,481) |
| Accumulated net unrealized appreciation (depreciation) | | | | |
| on investments and foreign currency transactions | | | | (11,409,962) |
| |
| |
|
| Net Assets ($) | | | | 48,999,472 |
| |
| |
|
| |
| |
| Net Asset Value Per Share | | | | |
| | | Initial Shares | | Service Shares |
| |
| |
|
| Net Assets ($) | | 37,360,404 | | 11,639,068 |
| Shares Outstanding | | 2,929,712 | | 915,194 |
| |
| |
|
| Net Asset Value Per Share ($) | | 12.75 | | 12.72 |
| |
| See notes to financial statements. | | | | |
14
| STATEMENT OF OPERATIONS | | |
| Year Ended December 31, 2008 | | |
| |
|
| |
| |
| |
| |
| Investment Income ($): | | |
| Income: | | |
| Cash dividends (net of $179,065 foreign taxes withheld at source) | | 1,983,126 |
| Interest | | 796 |
| Total Income | | 1,983,922 |
| Expenses: | | |
| Investment advisory fee—Note 3(a) | | 551,694 |
| Custodian fees—Note 3(b) | | 154,032 |
| Auditing fees | | 51,812 |
| Distribution fees—Note 3(b) | | 40,149 |
| Prospectus and shareholders’ reports | | 17,129 |
| Trustees’ fees and expenses—Note 3(c) | | 6,042 |
| Shareholder servicing costs—Note 3(b) | | 2,587 |
| Legal fees | | 1,881 |
| Loan commitment fees—Note 2 | | 980 |
| Miscellaneous | | 21,356 |
| Total Expenses | | 847,662 |
| Less—reduction in fees due to | | |
| earnings credits—Note 1(c) | | (9,714) |
| Net Expenses | | 837,948 |
| Investment Income—Net | | 1,145,974 |
| |
|
| Realized and Unrealized Gain (Loss) on Investments—Note 4 ($): | | |
| Net realized gain (loss) on investments and foreign currency transactions | | (13,674,088) |
| Net realized gain (loss) on options transactions | | (477,252) |
| Net realized gain (loss) on forward currency exchange contracts | | 1,392,272 |
| Net Realized Gain (Loss) | | (12,759,068) |
| Net unrealized appreciation (depreciation) | | |
| on investments and foreign currency transactions | | (26,755,080) |
| Net Realized and Unrealized Gain (Loss) on Investments | | (39,514,148) |
| Net (Decrease) in Net Assets Resulting from Operations | | (38,368,174) |
| |
| See notes to financial statements. | | |
The Portfolio 15
STATEMENT OF CHANGES IN NET ASSETS
| | | Year Ended December 31, |
| | |
|
| | | 2008 | | 2007 |
| |
| |
|
| Operations ($): | | | | |
| Investment income—net | | 1,145,974 | | 1,040,780 |
| Net realized gain (loss) on investments | | (12,759,068) | | 10,606,561 |
| Net unrealized appreciation | | | | |
| (depreciation) on investments | | (26,755,080) | | 953,023 |
| Net Increase (Decrease) in Net Assets | | | | |
| Resulting from Operations | | (38,368,174) | | 12,600,364 |
| |
| |
|
| Dividends to Shareholders from ($): | | | | |
| Investment income—net: | | | | |
| Initial Shares | | (1,044,139) | | (1,074,877) |
| Service Shares | | (232,930) | | (176,401) |
| Net realized gain on investments: | | | | |
| Initial Shares | | (1,922,444) | | — |
| Service Shares | | (497,659) | | — |
| Total Dividends | | (3,697,172) | | (1,251,278) |
| |
| |
|
| Beneficial Interest Transactions ($): | | | | |
| Net proceeds from shares sold: | | | | |
| Initial Shares | | 11,271,804 | | 28,845,262 |
| Service Shares | | 5,935,274 | | 8,610,473 |
| Dividends reinvested: | | | | |
| Initial Shares | | 2,966,583 | | 1,074,877 |
| Service Shares | | 730,589 | | 176,401 |
| Cost of shares redeemed: | | | | |
| Initial Shares | | (15,239,119) | | (27,780,728) |
| Service Shares | | (4,129,338) | | (2,023,562) |
| Increase (Decrease) in Net Assets from | | | | |
| Beneficial Interest Transactions | | 1,535,793 | | 8,902,723 |
| Total Increase (Decrease) in Net Assets | | (40,529,553) | | 20,251,809 |
| |
| |
|
| Net Assets ($): | | | | |
| Beginning of Period | | 89,529,025 | | 69,277,216 |
| End of Period | | 48,999,472 | | 89,529,025 |
| Undistributed investment income—net | | 1,517,506 | | 866,632 |
16
| | | Year Ended December 31, |
| | |
|
| | | 2008 | | 2007 |
| |
| |
|
| Capital Share Transactions: | | | | |
| Initial Shares | | | | |
| Shares sold | | 581,150 | | 1,383,929 |
| Shares issued for dividends reinvested | | 145,207 | | 54,014 |
| Shares redeemed | | (864,884) | | (1,335,865) |
| Net Increase (Decrease) in Shares Outstanding | | (138,527) | | 102,078 |
| |
| |
|
| Service Shares | | | | |
| Shares sold | | 308,758 | | 407,840 |
| Shares issued for dividends reinvested | | 35,796 | | 8,869 |
| Shares redeemed | | (236,219) | | (94,486) |
| Net Increase (Decrease) in Shares Outstanding | | 108,335 | | 322,223 |
| |
| See notes to financial statements. | | | | |
The Portfolio 17
FINANCIAL HIGHLIGHTS
The following tables describe the performance for each share class for the fiscal periods indicated.All information (except portfolio turnover rate) reflects financial results for a single portfolio share.Total return shows how much your investment in the portfolio would have increased (or decreased) during each period, assuming you had reinvested all dividends and distributions.These figures have been derived from the portfolio’s financial statements.
| | | | | Year Ended December 31, | | |
| | |
| |
| |
|
| Initial Shares | | 2008 | | 2007 | | 2006 | | 2005 | | 2004 |
| |
| |
| |
| |
| |
|
| Per Share Data ($): | | | | | | | | | | |
| Net asset value, beginning of period | | 23.12 | | 20.08 | | 16.41 | | 14.36 | | 11.97 |
| Investment Operations: | | | | | | | | | | |
| Investment income—neta | | .30 | | .29 | | .22 | | .26 | | .27 |
| Net realized and unrealized | | | | | | | | | | |
| gain (loss) on investments | | (9.70) | | 3.10 | | 3.59 | | 1.85 | | 2.64 |
| Total from Investment Operations | | (9.40) | | 3.39 | | 3.81 | | 2.11 | | 2.91 |
| Distributions: | | | | | | | | | | |
| Dividends from investment income—net | | (.34) | | (.35) | | (.14) | | (.06) | | (.52) |
| Dividends from net realized | | | | | | | | | | |
| gain on investments | | (.63) | | — | | — | | — | | — |
| Total Distributions | | (.97) | | (.35) | | (.14) | | (.06) | | (.52) |
| Net asset value, end of period | | 12.75 | | 23.12 | | 20.08 | | 16.41 | | 14.36 |
| |
| |
| |
| |
| |
|
| Total Return (%) | | (42.22) | | 17.12 | | 23.31 | | 14.75 | | 24.57 |
| |
| |
| |
| |
| |
|
| Ratios/Supplemental Data (%): | | | | | | | | | | |
| Ratio of total expenses | | | | | | | | | | |
| to average net assets | | 1.10 | | 1.03 | | 1.03 | | 1.10 | | 1.04 |
| Ratio of net expenses | | | | | | | | | | |
| to average net assets | | 1.08 | | .98 | | .97 | | 1.09 | | 1.04b |
| Ratio of net investment income | | | | | | | | | | |
| to average net assets | | 1.62 | | 1.37 | | 1.19 | | 1.76 | | 2.13 |
| Portfolio Turnover Rate | | 99.61 | | 113.77 | | 98.92 | | 92.82 | | 96.55 |
| |
| |
| |
| |
| |
|
| Net Assets, end of period ($ x 1,000) | | 37,360 | | 70,923 | | 59,561 | | 42,289 | | 38,874 |
| a | | Based on average shares outstanding at each month end. |
| b | | Expense waivers and/or reimbursements amounted to less than .01%. |
| See notes to financial statements. |
18
| | | | | Year Ended December 31, | | |
| | |
| |
| |
|
| Service Shares | | 2008 | | 2007 | | 2006 | | 2005 | | 2004 |
| |
| |
| |
| |
| |
|
| Per Share Data ($): | | | | | | | | | | |
| Net asset value, beginning of period | | 23.06 | | 20.05 | | 16.39 | | 14.35 | | 11.95 |
| Investment Operations: | | | | | | | | | | |
| Investment income—neta | | .24 | | .22 | | .16 | | .22 | | .24 |
| Net realized and unrealized | | | | | | | | | | |
| gain (loss) on investments | | (9.66) | | 3.11 | | 3.61 | | 1.85 | | 2.63 |
| Total from Investment Operations | | (9.42) | | 3.33 | | 3.77 | | 2.07 | | 2.87 |
| Distributions: | | | | | | | | | | |
| Dividends from investment income—net | | (.29) | | (.32) | | (.11) | | (.03) | | (.47) |
| Dividends from net realized | | | | | | | | | | |
| gain on investments | | (.63) | | — | | — | | — | | — |
| Total Distributions | | (.92) | | (.32) | | (.11) | | (.03) | | (.47) |
| Net asset value, end of period | | 12.72 | | 23.06 | | 20.05 | | 16.39 | | 14.35 |
| |
| |
| |
| |
| |
|
| Total Return (%) | | (42.36) | | 16.84 | | 23.06 | | 14.45 | | 24.20 |
| |
| |
| |
| |
| |
|
| Ratios/Supplemental Data (%): | | | | | | | | | | |
| Ratio of total expenses | | | | | | | | | | |
| to average net assets | | 1.35 | | 1.28 | | 1.28 | | 1.34 | | 1.29 |
| Ratio of net expenses | | | | | | | | | | |
| to average net assets | | 1.34 | | 1.23 | | 1.21 | | 1.33 | | 1.29b |
| Ratio of net investment income | | | | | | | | | | |
| to average net assets | | 1.33 | | 1.02 | | .90 | | 1.50 | | 1.89 |
| Portfolio Turnover Rate | | 99.61 | | 113.77 | | 98.92 | | 92.82 | | 96.55 |
| |
| |
| |
| |
| |
|
| Net Assets, end of period ($ x 1,000) | | 11,639 | | 18,607 | | 9,716 | | 5,870 | | 4,265 |
| a | | Based on average shares outstanding at each month end. |
| b | | Expense waivers and/or reimbursements amounted to less than .01%. |
| See notes to financial statements. |
The Portfolio 19
NOTES TO FINANCIAL STATEMENTS
NOTE 1—Significant Accounting Policies:
Dreyfus Variable Investment Fund (the “fund”) is registered under the Investment Company Act of 1940, as amended (the “Act”), as an open-end management investment company, operating as a series company currently offering seven series, including the International Equity Portfolio (the “portfolio”).The portfolio is only offered to separate accounts established by insurance companies to fund variable annuity contracts and variable life insurance policies.The portfolio is a non-diversified series.The portfolio’s investment objective is to maximize capital growth. The Dreyfus Corporation (the “Manager” or “Dreyfus”), a wholly-owned subsidiary of The Bank of New York Mellon Corporation (“BNY Mellon”), serves as the portfolio’s investment adviser. Newton Capital Management Limited (“Newton”) is the portfolio’s sub-investment adviser. Newton is also a wholly-owned subsidiary of BNY Mellon, and an affiliate of Dreyfus.
Effective July 1,2008,BNY Mellon reorganized and consolidated a number of its banking and trust company subsidiaries.As a result of the reorganization, any services previously provided to the portfolio by Mellon Bank, N.A. or Mellon Trust of New England, N.A. are now provided by The Bank of NewYork Mellon (formerly,The Bank of NewYork).
MBSC Securities Corporation (the “Distributor”), a wholly-owned subsidiary of Dreyfus, is the distributor of the portfolio’s shares, which are sold without a sales charge.The portfolio is authorized to issue an unlimited number of $.001 par value shares of Beneficial Interest in each of the following classes of shares: Initial and Service. Each class of shares has identical rights and privileges, except with respect to the distribution plan and the expenses borne by each class, the allocation of certain transfer agency costs and certain voting rights. Income, expenses (other than expenses attributable to a specific class), and realized and unrealized gains or losses on investments are allocated to each class of shares based on its relative net assets.
20
The fund accounts separately for the assets, liabilities and operations of each series. Expenses directly attributable to each series are charged to that series’ operations; expenses which are applicable to all series are allocated among them on a pro rata basis.
The portfolio’s financial statements are prepared in accordance with U.S. generally accepted accounting principles, which may require the use of management estimates and assumptions.Actual results could differ from those estimates.
The fund enters into contracts that contain a variety of indemnifica-tions.The portfolio’s maximum exposure under these arrangements is unknown. The portfolio does not anticipate recognizing any loss related to these arrangements.
(a) Portfolio valuation: Investments in securities are valued at the last sales price on the securities exchange or national securities market on which such securities are primarily traded. Securities listed on the National Market System for which market quotations are available are valued at the official closing price or, if there is no official closing price that day, at the last sales price. Securities not listed on an exchange or the national securities market, or securities for which there were no transactions, are valued at the average of the most recent bid and asked prices, except for open short positions, where the asked price is used for valuation purposes. Bid price is used when no asked price is available. Registered investment companies that are not traded on an exchange are valued at their net asset value. When market quotations or official closing pri ces are not readily available, or are determined not to reflect accurately fair value, such as when the value of a security has been significantly affected by events after the close of the exchange or market on which the security is principally traded (for example, a foreign exchange or market), but before the portfolio calculates its net asset value, the
The Portfolio 21
| NOTES TO FINANCIAL STATEMENTS (continued) |
portfolio may value these investments at fair value as determined in accordance with the procedures approved by the Board of Trustees. Fair valuing of securities may be determined with the assistance of a pricing service using calculations based on indices of domestic securities and other appropriate indicators, such as prices of relevant ADRs and futures contracts. For other securities that are fair valued by the Board of Trustees, certain factors may be considered such as: fundamental analytical data, the nature and duration of restrictions on disposition, an evaluation of the forces that influence the market in which the securities are purchased and sold and public trading in similar securities of the issuer or comparable issuers. Financial futures are valued at the last sales price. Investments denominated in foreign currencies are translated to U.S. dollars at the prevailing rates of exchange. Forward currency exchange contracts are valued at the forward rate.
The portfolio adopted Statement of Financial Accounting Standards No. 157 “FairValue Measurements” (“FAS 157”). FAS 157 establishes an authoritative definition of fair value, sets out a framework for measuring fair value, and requires additional disclosures about fair value measurements.
Various inputs are used in determining the value of the portfolio’s investments relating to FAS 157.These inputs are summarized in the three broad levels listed below.
| | Level 1—quoted prices in active markets for identical securities.
Level 2—other significant observable inputs (including quoted
prices for similar securities, interest rates, prepayment speeds, credit
risk, etc.).
Level 3—significant unobservable inputs (including the portfolio’s
own assumptions in determining the fair value of investments). |
The inputs or methodology used for valuing securities are not necessarily an indication of the risk associated with investing in those securities.
22
The following is a summary of the inputs used as of December 31, 2008 in valuing the portfolio’s investments carried at fair value:
| | | Investments in | | Other Financial |
| Valuation Inputs | | Securities ($) | | Instruments ($)† |
| |
| |
|
| Level 1—Quoted Prices | | 30,250,248 | | 0 |
| Level 2—Other Significant | | | | |
| Observable Inputs | | 16,856,825 | | 342,865 |
| Level 3—Significant | | | | |
| Unobservable Inputs | | 0 | | 0 |
| Total | | 47,107,073 | | 342,865 |
| † | | Other financial instruments include derivative instruments such as futures, forward currency |
| | | exchange contracts and swap contracts, which are valued at the unrealized appreciation |
| | | (depreciation) on the instrument and written options contracts which are shown at value. |
(b) Foreign currency transactions: The portfolio does not isolate that portion of the results of operations resulting from changes in foreign exchange rates on investments from the fluctuations arising from changes in market prices of securities held. Such fluctuations are included with the net realized and unrealized gain or loss on investments.
Net realized foreign exchange gains or losses arise from sales and maturities of short-term securities, sales of foreign currencies, currency gains or losses realized on securities transactions and the difference between the amounts of dividends, interest and foreign withholding taxes recorded on the portfolio’s books and the U.S. dollar equivalent of the amounts actually received or paid. Net unrealized foreign exchange gains or losses arise from changes in the value of assets and liabilities other than investments in securities, resulting from changes in exchange rates. Such gains and losses are included with net realized and unrealized gain or loss on investments.
(c) Securities transactions and investment income: Securities transactions are recorded on a trade date basis. Realized gains and losses from securities transactions are recorded on the identified cost basis.
The Portfolio 23
| NOTES TO FINANCIAL STATEMENTS (continued) |
Dividend income is recognized on the ex-dividend date and interest income, including, where applicable, accretion of discount and amortization of premium on investments, is recognized on the accrual basis.
The portfolio has arrangements with the custodian and cash management banks whereby the portfolio may receive earnings credits when positive cash balances are maintained, which are used to offset custody and cash management fees. For financial reporting purposes, the portfolio includes net earnings credits as an expense offset in the Statement of Operations.
Investing in foreign markets may involve special risks and considerations not typically associated with investing in the U.S. These risks include revaluation of currencies, high rates of inflation, repatriation restrictions on income and capital, and adverse political and economic developments. Moreover, securities issued in these markets may be less liquid, subject to government ownership controls, delayed settlements, and their prices may be more volatile than those of comparable securities in the U.S.
(d) Dividends to shareholders: Dividends are recorded on the ex-dividend date. Dividends from investment income-net and dividends from net realized capital gains, if any, are normally declared and paid annually, but the portfolio may make distributions on a more frequent basis to comply with the distribution requirements of the Internal Revenue Code of 1986, as amended (the “Code”).To the extent that net realized capital gains can be offset by capital loss carryovers, it is the policy of the portfolio not to distribute such gains. Income and capital gain distributions are determined in accordance with income tax regulations, which may differ from U.S. generally accepted accounting principles.
(e) Federal income taxes: It is the policy of the portfolio to continue to qualify as a regulated investment company, if such qualification is in the best interests of its shareholders, by complying with the applicable provisions of the Code, and to make distributions of taxable income sufficient to relieve it from substantially all federal income and excise taxes.
24
As of and during the period ended December 31, 2008, the portfolio did not have any liabilities for any unrecognized tax positions. The portfolio recognizes interest and penalties, if any, related to unrecognized tax positions as income tax expense in the Statement of Operations. During the period, the portfolio did not incur any interest or penalties.
Each of the tax years in the four-year period ended December 31, 2008 remains subject to examination by the Internal Revenue Service and state taxing authorities.
At December 31, 2008, the components of accumulated earnings on a tax basis were as follows: undistributed ordinary income $2,002,791 accumulated capital losses $8,146,593 and unrealized depreciation $12,620,857. In addition, the portfolio had $4,711,278 of capital losses realized after October 31, 2008, which were deferred for tax purposes to the first day of the following fiscal year.
The accumulated capital loss carryover is available for federal income tax purposes to be applied against future net securities profits, if any, realized subsequent to December 31, 2008. If not applied, the carryover expires in fiscal 2016.
The tax character of distributions paid to shareholders during the fiscal periods ended December 31, 2008 and December 31, 2007 were as follows: ordinary income $1,279,244 and $1,251,278, and long-term capital gains $2,417,928 and $0, respectively.
During the period ended December 31, 2008, as a result of permanent book to tax differences, primarily due to the tax treatment for foreign currency exchange gains and losses, dividend reclassification and passive foreign investment companies, the portfolio increased accumulated undistributed investment income-net by $781,969 and decreased accumulated net realized gain (loss) on investments by the same amount. Net assets and net asset value per share were not affected by this reclassification.
The Portfolio 25
| NOTES TO FINANCIAL STATEMENTS (continued) |
NOTE 2—Bank Lines of Credit:
Prior to October 15, 2008, the portfolio participated with other Dreyfus-managed funds in a $350 million redemption credit facility. Effective October 15, 2008, the portfolio participates with other Dreyfus-managed funds in a $145 million redemption credit facility (the “Facility”) to be utilized for temporary or emergency purposes, including the financing of redemptions. In connection therewith, the portfolio has agreed to pay commitment fees on its pro rata portion of the Facility. Interest is charged to the portfolio based on prevailing market rates in effect at the time of borrowing. During the period ended December 31, 2008, the portfolio did not borrow under either Facility.
NOTE 3—Investment Advisory Fee, Sub-Investment Advisory Fee and Other Transactions with Affiliates:
(a) Pursuant to an Investment Advisory Agreement with Dreyfus, the investment advisory fee is computed at the annual rate of .75% of the value of the portfolio’s average daily net assets and is payable monthly.
Pursuant to a Sub-Investment Advisory Agreement between Dreyfus and Newton, the sub-investment advisory fee is payable monthly by Dreyfus, and is based upon the value of the portfolio’s average daily net assets, computed at the following annual rates:
| Average Net Assets | | |
| 0 to $100 million | | .35% |
| $100 million to $1 billion | | .30% |
| $1 billion to $1.5 billion | | .26% |
| In excess of $1.5 billion | | .20% |
(b) Under the Distribution Plan (the “Plan”) adopted pursuant to Rule 12b-1 under the Act, Service shares pay the Distributor for distributing their shares, for servicing and/or maintaining Service shares shareholder accounts and for advertising and marketing for Service shares.The Plan provides for payments to be made at an annual rate of .25% of the value of Service shares’ average daily net assets. The Distributor may make payments to Participating Insurance Companies
26
and to brokers and dealers acting as principal underwriter for their variable insurance products. The fees payable under the Plan are payable without regard to actual expenses incurred. During the period ended December 31, 2008, Service shares were charged $40,149 pursuant to the Plan.
The portfolio compensates Dreyfus Transfer, Inc., a wholly-owned subsidiary of Dreyfus, under a transfer agency agreement for providing personnel and facilities to perform transfer agency services for the portfolio. During the period ended December 31, 2008, the portfolio was charged $234 pursuant to the transfer agency agreement.
The portfolio compensates The Bank of New York Mellon, a subsidiary of BNY Mellon and an affiliate of Dreyfus, under a cash management agreement for performing cash management services related to portfolio subscriptions and redemptions. During the period ended December 31, 2008, the portfolio was charged $30 pursuant to the cash management agreement.
The portfolio compensates The Bank of New York Mellon under a custody agreement for providing custodial services for the portfolio. During the period ended December 31, 2008, the portfolio was charged $154,032 pursuant to the custody agreement.
During the period ended December 31, 2008, the portfolio was charged $5,403 for services performed by the Chief Compliance Officer.
The components of “Due to The Dreyfus Corporation and affiliates” in the Statement of Assets and Liabilities consist of: investment advisory fees $29,994, Rule 12b-1 distribution plan fees $2,378, custodian fees $36,749, chief compliance officer fees $1,197 and transfer agency per account fees $44.
(c) Each Board member also serves as a Board member of other funds within the Dreyfus complex. Annual retainer fees and attendance fees are allocated to each fund based on net assets.
The Portfolio 27
| NOTES TO FINANCIAL STATEMENTS (continued) |
NOTE 4—Securities Transactions:
The aggregate amount of purchases and sales of investment securities, excluding short-term securities, options and forward currency exchange contracts, during the period ended December 31, 2008, amounted to $72,680,920 and $72,804,957, respectively.
The portfolio enters into forward currency exchange contracts in order to hedge its exposure to changes in foreign currency exchange rates on its foreign portfolio holdings and to settle foreign currency transactions. When executing forward currency exchange contracts, the portfolio is obligated to buy or sell a foreign currency at a specified rate on a certain date in the future. With respect to sales of forward currency exchange contracts, the portfolio would incur a loss if the value of the contract increases between the date the forward contract is opened and the date the forward contract is closed.The portfolio realizes a gain if the value of the contract decreases between those dates.With respect to purchases of forward currency exchange contracts, the portfolio would incur a loss if the value of the contract decreases between the date the forward contract is opened and the date the forward contract is closed. The portfolio realizes a gain if the value of the contract increases between those dates.The portfolio is also exposed to credit risk associated with counterparty nonperformance on these forward currency exchange contracts which is typically limited to the unrealized gain on each open contract.The following summarizes open forward currency exchange contracts at December 31, 2008:
| | | Foreign | | | | | | Unrealized |
| Forward Currency | | Currency | | | | | | Appreciation |
| Exchange Contracts | | Amounts | | Cost ($) | | Value ($) | | (Depreciation) ($) |
| |
| |
| |
| |
|
| Purchases: | | | | | | | | |
| British Pound, | | | | | | | | |
| expiring 1/2/2009 | | 60,878 | | 88,493 | | 87,528 | | (965) |
| British Pound, | | | | | | | | |
| expiring 1/5/2009 | | 119,313 | | 172,932 | | 171,543 | | (1,389) |
| Euro, | | | | | | | | |
| expiring 6/15/2009 | | 684,523 | | 962,030 | | 947,152 | | (14,878) |
| Euro, | | | | | | | | |
| expiring 6/15/2009 | | 665,898 | | 935,855 | | 921,381 | | (14,474) |
28
| | | Foreign | | | | | | Unrealized |
| Forward Currency | | Currency | | | | | | Appreciation |
| Exchange Contracts | | Amounts | | Cost ($) | | Value ($) | | (Depreciation) ($) |
| |
| |
| |
| |
|
| Purchases (continued): | | | | | | | | |
| Euro, | | | | | | | | |
| expiring 7/15/2009 | | 684,570 | | 966,000 | | 946,751 | | (19,249) |
| Japanese Yen, | | | | | | | | |
| expiring 3/13/2009 | | 115,855,524 | | 1,076,974 | | 1,279,984 | | 203,010 |
| Japanese Yen, | | | | | | | | |
| expiring 3/13/2009 | | 40,617,579 | | 443,961 | | 448,747 | | 4,786 |
| Sales: | | | | Proceeds ($) | | | | |
| British Pound, | | | | | | | | |
| expiring 3/13/2009 | | 637,000 | | 1,076,974 | | 914,446 | | 162,528 |
| British Pound, | | | | | | | | |
| expiring 3/13/2009 | | 298,000 | | 443,961 | | 427,794 | | 16,167 |
| British Pound, | | | | | | | | |
| expiring 6/15/2009 | | 648,000 | | 935,855 | | 929,912 | | 5,943 |
| Euro, | | | | | | | | |
| expiring 1/5/2009 | | 24,438 | | 34,392 | | 33,971 | | 421 |
| Japanese Yen, | | | | | | | | |
| expiring 1/6/2009 | | 2,193,064 | | 24,373 | | 24,193 | | 180 |
| Japanese Yen, | | | | | | | | |
| expiring 1/7/2009 | | 4,651,723 | | 51,595 | | 51,315 | | 280 |
| Swiss Franc, | | | | | | | | |
| expiring 6/15/2009 | | 1,020,000 | | 962,030 | | 961,525 | | 505 |
| Total | | | | | | | | 342,865 |
The portfolio may purchase and write (sell) put and call options in order to gain exposure to or to protect against changes in the market.
As a writer of call options, the portfolio receives a premium at the outset and then bears the market risk of unfavorable changes in the price of the financial instrument underlying the option. Generally, the portfolio would incur a gain, to the extent of the premium, if the price of the underlying financial instrument decreases between the date the option is written and the date on which the option is terminated. Generally, the portfolio would realize a loss, if the price of the financial instrument increases between those dates. At December 31, 2008, there were no call options written outstanding.
The Portfolio 29
| NOTES TO FINANCIAL STATEMENTS (continued) |
As a writer of put options, the portfolio receives a premium at the outset and then bears the market risk of unfavorable changes in the price of the financial instrument underlying the option. Generally, the portfolio would incur a gain, to the extent of the premium, if the price of the underlying financial instrument increases between the date the option is written and the date on which the option is terminated. Generally, the portfolio would realize a loss, if the price of the financial instrument decreases between those dates. At December 31, 2008, there were no put options written outstanding.
At December 31, 2008, the cost of investments for federal income tax purposes was $59,695,796; accordingly, accumulated net unrealized depreciation on investments was $12,588,723, consisting of $2,656,753 gross unrealized appreciation and $15,245,476 gross unrealized depreciation.
In March 2008, the Financial Accounting Standards Board released Statement of Financial Accounting Standards No. 161, “Disclosures about Derivative Instruments and Hedging Activities” (“FAS 161”). FAS 161 requires qualitative disclosures about objectives and strategies for using derivatives, quantitative disclosures about fair value amounts of gains and losses on derivative instruments, and disclosures about credit-risk-related contingent features in derivative agreements. The application of FAS 161 is required for fiscal years and interim periods beginning after November 15, 2008.At this time, management is evaluating the implications of FAS 161 and its impact on the financial statements and the accompanying notes has not yet been determined.
30
REPORT OF INDEPENDENT REGISTERED
PUBLIC ACCOUNTING FIRM |
Shareholders and Board of Trustees
Dreyfus Variable Investment Fund, International Equity Portfolio
We have audited the accompanying statement of assets and liabilities, including the statement of investments, of Dreyfus Variable Investment Fund, International Equity Portfolio (one of the series comprising Dreyfus Variable Investment Fund) as of December 31, 2008, and the related statement of operations for the year then ended, the statement of changes in net assets for each of the two years in the period then ended, and financial highlights for each of the years indicated therein. These financial statements and financial highlights are the responsibility of the Fund’s management. Our responsibility is to express an opinion on these financial statements and financial highlights based on our audits.
We conducted our audits in accordance with the standards of the Public Company Accounting Oversight Board (United States).Those standards require that we plan and perform the audit to obtain reasonable assurance about whether the financial statements and financial highlights are free of material misstatement.We were not engaged to perform an audit of the Fund’s internal control over financial reporting. Our audits included consideration of internal control over financial reporting as a basis for designing audit procedures that are appropriate in the circumstances, but not for the purpose of expressing an opinion on the effectiveness of the Fund’s internal control over financial reporting. Accordingly, we express no such opinion. An audit also includes examining, on a test basis, evidence supporting the amounts and disclosures in the financial statements and financial highlights, assessing the accounting principles used and signific ant estimates made by management, and evaluating the overall financial statement presentation. Our procedures included confirmation of securities owned as of December 31, 2008 by correspondence with the custodian and others.We believe that our audits provide a reasonable basis for our opinion.
In our opinion, the financial statements and financial highlights referred to above present fairly, in all material respects, the financial position of Dreyfus Variable Investment Fund, International Equity Portfolio at December 31, 2008, the results of its operations for the year then ended, the changes in its net assets for each of the two years in the period then ended, and the financial highlights for each of the indicated years, in conformity with U.S. generally accepted accounting principles.

New York, New York
February 10, 2009 |
The Portfolio 31
IMPORTANT TAX INFORMATION (Unaudited)
In accordance with federal tax law, the portfolio elects to provide each shareholder with their portion of the portfolio’s foreign taxes paid and the income sourced from foreign countries.Accordingly, the portfolio hereby makes the following designations regarding its fiscal year ended December 31, 2008:
—the total amount of taxes paid to foreign countries was $165,872.
—the total amount of income sourced from foreign countries was $1,563,090.
As required by federal tax law rules, shareholders will receive notification of their proportionate share of foreign taxes paid and foreign sourced income for the 2008 calendar year with Form 1099-DIV which will be mailed by January 31, 2009.
Also, the portfolio hereby designates $.6260 per share as a long-term capital gain distribution paid on March 31, 2008.
32
BOARD MEMBERS INFORMATION (Unaudited)

The Portfolio 33
BOARD MEMBERS INFORMATION (Unaudited) (continued)
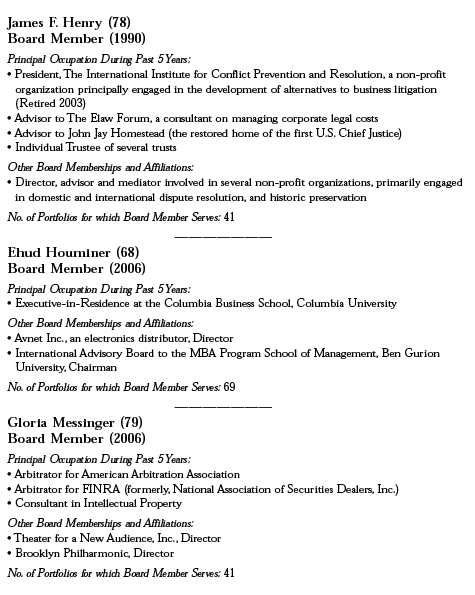
34

The Portfolio 35
OFFICERS OF THE FUND (Unaudited)
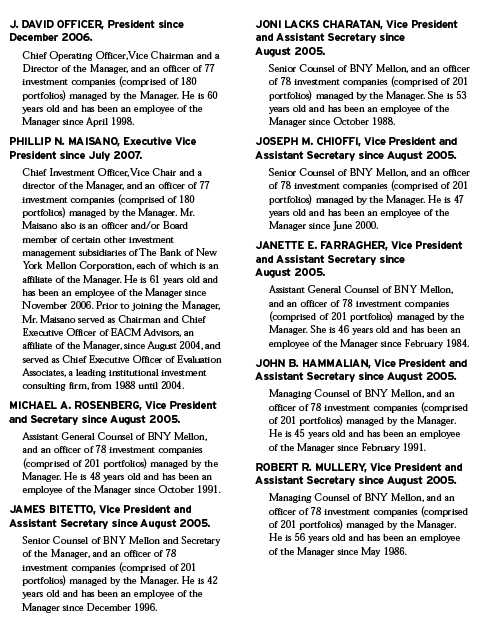
36

The Portfolio 37
For More Information
Telephone 1-800-554-4611 or 516-338-3300
Mail The Dreyfus Family of Funds, 144 Glenn Curtiss Boulevard, Uniondale, NY 11556-0144 Attn: Investments Division
The portfolio files its complete schedule of portfolio holdings with the Securities and Exchange Commission (“SEC”) for the first and third quarters of each fiscal year on Form N-Q. The portfolio’s Forms N-Q are available on the SEC’s website at http://www.sec.gov and may be reviewed and copied at the SEC’s Public Reference Room in Washington, DC. Information on the operation of the Public Reference Room may be obtained by calling 1-800-SEC-0330.
A description of the policies and procedures that the portfolio uses to determine how to vote proxies relating to portfolio securities, and information regarding how the portfolio voted these proxies for the 12-month period ended June 30, 2008, is available at http://www.dreyfus.com and on the SEC’s website at http://www.sec.gov. The description of the policies and procedures is also available without charge, upon request, by calling 1-800-645-6561.

| © 2009 MBSC Securities Corporation |
| | Dreyfus Variable
Investment Fund,
International Value
Portfolio |
| | ANNUAL REPORT December 31, 2008 |

The views expressed in this report reflect those of the portfolio manager only through the end of the period covered and do not necessarily represent the views of Dreyfus or any other person in the Dreyfus organization.Any such views are subject to change at any time based upon market or other conditions and Dreyfus disclaims any responsibility to update such views. These views may not be relied on as investment advice and, because investment decisions for a Dreyfus portfolio are based on numerous factors, may not be relied on as an indication of trading intent on behalf of any Dreyfus portfolio.
| | Contents |
| |
| | THE PORTFOLIO |
| |
| 2 | A Letter from the CEO |
| |
| 3 | Discussion of Performance |
| |
| 6 | Portfolio Performance |
| |
| 8 | Understanding Your Portfolio’s Expenses |
| |
| 8 | Comparing Your Portfolio’s Expenses With Those of Other Funds |
| |
| 9 | Statement of Investments |
| |
| 15 | Statement of Assets and Liabilities |
| |
| 16 | Statement of Operations |
| |
| 17 | Statement of Changes in Net Assets |
| |
| 19 | Financial Highlights |
| |
| 21 | Notes to Financial Statements |
| |
| 31 | Report of Independent Registered Public Accounting Firm |
| |
| 32 | Important Tax Information |
| |
| 33 | Board Members Information |
| |
| 36 | Officers of the Fund |
| |
| | FOR MORE INFORMATION |
| |
| | Back Cover |
| |
Dreyfus Variable Investment Fund,
International Value Portfolio |
The Portfolio

A LETTER FROM THE CEO
Dear Shareholder: |
We present to you this annual report for Dreyfus Variable Investment Fund, International Value Portfolio, covering the 12-month period from January 1, 2008, through December 31, 2008.
2008 was the most difficult year in decades for the world’s financial markets. A credit crunch that began in 2007 in the U.S. sub-prime mortgage market exploded in mid-2008 into a global financial crisis, resulting in the failures of major financial institutions, a deep and prolonged recession and lower investment values across a broad range of asset classes. Governments and regulators throughout the world moved aggressively to curtail the damage, implementing unprecedented reductions of short-term interest rates, massive injections of liquidity into the banking system, government bailouts of struggling companies and plans for massive economic stimulus programs. After several years of strong relative returns, international stocks generally declined more sharply than their U.S. counterparts.
Although we expect the U.S. and global economies to remain weak until longstanding imbalances have worked their way out of the system, the financial markets currently appear to have priced in investors’ generally low expectations. In previous recessions, however, the markets have tended to anticipate economic improvement before it occurs, potentially leading to major rallies when few expected them. That’s why it makes sense to remain disciplined, maintain a long-term perspective and adopt a consistent asset allocation strategy that reflects one’s future goals and attitudes toward risk.As always, we urge you to consult with your financial advisor, who can recommend the course of action that is right for you.
For information about how the portfolio performed during the reporting period, as well as market perspectives, we have provided a Discussion of Performance given by the Portfolio Manager.
Thank you for your continued confidence and support.

Jonathan R. Baum
Chief Executive Officer
The Dreyfus Corporation
January 15, 2009 |
2

DISCUSSION OF PERFORMANCE
For the period of January 1, 2008, through December 31, 2008, as provided by D. Kirk Henry, Senior Portfolio Manager
Portfolio and Market Performance Overview
For the 12-month period ended December 31, 2008, Dreyfus Variable Investment Fund, InternationalValue Portfolio’s Initial shares produced a total return of –37.32%, and its Service shares produced a total return of –37.48% .1 This compares with a –43.38% return for the portfolio’s benchmark, the Morgan Stanley Capital International Europe, Australasia, Far East Index (“MSCI EAFE Index”), for the same period.2
International equities fell sharply in 2008, particularly during the second half of the year, due to a global economic slowdown and an intensifying financial crisis. While we are never satisfied with negative absolute returns, especially of this magnitude, we nonetheless are pleased that the portfolio produced higher returns than its benchmark, largely due to the success of our stock selection strategy, including limited exposure to materials stocks that declined sharply along with commodity prices.
The Portfolio’s Investment Approach
The portfolio seeks long-term capital growth by investing in stocks of foreign companies that we consider to be value companies.The portfolio may invest in companies of any size, and may also invest in companies located in emerging markets. Our investment approach is value-oriented and research-driven. When selecting stocks, we conduct extensive quantitative and fundamental research that emphasizes individual stock selection rather than economic and industry trends.We focus on how a stock is valued relative to its intrinsic worth, the company’s underlying business health as measured by return on assets and return on equity, and the presence of a catalyst that may trigger an increase in the stock price.
International Equities Tumbled in Global Economic Downturn
International equities lost substantial value during 2008 as investor sentiment was depressed by intensifying economic concerns and a global financial crisis. Rising unemployment and plummeting housing prices in
The Portfolio 3
| DISCUSSION OF PERFORMANCE (continued) |
many international markets led to recessionary economic conditions in many parts of the world, dampening consumer spending and business investment. At the same time, the effects of the financial crisis were particularly severe among European banks, which reported massive write-downs among assets tied to troubled U.S. housing markets. As a result of these developments, all countries and market sectors tracked by the MSCI EAFE Index posted negative double-digit absolute returns during 2008, a testament to the depth and breadth of the bear market.
In many ways, the portfolio’s performance during the two halves of the year stood in stark contrast to each other.The portfolio lagged its benchmark during the first half of the reporting period due to its underweighted exposure to industrial and basic materials stocks. However, that same positioning was one of the primary drivers of the portfolio’s above-average results over the second half. As commodities markets slumped, we found better opportunities in the materials area through chemical and paper stocks, industries we have considered undervalued for some time.The portfolio also benefited from several of its energy holdings, including France’s Total, the United Kingdom’s BP and Netherlands-based Royal Dutch Shell, where we established positions before oil prices peaked and subsequently trimmed those holdings when oil prices began to fall.
Other areas of strong relative performance included an underweight position in European banks. Instead, we focused on some of the better-performing Japanese financial institutions that remained focused on the country’s domestic economy. Tokyo Gas and Central Japan Railways also bolstered relative performance, as did relatively limited exposure to Japanese exporters that were hurt when the yen rallied against the U.S. dollar and euro.
On the other hand, the portfolio’s stock selections in the consumer discretionary area generally disappointed. Holdings in auto makers Nissan Motor and Bayerische Motoren Werke (BMW) were adversely affected by a slowdown in U.S. sales. Although Volkswagen held up somewhat better, the portfolio had refrained from establishing a position in the stock due to valuation concerns.The uncertain economic environment also undermined U.K. consumer and media stocks, including Punch
4
Taverns, a pub operator, and Trinity Mirror, the region’s largest newspaper publisher. Trinity Mirror was sold during the reporting period. Finally, in the emerging markets, the portfolio was hurt by its exposure to Russian oil giant Gazprom and certain technology stocks in Taiwan.
Seeking to Protect Capital in a Turbulent Market
As 2009 begins, it is clear to us that global economic conditions have deteriorated and may not rebound as quickly as in previous market downturns. While government officials and monetary authorities across the globe have taken steps to ward off a more serious recession and possible deflation, market valuations currently reflect expectations of dismal business conditions. In this challenging environment, we have focused our efforts on cushioning declines for shareholders through investments in companies that, in our judgment, have solid capital structures, positive cash flows, the flexibility to reduce costs, and the ability to deliver earnings growth during economic expansions. In our judgment, stocks with these characteristics are likely to lead the international markets higher in an eventual rebound.
January 15, 2009
Investing in foreign companies involves special risks, including changes in currency rates, political, economic and social instability, a lack of comprehensive company information, differing auditing and legal standards and less market liquidity. An investment in this fund should be considered only as a supplement to an overall investment program.
The portfolio is only available as a funding vehicle under variable life insurance policies or variable annuity contracts issued by insurance companies. Individuals may not purchase shares of the portfolio directly. A variable annuity is an insurance contract issued by an insurance company that enables investors to accumulate assets on a tax-deferred basis for retirement or other long-term goals.The investment objective and policies of Dreyfus Variable Investment Fund, International Value Portfolio made available through insurance products may be similar to other funds/portfolios managed or advised by Dreyfus. However, the investment results of the portfolio may be higher or lower than, and may not be comparable to, those of any other Dreyfus fund/portfolio.
| 1 | | Total return includes reinvestment of dividends and any capital gains paid. Past performance is no |
| | | guarantee of future results. Share price and investment return fluctuate such that upon redemption, |
| | | portfolio shares may be worth more or less than their original cost.The portfolio’s performance does |
| | | not reflect the deduction of additional charges and expenses imposed in connection with investing |
| | | in variable insurance contracts, which will reduce returns. |
| 2 | | SOURCE: LIPPER INC. — Reflects reinvestment of net dividends and, where applicable, |
| | | capital gain distributions.The Morgan Stanley Capital International Europe, Australasia, Far |
| | | East (MSCI EAFE) Index is an unmanaged index composed of a sample of companies |
| | | representative of the market structure of European and Pacific Basin countries. |
The Portfolio 5
PORTFOLIO PERFORMANCE
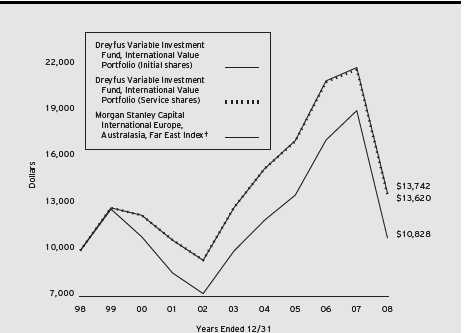
Comparison of change in value of $10,000 investment in Dreyfus Variable Investment Fund, International Value Portfolio Initial shares and Service shares and the Morgan Stanley Capital International Europe, Australasia, Far East Index
| Average Annual Total Returns as of 12/31/08 | | | | |
| | | 1 Year | | 5 Years | | 10 Years |
| |
| |
| |
|
| Initial shares | | (37.32)% | | 1.45% | | 3.23% |
| Service shares | | (37.48)% | | 1.25% | | 3.14% |
The data for Service shares includes the results of Initial shares for the period prior to December 31, 2000 (inception date of Service shares). Actual Service shares’ average annual total return and hypothetical growth results would have been lower. See notes below.
† Source: Lipper Inc.
Past performance is not predictive of future performance.The portfolio’s performance shown in the graph and table does not reflect the deduction of taxes that a shareholder would pay on portfolio distributions or the redemption of portfolio shares.
The portfolio’s performance does not reflect the deduction of additional charges and expenses imposed in connection with investing in variable insurance contracts which will reduce returns.
The above graph compares a $10,000 investment made in Initial and Service shares of Dreyfus Variable Investment Fund, International Value Portfolio on 12/31/98 to a $10,000 investment made in the Morgan Stanley Capital International Europe, Australasia, Far East Index (the “Index”) on that date.
6
The portfolio’s Initial shares are not subject to a Rule 12b-1 fee.The portfolio’s Service shares are subject to a 0.25% annual Rule 12b-1 fee.The performance figures for Service shares reflect the performance of the portfolio’s Initial shares from their inception date through December 30, 2000, and the performance of the portfolio’s Service shares from December 31, 2000 (inception date of Service shares) to December 31, 2008 (blended performance figures).The performance figures for each share class reflect certain expense reimbursements, without which the performance of each share class would have been lower. In addition, the blended performance figures have not been adjusted to reflect the higher operating expenses of the Service shares. If these expenses had been reflected, the blended performance figures would have been lower. All dividends and capital gain distributions are reinvested.
The portfolio’s performance shown in the line graph takes into account all applicable portfolio fees and expenses (after any expense reimbursements).The Index is an unmanaged index composed of a sample of companies representative of the market structure of European and Pacific Basin countries and includes net dividends reinvested. Unlike a mutual fund, the Index is not subject to charges, fees and other expenses. Investors cannot invest directly in any index. Further information relating to portfolio performance, including expense reimbursements, if applicable, is contained in the Financial Highlights section of the prospectus and elsewhere in this report.
The Portfolio 7
UNDERSTANDING YOUR
PORTFOLIO’S EXPENSES (Unaudited) |
As a mutual fund investor, you pay ongoing expenses, such as management fees and other expenses. Using the information below, you can estimate how these expenses affect your investment and compare them with the expenses of other funds.You also may pay one-time transaction expenses, including sales charges (loads) and redemption fees,which are not shown in this section and would have resulted in higher total expenses. For more information, see your portfolio’s prospectus or talk to your financial adviser.
Review your portfolio’s expenses
The table below shows the expenses you would have paid on a $1,000 investment in Dreyfus Variable Investment Fund, International Value Portfolio from July 1, 2008 to December 31, 2008. It also shows how much a $1,000 investment would be worth at the close of the period, assuming actual returns and expenses.
| | Expenses and Value of a $1,000 Investment
assuming actual returns for the six months ended December 31, 2008 |
| | | Initial Shares | | Service Shares |
| |
| |
|
| Expenses paid per $1,000† | | $ 5.45 | | $ 6.53 |
| Ending value (after expenses) | | $721.70 | | $720.60 |
| | COMPARING YOUR PORTFOLIO’S EXPENSES
WITH THOSE OF OTHER FUNDS (Unaudited) |
Using the SEC’s method to compare expenses
The Securities and Exchange Commission (SEC) has established guidelines to help investors assess fund expenses. Per these guidelines, the table below shows your portfolio’s expenses based on a $1,000 investment, assuming a hypothetical 5% annualized return. You can use this information to compare the ongoing expenses (but not transaction expenses or total cost) of investing in the portfolio with those of other funds. All mutual fund shareholder reports will provide this information to help you make this comparison. Please note that you cannot use this information to estimate your actual ending account balance and expenses paid during the period.
| | Expenses and Value of a $1,000 Investment
assuming a hypothetical 5% annualized return for the six months ended December 31, 2008 |
| | | Initial Shares | | Service Shares |
| |
| |
|
| Expenses paid per $1,000† | | $ 6.39 | | $ 7.66 |
| Ending value (after expenses) | | $1,018.80 | | $1,017.55 |
| † Expenses are equal to the portfolio’s annualized expense ratio of 1.26% for Initial shares and 1.51% for Service shares, |
| multiplied by the average account value over the period, multiplied by 184/366 (to reflect the one-half year period). |
8
STATEMENT OF INVESTMENTS
December 31, 2008 |
| Common Stocks—94.9% | | Shares | | Value ($) |
| |
| |
|
| Australia—1.8% | | | | |
| Amcor | | 160,840 | | 653,711 |
| Insurance Australia Group | | 130,021 | | 354,721 |
| National Australia Bank | | 38,201 | | 560,038 |
| OZ Minerals | | 322,796 | | 123,779 |
| | | | | 1,692,249 |
| Belgium—.2% | | | | |
| Delhaize Group | | 2,560 | | 157,286 |
| Brazil—.9% | | | | |
| Petroleo Brasileiro, ADR | | 16,850 | | 412,657 |
| Tele Norte Leste Participacoes, ADR | | 27,080 | | 376,954 |
| | | | | 789,611 |
| China—.5% | | | | |
| PetroChina, ADR | | 5,070 | | 451,129 |
| Finland—2.8% | | | | |
| Nokia | | 110,140 | | 1,699,408 |
| UPM-Kymmene | | 68,788 | | 860,567 |
| | | | | 2,559,975 |
| France—10.4% | | | | |
| BNP Paribas | | 10,130 | | 425,956 |
| Cap Gemini | | 7,800 | | 298,165 |
| Carrefour | | 20,970 | | 802,188 |
| Credit Agricole | | 69,567 | | 773,611 |
| France Telecom | | 25,589 | | 709,976 |
| Lagardere | | 9,440 | | 380,539 |
| PPR | | 2,520 | | 163,236 |
| Sanofi-Aventis | | 50,220 | | 3,169,291 |
| Total | | 44,500 | | 2,406,860 |
| Vivendi | | 11,410 | | 368,993 |
| | | | | 9,498,815 |
| Germany—8.7% | | | | |
| Allianz | | 5,890 | | 614,053 |
| Bayerische Motoren Werke | | 24,500 | | 735,954 |
| Daimler | | 14,994 | | 556,491 |
The Portfolio 9
| STATEMENT OF INVESTMENTS (continued) |
| Common Stocks (continued) | | Shares | | Value ($) |
| |
| |
|
| Germany (continued) | | | | |
| Deutsche Post | | 59,260 | | 981,077 |
| Deutsche Telekom | | 35,570 | | 531,523 |
| E.ON | | 28,570 | | 1,129,456 |
| MTU Aero Engines Holding | | 31,310 | | 852,168 |
| Muenchener Rueckversicherungs | | 8,570 | | 1,322,310 |
| RWE | | 9,797 | | 867,485 |
| Siemens | | 4,370 | | 320,005 |
| | | | | 7,910,522 |
| Greece—2.4% | | | | |
| Coca-Cola Hellenic Bottling | | 44,540 | | 643,892 |
| Public Power | | 95,960 | | 1,539,308 |
| | | | | 2,183,200 |
| Hong Kong—2.8% | | | | |
| BOC Hong Kong Holdings | | 947,000 | | 1,080,985 |
| China Mobile, ADR | | 8,020 | | 407,817 |
| Hutchison Whampoa | | 97,900 | | 493,837 |
| Johnson Electric Holdings | | 1,015,500 | | 172,235 |
| Yue Yuen Industrial Holdings | | 189,000 | | 374,526 |
| | | | | 2,529,400 |
| Italy—3.9% | | | | |
| Banco Popolare | | 49,630 | | 341,491 |
| ENI | | 25,925 | | 603,259 |
| Finmeccanica | | 63,986 | | 968,595 |
| Mediaset | | 133,910 | | 754,337 |
| UniCredit | | 164,010 | | 397,828 |
| Unipol Gruppo Finanziario | | 307,447 | | 463,692 |
| | | | | 3,529,202 |
| Japan—23.1% | | | | |
| Aeon | | 88,900 | | 890,444 |
| Astellas Pharma | | 9,400 | | 382,499 |
| Canon | | 14,759 | | 463,308 |
| Central Japan Railway | | 127 | | 1,097,645 |
| Chiyoda | | 87,700 | | 487,289 |
10
| Common Stocks (continued) | | Shares | | Value ($) |
| |
| |
|
| Japan (continued) | | | | |
| Chuo Mitsui Trust Holdings | | 154,700 | | 756,039 |
| Daiwa House Industry | | 84,000 | | 821,919 |
| Dentsu | | 203 | | 418,186 |
| JS Group | | 45,700 | | 707,449 |
| KDDI | | 155 | | 1,103,970 |
| Mediceo Paltac Holdings | | 38,800 | | 467,589 |
| Mitsubishi Chemical Holdings | | 160,000 | | 706,107 |
| Mitsubishi Rayon | | 139,000 | | 419,213 |
| Mitsubishi UFJ Financial Group | | 247,700 | | 1,536,960 |
| Murata Manufacturing | | 8,000 | | 313,599 |
| NGK Spark Plug | | 66,400 | | 532,150 |
| Nissan Motor | | 85,800 | | 310,768 |
| Nomura Holdings | | 96,900 | | 799,066 |
| Nomura Research Institute | | 21,000 | | 398,551 |
| Ricoh | | 42,700 | | 543,800 |
| Rohm | | 11,200 | | 565,549 |
| Sekisui Chemical | | 43,300 | | 270,459 |
| Sharp | | 48,000 | | 344,104 |
| Shimamura | | 6,100 | | 471,942 |
| Sumitomo | | 10,000 | | 88,132 |
| Sumitomo Mitsui Financial Group | | 380 | | 1,646,069 |
| Takashimaya | | 50,000 | | 378,707 |
| Takata | | 38,000 | | 268,308 |
| Takeda Pharmaceutical | | 11,400 | | 591,346 |
| THK | | 32,900 | | 345,714 |
| Tokyo Electron | | 13,500 | | 474,097 |
| Tokyo Gas | | 125,900 | | 637,995 |
| Toyota Motor | | 31,200 | | 1,021,264 |
| Yamaha Motor | | 47,200 | | 495,273 |
| Yamato Holdings | | 25,000 | | 325,982 |
| | | | | 21,081,492 |
| Malaysia—.6% | | | | |
| Malayan Banking | | 357,000 | | 529,574 |
The Portfolio 11
| STATEMENT OF INVESTMENTS (continued) |
| Common Stocks (continued) | | Shares | | Value ($) |
| |
| |
|
| Netherlands—3.0% | | | | |
| Aegon | | 46,164 | | 290,370 |
| Koninklijke DSM | | 18,340 | | 467,168 |
| Koninklijke Philips Electronics | | 21,110 | | 405,826 |
| Royal Dutch Shell, Cl. A | | 61,912 | | 1,613,636 |
| | | | | 2,777,000 |
| Norway—.5% | | | | |
| StatoilHydro | | 27,350 | | 444,890 |
| Russia—.3% | | | | |
| Gazprom, ADR | | 18,220 | | 259,635 |
| Singapore—1.5% | | | | |
| DBS Group—Rights | | 72,615 a | | 151,203 |
| DBS Group Holdings | | 145,230 | | 848,750 |
| Oversea-Chinese Banking | | 101,000 | | 351,897 |
| | | | | 1,351,850 |
| South Africa—.4% | | | | |
| Nedbank Group | | 37,412 | | 386,463 |
| South Korea—2.7% | | | | |
| Hyundai Motor | | 8,598 | | 276,784 |
| KB Financial Group, ADR | | 14,280 a | | 374,136 |
| Korea Electric Power, ADR | | 27,310 | | 317,069 |
| KT, ADR | | 30,780 | | 451,543 |
| Samsung Electronics | | 1,874 | | 680,483 |
| SK Telecom, ADR | | 21,040 | | 382,507 |
| | | | | 2,482,522 |
| Spain—.2% | | | | |
| Banco Santander | | 19,887 | | 186,596 |
| Sweden—1.1% | | | | |
| Sandvik | | 77,700 | | 481,452 |
| Svenska Cellulosa, Cl. B | | 57,700 | | 487,038 |
| | | | | 968,490 |
| Switzerland—8.1% | | | | |
| Adecco | | 9,050 | | 304,232 |
| Ciba Holding | | 3,546 | | 159,917 |
| Clariant | | 68,435 | | 458,441 |
12
| Common Stocks (continued) | | Shares | | Value ($) |
| |
| |
|
| Switzerland (continued) | | | | |
| Nestle | | 50,350 | | 1,967,924 |
| Novartis | | 61,979 | | 3,068,815 |
| Swiss Reinsurance | | 13,490 | | 637,522 |
| UBS | | 54,064 a | | 753,803 |
| | | | | 7,350,654 |
| Taiwan—.7% | | | | |
| Compal Electronics | | 680,711 | | 362,011 |
| United Microelectronics | | 1,178,000 | | 270,170 |
| | | | | 632,181 |
| United Kingdom—18.3% | | | | |
| Anglo American | | 54,121 | | 1,202,983 |
| BP | | 311,206 | | 2,353,520 |
| Centrica | | 374,150 | | 1,430,907 |
| Debenhams | | 95,313 | | 33,574 |
| Friends Provident | | 204,007 | | 252,541 |
| GlaxoSmithKline | | 107,403 | | 1,983,511 |
| HSBC Holdings | | 143,140 | | 1,362,395 |
| Kingfisher | | 178,804 | | 347,052 |
| Old Mutual | | 522,000 | | 412,779 |
| Punch Taverns | | 80,787 | | 67,368 |
| Royal Bank of Scotland Group | | 157,780 | | 112,063 |
| Royal Dutch Shell, Cl. A | | 33,269 | | 863,378 |
| Tesco | | 220,060 | | 1,139,011 |
| Unilever | | 90,830 | | 2,062,033 |
| Vodafone Group | | 1,319,411 | | 2,636,811 |
| WPP | | 75,610 | | 437,552 |
| | | | | 16,697,478 |
| Total Common Stocks | | | | |
| (cost $128,503,626) | | | | 86,450,214 |
| |
| |
|
| |
| Preferred Stocks—1.5% | | | | |
| |
| |
|
| Germany | | | | |
| Henkel & Co. | | | | |
| (cost $1,921,459) | | 43,150 | | 1,354,960 |
The Portfolio 13
| | STATEMENT OF INVESTMENTS (continued) |
| Other Investment—1.4% | | Shares | | Value ($) |
| |
| |
|
| Registered Investment Company; | | | | |
| Dreyfus Institutional Preferred | | | | |
| Plus Money Market Fund | | | | |
| (cost $1,250,000) | | 1,250,000 b | | 1,250,000 |
| |
| |
|
| |
| Total Investments (cost $131,675,085) | | 97.8% | | 89,055,174 |
| Cash and Receivables (Net) | | 2.2% | | 2,037,948 |
| Net Assets | | 100.0% | | 91,093,122 |
| ADR—American Depository Receipts |
| a | | Non-income producing security. |
| b | | Investment in affiliated money market mutual fund. |
| Portfolio Summary (Unaudited)† | | | | |
| |
| | | Value (%) | | | | Value (%) |
| |
| |
| |
|
| Financial | | 20.4 | | Telecommunication Services | | 7.2 |
| Health Care | | 10.6 | | Information Technology | | 6.7 |
| Energy | | 10.3 | | Utilities | | 6.5 |
| Consumer Staples | | 9.9 | | Materials | | 6.4 |
| Consumer Discretionary | | 9.6 | | Money Market Investment | | 1.4 |
| Industrial | | 8.8 | | | | 97.8 |
| † Based on net assets. |
| See notes to financial statements. |
14
STATEMENT OF ASSETS AND LIABILITIES
December 31, 2008 |
| | | Cost | | Value |
| |
| |
|
| Assets ($): | | | | |
| Investments in securities-See Statement of Investments: | | | | |
| Unaffiliated issuers | | 130,425,085 | | 87,805,174 |
| Affiliated issuers | | 1,250,000 | | 1,250,000 |
| Cash | | | | 282,425 |
| Cash denominated in foreign currencies | | 1,298,815 | | 1,291,811 |
| Receivable for investment securities sold | | | | 335,588 |
| Dividends and interest receivable | | | | 309,101 |
| Receivable for shares of Beneficial Interest subscribed | | | | 46,177 |
| Unrealized appreciation on forward | | | | |
| currency exchange contracts—Note 4 | | | | 228 |
| Prepaid expenses | | | | 1,780 |
| | | | | 91,322,284 |
| |
| |
|
| Liabilities ($): | | | | |
| Due to The Dreyfus Corporation and affiliates—Note 3(b) | | | | 148,063 |
| Payable for investment securities purchased | | | | 28,599 |
| Payable for shares of Beneficial Interest redeemed | | | | 12,492 |
| Unrealized depreciation on forward | | | | |
| currency exchange contracts—Note 4 | | | | 24 |
| Accrued expenses | | | | 39,984 |
| | | | | 229,162 |
| |
| |
|
| Net Assets ($) | | | | 91,093,122 |
| |
| |
|
| Composition of Net Assets ($): | | | | |
| Paid-in capital | | | | 147,987,507 |
| Accumulated undistributed investment income—net | | | | 3,671,106 |
| Accumulated net realized gain (loss) on investments | | | | (17,936,048) |
| Accumulated net unrealized appreciation (depreciation) | | | | |
| on investments and foreign currency transactions | | | | (42,629,443) |
| |
| |
|
| Net Assets ($) | | | | 91,093,122 |
| |
| |
|
| |
| |
| Net Asset Value Per Share | | | | |
| | | Initial Shares | | Service Shares |
| |
| |
|
| Net Assets ($) | | 49,867,945 | | 41,225,177 |
| Shares Outstanding | | 5,670,577 | | 4,698,452 |
| |
| |
|
| Net Asset Value Per Share ($) | | 8.79 | | 8.77 |
| |
| See notes to financial statements. | | | | |
The Portfolio 15
| STATEMENT OF OPERATIONS | | |
| Year Ended December 31, 2008 | | |
| |
|
| |
| |
| |
| |
| Investment Income ($): | | |
| Income: | | |
| Cash dividends (net of $520,458 foreign taxes withheld at source): | | |
| Unaffiliated issuers | | 5,394,982 |
| Affiliated issuers | | 55,022 |
| Interest | | 9,974 |
| Total Income | | 5,459,978 |
| Expenses: | | |
| Investment advisory fee—Note 3(a) | | 1,352,265 |
| Custodian fees—Note 3(b) | | 203,531 |
| Distribution fees—Note 3(b) | | 152,261 |
| Professional fees | | 49,567 |
| Prospectus and shareholders’ reports | | 18,646 |
| Trustees’ fees and expenses—Note 3(c) | | 10,282 |
| Shareholder servicing costs—Note 3(b) | | 5,582 |
| Loan commitment fees—Note 2 | | 1,767 |
| Interest expense—Note 2 | | 1,649 |
| Miscellaneous | | 24,969 |
| Total Expenses | | 1,820,519 |
| Less—reduction in fees due to earnings credits—Note 1(c) | | (4,807) |
| Net Expenses | | 1,815,712 |
| Investment Income—Net | | 3,644,266 |
| |
|
| Realized and Unrealized Gain (Loss) on Investments—Note 4 ($): | | |
| Net realized gain (loss) on investments and foreign currency transactions | | (17,293,236) |
| Net realized gain (loss) on forward currency exchange contracts | | 128 |
| Net Realized Gain (Loss) | | (17,293,108) |
| Net unrealized appreciation (depreciation) | | |
| on investments and foreign currency transactions | | (47,886,464) |
| Net Realized and Unrealized Gain (Loss) on Investments | | (65,179,572) |
| Net (Decrease) in Net Assets Resulting from Operations | | (61,535,306) |
| See notes to financial statements. | | |
16
STATEMENT OF CHANGES IN NET ASSETS
| | | Year Ended December 31, |
| | |
|
| | | 2008 | | 2007 |
| |
| |
|
| Operations ($): | | | | |
| Investment income—net | | 3,644,266 | | 3,230,263 |
| Net realized gain (loss) on investments | | (17,293,108) | | 27,352,115 |
| Net unrealized appreciation | | | | |
| (depreciation) on investments | | (47,886,464) | | (22,437,896) |
| Net Increase (Decrease) in Net Assets | | | | |
| Resulting from Operations | | (61,535,306) | | 8,144,482 |
| |
| |
|
| Dividends to Shareholders from ($): | | | | |
| Investment income—net: | | | | |
| Initial Shares | | (1,920,176) | | (1,825,090) |
| Service Shares | | (1,416,302) | | (1,249,526) |
| Net realized gain on investments: | | | | |
| Initial Shares | | (14,668,614) | | (14,659,613) |
| Service Shares | | (12,285,277) | | (11,179,479) |
| Total Dividends | | (30,290,369) | | (28,913,708) |
| |
| |
|
| Beneficial Interest Transactions ($): | | | | |
| Net proceeds from shares sold: | | | | |
| Initial Shares | | 15,111,981 | | 34,440,848 |
| Service Shares | | 17,272,345 | | 39,126,121 |
| Dividends reinvested: | | | | |
| Initial Shares | | 16,588,790 | | 16,484,703 |
| Service Shares | | 13,701,579 | | 12,429,005 |
| Cost of shares redeemed: | | | | |
| Initial Shares | | (33,408,036) | | (56,488,732) |
| Service Shares | | (27,737,249) | | (42,923,699) |
| Increase (Decrease) in Net Assets | | | | |
| from Beneficial Interest Transactions | | 1,529,410 | | 3,068,246 |
| Total Increase (Decrease) in Net Assets | | (90,296,265) | | (17,700,980) |
| |
| |
|
| Net Assets ($): | | | | |
| Beginning of Period | | 181,389,387 | | 199,090,367 |
| End of Period | | 91,093,122 | | 181,389,387 |
| Undistributed investment income—net | | 3,671,106 | | 3,331,717 |
The Portfolio 17
STATEMENT OF CHANGES IN NET ASSETS (continued)
| | | Year Ended December 31, |
| | |
|
| | | 2008 | | 2007 |
| |
| |
|
| Capital Share Transactions: | | | | |
| Initial Shares | | | | |
| Shares sold | | 1,319,997 | | 1,871,197 |
| Shares issued for dividends reinvested | | 1,324,983 | | 963,454 |
| Shares redeemed | | (2,804,043) | | (3,094,678) |
| Net Increase (Decrease) in Shares Outstanding | | (159,063) | | (260,027) |
| |
| |
|
| Service Shares | | | | |
| Shares sold | | 1,316,595 | | 2,142,942 |
| Shares issued for dividends reinvested | | 1,095,250 | | 727,268 |
| Shares redeemed | | (2,300,880) | | (2,410,785) |
| Net Increase (Decrease) in Shares Outstanding | | 110,965 | | 459,425 |
| See notes to financial statements. | | | | |
18
FINANCIAL HIGHLIGHTS
The following tables describe the performance for each share class for the fiscal periods indicated.All information (except portfolio turnover rate) reflects financial results for a single portfolio share. Total return shows how much your investment in the portfolio would have increased (or decreased) during each period, assuming you had reinvested all dividends and distributions.These figures have been derived from the portfolio’s financial statements.
| | | | | Year Ended December 31, | | |
| | |
| |
| |
|
| Initial Shares | | 2008 | | 2007 | | 2006 | | 2005 | | 2004 |
| |
| |
| |
| |
| |
|
| Per Share Data ($): | | | | | | | | | | |
| Net asset value, beginning of period | | 17.43 | | 19.50 | | 17.49 | | 15.85 | | 13.54 |
| Investment Operations: | | | | | | | | | | |
| Investment income—neta | | .34 | | .31 | | .29 | | .22 | | .16 |
| Net realized and unrealized | | | | | | | | | | |
| gain (loss) on investments | | (5.94) | | .44 | | 3.44 | | 1.64 | | 2.54 |
| Total from Investment Operations | | (5.60) | | .75 | | 3.73 | | 1.86 | | 2.70 |
| Distributions: | | | | | | | | | | |
| Dividends from investment income—net | | (.35) | | (.31) | | (.26) | | — | | (.16) |
| Dividends from net realized | | | | | | | | | | |
| gain on investments | | (2.69) | | (2.51) | | (1.46) | | (.22) | | (.23) |
| Total Distributions | | (3.04) | | (2.82) | | (1.72) | | (.22) | | (.39) |
| Net asset value, end of period | | 8.79 | | 17.43 | | 19.50 | | 17.49 | | 15.85 |
| |
| |
| |
| |
| |
|
| Total Return (%) | | (37.32) | | 4.15 | | 22.60 | | 11.89 | | 20.02 |
| |
| |
| |
| |
| |
|
| Ratios/Supplemental Data (%): | | | | | | | | | | |
| Ratio of total expenses | | | | | | | | | | |
| to average net assets | | 1.23 | | 1.19 | | 1.19 | | 1.20 | | 1.25 |
| Ratio of net expenses | | | | | | | | | | |
| to average net assets | | 1.23b | | 1.18 | | 1.18 | | 1.17 | | 1.24 |
| Ratio of net investment income | | | | | | | | | | |
| to average net assets | | 2.79 | | 1.69 | | 1.59 | | 1.39 | | 1.08 |
| Portfolio Turnover Rate | | 55.27 | | 66.08 | | 60.27 | | 54.32 | | 44.05 |
| |
| |
| |
| |
| |
|
| Net Assets, end of period ($ x 1,000) | | 49,868 | | 101,614 | | 118,733 | | 94,988 | | 88,713 |
| a | | Based on average shares outstanding at each month end. |
| b | | Expense waivers and/or reimbursements amounted to less than .01%. |
| See notes to financial statements. |
The Portfolio 19
| | FINANCIAL HIGHLIGHTS (continued) |
| | | | | Year Ended December 31, | | |
| | |
| |
| |
|
| Service Shares | | 2008 | | 2007 | | 2006 | | 2005 | | 2004 |
| |
| |
| |
| |
| |
|
| Per Share Data ($): | | | | | | | | | | |
| Net asset value, beginning of period | | 17.39 | | 19.47 | | 17.47 | | 15.86 | | 13.56 |
| Investment Operations: | | | | | | | | | | |
| Investment income—neta | | .32 | | .27 | | .24 | | .18 | | .06 |
| Net realized and unrealized | | | | | | | | | | |
| gain (loss) on investments | | (5.94) | | .44 | | 3.45 | | 1.65 | | 2.62 |
| Total from Investment Operations | | (5.62) | | .71 | | 3.69 | | 1.83 | | 2.68 |
| Distributions: | | | | | | | | | | |
| Dividends from investment income—net | | (.31) | | (.28) | | (.23) | | — | | (.15) |
| Dividends from net realized | | | | | | | | | | |
| gain on investments | | (2.69) | | (2.51) | | (1.46) | | (.22) | | (.23) |
| Total Distributions | | (3.00) | | (2.79) | | (1.69) | | (.22) | | (.38) |
| Net asset value, end of period | | 8.77 | | 17.39 | | 19.47 | | 17.47 | | 15.86 |
| |
| |
| |
| |
| |
|
| Total Return (%) | | (37.48) | | 3.92 | | 22.39 | | 11.69 | | 19.83 |
| |
| |
| |
| |
| |
|
| Ratios/Supplemental Data (%): | | | | | | | | | | |
| Ratio of total expenses | | | | | | | | | | |
| to average net assets | | 1.48 | | 1.44 | | 1.44 | | 1.45 | | 1.49 |
| Ratio of net expenses | | | | | | | | | | |
| to average net assets | | 1.48b | | 1.39 | | 1.38 | | 1.36 | | 1.39 |
| Ratio of net investment income | | | | | | | | | | |
| to average net assets | | 2.58 | | 1.49 | | 1.33 | | 1.10 | | .44 |
| Portfolio Turnover Rate | | 55.27 | | 66.08 | | 60.27 | | 54.32 | | 44.05 |
| |
| |
| |
| |
| |
|
| Net Assets, end of period ($ x 1,000) | | 41,225 | | 79,776 | | 80,358 | | 54,255 | | 34,119 |
| a | | Based on average shares outstanding at each month end. |
| b | | Expense waivers and/or reimbursements amounted to less than .01%. |
| See notes to financial statements. |
20
NOTES TO FINANCIAL STATEMENTS
NOTE 1—Significant Accounting Policies:
Dreyfus Variable Investment Fund (the “fund”) is registered under the Investment Company Act of 1940, as amended (the “Act”), as an open-end management investment company, operating as a series company currently offering seven series, including the InternationalValue Portfolio (the “portfolio”).The portfolio is only offered to separate accounts established by insurance companies to fund variable annuity contracts and variable life insurance policies. The portfolio is a diversified series. The portfolio’s investment objective is long-term capital growth.The Dreyfus Corporation (the “Manager” or “Dreyfus”), a wholly-owned subsidiary of The Bank of NewYork Mellon Corporation (“BNY Mellon”), serves as the portfolio’s investment adviser.
Effective July 1,2008,BNY Mellon reorganized and consolidated a number of its banking and trust company subsidiaries.As a result of the reorganization, any services previously provided to the portfolio by Mellon Bank, N.A. or Mellon Trust of New England, N.A. are now provided by The Bank of NewYork Mellon (formerly,The Bank of NewYork).
MBSC Securities Corporation (the “Distributor”), a wholly-owned subsidiary of the Manager, is the distributor of the portfolio’s shares, which are sold without a sales charge. The portfolio is authorized to issue an unlimited number of $.001 par value shares of Beneficial Interest in each of the following classes of shares: Initial and Service. Each class of shares has identical rights and privileges, except with respect to the distribution plan and the expenses borne by each class, the allocation of certain transfer agency costs and certain voting rights. Income, expenses (other than expenses attributable to a specific class), and realized and unrealized gains or losses on investments are allocated to each class of shares based on its relative net assets.
The fund accounts separately for the assets, liabilities and operations of each series. Expenses directly attributable to each series are charged to that series’ operations; expenses which are applicable to all series are allocated among them on a pro rata basis.
The Portfolio 21
| NOTES TO FINANCIAL STATEMENTS (continued) |
The portfolio’s financial statements are prepared in accordance with U.S. generally accepted accounting principles, which may require the use of management estimates and assumptions.Actual results could differ from those estimates.
The fund enters into contracts that contain a variety of indemnifica-tions.The portfolio’s maximum exposure under these arrangements is unknown. The portfolio does not anticipate recognizing any loss related to these arrangements.
(a) Portfolio valuation: Investments in securities are valued at the last sales price on the securities exchange or national securities market on which such securities are primarily traded. Securities listed on the National Market System for which market quotations are available are valued at the official closing price or, if there is no official closing price that day, at the last sales price. Securities not listed on an exchange or the national securities market, or securities for which there were no transactions, are valued at the average of the most recent bid and asked prices, except for open short positions, where the asked price is used for valuation purposes. Bid price is used when no asked price is available. Registered investment companies that are not traded on an exchange are valued at their net asset value.When market quotations or official closing prices are not readily available, or are determined not to reflect accurately fair value, such as when the value of a security has been significantly affected by events after the close of the exchange or market on which the security is principally traded (for example, a foreign exchange or market), but before the portfolio calculates its net asset value, the portfolio may value these investments at fair value as determined in accordance with the procedures approved by the Board ofTrustees. Fair valuing of securities may be determined with the assistance of a pricing service using calculations based on indices of domestic securities and other appropriate indicators, such as prices of relevant ADRs and futures contracts. For other securities that are fair valued by the Board ofTrustees, certain factors may be considered such as: fundamental analytical data, the nature and duration of restrictions on disposition, an evaluation of the forces that influence the market in
22
which the securities are purchased and sold and public trading in similar securities of the issuer or comparable issuers. Financial futures are valued at the last sales price. Investments denominated in foreign currencies are translated to U.S. dollars at the prevailing rates of exchange. Forward currency exchange contracts are valued at the forward rate.
The portfolio adopted Statement of Financial Accounting Standards No. 157 “Fair Value Measurements” (“FAS 157”). FAS 157 establishes an authoritative definition of fair value, sets out a framework for measuring fair value, and requires additional disclosures about fair value measurements.
Various inputs are used in determining the value of the portfolio’s investments relating to FAS 157.These inputs are summarized in the three broad levels listed below.
| | Level 1—quoted prices in active markets for identical securities.
Level 2—other significant observable inputs (including quoted
prices for similar securities, interest rates, prepayment speeds, credit
risk, etc.).
Level 3—significant unobservable inputs (including the portfolio’s
own assumptions in determining the fair value of investments). |
The inputs or methodology used for valuing securities are not necessarily an indication of the risk associated with investing in those securities.
The following is a summary of the inputs used as of December 31, 2008 in valuing the portfolio’s investments carried at fair value:
| | | Investments in | | Other Financial |
| Valuation Inputs | | Securities ($) | | Instruments ($)† |
| |
| |
|
| Level 1—Quoted Prices | | 61,688,933 | | 0 |
| Level 2—Other Significant | | | | |
| Observable Inputs | | 27,366,241 | | 204 |
| Level 3—Significant | | | | |
| Unobservable Inputs | | 0 | | 0 |
| Total | | 89,055,174 | | 204 |
| † | | Other financial instruments include derivative instruments, such as futures, forward currency |
| | | exchange contracts and swap contracts, which are valued at the unrealized appreciation |
| | | (depreciation) on the instrument and written options contracts which are shown at value. |
The Portfolio 23
| NOTES TO FINANCIAL STATEMENTS (continued) |
(b) Foreign currency transactions: The portfolio does not isolate that portion of the results of operations resulting from changes in foreign exchange rates on investments from the fluctuations arising from changes in market prices of securities held. Such fluctuations are included with the net realized and unrealized gain or loss on investments.
Net realized foreign exchange gains or losses arise from sales and maturities of short-term securities, sales of foreign currencies, currency gains or losses realized on securities transactions and the difference between the amounts of dividends, interest and foreign withholding taxes recorded on the portfolio’s books and the U.S. dollar equivalent of the amounts actually received or paid. Net unrealized foreign exchange gains or losses arise from changes in the value of assets and liabilities other than investments in securities, resulting from changes in exchange rates. Such gains and losses are included with net realized and unrealized gain or loss on investments.
(c) Securities transactions and investment income: Securities transactions are recorded on a trade date basis. Realized gains and losses from securities transactions are recorded on the identified cost basis. Dividend income is recognized on the ex-dividend date and interest income, including, where applicable, accretion of discount and amortization of premium on investments, is recognized on the accrual basis.
The portfolio has arrangements with the custodian and cash management banks whereby the portfolio may receive earnings credits when positive cash balances are maintained, which are used to offset custody and cash management fees. For financial reporting purposes, the portfolio includes net earnings credits as an expense offset in the Statement of Operations.
Investing in foreign markets may involve special risks and considerations not typically associated with investing in the U.S. These risks include revaluation of currencies, high rates of inflation, repatriation restrictions on income and capital,and adverse political and economic developments.
24
Moreover, securities issued in these markets may be less liquid, subject to government ownership controls,delayed settlements,and their prices may be more volatile than those of comparable securities in the U.S.
(d) Affiliated issuers: Investments in other investment companies advised by the Manager are defined as “affiliated” in the Act.
(e) Dividends to shareholders: Dividends are recorded on the ex-dividend date. Dividends from investment income-net and dividends from net realized capital gains, if any, are normally declared and paid annually, but the portfolio may make distributions on a more frequent basis to comply with the distribution requirements of the Internal Revenue Code of 1986, as amended (the “Code”).To the extent that net realized capital gains can be offset by capital loss carryovers, it is the policy of the portfolio not to distribute such gains. Income and capital gain distributions are determined in accordance with income tax regulations, which may differ from U.S. generally accepted accounting principles.
(f) Federal income taxes: It is the policy of the portfolio to continue to qualify as a regulated investment company, if such qualification is in the best interests of its shareholders, by complying with the applicable provisions of the Code, and to make distributions of taxable income sufficient to relieve it from substantially all federal income and excise taxes.
As of and during the period ended December 31, 2008, the portfolio did not have any liabilities for any unrecognized tax positions. The portfolio recognizes interest and penalties, if any, related to unrecognized tax positions as income tax expense in the Statement of Operations. During the period, the portfolio did not incur any interest or penalties.
Each of the tax years in the four-year period ended December 31, 2008 remains subject to examination by the Internal Revenue Service and state taxing authorities.
The Portfolio 25
| NOTES TO FINANCIAL STATEMENTS (continued) |
At December 31, 2008, the components of accumulated earnings on a tax basis were as follows: undistributed ordinary income $3,671,106, accumulated capital losses $9,980,117 and unrealized depreciation $45,466,538. In addition, the portfolio had $5,118,836 of capital losses realized after October 31, 2008, which were deferred for tax purposes to the first day of the following fiscal year.
The accumulated capital loss carryover is available for federal income tax purposes to be applied against future net securities profits, if any, realized subsequent to December 31, 2008. If not applied, the carryover expires in fiscal 2016.
The tax character of distributions paid to shareholders during the fiscal periods ended December 31, 2008 and December 31, 2007 were as follows: ordinary income $13,619,753 and $8,109,647 and long-term capital gains $16,670,616 and $20,804,061, respectively.
During the period ended December 31, 2008, as a result of permanent book to tax differences, primarily due to the tax treatment for foreign currency exchange gains and losses and dividend reclassification, the portfolio increased accumulated undistributed investment income-net by $31,601 and decreased accumulated net realized gain (loss) on investments by the same amount. Net assets and net asset value per share were not affected by this reclassification.
NOTE 2—Bank Lines of Credit:
Prior to October 15, 2008, the portfolio participated with other Dreyfus-managed funds in a $350 million redemption credit facility. Effective October 15, 2008, the portfolio participates with other Dreyfus-managed funds in a $145 million redemption credit facility (the “Facility”) to be utilized for temporary or emergency purposes, including the financing of redemptions. In connection therewith, the portfolio has agreed to pay commitment fees on its pro rata portion of the Facility. Interest is charged to the portfolio based on prevailing market rates in effect at the time of borrowing.
26
The average daily amount of borrowings outstanding under the Facilities during the period ended December 31, 2008, was approximately $42,300 with a related weighted average annualized interest rate of 3.89% .
NOTE 3—Investment Advisory Fee and Other Transactions With Affiliates:
(a) Pursuant to an Investment Advisory Agreement with the Manager, the investment advisory fee is computed at the annual rate of 1% of the value of the portfolio’s average daily net assets and is payable monthly.
(b) Under the Distribution Plan (the “Plan”) adopted pursuant to Rule 12b-1 under the Act, Service shares pay the Distributor for distributing their shares, for servicing and/or maintaining Service shares shareholder accounts and for advertising and marketing for Service shares.The Plan provides for payments to be made at an annual rate of .25% of the value of the Service shares’ average daily net assets.The Distributor may make payments to Participating Insurance Companies and to brokers and dealers acting as principal underwriter for their variable insurance products.The fees payable under the Plan are payable without regard to actual expenses incurred. During the period ended December 31, 2008, Service shares were charged $152,261 pursuant to the Plan.
The portfolio compensates Dreyfus Transfer, Inc., a wholly-owned subsidiary of the Manager, under a transfer agency agreement for providing personnel and facilities to perform transfer agency services for the portfolio. During the period ended December 31, 2008, the portfolio was charged $514 pursuant to the transfer agency agreement.
The portfolio compensates The Bank of New York Mellon, a subsidiary of BNY Mellon and an affiliate of Dreyfus, under a cash management agreement for performing cash management services related
The Portfolio 27
| NOTES TO FINANCIAL STATEMENTS (continued) |
to portfolio subscriptions and redemptions. During the period ended December 31, 2008, the portfolio was charged $71 pursuant to the cash management agreement.
The portfolio compensates The Bank of New York Mellon under a custody agreement for providing custodial services for the portfolio. During the period ended December 31, 2008, the portfolio was charged $203,531 pursuant to the custody agreement.
During the period ended December 31, 2008, the portfolio was charged $5,403 for services performed by the Chief Compliance Officer.
The components of “Due to The Dreyfus Corporation and affiliates” in the Statement of Assets and Liabilities consist of: investment advisory fees $74,282, Rule 12b-1 distribution plan fees $8,358, custody fees $64,146, chief compliance officer fees $1,197 and transfer agency per account fees $80.
(c) Each Board member also serves as a Board member of other funds within the Dreyfus complex. Annual retainer fees and attendance fees are allocated to each fund based on net assets.
NOTE 4—Securities Transactions:
The aggregate amount of purchases and sales of investment securities, excluding short-term securities and forward currency exchange contracts, during the period ended December 31, 2008, amounted to $73,100,408 and $95,398,540, respectively.
The portfolio enters into forward currency exchange contracts in order to hedge its exposure to changes in foreign currency exchange rates on its foreign portfolio holdings and to settle foreign currency transactions. When executing forward currency exchange contracts, the portfolio is obligated to buy or sell a foreign currency at a specified rate on a certain date in the future. With respect to sales of forward currency exchange contracts, the portfolio would incur a loss if
28
the value of the contract increases between the date the forward contract is opened and the date the forward contract is closed.The portfolio realizes a gain if the value of the contract decreases between those dates. With respect to purchases of forward currency exchange contracts, the portfolio would incur a loss if the value of the contract decreases between the date the forward contract is opened and the date the forward contract is closed.The portfolio realizes a gain if the value of the contract increases between those dates. The portfolio is also exposed to credit risk associated with counterparty nonperfor-mance on these forward currency exchange contracts, which is typically limited to the unrealized gain on each open contract.The following summarizes open forward currency exchange contracts at December 31, 2008:
| | | Foreign | | | | | | Unrealized |
| Forward Currency | | Currency | | | | | | Appreciation |
| Exchange Contracts | | Amounts | | Proceeds ($) | | Value ($) | | (Depreciation) ($) |
| |
| |
| |
| |
|
| Sales: | | | | | | | | |
| British Pound, | | | | | | | | |
| expiring 1/2/2009 | | 10,971 | | 16,001 | | 15,773 | | 228 |
| Euro, | | | | | | | | |
| expiring 1/2/2009 | | 43,155 | | 59,964 | | 59,988 | | (24) |
| Total | | | | | | | | 204 |
At December 31, 2008, the cost of investments for federal income tax purposes was $134,512,180; accordingly, accumulated net unrealized depreciation on investments was $45,457,006, consisting of $1,527,371 gross unrealized appreciation and $46,984,377 gross unrealized depreciation.
In March 2008, the Financial Accounting Standards Board released Statement of Financial Accounting Standards No. 161 “Disclosures about Derivative Instruments and Hedging Activities” (“FAS 161”). FAS 161 requires qualitative disclosures about objectives and strategies for using derivatives, quantitative disclosures about fair value amounts
The Portfolio 29
| NOTES TO FINANCIAL STATEMENTS (continued) |
of gains and losses on derivative instruments and disclosures about credit-risk-related contingent features in derivative agreements. The application of FAS 161 is required for fiscal years and interim periods beginning after November 15, 2008.At this time, management is evaluating the implications of FAS 161 and its impact on the financial statements and the accompanying notes has not yet been determined.
30
REPORT OF INDEPENDENT REGISTERED
PUBLIC ACCOUNTING FIRM |
Shareholders and Board of Trustees
Dreyfus Variable Investment Fund, International Value Portfolio
We have audited the accompanying statement of assets and liabilities, including the statement of investments, of Dreyfus Variable Investment Fund, International Value Portfolio (one of the series comprising Dreyfus Variable Investment Fund) as of December 31, 2008, and the related statement of operations for the year then ended, the statement of changes in net assets for each of the two years in the period then ended and financial highlights for each of the years indicated therein. These financial statements and financial highlights are the responsibility of the Fund’s management. Our responsibility is to express an opinion on these financial statements and financial highlights based on our audits.
We conducted our audits in accordance with the standards of the Public Company Accounting Oversight Board (United States). Those standards require that we plan and perform the audit to obtain reasonable assurance about whether the financial statements and financial highlights are free of material misstatement. We were not engaged to perform an audit of the Fund’s internal control over financial reporting. Our audits included consideration of internal control over financial reporting as a basis for designing audit procedures that are appropriate in the circumstances, but not for the purpose of expressing an opinion on the effectiveness of the Fund’s internal control over financial reporting. Accordingly, we express no such opinion. An audit also includes examining, on a test basis, evidence supporting the amounts and disclosures in the financial statements and financial highlights, assessing the accounting principles used and signif icant estimates made by management, and evaluating the overall financial statement presentation. Our procedures included confirmation of securities owned as of December 31, 2008 by correspondence with the custodian and others. We believe that our audits provide a reasonable basis for our opinion. In our opinion, the financial statements and financial highlights referred to above present fairly, in all material respects, the financial position of Dreyfus Variable Investment Fund, International Value Portfolio at December 31, 2008, the results of its operations for the year then ended, the changes in its net assets for each of the two years in the period then ended, and the financial highlights for each of the indicated years, in conformity with U. S. generally accepted accounting principles.

New York, New York
February 10, 2009 |
The Portfolio 31
IMPORTANT TAX INFORMATION (Unaudited)
In accordance with federal tax law, the fund elects to provide each shareholder with their portion of the Fund’s foreign taxes paid and the income sourced from foreign countries. Accordingly, the fund hereby makes the following designations regarding its fiscal year ended December 31, 2008:
— the total amount of taxes paid to foreign countries was $510,330
— the total amount of income sourced from foreign countries was $3,613,811.
As required by federal tax law rules, shareholders will receive notification of their proportionate share of foreign taxes paid and foreign sourced income for the 2008 calendar year with Form 1099-DIV which will be mailed by January 31, 2009.Also, the portfolio hereby designates $1.6640 per share as a long-term capital gain distribution and $1.0250 per share as a short-term capital gain distribution paid on March 31, 2008.
32
BOARD MEMBERS INFORMATION (Unaudited)

The Portfolio 33
BOARD MEMBERS INFORMATION (Unaudited) (continued)
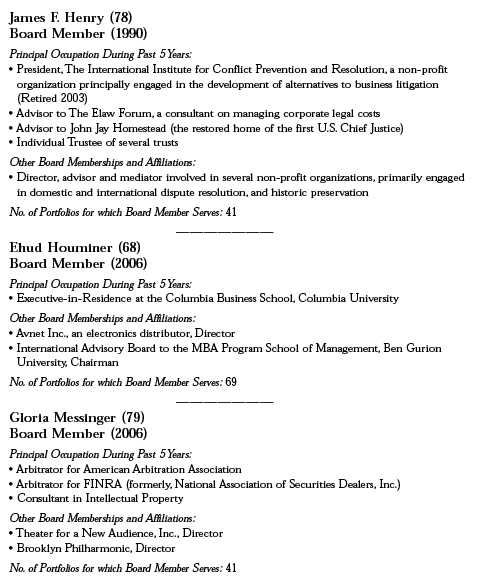
34

The Portfolio 35
OFFICERS OF THE FUND (Unaudited)
36

The Portfolio 37
For More Information
Telephone 1-800-554-4611 or 516-338-3300
Mail The Dreyfus Family of Funds, 144 Glenn Curtiss Boulevard, Uniondale, NY 11556-0144 Attn: Investments Division
The portfolio files its complete schedule of portfolio holdings with the Securities and Exchange Commission (“SEC”) for the first and third quarters of each fiscal year on Form N-Q. The portfolio’s Forms N-Q are available on the SEC’s website at http://www.sec.gov and may be reviewed and copied at the SEC’s Public Reference Room in Washington, DC. Information on the operation of the Public Reference Room may be obtained by calling 1-800-SEC-0330.
A description of the policies and procedures that the portfolio uses to determine how to vote proxies relating to portfolio securities, and information regarding how the portfolio voted these proxies for the 12-month period ended June 30, 2008, is available at http://www.dreyfus.com and on the SEC’s website at http://www.sec.gov. The description of the policies and procedures is also available without charge, upon request, by calling 1-800-645-6561.

| © 2009 MBSC Securities Corporation |
| | Dreyfus Variable
Investment Fund,
Money Market
Portfolio |
| | ANNUAL REPORT December 31, 2008 |

The views expressed in this report reflect those of the portfolio manager only through the end of the period covered and do not necessarily represent the views of Dreyfus or any other person in the Dreyfus organization.Any such views are subject to change at any time based upon market or other conditions and Dreyfus disclaims any responsibility to update such views. These views may not be relied on as investment advice and, because investment decisions for a Dreyfus portfolio are based on numerous factors, may not be relied on as an indication of trading intent on behalf of any Dreyfus portfolio.
| | Contents |
| |
| | THE PORTFOLIO |
| |
| 2 | A Letter from the CEO |
| |
| 3 | Discussion of Performance |
| |
| 6 | Understanding Your Portfolio’s Expenses |
| |
| 6 | Comparing Your Portfolio’s Expenses With Those of Other Funds |
| |
| 7 | Statement of Investments |
| |
| 10 | Statement of Assets and Liabilities |
| |
| 11 | Statement of Operations |
| |
| 12 | Statement of Changes in Net Assets |
| |
| 13 | Financial Highlights |
| |
| 14 | Notes to Financial Statements |
| |
| 21 | Report of Independent Registered Public Accounting Firm |
| |
| 22 | Board Members Information |
| |
| 25 | Officers of the Fund |
| |
| | FOR MORE INFORMATION |
| |
| | Back Cover |
| |
Dreyfus Variable Investment Fund,
Money Market Portfolio |
The Portfolio

A LETTER FROM THE CEO
Dear Shareholder: |
We are pleased to present this annual report for Dreyfus Variable Investment Fund, Money Market Portfolio, covering the 12-month period from January 1, 2008, through December 31, 2008.
2008 was the most difficult year in decades for the financial markets. A credit crunch that began in 2007 exploded in mid-2008 into a global financial crisis, resulting in the failures of major financial institutions, a deep and prolonged recession and lower investment values across a broad range of asset classes. Governments and regulators throughout the world moved aggressively to curtail the damage, implementing unprecedented reductions of short-term interest rates, massive injections of liquidity into the banking system, government bailouts of struggling companies and plans for massive economic stimulus programs. Money market funds were not immune to the downturn, and several U.S. money market funds were unable to maintain a stable net asset value. The federal government subsequently stepped in with a program for guaranteeing participating funds’ assets at stated levels, while others received financial support from their sponsors.
Although we expect the U.S. and global economies to remain weak until longstanding imbalances have worked their way out of the system, the financial markets currently appear to have priced in investors’ generally low expectations. In previous recessions, however, the markets have tended to anticipate economic improvement before it occurs, potentially leading to major rallies when few expected them. That’s why it makes sense to remain disciplined, maintain a long-term perspective and adopt a consistent asset allocation strategy that reflects one’s future goals and attitudes toward risk. As always, we urge you to consult with your financial advisor, who can recommend the course of action that is right for you.
For information about how the portfolio performed during the reporting period, as well as market perspectives, we have provided a Discussion of Performance given by the Portfolio Manager.
Thank you for your continued confidence and support.

Jonathan R. Baum
Chief Executive Officer
The Dreyfus Corporation
January 15, 2009 |
2

DISCUSSION OF PERFORMANCE
For the period of January 1, 2008, through December 31, 2008, as provided by Bernard W. Kiernan, Jr., Senior Portfolio Manager
Portfolio and Market Performance Overview
For the 12-month period ended December 31, 2008, Dreyfus Variable Investment Fund, Money Market Portfolio produced a yield of 2.50% . Taking into account the effects of compounding, the portfolio provided an effective yield of 2.53% for the same period.1
Money market yields declined over the reporting period along with short-term interest rates in a weakening U.S. economy.The portfolio also was affected by an intensifying global financial crisis, which produced turmoil in the commercial paper market.
The Portfolio’s Investment Approach
The portfolio seeks as high a level of current income as is consistent with the preservation of capital and the maintenance of liquidity.To pursue this goal, the portfolio invests in a diversified selection of high-quality, short-term debt securities, including securities issued or guaranteed by the U.S. government or its agencies or instrumentalities, certificates of deposit, time deposits, bankers’ acceptances and other short-term securities issued by domestic or foreign banks, repurchase agreements, asset-backed securities, domestic and dollar-denominated foreign commercial paper and other short-term corporate and bank obligations of domestic and foreign issuers and dollar-denominated obligations issued or guaranteed by one or more foreign governments or their agencies, including obligations of supranational entities.
Interest Rates Fell as U.S. Economy Struggled
Slumping U.S. housing markets, sluggish consumer spending and resurgent energy prices already had produced a weaker U.S. economy by the start of 2008.As a result, the Federal Reserve Board (the “Fed”) had reduced the overnight federal funds rate in the final months of 2007 from 5.25% to 4.25% .
The Portfolio 3
| DISCUSSION OF PERFORMANCE (continued) |
Additional evidence of economic weakness mounted as 2008 began, and the credit crisis intensified when institutional investors de-levered their portfolios to raise cash. Despite aggressive easing by the Fed and an economic stimulus package from Congress, job losses and delever-aging pressures intensified during the first quarter of 2008. In March, the Fed participated in the rescue of investment bank Bear Stearns and made funds available to Wall Street firms in an unprecedented program allowing the use of mortgage-backed securities as collateral. Nonetheless, unemployment continued to rise.
After a brief market rally in the spring,reports of additional write-downs by major banks in June and greater-than-expected losses by mortgage agencies Fannie Mae and Freddie Mac in July sparked renewed volatility in the stock and bond markets.The bad news continued to mount in August, including another jump in the unemployment rate.
September ranked as one of the most challenging months in memory, as financial institutions found themselves unable to obtain short-term funding for their operations. In the ensuing tumult, the U.S. government effectively nationalized Fannie Mae, Freddie Mac and insurer AIG, Lehman Brothers Holdings filed for bankruptcy, Washington Mutual was seized by regulators and Merrill Lynch and Wachovia were sold to former rivals. The U.S. Treasury Department proposed and Congress passed the $700 billionTroubled Assets Relief Program (TARP) to shore up the nation’s banking system. It later was announced that U.S. GDP contracted by a –0.50% annualized rate in the third quarter.
Money Markets Suffered in the Financial Crisis
Money market funds were not immune to the financial crisis. The Lehman Brothers bankruptcy led to challenging liquidity conditions in the commercial paper market, threatening to force some funds’ net asset values below $1 per share. Although at least one money market fund did so, most affected funds’ sponsors stepped in with cash infusions that maintained stable net asset values. The U.S. government implemented the Temporary Guarantee Program specifically for money market funds to shore up investor confidence. Consequently, the commercial paper market began to stabilize, as evidenced by rising trading activity.
4
In October, the Fed and other central banks around the world implemented a coordinated rate cut to combat spreading global economic weakness. Nonetheless, the economic downturn gained momentum, and retailers suffered through their worst holiday season in many years. Meanwhile, the National Bureau of Economic Research officially declared that the U.S. economy has been in a recession since late 2007, a pronouncement that appeared to be confirmed by more severe job losses and a rise in the unemployment rate to 7.20% in December, its highest level since 1993.The Fed followed up with additional reductions before year-end, and the target for the federal funds rate ended 2008 at between 0% and 0.25%, a record low.
Maintaining a Cautious Posture
For most of the reporting period, we maintained the portfolio’s weighted average maturity in a position we considered longer than industry averages. September’s developments constrained our ability to find longer-dated money market instruments at reasonable prices, and we shifted the portfolio’s focus to instruments with overnight maturi-ties.We subsequently have maintained the portfolio’s weighted average maturity in a range that is modestly shorter than industry averages.
We currently expect reduced liquidity and tighter loan standards to dampen economic growth well into 2009.Therefore, we intend to maintain the portfolio’s conservative credit posture and a focus on liquidity.
January 15, 2009
An investment in the portfolio is not insured or guaranteed by the FDIC or any other government agency.Although the portfolio seeks to preserve the value of your investment at $1.00 per share, it is possible to lose money by investing in the portfolio.
The portfolio is only available as a funding vehicle under variable life insurance policies or variable annuity contracts issued by insurance companies. Individuals may not purchase shares of the portfolio directly.A variable annuity is an insurance contract issued by an insurance company that enables investors to accumulate assets on a tax-deferred basis for retirement or other long-term goals.The investment objective and policies of Dreyfus Variable Investment Fund, Money Market Portfolio made available through insurance products may be similar to other funds/portfolios managed or advised by Dreyfus. However, the investment results of the portfolio may be higher or lower than, and may not be comparable to, those of any other Dreyfus fund/portfolio.
| 1 | Effective yield is based upon dividends declared daily and reinvested monthly. Past performance is no guarantee of future results.Yields fluctuate.The portfolio’s performance does not reflect the deduction of additional charges and expenses imposed in connection with investing in variable insurance contracts, which will reduce returns. |
| |
The Portfolio 5
UNDERSTANDING YOUR
PORTFOLIO’S EXPENSES (Unaudited) |
As a mutual fund investor, you pay ongoing expenses, such as management fees and other expenses. Using the information below, you can estimate how these expenses affect your investment and compare them with the expenses of other funds.You also may pay one-time transaction expenses, including sales charges (loads) and redemption fees,which are not shown in this section and would have resulted in higher total expenses. For more information, see your portfolio’s prospectus or talk to your financial adviser.
Review your portfolio’s expenses
The table below shows the expenses you would have paid on a $1,000 investment in Dreyfus Variable Investment Fund,Money Market Portfolio from July 1,2008 to December 31,2008. It also shows how much a $1,000 investment would be worth at the close of the period, assuming actual returns and expenses.
| | Expenses and Value of a $1,000 Investment
assuming actual returns for the six months ended December 31, 2008 |
| Expenses paid per $1,000† | | $ 2.88 |
| Ending value (after expenses) | | $1,009.30 |
COMPARING YOUR PORTFOLIO’S EXPENSES
WITH THOSE OF OTHER FUNDS (Unaudited) |
Using the SEC’s method to compare expenses
The Securities and Exchange Commission (SEC) has established guidelines to help investors assess fund expenses. Per these guidelines, the table below shows your portfolio’s expenses based on a $1,000 investment, assuming a hypothetical 5% annualized return. You can use this information to compare the ongoing expenses (but not transaction expenses or total cost) of investing in the portfolio with those of other funds. All mutual fund shareholder reports will provide this information to help you make this comparison. Please note that you cannot use this information to estimate your actual ending account balance and expenses paid during the period.
| | Expenses and Value of a $1,000 Investment
assuming a hypothetical 5% annualized return for the six months ended December 31, 2008 |
| Expenses paid per $1,000† | | $ 2.90 |
| Ending value (after expenses) | | $1,022.27 |
| † Expenses are equal to the portfolio’s annualized expense ratio of .57%, multiplied by the average account value over |
| the period, multiplied by 184/366 (to reflect the one-half year period). |
6
| STATEMENT OF INVESTMENTS | | | | |
| December 31, 2008 | | | | |
| |
| |
|
| |
| |
| |
| | | Principal | | |
| Commercial Paper—76.8% | | Amount ($) | | Value ($) |
| |
| |
|
| ABN-AMRO North America Finance Inc. | | | | |
| 2.08%, 3/11/09 | | 10,000,000 | | 9,960,325 |
| Allied Irish Banks | | | | |
| 3.07%, 2/6/09 | | 10,000,000 | | 9,969,800 |
| Atlantic Asset Securitization LLC | | | | |
| 1.76%, 2/5/09 | | 10,000,000 a | | 9,982,986 |
| Atlantis One Funding Corp. | | | | |
| 2.01%, 2/3/09 | | 10,000,000 a | | 9,981,667 |
| Bank of America Corp. | | | | |
| 2.01%, 2/12/09 | | 12,000,000 | | 11,972,000 |
| Barclays U.S. Funding Corp. | | | | |
| 3.75%, 1/22/09 | | 10,000,000 | | 9,978,329 |
| BNP Paribas Finance Inc. | | | | |
| 0.01%, 1/2/09 | | 10,000,000 | | 9,999,997 |
| Cancara Asset Securitisation Ltd. | | | | |
| 3.28%, 1/28/09 | | 12,000,000 a | | 11,970,750 |
| Citigroup Funding Inc. | | | | |
| 3.15%, 3/9/09 | | 10,000,000 | | 9,942,213 |
| Edison Asset Securitization LLC | | | | |
| 3.02%, 1/28/09 | | 8,000,000 a | | 7,982,000 |
| Fairway Finance Company LLC | | | | |
| 1.61%, 2/6/09 | | 9,000,000 a | | 8,985,600 |
| General Electric Capital Corp. | | | | |
| 2.52%, 2/4/09 | | 8,000,000 | | 7,981,111 |
| Gotham Funding Corp. | | | | |
| 1.76%, 2/18/09 | | 10,000,000 a | | 9,976,667 |
| Hannover Funding Company LLC | | | | |
| 2.35%, 1/7/09 | | 12,000,000 a | | 11,995,300 |
| LMA Americas LLC | | | | |
| 2.06%, 2/19/09 | | 10,000,000 a | | 9,972,097 |
| Market Street Funding LLC | | | | |
| 2.51%, 1/15/09 | | 12,000,000 a | | 11,988,333 |
| Prudential Funding LLC | | | | |
| 0.04%, 1/2/09 | | 10,000,000 | | 9,999,989 |
The Portfolio 7
| STATEMENT OF INVESTMENTS (continued) |
| | | Principal | | |
| Commercial Paper (continued) | | Amount ($) | | Value ($) |
| |
| |
|
| Salisbury Receivables Company LLC | | | | |
| 1.81%, 2/6/09 | | 5,000,000 a | | 4,991,000 |
| Santander Central Hispano Finance (Delaware) Inc. | | | | |
| 1.76%, 3/17/09 | | 9,040,000 | | 9,007,042 |
| Sheffield Receivables Corp. | | | | |
| 1.81%, 2/6/09 | | 5,000,000 a | | 4,991,000 |
| UBS Finance Delaware LLC | | | | |
| 0.01%, 1/2/09 | | 10,000,000 | | 9,999,997 |
| Unicredit Delaware Inc. | | | | |
| 3.07%, 3/16/09 | | 10,000,000 | | 9,937,922 |
| Working Capital Management Co. L.P. | | | | |
| 2.77%, 2/6/09 | | 12,000,000 a | | 11,967,000 |
| Total Commercial Paper | | | | |
| (cost $223,533,125) | | | | 223,533,125 |
| |
| |
|
| |
| Corporate Notes—5.2% | | | | |
| |
| |
|
| General Electric Capital Corp. | | | | |
| 0.50%, 1/27/09 | | 5,000,000 b | | 5,000,000 |
| Wachovia Bank, N.A. | | | | |
| 1.54%, 3/23/09 | | 10,000,000 b | | 9,991,058 |
| Total Corporate Notes | | | | |
| (cost $14,991,058) | | | | 14,991,058 |
| |
| |
|
| |
| Time Deposits—6.9% | | | | |
| |
| |
|
| Compass Bank (Grand Cayman) | | | | |
| 0.03%, 1/2/09 | | 10,000,000 | | 10,000,000 |
| Marshall & Ilsley Bank | | | | |
| Milwaukee, WI (Grand Cayman) | | | | |
| 0.02%, 1/2/09 | | 10,000,000 | | 10,000,000 |
| Total Time Deposits | | | | |
| (cost $20,000,000) | | | | 20,000,000 |
8
| | | Principal | | |
| Repurchase Agreement—8.6% | | Amount ($) | | Value ($) |
| |
| |
|
| Goldman, Sachs & Co. | | | | |
| .002%, dated 12/31/08, due 1/2/09 in the | | | | |
| amount of $25,000,003 (fully collateralized | | | | |
| by $16,033,000 U.S. Treasury Bonds, | | | | |
| 8.875%, due 2/15/19, value $25,500,026) | | | | |
| (cost $25,000,000) | | 25,000,000 | | 25,000,000 |
| |
| |
|
| |
| Total Investments (cost $283,524,183) | | 97.5% | | 283,524,183 |
| |
| Cash and Receivables (Net) | | 2.5% | | 7,408,815 |
| |
| Net Assets | | 100.0% | | 290,932,998 |
| a Securities exempt from registration under Rule 144A of the Securities Act of 1933.These securities may be resold in |
| transactions exempt from registration, normally to qualified institutional buyers.At December 31, 2008, these |
| securities amounted to $114,784,400 or 39.5% of net assets. |
| b Variable rate security—interest rate subject to periodic change. |
| Portfolio Summary (Unaudited)† | | | | |
| |
| | | Value (%) | | | | Value (%) |
| |
| |
| |
|
| Banking | | 59.8 | | Foreign/Governmental | | 3.4 |
| Asset-Backed/Multi-Seller Programs | | 17.8 | | Insurance | | 3.4 |
| Repurchase Agreement | | 8.6 | | | | |
| Finance | | 4.5 | | | | 97.5 |
| |
| † Based on net assets. | | | | | | |
| See notes to financial statements. | | | | | | |
The Portfolio 9
STATEMENT OF ASSETS AND LIABILITIES
December 31, 2008 |
| | | Cost | | Value |
| |
| |
|
| Assets ($): | | | | |
| Investments in securities—See Statement of | | | | |
| Investments—Note 1(b) | | 283,524,183 | | 283,524,183 |
| Cash | | | | 7,809,137 |
| Interest receivable | | | | 4,416 |
| Prepaid expenses | | | | 54,441 |
| | | | | 291,392,177 |
| |
| |
|
| Liabilities ($): | | | | |
| Due to The Dreyfus Corporation and affiliates—Note 2(a) | | | | 104,063 |
| Payable for shares of Beneficial Interest redeemed | | | | 312,080 |
| Accrued expenses | | | | 43,036 |
| | | | | 459,179 |
| |
| |
|
| Net Assets ($) | | | | 290,932,998 |
| |
| |
|
| Composition of Net Assets ($): | | | | |
| Paid-in capital | | | | 290,944,752 |
| Accumulated net realized gain (loss) on investments | | | | (11,754) |
| |
| |
|
| Net Assets ($) | | | | 290,932,998 |
| |
| |
|
| Shares Outstanding | | | | |
| (unlimited number of $.001 par value shares of Beneficial interest authorized) | | 290,944,683 |
| Net Asset Value, offering and redemption price per share ($) | | | | 1.00 |
| |
| See notes to financial statements. | | | | |
10
STATEMENT OF OPERATIONS
Year Ended December 31, 2008 |
| Investment Income ($): | | |
| Interest Income | | 9,247,773 |
| Expenses: | | |
| Investment advisory fee—Note 2(a) | | 1,492,523 |
| Custodian fees—Note 2(a) | | 67,526 |
| Treasury insurance expense—Note 1(e) | | 47,121 |
| Professional fees | | 40,090 |
| Trustees’ fees and expenses—Note 2(b) | | 19,940 |
| Prospectus and shareholders’ reports | | 7,965 |
| Shareholder servicing costs—Note 2(a) | | 4,744 |
| Miscellaneous | | 14,345 |
| Total Expenses | | 1,694,254 |
| Less—reduction in fees due to earnings credits—Note 1(b) | | (7,326) |
| Net Expenses | | 1,686,928 |
| Investment Income—Net | | 7,560,845 |
| |
|
| Net Realized Gain (Loss) on Investments—Note 1(b) ($) | | 10,725 |
| Net Increase in Net Assets Resulting from Operations | | 7,571,570 |
| |
| See notes to financial statements. | | |
The Portfolio 11
STATEMENT OF CHANGES IN NET ASSETS
| | | Year Ended December 31, |
| | |
|
| | | 2008 | | 2007 |
| |
| |
|
| Operations ($): | | | | |
| Investment income—net | | 7,560,845 | | 13,363,795 |
| Net realized gain (loss) on investments | | 10,725 | | 1,134 |
| Net Increase (Decrease) in Net Assets | | | | |
| Resulting from Operations | | 7,571,570 | | 13,364,929 |
| |
| |
|
| Dividends to Shareholders from ($): | | | | |
| Investment income—net | | (7,560,845) | | (13,403,840) |
| |
| |
|
| Beneficial Interest Transactions ($1.00 per share): | | | | |
| Net proceeds from shares sold | | 244,021,667 | | 723,408,303 |
| Dividends reinvested | | 7,560,845 | | 13,403,840 |
| Cost of shares redeemed | | (261,462,813) | | (587,271,974) |
| Increase (Decrease) in Net Assets from | | | | |
| Beneficial Interest Transactions | | (9,880,301) | | 149,540,169 |
| Total Increase (Decrease) in Net Assets | | (9,869,576) | | 149,501,258 |
| |
| |
|
| Net Assets ($): | | | | |
| Beginning of Period | | 300,802,574 | | 151,301,316 |
| End of Period | | 290,932,998 | | 300,802,574 |
| |
| See notes to financial statements. | | | | |
12
FINANCIAL HIGHLIGHTS
The following table describes the performance for the fiscal periods indicated.Total return shows how much your investment in the portfolio would have increased (or decreased) during each period, assuming you had reinvested all dividends and dis-tributions.These figures have been derived from the portfolio’s financial statements.
| | | | | Year Ended December 31, | | |
| | |
| |
| |
|
| | | 2008 | | 2007 | | 2006 | | 2005 | | 2004 |
| |
| |
| |
| |
| |
|
| Per Share Data ($): | | | | | | | | | | |
| Net asset value, beginning of period | | 1.00 | | 1.00 | | 1.00 | | 1.00 | | 1.00 |
| Investment Operations: | | | | | | | | | | |
| Investment income—net | | .025 | | .048 | | .045 | | .026 | | .008 |
| Distributions: | | | | | | | | | | |
| Dividends from investment income—net | | (.025) | | (.048) | | (.045) | | (.026) | | (.008) |
| Net asset value, end of period | | 1.00 | | 1.00 | | 1.00 | | 1.00 | | 1.00 |
| |
| |
| |
| |
| |
|
| Total Return (%) | | 2.54 | | 4.86 | | 4.58 | | 2.65 | | .80 |
| |
| |
| |
| |
| |
|
| Ratios/Supplemental Data (%): | | | | | | | | | | |
| Ratio of total expenses | | | | | | | | | | |
| to average net assets | | .57 | | .55 | | .57 | | .59 | | .60 |
| Ratio of net expenses | | | | | | | | | | |
| to average net assets | | .57a | | .55a | | .57a | | .59a | | .60a |
| Ratio of net investment income | | | | | | | | | | |
| to average net assets | | 2.53 | | 4.75 | | 4.56 | | 2.66 | | .77 |
| |
| |
| |
| |
| |
|
| Net Assets, end of period ($ x 1,000) | | 290,933 | | 300,803 | | 151,301 | | 131,210 | | 104,229 |
| |
| a Expense waivers and/or reimbursements amounted to less than .01%. | | | | | | |
| See notes to financial statements. | | | | | | | | | | |
The Portfolio 13
NOTES TO FINANCIAL STATEMENTS
NOTE 1—Significant Accounting Policies:
Dreyfus Variable Investment Fund (the “fund”) is registered under the Investment Company Act of 1940, as amended (the “Act”), as an open-end management investment company, operating as a series company currently offering seven series, including the Money Market Portfolio (the “portfolio”). The portfolio is only offered to separate accounts established by insurance companies to fund variable annuity contracts and variable life insurance policies.The portfolio is a diversified series. The portfolio’s investment objective is to provide as high a level of current income as is consistent with the preservation of capital and the maintenance of liquidity.The Dreyfus Corporation (the “Manager” or “Dreyfus”), a wholly-owned subsidiary of The Bank of New York Mellon Corporation (“BNY Mellon”), serves as the portfolio’s investment adviser. MBSC Securities Corporation (the “Distributor”), a wholly-owned subsidiary of the Manager, is the distributor of the portfolio’s shares, which are sold without a sales charge.
Effective July 1, 2008, BNY Mellon reorganized and consolidated a number of its banking and trust company subsidiaries.As a result of the reorganization, any services previously provided to the portfolio by Mellon Bank, N.A. or Mellon Trust of New England, N.A. are now provided by The Bank of New York Mellon (formerly, The Bank of New York).
It is the portfolio’s policy to maintain a continuous net asset value per share of $1.00; the portfolio has adopted certain investment, portfolio valuation and dividend and distribution policies to enable it to do so. There is no assurance, however, that the portfolio will be able to maintain a stable net asset value per share of $1.00.
The fund accounts separately for the assets, liabilities and operations of each series. Expenses directly attributable to each series are charged to that series’ operations; expenses which are applicable to all series are allocated among them on a pro rata basis.
14
The portfolio’s financial statements are prepared in accordance with U.S. generally accepted accounting principles, which may require the use of management estimates and assumptions.Actual results could differ from those estimates.
The fund enters into contracts that contain a variety of indemnifica-tions.The portfolio’s maximum exposure under these arrangements is unknown. The portfolio does not anticipate recognizing any loss related to these arrangements.
(a) Portfolio valuation: Investments in securities are valued at amortized cost in accordance with Rule 2a-7 of the Act, which has been determined by the Board of Trustees to represent the fair value of the portfolio’s investments.
The portfolio adopted Statement of Financial Accounting Standards No. 157 “FairValue Measurements” (“FAS 157”). FAS 157 establishes an authoritative definition of fair value, sets out a framework for measuring fair value, and requires additional disclosures about fair value measurements.
Various inputs are used in determining the value of the portfolio’s investments relating to FAS 157.These inputs are summarized in the three broad levels listed below.
| | Level 1—quoted prices in active markets for identical securities.
Level 2—other significant observable inputs (including quoted
prices for similar securities, interest rates, prepayment speeds, credit
risk, etc.).
Level 3—significant unobservable inputs (including the portfolio’s
own assumptions in determining the fair value of investments). |
The inputs or methodology used for valuing securities are not necessarily an indication of the risk associated with investing in those securities. For example, money market securities are valued using amortized
The Portfolio 15
| NOTES TO FINANCIAL STATEMENTS (continued) |
cost, in accordance with rules under the Act. Generally, amortized cost approximates the current fair value of a security, but since the value is not obtained from a quoted price in an active market, such securities are reflected as Level 2.
The following is a summary of the inputs used as of December 31, 2008 in valuing the portfolio’s investments carried at fair value:
| | | Investments in |
| Valuation Inputs | | Securities ($) |
| |
|
| Level 1—Quoted Prices | | 0 |
| Level 2—Other Significant Observable Inputs | | 283,524,183 |
| Level 3—Significant Unobservable Inputs | | 0 |
| Total | | 283,524,183 |
(b) Securities transactions and investment income: Securities transactions are recorded on a trade date basis. Interest income, adjusted for accretion of discount and amortization of premium on investments, is earned from settlement date and recognized on the accrual basis. Realized gains and losses from securities transactions are recorded on the identified cost basis. Cost of investments represents amortized cost.
In March 2008, the Financial Accounting Standards Board released Statement of Financial Accounting Standards No. 161, “Disclosures about Derivative Instruments and Hedging Activities” (“FAS 161”). FAS 161 requires qualitative disclosures about objectives and strategies for using derivatives, quantitative disclosures about fair value amounts of gains and losses on derivative instruments, and disclosures about credit-risk-related contingent features in derivative agreements. The application of FAS 161 is required for fiscal years and interim periods beginning after November 15, 2008. At this time, management is evaluating the implications of FAS 161 and its impact on the financial statements and the accompanying notes has not yet been determined.
The portfolio has arrangements with the custodian and cash management banks whereby the portfolio may receive earnings credits when positive cash balances are maintained, which are used to offset
16
custody and cash management fees. For financial reporting purposes, the portfolio includes net earnings credits as an expense offset in the Statement of Operations.
The portfolio may enter into repurchase agreements with financial institutions, deemed to be creditworthy by the Manager, subject to the seller’s agreement to repurchase and the portfolio’s agreement to resell such securities at a mutually agreed upon price. Securities purchased subject to repurchase agreements are deposited with the portfolio’s custodian and, pursuant to the terms of the repurchase agreement, must have an aggregate market value greater than or equal to the terms of the repurchase price plus accrued interest at all times. If the value of the underlying securities falls below the value of the repurchase price plus accrued interest, the portfolio will require the seller to deposit additional collateral by the next business day. If the request for additional collateral is not met, or the seller defaults on its repurchase obligation, the portfolio maintains its right to sell the underlying securities at market val ue and may claim any resulting loss against the seller.
(c) Dividends to shareholders: It is the policy of the portfolio to declare dividends daily from investment income-net. Such dividends are paid monthly. Dividends from net realized capital gains, if any, are normally declared and paid annually, but the portfolio may make distributions on a more frequent basis to comply with the distribution requirements of the Internal Revenue Code of 1986 as amended (the “Code”). To the extent that net realized capital gains can be offset by capital loss carryovers, it is the policy of the portfolio not to distribute such gains.
(d) Federal income taxes: It is the policy of the portfolio to continue to qualify as a regulated investment company, if such qualification is in the best interests of its shareholders, by complying with the applicable provisions of the Code, and to make distributions of taxable income sufficient to relieve it from substantially all federal income and excise taxes.
The Portfolio 17
| NOTES TO FINANCIAL STATEMENTS (continued) |
As of and during the period ended December 31, 2008, the portfolio did not have any liabilities for any unrecognized tax positions. The portfolio recognizes interest and penalties, if any, related to unrecognized tax positions as income tax expense in the Statement of Operations. During the period, the portfolio did not incur any interest or penalties.
Each of the tax years in the four-year period ended December 31, 2008 remains subject to examination by the Internal Revenue Service and state taxing authorities.
At December 31, 2008 the components of accumulated earnings on a tax basis were substantially the same as for financial reporting purposes.
The accumulated capital loss carryover of $11,754 is available for federal income tax purposes to be applied against future net securities profits, if any, realized subsequent to December 31, 2008. If not applied, $10,957 of the carryover expires in fiscal 2010, $17 expires in fiscal 2011, $65 expires in fiscal 2013 and $715 expires in fiscal 2014.
The tax character of distributions paid to shareholders during the fiscal periods ended December 31, 2008 and December 31, 2007 were all ordinary income.
At December 31, 2008, the cost of investments for federal income tax purposes was substantially the same as the cost for financial reporting purposes (see the Statement of Investments).
(e) Treasury’s Temporary Guarantee Program: The portfolio has entered into a Guarantee Agreement with the United States Department of theTreasury (the“Treasury”) to participate in theTreasury’sTemporary Guarantee Program for Money Market Funds (the “Program”).
Under the Program, the Treasury guarantees the share price of shares of the portfolio held by shareholders as of September 19, 2008 at $1.00 per share if the portfolio’s net asset value per share falls below $0.995 (a “Guarantee Event”) and the portfolio liquidates. Recovery under the Program is subject to certain conditions and limitations.
18
Portfolio shares acquired by investors after September 19, 2008 that increase the number of portfolio shares the investor held at the close of business on September 19, 2008 are not eligible for protection under the Program. In addition, portfolio shares acquired by investors who did not hold portfolio shares at the close of business on September 19, 2008 are not eligible for protection under the Program.
The Program, which was originally set to expire on December 18, 2008, has been extended by the Treasury until April 30, 2009, after which the Secretary of theTreasury will review the need for, and terms of, the Program. Participation in the initial term and the extended period of the Program required a payment to the Treasury in the amount of .015% and .022%, respectively, of the portfolio’s shares outstanding as of September 19, 2008 (valued at $1.00 per share). This expense is being borne by the portfolio without regard to any expense limitation currently in effect.
NOTE 2—Investment Advisory Fee and Other Transactions With Affiliates:
(a) Pursuant to an Investment Advisory Agreement with the Manager, the investment advisory fee is computed at the annual rate of .50% of the value of the portfolio’s average daily net assets and is payable monthly.
The Manager has undertaken to reimburse expenses in the event that current yields drop below a certain level.This undertaking is voluntary and not contractual and may be terminated at any time. During the period ended December 31, 2008, there was no expense reimbursement pursuant to the undertaking.
The portfolio compensates Dreyfus Transfer, Inc., a wholly-owned subsidiary of the Manager, under a transfer agency agreement for providing personnel and facilities to perform transfer agency services for the portfolio. During the period ended December 31, 2008, the portfolio was charged $347 pursuant to the transfer agency agreement.
The Portfolio 19
| NOTES TO FINANCIAL STATEMENTS (continued) |
The portfolio compensates The Bank of New York Mellon, a subsidiary of BNY Mellon and an affiliate of Dreyfus, under a cash management agreement for performing cash management services related to portfolio subscriptions and redemptions. During the period ended December 31, 2008, the portfolio was charged $31 pursuant to the cash management agreement.
The portfolio compensates The Bank of New York Mellon under a custody agreement for providing custodial services for the portfolio. During the period ended December 31, 2008, the portfolio was charged $67,526 pursuant to the custody agreement.
During the period ended December 31, 2008, the portfolio was charged $5,403 for services performed by the Chief Compliance Officer.
The components of “Due to The Dreyfus Corporation and affiliates” in the Statement of Assets and Liabilities consist of: investment advisory fee $102,815, chief compliance officer fees $1,197 and transfer agency per account fees $51.
(b) Each Board member also serves as a Board member of other funds within the Dreyfus complex. Annual retainer fees and attendance fees are allocated to each fund based on net assets.
20
REPORT OF INDEPENDENT REGISTERED
PUBLIC ACCOUNTING FIRM |
Shareholders and Board of Trustees
Dreyfus Variable Investment Fund, Money Market Portfolio
We have audited the accompanying statement of assets and liabilities, including the statement of investments, of Dreyfus Variable Investment Fund, Money Market Portfolio (one of the series comprising Dreyfus Variable Investment Fund) as of December 31, 2008, and the related statement of operations for the year then ended, the statement of changes in net assets for each of the two years in the period then ended, and financial highlights for each of the years indicated therein. These financial statements and financial highlights are the responsibility of the Fund’s management. Our responsibility is to express an opinion on these financial statements and financial highlights based on our audits.
We conducted our audits in accordance with the standards of the Public Company Accounting Oversight Board (United States).Those standards require that we plan and perform the audit to obtain reasonable assurance about whether the financial statements and financial highlights are free of material misstatement.We were not engaged to perform an audit of the Fund’s internal control over financial reporting. Our audits included consideration of internal control over financial reporting as a basis for designing audit procedures that are appropriate in the circumstances, but not for the purpose of expressing an opinion on the effectiveness of the Fund’s internal control over financial reporting. Accordingly, we express no such opinion.An audit also includes examining, on a test basis, evidence supporting the amounts and disclosures in the financial statements and financial highlights, assessing the accounting principles used and significa nt estimates made by management, and evaluating the overall financial statement presentation. Our procedures included confirmation of securities owned as of December 31, 2008 by correspondence with the custodian and others. We believe that our audits provide a reasonable basis for our opinion.
In our opinion, the financial statements and financial highlights referred to above present fairly, in all material respects, the financial position of DreyfusVariable Investment Fund, Money Market Portfolio at December 31, 2008, the results of its operations for the year then ended, the changes in its net assets for each of the two years in the period then ended, and the financial highlights for each of the indicated years,in conformity with U.S. generally accepted accounting principles.
New York, New York
February 10, 2009 |
The Portfolio 21
BOARD MEMBERS INFORMATION (Unaudited)

22

The Portfolio 23
BOARD MEMBERS INFORMATION (Unaudited) (continued)

24
OFFICERS OF THE FUND (Unaudited)

The Portfolio 25
OFFICERS OF THE FUND (Unaudited) (continued)

26
NOTES
For More Information

Telephone 1-800-554-4611 or 516-338-3300
Mail The Dreyfus Family of Funds, 144 Glenn Curtiss Boulevard, Uniondale, NY 11556-0144 Attn: Investments Division
The portfolio files its complete schedule of portfolio holdings with the Securities and Exchange Commission (“SEC”) for the first and third quarters of each fiscal year on Form N-Q. The portfolio’s Forms N-Q are available on the SEC’s website at http://www.sec.gov and may be reviewed and copied at the SEC’s Public Reference Room in Washington, DC. Information on the operation of the Public Reference Room may be obtained by calling 1-800-SEC-0330.
Information regarding how the portfolio voted proxies relating to portfolio securities for the 12-month period ended June 30, 2008, is available on the SEC’s website at http://www.sec.gov and without charge, upon request, by calling 1-800-645-6561.

| © 2009 MBSC Securities Corporation |
| | Dreyfus Variable
Investment Fund,
Quality Bond Portfolio |
| | ANNUAL REPORT December 31, 2008 |

The views expressed in this report reflect those of the portfolio manager only through the end of the period covered and do not necessarily represent the views of Dreyfus or any other person in the Dreyfus organization.Any such views are subject to change at any time based upon market or other conditions and Dreyfus disclaims any responsibility to update such views. These views may not be relied on as investment advice and, because investment decisions for a Dreyfus portfolio are based on numerous factors, may not be relied on as an indication of trading intent on behalf of any Dreyfus portfolio.
| | Contents |
| |
| | THE PORTFOLIO |
| |
| 2 | A Letter from the CEO |
| |
| 3 | Discussion of Performance |
| |
| 6 | Portfolio Performance |
| |
| 8 | Understanding Your Portfolio’s Expenses |
| |
| 8 | Comparing Your Portfolio’s Expenses With Those of Other Funds |
| |
| 9 | Statement of Investments |
| |
| 25 | Statement of Financial Futures |
| |
| 25 | Statement of Options Written |
| |
| 26 | Statement of Assets and Liabilities |
| |
| 27 | Statement of Operations |
| |
| 28 | Statement of Changes in Net Assets |
| |
| 30 | Financial Highlights |
| |
| 32 | Notes to Financial Statements |
| |
| 46 | Report of Independent Registered Public Accounting Firm |
| |
| 47 | Board Members Information |
| |
| 50 | Officers of the Fund |
| |
| | FOR MORE INFORMATION |
| |
| | Back Cover |
| |
Dreyfus Variable Investment Fund,
Quality Bond Portfolio |
The Portfolio

A LETTER FROM THE CEO
Dear Shareholder: |
We present to you this annual report for Dreyfus Variable Investment Fund, Quality Bond Portfolio, covering the 12-month period from January 1, 2008, through December 31, 2008.
2008 was the most difficult year in decades for the financial markets. A credit crunch that began in 2007 exploded in mid-2008 into a global financial crisis, resulting in the failures of major financial institutions, a deep and prolonged recession and lower investment values across a broad range of asset classes. Governments and regulators throughout the world moved aggressively to curtail the damage, implementing unprecedented reductions of short-term interest rates, massive injections of liquidity into the banking system, government bailouts of struggling companies and plans for massive economic stimulus programs. U.S. government securities generally fared well in the ensuing “flight to quality,” but riskier bond market sectors suffered sharp price declines.
Although we expect the U.S. and global economies to remain weak until longstanding imbalances have worked their way out of the system, the financial markets currently appear to have priced in investors’ generally low expectations.In previous recessions,however,the markets have tended to anticipate economic improvement before it occurs, potentially leading to major rallies when few expected them.That’s why it makes sense to remain disciplined, maintain a long-term perspective and adopt a consistent asset allocation strategy that reflects one’s future goals and attitudes toward risk. As always, we urge you to consult with your financial advisor, who can recommend the course of action that is right for you.
For information about how the portfolio performed during the reporting period, as well as market perspectives, we have provided a Discussion of Performance.
Thank you for your continued confidence and support.
Jonathan R. Baum
Chief Executive Officer
The Dreyfus Corporation
January 15, 2009 |
2

DISCUSSION OF PERFORMANCE
For the period of January 1, 2008, through December 31, 2008, as provided by David Bowser and Peter Vaream, Portfolio Managers
Performance Overview
For the 12-month period ended December 31, 2008, Dreyfus Variable Investment Fund, Quality Bond Portfolio’s Initial shares achieved a total return of –4.18%,and its Service shares achieved a total return of –4.46% .1 The Barclays Capital U.S.Aggregate Bond Index (the “Index”), the portfolio’s benchmark, achieved a total return of 5.24% for the same period.2
With the notable exception of U.S.Treasury securities, most sectors of the U.S. bond market suffered in 2008 as a financial crisis intensified, nearly leading to the collapse of the U.S. and global banking systems. The portfolio produced lower returns than its benchmark, due to its underweight position in U.S.Treasury securities relative to the benchmark and exposure to higher yielding bond market sectors that fared poorly in the downturn.
The Portfolio’s Investment Approach
The portfolio seeks to maximize total return consisting of capital appreciation and current income. To achieve this objective, the portfolio normally invests at least 80% of its assets in bonds, including corporate bonds, mortgage-related securities, collateralized mortgage obligations and asset-backed securities that, when purchased, are A-rated or better or what we believe are the unrated equivalent, and in securities issued or guaranteed by the U.S. government or its agencies or its instrumen-talities.The portfolio may also invest up to 10% of its net assets in non-dollar-denominated foreign securities and up to 20% of its assets in the securities of foreign issues collectively.
Global Financial Crisis Sparked Broad Declines
A credit crunch that began in the sub-prime mortgage market in 2007 developed into a full-blown global financial crisis over the summer of 2008, leading to the failures of several major financial institutions and sending repercussions throughout the world’s credit markets. As the
The Portfolio 3
| DISCUSSION OF PERFORMANCE (continued) |
crisis came close to spinning out of control in September, very difficult liquidity conditions in various markets, including the interbank lending market, nearly led to the collapse of the global banking system. Unprecedented interventions by government and monetary authorities, which pumped billions of dollars of liquidity into the system and rescued struggling corporations, helped thaw frozen credit markets by year-end. These efforts included the Troubled Asset Relief Program (“TARP”) from the U.S. Congress and coordinated cuts of short-term interest rates by central banks, including the Federal Reserve Board, which reduced its target for the overnight federal funds rate to the unprecedented low level of 0% to 0.25% .
Meanwhile, slumping housing markets, rising unemployment and sharply lower consumer confidence exacerbated a downturn in the U.S. economy. Commodity prices that had soared over the first half of 2008 plummeted over the second half when demand abated for energy and construction materials worldwide. In November, the National Bureau of Economic Research officially declared that the U.S. economy has been mired in recession since late 2007.
As market conditions deteriorated, many highly leveraged institutional investors were forced to de-lever their portfolios, selling their more liquid investments to raise cash for margin calls and redemption requests. Consequently, selling pressure intensified even among fundamentally sound fixed-income securities, leading to broadly lower prices for corporate bonds, asset-backed securities, mortgage-backed securities and the sovereign debt of developing nations. Lower-rated bonds were particularly hard-hit. U.S. Treasury securities were a notable exception, gaining considerable value as risk-averse investors flocked to the relatively safe haven provided by U.S. government-backed investments.
Sector Allocation Strategies Weighed on Performance
The portfolio’s longstanding preference for higher yielding bond market sectors detracted from its relative performance in this challenging environment. Relatively light exposure to U.S.Treasury securities, which we believe offered unappealing yields, and an overweight position in investment-grade corporate bonds, commercial mortgage-backed securities
4
and asset-backed securities with sound credit fundamentals weighed on the portfolio’s total return despite generating high current yields.
On the other hand, the portfolio’s interest-rate strategies contributed positively to relative performance, as a “bulleted” emphasis on securities with three- to five-year maturities helped it benefit from widening yield differences along the bond market’s maturity range early in the year. Similarly, a modestly long average duration helped the portfolio participate more fully in the benefits of falling U.S. interest rates. Finally, a modest position in non-dollar securities helped capture the benefits of falling interest rates in Europe.
Anticipating a Return to Fundamentals
As of year-end,the financial crisis has persisted and the economic downturn has worsened. However, low expectations among investors for 2009 appear to have already been priced into bond prices, and unexpected good news could spark a market rally.Therefore, we have maintained the portfolio’s overweight exposure to market sectors that we believe have been punished too severely during the downturn.After extensive credit analysis, we have found what we believe to be particularly compelling values among certain commercial mortgage-backed securities and corporate bonds, which we expect to fare well in an eventual recovery.
January 15, 2009
The portfolio is only available as a funding vehicle under variable life insurance policies or variable annuity contracts issued by insurance companies. Individuals may not purchase shares of the portfolio directly.A variable annuity is an insurance contract issued by an insurance company that enables investors to accumulate assets on a tax-deferred basis for retirement or other long-term goals.The investment objective and policies of Dreyfus Variable Investment Fund, Quality Bond Portfolio may be similar to other funds/portfolios managed or advised by Dreyfus. However, the investment results of the portfolio may be higher or lower than, and may not be comparable to, those of any other Dreyfus fund/portfolio.
| 1 | | Total return includes reinvestment of dividends and any capital gains paid. Past performance is no |
| | | guarantee of future results. Share price and investment return fluctuate such that upon redemption, |
| | | portfolio shares may be worth more or less than their original cost.The portfolio’s performance does |
| | | not reflect the deduction of additional charges and expenses imposed in connection with investing |
| | | in variable insurance contracts, which will reduce returns. |
| 2 | | SOURCE: LIPPER INC. — Reflects reinvestment of dividends and, where applicable, capital |
| | | gain distributions.The Barclays Capital U.S.Aggregate Bond Index is a widely accepted, |
| | | unmanaged total return index of corporate, U.S. government and U.S. government agency debt |
| | | instruments, mortgage-backed securities and asset-backed securities with an average maturity of 1- |
| | | 10 years.The Index does not include fees and expenses to which the portfolio is subject. |
The Portfolio 5
PORTFOLIO PERFORMANCE

| Average Annual Total Returns as of 12/31/08 | | | | | | |
| | | 1 Year | | 5 Years | | 10 Years |
| |
| |
| |
|
| Initial shares | | (4.18)% | | 1.84% | | 3.95% |
| Service shares | | (4.46)% | | 1.56% | | 3.73% |
The data for Service shares primarily represents the results of Initial shares for the period prior to December 31, 2000 (inception date of Service shares). Actual Service shares’ average annual total return and hypothetical growth results would have been lower. See notes below.
† Source: Lipper Inc.
Past performance is not predictive of future performance.The portfolio’s performance shown in the graph and table does not reflect the deduction of taxes that a shareholder would pay on portfolio distributions or the redemption of portfolio shares.
The portfolio’s performance does not reflect the deduction of additional charges and expenses imposed in connection with investing in variable insurance contracts which will reduce returns.
The above graph compares a $10,000 investment made in Initial and Service shares of Dreyfus Variable Investment Fund, Quality Bond Portfolio on 12/31/98 to a $10,000 investment made in the Barclays Capital U.S.Aggregate Index (the “Index”) on that date.
6
The portfolio’s Initial shares are not subject to a Rule 12b-1 fee.The portfolio’s Service shares are subject to a 0.25% annual Rule 12b-1 fee.The performance figures for Service shares reflect the performance of the portfolio’s Initial shares from their inception date through December 30, 2000, and the performance of the portfolio’s Service shares from December 31, 2000 (inception date of Service shares) to December 31, 2008 (blended performance figures).The blended performance figures have not been adjusted to reflect the higher operating expenses of the Service shares. If these expenses had been reflected, the blended performance figures would have been lower. All dividends and capital gain distributions are reinvested.
The portfolio’s performance shown in the line graph takes into account all applicable portfolio fees and expenses.The Index is a widely accepted, unmanaged index of corporate, U.S. government and U.S. government agency debt instruments, mortgage-backed securities and asset-backed securities with an average maturity of 1-10 years. Unlike a mutual fund, the Index is not subject to charges, fees and other expenses. Investors cannot invest directly in any index. Further information relating to portfolio performance, including expense reimbursements, if applicable, is contained in the Financial Highlights section of the prospectus and elsewhere in this report.
The Portfolio 7
UNDERSTANDING YOUR
PORTFOLIO’S EXPENSES (Unaudited) |
As a mutual fund investor, you pay ongoing expenses, such as management fees and other expenses. Using the information below, you can estimate how these expenses affect your investment and compare them with the expenses of other funds.You also may pay one-time transaction expenses, including sales charges (loads) and redemption fees,which are not shown in this section and would have resulted in higher total expenses. For more information, see your portfolio’s prospectus or talk to your financial adviser.
Review your portfolio’s expenses
The table below shows the expenses you would have paid on a $1,000 investment in Dreyfus Variable Investment Fund, Quality Bond Portfolio from July 1, 2008 to December 31, 2008. It also shows how much a $1,000 investment would be worth at the close of the period, assuming actual returns and expenses.
| | Expenses and Value of a $1,000 Investment
assuming actual returns for the six months ended December 31, 2008 |
| | | Initial Shares | | Service Shares |
| |
| |
|
| Expenses paid per $1,000† | | $ 3.90 | | $ 5.13 |
| Ending value (after expenses) | | $965.70 | | $963.30 |
| | COMPARING YOUR PORTFOLIO’S EXPENSES
WITH THOSE OF OTHER FUNDS (Unaudited) |
Using the SEC’s method to compare expenses
The Securities and Exchange Commission (SEC) has established guidelines to help investors assess fund expenses. Per these guidelines, the table below shows your portfolio’s expenses based on a $1,000 investment, assuming a hypothetical 5% annualized return. You can use this information to compare the ongoing expenses (but not transaction expenses or total cost) of investing in the portfolio with those of other funds. All mutual fund shareholder reports will provide this information to help you make this comparison. Please note that you cannot use this information to estimate your actual ending account balance and expenses paid during the period.
| | Expenses and Value of a $1,000 Investment
assuming a hypothetical 5% annualized return for the six months ended December 31, 2008 |
| | | Initial Shares | | Service Shares |
| |
| |
|
| Expenses paid per $1,000† | | $ 4.01 | | $ 5.28 |
| Ending value (after expenses) | | $1,021.17 | | $1,019.91 |
| † Expenses are equal to the portfolio’s annualized expense ratio of .79% for Initial shares and 1.04% for Service |
| shares; multiplied by the average account value over the period, multiplied by 184/366 (to reflect the one-half year |
| period). |
8
| STATEMENT OF INVESTMENTS | | | | | | | | |
| December 31, 2008 | | | | | | | | | | |
| |
| |
| |
| |
| |
|
| |
| |
| |
| |
| | | Coupon | | Maturity | | Principal | | | | |
| Bonds and Notes—120.4% | | Rate (%) | | Date | | Amount ($) | | | | Value ($) |
| |
| |
| |
| |
| |
|
| Aerospace & Defense—.2% | | | | | | | | | | |
| Raytheon, | | | | | | | | | | |
| Sr. Unscd. Notes | | 5.50 | | 11/15/12 | | 210,000 | | | | 212,465 |
| Asset-Backed Ctfs./ | | | | | | | | | | |
| Auto Receivables—3.7% | | | | | | | | | | |
| AmeriCredit Automobile Receivables | | | | | | | | | | |
| Trust, Ser. 2008-AF, Cl. A2A | | 4.47 | | 1/12/12 | | 435,000 | | | | 411,331 |
| AmeriCredit Automobile Receivables | | | | | | | | | | |
| Trust, Ser. 2005-DA, Cl. A3 | | 4.87 | | 12/6/10 | | 237,777 | | | | 232,805 |
| AmeriCredit Automobile Receivables | | | | | | | | | | |
| Trust, Ser. 2006-BG, Cl. A3 | | 5.21 | | 10/6/11 | | 481,719 | | | | 468,874 |
| AmeriCredit Prime Automobile | | | | | | | | | | |
| Receivables Trust, | | | | | | | | | | |
| Ser. 2007-1, Cl. E | | 6.96 | | 3/8/16 | | 256,302 | | a | | 147,374 |
| AmeriCredit Prime Automobile | | | | | | | | | | |
| Receivables Trust, Ser. 2007-2M, | | | | | | | | | | |
| Cl. A2B | | 2.26 | | 11/8/10 | | 87,220 | | b | | 85,657 |
| Capital One Auto Finance Trust, | | | | | | | | | | |
| Ser. 2007-A, Cl. A3B | | 1.20 | | 8/15/11 | | 347,763 | | b | | 330,239 |
| Capital One Auto Finance Trust, | | | | | | | | | | |
| Ser. 2006-C, Cl. A3A | | 5.07 | | 7/15/11 | | 328,231 | | | | 318,313 |
| Capital One Auto Finance Trust, | | | | | | | | | | |
| Ser. 2007-C, Cl. A3A | | 5.13 | | 4/16/12 | | 895,000 | | | | 817,411 |
| Capital One Auto Finance Trust, | | | | | | | | | | |
| Ser. 2007-C, Cl. A2A | | 5.29 | | 5/17/10 | | 16,501 | | | | 16,459 |
| Capital One Auto Finance Trust, | | | | | | | | | | |
| Ser. 2006-A, Cl. A3 | | 5.33 | | 11/15/10 | | 23,960 | | | | 23,879 |
| Ford Credit Auto Owner Trust, | | | | | | | | | | |
| Ser. 2005-C, Cl. C | | 4.72 | | 2/15/11 | | 240,000 | | | | 228,936 |
| Ford Credit Auto Owner Trust, | | | | | | | | | | |
| Ser. 2006-C, Cl. C | | 5.47 | | 9/15/12 | | 215,000 | | | | 144,814 |
| Ford Credit Auto Owner Trust, | | | | | | | | | | |
| Ser. 2007-A, Cl. D | | 7.05 | | 12/15/13 | | 250,000 | | a | | 155,166 |
| Honda Auto Receivables Owner | | | | | | | | | | |
| Trust, Ser. 2008-1, Cl. A2 | | 3.77 | | 9/20/10 | | 175,000 | | | | 172,491 |
| Honda Auto Receivables Owner | | | | | | | | | | |
| Trust, Ser. 2006-1, Cl. A3 | | 5.07 | | 2/18/10 | | 48,671 | | | | 48,618 |
| Hyundai Auto Receivables Trust, | | | | | | | | | | |
| Ser. 2007-A, Cl. A3A | | 5.04 | | 1/17/12 | | 300,000 | | | | 295,045 |
| Triad Auto Receivables Owner | | | | | | | | | | |
| Trust, Ser. 2006-A, Cl. A3 | | 4.77 | | 1/12/11 | | 392,424 | | | | 387,996 |
The Portfolio 9
| STATEMENT OF INVESTMENTS (continued) |
| | | Coupon | | Maturity | | Principal | | | | |
| Bonds and Notes (continued) | | Rate (%) | | Date | | Amount ($) | | | | Value ($) |
| |
| |
| |
| |
| |
|
| Asset-Backed Ctfs./ | | | | | | | | | | |
| Auto Receivables (continued) | | | | | | | | | | |
| Wachovia Auto Loan Owner Trust, | | | | | | | | | | |
| Ser. 2007-1, Cl. D | | 5.65 | | 2/20/13 | | 610,000 | | | | 290,519 |
| WFS Financial Owner Trust, | | | | | | | | | | |
| Ser. 2005-2, Cl. B | | 4.57 | | 11/19/12 | | 325,000 | | | | 319,699 |
| | | | | | | | | | | 4,895,626 |
| Asset-Backed Ctfs./Credit Cards—.7% | | | | | | | | | | |
| American Express Credit Account | | | | | | | | | | |
| Master Trust, Ser. 2007-6, Cl. C | | 1.59 | | 1/15/13 | | 1,400,000 | | a,b | | 913,172 |
| Asset-Backed Ctfs./ | | | | | | | | | | |
| Home Equity Loans—2.3% | | | | | | | | | | |
| Ameriquest Mortgage Securities, | | | | | | | | | | |
| Ser. 2003-11, Cl. AF6 | | 5.14 | | 1/25/34 | | 501,711 | | b | | 394,060 |
| Citicorp Residential Mortgage | | | | | | | | | | |
| Securities, Ser. 2006-2, Cl. A2 | | 5.56 | | 9/25/36 | | 950,000 | | b | | 909,131 |
| CS First Boston Mortgage | | | | | | | | | | |
| Securities, Ser. 2005-C4, Cl. AAB | | 5.07 | | 8/15/38 | | 390,000 | | b | | 319,254 |
| GSAA Home Equity Trust, | | | | | | | | | | |
| Ser. 2006-7, Cl. AV1 | | 0.55 | | 3/25/46 | | 132,378 | | b | | 122,949 |
| JP Morgan Mortgage Acquisition, | | | | | | | | | | |
| Ser. 2007-HE1, Cl. AF1 | | 0.57 | | 3/25/47 | | 583,893 | | b | | 461,406 |
| Mastr Asset Backed Securities | | | | | | | | | | |
| Trust, Ser. 2006-AM1, Cl. A2 | | 0.60 | | 1/25/36 | | 170,840 | | b | | 159,253 |
| Ownit Mortgage Loan Asset-Backed | | | | | | | | | | |
| Certificates, Ser. 2005-5, Cl. A2B | | 0.76 | | 10/25/36 | | 417,636 | | b | | 325,268 |
| Residential Asset Securities, | | | | | | | | | | |
| Ser. 2005-EMX4, Cl. A2 | | 0.73 | | 11/25/35 | | 447,765 | | b | | 376,426 |
| Sovereign Commercial Mortgage | | | | | | | | | | |
| Securities Trust, | | | | | | | | | | |
| Ser. 2007-C1, Cl. D | | 5.78 | | 7/22/30 | | 270,000 | | a,b | | 28,490 |
| | | | | | | | | | | 3,096,237 |
| Asset-Backed Ctfs./ | | | | | | | | | | |
| Manufactured Housing—.1% | | | | | | | | | | |
| Green Tree Financial, | | | | | | | | | | |
| Ser. 1994-7, Cl. M1 | | 9.25 | | 3/15/20 | | 156,977 | | | | 135,830 |
| Banks—6.7% | | | | | | | | | | |
| Bank of America, | | | | | | | | | | |
| Jr. Sub. Bonds | | 8.00 | | 12/29/49 | | 870,000 | | b | | 626,678 |
| Barclays Bank, | | | | | | | | | | |
| Jr. Sub. Bonds | | 5.93 | | 9/29/49 | | 460,000 | | a,b | | 169,350 |
10
| | | | | Coupon | | Maturity | | Principal | | | | |
| Bonds and Notes (continued) | | Rate (%) | | Date | | Amount ($) | | | | Value ($) |
| |
| |
| |
| |
| |
|
| Banks (continued) | | | | | | | | | | | | |
| Barclays Bank, | | | | | | | | | | | | |
| Sub. Bonds | | | | 7.70 | | 4/29/49 | | 430,000 | | a,b | | 284,954 |
| Chevy Chase Bank, | | | | | | | | | | | | |
| Sub. Notes | | | | 6.88 | | 12/1/13 | | 260,000 | | | | 209,625 |
| Chuo Mitsui Trust & Banking, | | | | | | | | | | | | |
| Jr. Sub. Notes | | | | 5.51 | | 12/29/49 | | 245,000 | | a,b | | 168,798 |
| Colonial Bank, | | | | | | | | | | | | |
| Sub. Notes | | | | 6.38 | | 12/1/15 | | 500,000 | | | | 333,853 |
| European Investment Bank, | | | | | | | | | | | | |
| Sr. Unscd. Notes | | NZD | | 7.00 | | 1/18/12 | | 2,400,000 | | c | | 1,508,338 |
| M&T Bank, | | | | | | | | | | | | |
| Sr. Unscd. Bonds | | | | 5.38 | | 5/24/12 | | 190,000 | | | | 174,747 |
| Manufacturers & Traders Trust, | | | | | | | | | | | | |
| Sub. Notes | | | | 5.59 | | 12/28/20 | | 275,000 | | b | | 197,580 |
| Marshall & Ilsley Bank, | | | | | | | | | | | | |
| Sub. Notes, Ser. BN | | | | 2.48 | | 12/4/12 | | 1,750,000 | | b | | 1,370,558 |
| NB Capital Trust IV, | | | | | | | | | | | | |
| Bank Gtd. Cap. Secs. | | | | 8.25 | | 4/15/27 | | 620,000 | | | | 513,983 |
| Royal Bank of Scotland Group, | | | | | | | | | | | | |
| Jr. Sub. Bonds | | | | 6.99 | | 10/29/49 | | 550,000 | | a,b | | 257,469 |
| Shinsei Finance II, | | | | | | | | | | | | |
| Unscd. Bonds | | | | 7.16 | | 7/29/49 | | 100,000 | | a,b | | 20,875 |
| Sovereign Bancorp, | | | | | | | | | | | | |
| Sr. Unscd. Notes | | | | 1.73 | | 3/23/10 | | 370,000 | | b | | 328,632 |
| Sovereign Bancorp, | | | | | | | | | | | | |
| Sr. Unscd. Notes | | | | 4.80 | | 9/1/10 | | 525,000 | | b | | 471,098 |
| Sumitomo Mitsui Banking, | | | | | | | | | | | | |
| Sub. Notes | | EUR | | 4.38 | | 7/29/49 | | 210,000 | | b,c | | 169,103 |
| Sumitomo Mitsui Banking, | | | | | | | | | | | | |
| Sub. Notes | | | | 5.63 | | 7/29/49 | | 255,000 | | a,b | | 189,093 |
| SunTrust Preferred Capital I, | | | | | | | | | | | | |
| Bank Gtd. Notes | | | | 5.85 | | 12/31/49 | | 435,000 | | b | | 235,035 |
| Wachovia, | | | | | | | | | | | | |
| Sub. Notes | | | | 6.38 | | 1/15/09 | | 405,000 | | | | 404,301 |
| Wells Fargo & Co., | | | | | | | | | | | | |
| Sub. Notes | | | | 6.38 | | 8/1/11 | | 290,000 | | | | 296,183 |
| Wells Fargo Capital XIII, | | | | | | | | | | | | |
| Bank Gtd. Secs. | | | | 7.70 | | 12/29/49 | | 1,140,000 | | b | | 941,654 |
| | | | | | | | | | | | | 8,871,907 |
The Portfolio 11
| STATEMENT OF INVESTMENTS (continued) |
| | | Coupon | | Maturity | | Principal | | | | |
| Bonds and Notes (continued) | | Rate (%) | | Date | | Amount ($) | | | | Value ($) |
| |
| |
| |
| |
| |
|
| Building & Construction—.1% | | | | | | | | | | |
| Masco, | | | | | | | | | | |
| Sr. Unscd. Notes | | 2.40 | | 3/12/10 | | 240,000 | | b | | 187,677 |
| Chemicals—.3% | | | | | | | | | | |
| Lubrizol, | | | | | | | | | | |
| Gtd. Notes | | 4.63 | | 10/1/09 | | 445,000 | | | | 437,174 |
| Commercial & Professional | | | | | | | | | | |
| Services—1.0% | | | | | | | | | | |
| Donnelley (R.R.) and Sons, | | | | | | | | | | |
| Sr. Unscd. Notes | | 5.63 | | 1/15/12 | | 430,000 | | | | 382,673 |
| ERAC USA Finance, | | | | | | | | | | |
| Notes | | 3.72 | | 4/30/09 | | 110,000 | | a,b | | 104,943 |
| ERAC USA Finance, | | | | | | | | | | |
| Bonds | | 5.60 | | 5/1/15 | | 310,000 | | a | | 228,982 |
| ERAC USA Finance, | | | | | | | | | | |
| Gtd. Notes | | 6.38 | | 10/15/17 | | 500,000 | | a | | 347,530 |
| ERAC USA Finance, | | | | | | | | | | |
| Notes | | 7.95 | | 12/15/09 | | 210,000 | | a | | 200,925 |
| | | | | | | | �� | | | 1,265,053 |
| Commercial Mortgage | | | | | | | | | | |
| Pass-Through Ctfs.—5.9% | | | | | | | | | | |
| Banc of America Commercial | | | | | | | | | | |
| Mortgage, Ser. 2002-2, Cl. A3 | | 5.12 | | 7/11/43 | | 190,000 | | | | 176,620 |
| Bayview Commercial Asset Trust, | | | | | | | | | | |
| Ser. 2006-SP1, Cl. A1 | | 0.74 | | 4/25/36 | | 59,543 | | a,b | | 47,039 |
| Bayview Commercial Asset Trust, | | | | | | | | | | |
| Ser. 2004-1, Cl. A | | 0.83 | | 4/25/34 | | 126,611 | | a,b | | 92,290 |
| Bayview Commercial Asset Trust, | | | | | | | | | | |
| Ser. 2003-2, Cl. A | | 1.05 | | 12/25/33 | | 124,188 | | a,b | | 103,249 |
| Bayview Commercial Asset Trust, | | | | | | | | | | |
| Ser. 2006-2A, Cl. B2 | | 1.94 | | 7/25/36 | | 345,105 | | a,b | | 173,899 |
| Bayview Commercial Asset Trust, | | | | | | | | | | |
| Ser. 2006-1A, Cl. B2 | | 2.17 | | 4/25/36 | | 82,676 | | a,b | | 39,610 |
| Bayview Commercial Asset Trust, | | | | | | | | | | |
| Ser. 2005-3A, Cl. B3 | | 3.47 | | 11/25/35 | | 86,523 | | a,b | | 43,201 |
| Bayview Commercial Asset Trust, | | | | | | | | | | |
| Ser. 2005-4A, Cl. B3 | | 3.97 | | 1/25/36 | | 64,035 | | a,b | | 19,210 |
| Bear Stearns Commercial Mortgage | | | | | | | | | | |
| Securities, Ser. 2006-PW12, | | | | | | | | | | |
| Cl. AAB | | 5.69 | | 9/11/38 | | 430,000 | | b | | 352,123 |
12
| | | Coupon | | Maturity | | Principal | | | | |
| Bonds and Notes (continued) | | Rate (%) | | Date | | Amount ($) | | | | Value ($) |
| |
| |
| |
| |
| |
|
| Commercial Mortgage | | | | | | | | | | |
| Pass-Through Ctfs. (continued) | | | | | | | | | | |
| Credit Suisse/Morgan Stanley | | | | | | | | | | |
| Commercial Mortgage Certificates, | | | | | | | | | | |
| Ser. 2006-HC1A, Cl. A1 | | 1.39 | | 5/15/23 | | 418,266 | | a,b | | 335,607 |
| Crown Castle Towers, | | | | | | | | | | |
| Ser. 2006-1A, Cl. AFX | | 5.24 | | 11/15/36 | | 950,000 | | a | | 789,963 |
| Crown Castle Towers, | | | | | | | | | | |
| Ser. 2006-1A, Cl. B | | 5.36 | | 11/15/36 | | 190,000 | | a | | 138,700 |
| Crown Castle Towers, | | | | | | | | | | |
| Ser. 2006-1A, Cl. C | | 5.47 | | 11/15/36 | | 505,000 | | a | | 355,055 |
| Crown Castle Towers, | | | | | | | | | | |
| Ser. 2005-1A, Cl. D | | 5.61 | | 6/15/35 | | 240,000 | | a | | 168,739 |
| Crown Castle Towers, | | | | | | | | | | |
| Ser. 2006-1A, Cl. D | | 5.77 | | 11/15/36 | | 350,000 | | a | | 220,500 |
| Global Signal Trust, | | | | | | | | | | |
| Ser. 2006-1, Cl. C | | 5.71 | | 2/15/36 | | 350,000 | | a | | 262,500 |
| Global Signal Trust, | | | | | | | | | | |
| Ser. 2006-1, Cl. D | | 6.05 | | 2/15/36 | | 340,000 | | a | | 246,415 |
| Global Signal Trust, | | | | | | | | | | |
| Ser. 2006-1, Cl. E | | 6.50 | | 2/15/36 | | 170,000 | | a | | 116,117 |
| Goldman Sachs Mortgage Securities | | | | | | | | | | |
| Corporation II, Ser. 2007-EOP, Cl. B | | 2.13 | | 3/6/20 | | 1,065,000 | | a,b | | 685,519 |
| Goldman Sachs Mortgage Securities | | | | | | | | | | |
| Corporation II, Ser. 2007-EOP, Cl. E | | 2.32 | | 3/6/20 | | 395,000 | | a,b | | 254,121 |
| Goldman Sachs Mortgage Securities | | | | | | | | | | |
| Corporation II, Ser. 2007-EOP, | | | | | | | | | | |
| Cl. K | | 2.93 | | 3/6/20 | | 225,000 | | a,b | | 135,656 |
| JP Morgan Chase Commercial | | | | | | | | | | |
| Mortgage Securities, | | | | | | | | | | |
| Ser. 2004-C1, Cl. A2 | | 4.30 | | 1/15/38 | | 340,000 | | | | 313,419 |
| JP Morgan Chase Commercial | | | | | | | | | | |
| Mortgage Securities, | | | | | | | | | | |
| Ser. 2005-LDP5, Cl. A2 | | 5.20 | | 12/15/44 | | 725,000 | | | | 650,544 |
| Merrill Lynch Mortgage Trust, | | | | | | | | | | |
| Ser. 2005-CKI1, Cl. A2 | | 5.22 | | 11/12/37 | | 165,000 | | b | | 149,317 |
| Merrill Lynch Mortgage Trust, | | | | | | | | | | |
| Ser. 2002-MW1, Cl. A3 | | 5.40 | | 7/12/34 | | 556,258 | | | | 542,654 |
| Morgan Stanley Capital I, | | | | | | | | | | |
| Ser. 2005-HQ5, Cl. A2 | | 4.81 | | 1/14/42 | | 460,340 | | | | 446,371 |
The Portfolio 13
| STATEMENT OF INVESTMENTS (continued) |
| | | Coupon | | Maturity | | Principal | | | | |
| Bonds and Notes (continued) | | Rate (%) | | Date | | Amount ($) | | | | Value ($) |
| |
| |
| |
| |
| |
|
| Commercial Mortgage | | | | | | | | | | |
| Pass-Through Ctfs. (continued) | | | | | | | | | | |
| SBA CMBS Trust, | | | | | | | | | | |
| Ser. 2006-1A, Cl. D | | 5.85 | | 11/15/36 | | 135,000 | | a | | 95,850 |
| TIAA Seasoned Commercial Mortgage | | | | | | | | | | |
| Trust, Ser. 2007-C4, Cl. A3 | | 6.09 | | 8/15/39 | | 325,000 | | b | | 280,847 |
| Wachovia Bank Commercial Mortgage | | | | | | | | | | |
| Trust, Ser. 2005-C16, Cl. A2 | | 4.38 | | 10/15/41 | | 359,761 | | | | 340,423 |
| Wachovia Bank Commercial Mortgage | | | | | | | | | | |
| Trust, Ser. 2005-C19, Cl. A5 | | 4.66 | | 5/15/44 | | 300,000 | | | | 263,128 |
| | | | | | | | | | | 7,838,686 |
| Diversified Financial Services—8.3% | | | | | | | | | | |
| American Express Credit, | | | | | | | | | | |
| Sr. Unscd. Notes | | 1.93 | | 11/9/09 | | 315,000 | | b | | 292,989 |
| Ameriprise Financial, | | | | | | | | | | |
| Jr. Sub. Notes | | 7.52 | | 6/1/66 | | 233,000 | | b | | 126,320 |
| Amvescap, | | | | | | | | | | |
| Gtd. Notes | | 5.38 | | 2/27/13 | | 250,000 | | | | 222,247 |
| Boeing Capital, | | | | | | | | | | |
| Sr. Unscd. Notes | | 7.38 | | 9/27/10 | | 490,000 | | | | 511,685 |
| Capmark Financial Group, | | | | | | | | | | |
| Gtd. Notes | | 5.88 | | 5/10/12 | | 550,000 | | | | 187,654 |
| Citigroup, | | | | | | | | | | |
| Sr. Unscd. Notes | | 5.50 | | 4/11/13 | | 1,665,000 | | | | 1,622,699 |
| Citigroup, | | | | | | | | | | |
| Sr. Sub. Bonds | | 6.00 | | 10/31/33 | | 15,000 | | | | 13,236 |
| Citigroup, | | | | | | | | | | |
| Sr. Unscd. Notes | | 6.13 | | 5/15/18 | | 215,000 | | | | 217,776 |
| Countrywide Home Loans, | | | | | | | | | | |
| Gtd. Notes | | 4.13 | | 9/15/09 | | 210,000 | | | | 207,574 |
| Credit Suisse Guernsey, | | | | | | | | | | |
| Jr. Sub. Notes | | 5.86 | | 5/29/49 | | 481,000 | | b | | 224,796 |
| General Electric Capital, | | | | | | | | | | |
| Sr. Unscd. Notes | | 4.52 | | 10/21/10 | | 945,000 | | b | | 877,709 |
| Goldman Sachs Capital II, | | | | | | | | | | |
| Gtd. Bonds | | 5.79 | | 12/29/49 | | 315,000 | | b | | 121,167 |
| Goldman Sachs Group, | | | | | | | | | | |
| Sub. Notes | | 5.63 | | 1/15/17 | | 195,000 | | | | 167,779 |
| Goldman Sachs Group, | | | | | | | | | | |
| Sub. Notes | | 6.75 | | 10/1/37 | | 350,000 | | | | 284,942 |
14
| | | Coupon | | Maturity | | Principal | | | | |
| Bonds and Notes (continued) | | Rate (%) | | Date | | Amount ($) | | | | Value ($) |
| |
| |
| |
| |
| |
|
| Diversified Financial | | | | | | | | | | |
| Services (continued) | | | | | | | | | | |
| HSBC Finance Capital Trust IX, | | | | | | | | | | |
| Gtd. Notes | | 5.91 | | 11/30/35 | | 625,000 | | b | | 261,795 |
| Janus Capital Group, | | | | | | | | | | |
| Sr. Unscd. Notes | | 6.25 | | 6/15/12 | | 350,000 | | | | 280,454 |
| Jefferies Group, | | | | | | | | | | |
| Sr. Unscd. Debs. | | 6.25 | | 1/15/36 | | 440,000 | | | | 261,836 |
| John Deere Capital, | | | | | | | | | | |
| Sr. Unscd. Notes | | 2.24 | | 9/1/09 | | 310,000 | | b | | 302,078 |
| JPMorgan Chase & Co., | | | | | | | | | | |
| Sr. Unscd. Notes | | 6.40 | | 5/15/38 | | 445,000 | | | | 528,318 |
| MBNA, | | | | | | | | | | |
| Sr. Unscd. Notes | | 6.13 | | 3/1/13 | | 750,000 | | | | 724,705 |
| Merrill Lynch & Co., | | | | | | | | | | |
| Sub. Notes | | 5.70 | | 5/2/17 | | 740,000 | | | | 656,655 |
| Merrill Lynch & Co., | | | | | | | | | | |
| Sr. Unscd. Notes | | 6.05 | | 8/15/12 | | 570,000 | | | | 562,799 |
| Morgan Stanley, | | | | | | | | | | |
| Sub. Notes | | 4.75 | | 4/1/14 | | 705,000 | | | | 537,718 |
| MUFG Capital Finance 1, | | | | | | | | | | |
| Bank Gtd. Bonds | | 6.35 | | 7/29/49 | | 250,000 | | b | | 174,417 |
| NYSE Euronext, | | | | | | | | | | |
| Sr. Unscd. Notes | | 4.80 | | 6/28/13 | | 320,000 | | | | 310,693 |
| Pearson Dollar Finance Two, | | | | | | | | | | |
| Gtd. Notes | | 6.25 | | 5/6/18 | | 430,000 | | a,d | | 362,928 |
| SLM, | | | | | | | | | | |
| Sr. Unscd. Notes, Ser. A | | 4.00 | | 1/15/09 | | 930,000 | | | | 925,759 |
| Windsor Financing, | | | | | | | | | | |
| Sr. Scd. Notes | | 5.88 | | 7/15/17 | | 99,793 | | a | | 105,466 |
| | | | | | | | | | | 11,074,194 |
| Electric Utilities—5.1% | | | | | | | | | | |
| Cleveland Electric Illumination, | | | | | | | | | | |
| Sr. Unscd. Notes | | 5.70 | | 4/1/17 | | 500,000 | | | | 406,005 |
| Consolidated Edison of NY, | | | | | | | | | | |
| Sr. Unscd. Debs., Ser. 06-D | | 5.30 | | 12/1/16 | | 400,000 | | | | 391,774 |
| Consolidated Edison of NY, | | | | | | | | | | |
| Sr. Unscd. Debs., Ser. 08-A | | 5.85 | | 4/1/18 | | 230,000 | | | | 232,017 |
| Consumers Energy, | | | | | | | | | | |
| First Mortgage Bonds, Ser. O | | 5.00 | | 2/15/12 | | 655,000 | | | | 640,758 |
The Portfolio 15
| STATEMENT OF INVESTMENTS (continued) |
| | | Coupon | | Maturity | | Principal | | | | |
| Bonds and Notes (continued) | | Rate (%) | | Date | | Amount ($) | | | | Value ($) |
| |
| |
| |
| |
| |
|
| Electric Utilities (continued) | | | | | | | | | | |
| Enel Finance International, | | | | | | | | | | |
| Gtd. Notes | | 5.70 | | 1/15/13 | | 185,000 | | a | | 170,464 |
| Enel Finance International, | | | | | | | | | | |
| Gtd. Bonds | | 6.25 | | 9/15/17 | | 645,000 | | a | | 545,542 |
| Energy Future Holdings, | | | | | | | | | | |
| Gtd. Notes | | 10.88 | | 11/1/17 | | 850,000 | | a | | 607,750 |
| FirstEnergy, | | | | | | | | | | |
| Sr. Unscd. Notes, Ser. B | | 6.45 | | 11/15/11 | | 245,000 | | | | 231,735 |
| FPL Group Capital, | | | | | | | | | | |
| Gtd. Debs. | | 5.63 | | 9/1/11 | | 950,000 | | | | 963,992 |
| National Grid, | | | | | | | | | | |
| Unsub. Notes | | 6.30 | | 8/1/16 | | 605,000 | | | | 527,930 |
| Nevada Power, | | | | | | | | | | |
| Mortgage Notes | | 6.50 | | 8/1/18 | | 305,000 | | | | 294,971 |
| Nevada Power, | | | | | | | | | | |
| Mortgage Notes, Ser. R | | 6.75 | | 7/1/37 | | 265,000 | | | | 237,786 |
| NiSource Finance, | | | | | | | | | | |
| Gtd. Notes | | 2.72 | | 11/23/09 | | 260,000 | | b | | 234,323 |
| NiSource Finance, | | | | | | | | | | |
| Gtd. Notes | | 5.25 | | 9/15/17 | | 375,000 | | | | 227,665 |
| Ohio Power, | | | | | | | | | | |
| Sr. Unscd. Notes | | 4.39 | | 4/5/10 | | 390,000 | | b | | 365,028 |
| Pacific Gas & Electric, | | | | | | | | | | |
| Sr. Unscd. Notes | | 6.35 | | 2/15/38 | | 260,000 | | | | 285,354 |
| Sierra Pacific Power, | | | | | | | | | | |
| Mortgage Notes, Ser. P | | 6.75 | | 7/1/37 | | 130,000 | | | | 116,650 |
| Southern, | | | | | | | | | | |
| Sr. Unscd. Notes, Ser. A | | 5.30 | | 1/15/12 | | 290,000 | | d | | 293,042 |
| | | | | | | | | | | 6,772,786 |
| Environmental Control—.2% | | | | | | | | | | |
| Republic Services, | | | | | | | | | | |
| Sr. Unscd. Notes | | 6.75 | | 8/15/11 | | 85,000 | | | | 83,667 |
| USA Waste Services, | | | | | | | | | | |
| Sr. Unscd. Notes | | 7.00 | | 7/15/28 | | 210,000 | | | | 174,609 |
| | | | | | | | | | | 258,276 |
| Food & Beverages—1.2% | | | | | | | | | | |
| Kraft Foods, | | | | | | | | | | |
| Sr. Unscd. Notes | | 6.00 | | 2/11/13 | | 100,000 | | | | 101,714 |
| Kraft Foods, | | | | | | | | | | |
| Sr. Unscd. Notes | | 6.13 | | 2/1/18 | | 755,000 | | | | 741,091 |
16
| | | | | Coupon | | Maturity | | Principal | | | | |
| Bonds and Notes (continued) | | Rate (%) | | Date | | Amount ($) | | | | Value ($) |
| |
| |
| |
| |
| |
|
| Food & Beverages (continued) | | | | | | | | | | |
| Kroger, | | | | | | | | | | | | |
| Gtd. Notes | | | | 6.15 | | 1/15/20 | | 410,000 | | | | 405,315 |
| Safeway, | | | | | | | | | | | | |
| Sr. Unscd. Notes | | | | 6.35 | | 8/15/17 | | 410,000 | | | | 406,027 |
| | | | | | | | | | | | | 1,654,147 |
| Foreign/ | | | | | | | | | | | | |
| Governmental—.1% | | | | | | | | | | | | |
| Brazilian Government, | | | | | | | | | | | | |
| Unsub. Bonds | | BRL | | 12.50 | | 1/5/16 | | 250,000 | | c | | 112,832 |
| Health Care—.8% | | | | | | | | | | | | |
| Ace INA Holdings, | | | | | | | | | | | | |
| Gtd. Notes | | | | 5.80 | | 3/15/18 | | 255,000 | | | | 229,883 |
| American Home Products, | | | | | | | | | | | | |
| Sr. Unscd. Notes | | | | 6.95 | | 3/15/11 | | 325,000 | | b | | 338,621 |
| Community Health Systems, | | | | | | | | | | | | |
| Gtd. Notes | | | | 8.88 | | 7/15/15 | | 205,000 | | | | 189,625 |
| Coventry Health Care, | | | | | | | | | | | | |
| Sr. Unscd. Notes | | | | 5.95 | | 3/15/17 | | 225,000 | | | | 117,461 |
| Wellpoint, | | | | | | | | | | | | |
| Sr. Unscd. Notes | | | | 5.88 | | 6/15/17 | | 255,000 | | | | 232,459 |
| | | | | | | | | | | | | 1,108,049 |
| Machinery—.1% | | | | | | | | | | | | |
| Atlas Copco, | | | | | | | | | | | | |
| Sr. Unscd. Bonds | | | | 5.60 | | 5/22/17 | | 185,000 | | a | | 174,074 |
| Media—2.9% | | | | | | | | | | | | |
| British Sky Broadcasting, | | | | | | | | | | | | |
| Gtd. Notes | | | | 6.88 | | 2/23/09 | | 510,000 | | | | 512,356 |
| BSKYB Finance UK, | | | | | | | | | | | | |
| Gtd. Notes | | | | 6.50 | | 10/15/35 | | 300,000 | | a | | 220,932 |
| Comcast, | | | | | | | | | | | | |
| Gtd. Notes | | | | 5.50 | | 3/15/11 | | 530,000 | | | | 519,047 |
| Comcast, | | | | | | | | | | | | |
| Gtd. Notes | | | | 6.30 | | 11/15/17 | | 425,000 | | | | 414,426 |
| Cox Communications, | | | | | | | | | | | | |
| Notes | | | | 6.25 | | 6/1/18 | | 405,000 | | a | | 360,089 |
| News America Holdings, | | | | | | | | | | | | |
| Gtd. Notes | | | | 7.70 | | 10/30/25 | | 425,000 | | | | 407,076 |
| News America, | | | | | | | | | | | | |
| Gtd. Notes | | | | 6.15 | | 3/1/37 | | 460,000 | | | | 430,572 |
The Portfolio 17
| STATEMENT OF INVESTMENTS (continued) |
| | | Coupon | | Maturity | | Principal | | | | |
| Bonds and Notes (continued) | | Rate (%) | | Date | | Amount ($) | | | | Value ($) |
| |
| |
| |
| |
| |
|
| Media (continued) | | | | | | | | | | |
| News America, | | | | | | | | | | |
| Gtd. Notes | | 6.65 | | 11/15/37 | | 355,000 | | | | 352,483 |
| Reed Elsevier Capital, | | | | | | | | | | |
| Gtd. Notes | | 4.63 | | 6/15/12 | | 670,000 | | | | 589,928 |
| | | | | | | | | | | 3,806,909 |
| Mining—.3% | | | | | | | | | | |
| Alcoa, | | | | | | | | | | |
| Sr. Unscd. Notes | | 6.00 | | 7/15/13 | | 130,000 | | | | 117,657 |
| Rio Tinto Finance, | | | | | | | | | | |
| Gtd. Notes | | 5.88 | | 7/15/13 | | 395,000 | | | | 314,917 |
| | | | | | | | | | | 432,574 |
| Oil & Gas—.4% | | | | | | | | | | |
| Amerada Hess, | | | | | | | | | | |
| Sr. Unscd. Notes | | 6.65 | | 8/15/11 | | 470,000 | | | | 470,091 |
| Chesapeake Energy, | | | | | | | | | | |
| Gtd. Notes | | 7.50 | | 6/15/14 | | 90,000 | | | | 76,500 |
| | | | | | | | | | | 546,591 |
| Packaging & Containers—.3% | | | | | | | | | | |
| Ball, | | | | | | | | | | |
| Gtd. Notes | | 6.88 | | 12/15/12 | | 120,000 | | | | 119,400 |
| Crown Americas, | | | | | | | | | | |
| Gtd. Notes | | 7.63 | | 11/15/13 | | 325,000 | | | | 323,375 |
| | | | | | | | | | | 442,775 |
| Property & Casualty Insurance—2.2% | | | | | | | | | | |
| Allstate, | | | | | | | | | | |
| Jr. Sub. Debs. | | 6.50 | | 5/15/67 | | 170,000 | | b | | 95,800 |
| Jackson National Life Global, | | | | | | | | | | |
| Sr. Scd. Notes | | 5.38 | | 5/8/13 | | 270,000 | | a | | 244,233 |
| Leucadia National, | | | | | | | | | | |
| Sr. Unscd. Notes | | 7.13 | | 3/15/17 | | 305,000 | | | | 227,988 |
| Lincoln National, | | | | | | | | | | |
| Sr. Unscd. Notes | | 2.18 | | 3/12/10 | | 425,000 | | b | | 373,370 |
| Lincoln National, | | | | | | | | | | |
| Jr. Sub. Bonds | | 6.05 | | 4/20/67 | | 1,050,000 | | b | | 420,518 |
| MetLife, | | | | | | | | | | |
| Sr. Unscd. Notes | | 5.00 | | 6/15/15 | | 1,050,000 | | | | 984,851 |
| Nippon Life Insurance, | | | | | | | | | | |
| Notes | | 4.88 | | 8/9/10 | | 475,000 | | a | | 465,299 |
18
| | | Coupon | | Maturity | | Principal | | | | |
| Bonds and Notes (continued) | | Rate (%) | | Date | | Amount ($) | | | | Value ($) |
| |
| |
| |
| |
| |
|
| Property & Casualty | | | | | | | | | | |
| Insurance (continued) | | | | | | | | | | |
| Willis North America, | | | | | | | | | | |
| Gtd. Notes | | 6.20 | | 3/28/17 | | 155,000 | | | | 107,538 |
| | | | | | | | | | | 2,919,597 |
| Real Estate Investment | | | | | | | | | | |
| Trusts—2.9% | | | | | | | | | | |
| Arden Realty, | | | | | | | | | | |
| Sr. Unscd. Notes | | 5.25 | | 3/1/15 | | 350,000 | | | | 289,562 |
| Boston Properties, | | | | | | | | | | |
| Sr. Unscd. Notes | | 5.00 | | 6/1/15 | | 470,000 | | | | 296,327 |
| Commercial Net Realty, | | | | | | | | | | |
| Sr. Unscd. Notes | | 6.15 | | 12/15/15 | | 210,000 | | | | 154,923 |
| Duke Realty, | | | | | | | | | | |
| Sr. Unscd. Notes | | 5.88 | | 8/15/12 | | 450,000 | | d | | 315,743 |
| Federal Realty Investment Trust, | | | | | | | | | | |
| Sr. Unscd. Bonds | | 5.65 | | 6/1/16 | | 325,000 | | | | 213,880 |
| Federal Realty Investment Trust, | | | | | | | | | | |
| Sr. Unscd. Notes | | 6.00 | | 7/15/12 | | 100,000 | | | | 80,150 |
| Healthcare Realty Trust, | | | | | | | | | | |
| Sr. Unscd. Notes | | 5.13 | | 4/1/14 | | 475,000 | | | | 286,476 |
| HRPT Properties Trust, | | | | | | | | | | |
| Sr. Unscd. Notes | | 2.52 | | 3/16/11 | | 238,000 | | b | | 174,867 |
| Liberty Property, | | | | | | | | | | |
| Sr. Unscd. Notes | | 5.50 | | 12/15/16 | | 185,000 | | | | 110,253 |
| Mack-Cali Realty, | | | | | | | | | | |
| Sr. Unscd. Notes | | 5.05 | | 4/15/10 | | 225,000 | | | | 198,467 |
| Mack-Cali Realty, | | | | | | | | | | |
| Sr. Unscd. Notes | | 5.25 | | 1/15/12 | | 400,000 | | | | 310,760 |
| Mack-Cali Realty, | | | | | | | | | | |
| Sr. Unscd. Notes | | 5.80 | | 1/15/16 | | 400,000 | | d | | 259,320 |
| Prologis, | | | | | | | | | | |
| Sr. Unscd. Notes | | 6.63 | | 5/15/18 | | 435,000 | | | | 208,354 |
| Regency Centers, | | | | | | | | | | |
| Gtd. Notes | | 5.25 | | 8/1/15 | | 145,000 | | | | 96,218 |
| Regency Centers, | | | | | | | | | | |
| Gtd. Notes | | 5.88 | | 6/15/17 | | 120,000 | | | | 76,108 |
| Simon Property Group, | | | | | | | | | | |
| Sr. Unscd. Notes | | 5.00 | | 3/1/12 | | 550,000 | | | | 434,850 |
The Portfolio 19
| STATEMENT OF INVESTMENTS (continued) |
| | | Coupon | | Maturity | | Principal | | | | |
| Bonds and Notes (continued) | | Rate (%) | | Date | | Amount ($) | | | | Value ($) |
| |
| |
| |
| |
| |
|
| Real Estate Investment | | | | | | | | | | |
| Trusts (continued) | | | | | | | | | | |
| Simon Property Group, | | | | | | | | | | |
| Sr. Unscd. Notes | | 5.75 | | 5/1/12 | | 150,000 | | | | 119,994 |
| WEA Finance, | | | | | | | | | | |
| Sr. Notes | | 7.13 | | 4/15/18 | | 435,000 | | a | | 309,053 |
| | | | | | | | | | | 3,935,305 |
| Residential Mortgage | | | | | | | | | | |
| Pass-Through Ctfs.—1.3% | | | | | | | | | | |
| ChaseFlex Trust, | | | | | | | | | | |
| Ser. 2006-2, Cl. A1A | | 5.59 | | 9/25/36 | | 69,804 | | b | | 67,142 |
| Citigroup Mortgage Loan Trust, | | | | | | | | | | |
| Ser. 2005-WF2, Cl. AF7 | | 5.25 | | 8/25/35 | | 937,055 | | b | | 597,403 |
| Impac Secured Assets CMN Owner | | | | | | | | | | |
| Trust, Ser. 2006-1, Cl. 2A1 | | 0.82 | | 5/25/36 | | 240,146 | | b | | 170,998 |
| Nomura Asset Acceptance, | | | | | | | | | | |
| Ser. 2005-WF1, Cl. 2A5 | | 5.16 | | 3/25/35 | | 459,123 | | b | | 341,138 |
| WaMu Pass-Through Certificates, | | | | | | | | | | |
| Ser. 2005-AR4, Cl. A4B | | 4.67 | | 4/25/35 | | 575,000 | | b | | 536,449 |
| | | | | | | | | | | 1,713,130 |
| Retail—.2% | | | | | | | | | | |
| CVS Caremark, | | | | | | | | | | |
| Sr. Unscd. Notes | | 5.75 | | 8/15/11 | | 155,000 | | | | 155,629 |
| Lowe’s Companies, | | | | | | | | | | |
| Sr. Unscd. Notes | | 5.60 | | 9/15/12 | | 110,000 | | | | 111,747 |
| | | | | | | | | | | 267,376 |
| State/Territory General Obligation—2.2% | | | | | | | | |
| Clark County School District, | | | | | | | | | | |
| GO, Ser. F (Insured; FSA) | | 5.50 | | 12/15/11 | | 110,000 | | e | | 121,675 |
| Clark County School District, | | | | | | | | | | |
| GO, Ser. F (Insured; FSA) | | 5.50 | | 12/15/11 | | 75,000 | | e | | 82,961 |
| Clark County, | | | | | | | | | | |
| GO (Bond Bank) (Insured; MBIA, Inc.) | | 5.25 | | 12/1/12 | | 105,000 | | e | | 117,748 |
| Cypress-Fairbanks Independent | | | | | | | | | | |
| School District, GO, Ser. A | | | | | | | | | | |
| (Schoolhouse) (Insured; PSF-GTD) | | 5.25 | | 2/15/10 | | 95,000 | | e | | 99,298 |
| Delaware Housing Authority, | | | | | | | | | | |
| SFMR D-2, Revenue Bonds | | 5.80 | | 7/1/16 | | 340,000 | | | | 349,598 |
| Erie Tobacco Asset | | | | | | | | | | |
| Securitization/NY, Tobacco | | | | | | | | | | |
| Settlement Asset-Backed Bonds | | 6.00 | | 6/1/28 | | 400,000 | | | | 280,980 |
20
| | | Coupon | | Maturity | | Principal | | | | |
| Bonds and Notes (continued) | | Rate (%) | | Date | | Amount ($) | | | | Value ($) |
| |
| |
| |
| |
| |
|
| State/Territory General | | | | | | | | | | |
| Obligation (continued) | | | | | | | | | | |
| Michigan Tobacco Settlement | | | | | | | | | | |
| Finance Authority, | | | | | | | | | | |
| Tobacco Settlement | | | | | | | | | | |
| Asset-Backed Bonds | | 7.31 | | 6/1/34 | | 1,390,000 | | | | 808,299 |
| Tobacco Settlement | | | | | | | | | | |
| Authority of Iowa, | | | | | | | | | | |
| Tobacco Settlement | | | | | | | | | | |
| Asset-Backed Bonds | | 6.50 | | 6/1/23 | | 670,000 | | | | 484,872 |
| Tobacco Settlement Finance | | | | | | | | | | |
| Authority of West Virginia, | | | | | | | | | | |
| Tobacco Settlement | | | | | | | | | | |
| Asset-Backed Bonds | | 7.47 | | 6/1/47 | | 725,000 | | | | 415,505 |
| Williamson County, | | | | | | | | | | |
| GO, Ser. A (Insured; FSA) | | 6.00 | | 8/15/10 | | 75,000 | | e | | 80,679 |
| Wisconsin, | | | | | | | | | | |
| GO, Ser. G (Insured; MBIA, Inc.) | | 5.00 | | 5/1/13 | | 130,000 | | e | | 145,829 |
| | | | | | | | | | | 2,987,444 |
| Telecommunications—2.1% | | | | | | | | | | |
| AT & T, | | | | | | | | | | |
| Sr. Unscd. Notes | | 5.60 | | 5/15/18 | | 355,000 | | | | 362,096 |
| AT & T, | | | | | | | | | | |
| Gtd. Notes | | 7.30 | | 11/15/11 | | 440,000 | | b | | 457,439 |
| KPN, | | | | | | | | | | |
| Sr. Unscd. Notes | | 8.00 | | 10/1/10 | | 115,000 | | | | 116,105 |
| Telecom Italia Capital, | | | | | | | | | | |
| Gtd. Notes | | 7.72 | | 6/4/38 | | 180,000 | | | | 148,198 |
| Telefonica Emisiones, | | | | | | | | | | |
| Gtd. Notes | | 1.83 | | 6/19/09 | | 250,000 | | b | | 242,055 |
| Time Warner Cable, | | | | | | | | | | |
| Gtd. Notes | | 5.85 | | 5/1/17 | | 440,000 | | | | 402,606 |
| Time Warner, | | | | | | | | | | |
| Gtd. Notes | | 5.88 | | 11/15/16 | | 900,000 | | | | 808,065 |
| Verizon Communications, | | | | | | | | | | |
| Sr. Unscd. Notes | | 8.95 | | 3/1/39 | | 210,000 | | | | 272,093 |
| | | | | | | | | | | 2,808,657 |
| Textiles & Apparel—.3% | | | | | | | | | | |
| Mohawk Industries, | | | | | | | | | | |
| Sr. Unscd. Notes | | 5.75 | | 1/15/11 | | 400,000 | | | | 367,258 |
The Portfolio 21
| STATEMENT OF INVESTMENTS (continued) |
| | | Principal | | |
| Bonds and Notes (continued) | | Amount ($) | | Value ($) |
| |
| |
|
| U.S. Government Agencies/ | | | | |
| Mortgage-Backed—49.2% | | | | |
| Federal Home Loan Mortgage Corp.: | | | | |
| 3.50%, 9/1/10 | | 132,271 f | | 131,082 |
| 5.00% | | 420,000 f,g | | 431,091 |
| 5.50% | | 11,305,000f,g | | 11,571,730 |
| 5.00%, 12/1/35—6/1/37 | | 2,889,881 f | | 2,957,735 |
| 6.00%, 11/1/37 | | 3,679,567 f | | 3,795,078 |
| Multiclass Mortgage Participation Ctfs., | | | | |
| Ser. 2586, Cl. WE, 4.00%, 12/15/32 | | 554,833 f | | 542,003 |
| Multiclass Mortgage Participation Ctfs. | | | | |
| (Interest Only), Ser. 2764, | | | | |
| Cl. IT, 5.00%, 6/15/27 | | 7,390,400 f,h | | 398,321 |
| Federal National Mortgage Association: | | | | |
| 4.50% | | 5,250,000 f,g | | 5,276,250 |
| 5.00% | | 7,075,000 f,g | | 7,229,446 |
| 5.50% | | 8,465,000 f,g | | 8,677,946 |
| 4.00%, 5/1/10 | | 586,840 f | | 586,375 |
| 5.00%, 11/1/20—11/1/21 | | 3,911,692 f | | 4,027,408 |
| 5.50%, 9/1/34—6/1/38 | | 3,431,262 f | | 3,521,730 |
| 6.00%, 9/1/22—11/1/37 | | 8,636,341 f | | 8,929,687 |
| 7.00%, 6/1/29—9/1/29 | | 91,573 f | | 96,911 |
| Government National Mortgage Association I: | | | | |
| 5.50%, 4/15/33—3/15/34 | | 2,322,677 | | 2,400,604 |
| Ser. 2007-46, Cl. A, 3.14%, 11/16/29 | | 387,855 | | 386,796 |
| Ser. 2005-90, Cl. A, 3.76%, 9/16/28 | | 627,621 | | 628,986 |
| Ser. 2005-29, Cl. A, 4.02%, 7/16/27 | | 433,271 | | 435,484 |
| Ser. 2006-3, Cl. A, 4.21%, 1/16/28 | | 785,768 | | 792,239 |
| Ser. 2006-55, Cl. A, 4.25%, 7/16/29 | | 794,966 | | 802,423 |
| Ser. 2005-32, Cl. B, 4.39%, 8/16/30 | | 622,650 | | 628,189 |
| Ser. 2005-87, Cl. A, 4.45%, 3/16/25 | | 493,309 | | 498,631 |
| Ser. 2004-39, Cl. LC, 5.50%, 12/20/29 | | 937,775 | | 948,440 |
| Government National Mortgage Association II: | | | | |
| 7.00%, 9/20/28—7/20/29 | | 14,869 | | 15,670 |
| | | | | 65,710,255 |
22
| | | Principal | | |
| Bonds and Notes (continued) | | Amount ($) | | Value ($) |
| |
| |
|
| U.S. Government Securities—19.3% | | | | |
| U.S. Treasury Bonds: | | | | |
| 5.00%, 5/15/37 | | 3,613,000 d | | 5,236,028 |
| 6.25%, 8/15/23 | | 1,620,000 d | | 2,210,035 |
| U.S. Treasury Inflation Protected | | | | |
| Securities, 2.00%, 1/15/16 | | 2,810,690 i | | 2,692,554 |
| U.S. Treasury Notes: | | | | |
| 3.50%, 5/31/13 | | 160,000 d | | 175,300 |
| 4.75%, 8/15/17 | | 8,090,000 d | | 9,675,138 |
| 4.88%, 4/30/11 | | 5,243,000 d | | 5,749,689 |
| | | | | 25,738,744 |
| Total Bonds and Notes | | | | |
| (cost $172,679,385) | | | | 160,684,800 |
| |
| |
|
| |
| | | Face Amount | | |
| | | Covered by | | |
| Options—.0% | | Contracts ($) | | Value ($) |
| |
| |
|
| Call Options | | | | |
| 3-Month Floor USD LIBOR-BBA | | | | |
| Interest Rate, January 2009 @ 2.5 | | | | |
| (cost $23,578) | | 9,250,000 j | | 0 |
| |
| |
|
| |
| | | Principal | | |
| Short-Term Investments—.6% | | Amount ($) | | Value ($) |
| |
| |
|
| U.S. Treasury Bills; | | | | |
| 0.22%, 1/2/09 | | | | |
| (cost $759,995) | | 760,000 k | | 760,000 |
| |
| |
|
| |
| Other Investment—2.8% | | Shares | | Value ($) |
| |
| |
|
| Registered Investment Company; | | | | |
| Dreyfus Institutional Preferred | | | | |
| Plus Money Market Fund | | | | |
| (cost $3,795,000) | | 3,795,000 l | | 3,795,000 |
The Portfolio 23
| STATEMENT OF INVESTMENTS (continued) |
| Investment of Cash Collateral | | | | |
| for Securities Loaned—17.8% | | Shares | | Value ($) |
| |
| |
|
| Registered Investment Company; | | | | |
| Dreyfus Institutional Cash Advantage Fund | | | | |
| (cost $23,829,709) | | 23,829,709 l | | 23,829,709 |
| |
| |
|
| Total Investments (cost $201,087,667) | | 141.6% | | 189,069,509 |
| Liabilities, Less Cash and Receivables | | (41.6%) | | (55,568,410) |
| Net Assets | | 100.0% | | 133,501,099 |
| FSA—Financial Security Assurance |
| GO—General Obligation |
| LIBOR-BBA—London Interbank Offered Rate British Bankers’Association |
| PSF-GTD—Permanent School Fund Guaranteed |
| SFMR—Single Family Mortgage Revenue |
| a Securities exempt from registration under Rule 144A of the Securities Act of 1933.These securities may be resold in |
| transactions exempt from registration, normally to qualified institutional buyers.At December 31, 2008, these |
| securities amounted to $11,106,191 or 8.3% of net assets. |
| b Variable rate security—interest rate subject to periodic change. |
| c Principal amount stated in U.S. Dollars unless otherwise noted. |
| BRL—Brazilian Real |
| EUR—Euro |
| NZD—New Zealand Dollar |
| d All or a portion of these securities are on loan.At December 31, 2008, the total market value of the portfolio’s |
| securities on loan is $22,889,897 and the total market value of the collateral held by the portfolio is $23,829,709. |
| e These securities are prerefunded; the date shown represents the prerefunded date. Bonds which are prerefunded are |
| collateralized by U.S. Government securities which are held in escrow and are used to pay principal and interest on |
| the municipal issue and to retire the bonds in full at the earliest refunding date. |
| f On September 7, 2008, the Federal Housing Finance Agency (FHFA) placed Federal National Mortgage |
| Association and Federal Home Loan Mortgage Corporation into conservatorship with FHFA as the conservator.As |
| such, the FHFA will oversee the continuing affairs of these companies. |
| g Purchased on a forward commitment basis. |
| h Notional face amount shown. |
| i Principal amount for accrual purposes is periodically adjusted based on changes in the Consumer Price Index. |
| j Non-income producing security. |
| k Held by a broker as collateral for open financial futures positions. |
| l Investment in affiliated money market mutual fund. |
| Portfolio Summary (Unaudited)† | | | | |
| |
| | | Value (%) | | | | Value (%) |
| |
| |
| |
|
| U.S. Government & Agencies | | 68.5 | | State/Government General Obligations | | 2.2 |
| Corporate Bonds | | 35.6 | | Foreign/Governmental | | .1 |
| Short-Term/ | | | | Options | | .0 |
| Money Market Investments | | 21.2 | | | | |
| Asset/Mortgage-Backed | | 14.0 | | | | 141.6 |
| |
| † Based on net assets. | | | | | | |
| See notes to financial statements. | | | | | | |
24
STATEMENT OF FINANCIAL FUTURES
December 31, 2008 |
| | | | | | | | | Unrealized |
| | | | | Market Value | | | | Appreciation |
| | | | | Covered by | | | | (Depreciation) |
| | | Contracts | | Contracts ($) | | Expiration | | at 12/31/2008 ($) |
| |
| |
| |
| |
|
| Financial Futures Long | | | | | | | | |
| British Long Gilt | | 22 | | 3,905,425 | | March 2009 | | 232,600 |
| U.S. Treasury Bonds | | 12 | | 1,656,563 | | March 2009 | | 130,577 |
| U.S. Treasury 5 year Notes | | 16 | | 1,904,875 | | March 2009 | | 44,932 |
| U.S. Treasury 10 year Notes | | 15 | | 1,886,250 | | March 2009 | | 39,844 |
| Financial Futures Short | | | | | | | | |
| U.S. Treasury 2 year Notes | | 28 | | (6,105,750) | | March 2009 | | (53,906) |
| | | | | | | | | 394,047 |
| |
| See notes to financial statements. | | | | | | | | |
STATEMENT OF OPTIONS WRITTEN
December 31, 2008 |
| | | Face Amount | | |
| | | Covered by | | |
| | | Contracts ($) | | Value ($) |
| |
| |
|
| Call Options: | | | | |
| U.S. Treasury 5 Year Notes, | | | | |
| January 2009 @ 118.5 | | 2,200,000 a | | (26,813) |
| U.S. Treasury 10 Year Notes, | | | | |
| January 2009 @ 127.5 | | 1,100,000 a | | (9,797) |
| Put Options: | | | | |
| U.S. Treasury 5 Year Notes, | | | | |
| January 2009 @ 118.5 | | 2,200,000 a | | (14,609) |
| U.S. Treasury 10 Year Notes, | | | | |
| January 2009 @ 127.5 | | 1,100,000 a | | (29,047) |
| (Premiums received $95,447) | | | | (80,266) |
| a Non-income producing security. |
| See notes to financial statements. |
The Portfolio 25
STATEMENT OF ASSETS AND LIABILITIES
December 31, 2008 |
| | | Cost | | Value |
| |
| |
|
| Assets ($): | | | | |
| Investments in securities—See Statement of Investments (including | | | | |
| securities on loan, valued at $22,889,897)—Note 1(c): | | | | |
| Unaffiliated issuers | | 173,462,958 | | 161,444,800 |
| Affiliated issuers | | 27,624,709 | | 27,624,709 |
| Cash | | | | 113,576 |
| Cash denominated in foreign currencies | | 5 | | 5 |
| Receivable for investment securities sold | | | | 4,856,193 |
| Dividends and interest receivable | | | | 1,496,941 |
| Unrealized appreciation on swap contracts—Note 4 | | | | 75,672 |
| Receivable for shares of Beneficial Interest subscribed | | | | 34,502 |
| Unrealized appreciation on forward currency exchange contracts—Note 4 | | 2,500 |
| Prepaid expenses | | | | 1,270 |
| | | | | 195,650,168 |
| |
| |
|
| Liabilities ($): | | | | |
| Due to The Dreyfus Corporation and affiliates—Note 3(b) | | | | 96,535 |
| Payable for investment securities purchased | | | | 37,616,888 |
| Liability for securities on loan—Note 1(c) | | | | 23,829,709 |
| Payable for shares of Beneficial Interest redeemed | | | | 208,257 |
| Unrealized depreciation on forward currency exchange contracts—Note 4 | | 126,449 |
| Outstanding options written, at value (premiums received | | | | |
| $95,447)—see Statement of Options Written—Note 4 | | | | 80,266 |
| Payable for futures variation margin—Note 4 | | | | 52,946 |
| Other liabilities | | | | 86,263 |
| Accrued expenses | | | | 51,756 |
| | | | | 62,149,069 |
| |
| |
|
| Net Assets ($) | | | | 133,501,099 |
| |
| |
|
| Composition of Net Assets ($): | | | | |
| Paid-in capital | | | | 155,781,984 |
| Accumulated undistributed investment income—net | | | | 2,720,819 |
| Accumulated net realized gain (loss) on investments | | | | (13,323,825) |
| Accumulated net unrealized appreciation (depreciation) on investments, | | |
| options, swap transactions and foreign currency transactions | | | | |
| (including $394,047 net unrealized appreciation on financial futures) | | (11,677,879) |
| |
|
| Net Assets ($) | | | | 133,501,099 |
| |
| |
|
| |
| |
| Net Asset Value Per Share | | | | |
| | | Initial Shares | | Service Shares |
| |
| |
|
| Net Assets ($) | | 100,395,825 | | 33,105,274 |
| Shares Outstanding | | 9,931,979 | | 3,286,859 |
| |
| |
|
| Net Asset Value Per Share ($) | | 10.11 | | 10.07 |
| |
| See notes to financial statements. | | | | |
26
| STATEMENT OF OPERATIONS | | |
| Year Ended December 31, 2008 | | |
| |
|
| |
| |
| |
| |
| Investment Income ($): | | |
| Income: | | |
| Interest | | 8,648,737 |
| Dividends; | | |
| Affiliated issuers | | 42,062 |
| Income from securities lending | | 131,061 |
| Total Income | | 8,821,860 |
| Expenses: | | |
| Investment advisory fee—Note 3(a) | | 1,047,315 |
| Distribution fees—Note 3(b) | | 100,223 |
| Professional fees | | 46,247 |
| Custodian fees—Note 3(b) | | 28,890 |
| Prospectus and shareholders’ reports | | 25,503 |
| Trustees’ fees and expenses—Note 3(c) | | 11,894 |
| Shareholder servicing costs—Note 3(b) | | 5,260 |
| Loan commitment fees—Note 2 | | 250 |
| Miscellaneous | | 65,487 |
| Total Expenses | | 1,331,069 |
| Less—reduction in fees due to | | |
| earnings credits—Note 1(c) | | (64) |
| Net Expenses | | 1,331,005 |
| Investment Income—Net | | 7,490,855 |
| |
|
| Realized and Unrealized Gain (Loss) on Investments—Note 4 ($): | | |
| Net realized gain (loss) on investments and foreign currency transactions | | (5,756,320) |
| Net realized gain (loss) on options transactions | | (210,754) |
| Net realized gain (loss) on financial futures | | 36,712 |
| Net realized gain (loss) on swap transactions | | 221,033 |
| Net realized gain (loss) on forward currency exchange contracts | | 509,166 |
| Net Realized Gain (Loss) | | (5,200,163) |
| Net unrealized appreciation (depreciation) on investments, | | |
| options transactions, swap transactions and foreign currency | | |
| transactions (including $424,815 net unrealized | | |
| appreciation on financial futures) | | (9,604,838) |
| Net Realized and Unrealized Gain (Loss) on Investments | | (14,805,001) |
| Net (Decrease) in Net Assets Resulting from Operations | | (7,314,146) |
| |
| See notes to financial statements. | | |
The Portfolio 27
STATEMENT OF CHANGES IN NET ASSETS
| | | Year Ended December 31, |
| | |
|
| | | 2008 | | 2007 |
| |
| |
|
| Operations ($): | | | | |
| Investment income—net | | 7,490,855 | | 8,665,274 |
| Net realized gain (loss) on investments | | (5,200,163) | | (1,153,931) |
| Net unrealized appreciation | | | | |
| (depreciation) on investments | | (9,604,838) | | (1,638,329) |
| Net Increase (Decrease) in Net Assets | | | | |
| Resulting from Operations | | (7,314,146) | | 5,873,014 |
| |
| |
|
| Dividends to Shareholders from ($): | | | | |
| Investment income—net: | | | | |
| Initial Shares | | (5,919,879) | | (6,690,160) |
| Service Shares | | (1,871,739) | | (2,142,188) |
| Total Dividends | | (7,791,618) | | (8,832,348) |
| |
| |
|
| Beneficial Interest Transactions ($): | | | | |
| Net proceeds from shares sold: | | | | |
| Initial Shares | | 25,752,579 | | 17,904,773 |
| Service Shares | | 3,256,252 | | 21,736,487 |
| Dividends reinvested: | | | | |
| Initial Shares | | 5,919,879 | | 6,690,160 |
| Service Shares | | 1,871,739 | | 2,142,188 |
| Cost of shares redeemed: | | | | |
| Initial Shares | | (40,317,390) | | (47,387,185) |
| Service Shares | | (12,357,851) | | (20,498,808) |
| Increase (Decrease) in Net Assets from | | | | |
| Beneficial Interest Transactions | | (15,874,792) | | (19,412,385) |
| Total Increase (Decrease) in Net Assets | | (30,980,556) | | (22,371,719) |
| |
| |
|
| Net Assets ($): | | | | |
| Beginning of Period | | 164,481,655 | | 186,853,374 |
| End of Period | | 133,501,099 | | 164,481,655 |
| Undistributed investment income—net | | 2,720,819 | | 2,511,056 |
28
| | | Year Ended December 31, |
| | |
|
| | | 2008 | | 2007 |
| |
| |
|
| Capital Share Transactions: | | | | |
| Initial Shares | | | | |
| Shares sold | | 2,357,886 | | 1,604,043 |
| Shares issued for dividends reinvested | | 555,105 | | 601,017 |
| Shares redeemed | | (3,851,873) | | (4,263,788) |
| Net Increase (Decrease) in Shares Outstanding | | (938,882) | | (2,058,728) |
| |
| |
|
| Service Shares | | | | |
| Shares sold | | 303,256 | | 1,961,886 |
| Shares issued for dividends reinvested | | 175,960 | | 193,322 |
| Shares redeemed | | (1,181,461) | | (1,854,465) |
| Net Increase (Decrease) in Shares Outstanding | | (702,245) | | 300,743 |
| |
| See notes to financial statements. | | | | |
The Portfolio 29
FINANCIAL HIGHLIGHTS
The following tables describe the performance for each share class for the fiscal periods indicated. All information (except portfolio turnover rate) reflects financial results for a single portfolio share.Total return shows how much your investment in the portfolio would have increased (or decreased) during each period, assuming you had reinvested all dividends and distributions.These figures have been derived from the portfolio’s financial statements.
| | | | | Year Ended December 31, | | |
| | |
| |
| |
|
| Initial Shares | | 2008 | | 2007 | | 2006 | | 2005 | | 2004 |
| |
| |
| |
| |
| |
|
| Per Share Data ($): | | | | | | | | | | |
| Net asset value, beginning of period | | 11.08 | | 11.25 | | 11.29 | | 11.42 | | 11.50 |
| Investment Operations: | | | | | | | | | | |
| Investment income—neta | | .51 | | .53 | | .49 | | .39 | | .37 |
| Net realized and unrealized | | | | | | | | | | |
| gain (loss) on investments | | (.96) | | (.16) | | (.02) | | (.11) | | .01 |
| Total from Investment Operations | | (.45) | | .37 | | .47 | | .28 | | .38 |
| Distributions: | | | | | | | | | | |
| Dividends from investment income—net | | (.52) | | (.54) | | (.51) | | (.41) | | (.46) |
| Net asset value, end of period | | 10.11 | | 11.08 | | 11.25 | | 11.29 | | 11.42 |
| |
| |
| |
| |
| |
|
| Total Return (%) | | (4.18) | | 3.54 | | 4.23 | | 2.48 | | 3.37 |
| |
| |
| |
| |
| |
|
| Ratios/Supplemental Data (%): | | | | | | | | | | |
| Ratio of total expenses | | | | | | | | | | |
| to average net assets | | .76 | | .77 | | .75 | | .75 | | .74 |
| Ratio of net expenses | | | | | | | | | | |
| to average net assets | | .76b | | .72 | | .63 | | .60 | | .74 |
| Ratio of net investment income | | | | | | | | | | |
| to average net assets | | 4.71 | | 4.78 | | 4.43 | | 3.45 | | 3.30 |
| Portfolio Turnover Ratec | | 391.87 | | 446.13 | | 507.83 | | 504.21 | | 819.75 |
| |
| |
| |
| |
| |
|
| Net Assets, end of period ($ x 1,000) | | 100,396 | | 120,446 | | 145,490 | | 158,999 | | 171,424 |
| a | | Based on average shares outstanding at each month end. |
| b | | Expense waivers and/or reimbursements amounted to less than .01%. |
| c | | The portfolio turnover rates excluding mortgage dollar roll transactions for the periods ended December 31, 2008, |
| | | 2007, 2006, 2005 and 2004, were 142.10%, 219.54%, 262.26%, 393.37% and 761.92%, respectively. |
| See notes to financial statements. |
30
| | | | | Year Ended December 31, | | |
| | |
| |
| |
|
| Service Shares | | 2008 | | 2007 | | 2006 | | 2005 | | 2004 |
| |
| |
| |
| |
| |
|
| Per Share Data ($): | | | | | | | | | | |
| Net asset value, beginning of period | | 11.04 | | 11.21 | | 11.25 | | 11.38 | | 11.48 |
| Investment Operations: | | | | | | | | | | |
| Investment income—neta | | .48 | | .51 | | .46 | | .36 | | .35 |
| Net realized and unrealized | | | | | | | | | | |
| gain (loss) on investments | | (.96) | | (.17) | | (.02) | | (.11) | | (.01) |
| Total from Investment Operations | | (.48) | | .34 | | .44 | | .25 | | .34 |
| Distributions: | | | | | | | | | | |
| Dividends from investment income—net | | (.49) | | (.51) | | (.48) | | (.38) | | (.44) |
| Net asset value, end of period | | 10.07 | | 11.04 | | 11.21 | | 11.25 | | 11.38 |
| |
| |
| |
| |
| |
|
| Total Return (%) | | (4.46) | | 3.31 | | 3.90 | | 2.26 | | 3.05 |
| |
| |
| |
| |
| |
|
| Ratios/Supplemental Data (%): | | | | | | | | | | |
| Ratio of total expenses | | | | | | | | | | |
| to average net assets | | 1.01 | | 1.02 | | 1.00 | | .99 | | .99 |
| Ratio of net expenses | | | | | | | | | | |
| to average net assets | | 1.01b | | .97 | | .88 | | .84 | | .99 |
| Ratio of net investment income | | | | | | | | | | |
| to average net assets | | 4.46 | | 4.51 | | 4.17 | | 3.21 | | 3.06 |
| Portfolio Turnover Ratec | | 391.87 | | 446.13 | | 507.83 | | 504.21 | | 819.75 |
| |
| |
| |
| |
| |
|
| Net Assets, end of period ($ x 1,000) | | 33,105 | | 44,035 | | 41,363 | | 47,757 | | 55,585 |
| a | | Based on average shares outstanding at each month end. |
| b | | Expense waivers and/or reimbursements amounted to less than .01%. |
| c | | The portfolio turnover rates excluding mortgage dollar roll transactions for the periods ended December 31, 2008, |
| | | 2007, 2006, 2005 and 2004, were 142.10%, 219.54%, 262.26%, 393.37% and 761.92%, respectively. |
| See notes to financial statements. |
The Portfolio 31
NOTES TO FINANCIAL STATEMENTS
NOTE 1—Significant Accounting Policies:
Dreyfus Variable Investment Fund (the “fund”) is registered under the Investment Company Act of 1940, as amended (the “Act”), as an open end management investment company, operating as a series company currently offering seven series, including the Quality Bond Portfolio (the “portfolio”).The portfolio is only offered to separate accounts established by insurance companies to fund variable annuity contracts and variable life insurance policies.The portfolio is a diversified series. The portfolio’s investment objective is to maximize total return, consisting of capital appreciation and current income. The Dreyfus Corporation (the “Manager” or “Dreyfus”), a wholly-owned subsidiary of The Bank of New York Mellon Corporation (“BNY Mellon”), serves as the portfolio’s investment adviser.
Effective July 1, 2008, BNY Mellon reorganized and consolidated a number of its banking and trust company subsidiaries.As a result of the reorganization, any services previously provided to the fund by Mellon Bank, N.A. or Mellon Trust of New England, N.A. are now provided by The Bank of NewYork Mellon (formerly,The Bank of NewYork).
MBSC Securities Corporation (the “Distributor”), a wholly-owned subsidiary of the Manager, is the distributor of the portfolio’s shares, which are sold without a sales charge. The portfolio is authorized to issue an unlimited number of $.001 par value shares of Beneficial Interest in each of the following classes of shares: Initial and Service. Each class of shares has identical rights and privileges, except with respect to the distribution plan and the expenses borne by each class, the allocation of certain transfer agency costs and certain voting rights. Income, expenses (other than expenses attributable to a specific class), and realized and unrealized gains or losses on investments are allocated to each class of shares based on its relative net assets.
The fund accounts separately for the assets, liabilities and operations of each series. Expenses directly attributable to each series are charged to that series’ operations, expenses which are applicable to all series are allocated among them on a pro rata basis.
32
The portfolio’s financial statements are prepared in accordance with U.S. generally accepted accounting principles, which may require the use of management estimates and assumptions.Actual results could differ from those estimates.
The fund enters into contracts that contain a variety of indemnifica-tions.The portfolio’s maximum exposure under these arrangements is unknown. The portfolio does not anticipate recognizing any loss related to these arrangements.
(a) Portfolio valuation: Investments in securities, excluding short-term investments (other than U.S. Treasury Bills), financial futures, options, swap transactions and forward currency exchange contracts are valued each business day by an independent pricing service (the “Service”) approved by the Board of Trustees. Investments for which quoted bid prices are readily available and are representative of the bid side of the market in the judgment of the Service are valued at the mean between the quoted bid prices (as obtained by the Service from dealers in such securities) and asked prices (as calculated by the Service based upon its evaluation of the market for such securities). Other investments (which constitute a majority of the portfolio’s securities) are valued as determined by the Service, based on methods which include consideration of: yields or prices of securities of comparable quality, coupon, maturity and type; indications as to values from dealers; and general market conditions. Restricted securities, as well as securities or other assets for which recent market quotations are not readily available, not valued by a pricing service approved by the Board ofTrustees, or determined by the portfolio not to reflect accurately fair value are valued at fair value as determined in good faith under the direction of the Board of Trustees.The factors that may be considered when fair valuing a security include fundamental analytical data, the nature and duration of restrictions on disposition, an evaluation of the forces that influence the market in which the securities are purchased and sold, and public trading in similar securities of the issuer or com-
The Portfolio 33
| | NOTES TO FINANCIAL STATEMENTS (continued) |
parable issuers. Short-term investments, excluding U.S.Treasury Bills, are carried at amortized cost, which approximates value. Registered investment companies that are not traded on an exchange are valued at their net asset value. Financial futures and options, which are traded on an exchange, are valued at the last sales price on the securities exchange on which such securities are primarily traded or at the last sales price on the national securities market on each business day. Options traded over-the-counter are priced at the mean between the bid prices and asked prices. Investments in swap transactions are valued each business day by an independent pricing service approved by the Board of Trustees. Swaps are valued by the service by using a swap pricing model which incorporates among other factors, default probabilities, recovery rates, credit curves of the underlying issuers and swap spreads on interest rates. Investments denominated in foreign currencies are translated to U.S. dollars at the prevailing rates of exchange. Forward currency exchange contracts are valued at the forward rate.
The portfolio adopted Statement of Financial Accounting Standards No. 157 “Fair Value Measurements” (“FAS 157”). FAS 157 establishes an authoritative definition of fair value, sets out a framework for measuring fair value, and requires additional disclosures about fair value measurements.
Various inputs are used in determining the value of the portfolio’s investments relating to FAS 157.These inputs are summarized in the three broad levels listed below.
| | Level 1—quoted prices in active markets for identical securities.
Level 2—other significant observable inputs (including quoted
prices for similar securities, interest rates, prepayment speeds, credit
risk, etc.)
Level 3—significant unobservable inputs (including the portfolio’s
own assumptions in determining the fair value of investments). |
The inputs or methodology used for valuing securities are not necessarily an indication of the risk associated with investing in those securities.
34
The following is a summary of the inputs used as of December 31, 2008 in valuing the portfolio’s investments carried at fair value:
| | | Investments in | | Other Financial |
| Valuation Inputs | | Securities ($) | | Instruments ($)† |
| |
| |
|
| Level 1—Quoted Prices | | 27,624,709 | | 313,781 |
| Level 2—Other Significant | | | | |
| Observable Inputs | | 161,444,800 | | (48,277) |
| Level 3—Significant | | | | |
| Unobservable Inputs | | 0 | | 0 |
| Total | | 189,069,509 | | 265,504 |
| † | | Other financial instruments include derivative instruments such as futures, forward currency |
| | | exchange contracts and swap contracts, which are valued at the unrealized appreciation |
| | | (depreciation) on the instrument and written options contracts which are shown at value. |
(b) Foreign currency transactions: The portfolio does not isolate that portion of the results of operations resulting from changes in foreign exchange rates on investments from the fluctuations arising from changes in the market prices of securities held. Such fluctuations are included with the net realized and unrealized gain or loss on investments.
Net realized foreign exchange gains or losses arise from sales and maturities of short-term securities, sales of foreign currencies, currency gains or losses realized on securities transactions and the difference between the amounts of dividends, interest and foreign withholding taxes recorded on the portfolios’ books and the U.S. dollar equivalent of the amounts actually received or paid. Net unrealized foreign exchange gains and losses arise from changes in the value of assets and liabilities other than investments in securities, resulting from changes in exchange rates. Such gains and losses are included with net realized and unrealized gain or loss on investments.
(c) Securities transactions and investment income: Securities transactions are recorded on a trade date basis. Realized gains and losses from securities transactions are recorded on the identified cost basis. Dividend income is recognized on the ex-dividend date and interest
The Portfolio 35
| NOTES TO FINANCIAL STATEMENTS (continued) |
income, including, where applicable, accretion of discount and amortization of premium on investments, is recognized on the accrual basis.
The portfolio has arrangements with the custodian and cash management banks whereby the portfolio may receive earnings credits when positive cash balances are maintained, which are used to offset custody and cash management fees. For financial reporting purposes, the portfolio includes net earnings credits as an expense offset in the Statement of Operations.
Pursuant to a securities lending agreement with The Bank of New York Mellon, a subsidiary of BNY Mellon and an affiliate of Dreyfus, the portfolio may lend securities to qualified institutions. It is the portfolio’s policy, that at origination, all loans are secured by collateral of at least 102% of the value of U.S. securities loaned and 105% of the value of foreign securities loaned. Collateral equivalent to at least 100% of the market value of securities on loan will be maintained at all times. Collateral is either in the form of cash, which can be invested in certain money market mutual funds managed by the Manager, U.S. Government and Agency securities or letters of credit. The portfolio will be entitled to receive all income on securities loaned, in addition to income earned as a result of the lending transaction.Although each security loaned is fully collateralized, the portfolio would bear the risk of delay in recovery of, or loss of rights in, the securities loaned should a borrower fail to return the securities in a timely manner. During the period ended December 31, 2008, The Bank of New York Mellon earned $70,571 from lending fund portfolio securities, pursuant to the securities lending agreement.
(d) Affiliated issuers: Investments in other investment companies advised by the Manager are defined as “affiliated” in the Act.
(e) Dividends to shareholders: Dividends are recorded on the ex-dividend date. Dividends from investment income-net are declared and paid monthly. Dividends from net realized capital gains, if any, are
36
normally declared and paid annually, but the portfolio may make distributions on a more frequent basis to comply with the distribution requirements of the Internal Revenue Code of 1986, as amended (the “Code”).To the extent that net realized capital gains can be offset by capital loss carryovers, if any, it is the policy of the portfolio not to distribute such gains. Income and capital gain distributions are determined in accordance with income tax regulations, which may differ from U.S. generally accepted accounting principles.
On December 31, 2008, the Board ofTrustees declared a cash dividend of $.035 and $.033 per share for the Initial shares and Service shares, respectively, from undistributed investment income-net payable on January 2, 2009 (ex-dividend date) to shareholders of record as of the close of business on December 31, 2008.
(f) Federal income taxes: It is the policy of the portfolio to continue to qualify as a regulated investment company, if such qualification is in the best interests of its shareholders, by complying with the applicable provisions of the Code, and to make distributions of taxable income sufficient to relieve it from substantially all federal income and excise taxes.
As of and during the period ended December 31, 2008, the portfolio did not have any liabilities for any unrecognized tax positions. The portfolio recognizes interest and penalties, if any, related to unrecognized tax positions as income tax expense in the Statement of Operations. During the period, the portfolio did not incur any interest or penalties.
Each of the tax years in the four-year period ended December 31, 2008, remains subject to examination by the Internal Revenue Service and state taxing authorities.
At December 31, 2008, the components of accumulated earnings on a tax basis were as follows: undistributed ordinary income $2,618,139, accumulated capital losses $11,094,953 and unrealized depreciation $13,804,071.
The Portfolio 37
| NOTES TO FINANCIAL STATEMENTS (continued) |
The accumulated capital loss carryover is available for federal income tax purposes to be applied against future net securities profits, if any, realized subsequent to December 31, 2008. If not applied, $3,171,594 of the carryover expires in fiscal 2012, $61,980 expires in fiscal 2013, $1,624,385 expires in fiscal 2014, $1,707,613 expires in fiscal 2015 and $4,529,381 expires in fiscal 2016.
The tax character of distributions paid to shareholders during the fiscal periods ended December 31, 2008 and December 31, 2007 were as follows: ordinary income $7,791,618 and $8,832,348, respectively.
During the period ended December 31, 2008, as a result of permanent book to tax differences, primarily due to the tax treatment for amortization of premiums, paydown gains/losses, swap periodic payments and foreign currency transactions, the portfolio increased accumulated undistributed investment income-net by $510,526 and decreased accumulated net realized gain (loss) on investments by the same amount.Net assets and net asset value per share were not affected by this reclassification.
NOTE 2—Bank Lines of Credit:
Prior to May 1, 2008, the portfolio had the ability to borrow up to $10 million for leveraging purposes under a short-term unsecured line of credit and participated with other Dreyfus-managed funds in a $100 million unsecured line of credit. Effective May 1, 2008, the portfolio participates with other Dreyfus managed funds in a $300 million unsecured line of credit primarily to be utilized for temporary or emergency purposes, including the financing of redemptions.The terms of the line of credit agreement limit the amount of individual fund borrowings. Interest is charged to the portfolio based on prevailing market rates in effect at the time of borrowing. Effective October 15, 2008, in connection therewith, the portfolio has agreed to pay commitment fees on its pro rata portion of the unsecured line of credit. During the period ended December 31, 2008, the portfolio did not borrow under either line of credit.
38
NOTE 3—Investment Advisory Fee and Other Transactions With Affiliates:
(a) Pursuant to an Investment Advisory Agreement with the Manager, the investment advisory fee is computed at the annual rate of .65% of the value of the portfolio’s average daily net assets and is payable monthly.
(b) Under the Distribution Plan (the “Plan”) adopted pursuant to Rule 12b-1 under the Act, Service shares pay the Distributor for distributing their shares, for servicing and/or maintaining Service shares shareholder accounts and for advertising and marketing for Service shares.The Plan provides for payments to be made at an annual rate of .25% of the value of the Service shares’ average daily net assets.The Distributor may make payments to participating insurance companies and to brokers and dealers acting as principal underwriter for their variable insurance products. The fees payable under the Plan are payable without regard to actual expenses incurred. During the period ended December 31, 2008, Service shares were charged $100,223 pursuant to the Plan.
The portfolio compensates Dreyfus Transfer, Inc., a wholly-owned subsidiary of the Manager, under a transfer agency agreement for providing personnel and facilities to perform transfer agency services for the portfolio. During the period ended December 31, 2008, the portfolio was charged $554 pursuant to the transfer agency agreement.
The portfolio compensates The Bank of New York Mellon under a cash management agreement for performing cash management services related to portfolio subscriptions and redemptions. During the period ended December 31, 2008, the portfolio was charged $64 pursuant to the cash management agreement.
The portfolio compensates The Bank of New York Mellon under a custody agreement to provide custodial services for the portfolio. During the period ended December 31, 2008, the portfolio was charged $28,890 pursuant to the custody agreement.
The Portfolio 39
| NOTES TO FINANCIAL STATEMENTS (continued) |
During the period ended December 31, 2008, the portfolio was charged $5,403 for services performed by the Chief Compliance Officer.
The components of “Due to The Dreyfus Corporation and affiliates” in the Statement of Assets and Liabilities consist of: investment advisory fees $73,264, Rule 12b-1 distribution plan fees $6,991, custodian fees $14,957, chief compliance officer fees $1,197 and transfer agency per account fees $126.
(c) Each Board member also serves as a Board member of other funds within the Dreyfus complex. Annual retainer fees and attendance fees are allocated to each fund based on net assets.
NOTE 4—Securities Transactions:
The aggregate amount of purchases and sales (including paydowns) of investment securities, excluding short-term securities, financial futures, forward currency exchange contracts, options transactions and swap transactions, during the period ended December 31, 2008, amounted to $776,030,009 and $794,610,152, respectively, of which $494,625,334 in purchases and $495,668,550 in sales were from mortgage dollar roll transactions.
A mortgage dollar roll transaction involves a sale by the portfolio of mortgage related securities that it holds with an agreement by the portfolio to repurchase similar securities at an agreed upon price and date.The securities purchased will bear the same interest rate as those sold, but generally will be collateralized by pools of mortgages with different prepayment histories than those securities sold.
The portfolio may invest in financial futures contracts in order to gain exposure to or protect against changes in the market.The portfolio is exposed to market risk as a result of changes in the value of the underlying financial instruments. Investments in financial futures require the
40
portfolio to “mark to market” on a daily basis, which reflects the change in market value of the contracts at the close of each day’s trading. Accordingly, variation margin payments are received or made to reflect daily unrealized gains or losses.When the contracts are closed, the portfolio recognizes a realized gain or loss. These investments require initial margin deposits with a broker, which consist of cash or cash equivalents. The amount of these deposits is determined by the exchange or Board of Trade on which the contract is traded and is subject to change. Contracts open at December 31, 2008, are set forth in the Statement of Financial Futures.
The portfolio may purchase and write (sell) put and call options in order to gain exposure to or to protect against changes in the market.
As a writer of call options, the portfolio receives a premium at the outset and then bears the market risk of unfavorable changes in the price of the financial instrument underlying the option. Generally, the portfolio would incur a gain, to the extent of the premium if the price of the underlying financial instrument decreases between the date the option is written and the date on which the option is terminated. Generally, the portfolio would realize a loss if the price of the financial instrument increases between those dates.
As a writer of put options, the portfolio receives a premium at the outset and then bears the market risk of unfavorable changes in the price of the financial instrument underlying the option. Generally, the portfolio would incur a gain, to the extent of the premium if the price of the underlying financial instrument increases between the date the option is written and the date on which the option is terminated. Generally, the portfolio would realize a loss if the price of the financial instrument decreases between those dates.
The Portfolio 41
| NOTES TO FINANCIAL STATEMENTS (continued) |
The following summarizes the portfolio’s call/put options written for the period ended December 31, 2008.
| | | Face Amount | | | | Options Terminated |
| | | | | | |
|
| | | Covered by | | Premiums | | | | Net Realized |
| Options Written: | | Contracts ($) | | Received ($) | | Cost ($) Gain (Loss) ($) |
| |
| |
| |
|
| Contracts outstanding | | | | | | | | |
| December 31, 2007 | | — | | — | | | | |
| Contracts written | | 194,790,000 | | 2,051,186 | | | | |
| Contracts terminated: | | | | | | | | |
| Contracts closed | | 133,871,000 | | 1,356,436 | | 2,132,475 | | (776,039) |
| Contracts expired | | 54,319,000 | | 599,303 | | — | | 599,303 |
| Total contracts | | | | | | | | |
| terminated | | 188,190,000 | | 1,955,739 | | 2,132,475 | | (176,736) |
| Contracts outstanding | | | | | | | | |
| December 31, 2008 | | 6,600,000 | | 95,447 | | | | |
The portfolio may enter into forward currency exchange contracts in order to hedge its exposure to changes in foreign currency exchange rates on its foreign portfolio holdings and to settle foreign currency transactions.When executing forward currency exchange contracts, the portfolio is obligated to buy or sell a foreign currency at a specified rate on a certain date in the future.With respect to sales of forward currency exchange contracts, the portfolio would incur a loss if the value of the contract increases between the date the forward contract is opened and the date the forward contract is closed.The portfolio realizes a gain if the value of the contract decreases between those dates.With respect to purchases of forward currency exchange contracts, the portfolio would incur a loss if the value of the contract decreases between the date the forward contract is opened and the date the forward contract is closed. The portfolio realizes a gain if the value of the contract increases between those dates.The portfolio is also exposed to credit risk associated with counterparty nonperformance on these forward currency exchange contracts which is typically limited to the unrealized gain on each open contract.
42
The following summarizes open forward currency exchange contracts at December 31, 2008:
| | | Foreign | | | | | | Unrealized |
| Forward Currency | | Currency | | | | | | Appreciation/ |
| Exchange Contracts | | Amounts | | Proceeds ($) | | Value ($) (Depreciation) ($) |
| |
| |
| |
|
| Sales: | | | | | | | | |
| Brazilian Real, | | | | | | | | |
| Expiring 1/16/2009 | | 220,000 | | 86,072 | | 93,728 | | (7,656) |
| British Pound, | | | | | | | | |
| Expiring 1/16/2009 | | 60,000 | | 88,721 | | 86,221 | | 2,500 |
| Euro, | | | | | | | | |
| Expiring 1/16/2009 | | 170,000 | | 218,969 | | 236,124 | | (17,155) |
| New Zealand Dollar, | | | | | | | | |
| Expiring 1/16/2009 | | 2,430,000 | | 1,314,751 | | 1,416,389 | | (101,638) |
| Total | | | | | | | | (123,949) |
The portfolio may enter into swap agreements to exchange the interest rate on, or return generated by, one nominal instrument for the return generated by another nominal instrument.
The portfolio accrues for the interim payments on swap contracts on a daily basis, with the net amount recorded within unrealized appreciation (depreciation) of swap contracts in the Statement of Assets and Liabilities. Once the interim payments are settled in cash, the net amount is recorded as realized gain (loss) on swaps, in addition to realized gain (loss) recorded upon the termination of swap contracts in the Statement of Operations. Fluctuations in the value of swap contracts are recorded as a component of net change in unrealized appreciation (depreciation) on investments.
Credit default swaps involve commitments to pay a fixed interest rate in exchange for payment if a credit event affecting a third party (the referenced company) occurs. Credit events may include a failure to pay interest or principal, bankruptcy, or restructuring. For those credit default swaps in which the fund is receiving a fixed rate, the
The Portfolio 43
| NOTES TO FINANCIAL STATEMENTS (continued) |
fund is providing credit protection on the underlying instrument. The maximum payouts for these contracts are limited to the notional amount of each swap.
The following summarizes credit default swaps entered into by the portfolio at December 31, 2008:
| Notional | | Reference | | | | (Pay)/Receive Unrealized | | |
| Amount ($) | | Entity | | Counterparty | | Fixed Rate (%) Expiration | | Appreciation($) |
| |
| |
| |
| |
|
| |
| 670,000 | | Reed Elsevier | | | | | | |
| | | Capital, 4.625%, | | Deutsche | | | | |
| | | 6/15/2012 | | Bank | | (0.96) 6/20/2012 | | 52,574 |
| 310,000 | | R.R. Donnelley & | | | | | | |
| | | Sons, 4.95%, | | Deutsche | | | | |
| | | 4/1/2014 | | Bank | | (1.60) 3/20/2012 | | 17,221 |
| 120,000 | | R.R. Donnelley & | | | | | | |
| | | Sons, 4.95%, | | J.P. Morgan | | | | |
| | | 4/1/2014 | | Chase Bank | | (1.70) 12/20/2011 | | 5,877 |
| | | | | | | | | 75,672 |
The portfolio may enter into interest rate swaps which involve the exchange of commitments to pay and receive interest based on a notional principal amount.At December 31, 2008, there were no open interest rate swaps.
Total return swaps involve commitments to pay interest in exchange for a market-linked return based on a national amount. To the extent the total return of the security or index underlying the transaction exceeds or falls short of the offsetting interest rate obligation, the portfolio will receive a payment from or make a payment to the counterparty, respectively. At December 31, 2008, there were no open total return swaps.
Risks may arise upon entering into these agreements from the potential inability of the counterparties to meet the terms of the agreement and are generally limited to the amount of net payments to be received, if any, at the date of default.
44
At December 31, 2008, the cost of investments for federal income tax purposes was $201,518,039; accordingly, accumulated net unrealized depreciation on investments was $12,448,530, consisting of $3,615,930 gross unrealized appreciation and $16,064,460 gross unrealized depreciation.
In March 2008, the Financial Accounting Standards Board released Statement of Financial Accounting Standards No. 161 “Disclosures about Derivative Instruments and Hedging Activities” (“FAS 161”). FAS 161 requires qualitative disclosures about objectives and strategies for using derivatives, quantitative disclosures about fair value amounts of gains and losses on derivative instruments and disclosures about credit-risk-related contingent features in derivative agreements. The application of FAS 161 is required for fiscal years and interim periods beginning after November 15, 2008.At this time, management is evaluating the implications of FAS 161 and its impact on the financial statements and the accompanying notes has not yet been determined.
The Portfolio 45
REPORT OF INDEPENDENT REGISTERED
PUBLIC ACCOUNTING FIRM |
Shareholders and Board of Trustees
Dreyfus Variable Investment Fund, Quality Bond Portfolio
We have audited the accompanying statement of assets and liabilities, including the statements of investments, financial futures and options written, of DreyfusVariable Investment Fund, Quality Bond Portfolio (one of the series comprising DreyfusVariable Investment Fund) as of December 31, 2008, and the related statement of operations for the year then ended, the statement of changes in net assets for each of the two years in the period then ended and financial highlights for each of the years indicated therein.These financial statements and financial highlights are the responsibility of the Fund’s management. Our responsibility is to express an opinion on these financial statements and financial highlights based on our audits.
We conducted our audits in accordance with the standards of the Public Company Accounting Oversight Board (United States).Those standards require that we plan and perform the audit to obtain reasonable assurance about whether the financial statements and financial highlights are free of material misstatement.We were not engaged to perform an audit of the Fund’s internal control over financial reporting. Our audits included consideration of internal control over financial reporting as a basis for designing audit procedures that are appropriate in the circumstances, but not for the purpose of expressing an opinion on the effectiveness of the Fund’s internal control over financial reporting. Accordingly, we express no such opinion.An audit also includes examining, on a test basis, evidence supporting the amounts and disclosures in the financial statements and financial highlights, assessing the accounting principles used and significant estimates made by management, and evaluating the overall financial statement presentation. Our procedures included confirmation of securities owned as of December 31, 2008 by correspondence with the custodian and others.We believe that our audits provide a reasonable basis for our opinion.
In our opinion, the financial statements and financial highlights referred to above present fairly, in all material respects, the financial position of DreyfusVariable Investment Fund, Quality Bond Portfolio at December 31,2008,the results of its operations for the year then ended,the changes in its net assets for each of the two years in the period then ended and the financial highlights for each of the indicated years, in conformity with U.S. generally accepted accounting principles.

New York, New York
February 10, 2009 |
46
BOARD MEMBERS INFORMATION (Unaudited)
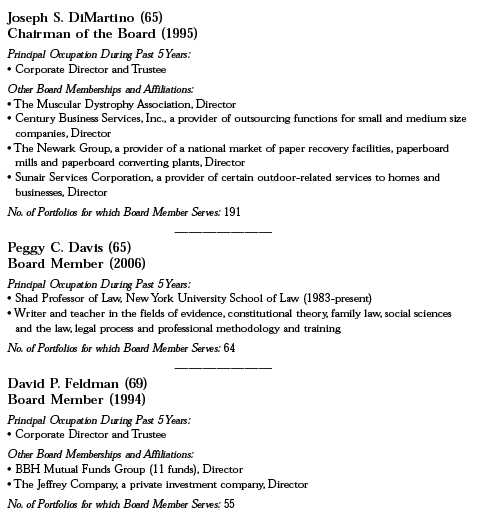
The Portfolio 47
BOARD MEMBERS INFORMATION (Unaudited) (continued)

48

The Portfolio 49
OFFICERS OF THE FUND (Unaudited)

50

The Portfolio 51
NOTES
For More Information

Telephone 1-800-554-4611 or 516-338-3300
Mail The Dreyfus Family of Funds, 144 Glenn Curtiss Boulevard, Uniondale, NY 11556-0144 Attn: Investments Division
The portfolio files its complete schedule of portfolio holdings with the Securities and Exchange Commission (“SEC”) for the first and third quarters of each fiscal year on Form N-Q. The portfolio’s Forms N-Q are available on the SEC’s website at http://www.sec.gov and may be reviewed and copied at the SEC’s Public Reference Room in Washington, DC. Information on the operation of the Public Reference Room may be obtained by calling 1-800-SEC-0330.
A description of the policies and procedures that the portfolio uses to determine how to vote proxies relating to portfolio securities, and information regarding how the portfolio voted these proxies for the 12-month period ended June 30, 2008, is available at http://www.dreyfus.com and on the SEC’s website at http://www.sec.gov. The description of the policies and procedures is also available without charge, upon request, by calling 1-800-645-6561.

| © 2009 MBSC Securities Corporation |
The Registrant has adopted a code of ethics that applies to the Registrant's principal executive officer, principal financial officer, principal accounting officer or controller, or persons performing similar functions. There have been no amendments to, or waivers in connection with, the Code of Ethics during the period covered by this Report.
| Item 3. | | Audit Committee Financial Expert. |
The Registrant's Board has determined that David P. Feldman, a member of the Audit Committee of the Board, is an audit committee financial expert as defined by the Securities and Exchange Commission (the "SEC"). David P. Feldman is "independent" as defined by the SEC for purposes of audit committee financial expert determinations.
| Item 4. | | Principal Accountant Fees and Services. |
(a) Audit Fees. The aggregate fees billed for each of the last two fiscal years (the "Reporting Periods") for professional services rendered by the Registrant's principal accountant (the "Auditor") for the audit of the Registrant's annual financial statements or services that are normally provided by the Auditor in connection with the statutory and regulatory filings or engagements for the Reporting Periods, were $148,695 in 2007 and $153,153 in 2008.
(b) Audit-Related Fees. The aggregate fees billed in the Reporting Periods for assurance and related services by the Auditor that are reasonably related to the performance of the audit of the Registrant's financial statements and are not reported under paragraph (a) of this Item 4 were $91,494 in 2007 and $106,582 in 2008. These services consisted of (i) agreed-upon procedures related to compliance with Internal Revenue Code section 817(h) and (ii) security counts required by Rule 17f-2 under the Investment Company Act of 1940, as amended.
The aggregate fees billed in the Reporting Periods for non-audit assurance and related services by the Auditor to the Registrant's investment adviser (not including any sub-investment adviser whose role primarily portfolio management and is subcontracted with or overseen by another investment adviser), and any entity controlling, controlled by or under common control with the investment adviser that provides ongoing services to the Registrant ("Service Affiliates"), that were reasonably related to the performance of the annual audit of the Service Affiliate, which required pre-approval by the Audit Committee were $-0- in 2007 and $-0- in 2008.
Note: For the second paragraph in each of (b) through (d) of this Item 4, certain of such services were not pre-approved prior to May 6, 2003, when such services were required to be pre-approved. On and after May 6, 2003, 100% of all services provided by the Auditor were pre-approved as required. For comparative purposes, the fees shown assume that all such services were pre-approved, including services that were not pre-approved prior to the compliance date of the pre-approval requirement.
(c) Tax Fees. The aggregate fees billed in the Reporting Periods for professional services rendered by the Auditor for tax compliance, tax advice, and tax planning ("Tax Services") were $24,931 in 2007 and $23,778 in 2008. These services consisted of: (i) review or preparation of U.S. federal, state, local and excise tax returns; (ii) U.S. federal, state and local tax planning, advice and assistance regarding statutory, regulatory or administrative developments; (iii) tax advice regarding tax qualification matters and/or treatment of various financial instruments held or proposed to be acquired or held, and (iv) determination of Passive Foreign Investment Companies.
SSL-DOCS2 70128344v15
The aggregate fees billed in the Reporting Periods for Tax Services by the Auditor to Service Affiliates, which required pre-approval by the Audit Committee were $-0- in 2007 and $-0- in 2008.
(d) All Other Fees. The aggregate fees billed in the Reporting Periods for products and services provided by the Auditor, other than the services reported in paragraphs (a) through (c) of this Item, were $-0- in 2007 and $794 in 2008. These services consisted of a review of the Registrant's anti-money laundering program.
The aggregate fees billed in the Reporting Periods for Non-Audit Services by the Auditor to Service Affiliates, other than the services reported in paragraphs (b) through (c) of this Item, which required pre-approval by the Audit Committee, were $-0- in 2007 and $-0- in 2008.
Audit Committee Pre-Approval Policies and Procedures. The Registrant's Audit Committee has established policies and procedures (the "Policy") for pre-approval (within specified fee limits) of the Auditor's engagements for non-audit services to the Registrant and Service Affiliates without specific case-by-case consideration. Pre-approval considerations include whether the proposed services are compatible with maintaining the Auditor's independence. Pre-approvals pursuant to the Policy are considered annually.
Non-Audit Fees. The aggregate non-audit fees billed by the Auditor for services rendered to the Registrant, and rendered to Service Affiliates, for the Reporting Periods were $1,889,332 in 2007 and $12,561,320 in 2008.
Auditor Independence. The Registrant's Audit Committee has considered whether the provision of non-audit services that were rendered to Service Affiliates, which were not pre-approved (not requiring pre-approval), is compatible with maintaining the Auditor's independence.
| Item 5. | | Audit Committee of Listed Registrants. |
| | | Not applicable. [CLOSED-END FUNDS ONLY] |
| Item 6. | | Investments. |
| (a) | | Not applicable. |
| Item 7. | | Disclosure of Proxy Voting Policies and Procedures for Closed-End Management |
| | | Investment Companies. |
| | | Not applicable. [CLOSED-END FUNDS ONLY] |
| Item 8. | | Portfolio Managers of Closed-End Management Investment Companies. |
| | | Not applicable. [CLOSED-END FUNDS ONLY, beginning with reports for periods ended |
| | | on and after December 31, 2005] |
| Item 9. | | Purchases of Equity Securities by Closed-End Management Investment Companies and |
| | | Affiliated Purchasers. |
| | | Not applicable. [CLOSED-END FUNDS ONLY] |
| Item 10. | | Submission of Matters to a Vote of Security Holders. |
The Registrant has a Nominating Committee (the "Committee"), which is responsible for selecting and nominating persons for election or appointment by the Registrant's Board as Board members. The
SSL-DOCS2 70128344v15
Committee has adopted a Nominating Committee Charter (the "Charter"). Pursuant to the Charter, the Committee will consider recommendations for nominees from shareholders submitted to the Secretary of the Registrant, c/o The Dreyfus Corporation Legal Department, 200 Park Avenue, 8th Floor East, New York, New York 10166. A nomination submission must include information regarding the recommended nominee as specified in the Charter. This information includes all information relating to a recommended nominee that is required to be disclosed in solicitations or proxy statements for the election of Board members, as well as information sufficient to evaluate the factors to be considered by the Committee, including character and integrity, business and professional experience, and whether the person has the ability to apply sound and independent business judgment and would act in the interests of the Registrant and its shareholders. Nomi nation submissions are required to be accompanied by a written consent of the individual to stand for election if nominated by the Board and to serve if elected by the shareholders, and such additional information must be provided regarding the recommended nominee as reasonably requested by the Committee.
| Item 11. | | Controls and Procedures. |
(a) The Registrant's principal executive and principal financial officers have concluded, based on their evaluation of the Registrant's disclosure controls and procedures as of a date within 90 days of the filing date of this report, that the Registrant's disclosure controls and procedures are reasonably designed to ensure that information required to be disclosed by the Registrant on Form N-CSR is recorded, processed, summarized and reported within the required time periods and that information required to be disclosed by the Registrant in the reports that it files or submits on Form N-CSR is accumulated and communicated to the Registrant's management, including its principal executive and principal financial officers, as appropriate to allow timely decisions regarding required disclosure.
(b) There were no changes to the Registrant's internal control over financial reporting that occurred during the second fiscal quarter of the period covered by this report that have materially affected, or are reasonably likely to materially affect, the Registrant's internal control over financial reporting.
(a)(1) Code of ethics referred to in Item 2.
(a)(2) Certifications of principal executive and principal financial officers as required by Rule 30a-2(a) under the Investment Company Act of 1940.
(a)(3) Not applicable.
(b) Certification of principal executive and principal financial officers as required by Rule 30a-2(b) under the Investment Company Act of 1940.
SSL-DOCS2 70128344v15
Pursuant to the requirements of the Securities Exchange Act of 1934 and the Investment Company Act of 1940, the Registrant has duly caused this Report to be signed on its behalf by the undersigned, thereunto duly authorized.
Dreyfus Variable Investment Fund
| By: | | /s/ J. David Officer |
| | | |
| | | J. David Officer, |
| | President |
| |
| Date: | | February 17, 2009 |
Pursuant to the requirements of the Securities Exchange Act of 1934 and the Investment Company Act of 1940, this Report has been signed below by the following persons on behalf of the Registrant and in the capacities and on the dates indicated.
| By: | | /s/ J. David Officer |
| | | |
| | | J. David Officer, |
| | President |
| |
| Date: | | February 17, 2009 |
| By: | | /s/ James Windels |
| | | |
| | | James Windels, |
| | Treasurer |
| |
| Date: | | February 17, 2009 |
(a)(1) Code of ethics referred to in Item 2.
(a)(2) Certifications of principal executive and principal financial officers as required by Rule 30a-2(a) under the Investment Company Act of 1940. (EX-99.CERT)
(b) Certification of principal executive and principal financial officers as required by Rule 30a-2(b) under the Investment Company Act of 1940. (EX-99.906CERT)
SSL-DOCS2 70128344v15