UNITED STATES
SECURITIES AND EXCHANGE COMMISSION
Washington, D.C. 20549
FORM N-CSR
CERTIFIED SHAREHOLDER REPORT OF REGISTERED MANAGEMENT
INVESTMENT COMPANIES
| |
| Investment Company Act file number | 811-5125 |
Dreyfus Variable Investment Fund
(Exact name of Registrant as specified in charter)
c/o The Dreyfus Corporation
200 Park Avenue
New York, New York 10166
(Address of principal executive offices) (Zip code)
Michael A. Rosenberg, Esq.
200 Park Avenue
New York, New York 10166
(Name and address of agent for service)
| | |
| Registrant's telephone number, including area code: | (212) 922-6000 |
| Date of fiscal year end: | 12/31 | |
| Date of reporting period: | 12/31/09 | |
FORM N-CSR
| |
| Item 1. | Reports to Stockholders. |
|
| Dreyfus Variable |
| Investment Fund, |
| Appreciation Portfolio |
ANNUAL REPORT December 31, 2009

The views expressed in this report reflect those of the portfolio manager only through the end of the period covered and do not necessarily represent the views of Dreyfus or any other person in the Dreyfus organization. Any such views are subject to change at any time based upon market or other conditions and Dreyfus disclaims any responsibility to update such views.These views may not be relied on as investment advice and, because investment decisions for a Dreyfus fund are based on numerous factors, may not be relied on as an indication of trading intent on behalf of any Dreyfus fund.

| | Contents |
| | THE FUND |
| 2 | A Letter from the Chairman and CEO |
| 3 | Discussion of Fund Performance |
| 6 | Fund Performance |
| 8 | Understanding Your Fund’s Expenses |
| 8 | Comparing Your Fund’s Expenses With Those of Other Funds |
| 9 | Statement of Investments |
| 12 | Statement of Assets and Liabilities |
| 13 | Statement of Operations |
| 14 | Statement of Changes in Net Assets |
| 16 | Financial Highlights |
| 18 | Notes to Financial Statements |
| 27 | Report of Independent Registered Public Accounting Firm |
| 28 | Important Tax Information |
| 29 | Information About the Review and Approval of the Fund’s Investment Advisory Agreement |
| 32 | Board Members Information |
| 34 | Officers of the Fund |
| | FOR MORE INFORMATION |
| | Back Cover |
Dreyfus Variable Investment Fund,
Appreciation Portfolio
The Fund

A LETTER FROM THE CHAIRMAN AND CEO
Dear Shareholder:
We are pleased to present this annual report for Dreyfus Variable Investment Fund, Appreciation Portfolio, covering the 12-month period from January 1, 2009, through December 31, 2009.
The U.S stock market ended 2009 with a healthy annual gain, but market indices across all capitalization ranges and investment styles remained well below the peaks reached in the fall of 2007.The equity market’s advance was driven by improving investor sentiment as the U.S. economy staged a gradual, but sustained, recovery from the recession and banking crisis that had depressed stock prices at the beginning of the year. After four consecutive quarters of contraction, the U.S. economy returned to growth during the third quarter of 2009, buoyed by greater manufacturing activity to replenish depleted inventories and satisfy export demand. The slumping housing market also showed signs of renewed life later in the year when home sales and prices rebounded modestly. However, economic headwinds remain, including a high unemployment rate and the prospect of anemic consumer spending.
As 2010 begins, our Chief Economist, as well as many securities analysts and portfolio managers have continued to find opportunities and survey potential challenges across a variety of asset classes, including equities. While no one can predict the future, we believe that the 2010 investment environment will likely require a broader range of investment considerations relative to last year. As always, your financial adviser can help you determine the mix of investments that may be best suited to helping you achieve your goals at a level of risk that is comfortable for you.
For information about how the fund performed during the reporting period, as well as market perspectives, we have provided a Discussion of Performance.
Thank you for your continued confidence and support.

Jonathan R. Baum
Chairman and Chief Executive Officer
The Dreyfus Corporation
January 15, 2010
2

DISCUSSION OF FUND PERFORMANCE
For the period of January 1, 2009, through December 31, 2009, as provided by Fayez Sarofim, Portfolio Manager of Fayez Sarofim & Co., Sub-Investment Adviser
Fund and Market Performance Overview
For the 12-month period ended December 31, 2009, Dreyfus Variable Investment Fund,Appreciation Portfolio’s Initial shares produced a total return of 22.56%, and its Service shares produced a total return of 22.23%.1 In comparison, the total return of the fund’s benchmark, the Standard & Poor’s 500 Composite Stock Price Index (the “S&P 500 Index”), was 26.47% for the same period.2
A recession and banking crisis continued to depress stock prices in early 2009, but a sustained rally in anticipation of an economic recovery fueled gains over the remainder of the year. The fund’s returns were lower than its benchmark, due to the fund’s focus on blue-chip stocks at a time when lower quality companies led the rally.
The Fund’s Investment Approach
The fund seeks long-term capital growth consistent with the preservation of capital.Its secondary goal is current income.To pursue these goals, the fund normally invests at least 80% of its assets in common stocks.The fund focuses on blue-chip companies with total market capitalizations of more than $5 billion at the time of purchase, including multinational companies. These are established companies that have demonstrated sustained patterns of profitability, strong balance sheets, an expanding global presence and the potential to achieve predictable, above-average earnings growth.
In choosing stocks, the fund first identifies economic sectors it believes will expand over the next three to five years or longer. Using fundamental analysis, the fund then seeks companies within these sectors that have proven track records and dominant positions in their industries. The fund employs a “buy-and-hold” investment strategy, which generally has resulted in an annual portfolio turnover of below 15%.A low portfolio turnover rate helps reduce the fund’s trading costs and minimizes tax liability by limiting the distribution of capital gains.3
The Fund 3
DISCUSSION OF FUND PERFORMANCE (continued)
Equity Markets Rebounded Sharply
As 2009 began, a financial crisis, rising unemployment, plunging housing prices and depressed consumer confidence had exacerbated the worst economic downturn since the 1930s.These influences drove stock market averages to multi-year lows during the first quarter of the year. Market sentiment began to improve in early March, as aggressive remedial measures adopted by government and monetary authorities gained traction. Soon thereafter, evidence of economic stabilization supported a sustained market rally through year-end.The rebound was especially robust among more speculative stocks, suggesting to us that bargain hunters were taking advantage of beaten-down stock prices rather than responding to improving fundamentals.
Quality Bias Dampened Relative Performance
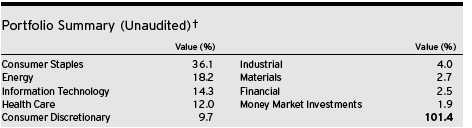
The fund participated in the market rally to a significant degree despite generally lagging returns from blue-chip companies. Nonetheless, performance shortfalls relative to the S&P 500 Index were especially pronounced in the energy sector, where an overweighted position magnified the effects of volatile commodity prices, and in the technology sector where the fund maintained underweighted exposure during the reporting period. Finally, blue-chip companies in the health care sector suffered amid uncertainty surrounding proposed health care reform legislation.
The fund achieved better results in other areas. Most notably, the fund held no stocks in the utilities and telecommunications services sectors, enabling it to avoid relative weakness in those groups. Although the financials sector rebounded in 2009, mildly underweighted exposure to the sector helped bolster the fund’s relative results. Among individual stocks, the fund received strong contributions to performance from electronics innovator Apple, where the success of the iPhone supported sales of personal computers. Semiconductor giant Intel fared well amid expectations of rising customer demand in the early stages of economic recovery. Beverage producer Coca-Cola gained value due to robust growth in overseas markets. Pharmacy chain Walgreen bounced back after addressing operational issues.
Changes to the fund included establishing a position in medical equipment supplier Becton, Dickinson & Co., whose relatively low-cost
4
products seem likely to survive industry-wide cost-cutting efforts.Also in the health care sector, diabetes specialist Novo Nordisk appears to us to be well positioned to treat the burgeoning disease.We sold financial company American Express due to persistent weakness in the credit card and travel industries; industrial firm Emerson Electric amid expectations of a muted recovery in key markets; oil rig provider Transocean on a slowdown in energy exploration and production activity; and apparel maker Polo Ralph Lauren as a result of sluggish consumer spending on luxury items.
Blue-Chip Companies Poised for a Return to Favor
Although we have seen some economic stabilization, a number of head-winds remain, including tight credit conditions, high unemployment rates and sluggish consumer spending. Consequently, we believe that investors are likely to turn away from the more speculative stocks that led the rally, instead favoring large, financially sound companies with diversified revenue streams from global markets. In our view, the fund’s investment approach may be particularly well suited to such an environment.
January 15, 2010
The Fund 5
FUND PERFORMANCE
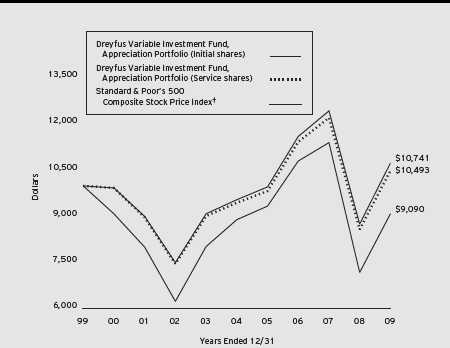
Comparison of change in value of $10,000 investment in Dreyfus Variable Investment Fund, Appreciation Portfolio Initial shares and Service shares and the Standard & Poor’s 500 Composite Stock Price Index
| | | |
| Average Annual Total Returns as of 12/31/09 | | | |
| | 1 Year | 5 Years | 10 Years |
| Initial shares | 22.56% | 2.38% | 0.72% |
| Service shares | 22.23% | 2.12% | 0.48% |
|
| The data for Service shares includes the results of Initial shares for the period prior to December 31, 2000 |
| (inception date of Service shares). Actual Service shares’ average annual total return and hypothetical growth |
| results would have been lower. See notes below. |
| † Source: Lipper Inc. |
| Past performance is not predictive of future performance.The fund’s performance shown in the graph and table does not |
| reflect the deduction of taxes that a shareholder would pay on fund distributions or the redemption of fund shares. |
| The fund’s performance does not reflect the deduction of additional charges and expenses imposed in connection |
| with investing in variable insurance contracts which will reduce returns. |
| The above graph compares a $10,000 investment made in Initial and Service shares of Dreyfus Variable Investment |
| Fund, Appreciation Portfolio on 12/31/99 to a $10,000 investment made in the Standard & Poor’s 500 Composite |
| Stock Price Index (the “Index”) on that date. |
6
The fund’s Initial shares are not subject to a Rule 12b-1 fee.The fund’s Service shares are subject to a 0.25% annual Rule 12b-1 fee.The performance figures for Service shares reflect the performance of the fund’s Initial shares from their inception date through December 30, 2000, and the performance of the fund’s Service shares from December 31, 2000 (inception date of Service shares) to December 31, 2009 (blended performance figures).The blended performance figures have not been adjusted to reflect the higher operating expenses of the Service shares. If these expenses had been reflected, the blended performance figures would have been lower. All dividends and capital gain distributions are reinvested.The fund’s performance shown in the line graph takes into account all applicable fund fees and expenses.The Index is a widely accepted, unmanaged index of U.S. stock market performance. Unlike a mutual fund, the Index is not subject to charges, fees and other expenses. Investors cannot invest directly in any index. Further information relating to fund performance, including expense reimbursements, if applicable, is contained in the Financial Highlights section of the prospectus and elsewhere in this report.
The Fund 7
UNDERSTANDING YOUR FUND’S EXPENSES (Unaudited)
As a mutual fund investor, you pay ongoing expenses, such as management fees and other expenses. Using the information below, you can estimate how these expenses affect your investment and compare them with the expenses of other funds.You also may pay one-time transaction expenses, including sales charges (loads), redemption fees and expenses associated with variable annuity or insurance contracts, which are not shown in this section and would have resulted in higher total expenses. For more information, see your fund’s prospectus or talk to your financial adviser.
Review your fund’s expenses
The table below shows the expenses you would have paid on a $1,000 investment in Dreyfus Variable Investment Fund,Appreciation Portfolio from July 1, 2009 to December 31, 2009. It also shows how much a $1,000 investment would be worth at the close of the period, assuming actual returns and expenses.
|
| Expenses and Value of a $1,000 Investment |
| assuming actual returns for the six months ended December 31, 2009 |
| | | | |
| | | Initial Shares | | Service Shares |
| Expenses paid per $1,000† | $ | 4.39 | $ | 5.77 |
| Ending value (after expenses) | $ | 1,202.60 | $ | 1,200.80 |
|
| COMPARING YOUR FUND’S EXPENSES |
| WITH THOSE OF OTHER FUNDS (Unaudited) |
Using the SEC’s method to compare expenses
The Securities and Exchange Commission (SEC) has established guidelines to help investors assess fund expenses. Per these guidelines, the table below shows your fund’s expenses based on a $1,000 investment, assuming a hypothetical 5% annualized return. You can use this information to compare the ongoing expenses (but not transaction expenses or total cost) of investing in the fund with those of other funds.All mutual fund shareholder reports will provide this information to help you make this comparison. Please note that you cannot use this information to estimate your actual ending account balance and expenses paid during the period.
|
| Expenses and Value of a $1,000 Investment |
| assuming a hypothetical 5% annualized return for the six months ended December 31, 2009 |
| | | | |
| | | Initial Shares | | Service Shares |
| Expenses paid per $1,000† | $ | 4.02 | $ | 5.30 |
| Ending value (after expenses) | $ | 1,021.22 | $ | 1,019.96 |
|
| † Expenses are equal to the fund’s annualized expense ratio of .79% for Initial Shares and 1.04% for Service Shares, |
| multiplied by the average account value over the period, multiplied by 184/365 (to reflect the one-half year period). |
8
|
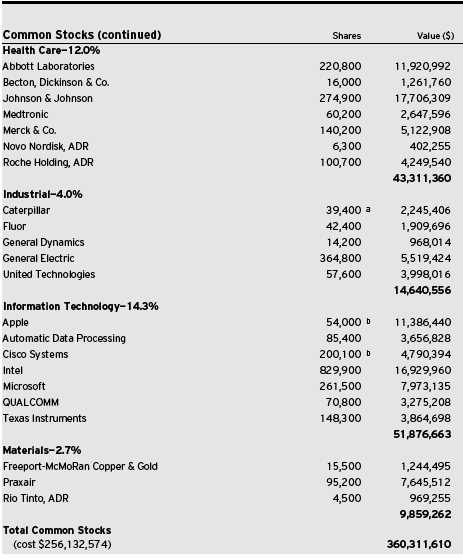
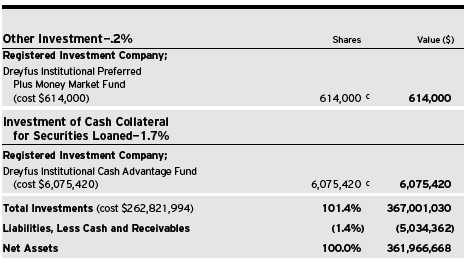
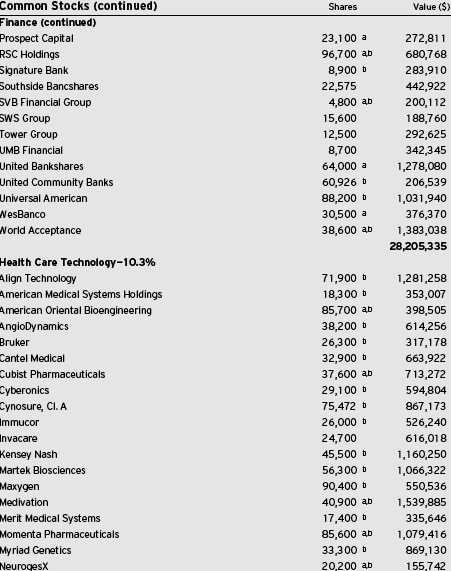
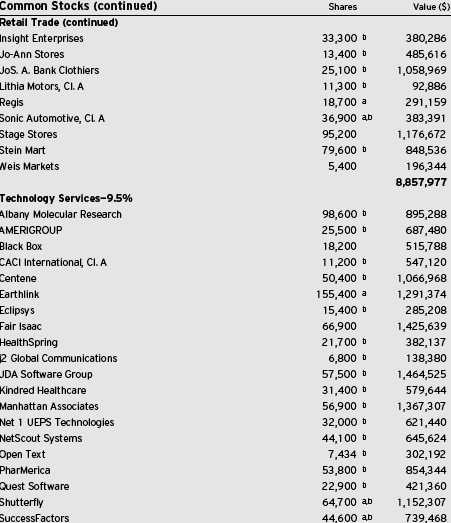
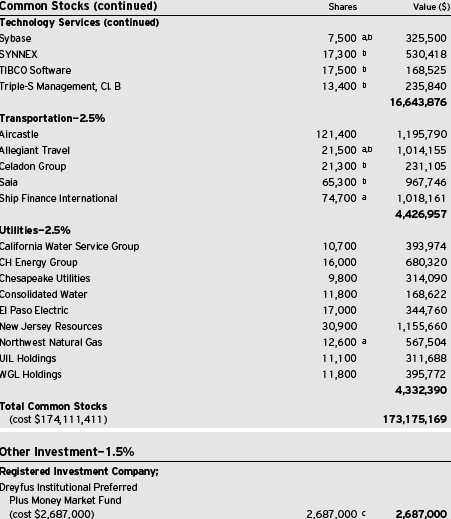
| STATEMENT OF INVESTMENTS |
| December 31, 2009 |

The Fund 9
STATEMENT OF INVESTMENTS (continued)
10
ADR—American Depository Receipts
|
| a Security, or portion thereof, on loan. At December 31, 2009, the total market value of the fund’s securities on loan is |
| $5,860,890, and the total market value of the collateral held by the fund is $6,075,420. |
| b Non-income producing security. |
| c Investment in affiliated money market mutual fund. |
|
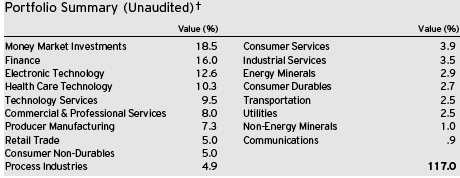
| † Based on net assets. |
| See notes to financial statements. |
The Fund 11
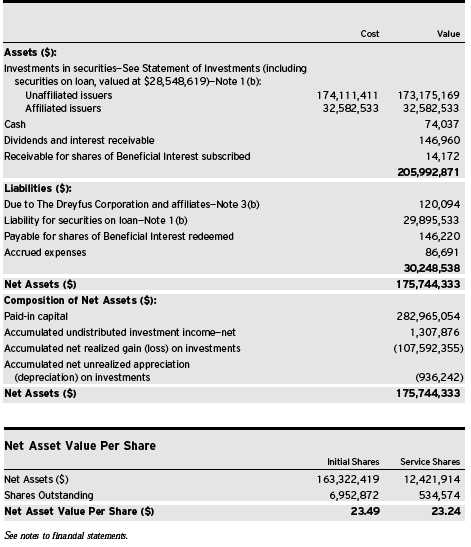
|
| STATEMENT OF ASSETS AND LIABILITIES |
| December 31, 2009 |
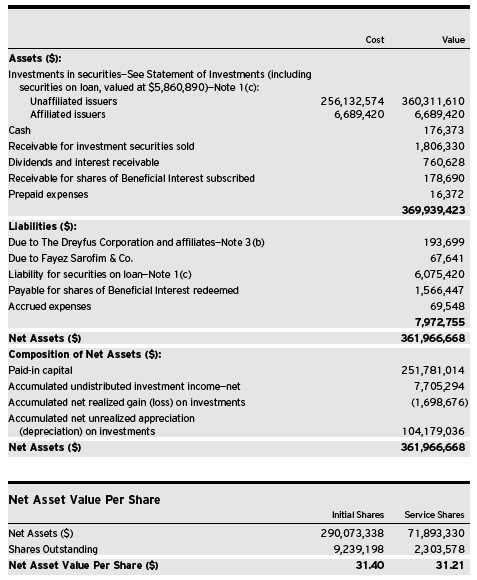
See notes to financial statements.
12
|
| STATEMENT OF OPERATIONS |
| Year Ended December 31, 2009 |
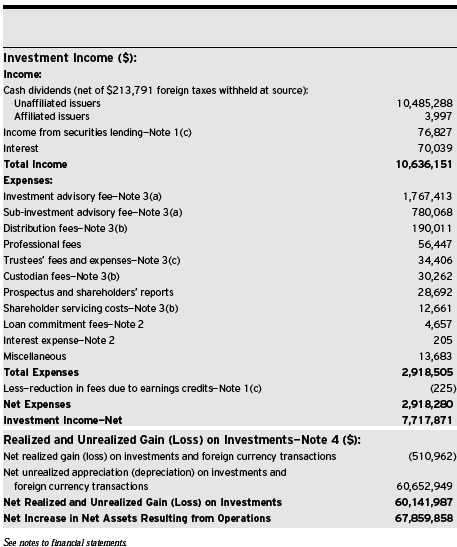
The Fund 13
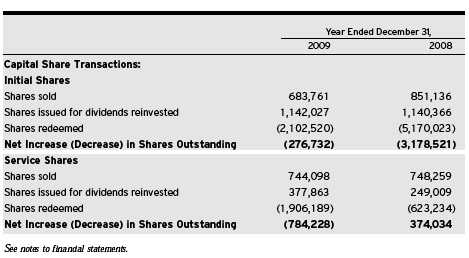
STATEMENT OF CHANGES IN NET ASSETS
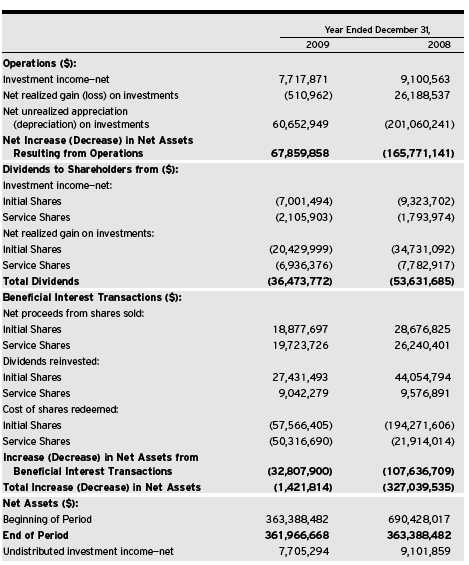
14
The Fund 15
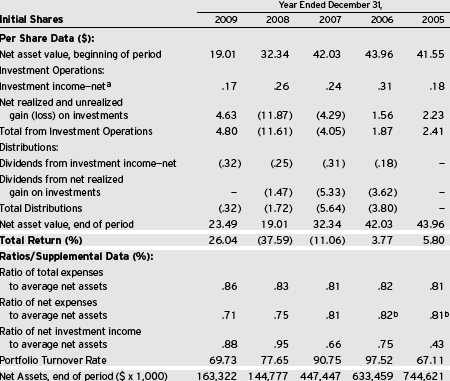
FINANCIAL HIGHLIGHTS
The following tables describe the performance for each share class for the fiscal periods indicated.All information (except portfolio turnover rate) reflects financial results for a single fund share.Total return shows how much your investment in the fund would have increased (or decreased) during each period, assuming you had reinvested all dividends and distributions. The fund’s total returns do not reflect expenses associated with variable annuity or insurance contracts.These figures have been derived from the fund’s financial statements.
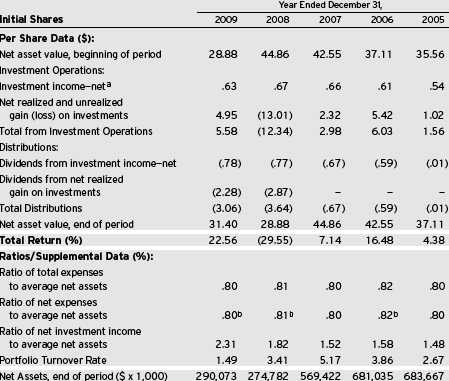
| a | Based on average shares outstanding at each month end. |
| b | Expense waivers and/or reimbursements amounted to less than .01%. |
See notes to financial statements.
16

| |
| a | Based on average shares outstanding at each month end. |
| b | Expense waivers and/or reimbursements amounted to less than .01%. |
See notes to financial statements.
The Fund 17
NOTES TO FINANCIAL STATEMENTS
NOTE 1—Significant Accounting Policies:
Dreyfus Variable Investment Fund (the “Company”) is registered under the Investment Company Act of 1940, as amended (the “Act”), as an open-end management investment company, operating as a series company currently offering seven series, including the Appreciation Portfolio (the “fund”). The fund is only offered to separate accounts established by insurance companies to fund variable annuity contracts and variable life insurance policies.The fund is a diversified series.The fund’s investment objective is to provide long-term capital growth consistent with the preservation of capital. The Dreyfus Corporation (the “Manager” or “Dreyfus”), a wholly-owned subsidiary ofThe Bank of New York Mellon Corporation (“BNY Mellon”), serves as the fund’s investment adviser. Fayez Sarofim & Co. (“Sarofim & Co.”) serves as the fund’s sub-investment advi ser.
MBSC Securities Corporation (the “Distributor”), a wholly-owned subsidiary of the Manager, is the distributor of the fund’s shares, which are sold without a sales charge.The fund is authorized to issue an unlimited number of $.001 par value shares of Beneficial Interest in each of the following classes of shares: Initial and Service. Each class of shares has identical rights and privileges, except with respect to the distribution plan, the expenses borne by each class, the allocation of certain transfer agency costs and certain voting rights. Income, expenses (other than expenses attributable to a specific class), and realized and unrealized gains or losses on investments are allocated to each class of shares based on its relative net assets.
The Company accounts separately for the assets, liabilities and operations of each series. Expenses directly attributable to each series are charged to that series’ operations; expenses which are applicable to all series are allocated among them on a pro rata basis.
The Financial Accounting Standards Board (“FASB”) Accounting Standards Codification (“ASC”) has become the exclusive reference of authoritative U.S. generally accepted accounting principles (“GAAP”) recognized by the FASB to be applied by nongovernmental entities.
18
Rules and interpretive releases of the Securities and Exchange Commission (“SEC”) under authority of federal laws are also sources of authoritative GAAP for SEC registrants. The ASC has superseded all existing non-SEC accounting and reporting standards. The fund’s financial statements are prepared in accordance with GAAP, which may require the use of management estimates and assumptions.Actual results could differ from those estimates.
The Company enters into contracts that contain a variety of indemnifications. The fund’s maximum exposure under these arrangements is unknown.The fund does not anticipate recognizing any loss related to these arrangements.
(a) Portfolio valuation: Investments in securities are valued at the last sales price on the securities exchange or national securities market on which such securities are primarily traded. Securities listed on the National Market System for which market quotations are available are valued at the official closing price or, if there is no official closing price that day, at the last sales price. Securities not listed on an exchange or the national securities market, or securities for which there were no transactions, are valued at the average of the most recent bid and asked prices, except for open short positions, where the asked price is used for valuation purposes. Bid price is used when no asked price is available. Registered investment companies that are not traded on an exchange are valued at their net asset value.When market quotations or officia l closing prices are not readily available, or are determined not to reflect accurately fair value, such as when the value of a security has been significantly affected by events after the close of the exchange or market on which the security is principally traded (for example, a foreign exchange or market), but before the fund calculates its net asset value, the fund may value these investments at fair value as determined in accordance with the procedures approved by the Board of Trustees. Fair valuing of securities may be determined with the assistance of a pricing service using calculations based on indices of domestic securities and other appropriate indicators, such as prices of relevant ADRs
The Fund 19
NOTES TO FINANCIAL STATEMENTS (continued)
and futures contracts. For other securities that are fair valued by the Board ofTrustees, certain factors may be considered such as: fundamental analytical data, the nature and duration of restrictions on disposition, an evaluation of the forces that influence the market in which the securities are purchased and sold and public trading in similar securities of the issuer or comparable issuers. Financial futures are valued at the last sales price. Investments denominated in foreign currencies are translated to U.S. dollars at the prevailing rates of exchange.
The fair value of a financial instrument is the amount that would be received to sell an asset or paid to transfer a liability in an orderly transaction between market participants at the measurement date (i.e. the exit price). GAAP establishes a fair value hierarchy that prioritizes the inputs of valuation techniques used to measure fair value.This hierarchy gives the highest priority to unadjusted quoted prices in active markets for identical assets or liabilities (Level 1 measurements) and the lowest priority to unobservable inputs (Level 3 measurements).
Additionally, GAAP provides guidance on determining whether the volume and activity in a market has decreased significantly and whether such a decrease in activity results in transactions that are not orderly. GAAP requires enhanced disclosures around valuation inputs and techniques used during annual and interim periods.
Various inputs are used in determining the value of the fund’s investments relating to fair value measurements. These inputs are summarized in the three broad levels listed below:
Level 1—unadjusted quoted prices in active markets for
identical investments.
Level 2—other significant observable inputs (including quoted
prices for similar investments, interest rates, prepayment speeds,
credit risk, etc.).
Level 3—significant unobservable inputs (including the fund’s own
assumptions in determining the fair value of investments).
The inputs or methodology used for valuing securities are not necessarily an indication of the risk associated with investing in those securities.
20
The following is a summary of the inputs used as of December 31, 2009 in valuing the fund’s investments:

| |
| † | See Statement of Investments for industry classification. |
(b) Foreign currency transactions: The fund does not isolate that portion of the results of operations resulting from changes in foreign exchange rates on investments from the fluctuations arising from changes in market prices of securities held. Such fluctuations are included with the net realized and unrealized gain or loss on investments.
Net realized foreign exchange gains or losses arise from sales of foreign currencies,currency gains or losses realized on securities transactions and the difference between the amounts of dividends, interest and foreign withholding taxes recorded on the fund’s books and the U.S. dollar equivalent of the amounts actually received or paid. Net unrealized foreign exchange gains and losses arise from changes in the value of assets and liabilities other than investments, resulting from changes in exchange rates. Foreign currency gains and losses on investments are included with net realized and unrealized gain or loss on investments.
(c) Securities transactions and investment income: Securities transactions are recorded on a trade date basis. Realized gains and losses from securities transactions are recorded on the identified cost basis. Dividend income is recognized on the ex-dividend date and interest income, including, where applicable, accretion of discount and amortization of premium on investments, is recognized on the accrual basis.
The Fund 21
NOTES TO FINANCIAL STATEMENTS (continued)
The fund has arrangements with the custodian and cash management bank whereby the fund may receive earnings credits when positive cash balances are maintained, which are used to offset custody and cash management fees. For financial reporting purposes, the fund includes net earnings credits as an expense offset in the Statement of Operations.
Pursuant to a securities lending agreement with The Bank of New York Mellon, a subsidiary of BNY Mellon and an affiliate of Dreyfus, the fund may lend securities to qualified institutions. It is the fund’s policy that, at origination, all loans are secured by collateral of at least 102% of the value of U.S. securities loaned and 105% of the value of foreign securities loaned. Collateral equivalent to at least 100% of the market value of securities on loan is maintained at all times. Collateral is either in the form of cash, which can be invested in certain money market mutual funds managed by the Manager, U.S. Government and Agency securities or letters of credit.The fund is entitled to receive all income on securities loaned, in addition to income earned as a result of the lending transaction. Although each security loaned is fully collateralized, the fund bears the risk of delay in recovery of, or loss of rights in, the securities loaned should a borrower fail to return the securities in a timely manner. During the period ended December 31, 2009, The Bank of New York Mellon earned $32,926 from lending portfolio securities, pursuant to the securities lending agreement.
(d) Affiliated issuers: Investments in other investment companies advised by Dreyfus are defined as “affiliated” in the Act.
(e) Dividends to shareholders: Dividends are recorded on the ex-dividend date. Dividends from investment income-net and dividends from net realized capital gains, if any, are normally declared and paid annually, but the fund may make distributions on a more frequent basis to comply with the distribution requirements of the Internal Revenue Code of 1986, as amended (the “Code”).To the extent that net realized capital gains can be offset by capital loss carryovers, it is the policy of the fund not to distribute such gains. Income and capital gain distributions are determined in accordance with income tax regulations, which may differ from GAAP.
22
(f) Federal income taxes: It is the policy of the fund to continue to qualify as a regulated investment company, if such qualification is in the best interests of its shareholders, by complying with the applicable provisions of the Code, and to make distributions of taxable income sufficient to relieve it from substantially all federal income and excise taxes.
As of and during the period ended December 31, 2009, the fund did not have any liabilities for any uncertain tax positions.The fund recognizes interest and penalties, if any, related to uncertain tax positions as income tax expense in the Statement of Operations. During the period, the fund did not incur any interest or penalties.
Each of the tax years in the four-year period ended December 31, 2009 remains subject to examination by the Internal Revenue Service and state taxing authorities.
At December 31, 2009, the components of accumulated earnings on a tax basis were as follow: ordinary income $7,705,294, accumulated capital losses $658,768 and unrealized appreciation $103,286,931. In addition, the fund had $147,803 of capital losses realized after October 31, 2009, which were deferred for tax purposes to the first day of the following fiscal year.
The accumulated capital loss carryover is available for federal income tax purposes to be applied against future net securities profits, if any, realized subsequent to December 31, 2009. If not applied, the carryover expires in fiscal 2017.
The tax character of distributions paid to shareholders during the fiscal periods ended December 31, 2009 and December 31, 2008 were as follows: undistributed ordinary income $9,239,227 and $11,221,296 and long-term capital gains $27,234,545 and $42,410,389, respectively.
During the period ended December 31, 2009, as a result of permanent book to tax differences, primarily due to the tax treatment for foreign currency exchange gains and losses and dividend reclassification, the fund decreased accumulated undistributed investment income-net by $7,039 and increased accumulated net realized gain
The Fund 23
NOTES TO FINANCIAL STATEMENTS (continued)
(loss) on investments by the same amount. Net assets and net asset value per share were not affected by this reclassification.
NOTE 2—Bank Lines of Credit:
The fund participates with other Dreyfus-managed funds in a $225 million unsecured credit facility led by Citibank, N.A. and a $300 million unsecured credit facility provided by The Bank of New York Mellon (each, a “Facility”), each to be utilized primarily for temporary or emergency purposes, including the financing of redemptions. In connection therewith, the fund has agreed to pay its pro rata portion of commitment fees for each Facility. Interest is charged to the fund based on rates determined pursuant to the terms of the respective Facility at the time of borrowing.
The average amount of borrowings outstanding under the Facilities during the period ended December 31, 2009, was approximately $13,000, with a related weighted average annualized interest rate of 1.57%.
NOTE 3—Investment Advisory Fee, Sub-Investment Advisory Fee and Other Transactions With Affiliates:
(a) Pursuant to an investment advisory agreement with Dreyfus, the investment advisory fee was based on the value of the fund’s average daily net assets and was computed at the following annual rates: .55% of the first $150 million; .50% of the next $150 million; and .375% over $300 million. Effective August 3, 2009, the annual rate of the investment advisory fee is .5325% of the value of the fund’s average daily net assets.The fee is payable monthly. Pursuant to a sub-investment advisory agreement with Sarofim & Co., the sub-investment advisory fee was based upon the value of the fund’s average daily net assets and is computed at the following annual rates: .20% of the first $150 million; .25% of the next $150 million; and .375% over $300 million. Effective August 3, 2009, the annual rate of the sub-investment advisory fee is .2175% of the value of the fund’s average daily net assets.The fee is payable monthly.
(b) Under the Distribution Plan (the “Plan”) adopted pursuant to Rule 12b-1 under the Act, Service shares pay the Distributor for distributing
24
their shares, for servicing and/or maintaining Service shares’ shareholder accounts and for advertising and marketing for Service shares.The Plan provides for payments to be made at an annual rate of .25% of the value of the Service shares’ average daily net assets.The Distributor may make payments to Participating Insurance Companies and to brokers and dealers acting as principal underwriter for their variable insurance prod-ucts.The fees payable under the Plan are payable without regard to actual expenses incurred. During the period ended December 31, 2009, Service shares were charged $190,011 pursuant to the Plan.
The fund compensates Dreyfus Transfer, Inc., a wholly-owned subsidiary of Dreyfus, under a transfer agency agreement for providing personnel and facilities to perform transfer agency services for the fund. During the period ended December 31, 2009, the fund was charged $1,251 pursuant to the transfer agency agreement, which is included in Shareholder servicing costs in the Statement of Operations.
The fund compensates The Bank of New York Mellon under a cash management agreement for performing cash management services related to fund subscriptions and redemptions. During the period ended December 31, 2009, the fund was charged $225 pursuant to the cash management agreement, which is included in Shareholder servicing costs in the Statement of Operations. These fees were offset by earnings credits pursuant to the cash management agreement.
The fund also compensates The Bank of New York Mellon under a custody agreement for providing custodial services for the fund. During the period ended December 31, 2009, the fund was charged $30,262 pursuant to the custody agreement.
During the period ended December 31, 2009, the fund was charged $6,681 for services performed by the Chief Compliance Officer.
The components of “Due to The Dreyfus Corporation and affiliates” in the Statement of Assets and Liabilities consist of: investment advisory fees $165,604, Rule 12b-1 distribution plan fees $15,197, custodian fees $7,691, chief compliance officer fees $5,011 and transfer agency per account fees $196.
The Fund 25
NOTES TO FINANCIAL STATEMENTS (continued)
(c) Each Board member also serves as a Board member of other funds within the Dreyfus complex. Annual retainer fees and attendance fees are allocated to each fund based on net assets.
NOTE 4—Securities Transactions:
The aggregate amount of purchases and sales of investment securities, excluding short-term securities, during the period ended December 31, 2009, amounted to $4,992,352 and $63,196,642, respectively.
The fund adopted the provisions of ASC Topic 815 “Derivatives and Hedging” which requires qualitative disclosures about objectives and strategies for using derivatives, quantitative disclosures about fair value amounts of gains and losses on derivative instruments and disclosures about credit-risk-related contingent features in derivative agreements. The fund held no derivatives during the period ended December 31, 2009. These disclosures did not impact the notes to the financial statements.
At December 31, 2009, the cost of investments for federal income tax purposes was $263,714,099; accordingly, accumulated net unrealized appreciation on investments was $103,286,931, consisting of $121,486,066 gross unrealized appreciation and $18,199,135 gross unrealized depreciation.
NOTE 5—Subsequent Events Evaluation:
Dreyfus has evaluated the need for disclosures and/or adjustments resulting from subsequent events through February 10, 2010, the date the financial statements were issued. This evaluation did not result in any subsequent events that necessitated disclosures and/or adjustments.
26
|
| REPORT OF INDEPENDENT REGISTERED |
| PUBLIC ACCOUNTING FIRM |
|
| Shareholders and Board of Trustees |
| Dreyfus Variable Investment Fund, Appreciation Portfolio |
We have audited the accompanying statement of assets and liabilities, including the statement of investments, of Dreyfus Variable Investment Fund, Appreciation Portfolio (one of the series comprising Dreyfus Variable Investment Fund) as of December 31, 2009, and the related statement of operations for the year then ended, the statement of changes in net assets for each of the two years in the period then ended, and financial highlights for each of the years indicated therein. These financial statements and financial highlights are the responsibility of the Fund’s management. Our responsibility is to express an opinion on these financial statements and financial highlights based on our audits.
We conducted our audits in accordance with the standards of the Public Company Accounting Oversight Board (United States).Those standards require that we plan and perform the audit to obtain reasonable assurance about whether the financial statements and financial highlights are free of material misstatement.We were not engaged to perform an audit of the Fund’s internal control over financial reporting.Our audits included consideration of internal control over financial reporting as a basis for designing audit procedures that are appropriate in the circumstances,but not for the purpose of expressing an opinion on the effectiveness of the Fund’s internal control over financial reporting.Accordingly, we express no such opinion.An audit also includes examining, on a test basis, evidence supporting the amounts and disclosures in the financial statements and financial highlights, assessing the accounting principles used an d significant estimates made by management, and evaluating the overall financial statement presentation. Our procedures included confirmation of securities owned as of December 31, 2009 by correspondence with the custodian and others.We believe that our audits provide a reasonable basis for our opinion.
In our opinion, the financial statements and financial highlights referred to above present fairly, in all material respects, the financial position of Dreyfus Variable Investment Fund, Appreciation Portfolio at December 31,2009,the results of its operations for the year then ended,the changes in its net assets for each of the two years in the period then ended, and the financial highlights for each of the indicated years, in conformity with U. S. generally accepted accounting principles.

The Fund 27
IMPORTANT TAX INFORMATION (Unaudited)
For federal tax purposes, the fund hereby designates $2.2654 per share as a long-term capital gain distribution and $.0106 per share as a short-term capital gain distribution paid on March 26, 2009 and also the fund hereby designates 100% of the ordinary dividends paid during the fiscal year ended December 31, 2009 as qualifying for the corporate dividends received deduction. Shareholders will receive notification in early 2010 of the percentage applicable to the preparation of their 2009 income tax returns.
28
|
| INFORMATION ABOUT THE REVIEW AND |
| APPROVAL OF THE FUND’S INVESTMENT |
| ADVISORY AGREEMENT (Unaudited) |
At a meeting of the fund’s Board held on June 30, 2009, the Board unanimously approved amendment, effective August 3, 2009, of the fund’s Investment Advisory Agreement with Dreyfus and the Sub-Investment Advisory Agreement between the fund and Fayez Sarofim & Co. (“Sarofim”) (together, the “Agreements”).The Board members, none of whom are “interested persons” (as defined in the Investment Company Act of 1940, as amended) of the fund, were assisted in their review by independent legal counsel. In approving the amendment of the Agreements, the Board considered all factors that it believed to be relevant, including, among other things, the factors discussed below. Since the Board had renewed the Agreements at a meeting held on March 3, 2009 (the “March Meeting”) for one-year terms ending March 31, 2010, and, other than as discussed below, there had been no material changes in t he information presented, the Board addressed many of the relevant considerations by reference to their considerations and determinations at the March Meeting.
Analysis of Nature, Extent and Quality of Services Provided to the Fund. The nature, extent and quality of services provided to the fund by Dreyfus and Sarofim had been considered at the March Meeting, and there had been no material changes in this information. Dreyfus representatives stated, and the Board considered, that Sarofim, subject to Dreyfus’ supervision, would continue to provide the day-to-day management of the fund’s investments in accordance with the fund’s investment objective, policies and limitations as set forth in the fund’s prospectus and statement of additional information; Dreyfus would continue to supervise Sarofim in its sub-investment advisory role for the fund; Dreyfus does not believe that the proposed amendments to the Agreements would have any adverse impact on the scope or quality of the services provided to the fund by Dreyfus or Sarofim; and the proposed amendments also would not result in any change to the investment management of the fund.
The Fund 29
|
| INFORMATION ABOUT THE REVIEW AND APPROVAL OF THE FUND’S |
| INVESTMENT ADVISORY AGREEMENT (Unaudited) (continued) |
Comparative Analysis of the Fund’s Performance, Management Fee and Expense Ratio. The Board considered the fund’s performance, management fee and expense ratio at the March Meeting.The Board did not consider the period of time since the March Meeting to be an adequate period of time for reconsideration of performance in connection with approving the amendments to the Agreements. The Board also considered that the amendments would not change the aggregate management fees paid by the fund or the fund’s expense ratio. As a result, the Board did not reconsider comparative fee and expense information, including fees paid to Dreyfus or Sarofim by mutual funds and/or separate accounts with similar investment objectives, policies and strategies as the fund.
Analysis of Profitability and Economies of Scale. The Board had considered profitability, economies of scale and potential benefits to Dreyfus or Sarofim from acting as investment adviser and sub-investment adviser, respectively, at the March Meeting.As a result, the Board did not reconsider economies of scale and potential benefits, which would not change under the amendments from those considered at the March Meeting. In addition, since the increase in Drefyus’ fee that would result from the amendments was not believed to be material, and since future profitability is difficult to estimate, the Board did not reconsider profitability, which would be considered in connection with the Agreements’ renewal.
At the conclusion of these discussions, the Board agreed that it had been furnished with sufficient information to make an informed business decision with respect to amendment of the fund’s Agreements. Based on the discussions and considerations as described above, the Board made the following conclusions and determinations.
30
- The Board concluded that the nature, extent and quality of the ser- vices provided by Dreyfus and Sarofim continued to be adequate and appropriate.
- The Board concluded that the fees to be paid to Dreyfus and Sarofim, which were not changing in aggregate amount paid by the fund, continued to be reasonable.
The Board members considered these conclusions and determinations and, in light of the conclusions and determinations at the March Meeting and without any one factor being dispositive, the Board determined that amendment of the fund’s Agreements was in the best interests of the fund and its shareholders.
The Fund 31
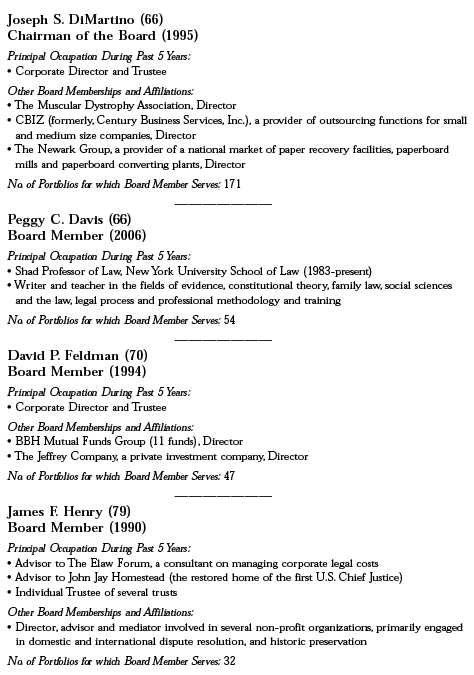
BOARD MEMBERS INFORMATION (Unaudited)
32
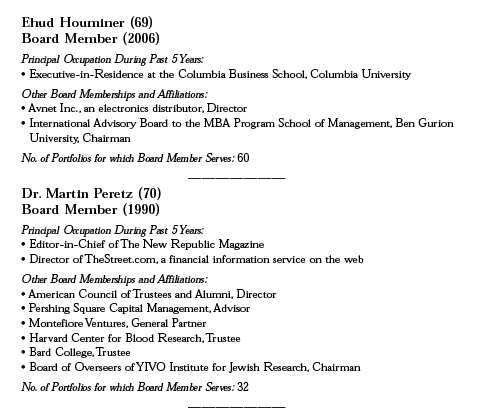
Once elected all Board Members serve for an indefinite term, but achieve Emeritus status upon reaching age 80.The address of the Board Members and Officers is in c/o The Dreyfus Corporation, 200 Park Avenue, NewYork, NewYork 10166. Additional information about the Board Members is available in the fund’s Statement of Additional Information which can be obtained from Dreyfus free of charge by calling this toll free number: 1-800-554-4611.
John M. Fraser, Jr., Emeritus Board Member
Rosalind G. Jacobs, Emeritus Board Member
Dr. Paul A. Marks, Emeritus Board Member
Gloria Messinger, Emeritus Board Member
The Fund 33
OFFICERS OF THE FUND (Unaudited)
34
The Fund 35
OFFICERS OF THE FUND (Unaudited) (continued)
36
For More Information
|
| Telephone 1-800-554-4611 or 1-516-338-3300 |
| Mail The Dreyfus Family of Funds, 144 Glenn Curtiss Boulevard, Uniondale, NY 11556-0144 |
| Attn: Investments Division |
The fund files its complete schedule of portfolio holdings with the Securities and Exchange Commission (“SEC”) for the first and third quarters of each fiscal year on Form N-Q. The fund’s Forms N-Q are available on the SEC’s website at http://www.sec.gov and may be reviewed and copied at the SEC’s Public Reference Room in Washington, DC. Information on the operation of the Public Reference Room may be obtained by calling 1-800-SEC-0330.
A description of the policies and procedures that the fund uses to determine how to vote proxies relating to portfolio securities, and information regarding how the fund voted these proxies for the most recent 12-month period ended June 30 is available at http://www.dreyfus.com and on the SEC’s website at http://www.sec.gov. The description of the policies and procedures is also available without charge, upon request, by calling 1-800-645-6561.

|
| Dreyfus Variable |
| Investment Fund, |
| Developing Leaders |
| Portfolio |
ANNUAL REPORT December 31, 2009

The views expressed in this report reflect those of the portfolio manager only through the end of the period covered and do not necessarily represent the views of Dreyfus or any other person in the Dreyfus organization. Any such views are subject to change at any time based upon market or other conditions and Dreyfus disclaims any responsibility to update such views.These views may not be relied on as investment advice and, because investment decisions for a Dreyfus fund are based on numerous factors, may not be relied on as an indication of trading intent on behalf of any Dreyfus fund.

| | Contents |
| | THE FUND |
| 2 | A Letter from the Chairman and CEO |
| 3 | Discussion of Fund Performance |
| 6 | Fund Performance |
| 8 | Understanding Your Fund’s Expenses |
| 8 | Comparing Your Fund’s Expenses With Those of Other Funds |
| 9 | Statement of Investments |
| 19 | Statement of Assets and Liabilities |
| 20 | Statement of Operations |
| 21 | Statement of Changes in Net Assets |
| 23 | Financial Highlights |
| 25 | Notes to Financial Statements |
| 34 | Report of Independent Registered Public Accounting Firm |
| 35 | Important Tax Information |
| 36 | Information About the Review and Approval of the Fund’s Investment Advisory Agreement |
| 41 | Board Members Information |
| 43 | Officers of the Fund |
| | FOR MORE INFORMATION |
| | Back Cover |
Dreyfus Variable Investment Fund,
Developing Leaders Portfolio
The Fund

A LETTER FROM THE CHAIRMAN AND CEO
Dear Shareholder:
We are pleased to present this annual report for Developing Leaders Portfolio, a series of Dreyfus Variable Investment Fund, covering the 12-month period from January 1, 2009, through December 31, 2009.
The U.S. stock market ended 2009 with a healthy annual gain, but market indices across all capitalization ranges and investment styles remained well below the peaks reached in the fall of 2007.The equity market’s advance was driven by improving investor sentiment as the U.S. economy staged a gradual, but sustained, recovery from the recession and banking crisis that had depressed stock prices at the beginning of the year. After four consecutive quarters of contraction, the U.S. economy returned to growth during the third quarter of 2009, buoyed by greater manufacturing activity to replenish depleted inventories and satisfy export demand. The slumping housing market also showed signs of renewed life later in the year when home sales and prices rebounded modestly. However, economic headwinds remain, including a high unemployment rate and the prospect of anemic consumer spending.
As 2010 begins, our Chief Economist, as well as many securities analysts and portfolio managers have continued to find opportunities and survey potential challenges across a variety of asset classes, including equities. While no one can predict the future, we believe that the 2010 investment environment will likely require a broader range of investment considerations relative to last year. As always, your financial adviser can help you determine the mix of investments that may be best suited to helping you achieve your goals at a level of risk that is comfortable for you.
For information about how the fund performed during the reporting period, as well as market perspectives, we have provided a Discussion of Fund Performance.
Thank you for your continued confidence and support.

Jonathan R. Baum
Chairman and Chief Executive Officer
The Dreyfus Corporation
January 15, 2010
2

DISCUSSION OF FUND PERFORMANCE
For the period of January 1, 2009, through December 31, 2009, as provided by Oliver Buckley, Langton C. Garvin and Kristin Crawford, Portfolio Managers
Fund and Market Performance Overview
For the 12-month period ended December 31, 2009, Developing Leaders Portfolio,a series of Dreyfus Variable Investment Fund, produced a total return of 26.04% for its Initial shares, and its Service shares returned 25.77%.1 In comparison, the Russell 2000 Index (the “Index”), the fund’s benchmark, produced a total return of 27.17% for the same period.2
Following a recession-related slide during January and February 2009, stocks broadly rebounded as investors looked forward to better economic times. On average, small-cap stocks performed roughly on a par with their large-cap counterparts, and the fund participated in the market’s advance to a significant degree. However, underweighted exposure to highly leveraged, previously beaten down stocks during a time when investors favored such shares caused the fund’s returns to trail slightly behind the benchmark.
The Fund’s Investment Approach
We select small-cap stocks through a “bottom-up” approach that seeks to identify undervalued securities using a quantitative screening process. This process is driven by a proprietary quantitative model, which measures approximately 40 stock characteristics to identify and rank stocks. Over time, we attempt to construct a portfolio that has exposure to industries and market capitalizations generally similar to the fund’s benchmark.Within each sector, we seek to overweight the most attractive stocks and underweight or not hold the stocks that have been ranked least attractive.
Positive Investor Sentiment Fueled Market Rally
The first two months of 2009 saw more of the recession-related market declines that had characterized the second half of 2008 as a global recession and financial crisis continued to take its toll. During the first quarter of the year, most major stock market indices hit multi-year lows amid fears of frozen credit markets and depressed business conditions.
The Fund 3
DISCUSSION OF FUND PERFORMANCE (continued)
However, stock prices began to rebound in March due to signs that aggressive remedial programs implemented by government and monetary authorities—including historically low short-term interest rates and a massive economic stimulus package—were gaining traction.
As the possibility of widespread bankruptcies receded, previously beaten-down companies with weak balance sheets and high degrees of leverage enjoyed especially robust gains. Conversely, stocks exhibiting several traditionally favorable qualities—such as consistently high levels of profitability and a consistent ability to pay interest on outstanding debt—significantly underperformed market averages. This trend persisted until the fourth quarter, when mounting evidence of sustainable economic improvement prompted an increasing number of investors to place greater emphasis on long-term growth prospects, management quality and valuations.
Performance Metrics Produced Some Successes
The market’s bias in favor of lower-quality stocks during much of the year generally worked in favor of the fund’s valuation metrics. At the same time, these same factors caused momentum metrics to detract from fund performance. As a result, stocks exhibiting good value and good momentum characteristics underperformed those exhibiting good value and weaker momentum.
The impact of this trend was most starkly apparent in the financials sector, where many firms that had appeared to be headed for bankruptcy in early 2009 multiplied in value after investors grew more confident of their survival.The fund invested in few such companies because they did not meet our investment criteria.Nevertheless,the fund participated substantially in the market’s surge, underperforming its benchmark by only a narrow margin. During the latter part of the year, as investors increasingly factored longer-term profitability and management quality into their calculations, the fund’s relative performance improved significantly.
Stock Selection Strategy Drove Fund Performance
Individual stock selections were the primary drivers of fund returns. Several outstanding performers doubled or tripled in value on the strength of better-than-expected earnings, far outpacing their sector and industry counterparts. Top holdings included greeting card publisher American Greetings, mobile communications equipment maker Starent Networks (which was sold during the period), business services provider
4
M & F Worldwide and customer relations servicer TeleTech Holdings. The fund also derived notably strong returns from bank holding company SVB Financial Group and dental equipment makers Sirona Dental Systems (also sold during the reporting period) and Align Technology.
On a more negative note, several biotechnology stocks produced significant disappointments.These included Martek Biosciences,ViroPharma and Myriad Genetics. Biotechnology-related returns also suffered from the fund’s lack of exposure to Human Genome Sciences, a benchmark holding that shot up after announcing successful results of new drug trial.Timing of the purchase and sale of shipping services provider Pacer International further detracted from the fund’s relative performance.
Staying the Course
As of the end of the reporting period, we are encouraged by a broadly based return of market sentiment to more rational and balanced investment criteria.The fund is structured to continue benefiting from market conditions that reward companies exhibiting strong momentum and valuation characteristics.While temporary market influences may undermine the effectiveness of our approach for brief periods, we believe that our consistent, disciplined stock selection process positions the fund to outperform its benchmark over the long term.
January 15, 2010
| |
| | The fund is only available as a funding vehicle under various life insurance policies or variable |
| | annuity contracts issued by insurance companies. Individuals may not purchase shares of the fund |
| | directly. A variable annuity is an insurance contract issued by an insurance company that enables |
| | investors to accumulate assets on a tax-deferred basis for retirement or other long-term goals.The |
| | investment objective and policies of Developing Leaders Portfolio, a series of Dreyfus Variable |
| | Investment Fund, made available through insurance products may be similar to other funds |
| | managed or advised by Dreyfus. However, the investment results of the fund may be higher or |
| | lower than, and may not be comparable to, those of any other Dreyfus fund. |
| 1 | Total return includes reinvestment of dividends and any capital gains paid. Past performance is no |
| | guarantee of future results. Share price and investment return fluctuate such that upon redemption, |
| | fund shares may be worth more or less than their original cost.The fund’s performance does not |
| | reflect the deduction of additional charges and expenses imposed in connection with investing in |
| | variable insurance contracts, which will reduce returns. Return figures provided reflect the absorption |
| | of certain fund expenses by The Dreyfus Corporation pursuant to an agreement in effect through |
| | May 1, 2010, at which time it may be extended, terminated or modified. Had these expenses not |
| | been absorbed, the fund’s returns would have been lower. |
| 2 | SOURCE: LIPPER INC. — Reflects reinvestment of dividends and, where applicable, capital |
| | gain distributions.The Russell 2000 Index is an unmanaged index of small-cap stock performance |
| | and is composed of the 2,000 smallest companies in the Russell 3000 Index.The Russell 3000 |
| | Index is composed of the 3,000 largest U.S. companies based on total market capitalization. |
The Fund 5
FUND PERFORMANCE
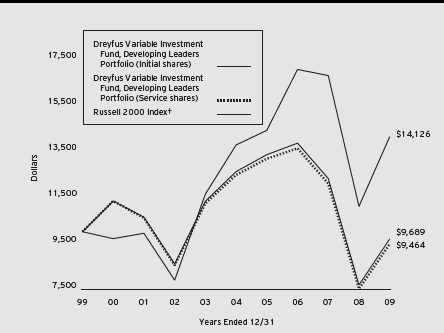
Comparison of change in value of $10,000 investment in Dreyfus Variable Investment Fund, Developing Leaders Portfolio Initial shares and Service shares and the Russell 2000 Index
| | | | | | |
| Average Annual Total Returns as of 12/31/09 | | | | | | |
| | 1 Year | 5 Years | 10 Years |
| Initial shares | 26.04% | –5.14% | –0.32% |
| Service shares | 25.77% | –5.37% | –0.55% |
|
| The data for Service shares includes the results of Initial shares for the period prior to December 31, 2000 |
| (inception date of Service shares). Actual Service shares’ average annual total return and hypothetical growth |
| results would have been lower. See notes below. |
| † Source: Lipper Inc. |
| Past performance is not predictive of future performance.The fund’s performance shown in the graph and table does not |
| reflect the deduction of taxes that a shareholder would pay on fund distributions or the redemption of fund shares. |
| The fund’s performance does not reflect the deduction of additional charges and expenses imposed in connection |
| with investing in variable insurance contracts which will reduce returns. |
| The above graph compares a $10,000 investment made in Initial and Service shares of Dreyfus Variable Investment |
| Fund, Developing Leaders Portfolio on 12/31/99 to a $10,000 investment made in the Russell 2000 Index (the |
| “Index”) on that date. |
6
The fund’s Initial shares are not subject to a Rule 12b-1 fee.The fund’s Service shares are subject to a 0.25% annual
Rule 12b-1 fee.The performance figures for Service shares reflect the performance of the fund’s Initial shares from their
inception date through December 30, 2000, and the performance of the fund’s Service shares from December 31, 2000
(inception date of Service shares) to December 31, 2009 (blended performance figures).The blended performance figures
have not been adjusted to reflect the higher operating expenses of the Service shares. If these expenses had been reflected, the
blended performance figures would have been lower.All dividends and capital gain distributions are reinvested.
The fund’s performance shown in the line graph takes into account all applicable fund fees and expenses.The Index is an
unmanaged index and is composed of the 2,000 smallest companies in the Russell 3000 Index.The Russell 3000
Index is composed of 3,000 of the largest U.S. companies by market capitalization. Unlike a mutual fund, the Index is
not subject to charges, fees and other expenses. Investors cannot invest directly in any index. Further information relating
to fund performance, including expense reimbursements, if applicable, is contained in the Financial Highlights section of
the prospectus and elsewhere in this report.
The Fund 7
UNDERSTANDING YOUR FUND’S EXPENSES (Unaudited)
As a mutual fund investor, you pay ongoing expenses, such as management fees and other expenses. Using the information below, you can estimate how these expenses affect your investment and compare them with the expenses of other funds.You also may pay one-time transaction expenses, including sales charges (loads), redemption fees and expenses associated with variable annuity or insurance contracts, which are not shown in this section and would have resulted in higher total expenses. For more information, see your fund’s prospectus or talk to your financial adviser.
Review your fund’s expenses
The table below shows the expenses you would have paid on a $1,000 investment in Dreyfus Variable Investment Fund, Developing Leaders Portfolio from July 1, 2009 to December 31, 2009. It also shows how much a $1,000 investment would be worth at the close of the period, assuming actual returns and expenses.
|
| Expenses and Value of a $1,000 Investment |
| assuming actual returns for the six months ended December 31, 2009 |
| | | | |
| | | Initial Shares | | Service Shares |
| Expenses paid per $1,000† | $ | 3.95 | $ | 5.36 |
| Ending value (after expenses) | $ | 1,240.90 | $ | 1,239.50 |
|
| COMPARING YOUR FUND’S EXPENSES |
| WITH THOSE OF OTHER FUNDS (Unaudited) |
Using the SEC’s method to compare expenses
The Securities and Exchange Commission (SEC) has established guidelines to help investors assess fund expenses. Per these guidelines, the table below shows your fund’s expenses based on a $1,000 investment, assuming a hypothetical 5% annualized return. You can use this information to compare the ongoing expenses (but not transaction expenses or total cost) of investing in the fund with those of other funds.All mutual fund shareholder reports will provide this information to help you make this comparison. Please note that you cannot use this information to estimate your actual ending account balance and expenses paid during the period.
|
| Expenses and Value of a $1,000 Investment |
| assuming a hypothetical 5% annualized return for the six months ended December 31, 2009 |
| | | | |
| | | Initial Shares | | Service Shares |
| Expenses paid per $1,000† | $ | 3.57 | $ | 4.84 |
| Ending value (after expenses) | $ | 1,021.68 | $ | 1,020.42 |
|
| † Expenses are equal to the fund’s annualized expense ratio of .70% for Initial Shares and .95% for Service Shares, |
| multiplied by the average account value over the period, multiplied by 184/365 (to reflect the one-half year period). |
8
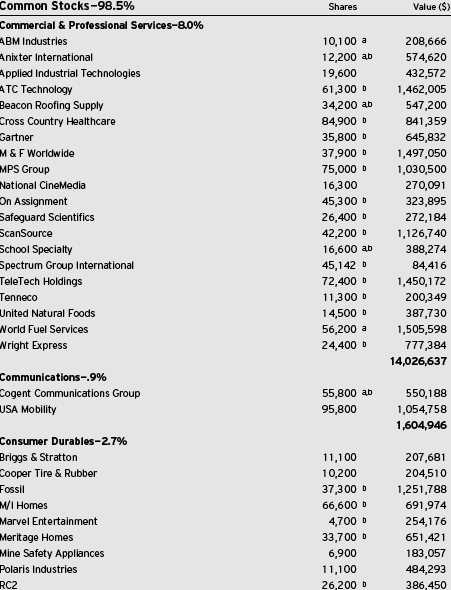
STATEMENT OF INVESTMENTS
December 31, 2009
The Fund 9
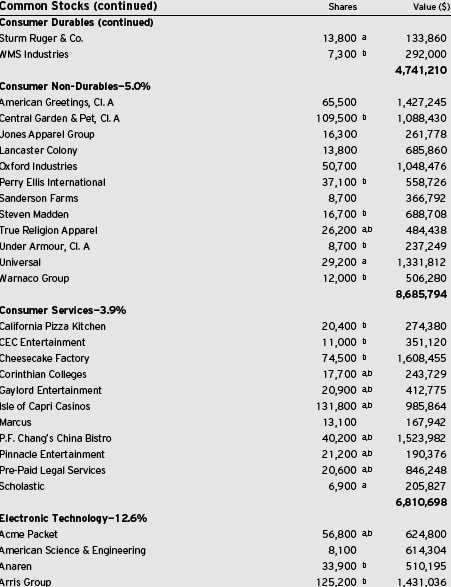
STATEMENT OF INVESTMENTS (continued)
10
The Fund 11
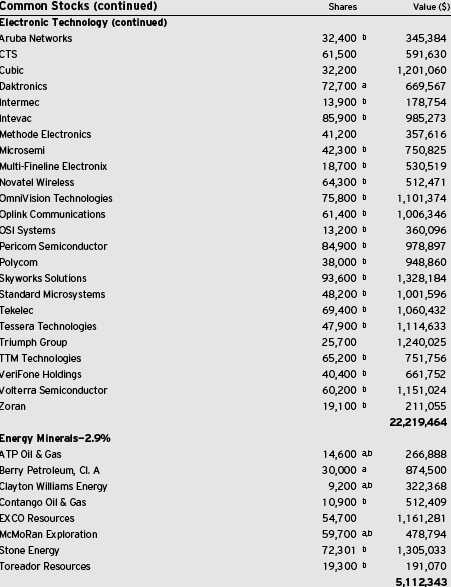
STATEMENT OF INVESTMENTS (continued)

12
The Fund 13
STATEMENT OF INVESTMENTS (continued)

14

The Fund 15
STATEMENT OF INVESTMENTS (continued)
16
The Fund 17
STATEMENT OF INVESTMENTS (continued)

|
| a Security, or portion thereof, on loan. At December 31, 2009, the total market value of the fund’s securities on loan is |
| $28,548,619 and the total market value of the collateral held by the fund is $29,895,533. |
| b Non-income producing security. |
| c Investment in affiliated money market mutual fund. |
|
| † Based on net assets. |
| See notes to financial statements. |
18
|
| STATEMENT OF ASSETS AND LIABILITIES |
| December 31, 2009 |
The Fund 19
|
| STATEMENT OF OPERATIONS |
| Year Ended December 31, 2009 |
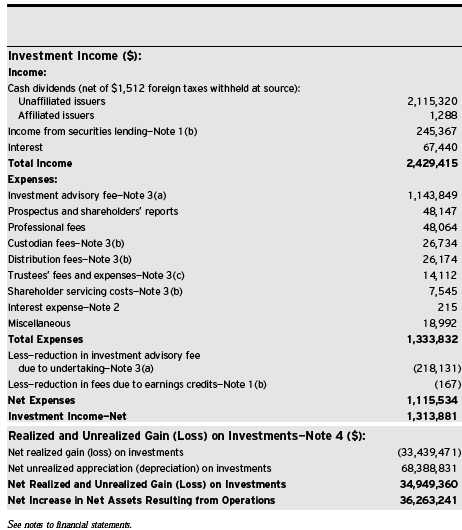
20
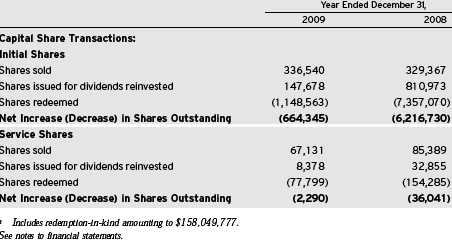
STATEMENT OF CHANGES IN NET ASSETS
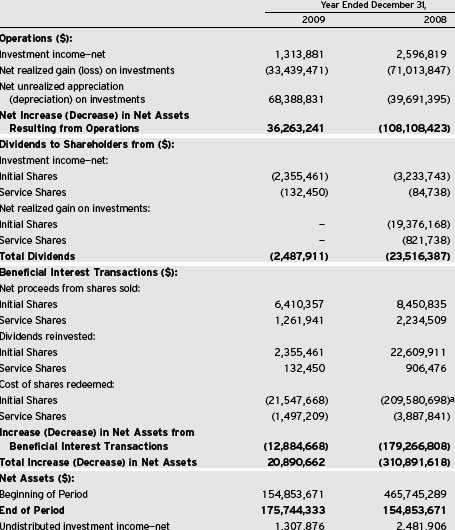
The Fund 21
STATEMENT OF CHANGES IN NET ASSETS (continued)
22
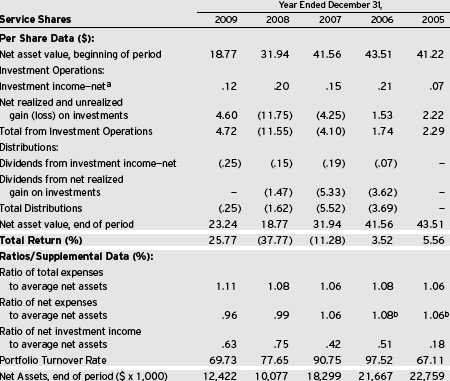
FINANCIAL HIGHLIGHTS
The following tables describe the performance for each share class for the fiscal periods indicated.All information (except portfolio turnover rate) reflects financial results for a single fund share.Total return shows how much your investment in the fund would have increased (or decreased) during each period, assuming you had reinvested all dividends and distributions. The fund’s total returns do not reflect expenses associated with variable annuity or insurance contracts.These figures have been derived from the fund’s financial statements.
| |
| a | Based on average shares outstanding at each month end. |
| b | Expense waivers and/or reimbursements amounted to less than .01%. |
See notes to financial statements.
The Fund 23
FINANCIAL HIGHLIGHTS (continued)
| |
| a | Based on average shares outstanding at each month end. |
| b | Expense waivers and/or reimbursements amounted to less than .01%. |
See notes to financial statements.
24
NOTES TO FINANCIAL STATEMENTS
NOTE 1—Significant Accounting Policies:
DreyfusVariable Investment Fund (the “Company”) is registered under the Investment Company Act of 1940, as amended (the “Act”), as an open-end management investment company, operating as a series company currently offering seven series, including the Developing Leaders Portfolio (the “fund”). The fund is only offered to separate accounts established by insurance companies to fund variable annuity contracts and variable life insurance policies.The fund is a diversified series.The fund’s investment objective is capital growth.The Dreyfus Corporation (the “Manager” or “Dreyfus”), a wholly-owned subsidiary of The Bank of New York Mellon Corporation (“BNY Mellon”), serves as the fund’s investment adviser.
MBSC Securities Corporation (the “Distributor”), a wholly-owned subsidiary of the Manager, is the distributor of the fund’s shares, which are sold without a sales charge. The fund is authorized to issue an unlimited number of $.001 par value shares of Beneficial Interest in each of the following classes of shares: Initial and Service. Each class of shares has identical rights and privileges, except with respect to the distribution plan and the expenses borne by each class, the allocation of certain transfer agency costs and certain voting rights. Income, expenses (other than expenses attributable to a specific class), and realized and unrealized gains or losses on investments are allocated to each class of shares based on its relative net assets.
The Company accounts separately for the assets, liabilities and operations of each series. Expenses directly attributable to each series are charged to that series’ operations; expenses which are applicable to all series are allocated among them on a pro rata basis.
The Financial Accounting Standards Board (“FASB”) Accounting Standards Codification (“ASC”) has become the exclusive reference of authoritative U.S. generally accepted accounting principles (“GAAP”) recognized by the FASB to be applied by nongovernmental entities. Rules and interpretive releases of the Securities and Exchange Commission (“SEC”) under authority of federal laws are also sources
The Fund 25
NOTES TO FINANCIAL STATEMENTS (continued)
of authoritative GAAP for SEC registrants. The ASC has superseded all existing non-SEC accounting and reporting standards. The fund’s financial statements are prepared in accordance with GAAP, which may require the use of management estimates and assumptions.Actual results could differ from those estimates.
The Company enters into contracts that contain a variety of indemnifications. The fund’s maximum exposure under these arrangements is unknown.The fund does not anticipate recognizing any loss related to these arrangements.
(a) Portfolio valuation: Investments in securities are valued at the last sales price on the securities exchange or national securities market on which such securities are primarily traded. Securities listed on the National Market System for which market quotations are available are valued at the official closing price or, if there is no official closing price that day, at the last sales price. Securities not listed on an exchange or the national securities market, or securities for which there were no transactions, are valued at the average of the most recent bid and asked prices, except for open short positions, where the asked price is used for valuation purposes. Bid price is used when no asked price is available. Registered investment companies that are not traded on an exchange are valued at their net asset value.When market quotations or officia l closing prices are not readily available, or are determined not to reflect accurately fair value, such as when the value of a security has been significantly affected by events after the close of the exchange or market on which the security is principally traded (for example, a foreign exchange or market), but before the fund calculates its net asset value, the fund may value these investments at fair value as determined in accordance with the procedures approved by the Board of Trustees. Fair valuing of securities may be determined with the assistance of a pricing service using calculations based on indices of domestic securities and other appropriate indicators, such as prices of relevant American Depository Receipts and futures contracts. For other securities that are fair valued by the Board of Trustees, certain factors may
26
be considered such as: fundamental analytical data, the nature and duration of restrictions on disposition, an evaluation of the forces that influence the market in which the securities are purchased and sold, and public trading in similar securities of the issuer or comparable issuers. Financial futures are valued at the last sales price.
The fair value of a financial instrument is the amount that would be received to sell an asset or paid to transfer a liability in an orderly transaction between market participants at the measurement date (i.e. the exit price). GAAP establishes a fair value hierarchy that prioritizes the inputs of valuation techniques used to measure fair value.This hierarchy gives the highest priority to unadjusted quoted prices in active markets for identical assets or liabilities (Level 1 measurements) and the lowest priority to unobservable inputs (Level 3 measurements).
Additionally, GAAP provides guidance on determining whether the volume and activity in a market has decreased significantly and whether such a decrease in activity results in transactions that are not orderly. GAAP requires enhanced disclosures around valuation inputs and techniques used during annual and interim periods.
Various inputs are used in determining the value of the fund’s investments relating to fair value measurements. These inputs are summarized in the three broad levels listed below:
Level 1—unadjusted quoted prices in active markets for
identical investments.
Level 2—other significant observable inputs (including quoted
prices for similar investments, interest rates, prepayment speeds,
credit risk, etc.).
Level 3—significant unobservable inputs (including the fund’s own
assumptions in determining the fair value of investments).
The inputs or methodology used for valuing securities are not necessarily an indication of the risk associated with investing in those securities.
The Fund 27
NOTES TO FINANCIAL STATEMENTS (continued)
The following is a summary of the inputs used as of December 31, 2009 in valuing the fund’s investments:
| | | | |
| | | Level 2—Other | Level 3— | |
| | Level 1— | Significant | Significant | |
| | Unadjusted | Observable | Unobservable | |
| | Quoted Prices | Inputs | Inputs | Total |
| Assets ($) | | | | |
| Investments in Securities: | | | |
| Equity Securities— | | | | |
| Domestic† | 170,639,792 | — | — | 170,639,792 |
| Equity Securities— | | | | |
| Foreign† | 2,535,377 | — | — | 2,535,377 |
| Mutual Funds | 32,582,533 | — | — | 32,582,533 |
| |
| † | See Statement of Investments for industry classification. |
(b) Securities transactions and investment income: Securities transactions are recorded on a trade date basis. Realized gains and losses from securities transactions are recorded on the identified cost basis. Dividend income is recognized on the ex-dividend date and interest income, including, where applicable, accretion of discount and amortization of premium on investments, is recognized on the accrual basis.
The fund has arrangements with the custodian and cash management bank whereby the fund may receive earnings credits when positive cash balances are maintained, which are used to offset custody and cash management fees. For financial reporting purposes, the fund includes net earnings credits as an expense offset in the Statement of Operations.
Pursuant to a securities lending agreement with The Bank of New York Mellon, a subsidiary of BNY Mellon and an affiliate of Dreyfus, the fund may lend securities to qualified institutions. It is the fund’s policy that, at origination, all loans are secured by collateral of at least 102% of the value of U.S. securities loaned and 105% of the value of foreign securities loaned. Collateral equivalent to at least 100% of the market value of securities on loan is maintained at all times. Collateral is either in the form of cash, which can be invested in certain money market mutual funds managed by the Manager, U.S. Government and Agency securities or letters of credit.The fund is entitled to receive all
28
income on securities loaned, in addition to income earned as a result of the lending transaction. Although each security loaned is fully collateralized, the fund bears the risk of delay in recovery of, or loss of rights in, the securities loaned should a borrower fail to return the securities in a timely manner. During the period ended December 31, 2009,The Bank of New York Mellon earned $105,157 from lending portfolio securities, pursuant to the securities lending agreement.
(c) Affiliated issuers: Investments in other investment companies advised by the Manager are defined as “affiliated” in the Act.
(d) Dividends to shareholders: Dividends are recorded on the ex-dividend date. Dividends from investment income-net and dividends from net realized capital gains, if any, are normally declared and paid annually, but the fund may make distributions on a more frequent basis to comply with the distribution requirements of the Internal Revenue Code of 1986, as amended (the “Code”).To the extent that net realized capital gains can be offset by capital loss carryovers, it is the policy of the fund not to distribute such gains. Income and capital gain distributions are determined in accordance with income tax regulations, which may differ from GAAP.
(e) Federal income taxes: It is the policy of the fund to continue to qualify as a regulated investment company, if such qualification is in the best interests of its shareholders, by complying with the applicable provisions of the Code, and to make distributions of taxable income sufficient to relieve it from substantially all federal income and excise taxes.
As of and during the period ended December 31, 2009, the fund did not have any liabilities for any uncertain tax positions.The fund recognizes interest and penalties, if any, related to uncertain tax positions as income tax expense in the Statement of Operations. During the period, the fund did not incur any interest or penalties.
Each of the tax years in the four-year period ended December 31, 2009 remains subject to examination by the Internal Revenue Service and state taxing authorities.
The Fund 29
NOTES TO FINANCIAL STATEMENTS (continued)
At December 31, 2009, the components of accumulated earnings on a tax basis were as follows: undistributed ordinary income $1,355,392, accumulated capital losses $107,316,986 and unrealized depreciation $983,761. In addition, the fund had $275,366 of capital losses realized after October 31, 2009 which were deferred for tax purposes to the first day of the following fiscal year.
The accumulated capital loss carryover is available for federal income tax purposes to be applied against future net securities profits, if any, realized subsequent to December 31, 2009. If not applied, $56,692,295 of the carryover expires in fiscal 2016 and $50,624,691 expires in fiscal 2017.
The tax character of distributions paid to shareholders during the fiscal periods ended December 31, 2009 and December 31, 2008, were as follows: ordinary income $2,487,911 and $9,843,199 and long-term capital gains $0 and $13,673,188, respectively.
NOTE 2—Bank Lines of Credit:
The fund participates with other Dreyfus-managed funds in a $225 million unsecured credit facility led by Citibank, N.A. and a $300 million unsecured credit facility provided by The Bank of New York Mellon (each, a “Facility”), each to be utilized primarily for temporary or emergency purposes, including the financing of redemptions. In connection therewith, the fund has agreed to pay its pro rata portion of commitment fees for each Facility. Interest is charged to the fund based on rates determined pursuant to the terms of the respective Facility at the time of borrowing.
The average amount of borrowings outstanding under the Facilities during the period ended December 31, 2009, was approximately $13,900, with a related weighted average annualized interest rate of 1.55%.
NOTE 3—Investment Advisory Fee and Other Transactions With Affiliates:
(a) Pursuant to an investment advisory agreement with the Manager, the investment advisory fee is computed at the annual rate of .75% of the value of the fund’s average daily net assets and is payable monthly.
30
The Manager has agreed until May 1, 2010, to waive receipt of its fees and/or assume the expenses of the fund so that the total annual fund operating expenses of each class (excluding Rule 12b-1 fees, taxes, brokerage commissions, interest on borrowings, commitment fees and extraordinary expenses) do not exceed .70% of the value of the fund’s average daily net assets.The reduction in investment advisory fee, pursuant to the undertaking, amounted to $218,131 during the period ended December 31, 2009.
(b) Under the Distribution Plan (the “Plan”) adopted pursuant to Rule 12b-1 under the Act, Service shares pay the Distributor for distributing their shares, for servicing and/or maintaining Service shares’ shareholder accounts and for advertising and marketing for Service shares.The Plan provides for payments to be made at an annual rate of .25% of the value of the Service shares’ average daily net assets.The Distributor may make payments to Participating Insurance Companies and to brokers and dealers acting as principal underwriter for their variable insurance products.The fees payable under the Plan are payable without regard to actual expenses incurred. During the period ended December 31, 2009, Service shares were charged $26,174 pursuant to the Plan.
The fund compensates Dreyfus Transfer, Inc., a wholly-owned subsidiary of the Manager, under a transfer agency agreement for providing personnel and facilities to perform transfer agency services for the fund. During the period ended December 31, 2009, the fund was charged $1,017 pursuant to the transfer agency agreement, which is included in Shareholder servicing costs in the Statement of Operations.
The fund compensates The Bank of New York Mellon under a cash management agreement for performing cash management services related to fund subscriptions and redemptions. During the period ended December 31, 2009, the fund was charged $167 pursuant to the cash management agreement, which is included in Shareholder servicing costs in the Statement of Operations. These fees were offset by earnings credits pursuant to the cash management agreement.
The Fund 31
NOTES TO FINANCIAL STATEMENTS (continued)
The fund also compensates The Bank of New York Mellon under a custody agreement for providing custodial services for the fund. During the period ended December 31, 2009, the fund was charged $26,734 pursuant to the custody agreement.
During the period ended December 31, 2009, the fund was charged $6,681 for services performed by the Chief Compliance Officer.
The components of “Due to The Dreyfus Corporation and affiliates” in the Statement of Assets and Liabilities consist of: investment advisory fees $109,927, Rule 12b-1 distribution plan fees $2,585, custodian fees $2,889, chief compliance officer fees $5,011 and transfer agency per account fees $143, which are offset against an expense reimbursement currently in effect in the amount of $461.
(c) Each Board member also serves as a Board member of other funds within the Dreyfus complex. Annual retainer fees and attendance fees are allocated to each fund based on net assets.
NOTE 4—Securities Transactions:
The aggregate amount of purchases and sales of investment securities, excluding short-term securities, during the period ended December 31, 2009, amounted to $105,382,148 and $120,132,457, respectively.
The fund adopted the provisions of ASC Topic 815 “Derivatives and Hedging” which requires qualitative disclosures about objectives and strategies for using derivatives, quantitative disclosures about fair value amounts of gains and losses on derivative instruments and disclosures about credit-risk-related contingent features in derivative agreements. The fund held no derivatives during the period ended December 31, 2009. These disclosures did not impact the notes to the financial statements.
32
At December 31, 2009, the cost of investments for federal income tax purposes was $206,741,463; accordingly, accumulated net unrealized depreciation on investments was $983,761, consisting of $21,049,950 gross unrealized appreciation and $22,033,711 gross unrealized depreciation.
NOTE 5—Subsequent Events Evaluation:
Dreyfus has evaluated the need for disclosures and/or adjustments resulting from subsequent events through February 10, 2010, the date the financial statements were issued. This evaluation did not result in any subsequent events that necessitated disclosures and/or adjustments other than at a special telephonic meeting of the Board on February 3, 2010, the Board approved the following:
- David Daglio was appointed primary portfolio manager effective February 8, 2010.
- Effective February 8, 2010, the fund’s investment process was changed to focus on fundamental analysis and research, rather than a quantitative model, to select stocks for the fund. In addition, the fund’s sector and industry weightings and risk characteristics will be based on the portfolio manager’s bottom-up fundamental analysis and could vary from those of the Russell 2000 Index.
- Effective April 19, 2010, the fund’s name will be changed to Dreyfus Variable Investment Fund- Opportunistic Small Cap Portfolio.
- Effective April 19, 2010, the fund will have a policy of investing at least 80% of its assets in small cap companies. The fund currently considers small cap companies to be companies with market capital- izations that fall within the range of companies in the Russell 2000 Index at the time of purchase.
The Fund 33
|
| REPORT OF INDEPENDENT REGISTERED |
| PUBLIC ACCOUNTING FIRM |
|
| Shareholders and Board of Trustees |
| Dreyfus Variable Investment Fund, Developing Leaders Portfolio |
We have audited the accompanying statement of assets and liabilities, including the statement of investments, of Dreyfus Variable Investment Fund, Developing Leaders Portfolio (one of the series comprising Dreyfus Variable Investment Fund) as of December 31, 2009, and the related statement of operations for the year then ended, the statement of changes in net assets for each of the two years in the period then ended, and financial highlights for each of the years indicated therein. These financial statements and financial highlights are the responsibility of the Fund’s management. Our responsibility is to express an opinion on these financial statements and financial highlights based on our audits.
We conducted our audits in accordance with the standards of the Public Company Accounting Oversight Board (United States).Those standards require that we plan and perform the audit to obtain reasonable assurance about whether the financial statements and financial highlights are free of material misstatement.We were not engaged to perform an audit of the Fund’s internal control over financial reporting. Our audits included consideration of internal control over financial reporting as a basis for designing audit procedures that are appropriate in the circumstances, but not for the purpose of expressing an opinion on the effectiveness of the Fund’s internal control over financial reporting. Accordingly, we express no such opinion.An audit also includes examining, on a test basis, evidence supporting the amounts and disclosures in the financial statements and financial highlights, assessing the accounting principles used and significant estimates made by management, and evaluating the overall financial statement presentation. Our procedures included confirmation of securities owned as of December 31, 2009 by correspondence with the custodian and others.We believe that our audits provide a reasonable basis for our opinion.
In our opinion, the financial statements and financial highlights referred to above present fairly, in all material respects, the financial position of Dreyfus Variable Investment Fund, Developing Leaders Portfolio at December 31, 2009, the results of its operations for the year then ended, the changes in its net assets for each of the two years in the period then ended, and the financial highlights for each of the indicated years, in conformity with U.S. generally accepted accounting principles.
New York, New York
February 10, 2010
34
IMPORTANT TAX INFORMATION (Unaudited)
For federal tax purposes, the fund hereby designates 100% of the ordinary dividends paid during the fiscal year ended December 31, 2009 as qualifying for the corporate dividends received deduction. Shareholders will receive notification in early 2010 of the percentage applicable to the preparation of their 2009 income tax returns.
The Fund 35
|
| INFORMATION ABOUT THE REVIEW AND |
| APPROVAL OF THE FUND’S INVESTMENT |
| ADVISORY AGREEMENT (Unaudited) |
At a meeting of the Board of Trustees of Dreyfus Variable Investment Fund (the “Company”) held on September 22, 2009, the Board unanimously approved the continuation of the Developing Leaders Porfolio (the “fund”) Investment Advisory Agreement with Dreyfus for a six-month term ending March 31, 2010. The Board members, none of whom are “interested persons” (as defined in the Investment Company Act of 1940, as amended) of the fund, were assisted in their review by independent legal counsel and met with counsel in executive session separate from representatives of Dreyfus. In approving the continuance of the Investment Advisory Agreement, the Board considered all factors that they believed to be relevant, including, among other things, the factors discussed below.
Analysis of Nature, Extent and Quality of Services Provided to the Fund. The Board members received a presentation from representatives of Dreyfus regarding services provided to the fund and other funds in the Dreyfus fund complex, and discussed the nature, extent and quality of the services provided to the fund pursuant to its Investment Advisory Agreement. Dreyfus’ representatives reviewed the fund’s distribution of accounts and the relationships Dreyfus has with various intermediaries and the different needs of each. Dreyfus’ representatives noted the various distribution channels for the fund as well as the diverse methods of distribution among other funds in the Dreyfus fund complex, and Dreyfus’ corresponding need for broad, deep, and diverse resources to be able to provide ongoing shareholder services to each distribution channel, inc luding those of the fund. Dreyfus also provided the number of accounts investing in the fund, as well as the fund’s asset size.
The Board members also considered Dreyfus’ research and portfolio management capabilities and Dreyfus’ oversight of day-to-day fund operations, including fund accounting and administration and assistance in meeting legal and regulatory requirements. The Board members also considered Dreyfus’ extensive administrative, accounting and compliance infrastructure.The Board also considered Dreyfus’ brokerage policies and practices, the standards applied in seeking best execution and Dreyfus’ policies and practices regarding soft dollars.
36
Comparative Analysis of the Fund’s Performance and Advisory Fee and Expense Ratio. The Board members reviewed the fund’s performance and comparisons to a group of small-cap core funds underlying variable insurance products (the “Performance Group”) and to a larger universe of funds, consisting of all small-cap core funds underlying variable insurance products (the “Performance Universe”) selected and provided by Lipper, Inc. (“Lipper”), an independent provider of investment company data. The Board was provided with a description of the methodology Lipper used to select the Performance Group and Performance Universe, as well as the Expense Group and Expense Universe (discussed below). The Board members discussed the results of the comparisons and noted the fund’s average annual total return ranked in the fourth quarti le of the Performance Group and Performance Universe for the one-, three- and five-year periods ended December 31, 2008.The Board was encouraged, however, by the fact that the fund was in the first and second quartile of its Lipper group for the three-month and year-to-date periods, respectively, ended July 31, 2009.
The Board members also discussed the fund’s contractual and actual management fees and expense ratio and reviewed the range of management fees and expense ratios as compared to a comparable group of funds (the “Expense Group”) and a broader group of funds (the “Expense Universe”), each selected and provided by Lipper.The fund’s contractual and actual management fees and expense ratio ranked in the first quartile (lowest fees) of the Expense Group and Expense Universe. The Board members also noted Dreyfus’ undertaking that, through May 1, 2010, if the aggregate expenses of the fund, exclusive of shareholder servicing fees, and Rule 12b-1 fees, but including the management fee, exceed 0.70 of 1% of the value of the fund’s average daily net assets, the fund may deduct from the payment to be made to Dreyfus under the Investment Advisory Agreement, or Dreyfus will bear, such excess expense.
The Fund 37
|
| INFORMATION ABOUT THE REVIEW AND APPROVAL OF THE FUND’S |
| INVESTMENT ADVISORY AGREEMENT (Unaudited) (continued) |
Representatives of Dreyfus reviewed with the Board members the fees paid to Dreyfus or its affiliates by mutual funds and/or separate accounts managed by Dreyfus with similar investment objectives, policies and strategies as the fund (the “Similar Accounts”), and explained the nature of the Similar Accounts and the differences, from Dreyfus’ perspective, as applicable, in providing services to the Similar Accounts as compared to the fund. Dreyfus’ representatives also reviewed the costs associated with distribution through intermediaries. The Board analyzed differences in fees paid to Dreyfus and discussed the relationship of the advisory fees paid in light of the services provided. The Board members considered the relevance of the fee information provided for the Similar Accounts to evaluate the appropriateness and reasonableness of the fund’s management fees. The Board acknowledged that differences in fees paid by the Similar Accounts seemed to be consistent with the services provided.
Analysis of Profitability and Economies of Scale. Dreyfus’ representatives reviewed the dollar amount of expenses allocated and profit received by Dreyfus and the method used to determine such expenses and profit. The Board previously had been provided with information prepared by an independent consulting firm regarding Dreyfus’ approach to allocating costs to, and determining the profitability of, individual funds and the entire Dreyfus mutual fund complex.The Board also was informed that the methodology had also been reviewed by an independent registered public accounting firm which, like the consultant, found the methodology to be reasonable.The consulting firm also analyzed where any economies of scale might emerge in connection with the management of the fund. The Board members evaluated the profitability analysis in light of the relevant circum stances for the fund and the extent to which economies of scale would be realized if the fund grows and whether fee levels reflect these economies of scale for the benefit of fund investors. The Board members also considered potential benefits to
38
Dreyfus from acting as investment adviser and noted the soft dollar arrangements with respect to trading the fund’s investments.
It was noted that the Board members should consider Dreyfus’ profitability with respect to the fund as part of their evaluation of whether the fees under the Investment Advisory Agreement bear a reasonable relationship to the mix of services provided by Dreyfus, including the nature, extent and quality of such services, and that a discussion of economies of scale is predicated on a fund having achieved a substantial size with increasing assets and that, if a fund’s assets had been static or decreasing, the possibility that Dreyfus may have realized any economies of scale would be less. It also was noted that the profitability percentage for managing the fund was within ranges determined by appropriate court cases to be reasonable given the services rendered and generally superior service levels provided.The Board also noted Dreyfus’ waiver of receipt of a portion of the management fee and its effect on the profit ability of Dreyfus.
At the conclusion of these discussions, the Board agreed that it had been furnished with sufficient information to make an informed business decision with respect to continuation of the fund’s Investment Advisory Agreement. Based on the discussions and considerations as described above, the Board made the following conclusions and determinations.
- The Board concluded that the nature, extent and quality of the services provided by Dreyfus are adequate and appropriate.
- While the Board was concerned with the fund’s long-term perfor- mance, the Board noted the recent improvement in performance and Dreyfus’ efforts to improve the fund’s returns, and determined to continue to closely monitor performance.
- The Board concluded that the fee paid by the fund to Dreyfus was reasonable in light of the considerations described above.
The Fund 39
|
| INFORMATION ABOUT THE REVIEW AND APPROVAL OF THE FUND’S |
| INVESTMENT ADVISORY AGREEMENT (Unaudited) (continued) |
- The Board determined that the economies of scale which may accrue to Dreyfus and its affiliates in connection with the management of the fund had been adequately considered by Dreyfus in connection with the advisory fee rate charged to the fund and that, to the extent in the future it were determined that material economies of scale had not been shared with the fund, the Board would seek to have those economies of scale shared with the fund.
The Board members considered these conclusions and determinations, along with information received on a routine and regular basis throughout the year, and, without any one factor being dispositive, the Board determined that continuation of the fund’s Investment Advisory Agreement for a six-month period was in the best interests of the fund and its shareholders.
40
BOARD MEMBERS INFORMATION (Unaudited)
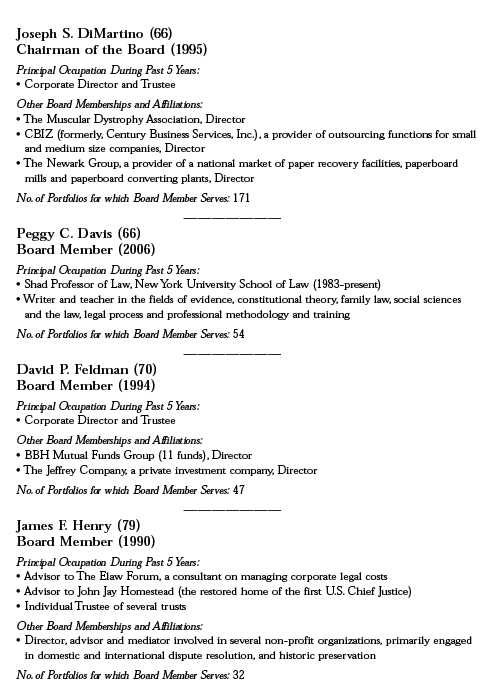
The Fund 41
BOARD MEMBERS INFORMATION (Unaudited) (continued)
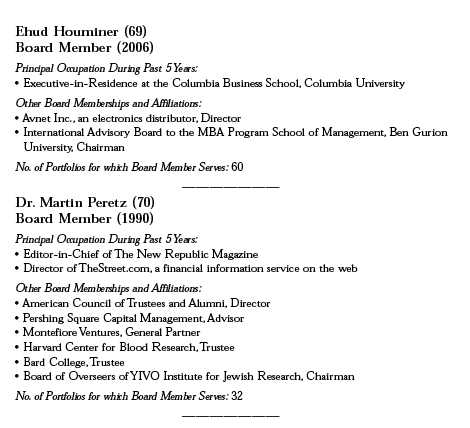
Once elected all Board Members serve for an indefinite term, but achieve Emeritus status upon reaching age 80.The address of the Board Members and Officers is in c/o The Dreyfus Corporation, 200 Park Avenue, NewYork, NewYork 10166. Additional information about the Board Members is available in the fund’s Statement of Additional Information which can be obtained from Dreyfus free of charge by calling this toll free number: 1-800-554-4611.
John M. Fraser, Jr., Emeritus Board Member
Rosalind G. Jacobs, Emeritus Board Member
Dr. Paul A. Marks, Emeritus Board Member
Gloria Messinger, Emeritus Board Member
42
OFFICERS OF THE FUND (Unaudited)
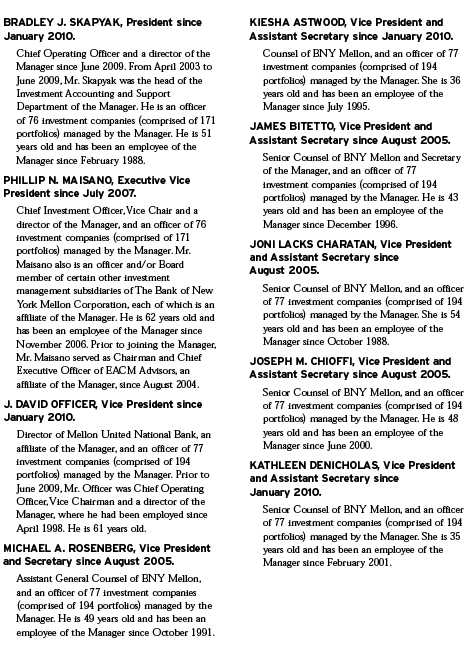
The Fund 43
OFFICERS OF THE FUND (Unaudited) (continued)
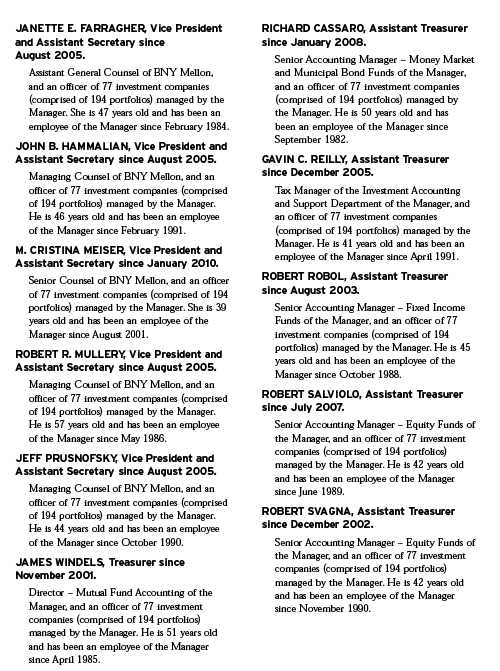
44
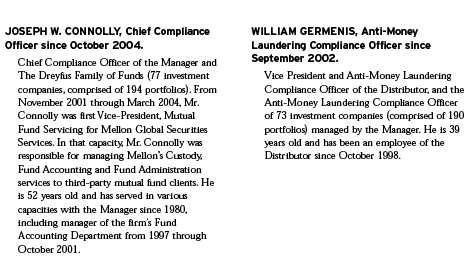
The Fund 45
For More Information
Telephone 1-800-554-4611 or 1-516-338-3300
Mail The Dreyfus Family of Funds, 144 Glenn Curtiss Boulevard, Uniondale, NY 11556-0144 Attn: Investments Division
The fund files its complete schedule of portfolio holdings with the Securities and Exchange Commission (“SEC”) for the first and third quarters of each fiscal year on Form N-Q. The fund’s Forms N-Q are available on the SEC’s website at http://www.sec.gov and may be reviewed and copied at the SEC’s Public Reference Room in Washington, DC. Information on the operation of the Public Reference Room may be obtained by calling 1-800-SEC-0330.
A description of the policies and procedures that the fund uses to determine how to vote proxies relating to portfolio securities, and information regarding how the fund voted these proxies for the most recent 12-month period ended June 30 is available at http://www.dreyfus.com and on the SEC’s website at http://www.sec.gov. The description of the policies and procedures is also available without charge, upon request, by calling 1-800-645-6561.

|
| Dreyfus Variable |
| Investment Fund, |
| Growth and Income |
| Portfolio |
ANNUAL REPORT December 31, 2009

The views expressed in this report reflect those of the portfolio manager only through the end of the period covered and do not necessarily represent the views of Dreyfus or any other person in the Dreyfus organization. Any such views are subject to change at any time based upon market or other conditions and Dreyfus disclaims any responsibility to update such views.These views may not be relied on as investment advice and, because investment decisions for a Dreyfus fund are based on numerous factors, may not be relied on as an indication of trading intent on behalf of any Dreyfus fund.

| | Contents |
| | THE FUND |
| 2 | A Letter from the Chairman and CEO |
| 3 | Discussion of Fund Performance |
| 6 | Fund Performance |
| 8 | Understanding Your Fund’s Expenses |
| 8 | Comparing Your Fund’s Expenses With Those of Other Funds |
| 9 | Statement of Investments |
| 15 | Statement of Options Written |
| 16 | Statement of Assets and Liabilities |
| 17 | Statement of Operations |
| 18 | Statement of Changes in Net Assets |
| 20 | Financial Highlights |
| 22 | Notes to Financial Statements |
| 33 | Report of Independent Registered Public Accounting Firm |
| 34 | Important Tax Information |
| 35 | Board Members Information |
| 37 | Officers of the Fund |
| | FOR MORE INFORMATION |
| | Back Cover |
|
| Dreyfus Variable Investment Fund, |
| Growth and Income Portfolio |
The Fund

A LETTER FROM THE CHAIRMAN AND CEO
Dear Shareholder:
We are pleased to present this annual report for Dreyfus Variable Investment Fund, Growth and Income Portfolio, covering the 12-month period from January 1, 2009, through December 31, 2009.
The U.S stock market ended 2009 with a healthy annual gain, but market indices across all capitalization ranges and investment styles remained well below the peaks reached in the fall of 2007.The equity market’s advance was driven by improving investor sentiment as the U.S. economy staged a gradual, but sustained, recovery from the recession and banking crisis that had depressed stock prices at the beginning of the year. After four consecutive quarters of contraction, the U.S. economy returned to growth during the third quarter of 2009, buoyed by greater manufacturing activity to replenish depleted inventories and satisfy export demand. The slumping housing market also showed signs of renewed life later in the year when home sales and prices rebounded modestly. However, economic headwinds remain, including a high unemployment rate and the prospect of anemic consumer spending.
As 2010 begins, our Chief Economist, as well as many securities analysts and portfolio managers have continued to find opportunities and survey potential challenges across a variety of asset classes, including equities. While no one can predict the future, we believe that the 2010 investment environment will likely require a broader range of investment considerations relative to last year. As always, your financial adviser can help you determine the mix of investments that may be best suited to helping you achieve your goals at a level of risk that is comfortable for you.
For information about how the fund performed during the reporting period, as well as market perspectives, we have provided a Discussion of Performance.
Thank you for your continued confidence and support.

Jonathan R. Baum
Chairman and Chief Executive Officer
The Dreyfus Corporation
January 15, 2010
2

DISCUSSION OF FUND PERFORMANCE
For the reporting period of January 1, 2009, through December 31, 2009, as provided by John Bailer and Elizabeth Slover, Portfolio Managers
Fund and Market Performance Overview
For the 12-month period ended December 31, 2009, Dreyfus Variable Investment Fund, Growth and Income Portfolio’s Initial shares achieved a 28.79% total return, and its Service shares achieved a total return of 28.44%.1 The fund’s benchmark, the Standard & Poor’s 500 Composite Stock Price Index (the “S&P 500 Index”), returned 26.47% for the same period.2
In the wake of a severe recession and banking crisis, stocks rallied over much of 2009 as credit markets thawed and investors looked forward to better economic times.The fund produced higher returns than its benchmark, as our security selection strategy produced above-average results in seven of the S&P 500 Index’s 10 market sectors.
The Fund’s Investment Approach
To pursue the fund’s goal of seeking long-term capital growth, current income and growth of income consistent with reasonable investment risk, the fund invests primarily in stocks of domestic and foreign issuers. We seek to create a broadly diversified portfolio that includes a blend of growth and dividend-paying stocks, as well as other investments that provide income.We choose stocks through a disciplined investment process that combines computer modeling techniques, bottom-up fundamental analysis and risk management. The investment process is designed to provide investors with investment exposure to sector weightings and risk characteristics similar to those of the S&P 500 Index.
U.S. Stock Market Rebounded Sharply
During the winter of 2009,equity markets were still reeling from a global financial crisis that nearly led to the collapse of the worldwide banking system. In addition, rising unemployment and declining housing markets had produced the most severe recession since the 1930s.These influences fueled a bear market that drove stocks across all capitalization ranges and investment styles to multi-year lows during the first quarter of the year.The decline affected a wide variety of industry groups seemingly regardless of their underlying business fundamentals.
The Fund 3
DISCUSSION OF FUND PERFORMANCE (continued)
Market sentiment began to improve in early March,as aggressive measures adopted by government and monetary authorities to repair the credit markets—including historically low short-term interest rates and a massive economic stimulus program—seemed to gain traction. Additional evidence of economic stabilization later appeared, sparking a sustained market rally through year-end. Lower-quality companies generally led the rally as investors turned to stocks that had been severely punished in the downturn.
Stock Selection Strategy Drove Fund Performance
Although investor behavior during the downturn was motivated more by fear of losses than the strengths and weaknesses of individual companies, our stock selection strategy proved relatively effective, helping the fund cushion market declines. Our process continued to work well during the rally over the remainder of 2009, when investors’ appetite for risk returned and we began to shift from a defensive investment posture to a more constructive stance.
The fund’s relative performance was especially robust in the energy sector, where our more constructive investment posture helped bolster the fund’s results as rising commodity prices drove stock prices higher.An underweighted position in industry bellwether ExxonMobil boosted relative returns when investors turned toward less defensive investments in the rally. Instead, we focused on smaller oil producers such as Occidental Petroleum, which advanced due to an attractive valuation and strong growth prospects.
In the economically sensitive consumer discretionary sector, we eliminated the fund’s position in for-profit education provider Apollo Group before the announcement of a regulatory investigation depressed its stock price, which weighed on the benchmark’s results. Positions in advertising-supported media companies, which had been hard-hit in the downturn, also contributed positively to relative performance as investors took advantage of depressed valuations in anticipation of rising advertising spending by businesses. Media giant Time Warner and advertising conglomerate Omnicom Group benefited from this development.
On the other hand, the fund encountered a number of disappointments in the health care sector, where stocks of companies such as mental health specialist Psychiatric Solutions were constrained by concerns
4
regarding health care reform legislation as well as investors’ shift away from traditionally defensive companies. In addition, underweighted exposure to pharmaceutical developer Schering-Plough dampened returns relative to the benchmark when the company was acquired by a former rival. Finally, in the industrials sector, trash disposal services provider Waste Management lagged market averages when investors turned to less defensive investments in the recovery.
Sluggish Recovery Expected
As of the reporting period’s end, the economy appears to be gaining strength, and we have seen signs that investors have been refocusing on companies with healthy finances and strong business fundamentals. Although we expect the recovery to remain relatively sluggish, in our judgment, these developments could lead to an investment environment that is especially well suited to our stock selection process. Indeed, we have continued to seek attractive opportunities among multinational companies, especially in the information technology and consumer discretionary sectors, that appear poised to prosper during an economic rebound that may be more robust overseas than in the United States.We have found fewer opportunities in the industrials and utilities sectors.
January 15, 2010
| |
| | Please note, the position in any security highlighted with italicized typeface was sold during the |
| | reporting period. |
| | The fund is only available as a funding vehicle under variable life insurance policies or variable |
| | annuity contracts issued by insurance companies. Individuals may not purchase shares of the fund |
| | directly. A variable annuity is an insurance contract issued by an insurance company that enables |
| | investors to accumulate assets on a tax-deferred basis for retirement or other long-term goals.The |
| | investment objective and policies of Dreyfus Variable Investment Fund, Growth and Income |
| | Portfolio made available through insurance products may be similar to other funds managed or |
| | advised by Dreyfus. However, the investment results of the fund may be higher or lower than, and |
| | may not be comparable to, those of any other Dreyfus fund. |
| 1 | Total return includes reinvestment of dividends and any capital gains paid. Past performance is no |
| | guarantee of future results. Share price and investment return fluctuate such that upon redemption, |
| | fund shares may be worth more or less than their original cost.The fund’s performance does not reflect |
| | the deduction of additional charges and expenses imposed in connection with investing in variable |
| | insurance contracts, which will reduce returns.The fund’s returns reflect the absorption of certain fund |
| | expenses by The Dreyfus Corporation pursuant to an undertaking that was in effect until October 1, |
| | 2009. Had these expenses not been absorbed, the fund’s returns would have been lower. |
| 2 | SOURCE: LIPPER, INC. – Reflects reinvestment of net dividends and, where applicable, |
| | capital gain distributions.The Standard & Poor’s 500 Composite Stock Price Index is a widely |
| | accepted, unmanaged index of U.S. stock market performance. |
The Fund 5
FUND PERFORMANCE
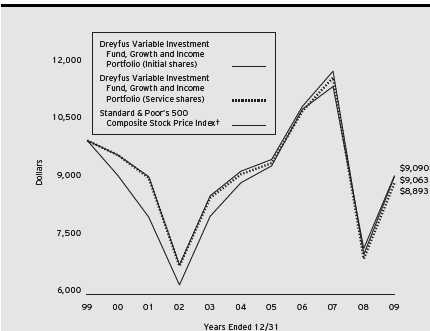
Comparison of change in value of $10,000 investment in Dreyfus Variable Investment Fund, Growth and Income Portfolio Initial shares and Service shares and the Standard & Poor’s 500 Composite Stock Price Index
| | | | | | |
| Average Annual Total Returns as of 12/31/09 | | | | | |
| | 1 | Year | 5 Years | | 10 Years | |
| Initial shares | 28.79 | % | –0.30 | % | –0.98 | % |
| Service shares | 28.44 | % | –0.51 | % | –1.17 | % |
|
| The data for Service shares includes the results of Initial shares for the period prior to December 31, 2000 |
| (inception date of Service shares). Actual Service shares’ average annual total return and hypothetical growth |
| results would have been lower. See notes below. |
| † Source: Lipper Inc. |
| Past performance is not predictive of future performance.The fund’s performance shown in the graph and table does not |
| reflect the deduction of taxes that a shareholder would pay on fund distributions or the redemption of fund shares. |
| The fund’s performance does not reflect the deduction of additional charges and expenses imposed in connection |
| with investing in variable insurance contracts which will reduce returns. |
| The above graph compares a $10,000 investment made in Initial and Service shares of Dreyfus Variable Investment |
| Fund, Growth and Income Portfolio on 12/31/99 to a $10,000 investment made in the Standard & Poor’s 500 |
| Composite Stock Price Index (the “Index”) on that date. |
6
The fund’s Initial shares are not subject to a Rule 12b-1 fee.The fund’s Service shares are subject to a 0.25% annual Rule 12b-1 fee.The performance figures for Service shares reflect the performance of the fund’s Initial shares from their inception date through December 30, 2000, and the performance of the fund’s Service shares from December 31, 2000 (inception date of Service shares) to December 31, 2009 (blended performance figures).The performance figures for each share class reflect certain expense reimbursements, without which the performance of each share class would have been lower. In addition, the blended performance figures have not been adjusted to reflect the higher operating expenses of the Service shares. If these expenses had been reflected, the blended performance figures would have been lower. All dividends and capital gain distributions are reinvested. The fund’s performance shown in the line graph takes into account all applicable fund fees and expenses (after any expense reimbursements).The Index is a widely accepted, unmanaged index of U.S. stock market performance. Unlike a mutual fund, the Index is not subject to charges, fees and other expenses. Investors cannot invest directly in any index. Further information relating to fund performance, including expense reimbursements, if applicable, is contained in the Financial Highlights section of the prospectus and elsewhere in this report.
The Fund 7
UNDERSTANDING YOUR FUND’S EXPENSES (Unaudited)
As a mutual fund investor, you pay ongoing expenses, such as management fees and other expenses. Using the information below, you can estimate how these expenses affect your investment and compare them with the expenses of other funds.You also may pay one-time transaction expenses, including sales charges (loads), redemption fees and expenses associated with variable annuity or insurance contracts, which are not shown in this section and would have resulted in higher total expenses. For more information, see your fund’s prospectus or talk to your financial adviser.
Review your fund’s expenses
The table below shows the expenses you would have paid on a $1,000 investment in Dreyfus Variable Investment Fund, Growth and Income Portfolio from July 1, 2009 to December 31, 2009. It also shows how much a $1,000 investment would be worth at the close of the period, assuming actual returns and expenses.
|
| Expenses and Value of a $1,000 Investment |
| assuming actual returns for the six months ended December 31, 2009 |
| | | | |
| | | Initial Shares | | Service Shares |
| Expenses paid per $1,000† | $ | 4.67 | $ | 6.07 |
| Ending value (after expenses) | $ | 1,231.30 | $ | 1,229.60 |
|
| COMPARING YOUR FUND’S EXPENSES |
| WITH THOSE OF OTHER FUNDS (Unaudited) |
Using the SEC’s method to compare expenses
The Securities and Exchange Commission (SEC) has established guidelines to help investors assess fund expenses. Per these guidelines, the table below shows your fund’s expenses based on a $1,000 investment, assuming a hypothetical 5% annualized return. You can use this information to compare the ongoing expenses (but not transaction expenses or total cost) of investing in the fund with those of other funds.All mutual fund shareholder reports will provide this information to help you make this comparison. Please note that you cannot use this information to estimate your actual ending account balance and expenses paid during the period.
|
| Expenses and Value of a $1,000 Investment |
| assuming a hypothetical 5% annualized return for the six months ended December 31, 2009 |
| | | | |
| | | Initial Shares | | Service Shares |
| Expenses paid per $1,000† | $ | 4.23 | $ | 5.50 |
| Ending value (after expenses) | $ | 1,021.02 | $ | 1,019.76 |
|
| † Expenses are equal to the fund’s annualized expense ratio of .83% for Initial Shares and 1.08% for Service Shares, |
| multiplied by the average account value over the period, multiplied by 184/365 (to reflect the one-half year period). |
8
|
| STATEMENT OF INVESTMENTS |
| December 31, 2009 |

The Fund 9
STATEMENT OF INVESTMENTS (continued)
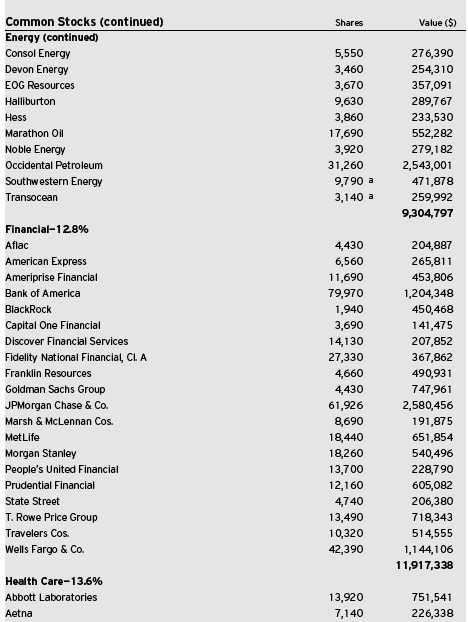
10
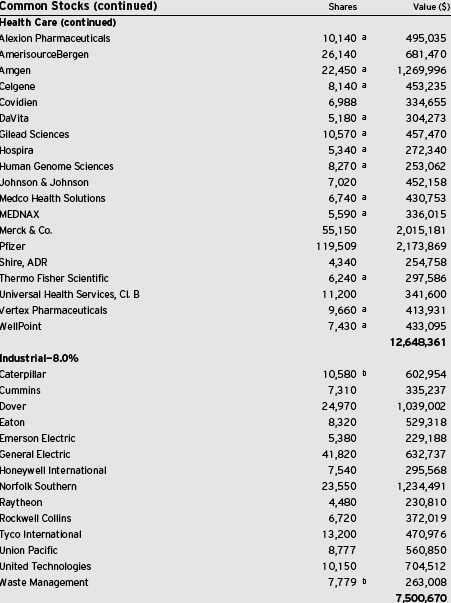
The Fund 11
STATEMENT OF INVESTMENTS (continued)
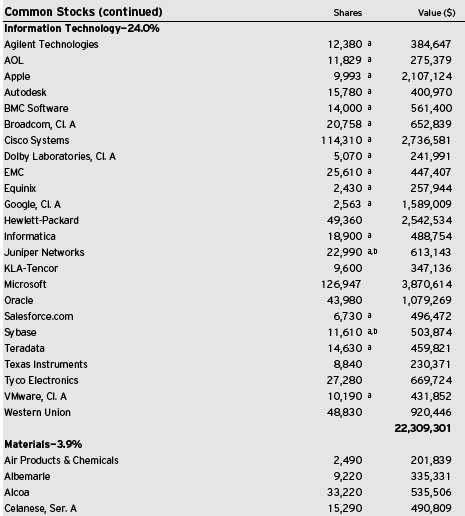
12
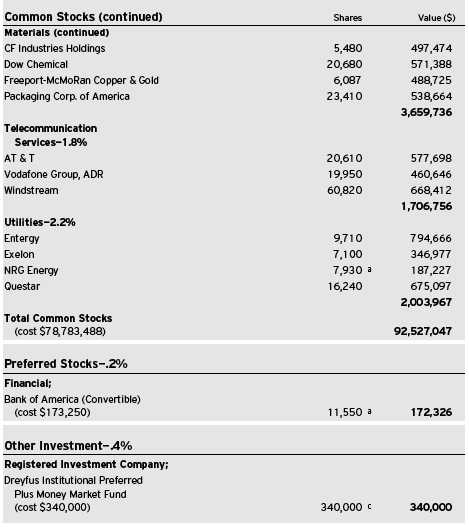
The Fund 13
STATEMENT OF INVESTMENTS (continued)
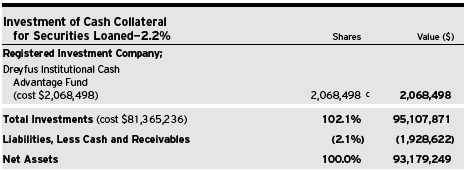
ADR—American Depository Receipts
|
| a Non-income producing security. |
| b Security, or portion thereof, on loan. At December 31, 2009, the total market value of the fimd’s securities on loan is |
| $1,996,290 and the total market value of the collateral held by the fimd is $2,068,498. |
| c Investment in affiliated money market mutual fund. |

|
| † Based on net assets. |
| See notes to financial statements. |
14
|
| STATEMENT OF OPTIONS WRITTEN |
| December 31, 2009 |
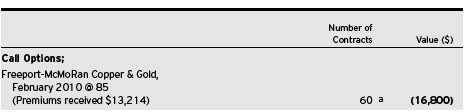
|
| a Non-income producing security. |
| See notes to financial statements. |
The Fund 15
|
| STATEMENT OF ASSETS AND LIABILITIES |
| December 31, 2009 |
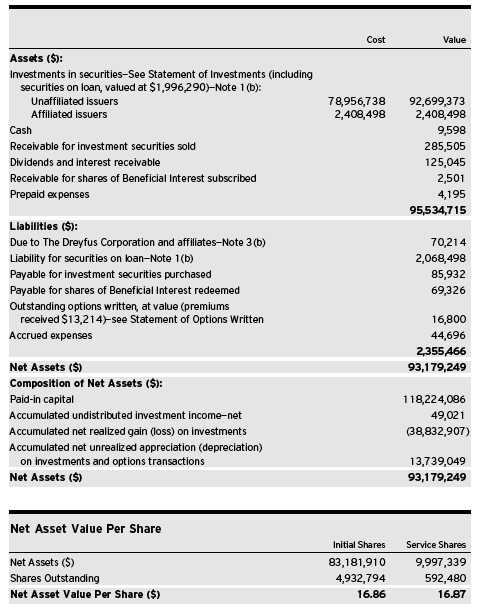
See notes to financial statements.
16
|
| STATEMENT OF OPERATIONS |
| Year Ended December 31, 2009 |
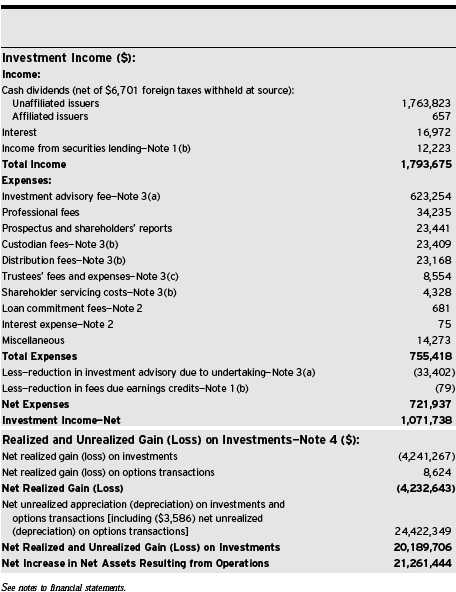
The Fund 17
STATEMENT OF CHANGES IN NET ASSETS
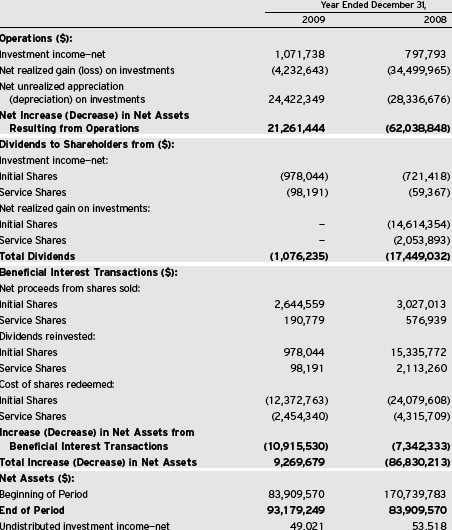
18

The Fund 19
FINANCIAL HIGHLIGHTS
The following tables describe the performance for each share class for the fiscal periods indicated. All information (except portfolio turnover rate) reflects financial results for a single fund share.Total return shows how much your investment in the fund would have increased (or decreased) during each period, assuming you had reinvested all dividends and distributions. The fund’s total returns do not reflect expenses associated with variable annuity or insurance contracts.These figures have been derived from the fund’s financial statements.
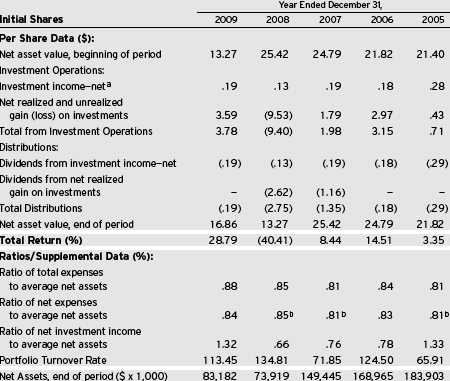
| |
| a | Based on average shares outstanding at each month end. |
| b | Expense waivers and/or reimbursements amounted to less than .01%. |
See notes to financial statements.
20

| |
| a | Based on average shares outstanding at each month end. |
| b | Expense waivers and/or reimbursements amounted to less than .01%. |
See notes to financial statements.
The Fund 21
NOTES TO FINANCIAL STATEMENTS
NOTE 1—Significant Accounting Policies:
Dreyfus Variable Investment Fund (the “Company”) is registered under the Investment Company Act of 1940, as amended (the “Act”), as an open end management investment company, operating as a series company currently offering seven series, including the Growth and Income Portfolio (the “fund”).The fund is only offered to separate accounts established by insurance companies to fund variable annuity contracts and variable life insurance policies. The fund is a non-diversified series. The fund’s investment objective is to provide long-term capital growth, current income and growth of income, consistent with reasonable investment risk.The Dreyfus Corporation (the “Manager” or “Dreyfus”), a wholly-owned subsidiary of The Bank of New York Mellon Corporation (“BNY Mellon”), serves as the fund’s investment adviser.
MBSC Securities Corporation (the “Distributor”), a wholly-owned subsidiary of the Manager, is the distributor of the fund’s shares, which are sold without a sales charge.The fund is authorized to issue an unlimited number of $.001 par value shares of Beneficial Interest in each of the following classes of shares: Initial and Service. Each class of shares has identical rights and privileges, except with respect to the distribution plan, the expenses borne by each class, the allocation of certain transfer agency costs and certain voting rights. Income, expenses (other than expenses attributable to a specific class), and realized and unrealized gains or losses on investments are allocated to each class of shares based on its relative net assets.
The Company accounts separately for the assets, liabilities and operations of each series. Expenses directly attributable to each series are charged to that series’ operations; expenses which are applicable to all series are allocated among them on a pro rata basis.
The Financial Accounting Standards Board (“FASB”) Accounting Standards Codification (“ASC”) has become the exclusive reference of authoritative U.S. generally accepted accounting principles (“GAAP”) recognized by the FASB to be applied by nongovernmental entities.
22
Rules and interpretive releases of the Securities and Exchange Commission (“SEC”) under authority of federal laws are also sources of authoritative GAAP for SEC registrants. The ASC has superseded all existing non-SEC accounting and reporting standards. The fund’s financial statements are prepared in accordance with GAAP, which may require the use of management estimates and assumptions.Actual results could differ from those estimates.
The Company enters into contracts that contain a variety of indemnifications. The fund’s maximum exposure under these arrangements is unknown.The fund does not anticipate recognizing any loss related to these arrangements.
(a) Portfolio valuation: Investments in securities are valued at the last sales price on the securities exchange or national securities market on which such securities are primarily traded. Securities listed on the National Market System for which market quotations are available are valued at the official closing price or, if there is no official closing price that day, at the last sales price. Securities not listed on an exchange or the national securities market, or securities for which there were no transactions, are valued at the average of the most recent bid and asked prices, except for open short positions, where the asked price is used for valuation purposes. Bid price is used when no asked price is available. Registered investment companies that are not traded on an exchange are valued at their net asset value.When market quotations or officia l closing prices are not readily available, or are determined not to reflect accurately fair value, such as when the value of a security has been significantly affected by events after the close of the exchange or market on which the security is principally traded (for example, a foreign exchange or market), but before the fund calculates its net asset value, the fund may value these investments at fair value as determined in accordance with the procedures approved by the Board of Trustees. Fair valuing of securities may be determined with the assistance of a pricing service using calculations based on indices of domestic securities and other appropriate indicators, such as prices of relevant ADRs
The Fund 23
NOTES TO FINANCIAL STATEMENTS (continued)
and futures contracts. For other securities that are fair valued by the Board of Trustees, certain factors may be considered such as: fundamental analytical data, the nature and duration of restrictions on disposition, an evaluation of the forces that influence the market in which the securities are purchased and sold, and public trading in similar securities of the issuer or comparable issuers. Options traded over-the-counter are valued at the mean between the bid and asked price. Financial futures are valued at the last sales price.
The fair value of a financial instrument is the amount that would be received to sell an asset or paid to transfer a liability in an orderly transaction between market participants at the measurement date (i.e. the exit price). GAAP establishes a fair value hierarchy that prioritizes the inputs of valuation techniques used to measure fair value.This hierarchy gives the highest priority to unadjusted quoted prices in active markets for identical assets or liabilities (Level 1 measurements) and the lowest priority to unobservable inputs (Level 3 measurements).
Additionally, GAAP provides guidance on determining whether the volume and activity in a market has decreased significantly and whether such a decrease in activity results in transactions that are not orderly. GAAP requires enhanced disclosures around valuation inputs and techniques used during annual and interim periods.
Various inputs are used in determining the value of the fund’s investments relating to fair value measurements.These inputs are summarized in the three broad levels listed below:
Level 1—unadjusted quoted prices in active markets for
identical investments.
Level 2—other significant observable inputs (including quoted
prices for similar investments, interest rates, prepayment speeds,
credit risk, etc.).
Level 3—significant unobservable inputs (including the fund’s own
assumptions in determining the fair value of investments).
24
The inputs or methodology used for valuing securities are not necessarily an indication of the risk associated with investing in those securities.
The following is a summary of the inputs used as of December 31, 2009 in valuing the fund’s investments:
| | | | | | |
| | | | Level 2—Other | Level 3— | | |
| | Level 1— | | Significant | Significant | | |
| | Unadjusted | | Observable | Unobservable | | |
| | Quoted Prices | | Inputs | Inputs | Total | |
| Assets ($) | | | | | | |
| Investments in Securities: | | | | | |
| Equity Securities— | | | | | | |
| Domestic† | 91,524,353 | | — | — | 91,524,353 | |
| Equity Securities— | | | | | | |
| Foreign† | 1,175,020 | | — | — | 1,175,020 | |
| Mutual Funds | 2,408,498 | | — | — | 2,408,498 | |
| Other Financial | | | | | | |
| Instruments†† | — | | — | — | — | |
| Liabilities ($) | | | | | | |
| Other Financial | | | | | | |
| Instruments†† | (16,800 | ) | — | — | (16,800 | ) |
| |
| † | See Statement of Investments for industry classification. |
| †† | Other financial instruments include derivative instruments, such as futures, forward foreign currency |
| | exchange contracts, swap contracts and options contracts. Amounts shown represent unrealized |
| | appreciation (depreciation), or in the case of options, market value at period end. |
(b) Securities transactions and investment income: Securities transactions are recorded on a trade date basis. Realized gains and losses from securities transactions are recorded on the identified cost basis. Dividend income is recognized on the ex-dividend date and interest income, including, where applicable, accretion of discount and amortization of premium on investments, is recognized on the accrual basis.
The fund has arrangements with the custodian and cash management bank whereby the fund may receive earnings credits when positive cash balances are maintained, which are used to offset custody and cash
The Fund 25
NOTES TO FINANCIAL STATEMENTS (continued)
management fees. For financial reporting purposes, the fund includes net earnings credits as an expense offset in the Statement of Operations.
Pursuant to a securities lending agreement with The Bank of New York Mellon, a subsidiary of BNY Mellon and an affiliate of Dreyfus, the fund may lend securities to qualified institutions. It is the fund’s policy that, at origination, all loans are secured by collateral of at least 102% of the value of U.S. securities loaned and 105% of the value of foreign securities loaned. Collateral equivalent to at least 100% of the market value of securities on loan is maintained at all times. Collateral is either in the form of cash, which can be invested in certain money market mutual funds managed by the Manager, U.S. Government and Agency securities or letters of credit.The fund is entitled to receive all income on securities loaned, in addition to income earned as a result of the lending transaction. Although each security loaned is fully collateralized, the fund bears the risk of delay in recovery of, or loss of rights in, the securities loaned should a borrower fail to return the securities in a timely manner. During the period ended December 31, 2009, The Bank of New York Mellon earned $5,238 from lending portfolio securities, pursuant to the securities lending agreement.
(c) Affiliated issuers: Investments in other investment companies advised by the Manager are defined as “affiliated” in the Act.
(d) Dividends to shareholders: Dividends are recorded on the ex-dividend date. The fund declares and pays dividends from investment income-net on a quarterly basis. Dividends from net realized capital gains, if any, are normally declared and paid annually, but the fund may make distributions on a more frequent basis to comply with the distribution requirements of the Internal Revenue Code of 1986, as amended (the “Code”).To the extent that net realized capital gains can be offset by capital loss carryovers, it is the policy of the fund not to distribute such gains. Income and capital gain distributions are determined in accordance with income tax regulations, which may differ from GAAP.
26
(e) Federal income taxes: It is the policy of the fund to continue to qualify as a regulated investment company, if such qualification is in the best interests of its shareholders, by complying with the applicable provisions of the Code, and to make distributions of taxable income sufficient to relieve it from substantially all federal income and excise taxes.
As of and during the period ended December 31, 2009, the fund did not have any liabilities for any uncertain tax positions.The fund recognizes interest and penalties, if any, related to uncertain tax positions as income tax expense in the Statement of Operations. During the period, the fund did not incur any interest or penalties.
Each of the tax years in the four-year period ended December 31, 2009 remains subject to examination by the Internal Revenue Service and state taxing authorities.
At December 31, 2009, the components of accumulated earnings on a tax basis were as follows: undistributed ordinary income $49,021, accumulated capital losses $37,490,176 and unrealized appreciation $12,396,318.
The accumulated capital loss carryover is available for federal income tax purposes to be applied against future net securities profits, if any, realized subsequent to December 31, 2009. If not applied, $27,760,538 of the carryover expires in fiscal 2016 and $9,729,638 expires in fiscal 2017.
The tax character of distributions paid to shareholders during the fiscal periods ended December 31, 2009 and December 31, 2008 were as follows: ordinary income $1,076,235 and $9,798,190 and long-term capital gains $0 and $7,650,842, respectively.
NOTE 2—Bank Lines of Credit:
The fund participates with other Dreyfus-managed funds in a $225 million unsecured credit facility led by Citibank, N.A. and a $300 million unsecured credit facility provided by The Bank of New York Mellon,
The Fund 27
NOTES TO FINANCIAL STATEMENTS (continued)
(each, a “Facility”), each to be utilized primarily for temporary or emergency purposes, including the financing of redemptions. In connection therewith, the fund has agreed to pay its pro rata portion of commitment fees for each Facility. Interest is charged to the fund based on rates determined pursuant to the terms of the respective Facility at the time of borrowing.
The average amount of borrowings outstanding under the Facilities during the period ended December 31, 2009 was approximately $4,800 with a related weighted average annualized interest rate of 1.57%.
NOTE 3—Investment Advisory Fee and Other Transactions With Affiliates:
(a) Pursuant to an investment advisory agreement with the Manager, the investment advisory fee is computed at the annual rate of .75% of the value of the fund’s average daily net assets and is payable monthly.
The Manager had agreed to waive receipt of a portion of the fund’s management fee, in the amount of .08% of the value of the fund’s average daily net assets until October 1, 2009.The reduction in investment advisory fee, pursuant to the undertaking, amounted to $33,402 during the period ended December 31, 2009.
(b) Under the Distribution Plan (the “Plan”) adopted pursuant to Rule 12b-1 under the Act, Service shares pay the Distributor for distributing their shares, for servicing and/or maintaining Service shares’ shareholder accounts and for advertising and marketing for Service shares.The Plan provides for payments to be made at an annual rate of .25% of the value of the Service shares’ average daily net assets.The Distributor may make payments to Participating Insurance Companies and to brokers and dealers acting as principal underwriter for their variable insurance prod-ucts.The fees payable under the Plan are payable without regard to actual expenses incurred. During the period ended December 31, 2009, Service shares were charged $23,168 pursuant to the Plan.
The fund compensates Dreyfus Transfer, Inc., a wholly-owned subsidiary of Dreyfus, under a transfer agency agreement for providing per-
28
sonnel and facilities to perform transfer agency services for the fund. During the period ended December 31, 2009, the fund was charged $437 pursuant to the transfer agency agreement, which is included in Shareholder servicing costs in the Statement of Operations.
The fund compensates The Bank of New York Mellon under a cash management agreement for performing cash management services related to fund subscriptions and redemptions. During the period ended December 31, 2009, the fund was charged $79 pursuant to the cash management agreement, which is included in Shareholder servicing costs in the Statement of Operations. These fees were offset by earnings credits pursuant to the cash management agreement.
The fund also compensates The Bank of New York Mellon under a custody agreement for providing custodial services for the fund. During the period ended December 31, 2009, the fund was charged $23,409 pursuant to the custody agreement.
During the period ended December 31, 2009, the fund was charged $6,681 for services performed by the Chief Compliance Officer.
The components of “Due to The Dreyfus Corporation and affiliates” in the Statement of Assets and Liabilities consist of: investment advisory fees $59,231, Rule 12b-1 distribution plan fees $2,121, custodian fees $3,776, chief compliance officer fees $5,011 and transfer agency per account fees $75.
(c) Each Board member also serves as a Board member of other funds within the Dreyfus complex. Annual retainer fees and attendance fees are allocated to each fund based on net assets.
NOTE 4—Securities Transactions:
The aggregate amount of purchases and sales of investment securities, excluding short-term securities and options transactions, during the period ended December 31, 2009, amounted to $93,266,259 and $103,137,561, respectively.
The Fund 29
NOTES TO FINANCIAL STATEMENTS (continued)
The fund adopted the provisions of ASC Topic 815 “Derivatives and Hedging” which requires qualitative disclosures about objectives and strategies for using derivatives, quantitative disclosures about fair value amounts of gains and losses on derivative instruments and disclosures about credit-risk-related contingent features in derivative agreements. The disclosure requirements distinguish between derivatives, which are accounted for as “hedges” and those that do not qualify for hedge accounting. Because investment companies value their derivatives at fair value and recognize changes in fair value through the Statement of Operations, they do not qualify for such accounting. Accordingly, even though a fund’s investments in derivatives may represent economic hedges, they are considered to be non-hedge transactions for purposes of this disclosure.
Options: A call option gives the purchaser of the option the right (but not the obligation) to buy, and obligates the writer to sell, the underlying security or securities at the exercise price at any time during the option period, or at a specified date. Conversely, a put option gives the purchaser of the option the right (but not the obligation) to sell, and obligates the writer to buy the underlying security or securities at the exercise price at any time during the option period, or at a specified date.The fund may purchase and write (sell) put and call options primarily to hedge against changes in security prices, or securities that the fund intends to purchase, or against fluctuations in value caused by changes in prevailing market interest rates or other market conditions.
As a writer of call options, the fund receives a premium at the outset and then bears the market risk of unfavorable changes in the price of the financial instrument underlying the option. Generally, the fund would realize a gain, to the extent of the premium, if the price of the underlying financial instrument decreases between the date the option is written and the date on which the option is terminated. Generally, the fund would incur a loss, if the price of the financial instrument increases between those dates.
30
As a writer of put options, the fund receives a premium at the outset and then bears the market risk of unfavorable changes in the price of the financial instrument underlying the option. Generally, the fund would realize a gain, to the extent of the premium, if the price of the underlying financial instrument increases between the date the option is written and the date on which the option is terminated. Generally, the fund would incur a loss, if the price of the financial instrument decreases between those dates. As a writer of an option, the fund may have no control over whether the underlying securities may be sold (call) or purchased (put) and as a result bears the market risk of an unfavorable change in the price of the security underlying the written option. One risk of holding a put or a call option is that if the option is not sold or exercised prior to its expiration, it becomes worthless. However, this risk is limite d to the premium paid by the fund. Upon the expiration or closing of the option transaction, a gain or loss is reported in the Statement of Operations.
The following summarizes the fund’s call/put options written for the period ended December 31, 2009:
| | | | |
| | | | Options Terminated |
| | Number of | Premiums | | Net Realized |
| Options Written: | Contracts | Received ($) | Cost ($) | Gain ($) |
| Contracts outstanding | | | | |
| December 31, 2008 | — | — | | |
| Contracts written | 106 | 22,341 | | |
| Contracts terminated: | | | | |
| Closed | 46 | 9,127 | 503 | 8,624 |
| Contracts Outstanding | | | | |
| December 31, 2009 | 60 | 13,214 | | |
At December 31, 2009, the cost of investments for federal income tax purposes was $82,707,967; accordingly, accumulated net unrealized appreciation on investments was $12,399,904, consisting of $14,781,011 gross unrealized appreciation and $2,381,107 gross unrealized depreciation.
The Fund 31
NOTES TO FINANCIAL STATEMENTS (continued)
NOTE 5—Subsequent Events Evaluation:
Dreyfus has evaluated the need for disclosures and/or adjustments resulting from subsequent events through February 10, 2010, the date the financial statements were issued. This evaluation did not result in any subsequent events that necessitated disclosures and/or adjustments.
32
|
| REPORT OF INDEPENDENT REGISTERED |
| PUBLIC ACCOUNTING FIRM |
|
| Shareholders and Board of Trustees |
| Dreyfus Variable Investment Fund, Growth and Income Portfolio |
We have audited the accompanying statement of assets and liabilities, including the statements of investments and options written, of Dreyfus Variable Investment Fund, Growth and Income Portfolio (one of the series comprising Dreyfus Variable Investment Fund) as of December 31, 2009, and the related statement of operations for the year then ended, the statement of changes in net assets for each of the two years in the period then ended, and financial highlights for each of the years indicated therein.These financial statements and financial highlights are the responsibility of the Fund’s management. Our responsibility is to express an opinion on these financial statements and financial highlights based on our audits.
We conducted our audits in accordance with the standards of the Public Company Accounting Oversight Board (United States).Those standards require that we plan and perform the audit to obtain reasonable assurance about whether the financial statements and financial highlights are free of material misstatement.We were not engaged to perform an audit of the Fund’s internal control over financial reporting. Our audits included consideration of internal control over financial reporting as a basis for designing audit procedures that are appropriate in the circumstances, but not for the purpose of expressing an opinion on the effectiveness of the Fund’s internal control over financial reporting. Accordingly, we express no such opinion.An audit also includes examining, on a test basis, evidence supporting the amounts and disclosures in the financial statements and financial highlights, assessing the accounting principles used and significant estimates made by management, and evaluating the overall financial statement presentation. Our procedures included confirmation of securities owned as of December 31, 2009 by correspondence with the custodian and others.We believe that our audits provide a reasonable basis for our opinion.
In our opinion, the financial statements and financial highlights referred to above present fairly, in all material respects, the financial position of Dreyfus Variable Investment Fund, Growth and Income Portfolio at December 31, 2009, the results of its operations for the year then ended, the changes in its net assets for each of the two years in the period then ended, and the financial highlights for each of the indicated years, in conformity with U.S. generally accepted accounting principles.

The Fund 33
IMPORTANT TAX INFORMATION (Unaudited)
For federal tax purposes, the fund hereby designates 100% of the ordinary dividends paid during the fiscal year ended December 31, 2009 as qualifying for the corporate dividends received deduction. Shareholders will receive notification in early 2010 of the percentage applicable to the preparation of their 2009 income tax returns.
34
BOARD MEMBERS INFORMATION (Unaudited)
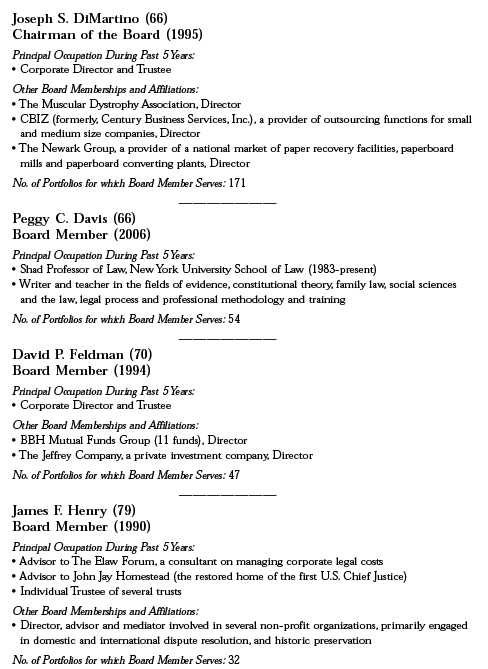
The Fund 35
BOARD MEMBERS INFORMATION (Unaudited) (continued)

Once elected all Board Members serve for an indefinite term, but achieve Emeritus status upon reaching age 80.The address of the Board Members and Officers is in c/o The Dreyfus Corporation, 200 Park Avenue, NewYork, NewYork 10166. Additional information about the Board Members is available in the fund’s Statement of Additional Information which can be obtained from Dreyfus free of charge by calling this toll free number: 1-800-554-4611.
John M. Fraser, Jr., Emeritus Board Member
Rosalind G. Jacobs, Emeritus Board Member
Dr. Paul A. Marks, Emeritus Board Member
Gloria Messinger, Emeritus Board Member
36
OFFICERS OF THE FUND (Unaudited)
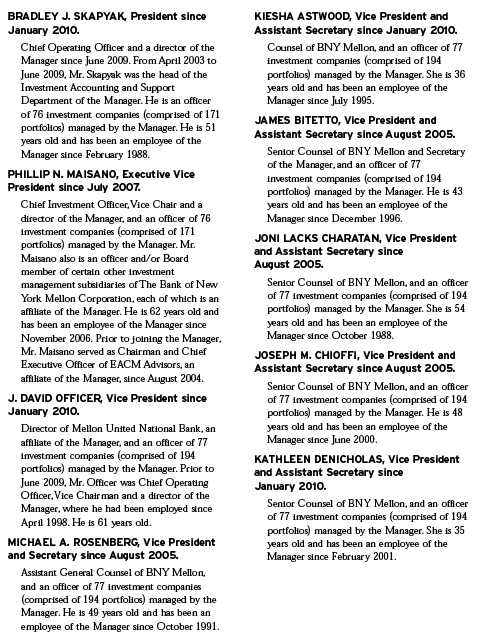
The Fund 37
OFFICERS OF THE FUND (Unaudited) (continued)
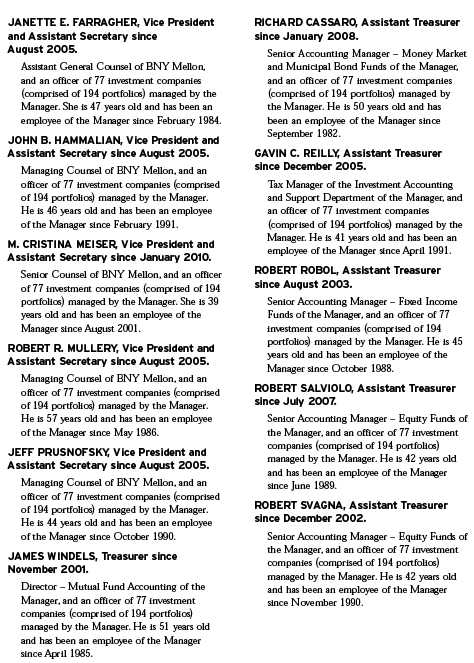
38
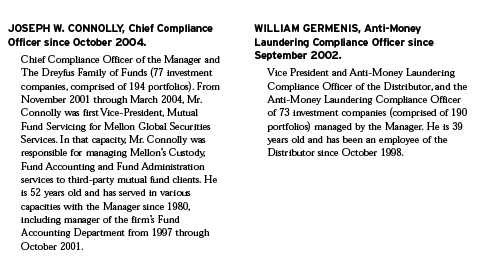
The Fund 39
NOTES
For More Information

|
| Telephone 1-800-554-4611 or 1-516-338-3300 |
| Mail The Dreyfus Family of Funds, 144 Glenn Curtiss Boulevard, Uniondale, NY 11556-0144 |
| Attn: Investments Division |
The fund files its complete schedule of portfolio holdings with the Securities and Exchange Commission (“SEC”) for the first and third quarters of each fiscal year on Form N-Q. The fund’s Forms N-Q are available on the SEC’s website at http://www.sec.gov and may be reviewed and copied at the SEC’s Public Reference Room in Washington, DC. Information on the operation of the Public Reference Room may be obtained by calling 1-800-SEC-0330.
A description of the policies and procedures that the fund uses to determine how to vote proxies relating to portfolio securities, and information regarding how the fund voted these proxies for the most recent 12-month period ended June 30 is available at http://www.dreyfus.com and on the SEC’s website at http://www.sec.gov. The description of the policies and procedures is also available without charge, upon request, by calling 1-800-645-6561.

|
| Dreyfus Variable |
| Investment Fund, |
| International |
| Equity Portfolio |
ANNUAL REPORT December 31, 2009

The views expressed in this report reflect those of the portfolio manager only through the end of the period covered and do not necessarily represent the views of Dreyfus or any other person in the Dreyfus organization. Any such views are subject to change at any time based upon market or other conditions and Dreyfus disclaims any responsibility to update such views.These views may not be relied on as investment advice and, because investment decisions for a Dreyfus fund are based on numerous factors, may not be relied on as an indication of trading intent on behalf of any Dreyfus fund.

| | Contents |
| | THE FUND |
| 2 | A Letter from the Chairman and CEO |
| 3 | Discussion of Fund Performance |
| 6 | Fund Performance |
| 8 | Understanding Your Fund’s Expenses |
| 8 | Comparing Your Fund’s Expenses With Those of Other Funds |
| 9 | Statement of Investments |
| 13 | Statement of Assets and Liabilities |
| 14 | Statement of Operations |
| 15 | Statement of Changes in Net Assets |
| 17 | Financial Highlights |
| 19 | Notes to Financial Statements |
| 30 | Report of Independent Registered Public Accounting Firm |
| 31 | Important Tax Information |
| 32 | Board Members Information |
| 34 | Officers of the Fund |
| | FOR MORE INFORMATION |
| | Back Cover |
Dreyfus Variable Investment Fund,
International Equity Portfolio
The Fund

A LETTER FROM THE CHAIRMAN AND CEO
Dear Shareholder:
We are pleased to present this annual report for International Equity Portfolio, a series of Dreyfus Variable Investment Fund, covering the 12-month period from January 1, 2009, through December 31, 2009.
Global stock markets ended 2009 with healthy annual gains, but market indices across most regions, capitalization ranges and investment styles remained well below the peaks reached in the fall of 2007.The equity markets’ advance was driven by improving investor sentiment as the global economy staged a gradual, but sustained, recovery from the recession and banking crisis that had depressed stock prices at the beginning of the year. Growth was particularly robust in some emerging markets, supporting worldwide manufacturing activity to satisfy industrial demand.In many regions,slumping housing markets also showed signs of renewed life as home sales and prices rebounded modestly.However,eco-nomic headwinds remain, including high unemployment rates and the prospect of anemic consumer spending in Europe and the United States.
As 2010 begins, our Chief Economist, securities analysts and portfolio managers have continued to find opportunities and survey potential challenges throughout the world equity markets.While no one can predict the future, we believe that the 2010 investment environment will likely require a broader range of investment considerations relative to last year. As always, your financial adviser can help you determine the mix of investments that may be best suited to helping you achieve your goals at a level of risk that is comfortable for you.
For information about how the fund performed during the reporting period, as well as market perspectives, we have provided a Discussion of Fund Performance.
Thank you for your continued confidence and support.
Jonathan R. Baum
Chairman and Chief Executive Officer
The Dreyfus Corporation
January 15, 2010
2

DISCUSSION OF FUND PERFORMANCE
For the period of January 1, 2009, through December 31, 2009, as provided by Jon Bell, Portfolio Manager, Newton Capital Management Limited, Sub-Investment Adviser
Fund and Market Performance Overview
For the 12-month period ended December 31, 2009, International Equity Portfolio, a series of DreyfusVariable Investment Fund, produced a total return of 25.26% for its Initial shares, and its Service shares produced a total return of 24.89%.1This compares with a 31.78% return for the fund’s benchmark, the Morgan Stanley Capital International Europe, Australasia, Far East Index (“MSCI EAFE Index”), for the same period.2
After declining early in the year due to a global recession and banking crisis, international stocks rallied over much of 2009 as credit markets thawed and investors looked forward to an economic recovery. Although the fund participated to a significant degree in the markets’ gains, it produced lower returns than its benchmark, primarily due to a relatively defensive investment posture at a time when lower-quality stocks led the rebound.
The Fund’s Investment Approach
The fund seeks capital growth by investing primarily in stocks of foreign companies.
The process of identifying investment ideas begins by identifying a core list of investment themes.These (typically global) themes are based primarily on observable economic, industrial or social trends that Newton believes will positively affect certain markets, industries or companies, and these ideas help us to identify areas of investment opportunity and risk. Such themes currently include all change, which asserts that the bursting of the credit bubble heralds a number of structural changes in economies and financial markets (and provides the rationale for the portfolio’s underweight exposure to the financial sector). Elsewhere, the networked world theme identifies the opportunities inherent in the growth of information technology networks around the world.
When choosing stocks, we consider trends in economic variables, such as gross domestic product, inflation and interest rates; investment themes, such as new technologies and globalization; the relative values
The Fund 3
DISCUSSION OF FUND PERFORMANCE (continued)
of equities, bonds and cash; company fundamentals; and long-term trends in currency movements.Within markets and sectors determined to be relatively attractive, we seek what we believe are attractively priced companies that possess a sustainable competitive advantage in their market or sector. Securities are generally sold when themes or strategies change, when we determine that the company’s prospects have changed, or when a stock becomes fully valued by the market.
International Equities Rebounded in a Sustained Rally
During the first quarter of 2009, investor sentiment remained depressed by a deep global recession characterized by rising unemployment rates and plummeting housing prices.At the same time, the world was in the grip of a financial crisis that nearly led to the collapse of the international banking system. These factors drove stock prices to multi-year lows. However, investor sentiment began to improve in March as it became clearer that massive government interventions were gaining traction. Indeed, after more than a year of economic contraction, much of the world appeared to return to growth during the third quarter of 2009, helping to support sustained stock market rallies through year-end.The rebound was led by stocks and market sectors that had been severely beaten down during the downturn.
Some Stock Selections Dampened Fund Performance
Although our relatively defensive security selection strategy helped cushion the effects of the downturn, it prevented the fund from participating more fully in the subsequent rally. Lagging results were particularly pronounced in the materials sector, where our emphasis on producers of industrial metals over gold companies hindered the fund’s performance relative to its benchmark. We later increased the fund’s exposure to the rising price of gold through an investment in U.K.-based Anglo American, but it was not enough to offset earlier weakness. Overweighted exposure to the traditionally defensive telecommunications services sector detracted from relative performance, as Japan’s KDDI, the United Kingdom’s Vodafone Group and China Mobile suffered when investors turned to mo re ‘aggressive’ investments. Relatively defensive positioning in the consumer staples and health care sectors also caused the fund to trail its benchmark.
As the year progressed, we shifted some of the fund’s assets to the Japanese market, where we expect a revival of domestic consumption to
4
drive stock prices higher. While the country’s overall results in 2009 remained relatively disappointing, we began to see evidence of a more robust rebound in holdings such as automaker Nissan Motor Company, which advanced after restructuring and redirecting its development efforts toward electric vehicles.The fund also fared well in the emerging markets, where massive government stimulus programs helped boost economic activity.
Finding Opportunities in a Sluggish Recovery
Historically, recessions driven by balance sheet deleveraging have been followed by relatively weak recoveries.Therefore, we have maintained a defensive posture in Europe and the United Kingdom, and we have reduced the fund’s exposure to the weakening U.S. dollar.We also have focused more intently on companies that we believe are poised to benefit from greater budget-consciousness and deleveraging among consumers, including low-cost retailers such as Tesco in the United Kingdom. In our judgment, these are prudent strategies in a still-fragile global economic environment.
January 15, 2010

The Fund 5
FUND PERFORMANCE
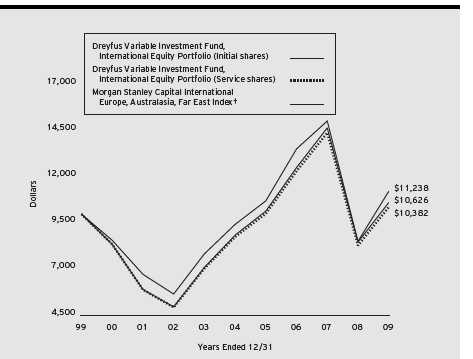
Comparison of change in value of $10,000 investment in Dreyfus Variable Investment Fund, International Equity Portfolio Initial shares and Service shares and the Morgan Stanley Capital International Europe, Australasia, Far East Index
| | | | | | |
| Average Annual Total Returns as of 12/31/09 | | | | | | |
| | 1 Year | 5 Years | 10 Years |
| Initial shares | 25.26% | 3.70% | 0.61% |
| Service shares | 24.89% | 3.45% | 0.38% |
|
| The data for Service shares includes the results of Initial shares for the period prior to December 31, 2000 |
| (inception date of Service shares). Actual Service shares’ average annual total return and hypothetical growth |
| results would have been lower. See notes below. |
| † Source: Lipper Inc. |
| Past performance is not predictive of future performance.The fund’s performance shown in the graph and table does not |
| reflect the deduction of taxes that a shareholder would pay on fund distributions or the redemption of fund shares. |
| The fund’s performance does not reflect the deduction of additional charges and expenses imposed in connection |
| with investing in variable insurance contracts which will reduce returns. |
| The above graph compares a $10,000 investment made in Initial and Service shares of Dreyfus Variable Investment |
| Fund, International Equity Portfolio on 12/31/99 to a $10,000 investment made in the Morgan Stanley Capital |
| International Europe, Australasia, Far East Index (the “Index”) on that date. |
6
The fund’s Initial shares are not subject to a Rule 12b-1 fee.The fund’s Service shares are subject to a 0.25% annual
Rule 12b-1 fee.The performance figures for Service shares reflect the performance of the fund’s Initial shares from their
inception date through December 30, 2000, and the performance of the fund’s Service shares from December 31, 2000
(inception date of Service shares) to December 31, 2009 (blended performance figures).The blended performance figures
have not been adjusted to reflect the higher operating expenses of the Service shares. If these expenses had been reflected, the
blended performance figures would have been lower.All dividends and capital gain distributions are reinvested.
The fund’s performance shown in the line graph takes into account all applicable fund fees and expenses.The Index is
an unmanaged index composed of a sample of companies representative of the market structure of European and Pacific
Basin countries and includes net dividends reinvested. Unlike a mutual fund, the Index is not subject to charges, fees
and other expenses. Investors cannot invest directly in any index. Further information relating to fund performance,
including expense reimbursements, if applicable, is contained in the Financial Highlights section of the prospectus and
elsewhere in this report.
The Fund 7
UNDERSTANDING YOUR FUND’S EXPENSES (Unaudited)
As a mutual fund investor, you pay ongoing expenses, such as management fees and other expenses. Using the information below, you can estimate how these expenses affect your investment and compare them with the expenses of other funds.You also may pay one-time transaction expenses, including sales charges (loads), redemption fees and expenses associated with variable annuity or insurance contracts, which are not shown in this section and would have resulted in higher total expenses. For more information, see your fund’s prospectus or talk to your financial adviser.
Review your fund’s expenses
The table below shows the expenses you would have paid on a $1,000 investment in Dreyfus Variable Investment Fund, International Equity Portfolio from July 1, 2009 to December 31, 2009. It also shows how much a $1,000 investment would be worth at the close of the period, assuming actual returns and expenses.
|
| Expenses and Value of a $1,000 Investment |
| assuming actual returns for the six months ended December 31, 2009 |
| | | | |
| | | Initial Shares | | Service Shares |
| Expenses paid per $1,000† | $ | 5.83 | $ | 7.20 |
| Ending value (after expenses) | $ | 1,181.20 | $ | 1,179.60 |
COMPARING YOUR FUND’S EXPENSES
WITH THOSE OF OTHER FUNDS (Unaudited)
Using the SEC’s method to compare expenses
The Securities and Exchange Commission (SEC) has established guidelines to help investors assess fund expenses. Per these guidelines, the table below shows your fund’s expenses based on a $1,000 investment, assuming a hypothetical 5% annualized return. You can use this information to compare the ongoing expenses (but not transaction expenses or total cost) of investing in the fund with those of other funds.All mutual fund shareholder reports will provide this information to help you make this comparison. Please note that you cannot use this information to estimate your actual ending account balance and expenses paid during the period.
|
| Expenses and Value of a $1,000 Investment |
| assuming a hypothetical 5% annualized return for the six months ended December 31, 2009 |
| | | | |
| | | Initial Shares | | Service Shares |
| Expenses paid per $1,000† | $ | 5.40 | $ | 6.67 |
| Ending value (after expenses) | $ | 1,019.86 | $ | 1,018.60 |
|
| † Expenses are equal to the fund’s annualized expense ratio of 1.06% for Initial Shares and 1.31% for Service Shares, |
| multiplied by the average account value over the period, multiplied by 184/365 (to reflect the one-half year period). |
8
|
| STATEMENT OF INVESTMENTS |
| December 31, 2009 |
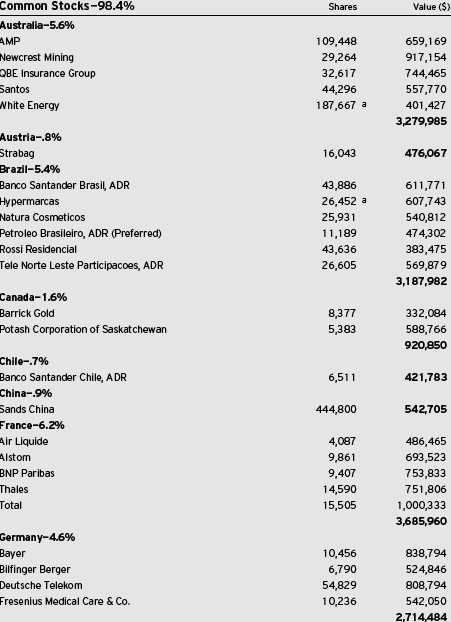
The Fund 9
STATEMENT OF INVESTMENTS (continued)

10

The Fund 11
STATEMENT OF INVESTMENTS (continued)
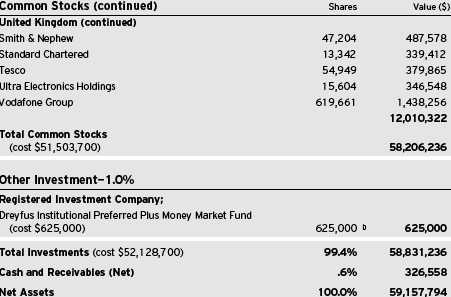
| |
| ADR—American Depository Receipts |
| SDR—Swedish Depository Receipts |
| a | Non-income producing security. |
| b | Investment in affiliated money market mutual fund. |
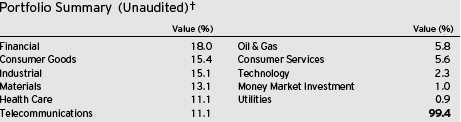
|
| † Based on net assets. |
| See notes to financial statements. |
12
|
| STATEMENT OF ASSETS AND LIABILITIES |
| December 31, 2009 |
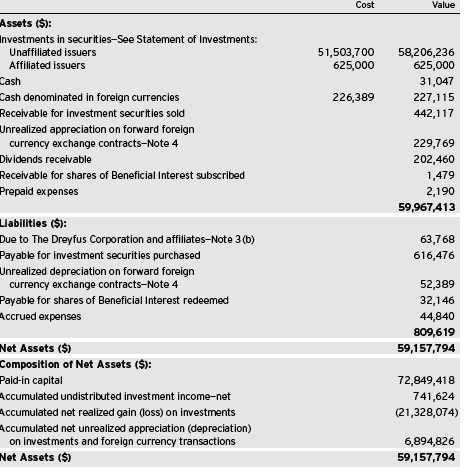
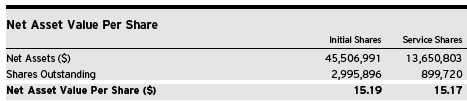
See notes to financial statements.
The Fund 13
|
| STATEMENT OF OPERATIONS |
| Year Ended December 31, 2009 |
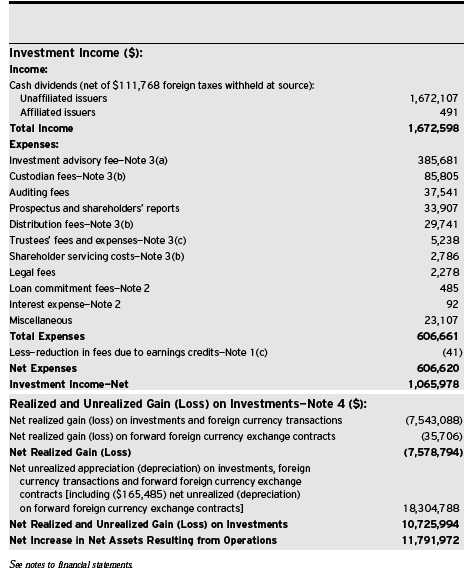
14
STATEMENT OF CHANGES IN NET ASSETS
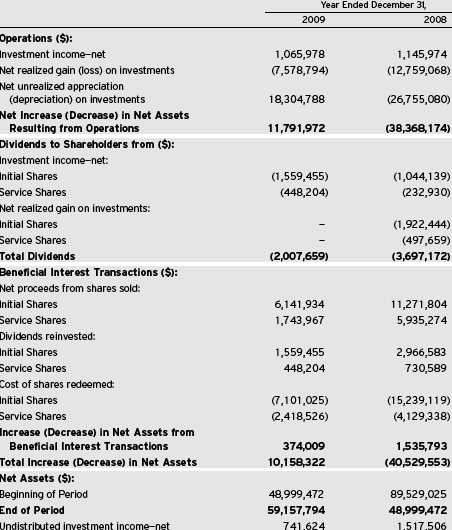
The Fund 15
STATEMENT OF CHANGES IN NET ASSETS (continued)
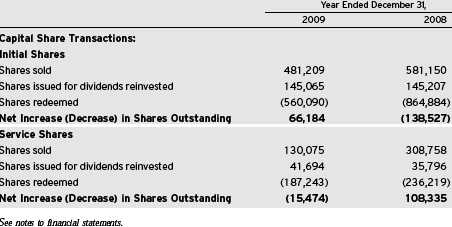
16
FINANCIAL HIGHLIGHTS
The following tables describe the performance for each share class for the fiscal periods indicated.All information (except portfolio turnover rate) reflects financial results for a single fund share.Total return shows how much your investment in the fund would have increased (or decreased) during each period, assuming you had reinvested all dividends and distributions. The fund’s total returns do not reflect expenses associated with variable annuity or insurance contracts.These figures have been derived from the fund’s financial statements.
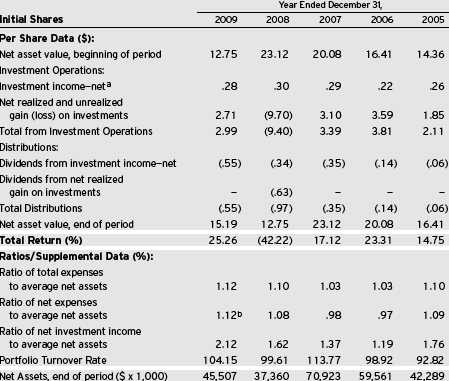
| |
| a | Based on average shares outstanding at each month end. |
| b | Expense waivers and/or reimbursements amounted to less than .01%. |
See notes to financial statements.
The Fund 17
FINANCIAL HIGHLIGHTS (continued)

| |
| a | Based on average shares outstanding at each month end. |
| b | Expense waivers and/or reimbursements amounted to less than .01%. |
See notes to financial statements.
18
NOTES TO FINANCIAL STATEMENTS
NOTE 1—Significant Accounting Policies:
DreyfusVariable Investment Fund (the “Company”) is registered under the Investment Company Act of 1940, as amended (the “Act”), as an open-end management investment company, operating as a series company currently offering seven series, including the International Equity Portfolio (the “fund”). The fund is only offered to separate accounts established by insurance companies to fund variable annuity contracts and variable life insurance policies.The fund is a non-diversified series. The fund’s investment objective is to maximize capital growth. The Dreyfus Corporation (the “Manager” or “Dreyfus”), a wholly-owned subsidiary of The Bank of New York Mellon Corporation (“BNY Mellon”), serves as the fund’s investment adviser. Newton Capital Management Limited (“Newton”) serves as the fund’s sub-investment adviser. Newton is also a wholly-owned subsid iary of BNY Mellon and an affiliate of Dreyfus.
MBSC Securities Corporation (the “Distributor”), a wholly-owned subsidiary of Dreyfus, is the distributor of the fund’s shares, which are sold without a sales charge.The fund is authorized to issue an unlimited number of $.001 par value shares of Beneficial Interest in each of the following classes of shares: Initial and Service. Each class of shares has identical rights and privileges, except with respect to the distribution plan and the expenses borne by each class, the allocation of certain transfer agency costs and certain voting rights. Income, expenses (other than expenses attributable to a specific class), and realized and unrealized gains or losses on investments are allocated to each class of shares based on its relative net assets.
The Company accounts separately for the assets, liabilities and operations of each series. Expenses directly attributable to each series are charged to that series’ operations; expenses which are applicable to all series are allocated among them on a pro rata basis.
The Financial Accounting Standards Board (“FASB”) Accounting Standards Codification (“ASC”) has become the exclusive reference of authoritative U.S. generally accepted accounting principles (“GAAP”)
The Fund 19
NOTES TO FINANCIAL STATEMENTS (continued)
recognized by the FASB to be applied by nongovernmental entities. Rules and interpretive releases of the Securities and Exchange Commission (“SEC”) under authority of federal laws are also sources of authoritative GAAP for SEC registrants. The ASC has superseded all existing non-SEC accounting and reporting standards. The fund’s financial statements are prepared in accordance with GAAP, which may require the use of management estimates and assumptions.Actual results could differ from those estimates.
The Company enters into contracts that contain a variety of indemnifications. The fund’s maximum exposure under these arrangements is unknown.The fund does not anticipate recognizing any loss related to these arrangements.
(a) Portfolio valuation: Investments in securities are valued at the last sales price on the securities exchange or national securities market on which such securities are primarily traded. Securities listed on the National Market System for which market quotations are available are valued at the official closing price or, if there is no official closing price that day, at the last sales price. Securities not listed on an exchange or the national securities market, or securities for which there were no transactions, are valued at the average of the most recent bid and asked prices, except for open short positions, where the asked price is used for valuation purposes. Bid price is used when no asked price is available. Registered investment companies that are not traded on an exchange are valued at their net asset value. When market quotations or offici al closing prices are not readily available, or are determined not to reflect accurately fair value, such as when the value of a security has been significantly affected by events after the close of the exchange or market on which the security is principally traded (for example, a foreign exchange or market),but before the fund calculates its net asset value,the fund may value these investments at fair value as determined in accordance with the procedures approved by the Board of Trustees. Fair valuing of securities may be determined with the assistance of a pricing service using calculations based on indices of domestic securities and other appropriate indicators, such as prices of relevant ADRs and futures contracts. For
20
other securities that are fair valued by the Board of Trustees, certain factors may be considered such as: fundamental analytical data, the nature and duration of restrictions on disposition, an evaluation of the forces that influence the market in which the securities are purchased and sold and public trading in similar securities of the issuer or comparable issuers. Financial futures are valued at the last sales price. Investments denominated in foreign currencies are translated to U.S. dollars at the prevailing rates of exchange. Forward foreign currency exchange contracts (“forward contracts”) are valued at the forward rate.
The fair value of a financial instrument is the amount that would be received to sell an asset or paid to transfer a liability in an orderly transaction between market participants at the measurement date (i.e. the exit price). GAAP establishes a fair value hierarchy that prioritizes the inputs of valuation techniques used to measure fair value.This hierarchy gives the highest priority to unadjusted quoted prices in active markets for identical assets or liabilities (Level 1 measurements) and the lowest priority to unobservable inputs (Level 3 measurements).
Additionally, GAAP provides guidance on determining whether the volume and activity in a market has decreased significantly and whether such a decrease in activity results in transactions that are not orderly. GAAP requires enhanced disclosures around valuation inputs and techniques used during annual and interim periods.
Various inputs are used in determining the value of the fund’s investments relating to fair value measurements.These inputs are summarized in the three broad levels listed below:
Level 1—unadjusted quoted prices in active markets for
identical investments.
Level 2—other significant observable inputs (including quoted
prices for similar investments, interest rates, prepayment speeds,
credit risk, etc.).
Level 3—significant unobservable inputs (including the fund’s own
assumptions in determining the fair value of investments).
The Fund 21
NOTES TO FINANCIAL STATEMENTS (continued)
The inputs or methodology used for valuing securities are not necessarily an indication of the risk associated with investing in those securities.
The following is a summary of the inputs used as of December 31, 2009 in valuing the fund’s investments:
| | | | | | |
| | | Level 2—Other | | Level 3— | | |
| | Level 1— | Significant | | Significant | | |
| | Unadjusted | Observable | | Unobservable | | |
| | Quoted Prices | Inputs | | Inputs | Total | |
| Assets ($) | | | | | | |
| Investments in Securities: | | | | | |
| Equity Securities— | | | | | | |
| Foreign† | 35,941,572 | 22,264,664 | | — | 58,206,236 | |
| Mutual Funds | 625,000 | — | | — | 625,000 | |
| Other Financial | | | | | | |
| Instruments†† | — | 229,769 | | — | 229,769 | |
| Liabilities ($) | | | | | | |
| Other Financial | | | | | | |
| Instruments†† | — | (52,389 | ) | — | (52,389 | ) |
| |
| † | See Statement of Investments for country classification. |
| †† | Other financial instruments include derivative instruments, such as futures, forward foreign currency |
| | exchange contracts, swap contracts and options contracts. Amounts shown represent unrealized |
| | appreciation (depreciation), or in the case of options, market value at period end. |
(b) Foreign currency transactions: The fund does not isolate that portion of the results of operations resulting from changes in foreign exchange rates on investments from the fluctuations arising from changes in the market prices of securities held. Such fluctuations are included with the net realized and unrealized gain or loss on investments.
Net realized foreign exchange gains or losses arise from sales of foreign currencies,currency gains or losses realized on securities transactions and the difference between the amounts of dividends, interest and foreign withholding taxes recorded on the fund’s books and the U.S. dollar equivalent of the amounts actually received or paid. Net unrealized foreign exchange gains and losses arise from changes in the value of assets and liabilities other than investments resulting from changes in exchange rates. Foreign currency gains and losses on investments are included with net realized and unrealized gain or loss on investments.
22
(c) Securities transactions and investment income: Securities transactions are recorded on a trade date basis. Realized gains and losses from securities transactions are recorded on the identified cost basis. Dividend income is recognized on the ex-dividend date and interest income, including, where applicable, accretion of discount and amortization of premium on investments, is recognized on the accrual basis.
The fund has arrangements with the custodian and cash management bank whereby the fund may receive earnings credits when positive cash balances are maintained, which are used to offset custody and cash management fees. For financial reporting purposes, the fund includes net earnings credits as an expense offset in the Statement of Operations.
Investing in foreign markets may involve special risks and considerations not typically associated with investing in the U.S. These risks include revaluation of currencies, high rates of inflation, repatriation restrictions on income and capital, and adverse political and economic developments. Moreover, securities issued in these markets may be less liquid, subject to government ownership controls and delayed settlements, and their prices may be more volatile than those of comparable securities in the U.S.
(d) Dividends to shareholders: Dividends are recorded on the ex-dividend date. Dividends from investment income-net and dividends from net realized capital gains, if any, are normally declared and paid annually, but the fund may make distributions on a more frequent basis to comply with the distribution requirements of the Internal Revenue Code of 1986, as amended (the “Code”).To the extent that net realized capital gains can be offset by capital loss carryovers, it is the policy of the fund not to distribute such gains. Income and capital gain distributions are determined in accordance with income tax regulations, which may differ from GAAP.
(e) Federal income taxes: It is the policy of the fund to continue to qualify as a regulated investment company, if such qualification is in the
The Fund 23
NOTES TO FINANCIAL STATEMENTS (continued)
best interests of its shareholders, by complying with the applicable provisions of the Code, and to make distributions of taxable income sufficient to relieve it from substantially all federal income and excise taxes.
As of and during the period ended December 31, 2009, the fund did not have any liabilities for any uncertain tax positions.The fund recognizes interest and penalties, if any, related to uncertain tax positions as income tax expense in the Statement of Operations. During the period, the fund did not incur any interest or penalties.
Each of the tax years in the four-year period ended December 31, 2009 remains subject to examination by the Internal Revenue Service and state taxing authorities.
At December 31, 2009, the components of accumulated earnings on a tax basis were as follows: undistributed ordinary income $931,591, accumulated capital losses $19,956,592 and unrealized appreciation $5,695,107. In addition, the fund had $361,730 of capital losses realized after October 31, 2009, which were deferred for tax purposes to the first day of the following fiscal year.
The accumulated capital loss carryover is available for federal income tax purposes to be applied against future net securities profits, if any, realized subsequent to December 31, 2009. If not applied, $8,146,593 of the carryover expires in fiscal 2016 and $11,809,999 expires in fiscal 2017.
The tax character of distributions paid to shareholders during the fiscal periods ended December 31, 2009 and December 31, 2008, were as follows: ordinary income $2,007,659 and $1,279,244, and long-term capital gains $0 and $2,417,928, respectively.
During the period ended December 31, 2009, as a result of permanent book to tax differences, primarily due to the tax treatment for foreign currency exchange gains and losses and passive foreign investment companies, the fund increased accumulated undistributed investment income-net by $165,799 and decreased accumulated net realized gain (loss) on investments by the same amount. Net assets and net asset value per share were not affected by this reclassification.
24
NOTE 2—Bank Lines of Credit:
The fund participates with other Dreyfus-managed funds in a $225 million unsecured credit facility led by Citibank, N.A. and a $300 million unsecured credit facility provided by The Bank of NewYork Mellon, a subsidiary of BNY Mellon and an affiliate of Dreyfus, (each, a “Facility”), each to be utilized primarily for temporary or emergency purposes, including the financing of redemptions. In connection therewith, the fund has agreed to pay its pro rata portion of commitment fees for each Facility. Interest is charged to the fund based on rates determined pursuant to the terms of the respective Facility at the time of borrowing.
The average amount of borrowings outstanding under the Facilities during the period ended December 31, 2009, was approximately $6,000 with a related weighted average annualized interest rate of 1.53%.
NOTE 3—Investment Advisory Fee, Sub-Investment Advisory Fee and Other Transactions with Affiliates:
(a) Pursuant to an investment advisory agreement with Dreyfus, the investment advisory fee is computed at the annual rate of .75% of the value of the fund’s average daily net assets and is payable monthly.
Pursuant to a sub-investment advisory agreement between Dreyfus and Newton, the sub-investment advisory fee is payable monthly by Dreyfus, and is based upon the value of the fund’s average daily net assets, computed at the following annual rates:
| | |
| Average Net Assets | | |
| 0 up to $100 million | .35 | % |
| $100 million up to $1 billion | .30 | % |
| $1 billion up to $1.5 billion | .26 | % |
| In excess of $1.5 billion | .20 | % |
(b) Under the Distribution Plan (the “Plan”) adopted pursuant to Rule 12b-1 under the Act, Service shares pay the Distributor for distributing their shares, for servicing and/or maintaining Service shares’ shareholder
The Fund 25
NOTES TO FINANCIAL STATEMENTS (continued)
accounts and for advertising and marketing for Service shares.The Plan provides for payments to be made at an annual rate of .25% of the value of Service shares’ average daily net assets. The Distributor may make payments to Participating Insurance Companies and to brokers and dealers acting as principal underwriter for their variable insurance products.The fees payable under the Plan are payable without regard to actual expenses incurred. During the period ended December 31, 2009, Service shares were charged $29,741 pursuant to the Plan.
The fund compensates Dreyfus Transfer, Inc., a wholly-owned subsidiary of Dreyfus, under a transfer agency agreement for providing personnel and facilities to perform transfer agency services for the fund. During the period ended December 31, 2009, the fund was charged $230 pursuant to the transfer agency agreement, which is included in Shareholder servicing costs in the Statement of Operations.
The fund compensates The Bank of New York Mellon under a cash management agreement for performing cash management services related to fund subscriptions and redemptions. During the period ended December 31, 2009, the fund was charged $41 pursuant to the cash management agreement, which is included in Shareholder servicing costs in the Statement of Operations. These fees were offset by earnings credits pursuant to the cash management agreement.
The fund also compensates The Bank of New York Mellon under a custody agreement for providing custodial services for the fund. During the period ended December 31, 2009, the fund was charged $85,805 pursuant to the custody agreement.
During the period ended December 31, 2009, the fund was charged $6,681 for services performed by the Chief Compliance Officer.
The components of “Due to The Dreyfus Corporation and affiliates” in the Statement of Assets and Liabilities consist of: investment advisory fees $37,716, Rule 12b-1 distribution plan fees $2,900, custodian fees $18,101, chief compliance officer fees $5,011 and transfer agency per account fees $40.
26
(c) Each Board member also serves as a Board member of other funds within the Dreyfus complex. Annual retainer fees and attendance fees are allocated to each fund based on net assets.
NOTE 4—Securities Transactions:
The aggregate amount of purchases and sales of investment securities, excluding short-term securities and forward contracts, during the period ended December 31, 2009, amounted to $52,675,803 and $52,477,184, respectively.
The fund adopted the provisions of ASC Topic 815 “Derivatives and Hedging” which requires qualitative disclosures about objectives and strategies for using derivatives, quantitative disclosures about fair value amounts of gains and losses on derivative instruments and disclosures about credit-risk-related contingent features in derivative agreements. The disclosure requirements distinguish between derivatives, which are accounted for as “hedges” and those that do not qualify for hedge accounting. Because investment companies value their derivatives at fair value and recognize changes in fair value through the Statement of Operations, they do not qualify for such accounting. Accordingly, even though a fund’s investments in derivatives may represent economic hedges, they are considered to be non-hedge transactions for purposes of this disclosure.
Forward Foreign Currency Exchange Contracts: The fund may enter into forward contracts in order to hedge its exposure to changes in foreign currency exchange rates on its foreign portfolio holdings, to settle foreign currency transactions or as a part of an investment strat-egy.When executing forward contracts, the fund is obligated to buy or sell a foreign currency at a specified rate on a certain date in the future. With respect to sales of forward contracts, the fund would incur a loss if the value of the contract increases between the date the forward contract is opened and the date the forward contract is closed. The fund realizes a gain if the value of the contract decreases between those
The Fund 27
NOTES TO FINANCIAL STATEMENTS (continued)
dates.With respect to purchases of forward contracts, the fund would incur a loss if the value of the contract decreases between the date the forward contract is opened and the date the forward contract is closed. The fund realizes a gain if the value of the contract increases between those dates.The fund is exposed to foreign currency risk as a result of changes in value of underlying financial instruments.The fund is also exposed to credit risk associated with counterparty nonperformance on these forward contracts, which is typically limited to the unrealized gain on each open contract.The following summarizes open forward contracts at December 31, 2009:
| | | | | |
| | | | | Unrealized | |
| | Foreign | | | Appreciation | |
| Forward Foreign Currency | Currency | | | (Depreciation) | |
| Exchange Contracts | Amounts | Cost ($) | Value ($) | at 12/31/2009 | ($) |
| Purchases: | | | | | |
| Euro, | | | | | |
| Expiring 2/12/2010 | 163,970 | 235,541 | 235,046 | (495 | ) |
| Euro, | | | | | |
| Expiring 2/12/2010 | 804,647 | 1,180,018 | 1,153,438 | (26,580 | ) |
| Japanese Yen, | | | | | |
| Expiring 1/4/2010 | 48,065,271 | 522,847 | 516,082 | (6,765 | ) |
| Norwegian Krone, | | | | | |
| Expiring 2/12/2010 | 6,364,951 | 1,046,606 | 1,097,226 | 50,620 | |
| Norwegian Krone, | | | | | |
| Expiring 2/12/2010 | 988,369 | 164,904 | 170,380 | 5,476 | |
| Singapore Dollar, | | | | | |
| Expiring 4/15/2010 | 827,399 | 594,494 | 588,372 | (6,122 | ) |
| Sales: | | Proceeds($) | | | |
| Australian Dollar, | | | | | |
| Expiring 1/4/2010 | 19,348 | 17,371 | 17,378 | (7 | ) |
| British Pound, | | | | | |
| Expiring 2/12/2010 | 618,000 | 1,046,606 | 997,937 | 48,669 | |
| British Pound, | | | | | |
| Expiring 2/12/2010 | 97,000 | 164,904 | 156,634 | 8,270 | |
| British Pound, | | | | | |
| Expiring 2/12/2010 | 144,000 | 235,540 | 232,529 | 3,011 | |
28
| | | | | |
| | | | | Unrealized | |
| | Foreign | | | Appreciation | |
| Forward Foreign Currency | Currency | | | (Depreciation) | |
| Exchange Contracts | Amounts | Proceeds ($) | Value ($) | at 12/31/2009 | ($) |
| Sales (continued): | | | | | |
| British Pound, | | | | | |
| Expiring 2/12/2010 | 728,000 | 1,180,018 | 1,175,563 | 4,455 | |
| British Pound, | | | | | |
| Expiring 4/15/2010 | 376,000 | 594,495 | 606,915 | (12,420 | ) |
| Euro, | | | | | |
| Expiring 1/4/2010 | 3,483 | 5,015 | 4,993 | 22 | |
| Japanese Yen, | | | | | |
| Expiring 1/6/2010 | 2,802,087 | 30,372 | 30,086 | 286 | |
| Japanese Yen, | | | | | |
| Expiring 6/15/2010 | 105,834,000 | 1,197,675 | 1,137,789 | 59,886 | |
| Japanese Yen, | | | | | |
| Expiring 6/15/2010 | 105,316,000 | 1,181,294 | 1,132,220 | 49,074 | |
| Gross Unrealized | | | | | |
| Appreciation | | | | 229,769 | |
| Gross Unrealized | | | | | |
| Depreciation | | | | (52,389 | ) |
At December 31, 2009, the cost of investments for federal income tax purposes was $53,138,452; accordingly, accumulated net unrealized appreciation on investments was $5,692,784, consisting of $8,515,692 gross unrealized appreciation and $2,822,908 gross unrealized depreciation.
NOTE 5—Subsequent Events Evaluation:
Dreyfus has evaluated the need for disclosures and/or adjustments resulting from subsequent events through February 10, 2010, the date the financial statements were issued. This evaluation did not result in any subsequent events that necessitated disclosures and/or adjustments.
The Fund 29
|
| REPORT OF INDEPENDENT REGISTERED |
| PUBLIC ACCOUNTING FIRM |
|
| Shareholders and Board of Trustees |
| Dreyfus Variable Investment Fund, International Equity Portfolio |
We have audited the accompanying statement of assets and liabilities, including the statement of investments, of Dreyfus Variable Investment Fund, International Equity Portfolio (one of the series comprising Dreyfus Variable Investment Fund) as of December 31, 2009, and the related statement of operations for the year then ended, the statement of changes in net assets for each of the two years in the period then ended, and financial highlights for each of the years indicated therein. These financial statements and financial highlights are the responsibility of the Fund��s management. Our responsibility is to express an opinion on these financial statements and financial highlights based on our audits.
We conducted our audits in accordance with the standards of the Public Company Accounting Oversight Board (United States).Those standards require that we plan and perform the audit to obtain reasonable assurance about whether the financial statements and financial highlights are free of material misstatement.We were not engaged to perform an audit of the Fund’s internal control over financial reporting. Our audits included consideration of internal control over financial reporting as a basis for designing audit procedures that are appropriate in the circumstances, but not for the purpose of expressing an opinion on the effectiveness of the Fund’s internal control over financial reporting. Accordingly, we express no such opinion.An audit also includes examining, on a test basis, evidence supporting the amounts and disclosures in the financial statements and financial highlights, assessing the accounting principles used and significant estimates made by management, and evaluating the overall financial statement presentation. Our procedures included confirmation of securities owned as of December 31, 2009 by correspondence with the custodian and others. We believe that our audits provide a reasonable basis for our opinion.
In our opinion, the financial statements and financial highlights referred to above present fairly, in all material respects, the financial position of Dreyfus Variable Investment Fund, International Equity Portfolio at December 31, 2009, the results of its operations for the year then ended, the changes in its net assets for each of the two years in the period then ended, and the financial highlights for each of the indicated years, in conformity with U.S. generally accepted accounting principles.

New York, New York
February 10, 2010
30
IMPORTANT TAX INFORMATION (Unaudited)
In accordance with federal tax law, the fund elects to provide each shareholder with their portion of the fund’s foreign taxes paid and the income sourced from foreign countries. Accordingly, the fund hereby makes the following designations regarding its fiscal year ended December 31, 2009:
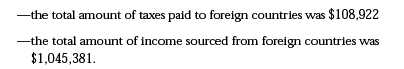
Where required by federal tax law rules, shareholders will receive notification of their proportionate share of foreign taxes paid and foreign sourced income for the 2009 calendar year with Form 1099-DIV which will be mailed in early 2010.
The Fund 31
BOARD MEMBERS INFORMATION (Unaudited)

32
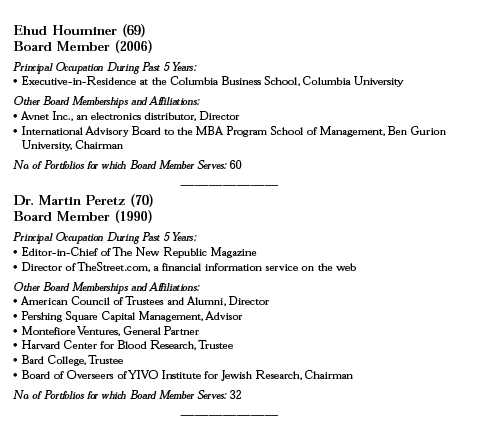
Once elected all Board Members serve for an indefinite term, but achieve Emeritus status upon reaching age 80.The address of the Board Members and Officers is in c/o The Dreyfus Corporation, 200 Park Avenue, NewYork, NewYork 10166. Additional information about the Board Members is available in the fund’s Statement of Additional Information which can be obtained from Dreyfus free of charge by calling this toll free number: 1-800-554-4611.
John M. Fraser, Jr., Emeritus Board Member
Rosalind G. Jacobs, Emeritus Board Member
Dr. Paul A. Marks, Emeritus Board Member
Gloria Messinger, Emeritus Board Member
The Fund 33
OFFICERS OF THE FUND (Unaudited)
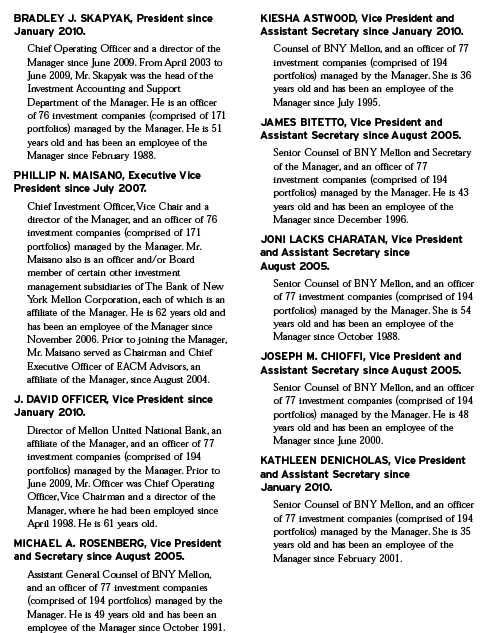
34
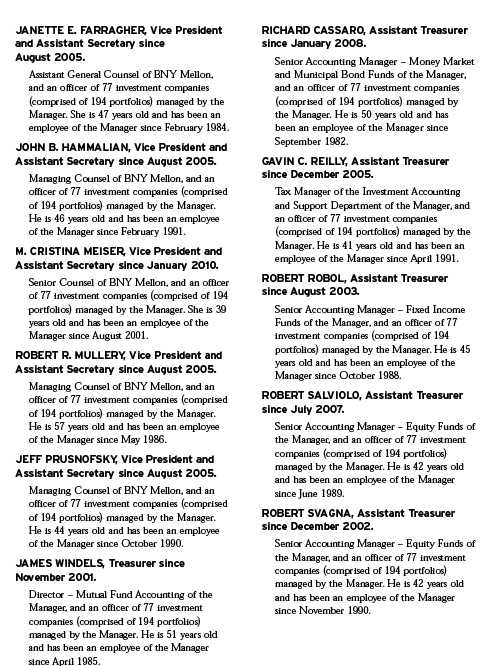
The Fund 35
OFFICERS OF THE FUND (Unaudited) (continued)
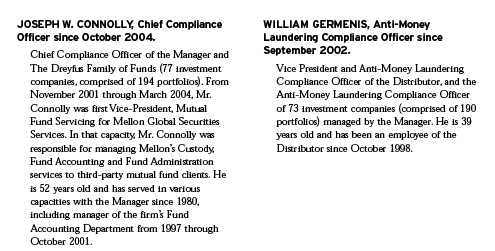
36
For More Information
Telephone 1-800-554-4611 or 1-516-338-3300
Mail The Dreyfus Family of Funds, 144 Glenn Curtiss Boulevard, Uniondale, NY 11556-0144 Attn: Investments Division
The fund files its complete schedule of portfolio holdings with the Securities and Exchange Commission (“SEC”) for the first and third quarters of each fiscal year on Form N-Q. The fund’s Forms N-Q are available on the SEC’s website at http://www.sec.gov and may be reviewed and copied at the SEC’s Public Reference Room in Washington, DC. Information on the operation of the Public Reference Room may be obtained by calling 1-800-SEC-0330.
A description of the policies and procedures that the fund uses to determine how to vote proxies relating to portfolio securities, and information regarding how the fund voted these proxies for the most recent 12-month period ended June 30 is available at http://www.dreyfus.com and on the SEC’s website at http://www.sec.gov. The description of the policies and procedures is also available without charge, upon request, by calling 1-800-645-6561.

|
| Dreyfus Variable |
| Investment Fund, |
| International Value |
| Portfolio |
ANNUAL REPORT December 31, 2009

The views expressed in this report reflect those of the portfolio manager only through the end of the period covered and do not necessarily represent the views of Dreyfus or any other person in the Dreyfus organization. Any such views are subject to change at any time based upon market or other conditions and Dreyfus disclaims any responsibility to update such views.These views may not be relied on as investment advice and, because investment decisions for a Dreyfus fund are based on numerous factors, may not be relied on as an indication of trading intent on behalf of any Dreyfus fund.

| | Contents |
| | THE FUND |
| 2 | A Letter from the Chairman and CEO |
| 3 | Discussion of Fund Performance |
| 6 | Fund Performance |
| 8 | Understanding Your Fund’s Expenses |
| 8 | Comparing Your Fund’s Expenses With Those of Other Funds |
| 9 | Statement of Investments |
| 15 | Statement of Assets and Liabilities |
| 16 | Statement of Operations |
| 17 | Statement of Changes in Net Assets |
| 19 | Financial Highlights |
| 21 | Notes to Financial Statements |
| 31 | Report of Independent Registered Public Accounting Firm |
| 32 | Important Tax Information |
| 33 | Board Members Information |
| 35 | Officers of the Fund |
| | FOR MORE INFORMATION |
| | Back Cover |
Dreyfus Variable Investment Fund,
International Value Portfolio
The Fund

A LETTER FROM THE CHAIRMAN AND CEO
Dear Shareholder:
We are pleased to present this annual report for International Value Portfolio, a series of Dreyfus Variable Investment Fund, covering the 12-month period from January 1, 2009, through December 31, 2009.
Global stock markets ended 2009 with healthy annual gains, but market indices across most regions, capitalization ranges and investment styles remained well below the peaks reached in the fall of 2007.The equity markets’ advance was driven by improving investor sentiment as the global economy staged a gradual, but sustained, recovery from the recession and banking crisis that had depressed stock prices at the beginning of the year. Growth was particularly robust in some emerging markets, supporting worldwide manufacturing activity to satisfy industrial demand. In many regions, slumping housing markets also showed signs of renewed life as home sales and prices rebounded modestly.However,eco-nomic headwinds remain, including high unemployment rates and the prospect of anemic consumer spending in Europe and the United States.
As 2010 begins, our Chief Economist, securities analysts and portfolio managers have continued to find opportunities and survey potential challenges throughout the world equity markets. While no one can predict the future, we believe that the 2010 investment environment will likely require a broader range of investment considerations relative to last year.As always, your financial adviser can help you determine the mix of investments that may be best suited to helping you achieve your goals at a level of risk that is comfortable for you.
For information about how the fund performed during the reporting period, as well as market perspectives, we have provided a Discussion of Fund Performance.
Thank you for your continued confidence and support.

Jonathan R. Baum
Chairman and Chief Executive Officer
The Dreyfus Corporation
January 15, 2010
2

DISCUSSION OF FUND PERFORMANCE
For the period of January 1, 2009, through December 31, 2009, as provided by D. Kirk Henry, Senior Portfolio Manager
Fund and Market Performance Overview
For the 12-month period ended December 31, 2009, InternationalValue Portfolio, a series of DreyfusVariable Investment Fund, produced a total return of 30.97 % for its Initial shares, and its Service shares produced a total return of 30.66%.1 This compares with a 31.78% return for the fund’s benchmark, the Morgan Stanley Capital International Europe, Australasia, Far East Index (“MSCI EAFE Index”), for the same period.2
International stocks continued to fall in early 2009, but they went on to produce solid gains during a rally that began in March and persisted through year-end. We attribute the market’s advance to improved investor sentiment as the global economy recovered from a severe recession and financial crisis. The fund produced modestly lower returns than its benchmark, primarily due to the small portion of cash held in such a strong return year and an underweight in Australia and materials from a country and sector standpoint, as both areas of the market significantly outperformed the MSCI EAFE Index.
The Fund’s Investment Approach
The fund seeks long-term capital growth by investing in stocks of foreign companies that we consider to be value companies.The fund may invest in companies of any size, and may also invest in companies located in emerging markets. Our investment approach is value-oriented and research-driven.When selecting stocks,we conduct extensive quantitative and fundamental research that emphasizes individual stock selection rather than economic and industry trends.We focus on how a stock is valued relative to its intrinsic worth, the company’s underlying business health as measured by return on assets and return on equity, and the presence of a catalyst that may trigger an increase in the stock price.
International Equities Posted Impressive Gains
When the year began, investor sentiment had been depressed by a deep and prolonged global recession. Mounting job losses, plummeting
The Fund 3
DISCUSSION OF FUND PERFORMANCE (continued)
housing values, depressed consumer spending and sluggish business investment led to economic deterioration in many parts of the world.At the same time, the world was in the grip of a credit crisis that led to the collapse of the global banking system.The effects of the crisis were particularly severe among U.S. and European banks, which reported massive write-downs among fixed-income investments tied to troubled loans.
In March, market sentiment suddenly began to improve as investors realized that remedial measures imposed by the world’s government and monetary authorities were gaining traction. Subsequent evidence of economic improvement further bolstered investors’ enthusiasm, sparking stock market rallies throughout the world.Although job losses continued to mount in many developed markets over the second half of the year, other economic indicators improved as manufacturing activity increased, housing values crept upward in some markets and corporate earnings showed favorable comparisons to one year earlier.
These factors enabled the MSCI EAFE Index to end 2009 with strongly positive returns.While the rebound was led primarily by stocks and industry groups that had been severely beaten down during the downturn, we began to see a broader advance among higher-quality companies later in the year.The developed markets of Europe and Japan generally underperformed their U.S. counterparts in the rally, but emerging markets in Asia and Latin America fared especially well as massive government spending supported regional economic activity.
Emphasis on Emerging Markets Boosted Fund Performance
In this improving environment, the fund achieved especially strong results from the emerging markets, where it participated in robust gains from Compal Electronics and United Microelectronics in Taiwan, as well as South Korea’s Hyundai Motor. In Germany, export-oriented sectors began to rebound in late March, leading to strong gains for fund holdings BMW, Daimler and MTU Aero Engines Holdings. In Greece, winners included Coca-Cola Hellenic Bottling and Public Power Corp., the country’s leading elec tric utility. Consumer discretionary stocks in Japan also responded well to the global economic recovery, as Nissan Motors, automotive components manufacturer Takata Corporation and industrials firm Chiyoda bolstered the fund’s results.
4
On the other hand, the fund’s relative performance was hindered by its limited exposure to commodities stocks, such as metals-and-mining giants BHP Billiton and Rio Tinto, preventing the fund from participating more fully in the benefits of rising commodity prices in the global recovery. In addition, underweighted exposure to Australian financial companies hurt the fund’s performance as these stocks were among the first to recover from the global banking and credit crisis. Other detractors in 2009 included Finland’s Nokia, which lost value amid intensifying competitive pressures.
Searching for Value Opportunities in 2010
We believe that the global economy’s ability to transition from government support to private sector activity will be one of the keys to 2010 performance in international equity markets. Now, more than ever, we remain committed to our investment discipline, which seeks high-quality, value-oriented companies with strong brands and a geographically diversified client base. Indeed, as of year-end 2009, we have identified a number of companies that meet these criteria but have not yet benefited fully from the market’s recent rebound.
January 15, 2010

The Fund 5
FUND PERFORMANCE
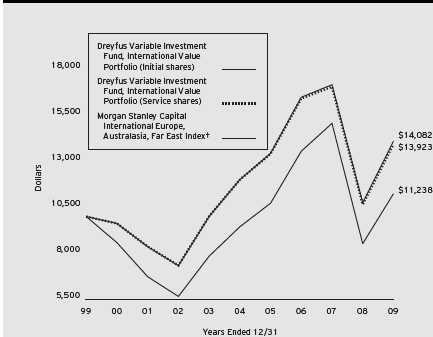
Comparison of change in value of $10,000 investment in Dreyfus Variable Investment Fund, International Value Portfolio Initial shares and Service shares and the Morgan Stanley Capital International Europe, Australasia, Far East Index
| | | | | | |
| Average Annual Total Returns as of 12/31/09 | | | | | | |
| | 1 Year | 5 Years | 10 Years |
| Initial shares | 30.97% | 3.24% | 3.48% |
| Service shares | 30.66% | 3.02% | 3.37% |
|
| The data for Service shares includes the results of Initial shares for the period prior to December 31, 2000 |
| (inception date of Service shares). Actual Service shares’ average annual total return and hypothetical growth |
| results would have been lower. See notes below. |
| † Source: Lipper Inc. |
| Past performance is not predictive of future performance.The fund’s performance shown in the graph and table does not |
| reflect the deduction of taxes that a shareholder would pay on fund distributions or the redemption of fund shares. |
| The fund’s performance does not reflect the deduction of additional charges and expenses imposed in connection |
| with investing in variable insurance contracts which will reduce returns. |
| The above graph compares a $10,000 investment made in Initial and Service shares of Dreyfus Variable Investment |
| Fund, International Value Portfolio on 12/31/99 to a $10,000 investment made in the Morgan Stanley Capital |
| International Europe,Australasia, Far East Index (the “Index”) on that date. |
6
The fund’s Initial shares are not subject to a Rule 12b-1 fee.The fund’s Service shares are subject to a 0.25% annual
Rule 12b-1 fee.The performance figures for Service shares reflect the performance of the fund’s Initial shares from their
inception date through December 30, 2000, and the performance of the fund’s Service shares from December 31, 2000
(inception date of Service shares) to December 31, 2009 (blended performance figures).The performance figures for each
share class reflect certain expense reimbursements, without which the performance of each share class would have been
lower. In addition, the blended performance figures have not been adjusted to reflect the higher operating expenses of the
Service shares. If these expenses had been reflected, the blended performance figures would have been lower.All dividends
and capital gain distributions are reinvested.
The fund’s performance shown in the line graph takes into account all applicable fund fees and expenses (after any
expense reimbursements).The Index is an unmanaged index composed of a sample of companies representative of the
market structure of European and Pacific Basin countries and includes net dividends reinvested. Unlike a mutual fund,
the Index is not subject to charges, fees and other expenses. Investors cannot invest directly in any index. Further
information relating to fund performance, including expense reimbursements, if applicable, is contained in the Financial
Highlights section of the prospectus and elsewhere in this report.
The Fund 7
UNDERSTANDING YOUR FUND’S EXPENSES (Unaudited)
As a mutual fund investor, you pay ongoing expenses, such as management fees and other expenses. Using the information below, you can estimate how these expenses affect your investment and compare them with the expenses of other funds.You also may pay one-time transaction expenses, including sales charges (loads), redemption fees and expenses associated with variable annuity or insurance contracts, which are not shown in this section and would have resulted in higher total expenses. For more information, see your fund’s prospectus or talk to your financial adviser.
Review your fund’s expenses
The table below shows the expenses you would have paid on a $1,000 investment in Dreyfus Variable Investment Fund, International Value Portfolio from July 1, 2009 to December 31, 2009. It also shows how much a $1,000 investment would be worth at the close of the period, assuming actual returns and expenses.
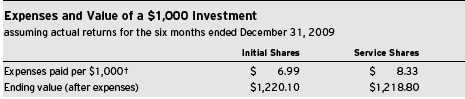
|
| COMPARING YOUR FUND’S EXPENSES |
| WITH THOSE OF OTHER FUNDS (Unaudited) |
Using the SEC’s method to compare expenses
The Securities and Exchange Commission (SEC) has established guidelines to help investors assess fund expenses. Per these guidelines, the table below shows your fund’s expenses based on a $1,000 investment, assuming a hypothetical 5% annualized return. You can use this information to compare the ongoing expenses (but not transaction expenses or total cost) of investing in the fund with those of other funds.All mutual fund shareholder reports will provide this information to help you make this comparison. Please note that you cannot use this information to estimate your actual ending account balance and expenses paid during the period.

|
| † Expenses are equal to the fund’s annualized expense ratio of 1.25% for Initial Shares and 1.49% for Service Shares, |
| multiplied by the average account value over the period, multiplied by 184/365 (to reflect the one-half year period). |
8
|
| STATEMENT OF INVESTMENTS |
| December 31, 2009 |
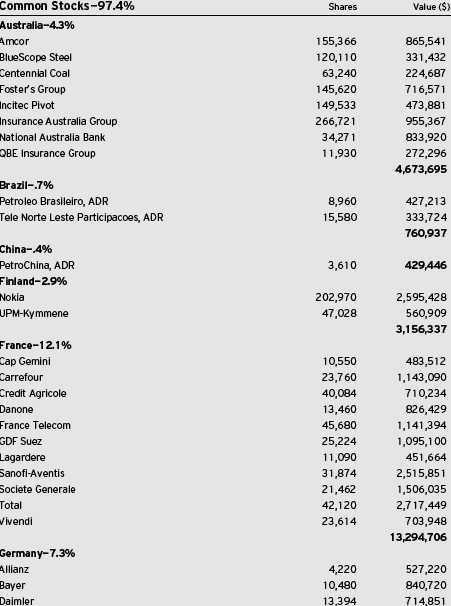
The Fund 9
STATEMENT OF INVESTMENTS (continued)

10
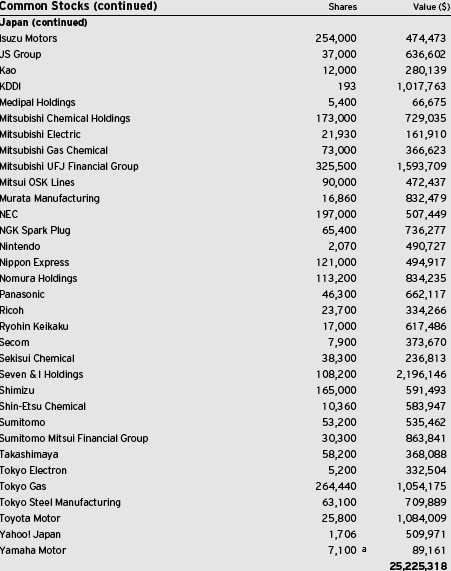
The Fund 11
STATEMENT OF INVESTMENTS (continued)
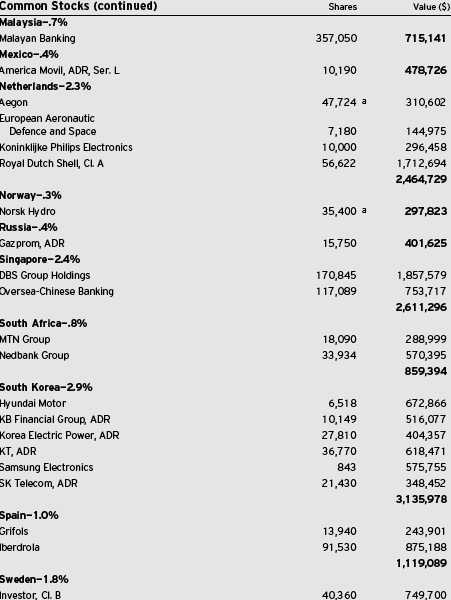
12
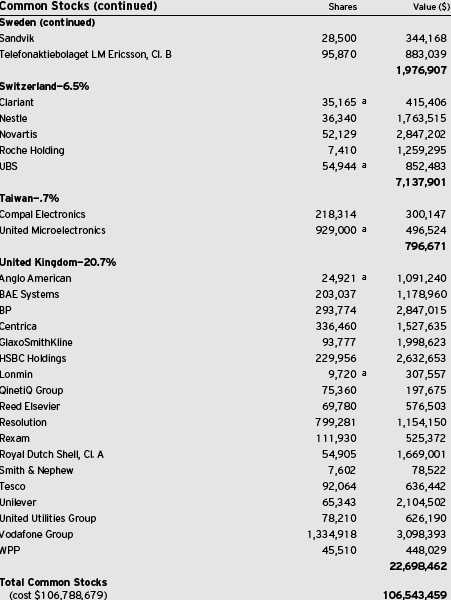
The Fund 13
STATEMENT OF INVESTMENTS (continued)
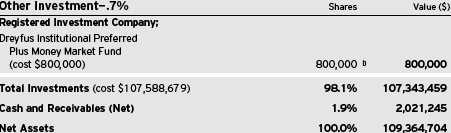
ADR—American Depository Receipts
| |
| a | Non-income producing security. |
| b | Investment in affiliated money market mutual fund. |
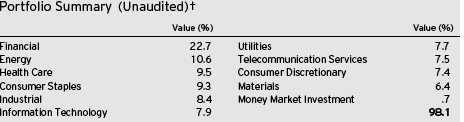
|
| † Based on net assets. |
| See notes to financial statements. |
14
|
| STATEMENT OF ASSETS AND LIABILITIES |
| December 31, 2009 |
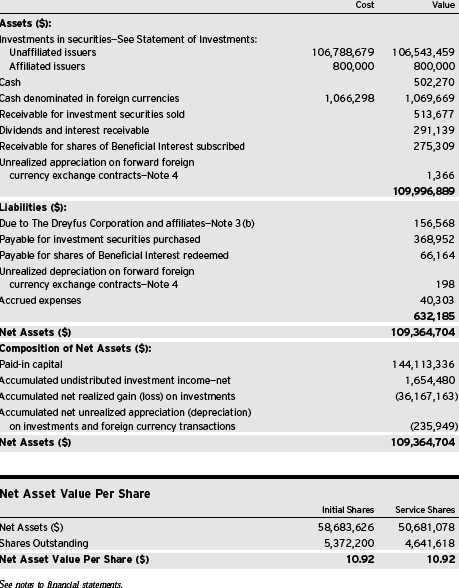
The Fund 15
|
| STATEMENT OF OPERATIONS |
| Year Ended December 31, 2009 |
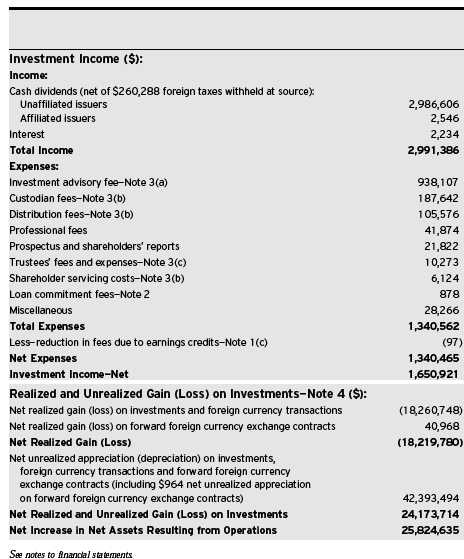
16
STATEMENT OF CHANGES IN NET ASSETS
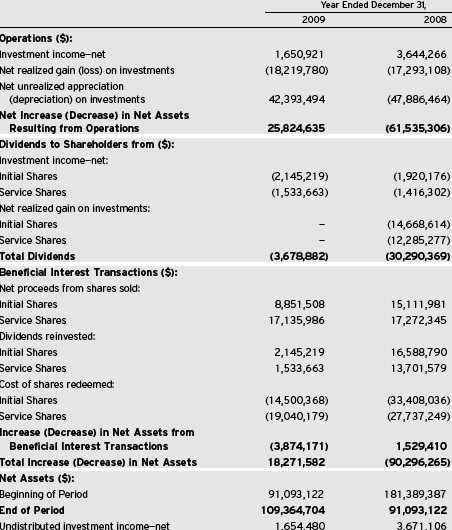
The Fund 17
STATEMENT OF CHANGES IN NET ASSETS (continued)
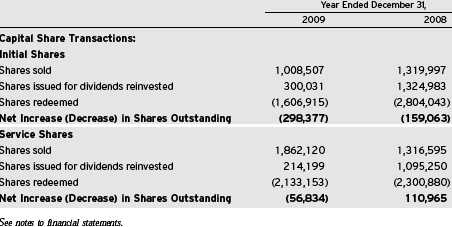
18
FINANCIAL HIGHLIGHTS
The following tables describe the performance for each share class for the fiscal periods indicated.All information (except portfolio turnover rate) reflects financial results for a single fund share.Total return shows how much your investment in the fund would have increased (or decreased) during each period, assuming you had reinvested all dividends and distributions. The fund’s total returns do not reflect expenses associated with variable annuity or insurance contracts.These figures have been derived from the fund’s financial statements.
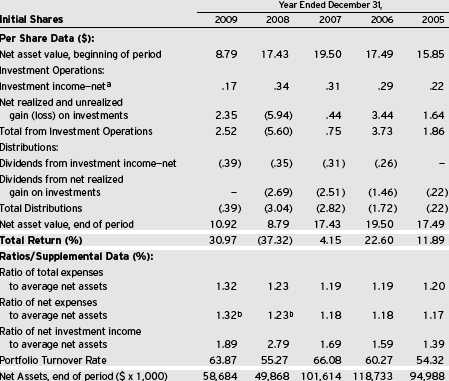
| |
| a | Based on average shares outstanding at each month end. |
| b | Expense waivers and/or reimbursements amounted to less than .01%. |
See notes to financial statements.
The Fund 19
FINANCIAL HIGHLIGHTS (continued)
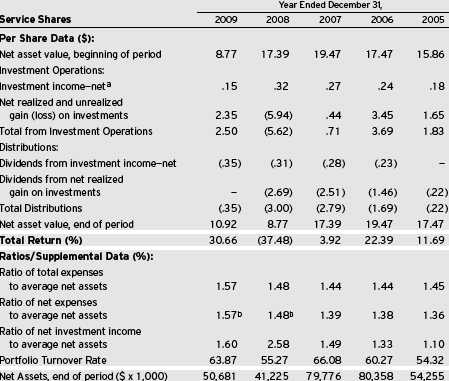
| |
| a | Based on average shares outstanding at each month end. |
| b | Expense waivers and/or reimbursements amounted to less than .01%. |
See notes to financial statements.
20
NOTES TO FINANCIAL STATEMENTS
NOTE 1—Significant Accounting Policies:
Dreyfus Variable Investment Fund (the “Company”) is registered under the Investment Company Act of 1940, as amended (the “Act”), as an open-end management investment company, operating as a series company currently offering seven series, including the International Value Portfolio (the “fund”). The fund is only offered to separate accounts established by insurance companies to fund variable annuity contracts and variable life insurance policies.The fund is a diversified series. The fund’s investment objective is long-term capital growth. The Dreyfus Corporation (the “Manager” or “Dreyfus”), a wholly-owned subsidiary of The Bank of New York Mellon Corporation (“BNY Mellon”), serves as the fund’s investment adviser.
MBSC Securities Corporation (the “Distributor”), a wholly-owned subsidiary of the Manager, is the distributor of the fund’s shares, which are sold without a sales charge. The fund is authorized to issue an unlimited number of $.001 par value shares of Beneficial Interest in each of the following classes of shares: Initial and Service. Each class of shares has identical rights and privileges, except with respect to the distribution plan, the expenses borne by each class, the allocation of certain transfer agency costs and certain voting rights. Income, expenses (other than expenses attributable to a specific class), and realized and unrealized gains or losses on investments are allocated to each class of shares based on its relative net assets.
The Company accounts separately for the assets, liabilities and operations of each series. Expenses directly attributable to each series are charged to that series’ operations; expenses which are applicable to all series are allocated among them on a pro rata basis.
The Financial Accounting Standards Board (“FASB”) Accounting Standards Codification (“ASC”) has become the exclusive reference of authoritative U.S. generally accepted accounting principles (“GAAP”) recognized by the FASB to be applied by nongovernmental entities. Rules and interpretive releases of the Securities and Exchange Commission (“SEC”) under authority of federal laws are also sources
The Fund 21
NOTES TO FINANCIAL STATEMENTS (continued)
of authoritative GAAP for SEC registrants. The ASC has superseded all existing non-SEC accounting and reporting standards. The fund’s financial statements are prepared in accordance with GAAP, which may require the use of management estimates and assumptions.Actual results could differ from those estimates.
The Company enters into contracts that contain a variety of indemnifications. The fund’s maximum exposure under these arrangements is unknown.The fund does not anticipate recognizing any loss related to these arrangements.
(a) Portfolio valuation: Investments in securities are valued at the last sales price on the securities exchange or national securities market on which such securities are primarily traded. Securities listed on the National Market System for which market quotations are available are valued at the official closing price or, if there is no official closing price that day, at the last sales price. Securities not listed on an exchange or the national securities market, or securities for which there were no transactions, are valued at the average of the most recent bid and asked prices, except for open short positions, where the asked price is used for valuation purposes. Bid price is used when no asked price is available. Registered investment companies that are not traded on an exchange are valued at their net asset value. When market quotations or offici al closing prices are not readily available, or are determined not to reflect accurately fair value, such as when the value of a security has been significantly affected by events after the close of the exchange or market on which the security is principally traded (for example, a foreign exchange or market),but before the fund calculates its net asset value,the fund may value these investments at fair value as determined in accordance with the procedures approved by the Board of Trustees. Fair valuing of securities may be determined with the assistance of a pricing service using calculations based on indices of domestic securities and other appropriate indicators, such as prices of relevant ADRs and futures contracts. For other securities that are fair valued by the Board of Trustees, certain factors may be considered such as: fundamental analytical data, the nature and duration of restrictions on disposition, an evaluation of the forces
22
that influence the market in which the securities are purchased and sold, and public trading in similar securities of the issuer or comparable issuers. Financial futures are valued at the last sales price. Investments denominated in foreign currencies are translated to U.S. dollars at the prevailing rates of exchange. Forward foreign currency exchange contracts (“forward contracts”) are valued at the forward rate.
The fair value of a financial instrument is the amount that would be received to sell an asset or paid to transfer a liability in an orderly transaction between market participants at the measurement date (i.e. the exit price). GAAP establishes a fair value hierarchy that prioritizes the inputs of valuation techniques used to measure fair value.This hierarchy gives the highest priority to unadjusted quoted prices in active markets for identical assets or liabilities (Level 1 measurements) and the lowest priority to unobservable inputs (Level 3 measurements).
Additionally, GAAP provides guidance on determining whether the volume and activity in a market has decreased significantly and whether such a decrease in activity results in transactions that are not orderly. GAAP requires enhanced disclosures around valuation inputs and techniques used during annual and interim periods.
Various inputs are used in determining the value of the fund’s investments relating to fair value measurements. These inputs are summarized in the three broad levels listed below:
|
| Level 1—unadjusted quoted prices in active markets for |
| identical investments. |
| Level 2—other significant observable inputs (including quoted |
| prices for similar investments, interest rates, prepayment speeds, |
| credit risk, etc.). |
| Level 3—significant unobservable inputs (including the fund’s own |
| assumptions in determining the fair value of investments). |
The inputs or methodology used for valuing securities are not necessarily an indication of the risk associated with investing in those securities.
The Fund 23
NOTES TO FINANCIAL STATEMENTS (continued)
The following is a summary of the inputs used as of December 31, 2009 in valuing the fund’s investments:
| | | | | | |
| | | Level 2—Other | | Level 3— | | |
| | Level 1— | Significant | | Significant | | |
| | Unadjusted | Observable | | Unobservable | | |
| | Quoted Prices | Inputs | | Inputs | Total | |
| Assets ($) | | | | | | |
| Investments in Securities: | | | | | |
| Equity Securities— | | | | | | |
| Foreign† | 68,830,335 | 37,713,124 | | — | 106,543,459 | |
| Mutual Funds | 800,000 | — | | — | 800,000 | |
| Other Financial | | | | | | |
| Instruments†† | — | 1,366 | | — | 1,366 | |
| Liabilities ($) | | | | | | |
| Other Financial | | | | | | |
| Instruments†† | — | (198 | ) | — | (198 | ) |
| |
| † | See Statement of Investments for country classification. |
| †† | Other financial instruments include derivative instruments, such as futures, forward foreign currency |
| | exchange contracts, swap contracts and options contracts.Amounts shown represent unrealized |
| | appreciation (depreciation), or in the case of options, market value at period end. |
(b) Foreign currency transactions: The fund does not isolate that portion of the results of operations resulting from changes in foreign exchange rates on investments from the fluctuations arising from changes in market prices of securities held. Such fluctuations are included with the net realized and unrealized gain or loss on investments.
Net realized foreign exchange gains or losses arise from sales of foreign currencies,currency gains or losses realized on securities transactions and the difference between the amounts of dividends, interest and foreign withholding taxes recorded on the fund’s books and the U.S. dollar equivalent of the amounts actually received or paid. Net unrealized foreign exchange gains and losses arise from changes in the value of assets and liabilities other than investments resulting from changes in exchange rates. Foreign currency gains and losses on investments are included with net realized and unrealized gain or loss on investments.
(c) Securities transactions and investment income: Securities transactions are recorded on a trade date basis. Realized gains and losses from securities transactions are recorded on the identified cost basis.
24
Dividend income is recognized on the ex-dividend date and interest income, including, where applicable, accretion of discount and amortization of premium on investments, is recognized on the accrual basis.
The fund has arrangements with the custodian and cash management bank whereby the fund may receive earnings credits when positive cash balances are maintained, which are used to offset custody and cash management fees. For financial reporting purposes, the fund includes net earnings credits as an expense offset in the Statement of Operations.
Investing in foreign markets may involve special risks and considerations not typically associated with investing in the U.S. These risks include revaluation of currencies, high rates of inflation, repatriation restrictions on income and capital, and adverse political and economic developments. Moreover, securities issued in these markets may be less liquid, subject to government ownership controls and delayed settlements, and their prices may be more volatile than those of comparable securities in the U.S.
(d) Affiliated issuers: Investments in other investment companies advised by the Manager are defined as “affiliated” in the Act.
(e) Dividends to shareholders: Dividends are recorded on the ex-dividend date. Dividends from investment income-net and dividends from net realized capital gains, if any, are normally declared and paid annually, but the fund may make distributions on a more frequent basis to comply with the distribution requirements of the Internal Revenue Code of 1986, as amended (the “Code”).To the extent that net realized capital gains can be offset by capital loss carryovers, it is the policy of the fund not to distribute such gains. Income and capital gain distributions are determined in accordance with income tax regulations, which may differ from GAAP.
(f) Federal income taxes: It is the policy of the fund to continue to qualify as a regulated investment company, if such qualification is in the best interests of its shareholders, by complying with the applicable provisions of the Code, and to make distributions of taxable income sufficient to relieve it from substantially all federal income and excise taxes.
The Fund 25
NOTES TO FINANCIAL STATEMENTS (continued)
As of and during the period ended December 31, 2009, the fund did not have any liabilities for any uncertain tax positions.The fund recognizes interest and penalties, if any, related to uncertain tax positions as income tax expense in the Statement of Operations. During the period, the fund did not incur any interest or penalties.
Each of the tax years in the four-year period ended December 31, 2009 remains subject to examination by the Internal Revenue Service and state taxing authorities.
At December 31, 2009, the components of accumulated earnings on a tax basis were as follows: undistributed ordinary income $1,739,379, accumulated capital losses $31,620,809 and unrealized depreciation $3,937,295. In addition, the fund had $929,907 of capital losses realized after October 31, 2009, which were deferred for tax purposes to the first day of the following fiscal year.
The accumulated capital loss carryover is available for federal income tax purposes to be applied against future net securities profits, if any, realized subsequent to December 31, 2009. If not applied, $9,980,117 of the carryover expires in fiscal 2016 and $21,640,692 expires in fiscal 2017.
The tax character of distributions paid to shareholders during the fiscal periods ended December 31, 2009 and December 31, 2008 were as follows: ordinary income $3,678,882 and $13,619,753 and long-term capital gains $0 and $16,670,616, respectively.
During the period ended December 31, 2009, as a result of permanent book to tax differences, primarily due to the tax treatment for foreign currency exchange gains and losses, the fund increased accumulated undistributed investment income-net by $11,335 and decreased accumulated net realized gain (loss) on investments by the same amount. Net assets and net asset value per share were not affected by this reclassification.
26
NOTE 2—Bank Lines of Credit:
The fund participates with other Dreyfus-managed funds in a $225 million unsecured credit facility led by Citibank, N.A. and a $300 million unsecured credit facility provided by The Bank of New York Mellon, a subsidiary of BNY Mellon and an affiliate of Dreyfus, (each, a “Facility”), each to be utilized primarily for temporary or emergency purposes, including the financing of redemptions. In connection therewith, the fund has agreed to pay its pro rata portion of commitment fees for each Facility. Interest is charged to the fund based on rates determined pursuant to the terms of the respective Facility at the time of borrowing. During the period ended December 31, 2009, the fund did not borrow under the Facilities.
NOTE 3—Investment Advisory Fee and Other Transactions With Affiliates:
(a) Pursuant to an investment advisory agreement with the Manager, the investment advisory fee is computed at the annual rate of 1% of the value of the fund’s average daily net assets and is payable monthly.
(b) Under the Distribution Plan (the “Plan”) adopted pursuant to Rule 12b-1 under the Act, Service shares pay the Distributor for distributing their shares, for servicing and/or maintaining Service shares’ shareholder accounts and for advertising and marketing for Service shares.The Plan provides for payments to be made at an annual rate of .25% of the value of the Service shares’ average daily net assets.The Distributor may make payments to Participating Insurance Companies and to brokers and dealers acting as principal underwriter for their variable insurance prod-ucts.The fees payable under the Plan are payable without regard to actual expenses incurred. During the period ended December 31, 2009, Service shares were charged $105,576 pursuant to the Plan.
The Fund 27
NOTES TO FINANCIAL STATEMENTS (continued)
The fund compensates Dreyfus Transfer, Inc., a wholly-owned subsidiary of the Manager, under a transfer agency agreement for providing personnel and facilities to perform transfer agency services for the fund. During the period ended December 31, 2009, the fund was charged $525 pursuant to the transfer agency agreement, which is included in Shareholder servicing costs in the Statement of Operations.
The fund compensates The Bank of New York Mellon under a cash management agreement for performing cash management services related to fund subscriptions and redemptions. During the period ended December 31, 2009, the fund was charged $97 pursuant to the cash management agreement, which is included in Shareholder servicing costs in the Statement of Operations. These fees were offset by earnings credits pursuant to the cash management agreement.
The fund also compensates The Bank of New York Mellon under a custody agreement for providing custodial services for the fund. During the period ended December 31, 2009, the fund was charged $187,642 pursuant to the custody agreement.
During the period ended December 31, 2009, the fund was charged $6,681 for services performed by the Chief Compliance Officer.
The components of “Due to The Dreyfus Corporation and affiliates” in the Statement of Assets and Liabilities consist of: investment advisory fees $92,571, Rule 12b-1 distribution plan fees $10,698, custodian fees $48,198, chief compliance officer fees $5,011 and transfer agency per account fees $90.
(c) Each Board member also serves as a Board member of other funds within the Dreyfus complex. Annual retainer fees and attendance fees are allocated to each fund based on net assets.
NOTE 4—Securities Transactions:
The aggregate amount of purchases and sales of investment securities, excluding short-term securities and forward contracts, during the
28
period ended December 31, 2009, amounted to $57,967,107 and $63,365,288, respectively.
The fund adopted the provisions of ASC Topic 815 “Derivatives and Hedging” which requires qualitative disclosures about objectives and strategies for using derivatives, quantitative disclosures about fair value amounts of gains and losses on derivative instruments and disclosures about credit-risk-related contingent features in derivative agreements. The disclosure requirements distinguish between derivatives, which are accounted for as “hedges” and those that do not qualify for hedge accounting. Because investment companies value their derivatives at fair value and recognize changes in fair value through the Statement of Operations, they do not qualify for such accounting. Accordingly, even though a fund’s investments in derivatives may represent economic hedges, they are considered to be non-hedge transactions for purposes of this disclosure.
Forward Foreign Currency Exchange Contracts: The fund may enter into forward contracts in order to hedge its exposure to changes in foreign currency exchange rates on its foreign portfolio holdings, to settle foreign currency transactions or as a part of an investment strat-egy.When executing forward contracts, the fund is obligated to buy or sell a foreign currency at a specified rate on a certain date in the future. With respect to sales of forward contracts, the fund would incur a loss if the value of the contract increases between the date the forward contract is opened and the date the forward contract is closed. The fund realizes a gain if the value of the contract decreases between those dates.With respect to purchases of forward contracts, the fund would incur a loss if the value of the contract decreases between the date the forward contract i s opened and the date the forward contract is closed. The fund realizes a gain if the value of the contract increases between those dates.The fund is exposed to foreign currency risk as a result of changes in value of underlying financial instruments.The fund is also
The Fund 29
NOTES TO FINANCIAL STATEMENTS (continued)
exposed to credit risk associated with counterparty nonperformance on these forward contracts, which is typically limited to the unrealized gain on each open contract.The following summarizes open forward contracts at December 31, 2009:
| | | | | |
| | Foreign | | | Unrealized | |
| Forward Foreign Currency | Currency | | | Appreciation | |
| Exchange Contracts | Amounts | Cost ($) | Value ($) (Depreciation) ($) | |
| Purchases: | | | | | |
| Euro, | | | | | |
| Expiring 1/4/2010 | 32,753 | 47,151 | 46,953 | (198 | ) |
| Sales: | | Proceeds ($) | | | |
| Australian Dollar, | | | | | |
| Expiring 1/4/2010 | 145,813 | 131,113 | 130,976 | 137 | |
| British Pound, | | | | | |
| Expiring 1/4/2010 | 74,267 | 120,350 | 119,955 | 395 | |
| Japanese Yen, | | | | | |
| Expiring 1/4/2010 | 11,956,581 | 129,047 | 128,379 | 668 | |
| Norwegian Krone, | | | | | |
| Expiring 1/4/2010 | 250,282 | 43,361 | 43,228 | 133 | |
| Swedish Krona, | | | | | |
| Expiring 1/4/2010 | 51,444 | 7,223 | 7,190 | 33 | |
| Gross Unrealized | | | | | |
| Appreciation | | | | 1,366 | |
| Gross Unrealized | | | | | |
| Depreciation | | | | (198 | ) |
At December 31, 2009, the cost of investments for federal income tax purposes was $111,290,025; accordingly, accumulated net unrealized depreciation on investments was $3,946,566, consisting of $11,662,686 gross unrealized appreciation and $15,609,252 gross unrealized depreciation.
NOTE 5—Subsequent Events Evaluation:
Dreyfus has evaluated the need for disclosures and/or adjustments resulting from subsequent events through February 10, 2010, the date the financial statements were issued. This evaluation did not result in any subsequent events that necessitated disclosures and/or adjustments.
30
|
| REPORT OF INDEPENDENT REGISTERED |
| PUBLIC ACCOUNTING FIRM |
|
| Shareholders and Board of Trustees |
| Dreyfus Variable Investment Fund, International Value Portfolio |
We have audited the accompanying statement of assets and liabilities, including the statement of investments, of Dreyfus Variable Investment Fund, International Value Portfolio (one of the series comprising Dreyfus Variable Investment Fund) as of December 31, 2009, and the related statement of operations for the year then ended, the statement of changes in net assets for each of the two years in the period then ended and financial highlights for each of the years indicated therein. These financial statements and financial highlights are the responsibility of the Fund’s management. Our responsibility is to express an opinion on these financial statements and financial highlights based on our audits.
We conducted our audits in accordance with the standards of the Public Company Accounting Oversight Board (United States).Those standards require that we plan and perform the audit to obtain reasonable assurance about whether the financial statements and financial highlights are free of material misstatement.We were not engaged to perform an audit of the Fund’s internal control over financial reporting. Our audits included consideration of internal control over financial reporting as a basis for designing audit procedures that are appropriate in the circumstances, but not for the purpose of expressing an opinion on the effectiveness of the Fund’s internal control over financial reporting. Accordingly, we express no such opinion.An audit also includes examining, on a test basis, evidence supporting the amounts and disclosures in the financial statements and financial highlights, assessing the accounting principles used and significant estimates made by management, and evaluating the overall financial statement presentation. Our procedures included confirmation of securities owned as of December 31, 2009 by correspondence with the custodian and others. We believe that our audits provide a reasonable basis for our opinion.
In our opinion, the financial statements and financial highlights referred to above present fairly, in all material respects, the financial position of Dreyfus Variable Investment Fund, International Value Portfolio at December 31, 2009, the results of its operations for the year then ended, the changes in its net assets for each of the two years in the period then ended, and the financial highlights for each of the indicated years, in conformity with U. S. generally accepted accounting principles.
New York, New York February 10, 2010
The Fund 31
IMPORTANT TAX INFORMATION (Unaudited)
In accordance with federal tax law, the fund elects to provide each shareholder with their portion of the fund’s foreign taxes paid and the income sourced from foreign countries. Accordingly, the fund hereby makes the following designations regarding its fiscal year ended December 31, 2009:
Where required by federal tax law rules, shareholders will receive notification of their proportionate share of foreign taxes paid and foreign sourced income for the 2009 calendar year with Form 1099-DIV which will be mailed in early 2010.
32
BOARD MEMBERS INFORMATION (Unaudited)
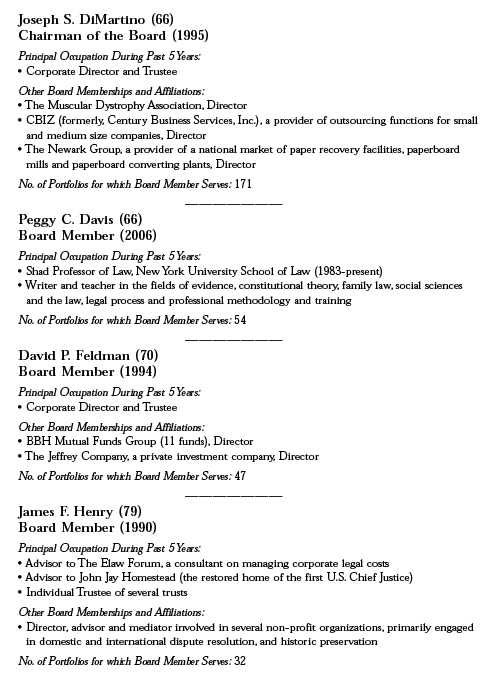
The Fund 33
BOARD MEMBERS INFORMATION (Unaudited) (continued)
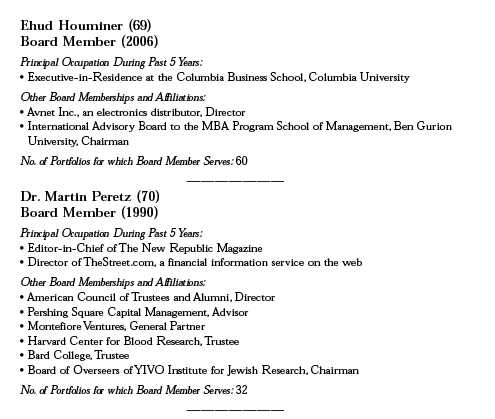
Once elected all Board Members serve for an indefinite term, but achieve Emeritus status upon reaching age 80.The address of the Board Members and Officers is in c/o The Dreyfus Corporation, 200 Park Avenue, NewYork, NewYork 10166.Additional information about the Board Members is available in the fund’s Statement of Additional Information which can be obtained from Dreyfus free of charge by calling this toll free number: 1-800-554-4611.
John M. Fraser, Jr., Emeritus Board Member
Rosalind G. Jacobs, Emeritus Board Member
Dr. Paul A. Marks, Emeritus Board Member
Gloria Messinger, Emeritus Board Member
34
OFFICERS OF THE FUND (Unaudited)

The Fund 35
OFFICERS OF THE FUND (Unaudited) (continued)
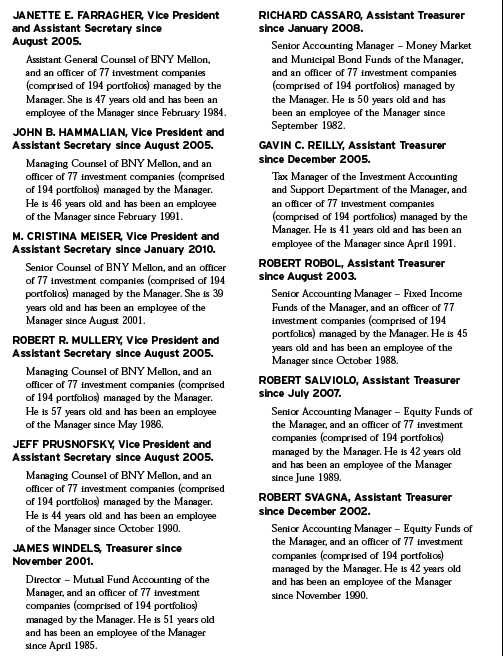
36
The Fund 37
For More Information
Telephone 1-800-554-4611 or 1-516-338-3300
Mail The Dreyfus Family of Funds, 144 Glenn Curtiss Boulevard, Uniondale, NY 11556-0144 Attn: Investments Division
The fund files its complete schedule of portfolio holdings with the Securities and Exchange Commission (“SEC”) for the first and third quarters of each fiscal year on Form N-Q. The fund’s Forms N-Q are available on the SEC’s website at http://www.sec.gov and may be reviewed and copied at the SEC’s Public Reference Room in Washington, DC. Information on the operation of the Public Reference Room may be obtained by calling 1-800-SEC-0330.
A description of the policies and procedures that the fund uses to determine how to vote proxies relating to portfolio securities, and information regarding how the fund voted these proxies for the most recent 12-month period ended June 30 is available at http://www.dreyfus.com and on the SEC’s website at http://www.sec.gov. The description of the policies and procedures is also available without charge,

|
| Dreyfus Variable |
| Investment Fund, |
| Money Market |
| Portfolio |
ANNUAL REPORT December 31, 2009

The views expressed in this report reflect those of the portfolio manager only through the end of the period covered and do not necessarily represent the views of Dreyfus or any other person in the Dreyfus organization. Any such views are subject to change at any time based upon market or other conditions and Dreyfus disclaims any responsibility to update such views.These views may not be relied on as investment advice and, because investment decisions for a Dreyfus fund are based on numerous factors, may not be relied on as an indication of trading intent on behalf of any Dreyfus fund.

| | Contents |
| | THE FUND |
| 2 | A Letter from the Chairman and CEO |
| 3 | Discussion of Fund Performance |
| 6 | Understanding Your Fund’s Expenses |
| 6 | Comparing Your Fund’s Expenses With Those of Other Funds |
| 7 | Statement of Investments |
| 10 | Statement of Assets and Liabilities |
| 11 | Statement of Operations |
| 12 | Statement of Changes in Net Assets |
| 13 | Financial Highlights |
| 14 | Notes to Financial Statements |
| 21 | Report of Independent Registered Public Accounting Firm |
| 22 | Proxy Results |
| 23 | Board Members Information |
| 25 | Officers of the Fund |
| | FOR MORE INFORMATION |
| | Back Cover |
Dreyfus Variable Investment Fund,
Money Market Portfolio
The Fund

A LETTER FROM THE CHAIRMAN AND CEO
Dear Shareholder:
We are pleased to present this annual report for Dreyfus Variable Investment Fund, Money Market Portfolio, covering the 12-month period from January 1, 2009, through December 31, 2009.
Most financial assets ended 2009 with healthy returns, but short-term interest rates remained at historical lows as monetary authorities fought to bring the nation and world out of a severe recession and banking crisis.
After four consecutive quarters of contraction, the U.S. economy returned to growth during the third quarter of 2009, buoyed by greater manufacturing activity to replenish depleted inventories and satisfy export demand. The slumping housing market also showed signs of renewed life when home sales and prices rebounded modestly. However, economic headwinds remain, including a high unemployment rate and the prospect of anemic consumer spending.
While money market yields are unlikely to return to their pre-recession levels any time soon, we continue to stress the importance of both municipal and taxable money market mutual funds as a haven of price stability and liquidity for risk-averse investors. Is your cash allocation properly positioned for the next phase of this economic cycle? Talk to your financial advisor, who can help you make that determination and prepare for the challenges and opportunities that lie ahead.
For information about how the fund performed during the reporting period, as well as market perspectives, we have provided a Discussion of Fund Performance.
Thank you for your continued confidence and support.

Jonathan R. Baum
Chairman and Chief Executive Officer
The Dreyfus Corporation
January 15, 2010
2

DISCUSSION OF FUND PERFORMANCE
For the period of January 1, 2009, through December 31, 2009, as provided by Bernard W. Kiernan, Jr., Senior Portfolio Manager
Fund and Market Performance Overview
For the 12-month period ended December 31, 2009, DreyfusVariable Investment Fund, Money Market Portfolio produced a yield of 0.13%. Taking into account the effects of compounding, the fund provided an effective yield of 0.13% for the same period.1
Money market yields remained near historically low levels as the U.S. government and Federal Reserve Board (the “Fed”) adopted a number of aggressive measures, including historically low short-term interest rates, to address a severe recession and credit crisis.
The Fund’s Investment Approach
The fund seeks as high a level of current income as is consistent with the preservation of capital and the maintenance of liquidity. To pursue this goal, the fund invests in a diversified selection of high-quality, short-term debt securities, including securities issued or guaranteed by the U.S. government or its agencies or instrumentalities, certificates of deposit, time deposits, bankers’ acceptances and other short-term securities issued by domestic or foreign banks, repurchase agreements, asset-backed securities, domestic and dollar-denominated foreign commercial paper and other short-term corporate and bank obligations of domestic and foreign issuers and dollar-denominated obligations issued or guaranteed by one or more foreign governments or their agencies.
Money Market Yields Fell to Record Lows
2009 began in the midst of a global financial crisis and severe recession. In response, the Fed had pumped liquidity into the banking system and eased monetary policy aggressively, driving the overnight federal funds rate to an unprecedented low of 0% to 0.25% by the end of 2008.As a result, money market yields fell to historical lows and remained there throughout the year.
The Fund 3
DISCUSSION OF FUND PERFORMANCE (continued)
The U.S. government responded with a number of its own remedial measures, including the Temporary Guarantee Program for Money Market Funds, which remained in effect through most of the reporting period before ending on September 18, 2009. This measure was designed to promote liquidity in the commercial paper market.
Although economic conditions continued to deteriorate in early 2009 as housing prices plummeted and job losses mounted, investor sentiment began to improve in March when evidence emerged that credit markets were recovering. Still, the U.S. economy sent mixed signals in the spring. Existing home sales and prices increased in May, but the unemployment rate hit a 26-year high.The U.S. economy contracted at a 0.7% annualized rate between April and June, a much milder decline than the previous quarter’s –5.5% annualized rate, lending credence to forecasts that the recession was nearing an end.
Residential construction improved in July, and August saw the first expansion of manufacturing activity in more than 18 months. Consumer spending increased in August by 1.3%,the largest gain in more than seven years, due in part to the U.S. government’s Cash for Clunkers automobile purchasing program.
October also experienced gradual economic improvement. Positive news included a return to growth for the U.S. economy, with U.S. GDP expanding at a 2.2% annualized rate in the third quarter, its first quarterly gain in more than a year.While pending home sales reached their highest level in almost three years, distressed sales accounted for more than 30% of those transactions.The unemployment rate moved to 10.2% in October, its highest level since the early 1980s.
In November, investors were encouraged by a slight dip in the unemployment rate to 10.0%. The manufacturing sector expanded and foreclosure activity in the housing sector moderated, with each indicator showing improvement for the fourth straight month. Manufacturing activity expanded for the fifth consecutive month in December, and new orders increased for the sixth straight month, providing further evidence of a mending economy. Retail sales in December were almost 3% higher than one year earlier, suggesting that consumers were spending more freely. While the unemployment rate remained at 10%, double its
4
level at the beginning of 2009, monthly job losses moderated in December to 85,000, down from an average of 691,000 per month during the first quarter.
Quality and Liquidity Still Our Priority
With yields at historically low levels, most money market funds maintained relatively defensive footings throughout the reporting period, and the industry’s average weighted maturity remained substantially shorter than historical averages.The fund was no exception; we set its weighted average maturity in a position that was roughly in line with industry averages for most of 2009.We also focused exclusively on money market instruments meeting our stringent credit-quality criteria.
Despite continued signs of economic improvement, the Fed has repeatedly indicated that “economic conditions are likely to warrant exceptionally low levels of the federal funds rate for an extended period.” In addition, the Treasury Department extended the Troubled Asset Relief Program (“TARP”) until October 2010 as a precaution against unforeseen problems. Until we see more convincing evidence that the Fed is prepared to raise interest rates, we will continue to maintain the fund’s focus on credit quality and liquidity.
January 15, 2010
| |
| | An investment in the fund is not insured or guaranteed by the FDIC or any other government |
| | agency. Although the fund seeks to preserve the value of your investment at $1.00 per share, it is |
| | possible to lose money by investing in the fund. |
| | The fund is only available as a funding vehicle under variable life insurance policies or variable |
| | annuity contracts issued by insurance companies. Individuals may not purchase shares of the fund |
| | directly. A variable annuity is an insurance contract issued by an insurance company that enables |
| | investors to accumulate assets on a tax-deferred basis for retirement or other long-term goals.The |
| | investment objective and policies of Dreyfus Variable Investment Fund, Money Market Portfolio |
| | made available through insurance products may be similar to other funds managed or advised by |
| | Dreyfus. However, the investment results of the fund may be higher or lower than, and may not be |
| | comparable to, those of any other Dreyfus fund. |
| 1 | Effective yield is based upon dividends declared daily and reinvested monthly. Past performance is |
| | no guarantee of future results.Yields fluctuate.The fund’s performance does not reflect the deduction |
| | of additional charges and expenses imposed in connection with investing in variable insurance |
| | contracts, which will reduce returns.Yields provided for the fund reflect the absorption of certain |
| | fund expenses by The Dreyfus Corporation pursuant to an undertaking in effect that may be |
| | extended, terminated or modified at any time. Had these expenses not been absorbed, the fund’s |
| | yield would have been -0.02%, and the effective yield would have been -0.02%. |
The Fund 5
UNDERSTANDING YOUR FUND’S EXPENSES (Unaudited)
As a mutual fund investor, you pay ongoing expenses, such as management fees and other expenses. Using the information below, you can estimate how these expenses affect your investment and compare them with the expenses of other funds.You also may pay one-time transaction expenses, including sales charges (loads), redemption fees and expenses associated with variable annuity or insurance contracts, which are not shown in this section and would have resulted in higher total expenses. For more information, see your fund’s prospectus or talk to your financial adviser.
Review your fund’s expenses
The table below shows the expenses you would have paid on a $1,000 investment in Dreyfus Variable Investment Fund,Money Market Portfolio from July 1,2009 to December 31,2009. It also shows how much a $1,000 investment would be worth at the close of the period, assuming actual returns and expenses.
|
| Expenses and Value of a $1,000 Investment |
| assuming actual returns for the six months ended December 31, 2009 |
| | |
| Expenses paid per $1,000† | $ | 2.22 |
| Ending value (after expenses) | $ | 1,000.00 |
|
| COMPARING YOUR FUND’S EXPENSES |
| WITH THOSE OF OTHER FUNDS (Unaudited) |
Using the SEC’s method to compare expenses
The Securities and Exchange Commission (SEC) has established guidelines to help investors assess fund expenses. Per these guidelines, the table below shows your fund’s expenses based on a $1,000 investment, assuming a hypothetical 5% annualized return. You can use this information to compare the ongoing expenses (but not transaction expenses or total cost) of investing in the fund with those of other funds.All mutual fund shareholder reports will provide this information to help you make this comparison. Please note that you cannot use this information to estimate your actual ending account balance and expenses paid during the period.
|
| Expenses and Value of a $1,000 Investment |
| assuming a hypothetical 5% annualized return for the six months ended December 31, 2009 |
| | |
| Expenses paid per $1,000† | $ | 2.24 |
| Ending value (after expenses) | $ | 1,022.99 |
|
| † Expenses are equal to the fund’s annualized expense ratio of .44%, multiplied by the average account value over the |
| period, multiplied by 184/365 (to reflect the one-half year period). |
6
|
| STATEMENT OF INVESTMENTS |
| December 31, 2009 |
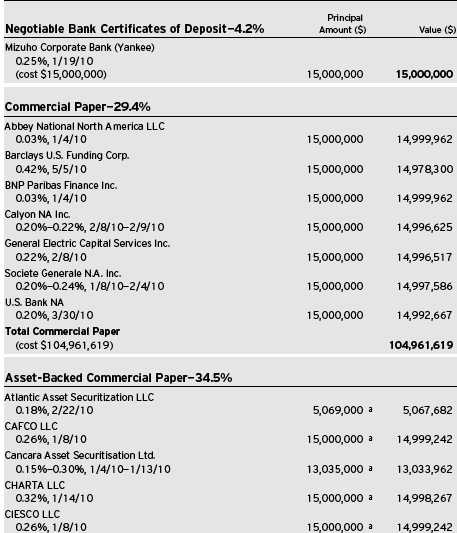
The Fund 7
STATEMENT OF INVESTMENTS (continued)
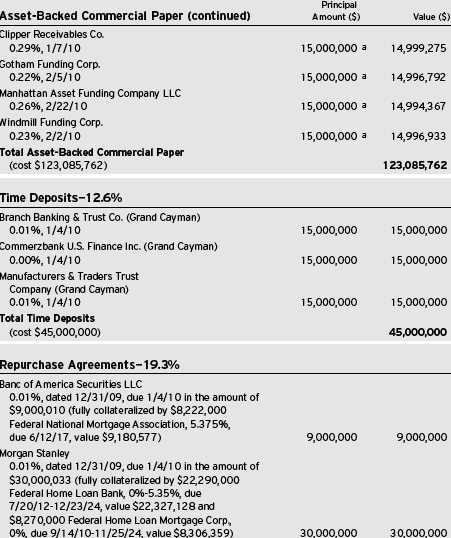
8

|
| a Securities exempt from registration under Rule 144A of the Securities Act of 1933.These securities may be resold in |
| transactions exempt from registration, normally to qualified institutional buyers. At December 31, 2009, these |
| securities amounted to $123,085,762 or 34.5% of net assets. |
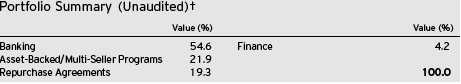
|
| † Based on net assets. |
| See notes to financial statements. |
The Fund 9
|
| STATEMENT OF ASSETS AND LIABILITIES |
| December 31, 2009 |
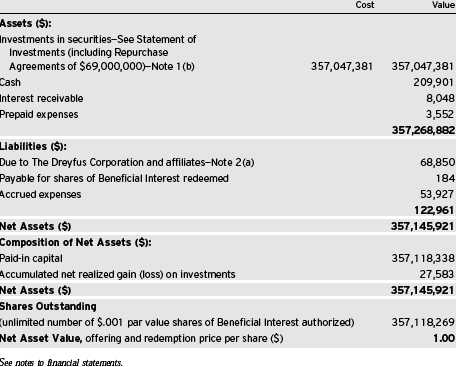
10
STATEMENT OF OPERATIONS
Year Ended December 31, 2009
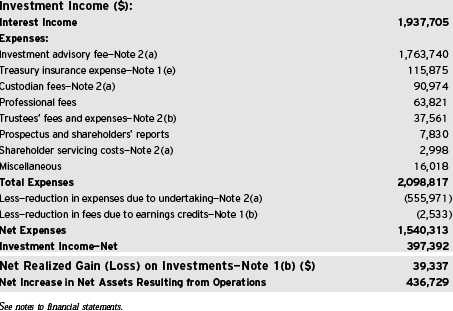
The Fund 11
STATEMENT OF CHANGES IN NET ASSETS
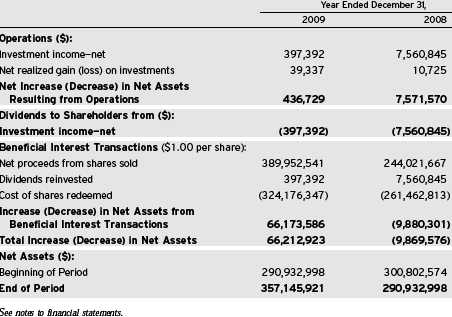
12
FINANCIAL HIGHLIGHTS
The following table describes the performance for the fiscal periods indicated. Total return shows how much your investment in the fund would have increased (or decreased) during each period, assuming you had reinvested all dividends and distributions. The fund’s total returns do not reflect expenses associated with variable annuity or insurance contracts.These figures have been derived from the fund’s financial statements.
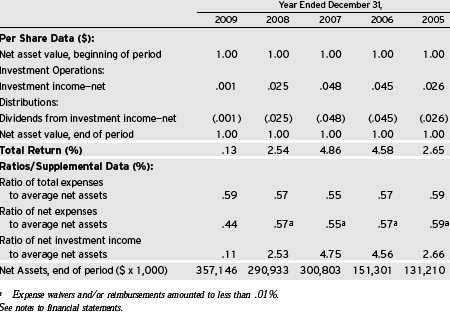
The Fund 13
NOTES TO FINANCIAL STATEMENTS
NOTE 1—Significant Accounting Policies:
Dreyfus Variable Investment Fund (the “Company”) is registered under the Investment Company Act of 1940, as amended (the “Act”), as an open-end management investment company, operating as a series company currently offering seven series, including the Money Market Portfolio (the “fund”). The fund is only offered to separate accounts established by insurance companies to fund variable annuity contracts and variable life insurance policies.The fund is a diversified series.The fund’s investment objective is to provide as high a level of current income as is consistent with the preservation of capital and the maintenance of liquidity. The Dreyfus Corporation (the “Manager” or “Dreyfus”), a wholly-owned subsidiary of The Bank of New York Mellon Corporation (“BNY Mellon”), serves as the fund’s investment adviser. MBSC Securities Corporation (the “Distributor&# 148;), a wholly-owned subsidiary of the Manager, is the distributor of the fund’s shares, which are sold without a sales charge.
It is the fund’s policy to maintain a continuous net asset value per share of $1.00; the fund has adopted certain investment, portfolio valuation and dividend and distribution policies to enable it to do so.There is no assurance, however, that the fund will be able to maintain a stable net asset value per share of $1.00.
The Company accounts separately for the assets, liabilities and operations of each series. Expenses directly attributable to each series are charged to that series’ operations; expenses which are applicable to all series are allocated among them on a pro rata basis.
The Financial Accounting Standards Board (“FASB”) Accounting Standards Codification (“ASC”) has become the exclusive reference of authoritative U.S. generally accepted accounting principles (“GAAP”) recognized by the FASB to be applied by nongovernmental entities. Rules and interpretive releases of the Securities and Exchange Commission (“SEC”) under authority of federal laws are also sources of authoritative GAAP for SEC registrants. The ASC has superseded all existing non-SEC accounting and reporting standards. The fund’s financial statements are prepared in accordance with GAAP, which
14
may require the use of management estimates and assumptions.Actual results could differ from those estimates.
The Company enters into contracts that contain a variety of indemnifications. The fund’s maximum exposure under these arrangements is unknown.The fund does not anticipate recognizing any loss related to these arrangements.
(a) Portfolio valuation: Investments in securities are valued at amortized cost in accordance with Rule 2a-7 of the Act, which has been determined by the Board of Trustees to represent the fair value of the fund’s investments.
The fair value of a financial instrument is the amount that would be received to sell an asset or paid to transfer a liability in an orderly transaction between market participants at the measurement date (i.e. the exit price). GAAP establishes a fair value hierarchy that prioritizes the inputs of valuation techniques used to measure fair value.This hierarchy gives the highest priority to unadjusted quoted prices in active markets for identical assets or liabilities (Level 1 measurements) and the lowest priority to unobservable inputs (Level 3 measurements).
Additionally, GAAP provides guidance on determining whether the volume and activity in a market has decreased significantly and whether such a decrease in activity results in transactions that are not orderly. GAAP requires enhanced disclosures around valuation inputs and techniques used during annual and interim periods.
Various inputs are used in determining the value of the fund’s investments relating to fair value measurements. These inputs are summarized in the three broad levels listed below:
Level 1—unadjusted quoted prices in active markets for
identical investments.
Level 2—other significant observable inputs (including quoted
prices for similar investments, interest rates, prepayment speeds,
credit risk, etc.).
Level 3—significant unobservable inputs (including the fund’s own
assumptions in determining the fair value of investments).
The Fund 15
NOTES TO FINANCIAL STATEMENTS (continued)
The inputs or methodology used for valuing securities are not necessarily an indication of the risk associated with investing in those securities. For example, money market securities are valued using amortized cost, in accordance with rules under the Act. Generally, amortized cost approximates the current fair value of a security, but since the value is not obtained from a quoted price in an active market, such securities are reflected as Level 2.
The following is a summary of the inputs used as of December 31, 2009 in valuing the fund’s investments:
| |
| | Short-Term |
| Valuation Inputs | Investments ($)† |
| Level 1—Unadjusted Quoted Prices | — |
| Level 2—Other Significant Observable Inputs | 357,047,381 |
| Level 3—Significant Unobservable Inputs | — |
| Total | 357,047,381 |
| |
| † | See Statement of Investments for additional detailed categorizations. |
(b) Securities transactions and investment income: Securities transactions are recorded on a trade date basis. Interest income, adjusted for accretion of discount and amortization of premium on investments, is earned from settlement date and recognized on the accrual basis. Realized gains and losses from securities transactions are recorded on the identified cost basis. Cost of investments represents amortized cost.
The fund has arrangements with the custodian and cash management bank whereby the fund may receive earnings credits when positive cash balances are maintained, which are used to offset custody and cash management fees. For financial reporting purposes, the fund includes net earnings credits as an expense offset in the Statement of Operations.
The fund may enter into repurchase agreements with financial institutions, deemed to be creditworthy by the Manager, subject to the seller’s agreement to repurchase and the fund’s agreement to resell such securities at a mutually agreed upon price. Securities purchased subject to repurchase agreements are deposited with the fund’s custodian and, pursuant to the terms of the repurchase agreement, must have an aggre-
16
gate market value greater than or equal to the terms of the repurchase price plus accrued interest at all times. If the value of the underlying securities falls below the value of the repurchase price plus accrued interest, the fund will require the seller to deposit additional collateral by the next business day. If the request for additional collateral is not met, or the seller defaults on its repurchase obligation, the fund maintains its right to sell the underlying securities at market value and may claim any resulting loss against the seller.
(c) Dividends to shareholders: It is the policy of the fund to declare dividends daily from investment income-net. Such dividends are paid monthly. Dividends from net realized capital gains, if any, are normally declared and paid annually, but the fund may make distributions on a more frequent basis to comply with the distribution requirements of the Internal Revenue Code of 1986 as amended (the “Code”).To the extent that net realized capital gains can be offset by capital loss carryovers, it is the policy of the fund not to distribute such gains.
(d) Federal income taxes: It is the policy of the fund to continue to qualify as a regulated investment company, if such qualification is in the best interests of its shareholders, by complying with the applicable provisions of the Code, and to make distributions of taxable income sufficient to relieve it from substantially all federal income and excise taxes.
As of and during the period ended December 31, 2009, the fund did not have any liabilities for any uncertain tax positions.The fund recognizes interest and penalties, if any, related to uncertain tax positions as income tax expense in the Statement of Operations. During the period, the fund did not incur any interest or penalties.
Each of the tax years in the four-year period ended December 31, 2009 remains subject to examination by the Internal Revenue Service and state taxing authorities.
At December 31, 2009, the components of accumulated earnings on a tax basis were substantially the same as for financial reporting purposes.
The Fund 17
NOTES TO FINANCIAL STATEMENTS (continued)
The tax character of distributions paid to shareholders during the fiscal periods ended December 31, 2009 and December 31, 2008, were all ordinary income.
At December 31, 2009, the cost of investments for federal income tax purposes was substantially the same as the cost for financial reporting purposes (see the Statement of Investments).
(e) Treasury’s Temporary Guarantee Program: The fund entered into a Guarantee Agreement with the United States Department of the Treasury (the “Treasury”) to participate in the Treasury’s Temporary Guarantee Program for Money Market Funds (the “Program”).
Under the Program, the Treasury guaranteed the share price of shares of the fund held by shareholders as of September 19, 2008 at $1.00 per share if the fund’s net asset value per share fell below $0.995 (a “Guarantee Event”) and the fund liquidated. Recovery under the Program was subject to certain conditions and limitations.
Fund shares acquired by investors after September 19, 2008 that increased the number of fund shares the investor held at the close of business on September 19, 2008 were not eligible for protection under the Program. In addition, fund shares acquired by investors who did not hold fund shares at the close of business on September 19, 2008 were not eligible for protection under the Program.
The Program, which was originally set to expire on December 18, 2008, was initially extended by the Treasury until April 30, 2009 and had been further extended by the Treasury until September 18, 2009, at which time the Secretary of the Treasury terminated the Program.As such, the fund is no longer eligible for protection under the Program. Participation in the initial term and the two extended periods of the Program required payments to the Treasury in the amounts of .015%, .022% and .023% respectively, of the fund’s shares outstanding as of September 19, 2008 (valued at $1.00 per share).This expense was borne by the fund without regard to any expense limitation in effect.
18
NOTE 2—Investment Advisory Fee and Other Transactions With Affiliates:
(a) Pursuant to an investment advisory agreement with the Manager, the investment advisory fee is computed at the annual rate of .50% of the value of the fund’s average daily net assets and is payable monthly.
The Manager has undertaken to reimburse expenses in the event that current yields drop below a certain level.This undertaking is voluntary and not contractual and may be terminated at any time.The reduction in expenses, pursuant to the undertaking, amounted to $555,971, during the period ended December 31, 2009.
The fund compensates Dreyfus Transfer, Inc., a wholly-owned subsidiary of the Manager, under a transfer agency agreement for providing personnel and facilities to perform transfer agency services for the fund. During the period ended December 31, 2009, the fund was charged $364 pursuant to the transfer agency agreement, which is included in Shareholder servicing costs in the Statement of Operations.
The fund compensates The Bank of New York Mellon, a subsidiary of BNY Mellon and an affiliate of Dreyfus, under a cash management agreement for performing cash management services related to fund subscriptions and redemptions. During the period ended December 31, 2009, the fund was charged $41 pursuant to the cash management agreement, which is included in Shareholder servicing costs in the Statement of Operations.These fees were offset by earnings credits pursuant to the cash management agreement.
The fund also compensates The Bank of New York Mellon under a custody agreement for providing custodial services for the fund. During the period ended December 31, 2009, the fund was charged $90,974 pursuant to the custody agreement.
During the period ended December 31, 2009, the fund was charged $6,681 for services performed by the Chief Compliance Officer.
The Fund 19
NOTES TO FINANCIAL STATEMENTS (continued)
The components of “Due to The Dreyfus Corporation and affiliates” in the Statement of Assets and Liabilities consist of:investment advisory fees $155,817, custodian fees $16,181, chief compliance officer fees $5,011 and transfer agency per account fees $54, which are offset against an expense reimbursement currently in effect in the amount of $108,213.
(b) Each Board member also serves as a Board member of other funds within the Dreyfus complex. Annual retainer fees and attendance fees are allocated to each fund based on net assets.
NOTE 3—Subsequent Events Evaluation:
Dreyfus has evaluated the need for disclosures and/or adjustments resulting from subsequent events through February 10, 2010, the date the financial statements were issued. This evaluation did not result in any subsequent events that necessitated disclosures and/or adjustments.
20
|
| REPORT OF INDEPENDENT REGISTERED |
| PUBLIC ACCOUNTING FIRM |
|
| Shareholders and Board of Trustees |
| Dreyfus Variable Investment Fund, Money Market Portfolio |
We have audited the accompanying statement of assets and liabilities, including the statement of investments, of Dreyfus Variable Investment Fund, Money Market Portfolio (one of the series comprising Dreyfus Variable Investment Fund) as of December 31, 2009, and the related statement of operations for the year then ended, the statement of changes in net assets for each of the two years in the period then ended, and financial highlights for each of the years indicated therein. These financial statements and financial highlights are the responsibility of the Fund’s management. Our responsibility is to express an opinion on these financial statements and financial highlights based on our audits.
We conducted our audits in accordance with the standards of the Public Company Accounting Oversight Board (United States).Those standards require that we plan and perform the audit to obtain reasonable assurance about whether the financial statements and financial highlights are free of material misstatement.We were not engaged to perform an audit of the Fund’s internal control over financial reporting. Our audits included consideration of internal control over financial reporting as a basis for designing audit procedures that are appropriate in the circumstances, but not for the purpose of expressing an opinion on the effectiveness of the Fund’s internal control over financial reporting. Accordingly, we express no such opinion.An audit also includes examining, on a test basis, evidence supporting the amounts and disclosures in the financial statements and financial highlights, assessing the accounting principles used and significant estimates made by management, and evaluating the overall financial statement presentation. Our procedures included confirmation of securities owned as of December 31, 2009 by correspondence with the custodian and others.We believe that our audits provide a reasonable basis for our opinion.
In our opinion, the financial statements and financial highlights referred to above present fairly, in all material respects, the financial position of DreyfusVariable Investment Fund, Money Market Portfolio at December 31, 2009, the results of its operations for the year then ended, the changes in its net assets for each of the two years in the period then ended, and the financial highlights for each of the indicated years,in conformity with U.S. generally accepted accounting principles.

The Fund 21
PROXY RESULTS (Unaudited)
DreyfusVariable Investment Fund—Money Market Portfolio held a special meeting of shareholders on November 16, 2009. The proposals considered at the meeting, and the results, are as follows:
| | | |
| | | Shares | |
| | | Authority | |
| | Votes For | Withheld | Abstain |
| 1. To approve amending the fund’s | | | |
| policy regarding borrowing. | 155,620,547 | 16,309,927 | 17,974,045 |
| 2. To approve amending the fund’s | | | |
| policy regarding lending. | 153,875,375 | 15,807,151 | 20,221,993 |
22
BOARD MEMBERS INFORMATION (Unaudited)
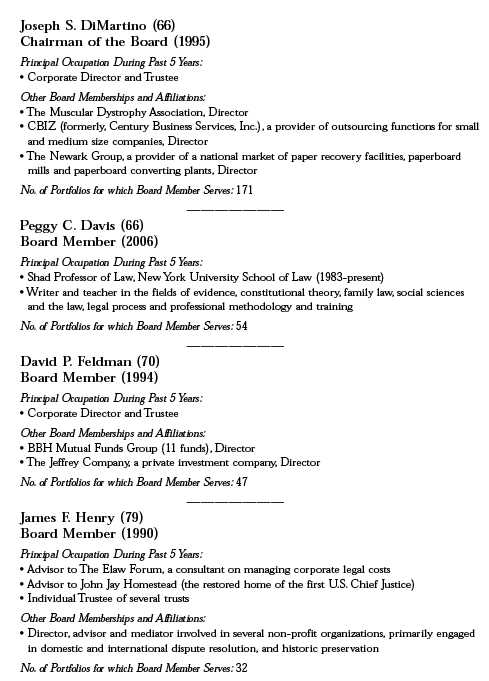
The Fund 23
BOARD MEMBERS INFORMATION (Unaudited) (continued)
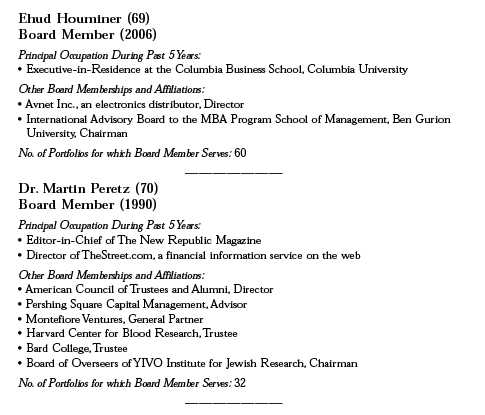
Once elected all Board Members serve for an indefinite term, but achieve Emeritus status upon reaching age 80.The address of the Board Members and Officers is in c/o The Dreyfus Corporation, 200 Park Avenue, NewYork, NewYork 10166. Additional information about the Board Members is available in the fund’s Statement of Additional Information which can be obtained from Dreyfus free of charge by calling this toll free number: 1-800-554-4611.
John M. Fraser, Jr., Emeritus Board Member
Rosalind G. Jacobs, Emeritus Board Member
Dr. Paul A. Marks, Emeritus Board Member
Gloria Messinger, Emeritus Board Member
24
OFFICERS OF THE FUND (Unaudited)
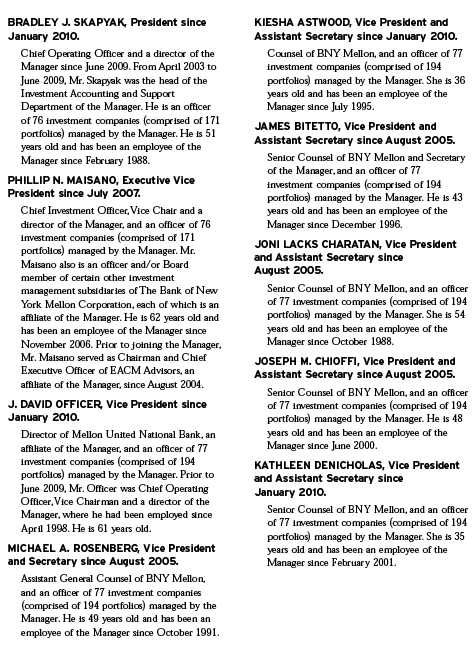
The Fund 25
OFFICERS OF THE FUND (Unaudited) (continued)
26

The Fund 27
NOTES
For More Information

|
| Telephone 1-800-554-4611 or 1-516-338-3300 |
| Mail The Dreyfus Family of Funds, 144 Glenn Curtiss Boulevard, Uniondale, NY 11556-0144 |
| Attn: Investments Division |
The fund files its complete schedule of portfolio holdings with the Securities and Exchange Commission (“SEC”) for the first and third quarters of each fiscal year on Form N-Q. The fund’s Forms N-Q are available on the SEC’s website at http://www.sec.gov and may be reviewed and copied at the SEC’s Public Reference Room in Washington, DC. Information on the operation of the Public Reference Room may be obtained by calling 1-800-SEC-0330.
Information regarding how the fund voted proxies relating to fund securities for the most recent 12-month period ended June 30 is available on the SEC’s website at http://www.sec.gov and without charge, upon request, by calling 1-800-645-6561.

|
| Dreyfus Variable |
| Investment Fund, |
| Quality Bond Portfolio |
ANNUAL REPORT December 31, 2009

The views expressed in this report reflect those of the portfolio manager only through the end of the period covered and do not necessarily represent the views of Dreyfus or any other person in the Dreyfus organization. Any such views are subject to change at any time based upon market or other conditions and Dreyfus disclaims any responsibility to update such views.These views may not be relied on as investment advice and, because investment decisions for a Dreyfus fund are based on numerous factors, may not be relied on as an indication of trading intent on behalf of any Dreyfus fund.

| | Contents |
| | THE FUND |
| 2 | A Letter from the Chairman and CEO |
| 3 | Discussion of Fund Performance |
| 6 | Fund Performance |
| 8 | Understanding Your Fund’s Expenses |
| 8 | Comparing Your Fund’s Expenses With Those of Other Funds |
| 9 | Statement of Investments |
| 26 | Statement of Financial Futures |
| 28 | Statement of Options Written |
| 29 | Statement of Assets and Liabilities |
| 30 | Statement of Operations |
| 31 | Statement of Changes in Net Assets |
| 33 | Financial Highlights |
| 35 | Notes to Financial Statements |
| 51 | Report of Independent Registered Public Accounting Firm |
| 52 | Board Members Information |
| 54 | Officers of the Fund |
| | FOR MORE INFORMATION |
| | Back Cover |
Dreyfus Variable Investment Fund,
Quality Bond Portfolio
The Fund

A LETTER FROM THE CHAIRMAN AND CEO
Dear Shareholder:
We are pleased to present this annual report for Dreyfus Variable Investment Fund, Quality Bond Portfolio, covering the 12-month period from January 1, 2009, through December 31, 2009.
The U.S and global bond markets ended 2009 with healthy annual gains among higher yielding market sectors, but U.S.Treasury securities and other sovereign bonds from developed nations gave back a portion of their previous gains. The bond market’s advance was driven partly by government intervention and partly by improving investor sentiment as the global economy staged a gradual, but sustained, recovery from a severe recession and banking crisis. After four consecutive quarters of contraction, the U.S. economy returned to growth during the third quarter of 2009, buoyed by greater manufacturing activity to replenish depleted inventories and satisfy export demand.The slumping housing market also showed signs of renewed life later in the year when home sales and prices rebounded modestly. However, economic headwinds remain, including a high unemployment rate and the prospect of anemic consumer spending.
As 2010 begins, our Chief Economist, as well as many securities analysts and portfolio managers have continued to find opportunities and survey potential challenges across the various fixed-income markets, both domestic and international. While no one can predict the future, we believe that the 2010 investment environment will likely require a broader range of investment considerations relative to last year.As always, your financial adviser can help you determine the mix of investments that may be best suited to helping you achieve your goals at a level of risk that is comfortable for you.
For information about how the fund performed during the reporting period, as well as market perspectives, we have provided a Discussion of Fund Performance.
Thank you for your continued confidence and support.

|
| Jonathan R. Baum |
| Chairman and Chief Executive Officer |
| The Dreyfus Corporation |
| January 15, 2010 |
2

DISCUSSION OF FUND PERFORMANCE
For the period of January 1, 2009, through December 31, 2009, as provided by David Bowser and Peter Vaream, Portfolio Managers
Fund and Market Performance Overview
For the 12-month period ended December 31, 2009, DreyfusVariable Investment Fund, Quality Bond Portfolio’s Initial shares achieved a total return of 14.96%, and its Service shares achieved a total return of 14.63%.1 The Barclays Capital U.S. Aggregate Bond Index (the “Index”), the fund’s benchmark, achieved a total return of 5.93% for the same period.2
After bottoming early in the year, most sectors of the U.S. bond market rallied during 2009 as credit markets thawed and investors began to anticipate an economic recovery. Conversely, U.S. Treasury securities gave back some of the gains achieved during a “flight to quality” in late 2008. The fund produced higher returns than its benchmark over the reporting period, primarily due to strong results from higher-yielding market sectors, such as investment-grade corporate bonds, high-yield bonds and commercial mortgages.
The Fund’s Investment Approach
The fund seeks to maximize total return consisting of capital appreciation and current income. To achieve this objective, the fund normally invests at least 80% of its assets in bonds, including corporate bonds, mortgage-related securities, collateralized mortgage obligations and asset-backed securities that, when purchased, are A-rated or better or what we believe are the unrated equivalent, and in securities issued or guaranteed by the U.S. government or its agencies or its instrumentalities.The fund may also invest up to 10% of its net assets in non-dollar-denominated foreign securities and up to 20% of its assets in the securities of foreign issues collectively.
Sustained Market Rally Erased Earlier Losses
2009 began in the midst of a global banking crisis and deep recession that produced steep declines among higher yielding bonds, including
The Fund 3
DISCUSSION OF FUND PERFORMANCE (continued)
mortgage-backed, asset-backed and corporate securities. In contrast, U.S.Treasury securities had rallied amid a “flight to quality.”
The Federal Reserve Board (the “Fed”) and U.S. government responded aggressively to the downturn. In early 2009, government officials rescued struggling automakers, and Congress passed the $787 billion American Recovery and Reinvestment Act of 2009.The Fed continued to inject massive amounts of liquidity into the banking system, and it purchased mortgage- and asset-backed debt through new programs such as the Term Asset-Backed Securities Loan Facility (TALF). In addition, the Fed maintained its target for the overnight federal funds rate at an all-time low range of between 0% and 0.25%.
Investor sentiment began to improve as it became clearer in March 2009 that these remedial measures had helped to avert a collapse of the U.S. banking system. Investors capitalized on attractive valuations among higher yielding fixed-income securities, sparking sustained rallies that were particularly impressive for high yield bonds, investment-grade corporate bonds, emerging market debt securities and certain commercial mortgage-backed securities. Residential mortgage-backed securities also rebounded, in part due to massive purchases by the Fed. Conversely, U.S. Treasury securities gave back some of their earlier gains.
Sector Allocation Strategy Produced Strong Results
The fund began the reporting period with underweighted exposure to U.S.Treasury securities and overweighted positions in investment-grade corporate bonds, high yield bonds and commercial mortgage-backed securities.These higher yielding market sectors led the 2009 rebound. The fund’s holdings in the investment-grade corporate sector were broadly diversified across industry groups, and we maintained a relatively conservative security selection strategy to mitigate some of the risk inherent in overweighted exposure to the sector.The fund’s holdings of lower-rated high yield bonds emphasized issuers that we believed had sound underlying assets, including a number of opportunities in the health care and utilities industry groups. The fund’s holdings of commercial mortgages focused on AAA-rated, seasoned securities with an average maturity in the five- to six-year range.The fund also benefited from its holdings of high - -quality asset-backed securities and emerging market debt.
4
In order to focus on adding value through our sector allocation and security selection strategies, we generally maintained the fund’s interest-rate strategies—including its average duration and yield-curve positioning—in ranges that were roughly in line with the benchmark. However, a modestly longer-than-average effective duration early in the year was a mild drag on performance, but any resulting shortfall was offset by income produced from the sale of options designed to capture differences between implied and actual price volatility.
Maintaining a Disciplined Approach to Security Selection
As of the reporting period’s end, we have maintained the fund’s sector allocation strategy, as we believe that higher yielding bonds have room for further gains as a subpar U.S. economic recovery continues to gain traction. However, we are aware that the bulk of the bond market rally probably is behind us, and we expect the Fed to pare back some of its remedial programs in 2010.Therefore, we believe that security selection will become a more critical determinant of fund performance over the foreseeable future, an environment to which our research-intensive approach may be particularly well suited.
January 15, 2010
| |
| | The fund is only available as a funding vehicle under variable life insurance policies or variable |
| | annuity contracts issued by insurance companies. Individuals may not purchase shares of the fund |
| | directly. A variable annuity is an insurance contract issued by an insurance company that enables |
| | investors to accumulate assets on a tax-deferred basis for retirement or other long-term goals.The |
| | investment objective and policies of Dreyfus Variable Investment Fund, Quality Bond Portfolio |
| | may be similar to other funds/portfolios managed or advised by Dreyfus. However, the investment |
| | results of the fund may be higher or lower than, and may not be comparable to, those of any other |
| | Dreyfus fund/portfolio. |
| 1 | Total return includes reinvestment of dividends and any capital gains paid. Past performance is no |
| | guarantee of future results. Share price and investment return fluctuate such that upon redemption, |
| | and fund shares may be worth more or less than their original cost.The fund’s performance does |
| | not reflect the deduction of additional charges and expenses imposed in connection with investing |
| | in variable insurance contracts, which will reduce returns. |
| 2 | SOURCE: LIPPER INC. — Reflects reinvestment of dividends and, where applicable, capital |
| | gain distributions.The Barclays Capital U.S. Aggregate Bond Index is a widely accepted, |
| | unmanaged total return index of corporate, U.S. government and U.S. government agency debt |
| | instruments, mortgage-backed securities and asset-backed securities with an average maturity of 1- |
| | 10 years.The Index does not include fees and expenses to which the fund is subject. |
The Fund 5
FUND PERFORMANCE
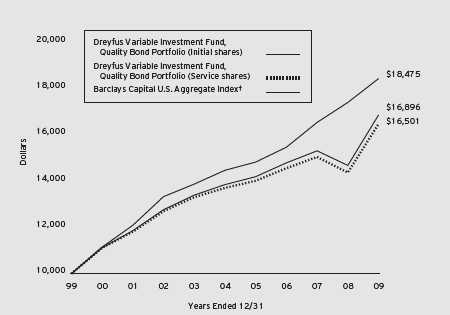
Comparison of change in value of $10,000 investment in Dreyfus Variable Investment Fund, Quality Bond Portfolio Initial shares and Service shares and the Barclays Capital U.S. Aggregate Index
| | | | | | |
| Average Annual Total Returns as of 12/31/09 | | | | | | |
| | 1 Year | 5 Years | 10 Years |
| Initial shares | 14.96% | 4.03% | 5.39% |
| Service shares | 14.63% | 3.75% | 5.14% |
|
| The data for Service shares primarily represents the results of Initial shares for the period prior to December 31, |
| 2000 (inception date of Service shares). Actual Service shares’ average annual total return and hypothetical |
| growth results would have been lower. See notes below. |
| † Source: Lipper Inc. |
| Past performance is not predictive of future performance.The fund’s performance shown in the graph and table does not |
| reflect the deduction of taxes that a shareholder would pay on fund distributions or the redemption of fund shares. |
| The fund’s performance does not reflect the deduction of additional charges and expenses imposed in connection |
| with investing in variable insurance contracts which will reduce returns. |
| The above graph compares a $10,000 investment made in Initial and Service shares of Dreyfus Variable Investment |
| Fund, Quality Bond Portfolio on 12/31/99 to a $10,000 investment made in the Barclays Capital U.S. Aggregate |
| Index (the “Index”) on that date. |
6
The fund’s Initial shares are not subject to a Rule 12b-1 fee.The fund’s Service shares are subject to a 0.25% annual
Rule 12b-1 fee.The performance figures for Service shares reflect the performance of the fund’s Initial shares from their
inception date through December 30, 2000, and the performance of the fund’s Service shares from December 31, 2000
(inception date of Service shares) to December 31, 2009 (blended performance figures).The blended performance figures
have not been adjusted to reflect the higher operating expenses of the Service shares. If these expenses had been reflected, the
blended performance figures would have been lower.All dividends and capital gain distributions are reinvested.
The fund’s performance shown in the line graph takes into account all applicable fund fees and expenses.The Index is a
widely accepted, unmanaged index of corporate, U.S. government and U.S. government agency debt instruments,
mortgage-backed securities and asset-backed securities with an average maturity of 1-10 years. Unlike a mutual fund, the
Index is not subject to charges, fees and other expenses. Investors cannot invest directly in any index. Further information
relating to fund performance, including expense reimbursements, if applicable, is contained in the Financial Highlights
section of the prospectus and elsewhere in this report.
The Fund 7
UNDERSTANDING YOUR FUND’S EXPENSES (Unaudited)
As a mutual fund investor, you pay ongoing expenses, such as management fees and other expenses. Using the information below, you can estimate how these expenses affect your investment and compare them with the expenses of other funds.You also may pay one-time transaction expenses, including sales charges (loads), redemption fees and expenses associated with variable annuity or insurance contracts, which are not shown in this section and would have resulted in higher total expenses. For more information, see your fund’s prospectus or talk to your financial adviser.
Review your portfolio’s expenses
The table below shows the expenses you would have paid on a $1,000 investment in Dreyfus Variable Investment Fund, Quality Bond Portfolio from July 1, 2009 to December 31, 2009. It also shows how much a $1,000 investment would be worth at the close of the period, assuming actual returns and expenses.
|
| Expenses and Value of a $1,000 Investment |
| assuming actual returns for the six months ended December 31, 2009 |
| | | | |
| | | Initial Shares | | Service Shares |
| Expenses paid per $1,000† | $ | 3.79 | $ | 5.15 |
| Ending value (after expenses) | $ | 1,088.70 | $ | 1,086.60 |
COMPARING YOUR FUND’S EXPENSES
WITH THOSE OF OTHER FUNDS (Unaudited)
Using the SEC’s method to compare expenses
The Securities and Exchange Commission (SEC) has established guidelines to help investors assess fund expenses. Per these guidelines, the table below shows your fund’s expenses based on a $1,000 investment, assuming a hypothetical 5% annualized return. You can use this information to compare the ongoing expenses (but not transaction expenses or total cost) of investing in the fund with those of other funds.All mutual fund shareholder reports will provide this information to help you make this comparison. Please note that you cannot use this information to estimate your actual ending account balance and expenses paid during the period.
|
| Expenses and Value of a $1,000 Investment |
| assuming a hypothetical 5% annualized return for the six months ended December 31, 2009 |
| | | | |
| | | Initial Shares | | Service Shares |
| Expenses paid per $1,000† | $ | 3.67 | $ | 4.99 |
| Ending value (after expenses) | $ | 1,021.58 | $ | 1,020.27 |
|
| † Expenses are equal to the fund’s annualized expense ratio of .72% for Initial Shares and .98% for Service Shares, |
| multiplied by the average account value over the period, multiplied by 184/365 (to reflect the one-half year period). |
8
|
| STATEMENT OF INVESTMENTS |
| December 31, 2009 |
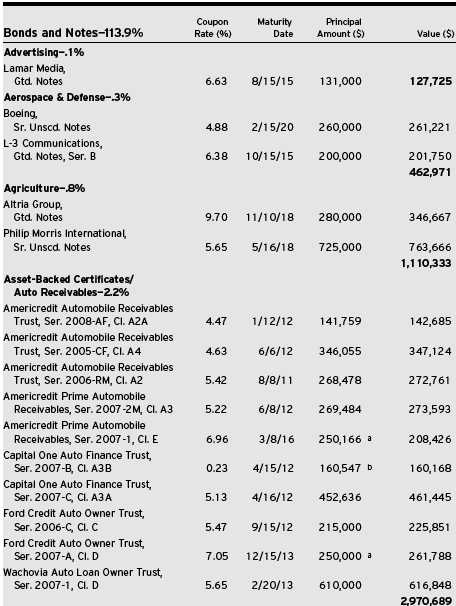
The Fund 9
STATEMENT OF INVESTMENTS (continued)
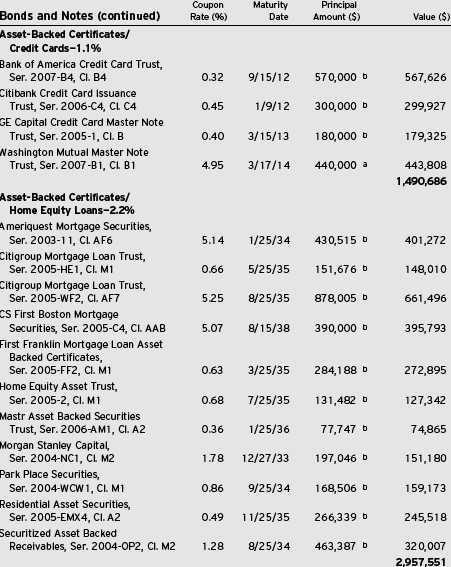
10
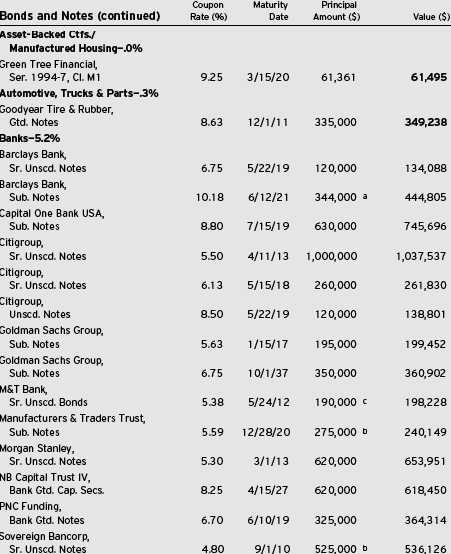
The Fund 11
STATEMENT OF INVESTMENTS (continued)

12
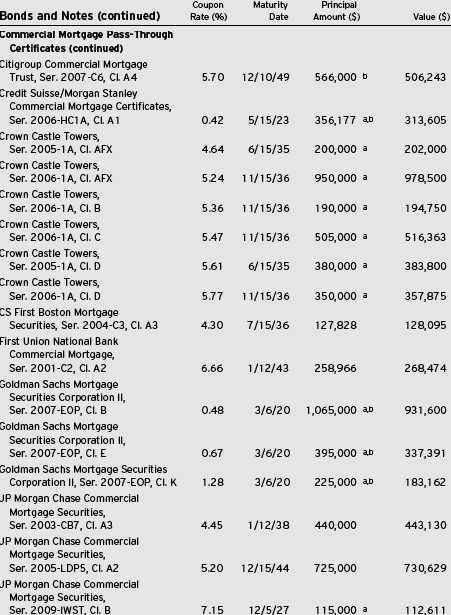
The Fund 13
STATEMENT OF INVESTMENTS (continued)
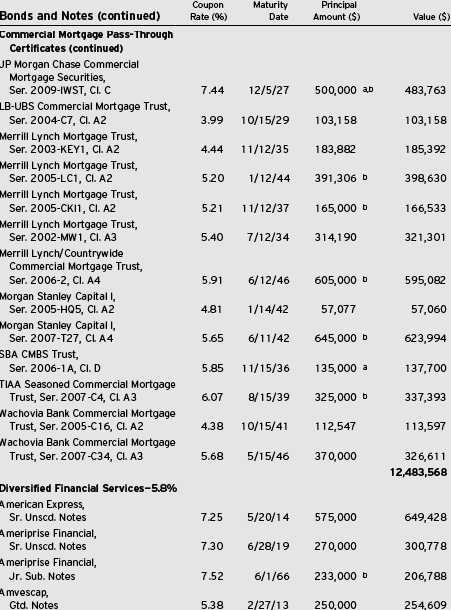
14
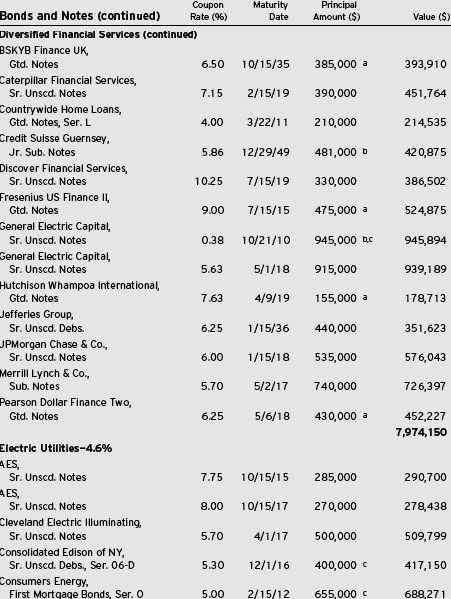
The Fund 15
STATEMENT OF INVESTMENTS (continued)
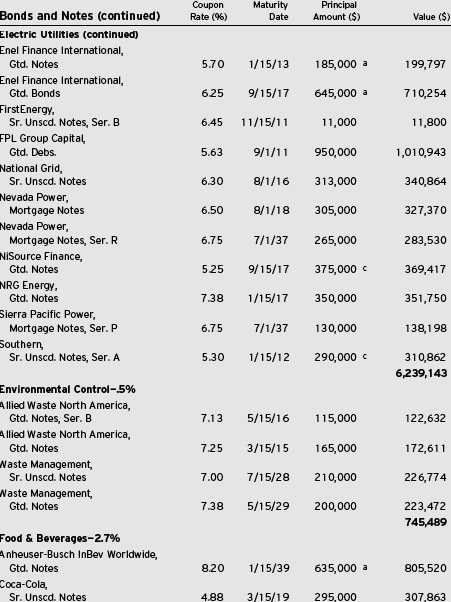
16
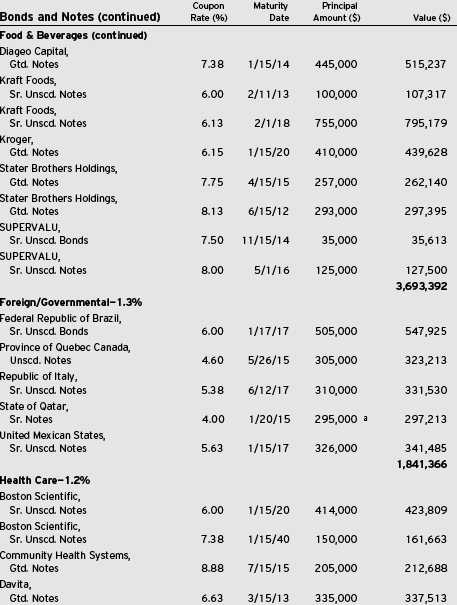
The Fund 17
STATEMENT OF INVESTMENTS (continued)
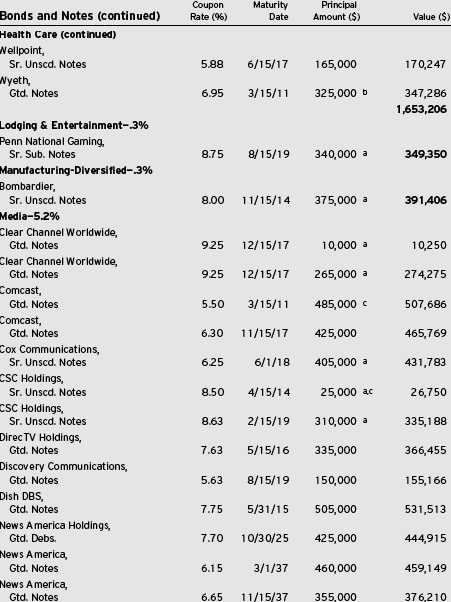
18
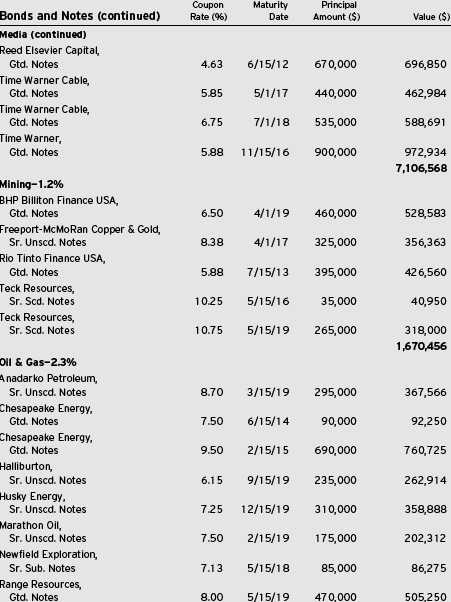
The Fund 19
STATEMENT OF INVESTMENTS (continued)

20
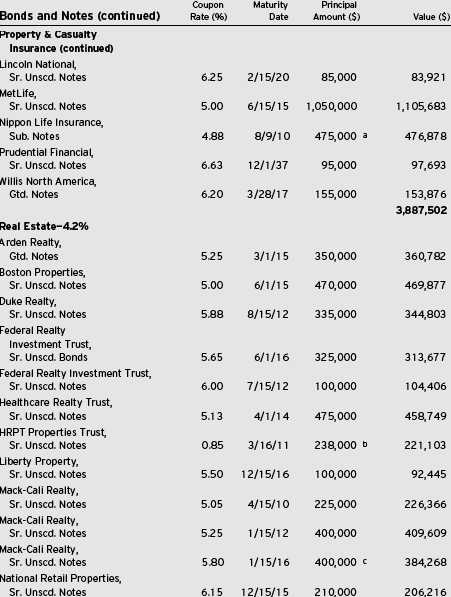
The Fund 21
STATEMENT OF INVESTMENTS (continued)
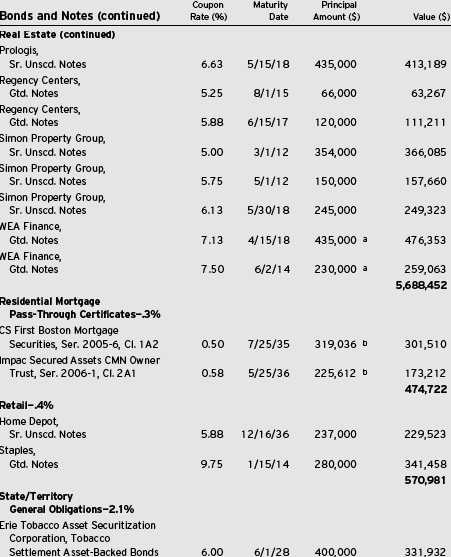
22
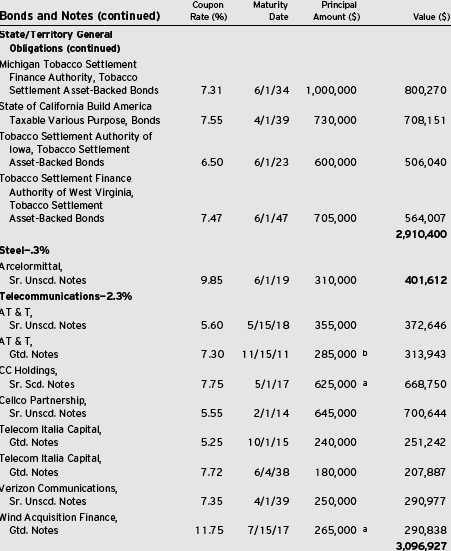
The Fund 23
STATEMENT OF INVESTMENTS (continued)
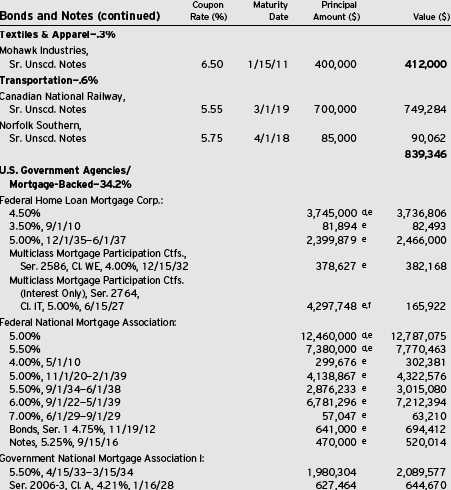
24
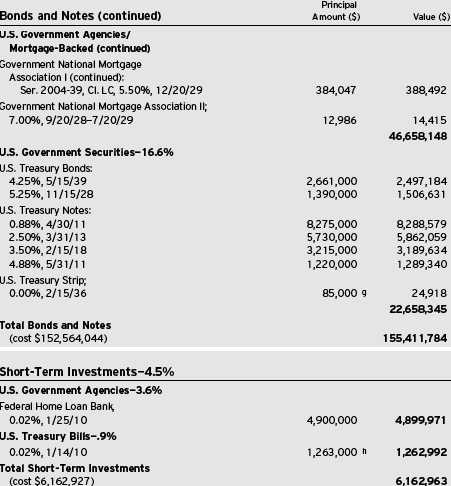
The Fund 25
STATEMENT OF INVESTMENTS (continued)

|
| a Securities exempt from registration under Rule 144A of the Securities Act of 1933.These securities may be resold in |
| transactions exempt from registration, normally to qualified institutional buyers. At December 31, 2009, these |
| securities had a total market value of $15,952,776 or 11.7% of net assets. |
| b Variable rate security—interest rate subject to periodic change. |
| c Security, or portion thereof, on loan.At December 31, 2009, the total market value of the fund’s securities on loan is |
| $3,937,842 and the total market value of the collateral held by the fund is $4,094,696. |
| d Purchased on a forward commitment basis. |
| e On September 7, 2008, the Federal Housing Finance Agency (FHFA) placed Federal National Mortgage |
| Association and Federal Home Loan Mortgage Corporation into conservatorship with FHFA as the conservator. As |
| such, the FHFA will oversee the continuing affairs of these companies. |
| f Notional face amount shown. |
| g Security issued with a zero coupon. Income is recognized through the accretion of discount. |
| h Held by a broker as collateral for open financial futures positions and open option positions. |
| i Investment in affiliated money market mutual fund. |
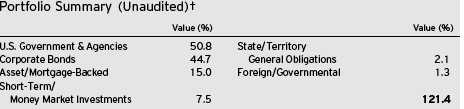
|
| † Based on net assets. |
| See notes to financial statements. |
26
|
| STATEMENT OF FINANCIAL FUTURES |
| December 31, 2009 |
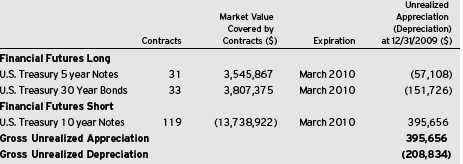
See notes to financial statements.
The Fund 27
|
| STATEMENT OF OPTIONS WRITTEN |
| December 31, 2009 |
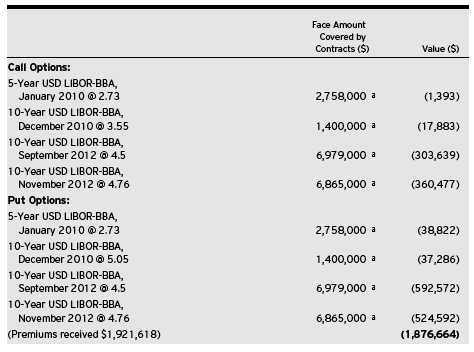

28
|
| STATEMENT OF ASSETS AND LIABILITIES |
| December 31, 2009 |
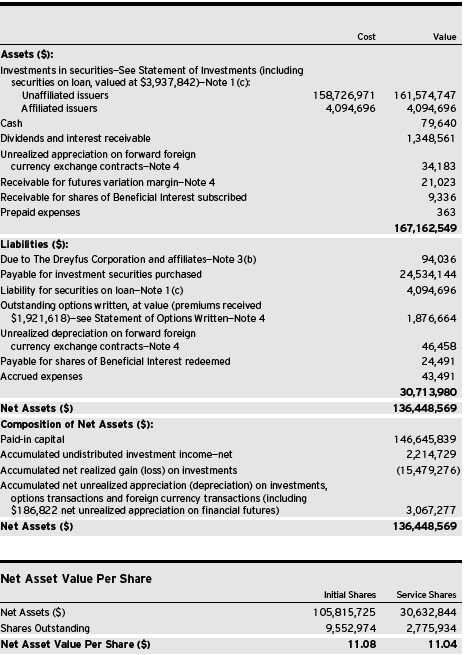
See notes to financial statements.
The Fund 29
|
| STATEMENT OF OPERATIONS |
| Year Ended December 31, 2009 |
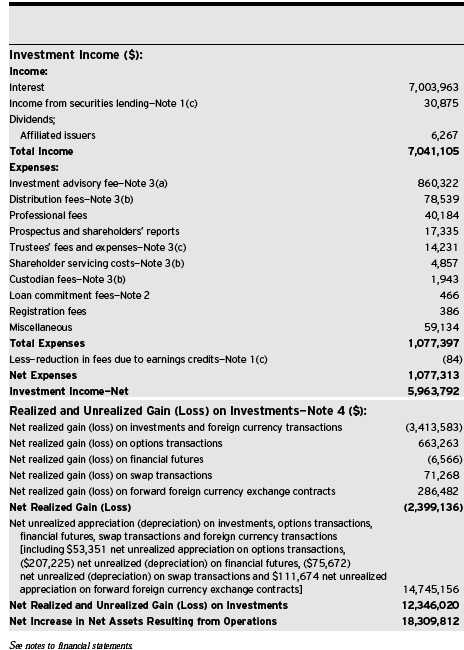
30
STATEMENT OF CHANGES IN NET ASSETS
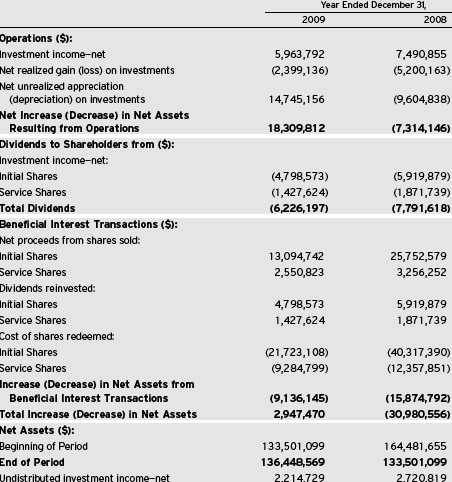
The Fund 31
STATEMENT OF CHANGES IN NET ASSETS (continued)

32
FINANCIAL HIGHLIGHTS
The following tables describe the performance for each share class for the fiscal periods indicated.All information (except portfolio turnover rate) reflects financial results for a single fund share.Total return shows how much your investment in the fund would have increased (or decreased) during each period, assuming you had reinvested all dividends and distributions. The fund's total returns do not reflect expenses associated with variable annuity or insurance contracts.These figures have been derived from the fund’s financial statements.
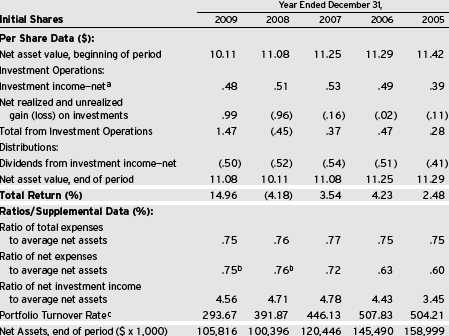
| |
| a | Based on average shares outstanding at each month end. |
| b | Expense waivers and/or reimbursements amounted to less than .01%. |
| c | The portfolio turnover rates excluding mortgage dollar roll transactions for the periods ended Decemebr 31, 2009, |
| | 2008, 2007, 2006 and 2005 were 102.76%, 142.10%, 219.54%, 262.26% and 393.37%, respectively. |
| See notes to financial statements. |
The Fund 33
FINANCIAL HIGHLIGHTS (continued)
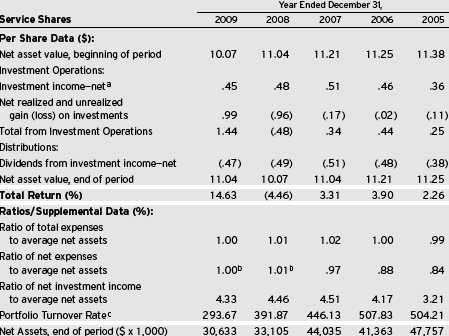
|
| a Based on average shares outstanding at each month end. |
| b Expense waivers and/or reimbursements amounted to less than .01%. |
| c The portfolio turnover rates excluding mortgage dollar roll transactions for the periods ended Decemebr 31, 2009, |
| 2008, 2007, 2006 and 2005 were 102.76%, 142.10%, 219.54%, 262.26% and 393.37%, respectively. |
See notes to financial statements.
34
NOTES TO FINANCIAL STATEMENTS
NOTE 1—Significant Accounting Policies:
Dreyfus Variable Investment Fund (the “Company”) is registered under the Investment Company Act of 1940, as amended (the “Act”), as an open end management investment company, operating as a series company currently offering seven series, including the Quality Bond Portfolio (the “fund”). The fund is only offered to separate accounts established by insurance companies to fund variable annuity contracts and variable life insurance policies.The fund is a diversified series.The fund’s investment objective is to maximize total return, consisting of capital appreciation and current income. The Dreyfus Corporation (the “Manager” or “Dreyfus”), a wholly-owned subsidiary ofThe Bank of New York Mellon Corporation (“BNY Mellon”), serves as the fund’s investment adviser.
MBSC Securities Corporation (the “Distributor”), a wholly-owned subsidiary of the Manager, is the distributor of the fund’s shares, which are sold without a sales charge. The fund is authorized to issue an unlimited number of $.001 par value shares of Beneficial Interest in each of the following classes of shares: Initial and Service. Each class of shares has identical rights and privileges, except with respect to the distribution plan, the expenses borne by each class, the allocation of certain transfer agency costs and certain voting rights. Income, expenses (other than expenses attributable to a specific class), and realized and unrealized gains or losses on investments are allocated to each class of shares based on its relative net assets.
The Company accounts separately for the assets, liabilities and operations of each series. Expenses directly attributable to each series are charged to that series’ operations; expenses which are applicable to all series are allocated among them on a pro rata basis.
The Financial Accounting Standards Board (“FASB”) Accounting Standards Codification (“ASC”) has become the exclusive reference of authoritative U.S. generally accepted accounting principles (“GAAP”) recognized by the FASB to be applied by nongovernmental entities. Rules and interpretive releases of the Securities and Exchange
The Fund 35
NOTES TO FINANCIAL STATEMENTS (continued)
Commission (“SEC”) under authority of federal laws are also sources of authoritative GAAP for SEC registrants. The ASC has superseded all existing non-SEC accounting and reporting standards. The fund’s financial statements are prepared in accordance with GAAP, which may require the use of management estimates and assumptions.Actual results could differ from those estimates.
The Company enters into contracts that contain a variety of indemnifications. The fund’s maximum exposure under these arrangements is unknown.The fund does not anticipate recognizing any loss related to these arrangements.
(a) Portfolio valuation: Investments in securities, excluding short-term investments (other than U.S. Treasury Bills), financial futures, options, swap transactions and forward foreign currency exchange contracts (“forward contracts”) are valued each business day by an independent pricing service (the “Service”) approved by the Board of Trustees. Investments for which quoted bid prices are readily available and are representative of the bid side of the market in the judgment of the Service are valued at the mean between the quoted bid prices (as obtained by the Service from dealers in such securities) and asked prices (as calculated by the Service based upon its evaluation of the market for such securities). Other investments (which constitute a majority of the portfolio’s securities) are valued as determined by the Service, ba sed on methods which include consideration of: yields or prices of securities of comparable quality, coupon, maturity and type; indications as to values from dealers;and general market conditions.Restricted securities,as well as securities or other assets for which recent market quotations are not readily available, that are not valued by a pricing service approved by the Board of Trustees, or determined by the fund not to reflect accurately fair value, are valued at fair value as determined in good faith under the direction of the Board of Trustees.The factors that may be considered when fair valuing a security include fundamental analytical data, the nature and duration of restrictions on disposition, an evaluation of the
36
forces that influence the market in which the securities are purchased and sold, and public trading in similar securities of the issuer or comparable issuers. Short-term investments, excluding U.S.Treasury Bills, are carried at amortized cost, which approximates value. Registered investment companies that are not traded on an exchange are valued at their net asset value. Financial futures and options, which are traded on an exchange, are valued at the last sales price on the securities exchange on which such securities are primarily traded or at the last sales price on the national securities market on each business day. Options traded over-the-counter are valued at the mean between the bid and asked price. Investments in swap transactions are valued each business day by an independent pricing service approved by the Board of Trustees. Swaps are valued by the service by using a swap pricing model which incorporates among other factors, default probabilities, recovery rates, credit curves of the underlying issuers and swap spreads on interest rates. Investments denominated in foreign currencies are translated to U.S. dollars at the prevailing rates of exchange. Forward contracts are valued at the forward rate.
The fair value of a financial instrument is the amount that would be received to sell an asset or paid to transfer a liability in an orderly transaction between market participants at the measurement date (i.e. the exit price). GAAP establishes a fair value hierarchy that prioritizes the inputs of valuation techniques used to measure fair value.This hierarchy gives the highest priority to unadjusted quoted prices in active markets for identical assets or liabilities (Level 1 measurements) and the lowest priority to unobservable inputs (Level 3 measurements).
Additionally, GAAP provides guidance on determining whether the volume and activity in a market has decreased significantly and whether such a decrease in activity results in transactions that are not orderly. GAAP requires enhanced disclosures around valuation inputs and techniques used during annual and interim periods.
The Fund 37
NOTES TO FINANCIAL STATEMENTS (continued)
Various inputs are used in determining the value of the fund’s investments relating to fair value measurements.These inputs are summarized in the three broad levels listed below:
Level 1—unadjusted quoted prices in active markets for
identical investments.
Level 2—other significant observable inputs (including quoted
prices for similar investments, interest rates, prepayment speeds,
credit risk, etc.).
Level 3—significant unobservable inputs (including the fund’s own
assumptions in determining the fair value of investments).
The inputs or methodology used for valuing securities are not necessarily an indication of the risk associated with investing in those securities.
The following is a summary of the inputs used as of December 31, 2009 in valuing the fund’s investments:
| | | | | | | |
| | | | Level 2—Other | | Level 3— | | |
| | Level 1— | | Significant | | Significant | | |
| | Unadjusted | | Observable | | Unobservable | | |
| | Quoted Prices | | Inputs | | Inputs | Total | |
| Assets ($) | | | | | | | |
| Investments in Securities: | | | | | | |
| U.S. Treasury | — | | 23,921,337 | | — | 23,921,337 | |
| Asset—Backed | — | | 7,480,421 | | — | 7,480,421 | |
| Corporate Bonds | — | | 60,904,814 | | — | 60,904,814 | |
| Foreign Government | — | | 1,841,366 | | — | 1,841,366 | |
| Municipal Bonds | — | | 2,910,400 | | — | 2,910,400 | |
| U.S. Government Agencies/ | | | | | | |
| Mortgage—Backed | — | | 51,558,119 | | — | 51,558,119 | |
| Residential | | | | | | | |
| Mortgage-Backed | — | | 474,722 | | — | 474,722 | |
| Commercial | | | | | | | |
| Mortgage-Backed | — | | 12,483,568 | | — | 12,483,568 | |
| Mutual Funds | 4,094,696 | | — | | — | 4,094,696 | |
| Other Financial | | | | | | | |
| Instruments† | 395,656 | | 34,183 | | — | 429,839 | |
| Liabilities ($) | | | | | | | |
| Other Financial | | | | | | | |
| Instruments† | (208,834 | ) | (1,923,122 | ) | — | (2,131,956 | ) |
|
| † Other financial instruments include derivative instruments, such as futures, forward foreign currency |
| exchange contracts, swap contracts and options contracts. Amounts shown represent unrealized |
| appreciation (depreciation), or in the case of options, market value at period end. |
38
(b) Foreign currency transactions: The fund does not isolate that portion of the results of operations resulting from changes in foreign exchange rates on investments from the fluctuations arising from changes in the market prices of securities held. Such fluctuations are included with the net realized and unrealized gain or loss on investments.
Net realized foreign exchange gains or losses arise from sales of foreign currencies,currency gains or losses realized on securities transactions and the difference between the amounts of dividends, interest and foreign withholding taxes recorded on the fund’s books and the U.S. dollar equivalent of the amounts actually received or paid. Net unrealized foreign exchange gains and losses arise from changes in the value of assets and liabilities other than investments resulting from changes in exchange rates. Foreign currency gains and losses on investments are included with net realized and unrealized gain or loss on investments.
(c) Securities transactions and investment income: Securities transactions are recorded on a trade date basis. Realized gains and losses from securities transactions are recorded on the identified cost basis. Dividend income is recognized on the ex-dividend date and interest income, including, where applicable, accretion of discount and amortization of premium on investments, is recognized on the accrual basis.
The fund has arrangements with the custodian and cash management bank whereby the fund may receive earnings credits when positive cash balances are maintained, which are used to offset custody and cash management fees. For financial reporting purposes, the fund includes net earnings credits as an expense offset in the Statement of Operations.
Pursuant to a securities lending agreement with The Bank of New York Mellon, a subsidiary of BNY Mellon and an affiliate of Dreyfus, the fund may lend securities to qualified institutions. It is the fund’s policy that, at origination, all loans are secured by collateral of at least 102% of the value of U.S. securities loaned and 105% of the value of foreign securities loaned. Collateral equivalent to at least 100% of the market value of securities on loan is maintained at all times. Collateral is either in the form of cash, which can be invested in certain money
The Fund 39
NOTES TO FINANCIAL STATEMENTS (continued)
market mutual funds managed by the Manager, U.S. Government and Agency securities or letters of credit.The fund is entitled to receive all income on securities loaned, in addition to income earned as a result of the lending transaction. Although each security loaned is fully collateralized, the fund bears the risk of delay in recovery of, or loss of rights in, the securities loaned should a borrower fail to return the securities in a timely manner. During the period ended December 31, 2009, The Bank of New York Mellon earned $16,625 from lending fund portfolio securities, pursuant to the securities lending agreement.
(d) Affiliated issuers: Investments in other investment companies advised by the Manager are defined as “affiliated” in the Act.
(e) Dividends to shareholders: Dividends are recorded on the ex-dividend date. Dividends from investment income-net and dividends from net realized capital gains, if any, are normally declared and paid annually, but the fund may make distributions on a more frequent basis to comply with the distribution requirements of the Internal Revenue Code of 1986, as amended (the “Code”).To the extent that net realized capital gains can be offset by capital loss carryovers, it is the policy of the fund not to distribute such gains. Income and capital gain distributions are determined in accordance with income tax regulations, which may differ from GAAP.
On December 31, 2009, the Board of Trustees declared a cash dividend of $.041 and $.038 per share for the Initial shares and Service shares, respectively, from undistributed investment income-net payable on January 4, 2010 (ex-dividend date) to shareholders of record as of the close of business on December 31, 2009.
(f) Federal income taxes: It is the policy of the fund to continue to qualify as a regulated investment company, if such qualification is in the best interests of its shareholders, by complying with the applicable provisions of the Code, and to make distributions of taxable income sufficient to relieve it from substantially all federal income and excise taxes.
As of and during the period ended December 31, 2009, the fund did not have any liabilities for any uncertain tax positions.The fund rec-
40
ognizes interest and penalties, if any, related to uncertain tax positions as income tax expense in the Statement of Operations. During the period, the fund did not incur any interest or penalties.
Each of the tax years in the four-year period ended December 31, 2009 remains subject to examination by the Internal Revenue Service and state taxing authorities.
At December 31, 2009, the components of accumulated earnings on a tax basis were as follows: undistributed ordinary income $2,242,525, accumulated capital losses $15,060,529 and unrealized appreciation $2,620,734.
The accumulated capital loss carryover is available for federal income tax purposes to be applied against future net securities profits, if any, realized subsequent to December 31, 2009. If not applied, $3,171,594 of the carryover expires in fiscal 2012, $61,980 expires in fiscal 2013, $1,624,385 expires in fiscal 2014, $1,707,613 expires in fiscal 2015, $4,529,381 expires in fiscal 2016 and $3,965,576 expires in fiscal 2017.
The tax character of distributions paid to shareholders during the fiscal periods ended December 31, 2009 and December 31, 2008 were as follows: ordinary income $6,226,197 and $7,791,618, respectively.
During the period ended December 31, 2009, as a result of permanent book to tax differences, primarily due to the tax treatment for amortization of premiums, paydown gains (losses), swap periodic payments and foreign currency transactions, the fund decreased accumulated undistributed investment income-net by $243,685 and increased accumulated net realized gain (loss) on investments by the same amount. Net assets and net asset value per share were not affected by this reclassification.
NOTE 2—Bank Lines of Credit:
The fund participates with other Dreyfus-managed funds in a $225 million unsecured credit facility led by Citibank, N.A. and a $300 million unsecured credit facility provided by The Bank of New York Mellon (each, a “Facility”), each to be utilized primarily for temporary or emer-
The Fund 41
NOTES TO FINANCIAL STATEMENTS (continued)
gency purposes, including the financing of redemptions. In connection therewith, the fund has agreed to pay its pro rata portion of commitment fees for each Facility. Interest is charged to the fund based on rates determined pursuant to the terms of the respective Facility at the time of borrowing. During the period ended December 31, 2009, the fund did not borrow under the Facilities.
NOTE 3—Investment Advisory Fee and Other Transactions With Affiliates:
(a) Pursuant to an investment advisory agreement with the Manager, the investment advisory fee is computed at the annual rate of .65% of the value of the fund’s average daily net assets and is payable monthly.
(b) Under the Distribution Plan (the “Plan”) adopted pursuant to Rule 12b-1 under the Act, Service shares pay the Distributor for distributing their shares, for servicing and/or maintaining Service shares’ shareholder accounts and for advertising and marketing for Service shares. The Plan provides for payments to be made at an annual rate of .25% of the value of the Service shares’ average daily net assets. The Distributor may make payments to participating insurance companies and to brokers and dealers acting as principal underwriter for their variable insurance products. The fees payable under the Plan are payable without regard to actual expenses incurred. During the period ended December 31, 2009, Service shares were charged $78,539 pursuant to the Plan.
The fund compensates Dreyfus Transfer, Inc., a wholly-owned subsidiary of the Manager under a transfer agency agreement for providing personnel and facilities to perform transfer agency services for the fund. During the period ended December 31, 2009, the fund was charged $507 pursuant to the transfer agency agreement, which is included in Shareholder servicing costs in the Statement of Operations.
The fund compensates The Bank of New York Mellon under a cash management agreement for performing cash management services related to fund subscriptions and redemptions. During the period
42
ended December 31, 2009, the fund was charged $84 pursuant to the cash management agreement, which is included in Shareholder servicing costs in the Statement of Operations. These fees were offset by earnings credits pursuant to the cash management agreement.
The fund also compensates The Bank of New York Mellon under a custody agreement for providing custodial services for the fund. During the period ended December 31, 2009, the fund was charged $1,943 pursuant to the custody agreement.
During the period ended December 31, 2009, the fund was charged $6,681 for services performed by the Chief Compliance Officer.
The components of “Due to The Dreyfus Corporation and affiliates” in the Statement of Assets and Liabilities consist of: investment advisory fees $75,837, Rule 12b-1 distribution plan fees $6,623, custodian fees $6,479, chief compliance officer fees $5,011 and transfer agency per account fees $86.
(c) Each Board member also serves as a Board member of other funds within the Dreyfus complex. Annual retainer fees and attendance fees are allocated to each fund based on net assets.
NOTE 4—Securities Transactions:
The aggregate amount of purchases and sales (including paydowns) of investment securities, excluding short-term securities, financial futures, forward contracts, options transactions and swap transactions, during the period ended December 31, 2009, amounted to $447,423,968 and $463,968,710, respectively, of which $290,855,448 in purchases and $291,849,589 in sales were from mortgage dollar roll transactions.
The fund adopted the provisions of ASC Topic 815 “Derivatives and Hedging” which requires qualitative disclosures about objectives and strategies for using derivatives, quantitative disclosures about fair value amounts of gains and losses on derivative instruments and disclosures about credit-risk-related contingent features in derivative agreements. The disclosure requirements distinguish between derivatives, which are
The Fund 43
NOTES TO FINANCIAL STATEMENTS (continued)
accounted for as “hedges” and those that do not qualify for hedge accounting. Because investment companies value their derivatives at fair value and recognize changes in fair value through the Statement of Operations, they do not qualify for such accounting.Accordingly, even though a fund’s investments in derivatives may represent economic hedges, they are considered to be non-hedge transactions for purposes of this disclosure.The following tables show the fund’s exposure to different types of market risk as it relates to the Statement of Assets and Liabilities and the Statement of Operations, respectively.
Fair value of derivative instruments as of December 31, 2009 is shown below:
| | | | |
| | Derivative | | Derivative | |
| | Assets ($) | | Liabilities ($) | |
| Interest rate risk1 | 395,656 | Interest rate risk1,2 | (2,085,498 | ) |
| Foreign exchange risk3 | 34,183 | Foreign exchange risk4 | (46,458 | ) |
| Gross fair value of | | | | |
| derivatives contracts | 429,839 | | (2,131,956 | ) |
| |
| Statement of Assets and Liabilities location: |
| 1 | Includes cumulative appreciation (depreciation) on futures contracts as reported in the Statement of |
| | Financial Futures, but only the unpaid variation margin is reported in the Statement of Assets |
| | and Liabilities. |
| 2 | Outstanding options written, at value. |
| 3 | Unrealized appreciation on forward foreign currency exchange contracts. |
| 4 | Unrealized depreciation on forward foreign currency exchange contracts. |
The effect of derivative instruments in the Statement of Operations during the period ended December 31, 2009 is shown below:
| | | | | | |
| | Amount of realized gain or (loss) on derivatives recognized in income ($) |
| | | | | Forward | | |
| Underlying risk | Futures5 | | Options6 | Contracts7 | Swaps8 | Total |
| Interest rate | (6,566 | ) | 663,263 | — | — | 656,697 |
| Foreign exchange | — | | — | 286,482 | — | 286,482 |
| Credit | — | | — | — | 71,268 | 71,268 |
| Total | (6,566 | ) | 663,263 | 286,482 | 71,268 | 1,014,447 |
44
| | | | | | | | |
| Change in unrealized appreciation or (depreciation) on derivatives recognized in income ($)9 | |
| | | | | Forward | | | | |
| Underlying risk | Futures | | Options | Contracts | Swaps | | Total | |
| Interest rate | (207,225 | ) | 53,351 | — | — | | (153,874 | ) |
| Foreign exchange | — | | — | 111,674 | — | | 111,674 | |
| Credit | — | | — | — | (75,672 | ) | (75,672 | ) |
| Total | (207,225 | ) | 53,351 | 111,674 | (75,672 | ) | (117,872 | ) |
| |
| Statement of Operations location: |
| 5 | Net realized gain (loss) on financial futures. |
| 6 | Net realized gain (loss) on options transactions. |
| 7 | Net realized gain (loss) on forward foreign currency exchange contracts. |
| 8 | Net realized gain (loss) on swap transactions. |
| 9 | Net unrealized appreciation (depreciation) on investments, financial futures, options transactions, |
| | forward foreign currency exchange contracts and swap transactions. |
During the period ended December 31, 2009, the average market value of interest rate futures contracts was $25,759,192, which represented 19.5% of average net assets. The average market value of interest rate option contracts was $607,594, which represented 0.5% of average net assets. The average market value of forward contracts was $4,103,834, which represented 3.1% of average net assets.The average notional value of credit default swap contracts was $150,769, which represented 0.1% of average net assets.
Mortgage Dollar Rolls: A mortgage dollar roll transaction involves a sale by the fund of mortgage related securities that it holds with an agreement by the fund to repurchase similar securities at an agreed upon price and date.The securities purchased will bear the same interest rate as those sold, but generally will be collateralized by pools of mortgages with different prepayment histories than those securities sold.
Futures Contracts: In the normal course of pursuing its investment objectives, the fund is exposed to market risk, including interest rate risk as a result of changes in value of underlying financial instruments. The fund may invest in financial futures contracts in order to manage
The Fund 45
NOTES TO FINANCIAL STATEMENTS (continued)
its exposure to or protect against changes in the market.A futures contract represents a commitment for the future purchase or a sale of an asset at a specified date. Upon entering into such contracts, these investments require initial margin deposits with a broker, which consist of cash or cash equivalents.The amount of these deposits is determined by the exchange or Board of Trade on which the contract is traded and is subject to change.Accordingly, variation margin payments are received or made to reflect daily unrealized gains or losses which are recorded in the Statement of Operations. Futures contracts are valued daily at the last sales price established by the Board of Trade or exchange upon which they are traded.When the contracts are closed, the fund recognizes a realized gain or loss.There is minimal counterparty credit risk to the fund with futures, since futures are exchange traded and the exchange’s clearingho use, as counterparty to all exchange traded futures, guarantees the futures against default. Contracts open at December 31, 2009 are set forth in the Statement of Financial Futures.
Options: A call option gives the purchaser of the option the right (but not the obligation) to buy, and obligates the writer to sell, the underlying security or securities at the exercise price at any time during the option period, or at a specified date. Conversely, a put option gives the purchaser of the option the right (but not the obligation) to sell, and obligates the writer to buy the underlying security or securities at the exercise price at any time during the option period, or at a specified date.The fund may purchase and write (sell) put and call options primarily to hedge against changes in security prices, or securities that the fund intends to purchase, or against fluctuations in value caused by changes in prevailing market interest rates or other market conditions.
As a writer of call options, the fund receives a premium at the outset and then bears the market risk of unfavorable changes in the price of the financial instrument underlying the option. Generally, the fund would realize a gain, to the extent of the premium, if the price of the underlying financial instrument decreases between the date the option is written and the date on which the option is terminated. Generally, the fund would incur a loss, if the price of the financial instrument increases between those dates.
46
As a writer of put options, the fund receives a premium at the outset and then bears the market risk of unfavorable changes in the price of the financial instrument underlying the option. Generally, the fund would realize a gain, to the extent of the premium, if the price of the underlying financial instrument increases between the date the option is written and the date on which the option is terminated. Generally, the fund would incur a loss, if the price of the financial instrument decreases between those dates.As a writer of an option, the fund may have no control over whether the underlying securities may be sold (call) or purchased (put) and as a result bears the market risk of an unfavorable change in the price of the security underlying the written option. One risk of holding a put or a call option is that if the option is not sold or exercised prior to its expiration, it becomes worthless. However, this risk is limited to the premium paid by the fund. Upon the expiration or closing of the option transaction, a gain or loss is reported in the Statement of Operations.
The following summarizes the fund’s call/put options written for the period ended December 31, 2009:
| | | | | |
| | Face Amount | | Options Terminated | |
| | Covered by | Premiums | | Net Realized | |
| Options Written: | Contracts ($) | Received ($) | Cost ($) Gain (Loss) ($) | |
| Contracts outstanding | | | | | |
| December 31, 2008 | 6,600,000 | 95,447 | | | |
| Contracts written | 231,704,000 | 3,694,716 | | | |
| Contracts terminated: | | | | | |
| Contracts closed | 111,554,000 | 1,059,726 | 1,155,981 | (96,255 | ) |
| Contracts expired | 90,746,000 | 808,819 | — | 808,819 | |
| Total contracts | | | | | |
| terminated | 202,300,000 | 1,868,545 | 1,155,981 | 712,564 | |
| Contracts Outstanding | | | | | |
| December 31, 2009 | 36,004,000 | 1,921,618 | | | |
Forward Foreign Currency Exchange Contracts: The fund may enter into forward contracts in order to hedge its exposure to changes in foreign currency exchange rates on its foreign fund holdings, to settle foreign currency transactions or as a part of an investment strategy. When executing forward contracts, the fund is obligated to buy or sell
The Fund 47
NOTES TO FINANCIAL STATEMENTS (continued)
a foreign currency at a specified rate on a certain date in the future. With respect to sales of forward contracts, the fund would incur a loss if the value of the contract increases between the date the forward contract is opened and the date the forward contract is closed. The fund realizes a gain if the value of the contract decreases between those dates.With respect to purchases of forward contracts, the fund would incur a loss if the value of the contract decreases between the date the forward contract is opened and the date the forward contract is closed. The fund realizes a gain if the value of the contract increases between those dates.The fund is exposed to foreign currency risk as a result of changes in value of underlying financial instruments.The fund is also exposed to credit risk associated with counterparty nonperformance on these forward contracts, which is typically limited to the unrealized gain on each open c ontract.The following summarizes open forward contracts at December 31, 2009:
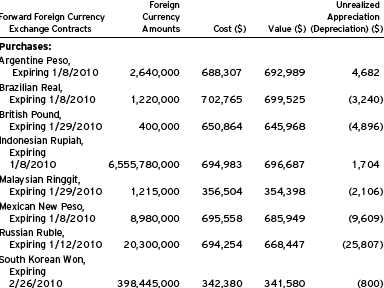
48

Swaps:The fund may enter into swap agreements to exchange the interest rate on, or return generated by, one nominal instrument for the return generated by another nominal instrument. The fund enters into these agreements for a variety of reasons, including to hedge certain market or interest rate risks, to manage the interest rate sensitivity (sometimes called duration) of fixed income securities, to provide a substitute for purchasing or selling particular securities or to increase potential returns.
The fund accrues for the interim payments on swap contracts on a daily basis, with the net amount recorded within unrealized appreciation (depreciation) on swap contracts in the Statement of Assets and Liabilities. Once the interim payments are settled in cash, the net amount is recorded as realized gain (loss) on swaps, in addition to realized gain (loss) recorded upon the termination of swap contracts in the Statement of Operations. Upfront payments made and/or received by the fund, are recorded as an asset and/or liability in the Statement of Assets and Liabilities and are recorded as a realized gain or loss ratably over the contract’s term/event with the exception of forward starting interest rate swaps which are recorded as realized gains or losses on the termination date. Fluctuations in the value of swap contracts are recorded for financial statement purposes as unrealized appreciation or depreciation on swap transa ctions.
The Fund 49
NOTES TO FINANCIAL STATEMENTS (continued)
Credit Default Swaps: Credit default swaps involve commitments to pay a fixed interest rate in exchange for payment if a credit event affecting a third party (the referenced company, obligation or index) occurs. Credit events may include a failure to pay interest or principal, bankruptcy, or restructuring.The fund enters into these agreements to manage its exposure to the market or certain sectors of the market, to reduce its risk exposure to defaults of corporate and sovereign issuers, or to create exposure to corporate or sovereign issuers to which it is not otherwise exposed. For those credit default swaps in which the fund is paying a fixed rate, the fund is buying credit protection on the instrument. In the event of a credit event, the fund would receive the full notional amount for the reference obligation. For those credit default swaps in which the fund is receiving a fixed rate, the fund is selling credit protection on the underlying instrument.The maximum payouts for these contracts are limited to the notional amount of each swap. Credit default swaps may involve greater risks than if the fund had invested in the reference obligation directly and are subject to general market risk, liquidity risk, counterparty risk and credit risk.At December 31, 2009, the fund held no open credit default swaps.
At December 31, 2009, the cost of investments for federal income tax purposes was $163,097,945; accordingly, accumulated net unrealized appreciation on investments was $2,571,498, consisting of $5,565,196 gross unrealized appreciation and $2,993,698 gross unrealized depreciation.
NOTE 5—Subsequent Events Evaluation:
Dreyfus has evaluated the need for disclosures and/or adjustments resulting from subsequent events through February 10, 2010, the date the financial statements were issued. This evaluation did not result in any subsequent events that necessitated disclosures and/or adjustments.
50
|
| REPORT OF INDEPENDENT REGISTERED |
| PUBLIC ACCOUNTING FIRM |
|
| Shareholders and Board of Trustees |
| Dreyfus Variable Investment Fund, Quality Bond Portfolio |
We have audited the accompanying statement of assets and liabilities, including the statements of investments, financial futures and options written, of Dreyfus Variable Investment Fund, Quality Bond Portfolio (one of the series comprising Dreyfus Variable Investment Fund) as of December 31, 2009, and the related statement of operations for the year then ended, the statement of changes in net assets for each of the two years in the period then ended and financial highlights for each of the years indicated therein. These financial statements and financial highlights are the responsibility of the Fund’s management. Our responsibility is to express an opinion on these financial statements and financial highlights based on our audits.
We conducted our audits in accordance with the standards of the Public Company Accounting Oversight Board (United States).Those standards require that we plan and perform the audit to obtain reasonable assurance about whether the financial statements and financial highlights are free of material misstatement.We were not engaged to perform an audit of the Fund’s internal control over financial reporting. Our audits included consideration of internal control over financial reporting as a basis for designing audit procedures that are appropriate in the circumstances, but not for the purpose of expressing an opinion on the effectiveness of the Fund’s internal control over financial reporting. Accordingly, we express no such opinion.An audit also includes examining, on a test basis, evidence supporting the amounts and disclosures in the financial statements and financial highlights, assessing the accounting principles used and significant estimates made by management, and evaluating the overall financial statement presentation. Our procedures included confirmation of securities owned as of December 31, 2009 by correspondence with the custodian and others. We believe that our audits provide a reasonable basis for our opinion.
In our opinion, the financial statements and financial highlights referred to above present fairly, in all material respects, the financial position of DreyfusVariable Investment Fund, Quality Bond Portfolio at December 31,2009,the results of its operations for the year then ended,the changes in its net assets for each of the two years in the period then ended and the financial highlights for each of the indicated years, in conformity with U.S. generally accepted accounting principles.

|
| New York, New York |
| February 10, 2010 |
The Fund 51
BOARD MEMBERS INFORMATION (Unaudited)
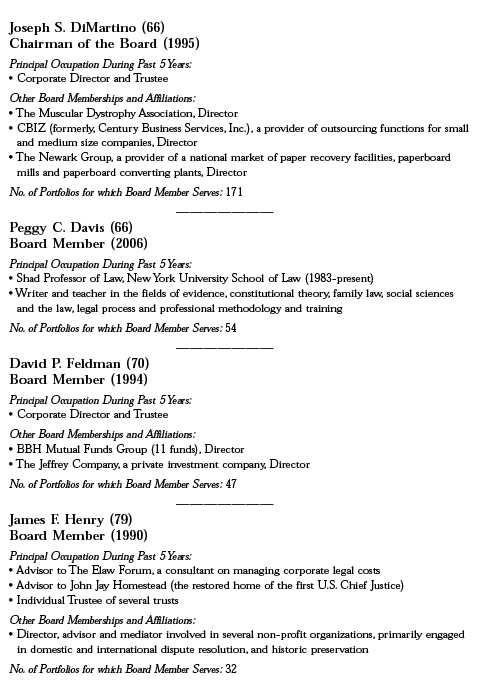
52
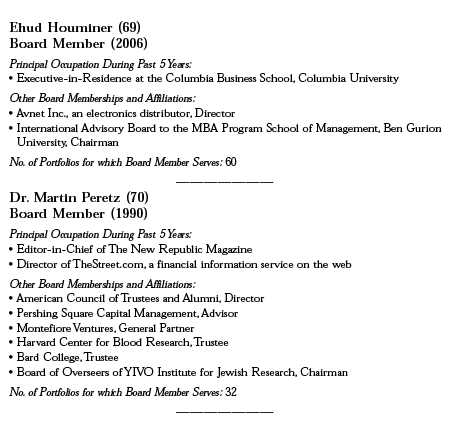
Once elected all Board Members serve for an indefinite term, but achieve Emeritus status upon reaching age 80.The address of the Board Members and Officers is in c/o The Dreyfus Corporation, 200 Park Avenue, NewYork, NewYork 10166.Additional information about the Board Members is available in the fund’s Statement of Additional Information which can be obtained from Dreyfus free of charge by calling this toll free number: 1-800-554-4611.
John M. Fraser, Jr., Emeritus Board Member
Rosalind G. Jacobs, Emeritus Board Member
Dr. Paul A. Marks, Emeritus Board Member
Gloria Messinger, Emeritus Board Member
The Fund 53
OFFICERS OF THE FUND (Unaudited)

54
The Fund 55
OFFICERS OF THE FUND (Unaudited) (continued)
56
For More Information
Telephone 1-800-554-4611 or 516-338-3300
Mail The Dreyfus Family of Funds, 144 Glenn Curtiss Boulevard, Uniondale, NY 11556-0144 Attn: Investments Division
The fund files its complete schedule of portfolio holdings with the Securities and Exchange Commission (“SEC”) for the first and third quarters of each fiscal year on Form N-Q. The fund’s Forms N-Q are available on the SEC’s website at http://www.sec.gov and may be reviewed and copied at the SEC’s Public Reference Room in Washington, DC. Information on the operation of the Public Reference Room may be obtained by calling 1-800-SEC-0330.
A description of the policies and procedures that the fund uses to determine how to vote proxies relating to portfolio securities, and information regarding how the fund voted these proxies for the most recent 12-month period ended June 30 is available at http://www.dreyfus.com and on the SEC’s website at http://www.sec.gov. The description of the policies and procedures is also available without charge, upon request, by calling 1-800-645-6561.

Item 2. Code of Ethics.
The Registrant has adopted a code of ethics that applies to the Registrant's principal executive officer, principal financial officer, principal accounting officer or controller, or persons performing similar functions. There have been no amendments to, or waivers in connection with, the Code of Ethics during the period covered by this Report.
Item 3. Audit Committee Financial Expert.
The Registrant's Board has determined that David P. Feldman, a member of the Audit Committee of the Board, is an audit committee financial expert as defined by the Securities and Exchange Commission (the "SEC"). David P. Feldman is "independent" as defined by the SEC for purposes of audit committee financial expert determinations.
Item 4. Principal Accountant Fees and Services.
(a) Audit Fees. The aggregate fees billed for each of the last two fiscal years (the "Reporting Periods") for professional services rendered by the Registrant's principal accountant (the "Auditor") for the audit of the Registrant's annual financial statements or services that are normally provided by the Auditor in connection with the statutory and regulatory filings or engagements for the Reporting Periods, were $153,153 in 2008 and $156,212 in 2009.
(b) Audit-Related Fees. The aggregate fees billed in the Reporting Periods for assurance and related services by the Auditor that are reasonably related to the performance of the audit of the Registrant's financial statements and are not reported under paragraph (a) of this Item 4 were $106,582 in 2008 and $71,066 in 2009. This services consisted of (i) agreed upon procedures related to compliance with Internal Revenue Code section 817(h), and (ii) security counts required by Rule 17f-2 under the Investment Company Act of 1940, as amended.
The aggregate fees billed in the Reporting Periods for non-audit assurance and related services by the Auditor to the Registrant's investment adviser (not including any sub-investment adviser whose role is primarily portfolio management and is subcontracted with or overseen by another investment adviser), and any entity controlling, controlled by or under common control with the investment adviser that provides ongoing services to the Registrant ("Service Affiliates"), that were reasonably related to the performance of the annual audit of the Service Affiliate, which required pre-approval by the Audit Committee were $-0- in 2008 and $ -0- in 2009.
(c) Tax Fees. The aggregate fees billed in the Reporting Periods for professional services rendered by the Auditor for tax compliance, tax advice, and tax planning ("Tax Services") were $23,778 in 2008 and $28,093 in 2009. These services consisted of: (i) review or preparation of U.S. federal, state, local and excise tax returns; (ii) U.S. federal, state and local tax planning, advice and assistance regarding statutory, regulatory or administrative developments; (iii) tax advice regarding tax qualification matters and/or treatment of various financial instruments held or proposed to be acquired or held, and (iv) determination of Passive Foreign Investment Companies.
The aggregate fees billed in the Reporting Periods for Tax Services by the Auditor to Service Affiliates, which required pre-approval by the Audit Committee were $ -0- in 2008 and $-0- in 2009.
(d) All Other Fees. The aggregate fees billed in the Reporting Periods for products and services provided by the Auditor, other than the services reported in paragraphs (a) through (c) of this Item, were $794 in 2008 and $348 in 2009. These services consisted of a review of the Registrant's anti-money laundering program.
The aggregate fees billed in the Reporting Periods for Non-Audit Services by the Auditor to Service Affiliates, other than the services reported in paragraphs (b) through (c) of this Item, which required pre-approval by the Audit Committee, were $-0- in 2008 and $-0- in 2009.
Note: None of the services described in paragraphs (b) though (d) of this Item 4 were approved by the Audit Committee pursuant to paragraph (c)(7)(i)(C) of Rule 2-01 of Regulation S-X.
Audit Committee Pre-Approval Policies and Procedures. The Registrant's Audit Committee has established policies and procedures (the "Policy") for pre-approval (within specified fee limits) of the Auditor's engagements for non-audit services to the Registrant and Service Affiliates without specific case-by-case consideration. Pre-approval considerations include whether the proposed services are compatible with maintaining the Auditor's independence. Pre-approvals pursuant to the Policy are considered annually.
Non-Audit Fees. The aggregate non-audit fees billed by the Auditor for services rendered to the Registrant, and rendered to Service Affiliates, for the Reporting Periods were $12,561,320 in 2008 and $24,975,296 in 2009.
Auditor Independence. The Registrant's Audit Committee has considered whether the provision of non-audit services that were rendered to Service Affiliates, which were not pre-approved (not requiring pre-approval), is compatible with maintaining the Auditor's independence.
| |
| Item 5. | Audit Committee of Listed Registrants. |
| | Not applicable. [CLOSED-END FUNDS ONLY] |
| Item 6. | Investments. |
| (a) | Not applicable. |
| Item 7. | Disclosure of Proxy Voting Policies and Procedures for Closed-End Management |
| | Investment Companies. |
| | Not applicable. [CLOSED-END FUNDS ONLY] |
| Item 8. | Portfolio Managers of Closed-End Management Investment Companies. |
| | Not applicable. [CLOSED-END FUNDS ONLY, beginning with reports for periods ended |
| | on and after December 31, 2005] |
| Item 9. | Purchases of Equity Securities by Closed-End Management Investment Companies and |
| | Affiliated Purchasers. |
| | Not applicable. [CLOSED-END FUNDS ONLY] |
| Item 10. | Submission of Matters to a Vote of Security Holders. |
| There have been no material changes to the procedures applicable to Item 10. |
| |
| Item 11. | Controls and Procedures. |
(a) The Registrant's principal executive and principal financial officers have concluded, based on their evaluation of the Registrant's disclosure controls and procedures as of a date within 90 days of the filing date of this report, that the Registrant's disclosure controls and procedures are reasonably designed to ensure that information required to be disclosed by the Registrant on Form N-CSR is recorded, processed, summarized and reported within the required time periods and that information required to be disclosed by the Registrant in the reports that it files or submits on Form N-CSR is accumulated and communicated to the Registrant's management, including its principal executive and principal financial officers, as appropriate to allow timely decisions regarding required disclosure.
(b) There were no changes to the Registrant's internal control over financial reporting that occurred during the second fiscal quarter of the period covered by this report that have materially affected, or are reasonably likely to materially affect, the Registrant's internal control over financial reporting.
(a)(1) Code of ethics referred to in Item 2.
(a)(2) Certifications of principal executive and principal financial officers as required by Rule 30a-2(a) under the Investment Company Act of 1940.
(a)(3) Not applicable.
(b) Certification of principal executive and principal financial officers as required by Rule 30a-2(b) under the Investment Company Act of 1940.
SIGNATURES
Pursuant to the requirements of the Securities Exchange Act of 1934 and the Investment Company Act of 1940, the Registrant has duly caused this Report to be signed on its behalf by the undersigned, thereunto duly authorized.
Dreyfus Variable Investment Fund
| |
| By: | /s/ Bradley J. Skapyak |
| | Bradley J. Skapyak, |
| | President |
| |
| Date: | February 12, 2010 |
Pursuant to the requirements of the Securities Exchange Act of 1934 and the Investment Company Act of 1940, this Report has been signed below by the following persons on behalf of the Registrant and in the capacities and on the dates indicated.
| |
| By: | /s/ Bradley J. Skapyak |
| | Bradley J. Skapyak, |
| | President |
| |
| Date: | February 12, 2010 |
| |
| By: | /s/ James Windels |
| James Windels, |
| | Treasurer |
| |
| Date: | February 12, 2010 |
EXHIBIT INDEX
(a)(1) Code of ethics referred to in Item 2.
(a)(2) Certifications of principal executive and principal financial officers as required by Rule 30a-2(a) under the Investment Company Act of 1940. (EX-99.CERT)
(b) Certification of principal executive and principal financial officers as required by Rule 30a-2(b) under the Investment Company Act of 1940. (EX-99.906CERT)