UNITED STATES
SECURITIES AND EXCHANGE COMMISSION
Washington, D.C. 20549
FORM N-CSR
CERTIFIED SHAREHOLDER REPORT OF REGISTERED MANAGEMENT
INVESTMENT COMPANIES
Investment Company Act file number | 811- 5125 |
| |
| DREYFUS VARIABLE INVESTMENT FUND | |
| (Exact name of Registrant as specified in charter) | |
| | |
| c/o The Dreyfus Corporation 200 Park Avenue New York, New York 10166 | |
| (Address of principal executive offices) (Zip code) | |
| | |
| Janette E. Farragher, Esq. 200 Park Avenue New York, New York 10 166 | |
| (Name and address of agent for service) | |
|
Registrant's telephone number, including area code: | (212) 922-6000 |
| |
Date of fiscal year end: | 12/31 | |
Date of reporting period: | 12/31/2011 | |
| | | | | | | |
FORM N-CSR
Item 1. Reports to Stockholders.
|
| Dreyfus Variable |
| Investment Fund, |
| Appreciation Portfolio |

The views expressed in this report reflect those of the portfolio manager only through the end of the period covered and do not necessarily represent the views of Dreyfus or any other person in the Dreyfus organization. Any such views are subject to change at any time based upon market or other conditions and Dreyfus disclaims any responsibility to update such views.These views may not be relied on as investment advice and, because investment decisions for a Dreyfus fund are based on numerous factors, may not be relied on as an indication of trading intent on behalf of any Dreyfus fund.
|
| Not FDIC-Insured • Not Bank-Guaranteed • May Lose Value |
| | Contents |
| | THE FUND |
| 2 | A Letter from the Chairman and CEO |
| 3 | Discussion of Fund Performance |
| 6 | Fund Performance |
| 8 | Understanding Your Fund’s Expenses |
| 8 | Comparing Your Fund’s Expenses With Those of Other Funds |
| 9 | Statement of Investments |
| 12 | Statement of Assets and Liabilities |
| 13 | Statement of Operations |
| 14 | Statement of Changes in Net Assets |
| 16 | Financial Highlights |
| 18 | Notes to Financial Statements |
| 29 | Report of Independent Registered Public Accounting Firm |
| 30 | Important Tax Information |
| 31 | Board Members Information |
| 33 | Officers of the Fund |
| | FOR MORE INFORMATION |
| | Back Cover |
Dreyfus Variable Investment Fund,
Appreciation Portfolio
The Fund

A LETTER FROM THE CHAIRMAN AND CEO
Dear Shareholder:
We present to you this annual report for Dreyfus Variable Investment Fund, Appreciation Portfolio, covering the 12-month period from January 1, 2011, through December 31, 2011. For information about how the fund performed during the reporting period, as well as general market perspectives, we provide a Discussion of Fund Performance on the pages that follow.
The generally mild returns produced by the U.S. stock market in 2011 belie the pronounced volatility affecting equities over much of the year. Day-to-day market movements were often tumultuous, driven by macroeconomic developments ranging from catastrophic natural disasters in Japan to an unprecedented downgrade of long-term U.S. debt securities and the resurgence of a sovereign debt crisis in Europe. Still, U.S. corporations achieved record-setting profits, on average, even as market valuations dropped below historical norms.A fundamentals-based investment approach proved relatively ineffective in a market fueled mainly by emotion, causing most active portfolio managers to lag market averages.
We are hopeful that equity investors will adopt a more rational perspective in 2012. Our economic forecast calls for a mild acceleration of the U.S. recovery as the domestic banking system regains strength, credit conditions loosen and housing markets begin a long-awaited convalescence. Of course, we encourage you to talk with your financial adviser to help ensure that your investment objectives are properly aligned with your risk tolerance in pursuing potential market opportunities in 2012.
Thank you for your continued confidence and support.
2

DISCUSSION OF FUND PERFORMANCE
For the period of January 1, 2011, through December 31, 2011, as provided by Fayez Sarofim, Portfolio Manager of Fayez Sarofim & Co., Sub-InvestmentAdviser
Fund and Market Performance Overview
For the 12-month period ended December 31, 2011, DreyfusVariable Investment Fund, Appreciation Portfolio’s Initial shares produced a total return of 9.01%, and its Service shares produced a total return of 8.74%.1 In comparison, the total return of the fund’s benchmark, the Standard & Poor’s 500 Composite Stock Price Index (“S&P 500 Index”), was 2.09% for the same period.2
Macroeconomic disappointments throughout the world weighed on equity markets during much of 2011, but rallies in the first and fourth quarters enabled the S&P 500 Index to end the year in positive territory. The fund produced higher returns than its benchmark as risk-averse investors turned to the kinds of large, multinational companies that the fund favors.
The Fund’s Investment Approach
The fund seeks long-term capital growth consistent with the preservation of capital. Its secondary goal is current income. To pursue these goals, the fund normally invests at least 80% of its assets in common stocks. The fund focuses on blue-chip companies with total market capitalizations of more than $5 billion at the time of purchase, including multinational companies. These are established companies that have demonstrated sustained patterns of profitability, strong balance sheets, an expanding global presence and the potential to achieve predictable, above-average earnings growth.
In choosing stocks, the fund first identifies economic sectors it believes will expand over the next three to five years or longer. Using fundamental analysis, the fund then seeks companies within these sectors that have proven track records and dominant positions in their industries. The fund employs a “buy-and-hold” investment strategy, which generally has resulted in an annual portfolio turnover of below 15%.A low portfolio turnover rate helps reduce the fund’s trading costs and minimizes tax liability by limiting the distribution of capital gains.3
DISCUSSION OF FUND PERFORMANCE (continued)
Global Economic Developments Roiled Equity Markets
Improvements in U.S. economic data supported stock prices at the start of 2011, but political unrest in the Middle East and catastrophic natural and nuclear disasters in Japan soon interrupted the rally. Nonetheless, investors continued to look forward to better business conditions, and stocks rebounded from these unexpected shocks by the end of the first quarter.
Investors’ hopes for a more robust recovery were dashed in late April, when Greece appeared headed for default on its sovereign debt and the crisis spread to other European nations. In addition, U.S. economic data proved more disappointing than expected, and investors reacted cautiously to a contentious political debate regarding U.S. government spending and borrowing. Consequently, newly risk-averse investors moved away from more speculative investments and toward traditionally defensive industries and companies. Market declines were particularly severe in August and September, after a major credit-rating agency downgraded its assessment of long-term U.S. government debt. In contrast, the market rebounded from October through December when U.S. economic data improved and European policymakers made some progress in addressing the region’s problems.
Multinational Leaders Buoyed Fund Performance
In the turbulent market environment, skittish investors flocked to blue-chip companies with generous dividend yields, a presence in global markets and strong balance sheets.The fund particularly benefited from underweighted exposure to the financials sector, which helped it avoid weakness among banks affected by Europe’s debt crisis and a stricter U.S. regulatory environment. In the consumer staples sector, tobacco producer Philip Morris International encountered rising global demand, while Altria Group and Coca-Cola benefited from renewed investor interest in traditionally defensive companies with substantially positive cash flows. Industry giants Apple and International Business Machines fared well in the information technology sector. Other top performers included casual dining chain McDonald’s and large integrated energy companies Exxon Mobil and Chevron.
The materials sector fared less well during the reporting period, as metal producers Freeport-McMoRan Copper & Gold and Rio Tinto
4
suffered amid falling industrial commodity prices. The fund held no exposure to the utilities and telecommunications services sectors, which generally beat market averages despite growth characteristics that did not meet our investment criteria. Banking giant JPMorgan Chase & Co. was hurt by industry-wide concerns stemming from Europe’s debt crisis, and luxury goods purveyor Christian Dior suffered despite strong business fundamentals due to worries over the European financial crisis and potential contagion.
Investors Remain Focused on High-Quality Companies
We expect the global economic rebound to persist fitfully amid significant headwinds, leading us to conclude that investors are likely to continue to favor large, multinational companies with solid business fundamentals and strong income characteristics. Indeed, corporate earnings in 2011 generally remained robust despite the economic downturn, while equity valuations have become more attractive.When adjusting to the changing market environment, we identified a number of new opportunities among multinational companies with healthy balance sheets, ample cash reserves and a presence in growing markets, and we eliminated some older positions to make room for these opportunities.
January 17, 2012
| |
| | Equity funds are subject generally to market, market sector, market liquidity, issuer, and investment |
| | style risks, among other factors, to varying degrees, all of which are more fully described in the |
| | fund’s prospectus. |
| | Fund shares are only available as a funding vehicle under variable life insurance policies or variable |
| | annuity contracts issued by insurance companies. Individuals may not purchase shares of the fund |
| | directly.A variable annuity is an insurance contract issued by an insurance company that enables |
| | investors to accumulate assets on a tax-deferred basis for retirement or other long-term goals. |
| 1 | Total return includes reinvestment of dividends and any capital gains paid. Past performance is no |
| | guarantee of future results. Share price and investment return fluctuate such that upon redemption |
| | fund shares may be worth more or less than their original cost.The fund’s performance does not |
| | reflect the deduction of additional charges and expenses imposed in connection with investing in |
| | variable insurance contracts, which will reduce returns. |
| 2 | SOURCE: LIPPER INC. — Reflects monthly reinvestment of dividends and, where |
| | applicable, capital gain distributions.The Standard & Poor’s 500 Composite Stock Price Index is |
| | a widely accepted, unmanaged index of U.S. stock market performance. Investors cannot invest |
| | directly in an index. |
| 3 | Achieving tax efficiency is not a part of the fund’s investment objective, and there can be no |
| | guarantee that the fund will achieve any particular level of taxable distributions in future years. In |
| | periods when the manager has to sell significant amounts of securities (e.g., during periods of |
| | significant net redemptions or changes in index components) funds can be expected to be less tax |
| | efficient than during periods of more stable market conditions and asset flows. |
FUND PERFORMANCE
| | | | | | |
| Average Annual Total Returns as of 12/31/11 | | | |
| | 1Year | 5 Years | 10 Years |
| Initial shares | 9.01% | 3.06% | 4.13% |
| Service shares | 8.74% | 2.80% | 3.87% |
| Standard & Poor’s 500 | | | |
| Composite Stock Price Index | 2.09% | –0.25% | 2.92% |
|
| † Source: Lipper Inc. |
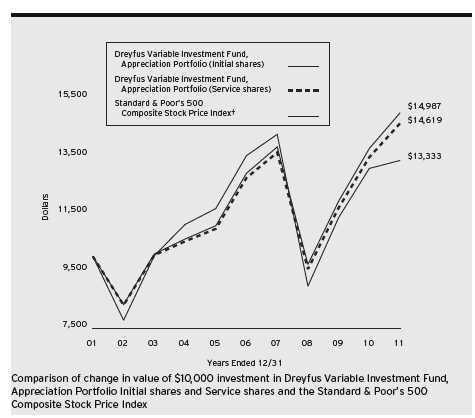
| Past performance is not predictive of future performance.The fund’s performance shown in the graph and table does not |
| reflect the deduction of taxes that a shareholder would pay on fund distributions or the redemption of fund shares. |
| The fund’s performance does not reflect the deduction of additional charges and expenses imposed in connection |
| with investing in variable insurance contracts which will reduce returns. |
| The above graph compares a $10,000 investment made in Initial and Service shares of Dreyfus Variable Investment |
| Fund,Appreciation Portfolio on 12/31/01 to a $10,000 investment made in the Standard & Poor’s 500 Composite |
| Stock Price Index (the “Index”) on that date. |
6
The fund’s Initial shares are not subject to a Rule 12b-1 fee.The fund’s Service shares are subject to a 0.25% annual Rule 12b-1 fee.All dividends and capital gain distributions are reinvested.
The fund’s performance shown in the line graph above takes into account all applicable fund fees and expenses.The Index is a widely accepted, unmanaged index of U.S. stock market performance. Unlike a mutual fund, the Index is not subject to charges, fees and other expenses. Investors cannot invest directly in any index. Further information relating to fund performance, including expense reimbursements, if applicable, is contained in the Financial Highlights section of the prospectus and elsewhere in this report.
UNDERSTANDING YOUR FUND’S EXPENSES (Unaudited)
As a mutual fund investor, you pay ongoing expenses, such as management fees and other expenses. Using the information below, you can estimate how these expenses affect your investment and compare them with the expenses of other funds.You also may pay one-time transaction expenses, including sales charges (loads), redemption fees and expenses associated with variable annuity or insurance contracts, which are not shown in this section and would have resulted in higher total expenses. For more information, see your fund’s prospectus or talk to your financial adviser.
Review your fund’s expenses
The table below shows the expenses you would have paid on a $1,000 investment in Dreyfus Variable Investment Fund,Appreciation Portfolio from July 1, 2011 to December 31, 2011. It also shows how much a $1,000 investment would be worth at the close of the period, assuming actual returns and expenses.
Expenses and Value of a $1,000 Investment
assuming actual returns for the six months ended December 31, 2011
| | | | |
| | | Initial Shares | | Service Shares |
| Expenses paid per $1,000† | | $4.06 | | $5.33 |
| Ending value (after expenses) | | $1,013.40 | | $1,012.10 |
COMPARING YOUR FUND’S EXPENSES
WITH THOSE OF OTHER FUNDS (Unaudited)
Using the SEC’s method to compare expenses
The Securities and Exchange Commission (SEC) has established guidelines to help investors assess fund expenses. Per these guidelines, the table below shows your fund’s expenses based on a $1,000 investment, assuming a hypothetical 5% annualized return. You can use this information to compare the ongoing expenses (but not transaction expenses or total cost) of investing in the fund with those of other funds.All mutual fund shareholder reports will provide this information to help you make this comparison. Please note that you cannot use this information to estimate your actual ending account balance and expenses paid during the period.
Expenses and Value of a $1,000 Investment
assuming a hypothetical 5% annualized return for the six months ended December 31, 2011
| | | | |
| | | Initial Shares | | Service Shares |
| Expenses paid per $1,000† | | $4.08 | | $5.35 |
| Ending value (after expenses) | | $1,021.17 | | $1,019.91 |
|
| † Expenses are equal to the fund’s annualized expense ratio of .80% for Initial Shares and 1.05% for Service Shares, |
| multiplied by the average account value over the period, multiplied by 184/365 (to reflect the one-half year period). |
8
|
| STATEMENT OF INVESTMENTS |
| December 31, 2011 |
| | | | |
| Common Stocks—98.1% | Shares | | | Value ($) |
| Consumer Discretionary—11.4% | | | | |
| Arcos Dorados Holdings, Cl. A | 110,000 | | | 2,258,300 |
| McDonald’s | 170,900 | | | 17,146,397 |
| McGraw-Hill | 107,100 | | | 4,816,287 |
| News, Cl. A | 308,136 | | | 5,497,146 |
| News, Cl. B | 7,700 | | | 139,986 |
| Target | 189,700 | | | 9,716,434 |
| Time Warner Cable | 45,000 | | | 2,860,650 |
| Wal-Mart Stores | 171,600 | | | 10,254,816 |
| Walt Disney | 120,000 | | | 4,500,000 |
| | | | | 57,190,016 |
| Consumer Staples—33.1% | | | | |
| Altria Group | 488,100 | | | 14,472,165 |
| Christian Dior | 65,500 | | | 7,766,071 |
| Coca-Cola | 472,600 | | | 33,067,822 |
| Estee Lauder, Cl. A | 64,200 | | | 7,210,944 |
| Green Mountain Coffee Roasters | 30,000 a,b | | | 1,345,500 |
| Kraft Foods, Cl. A | 160,000 | | | 5,977,600 |
| Nestle, ADR | 317,400 | | | 18,317,154 |
| PepsiCo | 142,900 | | | 9,481,415 |
| Philip Morris International | 488,100 | | | 38,306,088 |
| Procter & Gamble | 255,000 | | | 17,011,050 |
| Walgreen | 294,300 | | | 9,729,558 |
| Whole Foods Market | 45,100 | | | 3,138,058 |
| | | | | 165,823,425 |
| Energy—19.7% | | | | |
| Chevron | 190,900 | | | 20,311,760 |
| ConocoPhillips | 165,100 | | | 12,030,837 |
| Exxon Mobil | 321,364 | | | 27,238,813 |
| Imperial Oil | 85,000 a | | | 3,780,800 |
| Occidental Petroleum | 133,100 | | | 12,471,470 |
| Royal Dutch Shell, Cl. A, ADR | 172,500 | | | 12,608,025 |
| Total, ADR | 199,400a | | 10,191,334 |
| | | | | 98,633,039 |
STATEMENT OF INVESTMENTS (continued)
| | | | |
| Common Stocks (continued) | Shares | | | Value ($) |
| Financial—3.3% | | | | |
| BlackRock | 20,000 | | | 3,564,800 |
| Franklin Resources | 41,000 | | | 3,938,460 |
| JPMorgan Chase & Co. | 267,300 | | | 8,887,725 |
| | | | | 16,390,985 |
| Health Care—9.7% | | | | |
| Abbott Laboratories | 176,800 | | | 9,941,464 |
| Intuitive Surgical | 12,000 b | | | 5,556,120 |
| Johnson & Johnson | 212,900 | | | 13,961,982 |
| Medtronic | 90,200 | | | 3,450,150 |
| Merck & Co. | 143,200 | | | 5,398,640 |
| Novo Nordisk, ADR | 33,300 | | | 3,838,158 |
| Roche Holding, ADR | 150,700 | | | 6,412,285 |
| | | | | 48,558,799 |
| Industrial—3.2% | | | | |
| Caterpillar | 84,400 | | | 7,646,640 |
| General Electric | 214,800 | | | 3,847,068 |
| United Technologies | 59,000 | | | 4,312,310 |
| | | | | 15,806,018 |
| Information Technology—13.0% | | | | |
| Apple | 61,000b | | 24,705,000 |
| Automatic Data Processing | 85,400 | | | 4,612,454 |
| Intel | 592,900 | | | 14,377,825 |
| International Business Machines | 67,000 | | | 12,319,960 |
| QUALCOMM | 50,800 | | | 2,778,760 |
| Texas Instruments | 213,300 | | | 6,209,163 |
| | | | | 65,003,162 |
| Materials—4.7% | | | | |
| Air Products & Chemicals | 20,000 | | | 1,703,800 |
| Freeport-McMoRan Copper & Gold | 185,000 | | | 6,806,150 |
| Praxair | 95,200 | | | 10,176,880 |
| Rio Tinto, ADR | 100,000 | | | 4,892,000 |
| | | | | 23,578,830 |
| Total Common Stocks | | | | |
| (cost $304,209,663) | | | | 490,984,274 |
10
| | | | |
| Other Investment—1.5% | Shares | Value ($) |
| Registered Investment Company; | | |
| Dreyfus Institutional Preferred | | |
| Plus Money Market Fund | | |
| (cost $7,593,542) | 7,593,542c | 7,593,542 |
| |
| Investment of Cash Collateral | | |
| for Securities Loaned—.5% | | |
| Registered Investment Company; | | |
| Dreyfus Institutional Cash Advantage Fund | | |
| (cost $2,642,191) | 2,642,191c | 2,642,191 |
| |
| Total Investments (cost $314,445,396) | 100.1% | 501,220,007 |
| Liabilities, Less Cash and Receivables | (.1%) | (615,493) |
| Net Assets | 100.0% | 500,604,514 |
ADR—American Depository Receipts
|
| a Security, or portion thereof, on loan.At December 31, 2011, the value of the fund’s securities on loan was |
| $2,592,538 and the value of the collateral held by the fund was $2,642,191. |
| b Non-income producing security. |
| c Investment in affiliated money market mutual fund. |
| | | |
| Portfolio Summary (Unaudited)† | | |
| |
| | Value (%) | | Value (%) |
| Consumer Staples | 33.1 | Materials | 4.7 |
| Energy | 19.7 | Financial | 3.3 |
| Information Technology | 13.0 | Industrial | 3.2 |
| Consumer Discretionary | 11.4 | Money Market Investments | 2.0 |
| Health Care | 9.7 | | 100.1 |
| |
| † Based on net assets. | | | |
| See notes to financial statements. | | | |
|
| STATEMENT OF ASSETS AND LIABILITIES |
| December 31, 2011 |
| | | |
| | Cost | Value |
| Assets ($): | | |
| Investments in securities—See Statement of Investments (including | | |
| securities on loan, valued at $2,592,538)—Note 1(c): | | |
| Unaffiliated issuers | 304,209,663 | 490,984,274 |
| Affiliated issuers | 10,235,733 | 10,235,733 |
| Cash | | 1,696,633 |
| Dividends and securities lending income receivable | | 1,184,021 |
| Receivable for shares of Beneficial Interest subscribed | | 1,173,575 |
| Prepaid expenses | | 15,657 |
| | | 505,289,893 |
| Liabilities ($): | | |
| Due to The Dreyfus Corporation and affiliates—Note 3(b) | | 276,702 |
| Due to Fayez & Sarofim & Co. | | 90,106 |
| Liability for securities on loan—Note 1(c) | | 2,642,191 |
| Payable for investment securities purchased | | 1,347,028 |
| Payable for shares of Beneficial Interest redeemed | | 286,373 |
| Accrued expenses | | 42,979 |
| | | 4,685,379 |
| Net Assets ($) | | 500,604,514 |
| Composition of Net Assets ($): | | |
| Paid-in capital | | 307,637,163 |
| Accumulated undistributed investment income—net | | 8,843,223 |
| Accumulated net realized gain (loss) on investments | | (2,650,483) |
| Accumulated net unrealized appreciation | | |
| (depreciation) on investments | | 186,774,611 |
| Net Assets ($) | | 500,604,514 |
| |
| |
| Net Asset Value Per Share | | |
| | Initial Shares | Service Shares |
| Net Assets ($) | 326,444,707 | 174,159,807 |
| Shares Outstanding | 8,591,846 | 4,615,304 |
| Net Asset Value Per Share ($) | 37.99 | 37.74 |
| |
| See notes to financial statements. | | |
12
|
| STATEMENT OF OPERATIONS |
| Year Ended December 31, 2011 |
| | |
| Investment Income ($): | |
| Income: | |
| Cash dividends (net of $371,041 foreign taxes withheld at source): | |
| Unaffiliated issuers | 12,846,031 |
| Affiliated issuers | 4,870 |
| Income from securities lending—Note 1(c) | 76,748 |
| Total Income | 12,927,649 |
| Expenses: | |
| Investment advisory fee—Note 3(a) | 2,460,928 |
| Sub-investment advisory fee—Note 3(a) | 1,005,168 |
| Distribution fees—Note 3(b) | 359,542 |
| Professional fees | 73,685 |
| Prospectus and shareholders’ reports | 64,725 |
| Custodian fees—Note 3(b) | 37,863 |
| Trustees’ fees and expenses—Note 3(c) | 32,703 |
| Shareholder servicing costs—Note 3(b) | 14,644 |
| Loan commitment fees—Note 2 | 7,494 |
| Miscellaneous | 21,679 |
| Total Expenses | 4,078,431 |
| Less—reduction in fees due to earnings credits—Note 3(b) | (7) |
| Net Expenses | 4,078,424 |
| Investment Income—Net | 8,849,225 |
| Realized and Unrealized Gain (Loss) on Investments—Note 4 ($): | |
| Net realized gain (loss) on investments | (368,068) |
| Net unrealized appreciation (depreciation) on investments | 31,468,680 |
| Net Realized and Unrealized Gain (Loss) on Investments | 31,100,612 |
| Net Increase in Net Assets Resulting from Operations | 39,949,837 |
| |
| See notes to financial statements. | |
STATEMENT OF CHANGES IN NET ASSETS
| | | | |
| | Year Ended December 31, |
| | 2011 | 2010 |
| Operations ($): | | |
| Investment income—net | 8,849,225 | 7,352,431 |
| Net realized gain (loss) on investments | (368,068) | (586,025) |
| Net unrealized appreciation | | |
| (depreciation) on investments | 31,468,680 | 51,126,895 |
| Net Increase (Decrease) in Net Assets | | |
| Resulting from Operations | 39,949,837 | 57,893,301 |
| Dividends to Shareholders from ($): | | |
| Investment income—net: | | |
| Initial Shares | (5,339,622) | (6,320,853) |
| Service Shares | (2,014,556) | (1,386,410) |
| Total Dividends | (7,354,178) | (7,707,263) |
| Beneficial Interest Transactions ($): | | |
| Net proceeds from shares sold: | | |
| Initial Shares | 46,939,033 | 27,881,230 |
| Service Shares | 64,879,366 | 75,657,393 |
| Dividends reinvested: | | |
| Initial Shares | 5,339,622 | 6,320,853 |
| Service Shares | 2,014,556 | 1,386,410 |
| Cost of shares redeemed: | | |
| Initial Shares | (58,474,591) | (48,910,102) |
| Service Shares | (28,370,572) | (38,807,049) |
| Increase (Decrease) in Net Assets from | | |
| Beneficial Interest Transactions | 32,327,414 | 23,528,735 |
| Total Increase (Decrease) in Net Assets | 64,923,073 | 73,714,773 |
| Net Assets ($): | | |
| Beginning of Period | 435,681,441 | 361,966,668 |
| End of Period | 500,604,514 | 435,681,441 |
| Undistributed investment income—net | 8,843,223 | 7,349,430 |
14
| | | | |
| | Year Ended December 31, |
| | 2011 | 2010 |
| Capital Share Transactions: | | |
| Initial Shares | | |
| Shares sold | 1,285,530 | 864,720 |
| Shares issued for dividends reinvested | 147,422 | 199,459 |
| Shares redeemed | (1,599,685) | (1,544,798) |
| Net Increase (Decrease) in Shares Outstanding | (166,733) | (480,619) |
| Service Shares | | |
| Shares sold | 1,791,766 | 2,347,577 |
| Shares issued for dividends reinvested | 55,897 | 43,916 |
| Shares redeemed | (789,159) | (1,138,271) |
| Net Increase (Decrease) in Shares Outstanding | 1,058,504 | 1,253,222 |
| |
| See notes to financial statements. | | |
FINANCIAL HIGHLIGHTS
The following tables describe the performance for each share class for the fiscal periods indicated.All information (except portfolio turnover rate) reflects financial results for a single fund share.Total return shows how much your investment in the fund would have increased (or decreased) during each period, assuming you had reinvested all dividends and distributions. The fund’s total returns do not reflect expenses associated with variable annuity or insurance contracts.These figures have been derived from the fund’s financial statements.
| | | | | | | | | | |
| | | Year Ended December 31, | |
| Initial Shares | 2011 | 2010 | 2009 | 2008 | 2007 |
| Per Share Data ($): | | | | | |
| Net asset value, beginning of period | 35.44 | 31.40 | 28.88 | 44.86 | 42.55 |
| Investment Operations: | | | | | |
| Investment income—neta | .73 | .64 | .63 | .67 | .66 |
| Net realized and unrealized | | | | | |
| gain (loss) on investments | 2.42 | 4.09 | 4.95 | (13.01) | 2.32 |
| Total from Investment Operations | 3.15 | 4.73 | 5.58 | (12.34) | 2.98 |
| Distributions: | | | | | |
| Dividends from investment income—net | (.60) | (.69) | (.78) | (.77) | (.67) |
| Dividends from net realized | | | | | |
| gain on investments | — | — | (2.28) | (2.87) | — |
| Total Distributions | (.60) | (.69) | (3.06) | (3.64) | (.67) |
| Net asset value, end of period | 37.99 | 35.44 | 31.40 | 28.88 | 44.86 |
| Total Return (%) | 9.01 | 15.32 | 22.56 | (29.55) | 7.14 |
| Ratios/Supplemental Data (%): | | | | | |
| Ratio of total expenses | | | | | |
| to average net assets | .80 | .81 | .80 | .81 | .80 |
| Ratio of net expenses | | | | | |
| to average net assets | .80 | .81 | .80 | .81 | .80 |
| Ratio of net investment income | | | | | |
| to average net assets | 1.99 | 2.01 | 2.31 | 1.82 | 1.52 |
| Portfolio Turnover Rate | 4.24 | 11.90 | 1.49 | 3.41 | 5.17 |
| Net Assets, end of period ($ x 1,000) | 326,445 | 310,385 | 290,073 | 274,782 | 569,422 |
| |
| a Based on average shares outstanding at each month end. | | | | |
| See notes to financial statements. | | | | | |
16
| | | | | | | | | | |
| | | Year Ended December 31, | |
| Service Shares | 2011 | 2010 | 2009 | 2008 | 2007 |
| Per Share Data ($): | | | | | |
| Net asset value, beginning of period | 35.23 | 31.21 | 28.70 | 44.59 | 42.32 |
| Investment Operations: | | | | | |
| Investment income—neta | .63 | .58 | .59 | .58 | .56 |
| Net realized and unrealized | | | | | |
| gain (loss) on investments | 2.42 | 4.05 | 4.89 | (12.94) | 2.30 |
| Total from Investment Operations | 3.05 | 4.63 | 5.48 | (12.36) | 2.86 |
| Distributions: | | | | | |
| Dividends from investment income—net | (.54) | (.61) | (.69) | (.66) | (.59) |
| Dividends from net realized | | | | | |
| gain on investments | — | — | (2.28) | (2.87) | — |
| Total Distributions | (.54) | (.61) | (2.97) | (3.53) | (.59) |
| Net asset value, end of period | 37.74 | 35.23 | 31.21 | 28.70 | 44.59 |
| Total Return (%) | 8.74 | 15.04 | 22.23 | (29.72) | 6.85 |
| Ratios/Supplemental Data (%): | | | | | |
| Ratio of total expenses | | | | | |
| to average net assets | 1.05 | 1.06 | 1.05 | 1.06 | 1.05 |
| Ratio of net expenses | | | | | |
| to average net assets | 1.05 | 1.06 | 1.05 | 1.06 | 1.05 |
| Ratio of net investment income | | | | | |
| to average net assets | 1.75 | 1.74 | 2.15 | 1.61 | 1.27 |
| Portfolio Turnover Rate | 4.24 | 11.90 | 1.49 | 3.41 | 5.17 |
| Net Assets, end of period ($ x 1,000) | 174,160 | 125,296 | 71,893 | 88,606 | 121,006 |
| a Based on average shares outstanding at each month end. | | | | |
| See notes to financial statements. | | | | | |
NOTES TO FINANCIAL STATEMENTS
NOTE 1—Significant Accounting Policies:
Dreyfus Variable Investment Fund (the “Company”) is registered under the Investment Company Act of 1940, as amended (the “Act”), as an open-end management investment company, operating as a series company currently offering seven series, including the Appreciation Portfolio (the “fund”). The fund is only offered to separate accounts established by insurance companies to fund variable annuity contracts and variable life insurance policies.The fund is a diversified series.The fund’s investment objective is to seek long-term capital growth consistent with the preservation of capital.The Dreyfus Corporation (the “Manager” or “Dreyfus”), a wholly-owned subsidiary of The Bank of NewYork Mellon Corporation (“BNY Mellon”), serves as the fund’s investment adviser. Fayez Sarofim & Co. (“Sarofim & Co.”) serves as the fund’s sub-investment adviser.
MBSC Securities Corporation (the “Distributor”), a wholly-owned subsidiary of Dreyfus, is the distributor of the fund’s shares, which are sold without a sales charge.The fund is authorized to issue an unlimited number of $.001 par value shares of Beneficial Interest in each of the following classes of shares: Initial and Service. Each class of shares has identical rights and privileges, except with respect to the distribution plan and the expenses borne by each class, the allocation of certain transfer agency costs and certain voting rights. Income, expenses (other than expenses attributable to a specific class), and realized and unrealized gains or losses on investments are allocated to each class of shares based on its relative net assets.
The Company accounts separately for the assets, liabilities and operations of each series. Expenses directly attributable to each series are charged to that series’ operations; expenses which are applicable to all series are allocated among them on a pro rata basis.
18
The Financial Accounting Standards Board (“FASB”) Accounting Standards Codification (“ASC”) is the exclusive reference of authoritative U.S. generally accepted accounting principles (“GAAP”) recognized by the FASB to be applied by nongovernmental entities. Rules and interpretive releases of the Securities and Exchange Commission (“SEC”) under authority of federal laws are also sources of authoritative GAAP for SEC registrants. The fund���s financial statements are prepared in accordance with GAAP, which may require the use of management estimates and assumptions.Actual results could differ from those estimates.
The Company enters into contracts that contain a variety of indemnifications.The fund’s maximum exposure under these arrangements is unknown.The fund does not anticipate recognizing any loss related to these arrangements.
(a) Portfolio valuation: The fair value of a financial instrument is the amount that would be received to sell an asset or paid to transfer a liability in an orderly transaction between market participants at the measurement date (i.e. the exit price). GAAP establishes a fair value hierarchy that prioritizes the inputs of valuation techniques used to measure fair value.This hierarchy gives the highest priority to unadjusted quoted prices in active markets for identical assets or liabilities (Level 1 measurements) and the lowest priority to unobservable inputs (Level 3 measurements).
Additionally, GAAP provides guidance on determining whether the volume and activity in a market has decreased significantly and whether such a decrease in activity results in transactions that are not orderly. GAAP requires enhanced disclosures around valuation inputs and techniques used during annual and interim periods.
NOTES TO FINANCIAL STATEMENTS (continued)
Various inputs are used in determining the value of the fund’s investments relating to fair value measurements.These inputs are summarized in the three broad levels listed below:
Level 1—unadjusted quoted prices in active markets for identical investments.
Level 2—other significant observable inputs (including quoted prices for similar investments, interest rates, prepayment speeds, credit risk, etc.).
Level 3—significant unobservable inputs (including the fund’s own assumptions in determining the fair value of investments).
The inputs or methodology used for valuing securities are not necessarily an indication of the risk associated with investing in those securities.
Changes in valuation techniques may result in transfers in or out of an assigned level within the disclosure hierarchy. Valuation techniques used to value the fund’s investments are as follows:
Investments in securities are valued at the last sales price on the securities exchange or national securities market on which such securities are primarily traded. Securities listed on the National Market System for which market quotations are available are valued at the official closing price or, if there is no official closing price that day, at the last sales price. Securities not listed on an exchange or the national securities market, or securities for which there were no transactions, are valued at the average of the most recent bid and asked prices, except for open short positions, where the asked price is used for valuation purposes. Bid price is used when no asked price is available. Registered investment companies that are not traded on an exchange are valued at their net asset value.All preceding securities are categorized within Level 1 of the fair value hierarchy.
Fair valuing of securities may be determined with the assistance of a pricing service using calculations based on indices of domestic securities and other appropriate indicators, such as prices of relevant ADRs and futures contracts. Utilizing these techniques may result in transfers between Level 1 and Level 2 of the fair value hierarchy.
20
When market quotations or official closing prices are not readily available, or are determined not to reflect accurately fair value, such as when the value of a security has been significantly affected by events after the close of the exchange or market on which the security is principally traded (for example, a foreign exchange or market), but before the fund calculates its net asset value, the fund may value these investments at fair value as determined in accordance with the procedures approved by the Board of Trustees. Certain factors may be considered when fair valuing investments such as: fundamental analytical data, the nature and duration of restrictions on disposition, an evaluation of the forces that influence the market in which the securities are purchased and sold, and public trading in similar securities of the issuer or comparable issuers.These securities are either categorized as Level 2 or 3 depending on the relevant inputs used.
For restricted securities where observable inputs are limited, assumptions about market activity and risk are used and are categorized within Level 3 of the fair value hierarchy.
The following is a summary of the inputs used as of December 31, 2011 in valuing the fund’s investments:
| | | | |
| | | Level 2—Other | Level 3— | |
| | Level 1— | Significant | Significant | |
| | Unadjusted | Observable | Unobservable | |
| | Quoted Prices | Inputs | Inputs | Total |
| Assets ($) | | | | |
| Investments in Securities: | | | |
| Equity Securities— | | | | |
| Domestic† | 420,920,147 | — | — | 420,920,147 |
| Equity Securities— | | | | |
| Foreign† | 70,064,127 | — | — | 70,064,127 |
| Mutual Funds | 10,235,733 | — | — | 10,235,733 |
| † See Statement of Investments for additional detailed categorizations. | |
In May 2011, FASB issued Accounting Standards Update (“ASU”) No. 2011-04 “Amendments to Achieve Common FairValue Measurement and Disclosure Requirements in GAAP and International Financial
NOTES TO FINANCIAL STATEMENTS (continued)
Reporting Standards (“IFRS”)” (“ASU 2011-04”). ASU 2011-04 includes common requirements for measurement of and disclosure about fair value between GAAP and IFRS. ASU 2011-04 will require reporting entities to disclose the following information for fair value measurements categorized within Level 3 of the fair value hierarchy: quantitative information about the unobservable inputs used in the fair value measurement, the valuation processes used by the reporting entity and a narrative description of the sensitivity of the fair value measurement to changes in unobservable inputs and the interrelationships between those unobservable inputs. In addition, ASU 2011-04 will require reporting entities to make disclosures about amounts and reasons for all transfers in and out of Level 1 and Level 2 fair value measurements.The new and revised disclosures are effective for interim and annual reporting periods beginning after December 15, 2011. At this time, management is evaluating the implications of ASU 2011-04 and its impact on the financial statements.
(b) Foreign currency transactions: The fund does not isolate that portion of the results of operations resulting from changes in foreign exchange rates on investments from the fluctuations arising from changes in market prices of securities held. Such fluctuations are included with the net realized and unrealized gain or loss on investments.
Net realized foreign exchange gains or losses arise from sales of foreign currencies, currency gains or losses realized on securities transactions between trade and settlement date, and the difference between the amounts of dividends, interest and foreign withholding taxes recorded on the fund’s books and the U.S. dollar equivalent of the amounts actually received or paid. Net unrealized foreign exchange gains and losses arise from changes in the value of assets and liabilities other than investments resulting from changes in exchange rates. Foreign cur-
22
rency gains and losses on investments are included with net realized and unrealized gain or loss on investments.
(c) Securities transactions and investment income: Securities transactions are recorded on a trade date basis. Realized gains and losses from securities transactions are recorded on the identified cost basis. Dividend income is recognized on the ex-dividend date and interest income, including, where applicable, accretion of discount and amortization of premium on investments, is recognized on the accrual basis.
Pursuant to a securities lending agreement withThe Bank of NewYork Mellon, a subsidiary of BNY Mellon and an affiliate of Dreyfus, the fund may lend securities to qualified institutions. It is the fund’s policy that, at origination, all loans are secured by collateral of at least 102% of the value of U.S. securities loaned and 105% of the value of foreign securities loaned. Collateral equivalent to at least 100% of the market value of securities on loan is maintained at all times. Collateral is either in the form of cash, which can be invested in certain money market mutual funds managed by Dreyfus, U.S. Government and Agency securities or letters of credit.The fund is entitled to receive all income on securities loaned, in addition to income earned as a result of the lending transaction. Although each security loaned is fully collateralized, the fund bears the risk of delay in recovery of, or loss of rights in, the securities loaned should a borrower fail to return the securities in a timely manner. During the period ended December 31, 2011, The Bank of New York Mellon earned $32,892 from lending portfolio securities, pursuant to the securities lending agreement.
(d) Affiliated issuers: Investments in other investment companies advised by Dreyfus are defined as “affiliated” in the Act.
NOTES TO FINANCIAL STATEMENTS (continued)
The fund may invest in shares of certain affiliated investment companies also advised or managed by Dreyfus. Investments in affiliated investment companies for the period ended December 31, 2011 were as follows:
| | | | | |
| Affiliated | | | | | |
| Investment | Value | | | Value | Net |
| Company | 12/31/2010 ($) | Purchases ($) | Sales ($) | 12/31/2011 ($) | Assets (%) |
| Dreyfus | | | | | |
| Institutional | | | | | |
| Preferred | | | | | |
| Plus Money | | | | | |
| Market | | | | | |
| Fund | 28,098,000 | 60,247,792 | 80,75C2,250 | 7,593,542 | 1.5 |
| Dreyfus | | | | | |
| Institutional | | | | | |
| Cash | | | | | |
| Advantage | | | | | |
| Fund | 9,340,956 | 354,198,748 | 360,897,513 | 2,642,191 | .5 |
| Total | 37,438,956 | 414,446,540 | 441,649,763 | 10,235,733 | 2.0 |
(e) Dividends to shareholders: Dividends are recorded on the ex-dividend date. Dividends from investment income-net and dividends from net realized capital gains, if any, are normally declared and paid annually, but the fund may make distributions on a more frequent basis to comply with the distribution requirements of the Internal Revenue Code of 1986, as amended (the “Code”).To the extent that net realized capital gains can be offset by capital loss carryovers, it is the policy of the fund not to distribute such gains. Income and capital gain distributions are determined in accordance with income tax regulations, which may differ from GAAP.
(f) Federal income taxes: It is the policy of the fund to continue to qualify as a regulated investment company, if such qualification is in the best interests of its shareholders, by complying with the applicable provisions of the Code, and to make distributions of taxable income sufficient to relieve it from substantially all federal income and excise taxes.
As of and during the period ended December 31, 2011, the fund did not have any liabilities for any uncertain tax positions.The fund recognizes interest and penalties, if any, related to uncertain tax positions as income tax expense in the Statement of Operations. During the period, the fund did not incur any interest or penalties.
24
Each of the tax years in the four-year period ended December 31, 2011 remains subject to examination by the Internal Revenue Service and state taxing authorities.
At December 31, 2011, the components of accumulated earnings on a tax basis were as follows: ordinary income $8,843,223, accumulated capital losses $1,621,087 and unrealized appreciation $185,882,506. In addition, the fund had $137,291 of capital losses realized after October 31, 2011, which were deferred for tax purposes to the first day of the following fiscal year.
Under the Regulated Investment Company Modernization Act of 2010 (the “2010 Act”), the fund will be permitted to carry forward capital losses incurred in taxable years beginning after December 22, 2010 (“post-enactment losses”) for an unlimited period. Post-enactment capital loss carryovers will retain their character as either short-term or long-term capital losses rather than be considered short-term as they were under previous statute. However, the 2010 Act requires post-enactment losses to be utilized before the utilization of losses incurred in taxable years prior to the effective date of the 2010 Act (“pre-enactment losses”). As a result of this ordering rule, pre-enactment losses may be more likely to expire unused.
The accumulated capital loss carryover is available for federal income tax purposes to be applied against future net securities profits, if any, realized subsequent to December 31, 2011. If not applied, $658,768 of the carryover expires in fiscal 2017, $732,796 expires in fiscal 2018 and $229,523 of post-enactment long-term capital losses can be carried forward for an unlimited period.
The tax character of distributions paid to shareholders during the fiscal periods ended December 31, 2011 and December 31, 2010 were as follows: ordinary income $7,354,178 and $7,707,263, respectively.
During the period ended December 31, 2011, as a result of permanent book to tax differences, primarily due to the tax treatment for foreign currency exchange gains and losses, the fund decreased
NOTES TO FINANCIAL STATEMENTS (continued)
accumulated undistributed investment income-net by $1,254 and increased accumulated net realized gain (loss) on investments by the same amount. Net assets and net asset value per share were not affected by this reclassification.
NOTE 2—Bank Lines of Credit:
The fund participates with other Dreyfus-managed funds in a $225 million unsecured credit facility led by Citibank, N.A. and a $300 million unsecured credit facility provided by The Bank of New York Mellon (each, a “Facility”), each to be utilized primarily for temporary or emergency purposes, including the financing of redemptions. In connection therewith, the fund has agreed to pay its pro rata portion of commitment fees for each Facility. Interest is charged to the fund based on rates determined pursuant to the terms of the respective Facility at the time of borrowing. During the period ended December 31, 2011, the fund did not borrow under the Facilities.
NOTE 3—Investment Advisory Fee, Sub-Investment Advisory Fee and Other Transactions With Affiliates:
(a) Pursuant to an investment advisory agreement with Dreyfus, the investment advisory fee is computed at the annual rate of .5325% of the value of the fund’s average daily net assets. Pursuant to a sub-investment advisory agreement with Sarofim & Co., the fund pays Sarofim & Co. a monthly sub-investment advisory fee at the annual rate of .2175% of the value of the fund’s average daily net assets. Both fees are payable monthly.
(b) Under the Distribution Plan (the “Plan”) adopted pursuant to Rule 12b-1 under the Act, Service shares pay the Distributor for distributing its shares, for servicing and/or maintaining Service shares’ shareholder accounts and for advertising and marketing for Service shares.The Plan provides for payments to be made at an annual rate of .25% of the value of the Service shares’ average daily net assets.The Distributor may make
26
payments to Participating Insurance Companies and to brokers and dealers acting as principal underwriter for their variable insurance products.The fees payable under the Plan are payable without regard to actual expenses incurred. During the period ended December 31, 2011, Service shares were charged $359,542 pursuant to the Plan.
The fund compensates Dreyfus Transfer, Inc., a wholly-owned subsidiary of Dreyfus, under a transfer agency agreement for providing personnel and facilities to perform transfer agency services for the fund. During the period ended December 31, 2011, the fund was charged $1,506 pursuant to the transfer agency agreement, which is included in Shareholder servicing costs in the Statement of Operations.
The fund has arrangements with the custodian and cash management bank whereby the fund may receive earnings credits when positive cash balances are maintained, which are used to offset custody and cash management fees. For financial reporting purposes, the fund includes net earnings credits as an expense offset in the Statement of Operations.
The fund compensates The Bank of New York Mellon under cash management agreements for performing cash management services related to fund subscriptions and redemptions. During the period ended December 31, 2011, the fund was charged $227 pursuant to the cash management agreements, which is included in Shareholder servicing costs in the Statement of Operations.These fees were partially offset by earnings credits of $7.
The fund also compensates The Bank of New York Mellon under a custody agreement for providing custodial services for the fund. During the period ended December 31, 2011, the fund was charged $37,863 pursuant to the custody agreement.
During the period ended December 31, 2011, the fund was charged $6,402 for services performed by the Chief Compliance Officer.
NOTES TO FINANCIAL STATEMENTS (continued)
The components of “Due to The Dreyfus Corporation and affiliates” in the Statement of Assets and Liabilities consist of: investment advisory fees $220,603, Rule 12b-1 distribution plan fees $35,578, custodian fees $15,003, chief compliance officer fees $5,295 and transfer agency per account fees $223.
(c) Each Board member also serves as a Board member of other funds within the Dreyfus complex. Annual retainer fees and attendance fees are allocated to each fund based on net assets.
NOTE 4—Securities Transactions:
The aggregate amount of purchases and sales of investment securities, excluding short-term securities, during the period ended December 31, 2011, amounted to $48,582,853 and $19,558,921, respectively.
At December 31, 2011, the cost of investments for federal income tax purposes was $315,337,501; accordingly, accumulated net unrealized appreciation on investments was $185,882,506, consisting of $199,694,157 gross unrealized appreciation and $13,811,651 gross unrealized depreciation.
28
|
| REPORT OF INDEPENDENT REGISTERED |
| PUBLIC ACCOUNTING FIRM |
Shareholders and Board of Trustees
Dreyfus Variable Investment Fund, Appreciation Portfolio
We have audited the accompanying statement of assets and liabilities, including the statement of investments, of Dreyfus Variable Investment Fund, Appreciation Portfolio (one of the series comprising Dreyfus Variable Investment Fund) as of December 31, 2011, and the related statement of operations for the year then ended, the statement of changes in net assets for each of the two years in the period then ended, and financial highlights for each of the years indicated therein. These financial statements and financial highlights are the responsibility of the Fund’s management. Our responsibility is to express an opinion on these financial statements and financial highlights based on our audits.
We conducted our audits in accordance with the standards of the Public Company Accounting Oversight Board (United States).Those standards require that we plan and perform the audit to obtain reasonable assurance about whether the financial statements and financial highlights are free of material misstatement.We were not engaged to perform an audit of the Fund’s internal control over financial reporting. Our audits included consideration of internal control over financial reporting as a basis for designing audit procedures that are appropriate in the circumstances, but not for the purpose of expressing an opinion on the effectiveness of the Fund’s internal control over financial reporting. Accordingly, we express no such opinion. An audit also includes examining, on a test basis, evidence supporting the amounts and disclosures in the financial statements and financial highlights, assessing the accounting principles used and significant estimates made by management, and evaluating the overall financial statement presentation. Our procedures included confirmation of securities owned as of December 31, 2011 by correspondence with the custodian and others.We believe that our audits provide a reasonable basis for our opinion.
In our opinion, the financial statements and financial highlights referred to above present fairly, in all material respects, the financial position of Dreyfus Variable Investment Fund, Appreciation Portfolio at December 31, 2011, the results of its operations for the year then ended, the changes in its net assets for each of the two years in the period then ended, and the financial highlights for each of the indicated years, in conformity with U.S. generally accepted accounting principles.

|
| New York, New York |
| February 10, 2012 |
IMPORTANT TAX INFORMATION (Unaudited)
For federal tax purposes, the fund hereby designates 100% of the ordinary dividends paid during the fiscal year ended December 31, 2011 as qualifying for the corporate dividends received deduction. Shareholders will receive notification in early 2012 of the percentage applicable to the preparation of their 2011 income tax returns.
30
BOARD MEMBERS INFORMATION (Unaudited)
|
| Joseph S. DiMartino (68) |
| Chairman of the Board (1995) |
| Principal Occupation During Past 5Years: |
| • Corporate Director and Trustee |
| Other Public Company Board Memberships During Past 5Years: |
| • CBIZ (formerly, Century Business Services, Inc.), a provider of outsourcing functions for small |
| and medium size companies, Director (1997-present) |
| • Sunair Services Corporation, a provider of certain outdoor-related services to homes and |
| businesses, Director (2005-2009) |
| • The Newark Group, a provider of a national market of paper recovery facilities, paperboard |
| mills and paperboard converting plants, Director (2000-2010) |
| No. of Portfolios for which Board Member Serves: 164 |
| ——————— |
| Peggy C. Davis (68) |
| Board Member (2006) |
| Principal Occupation During Past 5Years: |
| • Shad Professor of Law, New York University School of Law |
| • Writer and teacher in the fields of evidence, constitutional theory, family law, social sciences |
| and the law, legal process and professional methodology and training |
| No. of Portfolios for which Board Member Serves: 53 |
| ——————— |
| David P. Feldman (72) |
| Board Member (1994) |
| Principal Occupation During Past 5Years: |
| • Corporate Director and Trustee |
| Other Public Company Board Memberships During Past 5Years: |
| • BBH Mutual Funds Group (4 registered mutual funds), Director (1992-present) |
| • QMed, Inc. a healthcare company, Director (1999-2007) |
| No. of Portfolios for which Board Member Serves: 49 |
BOARD MEMBERS INFORMATION (Unaudited) (continued)
|
| Ehud Houminer (71) |
| Board Member (2006) |
| Principal Occupation During Past 5Years: |
| • Executive-in-Residence at the Columbia Business School, Columbia University (1992-present) |
| Other Public Company Board Memberships During Past 5Years: |
| • Avnet Inc., an electronics distributor, Director (1993-present) |
| No. of Portfolios for which Board Member Serves: 63 |
| ——————— |
| Dr. Martin Peretz (72) |
| Board Member (1990) |
| Principal Occupation During Past 5Years: |
| • Editor-in-Chief Emeritus of The New Republic Magazine (2010-present) (previously, Editor- |
| in-Chief, 1974-2010) |
| • Director of TheStreet.com, a financial information service on the web (1996-present) |
| No. of Portfolios for which Board Member Serves: 35 |
| ——————— |
Once elected all Board Members serve for an indefinite term, but achieve Emeritus status upon reaching age 80.The address of the Board Members and Officers is in c/o The Dreyfus Corporation, 200 Park Avenue, NewYork, NewYork 10166.Additional information about the Board Members is available in the fund’s Statement of Additional Information which can be obtained from Dreyfus free of charge by calling this toll free number: 1-800-DREYFUS.
James F. Henry, Emeritus Board Member
Rosalind G. Jacobs, Emeritus Board Member
Dr. Paul A. Marks, Emeritus Board Member
Gloria Messinger, Emeritus Board Member
32
OFFICERS OF THE FUND (Unaudited)
BRADLEY J. SKAPYAK, President since January 2010.
Chief Operating Officer and a director of the Manager since June 2009. From April 2003 to June 2009, Mr. Skapyak was the head of the Investment Accounting and Support Department of the Manager. He is an officer of 75 investment companies (comprised of 163 portfolios) managed by the Manager. He is 53 years old and has been an employee of the Manager since February 1988.
JANETTE E. FARRAGHER, Vice President and Secretary since December 2011.
Assistant General Counsel of BNY Mellon, and an officer of 76 investment companies (comprised of 189 portfolios) managed by the Manager. She is 49 years old and has been an employee of the Manager since February 1984.
KIESHA ASTWOOD, Vice President and Assistant Secretary since January 2010.
Counsel of BNY Mellon, and an officer of 76 investment companies (comprised of 189 portfolios) managed by the Manager. She is 38 years old and has been an employee of the Manager since July 1995.
JAMES BITETTO, Vice President and Assistant Secretary since August 2005.
Senior Counsel of BNY Mellon and Secretary of the Manager, and an officer of 76 investment companies (comprised of 189 portfolios) managed by the Manager. He is 45 years old and has been an employee of the Manager since December 1996.
JONI LACKS CHARATAN, Vice President and Assistant Secretary since August 2005.
Senior Counsel of BNY Mellon, and an officer of 76 investment companies (comprised of 189 portfolios) managed by the Manager. She is 56 years old and has been an employee of the Manager since October 1988.
JOSEPH M. CHIOFFI, Vice President and Assistant Secretary since August 2005.
Senior Counsel of BNY Mellon, and an officer of 76 investment companies (comprised of 189 portfolios) managed by the Manager. He is 50 years old and has been an employee of the Manager since June 2000.
KATHLEEN DENICHOLAS, Vice President and Assistant Secretary since January 2010.
Managing Counsel of BNY Mellon, and an officer of 76 investment companies (comprised of 189 portfolios) managed by the Manager. She is 37 years old and has been an employee of the Manager since February 2001.
JOHN B. HAMMALIAN, Vice President and Assistant Secretary since August 2005.
Senior Managing Counsel of BNY Mellon, and an officer of 76 investment companies (comprised of 189 portfolios) managed by the Manager. He is 48 years old and has been an employee of the Manager since February 1991.
M. CRISTINA MEISER, Vice President and Assistant Secretary since January 2010.
Senior Counsel of BNY Mellon, and an officer of 76 investment companies (comprised of 189 portfolios) managed by the Manager. She is 41 years old and has been an employee of the Manager since August 2001.
ROBERT R. MULLERY, Vice President and Assistant Secretary since August 2005.
Managing Counsel of BNY Mellon, and an officer of 76 investment companies (comprised of 189 portfolios) managed by the Manager. He is 59 years old and has been an employee of the Manager since May 1986.
OFFICERS OF THE FUND (Unaudited) (continued)
JEFF PRUSNOFSKY, Vice President and Assistant Secretary since August 2005.
Senior Managing Counsel of BNY Mellon, and an officer of 76 investment companies (comprised of 189 portfolios) managed by the Manager. He is 46 years old and has been an employee of the Manager since October 1990.
JAMES WINDELS, Treasurer since November 2001.
Director – Mutual Fund Accounting of the Manager, and an officer of 76 investment companies (comprised of 189 portfolios) managed by the Manager. He is 53 years old and has been an employee of the Manager since April 1985.
RICHARD CASSARO, Assistant Treasurer since January 2008.
Senior Accounting Manager – Money Market and Municipal Bond Funds of the Manager, and an officer of 76 investment companies (comprised of 189 portfolios) managed by the Manager. He is 52 years old and has been an employee of the Manager since September 1982.
GAVIN C. REILLY, Assistant Treasurer since December 2005.
Tax Manager of the Investment Accounting and Support Department of the Manager, and an officer of 76 investment companies (comprised of 189 portfolios) managed by the Manager. He is 43 years old and has been an employee of the Manager since April 1991.
ROBERT S. ROBOL, Assistant Treasurer since August 2003.
Senior Accounting Manager – Fixed Income Funds of the Manager, and an officer of 76 investment companies (comprised of 189 portfolios) managed by the Manager. He is 47 years old and has been an employee of the Manager since October 1988.
ROBERT SALVIOLO, Assistant Treasurer since July 2007.
Senior Accounting Manager – Equity Funds of the Manager, and an officer of 76 investment companies (comprised of 189 portfolios) managed by the Manager. He is 44 years old and has been an employee of the Manager since June 1989.
ROBERT SVAGNA, Assistant Treasurer since December 2002.
Senior Accounting Manager – Equity Funds of the Manager, and an officer of 76 investment companies (comprised of 189 portfolios) managed by the Manager. He is 44 years old and has been an employee of the Manager since November 1990.
JOSEPH W. CONNOLLY, Chief Compliance Officer since October 2004.
Chief Compliance Officer of the Manager and The Dreyfus Family of Funds (76 investment companies, comprised of 189 portfolios). From November 2001 through March 2004, Mr. Connolly was first Vice-President, Mutual Fund Servicing for Mellon Global Securities Services. In that capacity, Mr. Connolly was responsible for managing Mellon’s Custody, Fund Accounting and Fund Administration services to third-party mutual fund clients. He is 54 years old and has served in various capacities with the Manager since 1980, including manager of the firm’s Fund Accounting Department from 1997 through October 2001.
STEPHEN J. STOREN, Anti-Money Laundering Compliance Officer since May 2011.
Chief Compliance Officer of the Distributor, and the Anti-Money Laundering Compliance Officer of 72 investment companies (comprised of 185 portfolios) managed by the Manager. He is 57 years old and has been an employee of the Distributor since October 1999.
34
For More Information
The fund files its complete schedule of portfolio holdings with the Securities and Exchange Commission (“SEC”) for the first and third quarters of each fiscal year on Form N-Q. The fund’s Forms N-Q are available on the SEC’s website at http://www.sec.gov and may be reviewed and copied at the SEC’s Public Reference Room in Washington, DC. Information on the operation of the Public Reference Room may be obtained by calling 1-800-SEC-0330.
A description of the policies and procedures that the fund uses to determine how to vote proxies relating to portfolio securities, and information regarding how the fund voted these proxies for the most recent 12-month period ended June 30 is available at http://www.dreyfus.com and on the SEC’s website at http://www.sec.gov. The description of the policies and procedures is also available without charge, upon request, by calling 1-800-DREYFUS.

|
| Dreyfus Variable |
| Investment Fund, |
| Growth and Income |
| Portfolio |

The views expressed in this report reflect those of the portfolio manager only through the end of the period covered and do not necessarily represent the views of Dreyfus or any other person in the Dreyfus organization. Any such views are subject to change at any time based upon market or other conditions and Dreyfus disclaims any responsibility to update such views.These views may not be relied on as investment advice and, because investment decisions for a Dreyfus fund are based on numerous factors, may not be relied on as an indication of trading intent on behalf of any Dreyfus fund.
|
| Not FDIC-Insured • Not Bank-Guaranteed • May Lose Value |
Contents
| |
| | THE FUND |
| 2 | A Letter from the Chairman and CEO |
| 3 | Discussion of Fund Performance |
| 6 | Fund Performance |
| 8 | Understanding Your Fund’s Expenses |
| 8 | Comparing Your Fund’s Expenses |
| With Those of Other Funds |
| 9 | Statement of Investments |
| 15 | Statement of Assets and Liabilities |
| 16 | Statement of Operations |
| 17 | Statement of Changes in Net Assets |
| 19 | Financial Highlights |
| 21 | Notes to Financial Statements |
| 33 | Report of Independent Registered |
| | Public Accounting Firm |
| 34 | Important Tax Information |
| 35 | Board Members Information |
| 37 | Officers of the Fund |
|
| FOR MORE INFORMATION |
| Back Cover |
Dreyfus Variable Investment Fund,
Growth and Income Portfolio
The Fund

A LETTER FROM THE CHAIRMAN AND CEO
Dear Shareholder:
We present to you this annual report for Dreyfus Variable Investment Fund, Growth and Income Portfolio, covering the 12-month period from January 1, 2011, through December 31, 2011. For information about how the fund performed during the reporting period, as well as general market perspectives, we provide a Discussion of Fund Performance on the pages that follow.
The generally mild returns produced by the U.S. stock market in 2011 belie the pronounced volatility affecting equities over much of the year. Day-to-day market movements were often tumultuous, driven by macroeconomic developments ranging from catastrophic natural disasters in Japan to an unprecedented downgrade of long-term U.S. debt securities and the resurgence of a sovereign debt crisis in Europe. Still, U.S. corporations achieved record-setting profits, on average, even as market valuations dropped below historical norms.A fundamentals-based investment approach proved relatively ineffective in a market fueled mainly by emotion, causing most active portfolio managers to lag market averages.
We are hopeful that equity investors will adopt a more rational perspective in 2012. Our economic forecast calls for a mild acceleration of the U.S. recovery as the domestic banking system regains strength, credit conditions loosen and housing markets begin a long-awaited convalescence. Of course, we encourage you to talk with your financial adviser to help ensure that your investment objectives are properly aligned with your risk tolerance in pursuing potential market opportunities in 2012.
Thank you for your continued confidence and support.
2

DISCUSSION OF FUND PERFORMANCE
For the period of January 1, 2011, through December 31, 2011, as provided by John Bailer and Elizabeth Slover, Portfolio Managers
Fund and Market Performance Overview
For the 12-month period ended December 31, 2011, Dreyfus Variable Investment Fund, Growth and Income Portfolio’s Initial shares achieved a –2.79% total return, and its Service shares achieved a total return of –2.99%.1 In comparison, the fund’s benchmark, the Standard & Poor’s 500 Composite Stock Price Index (“S&P 500 Index”), produced a total return of 2.09% for the same period.2
Macroeconomic disappointments throughout the world weighed on equity markets during much of 2011, but rallies in the first and fourth quarters enabled the S&P 500 Index to end the year in positive territory. The fund produced lower returns than its benchmark, primarily due to shortfalls in our stock selection strategy in the industrials, consumer discretionary and materials sectors.
The Fund’s Investment Approach
The fund seeks long-term capital growth, current income and growth of income consistent with reasonable investment risk. To pursue this goal, the fund invests primarily in stocks of domestic and foreign issuers.We seek to create a portfolio that includes a blend of growth and dividend-paying stocks, as well as other investments that provide income.We choose stocks through a disciplined investment process that combines computer modeling techniques, “bottom-up” fundamental analysis and risk management. The investment process is designed to provide investors with investment exposure to sector weightings and risk characteristics similar to those of the S&P 500 Index.
Global Economic Developments Roiled Equity Markets
Improvements in U.S. economic data supported stock prices at the start of 2011, but political unrest in the Middle East and catastrophic natural and nuclear disasters in Japan soon interrupted the rally. Nonetheless, investors continued to look forward to better business conditions, and stocks generally rebounded from these unexpected shocks by the end of the first quarter.
Investors’ hopes for a more robust recovery were dashed in late April, when Greece teetered on the brink of default on its sovereign debt and
DISCUSSION OF FUND PERFORMANCE (continued)
the crisis spread to other European nations. In addition, U.S. economic data proved more disappointing than expected, and investors reacted cautiously to a contentious political debate regarding U.S. government spending and borrowing. Consequently, newly risk-averse investors shifted their focus toward traditionally defensive industries and companies, particularly well-known businesses with consistent earnings.
Market declines were particularly severe in August and September, after a major credit-rating agency downgraded its assessment of long-term U.S. government debt. In contrast, the market rebounded to a degree from October through December, when U.S. economic data improved and European policymakers made some progress in addressing the region’s problems.
Stock Selections Dampened Relative Performance
The fund’s results compared to the benchmark in 2011 were hurt by a tilt toward companies that tend to be more sensitive to economic conditions. In the industrials sector, a number of fundamentally sound companies saw their stock prices fall when investor sentiment deteriorated, including Caterpillar, Ingersoll-Rand, Eaton and Cummins. In the consumer discretionary sector, cruise operator Carnival was hurt by elevated fuel costs and the need to reroute itineraries to avoid political unrest in North Africa. Office supplies retailer Staples lost value after reporting disappointing sales and earnings stemming from lackluster employment gains among its corporate customers. Among materials companies, metals producer Freeport-McMoRan Copper & Gold was undermined by reduced demand from the emerging markets. Specialty chemicals maker Eastman Chemical also suffered from reduced end-market demand. Finally, overweighted exposure to oil services provider Schlumberger proved counterproductive when a number of international projects were delayed due to the struggling global economy.
The fund achieved better results from individual holdings across several different industry groups. Pharmaceutical giant Pfizer posted better-than-expected earnings based on strong results in Japan, and investors responded positively to good news regarding new products under development. Media conglomerate Time Warner reported higher earnings due to record results in its film and entertainment division. Grocery chain Whole Foods Market captured market share from more traditional competitors and achieved stronger sales of premium brands to a relatively affluent customer base.The fund also
4
benefited from underweighted exposure to Bank of America, avoiding the brunt of weakness stemming from negative headlines and concerns regarding mortgage liabilities.
Finally, the fund benefited from our options strategy, in which we sold call options on stocks nearing our price targets. This strategy resulted in additional income, boosting the fund’s total return for the reporting period.
Stocks Have Become More Attractively Valued
Despite ongoing headwinds, we believe the economic expansion is likely to persist. Indeed, for much of 2011, the stock market seemed to react more to macroeconomic developments than to the fundamental strengths and weaknesses of individual companies. Consequently, in our analysis, many stocks have declined to lower valuations than are warranted by their fundamentals. Our bottom-up security selection process has identified a number of opportunities in the consumer discretionary sector, especially among media companies poised for increased advertising spending in an election year. Conversely, we have found fewer opportunities meeting our investment criteria in the utilities sector, where stocks generally appear more expensive.
January 17, 2012
| |
| | Please note, the position in any security highlighted in italicized typeface was sold during the |
| | reporting period. |
| | Equity funds are subject generally to market, market sector, market liquidity, issuer and investment |
| | style risks, among other factors, to varying degrees, all of which are more fully described in the |
| | fund’s prospectus. |
| | The use of derivatives involves risks different from, or possibly greater than, the risks associated |
| | with investing directly in the underlying assets. Derivatives can be highly volatile, illiquid, and |
| | difficult to value and there is the risk that changes in the value of a derivative held by the fund |
| | will not correlate with the underlying instruments or the fund’s other investments. |
| | The fund is only available as a funding vehicle under variable life insurance policies or variable |
| | annuity contracts issued by insurance companies. Individuals may not purchase shares of the fund |
| | directly.A variable annuity is an insurance contract issued by an insurance company that enables |
| | investors to accumulate assets on a tax-deferred basis for retirement or other long-term goals. |
| 1 | Total return includes reinvestment of dividends and any capital gains paid. Past performance is no |
| | guarantee of future results. Share price and investment return fluctuate such that upon redemption, |
| | fund shares may be worth more or less than their original cost.The fund’s performance does not |
| | reflect the deduction of additional charges and expenses imposed in connection with investing in |
| | variable insurance contracts, which will reduce returns. |
| 2 | SOURCE: LIPPER INC. — Reflects reinvestment of net dividends and, where applicable, capital |
| | gain distributions.The Standard & Poor’s 500 Composite Stock Price Index is a widely accepted, |
| | unmanaged index of U.S. stock market performance. Investors cannot invest directly in an index. |
FUND PERFORMANCE

| | | | | | |
| Average Annual Total Returns as of 12/31/11 | | |
| | 1Year | 5 Years | 10 Years |
| Initial shares | –2.79% | –0.82% | 1.44% |
| Service shares | –2.99% | –1.05% | 1.23% |
| Standard & Poor’s 500 | | | |
| Composite Stock Price Index | 2.09% | –0.25% | 2.92% |
|
| † Source: Lipper Inc. |
| Past performance is not predictive of future performance.The fund’s performance shown in the graph and table does not |
| reflect the deduction of taxes that a shareholder would pay on fund distributions or the redemption of fund shares. |
| The fund’s performance does not reflect the deduction of additional charges and expenses imposed in connection |
| with investing in variable insurance contracts which will reduce returns. |
| The above graph compares a $10,000 investment made in Initial and Service shares of Dreyfus Variable Investment |
| Fund, Growth and Income Portfolio on 12/31/01 to a $10,000 investment made in the Standard & Poor’s 500 |
| Composite Stock Price Index (the “Index”) on that date. |
6
The fund’s Initial shares are not subject to a Rule 12b-1 fee.The fund’s Service shares are subject to a 0.25% annual Rule 12b-1 fee.All dividends and capital gain distributions are reinvested.
The fund’s performance shown in the line graph above takes into account all applicable fund fees and expenses (after any expense reimbursements).The Index is a widely accepted, unmanaged index of U.S. stock market performance. Unlike a mutual fund, the Index is not subject to charges, fees and other expenses. Investors cannot invest directly in any index. Further information relating to fund performance, including expense reimbursements, if applicable, is contained in the Financial Highlights section of the prospectus and elsewhere in this report.
UNDERSTANDING YOUR FUND’S EXPENSES (Unaudited)
As a mutual fund investor, you pay ongoing expenses, such as management fees and other expenses. Using the information below, you can estimate how these expenses affect your investment and compare them with the expenses of other funds.You also may pay one-time transaction expenses, including sales charges (loads), redemption fees and expenses associated with variable annuity or insurance contracts, which are not shown in this section and would have resulted in higher total expenses. For more information, see your fund’s prospectus or talk to your financial adviser.
Review your fund’s expenses
The table below shows the expenses you would have paid on a $1,000 investment in Dreyfus Variable Investment Fund, Growth and Income Portfolio from July 1, 2011 to December 31, 2011. It also shows how much a $1,000 investment would be worth at the close of the period, assuming actual returns and expenses.
Expenses and Value of a $1,000 Investment
assuming actual returns for the six months ended December 31, 2011
| | | | |
| | | Initial Shares | | Service Shares |
| Expenses paid per $1,000† | | $4.40 | | $5.61 |
| Ending value (after expenses) | | $918.20 | | $917.50 |
COMPARING YOUR FUND’S EXPENSES
WITH THOSE OF OTHER FUNDS (Unaudited)
Using the SEC’s method to compare expenses
The Securities and Exchange Commission (SEC) has established guidelines to help investors assess fund expenses. Per these guidelines, the table below shows your fund’s expenses based on a $1,000 investment, assuming a hypothetical 5% annualized return. You can use this information to compare the ongoing expenses (but not transaction expenses or total cost) of investing in the fund with those of other funds.All mutual fund shareholder reports will provide this information to help you make this comparison. Please note that you cannot use this information to estimate your actual ending account balance and expenses paid during the period.
Expenses and Value of a $1,000 Investment
assuming a hypothetical 5% annualized return for the six months ended December 31, 2011
| | | | |
| | | Initial Shares | | Service Shares |
| Expenses paid per $1,000† | | $4.63 | | $5.90 |
| Ending value (after expenses) | | $1,020.62 | | $1,019.36 |
|
| † Expenses are equal to the fund’s annualized expense ratio of .91% for Initial shares and 1.16% for Service shares, |
| multiplied by the average account value over the period, multiplied by 184/365 (to reflect the one-half year period). |
8
|
| STATEMENT OF INVESTMENTS |
| December 31, 2011 |
| | | |
| Common Stocks—99.3% | Shares | Value ($) |
| Consumer Discretionary—16.3% | | |
| Amazon.com | 3,830a | 662,973 |
| Carnival | 13,914 | 454,153 |
| Dick’s Sporting Goods | 5,630 | 207,634 |
| DIRECTV, Cl. A | 7,510a | 321,128 |
| Express | 10,120 | 201,793 |
| Home Depot | 8,550 | 359,442 |
| Johnson Controls | 30,990 | 968,747 |
| Limited Brands | 7,910 | 319,168 |
| Macy’s | 14,920 | 480,126 |
| Michael Kors Holdings | 7,260 | 197,835 |
| Newell Rubbermaid | 74,940 | 1,210,281 |
| News, Cl. A | 32,280 | 575,875 |
| Nordstrom | 5,540 | 275,393 |
| Omnicom Group | 42,040 | 1,874,143 |
| Priceline.com | 810a | 378,845 |
| PVH | 4,880 | 343,991 |
| Regal Entertainment Group, Cl. A | 14,720b | 175,757 |
| Ross Stores | 6,460 | 307,044 |
| Royal Caribbean Cruises | 10,450 | 258,847 |
| Target | 5,170 | 264,807 |
| Time Warner | 37,226 | 1,345,348 |
| Under Armour, Cl. A | 3,820a,b | 274,238 |
| Viacom, Cl. B | 9,880 | 448,651 |
| | | 11,906,219 |
| Consumer Staples—8.8% | | |
| Coca-Cola Enterprises | 9,380 | 241,816 |
| ConAgra Foods | 35,330 | 932,712 |
| Energizer Holdings | 5,420a | 419,942 |
| Kraft Foods, Cl. A | 22,880 | 854,797 |
| Lorillard | 1,590 | 181,260 |
| PepsiCo | 22,400 | 1,486,240 |
| Philip Morris International | 14,320 | 1,123,834 |
| Procter & Gamble | 12,890 | 859,892 |
| Whole Foods Market | 4,300 | 299,194 |
| | | 6,399,687 |
STATEMENT OF INVESTMENTS (continued)
| | | | |
| Common Stocks (continued) | Shares | | | Value ($) |
| Energy—11.5% | | | | |
| Cameron International | 4,750 a | | | 233,652 |
| Chevron | 4,650 | | | 494,760 |
| ENSCO, ADR | 7,780 | | | 365,038 |
| EOG Resources | 4,920 | | | 484,669 |
| EQT | 3,360 | | | 184,094 |
| Exxon Mobil | 19,300 | | | 1,635,868 |
| National Oilwell Varco | 4,610 | | | 313,434 |
| Occidental Petroleum | 22,540 | | | 2,111,998 |
| Pioneer Natural Resources | 4,120 | | | 368,658 |
| Schlumberger | 28,699 | | | 1,960,429 |
| Southwestern Energy | 7,150a | | 228,371 |
| | | | | 8,380,971 |
| Financial—13.0% | | | | |
| Ameriprise Financial | 6,650 | | | 330,106 |
| Arthur J. Gallagher & Co. | 19,900 | | | 665,456 |
| Capital One Financial | 14,090 b | | | 595,866 |
| Comerica | 22,040 | | | 568,632 |
| Discover Financial Services | 13,010 | | | 312,240 |
| Franklin Resources | 2,530 | | | 243,032 |
| Goldman Sachs Group | 2,260 | | | 204,372 |
| IntercontinentalExchange | 1,580 a | | | 190,469 |
| JPMorgan Chase & Co. | 53,236 | | | 1,770,097 |
| Marsh & McLennan | 14,800 | | | 467,976 |
| MetLife | 21,400 | | | 667,252 |
| Moody’s | 20,250b | | 682,020 |
| New York Community Bancorp | 19,300 | | | 238,741 |
| TD Ameritrade Holding | 9,960 | | | 155,874 |
| Travelers | 3,140 | | | 185,794 |
| U.S. Bancorp | 35,110 | | | 949,726 |
| Wells Fargo & Co. | 44,460 | | | 1,225,318 |
| | | | | 9,452,971 |
| Health Care—11.7% | | | | |
| Agilent Technologies | 6,150a | | 214,819 |
| Alexion Pharmaceuticals | 2,860a | | | 204,490 |
10
| | | | |
| Common Stocks (continued) | Shares | | | Value ($) |
| Health Care (continued) | | | | |
| Allergan | 3,200 | | | 280,768 |
| Amgen | 3,930 | | | 252,345 |
| Baxter International | 5,250 | | | 259,770 |
| Biogen Idec | 2,630a | | | 289,431 |
| Bristol-Myers Squibb | 6,010 | | | 211,792 |
| Celgene | 5,530a | | 373,828 |
| Gilead Sciences | 9,290a | | 380,240 |
| Johnson & Johnson | 10,093 | | | 661,899 |
| McKesson | 10,130 | | | 789,228 |
| Medtronic | 5,390 | | | 206,167 |
| Merck & Co. | 28,850 | | | 1,087,645 |
| Omnicare | 13,070 | | | 450262 |
| Perrigo | 2,130 | | | 207,249 |
| Pfizer | 100,500 | | | 2,174,820 |
| Watson Pharmaceuticals | 4,870a | | | 293,856 |
| WellCare Health Plans | 3,320a | | | 174,300 |
| | | | | 8,512,909 |
| Industrial—11.1% | | | | |
| Caterpillar | 13,100 | | | 1,186,860 |
| Cooper Industries | 9,680 | | | 524,172 |
| Cummins | 5,270 | | | 463,865 |
| Danaher | 11,930 | | | 561,187 |
| Dover | 17,030 | | | 988,591 |
| Eaton | 27,990 | | | 1,218,405 |
| General Electric | 70,460 | | | 1,261,939 |
| Hubbell, Cl. B | 8,800 | | | 588,368 |
| Pitney Bowes | 14,110b | | 261,599 |
| Precision Castparts | 2,470 | | | 407,031 |
| Stanley Black & Decker | 6,680 | | | 451,568 |
| United Technologies | 2,530 | | | 184,918 |
| | | | | 8,098,503 |
| Information Technology—20.1% | | | | |
| Accenture, Cl. A | 4,270 | | | 227,292 |
| Analog Devices | 13,720 | | | 490,902 |
STATEMENT OF INVESTMENTS (continued)
| | | |
| Common Stocks (continued) | Shares | Value ($) |
| Information Technology (continued) | | |
| Apple | 5,456a | 2,209,680 |
| Broadcom, Cl. A | 6,050 | 177,628 |
| Cisco Systems | 66,580 | 1,203,766 |
| Citrix Systems | 4,020a | 244,094 |
| Cypress Semiconductor | 18,800 | 317,532 |
| Electronic Arts | 16,940a | 348,964 |
| EMC | 20,290a | 437,047 |
| F5 Networks | 2,890a | 306,687 |
| Google, Cl. A | 2,173a | 1,403,541 |
| Intuit | 7,880 | 414,409 |
| MasterCard, Cl. A | 1,170 | 436,199 |
| Oracle | 35,970 | 922,631 |
| Paychex | 23,140 | 696,745 |
| QUALCOMM | 42,680 | 2,334,596 |
| Riverbed Technology | 13,270a | 311,845 |
| Salesforce.com | 2,850a | 289,161 |
| SanDisk | 8,650a | 425,667 |
| Teradata | 5,930a | 287,664 |
| Texas Instruments | 28,910 | 841,570 |
| VMware, Cl. A | 3,670a | 305,307 |
| | | 14,632,927 |
| Materials—4.2% | | |
| Air Products & Chemicals | 9,440 | 804,194 |
| Cliffs Natural Resources | 4,360 | 271,846 |
| Dow Chemical | 12,310 | 354,036 |
| Eastman Chemical | 6,750 | 263,655 |
| Freeport-McMoRan Copper & Gold | 19,324 | 710,930 |
12
| | | |
| Common Stocks (continued) | Shares | | Value ($) |
| Materials (continued) | | | |
| Monsanto | 6,760 | | 473,673 |
| Packaging Corp. of America | 7,400 | | 186,776 |
| | | | 3,065,110 |
| Telecommunication | | | |
| Services—1.9% | | | |
| AT&T | 8,570 | | 259,157 |
| Vodafone Group, ADR | 23,850 | | 668,516 |
| Windstream | 40,740 | b | 478,288 |
| | | | 1,405,961 |
| Utilities—.7% | | | |
| Exelon | 8,100 | | 351,297 |
| PPL | 6,070 | | 178,579 |
| | | | 529,876 |
| Total Common Stocks | | | |
| (cost $67,930,366) | | | 72,385,134 |
| |
| Preferred Stocks—.4% | | | |
| Financial | | | |
| Citigroup, | | | |
| Conv., Cum. $7.50 | | | |
| (cost $273,079) | 3,290 | | 267,312 |
| |
| Other Investment—.4% | | | |
| Registered Investment Company; | | | |
| Dreyfus Institutional Preferred | | | |
| Plus Money Market Fund | | | |
| (cost $268,468) | 268,468 | c | 268,468 |
STATEMENT OF INVESTMENTS (continued)
| | | | |
| Investment of Cash Collateral | | |
| for Securities Loaned—2.4% | Shares | Value ($) |
| Registered Investment Company; | | |
| Dreyfus Institutional Cash Advantage Fund | | |
| (cost $1,727,431) | 1,727,431c | 1,727,431 |
| Total Investments (cost $70,199,344) | 102.5% | 74,648,345 |
| Liabilities, Less Cash and Receivables | (2.5%) | (1,797,591) |
| Net Assets | 100.0% | 72,850,754 |
ADR—American Depository Receipts
|
| a Non-income producing security. |
| b Security, or portion thereof, on loan.At December 31, 2011, the value of the fund’s securities on loan was |
| $1,670,541 and the value of the collateral held by the fund was $1,727,431. |
| c Investment in affiliated money market mutual fund. |
| | | |
| Portfolio Summary (Unaudited)† | | |
| |
| | Value (%) | | Value (%) |
| Information Technology | 20.1 | Consumer Staples | 8.8 |
| Consumer Discretionary | 16.3 | Materials | 4.2 |
| Financial | 13.4 | Money Market Investments | 2.8 |
| Health Care | 11.7 | Telecommunication Services | 1.9 |
| Energy | 11.5 | Utilities | .7 |
| Industrial | 11.1 | | 102.5 |
| |
| † Based on net assets. | | | |
| See notes to financial statements. | | | |
14
|
| STATEMENT OF ASSETS AND LIABILITIES |
| December 31, 2011 |
| | | |
| | Cost | Value |
| Assets ($): | | |
| Investments in securities—See Statement of Investments (including | | |
| securities on loan, valued at $1,670,541)—Note 1(b): | | |
| Unaffiliated issuers | 68,203,445 | 72,652,446 |
| Affiliated issuers | 1,995,899 | 1,995,899 |
| Cash | | 4,556 |
| Dividends and securities lending income receivable | | 163,173 |
| Receivable for investment securities sold | | 57,073 |
| Receivable for shares of Beneficial Interest subscribed | | 119 |
| Prepaid expenses | | 3,462 |
| | | 74,876,728 |
| Liabilities ($): | | |
| Due to The Dreyfus Corporation and affiliates—Note 3(b) | | 60,435 |
| Liability for securities on loan—Note 1(b) | | 1,727,431 |
| Payable for shares of Beneficial Interest redeemed | | 148,239 |
| Payable for investment securities purchased | | 71,672 |
| Accrued expenses | | 18,197 |
| | | 2,025,974 |
| Net Assets ($) | | 72,850,754 |
| Composition of Net Assets ($): | | |
| Paid-in capital | | 87,926,116 |
| Accumulated undistributed investment income—net | | 41,114 |
| Accumulated net realized gain (loss) on investments | | (19,565,477) |
| Accumulated net unrealized appreciation | | |
| (depreciation) on investments | | 4,449,001 |
| Net Assets ($) | | 72,850,754 |
| |
| |
| Net Asset Value Per Share | | |
| | Initial Shares | Service Shares |
| Net Assets ($) | 65,628,573 | 7,222,181 |
| Shares Outstanding | 3,461,909 | 380,587 |
| Net Asset Value Per Share ($) | 18.96 | 18.98 |
| |
| See notes to financial statements. | | |
|
| STATEMENT OF OPERATIONS |
| Year Ended December 31, 2011 |
| | |
| Investment Income ($): | |
| Income: | |
| Cash dividends (net of $573 foreign taxes withheld at source): | |
| Unaffiliated issuers | 1,724,479 |
| Affiliated issuers | 429 |
| Income from securities lending—Note 1(b) | 5,515 |
| Total Income | 1,730,423 |
| Expenses: | |
| Investment advisory fee—Note 3(a) | 607,818 |
| Auditing fees | 41,004 |
| Custodian fees—Note 3(b) | 20,752 |
| Distribution fees—Note 3(b) | 20,733 |
| Prospectus and shareholders’ reports | 20,310 |
| Trustees’ fees and expenses—Note 3(c) | 9,662 |
| Legal fees | 5,011 |
| Shareholder servicing costs—Note 3(b) | 1,783 |
| Loan commitment fees—Note 2 | 1,245 |
| Miscellaneous | 17,350 |
| Total Expenses | 745,668 |
| Less—reduction in fees due to earnings credits—Note 3(b) | (2) |
| Net Expenses | 745,666 |
| Investment Income—Net | 984,757 |
| Realized and Unrealized Gain (Loss) on Investments—Note 4 ($): | |
| Net realized gain (loss) on investments | 7,419,094 |
| Net realized gain (loss) on options transactions | 37,416 |
| Net Realized Gain (Loss) | 7,456,510 |
| Net unrealized appreciation (depreciation) on investments | (10,574,186) |
| Net unrealized appreciation (depreciation) on options transactions | (1,526) |
| Net Unrealized Appreciation (Depreciation) | (10,575,712) |
| Net Realized and Unrealized Gain (Loss) on Investments | (3,119,202) |
| Net (Decrease) in Net Assets Resulting from Operations | (2,134,445) |
| |
| See notes to financial statements. | |
16
STATEMENT OF CHANGES IN NET ASSETS
| | | | |
| | Year Ended December 31, |
| | 2011 | 2010 |
| Operations ($): | | |
| Investment income—net | 984,757 | 987,912 |
| Net realized gain (loss) on investments | 7,456,510 | 11,807,862 |
| Net unrealized appreciation | | |
| (depreciation) on investments | (10,575,712) | 1,285,664 |
| Net Increase (Decrease) in Net Assets | | |
| Resulting from Operations | (2,134,445) | 14,081,438 |
| Dividends to Shareholders from ($): | | |
| Investment income—net: | | |
| Initial Shares | (907,365) | (902,514) |
| Service Shares | (81,785) | (82,430) |
| Total Dividends | (989,150) | (984,944) |
| Beneficial Interest Transactions ($): | | |
| Net proceeds from shares sold: | | |
| Initial Shares | 2,620,731 | 2,666,633 |
| Service Shares | 182,174 | 182,777 |
| Dividends reinvested: | | |
| Initial Shares | 907,365 | 902,514 |
| Service Shares | 81,785 | 82,430 |
| Cost of shares redeemed: | | |
| Initial Shares | (12,250,536) | (21,275,606) |
| Service Shares | (1,746,186) | (2,655,475) |
| Increase (Decrease) in Net Assets from | | |
| Beneficial Interest Transactions | (10,204,667) | (20,096,727) |
| Total Increase (Decrease) in Net Assets | (13,328,262) | (7,000,233) |
| Net Assets ($): | | |
| Beginning of Period | 86,179,016 | 93,179,249 |
| End of Period | 72,850,754 | 86,179,016 |
| Undistributed investment income—net | 41,114 | 51,989 |
STATEMENT OF CHANGES IN NET ASSETS (continued)
| | | | |
| | Year Ended December 31, |
| | 2011 | 2010 |
| Capital Share Transactions: | | |
| Initial Shares | | |
| Shares sold | 131,161 | 150,055 |
| Shares issued for dividends reinvested | 46,954 | 50,634 |
| Shares redeemed | (620,661) | (1,229,028) |
| Net Increase (Decrease) in Shares Outstanding | (442,546) | (1,028,339) |
| Service Shares | | |
| Shares sold | 8,896 | 10,621 |
| Shares issued for dividends reinvested | 4,230 | 4,597 |
| Shares redeemed | (89,124) | (151,113) |
| Net Increase (Decrease) in Shares Outstanding | (75,998) | (135,895) |
| |
| See notes to financial statements. | | |
18
FINANCIAL HIGHLIGHTS
The following tables describe the performance for each share class for the fiscal periods indicated.All information (except portfolio turnover rate) reflects financial results for a single fund share.Total return shows how much your investment in the fund would have increased (or decreased) during each period, assuming you had reinvested all dividends and distributions. The fund’s total returns do not reflect expenses associated with variable annuity or insurance contracts.These figures have been derived from the fund’s financial statements.
| | | | | | | | | | |
| | | Year Ended December 31, | |
| Initial Shares | 2011 | 2010 | 2009 | 2008 | 2007 |
| Per Share Data ($): | | | | | |
| Net asset value, beginning of period | 19.76 | 16.86 | 13.27 | 25.42 | 24.79 |
| Investment Operations: | | | | | |
| Investment income—neta | .25 | .20 | .19 | .13 | .19 |
| Net realized and unrealized | | | | | |
| gain (loss) on investments | (.80) | 2.91 | 3.59 | (9.53) | 1.79 |
| Total from Investment Operations | (.55) | 3.11 | 3.78 | (9.40) | 1.98 |
| Distributions: | | | | | |
| Dividends from investment income—net | (.25) | (.21) | (.19) | (.13) | (.19) |
| Dividends from net realized | | | | | |
| gain on investments | — | — | — | (2.62) | (1.16) |
| Total Distributions | (.25) | (.21) | (.19) | (2.75) | (1.35) |
| Net asset value, end of period | 18.96 | 19.76 | 16.86 | 13.27 | 25.42 |
| Total Return (%) | (2.79) | 18.61 | 28.79 | (40.41) | 8.44 |
| Ratios/Supplemental Data (%): | | | | | |
| Ratio of total expenses | | | | | |
| to average net assets | .89 | .88 | .88 | .85 | .81 |
| Ratio of net expenses | | | | | |
| to average net assets | .89 | .88 | .84 | .85 | .81 |
| Ratio of net investment income | | | | | |
| to average net assets | 1.24 | 1.16 | 1.32 | .66 | .76 |
| Portfolio Turnover Rate | 83.28 | 82.26 | 113.45 | 134.81 | 71.85 |
| Net Assets, end of period ($ x 1,000) | 65,629 | 77,151 | 83,182 | 73,919 | 149,445 |
| |
| a Based on average shares outstanding at each month end. | | | | |
| See notes to financial statements. | | | | | |
FINANCIAL HIGHLIGHTS (continued)
| | | | | | | | | | |
| | | Year Ended December 31, | |
| Service Shares | 2011 | 2010 | 2009 | 2008 | 2007 |
| Per Share Data ($): | | | | | |
| Net asset value, beginning of period | 19.77 | 16.87 | 13.28 | 25.43 | 24.80 |
| Investment Operations: | | | | | |
| Investment income—neta | .20 | .16 | .15 | .08 | .14 |
| Net realized and unrealized | | | | | |
| gain (loss) on investments | (.79) | 2.91 | 3.59 | (9.53) | 1.79 |
| Total from Investment Operations | (.59) | 3.07 | 3.74 | (9.45) | 1.93 |
| Distributions: | | | | | |
| Dividends from investment income—net | (.20) | (.17) | (.15) | (.08) | (.14) |
| Dividends from net realized | | | | | |
| gain on investments | — | — | — | (2.62) | (1.16) |
| Total Distributions | (.20) | (.17) | (.15) | (2.70) | (1.30) |
| Net asset value, end of period | 18.98 | 19.77 | 16.87 | 13.28 | 25.43 |
| Total Return (%) | (2.99) | 18.29 | 28.44 | (40.53) | 8.19 |
| Ratios/Supplemental Data (%): | | | | | |
| Ratio of total expenses | | | | | |
| to average net assets | 1.14 | 1.13 | 1.13 | 1.10 | 1.06 |
| Ratio of net expenses | | | | | |
| to average net assets | 1.14 | 1.13 | 1.09 | 1.10 | 1.00 |
| Ratio of net investment income | | | | | |
| to average net assets | .99 | .91 | 1.08 | .40 | .55�� |
| Portfolio Turnover Rate | 83.28 | 82.26 | 113.45 | 134.81 | 71.85 |
| Net Assets, end of period ($ x 1,000) | 7,222 | 9,028 | 9,997 | 9,990 | 21,294 |
| |
| a Based on average shares outstanding at each month end. | | | | |
| See notes to financial statements. | | | | | |
20
NOTES TO FINANCIAL STATEMENTS
NOTE 1—Significant Accounting Policies:
Dreyfus Variable Investment Fund (the “Company”) is registered under the Investment Company Act of 1940, as amended (the “Act”), as an open end management investment company, operating as a series company currently offering seven series, including the Growth and Income Portfolio (the “fund”).The fund is only offered to separate accounts established by insurance companies to fund variable annuity contracts and variable life insurance policies.The fund is a non-diversified series.The fund’s investment objective is to seek long-term capital growth, current income and growth of income consistent with reasonable investment risk.The Dreyfus Corporation (the “Manager” or “Dreyfus”), a wholly-owned subsidiary ofThe Bank of NewYork Mellon Corporation (“BNY Mellon”), serves as the fund’s investment adviser.
MBSC Securities Corporation (the “Distributor”), a wholly-owned subsidiary of the Manager, is the distributor of the fund’s shares, which are sold without a sales charge. The fund is authorized to issue an unlimited number of $.001 par value shares of Beneficial Interest in each of the following classes of shares: Initial and Service. Each class of shares has identical rights and privileges, except with respect to the distribution plan, the expenses borne by each class, the allocation of certain transfer agency costs and certain voting rights. Income, expenses (other than expenses attributable to a specific class), and realized and unrealized gains or losses on investments are allocated to each class of shares based on its relative net assets.
The Company accounts separately for the assets, liabilities and operations of each series. Expenses directly attributable to each series are charged to that series’ operations; expenses which are applicable to all series are allocated among them on a pro rata basis.
The Financial Accounting Standards Board (“FASB”) Accounting Standards Codification (“ASC”) is the exclusive reference of authoritative U.S. generally accepted accounting principles (“GAAP”) recognized by the FASB to be applied by nongovernmental entities. Rules and inter-
NOTES TO FINANCIAL STATEMENTS (continued)
pretive releases of the Securities and Exchange Commission (“SEC”) under authority of federal laws are also sources of authoritative GAAP for SEC registrants. The fund’s financial statements are prepared in accordance with GAAP, which may require the use of management estimates and assumptions.Actual results could differ from those estimates.
The Company enters into contracts that contain a variety of indemnifications.The fund’s maximum exposure under these arrangements is unknown.The fund does not anticipate recognizing any loss related to these arrangements.
(a) Portfolio valuation: The fair value of a financial instrument is the amount that would be received to sell an asset or paid to transfer a liability in an orderly transaction between market participants at the measurement date (i.e. the exit price). GAAP establishes a fair value hierarchy that prioritizes the inputs of valuation techniques used to measure fair value.This hierarchy gives the highest priority to unadjusted quoted prices in active markets for identical assets or liabilities (Level 1 measurements) and the lowest priority to unobservable inputs (Level 3 measurements).
Additionally, GAAP provides guidance on determining whether the volume and activity in a market has decreased significantly and whether such a decrease in activity results in transactions that are not orderly. GAAP requires enhanced disclosures around valuation inputs and techniques used during annual and interim periods.
Various inputs are used in determining the value of the fund’s investments relating to fair value measurements.These inputs are summarized in the three broad levels listed below:
Level 1—unadjusted quoted prices in active markets for identical investments.
Level 2—other significant observable inputs (including quoted prices for similar investments, interest rates, prepayment speeds, credit risk, etc.).
Level 3—significant unobservable inputs (including the fund’s own assumptions in determining the fair value of investments).
22
The inputs or methodology used for valuing securities are not necessarily an indication of the risk associated with investing in those securities.
Changes in valuation techniques may result in transfers in or out of an assigned level within the disclosure hierarchy. Valuation techniques used to value the fund’s investments are as follows:
Investments in securities are valued at the last sales price on the securities exchange or national securities market on which such securities are primarily traded. Securities listed on the National Market System for which market quotations are available are valued at the official closing price or, if there is no official closing price that day, at the last sales price. Securities not listed on an exchange or the national securities market, or securities for which there were no transactions, are valued at the average of the most recent bid and asked prices, except for open short positions, where the asked price is used for valuation purposes. Bid price is used when no asked price is available. Registered investment companies that are not traded on an exchange are valued at their net asset value.All preceding securities are categorized within Level 1 of the fair value hierarchy.
Fair valuing of securities may be determined with the assistance of a pricing service using calculations based on indices of domestic securities and other appropriate indicators, such as prices of relevant ADRs and futures contracts. Utilizing these techniques may result in transfers between Level 1 and Level 2 of the fair value hierarchy.
When market quotations or official closing prices are not readily available, or are determined not to reflect accurately fair value, such as when the value of a security has been significantly affected by events after the close of the exchange or market on which the security is principally traded (for example, a foreign exchange or market), but before the fund calculates its net asset value, the fund may value these investments at fair value as determined in accordance with the procedures approved by the Board of Trustees. Certain factors may be considered when fair valuing investments such as: fundamental analytical data, the nature and duration of restrictions on disposition, an evaluation of the forces that influence
NOTES TO FINANCIAL STATEMENTS (continued)
the market in which the securities are purchased and sold, and public trading in similar securities of the issuer or comparable issuers. These securities are either categorized as Level 2 or 3 depending on the relevant inputs used.
For restricted securities where observable inputs are limited, assumptions about market activity and risk are used and are categorized within Level 3 of the fair value hierarchy.
Options, which are traded on an exchange, are valued at the last sales price on the securities exchange on which such securities are primarily traded or at the last sales price on the national securities market on each business day.These securities are generally categorized within Level 1 of the fair value hierarchy. Options traded over-the-counter are valued at the mean between the bid and asked price.These securities are generally categorized within Level 2 of the fair value hierarchy.
The following is a summary of the inputs used as of December 31, 2011 in valuing the fund’s investments:
| | | | |
| | | Level 2—Other | Level 3— | |
| | Level 1— | Significant | Significant | |
| | Unadjusted | Observable | Unobservable | |
| | Quoted Prices | Inputs | Inputs | Total |
| Assets ($) | | | | |
| Investments in Securities: | | | |
| Equity Securities— | | | | |
| Domestic† | 71,153,745 | 267,312 | — | 71,421,057 |
| Equity Securities— | | | | |
| Foreign† | 1,231,389 | — | — | 1,231,389 |
| Mutual Funds | 1,995,899 | — | — | 1,995,899 |
| † See Statement of Investments for additional detailed categorizations. | |
In May 2011, FASB issued Accounting Standards Update (“ASU”) No. 2011-04 “Amendments to Achieve Common FairValue Measurement and Disclosure Requirements in GAAP and International Financial Reporting Standards (“IFRS”)” (“ASU 2011-04”). ASU 2011-04 includes common requirements for measurement of and disclosure about fair value between GAAP and IFRS. ASU 2011-04 will require
24
reporting entities to disclose the following information for fair value measurements categorized within Level 3 of the fair value hierarchy: quantitative information about the unobservable inputs used in the fair value measurement, the valuation processes used by the reporting entity and a narrative description of the sensitivity of the fair value measurement to changes in unobservable inputs and the interrelationships between those unobservable inputs. In addition, ASU 2011-04 will require reporting entities to make disclosures about amounts and reasons for all transfers in and out of Level 1 and Level 2 fair value mea-surements.The new and revised disclosures are effective for interim and annual reporting periods beginning after December 15, 2011. At this time, management is evaluating the implications of ASU 2011-04 and its impact on the financial statements.
(b) Securities transactions and investment income: Securities transactions are recorded on a trade date basis. Realized gains and losses from securities transactions are recorded on the identified cost basis. Dividend income is recognized on the ex-dividend date and interest income, including, where applicable, accretion of discount and amortization of premium on investments, is recognized on the accrual basis.
Pursuant to a securities lending agreement with The Bank of New York Mellon, a subsidiary of BNY Mellon and an affiliate of Dreyfus, the fund may lend securities to qualified institutions. It is the fund’s policy that, at origination, all loans are secured by collateral of at least 102% of the value of U.S. securities loaned and 105% of the value of foreign securities loaned. Collateral equivalent to at least 100% of the market value of securities on loan is maintained at all times. Collateral is either in the form of cash, which can be invested in certain money market mutual funds managed by the Manager, U.S. Government and Agency securities or letters of credit.The fund is entitled to receive all income on securities loaned, in addition to income earned as a result of the lending transaction. Although each security loaned is fully collateralized, the fund bears the risk of delay in recovery of, or loss of
NOTES TO FINANCIAL STATEMENTS (continued)
rights in, the securities loaned should a borrower fail to return the securities in a timely manner. During the period ended December 31, 2011, The Bank of New York Mellon earned $2,363 from lending portfolio securities, pursuant to the securities lending agreement.
(c) Affiliated issuers: Investments in other investment companies advised by Dreyfus are defined as “affiliated” in the Act.
The fund may invest in shares of certain affiliated investment companies also advised or managed by Dreyfus. Investments in affiliated investment companies for the period ended December 31, 2011 were as follows:
| | | | | | | |
| Affiliated | | | | | | | |
| Investment | Value | | | | Value | | Net |
| Company | 12/31/2010 ($) | | Purchases ($) | Sales ($) | 12/31/2011 ($) | | Assets (%) |
| Dreyfus | | | | | | | |
| Institutional | | | | | | | |
| Preferred | | | | | | | |
| Plus Money | | | | | | | |
| Market Fund | 874,000 | | 12,682,285 | 13,287,817 | 268,468 | | .4 |
| Dreyfus | | | | | | | |
| Institutional | | | | | | | |
| Cash | | | | | | | |
| Advantage | | | | | | | |
| Fund | 3,432,688 | | 56,142,261 | 57,847,518 | 1,727,431 | | 2.4 |
| Total | 4,306,688 | | 68,824,546 | 71,135,335 | 1,995,899 | | 2.8 |
(d) Dividends to shareholders: Dividends are recorded on the ex-dividend date. The fund declares and pays dividends from investment income-net on a quarterly basis. Dividends from net realized capital gains, if any, are normally declared and paid annually, but the fund may make distributions on a more frequent basis to comply with the distribution requirements of the Internal Revenue Code of 1986, as amended (the “Code”).To the extent that net realized capital gains can be offset by capital loss carryovers, it is the policy of the fund not to distribute such gains. Income and capital gain distributions are determined in accordance with income tax regulations, which may differ from GAAP.
(e) Federal income taxes: It is the policy of the fund to continue to qualify as a regulated investment company, if such qualification is in the best interests of its shareholders, by complying with the applicable pro-
26
visions of the Code, and to make distributions of taxable income sufficient to relieve it from substantially all federal income and excise taxes.
As of and during the period ended December 31, 2011, the fund did not have any liabilities for any uncertain tax positions.The fund recognizes interest and penalties, if any, related to uncertain tax positions as income tax expense in the Statement of Operations. During the period, the fund did not incur any interest or penalties.
Each of the tax years in the four-year period ended December 31, 2011 remains subject to examination by the Internal Revenue Service and state taxing authorities.
At December 31, 2011, the components of accumulated earnings on a tax basis were as follows: undistributed ordinary income $41,114, accumulated capital losses $18,903,892 and unrealized appreciation $4,117,949. In addition, the fund had $330,533 of capital losses realized after October 31, 2011, which were deferred for tax purposes to the first day of the following fiscal year.
Under the Regulated Investment Company Modernization Act of 2010 (the “2010 Act”), the fund will be permitted to carry forward capital losses incurred in taxable years beginning after December 22, 2010 (“post-enactment losses”) for an unlimited period. Post-enactment capital loss carryovers will retain their character as either short-term or long-term capital losses rather than be considered short-term as they were under previous statute. However, the 2010 Act requires post-enactment losses to be utilized before the utilization of losses incurred in taxable years prior to the effective date of the 2010 Act (“pre-enactment losses”). As a result of this ordering rule, pre-enactment losses may be more likely to expire unused.
The accumulated capital loss carryover is available for federal income tax purposes to be applied against future net securities profits, if any, realized subsequent to December 31, 2011. If not applied, $9,174,254 of the carryover expires in fiscal 2016 and $9,729,638 expires in fiscal 2017.
NOTES TO FINANCIAL STATEMENTS (continued)
The tax character of distributions paid to shareholders during the fiscal periods ended December 31, 2011 and December 31, 2010, were as follows: ordinary income $989,150 and $984,944, respectively.
During the period ended December 31, 2011, as a result of permanent book to tax differences, primarily due to the tax treatment for return of capital distributions, the fund decreased accumulated undistributed investment income-net by $6,482, increased accumulated net realized gain (loss) on investments by $3,058 and increased paid-in capital by $3,424. Net assets and net asset value per share were not affected by this reclassification.
NOTE 2—Bank Lines of Credit:
The fund participates with other Dreyfus-managed funds in a $225 million unsecured credit facility led by Citibank, N.A. and a $300 million unsecured credit facility provided by The Bank of New York Mellon (each, a “Facility”), each to be utilized primarily for temporary or emergency purposes, including the financing of redemptions. In connection therewith, the fund has agreed to pay its pro rata portion of commitment fees for each Facility. Interest is charged to the fund based on rates determined pursuant to the terms of the respective Facility at the time of borrowing. During the period ended December 31, 2011, the fund did not borrow under the Facilities.
NOTE 3—Investment Advisory Fee and Other Transactions With Affiliates:
(a) Pursuant to an investment advisory agreement with the Manager, the investment advisory fee is computed at the annual rate of .75% of the value of the fund’s average daily net assets and is payable monthly.
(b) Under the Distribution Plan (the “Plan”) adopted pursuant to Rule 12b-1 under the Act, Service shares pay the Distributor for distributing its shares, for servicing and/or maintaining Service shares’ shareholder accounts and for advertising and marketing for Service shares.The Plan
28
provides for payments to be made at an annual rate of .25% of the value of the Service shares’ average daily net assets.The Distributor may make payments to Participating Insurance Companies and to brokers and dealers acting as principal underwriter for their variable insurance products.The fees payable under the Plan are payable without regard to actual expenses incurred. During the period ended December 31, 2011, Service shares were charged $20,733 pursuant to the Plan.
The fund compensates Dreyfus Transfer, Inc., a wholly-owned subsidiary of the Manager, under a transfer agency agreement for providing personnel and facilities to perform transfer agency services for the fund. During the period ended December 31, 2011, the fund was charged $465 pursuant to the transfer agency agreement, which is included in Shareholder servicing costs in the Statement of Operations.
The fund has arrangements with the custodian and cash management bank whereby the fund may receive earnings credits when positive cash balances are maintained, which are used to offset custody and cash management fees. For financial reporting purposes, the fund includes net earnings credits as an expense offset in the Statement of Operations.
The fund compensates The Bank of New York Mellon under cash management agreements for performing cash management services related to fund subscriptions and redemptions. During the period ended December 31, 2011, the fund was charged $73 pursuant to the cash management agreements, which is included in Shareholder servicing costs in the Statement of Operations.These fees were partially offset by earnings credits of $2.
The fund also compensates The Bank of New York Mellon under a custody agreement for providing custodial services for the fund. During the period ended December 31, 2011, the fund was charged $20,752 pursuant to the custody agreement.
NOTES TO FINANCIAL STATEMENTS (continued)
During the period ended December 31, 2011, the fund was charged $6,402 for services performed by the Chief Compliance Officer.
The components of “Due to The Dreyfus Corporation and affiliates” in the Statement of Assets and Liabilities consist of: investment advisory fees $46,465, Rule 12b-1 distribution plan fees $1,543, custodian fees $7,060, chief compliance officer fees $5,295 and transfer agency per account fees $72.
(c) Each Board member also serves as a Board member of other funds within the Dreyfus complex. Annual retainer fees and attendance fees are allocated to each fund based on net assets.
NOTE 4—Securities Transactions:
The aggregate amount of purchases and sales of investment securities, excluding short-term securities and options transactions, during the period ended December 31, 2011, amounted to $67,642,381 and $76,940,171, respectively.
Options: The fund purchases and writes (sells) put and call options to hedge against changes in the values of equities, or as a substitute for an investment.The fund is subject to market risk in the course of pursuing its investment objectives through its investments in options contracts.A call option gives the purchaser of the option the right (but not the obligation) to buy, and obligates the writer to sell, the underlying security or securities at the exercise price at any time during the option period, or at a specified date. Conversely, a put option gives the purchaser of the option the right (but not the obligation) to sell, and obligates the writer to buy the underlying security or securities at the exercise price at any time during the option period, or at a specified date.
As a writer of call options, the fund receives a premium at the outset and then bears the market risk of unfavorable changes in the price of the financial instrument underlying the option. Generally, the fund realizes a gain, to the extent of the premium, if the price of the underlying finan-
30
cial instrument decreases between the date the option is written and the date on which the option is terminated. Generally, the fund incurs a loss, if the price of the financial instrument increases between those dates.
As a writer of put options, the fund receives a premium at the outset and then bears the market risk of unfavorable changes in the price of the financial instrument underlying the option. Generally, the fund realizes a gain, to the extent of the premium, if the price of the underlying financial instrument increases between the date the option is written and the date on which the option is terminated. Generally, the fund incurs a loss, if the price of the financial instrument decreases between those dates.
As a writer of an option, the fund has no control over whether the underlying securities may be sold (call) or purchased (put) and as a result bears the market risk of an unfavorable change in the price of the security underlying the written option.There is a risk of loss from a change in value of such options which may exceed the related premiums received. One risk of holding a put or a call option is that if the option is not sold or exercised prior to its expiration, it becomes worthless. However, this risk is limited to the premium paid by the fund. Upon the expiration or closing of the option transaction, a gain or loss is reported in the Statement of Operations.
The following summarizes the fund’s call/put options written during the period ended December 31, 2011
| | | | |
| | | | Options Terminated |
| | Number of | Premiums | | Net Realized |
| Options Written: | Contracts | Received ($) | Cost ($) | Gain ($) |
| Contracts outstanding | | | | |
| December 31, 2010 | 109 | 2,616 | | |
| Contracts written | 392 | 60,030 | | |
| Contracts terminated: | | | | |
| Contracts closed | 215 | 45,945 | 25,230 | 20,715 |
| Contracts expired | 286 | 16,701 | — | 16,701 |
| Total contracts terminated | 501 | 62,646 | 25,230 | 37,416 |
| Contracts Outstanding | | | | |
| December 31, 2011 | — | — | | |
NOTES TO FINANCIAL STATEMENTS (continued)
The following summarizes the average market value of derivatives outstanding during the period ended December 31, 2011:
| |
| | Average Market Value ($) |
| Equity options contracts | 5,278 |
At December 31, 2011, the cost of investments for federal income tax purposes was $70,530,396; accordingly, accumulated net unrealized appreciation on investments was $4,117,949, consisting of $6,947,348 gross unrealized appreciation and $2,829,399 gross unrealized depreciation.
32
|
| REPORT OF INDEPENDENT REGISTERED |
| PUBLIC ACCOUNTING FIRM |
Shareholders and Board of Trustees
Dreyfus Variable Investment Fund, Growth and Income Portfolio
We have audited the accompanying statement of assets and liabilities, including the statement of investments, of Dreyfus Variable Investment Fund, Growth and Income Portfolio (one of the series comprising Dreyfus Variable Investment Fund) as of December 31, 2011, and the related statement of operations for the year then ended, the statement of changes in net assets for each of the two years in the period then ended, and financial highlights for each of the years indicated therein. These financial statements and financial highlights are the responsibility of the Fund’s management. Our responsibility is to express an opinion on these financial statements and financial highlights based on our audits.
We conducted our audits in accordance with the standards of the Public Company Accounting Oversight Board (United States).Those standards require that we plan and perform the audit to obtain reasonable assurance about whether the financial statements and financial highlights are free of material misstatement.We were not engaged to perform an audit of the Fund’s internal control over financial reporting. Our audits included consideration of internal control over financial reporting as a basis for designing audit procedures that are appropriate in the circumstances, but not for the purpose of expressing an opinion on the effectiveness of the Fund’s internal control over financial reporting. Accordingly, we express no such opinion.An audit also includes examining, on a test basis, evidence supporting the amounts and disclosures in the financial statements and financial highlights, assessing the accounting principles used and significant estimates made by management, and evaluating the overall financial statement presentation. Our procedures included confirmation of securities owned as of December 31, 2011 by correspondence with the custodian and others.We believe that our audits provide a reasonable basis for our opinion.
In our opinion, the financial statements and financial highlights referred to above present fairly, in all material respects, the financial position of Dreyfus Variable Investment Fund, Growth and Income Portfolio at December 31, 2011, the results of its operations for the year then ended, the changes in its net assets for each of the two years in the period then ended, and the financial highlights for each of the indicated years, in conformity with U.S. generally accepted accounting principles.

|
| New York, New York |
| February 10, 2012 |
IMPORTANT TAX INFORMATION (Unaudited)
For federal tax purposes, the fund hereby designates 100% of the ordinary dividends paid during the fiscal year ended December 31, 2011 as qualifying for the corporate dividends received deduction. Shareholders will receive notification in early 2012 of the percentage applicable to the preparation of their 2011 income tax returns.
34
BOARD MEMBERS INFORMATION (Unaudited)
|
| Joseph S. DiMartino (68) |
| Chairman of the Board (1995) |
| Principal Occupation During Past 5Years: |
| • Corporate Director and Trustee |
| Other Public Company Board Memberships During Past 5Years: |
| • CBIZ (formerly, Century Business Services, Inc.), a provider of outsourcing functions for small |
| and medium size companies, Director (1997-present) |
| • Sunair Services Corporation, a provider of certain outdoor-related services to homes and |
| businesses, Director (2005-2009) |
| • The Newark Group, a provider of a national market of paper recovery facilities, paperboard |
| mills and paperboard converting plants, Director (2000-2010) |
| No. of Portfolios for which Board Member Serves: 164 |
| ——————— |
| Peggy C. Davis (68) |
| Board Member (2006) |
| Principal Occupation During Past 5Years: |
| • Shad Professor of Law, New York University School of Law |
| • Writer and teacher in the fields of evidence, constitutional theory, family law, social sciences |
| and the law, legal process and professional methodology and training |
| No. of Portfolios for which Board Member Serves: 53 |
| ——————— |
| David P. Feldman (72) |
| Board Member (1994) |
| Principal Occupation During Past 5Years: |
| • Corporate Director and Trustee |
| Other Public Company Board Memberships During Past 5Years: |
| • BBH Mutual Funds Group (4 registered mutual funds), Director (1992-present) |
| • QMed, Inc. a healthcare company, Director (1999-2007) |
| No. of Portfolios for which Board Member Serves: 49 |
BOARD MEMBERS INFORMATION (Unaudited) (continued)
|
| Ehud Houminer (71) |
| Board Member (2006) |
| Principal Occupation During Past 5Years: |
| • Executive-in-Residence at the Columbia Business School, Columbia University (1992-present) |
| Other Public Company Board Memberships During Past 5Years: |
| • Avnet Inc., an electronics distributor, Director (1993-present) |
| No. of Portfolios for which Board Member Serves: 63 |
| ——————— |
| Dr. Martin Peretz (72) |
| Board Member (1990) |
| Principal Occupation During Past 5Years: |
| • Editor-in-Chief Emeritus of The New Republic Magazine (2010-present) (previously, |
| Editor-in-Chief, 1974-2010) |
| • Director of TheStreet.com, a financial information service on the web (1996-present) |
| No. of Portfolios for which Board Member Serves: 35 |
| ——————— |
Once elected all Board Members serve for an indefinite term, but achieve Emeritus status upon reaching age 80.The address of the Board Members and Officers is in c/o The Dreyfus Corporation, 200 Park Avenue, NewYork, NewYork 10166.Additional information about the Board Members is available in the fund’s Statement of Additional Information which can be obtained from Dreyfus free of charge by calling this toll free number: 1-800-DREYFUS.
James F. Henry, Emeritus Board Member
Rosalind G. Jacobs, Emeritus Board Member
Dr. Paul A. Marks, Emeritus Board Member
Gloria Messinger, Emeritus Board Member
36
OFFICERS OF THE FUND (Unaudited)
BRADLEY J. SKAPYAK, President since January 2010.
Chief Operating Officer and a director of the Manager since June 2009. From April 2003 to June 2009, Mr. Skapyak was the head of the Investment Accounting and Support Department of the Manager. He is an officer of 75 investment companies (comprised of 163 portfolios) managed by the Manager. He is 53 years old and has been an employee of the Manager since February 1988.
JANETTE E. FARRAGHER, Vice President and Secretary since December 2011.
Assistant General Counsel of BNY Mellon, and an officer of 76 investment companies (comprised of 189 portfolios) managed by the Manager. She is 49 years old and has been an employee of the Manager since February 1984.
KIESHA ASTWOOD, Vice President and Assistant Secretary since January 2010.
Counsel of BNY Mellon, and an officer of 76 investment companies (comprised of 189 portfolios) managed by the Manager. She is 38 years old and has been an employee of the Manager since July 1995.
JAMES BITETTO, Vice President and Assistant Secretary since August 2005.
Senior Counsel of BNY Mellon and Secretary of the Manager, and an officer of 76 investment companies (comprised of 189 portfolios) managed by the Manager. He is 45 years old and has been an employee of the Manager since December 1996.
JONI LACKS CHARATAN, Vice President and Assistant Secretary since August 2005.
Senior Counsel of BNY Mellon, and an officer of 76 investment companies (comprised of 189 portfolios) managed by the Manager. She is 56 years old and has been an employee of the Manager since October 1988.
JOSEPH M. CHIOFFI, Vice President and Assistant Secretary since August 2005.
Senior Counsel of BNY Mellon, and an officer of 76 investment companies (comprised of 189 portfolios) managed by the Manager. He is 50 years old and has been an employee of the Manager since June 2000.
KATHLEEN DENICHOLAS, Vice President and Assistant Secretary since January 2010.
Managing Counsel of BNY Mellon, and an officer of 76 investment companies (comprised of 189 portfolios) managed by the Manager. She is 37 years old and has been an employee of the Manager since February 2001.
JOHN B. HAMMALIAN, Vice President and Assistant Secretary since August 2005.
Senior Managing Counsel of BNY Mellon, and an officer of 76 investment companies (comprised of 189 portfolios) managed by the Manager. He is 48 years old and has been an employee of the Manager since February 1991.
M. CRISTINA MEISER, Vice President and Assistant Secretary since January 2010.
Senior Counsel of BNY Mellon, and an officer of 76 investment companies (comprised of 189 portfolios) managed by the Manager. She is 41 years old and has been an employee of the Manager since August 2001.
ROBERT R. MULLERY, Vice President and Assistant Secretary since August 2005.
Managing Counsel of BNY Mellon, and an officer of 76 investment companies (comprised of 189 portfolios) managed by the Manager. He is 59 years old and has been an employee of the Manager since May 1986.
OFFICERS OF THE FUND (Unaudited) (continued)
JEFF PRUSNOFSKY, Vice President and Assistant Secretary since August 2005.
Senior Managing Counsel of BNY Mellon, and an officer of 76 investment companies (comprised of 189 portfolios) managed by the Manager. He is 46 years old and has been an employee of the Manager since October 1990.
JAMES WINDELS, Treasurer since November 2001.
Director – Mutual Fund Accounting of the Manager, and an officer of 76 investment companies (comprised of 189 portfolios) managed by the Manager. He is 53 years old and has been an employee of the Manager since April 1985.
RICHARD CASSARO, Assistant Treasurer since January 2008.
Senior Accounting Manager – Money Market and Municipal Bond Funds of the Manager, and an officer of 76 investment companies (comprised of 189 portfolios) managed by the Manager. He is 52 years old and has been an employee of the Manager since September 1982.
GAVIN C. REILLY, Assistant Treasurer since December 2005.
Tax Manager of the Investment Accounting and Support Department of the Manager, and an officer of 76 investment companies (comprised of 189 portfolios) managed by the Manager. He is 43 years old and has been an employee of the Manager since April 1991.
ROBERT S. ROBOL, Assistant Treasurer since August 2005.
Senior Accounting Manager – Fixed Income Funds of the Manager, and an officer of 76 investment companies (comprised of 189 portfolios) managed by the Manager. He is 47 years old and has been an employee of the Manager since October 1988.
ROBERT SALVIOLO, Assistant Treasurer since July 2007.
Senior Accounting Manager – Equity Funds of the Manager, and an officer of 76 investment companies (comprised of 189 portfolios) managed by the Manager. He is 44 years old and has been an employee of the Manager since June 1989.
ROBERT SVAGNA, Assistant Treasurer since December 2002.
Senior Accounting Manager – Equity Funds of the Manager, and an officer of 76 investment companies (comprised of 189 portfolios) managed by the Manager. He is 44 years old and has been an employee of the Manager since November 1990.
JOSEPH W. CONNOLLY, Chief Compliance Officer since October 2004.
Chief Compliance Officer of the Manager and The Dreyfus Family of Funds (76 investment companies, comprised of 189 portfolios). From November 2001 through March 2004, Mr. Connolly was first Vice-President, Mutual Fund Servicing for Mellon Global Securities Services. In that capacity, Mr. Connolly was responsible for managing Mellon’s Custody, Fund Accounting and Fund Administration services to third-party mutual fund clients. He is 54 years old and has served in various capacities with the Manager since 1980, including manager of the firm’s Fund Accounting Department from 1997 through October 2001.
STEPHEN J. STOREN, Anti-Money Laundering Compliance Officer since May 2011.
Chief Compliance Officer of the Distributor, and the Anti-Money Laundering Compliance Officer of 72 investment companies (comprised of 185 portfolios) managed by the Manager. He is 57 years old and has been an employee of the Distributor since October 1999.
38
For More Information

The fund files its complete schedule of portfolio holdings with the Securities and Exchange Commission (“SEC”) for the first and third quarters of each fiscal year on Form N-Q. The fund’s Forms N-Q are available on the SEC’s website at http://www.sec.gov and may be reviewed and copied at the SEC’s Public Reference Room in Washington, DC. Information on the operation of the Public Reference Room may be obtained by calling 1-800-SEC-0330.
A description of the policies and procedures that the fund uses to determine how to vote proxies relating to portfolio securities, and information regarding how the fund voted these proxies for the most recent 12-month period ended June 30 is available at http://www.dreyfus.com and on the SEC’s website at http://www.sec.gov. The description of the policies and procedures is also available without charge, upon request, by calling 1-800-DREYFUS.

|
| Dreyfus Variable |
| Investment Fund, |
| International |
| Equity Portfolio |
The views expressed in this report reflect those of the portfolio manager only through the end of the period covered and do not necessarily represent the views of Dreyfus or any other person in the Dreyfus organization. Any such views are subject to change at any time based upon market or other conditions and Dreyfus disclaims any responsibility to update such views.These views may not be relied on as investment advice and, because investment decisions for a Dreyfus fund are based on numerous factors, may not be relied on as an indication of trading intent on behalf of any Dreyfus fund.
|
| Not FDIC-Insured • Not Bank-Guaranteed • May Lose Value |
| | Contents |
| | THE FUND |
| 2 | A Letter from the Chairman and CEO |
| 3 | Discussion of Fund Performance |
| 6 | Fund Performance |
| 8 | Understanding Your Fund’s Expenses |
| 8 | Comparing Your Fund’s Expenses With Those of Other Funds |
| 9 | Statement of Investments |
| 14 | Statement of Assets and Liabilities |
| 15 | Statement of Operations |
| 16 | Statement of Changes in Net Assets |
| 18 | Financial Highlights |
| 20 | Notes to Financial Statements |
| 32 | Report of Independent Registered Public Accounting Firm |
| 33 | Important Tax Information |
| 34 | Board Members Information |
| 36 | Officers of the Fund |
| | FOR MORE INFORMATION |
| | Back Cover |
Dreyfus Variable Investment Fund,
International Equity Portfolio
The Fund

A LETTER FROM THE CHAIRMAN AND CEO
Dear Shareholder:
We present to you this annual report for Dreyfus Variable Investment Fund, International Equity Portfolio, covering the 12-month period from January 1, 2011, through December 31, 2011. For information about how the fund performed during the reporting period, as well as general market perspectives, we provide a Discussion of Fund Performance on the pages that follow.
The generally disappointing returns produced by non-U.S. stock markets in 2011 were driven by adverse macroeconomic developments ranging from catastrophic natural disasters in Japan and an unprecedented downgrade of long-term U.S. debt securities to the resurgence of a sovereign debt crisis in Europe and inflation-fighting measures in China and India. In a departure from the trend of the past several years, developed markets in 2011 produced better overall results than emerging markets, and larger stocks generally outpaced smaller stocks.
We already have seen signs that Europe is making progress in addressing its debt crisis, and key emerging markets appear headed for a “soft landing” as inflationary pressures wane. Our economic forecast calls for a mild acceleration of the global recovery in most regions outside of Europe.As investors grow more comfortable with economic conditions, we expect investment capital to flow back into fundamentally sound nations throughout the world. Of course, we encourage you to talk with your financial adviser to help ensure that your investment objectives are properly aligned with your risk tolerance in pursuing potential market opportunities in 2012.
Thank you for your continued confidence and support.
2

DISCUSSION OF FUND PERFORMANCE
For the period of January 1, 2011, through December 31, 2011, as provided by Jonathan Bell, Portfolio Manager, Newton Capital Management Limited, Sub-Investment Adviser
Fund and Market Performance Overview
For the one-year period ended December 31, 2011, Dreyfus Variable Investment Fund, International Equity Portfolio’s Intial shares produced a total return of –14.68%, and its Service shares returned –14.91%.1This compares with a –12.14% return for the fund’s benchmark, the Morgan Stanley Capital International Europe,Australasia, Far East Index (“MSCI EAFE Index”), for the same period.2
The protracted debt crisis in Europe and disappointing global economic data undermined investor sentiment during much of 2011. The fund produced lower returns than the MSCI EAFE Index, primarily due to weakness among energy companies.
The Fund’s Investment Approach
The fund seeks to achieve long-term capital growth by investing primarily in stocks of foreign companies.
The process of seeking investment ideas takes place within the framework of global investment themes. These themes are based primarily on observable economic, industrial or social trends that Newton believes will positively affect markets, industries or companies globally, and so help to identify areas of investment opportunity and risk. Such themes currently include deleverage, which asserts that certain economies and institutions need to reduce their budget deficits and pay down debt burdens which are reducing their economic prospects (and provides the rationale for the portfolio’s underweighted exposure to the financial sector). Elsewhere, the networked world theme identifies the investment opportunities and challenges inherent in the growth of information technology and data communication around the world.
When choosing stocks, we consider trends in economic variables, such as gross domestic product, inflation and interest rates; investment themes, such as networked world and deleverage; the relative values of equities, bonds and cash; company fundamentals; and long-term trends in currency movements. Within markets and sectors determined to be relatively
DISCUSSION OF FUND PERFORMANCE (continued)
attractive, we seek what we believe are attractively priced companies that possess a sustainable competitive advantage in their market or sector. Securities are generally sold when themes or strategies change, when we determine that the company’s prospects have changed, or when a stock becomes fully valued by the market.
Unexpected Shocks Undermined Global Markets
Investor confidence generally remained positive over the first quarter of 2011, but sentiment later crumbled when the sovereign debt crisis intensified in the European Union, the U.S. economy weakened and China’s previously torrid growth slowed. Stocks fell particularly sharply during August and September, after a major agency downgraded the credit rating of long-term U.S. government debt. In this turbulent environment, investors favored perceived safe havens, including well-established companies that continued to meet earnings expectations. Market conditions began to stabilize in October, buoyed by improving U.S. economic conditions and signs of political progress in addressing Europe’s problems. Although volatility remained elevated from October through December, international markets regained some of the ground they had lost earlier.
Mixed Results in a Challenging Environment
Despite positioning the fund defensively, the fund’s relative performance was dampened by several holdings that are not part of the MSCI EAFE Index, including some with a significant presence in the emerging markets. Many of the fund’s laggards in 2011 were energy companies, including U.K.-based Bowleven, which was hurt by lower-than-expected production volumes. Australian coal processor White Energy encountered trouble obtaining raw materials, causing its stock to drop sharply.The fund did not own Royal Dutch Shell, which fared relatively well during the flight to quality.
Results from Brazil disappointed when inflation fears intensified, undermining consumer stocks, such as household goods maker Hypermarcas. In Hong Kong, fragrance maker Huabao International Holdings suffered amid corporate governance concerns, and furniture manufacturer Man Wah Holdings encountered softer demand for exports to the United States. Japanese investment bank Nomura Holdings stumbled due to headwinds affecting its international expansion efforts, and technology firm Sumco slid when higher silicon wafer prices did not materialize.
4
The fund achieved better results from Thai hospital operator Bangkok Dusit Medical Services, which posted strong growth as consumers gained greater access to the nation’s health care system.Also in Thailand, mobile operator Advanced Info Service rallied due to strong cash flows and an attractive dividend. Swiss pharmaceutical developer Roche Holding benefited from a robust pipeline of new products.Tobacco producers British American Tobacco and Japan Tobacco advanced due to high dividends and expanding profit margins. Other winners during 2011 included medical equipment maker Fresenius Medical Care & Co., convenience stores chain Lawson and Japanese retailer Don Quijote.
Maintaining a Cautious Investment Posture
We expect deleveraging among businesses, consumers and governments to continue to weigh on global economic growth. Consequently, we have intensified our focus on well-established companies with attractive dividends and positive cash flows.We also have found attractive growth opportunities in the emerging markets. We have identified relatively few opportunities in Europe, and we have deemphasized companies that tend to be more sensitive to economic cycles.
January 17, 2012
| |
| | Please note, any security highlighted with italicized typeface was sold during the reporting period. |
| | Equity funds are subject generally to market, market sector, market liquidity, issuer and investment |
| | style risks, among other factors, to varying degrees, all of which are more fully described in the |
| | fund’s prospectus. |
| | The fund’s performance will be influenced by political, social and economic factors affecting |
| | investments in foreign companies. Special risks associated with investments in foreign companies |
| | include exposure to currency fluctuations, less liquidity, less developed or less efficient trading |
| | markets, lack of comprehensive company information, political instability and differing auditing |
| | and legal standards.These risks are enhanced in emerging market countries. |
| | The fund is only available as a funding vehicle under variable life insurance policies or variable |
| | annuity contracts issued by insurance companies. Individuals may not purchase shares of the fund |
| | directly.A variable annuity is an insurance contract issued by an insurance company that enables |
| | investors to accumulate assets on a tax-deferred basis for retirement or other long-term goals. |
| 1 | Total return includes reinvestment of dividends and any capital gains paid. Past performance is no |
| | guarantee of future results. Share price and investment return fluctuate such that upon redemption |
| | fund shares may be worth more or less than their original cost.The fund’s performance does not |
| | reflect the deduction of additional charges and expenses imposed in connection with investing in |
| | variable insurance contracts, which will reduce returns. |
| 2 | SOURCE: LIPPER INC. — Reflects reinvestment of net dividends and, where applicable, |
| | capital gain distributions.The Morgan Stanley Capital International Europe,Australasia, Far |
| | East (MSCI EAFE) Index is an unmanaged index composed of a sample of companies |
| | representative of the market structure of European and Pacific Basin countries. Investors cannot |
| | invest directly in an index. |
FUND PERFORMANCE

| | | | | | |
| Average Annual Total Returns as of 12/31/11 | | | |
| | 1Year | 5 Years | 10 Years |
| Initial shares | –14.68% | –4.47% | 5.36% |
| Service shares | –14.91% | –4.72% | 5.08% |
| Morgan Stanley Capital International | | | |
| Europe, Australasia, Far East Index | –12.14% | –4.72% | 4.67% |
|
| † Source: Lipper Inc. |
| Past performance is not predictive of future performance.The fund’s performance shown in the graph and table does not |
| reflect the deduction of taxes that a shareholder would pay on fund distributions or the redemption of fund shares. |
| The fund’s performance does not reflect the deduction of additional charges and expenses imposed in connection |
| with investing in variable insurance contracts which will reduce returns. |
| The above graph compares a $10,000 investment made in Initial and Service shares of Dreyfus Variable Investment |
| Fund, International Equity Portfolio on 12/31/01 to a $10,000 investment made in the Morgan Stanley Capital |
| International Europe,Australasia, Far East Index (the “Index”) on that date. |
6
The fund’s Initial shares are not subject to a Rule 12b-1 fee.The fund’s Service shares are subject to a 0.25% annual Rule 12b-1 fee.All dividends and capital gain distributions are reinvested.
The fund’s performance shown in the line graph above takes into account all applicable fund fees and expenses.The Index is an unmanaged index composed of a sample of companies representative of the market structure of European and Pacific Basin countries and includes net dividends reinvested. Unlike a mutual fund, the Index is not subject to charges, fees and other expenses. Investors cannot invest directly in any index. Further information relating to fund performance, including expense reimbursements, if applicable, is contained in the Financial Highlights section of the prospectus and elsewhere in this report.
UNDERSTANDING YOUR FUND’S EXPENSES (Unaudited)
As a mutual fund investor, you pay ongoing expenses, such as management fees and other expenses. Using the information below, you can estimate how these expenses affect your investment and compare them with the expenses of other funds.You also may pay one-time transaction expenses, including sales charges (loads), redemption fees and expenses associated with variable annuity or insurance contracts, which are not shown in this section and would have resulted in higher total expenses. For more information, see your fund’s prospectus or talk to your financial adviser.
Review your fund’s expenses
The table below shows the expenses you would have paid on a $1,000 investment in Dreyfus Variable Investment Fund, International Equity Portfolio from July 1, 2011 to December 31, 2011. It also shows how much a $1,000 investment would be worth at the close of the period, assuming actual returns and expenses.
Expenses and Value of a $1,000 Investment
assuming actual returns for the six months ended December 31, 2011
| | | | |
| | | Initial Shares | | Service Shares |
| Expenses paid per $1,000† | | $5.00 | | $6.11 |
| Ending value (after expenses) | | $837.40 | | $836.10 |
COMPARING YOUR FUND’S EXPENSES
WITH THOSE OF OTHER FUNDS (Unaudited)
Using the SEC’s method to compare expenses
The Securities and Exchange Commission (SEC) has established guidelines to help investors assess fund expenses. Per these guidelines, the table below shows your fund’s expenses based on a $1,000 investment, assuming a hypothetical 5% annualized return. You can use this information to compare the ongoing expenses (but not transaction expenses or total cost) of investing in the fund with those of other funds.All mutual fund shareholder reports will provide this information to help you make this comparison. Please note that you cannot use this information to estimate your actual ending account balance and expenses paid during the period.
Expenses and Value of a $1,000 Investment
assuming a hypothetical 5% annualized return for the six months ended December 31, 2011
| | | | |
| | | Initial Shares | | Service Shares |
| Expenses paid per $1,000† | | $5.50 | | $6.72 |
| Ending value (after expenses) | | $1,019.76 | | $1,018.55 |
|
| Expenses are equal to the fund’s annualized expense ratio of 1.08% for Initial shares and 1.32% for Service shares, |
| multiplied by the average account value over the period, multiplied by 184/365 (to reflect the one-half year period). |
8
|
| STATEMENT OF INVESTMENTS |
| December 31, 2011 |
| | | |
| Common Stocks—97.2% | Shares | Value ($) |
| Australia—5.0% | | |
| AMP | 97,643 | 406,467 |
| Newcrest Mining | 25,582 | 774,491 |
| Santos | 43,176 | 540,522 |
| White Energy | 146,244a | 56,840 |
| WorleyParsons | 14,389 | 377,786 |
| | | 2,156,106 |
| Belgium—1.5% | | |
| Anheuser-Busch InBev | 10,135 | 620,509 |
| Brazil—1.6% | | |
| Arezzo Industria e Comercio | 24,879 | 309,445 |
| International Meal Co. Holdings | 26,400 | 183,855 |
| Rossi Residencial | 2,674 | 11,469 |
| Tele Norte Leste Participacoes, ADR | 18,046 | 171,617 |
| | | 676,386 |
| Canada—2.7% | | |
| Barrick Gold | 6,639 | 300,751 |
| Nexen | 12,590 | 200,328 |
| Potash Corporation of Saskatchewan | 7,202 | 297,694 |
| Yamana Gold | 25,056 | 369,415 |
| | | 1,168,188 |
| China—1.4% | | |
| Biostime International Holdings | 206,000 | 363,376 |
| Mindray Medical International, ADR | 9,622 | 246,708 |
| | | 610,084 |
| France—8.1% | | |
| Air Liquide | 4,823 | 596,687 |
| BNP Paribas | 22,487 | 883,298 |
| L’Oreal | 3,849 | 402,012 |
| Nexans | 4,969 | 257,888 |
| Thales | 12,918 | 407,946 |
| Total | 18,161 | 928,440 |
| | | 3,476,271 |
| Germany—4.7% | | |
| Allianz | 4,099 | 392,101 |
| Bayer | 13,115 | 838,518 |
STATEMENT OF INVESTMENTS (continued)
| | |
| Common Stocks (continued) | Shares | Value ($) |
| Germany (continued) | | |
| Fresenius Medical Care & Co. | 5,825 | 395,797 |
| Gerry Weber International | 12,071 | 368,231 |
| | | 1,994,647 |
| Hong Kong—5.3% | | |
| AIA Group | 91,200 | 284,758 |
| Belle International Holdings | 168,000 | 292,885 |
| China Mobile | 53,500 | 522,835 |
| GOME Electrical Appliances Holdings | 773,000 | 179,152 |
| Huabao International Holdings | 259,000 | 132,391 |
| Jardine Matheson Holdings | 13,200 | 621,060 |
| Man Wah Holdings | 363,167 | 217,902 |
| | | 2,250,983 |
| Italy—.6% | | |
| Saipem | 6,486 | 275,759 |
| Japan—22.1% | | |
| Asahi Group Holdings | 18,600 | 408,393 |
| CALBEE | 5,793 | 283,366 |
| Dena | 9,869 | 296,057 |
| Don Quijote | 19,000 | 651,929 |
| FANUC | 2,500 | 382,617 |
| Hitachi Construction Machinery | 18,500 | 311,498 |
| INPEX | 66 | 415,876 |
| Japan Tobacco | 199 | 935,923 |
| Lawson | 8,600 | 536,872 |
| Mitsui Fudosan | 36,000 | 524,776 |
| Nomura Holdings | 172,400 | 521,881 |
| NTT DoCoMo | 247 | 454,080 |
| Otsuka Holdings | 12,400 | 348,624 |
| Shiseido | 14,000 | 257,373 |
| SUGI HOLDINGS | 11,900 | 346,935 |
| Sumitomo Mitsui Financial Group | 18,500 | 515,318 |
| Toshiba | 120,000 | 491,100 |
| Towa Pharmaceutical | 11,600 | 495,076 |
| Toyota Motor | 38,600 | 1,286,332 |
| | | 9,464,026 |
10
| | | | |
| Common Stocks (continued) | Shares | | | Value ($) |
| Macau—.5% | | | | |
| Sands China | 72,800a | | 205,748 |
| Norway—1.4% | | | | |
| DnB | 61,942 | | | 606,386 |
| Philippines—.9% | | | | |
| Energy Development | 2,686,600 | | | 385,332 |
| Poland—.9% | | | | |
| Telekomunikacja Polska | 79,491 | | | 396,902 |
| Singapore—1.9% | | | | |
| Sakari Resources | 234,000 | | | 331,953 |
| United Overseas Bank | 39,000 | | | 459,142 |
| | | | | 791,095 |
| South Africa—.9% | | | | |
| MTN Group | 21,666 | | | 385,758 |
| Spain—.9% | | | | |
| Amadeus IT Holding, Cl. A | 22,675 | | | 367,865 |
| Sweden—1.0% | | | | |
| TeliaSonera | 64,064 | | | 435,375 |
| Switzerland—14.7% | | | | |
| ABB | 26,789a | | 504,237 |
| Actelion | 8,050a | | 276,389 |
| Bank Sarasin & Cie, Cl. B | 11,648 | | | 340,400 |
| Lonza Group | 3,796a | | 224,293 |
| Nestle | 24,570 | | | 1,412,520 |
| Novartis | 16,869 | | | 964,405 |
| Roche Holding | 8,718 | | | 1,477,596 |
| Syngenta | 2,056a | | 601,938 |
| Zurich Financial Services | 2,081a | | | 470,789 |
| | | | | 6,272,567 |
| Taiwan—.4% | | | | |
| HTC | 11,000 | | | 180,554 |
| Thailand—4.3% | | | | |
| Advanced Info Service | 60,700 | | | 270,312 |
| Bangkok Bank | 138,500 | | | 719,937 |
| Bangkok Dusit Medical Services | 318,798a | | | 828,572 |
| | | | | 1,818,821 |
STATEMENT OF INVESTMENTS (continued)
| | | | |
| Common Stocks (continued) | Shares | | | Value ($) |
| United Kingdom—16.4% | | | | |
| Associated British Foods | 22,416 | | | 385,366 |
| Barclays | 161,423 | | | 441,336 |
| BHP Billiton | 37,045 | | | 1,080,134 |
| Bowleven | 143,021a | | 149,369 |
| British American Tobacco | 20,261 | | | 961,416 |
| British Sky Broadcasting Group | 31,607 | | | 359,550 |
| Cable & Wireless Communications | 395,253 | | | 234,480 |
| Centrica | 118,199 | | | 531,044 |
| Compass Group | 35,550 | | | 337,325 |
| GlaxoSmithKline | 34,310 | | | 784,060 |
| ICAP | 93,404 | | | 503,197 |
| Imagination Technologies Group | 17,896a | | | 152,580 |
| Ophir Energy | 75,081 | | | 336,740 |
| SSE | 37,500 | | | 751,840 |
| | | | | 7,008,437 |
| Total Common Stocks | | | | |
| (cost $43,154,583) | | | | 41,547,799 |
| |
| Preferred Stocks—1.1% | | | | |
| Brazil—1.1% | | | | |
| Petroleo Brasileiro | | | | |
| (cost $646,413) | 39,107 | | | 450,561 |
12
| | | |
| Other Investment—1.2% | Shares | Value ($) |
| Registered Investment Company; | | |
| Dreyfus Institutional Preferred Plus Money Market Fund | | |
| (cost $520,000) | 520,000b | 520,000 |
| |
| Total Investments (cost $44,320,996) | 99.5% | 42,518,360 |
| Cash and Receivables (Net) | .5% | 217,756 |
| Net Assets | 100.0% | 42,736,116 |
| |
| ADR—American Depository Receipts |
| a | Non-income producing security. |
| b | Investment in affiliated money market mutual fund. |
| | | |
| Portfolio Summary (Unaudited)† | | |
| |
| | Value (%) | | Value (%) |
| Consumer Goods | 17.8 | Telecommunications | 6.7 |
| Financial | 16.5 | Utilities | 3.9 |
| Health Care | 14.4 | Technology | 1.6 |
| Materials | 13.1 | Consumer Staples | 1.5 |
| Oil & Gas | 8.6 | Money Market Investment | 1.2 |
| Consumer Services | 7.2 | | |
| Industrial | 7.0 | | 99.5 |
|
| † Based on net assets. |
| See notes to financial statements. |
STATEMENT OF ASSETS AND LIABILITIES
December 31, 2011
| | | |
| | Cost | Value |
| Assets ($): | | |
| Investments in securities—See Statement of Investments: | | |
| Unaffiliated issuers | 43,800,996 | 41,998,360 |
| Affiliated issuers | 520,000 | 520,000 |
| Cash | | 168,944 |
| Cash denominated in foreign currencies | 39,426 | 39,689 |
| Receivable for investment securities sold | | 96,910 |
| Dividends receivable | | 79,214 |
| Unrealized appreciation on forward foreign | | |
| currency exchange contracts—Note 4 | | 45,841 |
| Receivable for shares of Beneficial Interest subscribed | | 894 |
| Prepaid expenses | | 1,221 |
| | | 42,951,073 |
| Liabilities ($): | | |
| Due to The Dreyfus Corporation and affiliates—Note 3(b) | | 57,457 |
| Payable for shares of Beneficial Interest redeemed | | 81,176 |
| Unrealized depreciation on forward foreign | | |
| currency exchange contracts—Note 4 | | 55,890 |
| Accrued expenses | | 20,434 |
| | | 214,957 |
| Net Assets ($) | | 42,736,116 |
| Composition of Net Assets ($): | | |
| Paid-in capital | | 60,214,934 |
| Accumulated undistributed investment income—net | | 144,886 |
| Accumulated net realized gain (loss) on investments | | (15,809,156) |
| Accumulated net unrealized appreciation (depreciation) | | |
| on investments and foreign currency transactions | | (1,814,548) |
| Net Assets ($) | | 42,736,116 |
| |
| |
| Net Asset Value Per Share | | |
| | Initial Shares | Service Shares |
| Net Assets ($) | 33,296,894 | 9,439,222 |
| Shares Outstanding | 2,422,110 | 687,857 |
| Net Asset Value Per Share ($) | 13.75 | 13.72 |
| |
| See notes to financial statements. | | |
14
|
| STATEMENT OF OPERATIONS |
| Year Ended December 31, 2011 |
| | |
| Investment Income ($): | |
| Income: | |
| Cash dividends (net of $105,521 foreign taxes withheld at source): | |
| Unaffiliated issuers | 1,296,992 |
| Affiliated issuers | 525 |
| Total Income | 1,297,517 |
| Expenses: | |
| Investment advisory fee—Note 3(a) | 398,387 |
| Auditing fees | 67,487 |
| Custodian fees—Note 3(b) | 67,222 |
| Distribution fees—Note 3(b) | 30,318 |
| Prospectus and shareholders’ reports | 13,673 |
| Trustees’ fees and expenses—Note 3(c) | 5,680 |
| Legal fees | 3,666 |
| Shareholder servicing costs—Note 3(b) | 1,921 |
| Interest expense—Note 2 | 884 |
| Loan commitment fees—Note 2 | 787 |
| Miscellaneous | 23,217 |
| Total Expenses | 613,242 |
| Less—reduction in fees due to earnings credits—Note 3(b) | (1) |
| Net Expenses | 613,241 |
| Investment Income—Net | 684,276 |
| Realized and Unrealized Gain (Loss) on Investments—Note 4 ($): | |
| Net realized gain (loss) on investments and foreign currency transactions | 4,299,408 |
| Net realized gain (loss) on forward foreign currency exchange contracts | (1,926) |
| Net Realized Gain (Loss) | 4,297,482 |
| Net unrealized appreciation (depreciation) on | |
| investments and foreign currency transactions | (12,354,231) |
| Net unrealized appreciation (depreciation) on | |
| forward foreign currency exchange contracts | 70,428 |
| Net Unrealized Appreciation (Depreciation) | (12,283,803) |
| Net Realized and Unrealized Gain (Loss) on Investments | (7,986,321) |
| Net (Decrease) in Net Assets Resulting from Operations | (7,302,045) |
| See notes to financial statements. | |
STATEMENT OF CHANGES IN NET ASSETS
| | | | |
| | Year Ended December 31, |
| | 2011 | 2010 |
| Operations ($): | | |
| Investment income—net | 684,276 | 812,851 |
| Net realized gain (loss) on investments | 4,297,482 | 1,237,077 |
| Net unrealized appreciation | | |
| (depreciation) on investments | (12,283,803) | 3,574,429 |
| Net Increase (Decrease) in Net Assets | | |
| Resulting from Operations | (7,302,045) | 5,624,357 |
| Dividends to Shareholders from ($): | | |
| Investment income—net: | | |
| Initial Shares | (935,584) | (739,691) |
| Service Shares | (239,508) | (194,723) |
| Total Dividends | (1,175,092) | (934,414) |
| Beneficial Interest Transactions ($): | | |
| Net proceeds from shares sold: | | |
| Initial Shares | 3,442,961 | 4,924,552 |
| Service Shares | 944,711 | 1,706,809 |
| Dividends reinvested: | | |
| Initial Shares | 935,584 | 739,691 |
| Service Shares | 239,508 | 194,723 |
| Cost of shares redeemed: | | |
| Initial Shares | (12,030,624) | (7,378,266) |
| Service Shares | (3,581,111) | (2,773,022) |
| Increase (Decrease) in Net Assets from | | |
| Beneficial Interest Transactions | (10,048,971) | (2,585,513) |
| Total Increase (Decrease) in Net Assets | (18,526,108) | 2,104,430 |
| Net Assets ($): | | |
| Beginning of Period | 61,262,224 | 59,157,794 |
| End of Period | 42,736,116 | 61,262,224 |
| Undistributed investment income—net | 144,886 | 581,118 |
16
| | | | |
| | Year Ended December 31, |
| | 2011 | 2010 |
| Capital Share Transactions: | | |
| Initial Shares | | |
| Shares sold | 222,380 | 342,485 |
| Shares issued for dividends reinvested | 57,292 | 49,019 |
| Shares redeemed | (744,276) | (500,686) |
| Net Increase (Decrease) in Shares Outstanding | (464,604) | (109,182) |
| Service Shares | | |
| Shares sold | 60,669 | 117,507 |
| Shares issued for dividends reinvested | 14,667 | 12,904 |
| Shares redeemed | (229,570) | (188,040) |
| Net Increase (Decrease) in Shares Outstanding | (154,234) | (57,629) |
| |
| See notes to financial statements. | | |
FINANCIAL HIGHLIGHTS
The following tables describe the performance for each share class for the fiscal periods indicated.All information (except portfolio turnover rate) reflects financial results for a single fund share.Total return shows how much your investment in the fund would have increased (or decreased) during each period, assuming you had reinvested all dividends and distributions. The fund’s total returns do not reflect expenses associated with variable annuity or insurance contracts.These figures have been derived from the fund’s financial statements.
| | | | | | | | | | |
| | | Year Ended December 31, | |
| Initial Shares | 2011 | 2010 | 2009 | 2008 | 2007 |
| Per Share Data ($): | | | | | |
| Net asset value, beginning of period | 16.44 | 15.19 | 12.75 | 23.12 | 20.08 |
| Investment Operations: | | | | | |
| Investment income—neta | .21 | .22 | .28 | .30 | .29 |
| Net realized and unrealized | | | | | |
| gain (loss) on investments | (2.57) | 1.28 | 2.71 | (9.70) | 3.10 |
| Total from Investment Operations | (2.36) | 1.50 | 2.99 | (9.40) | 3.39 |
| Distributions: | | | | | |
| Dividends from investment income—net | (.33) | (.25) | (.55) | (.34) | (.35) |
| Dividends from net realized | | | | | |
| gain on investments | — | — | — | (.63) | — |
| Total Distributions | (.33) | (.25) | (.55) | (.97) | (.35) |
| Net asset value, end of period | 13.75 | 16.44 | 15.19 | 12.75 | 23.12 |
| Total Return (%) | (14.68) | 10.03 | 25.26 | (42.22) | 17.12 |
| Ratios/Supplemental Data (%): | | | | | |
| Ratio of total expenses | | | | | |
| to average net assets | 1.10 | 1.06 | 1.12 | 1.10 | 1.03 |
| Ratio of net expenses | | | | | |
| to average net assets | 1.10 | 1.06 | 1.12 | 1.08 | .98 |
| Ratio of net investment income | | | | | |
| to average net assets | 1.35 | 1.47 | 2.12 | 1.62 | 1.37 |
| Portfolio Turnover Rate | 56.20 | 63.67 | 104.15 | 99.61 | 113.77 |
| Net Assets, end of period ($ x 1,000) | 33,297 | 47,443 | 45,507 | 37,360 | 70,923 |
| a Based on average shares outstanding at each month end. | | | | |
| See notes to financial statements. | | | | | |
18
| | | | | | | | | | |
| | | Year Ended December 31, | |
| Service Shares | 2011 | 2010 | 2009 | 2008 | 2007 |
| Per Share Data ($): | | | | | |
| Net asset value, beginning of period | 16.41 | 15.17 | 12.72 | 23.06 | 20.05 |
| Investment Operations: | | | | | |
| Investment income—neta | .17 | .18 | .25 | .24 | .22 |
| Net realized and unrealized | | | | | |
| gain (loss) on investments | (2.57) | 1.28 | 2.71 | (9.66) | 3.11 |
| Total from Investment Operations | (2.40) | 1.46 | 2.96 | (9.42) | 3.33 |
| Distributions: | | | | | |
| Dividends from investment income—net | (.29) | (.22) | (.51) | (.29) | (.32) |
| Dividends from net realized | | | | | |
| gain on investments | — | — | — | (.63) | — |
| Total Distributions | (.29) | (.22) | (.51) | (.92) | (.32) |
| Net asset value, end of period | 13.72 | 16.41 | 15.17 | 12.72 | 23.06 |
| Total Return (%) | (14.91) | 9.74 | 24.89 | (42.36) | 16.84 |
| Ratios/Supplemental Data (%): | | | | | |
| Ratio of total expenses | | | | | |
| to average net assets | 1.35 | 1.31 | 1.37 | 1.35 | 1.28 |
| Ratio of net expenses | | | | | |
| to average net assets | 1.35 | 1.31 | 1.37 | 1.34 | 1.23 |
| Ratio of net investment income | | | | | |
| to average net assets | 1.09 | 1.23 | 1.91 | 1.33 | 1.02 |
| Portfolio Turnover Rate | 56.20 | 63.67 | 104.15 | 99.61 | 113.77 |
| Net Assets, end of period ($ x 1,000) | 9,439 | 13,819 | 13,651 | 11,639 | 18,607 |
| a Based on average shares outstanding at each month end. | | | | |
| See notes to financial statements. | | | | | |
NOTES TO FINANCIAL STATEMENTS
NOTE 1—Significant Accounting Policies:
Dreyfus Variable Investment Fund (the “Company”) is registered under the Investment Company Act of 1940, as amended (the “Act”), as an open-end management investment company, operating as a series company currently offering seven series, including the International Equity Portfolio (the “fund”). The fund is only offered to separate accounts established by insurance companies to fund variable annuity contracts and variable life insurance policies.The fund is a non-diversified series.The fund’s investment objective is to seek capital growth. The Dreyfus Corporation (the “Manager” or “Dreyfus”), a wholly-owned subsidiary of The Bank of New York Mellon Corporation (“BNY Mellon”), serves as the fund’s investment adviser. Newton Capital Management Limited (“Newton”) serves as the fund’s sub-investment adviser. Newton is also a wholly-owned subsidiary of BNY Mellon and an affiliate of Dreyfus.
MBSC Securities Corporation (the “Distributor”), a wholly-owned subsidiary of Dreyfus, is the distributor of the fund’s shares, which are sold without a sales charge.The fund is authorized to issue an unlimited number of $.001 par value shares of Beneficial Interest in each of the following classes of shares: Initial and Service. Each class of shares has identical rights and privileges, except with respect to the distribution plan, the expenses borne by each class, the allocation of certain transfer agency costs and certain voting rights. Income, expenses (other than expenses attributable to a specific class), and realized and unrealized gains or losses on investments are allocated to each class of shares based on its relative net assets.
The Company accounts separately for the assets, liabilities and operations of each series. Expenses directly attributable to each series are charged to that series’ operations; expenses which are applicable to all series are allocated among them on a pro rata basis.
The Financial Accounting Standards Board (“FASB”) Accounting Standards Codification (“ASC”) is the exclusive reference of authoritative U.S. generally accepted accounting principles (“GAAP”) recognized by the FASB to be applied by nongovernmental entities. Rules and inter-
20
pretive releases of the Securities and Exchange Commission (“SEC”) under authority of federal laws are also sources of authoritative GAAP for SEC registrants. The fund’s financial statements are prepared in accordance with GAAP, which may require the use of management estimates and assumptions.Actual results could differ from those estimates.
The Company enters into contracts that contain a variety of indemnifications.The fund’s maximum exposure under these arrangements is unknown.The fund does not anticipate recognizing any loss related to these arrangements.
(a) Portfolio valuation: The fair value of a financial instrument is the amount that would be received to sell an asset or paid to transfer a liability in an orderly transaction between market participants at the measurement date (i.e. the exit price). GAAP establishes a fair value hierarchy that prioritizes the inputs of valuation techniques used to measure fair value.This hierarchy gives the highest priority to unadjusted quoted prices in active markets for identical assets or liabilities (Level 1 measurements) and the lowest priority to unobservable inputs (Level 3 measurements).
Additionally, GAAP provides guidance on determining whether the volume and activity in a market has decreased significantly and whether such a decrease in activity results in transactions that are not orderly. GAAP requires enhanced disclosures around valuation inputs and techniques used during annual and interim periods.
Various inputs are used in determining the value of the fund’s investments relating to fair value measurements.These inputs are summarized in the three broad levels listed below:
Level 1—unadjusted quoted prices in active markets for identical investments.
Level 2—other significant observable inputs (including quoted prices for similar investments, interest rates, prepayment speeds, credit risk, etc.).
Level 3—significant unobservable inputs (including the fund’s own assumptions in determining the fair value of investments).
NOTES TO FINANCIAL STATEMENTS (continued)
The inputs or methodology used for valuing securities are not necessarily an indication of the risk associated with investing in those securities.
Changes in valuation techniques may result in transfers in or out of an assigned level within the disclosure hierarchy. Valuation techniques used to value the fund’s investments are as follows:
Investments in securities are valued at the last sales price on the securities exchange or national securities market on which such securities are primarily traded. Securities listed on the National Market System for which market quotations are available are valued at the official closing price or, if there is no official closing price that day, at the last sales price. Securities not listed on an exchange or the national securities market, or securities for which there were no transactions, are valued at the average of the most recent bid and asked prices, except for open short positions, where the asked price is used for valuation purposes. Bid price is used when no asked price is available. Registered investment companies that are not traded on an exchange are valued at their net asset value.All preceding securities are categorized within Level 1 of the fair value hierarchy.
Fair valuing of securities may be determined with the assistance of a pricing service using calculations based on indices of domestic securities and other appropriate indicators, such as prices of relevant ADRs and futures contracts. Utilizing these techniques may result in transfers between Level 1 and Level 2 of the fair value hierarchy.
When market quotations or official closing prices are not readily available, or are determined not to reflect accurately fair value, such as when the value of a security has been significantly affected by events after the close of the exchange or market on which the security is principally traded (for example, a foreign exchange or market), but before the fund calculates its net asset value, the fund may value these investments at fair value as determined in accordance with the procedures approved by the Board of Trustees. Certain factors may be considered when fair valuing investments such as: fundamental analytical data, the nature and duration of restrictions on disposition, an evaluation of the forces that influence the market in which the securities are
22
purchased and sold, and public trading in similar securities of the issuer or comparable issuers.These securities are either categorized as Level 2 or 3 depending on the relevant inputs used.
For restricted securities where observable inputs are limited, assumptions about market activity and risk are used and are categorized within Level 3 of the fair value hierarchy.
Investments denominated in foreign currencies are translated to U.S. dollars at the prevailing rates of exchange. Forward foreign currency exchange contracts (“forward contracts”) are valued at the forward rate. These securities are generally categorized within Level 2 of the fair value hierarchy.
The following is a summary of the inputs used as of December 31, 2011 in valuing the fund’s investments:
| | | | | | |
| | | Level 2—Other | | Level 3— | | |
| | Level 1— | Significant | | Significant | | |
| | Unadjusted | Observable | | Unobservable | | |
| | Quoted Prices | Inputs | | Inputs | Total | |
| Assets ($) | | | | | | |
| Investments in Securities: | | | | | |
| Equity Securities— | | | | | | |
| Foreign† | 41,998,360 | — | | — | 41,998,360 | |
| Mutual Funds | 520,000 | — | | — | 520,000 | |
| Other Financial | | | | | | |
| Instruments: | | | | | | |
| Forward Foreign | | | | | | |
| Currency Exchange | | | | | | |
| Contracts†† | — | 45,841 | | — | 45,841 | |
| Liabilities ($) | | | | | | |
| Other Financial | | | | | | |
| Instruments: | | | | | | |
| Forward Foreign | | | | | | |
| Currency Exchange | | | | | | |
| Contracts†† | — | (55,890 | ) | — | (55,890 | ) |
| |
| † | See Statement of Investments for additional detailed categorizations. |
| †† | Amount shown represents unrealized appreciation (depreciation) at period end. |
In May 2011, FASB issued Accounting Standards Update (“ASU”) No. 2011-04 “Amendments to Achieve Common Fair Value
NOTES TO FINANCIAL STATEMENTS (continued)
Measurement and Disclosure Requirements in GAAP and International Financial Reporting Standards (“IFRS”)” (“ASU 2011-04”). ASU 2011-04 includes common requirements for measurement of and disclosure about fair value between GAAP and IFRS. ASU 2011-04 will require reporting entities to disclose the following information for fair value measurements categorized within Level 3 of the fair value hierarchy: quantitative information about the unobservable inputs used in the fair value measurement, the valuation processes used by the reporting entity and a narrative description of the sensitivity of the fair value measurement to changes in unobservable inputs and the interrelationships between those unobservable inputs. In addition, ASU 2011-04 will require reporting entities to make disclosures about amounts and reasons for all transfers in and out of Level 1 and Level 2 fair value measurements.The new and revised disclosures are effective for interim and annual reporting periods beginning after December 15, 2011. At this time, management is evaluating the implications of ASU 2011-04 and its impact on the financial statements.
(b) Foreign currency transactions: The fund does not isolate that portion of the results of operations resulting from changes in foreign exchange rates on investments from the fluctuations arising from changes in the market prices of securities held. Such fluctuations are included with the net realized and unrealized gain or loss on investments.
Net realized foreign exchange gains or losses arise from sales of foreign currencies, currency gains or losses realized on securities transactions between trade and settlement date, and the difference between the amounts of dividends, interest and foreign withholding taxes recorded on the fund’s books and the U.S. dollar equivalent of the amounts actually received or paid. Net unrealized foreign exchange gains and losses arise from changes in the value of assets and liabilities other than investments resulting from changes in exchange rates. Foreign currency gains and losses on investments are included with net realized and unrealized gain or loss on investments.
(c) Securities transactions and investment income: Securities transactions are recorded on a trade date basis. Realized gains and losses
24
from securities transactions are recorded on the identified cost basis. Dividend income is recognized on the ex-dividend date and interest income, including, where applicable, accretion of discount and amortization of premium on investments, is recognized on the accrual basis.
Investing in foreign markets may involve special risks and considerations not typically associated with investing in the U.S. These risks include revaluation of currencies, high rates of inflation, repatriation restrictions on income and capital, and adverse political and economic developments. Moreover, securities issued in these markets may be less liquid, subject to government ownership controls and delayed settlements, and their prices may be more volatile than those of comparable securities in the U.S.
(d) Affiliated issuers: Investments in other investment companies advised by Dreyfus are defined as “affiliated” in the Act.
The fund may invest in shares of certain affiliated investment companies also advised or managed by Dreyfus. Investments in affiliated investment companies for the period ended December 31, 2011 were as follows:
| | | | | | | |
| Affiliated | | | | | | | |
| Investment | Value | | | | Value | | Net |
| Company | 12/31/2010 | ($) | Purchases ($) | Sales ($) | 12/31/2011 | ($) | Assets (%) |
| Dreyfus | | | | | | | |
| Institutional | | | | | | | |
| Preferred | | | | | | | |
| Plus Money | | | | | | | |
| Market Fund | — | | 9,500,000 | 8,980,000 | 520,000 | | 1.2 |
(e) Dividends to shareholders: Dividends are recorded on the ex-dividend date. Dividends from investment income-net and dividends from net realized capital gains, if any, are normally declared and paid annually, but the fund may make distributions on a more frequent basis to comply with the distribution requirements of the Internal Revenue Code of 1986, as amended (the “Code”).To the extent that net realized capital gains can be offset by capital loss carryovers, it is the policy of the fund not to distribute such gains. Income and capital gain distributions are determined in accordance with income tax regulations, which may differ from GAAP.
NOTES TO FINANCIAL STATEMENTS (continued)
(f) Federal income taxes: It is the policy of the fund to continue to qualify as a regulated investment company, if such qualification is in the best interests of its shareholders, by complying with the applicable provisions of the Code, and to make distributions of taxable income sufficient to relieve it from substantially all federal income and excise taxes.
As of and during the period ended December 31, 2011, the fund did not have any liabilities for any uncertain tax positions.The fund recognizes interest and penalties, if any, related to uncertain tax positions as income tax expense in the Statement of Operations. During the period, the fund did not incur any interest or penalties.
Each of the tax years in the four-year period ended December 31, 2011 remains subject to examination by the Internal Revenue Service and state taxing authorities.
At December 31, 2011, the components of accumulated earnings on a tax basis were as follows: undistributed ordinary income $171,872, accumulated capital losses $14,965,880 and unrealized depreciation $2,107,725. In addition, the fund had $577,085 of capital losses realized after October 31, 2011, which were deferred for tax purposes to the first day of the following fiscal year.
Under the Regulated Investment Company Modernization Act of 2010 (the “2010 Act”), the fund will be permitted to carry forward capital losses incurred in taxable years beginning after December 22, 2010 (“post-enactment losses”) for an unlimited period. Post-enactment capital loss carryovers will retain their character as either short-term or long-term capital losses rather than be considered short-term as they were under previous statute. However, the 2010 Act requires post-enactment losses to be utilized before the utilization of losses incurred in taxable years prior to the effective date of the 2010 Act (“pre-enactment losses”). As a result of this ordering rule, pre-enactment losses may be more likely to expire unused.
The accumulated capital loss carryover is available for federal income tax purposes to be applied against future net securities profits, if any, realized
26
subsequent to December 31, 2011. If not applied, $3,155,881 of the carryover expires in fiscal 2016 and $11,809,999 expires in fiscal 2017.
The tax character of distributions paid to shareholders during the fiscal periods ended December 31, 2011 and December 31, 2010, were as follows: ordinary income $1,175,092 and $934,414, respectively.
During the period ended December 31, 2011, as a result of permanent book to tax differences, primarily due to the tax treatment for foreign currency exchange gains and losses and passive foreign investment companies, the fund increased accumulated undistributed investment income-net by $54,584 and decreased accumulated net realized gain (loss) on investments by the same amount. Net assets and net asset value per share were not affected by this reclassification.
NOTE 2—Bank Lines of Credit:
The fund participates with other Dreyfus-managed funds in a $225 million unsecured credit facility led by Citibank, N.A. and a $300 million unsecured credit facility provided by The Bank of NewYork Mellon, a subsidiary of BNY Mellon and an affiliate of Dreyfus (each, a “Facility”), each to be utilized primarily for temporary or emergency purposes, including the financing of redemptions. In connection therewith, the fund has agreed to pay its pro rata portion of commitment fees for each Facility. Interest is charged to the fund based on rates determined pursuant to the terms of the respective Facility at the time of borrowing.
The average amount of borrowings outstanding under the Facilities during the period ended December 31, 2011 was approximately $64,700 with a related weighted average annualized interest rate of 1.37%.
NOTE 3—Investment Advisory Fee, Sub-Investment Advisory Fee and Other Transactions with Affiliates:
(a) Pursuant to an investment advisory agreement with Dreyfus, the investment advisory fee is computed at the annual rate of .75% of the value of the fund’s average daily net assets and is payable monthly.
NOTES TO FINANCIAL STATEMENTS (continued)
Pursuant to a sub-investment advisory agreement between Dreyfus and Newton, the sub-investment advisory fee is payable monthly by Dreyfus, and is based upon the value of the fund’s average daily net assets, computed at the following annual rates:
| | |
| Average Net Assets | |
| 0 up to $100 million | .35% |
| $100 million up to $1 billion | .30% |
| $1 billion up to $1.5 billion | .26% |
| In excess of $1.5 billion | .20% |
(b) Under the Distribution Plan (the “Plan”) adopted pursuant to Rule 12b-1 under the Act, Service shares pay the Distributor for distributing its shares, for servicing and/or maintaining Service shares’ shareholder accounts and for advertising and marketing for Service shares.The Plan provides for payments to be made at an annual rate of .25% of the value of Service shares’ average daily net assets. The Distributor may make payments to Participating Insurance Companies and to brokers and dealers acting as principal underwriter for their variable insurance products. The fees payable under the Plan are payable without regard to actual expenses incurred. During the period ended December 31, 2011, Service shares were charged $30,318 pursuant to the Plan.
The fund compensates DreyfusTransfer, Inc., a wholly-owned subsidiary of Dreyfus, under a transfer agency agreement for providing personnel and facilities to perform transfer agency services for the fund. During the period ended December 31, 2011, the fund was charged $292 pursuant to the transfer agency agreement, which is included in Shareholder servicing costs in the Statement of Operations.
The fund has arrangements with the custodian and cash management bank whereby the fund may receive earnings credits when positive cash balances are maintained, which are used to offset custody and cash management fees. For financial reporting purposes, the fund includes net earnings credits as an expense offset in the Statement of Operations.
The fund compensates The Bank of New York Mellon under a cash management agreement for performing cash management services
28
related to fund subscriptions and redemptions. During the period ended December 31, 2011, the fund was charged $43 pursuant to the cash management agreement, which is included in Shareholder servicing costs in the Statement of Operations.These fees were partially offset by earnings credits of $1.
The fund also compensates The Bank of New York Mellon under a custody agreement for providing custodial services for the fund. During the period ended December 31, 2011, the fund was charged $67,222 pursuant to the custody agreement.
During the period ended December 31, 2011, the fund was charged $6,402 for services performed by the Chief Compliance Officer.
The components of “Due to The Dreyfus Corporation and affiliates” in the Statement of Assets and Liabilities consist of: investment advisory fees $27,292, Rule 12b-1 distribution plan fees $2,034, custodian fees $22,791, chief compliance officer fees $5,295 and transfer agency per account fees $45.
(c) Each Board member also serves as a Board member of other funds within the Dreyfus complex. Annual retainer fees and attendance fees are allocated to each fund based on net assets.
NOTE 4—Securities Transactions:
The aggregate amount of purchases and sales of investment securities, excluding short-term securities and forward contracts, during the period ended December 31, 2011, amounted to $29,759,340 and $40,959,625, respectively.
Forward Foreign Currency Exchange Contracts: The fund enters into forward contracts in order to hedge its exposure to changes in foreign currency exchange rates on its foreign portfolio holdings, to settle foreign currency transactions or as a part of its investment strategy. When executing forward contracts, the fund is obligated to buy or sell a foreign currency at a specified rate on a certain date in the future. With respect to sales of forward contracts, the fund incurs a loss if the value of the contract increases between the date the forward contract
NOTES TO FINANCIAL STATEMENTS (continued)
is opened and the date the forward contract is closed.The fund realizes a gain if the value of the contract decreases between those dates.With respect to purchases of forward contracts, the fund incurs a loss if the value of the contract decreases between the date the forward contract is opened and the date the forward contract is closed.The fund realizes a gain if the value of the contract increases between those dates. Any realized gain or loss which occurred during the period is reflected in the Statement of Operations.The fund is exposed to foreign currency risk as a result of changes in value of underlying financial instruments. The fund is also exposed to credit risk associated with counterparty nonperformance on these forward contracts, which is typically limited to the unrealized gain on each open contract.The following summarizes open forward contracts at December 31, 2011:
| | | | | | | | | |
| Forward Foreign | | | | | | | | | |
| Currency | | | | | Foreign | | | Unrealized | |
| Exchange | | Number of | Currency | | | Appreciation | |
| Contracts | | Contracts | Amounts | Cost ($) | Value ($) (Depreciation) ($) | |
| Purchases: | | | | | | | | | |
| Brazilian Real, | | | | | | | | | |
| Expiring | | | | | | | | | |
| 3/15/2012a | | | | 1 | 1,238,000 | 663,167 | 652,707 | (10,460 | ) |
| Japanese Yen, | | | | | | | | | |
| Expiring | | | | | | | | | |
| 3/15/2012a | | | | 1 | 47,240,842 | 616,118 | 614,616 | (1,502 | ) |
| Sales: | | | | | | Proceeds ($) | | | |
| Australian Dollar, | | | | | | | |
| Expiring | | | | | | | | | |
| 2/15/2012a | | | | 2 | 669,000 | 673,145 | 680,484 | (7,339 | ) |
| Brazilian Real, | | | | | | | | | |
| Expiring: | | | | | | | | | |
| 3/15/2012a | | 1 | 1,238,000 | 616,118 | 652,707 | (36,589 | ) |
| 6/15/2012b | | 1 | 790,000 | 425,074 | 409,589 | 15,485 | |
| British Pound, | | | | | | | | | |
| Expiring | | | | | | | | | |
| 1/13/2012a | | | | 1 | 344,000 | 546,583 | 534,159 | 12,424 | |
| Japanese Yen, | | | | | | | | | |
| Expiring | | | | | | | | | |
| 3/15/2012a | | | | 1 | 49,594,280 | 663,167 | 645,235 | 17,932 | |
| Gross Unrealized | | | | | | | |
| Appreciation | | | | | | | | 45,841 | |
| Gross Unrealized | | | | | | | |
| Depreciation | | | | | | | | (55,890 | ) |
| |
| Counterparties: |
| a | JPMorgan Chase & Co. |
| b | UBS |
30
The following summarizes the average market value of derivatives outstanding during the period ended December 31, 2011:
| |
| | Average Market Value ($) |
| Forward contracts | 1,754,045 |
At December 31, 2011, the cost of investments for federal income tax purposes was $44,624,222; accordingly, accumulated net unrealized depreciation on investments was $2,105,862, consisting of $4,004,421 gross unrealized appreciation and $6,110,283 gross unrealized depreciation.
The Fund 31
|
| REPORT OF INDEPENDENT REGISTERED |
| PUBLIC ACCOUNTING FIRM |
Shareholders and Board of Trustees
Dreyfus Variable Investment Fund, International Equity Portfolio
We have audited the accompanying statement of assets and liabilities, including the statement of investments, of DreyfusVariable Investment Fund, International Equity Portfolio (one of the series comprising Dreyfus Variable Investment Fund) as of December 31, 2011, and the related statement of operations for the year then ended, the statement of changes in net assets for each of the two years in the period then ended, and financial highlights for each of the years indicated therein. These financial statements and financial highlights are the responsibility of the Fund’s management. Our responsibility is to express an opinion on these financial statements and financial highlights based on our audits.
We conducted our audits in accordance with the standards of the Public Company Accounting Oversight Board (United States).Those standards require that we plan and perform the audit to obtain reasonable assurance about whether the financial statements and financial highlights are free of material misstatement. We were not engaged to perform an audit of the Fund’s internal control over financial reporting. Our audits included consideration of internal control over financial reporting as a basis for designing audit procedures that are appropriate in the circumstances, but not for the purpose of expressing an opinion on the effectiveness of the Fund’s internal control over financial reporting. Accordingly, we express no such opinion. An audit also includes examining, on a test basis, evidence supporting the amounts and disclosures in the financial statements and financial highlights, assessing the accounting principles used and significant estimates made by management, and evaluating the overall financial statement presentation. Our procedures included confirmation of securities owned as of December 31, 2011 by correspondence with the custodian and others.We believe that our audits provide a reasonable basis for our opinion.
In our opinion, the financial statements and financial highlights referred to above present fairly, in all material respects, the financial position of Dreyfus Variable Investment Fund, International Equity Portfolio at December 31, 2011, the results of its operations for the year then ended, the changes in its net assets for each of the two years in the period then ended, and the financial highlights for each of the indicated years, in conformity with U.S. generally accepted accounting principles.

New York, New York
February 10, 2012
32
IMPORTANT TAX INFORMATION (Unaudited)
In accordance with federal tax law, the fund elects to provide each shareholder with their portion of the fund’s foreign taxes paid and the income sourced from foreign countries. Accordingly, the fund hereby makes the following designations regarding its fiscal year ended December 31, 2011:
—the total amount of taxes paid to foreign countries was $105,521
—the total amount of income sourced from foreign countries was $1,403,304.
Where required by federal tax law rules, shareholders will receive notification of their proportionate share of foreign taxes paid and foreign sourced income for the 2011 calendar year with Form 1099-DIV which will be mailed in early 2012.
BOARD MEMBERS INFORMATION (Unaudited)
|
| Joseph S. DiMartino (68) |
| Chairman of the Board (1995) |
| Principal Occupation During Past 5Years: |
| • Corporate Director and Trustee |
| Other Public Company Board Memberships During Past 5Years: |
| • CBIZ (formerly, Century Business Services, Inc.), a provider of outsourcing functions for small |
| and medium size companies, Director (1997-present) |
| • Sunair Services Corporation, a provider of certain outdoor-related services to homes and |
| businesses, Director (2005-2009) |
| • The Newark Group, a provider of a national market of paper recovery facilities, paperboard |
| mills and paperboard converting plants, Director (2000-2010) |
| No. of Portfolios for which Board Member Serves: 164 |
| ——————— |
| |
| Peggy C. Davis (68) |
| Board Member (2006) |
| Principal Occupation During Past 5Years: |
| • Shad Professor of Law, New York University School of Law |
| • Writer and teacher in the fields of evidence, constitutional theory, family law, social sciences and |
| the law, legal process and professional methodology and training |
| No. of Portfolios for which Board Member Serves: 53 |
| ——————— |
| David P. Feldman (72) |
| Board Member (1994) |
| Principal Occupation During Past 5Years: |
| • Corporate Director and Trustee |
| Other Public Company Board Memberships During Past 5Years: |
| • BBH Mutual Funds Group (4 registered mutual funds), Director (1992-present) |
| • QMed, Inc. a healthcare company, Director (1999-2007) |
| No. of Portfolios for which Board Member Serves: 49 |
34
|
| Ehud Houminer (71) |
| Board Member (2006) |
| Principal Occupation During Past 5Years: |
| • Executive-in-Residence at the Columbia Business School, Columbia University (1992-present) |
| Other Public Company Board Memberships During Past 5Years: |
| • Avnet Inc., an electronics distributor, Director (1993-present) |
| No. of Portfolios for which Board Member Serves: 63 |
| ——————— |
| Dr. Martin Peretz (72) |
| Board Member (1990) |
| Principal Occupation During Past 5Years: |
| • Editor-in-Chief Emeritus of The New Republic Magazine (2010-present) (previously, |
| Editor-in-Chief, 1974-2010) |
| • Director of TheStreet.com, a financial information service on the web (1996-present) |
| No. of Portfolios for which Board Member Serves: 35 |
| ——————— |
Once elected all Board Members serve for an indefinite term, but achieve Emeritus status upon reaching age 80.The address of the Board Members and Officers is in c/o The Dreyfus Corporation, 200 Park Avenue, NewYork, NewYork 10166.Additional information about the Board Members is available in the fund’s Statement of Additional Information which can be obtained from Dreyfus free of charge by calling this toll free number: 1-800-DREYFUS.
James F. Henry, Emeritus Board Member
Rosalind G. Jacobs, Emeritus Board Member
Dr. Paul A. Marks, Emeritus Board Member
Gloria Messinger, Emeritus Board Member
OFFICERS OF THE FUND (Unaudited)
BRADLEY J. SKAPYAK, President since January 2010.
Chief Operating Officer and a director of the Manager since June 2009. From April 2003 to June 2009, Mr. Skapyak was the head of the Investment Accounting and Support Department of the Manager. He is an officer of 75 investment companies (comprised of 163 portfolios) managed by the Manager. He is 53 years old and has been an employee of the Manager since February 1988.
JANETTE E. FARRAGHER, Vice President and Secretary since December 2011.
Assistant General Counsel of BNY Mellon, and an officer of 76 investment companies (comprised of 189 portfolios) managed by the Manager. She is 49 years old and has been an employee of the Manager since February 1984.
KIESHA ASTWOOD, Vice President and Assistant Secretary since January 2010.
Counsel of BNY Mellon, and an officer of 76 investment companies (comprised of 189 portfolios) managed by the Manager. She is 38 years old and has been an employee of the Manager since July 1995.
JAMES BITETTO, Vice President and Assistant Secretary since August 2005.
Senior Counsel of BNY Mellon and Secretary of the Manager, and an officer of 76 investment companies (comprised of 189 portfolios) managed by the Manager. He is 45 years old and has been an employee of the Manager since December 1996.
JONI LACKS CHARATAN, Vice President and Assistant Secretary since August 2005.
Senior Counsel of BNY Mellon, and an officer of 76 investment companies (comprised of 189 portfolios) managed by the Manager. She is 56 years old and has been an employee of the Manager since October 1988.
JOSEPH M. CHIOFFI, Vice President and Assistant Secretary since August 2005.
Senior Counsel of BNY Mellon, and an officer of 76 investment companies (comprised of 189 portfolios) managed by the Manager. He is 50 years old and has been an employee of the Manager since June 2000.
KATHLEEN DENICHOLAS, Vice President and Assistant Secretary since January 2010.
Managing Counsel of BNY Mellon, and an officer of 76 investment companies (comprised of 189 portfolios) managed by the Manager. She is 37 years old and has been an employee of the Manager since February 2001.
JOHN B. HAMMALIAN, Vice President and Assistant Secretary since August 2005.
Senior Managing Counsel of BNY Mellon, and an officer of 76 investment companies (comprised of 189 portfolios) managed by the Manager. He is 48 years old and has been an employee of the Manager since February 1991.
M. CRISTINA MEISER, Vice President and Assistant Secretary since January 2010.
Senior Counsel of BNY Mellon, and an officer of 76 investment companies (comprised of 189 portfolios) managed by the Manager. She is 41 years old and has been an employee of the Manager since August 2001.
ROBERT R. MULLERY, Vice President and Assistant Secretary since August 2005.
Managing Counsel of BNY Mellon, and an officer of 76 investment companies (comprised of 189 portfolios) managed by the Manager. He is 59 years old and has been an employee of the Manager since May 1986.
36
JEFF PRUSNOFSKY, Vice President and Assistant Secretary since August 2005.
Senior Managing Counsel of BNY Mellon, and an officer of 76 investment companies (comprised of 189 portfolios) managed by the Manager. He is 46 years old and has been an employee of the Manager since October 1990.
JAMES WINDELS, Treasurer since November 2001.
Director – Mutual Fund Accounting of the Manager, and an officer of 76 investment companies (comprised of 189 portfolios) managed by the Manager. He is 53 years old and has been an employee of the Manager since April 1985.
RICHARD CASSARO, Assistant Treasurer since January 2008.
Senior Accounting Manager – Money Market and Municipal Bond Funds of the Manager, and an officer of 76 investment companies (comprised of 189 portfolios) managed by the Manager. He is 52 years old and has been an employee of the Manager since September 1982.
GAVIN C. REILLY, Assistant Treasurer since December 2005.
Tax Manager of the Investment Accounting and Support Department of the Manager, and an officer of 76 investment companies (comprised of 189 portfolios) managed by the Manager. He is 43 years old and has been an employee of the Manager since April 1991.
ROBERT S. ROBOL, Assistant Treasurer since August 2003.
Senior Accounting Manager – Fixed Income Funds of the Manager, and an officer of 76 investment companies (comprised of 189 portfolios) managed by the Manager. He is 47 years old and has been an employee of the Manager since October 1988.
ROBERT SALVIOLO, Assistant Treasurer since July 2007.
Senior Accounting Manager – Equity Funds of the Manager, and an officer of 76 investment companies (comprised of 189 portfolios) managed by the Manager. He is 44 years old and has been an employee of the Manager since June 1989.
ROBERT SVAGNA, Assistant Treasurer since December 2002.
Senior Accounting Manager – Equity Funds of the Manager, and an officer of 76 investment companies (comprised of 189 portfolios) managed by the Manager. He is 44 years old and has been an employee of the Manager since November 1990.
JOSEPH W. CONNOLLY, Chief Compliance Officer since October 2004.
Chief Compliance Officer of the Manager and The Dreyfus Family of Funds (76 investment companies, comprised of 189 portfolios). From November 2001 through March 2004, Mr. Connolly was first Vice-President, Mutual Fund Servicing for Mellon Global Securities Services. In that capacity, Mr. Connolly was responsible for managing Mellon’s Custody, Fund Accounting and Fund Administration services to third-party mutual fund clients.
He is 54 years old and has served in various capacities with the Manager since 1980, including manager of the firm’s Fund Accounting Department from 1997 through October 2001.
STEPHEN J. STOREN, Anti-Money Laundering Compliance Officer since May 2011.
Chief Compliance Officer of the Distributor, and the Anti-Money Laundering Compliance Officer of 72 investment companies (comprised of 185 portfolios) managed by the Manager. He is 57 years old and has been an employee of the Distributor since October 1999.
For More Information
The fund files its complete schedule of portfolio holdings with the Securities and Exchange Commission (“SEC”) for the first and third quarters of each fiscal year on Form N-Q. The fund’s Forms N-Q are available on the SEC’s website at http://www.sec.gov and may be reviewed and copied at the SEC’s Public Reference Room in Washington, DC. Information on the operation of the Public Reference Room may be obtained by calling 1-800-SEC-0330.
A description of the policies and procedures that the fund uses to determine how to vote proxies relating to portfolio securities, and information regarding how the fund voted these proxies for the most recent 12-month period ended June 30 is available at http://www.dreyfus.com and on the SEC’s website at http://www.sec.gov. The description of the policies and procedures is also available without charge, upon request, by calling 1-800-DREYFUS.

|
| Dreyfus Variable |
| Investment Fund, |
| International Value |
| Portfolio |

The views expressed in this report reflect those of the portfolio manager only through the end of the period covered and do not necessarily represent the views of Dreyfus or any other person in the Dreyfus organization. Any such views are subject to change at any time based upon market or other conditions and Dreyfus disclaims any responsibility to update such views.These views may not be relied on as investment advice and, because investment decisions for a Dreyfus fund are based on numerous factors, may not be relied on as an indication of trading intent on behalf of any Dreyfus fund.
|
| Not FDIC-Insured • Not Bank-Guaranteed • May Lose Value |
| | Contents |
| | THE FUND |
| 2 | A Letter from the Chairman and CEO |
| 3 | Discussion of Fund Performance |
| 6 | Fund Performance |
| 8 | Understanding Your Fund’s Expenses |
| 8 | Comparing Your Fund’s Expenses With Those of Other Funds |
| 9 | Statement of Investments |
| 15 | Statement of Assets and Liabilities |
| 16 | Statement of Operations |
| 17 | Statement of Changes in Net Assets |
| 19 | Financial Highlights |
| 21 | Notes to Financial Statements |
| 32 | Report of Independent Registered Public Accounting Firm |
| 33 | Important Tax Information |
| 34 | Board Members Information |
| 36 | Officers of the Fund |
| | FOR MORE INFORMATION |
| | Back Cover |
Dreyfus Variable Investment Fund,
International Value Portfolio
The Fund

A LETTER FROM THE CHAIRMAN AND CEO
Dear Shareholder:
We present to you this annual report for Dreyfus Variable Investment Fund, InternationalValue Portfolio, covering the 12-month period from January 1, 2011, through December 31, 2011. For information about how the fund performed during the reporting period, as well as general market perspectives, we provide a Discussion of Fund Performance on the pages that follow.
The generally disappointing returns produced by non-U.S. stock markets in 2011 were driven by adverse macroeconomic developments ranging from catastrophic natural disasters in Japan and an unprecedented downgrade of long-term U.S. debt securities to the resurgence of a sovereign debt crisis in Europe and inflation-fighting measures in China and India. In a departure from the trend of the past several years, developed markets in 2011 produced better overall results than emerging markets, and larger stocks generally outpaced smaller stocks.
We already have seen signs that Europe is making progress in addressing its debt crisis, and key emerging markets appear headed for a “soft landing” as inflationary pressures wane. Our economic forecast calls for a mild acceleration of the global recovery in most regions outside of Europe.As investors grow more comfortable with economic conditions, we expect investment capital to flow back into fundamentally sound nations throughout the world. Of course, we encourage you to talk with your financial adviser to help ensure that your investment objectives are properly aligned with your risk tolerance in pursuing potential market opportunities in 2012.
Thank you for your continued confidence and support.

2

DISCUSSION OF FUND PERFORMANCE
For the period of January 1, 2011, through December 31, 2011, as provided by D. Kirk Henry, Primary Portfolio Manager; Carolyn Kedersha, Warren Skillman and Clifford Smith, Portfolio Managers
Fund and Market Performance Overview
For the 12-month period ended December 31, 2011, Dreyfus Variable Investment Fund, International Value Portfolio’s Initial shares produced a total return of –18.48%, and its Service shares produced a total return of –18.76%.1 This compares with a –12.14% return for the fund’s benchmark, the Morgan Stanley Capital International Europe, Australasia, Far East Index (“MSCI EAFE Index”), for the same period.2
A protracted debt crisis in Europe and disappointing global economic data undermined investor sentiment over much of 2011, driving stock prices significantly lower.The fund produced lower returns than the MSCI EAFE Index, primarily due to the market’s discounting of most value-oriented stocks in favor of momentum-oriented stocks and perceived safe havens.
The Fund’s Investment Approach
The fund seeks long-term capital growth.To pursue this goal, the fund normally invests in stocks of foreign companies that we consider to be value companies.The fund may invest in companies of any size, and may also invest in companies located in emerging markets. Our investment approach is value-oriented and research-driven.When selecting stocks, we conduct extensive quantitative and fundamental research that emphasizes individual stock selection rather than economic and industry trends.We focus on how a stock is valued relative to its intrinsic worth, the company’s underlying business health as measured by return on assets and return on equity, and the presence of a catalyst that may trigger an increase in the stock price.
Unexpected Shocks Undermined Global Markets
Despite several unexpected shocks to global markets, including unprecedented political unrest in the Middle East, natural and nuclear disasters in Japan, and the growing sovereign debt crisis in Europe, investors remained generally positive over the first several months of 2011. However, investor
DISCUSSION OF FUND PERFORMANCE (continued)
confidence later crumbled as the debt crisis spread to other members of the European Union, Chinese growth slowed in response to local inflation-fighting efforts, and the U.S. economy showed signs of renewed distress.The MSCI EAFE Index fell particularly sharply during August and September, when investors reacted negatively to a major credit rating agency’s downgrade of long-term U.S. government debt. In this turbulent environment, investors favored perceived safe havens, such as gold, U.S.Treasuries and a limited number of stocks of well-established companies that continued to meet earnings growth expectations.
Market conditions began to stabilize in October, buoyed by several positive developments including improving U.S. economic conditions, signs of political progress in addressing Europe’s structural problems and evidence that inflationary pressures were waning in China. Although market volatility remained high over the final three months of the year, global equity markets regained some of the ground they had lost earlier.
Mixed Results in a Challenging Environment
The fund trailed its benchmark most significantly in the consumer discretionary sector. Notable disappointments included U.K.-based Home Retail Group, which encountered unexpectedly weak demand from cash-strapped consumers; and Hong Kong-based apparel retailer Esprit Holdings, which faced weak demand, wholesale distribution problems and unfavorable market reaction to a corporate restructuring. The fund’s overweighted exposure to technology stocks hurt as well, most notably in the case of Finnish cell phone maker Nokia, which suffered due to its lagging presence in the fast-growing smartphone area. In Italy, international aerospace and defense contractor Finmeccanica lost value in response to widespread cutbacks in government spending and an unclear timetable regarding the company’s restructuring.
The fund achieved better results in other areas. A diverse group of Japan-based investments enhanced performance despite the disrupting effects of a major earthquake and related tsunami and nuclear disasters. Top performers in Japan included utility Tokyo Gas, rail transportation provider East Japan Railway, consumer products makers Kao, Seven & I Holdings, and pharmaceutical developer Astellas Pharma. Stock selections in Sweden delivered relatively strong performance as well, led by telecommunications giant Telefonaktiebolaget LM Ericsson, financial conglomerate Investor AB, and packaging manufacturer
4
Svenska Cellulosa. In Switzerland, strong stock selections, such as pharmaceutical giants Roche Holding and Novartis, more than made up for the fund’s underweighted country exposure.Another major drug maker, Paris based Sanofi, also contributed positively to relative performance, helping to make the health care sector the fund’s top performing industry group during 2011.
Focusing on Underlying Value
On balance, and in light of recent global political and economic developments, we believe the world’s economies are positioned for continued, albeit sluggish, growth in the face of ongoing challenges. In such an environment, we expect international stock markets to respond with less volatility stemming from short-term headlines, instead placing greater emphasis on each company’s underlying value and longer-term business prospects. As of year-end, we have found a relatively large number of investment opportunities in the technology sector that meet our disciplined, value-oriented stock selection criteria, but relatively few stocks have met our criteria in the basic materials sector.
January 17, 2012
| |
| | Please note, the position in any security highlighted in italicized typeface was sold during the |
| | reporting period. |
| | Equity funds are subject generally to market, market sector, market liquidity, issuer and investment |
| | style risks, among other factors, to varying degrees, all of which are more fully described in the |
| | fund’s prospectus. |
| | The fund’s performance will be influenced by political, social and economic factors affecting |
| | investments in foreign companies. Special risks associated with investments in foreign companies |
| | include exposure to currency fluctuations, less liquidity, less developed or less efficient trading |
| | markets, lack of comprehensive company information, political instability and differing auditing |
| | and legal standards.These risks are enhanced in emerging markets countries. |
| | The fund is only available as a funding vehicle under variable life insurance policies or variable |
| | annuity contracts issued by insurance companies. Individuals may not purchase shares of the fund |
| | directly.A variable annuity is an insurance contract issued by an insurance company that enables |
| | investors to accumulate assets on a tax-deferred basis for retirement or other long-term goals. |
| 1 | Total return includes reinvestment of dividends and any capital gains paid. Past performance is no |
| | guarantee of future results. Share price and investment return fluctuate such that upon redemption, |
| | fund shares may be worth more or less than their original cost.The fund’s performance does not |
| | reflect the deduction of additional charges and expenses imposed in connection with investing in |
| | variable insurance contracts, which will reduce returns. |
| 2 | SOURCE: LIPPER INC. — Reflects reinvestment of net dividends and, where applicable, |
| | capital gain distributions.The Morgan Stanley Capital International Europe,Australasia, Far |
| | East (MSCI EAFE) Index is an unmanaged index composed of a sample of companies |
| | representative of the market structure of European and Pacific Basin countries. Investors cannot |
| | invest directly in any index. |
FUND PERFORMANCE
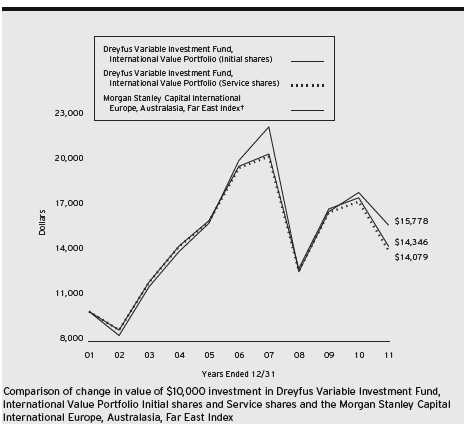
| | | | | | |
| Average Annual Total Returns as of 12/31/11 | | |
| | 1Year | 5 Years | 10 Years |
| Initial shares | –18.48% | –6.15% | 3.68% |
| Service shares | –18.76% | –6.39% | 3.48% |
| Morgan Stanley Capital International | | | |
| Europe, Australasia, Far East Index | –12.14% | –4.72% | 4.67% |
|
| † Source: Lipper Inc. |
| Past performance is not predictive of future performance.The fund’s performance shown in the graph and table does not |
| reflect the deduction of taxes that a shareholder would pay on fund distributions or the redemption of fund shares. |
| The fund’s performance does not reflect the deduction of additional charges and expenses imposed in connection |
| with investing in variable insurance contracts which will reduce returns. |
| The above graph compares a $10,000 investment made in Initial and Service shares of Dreyfus Variable Investment |
| Fund, International Value Portfolio on 12/31/01 to a $10,000 investment made in the Morgan Stanley Capital |
| International Europe,Australasia, Far East Index (the “Index”) on that date. |
6
The fund’s Initial shares are not subject to a Rule 12b-1 fee.The fund’s Service shares are subject to a 0.25% annual Rule 12b-1 fee.All dividends and capital gain distributions are reinvested.
The fund’s performance shown in the line graph above takes into account all applicable fund fees and expenses (after any expense reimbursements).The Index is an unmanaged index composed of a sample of companies representative of the market structure of European and Pacific Basin countries and includes net dividends reinvested. Unlike a mutual fund, the Index is not subject to charges, fees and other expenses. Investors cannot invest directly in any index. Further information relating to fund performance, including expense reimbursements, if applicable, is contained in the Financial Highlights section of the prospectus and elsewhere in this report.
UNDERSTANDING YOUR FUND’S EXPENSES (Unaudited)
As a mutual fund investor, you pay ongoing expenses, such as management fees and other expenses. Using the information below, you can estimate how these expenses affect your investment and compare them with the expenses of other funds.You also may pay one-time transaction expenses, including sales charges (loads), redemption fees and expenses associated with variable annuity or insurance contracts, which are not shown in this section and would have resulted in higher total expenses. For more information, see your fund’s prospectus or talk to your financial adviser.
Review your fund’s expenses
The table below shows the expenses you would have paid on a $1,000 investment in Dreyfus Variable Investment Fund, International Value Portfolio from July 1, 2011 to December 31, 2011. It also shows how much a $1,000 investment would be worth at the close of the period, assuming actual returns and expenses.
Expenses and Value of a $1,000 Investment
assuming actual returns for the six months ended December 31, 2011
| | | | |
| | | Initial Shares | | Service Shares |
| Expenses paid per $1,000† | | $5.98 | | $7.06 |
| Ending value (after expenses) | | $797.10 | | $795.60 |
COMPARING YOUR FUND’S EXPENSES
WITH THOSE OF OTHER FUNDS (Unaudited)
Using the SEC’s method to compare expenses
The Securities and Exchange Commission (SEC) has established guidelines to help investors assess fund expenses. Per these guidelines, the table below shows your fund’s expenses based on a $1,000 investment, assuming a hypothetical 5% annualized return. You can use this information to compare the ongoing expenses (but not transaction expenses or total cost) of investing in the fund with those of other funds.All mutual fund shareholder reports will provide this information to help you make this comparison. Please note that you cannot use this information to estimate your actual ending account balance and expenses paid during the period.
Expenses and Value of a $1,000 Investment
assuming a hypothetical 5% annualized return for the six months ended December 31, 2011
| | | | |
| | | Initial Shares | | Service Shares |
| Expenses paid per $1,000† | | $6.72 | | $7.93 |
| Ending value (after expenses) | | $1,018.55 | | $1,017.34 |
|
| † Expenses are equal to the fund’s annualized expense ratio of 1.32% for Initial Shares and 1.56% for Service Shares, |
| multiplied by the average account value over the period, multiplied by 184/365 (to reflect the one-half year period). |
8
|
| STATEMENT OF INVESTMENTS |
| December 31, 2011 |
| | | | |
| Common Stocks—96.1% | Shares | | | Value ($) |
| Australia—4.7% | | | | |
| BlueScope Steel | 212,633 | | | 88,080 |
| National Australia Bank | 38,671 | | | 923,949 |
| Nufarm | 94,613a | | 402,563 |
| Primary Health Care | 168,217 | | | 529,920 |
| Qantas Airways | 140,910a | | 210,419 |
| QBE Insurance Group | 64,570 | | | 855,245 |
| Toll Holdings | 101,223 | | | 436,900 |
| | | | | 3,447,076 |
| Belgium—.9% | | | | |
| Delhaize Group | 11,410 | | | 640,977 |
| Brazil—1.9% | | | | |
| Banco Santander Brasil, ADS | 62,690 | | | 510,297 |
| Petroleo Brasileiro, ADR | 22,540 | | | 560,119 |
| Tele Norte Leste Participacoes, ADR | 31,240 | | | 297,092 |
| | | | | 1,367,508 |
| China—3.1% | | | | |
| Beijing Capital International Airport, Cl. H | 756,000 | | | 379,626 |
| China Dongxiang Group | 1,133,000 | | | 192,563 |
| China Railway Group, Cl. H | 645,000 | | | 201,806 |
| Foxconn International Holdings | 556,000a | | | 358,659 |
| Guangzhou Automobile Group, Cl. H | 374,272 | | | 312,271 |
| Huaneng Power International, ADR | 3,380 | | | 71,048 |
| Huaneng Power International, Cl. H | 746,000 | | | 396,696 |
| PetroChina, ADR | 2,720 | | | 338,123 |
| | | | | 2,250,792 |
| Finland—1.3% | | | | |
| Nokia | 190,200 | | | 928,537 |
| France—11.7% | | | | |
| Alstom | 15,560 | | | 471,845 |
| Carrefour | 48,410 | | | 1,103,659 |
| Credit Agricole | 46,603 | | | 262,977 |
| EDF | 19,990 | | | 486,394 |
| France Telecom | 49,740 | | | 781,201 |
| GDF Suez | 25,500 | | | 697,030 |
| Lagardere | 7,140 | | | 188,515 |
STATEMENT OF INVESTMENTS (continued)
| | | | |
| Common Stocks (continued) | Shares | | | Value ($) |
| France (continued) | | | | |
| Sanofi | 20,587 | | | 1,512,085 |
| Societe Generale | 22,952 | | | 511,084 |
| Total | 35,780 | | | 1,829,172 |
| Vivendi | 33,644 | | | 736,759 |
| | | | | 8,580,721 |
| Germany—8.2% | | | | |
| Aixtron | 26,020 | | | 331,712 |
| Allianz | 5,420 | | | 518,465 |
| Bayer | 11,340 | | | 725,032 |
| Celesio | 30,010 | | | 475,406 |
| Commerzbank | 187,900a | | | 316,875 |
| Daimler | 11,094 | | | 487,036 |
| Deutsche Bank | 12,050 | | | 459,059 |
| Deutsche Telekom | 44,900 | | | 515,160 |
| E.ON | 61,360 | | | 1,323,848 |
| Muenchener Rueckversicherungs | 3,850 | | | 472,275 |
| RWE | 12,056 | | | 423,633 |
| | | | | 6,048,501 |
| Greece—.6% | | | | |
| Coca-Cola Hellenic Bottling | 27,420a | | | 470,219 |
| Hong Kong—2.6% | | | | |
| China Mobile, ADR | 6,340 | | | 307,427 |
| Esprit Holdings | 516,996 | | | 666,997 |
| Hang Seng Bank | 57,500 | | | 682,232 |
| Pacific Basin Shipping | 558,000 | | | 223,441 |
| | | | | 1,880,097 |
| India—.6% | | | | |
| Reliance Industries, GDR | 16,020b | | | 426,132 |
| Israel—1.9% | | | | |
| Teva Pharmaceutical Industries, ADR | 35,130 | | | 1,417,847 |
| Italy—2.5% | | | | |
| Buzzi Unicem | 10,800a | | 94,490 |
| ENI | 14,465 | | | 299,728 |
| Finmeccanica | 86,506 | | | 319,982 |
10
| | | | |
| Common Stocks (continued) | Shares | | | Value ($) |
| Italy (continued) | | | | |
| Saras | 703,920a | | 880,526 |
| Unipol Gruppo Finanziario | 638,057a | | | 206,038 |
| | | | | 1,800,764 |
| Japan—21.1% | | | | |
| Denso | 16,200 | | | 447,463 |
| East Japan Railway | 12,700 | | | 808,497 |
| Fujitsu | 84,000 | | | 436,534 |
| INPEX | 88 | | | 554,502 |
| Kao | 22,600 | | | 617,485 |
| Kirin Holdings | 25,000 | | | 304,015 |
| Matsumotokiyoshi Holdings | 24,800 | | | 501,993 |
| Medipal Holdings | 47,810 | | | 499,406 |
| Mitsubishi UFJ Financial Group | 271,800 | | | 1,154,717 |
| NEC | 107,000a | | 216,864 |
| Nintendo | 1,570 | | | 216,214 |
| Nippon Express | 127,000 | | | 494,998 |
| Nippon Telegraph & Telephone | 5,000 | | | 255,619 |
| Nomura Holdings | 87,700 | | | 265,481 |
| Panasonic | 73,700 | | | 626,215 |
| Ricoh | 83,700 | | | 729,670 |
| Sekisui House | 49,000 | | | 434,806 |
| Seven & I Holdings | 16,000 | | | 445,888 |
| Shimachu | 9,900 | | | 227,017 |
| Shin-Etsu Chemical | 18,560 | | | 913,894 |
| Sumitomo Mitsui Financial Group | 35,600 | | | 991,638 |
| Sumitomo Mitsui Trust Holdings | 149,240 | | | 438,200 |
| Taiyo Nippon Sanso | 88,000 | | | 613,954 |
| Tokyo Electron | 10,300 | | | 523,899 |
| Tokyo Gas | 117,000 | | | 538,106 |
| Tokyo Steel Manufacturing | 94,700 | | | 770,199 |
| Toyoda Gosei | 8,700 | | | 138,689 |
| Toyota Motor | 37,100 | | | 1,236,345 |
| Yamada Denki | 1,684 | | | 114,644 |
| | | | | 15,516,952 |
STATEMENT OF INVESTMENTS (continued)
| | | | |
| Common Stocks (continued) | Shares | | | Value ($) |
| Netherlands—2.5% | | | | |
| Aegon | 120,654a | | 484,240 |
| Heineken | 2,870 | | | 132,867 |
| Koninklijke Philips Electronics | 57,708 | | | 1,215,927 |
| | | | | 1,833,034 |
| Norway—.4% | | | | |
| Norsk Hydro | 70,066 | | | 324,976 |
| Russia—.1% | | | | |
| Gazprom, ADR | 9,600 | | | 102,336 |
| Singapore—1.8% | | | | |
| DBS Group Holdings | 112,453 | | | 998,773 |
| United Overseas Bank | 27,425 | | | 322,871 |
| | | | | 1,321,644 |
| South Africa—1.1% | | | | |
| Murray & Roberts Holdings | 78,960a | | | 250,890 |
| Standard Bank Group | 48,340 | | | 591,334 |
| | | | | 842,224 |
| South Korea—2.0% | | | | |
| KB Financial Group, ADR | 7,219a | | | 226,243 |
| Korea Electric Power | 8,810a | | 195,395 |
| Korea Electric Power, ADR | 24,580a | | 269,888 |
| Korea Exchange Bank | 69,770 | | | 445,147 |
| KT, ADR | 8,630 | | | 134,973 |
| SK Telecom, ADR | 13,600 | | | 185,096 |
| | | | | 1,456,742 |
| Spain—.4% | | | | |
| Gamesa Corp Tecnologica | 79,800 | | | 331,532 |
| Sweden—3.4% | | | | |
| Husqvarna, Cl. B | 62,480 | | | 287,885 |
| Investor, Cl. B | 22,290 | | | 415,870 |
| Svenska Cellulosa, Cl. B | 45,260 | | | 670,806 |
| Telefonaktiebolaget LM Ericsson, Cl. B | 106,380 | | | 1,088,215 |
| | | | | 2,462,776 |
12
| | | |
| Common Stocks (continued) | Shares | Value ($) |
| Switzerland—6.9% | | |
| Adecco | 9,590a | 401,753 |
| Lonza Group | 7,950a | 469,738 |
| Novartis | 28,539 | 1,631,581 |
| Roche Holding | 9,830 | 1,666,066 |
| UBS | 72,394a | 861,668 |
| | | 5,030,806 |
| Taiwan—.5% | | |
| United Microelectronics | 828,120 | 347,341 |
| United Kingdom—15.9% | | |
| Anglo American | 24,125 | 891,312 |
| BAE Systems | 132,058 | 584,696 |
| BP | 221,042 | 1,580,784 |
| Home Retail Group | 354,481 | 459,121 |
| HSBC Holdings | 302,931 | 2,310,136 |
| Lonmin | 42,797 | 651,340 |
| QinetiQ Group | 22,170 | 45,654 |
| Reed Elsevier | 40,224 | 324,206 |
| Resolution | 112,028 | 437,381 |
| Royal Dutch Shell, Cl. A | 43,065 | 1,577,323 |
| Smith & Nephew | 890 | 8,645 |
| Tesco | 127,607 | 799,525 |
| Unilever | 42,358 | 1,422,853 |
| Vodafone Group | 205,356 | 570,540 |
| | | 11,663,516 |
| Total Common Stocks | | |
| (cost $96,919,371) | | 70,493,050 |
| | Number of | |
| Rights—.0% | Rights | Value ($) |
| Australia | | |
| BlueScope Steel | | |
| (cost $65,206) | 170,106a | 1,044 |
STATEMENT OF INVESTMENTS (continued)
| | | |
| Other Investment—2.6% | Shares | Value ($) |
| Registered Investment Company; | | |
| Dreyfus Institutional Preferred | | |
| Plus Money Market Fund | | |
| (cost $1,920,000) | 1,920,000c | 1,920,000 |
| |
| Total Investments (cost $98,904,577) | 98.7% | 72,414,094 |
| Cash and Receivables (Net) | 1.3% | 944,249 |
| Net Assets | 100.0% | 73,358,343 |
ADR—American Depository Receipts
ADS—American Depository Shares
GDR—Global Depository Receipts
|
| a Non-income producing security. |
| b Security exempt from registration under Rule 144A of the Securities Act of 1933.This security may be resold in |
| transactions exempt from registration, normally to qualified institutional buyers.At December 31, 2011, this security |
| was valued at $426,132 or .6% of net assets. |
| c Investment in affiliated money market mutual fund. |
| | | |
| Portfolio Summary (Unaudited)† | | |
| |
| | Value (%) | | Value (%) |
| Financial | 21.3 | Materials | 8.0 |
| Health Care | 12.1 | Information Technology | 7.1 |
| Energy | 10.6 | Utilities | 5.9 |
| Consumer Staples | 8.8 | Telecommunication Services | 5.2 |
| Industrial | 8.7 | Money Market Investment | 2.6 |
| Consumer Discretionary | 8.4 | | 98.7 |
| |
| † Based on net assets. | | | |
| See notes to financial statements. | | | |
14
|
| STATEMENT OF ASSETS AND LIABILITIES |
| December 31, 2011 |
| | | |
| | Cost | Value |
| Assets ($): | | |
| Investments in securities—See Statement of Investments: | | |
| Unaffiliated issuers | 96,984,577 | 70,494,094 |
| Affiliated issuers | 1,920,000 | 1,920,000 |
| Cash | | 342,739 |
| Cash denominated in foreign currencies | 429,098 | 429,510 |
| Receivable for shares of Beneficial Interest subscribed | | 317,160 |
| Dividends receivable | | 202,478 |
| Receivable for investment securities sold | | 53,615 |
| Unrealized appreciation on forward foreign | | |
| currency exchange contracts—Note 4 | | 2 |
| Prepaid expenses | | 2,956 |
| | | 73,762,554 |
| Liabilities ($): | | |
| Due to The Dreyfus Corporation and affiliates—Note 3(b) | | 109,654 |
| Payable for investment securities purchased | | 216,386 |
| Payable for shares of Beneficial Interest redeemed | | 62,158 |
| Unrealized depreciation on forward foreign | | |
| currency exchange contracts—Note 4 | | 50 |
| Accrued expenses | | 15,963 |
| | | 404,211 |
| Net Assets ($) | | 73,358,343 |
| Composition of Net Assets ($): | | |
| Paid-in capital | | 124,675,434 |
| Accumulated undistributed investment income—net | | 1,993,211 |
| Accumulated net realized gain (loss) on investments | | (26,812,316) |
| Accumulated net unrealized appreciation (depreciation) | | |
| on investments and foreign currency transactions | | (26,497,986) |
| Net Assets ($) | | 73,358,343 |
| |
| |
| Net Asset Value Per Share | | |
| | Initial Shares | Service Shares |
| Net Assets ($) | 40,549,003 | 32,809,340 |
| Shares Outstanding | 4,525,512 | 3,664,658 |
| Net Asset Value Per Share ($) | 8.96 | 8.95 |
| |
| See notes to financial statements. | | |
|
| STATEMENT OF OPERATIONS |
| Year Ended December 31, 2011 |
| | |
| Investment Income ($): | |
| Income: | |
| Cash dividends (net of $312,997 foreign taxes withheld at source): | |
| Unaffiliated issuers | 3,243,228 |
| Affiliated issuers | 1,228 |
| Interest | 351 |
| Total Income | 3,244,807 |
| Expenses: | |
| Investment advisory fee—Note 3(a) | 925,088 |
| Distribution fees—Note 3(b) | 107,269 |
| Custodian fees—Note 3(b) | 87,671 |
| Auditing fees | 68,632 |
| Prospectus and shareholders’ reports | 25,256 |
| Legal fees | 9,017 |
| Shareholder servicing costs—Note 3(b) | 6,072 |
| Trustees’ fees and expenses—Note 3(c) | 4,347 |
| Interest expense—Note 2 | 2,329 |
| Loan commitment fees—Note 2 | 1,574 |
| Miscellaneous | 25,595 |
| Total Expenses | 1,262,850 |
| Less—reduction in fees due to earnings credits—Note 3(b) | (3) |
| Net Expenses | 1,262,847 |
| Investment Income—Net | 1,981,960 |
| Realized and Unrealized Gain (Loss) on Investments—Note 4 ($): | |
| Net realized gain (loss) on investments and foreign currency transactions | 4,937,275 |
| Net realized gain (loss) on forward foreign currency exchange contracts | (105,886) |
| Net Realized Gain (Loss) | 4,831,389 |
| Net unrealized appreciation (depreciation) on | |
| investments and foreign currency transactions | (23,466,283) |
| Net unrealized appreciation (depreciation) on | |
| forward foreign currency exchange contracts | 98 |
| Net Unrealized Appreciation (Depreciation) | (23,466,185) |
| Net Realized and Unrealized Gain (Loss) on Investments | (18,634,796) |
| Net (Decrease) in Net Assets Resulting from Operations | (16,652,836) |
| |
| See notes to financial statements. | |
16
STATEMENT OF CHANGES IN NET ASSETS
| | | | |
| | Year Ended December 31, |
| | 2011 | 2010 |
| Operations ($): | | |
| Investment income—net | 1,981,960 | 1,634,037 |
| Net realized gain (loss) on investments | 4,831,389 | 4,946,937 |
| Net unrealized appreciation | | |
| (depreciation) on investments | (23,466,185) | (2,795,852) |
| Net Increase (Decrease) in Net Assets | | |
| Resulting from Operations | (16,652,836) | 3,785,122 |
| Dividends to Shareholders from ($): | | |
| Investment income—net: | | |
| Initial Shares | (1,098,099) | (1,035,042) |
| Service Shares | (855,198) | (712,406) |
| Total Dividends | (1,953,297) | (1,747,448) |
| Beneficial Interest Transactions ($): | | |
| Net proceeds from shares sold: | | |
| Initial Shares | 10,351,325 | 9,286,687 |
| Service Shares | 6,541,873 | 13,407,360 |
| Dividends reinvested: | | |
| Initial Shares | 1,098,099 | 1,035,042 |
| Service Shares | 855,198 | 712,406 |
| Cost of shares redeemed: | | |
| Initial Shares | (20,126,658) | (10,963,529) |
| Service Shares | (14,959,209) | (16,676,496) |
| Increase (Decrease) in Net Assets from | | |
| Beneficial Interest Transactions | (16,239,372) | (3,198,530) |
| Total Increase (Decrease) in Net Assets | (34,845,505) | (1,160,856) |
| Net Assets ($): | | |
| Beginning of Period | 108,203,848 | 109,364,704 |
| End of Period | 73,358,343 | 108,203,848 |
| Undistributed investment income—net | 1,993,211 | 1,764,508 |
STATEMENT OF CHANGES IN NET ASSETS (continued)
| | | | |
| | Year Ended December 31, |
| | 2011 | 2010 |
| Capital Share Transactions: | | |
| Initial Shares | | |
| Shares sold | 973,051 | 856,479 |
| Shares issued for dividends reinvested | 96,749 | 94,958 |
| Shares redeemed | (1,827,409) | (1,040,516) |
| Net Increase (Decrease) in Shares Outstanding | (757,609) | (89,079) |
| Service Shares | | |
| Shares sold | 640,635 | 1,246,678 |
| Shares issued for dividends reinvested | 75,282 | 65,239 |
| Shares redeemed | (1,420,356) | (1,584,438) |
| Net Increase (Decrease) in Shares Outstanding | (704,439) | (272,521) |
| |
| See notes to financial statements. | | |
18
FINANCIAL HIGHLIGHTS
The following tables describe the performance for each share class for the fiscal periods indicated.All information (except portfolio turnover rate) reflects financial results for a single fund share.Total return shows how much your investment in the fund would have increased (or decreased) during each period, assuming you had reinvested all dividends and distributions. The fund’s total returns do not reflect expenses associated with variable annuity or insurance contracts.These figures have been derived from the fund’s financial statements.
| | | | | | | | | | |
| | | Year Ended December 31, | |
| Initial Shares | 2011 | 2010 | 2009 | 2008 | 2007 |
| Per Share Data ($): | | | | | |
| Net asset value, beginning of period | 11.21 | 10.92 | 8.79 | 17.43 | 19.50 |
| Investment Operations: | | | | | |
| Investment income—neta | .24 | .18 | .17 | .34 | .31 |
| Net realized and unrealized | | | | | |
| gain (loss) on investments | (2.26) | .30 | 2.35 | (5.94) | .44 |
| Total from Investment Operations | (2.02) | .48 | 2.52 | (5.60) | .75 |
| Distributions: | | | | | |
| Dividends from investment income—net | (.23) | (.19) | (.39) | (.35) | (.31) |
| Dividends from net realized | | | | | |
| gain on investments | — | — | — | (2.69) | (2.51) |
| Total Distributions | (.23) | (.19) | (.39) | (3.04) | (2.82) |
| Net asset value, end of period | 8.96 | 11.21 | 10.92 | 8.79 | 17.43 |
| Total Return (%) | (18.48) | 4.46 | 30.97 | (37.32) | 4.15 |
| Ratios/Supplemental Data (%): | | | | | |
| Ratio of total expenses | | | | | |
| to average net assets | 1.25 | 1.26 | 1.32 | 1.23 | 1.19 |
| Ratio of net expenses | | | | | |
| to average net assets | 1.25 | 1.26 | 1.32 | 1.23 | 1.18 |
| Ratio of net investment income | | | | | |
| to average net assets | 2.24 | 1.72 | 1.89 | 2.79 | 1.69 |
| Portfolio Turnover Rate | 46.71 | 61.13 | 63.87 | 55.27 | 66.08 |
| Net Assets, end of period ($ x 1,000) | 40,549 | 59,242 | 58,684 | 49,868 | 101,614 |
| |
| a Based on average shares outstanding at each month end. | | | | |
| See notes to financial statements. | | | | | |
FINANCIAL HIGHLIGHTS (continued)
| | | | | | | | | | |
| | | Year Ended December 31, | |
| Service Shares | 2011 | 2010 | 2009 | 2008 | 2007 |
| Per Share Data ($): | | | | | |
| Net asset value, beginning of period | 11.21 | 10.92 | 8.77 | 17.39 | 19.47 |
| Investment Operations: | | | | | |
| Investment income—neta | .22 | .15 | .15 | .32 | .27 |
| Net realized and unrealized | | | | | |
| gain (loss) on investments | (2.28) | .31 | 2.35 | (5.94) | .44 |
| Total from Investment Operations | (2.06) | .46 | 2.50 | (5.62) | .71 |
| Distributions: | | | | | |
| Dividends from investment income—net | (.20) | (.17) | (.35) | (.31) | (.28) |
| Dividends from net realized | | | | | |
| gain on investments | — | — | — | (2.69) | (2.51) |
| Total Distributions | (.20) | (.17) | (.35) | (3.00) | (2.79) |
| Net asset value, end of period | 8.95 | 11.21 | 10.92 | 8.77 | 17.39 |
| Total Return (%) | (18.76) | 4.22 | 30.66 | (37.48) | 3.92 |
| Ratios/Supplemental Data (%): | | | | | |
| Ratio of total expenses | | | | | |
| to average net assets | 1.50 | 1.51 | 1.57 | 1.48 | 1.44 |
| Ratio of net expenses | | | | | |
| to average net assets | 1.50 | 1.51 | 1.57 | 1.48 | 1.39 |
| Ratio of net investment income | | | | | |
| to average net assets | 2.03 | 1.44 | 1.60 | 2.58 | 1.49 |
| Portfolio Turnover Rate | 46.71 | 61.13 | 63.87 | 55.27 | 66.08 |
| Net Assets, end of period ($ x 1,000) | 32,809 | 48,962 | 50,681 | 41,225 | 79,776 |
| |
| a Based on average shares outstanding at each month end. | | | | |
| See notes to financial statements. | | | | | |
20
NOTES TO FINANCIAL STATEMENTS
NOTE 1—Significant Accounting Policies:
DreyfusVariable Investment Fund (the “Company”) is registered under the Investment Company Act of 1940, as amended (the “Act”), as an open-end management investment company, operating as a series company currently offering seven series, including the International Value Portfolio (the “fund”). The fund is only offered to separate accounts established by insurance companies to fund variable annuity contracts and variable life insurance policies.The fund is a diversified series.The fund’s investment objective is to seek long-term capital growth. The Dreyfus Corporation (the “Manager” or “Dreyfus”), a wholly-owned subsidiary of The Bank of New York Mellon Corporation (“BNY Mellon”), serves as the fund’s investment adviser.
MBSC Securities Corporation (the “Distributor”), a wholly-owned subsidiary of the Manager, is the distributor of the fund’s shares, which are sold without a sales charge. The fund is authorized to issue an unlimited number of $.001 par value shares of Beneficial Interest in each of the following classes of shares: Initial and Service. Each class of shares has identical rights and privileges, except with respect to the distribution plan, the expenses borne by each class, the allocation of certain transfer agency costs and certain voting rights. Income, expenses (other than expenses attributable to a specific class), and realized and unrealized gains or losses on investments are allocated to each class of shares based on its relative net assets.
The Company accounts separately for the assets, liabilities and operations of each series. Expenses directly attributable to each series are charged to that series’ operations; expenses which are applicable to all series are allocated among them on a pro rata basis.
The Financial Accounting Standards Board (“FASB”) Accounting Standards Codification (“ASC”) is the exclusive reference of authoritative U.S. generally accepted accounting principles (“GAAP”) recognized by the FASB to be applied by nongovernmental entities. Rules and interpretive releases of the Securities and Exchange Commission (“SEC”) under authority of federal laws are also sources of authoritative GAAP for
NOTES TO FINANCIAL STATEMENTS (continued)
SEC registrants. The fund’s financial statements are prepared in accordance with GAAP, which may require the use of management estimates and assumptions.Actual results could differ from those estimates.
The Company enters into contracts that contain a variety of indemnifications.The fund’s maximum exposure under these arrangements is unknown.The fund does not anticipate recognizing any loss related to these arrangements.
(a) Portfolio valuation: The fair value of a financial instrument is the amount that would be received to sell an asset or paid to transfer a liability in an orderly transaction between market participants at the measurement date (i.e. the exit price). GAAP establishes a fair value hierarchy that prioritizes the inputs of valuation techniques used to measure fair value.This hierarchy gives the highest priority to unadjusted quoted prices in active markets for identical assets or liabilities (Level 1 measurements) and the lowest priority to unobservable inputs (Level 3 measurements).
Additionally, GAAP provides guidance on determining whether the volume and activity in a market has decreased significantly and whether such a decrease in activity results in transactions that are not orderly. GAAP requires enhanced disclosures around valuation inputs and techniques used during annual and interim periods.
Various inputs are used in determining the value of the fund’s investments relating to fair value measurements.These inputs are summarized in the three broad levels listed below:
Level 1—unadjusted quoted prices in active markets for identical investments.
Level 2—other significant observable inputs (including quoted prices for similar investments, interest rates, prepayment speeds, credit risk, etc.).
Level 3—significant unobservable inputs (including the fund’s own assumptions in determining the fair value of investments).
The inputs or methodology used for valuing securities are not necessarily an indication of the risk associated with investing in those securities.
22
Changes in valuation techniques may result in transfers in or out of an assigned level within the disclosure hierarchy. Valuation techniques used to value the fund’s investments are as follows:
Investments in securities are valued at the last sales price on the securities exchange or national securities market on which such securities are primarily traded. Securities listed on the National Market System for which market quotations are available are valued at the official closing price or, if there is no official closing price that day, at the last sales price. Securities not listed on an exchange or the national securities market, or securities for which there were no transactions, are valued at the average of the most recent bid and asked prices, except for open short positions, where the asked price is used for valuation purposes. Bid price is used when no asked price is available. Registered investment companies that are not traded on an exchange are valued at their net asset value.All preceding securities are categorized within Level 1 of the fair value hierarchy.
Fair valuing of securities may be determined with the assistance of a pricing service using calculations based on indices of domestic securities and other appropriate indicators, such as prices of relevant ADRs and futures contracts. Utilizing these techniques may result in transfers between Level 1 and Level 2 of the fair value hierarchy.
When market quotations or official closing prices are not readily available, or are determined not to reflect accurately fair value, such as when the value of a security has been significantly affected by events after the close of the exchange or market on which the security is principally traded (for example, a foreign exchange or market), but before the fund calculates its net asset value, the fund may value these investments at fair value as determined in accordance with the procedures approved by the Board of Trustees. Certain factors may be considered when fair valuing investments such as: fundamental analytical data, the nature and duration of restrictions on disposition, an evaluation of the forces that influence the market in which the securities are purchased and sold, and public
NOTES TO FINANCIAL STATEMENTS (continued)
trading in similar securities of the issuer or comparable issuers. These securities are either categorized as Level 2 or 3 depending on the relevant inputs used.
For restricted securities where observable inputs are limited, assumptions about market activity and risk are used and are categorized within Level 3 of the fair value hierarchy.
Investments denominated in foreign currencies are translated to U.S. dollars at the prevailing rates of exchange. Forward foreign currency exchange contracts (“forward contracts”) are valued at the forward rate. These securities are generally categorized within Level 2 of the fair value hierarchy.
The following is a summary of the inputs used as of December 31, 2011 in valuing the fund’s investments:
| | | | | | |
| | | Level 2—Other | | Level 3— | | |
| | Level 1— | Significant | | Significant | | |
| | Unadjusted | Observable | | Unobservable | | |
| | Quoted Prices | Inputs | | Inputs | Total | |
| Assets ($) | | | | | | |
| Investments in Securities: | | | | | |
| Equity Securities— | | | | | | |
| Foreign† | 70,493,050 | — | | — | 70,493,050 | |
| Mutual Funds | 1,920,000 | — | | — | 1,920,000 | |
| Rights† | 1,044 | — | | — | 1,044 | |
| Other Financial | | | | | | |
| Instruments: | | | | | | |
| Forward Foreign | | | | | | |
| Currency Exchange | | | | | | |
| Contracts†† | — | 2 | | — | 2 | |
| Liabilities ($) | | | | | | |
| Other Financial | | | | | | |
| Instruments: | | | | | | |
| Forward Foreign | | | | | | |
| Currency Exchange | | | | | | |
| Contracts†† | — | (50 | ) | — | (50 | ) |
| |
| † | See Statement of Investments for additional detailed categorizations. |
| †† | Amount shown represents unrealized appreciation (depreciation) at period end. |
In May 2011, FASB issued Accounting Standards Update (“ASU”) No.
2011-04 “Amendments to Achieve Common FairValue Measurement
24
and Disclosure Requirements in GAAP and International Financial Reporting Standards (“IFRS”)” (“ASU 2011-04”). ASU 2011-04 includes common requirements for measurement of and disclosure about fair value between GAAP and IFRS. ASU 2011-04 will require reporting entities to disclose the following information for fair value measurements categorized within Level 3 of the fair value hierarchy: quantitative information about the unobservable inputs used in the fair value measurement, the valuation processes used by the reporting entity and a narrative description of the sensitivity of the fair value measurement to changes in unobservable inputs and the interrelationships between those unobservable inputs. In addition, ASU 2011-04 will require reporting entities to make disclosures about amounts and reasons for all transfers in and out of Level 1 and Level 2 fair value measurements.The new and revised disclosures are effective for interim and annual reporting periods beginning after December 15, 2011. At this time, management is evaluating the implications of ASU 2011-04 and its impact on the financial statements.
(b) Foreign currency transactions: The fund does not isolate that portion of the results of operations resulting from changes in foreign exchange rates on investments from the fluctuations arising from changes in market prices of securities held. Such fluctuations are included with the net realized and unrealized gain or loss on investments.
Net realized foreign exchange gains or losses arise from sales of foreign currencies, currency gains or losses realized on securities transactions between trade and settlement date, and the difference between the amounts of dividends, interest and foreign withholding taxes recorded on the fund’s books and the U.S. dollar equivalent of the amounts actually received or paid. Net unrealized foreign exchange gains and losses arise from changes in the value of assets and liabilities other than investments resulting from changes in exchange rates. Foreign currency gains and losses on investments are included with net realized and unrealized gain or loss on investments.
NOTES TO FINANCIAL STATEMENTS (continued)
(c) Securities transactions and investment income: Securities transactions are recorded on a trade date basis. Realized gains and losses from securities transactions are recorded on the identified cost basis. Dividend income is recognized on the ex-dividend date and interest income, including, where applicable, accretion of discount and amortization of premium on investments, is recognized on the accrual basis.
Investing in foreign markets may involve special risks and considerations not typically associated with investing in the U.S. These risks include revaluation of currencies, high rates of inflation, repatriation restrictions on income and capital, and adverse political and economic developments. Moreover, securities issued in these markets may be less liquid, subject to government ownership controls and delayed settlements, and their prices may be more volatile than those of comparable securities in the U.S.
(d) Affiliated issuers: Investments in other investment companies advised by Dreyfus are defined as “affiliated” in the Act.
The fund may invest in shares of certain affiliated investment companies also advised or managed by Dreyfus. Investments in affiliated investment companies for the period ended December 31, 2011 were as follows:
| | | | | | | |
| Affiliated | | | | | | | |
| Investment | Value | | | | Value | | Net |
| Company | 12/31/2010 | ($) | Purchases ($) | Sales ($) | 12/31/2011 | ($) | Assets (%) |
| Dreyfus | | | | | | | |
| Institutional | | | | | | | |
| Preferred | | | | | | | |
| Plus Money | | | | | | | |
| Market Fund | 3,740,000 | | 24,210,000 | 26,030,000 | 1,920,000 | | 2.6 |
(e) Dividends to shareholders: Dividends are recorded on the ex-dividend date. Dividends from investment income-net and dividends from net realized capital gains, if any, are normally declared and paid annually, but the fund may make distributions on a more frequent basis to comply with the distribution requirements of the Internal Revenue Code of 1986, as amended (the “Code”).To the extent that net realized capital gains can be offset by capital loss carryovers, it is the policy of the fund not to distribute such gains. Income and capital gain distributions are determined in accordance with income tax regulations, which may differ from GAAP.
26
(f) Federal income taxes: It is the policy of the fund to continue to qualify as a regulated investment company, if such qualification is in the best interests of its shareholders, by complying with the applicable provisions of the Code, and to make distributions of taxable income sufficient to relieve it from substantially all federal income and excise taxes.
As of and during the period ended December 31, 2011, the fund did not have any liabilities for any uncertain tax positions.The fund recognizes interest and penalties, if any, related to uncertain tax positions as income tax expense in the Statement of Operations. During the period, the fund did not incur any interest or penalties.
Each of the tax years in the four-year period ended December 31, 2011 remains subject to examination by the Internal Revenue Service and state taxing authorities.
At December 31, 2011, the components of accumulated earnings on a tax basis were as follows: undistributed ordinary income $2,030,315, accumulated capital losses $23,931,605 and unrealized depreciation $28,758,170. In addition, the fund had $657,631 of capital losses realized after October 31, 2011, which were deferred for tax purposes to the first day of the following fiscal year.
Under the Regulated Investment Company Modernization Act of 2010 (the “2010 Act”), the fund will be permitted to carry forward capital losses incurred in taxable years beginning after December 22, 2010 (“post-enactment losses”) for an unlimited period. Post-enactment capital loss carryovers will retain their character as either short-term or long-term capital losses rather than be considered short-term as they were under previous statute. However, the 2010 Act requires post-enactment losses to be utilized before the utilization of losses incurred in taxable years prior to the effective date of the 2010 Act (“pre-enactment losses”). As a result of this ordering rule, pre-enactment losses may be more likely to expire unused.
NOTES TO FINANCIAL STATEMENTS (continued)
The accumulated capital loss carryover is available for federal income tax purposes to be applied against future net securities profits, if any, realized subsequent to December 31, 2011. If not applied, $2,290,912 of the carryover expires in fiscal 2016 and $21,640,693 expires in fiscal 2017.
The tax character of distributions paid to shareholders during the fiscal periods ended December 31, 2011 and December 31, 2010 were as follows: ordinary income $1,953,297 and $1,747,448, respectively.
During the period ended December 31, 2011, as a result of permanent book to tax differences, primarily due to the tax treatment for foreign currency gains and losses and passive foreign investment companies, the fund increased accumulated undistributed investment income-net by $200,040 and decreased accumulated net realized gain (loss) on investments by the same amount. Net assets and net asset value per share were not affected by this reclassification.
NOTE 2—Bank Lines of Credit:
The fund participates with other Dreyfus-managed funds in a $225 million unsecured credit facility led by Citibank, N.A. and a $300 million unsecured credit facility provided by The Bank of New York Mellon, a subsidiary of BNY Mellon and an affiliate of Dreyfus, (each, a “Facility”), each to be utilized primarily for temporary or emergency purposes, including the financing of redemptions. In connection therewith, the fund has agreed to pay its pro rata portion of commitment fees for each Facility. Interest is charged to the fund based on rates determined pursuant to the terms of the respective Facility at the time of borrowing.
The average amount of borrowings outstanding under the Facilities during the period ended December 31, 2011 was approximately $168,200 with a related weighted average annualized interest rate of 1.38%.
NOTE 3—Investment Advisory Fee and Other Transactions With Affiliates:
(a) Pursuant to an investment advisory agreement with the Manager, the investment advisory fee is computed at the annual rate of 1% of the value of the fund’s average daily net assets and is payable monthly.
28
(b) Under the Distribution Plan (the “Plan”) adopted pursuant to Rule 12b-1 under the Act, Service shares pay the Distributor for distributing its shares, for servicing and/or maintaining Service shares’ shareholder accounts and for advertising and marketing for Service shares.The Plan provides for payments to be made at an annual rate of .25% of the value of the Service shares’ average daily net assets.The Distributor may make payments to Participating Insurance Companies and to brokers and dealers acting as principal underwriter for their variable insurance products.The fees payable under the Plan are payable without regard to actual expenses incurred. During the period ended December 31, 2011, Service shares were charged $107,269 pursuant to the Plan.
The fund compensates Dreyfus Transfer, Inc., a wholly-owned subsidiary of the Manager, under a transfer agency agreement for providing personnel and facilities to perform transfer agency services for the fund. During the period ended December 31, 2011, the fund was charged $631 pursuant to the transfer agency agreement, which is included in Shareholder servicing costs in the Statement of Operations.
The fund has arrangements with the custodian and cash management bank whereby the fund may receive earnings credits when positive cash balances are maintained, which are used to offset custody and cash management fees. For financial reporting purposes, the fund includes net earnings credits as an expense offset in the Statement of Operations.
The fund compensates The Bank of New York Mellon under a cash management agreement for performing cash management services related to fund subscriptions and redemptions. During the period ended December 31, 2011, the fund was charged $101 pursuant to the cash management agreement, which is included in Shareholder servicing costs in the Statement of Operations.These fees were partially offset by earnings credits of $3.
The fund also compensates The Bank of New York Mellon under a custody agreement for providing custodial services for the fund. During the period ended December 31, 2011, the fund was charged $87,671 pursuant to the custody agreement.
NOTES TO FINANCIAL STATEMENTS (continued)
During the period ended December 31, 2011, the fund was charged $6,402 for services performed by the Chief Compliance Officer.
The components of “Due to The Dreyfus Corporation and affiliates” in the Statement of Assets and Liabilities consist of: investment advisory fees $62,034, Rule 12b-1 distribution plan fees $6,898, custodian fees $35,332, chief compliance officer fees $5,295 and transfer agency per account fees $95.
(c) Each Board member also serves as a Board member of other funds within the Dreyfus complex. Annual retainer fees and attendance fees are allocated to each fund based on net assets.
NOTE 4—Securities Transactions:
The aggregate amount of purchases and sales of investment securities, excluding short-term securities and forward contracts, during the period ended December 31, 2011, amounted to $42,764,221 and $58,173,760, respectively.
Forward Foreign Currency Exchange Contracts: The fund enters into forward contracts in order to hedge its exposure to changes in foreign currency exchange rates on its foreign portfolio holdings, to settle foreign currency transactions or as a part of its investment strategy. When executing forward contracts, the fund is obligated to buy or sell a foreign currency at a specified rate on a certain date in the future. With respect to sales of forward contracts, the fund incurs a loss if the value of the contract increases between the date the forward contract is opened and the date the forward contract is closed.The fund realizes a gain if the value of the contract decreases between those dates.With respect to purchases of forward contracts, the fund incurs a loss if the value of the contract decreases between the date the forward contract is opened and the date the forward contract is closed.The fund realizes a gain if the value of the contract increases between those dates. Any realized gain or loss which occurred during the period is reflected in the Statement of Operations.The fund is exposed to foreign currency risk as a result of changes in value of underlying financial instruments.
30
The fund is also exposed to credit risk associated with counterparty nonperformance on these forward contracts, which is typically limited to the unrealized gain on each open contract.The following summarizes open forward contracts at December 31, 2011:
| | | | | | |
| Forward Foreign | | | | | | |
| Currency | | Foreign | | | Unrealized | |
| Exchange | Number of | Currency | | | Appreciation | |
| Contracts | Contracts | Amounts | Cost ($) | Value ($) (Depreciation) ($) | |
| Purchases: | | | | | | |
| Norwegian Krone, | | | | | |
| Expiring | | | | | | |
| 1/3/2012a | 1 | 240,672 | 40,281 | 40,240 | (41 | ) |
| Singapore Dollar, | | | | | |
| Expiring | | | | | | |
| 1/3/2012b | 1 | 46,672 | 35,992 | 35,983 | (9 | ) |
| Sales: | | | Proceeds ($) | | | |
| British Pound, | | | | | | |
| Expiring | | | | | | |
| 1/3/2012b | 1 | 19,842 | 30,816 | 30,814 | 2 | |
| Gross Unrealized | | | | | |
| Appreciation | | | | | 2 | |
| Gross Unrealized | | | | | |
| Depreciation | | | | | (50 | ) |
| |
| Counterparties: |
| a | Barclay’s Bank |
| b | Credit Suisse First Boston |
The following summarizes the average market value of derivatives outstanding during the period ended December 31, 2011:
| |
| | Average Market Value ($) |
| Forward contracts | 365,829 |
At December 31, 2011, the cost of investments for federal income tax purposes was $101,164,761; accordingly, accumulated net unrealized depreciation on investments was $28,750,667, consisting of $2,003,124 gross unrealized appreciation and $30,753,791 gross unrealized depreciation.
|
| REPORT OF INDEPENDENT REGISTERED |
| PUBLIC ACCOUNTING FIRM |
Shareholders and Board of Trustees
Dreyfus Variable Investment Fund, International Value Portfolio
We have audited the accompanying statement of assets and liabilities, including the statement of investments, of Dreyfus Variable Investment Fund, International Value Portfolio (one of the series comprising Dreyfus Variable Investment Fund) as of December 31, 2011, and the related statement of operations for the year then ended, the statement of changes in net assets for each of the two years in the period then ended and financial highlights for each of the years indicated therein. These financial statements and financial highlights are the responsibility of the Fund’s management. Our responsibility is to express an opinion on these financial statements and financial highlights based on our audits.
We conducted our audits in accordance with the standards of the Public Company Accounting Oversight Board (United States).Those standards require that we plan and perform the audit to obtain reasonable assurance about whether the financial statements and financial highlights are free of material misstatement.We were not engaged to perform an audit of the Fund’s internal control over financial reporting. Our audits included consideration of internal control over financial reporting as a basis for designing audit procedures that are appropriate in the circumstances, but not for the purpose of expressing an opinion on the effectiveness of the Fund’s internal control over financial reporting. Accordingly, we express no such opinion. An audit also includes examining, on a test basis, evidence supporting the amounts and disclosures in the financial statements and financial highlights, assessing the accounting principles used and significant estimates made by management, and evaluating the overall financial statement presentation. Our procedures included confirmation of securities owned as of December 31, 2011 by correspondence with the custodian and others.We believe that our audits provide a reasonable basis for our opinion.
In our opinion, the financial statements and financial highlights referred to above present fairly, in all material respects, the financial position of Dreyfus Variable Investment Fund, International Value Portfolio at December 31, 2011, the results of its operations for the year then ended, the changes in its net assets for each of the two years in the period then ended, and the financial highlights for each of the indicated years, in conformity with U. S. generally accepted accounting principles.

New York, New York
February 10, 2012
32
IMPORTANT TAX INFORMATION (Unaudited)
In accordance with federal tax law, the fund elects to provide each shareholder with their portion of the fund’s foreign taxes paid and the income sourced from foreign countries. Accordingly, the fund hereby makes the following designations regarding its fiscal year ended December 31, 2011:
—the total amount of taxes paid to foreign countries was $308,015
—the total amount of income sourced from foreign countries was $3,556,225.
Where required by federal tax law rules, shareholders will receive notification of their proportionate share of foreign taxes paid and foreign sourced income for the 2011 calendar year with Form 1099-DIV which will be mailed in early 2012.
BOARD MEMBERS INFORMATION (Unaudited)
|
| Joseph S. DiMartino (68) |
| Chairman of the Board (1995) |
| Principal Occupation During Past 5Years: |
| • Corporate Director and Trustee |
| Other Public Company Board Memberships During Past 5Years: |
| • CBIZ (formerly, Century Business Services, Inc.), a provider of outsourcing functions for small |
| and medium size companies, Director (1997-present) |
| • Sunair Services Corporation, a provider of certain outdoor-related services to homes and |
| businesses, Director (2005-2009) |
| • The Newark Group, a provider of a national market of paper recovery facilities, paperboard |
| mills and paperboard converting plants, Director (2000-2010) |
| No. of Portfolios for which Board Member Serves: 164 |
| ——————— |
| Peggy C. Davis (68) |
| Board Member (2006) |
| Principal Occupation During Past 5Years: |
| • Shad Professor of Law, New York University School of Law |
| • Writer and teacher in the fields of evidence, constitutional theory, family law, social sciences |
| and the law, legal process and professional methodology and training |
| No. of Portfolios for which Board Member Serves: 53 |
| ——————— |
| David P. Feldman (72) |
| Board Member (1994) |
| Principal Occupation During Past 5Years: |
| • Corporate Director and Trustee |
| Other Public Company Board Memberships During Past 5Years: |
| • BBH Mutual Funds Group (4 registered mutual funds), Director (1992-present) |
| • QMed, Inc. a healthcare company, Director (1999-2007) |
| No. of Portfolios for which Board Member Serves: 49 |
34
|
| Ehud Houminer (71) |
| Board Member (2006) |
| Principal Occupation During Past 5Years: |
| • Executive-in-Residence at the Columbia Business School, Columbia University (1992-present) |
| Other Public Company Board Memberships During Past 5Years: |
| • Avnet Inc., an electronics distributor, Director (1993-present) |
| No. of Portfolios for which Board Member Serves: 63 |
| ——————— |
| Dr. Martin Peretz (72) |
| Board Member (1990) |
| Principal Occupation During Past 5Years: |
| • Editor-in-Chief Emeritus of The New Republic Magazine (2010-present) (previously, |
| Editor-in-Chief, 1974-2010) |
| • Director of TheStreet.com, a financial information service on the web (1996-present) |
| No. of Portfolios for which Board Member Serves: 35 |
| ——————— |
Once elected all Board Members serve for an indefinite term, but achieve Emeritus status upon reaching age 80.The address of the Board Members and Officers is in c/o The Dreyfus Corporation, 200 Park Avenue, NewYork, NewYork 10166.Additional information about the Board Members is available in the fund’s Statement of Additional Information which can be obtained from Dreyfus free of charge by calling this toll free number: 1-800-DREYFUS.
James F. Henry, Emeritus Board Member
Rosalind G. Jacobs, Emeritus Board Member
Dr. Paul A. Marks, Emeritus Board Member
Gloria Messinger, Emeritus Board Member
OFFICERS OF THE FUND (Unaudited)
BRADLEY J. SKAPYAK, President since January 2010.
Chief Operating Officer and a director of the Manager since June 2009. From April 2003 to June 2009, Mr. Skapyak was the head of the Investment Accounting and Support Department of the Manager. He is an officer of 75 investment companies (comprised of 163 portfolios) managed by the Manager. He is 53 years old and has been an employee of the Manager since February 1988.
JANETTE E. FARRAGHER, Vice President and Secretary since December 2011.
Assistant General Counsel of BNY Mellon, and an officer of 76 investment companies (comprised of 189 portfolios) managed by the Manager. She is 49 years old and has been an employee of the Manager since February 1984.
KIESHA ASTWOOD, Vice President and Assistant Secretary since January 2010.
Counsel of BNY Mellon, and an officer of 76 investment companies (comprised of 189 portfolios) managed by the Manager. She is 38 years old and has been an employee of the Manager since July 1995.
JAMES BITETTO, Vice President and Assistant Secretary since August 2005.
Senior Counsel of BNY Mellon and Secretary of the Manager, and an officer of 76 investment companies (comprised of 189 portfolios) managed by the Manager. He is 45 years old and has been an employee of the Manager since December 1996.
JONI LACKS CHARATAN, Vice President and Assistant Secretary since August 2005.
Senior Counsel of BNY Mellon, and an officer of 76 investment companies (comprised of 189 portfolios) managed by the Manager. She is 56 years old and has been an employee of the Manager since October 1988.
JOSEPH M. CHIOFFI, Vice President and Assistant Secretary since August 2005.
Senior Counsel of BNY Mellon, and an officer of 76 investment companies (comprised of 189 portfolios) managed by the Manager. He is 50 years old and has been an employee of the Manager since June 2000.
KATHLEEN DENICHOLAS, Vice President and Assistant Secretary since January 2010.
Managing Counsel of BNY Mellon, and an officer of 76 investment companies (comprised of 189 portfolios) managed by the Manager. She is 37 years old and has been an employee of the Manager since February 2001.
JOHN B. HAMMALIAN, Vice President and Assistant Secretary since August 2005.
Senior Managing Counsel of BNY Mellon, and an officer of 76 investment companies (comprised of 189 portfolios) managed by the Manager. He is 48 years old and has been an employee of the Manager since February 1991.
M. CRISTINA MEISER, Vice President and Assistant Secretary since January 2010.
Senior Counsel of BNY Mellon, and an officer of 76 investment companies (comprised of 189 portfolios) managed by the Manager. She is 41 years old and has been an employee of the Manager since August 2001.
ROBERT R. MULLERY, Vice President and Assistant Secretary since August 2005.
Managing Counsel of BNY Mellon, and an officer of 76 investment companies (comprised of 189 portfolios) managed by the Manager. He is 59 years old and has been an employee of the Manager since May 1986.
36
JEFF PRUSNOFSKY, Vice President and Assistant Secretary since August 2005.
Senior Managing Counsel of BNY Mellon, and an officer of 76 investment companies (comprised of 189 portfolios) managed by the Manager. He is 46 years old and has been an employee of the Manager since October 1990.
JAMES WINDELS, Treasurer since November 2001.
Director – Mutual Fund Accounting of the Manager, and an officer of 76 investment companies (comprised of 189 portfolios) managed by the Manager. He is 53 years old and has been an employee of the Manager since April 1985.
RICHARD CASSARO, Assistant Treasurer since January 2008.
Senior Accounting Manager – Money Market and Municipal Bond Funds of the Manager, and an officer of 76 investment companies (comprised of 189 portfolios) managed by the Manager. He is 52 years old and has been an employee of the Manager since September 1982.
GAVIN C. REILLY, Assistant Treasurer since December 2005.
Tax Manager of the Investment Accounting and Support Department of the Manager, and an officer of 76 investment companies (comprised of 189 portfolios) managed by the Manager. He is 43 years old and has been an employee of the Manager since April 1991.
ROBERT S. ROBOL, Assistant Treasurer since August 2003.
Senior Accounting Manager – Fixed Income Funds of the Manager, and an officer of 76 investment companies (comprised of 189 portfolios) managed by the Manager. He is 47 years old and has been an employee of the Manager since October 1988.
ROBERT SALVIOLO, Assistant Treasurer since July 2007.
Senior Accounting Manager – Equity Funds of the Manager, and an officer of 76 investment companies (comprised of 189 portfolios) managed by the Manager. He is 44 years old and has been an employee of the Manager since June 1989.
ROBERT SVAGNA, Assistant Treasurer since December 2002.
Senior Accounting Manager – Equity Funds of the Manager, and an officer of 76 investment companies (comprised of 189 portfolios) managed by the Manager. He is 44 years old and has been an employee of the Manager since November 1990.
JOSEPH W. CONNOLLY, Chief Compliance Officer since October 2004.
Chief Compliance Officer of the Manager and The Dreyfus Family of Funds (76 investment companies, comprised of 189 portfolios). From November 2001 through March 2004, Mr. Connolly was first Vice-President, Mutual Fund Servicing for Mellon Global Securities Services. In that capacity, Mr. Connolly was responsible for managing Mellon’s Custody, Fund Accounting and Fund Administration services to third-party mutual fund clients. He is 54 years old and has served in various capacities with the Manager since 1980, including manager of the firm’s Fund Accounting Department from 1997 through October 2001.
STEPHEN J. STOREN, Anti-Money Laundering Compliance Officer since May 2011.
Chief Compliance Officer of the Distributor, and the Anti-Money Laundering Compliance Officer of 72 investment companies (comprised of 185 portfolios) managed by the Manager. He is 57 years old and has been an employee of the Distributor since October 1999.
For More Information
The fund files its complete schedule of portfolio holdings with the Securities and Exchange Commission (“SEC”) for the first and third quarters of each fiscal year on Form N-Q. The fund’s Forms N-Q are available on the SEC’s website at http://www.sec.gov and may be reviewed and copied at the SEC’s Public Reference Room in Washington, DC. Information on the operation of the Public Reference Room may be obtained by calling 1-800-SEC-0330.
A description of the policies and procedures that the fund uses to determine how to vote proxies relating to portfolio securities, and information regarding how the fund voted these proxies for the most recent 12-month period ended June 30 is available at http://www.dreyfus.com and on the SEC’s website at http://www.sec.gov. The description of the policies and procedures is also available without charge, upon request, by calling 1-800-DREYFUS.

|
| Dreyfus Variable |
| Investment Fund, |
| Money Market |
| Portfolio |

The views expressed in this report reflect those of the portfolio manager only through the end of the period covered and do not necessarily represent the views of Dreyfus or any other person in the Dreyfus organization. Any such views are subject to change at any time based upon market or other conditions and Dreyfus disclaims any responsibility to update such views.These views may not be relied on as investment advice and, because investment decisions for a Dreyfus fund are based on numerous factors, may not be relied on as an indication of trading intent on behalf of any Dreyfus fund.
|
| Not FDIC-Insured • Not Bank-Guaranteed • May Lose Value |
| | Contents |
| | THE FUND |
| 2 | A Letter from the Chairman and CEO |
| 3 | Discussion of Fund Performance |
| 6 | Understanding Your Fund’s Expenses |
| 6 | Comparing Your Fund’s Expenses With Those of Other Funds |
| 7 | Statement of Investments |
| 10 | Statement of Assets and Liabilities |
| 11 | Statement of Operations |
| 12 | Statement of Changes in Net Assets |
| 13 | Financial Highlights |
| 14 | Notes to Financial Statements |
| 21 | Report of Independent Registered Public Accounting Firm |
| 22 | Board Members Information |
| 24 | Officers of the Fund |
| | FOR MORE INFORMATION |
| | Back Cover |
Dreyfus Variable Investment Fund,
Money Market Portfolio
The Fund

A LETTER FROM THE CHAIRMAN AND CEO
Dear Shareholder:
We present to you this annual report for Dreyfus Variable Investment Fund, Money Market Portfolio, covering the 12-month period from January 1, 2011, through December 31, 2011. For information about how the fund performed during the reporting period, as well as general market perspectives, we provide a Discussion of Fund Performance on the pages that follow.
U.S. financial markets were significantly impacted by a “flight to quality” sentiment in which investors fled riskier assets due to adverse macroeconomic developments ranging from an unprecedented downgrade of long-term U.S. debt securities to the resurgence of a sovereign debt crisis in Europe. Ironically, despite the rating downgrade, long-term U.S. Treasury securities ended the reporting period with double-digit total returns. Meanwhile, the day-to-day movements of the stock market were often tumultuous, even as U.S. corporations achieved record-setting profits and market valuations dropped below historical norms.
Our economic forecast calls for a mild acceleration of the U.S. recovery as the domestic banking system regains strength, credit conditions loosen and housing markets begin a long-awaited convalescence. Under other circumstances a stronger recovery might be expected to lift short-term interest rates, but the Federal Reserve Board has indicated that it is likely to keep rates low for some time to come in the absence of meaningful inflation. Of course, we encourage you to talk with your financial adviser to help ensure that your investment objectives are properly aligned with your risk tolerance in pursuing potential market opportunities in 2012.
Thank you for your continued confidence and support.

2

DISCUSSION OF FUND PERFORMANCE
For the period of January 1, 2011, through December 31, 2011, as provided by Bernard W. Kiernan, Jr., Senior Portfolio Manager
Fund and Market Performance Overview
For the 12-month period ended December 31, 2011, DreyfusVariable Investment Fund, Money Market Portfolio produced a yield of 0.01%. Taking into account the effects of compounding, the fund provided an effective yield of 0.01% for the same period.1
Yields of money market instruments remained near historically low levels throughout 2011 as the Federal Reserve Board (the “Fed”) left short-term interest rates within a historically low range between 0.00% and 0.25%.
The Fund’s Investment Approach
The fund seeks as high a level of current income as is consistent with the preservation of capital and the maintenance of liquidity. To pursue this goal, the fund invests in a diversified portfolio of high-quality, dollar-denominated short-term debt securities, including securities issued or guaranteed by the U.S. government or its agencies or instrumentalities, certificates of deposit, time deposits, bankers’ acceptances and other short-term securities issued by domestic or foreign banks, repurchase agreements, including tri-party repurchase agreements, asset-backed securities, domestic and foreign commercial paper and other short-term corporate and bank obligations and dollar-denominated foreign bank obligations. Normally, the fund invests at least 25% of its net assets in domestic or dollar-denominated foreign bank obligations.
Global Economic Developments Roiled Equity Markets
Although a U.S. economic recovery seemed to gain momentum at the start of 2011, economic headwinds intensified in February, when energy prices surged higher amid unrest in the Middle East, and in March, when natural and nuclear disasters in Japan disrupted the global industrial supply chain. These factors helped produce an annualized U.S. GDP growth rate of just 0.4% for the first quarter of the year.
In late April, a European sovereign debt crisis worsened as Greece teetered on the brink of default and financial instability spread to other
DISCUSSION OF FUND PERFORMANCE (continued)
nations in the region. Meanwhile, a contentious political debate about government spending and borrowing dominated headlines in the United States. Industrial production picked up in May, but the unemployment rate climbed to 9.1%, and the U.S. housing market posted declines in existing home sales and housing starts.
The Fed ended its second quantitative easing program in June with relatively little impact on the financial markets. Meanwhile, energy prices moderated and manufacturing activity increased.These positive developments were largely offset by declining consumer confidence, weak housing markets and sluggish job creation.The unemployment rate crept higher to 9.2% in June, and it later was announced that U.S. gross domestic product grew at a sluggish 1.3% annualized rate during the second quarter of 2011.
July saw heightened turmoil in the financial markets when Greece moved closer to insolvency and an unprecedented default on U.S. government debt loomed. Some of these worries came to a head in early August, when Standard & Poor’s downgraded its credit rating on long-term U.S. debt securities.The rating on short-term government debt, including securities purchased by many money market funds, was unchanged.
September brought more market turbulence when investors feared that the U.S. economy was headed for recession. However, the data seemed to tell a different story, as the unemployment rate moderated to 9.0%, existing-home sales moved higher and U.S. households reduced their debt-service burdens to a level not seen since 1994. It later was announced that U.S. GDP grew at an annualized 1.8% rate during the third quarter.
Economic sentiment changed dramatically in October, when the U.S. economy continued to show resilience and European officials moved closer to agreement on measures to address the debt crisis. The U.S. industrial and manufacturing sectors continued to improve, and housing starts surged to their highest level in nearly 18 months.These developments sparked strong rebounds among investments that had been severely punished during the summer downturn. November brought more positive economic news, most notably a steep decline in the unemployment rate from 9.0% to 8.6%. In addition, early data from retailers during the holiday season suggested that consumers were
4
spending more freely, while orders and production in the manufacturing sector accelerated. December witnessed more economic improvement, including an unemployment rate that inched lower to 8.5%, the measure’s lowest reading in nearly three years, and consumer confidence climbed to an eight-month high.
Rates Likely to Stay Low
Yields of money market instruments remained near zero percent throughout the reporting period, and yield differences along the market’s maturity spectrum remained relatively narrow, so it made little sense to incur the additional risks that longer-dated securities typically entail. Therefore, we maintained the fund’s weighted average maturity in a range that was roughly in line with industry averages.
Despite recently encouraging signs of economic improvement, the outlook remains cloudy, and the Fed has reiterated its intention to keep short-term interest rates near historical lows “at least until late 2014.” Therefore, we intend to maintain the fund’s focus on quality and liquidity.
January 17, 2012
| |
| | An investment in the fund is not insured or guaranteed by the FDIC or any other government |
| | agency.Although the fund seeks to preserve the value of your investment at $1.00 per share, it is |
| | possible to lose money by investing in the fund. |
| | Short-term corporate and asset-backed securities holdings, while rated in the highest rating category |
| | by one or more NRSRO (or unrated, if deemed of comparable quality by Dreyfus), involve credit |
| | and liquidity risks and risk of principal loss. |
| | The fund is only available as a funding vehicle under variable life insurance policies or variable |
| | annuity contracts issued by insurance companies. Individuals may not purchase shares of the fund |
| | directly.A variable annuity is an insurance contract issued by an insurance company that enables |
| | investors to accumulate assets on a tax-deferred basis for retirement or other long-term goals.The |
| | investment objective and policies of Dreyfus Variable Investment Fund, Money Market Portfolio |
| | made available through insurance products may be similar to other funds managed or advised by |
| | Dreyfus. However, the investment results of the fund may be higher or lower than, and may not be |
| | comparable to, those of any other Dreyfus fund. |
| 1 | Effective yield is based upon dividends declared daily and reinvested monthly. Past performance is |
| | no guarantee of future results.Yields fluctuate.The fund’s performance does not reflect the |
| | deduction of additional charges and expenses imposed in connection with investing in variable |
| | insurance contracts, which will reduce returns.Yields provided for the fund reflect the absorption of |
| | certain fund expenses by The Dreyfus Corporation pursuant to an undertaking in effect that may |
| | be extended, terminated or modified at any time. Had these expenses not been absorbed, fund |
| | yields would have been lower, and in some cases, 7-day yields during the reporting period would |
| | have been negative absent the expense absorption. |
UNDERSTANDING YOUR FUND’S EXPENSES (Unaudited)
As a mutual fund investor, you pay ongoing expenses, such as management fees and other expenses. Using the information below, you can estimate how these expenses affect your investment and compare them with the expenses of other funds.You also may pay one-time transaction expenses, including sales charges (loads), redemption fees and expenses associated with variable annuity or insurance contracts, which are not shown in this section and would have resulted in higher total expenses. For more information, see your fund’s prospectus or talk to your financial adviser.
Review your fund’s expenses
The table below shows the expenses you would have paid on a $1,000 investment in Dreyfus Variable Investment Fund, Money Market Portfolio from July 1, 2011 to December 31, 2011. It also shows how much a $1,000 investment would be worth at the close of the period, assuming actual returns and expenses.
Expenses and Value of a $1,000 Investment
assuming actual returns for the six months ended December 31, 2011
| |
| Expenses paid per $1,000† | $.60 |
| Ending value (after expenses) | $1,000.00 |
COMPARING YOUR FUND’S EXPENSES
WITH THOSE OF OTHER FUNDS (Unaudited)
Using the SEC’s method to compare expenses
The Securities and Exchange Commission (SEC) has established guidelines to help investors assess fund expenses. Per these guidelines, the table below shows your fund’s expenses based on a $1,000 investment, assuming a hypothetical 5% annualized return. You can use this information to compare the ongoing expenses (but not transaction expenses or total cost) of investing in the fund with those of other funds.All mutual fund shareholder reports will provide this information to help you make this comparison. Please note that you cannot use this information to estimate your actual ending account balance and expenses paid during the period.
Expenses and Value of a $1,000 Investment
assuming a hypothetical 5% annualized return for the six months ended December 31, 2011
| |
| Expenses paid per $1,000† | $.61 |
| Ending value (after expenses) | $1,024.60 |
|
| † Expenses are equal to the fund’s annualized expense ratio of .12%, multiplied by the average account value over the |
| period, multiplied by 184/365 (to reflect the one-half year period). |
6
|
| STATEMENT OF INVESTMENTS |
| December 31, 2011 |
| | | | |
| | | Principal | | |
| | Negotiable Bank Certificates of Deposit—9.0% | Amount ($) | | Value ($) |
| | Bank of America N.A. | | | |
| | 0.55%, 3/9/12 | 10,000,000 | | 10,000,000 |
| | State Street Bank and Trust Co. (Yankee) | | | |
| | 0.10%, 1/3/12 | 10,000,000 | | 10,000,000 |
| | Total Negotiable Bank Certificates of Deposit | | | |
| | (cost $20,000,000) | | | 20,000,000 |
| |
| | Commercial Paper—18.1% | | | |
| | JPMorgan Chase & Co. | | | |
| | 0.00%, 1/3/12 | 10,000,000 | | 10,000,000 |
| | Mizuho Funding LLC | | | |
| | 0.36%, 1/12/12 | 10,000,000 | a | 9,998,900 |
| | Svenska Handelsbanken Inc. | | | |
| | 0.38%, 1/20/12 | 10,000,000 | | 9,997,994 |
| | UBS Finance Delaware Inc. | | | |
| | 0.44%, 1/13/12 | 10,000,000 | | 9,998,533 |
| | Total Commercial Paper | | | |
| | (cost $39,995,427) | | | 39,995,427 |
| |
| Asset-Backed Commercial Paper—11.8% | | | |
| | CIESCO LLC | | | |
| | 0.37%, 2/21/12 | 8,000,000 | a | 7,995,807 |
| | FCAR Owner Trust, Ser. II | | | |
| | 0.29%, 3/8/12 | 10,000,000 | | 9,994,603 |
| | Govco | | | |
| | 0.35%, 2/14/12 | 8,000,000 | a | 7,996,578 |
| | Total Asset-Backed Commercial Paper | | | |
| | (cost $25,986,988) | | | 25,986,988 |
| |
| | U.S. Government Agency—6.8% | | | |
| | Federal Home Loan Mortgage Corp. | | | |
| | 0.01%, 3/5/12 | | | |
| | (cost $14,999,733) | 15,000,000 | b | 14,999,733 |
STATEMENT OF INVESTMENTS (continued)
| | | |
| | | Principal | |
| | U.S. Treasury Bills—9.0% | Amount ($) | Value ($) |
| | 0.00%, 1/26/12 | | |
| | (cost $20,000,000) | 20,000,000 | 20,000,000 |
| |
| |
| | U.S. Treasury Notes—13.6% | | |
| | 0.01%—0.03%, 2/15/12—7/16/12 | | |
| | (cost $30,108,461) | 30,000,000 | 30,108,461 |
| |
| |
| | Repurchase Agreements—31.6% | | |
| | Barclays Capital, Inc. | | |
| | 0.02%, dated 12/30/11, due 1/3/12 in the | | |
| | amount of $1,000,002 (fully collateralized by | | |
| $973,700 U.S. Treasury Notes, 2.25%, | | |
| | due 5/31/14, value $1,020,072) | 1,000,000 | 1,000,000 |
| | HSBC USA Inc. | | |
| | 0.02%, dated 12/30/11, due 1/3/12 in the | | |
| | amount of $30,000,067 (fully collateralized by | | |
| $30,335,000 U.S. Treasury Notes, 0.75%, | | |
| | due 3/31/13, value $30,602,397) | 30,000,000 | 30,000,000 |
| | RBC Capital Markets | | |
| | 0.165%, dated 12/30/11, due 1/3/12 in the | | |
| | amount of $9,000,165 (fully collateralized by | | |
| $26,299,028 Corporate Bonds, 0%-7.50%, | | |
| | due 6/19/35-5/25/47, value $9,270,000 and | | |
| | $1,000 Federal National Mortgage Association, | | |
| | 4%, due 11/1/41, value $1,046) | 9,000,000 | 9,000,000 |
| | RBS Securities, Inc. | | |
| | 0.04%, dated 12/30/11, due 1/3/12 in the | | |
| | amount of $20,000,089 (fully collateralized by | | |
| $19,805,000 U.S. Treasury Notes, 1.38%, | | |
| | due 11/30/15, value $20,402,854) | 20,000,000 | 20,000,000 |
8
| | | |
| | Principal | |
| Repurchase Agreements (continued) | Amount ($) | Value ($) |
| UBS Securities LLC | | |
| 0.02%, dated 12/30/11, due 1/3/12 in the | | |
| amount of $10,000,022 (fully collateralized by | | |
| $8,700,100 U.S. Treasury Notes, 3.63%, | | |
| due 2/15/21, value $10,200,043) | 10,000,000 | 10,000,000 |
| Total Repurchase Agreements | | |
| (cost $70,000,000) | | 70,000,000 |
| |
| Total Investments (cost $221,090,609) | 99.9% | 221,090,609 |
| Cash and Receivables (Net) | .1% | 271,640 |
| Net Assets | 100.0% | 221,362,249 |
|
| a Securities exempt from registration under Rule 144A of the Securities Act of 1933.These securities may be resold in |
| transactions exempt from registration, normally to qualified institutional buyers.At December 31, 2011, these |
| securities amounted to $25,991,285 or 11.7% of net assets. |
| b The Federal Housing Finance Agency (“FHFA”) placed Federal Home Loan Mortgage Corporation and Federal |
| National Mortgage Association into conservatorship with FHFA as the conservator.As such, the FHFA oversees the |
| continuing affairs of these companies. |
| | | |
| Portfolio Summary (Unaudited)† | | |
| |
| | Value (%) | | Value (%) |
| Repurchase Agreements | 31.6 | Asset-Backed/Banking | 3.6 |
| U.S. Government/Agency | 29.4 | Asset-Backed/Multi-Seller Programs | 3.6 |
| Banking | 27.1 | | |
| Asset-Backed/Single Seller | 4.6 | | 99.9 |
| |
| † Based on net assets. | | | |
| See notes to financial statements. | | | |
|
| STATEMENT OF ASSETS AND LIABILITIES |
| December 31, 2011 |
| | |
| | Cost | Value |
| Assets ($): | | |
| Investments in securities—See Statement of Investments (including | |
| Repurchase Agreements of $70,000,000)—Note 1(b) | 221,090,609 | 221,090,609 |
| Cash | | 279,360 |
| Interest receivable | | 177,403 |
| Prepaid expenses | | 5,775 |
| | | 221,553,147 |
| Liabilities ($): | | |
| Due to The Dreyfus Corporation and affiliates—Note 2(a) | | 38,427 |
| Payable for shares of Beneficial Interest redeemed | | 136,691 |
| Accrued expenses | | 15,780 |
| | | 190,898 |
| Net Assets ($) | | 221,362,249 |
| Composition of Net Assets ($): | | |
| Paid-in capital | | 221,362,245 |
| Accumulated net realized gain (loss) on investments | | 4 |
| Net Assets ($) | | 221,362,249 |
| Shares Outstanding | | |
| (unlimited number of $.001 par value shares of Beneficial interest authorized) | 221,362,177 |
| Net Asset Value, offering and redemption price per share ($) | | 1.00 |
| |
| See notes to financial statements. | | |
10
|
| STATEMENT OF OPERATIONS |
| Year Ended December 31, 2011 |
| | |
| Investment Income ($): | |
| Interest Income | 377,850 |
| Expenses: | |
| Investment advisory fee—Note 2(a) | 1,118,690 |
| Prospectus and shareholders’ reports | 94,564 |
| Professional fees | 58,487 |
| Custodian fees—Note 2(a) | 37,621 |
| Trustees’ fees and expenses—Note 2(b) | 13,334 |
| Shareholder servicing costs—Note 2(a) | 3,254 |
| Miscellaneous | 16,683 |
| Total Expenses | 1,342,633 |
| Less—reduction in expenses due to undertaking—Note 2(a) | (964,273) |
| Less—reduction in fees due to earnings credits—Note 2(a) | (595) |
| Net Expenses | 377,765 |
| Investment Income—Net | 85 |
| Net Realized Gain (Loss) on Investments—Note 1(b) ($) | 4 |
| Net Increase in Net Assets Resulting from Operations | 89 |
| |
| See notes to financial statements. | |
STATEMENT OF CHANGES IN NET ASSETS
| | | | |
| | Year Ended December 31, |
| | 2011 | 2010 |
| Operations ($): | | |
| Investment income—net | 85 | 107 |
| Net realized gain (loss) on investments | 4 | 11,800 |
| Net Increase (Decrease) in Net Assets | | |
| Resulting from Operations | 89 | 11,907 |
| Dividends to Shareholders from ($): | | |
| Investment income—net | (11,885) | (27,690) |
| Beneficial Interest Transactions ($1.00 per share): | | |
| Net proceeds from shares sold | 274,899,540 | 153,765,306 |
| Dividends reinvested | 11,885 | 27,690 |
| Cost of shares redeemed | (264,631,141) | (299,829,373) |
| Increase (Decrease) in Net Assets from | | |
| Beneficial Interest Transactions | 10,280,284 | (146,036,377) |
| Total Increase (Decrease) in Net Assets | 10,268,488 | (146,052,160) |
| Net Assets ($): | | |
| Beginning of Period | 211,093,761 | 357,145,921 |
| End of Period | 221,362,249 | 211,093,761 |
| |
| See notes to financial statements. | | |
12
FINANCIAL HIGHLIGHTS
The following table describes the performance for the fiscal periods indicated.Total return shows how much your investment in the fund would have increased (or decreased) during each period, assuming you had reinvested all dividends and dis-tributions.The fund’s total returns do not reflect expenses associated with variable annuity or insurance contracts. These figures have been derived from the fund’s financial statements.
| | | | | | | | | | |
| | | Year Ended December 31, | |
| | 2011 | 2010 | 2009 | 2008 | 2007 |
| Per Share Data ($): | | | | | |
| Net asset value, beginning of period | 1.00 | 1.00 | 1.00 | 1.00 | 1.00 |
| Investment Operations: | | | | | |
| Investment income—net | .000a | .000a | .001 | .025 | .048 |
| Distributions: | | | | | |
| Dividends from investment income—net | (.000)a | (.000)a | (.001) | (.025) | (.048) |
| Net asset value, end of period | 1.00 | 1.00 | 1.00 | 1.00 | 1.00 |
| Total Return (%) | .01 | .01 | .13 | 2.54 | 4.86 |
| Ratios/Supplemental Data (%): | | | | | |
| Ratio of total expenses | | | | | |
| to average net assets | .60 | .58 | .59 | .57 | .55 |
| Ratio of net expenses | | | | | |
| to average net assets | .17 | .29 | .44 | .57 | .55 |
| Ratio of net investment income | | | | | |
| to average net assets | .00b | .00b | .11 | 2.53 | 4.75 |
| Net Assets, end of period ($ x 1,000) | 221,362 | 211,094 | 357,146 | 290,933 | 300,803 |
| |
| a | Amount represents less than $.001 per share. |
| b | Amount represents less than .01%. |
See notes to financial statements.
NOTES TO FINANCIAL STATEMENTS
NOTE 1—Significant Accounting Policies:
Dreyfus Variable Investment Fund (the “Company”), is registered under the Investment Company Act of 1940, as amended (the “Act���), as an open-end management investment company, operating as a series company currently offering seven series, including the Money Market Portfolio (the “fund”). The fund is only offered to separate accounts established by insurance companies to fund variable annuity contracts and variable life insurance policies.The fund is a diversified series.The fund’s investment objective is to seek as high a level of current income as is consistent with the preservation of capital and the maintenance of liquidity. The Dreyfus Corporation (the “Manager” or “Dreyfus”), a wholly-owned subsidiary of The Bank of New York Mellon Corporation (“BNY Mellon”), serves as the fund’s investment adviser. MBSC Securities Corporation (the “Distributor”), a wholly-owned subsidiary of the Manager, is the distributor of the fund’s shares, which are sold without a sales charge.
It is the fund’s policy to maintain a continuous net asset value per share of $1.00; the fund has adopted certain investment, portfolio valuation and dividend and distribution policies to enable it to do so.There is no assurance, however, that the fund will be able to maintain a stable net asset value per share of $1.00.
The Company accounts separately for the assets, liabilities and operations of each series. Expenses directly attributable to each series are charged to that series’ operations; expenses which are applicable to all series are allocated among them on a pro rata basis.
The Financial Accounting Standards Board (“FASB”) Accounting Standards Codification (“ASC”) is the exclusive reference of authoritative U.S. generally accepted accounting principles (“GAAP”) recognized by the FASB to be applied by nongovernmental entities. Rules and interpretive releases of the Securities and Exchange Commission (“SEC”) under authority of federal laws are also sources of authoritative GAAP for SEC registrants. The fund’s financial statements are prepared in accordance with GAAP, which may require the use of management estimates and assumptions.Actual results could differ from those estimates.
14
The Company enters into contracts that contain a variety of indemnifications.The fund’s maximum exposure under these arrangements is unknown.The fund does not anticipate recognizing any loss related to these arrangements.
(a) Portfolio valuation: Investments in securities are valued at amortized cost in accordance with Rule 2a-7 of the Act, which has been determined by the Board of Trustees to represent the fair value of the fund’s investments.
The fair value of a financial instrument is the amount that would be received to sell an asset or paid to transfer a liability in an orderly transaction between market participants at the measurement date (i.e. the exit price). GAAP establishes a fair value hierarchy that prioritizes the inputs of valuation techniques used to measure fair value.This hierarchy gives the highest priority to unadjusted quoted prices in active markets for identical assets or liabilities (Level 1 measurements) and the lowest priority to unobservable inputs (Level 3 measurements).
Additionally, GAAP provides guidance on determining whether the volume and activity in a market has decreased significantly and whether such a decrease in activity results in transactions that are not orderly. GAAP requires enhanced disclosures around valuation inputs and techniques used during annual and interim periods.
Various inputs are used in determining the value of the fund’s investments relating to fair value measurements.These inputs are summarized in the three broad levels listed below:
Level 1—unadjusted quoted prices in active markets for identical investments.
Level 2—other significant observable inputs (including quoted prices for similar investments, interest rates, prepayment speeds, credit risk, etc.).
Level 3—significant unobservable inputs (including the fund’s own assumptions in determining the fair value of investments).
NOTES TO FINANCIAL STATEMENTS (continued)
The inputs or methodology used for valuing securities are not necessarily an indication of the risk associated with investing in those securities. For example, money market securities are valued using amortized cost, in accordance with rules under the Act. Generally, amortized cost approximates the current fair value of a security, but since the value is not obtained from a quoted price in an active market, such securities are reflected within Level 2 of the fair value hierarchy.
The following is a summary of the inputs used as of December 31, 2011 in valuing the fund’s investments:
| |
| | Short-Term |
| Valuation Inputs | Investments ($)† |
| Level 1—Unadjusted Quoted Prices | — |
| Level 2—Other Significant Observable Inputs | 221,090,609 |
| Level 3—Significant Unobservable Inputs | — |
| Total | 221,090,609 |
| † See Statement of Investments for additional detailed categorizations. | |
In May 2011, FASB issued Accounting Standards Update (“ASU”) No. 2011-04 “Amendments to Achieve Common FairValue Measurement and Disclosure Requirements in GAAP and International Financial Reporting Standards (“IFRS”)” (“ASU 2011-04”). ASU 2011-04 includes common requirements for measurement of and disclosure about fair value between GAAP and IFRS. ASU 2011-04 will require reporting entities to disclose the following information for fair value measurements categorized within Level 3 of the fair value hierarchy: quantitative information about the unobservable inputs used in the fair value measurement, the valuation processes used by the reporting entity and a narrative description of the sensitivity of the fair value measurement to changes in unobservable inputs and the interrelationships between those unobservable inputs. In addition, ASU 2011-04 will require reporting entities to make disclosures about amounts and reasons for all transfers in and out of Level 1 and Level 2 fair value measurements.The new and revised disclosures are effective for interim
16
and annual reporting periods beginning after December 15, 2011. At this time, management is evaluating the implications of ASU 2011-04 and its impact on the financial statements.
(b) Securities transactions and investment income: Securities transactions are recorded on a trade date basis. Interest income, adjusted for accretion of discount and amortization of premium on investments, is earned from settlement date and recognized on the accrual basis. Realized gains and losses from securities transactions are recorded on the identified cost basis. Cost of investments represents amortized cost.
The fund may enter into repurchase agreements with financial institutions, deemed to be creditworthy by the Manager, subject to the seller’s agreement to repurchase and the fund’s agreement to resell such securities at a mutually agreed upon price. Securities purchased subject to repurchase agreements are deposited with the fund’s custodian and, pursuant to the terms of the repurchase agreement, must have an aggregate market value greater than or equal to the terms of the repurchase price plus accrued interest at all times. If the value of the underlying securities falls below the value of the repurchase price plus accrued interest, the fund will require the seller to deposit additional collateral by the next business day. If the request for additional collateral is not met, or the seller defaults on its repurchase obligation, the fund maintains its right to sell the underlying securities at market value and may claim any resulting loss against the seller.
(c) Dividends to shareholders: It is the policy of the fund to declare dividends daily from investment income-net. Such dividends are paid monthly. Dividends from net realized capital gains, if any, are normally declared and paid annually, but the fund may make distributions on a more frequent basis to comply with the distribution requirements of the Internal Revenue Code of 1986 as amended (the “Code”).To the extent that net realized capital gains can be offset by capital loss carryovers, it is the policy of the fund not to distribute such gains.
NOTES TO FINANCIAL STATEMENTS (continued)
(d) Federal income taxes: It is the policy of the fund to continue to qualify as a regulated investment company, if such qualification is in the best interests of its shareholders, by complying with the applicable provisions of the Code, and to make distributions of taxable income sufficient to relieve it from substantially all federal income and excise taxes.
As of and during the period ended December 31, 2011, the fund did not have any liabilities for any uncertain tax positions.The fund recognizes interest and penalties, if any, related to uncertain tax positions as income tax expense in the Statement of Operations. During the period, the fund did not incur any interest or penalties.
Each of the tax years in the four-year period ended December 31, 2011 remains subject to examination by the Internal Revenue Service and state taxing authorities.
At December 31, 2011, the components of accumulated earnings on a tax basis were substantially the same as for financial reporting purposes.
The tax character of distributions paid to shareholders during the fiscal periods ended December 31, 2011 and December 31, 2010, were all ordinary income.
During the period ended December 31, 2011, as a result of permanent book to tax differences, primarily due to the tax treatment for dividend reclassification, the fund increased accumulated undistributed investment income-net by $11,800 and decreased accumulated net realized gain (loss) on investments by the same amount. Net assets and net asset value per share were not affected by this reclassification.
At December 31, 2011, the cost of investments for federal income tax purposes was substantially the same as the cost for financial reporting purposes (See the Statement of Investments).
18
NOTE 2—Investment Advisory Fee and Other Transactions With Affiliates:
(a) Pursuant to an investment advisory agreement with the Manager, the investment advisory fee is computed at the annual rate of .50% of the value of the fund’s average daily net assets and is payable monthly.
The Manager has undertaken to waive receipt of the management fee and/or reimburse operating expenses in order to facilitate a daily yield at or above a certain level which may change from time to time.This undertaking is voluntary and not contractual, and may be terminated at any time. The reduction in expenses, pursuant to the undertaking, amounted to $964,273, during the period ended December 31, 2011.
The fund compensates Dreyfus Transfer, Inc., a wholly-owned subsidiary of the Manager, under a transfer agency agreement for providing personnel and facilities to perform transfer agency services for the fund. During the period ended December 31, 2011, the fund was charged $380 pursuant to the transfer agency agreement, which is included in Shareholder servicing costs in the Statement of Operations.
The fund has arrangements with the custodian and cash management bank whereby the fund may receive earnings credits when positive cash balances are maintained, which are used to offset custody and cash management fees. For financial reporting purposes, the fund includes net earnings credits as an expense offset in the Statement of Operations.
The fund compensates The Bank of NewYork Mellon, a subsidiary of BNY Mellon and an affiliate of Dreyfus, under a cash management agreement for performing cash management services related to fund subscriptions and redemptions. During the period ended December 31, 2011, the fund was charged $38 pursuant to the cash management
NOTES TO FINANCIAL STATEMENTS (continued)
agreement, which is included in Shareholder servicing costs in the Statement of Operations.These fees were partially offset by earnings credits of $1.
The fund also compensates The Bank of New York Mellon under a custody agreement for providing custodial services for the fund. During the period ended December 31, 2011, the fund was charged $37,621 pursuant to the custody agreement.These fees were partially offset by earnings credits of $594.
During the period ended December 31, 2011, the fund was charged $6,402 for services performed by the Chief Compliance Officer.
The components of “Due toThe Dreyfus Corporation and affiliates” in the Statement of Assets and Liabilities consist of: investment advisory fees $99,936, custodian fees $13,228, chief compliance officer fees $5,295 and transfer agency per account fees $60, which are offset against an expense reimbursement currently in effect in the amount of $80,092.
(b) Each Board member also serves as a Board member of other funds within the Dreyfus complex. Annual retainer fees and attendance fees are allocated to each fund based on net assets.
20
|
| REPORT OF INDEPENDENT REGISTERED |
| PUBLIC ACCOUNTING FIRM |
Shareholders and Board of Trustees
Dreyfus Variable Investment Fund, Money Market Portfolio
We have audited the accompanying statement of assets and liabilities, including the statement of investments, of Dreyfus Variable Investment Fund, Money Market Portfolio (one of the series comprising Dreyfus Variable Investment Fund) as of December 31, 2011, and the related statement of operations for the year then ended, the statement of changes in net assets for each of the two years in the period then ended, and financial highlights for each of the years indicated therein. These financial statements and financial highlights are the responsibility of the Fund’s management. Our responsibility is to express an opinion on these financial statements and financial highlights based on our audits.
We conducted our audits in accordance with the standards of the Public Company Accounting Oversight Board (United States).Those standards require that we plan and perform the audit to obtain reasonable assurance about whether the financial statements and financial highlights are free of material misstatement.We were not engaged to perform an audit of the Fund’s internal control over financial reporting. Our audits included consideration of internal control over financial reporting as a basis for designing audit procedures that are appropriate in the circumstances, but not for the purpose of expressing an opinion on the effectiveness of the Fund’s internal control over financial reporting. Accordingly, we express no such opinion.An audit also includes examining, on a test basis, evidence supporting the amounts and disclosures in the financial statements and financial highlights, assessing the accounting principles used and significant estimates made by management, and evaluating the overall financial statement presentation. Our procedures included confirmation of securities owned as of December 31, 2011 by correspondence with the custodian and others.We believe that our audits provide a reasonable basis for our opinion.
In our opinion, the financial statements and financial highlights referred to above present fairly, in all material respects, the financial position of Dreyfus Variable Investment Fund, Money Market Portfolio at December 31, 2011, the results of its operations for the year then ended, the changes in its net assets for each of the two years in the period then ended, and the financial highlights for each of the indicated years, in conformity with U.S. generally accepted accounting principles.

|
| New York, New York |
| February 10, 2012 |
BOARD MEMBERS INFORMATION (Unaudited)
|
| Joseph S. DiMartino (68) |
| Chairman of the Board (1995) |
| Principal Occupation During Past 5Years: |
| • Corporate Director and Trustee |
| Other Public Company Board Memberships During Past 5Years: |
| • CBIZ (formerly, Century Business Services, Inc.), a provider of outsourcing functions for small |
| and medium size companies, Director (1997-present) |
| • Sunair Services Corporation, a provider of certain outdoor-related services to homes and |
| businesses, Director (2005-2009) |
| • The Newark Group, a provider of a national market of paper recovery facilities, paperboard |
| mills and paperboard converting plants, Director (2000-2010) |
| No. of Portfolios for which Board Member Serves: 164 |
| ——————— |
| Peggy C. Davis (68) |
| Board Member (2006) |
| Principal Occupation During Past 5Years: |
| • Shad Professor of Law, New York University School of Law |
| • Writer and teacher in the fields of evidence, constitutional theory, family law, social sciences |
| and the law, legal process and professional methodology and training |
| No. of Portfolios for which Board Member Serves: 53 |
| ——————— |
| David P. Feldman (72) |
| Board Member (1994) |
| Principal Occupation During Past 5Years: |
| • Corporate Director and Trustee |
| Other Public Company Board Memberships During Past 5Years: |
| • BBH Mutual Funds Group (4 registered mutual funds), Director (1992-present) |
| • QMed, Inc. a healthcare company, Director (1999-2007) |
| No. of Portfolios for which Board Member Serves: 49 |
22
|
| Ehud Houminer (71) |
| Board Member (2006) |
| Principal Occupation During Past 5Years: |
| • Executive-in-Residence at the Columbia Business School, Columbia University (1992-present) |
| Other Public Company Board Memberships During Past 5Years: |
| • Avnet Inc., an electronics distributor, Director (1993-present) |
| No. of Portfolios for which Board Member Serves: 63 |
| ——————— |
| Dr. Martin Peretz (72) |
| Board Member (1990) |
| Principal Occupation During Past 5Years: |
| • Editor-in-Chief Emeritus of The New Republic Magazine (2010-present) (previously, |
| Editor-in-Chief, 1974-2010) |
| • Director of TheStreet.com, a financial information service on the web (1996-present) |
| No. of Portfolios for which Board Member Serves: 35 |
| ——————— |
Once elected all Board Members serve for an indefinite term, but achieve Emeritus status upon reaching age 80.The address of the Board Members and Officers is in c/o The Dreyfus Corporation, 200 Park Avenue, NewYork, NewYork 10166.Additional information about the Board Members is available in the fund’s Statement of Additional Information which can be obtained from Dreyfus free of charge by calling this toll free number: 1-800-DREYFUS.
James F. Henry, Emeritus Board Member
Rosalind G. Jacobs, Emeritus Board Member
Dr. Paul A. Marks, Emeritus Board Member
Gloria Messinger, Emeritus Board Member
OFFICERS OF THE FUND (Unaudited)
BRADLEY J. SKAPYAK, President since January 2010.
Chief Operating Officer and a director of the Manager since June 2009. From April 2003 to June 2009, Mr. Skapyak was the head of the Investment Accounting and Support Department of the Manager. He is an officer of 75 investment companies (comprised of 163 portfolios) managed by the Manager. He is 53 years old and has been an employee of the Manager since February 1988.
JANETTE E. FARRAGHER, Vice President and Secretary since December 2011.
Assistant General Counsel of BNY Mellon, and an officer of 76 investment companies (comprised of 189 portfolios) managed by the Manager. She is 49 years old and has been an employee of the Manager since February 1984.
KIESHA ASTWOOD, Vice President and Assistant Secretary since January 2010.
Counsel of BNY Mellon, and an officer of 76 investment companies (comprised of 189 portfolios) managed by the Manager. She is 38 years old and has been an employee of the Manager since July 1995.
JAMES BITETTO, Vice President and Assistant Secretary since August 2005.
Senior Counsel of BNY Mellon and Secretary of the Manager, and an officer of 76 investment companies (comprised of 189 portfolios) managed by the Manager. He is 45 years old and has been an employee of the Manager since December 1996.
JONI LACKS CHARATAN, Vice President and Assistant Secretary since August 2005.
Senior Counsel of BNY Mellon, and an officer of 76 investment companies (comprised of 189 portfolios) managed by the Manager. She is 56 years old and has been an employee of the Manager since October 1988.
JOSEPH M. CHIOFFI, Vice President and Assistant Secretary since August 2005.
Senior Counsel of BNY Mellon, and an officer of 76 investment companies (comprised of 189 portfolios) managed by the Manager. He is 50 years old and has been an employee of the Manager since June 2000.
KATHLEEN DENICHOLAS, Vice President and Assistant Secretary since January 2010.
Managing Counsel of BNY Mellon, and an officer of 76 investment companies (comprised of 189 portfolios) managed by the Manager. She is 37 years old and has been an employee of the Manager since February 2001.
JOHN B. HAMMALIAN, Vice President and Assistant Secretary since August 2005.
Senior Managing Counsel of BNY Mellon, and an officer of 76 investment companies (comprised of 189 portfolios) managed by the Manager. He is 48 years old and has been an employee of the Manager since February 1991.
M. CRISTINA MEISER, Vice President and Assistant Secretary since January 2010.
Senior Counsel of BNY Mellon, and an officer of 76 investment companies (comprised of 189 portfolios) managed by the Manager. She is 41 years old and has been an employee of the Manager since August 2001.
ROBERT R. MULLERY, Vice President and Assistant Secretary since August 2005.
Managing Counsel of BNY Mellon, and an officer of 76 investment companies (comprised of 189 portfolios) managed by the Manager. He is 59 years old and has been an employee of the Manager since May 1986.
24
JEFF PRUSNOFSKY, Vice President and Assistant Secretary since August 2005.
Senior Managing Counsel of BNY Mellon, and an officer of 76 investment companies (comprised of 189 portfolios) managed by the Manager. He is 46 years old and has been an employee of the Manager since October 1990.
JAMES WINDELS, Treasurer since November 2001.
Director – Mutual Fund Accounting of the Manager, and an officer of 76 investment companies (comprised of 189 portfolios) managed by the Manager. He is 53 years old and has been an employee of the Manager since April 1985.
RICHARD CASSARO, Assistant Treasurer since January 2008.
Senior Accounting Manager – Money Market and Municipal Bond Funds of the Manager, and an officer of 76 investment companies (comprised of 189 portfolios) managed by the Manager. He is 52 years old and has been an employee of the Manager since September 1982.
GAVIN C. REILLY, Assistant Treasurer since December 2005.
Tax Manager of the Investment Accounting and Support Department of the Manager, and an officer of 76 investment companies (comprised of 189 portfolios) managed by the Manager. He is 43 years old and has been an employee of the Manager since April 1991.
ROBERT S. ROBOL, Assistant Treasurer since August 2005.
Senior Accounting Manager – Fixed Income Funds of the Manager, and an officer of 76 investment companies (comprised of 189 portfolios) managed by the Manager. He is 47 years old and has been an employee of the Manager since October 1988.
ROBERT SALVIOLO, Assistant Treasurer since July 2007.
Senior Accounting Manager – Equity Funds of the Manager, and an officer of 76 investment companies (comprised of 189 portfolios) managed by the Manager. He is 44 years old and has been an employee of the Manager since June 1989.
ROBERT SVAGNA, Assistant Treasurer since December 2002.
Senior Accounting Manager – Equity Funds of the Manager, and an officer of 76 investment companies (comprised of 189 portfolios) managed by the Manager. He is 44 years old and has been an employee of the Manager since November 1990.
JOSEPH W. CONNOLLY, Chief Compliance Officer since October 2004.
Chief Compliance Officer of the Manager and The Dreyfus Family of Funds (76 investment companies, comprised of 189 portfolios). From November 2001 through March 2004, Mr. Connolly was first Vice-President, Mutual Fund Servicing for Mellon Global Securities Services. In that capacity, Mr. Connolly was responsible for managing Mellon’s Custody, Fund Accounting and Fund Administration services to third-party mutual fund clients. He is 54 years old and has served in various capacities with the Manager since 1980, including manager of the firm’s Fund Accounting Department from 1997 through October 2001.
STEPHEN J. STOREN, Anti-Money Laundering Compliance Officer since May 2011.
Chief Compliance Officer of the Distributor, and the Anti-Money Laundering Compliance Officer of 72 investment companies (comprised of 185 portfolios) managed by the Manager. He is 57 years old and has been an employee of the Distributor since October 1999.
For More Information

The fund files its complete schedule of portfolio holdings with the Securities and Exchange Commission (“SEC”) for the first and third quarters of each fiscal year on Form N-Q. The fund’s Forms N-Q are available on the SEC’s website at http://www.sec.gov and may be reviewed and copied at the SEC’s Public Reference Room in Washington, DC. Information on the operation of the Public Reference Room may be obtained by calling 1-800-SEC-0330.
Information regarding how the fund voted proxies relating to fund securities for the most recent 12-month period ended June 30 is available on the SEC’s website at http://www.sec.gov and without charge, upon request, by calling 1-800-DREYFUS.

|
| Dreyfus Variable |
| Investment Fund, |
| Opportunistic |
| Small Cap Portfolio |

The views expressed in this report reflect those of the portfolio manager only through the end of the period covered and do not necessarily represent the views of Dreyfus or any other person in the Dreyfus organization. Any such views are subject to change at any time based upon market or other conditions and Dreyfus disclaims any responsibility to update such views.These views may not be relied on as investment advice and, because investment decisions for a Dreyfus fund are based on numerous factors, may not be relied on as an indication of trading intent on behalf of any Dreyfus fund.
|
| Not FDIC-Insured • Not Bank-Guaranteed • May Lose Value |
| | Contents |
| | THE FUND |
| 2 | A Letter from the Chairman and CEO |
| 3 | Discussion of Fund Performance |
| 6 | Fund Performance |
| 8 | Understanding Your Fund’s Expenses |
| 8 | Comparing Your Fund’s Expenses With Those of Other Funds |
| 9 | Statement of Investments |
| 13 | Statement of Assets and Liabilities |
| 14 | Statement of Operations |
| 15 | Statement of Changes in Net Assets |
| 17 | Financial Highlights |
| 19 | Notes to Financial Statements |
| 29 | Report of Independent Registered Public Accounting Firm |
| 30 | Important Tax Information |
| 31 | Board Members Information |
| 33 | Officers of the Fund |
| | FOR MORE INFORMATION |
| | Back Cover |
Dreyfus Variable Investment Fund,
Opportunistic Small Cap Portfolio
The Fund

A LETTER FROM THE CHAIRMAN AND CEO
Dear Shareholder:
We present to you this annual report for Dreyfus Variable Investment Fund, Opportunistic Small Cap Portfolio, covering the 12-month period from January 1, 2011, through December 31, 2011. For information about how the fund performed during the reporting period, as well as general market perspectives, we provide a Discussion of Fund Performance on the pages that follow.
The generally mild returns produced by the U.S. stock market in 2011 belie the pronounced volatility affecting equities over much of the year. Day-to-day market movements were often tumultuous, driven by macroeconomic developments ranging from catastrophic natural disasters in Japan to an unprecedented downgrade of long-term U.S. debt securities and the resurgence of a sovereign debt crisis in Europe. Still, U.S. corporations achieved record-setting profits, on average, even as market valuations dropped below historical norms.A fundamentals-based investment approach proved relatively ineffective in a market fueled mainly by emotion, causing most active portfolio managers to lag market averages.
We are hopeful that equity investors will adopt a more rational perspective in 2012. Our economic forecast calls for a mild acceleration of the U.S. recovery as the domestic banking system regains strength, credit conditions loosen and housing markets begin a long-awaited convalescence. Of course, we encourage you to talk with your financial adviser to help ensure that your investment objectives are properly aligned with your risk tolerance in pursuing potential market opportunities in 2012.
Thank you for your continued confidence and support.
2

DISCUSSION OF FUND PERFORMANCE
For the period of January 1, 2011, through December 31, 2011, as provided by David A. Daglio, Primary Portfolio Manager, James Boyd, Dale Dutile and Creighton Kang, Portfolio Managers
Fund and Market Performance Overview
For the 12-month period ended December 31, 2011, DreyfusVariable Investment Fund, Opportunistic Small Cap Portfolio, produced a total return of –13.82% for its Initial shares, and its Service shares returned –14.03%.1 In comparison, the Russell 2000 Index (the “Index”), the fund’s benchmark, produced a total return of –4.18% for the same period.2
Small-cap stocks lost ground in the spring and summer of 2011 as equity markets came under pressure from an array of domestic and international macroeconomic concerns.The fund underperformed its benchmark, primarily due to disappointments in the industrials and consumer discretionary sectors during the market downturn.
The Fund’s Investment Approach
The fund seeks capital growth. Stocks are selected for the fund’s portfolio based primarily on bottom-up fundamental analysis. The fund’s portfolio managers use a disciplined investment process that relies, in general, on proprietary fundamental research and valuation. Generally, elements of the process include analysis of mid-cycle business prospects, estimation of the intrinsic value of the company and the identification of a revaluation trigger. Intrinsic value is based on the combination of the valuation assessment of the company’s operating divisions with the firm’s economic balance sheet. Mid-cycle estimates, growth prospects and competitive advantages are some of the factors used in the valuation assessment. A company’s stated and hidden liabilities and assets are included in the portfolio managers’ economic balance sheet calculation. Sector overweights and underweights are a function of the relative attractiveness of securities within the fund’s investable universe. The fund’s portfolio managers invest in stocks that they believe have attractive reward to risk opportunities and may actively adjust the fund’s portfolio to reflect new developments.
DISCUSSION OF FUND PERFORMANCE (continued)
High Levels of Volatility Roiled the Markets
Small-cap stocks rose at the start of 2011 on the strength of improvements in employment, consumer spending and corporate earnings.The market rally faltered in February, when political turmoil in the Middle East drove energy prices higher, and again in March, when natural and nuclear disasters undermined the Japanese economy and disrupted the global supply chain. However, markets quickly bounced back from these unexpected shocks.
Investor sentiment began to deteriorate in earnest in late April as pressures mounted on the sovereign debt of Greece and certain other European nations. In the United States, economic data proved more disappointing than expected, and a contentious political debate intensified regarding government spending and borrowing. In addition to these developments, a major credit-rating agency downgraded its assessment of long-term U.S. government debt in early August, sparking a steep market sell-off during August and September. However, signs of resilience in the U.S. economy enabled markets to rebound to a degree over the final few months of the year. Small-cap stocks generally produced lower returns during 2011 than their large-cap counterparts.
Seeking Opportunistic Values in a Challenging Market
The fund maintained its disciplined focus on small-cap investment opportunities, using the market downturn as an opportunity to increase its exposure to fundamentally sound companies priced below our estimation of their intrinsic value.While this approach detracted from relative returns as stocks declined, it positioned the fund for when markets later rebounded.
The fund experienced its weakest performance in the industrial sector. Truck parts maker Meritor was hurt by pricing pressures and an inability to take advantage of industry consolidation trends; heating and air conditioning equipment manufacturer Lennox International suffered after announcing lower-than-expected earnings and cash flow projections; and satellite imaging company GeoEye lost ground over concerns about proposed cuts in defense spending, the company’s main source of revenue. Underweighted exposure to the consumer staples sector further detracted from the fund’s returns relative to its benchmark, as did wholesale food distributor Nash Finch and purified water distributor Primo Water.
4
On a more positive note, the fund’s energy holdings helped returns as companies such as Gulfport Energy and Cabot Oil & Gas unlocked hidden value by increasing production. In the consumer discretionary sector, apparel maker Liz Claiborne reorganized to emphasize fast growing brands. Recently established positions in gaming companies Bally Technologies and Shuffle Master contributed positively to the strong fourth quarter returns, as did home products maker Williams-Sonoma, which recorded strong holiday sales.
Finding Opportunities in Underappreciated Areas
As of the end of the reporting period, we remain concerned about the possible impact of further negative developments in Europe, but we expect the United States to continue to produce relatively strong levels of economic growth. We have found a relatively large number of attractive investment opportunities in specific areas of the industrials, consumer discretionary and technology sectors. By contrast, most utilities, materials companies and real estate investment trusts currently appear richly valued, offering fewer investments that meet our disciplined stock selection criteria.
January 17, 2012
| |
| | Please note, the position in any security highlighted in italicized typeface was sold during the |
| | reporting period. |
| | Equity funds are subject generally to market, market sector, market liquidity, issuer and investment |
| | style risks, among other factors, to varying degrees, all of which are more fully described in the |
| | fund’s prospectus. |
| | Stocks of small- and/or midcap companies often experience sharper price fluctuations than stocks |
| | of large-cap companies. |
| | The fund is only available as a funding vehicle under various life insurance policies or variable |
| | annuity contracts issued by insurance companies. Individuals may not purchase shares of the fund |
| | directly.A variable annuity is an insurance contract issued by an insurance company that enables |
| | investors to accumulate assets on a tax-deferred basis for retirement or other long-term goals. |
| 1 | Total return includes reinvestment of dividends and any capital gains paid. Past performance is no |
| | guarantee of future results. Share price and investment return fluctuate such that upon redemption, |
| | fund shares may be worth more or less than their original cost. Return figures provided reflect the |
| | absorption of certain fund expenses pursuant to an agreement by The Dreyfus Corporation |
| | through May 1, 2011, at which time it was terminated. Had these expenses not been absorbed, |
| | the fund’s returns would have been lower. |
| 2 | SOURCE: LIPPER INC. — Reflects reinvestment of dividends and, where applicable, capital |
| | gain distributions.The Russell 2000 Index is an unmanaged index of small-cap stock |
| | performance and is composed of the 2,000 smallest companies in the Russell 3000 Index.The |
| | Russell 3000 Index is composed of the 3,000 largest U.S. companies based on total market |
| | capitalization. Investors cannot invest directly in any index. |
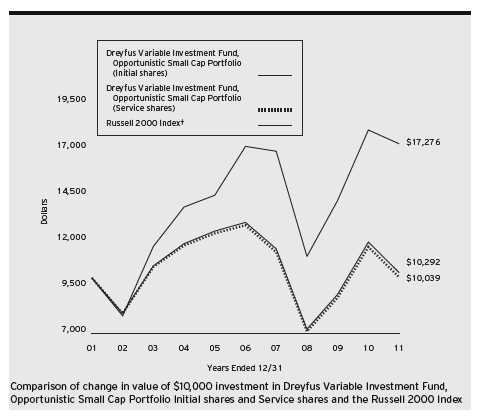
| | | | | | |
| Average Annual Total Returns as of 12/31/11 | | |
| | 1Year | 5 Years | 10 Years |
| Initial shares | –13.82% | –4.59% | 0.29% |
| Service shares | –14.03% | –4.83% | 0.04% |
| Russell 2000 Index | –4.18% | 0.15% | 5.62% |
|
| † Source: Lipper Inc. |
| Past performance is not predictive of future performance.The fund’s performance shown in the graph and table does not |
| reflect the deduction of taxes that a shareholder would pay on fund distributions or the redemption of fund shares. |
| The fund’s performance does not reflect the deduction of additional charges and expenses imposed in connection |
| with investing in variable insurance contracts which will reduce returns. |
| The above graph compares a $10,000 investment made in Initial and Service shares of Dreyfus Variable Investment |
| Fund, Opportunistic Small Cap Portfolio on 12/31/01 to a $10,000 investment made in the Russell 2000 Index |
| (the “Index”) on that date. |
6
The fund’s Initial shares are not subject to a Rule 12b-1 fee.The fund’s Service shares are subject to a 0.25% annual Rule 12b-1 fee.The performance figures for each share class reflect certain expense reimbursements without which the performance of each share class would have been lower.All dividends and capital gain distributions are reinvested.
The fund’s performance shown in the line graph above takes into account all applicable fund fees and expenses.The Index is an unmanaged index and is composed of the 2,000 smallest companies in the Russell 3000 Index.The Russell 3000 Index is composed of 3,000 of the largest U.S. companies by market capitalization. Unlike a mutual fund, the Index is not subject to charges, fees and other expenses. Investors cannot invest directly in any index. Further information relating to fund performance, including expense reimbursements, if applicable, is contained in the Financial Highlights section of the prospectus and elsewhere in this report.
UNDERSTANDING YOUR FUND’S EXPENSES (Unaudited)
As a mutual fund investor, you pay ongoing expenses, such as management fees and other expenses. Using the information below, you can estimate how these expenses affect your investment and compare them with the expenses of other funds.You also may pay one-time transaction expenses, including sales charges (loads), redemption fees and expenses associated with variable annuity or insurance contracts, which are not shown in this section and would have resulted in higher total expenses. For more information, see your fund’s prospectus or talk to your financial adviser.
Review your fund’s expenses
The table below shows the expenses you would have paid on a $1,000 investment in DreyfusVariable Investment Fund, Opportunistic Small Cap Portfolio from July 1, 2011 to December 31, 2011. It also shows how much a $1,000 investment would be worth at the close of the period, assuming actual returns and expenses.
Expenses and Value of a $1,000 Investment
assuming actual returns for the six months ended December 31, 2011
| | | | |
| | | Initial Shares | | Service Shares |
| Expenses paid per $1,000† | | $4.12 | | $5.27 |
| Ending value (after expenses) | | $836.60 | | $835.40 |
COMPARING YOUR FUND’S EXPENSES
WITH THOSE OF OTHER FUNDS (Unaudited)
Using the SEC’s method to compare expenses
The Securities and Exchange Commission (SEC) has established guidelines to help investors assess fund expenses. Per these guidelines, the table below shows your fund’s expenses based on a $1,000 investment, assuming a hypothetical 5% annualized return. You can use this information to compare the ongoing expenses (but not transaction expenses or total cost) of investing in the fund with those of other funds.All mutual fund shareholder reports will provide this information to help you make this comparison. Please note that you cannot use this information to estimate your actual ending account balance and expenses paid during the period.
Expenses and Value of a $1,000 Investment
assuming a hypothetical 5% annualized return for the six months ended December 31, 2011
| | | | |
| | | Initial Shares | | Service Shares |
| Expenses paid per $1,000† | | $4.53 | | $5.80 |
| Ending value (after expenses) | | $1,020.72 | | $1,019.46 |
|
| † Expenses are equal to the fund’s annualized expense ratio of .89% for Initial Shares and 1.14% for Service Shares, |
| multiplied by the average account value over the period, multiplied by 184/365 (to reflect the one-half year period). |
8
|
| STATEMENT OF INVESTMENTS |
| December 31, 2011 |
| | | |
| Common Stocks—99.7% | Shares | Value ($) |
| Consumer Discretionary—38.2% | | |
| American Axle & Manufacturing Holdings | 79,800a | 789,222 |
| Bally Technologies | 96,650a | 3,823,474 |
| Commercial Vehicle Group | 65,220a | 589,589 |
| Dana Holding | 237,990a | 2,891,578 |
| DFC Global | 76,240a | 1,376,894 |
| Employers Holdings | 135,560 | 2,452,280 |
| Express | 158,170a | 3,153,910 |
| Group 1 Automotive | 33,620b | 1,741,516 |
| Herman Miller | 86,780b | 1,601,091 |
| ICF International | 119,660a | 2,965,175 |
| Kelly Services, Cl. A | 121,540 | 1,662,667 |
| Liz Claiborne | 733,970a,b | 6,334,161 |
| Meritage Homes | 207,660a,b | 4,815,635 |
| Meritor | 147,230a | 783,264 |
| Mohawk Industries | 38,590a | 2,309,612 |
| Newell Rubbermaid | 59,250 | 956,888 |
| Oshkosh | 122,840a | 2,626,319 |
| Saks | 440,600a,b | 4,295,850 |
| ScanSource | 157,710a,b | 5,677,560 |
| Shuffle Master | 182,160a | 2,134,915 |
| Standard Pacific | 713,200a,b | 2,267,976 |
| Steelcase, Cl. A | 271,610b | 2,026,211 |
| Tower International | 115,710a | 1,242,725 |
| TrueBlue | 36,300a | 503,844 |
| Williams-Sonoma | 117,570 | 4,526,445 |
| Wright Express | 85,140a,b | 4,621,399 |
| | | 68,170,200 |
| Consumer Staples—.6% | | |
| Dole Food | 86,640a,b | 749,436 |
| Primo Water | 114,450a,b | 347,928 |
| | | 1,097,364 |
| Energy—4.7% | | |
| Endeavour International | 167,680a,b | 1,457,139 |
| Gulfport Energy | 127,200a | 3,746,040 |
| SandRidge Energy | 402,550a,b | 3,284,808 |
| | | 8,487,987 |
STATEMENT OF INVESTMENTS (continued)
| | | | |
| Common Stocks (continued) | Shares | | Value ($) |
| Financial—11.2% | | | | |
| Arthur J. Gallagher & Co. | 70,060 | | 2,342,806 |
| Brown & Brown | 173,490 | | 3,926,079 |
| Equifax | 72,880 | | 2,823,371 |
| Jones Lang LaSalle | 48,200 | | 2,952,732 |
| Nelnet, Cl. A | 82,280 | | 2,013,392 |
| Och-Ziff Capital Management Group, Cl. A | 372,720 | | 3,134,575 |
| Portfolio Recovery Associates | 40,390 | a,b | 2,727,133 |
| | | | | 19,920,088 |
| Health Care—7.9% | | | | |
| Align Technology | 103,520 | a | 2,456,012 |
| Durect | 253,310 | a,b | 298,906 |
| Emergent BioSolutions | 176,279 | a,b | 2,968,538 |
| Hanger Orthopedic Group | 233,510 | a | 4,364,302 |
| Sagent Pharmaceuticals | 33,580 | b | 705,180 |
| Salix Pharmaceuticals | 49,590 | a | 2,372,882 |
| United Therapeutics | 20,080 | a | 948,780 |
| | | | | 14,114,600 |
| Industrial—14.9% | | | | |
| Columbus McKinnon | 137,180 | a | 1,740,814 |
| Con-way | 102,280 | | 2,982,485 |
| Encore Wire | 84,320 | b | 2,183,888 |
| Granite Construction | 129,170 | b | 3,063,912 |
| Griffon | 91,280 | b | 833,386 |
| Hubbell, Cl. B | 16,390 | | 1,095,835 |
| Kenexa | 56,030 | a | 1,496,001 |
| Landstar System | 82,040 | | 3,931,357 |
| Old Dominion Freight Line | 18,330 | a | 742,915 |
| Orion Marine Group | 127,710 | a,b | 849,272 |
| Saia | 54,320 | a | 677,914 |
| Sterling Construction | 51,320 | a | 552,716 |
| Trinity Industries | 63,390 | | 1,905,503 |
| UTi Worldwide | 346,270 | | 4,601,928 |
| | | | | 26,657,926 |
10
| | | |
| Common Stocks (continued) | Shares | Value ($) |
| Information Technology—17.2% | | |
| Applied Micro Circuits | 116,080a | 780,058 |
| Brocade Communications Systems | 339,350a | 1,761,227 |
| CSG Systems International | 189,040a,b | 2,780,778 |
| DealerTrack Holdings | 244,920a,b | 6,676,519 |
| Electronic Arts | 27,160a | 559,496 |
| JDS Uniphase | 207,630a | 2,167,657 |
| KIT Digital | 140,880a,b | 1,190,436 |
| MICROS Systems | 62,950a | 2,932,211 |
| Microsemi | 177,220a | 2,968,435 |
| Omnicell | 43,660a | 721,263 |
| SYKES Enterprises | 10,680a,b | 167,249 |
| Take-Two Interactive Software | 125,660a | 1,702,693 |
| Velti | 430,370a | 2,926,516 |
| Vishay Intertechnology | 140,180a | 1,260,218 |
| Watts Water Technologies, Cl. A | 60,360 | 2,064,916 |
| | | 30,659,672 |
| Materials—3.4% | | |
| Cytec Industries | 6,910 | 308,532 |
| Georgia Gulf | 119,170a | 2,322,623 |
| Innospec | 30,950a | 868,767 |
| Omnova Solutions | 151,360a | 697,770 |
| Zoltek | 249,110a,b | 1,898,218 |
| | | 6,095,910 |
| Telecommunication Services—1.6% | | |
| GeoEye | 128,520a,b | 2,855,714 |
| Total Common Stocks | | |
| (cost $184,804,033) | | 178,059,461 |
| |
| Other Investment—.5% | | |
| Registered Investment Company; | | |
| Dreyfus Institutional Preferred | | |
| Plus Money Market Fund | | |
| (cost $894,229) | 894,229c | 894,229 |
STATEMENT OF INVESTMENTS (continued)
| | | | |
| Investment of Cash Collateral | | |
| for Securities Loaned—13.5% | Shares | Value ($) |
| Registered Investment Company; | | |
| Dreyfus Institutional Cash Advantage Fund | | |
| (cost $24,171,779) | 24,171,779c | 24,171,779 |
| Total Investments (cost $209,870,041) | 113.7% | 203,125,469 |
| Liabilities, Less Cash and Receivables | (13.7%) | (24,567,719) |
| Net Assets | 100.0% | 178,557,750 |
|
| a Non-income producing security. |
| b Security, or portion thereof, on loan.At December 31, 2011, the value of the fund’s securities on loan was |
| $23,541,268 and the value of the collateral held by the fund was $24,171,779. |
| c Investment in affiliated money market mutual fund. |
| | | |
| Portfolio Summary (Unaudited)† | | |
| |
| | Value (%) | | Value (%) |
| Consumer Discretionary | 38.2 | Energy | 4.7 |
| Information Technology | 17.2 | Materials | 3.4 |
| Industrial | 14.9 | Telecommunication Services | 1.6 |
| Money Market Investments | 14.0 | Consumer Staples | .6 |
| Financial | 11.2 | | |
| Health Care | 7.9 | | 113.7 |
| |
| † Based on net assets. | | | |
| See notes to financial statements. | | | |
12
|
| STATEMENT OF ASSETS AND LIABILITIES |
| December 31, 2011 |
| | | |
| | Cost | Value |
| Assets ($): | | |
| Investments in securities—See Statement of Investments (including | | |
| securities on loan, valued at $23,541,268)—Note 1(b): | | |
| Unaffiliated issuers | 184,804,033 | 178,059,461 |
| Affiliated issuers | 25,066,008 | 25,066,008 |
| Cash | | 15,447 |
| Dividends and securities lending income receivable | | 69,839 |
| Receivable for investment securities sold | | 16,601 |
| Receivable for shares of Beneficial Interest subscribed | | 5,202 |
| Prepaid expenses | | 3,663 |
| | | 203,236,221 |
| Liabilities ($): | | |
| Due to The Dreyfus Corporation and affiliates—Note 3(b) | | 136,118 |
| Liability for securities on loan—Note 1(b) | | 24,171,779 |
| Payable for investment securities purchased | | 247,086 |
| Payable for shares of Beneficial Interest redeemed | | 50,817 |
| Accrued expenses | | 72,671 |
| | | 24,678,471 |
| Net Assets ($) | | 178,557,750 |
| Composition of Net Assets ($): | | |
| Paid-in capital | | 265,851,448 |
| Accumulated net realized gain (loss) on investments | | (80,549,126) |
| Accumulated net unrealized appreciation | | |
| (depreciation) on investments | | (6,744,572) |
| Net Assets ($) | | 178,557,750 |
| |
| |
| Net Asset Value Per Share | | |
| | Initial Shares | Service Shares |
| Net Assets ($) | 165,655,562 | 12,902,188 |
| Shares Outstanding | 6,308,150 | 498,371 |
| Net Asset Value Per Share ($) | 26.26 | 25.89 |
| |
| See notes to financial statements. | | |
|
| STATEMENT OF OPERATIONS |
| Year Ended December 31, 2011 |
| | |
| Investment Income ($): | |
| Income: | |
| Cash dividends: | |
| Unaffiliated issuers | 794,055 |
| Affiliated issuers | 1,854 |
| Income from securities lending—Note 1(b) | 100,524 |
| Total Income | 896,433 |
| Expenses: | |
| Investment advisory fee—Note 3(a) | 1,468,313 |
| Prospectus and shareholders’ reports | 105,689 |
| Professional fees | 56,327 |
| Custodian fees—Note 3(b) | 38,887 |
| Distribution fees—Note 3(b) | 34,729 |
| Trustees’ fees and expenses—Note 3(c) | 16,994 |
| Shareholder servicing costs—Note 3(b) | 10,021 |
| Loan commitment fees—Note 2 | 2,752 |
| Miscellaneous | 16,661 |
| Total Expenses | 1,750,373 |
| Less—reduction in investment advisory fee due to undertaking—Note 3(a) | (105,705) |
| Less—reduction in fees due to earnings credits—Note 3(b) | (5) |
| Net Expenses | 1,644,663 |
| Investment (Loss)—Net | (748,230) |
| Realized and Unrealized Gain (Loss) on Investments—Note 4 ($): | |
| Net realized gain (loss) on investments | 14,553,334 |
| Net unrealized appreciation (depreciation) on investments | (43,421,641) |
| Net Realized and Unrealized Gain (Loss) on Investments | (28,868,307) |
| Net (Decrease) in Net Assets Resulting from Operations | (29,616,537) |
| |
| See notes to financial statements. | |
14
STATEMENT OF CHANGES IN NET ASSETS
| | | | |
| | Year Ended December 31, |
| | 2011 | 2010 |
| Operations ($): | | |
| Investment income (loss)—net | (748,230) | 810,319 |
| Net realized gain (loss) on investments | 14,553,334 | 12,489,895 |
| Net unrealized appreciation | | |
| (depreciation) on investments | (43,421,641) | 37,613,311 |
| Net Increase (Decrease) in Net Assets | | |
| Resulting from Operations | (29,616,537) | 50,913,525 |
| Dividends to Shareholders from ($): | | |
| Investment income—net: | | |
| Initial Shares | (718,813) | (1,268,984) |
| Service Shares | (43,939) | (87,019) |
| Total Dividends | (762,752) | (1,356,003) |
| Beneficial Interest Transactions ($): | | |
| Net proceeds from shares sold: | | |
| Initial Shares | 28,028,041 | 9,037,855 |
| Service Shares | 2,204,416 | 1,573,989 |
| Dividends reinvested: | | |
| Initial Shares | 718,813 | 1,268,984 |
| Service Shares | 43,939 | 87,019 |
| Cost of shares redeemed: | | |
| Initial Shares | (28,697,581) | (25,528,184) |
| Service Shares | (2,879,501) | (2,222,606) |
| Increase (Decrease) in Net Assets from | | |
| Beneficial Interest Transactions | (581,873) | (15,782,943) |
| Total Increase (Decrease) in Net Assets | (30,961,162) | 33,774,579 |
| Net Assets ($): | | |
| Beginning of Period | 209,518,912 | 175,744,333 |
| End of Period | 178,557,750 | 209,518,912 |
| Undistributed investment income—net | — | 762,192 |
STATEMENT OF CHANGES IN NET ASSETS (continued)
| | | | |
| | Year Ended December 31, |
| | 2011 | 2010 |
| Capital Share Transactions: | | |
| Initial Shares | | |
| Shares sold | 934,142 | 349,483 |
| Shares issued for dividends reinvested | 22,490 | 48,305 |
| Shares redeemed | (995,992) | (1,003,150) |
| Net Increase (Decrease) in Shares Outstanding | (39,360) | (605,362) |
| Service Shares | | |
| Shares sold | 84,677 | 61,092 |
| Shares issued for dividends reinvested | 1,392 | 3,347 |
| Shares redeemed | (98,107) | (88,604) |
| Net Increase (Decrease) in Shares Outstanding | (12,038) | (24,165) |
| |
| See notes to financial statements. | | |
16
FINANCIAL HIGHLIGHTS
The following tables describe the performance for each share class for the fiscal periods indicated.All information (except portfolio turnover rate) reflects financial results for a single fund share.Total return shows how much your investment in the fund would have increased (or decreased) during each period, assuming you had reinvested all dividends and distributions. The fund’s total returns do not reflect expenses associated with variable annuity or insurance contracts.These figures have been derived from the fund’s financial statements.
| | | | | | | | | | |
| | | Year Ended December 31, | |
| Initial Shares | 2011 | 2010 | 2009 | 2008 | 2007 |
| Per Share Data ($): | | | | | |
| Net asset value, beginning of period | 30.58 | 23.49 | 19.01 | 32.34 | 42.03 |
| Investment Operations: | | | | | |
| Investment income (loss)—neta | (.10) | .12 | .17 | .26 | .24 |
| Net realized and unrealized | | | | | |
| gain (loss) on investments | (4.10) | 7.16 | 4.63 | (11.87) | (4.29) |
| Total from Investment Operations | (4.20) | 7.28 | 4.80 | (11.61) | (4.05) |
| Distributions: | | | | | |
| Dividends from investment income—net | (.12) | (.19) | (.32) | (.25) | (.31) |
| Dividends from net realized | | | | | |
| gain on investments | — | — | — | (1.47) | (5.33) |
| Total Distributions | (.12) | (.19) | (.32) | (1.72) | (5.64) |
| Net asset value, end of period | 26.26 | 30.58 | 23.49 | 19.01 | 32.34 |
| Total Return (%) | (13.82) | 31.11 | 26.04 | (37.59) | (11.06) |
| Ratios/Supplemental Data (%): | | | | | |
| Ratio of total expenses | | | | | |
| to average net assets | .88 | .86 | .86 | .83 | .81 |
| Ratio of net expenses | | | | | |
| to average net assets | .82 | .70 | .71 | .75 | .81 |
| Ratio of net investment income | | | | | |
| (loss) to average net assets | (.36) | .46 | .88 | .95 | .66 |
| Portfolio Turnover Rate | 91.45 | 192.88 | 69.73 | 77.65 | 90.75 |
| Net Assets, end of period ($ x 1,000) | 165,656 | 194,105 | 163,322 | 144,777 | 447,447 |
| |
| a Based on average shares outstanding at each month end. | | | | |
| See notes to financial statements. | | | | | |
FINANCIAL HIGHLIGHTS (continued)
| | | | | | | | | | |
| | | Year Ended December 31, | |
| Service Shares | 2011 | 2010 | 2009 | 2008 | 2007 |
| Per Share Data ($): | | | | | |
| Net asset value, beginning of period | 30.20 | 23.24 | 18.77 | 31.94 | 41.56 |
| Investment Operations: | | | | | |
| Investment income (loss)—neta | (.17) | .06 | .12 | .20 | .15 |
| Net realized and unrealized | | | | | |
| gain (loss) on investments | (4.05) | 7.06 | 4.60 | (11.75) | (4.25) |
| Total from Investment Operations | (4.22) | 7.12 | 4.72 | (11.55) | (4.10) |
| Distributions: | | | | | |
| Dividends from investment income—net | (.09) | (.16) | (.25) | (.15) | (.19) |
| Dividends from net realized | | | | | |
| gain on investments | — | — | — | (1.47) | (5.33) |
| Total Distributions | (.09) | (.16) | (.25) | (1.62) | (5.52) |
| Net asset value, end of period | 25.89 | 30.20 | 23.24 | 18.77 | 31.94 |
| Total Return (%) | (14.03) | 30.77 | 25.77 | (37.77) | (11.28) |
| Ratios/Supplemental Data (%): | | | | | |
| Ratio of total expenses | | | | | |
| to average net assets | 1.13 | 1.11 | 1.11 | 1.08 | 1.06 |
| Ratio of net expenses | | | | | |
| to average net assets | 1.07 | .95 | .96 | .99 | 1.06 |
| Ratio of net investment income | | | | | |
| (loss) to average net assets | (.61) | .22 | .63 | .75 | .42 |
| Portfolio Turnover Rate | 91.45 | 192.88 | 69.73 | 77.65 | 90.75 |
| Net Assets, end of period ($ x 1,000) | 12,902 | 15,414 | 12,422 | 10,077 | 18,299 |
| |
| a Based on average shares outstanding at each month end. | | | | |
| See notes to financial statements. | | | | | |
18
NOTES TO FINANCIAL STATEMENTS
NOTE 1—Significant Accounting Policies:
Dreyfus Variable Investment Fund (the “Company”) is registered under the Investment Company Act of 1940, as amended (the “Act”), as an open-end management investment company, operating as a series company currently offering seven series, including the Opportunistic Small Cap Portfolio (the “fund”).The fund is only offered to separate accounts established by insurance companies to fund variable annuity contracts and variable life insurance policies.The fund is a diversified series. The fund’s investment objective is to seek capital growth. The Dreyfus Corporation (the “Manager” or “Dreyfus”), a wholly-owned subsidiary of The Bank of New York Mellon Corporation (“BNY Mellon”), serves as the fund’s investment adviser.
MBSC Securities Corporation (the “Distributor”), a wholly-owned subsidiary of the Manager, is the distributor of the fund’s shares, which are sold without a sales charge. The fund is authorized to issue an unlimited number of $.001 par value shares of Beneficial Interest in each of the following classes of shares: Initial and Service. Each class of shares has identical rights and privileges, except with respect to the distribution plan and the expenses borne by each class, the allocation of certain transfer agency costs and certain voting rights. Income, expenses (other than expenses attributable to a specific class), and realized and unrealized gains or losses on investments are allocated to each class of shares based on its relative net assets.
The Company accounts separately for the assets, liabilities and operations of each series. Expenses directly attributable to each series are charged to that series’ operations; expenses which are applicable to all series are allocated among them on a pro rata basis.
The Financial Accounting Standards Board (“FASB”) Accounting Standards Codification (“ASC”) is the exclusive reference of authoritative U.S. generally accepted accounting principles (“GAAP”) recognized by the FASB to be applied by nongovernmental entities. Rules and interpretive releases of the Securities and Exchange Commission (“SEC”)
NOTES TO FINANCIAL STATEMENTS (continued)
under authority of federal laws are also sources of authoritative GAAP for SEC registrants. The fund’s financial statements are prepared in accordance with GAAP, which may require the use of management estimates and assumptions.Actual results could differ from those estimates.
The Company enters into contracts that contain a variety of indemnifications.The fund’s maximum exposure under these arrangements is unknown.The fund does not anticipate recognizing any loss related to these arrangements.
(a) Portfolio valuation: The fair value of a financial instrument is the amount that would be received to sell an asset or paid to transfer a liability in an orderly transaction between market participants at the measurement date (i.e. the exit price). GAAP establishes a fair value hierarchy that prioritizes the inputs of valuation techniques used to measure fair value.This hierarchy gives the highest priority to unadjusted quoted prices in active markets for identical assets or liabilities (Level 1 measurements) and the lowest priority to unobservable inputs (Level 3 measurements).
Additionally, GAAP provides guidance on determining whether the volume and activity in a market has decreased significantly and whether such a decrease in activity results in transactions that are not orderly. GAAP requires enhanced disclosures around valuation inputs and techniques used during annual and interim periods.
Various inputs are used in determining the value of the fund’s investments relating to fair value measurements.These inputs are summarized in the three broad levels listed below:
Level 1—unadjusted quoted prices in active markets for identical investments.
Level 2—other significant observable inputs (including quoted prices for similar investments, interest rates, prepayment speeds, credit risk, etc.).
Level 3—significant unobservable inputs (including the fund’s own assumptions in determining the fair value of investments).
20
The inputs or methodology used for valuing securities are not necessarily an indication of the risk associated with investing in those securities.
Changes in valuation techniques may result in transfers in or out of an assigned level within the disclosure hierarchy. Valuation techniques used to value the fund’s investments are as follows:
Investments in securities are valued at the last sales price on the securities exchange or national securities market on which such securities are primarily traded. Securities listed on the National Market System for which market quotations are available are valued at the official closing price or, if there is no official closing price that day, at the last sales price. Securities not listed on an exchange or the national securities market, or securities for which there were no transactions, are valued at the average of the most recent bid and asked prices, except for open short positions, where the asked price is used for valuation purposes. Bid price is used when no asked price is available. Registered investment companies that are not traded on an exchange are valued at their net asset value.All preceding securities are categorized within Level 1 of the fair value hierarchy.
Fair valuing of securities may be determined with the assistance of a pricing service using calculations based on indices of domestic securities and other appropriate indicators, such as prices of relevant American Depository Receipts and futures contracts. Utilizing these techniques may result in transfers between Level 1 and Level 2 of the fair value hierarchy.
When market quotations or official closing prices are not readily available, or are determined not to reflect accurately fair value, such as when the value of a security has been significantly affected by events after the close of the exchange or market on which the security is principally traded (for example, a foreign exchange or market), but before the fund calculates its net asset value, the fund may value these investments at fair value as determined in accordance with the procedures approved by the
NOTES TO FINANCIAL STATEMENTS (continued)
Board of Trustees. Certain factors may be considered when fair valuing investments such as: fundamental analytical data, the nature and duration of restrictions on disposition, an evaluation of the forces that influence the market in which the securities are purchased and sold, and public trading in similar securities of the issuer or comparable issuers. These securities are either categorized as Level 2 or 3 depending on the relevant inputs used.
For restricted securities where observable inputs are limited, assumptions about market activity and risk are used and are categorized within Level 3 of the fair value hierarchy.
The following is a summary of the inputs used as of December 31, 2011 in valuing the fund’s investments:
| | | | |
| | | Level 2—Other | Level 3— | |
| | Level 1— | Significant | Significant | |
| | Unadjusted | Observable | Unobservable | |
| | Quoted Prices | Inputs | Inputs | Total |
| Assets ($) | | | | |
| Investments in Securities: | | | |
| Equity Securities— | | | | |
| Domestic† | 170,531,017 | — | — | 170,531,017 |
| Equity Securities— | | | | |
| Foreign† | 7,528,444 | — | — | 7,528,444 |
| Mutual Funds | 25,066,008 | — | — | 25,066,008 |
| † See Statement of Investments for additional detailed categorizations. | |
In May 2011, FASB issued Accounting Standards Update (“ASU”) No. 2011-04 “Amendments to Achieve Common FairValue Measurement and Disclosure Requirements in GAAP and International Financial Reporting Standards (“IFRS”)” (“ASU 2011-04”). ASU 2011-04 includes common requirements for measurement of and disclosure about fair value between GAAP and IFRS. ASU 2011-04 will require reporting entities to disclose the following information for fair value measurements categorized within Level 3 of the fair value hierarchy: quantitative information about the unobservable inputs used in the fair value measurement, the valuation processes used by the reporting entity
22
and a narrative description of the sensitivity of the fair value measurement to changes in unobservable inputs and the interrelationships between those unobservable inputs. In addition, ASU 2011-04 will require reporting entities to make disclosures about amounts and reasons for all transfers in and out of Level 1 and Level 2 fair value measurements.The new and revised disclosures are effective for interim and annual reporting periods beginning after December 15, 2011. At this time, management is evaluating the implications of ASU 2011-04 and its impact on the financial statements.
(b) Securities transactions and investment income: Securities transactions are recorded on a trade date basis. Realized gains and losses from securities transactions are recorded on the identified cost basis. Dividend income is recognized on the ex-dividend date and interest income, including, where applicable, accretion of discount and amortization of premium on investments, is recognized on the accrual basis.
Pursuant to a securities lending agreement withThe Bank of NewYork Mellon, a subsidiary of BNY Mellon and an affiliate of Dreyfus, the fund may lend securities to qualified institutions. It is the fund’s policy that, at origination, all loans are secured by collateral of at least 102% of the value of U.S. securities loaned and 105% of the value of foreign securities loaned. Collateral equivalent to at least 100% of the market value of securities on loan is maintained at all times. Collateral is either in the form of cash, which can be invested in certain money market mutual funds managed by the Manager, U.S. Government and Agency securities or letters of credit.The fund is entitled to receive all income on securities loaned, in addition to income earned as a result of the lending transaction. Although each security loaned is fully collateralized, the fund bears the risk of delay in recovery of, or loss of rights in, the securities loaned should a borrower fail to return the securities in a timely manner. During the period ended December 31, 2011, The Bank of New York Mellon earned $43,082 from lending portfolio securities, pursuant to the securities lending agreement.
NOTES TO FINANCIAL STATEMENTS (continued)
(c) Affiliated issuers: Investments in other investment companies advised by Dreyfus are defined as “affiliated” in the Act.
The fund may invest in shares of certain affiliated investment companies also advised or managed by Dreyfus. Investments in affiliated investment companies for the period ended December 31, 2011 were as follows:
| | | | | | | |
| Affiliated | | | | | | | |
| Investment | Value | | | | Value | | Net |
| Company | 12/31/2010 | ($) | Purchases ($) | Sales ($) | 12/31/2011 | ($) | Assets (%) |
| Dreyfus | | | | | | | |
| Institutional | | | | | | | |
| Preferred | | | | | | | |
| Plus Money | | | | | | | |
| Market Fund | 1,798,000 | | 88,409,663 | 89,313,434 | 894,229 | | .5 |
| Dreyfus | | | | | | | |
| Institutional | | | | | | | |
| Cash | | | | | | | |
| Advantage | | | | | | | |
| Fund | 43,915,116 | | 202,233,674 | 221,977,011 | 24,171,779 | | 13.5 |
| Total | 45,713,116 | | 290,643,337 | 311,290,445 | 25,066,008 | | 14.0 |
(d) Dividends to shareholders: Dividends are recorded on the ex-dividend date. Dividends from investment income-net and dividends from net realized capital gains, if any, are normally declared and paid annually, but the fund may make distributions on a more frequent basis to comply with the distribution requirements of the Internal Revenue Code of 1986, as amended (the “Code”).To the extent that net realized capital gains can be offset by capital loss carryovers, it is the policy of the fund not to distribute such gains. Income and capital gain distributions are determined in accordance with income tax regulations, which may differ from GAAP.
(e) Federal income taxes: It is the policy of the fund to continue to qualify as a regulated investment company, if such qualification is in the best interests of its shareholders, by complying with the applicable provisions of the Code, and to make distributions of taxable income sufficient to relieve it from substantially all federal income and excise taxes.
As of and during the period ended December 31, 2011, the fund did not have any liabilities for any uncertain tax positions. The fund
24
recognizes interest and penalties, if any, related to uncertain tax positions as income tax expense in the Statement of Operations. During the period, the fund did not incur any interest or penalties.
Each of the tax years in the four-year period ended December 31, 2011 remains subject to examination by the Internal Revenue Service and state taxing authorities.
At December 31, 2011, the components of accumulated earnings on a tax basis were as follows: accumulated capital losses $78,939,438 and unrealized depreciation $6,880,720. In addition, the fund had $1,473,540 of capital losses realized after October 31, 2011, which were deferred for tax purposes to the first day of the following fiscal year.
Under the Regulated Investment Company Modernization Act of 2010 (the “2010 Act”), the fund will be permitted to carry forward capital losses incurred in taxable years beginning after December 22, 2010 (“post-enactment losses”) for an unlimited period. Post-enactment capital loss carryovers will retain their character as either short-term or long-term capital losses rather than be considered short-term as they were under previous statute. However, the 2010 Act requires post-enactment losses to be utilized before the utilization of losses incurred in taxable years prior to the effective date of the 2010 Act (“pre-enactment losses”). As a result of this ordering rule, pre-enactment losses may be more likely to expire unused.
The accumulated capital loss carryover is available for federal income tax purposes to be applied against future net securities profits, if any, realized subsequent to December 31, 2011. If not applied, $28,314,747 of the carryover expires in fiscal 2016 and $50,624,691 expires in fiscal 2017.
The tax character of distributions paid to shareholders during the fiscal periods ended December 31, 2011 and December 31, 2010 were as follows: ordinary income $762,752 and $1,356,003, respectively.
NOTES TO FINANCIAL STATEMENTS (continued)
During the period ended December 31, 2011, as a result of permanent book to tax differences, primarily due to the tax treatment for net operating losses, the fund increased accumulated undistributed investment income-net by $748,790 and decreased paid-in capital by the same amount. Net assets and net asset value per share were not affected by this reclassification.
NOTE 2—Bank Lines of Credit:
The fund participates with other Dreyfus-managed funds in a $225 million unsecured credit facility led by Citibank, N.A. and a $300 million unsecured credit facility provided by The Bank of New York Mellon (each, a “Facility”), each to be utilized primarily for temporary or emergency purposes, including the financing of redemptions. In connection therewith, the fund has agreed to pay its pro rata portion of commitment fees for each Facility. Interest is charged to the fund based on rates determined pursuant to the terms of the respective Facility at the time of borrowing. During the period ended December 31, 2011, the fund did not borrow under the Facilities.
NOTE 3—Investment Advisory Fee and Other Transactions With Affiliates:
(a) Pursuant to an investment advisory agreement with the Manager, the investment advisory fee is computed at the annual rate of .75% of the value of the fund’s average daily net assets and is payable monthly.
The Manager had agreed until May 1, 2011, to waive receipt of its fees and/or assume the expenses of the fund so that the total annual fund operating expenses of each class (excluding Rule 12b-1 fees, taxes, brokerage commissions, interest on borrowings and extraordinary expenses) did not exceed .70% of the value of the fund’s average daily net assets. The reduction in investment advisory fee, pursuant to the undertaking, amounted to $105,705 during the period ended December 31, 2011.
(b) Under the Distribution Plan (the “Plan”) adopted pursuant to Rule 12b-1 under the Act, Service shares pay the Distributor for distributing
26
their shares, for servicing and/or maintaining Service shares’ shareholder accounts and for advertising and marketing for Service shares.The Plan provides for payments to be made at an annual rate of .25% of the value of the Service shares’ average daily net assets.The Distributor may make payments to Participating Insurance Companies and to brokers and dealers acting as principal underwriter for their variable insurance prod-ucts.The fees payable under the Plan are payable without regard to actual expenses incurred. During the period ended December 31, 2011, Service shares were charged $34,729 pursuant to the Plan.
The fund compensates Dreyfus Transfer, Inc., a wholly-owned subsidiary of the Manager, under a transfer agency agreement for providing personnel and facilities to perform transfer agency services for the fund. During the period ended December 31, 2011, the fund was charged $1,000 pursuant to the transfer agency agreement, which is included in Shareholder servicing costs in the Statement of Operations.
The fund has arrangements with the custodian and cash management bank whereby the fund may receive earnings credits when positive cash balances are maintained, which are used to offset custody and cash management fees. For financial reporting purposes, the fund includes net earnings credits as an expense offset in the Statement of Operations.
The fund compensates The Bank of New York Mellon under cash management agreements for performing cash management services related to fund subscriptions and redemptions. During the period ended December 31, 2011, the fund was charged $160 pursuant to the cash management agreements, which is included in Shareholder servicing costs in the Statement of Operations.These fees were partially offset by earnings credits of $5.
The fund also compensates The Bank of New York Mellon under a custody agreement for providing custodial services for the fund. During the period ended December 31, 2011, the fund was charged $38,887 pursuant to the custody agreement.
NOTES TO FINANCIAL STATEMENTS (continued)
During the period ended December 31, 2011, the fund was charged $6,402 for services performed by the Chief Compliance Officer.
The components of “Due to The Dreyfus Corporation and affiliates” in the Statement of Assets and Liabilities consist of: investment advisory fees $112,873, Rule 12b-1 distribution plan fees $2,709, custodian fees $15,067, chief compliance officer fees $5,295 and transfer agency per account fees $174.
(c) Each Board member also serves as a Board member of other funds within the Dreyfus complex. Annual retainer fees and attendance fees are allocated to each fund based on net assets.
NOTE 4—Securities Transactions:
The aggregate amount of purchases and sales of investment securities, excluding short-term securities, during the period ended December 31, 2011, amounted to $180,083,595 and $179,682,680, respectively.
At December 31, 2011, the cost of investments for federal income tax purposes was $210,006,189; accordingly, accumulated net unrealized depreciation on investments was $6,880,720, consisting of $14,205,227 gross unrealized appreciation and $21,085,947 gross unrealized depreciation.
28
|
| REPORT OF INDEPENDENT REGISTERED |
| PUBLIC ACCOUNTING FIRM |
|
| Shareholders and Board of Trustees |
| Dreyfus Variable Investment Fund, |
| Opportunistic Small Cap Portfolio |
We have audited the accompanying statement of assets and liabilities, including the statement of investments, of Dreyfus Variable Investment Fund, Opportunistic Small Cap Portfolio (one of the series comprising Dreyfus Variable Investment Fund) as of December 31, 2011, and the related statement of operations for the year then ended, the statement of changes in net assets for each of the two years in the period then ended, and financial highlights for each of the years indicated therein. These financial statements and financial highlights are the responsibility of the Fund’s management. Our responsibility is to express an opinion on these financial statements and financial highlights based on our audits.
We conducted our audits in accordance with the standards of the Public Company Accounting Oversight Board (United States).Those standards require that we plan and perform the audit to obtain reasonable assurance about whether the financial statements and financial highlights are free of material misstatement.We were not engaged to perform an audit of the Fund’s internal control over financial reporting. Our audits included consideration of internal control over financial reporting as a basis for designing audit procedures that are appropriate in the circumstances, but not for the purpose of expressing an opinion on the effectiveness of the Fund’s internal control over financial reporting. Accordingly, we express no such opinion.An audit also includes examining, on a test basis, evidence supporting the amounts and disclosures in the financial statements and financial highlights, assessing the accounting principles used and significant estimates made by management, and evaluating the overall financial statement presentation. Our procedures included confirmation of securities owned as of December 31, 2011 by correspondence with the custodian and others.We believe that our audits provide a reasonable basis for our opinion.
In our opinion, the financial statements and financial highlights referred to above present fairly, in all material respects, the financial position of DreyfusVariable Investment Fund, Opportunistic Small Cap Portfolio at December 31, 2011, the results of its operations for the year then ended, the changes in its net assets for each of the two years in the period then ended, and the financial highlights for each of the indicated years, in conformity with U.S. generally accepted accounting principles.

|
| New York, New York |
| February 10, 2012 |
IMPORTANT TAX INFORMATION (Unaudited)
For federal tax purposes, the fund hereby designates 100% of the ordinary dividends paid during the fiscal year ended December 31, 2011 as qualifying for the corporate dividends received deduction. Shareholders will receive notification in early 2012 of the percentage applicable to the preparation of their 2011 income tax returns.
30
BOARD MEMBERS INFORMATION (Unaudited)
|
| Joseph S. DiMartino (68) |
| Chairman of the Board (1995) |
| Principal Occupation During Past 5Years: |
| • Corporate Director and Trustee |
| Other Public Company Board Memberships During Past 5Years: |
| • CBIZ (formerly, Century Business Services, Inc.), a provider of outsourcing functions for small |
| and medium size companies, Director (1997-present) |
| • Sunair Services Corporation, a provider of certain outdoor-related services to homes and |
| businesses, Director (2005-2009) |
| • The Newark Group, a provider of a national market of paper recovery facilities, paperboard |
| mills and paperboard converting plants, Director (2000-2010) |
| No. of Portfolios for which Board Member Serves: 164 |
| ——————— |
| Peggy C. Davis (68) |
| Board Member (2006) |
| Principal Occupation During Past 5Years: |
| • Shad Professor of Law, New York University School of Law |
| • Writer and teacher in the fields of evidence, constitutional theory, family law, social sciences |
| and the law, legal process and professional methodology and training |
| No. of Portfolios for which Board Member Serves: 53 |
| ——————— |
| David P. Feldman (72) |
| Board Member (1994) |
| Principal Occupation During Past 5Years: |
| • Corporate Director and Trustee |
| Other Public Company Board Memberships During Past 5Years: |
| • BBH Mutual Funds Group (4 registered mutual funds), Director (1992-present) |
| • QMed, Inc. a healthcare company, Director (1999-2007) |
| No. of Portfolios for which Board Member Serves: 49 |
BOARD MEMBERS INFORMATION (Unaudited) (continued)
|
| Ehud Houminer (71) |
| Board Member (2006) |
| Principal Occupation During Past 5Years: |
| • Executive-in-Residence at the Columbia Business School, Columbia University (1992-present) |
| Other Public Company Board Memberships During Past 5Years: |
| • Avnet Inc., an electronics distributor, Director (1993-present) |
| No. of Portfolios for which Board Member Serves: 63 |
| ——————— |
| Dr. Martin Peretz (72) |
| Board Member (1990) |
| Principal Occupation During Past 5Years: |
| • Editor-in-Chief Emeritus of The New Republic Magazine (2010-present) (previously, |
| Editor-in-Chief, 1974-2010) |
| • Director of TheStreet.com, a financial information service on the web (1996-present) |
| No. of Portfolios for which Board Member Serves: 35 |
| ——————— |
Once elected all Board Members serve for an indefinite term, but achieve Emeritus status upon reaching age 80.The address of the Board Members and Officers is in c/o The Dreyfus Corporation, 200 Park Avenue, NewYork, NewYork 10166.Additional information about the Board Members is available in the fund’s Statement of Additional Information which can be obtained from Dreyfus free of charge by calling this toll free number: 1-800-DREYFUS.
James F. Henry, Emeritus Board Member
Rosalind G. Jacobs, Emeritus Board Member
Dr. Paul A. Marks, Emeritus Board Member
Gloria Messinger, Emeritus Board Member
32
OFFICERS OF THE FUND (Unaudited)
BRADLEY J. SKAPYAK, President since January 2010.
Chief Operating Officer and a director of the Manager since June 2009. From April 2003 to June 2009, Mr. Skapyak was the head of the Investment Accounting and Support Department of the Manager. He is an officer of 75 investment companies (comprised of 163 portfolios) managed by the Manager. He is 53 years old and has been an employee of the Manager since February 1988.
JANETTE E. FARRAGHER, Vice President and Secretary since December 2011.
Assistant General Counsel of BNY Mellon, and an officer of 76 investment companies (comprised of 189 portfolios) managed by the Manager. She is 49 years old and has been an employee of the Manager since February 1984.
KIESHA ASTWOOD, Vice President and Assistant Secretary since January 2010.
Counsel of BNY Mellon, and an officer of 76 investment companies (comprised of 189 portfolios) managed by the Manager. She is 38 years old and has been an employee of the Manager since July 1995.
JAMES BITETTO, Vice President and Assistant Secretary since August 2005.
Senior Counsel of BNY Mellon and Secretary of the Manager, and an officer of 76 investment companies (comprised of 189 portfolios) managed by the Manager. He is 45 years old and has been an employee of the Manager since December 1996.
JONI LACKS CHARATAN, Vice President and Assistant Secretary since August 2005.
Senior Counsel of BNY Mellon, and an officer of 76 investment companies (comprised of 189 portfolios) managed by the Manager. She is 56 years old and has been an employee of the Manager since October 1988.
JOSEPH M. CHIOFFI, Vice President and Assistant Secretary since August 2005.
Senior Counsel of BNY Mellon, and an officer of 76 investment companies (comprised of 189 portfolios) managed by the Manager. He is 50 years old and has been an employee of the Manager since June 2000.
KATHLEEN DENICHOLAS, Vice President and Assistant Secretary since January 2010.
Managing Counsel of BNY Mellon, and an officer of 76 investment companies (comprised of 189 portfolios) managed by the Manager. She is 37 years old and has been an employee of the Manager since February 2001.
JOHN B. HAMMALIAN, Vice President and Assistant Secretary since August 2005.
Senior Managing Counsel of BNY Mellon, and an officer of 76 investment companies (comprised of 189 portfolios) managed by the Manager. He is 48 years old and has been an employee of the Manager since February 1991.
M. CRISTINA MEISER, Vice President and Assistant Secretary since January 2010.
Senior Counsel of BNY Mellon, and an officer of 76 investment companies (comprised of 189 portfolios) managed by the Manager. She is 41 years old and has been an employee of the Manager since August 2001.
ROBERT R. MULLERY, Vice President and Assistant Secretary since August 2005.
Managing Counsel of BNY Mellon, and an officer of 76 investment companies (comprised of 189 portfolios) managed by the Manager. He is 59 years old and has been an employee of the Manager since May 1986.
OFFICERS OF THE FUND (Unaudited) (continued)
JEFF PRUSNOFSKY, Vice President and Assistant Secretary since August 2005.
Senior Managing Counsel of BNY Mellon, and an officer of 76 investment companies (comprised of 189 portfolios) managed by the Manager. He is 46 years old and has been an employee of the Manager since October 1990.
JAMES WINDELS, Treasurer since November 2001.
Director – Mutual Fund Accounting of the Manager, and an officer of 76 investment companies (comprised of 189 portfolios) managed by the Manager. He is 53 years old and has been an employee of the Manager since April 1985.
RICHARD CASSARO, Assistant Treasurer since January 2008.
Senior Accounting Manager – Money Market and Municipal Bond Funds of the Manager, and an officer of 76 investment companies (comprised of 189 portfolios) managed by the Manager. He is 52 years old and has been an employee of the Manager since September 1982.
GAVIN C. REILLY, Assistant Treasurer since December 2005.
Tax Manager of the Investment Accounting and Support Department of the Manager, and an officer of 76 investment companies (comprised of 189 portfolios) managed by the Manager. He is 43 years old and has been an employee of the Manager since April 1991.
ROBERT S. ROBOL, Assistant Treasurer since August 2003.
Senior Accounting Manager – Fixed Income Funds of the Manager, and an officer of 76 investment companies (comprised of 189 portfolios) managed by the Manager. He is 47 years old and has been an employee of the Manager since October 1988.
ROBERT SALVIOLO, Assistant Treasurer since July 2007.
Senior Accounting Manager – Equity Funds of the Manager, and an officer of 76 investment companies (comprised of 189 portfolios) managed by the Manager. He is 44 years old and has been an employee of the Manager since June 1989.
ROBERT SVAGNA, Assistant Treasurer since December 2002.
Senior Accounting Manager – Equity Funds of the Manager, and an officer of 76 investment companies (comprised of 189 portfolios) managed by the Manager. He is 44 years old and has been an employee of the Manager since November 1990.
JOSEPH W. CONNOLLY, Chief Compliance Officer since October 2004.
Chief Compliance Officer of the Manager and The Dreyfus Family of Funds (76 investment companies, comprised of 189 portfolios). From November 2001 through March 2004, Mr. Connolly was first Vice-President, Mutual Fund Servicing for Mellon Global Securities Services. In that capacity, Mr. Connolly was responsible for managing Mellon’s Custody, Fund Accounting and Fund Administration services to third-party mutual fund clients. He is 54 years old and has served in various capacities with the Manager since 1980, including manager of the firm’s Fund Accounting Department from 1997 through October 2001.
STEPHEN J. STOREN, Anti-Money Laundering Compliance Officer since May 2011.
Chief Compliance Officer of the Distributor, and the Anti-Money Laundering Compliance Officer of 72 investment companies (comprised of 185 portfolios) managed by the Manager. He is 57 years old and has been an employee of the Distributor since October 1999.
34
For More Information
The fund files its complete schedule of portfolio holdings with the Securities and Exchange Commission (“SEC”) for the first and third quarters of each fiscal year on Form N-Q. The fund’s Forms N-Q are available on the SEC’s website at http://www.sec.gov and may be reviewed and copied at the SEC’s Public Reference Room in Washington, DC. Information on the operation of the Public Reference Room may be obtained by calling 1-800-SEC-0330.
A description of the policies and procedures that the fund uses to determine how to vote proxies relating to portfolio securities, and information regarding how the fund voted these proxies for the most recent 12-month period ended June 30 is available at http://www.dreyfus.com and on the SEC’s website at http://www.sec.gov. The description of the policies and procedures is also available without charge, upon request, by calling 1-800-DREYFUS.

|
| Dreyfus Variable |
| Investment Fund, |
| Quality Bond Portfolio |

The views expressed in this report reflect those of the portfolio manager only through the end of the period covered and do not necessarily represent the views of Dreyfus or any other person in the Dreyfus organization. Any such views are subject to change at any time based upon market or other conditions and Dreyfus disclaims any responsibility to update such views.These views may not be relied on as investment advice and, because investment decisions for a Dreyfus fund are based on numerous factors, may not be relied on as an indication of trading intent on behalf of any Dreyfus fund.
|
| Not FDIC-Insured • Not Bank-Guaranteed • May Lose Value |
| | Contents |
| | THE FUND |
| 2 | A Letter from the Chairman and CEO |
| 3 | Discussion of Fund Performance |
| 6 | Fund Performance |
| 8 | Understanding Your Fund’s Expenses |
| 8 | Comparing Your Fund’s Expenses With Those of Other Funds |
| 9 | Statement of Investments |
| 20 | Statement of Options Written |
| 21 | Statement of Assets and Liabilities |
| 22 | Statement of Operations |
| 23 | Statement of Changes in Net Assets |
| 25 | Financial Highlights |
| 27 | Notes to Financial Statements |
| 43 | Report of Independent Registered Public Accounting Firm |
| 44 | Board Members Information |
| 46 | Officers of the Fund |
| | FOR MORE INFORMATION |
| | Back Cover |
Dreyfus Variable Investment Fund,
Quality Bond Portfolio
The Fund

A LETTER FROM THE CHAIRMAN AND CEO
Dear Shareholder:
We are pleased to present this annual report for Dreyfus Variable Investment Fund, Quality Bond Portfolio, covering the 12-month period from January 1, 2011, through December 31, 2011. For information about how the fund performed during the reporting period, as well as general market perspectives, we provide a Discussion of Fund Performance on the pages that follow.
U.S. bond markets in 2011 were primarily driven by a “flight to quality” in which investors fled riskier assets due to adverse macroeconomic developments ranging from natural disasters in Japan to an unprecedented downgrade of long-term U.S. debt securities and the resurgence of a sovereign debt crisis in Europe. Ironically, despite the rating downgrade, long-term U.S.Treasury securities ended the year with double-digit total returns as investors flocked to traditional safe havens. Corporate-backed bonds also fared well, but to a lesser degree than Treasuries, as investors sought competitive yields in a low interest-rate environment.
Our economic forecast calls for a mild acceleration of the U.S. recovery as the domestic banking system regains strength, credit conditions loosen and housing markets begin a long-awaited convalescence. In addition, we believe that long-term fundamentals currently appear to favor U.S. non-financial corporate credit, as well as emerging-markets local currency-denominated debt. Of course, we encourage you to talk with your financial adviser to help ensure that your investment objectives are properly aligned with your risk tolerance in pursuing potential market opportunities in 2012.
Thank you for your continued confidence and support.
2

DISCUSSION OF FUND PERFORMANCE
For the period of January 1, 2011, through December 31, 2011, as provided by David Bowser, CFA, and Peter Vaream, Portfolio Managers
Fund and Market Performance Overview
For the 12-month period ended December 31, 2011, Dreyfus Variable Investment Fund, Quality Bond Portfolio’s Initial shares achieved a total return of 7.04%, and its Service shares achieved a total return of 6.78%.1 The Barclays Capital U.S. Aggregate Bond Index (the “Index”), the fund’s benchmark, achieved a total return of 7.84% for the same period.2
U.S. government securities rallied strongly over much of 2011 when economic uncertainty intensified amid a subpar U.S. economic recovery and a sovereign debt crisis in Europe, causing a flight to traditional safe havens among investors. In contrast, higher yielding sectors of the bond market produced more modest returns. The fund produced lower returns than its benchmark, primarily due to allocations to higher yielding bonds and a relatively short average duration.
The Fund’s Investment Approach
The fund seeks to maximize total return consisting of capital appreciation and current income.To pursue this goal, the fund normally invests at least 80% of its net assets in bonds, including corporate bonds, debentures, notes, mortgage-related securities, collateralized mortgage obligations and asset-backed securities, convertible debt obligations, preferred stocks, convertible preferred stocks, municipal obligations and zero coupon bonds, that, when purchased, are A-rated or better or what we believe are the unrated equivalent, and in securities issued or guaranteed by the U.S. government or its agencies or its instrumentalities. The fund may also invest in fixed income securities rated lower than A (but not lower than B), up to 10% of its net assets in bonds issued by foreign issuers that are denominated in foreign currencies, and up to 20% of its net assets in bonds of foreign issuers whether denominated in U.S. dollars or in a foreign currency.
Government Securities Rallied Amid Economic Uncertainty
Improvements in U.S. economic data supported prices of higher yielding bonds at the start of 2011, but investor confidence deteriorated in
DISCUSSION OF FUND PERFORMANCE (continued)
the spring when Greece appeared headed for default on its sovereign debt and the crisis spread to other European nations. In addition, U.S. economic data proved more disappointing than expected, and investors reacted cautiously to a contentious political debate regarding U.S. government spending and borrowing.These developments sparked a shift away from riskier assets and toward traditional safe havens, causing U.S. government bond prices to rise and their yields to fall. Long-term U.S. government bonds benefited more from the rally than their shorter-term counterparts. Meanwhile, investment-grade and high yield corporate bonds suffered declines, erasing their earlier gains.
Economic data and investor confidence seemed to improve from October through December, when it became more apparent that the U.S. economic expansion remained intact and the European Union seemed to make some progress in addressing the region’s problems.As a result, U.S. government securities gave back some of their previous gains. Corporate-backed securities rallied to a degree over the final months of the reporting period, enabling them to end the year with positive total returns, on average.
Constructive Investment Posture Dampened Relative Results
The fund’s results compared to the benchmark were undermined by our expectations of a more robust U.S. economy, which led us to establish overweighted positions in riskier market sectors, including high yield securities and dollar-denominated bonds issued by governments in the emerging markets. These securities generally lagged the robust returns provided by long-term U.S. government securities during the flight to quality. In addition, we had set the fund’s average duration in a position we considered slightly shorter than market averages in anticipation of potentially higher interest rates. However, this strategy prevented the fund from participating more fully in the remarkable gains of U.S. Treasury securities and, to a lesser extent, U.S. government agency securities.
The fund achieved better results from high-quality commercial mortgage-backed securities and asset-backed securities, which fared quite well during 2011. Our security selection strategy among residential mortgage-backed securities also added value, as we favored higher coupon mortgages that benefited from low prepayment activity stemming from depressed home prices and tight lending standards.
4
Positioned for a Slow-Growth Environment
We currently expect the U.S. economic recovery to persist, but at a more sluggish pace than historical norms, as the concerns that weighed on investor sentiment in 2011 may be slow to recede. Nonetheless, we have maintained a mild emphasis on higher yielding securities, particularly residential mortgage-backed securities that, in our view, are likely to benefit from the Federal Reserve Board’s efforts to stimulate the U.S. economy. We also have favored commercial mortgages, asset-backed securities and corporate credits that have little exposure to Europe’s troubles.The fund’s high yield holdings are concentrated among shorter-term securities toward the upper end of the sector’s credit-quality spectrum. In our view, these are prudent strategies until the economic outlook becomes clearer.
January 17, 2012
| |
| | Bond funds are subject generally to interest rate, credit, liquidity and market risks, to varying degrees, |
| | all of which are more fully described in the fund’s prospectus. Generally, all other factors being equal, |
| | bond prices are inversely related to interest-rate changes, and rate increases can cause price declines. |
| | Short sales involve selling a security the fund does not hold own in anticipation that the security’s |
| | price will decline. Short sales may involve substantial risk and leverage, and expose the fund to the |
| | risk that it will be required to buy the security sold short at a time when the security has appreciated |
| | in value, thus resulting in a loss to the fund. Leverage may magnify the fund’s gains or losses. |
| | Investments in foreign currencies are subject to the risk that those currencies will decline in value |
| | relative to the U.S. dollar, or, in the case of hedged positions, that the U.S. dollar will decline |
| | relative to the currency being hedged. Each of these risks could increase the fund’s volatility. |
| | High yield bonds are subject to increased credit risk and are considered speculative in terms of the |
| | issuer’s perceived ability to continue making interest payments on a timely basis and to repay |
| | principal upon maturity. |
| | The fund may use derivative instruments, such as options, futures and options on futures, forward |
| | contracts, swaps (including credit default swaps on corporate bonds and asset-backed securities), |
| | options on swaps and other credit derivatives.A small investment in derivatives could have a |
| | potentially large impact on the fund’s performance. |
| | The fund is only available as a funding vehicle under variable life insurance policies or variable |
| | annuity contracts issued by insurance companies. Individuals may not purchase shares of the fund |
| | directly.A variable annuity is an insurance contract issued by an insurance company that enables |
| | investors to accumulate assets on a tax-deferred basis for retirement or other long-term goals. |
| 1 | Total return includes reinvestment of dividends and any capital gains paid. Past performance is no |
| | guarantee of future results. Share price and investment return fluctuate such that upon redemption |
| | fund shares may be worth more or less than their original cost.The fund’s performance does not |
| | reflect the deduction of additional charges and expenses imposed in connection with investing in |
| | variable insurance contracts, which will reduce returns. |
| 2 | SOURCE: LIPPER INC. — Reflects reinvestment of dividends and, where applicable, capital |
| | gain distributions.The Barclays Capital U.S.Aggregate Bond Index is a widely accepted, |
| | unmanaged total return index of corporate, U.S. government and U.S. government agency debt |
| | instruments, mortgage-backed securities and asset-backed securities with an average maturity of 1- |
| | 10 years.The Index does not include fees and expenses to which the fund is subject. Investors |
| | cannot invest directly in any index. |
FUND PERFORMANCE
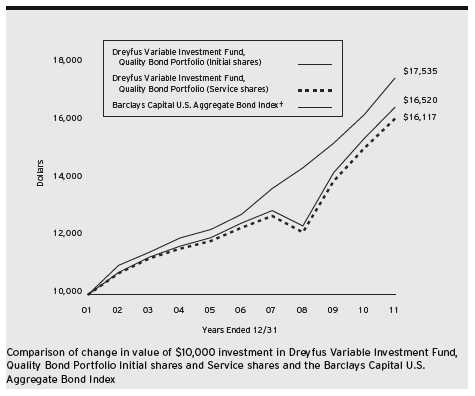
| | | | | | |
| Average Annual Total Returns as of 12/31/11 | | | |
| | 1Year | 5 Years | 10 Years |
| Initial shares | 7.04% | 5.76% | 5.15% |
| Service shares | 6.78% | 5.50% | 4.89% |
| Barclays Capital U.S. Aggregate Bond Index | 7.84% | 6.50% | 5.78% |
|
| † Source: Lipper Inc. |
| Past performance is not predictive of future performance.The fund’s performance shown in the graph and table does not |
| reflect the deduction of taxes that a shareholder would pay on fund distributions or the redemption of fund shares. |
| The fund’s performance does not reflect the deduction of additional charges and expenses imposed in connection |
| with investing in variable insurance contracts which will reduce returns. |
| The above graph compares a $10,000 investment made in Initial and Service shares of Dreyfus Variable Investment |
| Fund, Quality Bond Portfolio on 12/31/01 to a $10,000 investment made in the Barclays Capital U.S.Aggregate |
| Bond Index (the “Index”) on that date. |
6
The fund’s Initial shares are not subject to a Rule 12b-1 fee.The fund’s Service shares are subject to a 0.25% annual Rule 12b-1 fee.All dividends and capital gain distributions are reinvested.
The fund’s performance shown in the line graph above takes into account all applicable fund fees and expenses.The Index is a widely accepted, unmanaged index of corporate, U.S. government and U.S. government agency debt instruments, mortgage-backed securities and asset-backed securities with an average maturity of 1-10 years. Unlike a mutual fund, the Index is not subject to charges, fees and other expenses. Investors cannot invest directly in any index. Further information relating to fund performance, including expense reimbursements, if applicable, is contained in the Financial Highlights section of the prospectus and elsewhere in this report.
UNDERSTANDING YOUR FUND’S EXPENSES (Unaudited)
As a mutual fund investor, you pay ongoing expenses, such as management fees and other expenses. Using the information below, you can estimate how these expenses affect your investment and compare them with the expenses of other funds.You also may pay one-time transaction expenses, including sales charges (loads), redemption fees and expenses associated with variable annuity or insurance contracts, which are not shown in this section and would have resulted in higher total expenses. For more information, see your fund’s prospectus or talk to your financial adviser.
Review your fund’s expenses
The table below shows the expenses you would have paid on a $1,000 investment in Dreyfus Variable Investment Fund, Quality Bond Portfolio from July 1, 2011 to December 31, 2011. It also shows how much a $1,000 investment would be worth at the close of the period, assuming actual returns and expenses.
Expenses and Value of a $1,000 Investment
assuming actual returns for the six months ended December 31, 2011
| | | | |
| | | Initial Shares | | Service Shares |
| Expenses paid per $1,000† | | $4.12 | | $5.40 |
| Ending value (after expenses) | | $1,042.40 | | $1,040.90 |
COMPARING YOUR FUND’S EXPENSES
WITH THOSE OF OTHER FUNDS (Unaudited)
Using the SEC’s method to compare expenses
The Securities and Exchange Commission (SEC) has established guidelines to help investors assess fund expenses. Per these guidelines, the table below shows your fund’s expenses based on a $1,000 investment, assuming a hypothetical 5% annualized return. You can use this information to compare the ongoing expenses (but not transaction expenses or total cost) of investing in the fund with those of other funds.All mutual fund shareholder reports will provide this information to help you make this comparison. Please note that you cannot use this information to estimate your actual ending account balance and expenses paid during the period.
Expenses and Value of a $1,000 Investment
assuming a hypothetical 5% annualized return for the six months ended December 31, 2011
| | | | |
| | | Initial Shares | | Service Shares |
| Expenses paid per $1,000† | | $4.08 | | $5.35 |
| Ending value (after expenses) | | $1,021.17 | | $1,019.91 |
|
| † Expenses are equal to the fund’s annualized expense ratio of .80% for Initial shares and 1.05% for Service shares, |
| multiplied by the average account value over the period, multiplied by 184/365 (to reflect the one-half year period). |
8
|
| STATEMENT OF INVESTMENTS |
| December 31, 2011 |
| | | | | |
| | Coupon | Maturity | Principal | | |
| Bonds and Notes—123.4% | Rate (%) | Date | Amount ($)a | Value ($) |
| Agriculture—.5% | | | | | |
| Altria Group, | | | | | |
| Gtd. Notes | 10.20 | 2/6/39 | 335,000 | | 522,883 |
| Asset-Backed Ctfs./ | | | | | |
| Auto Receivables—4.6% | | | | | |
| Ally Auto Receivables Trust, | | | | | |
| Ser. 2010-1, Cl. B | 3.29 | 3/15/15 | 440,000 | b | 454,927 |
| Americredit Automobile Receivables | | | | | |
| Trust, Ser. 2010-3, Cl. C | 3.34 | 4/8/16 | 205,000 | | 206,595 |
| Americredit Automobile Receivables | | | | | |
| Trust, Ser. 2011-5, Cl. D | 5.05 | 12/8/17 | 490,000 | | 492,818 |
| Americredit Automobile Receivables | | | | | |
| Trust, Ser. 2010-1, Cl. C | 5.19 | 8/17/15 | 155,000 | | 160,465 |
| Americredit Prime Automobile | | | | | |
| Receivable, Ser. 2007-1, Cl. E | 6.96 | 3/8/16 | 250,166 | b | 250,441 |
| Carmax Auto Owner Trust, | | | | | |
| Ser. 2010-1, Cl. B | 3.75 | 12/15/15 | 110,000 | | 113,296 |
| Carmax Auto Owner Trust, | | | | | |
| Ser. 2010-2, Cl. B | 3.96 | 6/15/16 | 265,000 | | 275,632 |
| Chrysler Financial Auto | | | | | |
| Securitization Trust, | | | | | |
| Ser. 2010-A, Cl. C | 2.00 | 1/8/14 | 705,000 | | 705,469 |
| Franklin Auto Trust, | | | | | |
| Ser. 2008-A, Cl. B | 6.10 | 5/20/16 | 317,722 | b | 319,390 |
| JPMorgan Auto Receivables Trust, | | | | | |
| Ser. 2008-A, Cl. CFTS | 5.22 | 7/15/15 | 139,348 | b | 138,253 |
| Santander Drive Auto Receivables | | | | | |
| Trust, Ser. 2010-2, Cl. B | 2.24 | 12/15/14 | 150,000 | | 149,659 |
| Santander Drive Auto Receivables | | | | | |
| Trust, Ser. 2010-3, Cl. C | 3.06 | 11/15/17 | 245,000 | | 245,015 |
| Santander Drive Auto Receivables | | | | | |
| Trust, Ser. 2011-1, Cl. C | 3.11 | 5/16/16 | 475,000 | | 468,555 |
| Smart Trust, | | | | | |
| Ser. 2011-1USA, Cl. A3B | 1.13 | 10/14/14 | 465,000 | b,c | 464,311 |
| | | | | | 4,444,826 |
| Asset-Backed Ctfs./Credit Cards—1.4% | | | | |
| Citibank Omni Master Trust, | | | | | |
| Ser. 2009-A14A, Cl. A14 | 3.03 | 8/15/18 | 1,300,000 | b,c | 1,364,635 |
STATEMENT OF INVESTMENTS (continued)
| | | | | |
| | Coupon | Maturity | Principal | | |
| Bonds and Notes (continued) | Rate (%) | Date | Amount ($)a | Value ($) |
| Asset-Backed Ctfs./ | | | | | |
| Home Equity Loans—.6% | | | | | |
| Ameriquest Mortgage Securities, | | | | | |
| Ser. 2003-11, Cl. AF6 | 5.64 | 12/25/33 | 292,466 | c | 292,413 |
| Citicorp Residential Mortgage | | | | | |
| Securities, Ser. 2006-1, Cl. A3 | 5.71 | 7/25/36 | 73,036 | c | 73,173 |
| First Franklin Mortgage Loan Asset | | | | | |
| Backed Certificates, | | | | | |
| Ser. 2005-FF2, Cl. M1 | 0.69 | 3/25/35 | 38,520 | c | 38,333 |
| JP Morgan Mortgage Acquisition, | | | | | |
| Ser. 2006-CH2, Cl. AV2 | 0.34 | 10/25/36 | 11,256 | c | 11,166 |
| Park Place Securities, | | | | | |
| Ser. 2004-WCW1, Cl. M1 | 0.92 | 9/25/34 | 56,850 | c | 56,309 |
| Residential Asset Securities, | | | | | |
| Ser. 2005-EMX4, Cl. A2 | 0.55 | 11/25/35 | 62,790 | c | 61,936 |
| | | | | | 533,330 |
| Banks—3.4% | | | | | |
| Bank of America, | | | | | |
| Sr. Unscd. Notes | 5.63 | 7/1/20 | 270,000 | | 249,818 |
| Citigroup, | | | | | |
| Sr. Unscd. Notes | 4.50 | 1/14/22 | 225,000 | | 216,886 |
| Citigroup, | | | | | |
| Sr. Unscd. Notes | 5.38 | 8/9/20 | 230,000 | | 236,908 |
| Citigroup, | | | | | |
| Sr. Unscd. Notes | 5.50 | 4/11/13 | 490,000 | | 500,405 |
| Goldman Sachs Group, | | | | | |
| Sr. Unscd. Notes | 5.25 | 7/27/21 | 245,000 | | 239,450 |
| JPMorgan Chase & Co., | | | | | |
| Sr. Unscd. Notes | 6.00 | 1/15/18 | 175,000 | | 195,493 |
| JPMorgan Chase & Co., | | | | | |
| Sr. Unscd. Notes | 4.35 | 8/15/21 | 605,000 | | 612,187 |
| Morgan Stanley, | | | | | |
| Sr. Unscd. Notes | 5.30 | 3/1/13 | 240,000 | | 243,006 |
| Morgan Stanley, | | | | | |
| Sr. Unscd. Notes | 5.50 | 7/28/21 | 190,000 | | 175,999 |
| NB Capital Trust IV, | | | | | |
| Gtd. Cap. Secs | 8.25 | 4/15/27 | 620,000 | | 575,050 |
| | | | | | 3,245,202 |
10
| | | | | |
| | Coupon | Maturity | Principal | | |
| Bonds and Notes (continued) | Rate (%) | Date | Amount ($)a | Value ($) |
| Commercial Mortgage | | | | | |
| Pass-Through Ctfs.—4.1% | | | | | |
| Bear Stearns Commercial Mortgage | | | | | |
| Securities, Ser. 2006-PW12, | | | | | |
| Cl. AAB | 5.88 | 9/11/38 | 386,318 | c | 411,299 |
| Credit Suisse First Boston Mortgage | | | | | |
| Securities, Ser. 2005-C4, | | | | | |
| Cl. AAB | 5.07 | 8/15/38 | 253,058 | c | 257,728 |
| Extended Stay America Trust, | | | | | |
| Ser. 2010-ESHA, Cl. A | 2.95 | 11/5/27 | 132,296 | b | 132,958 |
| GS Mortgage Securities Corporation | | | | | |
| II, Ser. 2007-EOP, Cl. B | 1.84 | 3/6/20 | 1,065,000 | b,c | 1,037,155 |
| GS Mortgage Securities Corporation | | | | | |
| II, Ser. 2007-EOP, Cl. E | 2.67 | 3/6/20 | 395,000 | b,c | 382,695 |
| GS Mortgage Securities Corporation | | | | | |
| II, Ser. 2007-EOP, Cl. K | 5.33 | 3/6/20 | 225,000 | b,c | 221,391 |
| JP Morgan Chase Commercial | | | | | |
| Mortgage Securities, | | | | | |
| Ser. 2011-C3, Cl. A4 | 4.72 | 2/15/46 | 485,000 | b | 534,961 |
| JP Morgan Chase Commercial | | | | | |
| Mortgage Securities, | | | | | |
| Ser. 2005-LDP5, Cl. A2 | 5.20 | 12/15/44 | 725,000 | | 730,091 |
| Merrill Lynch Mortgage Trust, | | | | | |
| Ser. 2005-LC1, Cl. A2 | 5.20 | 1/12/44 | 56,651 | c | 56,626 |
| Wachovia Bank Commercial Mortgage | | | | | |
| Trust, Ser. 2005-C16, Cl. A2 | 4.38 | 10/15/41 | 22,840 | | 22,827 |
| WF-RBS Commercial Mortgage Trust, | | | | | |
| Ser. 2011-C5, Cl. A4 | 3.67 | 11/15/44 | 145,000 | | 151,664 |
| | | | | | 3,939,395 |
| Diversified Financial Services—4.2% | | | | | |
| American Express, | | | | | |
| Sr. Unscd. Notes | 7.25 | 5/20/14 | 110,000 | | 122,913 |
| Ameriprise Financial, | | | | | |
| Sr. Unscd. Notes | 7.30 | 6/28/19 | 270,000 | | 324,268 |
| Discover Financial Services, | | | | | |
| Sr. Unscd. Notes | 10.25 | 7/15/19 | 299,000 | | 364,967 |
| ERAC USA Finance, | | | | | |
| Gtd. Notes | 5.60 | 5/1/15 | 98,000 | b | 107,260 |
STATEMENT OF INVESTMENTS (continued)
| | | | | |
| | Coupon | Maturity | Principal | | |
| Bonds and Notes (continued) | Rate (%) | Date | Amount ($)a | Value ($) |
| Diversified Financial | | | | | |
| Services (continued) | | | | | |
| ERAC USA Finance, | | | | | |
| Gtd. Notes | 6.38 | 10/15/17 | 120,000 | b | 138,837 |
| Ford Motor Credit, | | | | | |
| Sr. Unscd. Notes | 5.00 | 5/15/18 | 365,000 | | 366,859 |
| General Electric Capital, | | | | | |
| Sr. Unscd. Notes | 1.01 | 4/7/14 | 520,000 | c | 508,563 |
| General Electric Capital, | | | | | |
| Sr. Unscd. Notes | 6.88 | 1/10/39 | 730,000 | | 877,505 |
| International Lease Finance, | | | | | |
| Sr. Unscd. Notes | 6.63 | 11/15/13 | 250,000 | d | 250,000 |
| Invesco, | | | | | |
| Gtd. Notes | 5.38 | 2/27/13 | 250,000 | | 259,905 |
| Merrill Lynch & Co., | | | | | |
| Sub. Notes | 5.70 | 5/2/17 | 740,000 | | 680,366 |
| | | | | | 4,001,443 |
| Electric Utilities—2.2% | | | | | |
| AES, | | | | | |
| Sr. Unscd. Notes | 8.00 | 10/15/17 | 215,000 | | 237,575 |
| Consolidated Edison of NY, | | | | | |
| Sr. Unscd. Debs., Ser. 06-D | 5.30 | 12/1/16 | 400,000 | | 467,263 |
| Consumers Energy, | | | | | |
| First Mortgage Bonds, Ser. O | 5.00 | 2/15/12 | 655,000 | | 658,071 |
| Nevada Power, | | | | | |
| Mortgage Notes, Ser. R | 6.75 | 7/1/37 | 265,000 | | 362,950 |
| Nisource Finance, | | | | | |
| Gtd. Notes | 4.45 | 12/1/21 | 245,000 | | 250,836 |
| Sierra Pacific Power, | | | | | |
| Mortgage Notes, Ser. P | 6.75 | 7/1/37 | 130,000 | | 178,051 |
| | | | | | 2,154,746 |
| Food, Beverage & Tobacco—.6% | | | | | |
| Altria Group, | | | | | |
| Gtd. Notes | 9.70 | 11/10/18 | 180,000 | | 242,497 |
| Kraft Foods, | | | | | |
| Sr. Unscd. Notes | 6.13 | 2/1/18 | 305,000 | | 357,972 |
| | | | | | 600,469 |
12
| | | | | | |
| | | Coupon | Maturity | Principal | | |
| Bonds and Notes (continued) | Rate (%) | Date | Amount ($)a | Value ($) |
| Foreign/Governmental—2.8% | | | | | | |
| Corp Andina De Formento, | | | | | | |
| Sr. Unscd. Notes | | 3.75 | 1/15/16 | 275,000 | | 280,612 |
| Mexican Government, | | | | | | |
| Bonds | MXN | 6.50 | 6/10/21 | 26,370,000 | | 1,896,392 |
| Province of Quebec Canada, | | | | | | |
| Unscd. Notes | | 4.60 | 5/26/15 | 305,000 | d | 339,680 |
| Republic of Korea, | | | | | | |
| Sr. Unscd. Notes | | 7.13 | 4/16/19 | 110,000 | | 137,803 |
| | | | | | | 2,654,487 |
| Health Care—1.3% | | | | | | |
| Amgen, | | | | | | |
| Sr. Unscd. Notes | | 3.88 | 11/15/21 | 375,000 | | 379,190 |
| Aristotle Holding, | | | | | | |
| Gtd. Notes | | 4.75 | 11/15/21 | 245,000 | b | 254,017 |
| Biomet, | | | | | | |
| Gtd. Notes | | 10.00 | 10/15/17 | 175,000 | | 189,875 |
| Gilead Sciences, | | | | | | |
| Sr. Unscd. Notes | | 4.40 | 12/1/21 | 205,000 | | 217,460 |
| HCA, | | | | | | |
| Sr. Unscd. Notes | | 6.25 | 2/15/13 | 245,000 | | 251,125 |
| | | | | | | 1,291,667 |
| Industrial—.8% | | | | | | |
| CSX, | | | | | | |
| Sr. Unscd. Notes | | 4.75 | 5/30/42 | 225,000 | | 233,103 |
| Waste Management, | | | | | | |
| Sr. Unscd. Notes | | 7.00 | 7/15/28 | 210,000 | | 263,993 |
| Waste Management, | | | | | | |
| Gtd. Notes | | 7.38 | 5/15/29 | 200,000 | | 254,981 |
| | | | | | | 752,077 |
| Materials—2.7% | | | | | | |
| Dow Chemical, | | | | | | |
| Sr. Unscd. Notes | | 4.13 | 11/15/21 | 560,000 | | 575,540 |
| Dow Chemical, | | | | | | |
| Sr. Unscd. Notes | | 5.25 | 11/15/41 | 185,000 | | 195,341 |
| Ecolab, | | | | | | |
| Sr. Unscd. Notes | | 4.35 | 12/8/21 | 90,000 | | 96,305 |
STATEMENT OF INVESTMENTS (continued)
| | | | | |
| | Coupon | Maturity | Principal | | |
| Bonds and Notes (continued) | Rate (%) | Date | Amount ($)a | Value ($) |
| Materials (continued) | | | | | |
| Freeport-McMoRan Copper & Gold, | | | | | |
| Sr. Unscd. Notes | 8.38 | 4/1/17 | 325,000 | | 345,678 |
| Georgia-Pacific, | | | | | |
| Gtd. Notes | 8.25 | 5/1/16 | 345,000 | b | 383,403 |
| Holcim US Finance Sarl & Cie, | | | | | |
| Gtd. Notes | 6.00 | 12/30/19 | 305,000 | b | 314,790 |
| International Paper, | | | | | |
| Sr. Unscd. Notes | 4.75 | 2/15/22 | 225,000 | | 239,637 |
| Peabody Energy, | | | | | |
| Gtd. Notes | 6.25 | 11/15/21 | 210,000 | b | 218,400 |
| Teck Resources, | | | | | |
| Gtd. Notes | 6.25 | 7/15/41 | 185,000 | | 214,489 |
| | | | | | 2,583,583 |
| Media—3.6% | | | | | |
| Comcast, | | | | | |
| Gtd. Notes | 6.30 | 11/15/17 | 85,000 | | 100,664 |
| Cox Communications, | | | | | |
| Sr. Unscd. Notes | 6.25 | 6/1/18 | 405,000 | b | 472,267 |
| DirecTV Holdings, | | | | | |
| Gtd. Notes | 6.00 | 8/15/40 | 165,000 | | 180,636 |
| DirecTV Holdings, | | | | | |
| Gtd. Notes | 7.63 | 5/15/16 | 335,000 | | 355,848 |
| Dish DBS, | | | | | |
| Gtd. Notes | 6.75 | 6/1/21 | 135,000 | | 146,138 |
| Dish DBS, | | | | | |
| Gtd. Notes | 7.13 | 2/1/16 | 105,000 | | 113,663 |
| NBC Universal Media, | | | | | |
| Sr. Unscd. Notes | 4.38 | 4/1/21 | 270,000 | | 285,486 |
| NBC Universal Media, | | | | | |
| Sr. Unscd. Notes | 5.15 | 4/30/20 | 345,000 | | 384,772 |
| News America, | | | | | |
| Gtd. Notes | 4.50 | 2/15/21 | 195,000 | | 204,842 |
| News America, | | | | | |
| Gtd. Notes | 6.15 | 3/1/37 | 320,000 | | 350,959 |
| Pearson Dollar Finance Two, | | | | | |
| Gtd. Notes | 6.25 | 5/6/18 | 165,000 | b | 191,879 |
| Time Warner Cable, | | | | | |
| Gtd. Notes | 5.50 | 9/1/41 | 240,000 | | 253,859 |
14
| | | | |
| | Coupon | Maturity | Principal | |
| Bonds and Notes (continued) | Rate (%) | Date | Amount ($)a | Value ($) |
| Media (continued) | | | | |
| Time Warner Cable, | | | | |
| Gtd. Notes | 6.75 | 7/1/18 | 295,000 | 350,847 |
| Time Warner, | | | | |
| Gtd. Notes | 5.88 | 11/15/16 | 90,000 | 103,992 |
| | | | | 3,495,852 |
| Municipal Bonds—.9% | | | | |
| California, | | | | |
| GO (Build America Bonds) | 7.30 | 10/1/39 | 340,000 | 402,366 |
| Illinois, | | | | |
| GO | 4.42 | 1/1/15 | 200,000 | 207,602 |
| New York City, | | | | |
| GO (Build America Bonds) | 5.99 | 12/1/36 | 200,000 | 239,444 |
| | | | | 849,412 |
| Oil & Gas—2.5% | | | | |
| Anadarko Petroleum, | | | | |
| Sr. Unscd. Notes | 6.38 | 9/15/17 | 530,000 | 615,088 |
| Chesapeake Energy, | | | | |
| Gtd. Notes | 6.63 | 8/15/20 | 340,000 | 366,350 |
| El Paso, | | | | |
| Sr. Unscd. Notes | 7.25 | 6/1/18 | 225,000 | 247,477 |
| Kinder Morgan Energy Partners, | | | | |
| Sr. Unscd. Notes | 6.85 | 2/15/20 | 170,000 | 200,209 |
| Pemex Project Funding Master | | | | |
| Trust, Gtd. Bonds | 6.63 | 6/15/35 | 315,000 | 360,281 |
| Sempra Energy, | | | | |
| Sr. Unscd. Notes | 6.50 | 6/1/16 | 295,000 | 344,453 |
| Valero Energy, | | | | |
| Gtd. Notes | 6.13 | 2/1/20 | 240,000 | 267,389 |
| | | | | 2,401,247 |
| Property & Casualty | | | | |
| Insurance—2.2% | | | | |
| AON, | | | | |
| Sr. Unscd. Notes | 3.50 | 9/30/15 | 240,000 | 246,493 |
| Cincinnati Financial, | | | | |
| Sr. Unscd. Notes | 6.13 | 11/1/34 | 51,000 | 50,908 |
| Cincinnati Financial, | | | | |
| Sr. Unscd. Debs | 6.92 | 5/15/28 | 224,000 | 245,048 |
STATEMENT OF INVESTMENTS (continued)
| | | | | |
| | Coupon | Maturity | Principal | | |
| Bonds and Notes (continued) | Rate (%) | Date | Amount ($)a | | Value ($) |
| Property & Casualty | | | | | |
| Insurance (continued) | | | | | |
| MetLife, | | | | | |
| Sr. Unscd. Notes | 5.00 | 6/15/15 | 328,000 | | 357,606 |
| Principal Financial Group, | | | | | |
| Gtd. Notes | 8.88 | 5/15/19 | 235,000 | | 292,998 |
| Prudential Financial, | | | | | |
| Sr. Unscd. Notes | 5.38 | 6/21/20 | 460,000 | | 493,147 |
| Willis North America, | | | | | |
| Gtd. Notes | 6.20 | 3/28/17 | 155,000 | | 170,616 |
| Willis North America, | | | | | |
| Gtd. Notes | 7.00 | 9/29/19 | 185,000 | | 206,247 |
| | | | | | 2,063,063 |
| Real Estate—3.0% | | | | | |
| Boston Properties, | | | | | |
| Sr. Unscd. Notes | 5.00 | 6/1/15 | 240,000 | | 260,118 |
| DDR, | | | | | |
| Sr. Unscd. Notes | 4.75 | 4/15/18 | 340,000 | | 325,749 |
| Duke Realty, | | | | | |
| Sr. Unscd. Notes | 6.75 | 3/15/20 | 30,000 | | 32,968 |
| Duke Realty, | | | | | |
| Sr. Unscd. Notes | 8.25 | 8/15/19 | 285,000 | | 335,368 |
| ERP Operating, | | | | | |
| Sr. Unscd. Notes | 5.75 | 6/15/17 | 135,000 | | 149,856 |
| Federal Realty Investment Trust, | | | | | |
| Sr. Unscd. Notes | 6.00 | 7/15/12 | 100,000 | | 101,750 |
| Healthcare Realty Trust, | | | | | |
| Sr. Unscd. Notes | 5.13 | 4/1/14 | 330,000 | | 338,669 |
| Mack-Cali Realty, | | | | | |
| Sr. Unscd. Notes | 5.80 | 1/15/16 | 400,000 | | 432,067 |
| Regency Centers, | | | | | |
| Gtd. Notes | 5.25 | 8/1/15 | 66,000 | | 70,390 |
| Regency Centers, | | | | | |
| Gtd. Notes | 5.88 | 6/15/17 | 120,000 | | 130,833 |
| Simon Property Group, | | | | | |
| Sr. Unscd. Notes | 6.13 | 5/30/18 | 160,000 | | 183,928 |
| WEA Finance, | | | | | |
| Gtd. Notes | 7.13 | 4/15/18 | 435,000 | b | 486,788 |
| | | | | | 2,848,484 |
16
| | | | | | | | |
| | | Coupon | Maturity | Principal | | |
| | Bonds and Notes (continued) | Rate (%) | Date | Amount ($)a | | Value ($) |
| | Residential Mortgage | | | | | | |
| Pass-Through Ctfs.—.2% | | | | | | |
| | Credit Suisse First Boston Mortgage | | | | | | |
| | Securities, Ser. 2005-6, Cl. 1A2 | 0.56 | 7/25/35 | 168,395 | c | 151,039 |
| | Retail—1.0% | | | | | | |
| | CVS Pass-Through Trust, | | | | | | |
| | Pass Thru Certificates | 6.04 | 12/10/28 | 292,099 | | 304,802 |
| | CVS Pass-Through Trust, | | | | | | |
| | Pass Thru Certificates | 8.35 | 7/10/31 | 521,602 | b | 640,035 |
| | | | | | | | 944,837 |
| | Telecommunications—1.5% | | | | | | |
| | AT&T, | | | | | | |
| | Sr. Unscd. Notes | 5.60 | 5/15/18 | 295,000 | | 343,243 |
| | AT&T, | | | | | | |
| | Sr. Unscd. Notes | 6.55 | 2/15/39 | 315,000 | | 402,120 |
| | Cellco Partnership/Verizon | | | | | | |
| | Wireless Capital, | | | | | | |
| | Sr. Unscd. Notes | 5.55 | 2/1/14 | 310,000 | | 336,970 |
| | Verizon Communications, | | | | | | |
| | Sr. Unscd. Notes | 3.50 | 11/1/21 | 175,000 | | 182,575 |
| | Verizon Communications, | | | | | | |
| | Sr. Unscd. Notes | 4.75 | 11/1/41 | 155,000 | | 167,501 |
| | | | | | | | 1,432,409 |
| | U.S. Government Agencies/ | | | | | | |
| | Mortgage-Backed—34.0% | | | | | | |
| | Federal Home Loan Mortgage Corp.: | | | | | | |
| | 4.00% | | | 5,005,000 | e,f | 5,250,558 |
| | Multiclass Mortgage Participation Ctfs., | | | | | | |
| | REMIC, Ser. 2586, Cl. WE, | | | | | | |
| | 4.00%, 12/15/32 | | | 145,122 | f | 149,325 |
| | 5.50%, 10/1/39—9/1/40 | | | 411,542 | f | 449,006 |
| | Federal National Mortgage Association: | | | | | | |
| | 3.50% | | | 485,000 | e,f | 498,944 |
| | 4.00% | | | 8,330,000 | e,f | 8,753,008 |
| | 5.00% | | | 5,625,000 | e,f | 6,077,638 |
| | 5.50% | | | 3,900,000 | e,f | 4,237,557 |
| | 5.00%, 11/1/20—11/1/21 | | | 1,480,266 | f | 1,599,624 |
| | 5.50%, 9/1/34—8/1/40 | | | 593,988 | f | 648,267 |
| | 6.00%, 11/1/37—5/1/39 | | | 2,248,527 | f | 2,492,800 |
| | 7.00%, 6/1/29—9/1/29 | | | 36,784 | f | 42,931 |
STATEMENT OF INVESTMENTS (continued)
| | | | | |
| | | | Principal | | |
| | Bonds and Notes (continued) | | Amount ($)a | | Value ($) |
| | U.S. Government Agencies/ | | | | |
| | Mortgage-Backed (continued) | | | | |
| | Government National Mortgage Association I: | | | | |
| | 4.00% | | 855,000 | e | 914,716 |
| | 5.50%, 4/15/33—3/15/34 | | 1,317,601 | | 1,488,309 |
| | Government National Mortgage Association II; | | | | |
| | 7.00%, 9/20/28—7/20/29 | | 9,689 | | 11,288 |
| | | | | | 32,613,971 |
| | U.S. Government Securities—45.3% | | | | |
| | U.S. Treasury Bonds: | | | | |
| | 3.88%, 8/15/40 | | 3,250,000 | d | 3,896,445 |
| | 6.13%, 11/15/27 | | 465,000 | d | 691,179 |
| | U.S. Treasury Notes: | | | | |
| | 1.00%, 4/30/12 | | 2,610,000 | d | 2,618,563 |
| | 1.13%, 1/15/12 | | 21,290,000 | d | 21,300,815 |
| | 1.75%, 4/15/13 | | 1,650,000 | d | 1,683,000 |
| | 2.13%, 5/31/15 | | 7,520,000 | d | 7,940,067 |
| | 3.63%, 5/15/13 | | 5,025,000 | d | 5,258,979 |
| | | | | | 43,389,048 |
| | Total Bonds and Notes | | | | |
| | (cost $114,531,648) | | | | 118,278,105 |
| |
| | | | Face Amount | | |
| | | | Covered by | | |
| | Options Purchased—.1% | | Contracts ($) | | Value ($) |
| | Call Options; | | | | |
| | 5-Year USD LIBOR-BBA, | | | | |
| | February 2012 @ $1.43 | | | | |
| | (cost $38,147) | | 5,155,000 | g | 49,264 |
| |
| | | | Principal | | |
| Short-Term Investments—1.8% | | Amount ($) | | Value ($) |
| | U.S. Treasury Bills; | | | | |
| | 0.03%, 1/12/12 | | | | |
| | (cost $1,690,015) | | 1,690,000 | | 1,689,995 |
| |
| | Other Investment—.7% | | Shares | | Value ($) |
| | Registered Investment Company; | | | | |
| | Dreyfus Institutional Preferred | | | | |
| | Plus Money Market Fund | | | | |
| | (cost $713,835) | | 713,835 | h | 713,835 |
18
| | | | |
| Investment of Cash Collateral | | |
| for Securities Loaned—.6% | Shares | Value ($) |
| Registered Investment Company; | | |
| Dreyfus Institutional Cash Advantage Fund | | |
| (cost $605,200) | 605,200h | 605,200 |
| Total Investments (cost $117,578,845) | 126.6% | 121,336,399 |
| Liabilities, Less Cash and Receivables | (26.6%) | (25,489,022) |
| Net Assets | 100.0% | 95,847,377 |
BBA—British Bankers Association
GO—General Obligation
LIBOR—London Interbank Offered Rate
REMIC—Real Estate Mortgage Investment Conduit
USD—US Dollar
|
| a Principal amount stated in U.S. Dollars unless otherwise noted. |
| MXN—Mexican New Peso |
| b Securities exempt from registration under Rule 144A of the Securities Act of 1933.These securities may be resold in |
| transactions exempt from registration, normally to qualified institutional buyers.At December 31, 2011, these |
| securities were valued at $8,508,793 or 8.9% of net assets. |
| c Variable rate security—interest rate subject to periodic change. |
| d Security, or portion thereof, on loan.At December 31, 2011, the value of the fund’s securities on loan was |
| $41,992,364 and the value of the collateral held by the fund was $43,054,645, consisting of cash collateral of |
| $605,200 and U.S Government & Agency securities valued at $42,449,445. |
| e Purchased on a forward commitment basis. |
| f The Federal Housing Finance Agency (“FHFA”) placed Federal Home Loan Mortgage Corporation and Federal |
| National Mortgage Association into conservatorship with FHFA as the conservator.As such, the FHFA oversees the |
| continuing affairs of these companies. |
| g Non-income producing security. |
| h Investment in affiliated money market mutual fund. |
| | | |
| Portfolio Summary (Unaudited)† | | |
| |
| | Value (%) | | Value (%) |
| U.S. Government & Agencies | 79.3 | Foreign/Governmental | 2.8 |
| Corporate Bonds | 29.5 | Municipal Bonds | .9 |
| Asset/Mortgage-Backed | 10.9 | Options Purchased | .1 |
| Short-Term/ | | | |
| Money Market Investments | 3.1 | | 126.6 |
| |
| † Based on net assets. | | | |
| See notes to financial statements. | | | |
|
| STATEMENT OF OPTIONS WRITTEN |
| December 31, 2011 |
| | | | |
| | Face Amount | | | |
| | Covered by | | | |
| | Contracts ($) | | Value ($) | |
| Call Options; | | | | |
| 10-Year USD LIBOR-BBA, | | | | |
| February 2012 @ $2.15 | | | | |
| (premiums received $38,147) | 2,705,000 | a | (47,882 | ) |
| |
| BBA—British Bankers Association | | | | |
| LIBOR—London Interbank Offered Rate | | | | |
| USD—US Dollar | | | | |
| a Non-income producing security. | | | | |
| See notes to financial statements. | | | | |
20
|
| STATEMENT OF ASSETS AND LIABILITIES |
| December 31, 2011 |
| | | |
| | Cost | Value |
| Assets ($): | | |
| Investments in securities—See Statement of Investments (including | | |
| securities on loan, valued at $41,992,364)—Note 1(c): | | |
| Unaffiliated issuers | 116,259,810 | 120,017,364 |
| Affiliated issuers | 1,319,035 | 1,319,035 |
| Cash | | 18,310 |
| Cash denominated in foreign currencies | 62,697 | 62,097 |
| Dividends, interest and securities lending income receivable | | 714,084 |
| Receivable for shares of Beneficial Interest subscribed | | 13,289 |
| Prepaid expenses | | 2,894 |
| | | 122,147,073 |
| Liabilities ($): | | |
| Due to The Dreyfus Corporation and affiliates—Note 3(b) | | 74,069 |
| Payable for open mortgage dollar roll transactions—Note 4 | | 23,724,689 |
| Payable for investment securities purchased | | 1,797,763 |
| Liability for securities on loan—Note 1(c) | | 605,200 |
| Outstanding options written, at value (premiums received | | |
| $38,147)—See Statement of Options Written—Note 4 | | 47,882 |
| Payable for shares of Beneficial Interest redeemed | | 32,565 |
| Accrued expenses | | 17,528 |
| | | 26,299,696 |
| Net Assets ($) | | 95,847,377 |
| Composition of Net Assets ($): | | |
| Paid-in capital | | 96,856,410 |
| Accumulated undistributed investment income—net | | 1,393,116 |
| Accumulated net realized gain (loss) on investments | | (6,149,354) |
| Accumulated net unrealized appreciation (depreciation) | | |
| on investments, options transactions and | | |
| foreign currency transactions | | 3,747,205 |
| Net Assets ($) | | 95,847,377 |
| |
| |
| Net Asset Value Per Share | | |
| | Initial Shares | Service Shares |
| Net Assets ($) | 69,071,838 | 26,775,539 |
| Shares Outstanding | 5,792,631 | 2,253,383 |
| Net Asset Value Per Share ($) | 11.92 | 11.88 |
| |
| See notes to financial statements. | | |
|
| STATEMENT OF OPERATIONS |
| Year Ended December 31, 2011 |
| | |
| Investment Income ($): | |
| Income: | |
| Interest | 3,829,787 |
| Dividends; | |
| Affiliated issuers | 2,307 |
| Income from securities lending—Note 1(c) | 8,262 |
| Total Income | 3,840,356 |
| Expenses: | |
| Investment advisory fee—Note 3(a) | 753,239 |
| Distribution fees—Note 3(b) | 67,868 |
| Professional fees | 53,042 |
| Prospectus and shareholders’ reports | 25,859 |
| Custodian fees—Note 3(b) | 18,918 |
| Trustees’ fees and expenses—Note 3(c) | 8,704 |
| Shareholder servicing costs—Note 3(b) | 4,585 |
| Loan commitment fees—Note 2 | 2,524 |
| Miscellaneous | 52,032 |
| Total Expenses | 986,771 |
| Less—reduction in fees due to earnings credits—Note 3(b) | (2) |
| Net Expenses | 986,769 |
| Investment Income—Net | 2,853,587 |
| Realized and Unrealized Gain (Loss) on Investments—Note 4 ($): | |
| Net realized gain (loss) on investments and foreign currency transactions | 5,653,573 |
| Net realized gain (loss) on options transactions | 57,572 |
| Net realized gain (loss) on financial futures | (192,152) |
| Net realized gain (loss) on forward foreign currency exchange contracts | 129,734 |
| Net Realized Gain (Loss) | 5,648,727 |
| Net unrealized appreciation (depreciation) on | |
| investments and foreign currency transactions | (755,061) |
| Net unrealized appreciation (depreciation) on options transactions | (18,804) |
| Net unrealized appreciation (depreciation) on financial futures | (88,062) |
| Net unrealized appreciation (depreciation) on | |
| forward foreign currency exchange contracts | 4,804 |
| Net Unrealized Appreciation (Depreciation) | (857,123) |
| Net Realized and Unrealized Gain (Loss) on Investments | 4,791,604 |
| Net Increase in Net Assets Resulting from Operations | 7,645,191 |
| |
| See notes to financial statements. | |
22
STATEMENT OF CHANGES IN NET ASSETS
| | | | |
| | Year Ended December 31, |
| | 2011 | 2010 |
| Operations ($): | | |
| Investment income—net | 2,853,587 | 4,759,418 |
| Net realized gain (loss) on investments | 5,648,727 | 4,694,626 |
| Net unrealized appreciation | | |
| (depreciation) on investments | (857,123) | 1,537,051 |
| Net Increase (Decrease) in Net Assets | | |
| Resulting from Operations | 7,645,191 | 10,991,095 |
| Dividends to Shareholders from ($): | | |
| Investment income—net: | | |
| Initial Shares | (3,302,535) | (4,147,602) |
| Service Shares | (924,818) | (1,073,094) |
| Total Dividends | (4,227,353) | (5,220,696) |
| Beneficial Interest Transactions ($): | | |
| Net proceeds from shares sold: | | |
| Initial Shares | 9,347,772 | 10,267,694 |
| Service Shares | 2,462,500 | 1,716,930 |
| Dividends reinvested: | | |
| Initial Shares | 3,302,535 | 4,147,602 |
| Service Shares | 924,818 | 1,073,094 |
| Cost of shares redeemed: | | |
| Initial Shares | (51,347,775) | (19,505,835) |
| Service Shares | (5,245,585) | (6,933,179) |
| Increase (Decrease) in Net Assets from | | |
| Beneficial Interest Transactions | (40,555,735) | (9,233,694) |
| Total Increase (Decrease) in Net Assets | (37,137,897) | (3,463,295) |
| Net Assets ($): | | |
| Beginning of Period | 132,985,274 | 136,448,569 |
| End of Period | 95,847,377 | 132,985,274 |
| Undistributed investment income—net | 1,393,116 | 2,061,794 |
STATEMENT OF CHANGES IN NET ASSETS (continued)
| | | | |
| | Year Ended December 31, |
| | 2011 | 2010 |
| Capital Share Transactions: | | |
| Initial Shares | | |
| Shares sold | 798,389 | 893,014 |
| Shares issued for dividends reinvested | 282,715 | 363,167 |
| Shares redeemed | (4,394,274) | (1,703,354) |
| Net Increase (Decrease) in Shares Outstanding | (3,313,170) | (447,173) |
| Service Shares | | |
| Shares sold | 209,770 | 149,601 |
| Shares issued for dividends reinvested | 79,292 | 94,370 |
| Shares redeemed | (448,776) | (606,808) |
| Net Increase (Decrease) in Shares Outstanding | (159,714) | (362,837) |
| |
| See notes to financial statements. | | |
24
FINANCIAL HIGHLIGHTS
The following tables describe the performance for each share class for the fiscal periods indicated.All information (except portfolio turnover rate) reflects financial results for a single fund share.Total return shows how much your investment in the fund would have increased (or decreased) during each period, assuming you had reinvested all dividends and distributions. The fund’s total returns do not reflect expenses associated with variable annuity or insurance contracts.These figures have been derived from the fund’s financial statements.
| | | | | | | | | | |
| | | Year Ended December 31, | |
| Initial Shares | 2011 | 2010 | 2009 | 2008 | 2007 |
| Per Share Data ($): | | | | | |
| Net asset value, beginning of period | 11.55 | 11.08 | 10.11 | 11.08 | 11.25 |
| Investment Operations: | | | | | |
| Investment income—neta | .29 | .41 | .48 | .51 | .53 |
| Net realized and unrealized | | | | | |
| gain (loss) on investments | .51 | .51 | .99 | (.96) | (.16) |
| Total from Investment Operations | .80 | .92 | 1.47 | (.45) | .37 |
| Distributions: | | | | | |
| Dividends from investment income—net | (.43) | (.45) | (.50) | (.52) | (.54) |
| Net asset value, end of period | 11.92 | 11.55 | 11.08 | 10.11 | 11.08 |
| Total Return (%) | 7.04 | 8.38 | 14.96 | (4.18) | 3.54 |
| Ratios/Supplemental Data (%): | | | | | |
| Ratio of total expenses | | | | | |
| to average net assets | .79 | .77 | .75 | .76 | .77 |
| Ratio of net expenses | | | | | |
| to average net assets | .79 | .77 | .75 | .76 | .72 |
| Ratio of net investment income | | | | | |
| to average net assets | 2.54 | 3.55 | 4.56 | 4.71 | 4.78 |
| Portfolio Turnover Rate b | 379.94 | 288.08 | 293.67 | 391.87 | 446.13 |
| Net Assets, end of period ($ x 1,000) | 69,072 | 105,205 | 105,816 | 100,396 | 120,446 |
|
| a Based on average shares outstanding at each month end. |
| b The portfolio turnover rates excluding mortgage dollar roll transactions for the periods ended December 31, 2011, |
| 2010, 2009, 2008 and 2007 were 162.19%, 129.47%, 102.76%, 142.10% and 219.54%, respectively. |
See notes to financial statements.
FINANCIAL HIGHLIGHTS (continued)
| | | | | | | | | | |
| | | Year Ended December 31, | |
| Service Shares | 2011 | 2010 | 2009 | 2008 | 2007 |
| Per Share Data ($): | | | | | |
| Net asset value, beginning of period | 11.51 | 11.04 | 10.07 | 11.04 | 11.21 |
| Investment Operations: | | | | | |
| Investment income—neta | .26 | .38 | .45 | .48 | .51 |
| Net realized and unrealized | | | | | |
| gain (loss) on investments | .51 | .50 | .99 | (.96) | (.17) |
| Total from Investment Operations | .77 | .88 | 1.44 | (.48) | .34 |
| Distributions: | | | | | |
| Dividends from investment income—net | (.40) | (.41) | (.47) | (.49) | (.51) |
| Net asset value, end of period | 11.88 | 11.51 | 11.04 | 10.07 | 11.04 |
| Total Return (%) | 6.78 | 8.20 | 14.63 | (4.46) | 3.31 |
| Ratios/Supplemental Data (%): | | | | | |
| Ratio of total expenses | | | | | |
| to average net assets | 1.04 | 1.02 | 1.00 | 1.01 | 1.02 |
| Ratio of net expenses | | | | | |
| to average net assets | 1.04 | 1.02 | 1.00 | 1.01 | .97 |
| Ratio of net investment income | | | | | |
| to average net assets | 2.22 | 3.29 | 4.33 | 4.46 | 4.51 |
| Portfolio Turnover Rateb | 379.94 | 288.08 | 293.67 | 391.87 | 446.13 |
| Net Assets, end of period ($ x 1,000) | 26,776 | 27,780 | 30,633 | 33,105 | 44,035 |
|
| a Based on average shares outstanding at each month end. |
| b The portfolio turnover rates excluding mortgage dollar roll transactions for the periods ended December 31, 2011, |
| 2010, 2009, 2008 and 2007 were 162.19%, 129.47%, 102.76%, 142.10% and 219.54%, respectively. |
See notes to financial statements.
26
NOTES TO FINANCIAL STATEMENTS
NOTE 1—Significant Accounting Policies:
Dreyfus Variable Investment Fund (the “Company”) is registered under the Investment Company Act of 1940, as amended (the “Act”), as an open end management investment company, operating as a series company currently offering seven series, including the Quality Bond Portfolio (the “fund”). The fund is only offered to separate accounts established by insurance companies to fund variable annuity contracts and variable life insurance policies.The fund is a diversified series.The fund’s investment objective is to maximize total return, consisting of capital appreciation and current income. The Dreyfus Corporation (the “Manager” or “Dreyfus”), a wholly-owned subsidiary of The Bank of New York Mellon Corporation (“BNY Mellon”), serves as the fund’s investment adviser.
MBSC Securities Corporation (the “Distributor”), a wholly-owned subsidiary of the Manager, is the distributor of the fund’s shares, which are sold without a sales charge. The fund is authorized to issue an unlimited number of $.001 par value shares of Beneficial Interest in each of the following classes of shares: Initial and Service. Each class of shares has identical rights and privileges, except with respect to the distribution plan, the expenses borne by each class, the allocation of certain transfer agency costs and certain voting rights. Income, expenses (other than expenses attributable to a specific class), and realized and unrealized gains or losses on investments are allocated to each class of shares based on its relative net assets.
The Company accounts separately for the assets, liabilities and operations of each series. Expenses directly attributable to each series are charged to that series’ operations; expenses which are applicable to all series are allocated among them on a pro rata basis.
The Financial Accounting Standards Board (“FASB”) Accounting Standards Codification (“ASC”) is the exclusive reference of authoritative U.S. generally accepted accounting principles (“GAAP”) recognized by the FASB to be applied by nongovernmental entities. Rules and inter-
NOTES TO FINANCIAL STATEMENTS (continued)
pretive releases of the Securities and Exchange Commission (“SEC”) under authority of federal laws are also sources of authoritative GAAP for SEC registrants. The fund’s financial statements are prepared in accordance with GAAP, which may require the use of management estimates and assumptions.Actual results could differ from those estimates.
The Company enters into contracts that contain a variety of indemnifications.The fund’s maximum exposure under these arrangements is unknown.The fund does not anticipate recognizing any loss related to these arrangements.
(a) Portfolio valuation: The fair value of a financial instrument is the amount that would be received to sell an asset or paid to transfer a liability in an orderly transaction between market participants at the measurement date (i.e. the exit price). GAAP establishes a fair value hierarchy that prioritizes the inputs of valuation techniques used to measure fair value.This hierarchy gives the highest priority to unadjusted quoted prices in active markets for identical assets or liabilities (Level 1 measurements) and the lowest priority to unobservable inputs (Level 3 measurements).
Additionally, GAAP provides guidance on determining whether the volume and activity in a market has decreased significantly and whether such a decrease in activity results in transactions that are not orderly. GAAP requires enhanced disclosures around valuation inputs and techniques used during annual and interim periods.
Various inputs are used in determining the value of the fund’s investments relating to fair value measurements.These inputs are summarized in the three broad levels listed below:
Level 1—unadjusted quoted prices in active markets for identical investments.
Level 2—other significant observable inputs (including quoted prices for similar investments, interest rates, prepayment speeds, credit risk, etc.).
Level 3—significant unobservable inputs (including the fund’s own assumptions in determining the fair value of investments).
28
The inputs or methodology used for valuing securities are not necessarily an indication of the risk associated with investing in those securities.
Changes in valuation techniques may result in transfers in or out of an assigned level within the disclosure hierarchy. Valuation techniques used to value the fund’s investments are as follows:
Registered investment companies that are not traded on an exchange are valued at their net asset value and are categorized within Level 1 of the fair value hierarchy.
Investments in securities excluding short-term investments (other than U.S. Treasury Bills), financial futures, options and forward foreign currency exchange contracts (“forward contracts”) are valued each business day by an independent pricing service (the “Service”) approved by the Board of Trustees. Investments for which quoted bid prices are readily available and are representative of the bid side of the market in the judgment of the Service are valued at the mean between the quoted bid prices (as obtained by the Service from dealers in such securities) and asked prices (as calculated by the Service based upon its evaluation of the market for such securities). Other investments (which constitute a majority of the portfolio securities) are valued as determined by the Service, based on methods which include consideration of: yields or prices of securities of comparable quality, coupon, maturity and type; indications as to values from dealers; and general market conditions. These securities are generally categorized within Level 2 of the fair value hierarchy.
U.S. Treasury Bills are valued at the mean price between quoted bid prices and asked prices by the Service. These securities are generally categorized within Level 2 of the fair value hierarchy
The Service’s procedures are reviewed by Dreyfus under the general supervision of the Board of Trustees.
NOTES TO FINANCIAL STATEMENTS (continued)
When market quotations or official closing prices are not readily available, or are determined not to reflect accurately fair value, such as when the value of a security has been significantly affected by events after the close of the exchange or market on which the security is principally traded (for example, a foreign exchange or market), but before the fund calculates its net asset value, the fund may value these investments at fair value as determined in accordance with the procedures approved by the Board of Trustees. Certain factors may be considered when fair valuing investments such as: fundamental analytical data, the nature and duration of restrictions on disposition, an evaluation of the forces that influence the market in which the securities are purchased and sold, and public trading in similar securities of the issuer or comparable issuers. These securities are either categorized as Level 2 or 3 depending on the relevant inputs used.
For restricted securities where observable inputs are limited, assumptions about market activity and risk are used and are categorized within Level 3 of the fair value hierarchy.
Financial futures and options, which are traded on an exchange, are valued at the last sales price on the securities exchange on which such securities are primarily traded or at the last sales price on the national securities market on each business day. These securities are generally categorized within Level 1 of the fair value hierarchy. Options traded over-the-counter are valued at the mean between the bid and asked price.These securities are generally categorized within Level 2 of the fair value hierarchy. Investments denominated in foreign currencies are translated to U.S. dollars at the prevailing rates of exchange. Forward contracts are valued at the forward rate.These securities are generally categorized within Level 2 of the fair value hierarchy.
30
The following is a summary of the inputs used as of December 31, 2011 in valuing the fund’s investments:
| | | | | | |
| | | Level 2—Other | Level 3— | |
| | Level 1— | Significant | Significant | |
| | Unadjusted | Observable | Unobservable | |
| | Quoted Prices | Inputs | Inputs | Total |
| Assets ($) | | | | |
| Investments in Securities: | | | |
| Asset-Backed | — | 6,342,791 | — | 6,342,791 |
| Commercial | | | | |
| Mortgage-Backed | — | 3,939,395 | — | 3,939,395 |
| Corporate Bonds† | — | 28,337,962 | — | 28,337,962 |
| Foreign/Governmental | — | 2,654,487 | — | 2,654,487 |
| Municipal Bonds | — | 849,412 | — | 849,412 |
| Mutual Funds | 1,319,035 | — | — | 1,319,035 |
| Residential | | | | |
| Mortgage-Backed | — | 151,039 | — | 151,039 |
| U.S. Government | | | | |
| Agencies/ | | | | |
| Mortgage-Backed | — | 32,613,971 | — | 32,613,971 |
| U.S. Treasury | — | 45,079,043 | — | 45,079,043 |
| Other Financial | | | | |
| Instruments: | | | | |
| Options Purchased | — | 49,264 | — | 49,264 |
| Liabilities ($) | | | | |
| Other Financial | | | | |
| Instruments: | | | | |
| Options Written | — | (47,882) | — | (47,882) |
| † See Statement of Investments for additional detailed categorizations. | |
In May 2011, FASB issued Accounting Standards Update (“ASU”) No. 2011-04 “Amendments to Achieve Common FairValue Measurement and Disclosure Requirements in GAAP and International Financial
NOTES TO FINANCIAL STATEMENTS (continued)
Reporting Standards (“IFRS”)” (“ASU 2011-04”). ASU 2011-04 includes common requirements for measurement of and disclosure about fair value between GAAP and IFRS. ASU 2011-04 will require reporting entities to disclose the following information for fair value measurements categorized within Level 3 of the fair value hierarchy: quantitative information about the unobservable inputs used in the fair value measurement, the valuation processes used by the reporting entity and a narrative description of the sensitivity of the fair value measurement to changes in unobservable inputs and the interrelationships between those unobservable inputs. In addition, ASU 2011-04 will require reporting entities to make disclosures about amounts and reasons for all transfers in and out of Level 1 and Level 2 fair value measurements.The new and revised disclosures are effective for interim and annual reporting periods beginning after December 15, 2011. At this time, management is evaluating the implications of ASU 2011-04 and its impact on the financial statements.
(b) Foreign currency transactions: The fund does not isolate that portion of the results of operations resulting from changes in foreign exchange rates on investments from the fluctuations arising from changes in market prices of securities held. Such fluctuations are included with the net realized and unrealized gain or loss on investments.
Net realized foreign exchange gains or losses arise from sales of foreign currencies, currency gains or losses realized on securities transactions between trade and settlement date, and the difference between the amounts of dividends, interest and foreign withholding taxes recorded on the fund’s books and the U.S. dollar equivalent of the amounts actually received or paid. Net unrealized foreign exchange gains and losses arise from changes in the value of assets and liabilities other than investments resulting from changes in exchange rates. Foreign
32
currency gains and losses on investments are included with net realized and unrealized gain or loss on investments.
(c) Securities transactions and investment income: Securities transactions are recorded on a trade date basis. Realized gains and losses from securities transactions are recorded on the identified cost basis. Dividend income is recognized on the ex-dividend date and interest income, including, where applicable, accretion of discount and amortization of premium on investments, is recognized on the accrual basis.
Pursuant to a securities lending agreement with The Bank of New York Mellon, a subsidiary of BNY Mellon and an affiliate of Dreyfus, the fund may lend securities to qualified institutions. It is the fund’s policy that, at origination, all loans are secured by collateral of at least 102% of the value of U.S. securities loaned and 105% of the value of foreign securities loaned. Collateral equivalent to at least 100% of the market value of securities on loan is maintained at all times. Collateral is either in the form of cash, which can be invested in certain money market mutual funds managed by the Manager, U.S. Government and Agency securities or letters of credit.The fund is entitled to receive all income on securities loaned, in addition to income earned as a result of the lending transaction. Although each security loaned is fully collateralized, the fund bears the risk of delay in recovery of, or loss of rights in, the securities loaned should a borrower fail to return the securities in a timely manner. During the period ended December 31, 2011, The Bank of New York Mellon earned $4,449 from lending portfolio securities, pursuant to the securities lending agreement.
(d) Affiliated issuers: Investments in other investment companies advised by Dreyfus are defined as “affiliated” in the Act.
NOTES TO FINANCIAL STATEMENTS (continued)
The fund may invest in shares of certain affiliated investment companies also advised or managed by Dreyfus. Investments in affiliated investment companies for the period ended December 31, 2011 were as follows:
| | | | | | | |
| Affiliated | | | | | | | |
| Investment | Value | | | | Value | | Net |
| Company | 12/31/2010 ($) | | Purchases ($) | Sales ($) | 12/31/2011 ($) | | Assets (%) |
| Dreyfus | | | | | | | |
| Institutional | | | | | | | |
| Preferred | | | | | | | |
| Plus Money | | | | | | | |
| Market Fund | 163,000 | | 53,594,570 | 53,043,735 | 713,835 | | .7 |
| Dreyfus | | | | | | | |
| Institutional | | | | | | | |
| Cash | | | | | | | |
| Advantage | | | | | | | |
| Fund | 1,982,010 | | 19,839,313 | 21,216,123 | 605,200 | | .6 |
| Total | 2,145,010 | | 73,433,883 | 74,259,858 | 1,319,035 | | 1.3 |
(e) Dividends to shareholders: Dividends are recorded on the ex-dividend date. Dividends from investment income-net are declared and paid monthly. Dividends from net realized capital gains, if any, are normally declared and paid annually, but the fund may make distributions on a more frequent basis to comply with the distribution requirements of the Internal Revenue Code of 1986, as amended (the “Code”).To the extent that net realized capital gains can be offset by capital loss carryovers, it is the policy of the fund not to distribute such gains. Income and capital gain distributions are determined in accordance with income tax regulations, which may differ from GAAP.
On December 30, 2011, the Board ofTrustees declared a cash dividend of $.031 and $.029 per share for the Initial shares and Service shares, respectively, from undistributed investment income-net payable on January 3, 2012 (ex-dividend date) to shareholders of record as of the close of business on December 30, 2011.
(f) Federal income taxes: It is the policy of the fund to continue to qualify as a regulated investment company, if such qualification is in the best interests of its shareholders, by complying with the applicable pro visions of the Code, and to make distributions of taxable income sufficient to relieve it from substantially all federal income and excise taxes.
34
As of and during the period ended December 31, 2011, the fund did not have any liabilities for any uncertain tax positions.The fund recognizes interest and penalties, if any, related to uncertain tax positions as income tax expense in the Statement of Operations. During the period, the fund did not incur any interest or penalties.
Each of the tax years in the four-year period ended December 31, 2011 remains subject to examination by the Internal Revenue Service and state taxing authorities.
At December 31, 2011, the components of accumulated earnings on a tax basis were as follows: undistributed ordinary income $1,393,116, accumulated capital losses $5,630,727 and unrealized appreciation $3,250,211. In addition, the fund had $21,633 of capital losses realized after October 31, 2011, which were deferred for tax purposes to the first day of the following fiscal year.
Under the Regulated Investment Company Modernization Act of 2010 (the “2010 Act”), the fund will be permitted to carry forward capital losses incurred in taxable years beginning after December 22, 2010 (“post-enactment losses”) for an unlimited period. Post-enactment capital loss carryovers will retain their character as either short-term or long-term capital losses rather than be considered short-term as they were under previous statute. However, the 2010 Act requires post-enactment losses to be utilized before the utilization of losses incurred in taxable years prior to the effective date of the 2010 Act (“pre-enactment losses”). As a result of this ordering rule, pre-enactment losses may be more likely to expire unused.
The accumulated capital loss carryover is available for federal income tax purposes to be applied against future net securities profits, if any, realized subsequent to December 31, 2011. If not applied, $1,665,151 of the carryover expires in fiscal 2016 and $3,965,576 expires in fiscal 2017.
The tax character of distributions paid to shareholders during the fiscal periods ended December 31, 2011 and December 31, 2010 were as follows: ordinary income $4,227,353 and $5,220,696, respectively.
NOTES TO FINANCIAL STATEMENTS (continued)
During the period ended December 31, 2011, as a result of permanent book to tax differences, primarily due to the tax treatment for amortization of premiums, paydown gains (losses) and foreign currency transactions, the fund increased accumulated undistributed investment income-net by $705,088 and decreased accumulated net realized gain (loss) on investments by the same amount. Net assets and net asset value per share were not affected by this reclassification.
(g) New Accounting Pronouncement: In April 2011, FASB issued ASU No. 2011-03 “Transfers and Servicing (Topic 860) Reconsideration of Effective Control for Repurchase Agreements (“ASU 2011-03”) which relates to the accounting for repurchase agreements and similar agreements including mortgage dollar rolls, that both entitle and obligate a transferor to repurchase or redeem financial assets before their matu-rity.ASU 2011-03 modifies the criteria for determining effective control of transferred assets and as a result certain agreements may now be accounted for as secured borrowings.ASU 2011-03 is effective prospectively for new transfers and existing transactions that are modified in the first interim or annual period beginning on or after December 15, 2011. Management is currently evaluating the implications of this change and its impact on the financial statements.
NOTE 2—Bank Lines of Credit:
The fund participates with other Dreyfus-managed funds in a $225 million unsecured credit facility led by Citibank, N.A. and a $300 million unsecured credit facility provided by The Bank of New York Mellon (each, a “Facility”), each to be utilized primarily for temporary or emergency purposes, including the financing of redemptions. In connection therewith, the fund has agreed to pay its pro rata portion of commitment fees for each Facility. Interest is charged to the fund based on rates determined pursuant to the terms of the respective Facility at the time of borrowing. During the period ended December 31, 2011, the fund did not borrow under the Facilities.
36
NOTE 3—Investment Advisory Fee and Other Transactions with Affiliates:
(a) Pursuant to an investment advisory agreement with the Manager, the investment advisory fee is computed at the annual rate of .65% of the value of the fund’s average daily net assets and is payable monthly.
(b) Under the Distribution Plan (the “Plan”) adopted pursuant to Rule 12b-1 under the Act, Service shares pay the Distributor for distributing its shares, for servicing and/or maintaining Service shares’ shareholder accounts and for advertising and marketing for Service shares.The Plan provides for payments to be made at an annual rate of .25% of the value of the Service shares’ average daily net assets.The Distributor may make payments to participating insurance companies and to brokers and dealers acting as principal underwriter for their variable insurance products. The fees payable under the Plan are payable without regard to actual expenses incurred. During the period ended December 31, 2011, Service shares were charged $67,868 pursuant to the Plan.
The fund compensates Dreyfus Transfer, Inc., a wholly-owned subsidiary of the Manager, under a transfer agency agreement for providing personnel and facilities to perform transfer agency services for the fund. During the period ended December 31, 2011, the fund was charged $580 pursuant to the transfer agency agreement, which is included in Shareholder servicing costs in the Statement of Operations.
The fund has arrangements with the custodian and cash management bank whereby the fund may receive earnings credits when positive cash balances are maintained, which are used to offset custody and cash management fees. For financial reporting purposes, the fund includes net earnings credits as an expense offset in the Statement of Operations.
The fund compensates The Bank of New York Mellon under cash management agreements for performing cash management services related to fund subscriptions and redemptions. During the period
NOTES TO FINANCIAL STATEMENTS (continued)
ended December 31, 2011, the fund was charged $79 pursuant to the cash management agreements, which is included in Shareholder servicing costs in the Statement of Operations.These fees were partially offset by earnings credits of $2.
The fund also compensates The Bank of New York Mellon under a custody agreement for providing custodial services for the fund. During the period ended December 31, 2011, the fund was charged $18,918 pursuant to the custody agreement.
During the period ended December 31, 2011, the fund was charged $6,402 for services performed by the Chief Compliance Officer.
The components of “Due to The Dreyfus Corporation and affiliates” in the Statement of Assets and Liabilities consist of: investment advisory fees $52,977, Rule 12b-1 distribution plan fees $5,699, custodian fees $10,006, chief compliance officer fees $5,295 and transfer agency per account fees $92.
(c) Each Board member also serves as a Board member of other funds within the Dreyfus complex. Annual retainer fees and attendance fees are allocated to each fund based on net assets.
NOTE 4—Securities Transactions:
The aggregate amount of purchases and sales (including paydowns) of investment securities, excluding short-term securities, financial futures, forward contracts and options transactions, during the period ended December 31, 2011, amounted to $533,219,858 and $575,241,018, respectively, of which $305,604,377 in purchases and $306,405,987 in sales were from mortgage dollar roll transactions.
Mortgage Dollar Rolls: A mortgage dollar roll transaction involves a sale by the fund of mortgage related securities that it holds with an agreement by the fund to repurchase similar securities at an agreed upon price and date.The securities purchased will bear the same interest rate as those sold, but generally will be collateralized by pools of mortgages with different prepayment histories than those securities sold.
38
The following tables show the fund’s exposure to different types of market risk as it relates to the Statement of Assets and Liabilities and the Statement of Operations, respectively.
Fair value of derivative instruments as of December 31, 2011 is shown below:
| | | | |
| | Derivative | | Derivative |
| | Assets ($) | | Liabilities ($) |
| Interest rate risk1 | 49,264 | Interest rate risk2 | (47,882) |
| Gross fair value of | | | |
| derivatives contracts | 49,264 | | (47,882) |
| |
| Statement of Assets and Liabilities location: |
| 1 | Options purchased are included in Investments in securities of Unaffiliated issuers at market value. |
| 2 | Outstanding options written, at value. |
The effect of derivative instruments in the Statement of Operations during the period ended December 31, 2011 is shown below:
| | | | | | | |
| | Amount of realized gain or (loss) on derivatives recognized in income ($) |
| | | | Forward | |
| Underlying risk | Futures3 | Options4 | Contracts5 | Total |
| Interest rate | (192,152) | 97,557 | — | (94,595) |
| Foreign exchange | — | (39,985) | 129,734 | 89,749 |
| Total | (192,152) | 57,572 | 129,734 | (4,846) |
| | | | | | | |
| Change in unrealized appreciation or (depreciation) on derivatives recognized in income ($) |
| | | | Forward | |
| Underlying risk | Futures6 | Options7 | Contracts8 | Total |
| Interest rate | (88,062) | (63,734) | — | (151,796) |
| Foreign exchange | — | 44,930 | 4,804 | 49,734 |
| Total | (88,062) | (18,804) | 4,804 | (102,062) |
| |
| Statement of Operations location: |
| 3 | Net realized gain (loss) on financial futures. |
| 4 | Net realized gain (loss) on options transactions. |
| 5 | Net realized gain (loss) on forward foreign currency exchange contracts. |
| 6 | Net unrealized appreciation (depreciation) on financial futures. |
| 7 | Net unrealized appreciation (depreciation) on options transactions. |
| 8 | Net unrealized appreciation (depreciation) on forward foreign currency exchange contracts. |
NOTES TO FINANCIAL STATEMENTS (continued)
Futures Contracts: In the normal course of pursuing its investment objective, the fund is exposed to market risk, including interest rate risk, as a result of changes in value of underlying financial instruments.The fund invests in financial futures contracts in order to manage its exposure to or protect against changes in the market.A futures contract represents a commitment for the future purchase or a sale of an asset at a specified date. Upon entering into such contracts, these investments require initial margin deposits with a broker, which consist of cash or cash equivalents. The amount of these deposits is determined by the exchange or Board of Trade on which the contract is traded and is subject to change. Accordingly, variation margin payments are received or made to reflect daily unrealized gains or losses which are recorded in the Statement of Operations. Futures contracts are valued daily at the last sales price established by the Board of Trade or exchange upon which they are traded. When the contracts are closed, the fund recognizes a realized gain or loss.There is minimal counterparty credit risk to the fund with futures since futures are exchange traded, and the exchange’s clearinghouse guarantees the futures against default.At December 31, 2011, there were no financial futures contracts outstanding.
Options: The fund purchases and writes (sells) put and call options to hedge against changes in interest rates and foreign currencies or as a substitute for an investment. The fund is subject to interest rate and currency risk in the course of pursuing its investment objectives through its investments in options contracts. A call option gives the purchaser of the option the right (but not the obligation) to buy, and obligates the writer to sell, the underlying security or securities at the exercise price at any time during the option period, or at a specified date. Conversely, a put option gives the purchaser of the option the right (but not the obligation) to sell, and obligates the writer to buy the underlying security or securities at the exercise price at any time during the option period, or at a specified date.
As a writer of call options, the fund receives a premium at the outset and then bears the market risk of unfavorable changes in the price of the financial instrument underlying the option. Generally, the fund realizes
40
a gain, to the extent of the premium, if the price of the underlying financial instrument decreases between the date the option is written and the date on which the option is terminated. Generally, the fund incurs a loss, if the price of the financial instrument increases between those dates.
As a writer of put options, the fund receives a premium at the outset and then bears the market risk of unfavorable changes in the price of the financial instrument underlying the option. Generally, the fund realizes a gain, to the extent of the premium, if the price of the underlying financial instrument increases between the date the option is written and the date on which the option is terminated. Generally, the fund incurs a loss, if the price of the financial instrument decreases between those dates.
As a writer of an option, the fund has no control over whether the underlying securities may be sold (call) or purchased (put) and as a result bears the market risk of an unfavorable change in the price of the security underlying the written option.There is a risk of loss from a change in value of such options which may exceed the related premiums received. One risk of holding a put or a call option is that if the option is not sold or exercised prior to its expiration, it becomes worthless. However, this risk is limited to the premium paid by the fund. Upon the expiration or closing of the option transaction, a gain or loss is reported in the Statement of Operations.
The following summarizes the fund’s call/put options written during the period ended December 31, 2011:
| | | | | |
| | Face Amount | | Options Terminated |
| | Covered by | Premiums | | Net Realized |
| Options Written: | Contracts ($) | Received ($) | Cost ($) Gain (Loss) ($) |
| Contracts outstanding | | | | |
| December 31, 2010 | 14,420,000 | 161,296 | | |
| Contracts written | 49,905,000 | 307,782 | | |
| Contracts terminated: | | | | |
| Contracts closed | 45,600,000 | 303,566 | 333,279 | (29,713) |
| Contracts expired | 16,020,000 | 127,365 | — | 127,365 |
| Total contracts terminated | 61,620,000 | 430,931 | 333,279 | 97,652 |
| Contracts Outstanding | | | | |
| December 31, 2011 | 2,705,000 | 38,147 | — | — |
NOTES TO FINANCIAL STATEMENTS (continued)
Forward Foreign Currency Exchange Contracts: The fund enters into forward contracts in order to hedge its exposure to changes in foreign currency exchange rates on its foreign portfolio holdings, to settle foreign currency transactions or as a part of its investment strategy. When executing forward contracts, the fund is obligated to buy or sell a foreign currency at a specified rate on a certain date in the future. With respect to sales of forward contracts, the fund incurs a loss if the value of the contract increases between the date the forward contract is opened and the date the forward contract is closed.The fund realizes a gain if the value of the contract decreases between those dates.With respect to purchases of forward contracts, the fund incurs a loss if the value of the contract decreases between the date the forward contract is opened and the date the forward contract is closed.The fund realizes a gain if the value of the contract increases between those dates. Any realized gain or loss which occurred during the period is reflected in the Statement of Operations.The fund is exposed to foreign currency risk as a result of changes in value of underlying financial instruments. The fund is also exposed to credit risk associated with counterparty nonperformance on these forward contracts, which is typically limited to the unrealized gain on each open contract. At December 31, 2011, there were no forward contracts outstanding.
The following summarizes the average market value of derivatives outstanding during the period ended December 31, 2011:
| |
| | Average Market Value ($) |
| Interest rate futures contracts | 2,255,833 |
| Interest rate options contracts | 28,141 |
| Foreign currency options contracts | 9,475 |
| Forward contracts | 2,841,937 |
At December 31, 2011, the cost of investments for federal income tax purposes was $117,921,068; accordingly, accumulated net unrealized appreciation on investments was $3,415,331, consisting of $4,110,063 gross unrealized appreciation and $694,732 gross unrealized depreciation.
42
|
| REPORT OF INDEPENDENT REGISTERED |
| PUBLIC ACCOUNTING FIRM |
Shareholders and Board of Trustees
Dreyfus Variable Investment Fund, Quality Bond Portfolio
We have audited the accompanying statement of assets and liabilities, including the statements of investments and options written, of Dreyfus Variable Investment Fund, Quality Bond Portfolio (one of the series comprising DreyfusVariable Investment Fund) as of December 31, 2011, and the related statement of operations for the year then ended, the statement of changes in net assets for each of the two years in the period then ended and financial highlights for each of the years indicated therein. These financial statements and financial highlights are the responsibility of the Fund’s management. Our responsibility is to express an opinion on these financial statements and financial highlights based on our audits.
We conducted our audits in accordance with the standards of the Public Company Accounting Oversight Board (United States).Those standards require that we plan and perform the audit to obtain reasonable assurance about whether the financial statements and financial highlights are free of material misstatement.We were not engaged to perform an audit of the Fund’s internal control over financial reporting. Our audits included consideration of internal control over financial reporting as a basis for designing audit procedures that are appropriate in the circumstances, but not for the purpose of expressing an opinion on the effectiveness of the Fund’s internal control over financial reporting. Accordingly, we express no such opinion.An audit also includes examining, on a test basis, evidence supporting the amounts and disclosures in the financial statements and financial highlights, assessing the accounting principles used and significant estimates made by management, and evaluating the overall financial statement presentation. Our procedures included confirmation of securities owned as of December 31, 2011 by correspondence with the custodian and others.We believe that our audits provide a reasonable basis for our opinion.
In our opinion, the financial statements and financial highlights referred to above present fairly, in all material respects, the financial position of DreyfusVariable Investment Fund, Quality Bond Portfolio at December 31, 2011, the results of its operations for the year then ended, the changes in its net assets for each of the two years in the period then ended, and the financial highlights for each of the indicated years, in conformity with U.S. generally accepted accounting principles.

|
| New York, New York |
| February 10, 2012 |
BOARD MEMBERS INFORMATION (Unaudited)
|
| Joseph S. DiMartino (68) |
| Chairman of the Board (1995) |
| Principal Occupation During Past 5Years: |
| • Corporate Director and Trustee |
| Other Public Company Board Memberships During Past 5Years: |
| • CBIZ (formerly, Century Business Services, Inc.), a provider of outsourcing functions for small |
| and medium size companies, Director (1997-present) |
| • Sunair Services Corporation, a provider of certain outdoor-related services to homes and |
| businesses, Director (2005-2009) |
| • The Newark Group, a provider of a national market of paper recovery facilities, paperboard |
| mills and paperboard converting plants, Director (2000-2010) |
| No. of Portfolios for which Board Member Serves: 164 |
| ——————— |
| Peggy C. Davis (68) |
| Board Member (2006) |
| Principal Occupation During Past 5Years: |
| • Shad Professor of Law, New York University School of Law |
| • Writer and teacher in the fields of evidence, constitutional theory, family law, social sciences |
| and the law, legal process and professional methodology and training |
| No. of Portfolios for which Board Member Serves: 53 |
| ——————— |
| David P. Feldman (72) |
| Board Member (1994) |
| Principal Occupation During Past 5Years: |
| • Corporate Director and Trustee |
| Other Public Company Board Memberships During Past 5Years: |
| • BBH Mutual Funds Group (4 registered mutual funds), Director (1992-present) |
| • QMed, Inc. a healthcare company, Director (1999-2007) |
| No. of Portfolios for which Board Member Serves: 49 |
44
|
| Ehud Houminer (71) |
| Board Member (2006) |
| Principal Occupation During Past 5Years: |
| • Executive-in-Residence at the Columbia Business School, Columbia University (1992-present) |
| Other Public Company Board Memberships During Past 5Years: |
| • Avnet Inc., an electronics distributor, Director (1993-present) |
| No. of Portfolios for which Board Member Serves: 63 |
| ——————— |
| Dr. Martin Peretz (72) |
| Board Member (1990) |
| Principal Occupation During Past 5Years: |
| • Editor-in-Chief Emeritus of The New Republic Magazine (2010-present) (previously, |
| Editor-in-Chief, 1974-2010) |
| • Director of TheStreet.com, a financial information service on the web (1996-present) |
| No. of Portfolios for which Board Member Serves: 35 |
| ——————— |
Once elected all Board Members serve for an indefinite term, but achieve Emeritus status upon reaching age 80.The address of the Board Members and Officers is in c/o The Dreyfus Corporation, 200 Park Avenue, NewYork, NewYork 10166.Additional information about the Board Members is available in the fund’s Statement of Additional Information which can be obtained from Dreyfus free of charge by calling this toll free number: 1-800-DREYFUS.
James F. Henry, Emeritus Board Member
Rosalind G. Jacobs, Emeritus Board Member
Dr. Paul A. Marks, Emeritus Board Member
Gloria Messinger, Emeritus Board Member
OFFICERS OF THE FUND (Unaudited)
BRADLEY J. SKAPYAK, President since January 2010.
Chief Operating Officer and a director of the Manager since June 2009. From April 2003 to June 2009, Mr. Skapyak was the head of the Investment Accounting and Support Department of the Manager. He is an officer of 75 investment companies (comprised of 163 portfolios) managed by the Manager. He is 53 years old and has been an employee of the Manager since February 1988.
JANETTE E. FARRAGHER, Vice President and Secretary since December 2011.
Assistant General Counsel of BNY Mellon, and an officer of 76 investment companies (comprised of 189 portfolios) managed by the Manager. She is 49 years old and has been an employee of the Manager since February 1984.
KIESHA ASTWOOD, Vice President and Assistant Secretary since January 2010.
Counsel of BNY Mellon, and an officer of 76 investment companies (comprised of 189 portfolios) managed by the Manager. She is 38 years old and has been an employee of the Manager since July 1995.
JAMES BITETTO, Vice President and Assistant Secretary since August 2005.
Senior Counsel of BNY Mellon and Secretary of the Manager, and an officer of 76 investment companies (comprised of 189 portfolios) managed by the Manager. He is 45 years old and has been an employee of the Manager since December 1996.
JONI LACKS CHARATAN, Vice President and Assistant Secretary since August 2005.
Senior Counsel of BNY Mellon, and an officer of 76 investment companies (comprised of 189 portfolios) managed by the Manager. She is 56 years old and has been an employee of the Manager since October 1988.
JOSEPH M. CHIOFFI, Vice President and Assistant Secretary since August 2005.
Senior Counsel of BNY Mellon, and an officer of 76 investment companies (comprised of 189 portfolios) managed by the Manager. He is 50 years old and has been an employee of the Manager since June 2000.
KATHLEEN DENICHOLAS, Vice President and Assistant Secretary since January 2010.
Managing Counsel of BNY Mellon, and an officer of 76 investment companies (comprised of 189 portfolios) managed by the Manager. She is 37 years old and has been an employee of the Manager since February 2001.
JANETTE E. FARRAGHER, Vice President and Secretary since December 2011.
Assistant General Counsel of BNY Mellon, and an officer of 76 investment companies (comprised of 189 portfolios) managed by the Manager. She is 49 years old and has been an employee of the Manager since February 1984.
JOHN B. HAMMALIAN, Vice President and Assistant Secretary since August 2005.
Senior Managing Counsel of BNY Mellon, and an officer of 76 investment companies (comprised of 189 portfolios) managed by the Manager. He is 48 years old and has been an employee of the Manager since February 1991.
M. CRISTINA MEISER, Vice President and Assistant Secretary since January 2010.
Senior Counsel of BNY Mellon, and an officer of 76 investment companies (comprised of 189 portfolios) managed by the Manager. She is 41 years old and has been an employee of the Manager since August 2001.
ROBERT R. MULLERY, Vice President and Assistant Secretary since August 2005.
Managing Counsel of BNY Mellon, and an officer of 76 investment companies (comprised of 189 portfolios) managed by the Manager. He is 59 years old and has been an employee of the Manager since May 1986.
46
JEFF PRUSNOFSKY, Vice President and Assistant Secretary since August 2005.
Senior Managing Counsel of BNY Mellon, and an officer of 76 investment companies (comprised of 189 portfolios) managed by the Manager. He is 46 years old and has been an employee of the Manager since October 1990.
JAMES WINDELS, Treasurer since November 2001.
Director – Mutual Fund Accounting of the Manager, and an officer of 76 investment companies (comprised of 189 portfolios) managed by the Manager. He is 53 years old and has been an employee of the Manager since April 1985.
RICHARD CASSARO, Assistant Treasurer since January 2008.
Senior Accounting Manager – Money Market and Municipal Bond Funds of the Manager, and an officer of 76 investment companies (comprised of 189 portfolios) managed by the Manager. He is 52 years old and has been an employee of the Manager since September 1982.
GAVIN C. REILLY, Assistant Treasurer since December 2005.
Tax Manager of the Investment Accounting and Support Department of the Manager, and an officer of 76 investment companies (comprised of 189 portfolios) managed by the Manager. He is 43 years old and has been an employee of the Manager since April 1991.
ROBERT S. ROBOL, Assistant Treasurer since August 2003.
Senior Accounting Manager – Fixed Income Funds of the Manager, and an officer of 76 investment companies (comprised of 189 portfolios) managed by the Manager. He is 47 years old and has been an employee of the Manager since October 1988.
ROBERT SALVIOLO, Assistant Treasurer since July 2007.
Senior Accounting Manager – Equity Funds of the Manager, and an officer of 76 investment companies (comprised of 189 portfolios) managed by the Manager. He is 44 years old and has been an employee of the Manager since June 1989.
ROBERT SVAGNA, Assistant Treasurer since December 2002.
Senior Accounting Manager – Equity Funds of the Manager, and an officer of 76 investment companies (comprised of 189 portfolios) managed by the Manager. He is 44 years old and has been an employee of the Manager since November 1990.
JOSEPH W. CONNOLLY, Chief Compliance Officer since October 2004.
Chief Compliance Officer of the Manager and The Dreyfus Family of Funds (76 investment companies, comprised of 189 portfolios). From November 2001 through March 2004, Mr. Connolly was first Vice-President, Mutual Fund Servicing for Mellon Global Securities Services. In that capacity, Mr. Connolly was responsible for managing Mellon’s Custody, Fund Accounting and Fund Administration services to third-party mutual fund clients. He is 54 years old and has served in various capacities with the Manager since 1980, including manager of the firm’s Fund Accounting Department from 1997 through October 2001.
STEPHEN J. STOREN, Anti-Money Laundering Compliance Officer since May 2011.
Chief Compliance Officer of the Distributor, and the Anti-Money Laundering Compliance Officer of 72 investment companies (comprised of 185 portfolios) managed by the Manager. He is 57 years old and has been an employee of the Distributor since October 1999.
For More Information
The fund files its complete schedule of portfolio holdings with the Securities and Exchange Commission (“SEC”) for the first and third quarters of each fiscal year on Form N-Q. The fund’s Forms N-Q are available on the SEC’s website at http://www.sec.gov and may be reviewed and copied at the SEC’s Public Reference Room in Washington, DC. Information on the operation of the Public Reference Room may be obtained by calling 1-800-SEC-0330.
A description of the policies and procedures that the fund uses to determine how to vote proxies relating to portfolio securities, and information regarding how the fund voted these proxies for the most recent 12-month period ended June 30 is available at http://www.dreyfus.com and on the SEC’s website at http://www.sec.gov. The description of the policies and procedures is also available without charge, upon request, by calling 1-800-DREYFUS.

Item 2. Code of Ethics.
The Registrant has adopted a code of ethics that applies to the Registrant's principal executive officer, principal financial officer, principal accounting officer or controller, or persons performing similar functions. There have been no amendments to, or waivers in connection with, the Code of Ethics during the period covered by this Report.
Item 3. Audit Committee Financial Expert.
The Registrant's Board has determined that David P. Feldman, a member of the Audit Committee of the Board, is an audit committee financial expert as defined by the Securities and Exchange Commission (the "SEC"). David P. Feldman is "independent" as defined by the SEC for purposes of audit committee financial expert determinations.
Item 4. Principal Accountant Fees and Services.
(a) Audit Fees. The aggregate fees billed for each of the last two fiscal years (the "Reporting Periods") for professional services rendered by the Registrant's principal accountant (the "Auditor") for the audit of the Registrant's annual financial statements or services that are normally provided by the Auditor in connection with the statutory and regulatory filings or engagements for the Reporting Periods, were $160,412 in 2010 and $238,908 in 2011.
(b) Audit-Related Fees. The aggregate fees billed in the Reporting Periods for assurance and related services by the Auditor that are reasonably related to the performance of the audit of the Registrant's financial statements and are not reported under paragraph (a) of this Item 4 were $63,528 in 2010 and $109,854 in 2011. These services consisted of one or more of the following: (i) agreed upon procedures related to compliance with Internal Revenue Code section 817(h), (ii) security counts required by Rule 17f-2 under the Investment Company Act of 1940, as amended, (iii) advisory services as to the accounting or disclosure treatment of Registrant transactions or events and (iv) advisory services to the accounting or disclosure treatment of the actual or potential impact to the Registrant of final or proposed rules, standards or interpretations by the Securities and Exchange Commission, the Financial Accounting Standards Boards or other regulatory or standard-setting bodies.
The aggregate fees billed in the Reporting Periods for non-audit assurance and related services by the Auditor to the Registrant's investment adviser (not including any sub-investment adviser whose role is primarily portfolio management and is subcontracted with or overseen by another investment adviser), and any entity controlling, controlled by or under common control with the investment adviser that provides ongoing services to the Registrant ("Service Affiliates"), that were reasonably related to the performance of the annual audit of the Service Affiliate, which required pre-approval by the Audit Committee were $ -0- in 2010 and $-0- in 2011.
(c) Tax Fees. The aggregate fees billed in the Reporting Periods for professional services rendered by the Auditor for tax compliance, tax advice, and tax planning ("Tax Services") were $25,727 in 2010 and $28,718 in 2011. These services consisted of: (i) review or preparation of U.S. federal, state, local and excise tax returns; (ii) U.S. federal, state and local tax planning, advice and assistance regarding statutory, regulatory or administrative developments; (iii) tax advice regarding tax qualification matters and/or treatment of various financial instruments held or proposed to be acquired or held, and (iv) determination of Passive Foreign Investment Companies. The aggregate fees billed in the Reporting Periods for Tax Services by the Auditor to Service Affiliates, which required pre-approval by the Audit Committee were $-0- in 2010 and $-0- in 2011.
(d) All Other Fees. The aggregate fees billed in the Reporting Periods for products and services provided by the Auditor, other than the services reported in paragraphs (a) through (c) of this Item, were $407 in 2010 and $414 in 2011. These services consisted of a review of the Registrant's anti-money laundering program.
The aggregate fees billed in the Reporting Periods for Non-Audit Services by the Auditor to Service Affiliates, other than the services reported in paragraphs (b) through (c) of this Item, which required pre-approval by the Audit Committee, were $-0- in 2010 and $-0- in 2011.
(e)(1) Audit Committee Pre-Approval Policies and Procedures. The Registrant's Audit Committee has established policies and procedures (the "Policy") for pre-approval (within specified fee limits) of the Auditor's engagements for non-audit services to the Registrant and Service Affiliates without specific case-by-case consideration. The pre-approved services in the Policy can include pre-approved audit services, pre-approved audit-related services, pre-approved tax services and pre-approved all other services. Pre-approval considerations include whether the proposed services are compatible with maintaining the Auditor's independence. Pre-approvals pursuant to the Policy are considered annually.
(e)(2) Note: None of the services described in paragraphs (b) through (d) of this Item 4 were approved by the Audit Committee pursuant to paragraph (c)(7)(i)(C) of Rule 2-01 of Regulation S-X.
(f) None of the hours expended on the principal accountant's engagement to audit the registrant's financial statements for the most recent fiscal year were attributed to work performed by persons other than the principal account's full-time, permanent employees.
Non-Audit Fees. The aggregate non-audit fees billed by the Auditor for services rendered to the Registrant, and rendered to Service Affiliates, for the Reporting Periods were $39,552,052 in 2010 and $20,226,638 in 2011.
Auditor Independence. The Registrant's Audit Committee has considered whether the provision of non-audit services that were rendered to Service Affiliates, which were not pre-approved (not requiring pre-approval), is compatible with maintaining the Auditor's independence.
Item 5. Audit Committee of Listed Registrants.
Not applicable. [CLOSED-END FUNDS ONLY]
Item 6. Investments.
(a) Not applicable.
Item 7. Disclosure of Proxy Voting Policies and Procedures for Closed-End Management Investment Companies.
Not applicable. [CLOSED-END FUNDS ONLY]
Item 8. Portfolio Managers of Closed-End Management Investment Companies.
Not applicable. [CLOSED-END FUNDS ONLY, beginning with reports for periods ended on and after December 31, 2005]
Item 9. Purchases of Equity Securities by Closed-End Management Investment Companies and Affiliated Purchasers.
Not applicable. [CLOSED-END FUNDS ONLY]
Item 10. Submission of Matters to a Vote of Security Holders.
There have been no material changes to the procedures applicable to Item 10.
Item 11. Controls and Procedures.
(a) The Registrant's principal executive and principal financial officers have concluded, based on their evaluation of the Registrant's disclosure controls and procedures as of a date within 90 days of the filing date of this report, that the Registrant's disclosure controls and procedures are reasonably designed to ensure that information required to be disclosed by the Registrant on Form N-CSR is recorded, processed, summarized and reported within the required time periods and that information required to be disclosed by the Registrant in the reports that it files or submits on Form N-CSR is accumulated and communicated to the Registrant's management, including its principal executive and principal financial officers, as appropriate to allow timely decisions regarding required disclosure.
(b) There were no changes to the Registrant's internal control over financial reporting that occurred during the second fiscal quarter of the period covered by this report that have materially affected, or are reasonably likely to materially affect, the Registrant's internal control over financial reporting.
Item 12. Exhibits.
(a)(1) Code of ethics referred to in Item 2.
(a)(2) Certifications of principal executive and principal financial officers as required by Rule 30a-2(a) under the Investment Company Act of 1940.
(a)(3) Not applicable.
(b) Certification of principal executive and principal financial officers as required by Rule 30a-2(b) under the Investment Company Act of 1940.
SIGNATURES
Pursuant to the requirements of the Securities Exchange Act of 1934 and the Investment Company Act of 1940, the Registrant has duly caused this Report to be signed on its behalf by the undersigned, thereunto duly authorized.
Dreyfus Variable Investment Fund
By: /s/ Bradley J. Skapyak |
Bradley J. Skapyak, President |
Date: | February 13, 2012 |
|
Pursuant to the requirements of the Securities Exchange Act of 1934 and the Investment Company Act of 1940, this Report has been signed below by the following persons on behalf of the Registrant and in the capacities and on the dates indicated. |
|
By: /s/ Bradley J. Skapyak |
Bradley J. Skapyak, President |
Date: | February 13, 2012 |
|
By: /s/ James Windels |
James Windels, Treasurer |
Date: | February 13, 2012 |
|
EXHIBIT INDEX
(a)(1) Code of ethics referred to in Item 2.
(a)(2) Certifications of principal executive and principal financial officers as required by Rule 30a-2(a) under the Investment Company Act of 1940. (EX-99.CERT)
(b) Certification of principal executive and principal financial officers as required by Rule 30a-2(b) under the Investment Company Act of 1940. (EX-99.906CERT)