UNITED STATES
SECURITIES AND EXCHANGE COMMISSION
Washington, D.C. 20549
FORM N-CSR
CERTIFIED SHAREHOLDER REPORT OF REGISTERED MANAGEMENT
INVESTMENT COMPANIES
Investment Company Act file number | 811- 5125 |
| |
| Dreyfus Variable Investment Fund | |
| (Exact name of Registrant as specified in charter) | |
| | |
| c/o The Dreyfus Corporation 200 Park Avenue New York, New York 10166 | |
| (Address of principal executive offices) (Zip code) | |
| | |
| John Pak, Esq. 200 Park Avenue New York, New York 10166 | |
| (Name and address of agent for service) | |
|
Registrant's telephone number, including area code: | (212) 922-6000 |
| |
Date of fiscal year end: | 12/31 | |
Date of reporting period: | 12/31/2014 | |
| | | | | | | |
FORM N-CSR
Item 1. Reports to Stockholders.
Dreyfus Variable
Investment Fund,
Appreciation Portfolio
The views expressed in this report reflect those of the portfolio manager only through the end of the period covered and do not necessarily represent the views of Dreyfus or any other person in the Dreyfus organization. Any such views are subject to change at any time based upon market or other conditions and Dreyfus disclaims any responsibility to update such views.These views may not be relied on as investment advice and, because investment decisions for a Dreyfus fund are based on numerous factors, may not be relied on as an indication of trading intent on behalf of any Dreyfus fund.

| | Contents |
| | THE FUND |
| 2 | A Letter from the President |
| 3 | Discussion of Fund Performance |
| 6 | Fund Performance |
| 8 | Understanding Your Fund’s Expenses |
| 8 | Comparing Your Fund’s Expenses With Those of Other Funds |
| 9 | Statement of Investments |
| 13 | Statement of Assets and Liabilities |
| 14 | Statement of Operations |
| 15 | Statement of Changes in Net Assets |
| 17 | Financial Highlights |
| 19 | Notes to Financial Statements |
| 28 | Report of Independent Registered Public Accounting Firm |
| 29 | Important Tax Information |
| 30 | Board Members Information |
| 32 | Officers of the Fund |
| | FOR MORE INFORMATION |
| | Back Cover |
Dreyfus Variable Investment Fund,
Appreciation Portfolio
The Fund
A LETTER FROM THE PRESIDENT
Dear Shareholder:
We are pleased to present this annual report for Dreyfus Variable Investment Fund, Appreciation Portfolio, covering the 12-month period from January 1, 2014, through December 31, 2014. For information about how the fund performed during the reporting period, as well as general market perspectives, we provide a Discussion of Fund Performance on the pages that follow.
While U.S. equities’ 2014 gains fell short of their impressive 2013 performance, some broad measures of stock market performance posted their sixth consecutive year of positive results. Investor sentiment remained strong in an environment of sustained economic growth, rising corporate profits, muted inflation, and historically low interest rates. It also is noteworthy that stocks advanced despite persistent headwinds stemming from a sluggish global economy, which was characterized by economic weakness in Europe, Japan and China; intensifying geopolitical conflicts; and plummeting commodity prices.
Many economists appear to be optimistic about the prospects for 2015. Our own analysts agree and, in light of the ongoing benefits of low interest rates and depressed energy prices, see the potential for a somewhat faster pace of global growth in 2015 than in 2014. U.S. economic growth also seems poised to accelerate, largely due to the fading of drags from tight fiscal policies adopted in the wake of the Great Recession. Of course, a number of risks to U.S. and global economic growth remain, and changing conditions in 2015 are likely to benefit some industry groups more than others. That’s why we urge you to talk regularly with your financial advisor about the potential impact of macroeconomic developments on your investments.
Thank you for your continued confidence and support.

J. Charles Cardona
President
The Dreyfus Corporation
January 15, 2015
2
DISCUSSION OF FUND PERFORMANCE
For the period of January 1, 2014, through December 31, 2014, as provided by Fayez Sarofim, Portfolio Manager of Fayez Sarofim & Co., Sub-Investment Adviser
Fund and Market Performance Overview
For the 12-month period ended December 31, 2014, Dreyfus Variable Investment Fund, Appreciation Portfolio’s Initial shares produced a total return of 8.09%, and its Service shares produced a total return of 7.83%.1 In comparison, the fund’s benchmark, the Standard & Poor’s 500® Composite Stock Price Index (“S&P 500 Index”), produced a total return of 13.66% for the same period.2
The S&P 500 Index reached a series of new record highs over the reporting period as the U.S. economic recovery gained momentum.The fund produced lower returns than its benchmark, primarily due to overweighted exposure to energy stocks and stock selection shortfalls in the consumer staples sector.
The Fund’s Investment Approach
The fund seeks long-term capital growth consistent with the preservation of capital. Its secondary goal is current income. To pursue these goals, the fund normally invests at least 80% of its assets in common stocks.The fund focuses on blue-chip companies with total market capitalizations of more than $5 billion at the time of purchase, including multinational companies. These are established companies that have demonstrated sustained patterns of profitability, strong balance sheets, an expanding global presence, and the potential to achieve predictable, above-average earnings growth.
In choosing stocks, the fund first identifies economic sectors it believes will expand over the next three to five years or longer. Using fundamental analysis, the fund then seeks companies within these sectors that have proven track records and dominant positions in their industries.The fund employs a “buy-and-hold” investment strategy, which generally has resulted in an annual portfolio turnover of below 15%. A low portfolio turnover rate helps reduce the fund’s trading costs and minimizes tax liability by limiting the distribution of capital gains.3
The Fund 3
DISCUSSION OF FUND PERFORMANCE (continued)
S&P 500 Index Reached New Record Highs
The S&P 500 Index recorded a series of new highs in 2014 despite several short-lived sell-offs.The benchmark generated a double-digit return for the third consecutive year and has more than tripled from its March 2009 low. U.S. equity markets outpaced other developed nations as domestic economic growth gained traction. In contrast, economic weakness and financial strains resurfaced abroad, and foreign central banks generally adopted new stimulative measures. The U.S. dollar strengthened against nearly every major currency while oil prices plunged. Concerns about global growth intensified over the second half of the year, sparking increased market volatility. In this environment, large-cap stocks significantly outperformed their small-cap counterparts. The utilities, health care, and information technology sectors fared especially well, while the energy sector was the only market segment to post a decline.
Energy Exposure Weighed on Fund Performance
Although the fund participated significantly in the market’s gains, an overweighted allocation to the lagging energy sector undermined results compared to the benchmark. Still, the impact of our allocation strategy was mitigated by strong stock selections within the sector, in which we avoided most of the more volatile oilfield service and equipment stocks. Instead, we focused on stocks with compelling valuations, established records of returning capital to shareholders, and disciplined cost controls. Our stock selection strategy in the consumer staples sector also hurt relative performance, more than offsetting the benefits of overweighted exposure to the relatively strong performing area.An emphasis on the financials and health care sectors further dampened relative results.
On a more positive note, factors supporting relative performance over the year included underweighted positions and favorable stock selections in the consumer discretionary and industrials sectors, both of which generally lagged market averages. Lack of exposure to the telecommunications services sector also proved constructive. In the information technology sector, strong stock selections effectively balanced shortfalls stemming from underweighted exposure, resulting in a market-neutral impact for the sector overall.
Individual fund holdings making the most positive contributions to returns included Apple, Altria Group, Johnson & Johnson, AbbVie, Walgreens Boots Alliance, Procter & Gamble, Intel, and Texas Instruments. Holdings that detracted from performance included International Business Machines, Exxon Mobil,
4
Chevron, Occidental Petroleum, Freeport-McMoRan, Whole Foods Market, and Philip Morris International.
Maintaining a Focus on Fundamentals
In our view, the backdrop for U.S. equities remains constructive even as the Federal Reserve Board contemplates steps to normalize interest rate policy. Domestic economic growth appears to be gaining momentum and is projected to provide support for higher corporate profits and additional, if more modest, equity gains in the year ahead. However, uneven and desynchronized global trends have created greater uncertainty and have fueled recently heightened volatility. We believe that market leadership is increasingly likely to be determined by underlying business fundamentals and the type of attributes that have long been central to the fund’s investment strategy. In our view, the high-quality industry leaders in which we primarily invest have the financial resources, management expertise, and operational discipline to sustain growth and build shareholder value in more challenging environments.
January 15, 2015
|
| Please note, the position in any security highlighted with italicized typeface was sold during the reporting period. |
| Equity funds are subject generally to market, market sector, market liquidity, issuer, and investment style risks, among |
| other factors, to varying degrees, all of which are more fully described in the fund’s prospectus. |
| The fund is only available as a funding vehicle under variable life insurance policies or variable annuity contracts |
| issued by insurance companies. Individuals may not purchase shares of the fund directly.A variable annuity is an |
| insurance contract issued by an insurance company that enables investors to accumulate assets on a tax-deferred basis |
| for retirement or other long-term goals.The investment objective and policies of Dreyfus Variable Investment Fund, |
| Appreciation Portfolio made available through insurance products may be similar to other funds managed or advised |
| by Dreyfus. However, the investment results of the fund may be higher or lower than, and may not be comparable to, |
| those of any other Dreyfus fund. |
|
| 1 Total return includes reinvestment of dividends and any capital gains paid, and does not take into consideration the |
| maximum initial sales charge in the case of Class A shares, or the applicable contingent deferred sales charge imposed |
| on redemptions in the case of Class C shares. Had these charges been reflected, returns would have been lower. Past |
| performance is no guarantee of future results. Share price and investment return fluctuate such that upon redemption, |
| fund shares may be worth more or less than their original cost. |
| 2 SOURCE: LIPPER INC. – Reflects monthly reinvestment of dividends and, where applicable, capital gain |
| distributions.The Standard & Poor’s 500® Composite Stock Price Index is a widely accepted, unmanaged index of |
| U.S. stock market performance. Investors cannot invest directly in any index. |
| 3 Achieving tax efficiency is not a part of the fund’s investment objective, and there can be no guarantee that the fund |
| will achieve any particular level of taxable distributions in future years. In periods when the manager has to sell |
| significant amounts of securities (e.g., during periods of significant net redemptions or changes in index components), |
| the fund can be expected to be less tax efficient than during periods of more stable market conditions and asset flows. |
The Fund 5
FUND PERFORMANCE
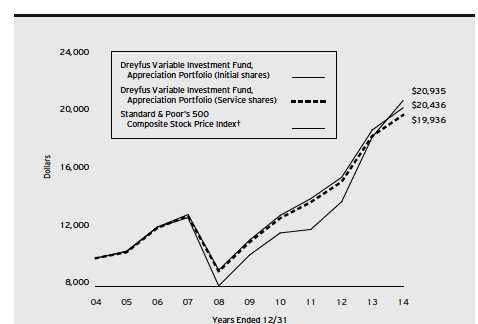
Comparison of change in value of $10,000 investment in Dreyfus Variable Investment Fund,
Appreciation Portfolio Initial shares and Service shares and the Standard & Poor’s 500
Composite Stock Price Index
| | | | | | |
| Average Annual Total Returns as of 12/31/14 | | | | | | |
| | 1 Year | | 5 Years | | 10 Years | |
| Initial shares | 8.09 | % | 12.69 | % | 7.41 | % |
| Service shares | 7.83 | % | 12.41 | % | 7.14 | % |
| Standard & Poor’s 500 | | | | | | |
| Composite Stock Price Index | 13.66 | % | 15.44 | % | 7.67 | % |
|
| † Source: Lipper Inc. |
| Past performance is not predictive of future performance.The fund’s performance shown in the graph and table does not |
| reflect the deduction of taxes that a shareholder would pay on fund distributions or the redemption of fund shares. |
| The fund’s performance does not reflect the deduction of additional charges and expenses imposed in connection |
| with investing in variable insurance contracts which will reduce returns. |
| The above graph compares a $10,000 investment made in Initial and Service shares of Dreyfus Variable Investment |
| Fund,Appreciation Portfolio on 12/31/04 to a $10,000 investment made in the Standard & Poor’s 500 Composite |
| Stock Price Index (the “Index”) on that date. |
6
The fund’s Initial shares are not subject to a Rule 12b-1 fee.The fund’s Service shares are subject to a 0.25% annual Rule 12b-1 fee. All dividends and capital gain distributions are reinvested.
The fund’s performance shown in the line graph above takes into account all applicable fund fees and expenses for Initial and Service shares.The Index is a widely accepted, unmanaged index of U.S. stock market performance. Unlike a mutual fund, the Index is not subject to charges, fees and other expenses. Investors cannot invest directly in any index. Further information relating to fund performance, including expense reimbursements, if applicable, is contained in the Financial Highlights section of the prospectus and elsewhere in this report.
The Fund 7
UNDERSTANDING YOUR FUND’S EXPENSES (Unaudited)
As a mutual fund investor, you pay ongoing expenses, such as management fees and other expenses. Using the information below, you can estimate how these expenses affect your investment and compare them with the expenses of other funds.You also may pay one-time transaction expenses, including sales charges (loads), redemption fees and expenses associated with variable annuity or insurance contracts, which are not shown in this section and would have resulted in higher total expenses. For more information, see your fund’s prospectus or talk to your financial adviser.
Review your fund’s expenses
The table below shows the expenses you would have paid on a $1,000 investment in Dreyfus Variable Investment Fund, Appreciation Portfolio from July 1, 2014 to December 31, 2014. It also shows how much a $1,000 investment would be worth at the close of the period, assuming actual returns and expenses.
Expenses and Value of a $1,000 Investment
assuming actual returns for the six months ended December 31, 2014
| | | | |
| | | Initial Shares | | Service Shares |
| Expenses paid per $1,000† | | $4.02 | | $5.29 |
| Ending value (after expenses) | | $1,017.30 | | $1,016.20 |
COMPARING YOUR FUND’S EXPENSES
WITH THOSE OF OTHER FUNDS (Unaudited)
Using the SEC’s method to compare expenses
The Securities and Exchange Commission (SEC) has established guidelines to help investors assess fund expenses. Per these guidelines, the table below shows your fund’s expenses based on a $1,000 investment, assuming a hypothetical 5% annualized return. You can use this information to compare the ongoing expenses (but not transaction expenses or total cost) of investing in the fund with those of other funds. All mutual fund shareholder reports will provide this information to help you make this comparison. Please note that you cannot use this information to estimate your actual ending account balance and expenses paid during the period.
Expenses and Value of a $1,000 Investment
assuming a hypothetical 5% annualized return for the six months ended December 31, 2014
| | | | |
| | | Initial Shares | | Service Shares |
| Expenses paid per $1,000† | | $4.02 | | $5.30 |
| Ending value (after expenses) | | $1,021.22 | | $1,019.96 |
|
| † Expenses are equal to the fund’s annualized expense ratio of .79% for Initial shares and 1.04% for Service shares, |
| multiplied by the average account value over the period, multiplied by 184/365 (to reflect the one-half year period). |
8
STATEMENT OF INVESTMENTS
December 31, 2014
| | | |
| Common Stocks—99.7% | Shares | | Value ($) |
| Banks—1.1% | | | |
| Wells Fargo & Co. | 120,000 | | 6,578,400 |
| Capital Goods—1.3% | | | |
| United Technologies | 67,000 | | 7,705,000 |
| Commercial & Professional Services—.1% | | | |
| CDK Global | 9,466 | | 385,834 |
| Consumer Durables & Apparel—1.8% | | | |
| Christian Dior | 56,100 | | 9,585,106 |
| Hermes International | 3,179 | | 1,133,552 |
| | | | 10,718,658 |
| Consumer Services—1.7% | | | |
| McDonald’s | 109,200 | | 10,232,040 |
| Diversified Financials—8.1% | | | |
| American Express | 75,000 | | 6,978,000 |
| BlackRock | 31,000 | | 11,084,360 |
| Franklin Resources | 183,000 | | 10,132,710 |
| JPMorgan Chase & Co. | 267,300 | | 16,727,634 |
| State Street | 40,000 | | 3,140,000 |
| | | | 48,062,704 |
| Energy—14.7% | | | |
| California Resources | 61,040 | | 336,330 |
| Chevron | 180,900 | | 20,293,362 |
| ConocoPhillips | 163,100 | | 11,263,686 |
| EOG Resources | 40,000 | | 3,682,800 |
| Exxon Mobil | 308,364 | | 28,508,252 |
| Imperial Oil | 100,000 | a | 4,303,000 |
| Occidental Petroleum | 152,600 | | 12,301,086 |
| Phillips 66 | 90,050 | | 6,456,585 |
| | | | 87,145,101 |
| Food & Staples Retailing—2.4% | | | |
| Walgreens Boots Alliance | 124,300 | | 9,471,660 |
| Whole Foods Market | 90,200 | | 4,547,884 |
| | | | 14,019,544 |
The Fund 9
STATEMENT OF INVESTMENTS (continued)
| | | |
| Common Stocks (continued) | Shares | | Value ($) |
| Food, Beverage & Tobacco—21.6% | | | |
| Altria Group | 373,100 | | 18,382,637 |
| Anheuser-Busch InBev, ADR | 27,000 | | 3,032,640 |
| Coca-Cola | 776,200 | | 32,771,164 |
| Diageo, ADR | 25,000 | | 2,852,250 |
| Mondelez International, Cl. A | 118,500 | | 4,304,512 |
| Nestle, ADR | 234,400 | | 17,099,480 |
| PepsiCo | 132,900 | | 12,567,024 |
| Philip Morris International | 392,100 | | 31,936,545 |
| SABMiller | 100,000 | | 5,175,238 |
| | | | 128,121,490 |
| Health Care Equipment & Services—1.4% | | | |
| Abbott Laboratories | 191,800 | | 8,634,836 |
| Household & Personal Products—4.8% | | | |
| Estee Lauder, Cl. A | 133,400 | | 10,165,080 |
| Procter & Gamble | 203,500 | | 18,536,815 |
| | | | 28,701,895 |
| Insurance—1.3% | | | |
| ACE | 65,000 | | 7,467,200 |
| Materials—2.1% | | | |
| Air Products & Chemicals | 5,000 | | 721,150 |
| Praxair | 92,000 | | 11,919,520 |
| | | | 12,640,670 |
| Media—6.5% | | | |
| Comcast, Cl. A | 140,000 | | 8,121,400 |
| McGraw-Hill Financial | 69,600 | | 6,193,008 |
| News Corp., Cl. A | 51,784 | b | 812,491 |
| Time Warner Cable | 11,300 | | 1,718,278 |
| Twenty-First Century Fox, Cl. A | 283,136 | | 10,873,838 |
| Walt Disney | 117,000 | | 11,020,230 |
| | | | 38,739,245 |
| Pharmaceuticals, Biotech & Life Sciences—11.2% | | | |
| AbbVie | 191,800 | | 12,551,392 |
| Gilead Sciences | 53,000 | b | 4,995,780 |
| Johnson & Johnson | 161,400 | | 16,877,598 |
10
| | | |
| Common Stocks (continued) | Shares | | Value ($) |
| Pharmaceuticals, Biotech & Life Sciences (continued) | | | |
| Novartis, ADR | 85,000 | | 7,876,100 |
| Novo Nordisk, ADR | 281,500 | | 11,913,080 |
| Roche Holding, ADR | 371,400 | | 12,623,886 |
| | | | 66,837,836 |
| Retailing—2.7% | | | |
| Target | 57,500 | | 4,364,825 |
| Wal-Mart Stores | 134,100 | | 11,516,508 |
| | | | 15,881,333 |
| Semiconductors & Semiconductor Equipment—3.4% | | | |
| Intel | 174,500 | | 6,332,605 |
| Texas Instruments | 218,300 | | 11,671,409 |
| Xilinx | 45,000 | | 1,948,050 |
| | | | 19,952,064 |
| Software & Services—4.8% | | | |
| Automatic Data Processing | 100,400 | | 8,370,348 |
| International Business Machines | 71,500 | | 11,471,460 |
| Oracle | 200,000 | | 8,994,000 |
| | | | 28,835,808 |
| Technology Hardware & Equipment—6.6% | | | |
| Apple | 301,700 | | 33,301,646 |
| QUALCOMM | 82,800 | | 6,154,524 |
| | | | 39,456,170 |
| Transportation—2.1% | | | |
| Canadian Pacific Railway | 50,000 | | 9,634,500 |
| Union Pacific | 25,000 | | 2,978,250 |
| | | | 12,612,750 |
| Total Common Stocks | | | |
| (cost $273,140,910) | | | 592,728,578 |
| |
| Other Investment—.2% | | | |
| Registered Investment Company; | | | |
| Dreyfus Institutional Preferred | | | |
| Plus Money Market Fund | | | |
| (cost $1,263,200) | 1,263,200 | c | 1,263,200 |
The Fund 11
STATEMENT OF INVESTMENTS (continued)
| | | | |
| Investment of Cash Collateral | | | | |
| for Securities Loaned—.7% | Shares | | Value ($) | |
| Registered Investment Company; | | | | |
| Dreyfus Institutional Cash Advantage Fund | | | | |
| (cost $4,154,880) | 4,154,880 | c | 4,154,880 | |
| Total Investments (cost $278,558,990) | 100.6 | % | 598,146,658 | |
| Liabilities, Less Cash and Receivables | (.6 | %) | (3,549,563 | ) |
| Net Assets | 100.0 | % | 594,597,095 | |
ADR—American Depository Receipts
|
| a Security, or portion thereof, on loan.At December 31, 2014, the value of the fund’s securities on loan was |
| $4,027,608 and the value of the collateral held by the fund was $4,154,880. |
| b Non-income producing security. |
| c Investment in affiliated money market mutual fund. |
| | | |
| Portfolio Summary (Unaudited)† | | |
| |
| | Value (%) | | Value (%) |
| Food, Beverage & Tobacco | 21.6 | Food & Staples Retailing | 2.4 |
| Energy | 14.7 | Materials | 2.1 |
| Pharmaceuticals, | | Transportation | 2.1 |
| Biotech & Life Sciences | 11.2 | Consumer Durables & Apparel | 1.8 |
| Diversified Financials | 8.1 | Consumer Services | 1.7 |
| Technology Hardware & Equipment | 6.6 | Health Care Equipment & Services | 1.4 |
| Media | 6.5 | Capital Goods | 1.3 |
| Household & Personal Products | 4.8 | Insurance | 1.3 |
| Software & Services | 4.8 | Banks | 1.1 |
| Semiconductors & | | Money Market Investments | .9 |
| Semiconductor Equipment | 3.4 | Commercial & Professional Services | .1 |
| Retailing | 2.7 | | 100.6 |
| |
| † Based on net assets. | | | |
| See notes to financial statements. | | | |
12
STATEMENT OF ASSETS AND LIABILITIES
December 31, 2014
| | |
| | Cost | Value |
| Assets ($): | | |
| Investments in securities—See Statement of Investments (including | | |
| securities on loan, valued at $4,027,608)—Note 1(b): | | |
| Unaffiliated issuers | 273,140,910 | 592,728,578 |
| Affiliated issuers | 5,418,080 | 5,418,080 |
| Cash | | 125,432 |
| Dividends and securities lending income receivable | | 1,512,914 |
| Prepaid expenses | | 3,054 |
| | | 599,788,058 |
| Liabilities ($): | | |
| Due to The Dreyfus Corporation and affiliates—Note 3(b) | | 348,706 |
| Due to Fayez Sarofim & Co. | | 110,565 |
| Liability for securities on loan—Note 1(b) | | 4,154,880 |
| Payable for shares of Beneficial Interest redeemed | | 508,391 |
| Accrued expenses | | 68,421 |
| | | 5,190,963 |
| Net Assets ($) | | 594,597,095 |
| Composition of Net Assets ($): | | |
| Paid-in capital | | 248,273,096 |
| Accumulated undistributed investment income—net | | 132,806 |
| Accumulated net realized gain (loss) on investments | | 26,603,525 |
| Accumulated net unrealized appreciation | | |
| (depreciation) on investments | | 319,587,668 |
| Net Assets ($) | | 594,597,095 |
| |
| |
| Net Asset Value Per Share | | |
| | Initial Shares | Service Shares |
| Net Assets ($) | 329,802,222 | 264,794,873 |
| Shares Outstanding | 6,660,858 | 5,378,816 |
| Net Asset Value Per Share ($) | 49.51 | 49.23 |
| |
| See notes to financial statements. | | |
The Fund 13
STATEMENT OF OPERATIONS
Year Ended December 31, 2014
| | |
| Investment Income ($): | | |
| Income: | | |
| Cash dividends (net of $445,854 foreign taxes withheld at source): | | |
| Unaffiliated issuers | 15,738,065 | |
| Affiliated issuers | 1,625 | |
| Income from securities lending—Note 1(b) | 9,801 | |
| Total Income | 15,749,491 | |
| Expenses: | | |
| Investment advisory fee—Note 3(a) | 3,176,973 | |
| Sub-investment advisory fee—Note 3(a) | 1,297,637 | |
| Distribution fees—Note 3(b) | 643,393 | |
| Professional fees | 93,660 | |
| Prospectus and shareholders’ reports | 50,162 | |
| Custodian fees—Note 3(b) | 45,580 | |
| Trustees’ fees and expenses—Note 3(c) | 32,372 | |
| Loan commitment fees—Note 2 | 6,141 | |
| Shareholder servicing costs—Note 3(b) | 2,031 | |
| Interest expense—Note 2 | 713 | |
| Miscellaneous | 42,002 | |
| Total Expenses | 5,390,664 | |
| Less—reduction in fees due to earnings credits—Note 3(b) | (7 | ) |
| Net Expenses | 5,390,657 | |
| Investment Income—Net | 10,358,834 | |
| Realized and Unrealized Gain (Loss) on Investments—Note 4 ($): | | |
| Net realized gain (loss) on investments | 27,347,692 | |
| Net unrealized appreciation (depreciation) on investments | 7,612,519 | |
| Net Realized and Unrealized Gain (Loss) on Investments | 34,960,211 | |
| Net Increase in Net Assets Resulting from Operations | 45,319,045 | |
| |
| See notes to financial statements. | | |
14
STATEMENT OF CHANGES IN NET ASSETS
| | | | |
| | Year Ended December 31, | |
| | 2014 | | 2013 | |
| Operations ($): | | | | |
| Investment income—net | 10,358,834 | | 11,040,818 | |
| Net realized gain (loss) on investments | 27,347,692 | | 16,061,416 | |
| Net unrealized appreciation | | | | |
| (depreciation) on investments | 7,612,519 | | 86,090,036 | |
| Net Increase (Decrease) in Net Assets | | | | |
| Resulting from Operations | 45,319,045 | | 113,192,270 | |
| Dividends to Shareholders from ($): | | | | |
| Investment income—net: | | | | |
| Initial Shares | (6,210,078 | ) | (6,893,926 | ) |
| Service Shares | (4,157,846 | ) | (4,166,702 | ) |
| Net realized gain on investments: | | | | |
| Initial Shares | (9,146,788 | ) | (845,058 | ) |
| Service Shares | (6,764,797 | ) | (570,306 | ) |
| Total Dividends | (26,279,509 | ) | (12,475,992 | ) |
| Beneficial Interest Transactions ($): | | | | |
| Net proceeds from shares sold: | | | | |
| Initial Shares | 16,457,471 | | 21,784,228 | |
| Service Shares | 35,946,895 | | 49,511,523 | |
| Dividends reinvested: | | | | |
| Initial Shares | 15,356,866 | | 7,738,984 | |
| Service Shares | 10,922,643 | | 4,737,008 | |
| Cost of shares redeemed: | | | | |
| Initial Shares | (72,828,378 | ) | (75,550,847 | ) |
| Service Shares | (45,422,441 | ) | (60,366,124 | ) |
| Increase (Decrease) in Net Assets from | | | | |
| Beneficial Interest Transactions | (39,566,944 | ) | (52,145,228 | ) |
| Total Increase (Decrease) in Net Assets | (20,527,408 | ) | 48,571,050 | |
| Net Assets ($): | | | | |
| Beginning of Period | 615,124,503 | | 566,553,453 | |
| End of Period | 594,597,095 | | 615,124,503 | |
| Undistributed investment income—net | 132,806 | | 141,896 | |
The Fund 15
STATEMENT OF CHANGES IN NET ASSETS (continued)
| | | | |
| | Year Ended December 31, | |
| | 2014 | | 2013 | |
| Capital Share Transactions: | | | | |
| Initial Shares | | | | |
| Shares sold | 342,337 | | 495,214 | |
| Shares issued for dividends reinvested | 325,702 | | 175,615 | |
| Shares redeemed | (1,518,733 | ) | (1,708,837 | ) |
| Net Increase (Decrease) in Shares Outstanding | (850,694 | ) | (1,038,008 | ) |
| Service Shares | | | | |
| Shares sold | 751,479 | | 1,130,343 | |
| Shares issued for dividends reinvested | 233,185 | | 108,119 | |
| Shares redeemed | (951,348 | ) | (1,372,296 | ) |
| Net Increase (Decrease) in Shares Outstanding | 33,316 | | (133,834 | ) |
| |
| See notes to financial statements. | | | | |
16
FINANCIAL HIGHLIGHTS
The following tables describe the performance for each share class for the fiscal periods indicated. All information (except portfolio turnover rate) reflects financial results for a single fund share.Total return shows how much your investment in the fund would have increased (or decreased) during each period, assuming you had reinvested all dividends and distributions. The fund’s total returns do not reflect expenses associated with variable annuity or insurance contracts.These figures have been derived from the fund’s financial statements.
| | | | | | | | | | |
| | | | Year Ended December 31, | | | |
| Initial Shares | 2014 | | 2013 | | 2012 | | 2011 | | 2010 | |
| Per Share Data ($): | | | | | | | | | | |
| Net asset value, beginning of period | 47.95 | | 40.47 | | 37.99 | | 35.44 | | 31.40 | |
| Investment Operations: | | | | | | | | | | |
| Investment income—neta | .89 | | .86 | | .82 | | .73 | | .64 | |
| Net realized and unrealized | | | | | | | | | | |
| gain (loss) on investments | 2.86 | | 7.59 | | 3.14 | | 2.42 | | 4.09 | |
| Total from Investment Operations | 3.75 | | 8.45 | | 3.96 | | 3.15 | | 4.73 | |
| Distributions: | | | | | | | | | | |
| Dividends from investment income—net | (.90 | ) | (.87 | ) | (1.48 | ) | (.60 | ) | (.69 | ) |
| Dividends from net realized | | | | | | | | | | |
| gain on investments | (1.29 | ) | (.10 | ) | — | | — | | — | |
| Total Distributions | (2.19 | ) | (.97 | ) | (1.48 | ) | (.60 | ) | (.69 | ) |
| Net asset value, end of period | 49.51 | | 47.95 | | 40.47 | | 37.99 | | 35.44 | |
| Total Return (%) | 8.09 | | 21.11 | | 10.44 | | 9.01 | | 15.32 | |
| Ratios/Supplemental Data (%): | | | | | | | | | | |
| Ratio of total expenses | | | | | | | | | | |
| to average net assets | .80 | | .81 | | .81 | | .80 | | .81 | |
| Ratio of net expenses | | | | | | | | | | |
| to average net assets | .80 | | .81 | | .81 | | .80 | | .81 | |
| Ratio of net investment income | | | | | | | | | | |
| to average net assets | 1.84 | | 1.95 | | 2.02 | | 1.99 | | 2.01 | |
| Portfolio Turnover Rate | 3.65 | | 7.71 | | 3.05 | | 4.24 | | 11.90 | |
| Net Assets, end of period ($ x 1,000) | 329,802 | | 360,197 | | 345,985 | | 326,445 | | 310,385 | |
| |
| a Based on average shares outstanding. | | | | | | | | | | |
| See notes to financial statements. | | | | | | | | | | |
The Fund 17
FINANCIAL HIGHLIGHTS (continued)
| | | | | | | | | | |
| | | | Year Ended December 31, | | | |
| Service Shares | 2014 | | 2013 | | 2012 | | 2011 | | 2010 | |
| Per Share Data ($): | | | | | | | | | | |
| Net asset value, beginning of period | 47.69 | | 40.25 | | 37.74 | | 35.23 | | 31.21 | |
| Investment Operations: | | | | | | | | | | |
| Investment income—neta | .76 | | .75 | | .72 | | .63 | | .58 | |
| Net realized and unrealized | | | | | | | | | | |
| gain (loss) on investments | 2.85 | | 7.55 | | 3.10 | | 2.42 | | 4.05 | |
| Total from Investment Operations | 3.61 | | 8.30 | | 3.82 | | 3.05 | | 4.63 | |
| Distributions: | | | | | | | | | | |
| Dividends from investment income—net | (.78 | ) | (.76 | ) | (1.31 | ) | (.54 | ) | (.61 | ) |
| Dividends from net realized | | | | | | | | | | |
| gain on investments | (1.29 | ) | (.10 | ) | — | | — | | — | |
| Total Distributions | (2.07 | ) | (.86 | ) | (1.31 | ) | (.54 | ) | (.61 | ) |
| Net asset value, end of period | 49.23 | | 47.69 | | 40.25 | | 37.74 | | 35.23 | |
| Total Return (%) | 7.83 | | 20.83 | | 10.14 | | 8.74 | | 15.04 | |
| Ratios/Supplemental Data (%): | | | | | | | | | | |
| Ratio of total expenses | | | | | | | | | | |
| to average net assets | 1.05 | | 1.06 | | 1.06 | | 1.05 | | 1.06 | |
| Ratio of net expenses | | | | | | | | | | |
| to average net assets | 1.05 | | 1.06 | | 1.06 | | 1.05 | | 1.06 | |
| Ratio of net investment income | | | | | | | | | | |
| to average net assets | 1.59 | | 1.70 | | 1.79 | | 1.75 | | 1.74 | |
| Portfolio Turnover Rate | 3.65 | | 7.71 | | 3.05 | | 4.24 | | 11.90 | |
| Net Assets, end of period ($ x 1,000) | 264,795 | | 254,928 | | 220,568 | | 174,160 | | 125,296 | |
| |
| a Based on average shares outstanding. | | | | | | | | | | |
| See notes to financial statements. | | | | | | | | | | |
18
NOTES TO FINANCIAL STATEMENTS
NOTE 1—Significant Accounting Policies:
Dreyfus Variable Investment Fund (the “Company”) is registered under the Investment Company Act of 1940, as amended (the “Act”), as an open-end management investment company, operating as a series company currently offering seven series, including the Appreciation Portfolio (the “fund”). The fund is only offered to separate accounts established by insurance companies to fund variable annuity contracts and variable life insurance policies.The fund is a diversified series.The fund’s investment objective is to seek long-term capital growth consistent with the preservation of capital. The Dreyfus Corporation (the “Manager” or “Dreyfus”), a wholly-owned subsidiary of The Bank of New York Mellon Corporation (“BNY Mellon”), serves as the fund’s investment adviser. Fayez Sarofim & Co. (“Sarofim & Co.”) serves as the fund’s sub-investment adviser.
MBSC Securities Corporation (the “Distributor”), a wholly-owned subsidiary of Dreyfus, is the distributor of the fund’s shares, which are sold without a sales charge.The fund is authorized to issue an unlimited number of $.001 par value shares of Beneficial Interest in each of the following classes of shares: Initial and Service. Each class of shares has identical rights and privileges, except with respect to the Distribution Plan and the expenses borne by each class, the allocation of certain transfer agency costs, and certain voting rights. Income, expenses (other than expenses attributable to a specific class), and realized and unrealized gains or losses on investments are allocated to each class of shares based on its relative net assets.
The Company accounts separately for the assets, liabilities and operations of each series. Expenses directly attributable to each series are charged to that series’ operations; expenses which are applicable to all series are allocated among them on a pro rata basis.
The Financial Accounting Standards Board (“FASB”) Accounting Standards Codification (“ASC”) is the exclusive reference of authoritative U.S. generally accepted accounting principles (“GAAP”) recognized by the FASB to be applied by nongovernmental entities. Rules and inter-
The Fund 19
NOTES TO FINANCIAL STATEMENTS (continued)
pretive releases of the Securities and Exchange Commission (“SEC”) under authority of federal laws are also sources of authoritative GAAP for SEC registrants. The fund’s financial statements are prepared in accordance with GAAP, which may require the use of management estimates and assumptions. Actual results could differ from those estimates.
The Company enters into contracts that contain a variety of indemnifications. The fund’s maximum exposure under these arrangements is unknown.The fund does not anticipate recognizing any loss related to these arrangements.
(a) Portfolio valuation: The fair value of a financial instrument is the amount that would be received to sell an asset or paid to transfer a liability in an orderly transaction between market participants at the measurement date (i.e., the exit price). GAAP establishes a fair value hierarchy that prioritizes the inputs of valuation techniques used to measure fair value. This hierarchy gives the highest priority to unadjusted quoted prices in active markets for identical assets or liabilities (Level 1 measurements) and the lowest priority to unobservable inputs (Level 3 measurements).
Additionally, GAAP provides guidance on determining whether the volume and activity in a market has decreased significantly and whether such a decrease in activity results in transactions that are not orderly. GAAP requires enhanced disclosures around valuation inputs and techniques used during annual and interim periods.
Various inputs are used in determining the value of the fund’s investments relating to fair value measurements.These inputs are summarized in the three broad levels listed below:
Level 1—unadjusted quoted prices in active markets for identical investments.
Level 2—other significant observable inputs (including quoted prices for similar investments, interest rates, prepayment speeds, credit risk, etc.).
Level 3—significant unobservable inputs (including the fund’s own assumptions in determining the fair value of investments).
20
The inputs or methodology used for valuing securities are not necessarily an indication of the risk associated with investing in those securities.
Changes in valuation techniques may result in transfers in or out of an assigned level within the disclosure hierarchy. Valuation techniques used to value the fund’s investments are as follows:
Investments in securities are valued at the last sales price on the securities exchange or national securities market on which such securities are primarily traded. Securities listed on the National Market System for which market quotations are available are valued at the official closing price or, if there is no official closing price that day, at the last sales price. For open short positions, asked prices are used for valuation purposes. Bid price is used when no asked price is available. Registered investment companies that are not traded on an exchange are valued at their net asset value.All of the preceding securities are generally categorized within Level 1 of the fair value hierarchy.
Securities not listed on an exchange or the national securities market, or securities for which there were no transactions, are valued at the average of the most recent bid and asked prices. These securities are generally categorized within Level 2 of the fair value hierarchy.
Fair valuing of securities may be determined with the assistance of a pricing service using calculations based on indices of domestic securities and other appropriate indicators, such as prices of relevant ADRs and financial futures. Utilizing these techniques may result in transfers between Level 1 and Level 2 of the fair value hierarchy.
When market quotations or official closing prices are not readily available, or are determined not to reflect accurately fair value, such as when the value of a security has been significantly affected by events after the close of the exchange or market on which the security is principally traded (for example, a foreign exchange or market), but before the fund calculates its net asset value, the fund may value these investments at fair value as determined in accordance with the procedures approved by the Company’s Board of Trustees (the “Board”).
The Fund 21
NOTES TO FINANCIAL STATEMENTS (continued)
Certain factors may be considered when fair valuing investments such as: fundamental analytical data, the nature and duration of restrictions on disposition, an evaluation of the forces that influence the market in which the securities are purchased and sold, and public trading in similar securities of the issuer or comparable issuers. These securities are either categorized within Level 2 or 3 of the fair value hierarchy depending on the relevant inputs used.
For restricted securities where observable inputs are limited, assumptions about market activity and risk are used and are generally categorized within Level 3 of the fair value hierarchy.
The following is a summary of the inputs used as of December 31, 2014 in valuing the fund's investments:
| | | | | |
| | | Level 2—Other | | Level 3— | |
| | Level 1— | Significant | | Significant | |
| | Unadjusted | Observable | | Unobservable | |
| | Quoted Prices | Inputs | | Inputs | Total |
| Assets ($) | | | | | |
| Investments in Securities: | | | | |
| Equity Securities— | | | | | |
| Domestic | | | | | |
| Common Stocks† | 507,499,746 | — | | — | 507,499,746 |
| Equity Securities— | | | | | |
| Foreign | | | | | |
| Common Stocks† | 69,334,936 | 15,893,896 | †† | — | 85,228,832 |
| Mutual Funds | 5,418,080 | — | | — | 5,418,080 |
| |
| † | See Statement of Investments for additional detailed categorizations. |
| †† | Securities classified within Level 2 at period end as the values were determined pursuant to the |
| | fund’s fair valuation procedures. See note above for additional information. |
At December 31, 2013, no exchange traded foreign equity securities were classified within Level 2 of the fair value hierarchy.
(b) Securities transactions and investment income: Securities transactions are recorded on a trade date basis. Realized gains and losses from securities transactions are recorded on the identified cost basis. Dividend income is recognized on the ex-dividend date and interest income, including, where applicable, accretion of discount and amortization of premium on investments, is recognized on the accrual basis.
22
Pursuant to a securities lending agreement with The Bank of New York Mellon, a subsidiary of BNY Mellon and an affiliate of Dreyfus, the fund may lend securities to qualified institutions. It is the fund’s policy that, at origination, all loans are secured by collateral of at least 102% of the value of U.S. securities loaned and 105% of the value of foreign securities loaned. Collateral equivalent to at least 100% of the market value of securities on loan is maintained at all times. Collateral is either in the form of cash, which can be invested in certain money market mutual funds managed by Dreyfus or U.S. Government and Agency securities.The fund is entitled to receive all dividends, interest and distributions on securities loaned, in addition to income earned as a result of the lending transaction. Should a borrower fail to return the securities in a timely manner, The Bank of New York Mellon is required to replace the securities for the benefit of the fund or credit the fund with the market value of the unreturned securities and is subrogated to the fund’s rights against the borrower and the collateral. During the period ended December 31, 2014,The Bank of New York Mellon earned $2,415 from lending portfolio securities, pursuant to the securities lending agreement.
(c) Affiliated issuers: Investments in other investment companies advised by Dreyfus are defined as “affiliated” under the Act. Investments in affiliated investment companies during the period ended December 31, 2014 were as follows:
| | | | | | |
| Affiliated | | | | | | |
| Investment | Value | | | | Value | Net |
| Company | 12/31/2013 ($) | | Purchases ($) | Sales ($) | 12/31/2014 ($) | Assets (%) |
| Dreyfus | | | | | | |
| Institutional | | | | | | |
| Preferred | | | | | | |
| Plus Money | | | | | | |
| Market Fund | 745,413 | | 49,980,362 | 49,462,575 | 1,263,200 | .2 |
| Dreyfus | | | | | | |
| Institutional | | | | | | |
| Cash Advantage | | | | | | |
| Fund | 2,088,930 | | 37,897,141 | 35,831,191 | 4,154,880 | .7 |
| Total | 2,834,343 | | 87,877,503 | 85,293,766 | 5,418,080 | .9 |
The Fund 23
NOTES TO FINANCIAL STATEMENTS (continued)
(d) Dividends to shareholders: Dividends are recorded on the ex-dividend date. Dividends from investment income-net are normally declared and paid quarterly. Dividends from net realized capital gains, if any, are normally declared and paid annually, but the fund may make distributions on a more frequent basis to comply with the distribution requirements of the Internal Revenue Code of 1986, as amended (the “Code”). To the extent that net realized capital gains can be offset by capital loss carryovers, it is the policy of the fund not to distribute such gains. Income and capital gain distributions are determined in accordance with income tax regulations, which may differ from GAAP.
(e) Federal income taxes: It is the policy of the fund to continue to qualify as a regulated investment company, if such qualification is in the best interests of its shareholders, by complying with the applicable provisions of the Code, and to make distributions of taxable income sufficient to relieve it from substantially all federal income and excise taxes.
As of and during the period ended December 31, 2014, the fund did not have any liabilities for any uncertain tax positions. The fund recognizes interest and penalties, if any, related to uncertain tax positions as income tax expense in the Statement of Operations. During the period ended December 31, 2014, the fund did not incur any interest or penalties.
Each tax year in the four-year period ended December 31, 2014 remains subject to examination by the Internal Revenue Service and state taxing authorities.
At December 31, 2014, the components of accumulated earnings on tax basis were as follows: undistributed ordinary income $262,224, undistributed capital gains $26,530,955 and unrealized appreciation $319,530,820.
The tax character of distributions paid to shareholders during the fiscal periods ended December 31, 2014 and December 31, 2013 were as follows: ordinary income $10,543,184 and $11,060,628, and long-term capital gains $15,736,325 and $1,415,364, respectively.
24
NOTE 2—Bank Lines of Credit:
The fund participates with other Dreyfus-managed funds in a $430 million unsecured credit facility led by Citibank, N.A. and a $300 million unsecured credit facility provided by The Bank of New York Mellon (each, a “Facility”), each to be utilized primarily for temporary or emergency purposes, including the financing of redemptions. Prior to October 8, 2014, the unsecured credit facility with Citibank, N.A. was $265 million. In connection therewith, the fund has agreed to pay its pro rata portion of commitment fees for each Facility. Interest is charged to the fund based on rates determined pursuant to the terms of the respective Facility at the time of borrowing.
The average amount of borrowings outstanding under the Facilities during the period ended December 31, 2014 was approximately $65,500 with a related weighted average annualized interest rate of 1.09%.
NOTE 3—Investment Advisory Fee, Sub-Investment Advisory Fee and Other Transactions with Affiliates:
(a) Pursuant to an investment advisory agreement with Dreyfus, the investment advisory fee is computed at the annual rate of .5325% of the value of the fund’s average daily net assets. Pursuant to a sub-investment advisory agreement with Sarofim & Co., the fund pays Sarofim & Co. a monthly sub-investment advisory fee at the annual rate of .2175% of the value of the fund’s average daily net assets. Both fees are payable monthly.
(b) Under the Distribution Plan adopted pursuant to Rule 12b-1 under the Act, Service shares pay the Distributor for distributing its shares, for servicing and/or maintaining Service shares’ shareholder accounts and for advertising and marketing for Service shares. The Distribution Plan provides for payments to be made at an annual rate of .25% of the value of the Service shares’ average daily net assets.The Distributor may make payments to Participating Insurance Companies and to brokers and dealers acting as principal underwriter for their
The Fund 25
NOTES TO FINANCIAL STATEMENTS (continued)
variable insurance products. The fees payable under the Distribution Plan are payable without regard to actual expenses incurred. During the period ended December 31, 2014, Service shares were charged $643,393 pursuant to the Distribution Plan.
The fund has arrangements with the transfer agent and the custodian whereby the fund may receive earnings credits when positive cash balances are maintained, which are used to offset transfer agency and custody fees. For financial reporting purposes, the fund includes net earnings credits as an expense offset in the Statement of Operations.
The fund compensates Dreyfus Transfer, Inc., a wholly-owned subsidiary of Dreyfus, under a transfer agency agreement for providing transfer agency and cash management services for the fund.The majority of transfer agency fees are comprised of amounts paid on a per account basis, while cash management fees are related to fund subscriptions and redemptions. During the period ended December 31, 2014, the fund was charged $1,898 for transfer agency services and $126 for cash management services.These fees are included in Shareholder servicing costs in the Statement of Operations. Cash management fees were partially offset by earnings credits of $7.
The fund compensates The Bank of NewYork Mellon under a custody agreement for providing custodial services for the fund.These fees are determined based on net assets, geographic region and transaction activity. During the period ended December 31, 2014, the fund was charged $45,580 pursuant to the custody agreement.
During the period ended December 31, 2014, the fund was charged $7,771 for services performed by the Chief Compliance Officer and his staff.
The components of “Due to The Dreyfus Corporation and affiliates” in the Statement of Assets and Liabilities consist of: investment advisory fees $270,693, Distribution Plan fees $56,500, custodian fees $19,356, Chief Compliance Officer fees $1,851 and transfer agency fees $306.
26
(c) Each Board member also serves as a Board member of other funds within the Dreyfus complex. Annual retainer fees and attendance fees are allocated to each fund based on net assets.
NOTE 4—Securities Transactions:
The aggregate amount of purchases and sales of investment securities, excluding short-term securities, during the period ended December 31, 2014, amounted to $21,732,630 and $76,740,743, respectively.
At December 31, 2014, the cost of investments for federal income tax purposes was $278,615,838; accordingly, accumulated net unrealized appreciation on investments was $319,530,820, consisting of $320,168,699 gross unrealized appreciation and $637,879 gross unrealized depreciation.
The Fund 27
REPORT OF INDEPENDENT REGISTERED
PUBLIC ACCOUNTING FIRM
Shareholders and Board of Trustees
Dreyfus Variable Investment Fund, Appreciation Portfolio
We have audited the accompanying statement of assets and liabilities, including the statement of investments, of Dreyfus Variable Investment Fund, Appreciation Portfolio (one of the series comprising Dreyfus Variable Investment Fund) as of December 31, 2014, and the related statement of operations for the year then ended, the statement of changes in net assets for each of the two years in the period then ended, and the financial highlights for each of the five years in the period then ended. These financial statements and financial highlights are the responsibility of the Fund’s management. Our responsibility is to express an opinion on these financial statements and financial highlights based on our audits.
We conducted our audits in accordance with the standards of the Public Company Accounting Oversight Board (United States). Those standards require that we plan and perform the audit to obtain reasonable assurance about whether the financial statements and financial highlights are free of material misstatement. We were not engaged to perform an audit of the Fund’s internal control over financial reporting. Our audits included consideration of internal control over financial reporting as a basis for designing audit procedures that are appropriate in the circumstances, but not for the purpose of expressing an opinion on the effectiveness of the Fund’s internal control over financial reporting. Accordingly, we express no such opinion. An audit also includes examining, on a test basis, evidence supporting the amounts and disclosures in the financial statements and financial highlights, assessing the accounting principles used and significant estimates made by management, and evaluating the overall financial statement presentation. Our procedures included confirmation of securities owned as of December 31, 2014 by correspondence with the custodian and others.We believe that our audits provide a reasonable basis for our opinion.
In our opinion, the financial statements and financial highlights referred to above present fairly, in all material respects, the financial position of Dreyfus Variable Investment Fund, Appreciation Portfolio at December 31, 2014, the results of its operations for the year then ended, the changes in its net assets for each of the two years in the period then ended, and the financial highlights for each of the five years in the period then ended, in conformity with U.S. generally accepted accounting principles.

New York, New York
February 11, 2015
28
IMPORTANT TAX INFORMATION (Unaudited)
For federal tax purposes, the fund hereby reports 100% of the ordinary dividends paid during the fiscal year ended December 31, 2014 as qualifying for the corporate dividends received deduction. Shareholders will receive notification in early 2015 of the percentage applicable to the preparation of their 2014 income tax returns. Also, the fund hereby reports $.0142 per share as a short-term capital gain distribution and $1.2750 per share as a long-term capital gain distribution paid on March 31, 2014.
The Fund 29
BOARD MEMBERS INFORMATION (Unaudited)
INDEPENDENT BOARD MEMBERS
|
| Joseph S. DiMartino (71) |
| Chairman of the Board (1995) |
| Principal Occupation During Past 5Years: |
| • Corporate Director and Trustee (1995-present) |
| Other Public Company Board Memberships During Past 5Years: |
| • CBIZ (formerly, Century Business Services, Inc.), a provider of outsourcing functions for small |
| and medium size companies, Director (1997-present) |
| • The Newark Group, a provider of a national market of paper recovery facilities, paperboard |
| mills and paperboard converting plants, Director (2000-2010) |
| • Sunair Services Corporation, a provider of certain outdoor-related services to homes and |
| businesses, Director (2005-2009) |
| No. of Portfolios for which Board Member Serves: 146 |
| ——————— |
| Peggy C. Davis (71) |
| Board Member (2006) |
| Principal Occupation During Past 5Years: |
| • Shad Professor of Law, New York University School of Law (1983-present) |
| No. of Portfolios for which Board Member Serves: 52 |
| ——————— |
| David P. Feldman (75) |
| Board Member (1994) |
| Principal Occupation During Past 5Years: |
| • Corporate Director and Trustee (1985-present) |
| Other Public Company Board Membership During Past 5Years: |
| • BBH Mutual Funds Group (5 registered mutual funds), Director (1992-present) |
| No. of Portfolios for which Board Member Serves: 38 |
| ——————— |
| Ehud Houminer (74) |
| Board Member (2006) |
| Principal Occupation During Past 5Years: |
| • Executive-in-Residence at the Columbia Business School, Columbia University (1992-present) |
| Other Public Company Board Membership During Past 5Years: |
| • Avnet, Inc., an electronics distributor, Director (1993-2012) |
| No. of Portfolios for which Board Member Serves: 62 |
30
Lynn Martin (75)
Board Member (2012)
|
| Principal Occupation During Past 5Years: |
| • President, of The Martin Hall Group LLC, a human resources consulting firm (2005-2012) |
| Other Public Company Board Memberships During Past 5Years: |
| • AT&T, Inc., a telecommunications company, Director (1999-2012) |
| • Ryder System, Inc., a supply chain and transportation management company, Director (1993-2012) |
| • The Proctor & Gamble Co., a consumer products company, Director (1994-2009) |
| • Constellation Energy Group, Inc., Director (2003-2009) |
| No. of Portfolios for which Board Member Serves: 38 |
| |
| ——————— |
| Robin A. Melvin (51) |
| Board Member (2012) |
| Principal Occupation During Past 5Years: |
| • Board Member, Illinois Mentoring Partnership, non-profit organization dedicated to increasing |
| the quantity and quality of mentoring services in Illinois (2013-present) |
| • Director, Boisi Family Foundation, a private family foundation that supports youth-serving organi- |
| zations that promote the self sufficiency of youth from disadvantaged circumstances (1995-2012) |
| No. of Portfolios for which Board Member Serves: 114 |
| |
| ——————— |
| Dr. Martin Peretz (75) |
| Board Member (1990) |
| Principal Occupation During Past 5Years: |
| • Editor-in-Chief Emeritus of The New Republic Magazine (2010-2011) (previously, |
| Editor-in-Chief, 1974-2010) |
| • Director of TheStreet.com, a financial information service on the web (1996-2010) |
| No. of Portfolios for which Board Member Serves: 38 |
| |
| ——————— |
| Once elected all Board Members serve for an indefinite term, but achieve Emeritus status upon reaching age 80.The |
| address of the Board Members and Officers is c/o The Dreyfus Corporation, 200 Park Avenue, NewYork, NewYork |
| 10166.Additional information about the Board Members is available in the fund’s Statement of Additional Information |
| which can be obtained from Dreyfus free of charge by calling this toll free number: 1-800-DREYFUS. |
| James F. Henry, Emeritus Board Member |
| Rosalind G. Jacobs, Emeritus Board Member |
| Dr. Paul A. Marks, Emeritus Board Member |
| Philip L.Toia, Emeritus Board Member |
The Fund 31
OFFICERS OF THE FUND (Unaudited)
32
The Fund 33
For More Information

Telephone 1-800-554-4611 or 1-516-338-3300
Mail The Dreyfus Family of Funds, 144 Glenn Curtiss Boulevard, Uniondale, NY 11556-0144
Attn: Investments Division
The fund files its complete schedule of portfolio holdings with the Securities and Exchange Commission (“SEC”) for the first and third quarters of each fiscal year on Form N-Q. The fund’s Forms N-Q are available on the SEC’s website at http://www.sec.gov and may be reviewed and copied at the SEC’s Public Reference Room in Washington, DC. Information on the operation of the Public Reference Room may be obtained by calling 1-800-SEC-0330.
A description of the policies and procedures that the fund uses to determine how to vote proxies relating to portfolio securities, and information regarding how the fund voted these proxies for the most recent 12-month period ended June 30 is available at http://www.dreyfus.com and on the SEC’s website at http://www.sec.gov. The description of the policies and procedures is also available without charge, upon request, by calling 1-800-DREYFUS.

Dreyfus Variable
Investment Fund,
Growth and Income
Portfolio

The views expressed in this report reflect those of the portfolio manager only through the end of the period covered and do not necessarily represent the views of Dreyfus or any other person in the Dreyfus organization. Any such views are subject to change at any time based upon market or other conditions and Dreyfus disclaims any responsibility to update such views.These views may not be relied on as investment advice and, because investment decisions for a Dreyfus fund are based on numerous factors, may not be relied on as an indication of trading intent on behalf of any Dreyfus fund.
| | Contents |
| | THE FUND |
| 2 | A Letter from the President |
| 3 | Discussion of Fund Performance |
| 6 | Fund Performance |
| 8 | Understanding Your Fund’s Expenses |
| 8 | Comparing Your Fund’s Expenses With Those of Other Funds |
| 9 | Statement of Investments |
| 15 | Statement of Assets and Liabilities |
| 16 | Statement of Operations |
| 17 | Statement of Changes in Net Assets |
| 19 | Financial Highlights |
| 21 | Notes to Financial Statements |
| 30 | Report of Independent Registered Public Accounting Firm |
| 31 | Important Tax Information |
| 32 | Board Members Information |
| 34 | Officers of the Fund |
| | FOR MORE INFORMATION |
| | Back Cover |
Dreyfus Variable Investment Fund,
Growth and Income Portfolio
The Fund
A LETTER FROM THE PRESIDENT
Dear Shareholder:
We are pleased to present this annual report for Dreyfus Variable Investment Fund, Growth and Income Portfolio, covering the 12-month period from January 1, 2014, through December 31, 2014. For information about how the fund performed during the reporting period, as well as general market perspectives, we provide a Discussion of Fund Performance on the pages that follow.
While U.S. equities’ 2014 gains fell short of their impressive 2013 performance, some broad measures of stock market performance posted their sixth consecutive year of positive results. Investor sentiment remained strong in an environment of sustained economic growth, rising corporate profits, muted inflation, and historically low interest rates. It also is noteworthy that stocks advanced despite persistent headwinds stemming from a sluggish global economy, which was characterized by economic weakness in Europe, Japan and China; intensifying geopolitical conflicts; and plummeting commodity prices.
Many economists appear to be optimistic about the prospects for 2015. Our own analysts agree and, in light of the ongoing benefits of low interest rates and depressed energy prices, see the potential for a somewhat faster pace of global growth in 2015 than in 2014. U.S. economic growth also seems poised to accelerate, largely due to the fading of drags from tight fiscal policies adopted in the wake of the Great Recession. Of course, a number of risks to U.S. and global economic growth remain, and changing conditions in 2015 are likely to benefit some industry groups more than others. That’s why we urge you to talk regularly with your financial advisor about the potential impact of macroeconomic developments on your investments.
Thank you for your continued confidence and support.

J. Charles Cardona
President
The Dreyfus Corporation
January 15, 2015
2
DISCUSSION OF FUND PERFORMANCE
For the period of January 1, 2014, through December 31, 2014, as provided by John Bailer and Elizabeth Slover, Portfolio Managers
Fund and Market Performance Overview
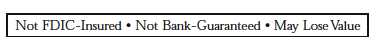
For the 12-month period ended December 31, 2014, Dreyfus Variable Investment Fund, Growth and Income Portfolio’s Initial shares achieved a total return of 10.07%, and its Service shares returned 9.83%.1 In comparison, the fund’s benchmark, the Standard & Poor’s 500® Composite Stock Price Index (the “S&P 500 Index”), produced a total return of 13.66% for the same period.2
U.S. equities climbed during 2014 in response to a recovering economy and strong corporate earnings.The fund participated in the market’s gains to a significant degree, but shortfalls in the information technology, industrials, consumer discretionary, and consumer staples sectors caused it to lag the benchmark.
The Fund’s Investment Approach
The fund seeks long-term capital growth, current income, and growth of income consistent with reasonable investment risk.To pursue these goals, the fund normally invests primarily in stocks of domestic and foreign issuers.We seek to create a portfolio that includes a blend of growth and dividend-paying stocks, as well as other investments that provide income.We choose stocks through a disciplined investment process that combines computer modeling techniques, “bottom-up” fundamental analysis, and risk management. The investment process is designed to provide investors with investment exposure to sector weightings and risk characteristics similar to those of the S&P 500 Index.
Higher Yielding Stocks Led Markets Higher
After bouts of weakness during the opening weeks of 2014, U.S. stocks rebounded strongly, climbing from February through June amid expectations that short-term interest rates would remain low even though the domestic economy rebounded at a robust 4.6% annualized rate during the second quarter. The market encountered renewed volatility in July and September due to renewed concerns that a weak global economy might derail the U.S. expansion. However, strong corporate earnings and
The Fund 3
DISCUSSION OF FUND PERFORMANCE (continued)
solid domestic economic data—including an estimated 5.0% annualized GDP growth rate for the third quarter—drove the S&P 500 Index to a series of new record highs by year-end.
The market’s advance benefited some economic sectors more than others. Concerns about slowing growth in Europe, China, and Japan—along with historically low interest rates and bond yields—caused investors to favor higher yielding stocks in traditionally defensive, dividend-paying market sectors. In contrast, more economically sensitive stocks in areas such as the consumer discretionary sector produced relatively weak gains.
Security Selections Drove Fund Performance
A handful of individual holdings in the information technology sector comprised the fund’s most significant disappointments in 2014. Semiconductor maker Xilinx was hurt by exposure to the slowing Chinese market and by excess inventory. Professional networking provider LinkedIn reported weaker-than-expected user metrics. Social network Twitter proved slow to monetize its user base. Our lack of exposure to semiconductor giant Intel further hurt relative returns.
Among industrial stocks, notably weak performers included construction and engineering firm Fluor, which suffered from exposure to falling oil prices; defense and aerospace parts maker Precision Castparts, which missed earnings targets; and construction materials manufacturer Owens Corning, which saw a sluggish housing market. In the consumer discretionary sector, entertainment services provider Netflix reported slow international subscriber growth, media giant Viacom was hurt by declining TV viewership, and casino operator Las Vegas Sands experienced declining revenues from its Macao casino. In the consumer staples sector, decelerating sales growth undermined food retailer Whole Foods Market, while negative foreign currency exposure dampened results from tobacco maker Altria Group.
On the other hand, several holdings bolstered the fund’s relative performance. Top performers in the health care sector included biotechnology developers Alexion Pharmaceuticals and Vertex Pharmaceuticals, which reported strong revenues from key drugs. Among medical product and service providers, insurer UnitedHealth Group, drug wholesaler McKesson, and device maker Illumina announced better-than-expected earnings growth. Relative returns also benefited from underweighted
4
exposure to the telecommunications services sector, where a number of companies encountered greater competitive pressures and regulatory uncertainties at a time of stretched valuations. Notably strong performers in other sectors included apparel maker Under Armour and pharmacy chain CVS Health.
Focusing on Investments Leveraged to the U.S. Economy
In light of the U.S. economy’s strength and corresponding weakness across overseas economies, we have continued to identify attractive opportunities among companies positioned to benefit from the domestic economic recovery. As of year-end, we have found a relatively large number of such opportunities among information technology firms poised to capture pent-up corporate capital expenditures, financial institutions leveraged to rising interest rates, health care companies with fast growing products and attractive valuations, industrial businesses with U.S. customer bases, and consumer discretionary firms positioned to gain a greater share of consumer spending.The fund held underweighted exposure to utilities and telecommunication services companies, where valuations appear unsustainable. We also have maintained relatively light positions in consumer staples, energy, and materials stocks due to weak commodity prices and global economic uncertainty.
January 15, 2015
|
| Please note, the position in any security highlighted with italicized typeface was sold during the reporting period. |
| Equity funds are subject generally to market, market sector, market liquidity, issuer, and investment style risks, among |
| other factors, to varying degrees, all of which are more fully described in the fund’s prospectus. |
| The use of derivatives involves risks different from, or possibly greater than, the risks associated with investing directly |
| in the underlying assets. Derivatives can be highly volatile, illiquid, and difficult to value and there is the risk that |
| changes in the value of a derivative held by the fund will not correlate with the underlying instruments or the fund’s |
| other investments. |
| The fund is only available as a funding vehicle under variable life insurance policies or variable annuity contracts |
| issued by insurance companies. Individuals may not purchase shares of the fund directly.A variable annuity is an |
| insurance contract issued by an insurance company that enables investors to accumulate assets on a tax-deferred basis |
| for retirement or other long-term goals. |
|
| 1 Total return includes reinvestment of dividends and any capital gains paid. Past performance is no guarantee of future |
| results. Share price and investment return fluctuate such that upon redemption, fund shares may be worth more or less |
| than their original cost.The fund’s performance does not reflect the deduction of additional charges and expenses |
| imposed in connection with investing in variable insurance contracts, which will reduce returns. |
| 2 SOURCE: LIPPER INC. — Reflects reinvestment of net dividends and, where applicable, capital gain |
| distributions.The Standard & Poor’s 500® Composite Stock Price Index is a widely accepted, unmanaged index of |
| U.S. stock market performance. Investors cannot invest directly in any index. |
The Fund 5
FUND PERFORMANCE
Comparison of change in value of $10,000 investment in Dreyfus Variable Investment Fund,
Growth and Income Portfolio Initial shares and Service shares and the Standard & Poor’s 500
Composite Stock Price Index
| | | | | | |
| Average Annual Total Returns as of 12/31/14 | | | | | |
| | 1 Year | | 5 Years | | 10 Years | |
| Initial shares | 10.07 | % | 15.43 | % | 7.28 | % |
| Service shares | 9.83 | % | 15.15 | % | 7.04 | % |
| Standard & Poor’s 500 | | | | | | |
| Composite Stock Price Index | 13.66 | % | 15.44 | % | 7.67 | % |
|
| † Source: Lipper Inc. |
| Past performance is not predictive of future performance.The fund’s performance shown in the graph and table does not |
| reflect the deduction of taxes that a shareholder would pay on fund distributions or the redemption of fund shares. |
| The fund’s performance does not reflect the deduction of additional charges and expenses imposed in connection |
| with investing in variable insurance contracts which will reduce returns. |
| The above graph compares a $10,000 investment made in Initial and Service shares of Dreyfus Variable Investment |
| Fund, Growth and Income Portfolio on 12/31/04 to a $10,000 investment made in the Standard & Poor’s 500 |
| Composite Stock Price Index (the “Index”) on that date. |
6
|
| The fund’s Initial shares are not subject to a Rule 12b-1 fee.The fund’s Service shares are subject to a 0.25% annual |
| Rule 12b-1 fee.All dividends and capital gain distributions are reinvested. |
| The fund’s performance shown in the line graph above takes into account all applicable fund fees and expenses for Initial |
| and Service shares (after any expense reimbursements).The Index is a widely accepted, unmanaged index of U.S. stock |
| market performance. Unlike a mutual fund, the Index is not subject to charges, fees and other expenses. Investors cannot |
| invest directly in any index. Further information relating to fund performance, including expense reimbursements, if |
| applicable, is contained in the Financial Highlights section of the prospectus and elsewhere in this report. |
The Fund 7
UNDERSTANDING YOUR FUND’S EXPENSES (Unaudited)
As a mutual fund investor, you pay ongoing expenses, such as management fees and other expenses. Using the information below, you can estimate how these expenses affect your investment and compare them with the expenses of other funds.You also may pay one-time transaction expenses, including sales charges (loads), redemption fees and expenses associated with variable annuity or insurance contracts, which are not shown in this section and would have resulted in higher total expenses. For more information, see your fund’s prospectus or talk to your financial adviser.
Review your fund’s expenses
The table below shows the expenses you would have paid on a $1,000 investment in Dreyfus Variable Investment Fund, Growth and Income Portfolio from July 1, 2014 to December 31, 2014. It also shows how much a $1,000 investment would be worth at the close of the period, assuming actual returns and expenses.
Expenses and Value of a $1,000 Investment
assuming actual returns for the six months ended December 31, 2014
| | | | |
| | | Initial Shares | | Service Shares |
| Expenses paid per $1,000† | | $4.44 | | $5.73 |
| Ending value (after expenses) | | $1,048.10 | | $1,046.70 |
COMPARING YOUR FUND’S EXPENSES
WITH THOSE OF OTHER FUNDS (Unaudited)
Using the SEC’s method to compare expenses
The Securities and Exchange Commission (SEC) has established guidelines to help investors assess fund expenses. Per these guidelines, the table below shows your fund’s expenses based on a $1,000 investment, assuming a hypothetical 5% annualized return. You can use this information to compare the ongoing expenses (but not transaction expenses or total cost) of investing in the fund with those of other funds. All mutual fund shareholder reports will provide this information to help you make this comparison. Please note that you cannot use this information to estimate your actual ending account balance and expenses paid during the period.
Expenses and Value of a $1,000 Investment
assuming a hypothetical 5% annualized return for the six months ended December 31, 2014
| | | | |
| | | Initial Shares | | Service Shares |
| Expenses paid per $1,000† | | $4.38 | | $5.65 |
| Ending value (after expenses) | | $1,020.87 | | $1,019.61 |
|
| Expenses are equal to the fund’s annualized expense ratio of .86% for Initial shares and 1.11% for Service shares, |
| multiplied by the average account value over the period, multiplied by 184/365 (to reflect the one-half year period). |
8
STATEMENT OF INVESTMENTS
December 31, 2014
| | | |
| Common Stocks—98.8% | Shares | | Value ($) |
| Automobiles & Components—.7% | | | |
| Delphi Automotive | 5,031 | | 365,854 |
| General Motors | 8,381 | | 292,581 |
| | | | 658,435 |
| Banks—7.1% | | | |
| Bank of America | 71,290 | | 1,275,378 |
| Citigroup | 21,777 | | 1,178,354 |
| JPMorgan Chase & Co. | 29,791 | | 1,864,321 |
| PNC Financial Services Group | 6,180 | | 563,801 |
| Regions Financial | 36,380 | | 384,173 |
| U.S. Bancorp | 5,380 | | 241,831 |
| Wells Fargo & Co. | 19,219 | | 1,053,586 |
| | | | 6,561,444 |
| Capital Goods—7.6% | | | |
| Cummins | 6,354 | | 916,056 |
| Danaher | 6,635 | | 568,686 |
| Fluor | 7,355 | | 445,934 |
| Honeywell International | 18,673 | | 1,865,806 |
| Northrop Grumman | 1,662 | | 244,962 |
| Owens Corning | 11,490 | | 411,457 |
| PACCAR | 3,820 | | 259,798 |
| Precision Castparts | 2,749 | | 662,179 |
| Raytheon | 8,852 | | 957,521 |
| United Technologies | 6,048 | | 695,520 |
| | | | 7,027,919 |
| Commercial & Professional Services—.6% | | | |
| Tyco International | 12,065 | | 529,171 |
| Consumer Durables & Apparel—2.2% | | | |
| Michael Kors Holdings | 7,090 | a | 532,459 |
| NIKE, Cl. B | 7,281 | | 700,068 |
| PVH | 4,513 | | 578,431 |
| Under Armour, Cl. A | 3,633 | a | 246,681 |
| | | | 2,057,639 |
| Consumer Services—.8% | | | |
| Carnival | 16,394 | | 743,140 |
The Fund 9
STATEMENT OF INVESTMENTS (continued)
| | | |
| Common Stocks (continued) | Shares | | Value ($) |
| Diversified Financials—7.8% | | | |
| Ameriprise Financial | 8,251 | | 1,091,195 |
| Berkshire Hathaway, Cl. B | 10,170 | a | 1,527,026 |
| BlackRock | 1,547 | | 553,145 |
| Discover Financial Services | 5,760 | | 377,222 |
| Goldman Sachs Group | 5,010 | | 971,088 |
| Intercontinental Exchange | 2,708 | | 593,837 |
| Invesco | 8,509 | | 336,276 |
| Morgan Stanley | 19,951 | | 774,099 |
| TD Ameritrade Holding | 10,100 | | 361,378 |
| Voya Financial | 15,000 | | 635,700 |
| | | | 7,220,966 |
| Energy—7.8% | | | |
| Anadarko Petroleum | 8,360 | | 689,700 |
| EOG Resources | 7,123 | | 655,815 |
| Kinder Morgan | 10,988 | | 464,902 |
| Marathon Oil | 14,570 | | 412,185 |
| Occidental Petroleum | 28,615 | | 2,306,655 |
| Phillips 66 | 11,149 | | 799,383 |
| Schlumberger | 22,118 | | 1,889,098 |
| | | | 7,217,738 |
| Food & Staples Retailing—2.3% | | | |
| Costco Wholesale | 4,095 | | 580,466 |
| CVS Health | 16,371 | | 1,576,691 |
| | | | 2,157,157 |
| Food, Beverage & Tobacco—5.6% | | | |
| Archer-Daniels-Midland | 7,779 | | 404,508 |
| Coca-Cola Enterprises | 26,267 | | 1,161,527 |
| ConAgra Foods | 7,773 | | 282,004 |
| Molson Coors Brewing, Cl. B | 6,624 | | 493,620 |
| Mondelez International, Cl. A | 14,369 | | 521,954 |
| PepsiCo | 21,234 | | 2,007,887 |
| Philip Morris International | 3,858 | | 314,234 |
| | | | 5,185,734 |
| Health Care Equipment & Services—5.6% | | | |
| Cardinal Health | 13,926 | | 1,124,246 |
| McKesson | 5,399 | | 1,120,724 |
10
| | | |
| Common Stocks (continued) | Shares | | Value ($) |
| Health Care Equipment & Services (continued) | | | |
| Medtronic | 4,884 | | 352,625 |
| Omnicare | 10,067 | | 734,186 |
| UnitedHealth Group | 18,423 | | 1,862,381 |
| | | | 5,194,162 |
| Household & Personal Products—1.5% | | | |
| Colgate-Palmolive | 10,578 | | 731,892 |
| Estee Lauder, Cl. A | 8,428 | | 642,214 |
| | | | 1,374,106 |
| Insurance—2.8% | | | |
| Allstate | 7,650 | | 537,413 |
| American International Group | 7,710 | | 431,837 |
| Hartford Financial Services Group | 9,100 | | 379,379 |
| Marsh & McLennan | 10,561 | | 604,512 |
| MetLife | 12,737 | | 688,944 |
| | | | 2,642,085 |
| Materials—3.6% | | | |
| Dow Chemical | 15,838 | | 722,371 |
| International Paper | 5,554 | | 297,583 |
| Martin Marietta Materials | 11,653 | | 1,285,559 |
| Praxair | 3,850 | | 498,806 |
| Vulcan Materials | 7,850 | | 515,981 |
| | | | 3,320,300 |
| Media—5.2% | | | |
| AMC Networks, Cl. A | 5,185 | a | 330,647 |
| Comcast, Cl. A | 16,114 | | 934,773 |
| Interpublic Group of Companies | 21,984 | | 456,608 |
| Omnicom Group | 9,360 | | 725,119 |
| Regal Entertainment Group, Cl. A | 11,200 | b | 239,232 |
| Time Warner | 4,846 | | 413,945 |
| Twenty-First Century Fox, Cl. A | 16,720 | | 642,132 |
| Viacom, Cl. B | 9,108 | | 685,377 |
| Walt Disney | 3,893 | | 366,682 |
| | | | 4,794,515 |
| Pharmaceuticals, Biotech & Life Sciences—9.9% | | | |
| AbbVie | 9,356 | | 612,257 |
| Actavis | 2,907 | a | 748,291 |
The Fund 11
STATEMENT OF INVESTMENTS (continued)
| | | |
| Common Stocks (continued) | Shares | | Value ($) |
| Pharmaceuticals, Biotech & Life Sciences (continued) | | | |
| Alexion Pharmaceuticals | 3,204 | a | 592,836 |
| Amgen | 2,975 | | 473,888 |
| Biogen Idec | 1,931 | a | 655,478 |
| Bristol-Myers Squibb | 7,321 | | 432,159 |
| Celgene | 7,402 | a | 827,988 |
| Eli Lilly & Co. | 4,236 | | 292,242 |
| Gilead Sciences | 10,236 | a | 964,845 |
| Illumina | 2,559 | a | 472,340 |
| Merck & Co. | 7,688 | | 436,602 |
| Perrigo Company | 3,158 | | 527,891 |
| Pfizer | 34,094 | | 1,062,028 |
| Regeneron Pharmaceuticals | 1,045 | a | 428,711 |
| Vertex Pharmaceuticals | 5,215 | a | 619,542 |
| | | | 9,147,098 |
| Retailing—3.5% | | | |
| Dollar General | 5,697 | a | 402,778 |
| Home Depot | 10,188 | | 1,069,434 |
| Kohl’s | 5,620 | | 343,045 |
| Macy’s | 3,160 | | 207,770 |
| Priceline Group | 676 | a | 770,782 |
| Ulta Salon, Cosmetics & Fragrance | 3,555 | a | 454,471 |
| | | | 3,248,280 |
| Semiconductors & Semiconductor Equipment—2.2% | | | |
| Applied Materials | 33,804 | | 842,396 |
| Microchip Technology | 12,234 | b | 551,876 |
| Texas Instruments | 12,769 | | 682,695 |
| | | | 2,076,967 |
| Software & Services—11.4% | | | |
| Accenture, Cl. A | 9,958 | | 889,349 |
| Adobe Systems | 6,543 | a | 475,676 |
| Akamai Technologies | 6,040 | a | 380,278 |
| Cognizant Technology Solutions, Cl. A | 8,825 | a | 464,725 |
| Facebook, Cl. A | 16,137 | a | 1,259,009 |
| Fortinet | 11,906 | a | 365,038 |
12
| | | |
| Common Stocks (continued) | Shares | | Value ($) |
| Software & Services (continued) | | | |
| Google, Cl. A | 1,576 | a | 836,320 |
| Google, Cl. C | 1,576 | a | 829,606 |
| Intuit | 8,001 | | 737,612 |
| LinkedIn, Cl. A | 2,044 | a | 469,527 |
| Microsoft | 27,487 | | 1,276,771 |
| Oracle | 15,121 | | 679,991 |
| salesforce.com | 10,952 | a | 649,563 |
| Visa, Cl. A | 4,718 | | 1,237,060 |
| | | | 10,550,525 |
| Technology Hardware & Equipment—8.5% | | | |
| Apple | 36,792 | | 4,061,101 |
| Cisco Systems | 58,343 | | 1,622,811 |
| EMC | 44,868 | | 1,334,374 |
| Hewlett-Packard | 8,060 | | 323,448 |
| SanDisk | 5,867 | | 574,849 |
| | | | 7,916,583 |
| Telecommunication Services—.7% | | | |
| Windstream Holdings | 77,340 | b | 637,282 |
| Transportation—.7% | | | |
| Delta Air Lines | 2,840 | | 139,700 |
| FedEx | 2,913 | | 505,872 |
| | | | 645,572 |
| Utilities—.7% | | | |
| Exelon | 6,518 | | 241,687 |
| NRG Yield, Cl. A | 8,014 | | 377,780 |
| | | | 619,467 |
| Total Common Stocks | | | |
| (cost $69,891,058) | | | 91,526,285 |
| |
| Other Investment—1.3% | | | |
| Registered Investment Company; | | | |
| Dreyfus Institutional Preferred | | | |
| Plus Money Market Fund | | | |
| (cost $1,189,496) | 1,189,496 | c | 1,189,496 |
The Fund 13
STATEMENT OF INVESTMENTS (continued)
| | | | |
| Investment of Cash Collateral | | | | |
| for Securities Loaned—.9% | Shares | | Value ($) | |
| Registered Investment Company; | | | | |
| Dreyfus Institutional Cash Advantage Fund | | | | |
| (cost $871,655) | 871,655 | c | 871,655 | |
| Total Investments (cost $71,952,209) | 101.0 | % | 93,587,436 | |
| Liabilities, Less Cash and Receivables | (1.0 | %) | (891,279 | ) |
| Net Assets | 100.0 | % | 92,696,157 | |
|
| a Non-income producing security. |
| b Security, or portion thereof, on loan.At December 31, 2014, the value of the fund’s securities on loan was |
| $1,277,452 and the value of the collateral held by the fund was $1,313,706, consisting of cash collateral of |
| $871,655 and U.S. Government & Agency securities valued at $442,051. |
| c Investment in affiliated money market mutual fund. |
| | | |
| Portfolio Summary (Unaudited)† | | |
| |
| | Value (%) | | Value (%) |
| Software & Services | 11.4 | Food & Staples Retailing | 2.3 |
| Pharmaceuticals, | | Consumer Durables & Apparel | 2.2 |
| Biotech & Life Sciences | 9.9 | Money Market Investments | 2.2 |
| Technology Hardware & Equipment | 8.5 | Semiconductors & | |
| Diversified Financials | 7.8 | Semiconductor Equipment | 2.2 |
| Energy | 7.8 | Household & Personal Products | 1.5 |
| Capital Goods | 7.6 | Consumer Services | .8 |
| Banks | 7.1 | Automobiles & Components | .7 |
| Food, Beverage & Tobacco | 5.6 | Telecommunication Services | .7 |
| Health Care Equipment & Services | 5.6 | Transportation | .7 |
| Media | 5.2 | Utilities | .7 |
| Materials | 3.6 | Commercial & Professional Services | .6 |
| Retailing | 3.5 | | |
| Insurance | 2.8 | | 101.0 |
| |
| † Based on net assets. | | | |
| See notes to financial statements. | | | |
14
STATEMENT OF ASSETS AND LIABILITIES
December 31, 2014
| | |
| | Cost | Value |
| Assets ($): | | |
| Investments in securities—See Statement of Investments (including | | |
| securities on loan, valued at $1,277,452)—Note 1(b): | | |
| Unaffiliated issuers | 69,891,058 | 91,526,285 |
| Affiliated issuers | 2,061,151 | 2,061,151 |
| Cash | | 10,920 |
| Dividends and securities lending income receivable | | 125,489 |
| Prepaid expenses | | 1,834 |
| | | 93,725,679 |
| Liabilities ($): | | |
| Due to The Dreyfus Corporation and affiliates—Note 3(b) | | 69,771 |
| Liability for securities on loan—Note 1(b) | | 871,655 |
| Payable for shares of Beneficial Interest redeemed | | 40,982 |
| Accrued expenses | | 47,114 |
| | | 1,029,522 |
| Net Assets ($) | | 92,696,157 |
| Composition of Net Assets ($): | | |
| Paid-in capital | | 62,963,156 |
| Accumulated undistributed investment income—net | | 38,670 |
| Accumulated net realized gain (loss) on investments | | 8,059,104 |
| Accumulated net unrealized appreciation | | |
| (depreciation) on investments | | 21,635,227 |
| Net Assets ($) | | 92,696,157 |
| |
| |
| Net Asset Value Per Share | | |
| | Initial Shares | Service Shares |
| Net Assets ($) | 85,533,719 | 7,162,438 |
| Shares Outstanding | 2,617,334 | 218,985 |
| Net Asset Value Per Share ($) | 32.68 | 32.71 |
| |
| See notes to financial statements. | | |
The Fund 15
STATEMENT OF OPERATIONS
Year Ended December 31, 2014
| | |
| Investment Income ($): | | |
| Income: | | |
| Cash dividends: | | |
| Unaffiliated issuers | 1,496,017 | |
| Affiliated issuers | 523 | |
| Income from securities lending—Note 1(b) | 15,576 | |
| Total Income | 1,512,116 | |
| Expenses: | | |
| Investment advisory fee—Note 3(a) | 688,031 | |
| Professional fees | 55,251 | |
| Distribution fees—Note 3(b) | 18,320 | |
| Custodian fees—Note 3(b) | 18,256 | |
| Prospectus and shareholders’ reports | 13,002 | |
| Trustees’ fees and expenses—Note 3(c) | 6,397 | |
| Loan commitment fees—Note 2 | 1,052 | |
| Shareholder servicing costs—Note 3(b) | 680 | |
| Miscellaneous | 15,051 | |
| Total Expenses | 816,040 | |
| Less—reduction in fees due to earnings credits—Note 3(b) | (3 | ) |
| Net Expenses | 816,037 | |
| Investment Income—Net | 696,079 | |
| Realized and Unrealized Gain (Loss) on Investments—Note 4 ($): | | |
| Net realized gain (loss) on investments | 9,409,709 | |
| Net unrealized appreciation (depreciation) on investments | (1,303,965 | ) |
| Net Realized and Unrealized Gain (Loss) on Investments | 8,105,744 | |
| Net Increase in Net Assets Resulting from Operations | 8,801,823 | |
| |
| See notes to financial statements. | | |
16
STATEMENT OF CHANGES IN NET ASSETS
| | | | |
| | Year Ended December 31, | |
| | 2014 | | 2013 | |
| Operations ($): | | | | |
| Investment income—net | 696,079 | | 734,759 | |
| Net realized gain (loss) on investments | 9,409,709 | | 11,161,376 | |
| Net unrealized appreciation | | | | |
| (depreciation) on investments | (1,303,965 | ) | 14,038,506 | |
| Net Increase (Decrease) in Net Assets | | | | |
| Resulting from Operations | 8,801,823 | | 25,934,641 | |
| Dividends to Shareholders from ($): | | | | |
| Investment income—net: | | | | |
| Initial Shares | (658,649 | ) | (677,452 | ) |
| Service Shares | (38,245 | ) | (51,365 | ) |
| Total Dividends | (696,894 | ) | (728,817 | ) |
| Beneficial Interest Transactions ($): | | | | |
| Net proceeds from shares sold: | | | | |
| Initial Shares | 5,712,344 | | 5,562,097 | |
| Service Shares | 507,846 | | 321,493 | |
| Dividends reinvested: | | | | |
| Initial Shares | 658,649 | | 677,452 | |
| Service Shares | 38,245 | | 51,365 | |
| Cost of shares redeemed: | | | | |
| Initial Shares | (12,784,397 | ) | (12,104,118 | ) |
| Service Shares | (2,071,360 | ) | (2,067,152 | ) |
| Increase (Decrease) in Net Assets from | | | | |
| Beneficial Interest Transactions | (7,938,673 | ) | (7,558,863 | ) |
| Total Increase (Decrease) in Net Assets | 166,256 | | 17,646,961 | |
| Net Assets ($): | | | | |
| Beginning of Period | 92,529,901 | | 74,882,940 | |
| End of Period | 92,696,157 | | 92,529,901 | |
| Undistributed investment income—net | 38,670 | | 39,485 | |
The Fund 17
STATEMENT OF CHANGES IN NET ASSETS (continued)
| | | | |
| | Year Ended December 31, | |
| | 2014 | | 2013 | |
| Capital Share Transactions: | | | | |
| Initial Shares | | | | |
| Shares sold | 188,310 | | 212,667 | |
| Shares issued for dividends reinvested | 20,879 | | 25,654 | |
| Shares redeemed | (415,673 | ) | (474,612 | ) |
| Net Increase (Decrease) in Shares Outstanding | (206,484 | ) | (236,291 | ) |
| Service Shares | | | | |
| Shares sold | 16,350 | | 13,064 | |
| Shares issued for dividends reinvested | 1,211 | | 1,957 | |
| Shares redeemed | (67,438 | ) | (79,275 | ) |
| Net Increase (Decrease) in Shares Outstanding | (49,877 | ) | (64,254 | ) |
| |
| See notes to financial statements. | | | | |
18
FINANCIAL HIGHLIGHTS
The following tables describe the performance for each share class for the fiscal periods indicated. All information (except portfolio turnover rate) reflects financial results for a single fund share.Total return shows how much your investment in the fund would have increased (or decreased) during each period, assuming you had reinvested all dividends and distributions. The fund’s total returns do not reflect expenses associated with variable annuity or insurance contracts.These figures have been derived from the fund’s financial statements.
| | | | | | | | | | |
| | | | Year Ended December 31, | | | |
| Initial Shares | 2014 | | 2013 | | 2012 | | 2011 | | 2010 | |
| Per Share Data ($): | | | | | | | | | | |
| Net asset value, beginning of period | 29.92 | | 22.07 | | 18.96 | | 19.76 | | 16.86 | |
| Investment Operations: | | | | | | | | | | |
| Investment income—neta | .24 | | .23 | | .30 | | .25 | | .20 | |
| Net realized and unrealized | | | | | | | | | | |
| gain (loss) on investments | 2.77 | | 7.86 | | 3.12 | | (.80 | ) | 2.91 | |
| Total from Investment Operations | 3.01 | | 8.09 | | 3.42 | | (.55 | ) | 3.11 | |
| Distributions: | | | | | | | | | | |
| Dividends from investment income—net | (.25 | ) | (.24 | ) | (.31 | ) | (.25 | ) | (.21 | ) |
| Net asset value, end of period | 32.68 | | 29.92 | | 22.07 | | 18.96 | | 19.76 | |
| Total Return (%) | 10.07 | | 36.78 | | 18.08 | | (2.79 | ) | 18.61 | |
| Ratios/Supplemental Data (%): | | | | | | | | | | |
| Ratio of total expenses | | | | | | | | | | |
| to average net assets | .87 | | .89 | | .91 | | .89 | | .88 | |
| Ratio of net expenses | | | | | | | | | | |
| to average net assets | .87 | | .89 | | .91 | | .89 | | .88 | |
| Ratio of net investment income | | | | | | | | | | |
| to average net assets | .78 | | .91 | | 1.42 | | 1.24 | | 1.16 | |
| Portfolio Turnover Rate | 51.99 | | 50.46 | | 48.39 | | 83.28 | | 82.26 | |
| Net Assets, end of period ($ x 1,000) | 85,534 | | 84,479 | | 67,525 | | 65,629 | | 77,151 | |
| |
| a Based on average shares outstanding. | | | | | | | | | | |
| See notes to financial statements. | | | | | | | | | | |
The Fund 19
FINANCIAL HIGHLIGHTS (continued)
| | | | | | | | | | |
| | | | Year Ended December 31, | | | |
| Service Shares | 2014 | | 2013 | | 2012 | | 2011 | | 2010 | |
| Per Share Data ($): | | | | | | | | | | |
| Net asset value, beginning of period | 29.94 | | 22.09 | | 18.98 | | 19.77 | | 16.87 | |
| Investment Operations: | | | | | | | | | | |
| Investment income—neta | .16 | | .17 | | .25 | | .20 | | .16 | |
| Net realized and unrealized | | | | | | | | | | |
| gain (loss) on investments | 2.78 | | 7.85 | | 3.12 | | (.79 | ) | 2.91 | |
| Total from Investment Operations | 2.94 | | 8.02 | | 3.37 | | (.59 | ) | 3.07 | |
| Distributions: | | | | | | | | | | |
| Dividends from investment income—net | (.17 | ) | (.17 | ) | (.26 | ) | (.20 | ) | (.17 | ) |
| Net asset value, end of period | 32.71 | | 29.94 | | 22.09 | | 18.98 | | 19.77 | |
| Total Return (%) | 9.83 | | 36.43 | | 17.77 | | (2.99 | ) | 18.29 | |
| Ratios/Supplemental Data (%): | | | | | | | | | | |
| Ratio of total expenses | | | | | | | | | | |
| to average net assets | 1.12 | | 1.14 | | 1.16 | | 1.14 | | 1.13 | |
| Ratio of net expenses | | | | | | | | | | |
| to average net assets | 1.12 | | 1.14 | | 1.16 | | 1.14 | | 1.13 | |
| Ratio of net investment income | | | | | | | | | | |
| to average net assets | .52 | | .65 | | 1.17 | | .99 | | .91 | |
| Portfolio Turnover Rate | 51.99 | | 50.46 | | 48.39 | | 83.28 | | 82.26 | |
| Net Assets, end of period ($ x 1,000) | 7,162 | | 8,051 | | 7,358 | | 7,222 | | 9,028 | |
| |
| a Based on average shares outstanding. | | | | | | | | | | |
| See notes to financial statements. | | | | | | | | | | |
20
NOTES TO FINANCIAL STATEMENTS
NOTE 1—Significant Accounting Policies:
Dreyfus Variable Investment Fund (the “Company”) is registered under the Investment Company Act of 1940, as amended (the “Act”), as an open end management investment company, operating as a series company currently offering seven series, including the Growth and Income Portfolio (the “fund”).The fund is only offered to separate accounts established by insurance companies to fund variable annuity contracts and variable life insurance policies. The fund is a non-diversified series. The fund’s investment objective is to seek long-term capital growth, current income and growth of income consistent with reasonable investment risk.The Dreyfus Corporation (the “Manager” or “Dreyfus”), a wholly-owned subsidiary of The Bank of New York Mellon Corporation (“BNY Mellon”), serves as the fund’s investment adviser.
MBSC Securities Corporation (the “Distributor”), a wholly-owned subsidiary of the Manager, is the distributor of the fund’s shares, which are sold without a sales charge. The fund is authorized to issue an unlimited number of $.001 par value shares of Beneficial Interest in each of the following classes of shares: Initial and Service. Each class of shares has identical rights and privileges, except with respect to the Distribution Plan, the expenses borne by each class, the allocation of certain transfer agency costs, and certain voting rights. Income, expenses (other than expenses attributable to a specific class), and realized and unrealized gains or losses on investments are allocated to each class of shares based on its relative net assets.
The Company accounts separately for the assets, liabilities and operations of each series. Expenses directly attributable to each series are charged to that series’ operations; expenses which are applicable to all series are allocated among them on a pro rata basis.
The Financial Accounting Standards Board (“FASB”) Accounting Standards Codification (“ASC”) is the exclusive reference of authoritative U.S. generally accepted accounting principles (“GAAP”) recognized by the FASB to be applied by nongovernmental entities. Rules and interpretive releases of the Securities and Exchange Commission (“SEC”)
The Fund 21
NOTES TO FINANCIAL STATEMENTS (continued)
under authority of federal laws are also sources of authoritative GAAP for SEC registrants. The fund’s financial statements are prepared in accordance with GAAP, which may require the use of management estimates and assumptions. Actual results could differ from those estimates.
The Company enters into contracts that contain a variety of indemnifications. The fund’s maximum exposure under these arrangements is unknown.The fund does not anticipate recognizing any loss related to these arrangements.
(a) Portfolio valuation: The fair value of a financial instrument is the amount that would be received to sell an asset or paid to transfer a liability in an orderly transaction between market participants at the measurement date (i.e., the exit price). GAAP establishes a fair value hierarchy that prioritizes the inputs of valuation techniques used to measure fair value. This hierarchy gives the highest priority to unadjusted quoted prices in active markets for identical assets or liabilities (Level 1 measurements) and the lowest priority to unobservable inputs (Level 3 measurements).
Additionally, GAAP provides guidance on determining whether the volume and activity in a market has decreased significantly and whether such a decrease in activity results in transactions that are not orderly. GAAP requires enhanced disclosures around valuation inputs and techniques used during annual and interim periods.
Various inputs are used in determining the value of the fund’s investments relating to fair value measurements.These inputs are summarized in the three broad levels listed below:
Level 1—unadjusted quoted prices in active markets for identical investments.
Level 2—other significant observable inputs (including quoted prices for similar investments, interest rates, prepayment speeds, credit risk, etc.).
Level 3—significant unobservable inputs (including the fund’s own assumptions in determining the fair value of investments).
22
The inputs or methodology used for valuing securities are not necessarily an indication of the risk associated with investing in those securities.
Changes in valuation techniques may result in transfers in or out of an assigned level within the disclosure hierarchy. Valuation techniques used to value the fund’s investments are as follows:
Investments in securities are valued at the last sales price on the securities exchange or national securities market on which such securities are primarily traded. Securities listed on the National Market System for which market quotations are available are valued at the official closing price or, if there is no official closing price that day, at the last sales price. For open short positions, asked prices are used for valuation purposes. Bid price is used when no asked price is available. Registered investment companies that are not traded on an exchange are valued at their net asset value.All of the preceding securities are generally categorized within Level 1 of the fair value hierarchy.
Securities not listed on an exchange or the national securities market, or securities for which there were no transactions, are valued at the average of the most recent bid and asked prices. These securities are generally categorized within Level 2 of the fair value hierarchy.
Fair valuing of securities may be determined with the assistance of a pricing service using calculations based on indices of domestic securities and other appropriate indicators, such as prices of relevant American Depository Receipts and financial futures. Utilizing these techniques may result in transfers between Level 1 and Level 2 of the fair value hierarchy.
When market quotations or official closing prices are not readily available, or are determined not to reflect accurately fair value, such as when the value of a security has been significantly affected by events after the close of the exchange or market on which the security is principally traded (for example, a foreign exchange or market), but before the fund calculates its net asset value, the fund may value these investments at fair value as determined in accordance with the proce-
The Fund 23
NOTES TO FINANCIAL STATEMENTS (continued)
dures approved by the Company’s Board of Trustees (the “Board”). Certain factors may be considered when fair valuing investments such as: fundamental analytical data, the nature and duration of restrictions on disposition, an evaluation of the forces that influence the market in which the securities are purchased and sold, and public trading in similar securities of the issuer or comparable issuers. These securities are either categorized within Level 2 or 3 of the fair value hierarchy depending on the relevant inputs used.
For restricted securities where observable inputs are limited, assumptions about market activity and risk are used and are generally categorized within Level 3 of the fair value hierarchy.
The following is a summary of the inputs used as of December 31, 2014 in valuing the fund’s investments.
| | | | |
| | | Level 2—Other | Level 3— | |
| | Level 1— | Significant | Significant | |
| | Unadjusted | Observable | Unobservable | |
| | Quoted Prices | Inputs | Inputs | Total |
| Assets ($) | | | | |
| Investments in Securities: | | | |
| Equity Securities— | | | | |
| Domestic | | | | |
| Common Stocks† | 90,993,826 | — | — | 90,993,826 |
| Equity Securities— | | | | |
| Foreign | | | | |
| Common Stocks† | 532,459 | — | — | 532,459 |
| Mutual Funds | 2,061,151 | — | — | 2,061,151 |
| |
| † See Statement of Investments for additional detailed categorizations. | |
At December 31, 2014, there were no transfers between Level 1 and Level 2 of the fair value hierarchy.
(b) Securities transactions and investment income: Securities transactions are recorded on a trade date basis. Realized gains and losses from securities transactions are recorded on the identified cost basis. Dividend income is recognized on the ex-dividend date and interest income, including, where applicable, accretion of discount and amortization of premium on investments, is recognized on the accrual basis.
24
Pursuant to a securities lending agreement with The Bank of New York Mellon, a subsidiary of BNY Mellon and an affiliate of Dreyfus, the fund may lend securities to qualified institutions. It is the fund’s policy that, at origination, all loans are secured by collateral of at least 102% of the value of U.S. securities loaned and 105% of the value of foreign securities loaned. Collateral equivalent to at least 100% of the market value of securities on loan is maintained at all times. Collateral is either in the form of cash, which can be invested in certain money market mutual funds managed by the Manager or U.S. Government and Agency securities. The fund is entitled to receive all dividends, interest and distributions on securities loaned, in addition to income earned as a result of the lending transaction. Should a borrower fail to return the securities in a timely manner, The Bank of New York Mellon is required to replace the securities for the benefit of the fund or credit the fund with the market value of the unreturned securities and is subrogated to the fund’s rights against the borrower and the collateral. During the period ended December 31, 2014,The Bank of New York Mellon earned $4,158 from lending portfolio securities, pursuant to the securities lending agreement.
(c) Affiliated issuers: Investments in other investment companies advised by Dreyfus are defined as “affiliated” under the Act. Investments in affiliated investment companies during the period ended December 31, 2014 were as follows:
| | | | | |
| Affiliated | | | | | |
| Investment | Value | | | Value | Net |
| Company | 12/31/2013 ($) | Purchases ($) | Sales ($) | 12/31/2014 ($) | Assets (%) |
| Dreyfus | | | | | |
| Institutional | | | | | |
| Preferred | | | | | |
| Plus Money | | | | | |
| Market Fund | 239,170 | 17,481,708 | 16,531,382 | 1,189,496 | 1.3 |
| Dreyfus | | | | | |
| Institutional | | | | | |
| Cash | | | | | |
| Advantage | | | | | |
| Fund | 1,196,251 | 13,567,571 | 13,892,167 | 871,655 | .9 |
| Total | 1,435,421 | 31,049,279 | 30,423,549 | 2,061,151 | 2.2 |
The Fund 25
NOTES TO FINANCIAL STATEMENTS (continued)
(d) Dividends to shareholders: Dividends are recorded on the ex-dividend date. Dividends from investment income-net are normally declared and paid quarterly. Dividends from net realized capital gains, if any, are normally declared and paid annually, but the fund may make distributions on a more frequent basis to comply with the distribution requirements of the Internal Revenue Code of 1986, as amended (the “Code”). To the extent that net realized capital gains can be offset by capital loss carryovers, it is the policy of the fund not to distribute such gains. Income and capital gain distributions are determined in accordance with income tax regulations, which may differ from GAAP.
(e) Federal income taxes: It is the policy of the fund to continue to qualify as a regulated investment company, if such qualification is in the best interests of its shareholders, by complying with the applicable provisions of the Code, and to make distributions of taxable income sufficient to relieve it from substantially all federal income and excise taxes.
As of and during the period ended December 31, 2014, the fund did not have any liabilities for any uncertain tax positions.The fund recognizes interest and penalties, if any, related to uncertain tax positions as income tax expense in the Statement of Operations. During the period ended December 31, 2014, the fund did not incur any interest or penalties.
Each tax year in the four-year period ended December 31, 2014 remains subject to examination by the Internal Revenue Service and state taxing authorities.
At December 31, 2014, the components of accumulated earnings on a tax basis were as follows: undistributed ordinary income $125,494, undistributed capital gains $8,138,288 and unrealized appreciation $21,469,219.
The tax character of distributions paid to shareholders during the fiscal periods ended December 31, 2014 and December 31, 2013 were as follows: ordinary income $696,894 and $728,817, respectively.
26
NOTE 2—Bank Lines of Credit:
The fund participates with other Dreyfus-managed funds in a $430 million unsecured credit facility led by Citibank, N.A. and a $300 million unsecured credit facility provided by The Bank of New York Mellon (each, a “Facility”), each to be utilized primarily for temporary or emergency purposes, including the financing of redemptions. Prior to October 8, 2014, the unsecured credit facility with Citibank, N.A. was $265 million. In connection therewith, the fund has agreed to pay its pro rata portion of commitment fees for each Facility. Interest is charged to the fund based on rates determined pursuant to the terms of the respective Facility at the time of borrowing. During the period ended December 31, 2014, the fund did not borrow under the Facilities.
NOTE 3—Investment Advisory Fee and Other Transactions with Affiliates:
(a) Pursuant to an investment advisory agreement with the Manager, the investment advisory fee is computed at the annual rate of .75% of the value of the fund’s average daily net assets and is payable monthly.
(b) Under the Distribution Plan adopted pursuant to Rule 12b-1 under the Act, Service shares pay the Distributor for distributing its shares, for servicing and/or maintaining Service shares’ shareholder accounts and for advertising and marketing for Service shares. The Distribution Plan provides for payments to be made at an annual rate of .25% of the value of the Service shares’ average daily net assets.The Distributor may make payments to Participating Insurance Companies and to brokers and dealers acting as principal underwriter for their variable insurance products. The fees payable under the Distribution Plan are payable without regard to actual expenses incurred. During the period ended December 31, 2014, Service shares were charged $18,320 pursuant to the Distribution Plan.
The Fund 27
NOTES TO FINANCIAL STATEMENTS (continued)
The fund has arrangements with the transfer agent and the custodian whereby the fund may receive earnings credits when positive cash balances are maintained, which are used to offset transfer agency and custody fees. For financial reporting purposes, the fund includes net earnings credits as an expense offset in the Statement of Operations.
The fund compensates Dreyfus Transfer, Inc., a wholly-owned subsidiary of the Manager, under a transfer agency agreement for providing transfer agency and cash management services for the fund.The majority of transfer agency fees are comprised of amounts paid on a per account basis, while cash management fees are related to fund subscriptions and redemptions. During the period ended December 31, 2014, the fund was charged $580 for transfer agency services and $44 for cash management services. These fees are included in Shareholder servicing costs in the Statement of Operations. Cash management fees were partially offset by earnings credits of $3.
The fund compensates The Bank of NewYork Mellon under a custody agreement for providing custodial services for the fund.These fees are determined based on net assets, geographic region and transaction activity. During the period ended December 31, 2014, the fund was charged $18,256 pursuant to the custody agreement.
During the period ended December 31, 2014, the fund was charged $7,771 for services performed by the Chief Compliance Officer and his staff.
The components of “Due to The Dreyfus Corporation and affiliates” in the Statement of Assets and Liabilities consist of: investment advisory fees $59,085, Distribution Plan fees $1,542, custodian fees $7,177, Chief Compliance Officer fees $1,851 and transfer agency fees $116.
(c) Each Board member also serves as a Board member of other funds within the Dreyfus complex. Annual retainer fees and attendance fees are allocated to each fund based on net assets.
28
NOTE 4—Securities Transactions:
The aggregate amount of purchases and sales of investment securities, excluding short-term securities, during the period ended December 31, 2014, amounted to $47,479,954 and $55,534,854, respectively.
At December 31, 2014, the cost of investments for federal income tax purposes was $72,118,217 accordingly, accumulated net unrealized appreciation on investments was $21,469,219, consisting of $22,682,420 gross unrealized appreciation and $1,213,201 gross unrealized depreciation.
The Fund 29
REPORT OF INDEPENDENT REGISTERED
PUBLIC ACCOUNTING FIRM
Shareholders and Board of Trustees
Dreyfus Variable Investment Fund, Growth and Income Portfolio
We have audited the accompanying statement of assets and liabilities, including the statement of investments, of Dreyfus Variable Investment Fund, Growth and Income Portfolio (one of the series comprising Dreyfus Variable Investment Fund) as of December 31, 2014, and the related statement of operations for the year then ended, the statement of changes in net assets for each of the two years in the period then ended, and the financial highlights for each of the five years in the period then ended.These financial statements and financial highlights are the responsibility of the Fund’s management. Our responsibility is to express an opinion on these financial statements and financial highlights based on our audits.
We conducted our audits in accordance with the standards of the Public Company Accounting Oversight Board (United States). Those standards require that we plan and perform the audit to obtain reasonable assurance about whether the financial statements and financial highlights are free of material misstatement. We were not engaged to perform an audit of the Fund’s internal control over financial reporting. Our audits included consideration of internal control over financial reporting as a basis for designing audit procedures that are appropriate in the circumstances, but not for the purpose of expressing an opinion on the effectiveness of the Fund’s internal control over financial reporting. Accordingly, we express no such opinion. An audit also includes examining, on a test basis, evidence supporting the amounts and disclosures in the financial statements and financial highlights, assessing the accounting principles used and significant estimates made by management, and evaluating the overall financial statement presentation. Our procedures included confirmation of securities owned as of December 31, 2014 by correspondence with the custodian and others.We believe that our audits provide a reasonable basis for our opinion.
In our opinion, the financial statements and financial highlights referred to above present fairly, in all material respects, the financial position of Dreyfus Variable Investment Fund, Growth and Income Portfolio at December 31, 2014, the results of its operations for the year then ended, the changes in its net assets for each of the two years in the period then ended, and the financial highlights for each of the five years in the period then ended, in conformity with U.S. generally accepted accounting principles.

New York, New York
February 11, 2015
30
IMPORTANT TAX INFORMATION (Unaudited)
For federal tax purposes, the portfolio hereby reports 100% of the ordinary dividends paid during the fiscal year ended December 31, 2014 as qualifying for the corporate dividends received deduction. Shareholders will receive notification in early 2015 of the percentage applicable to the preparation of their 2014 income tax returns.
The Fund 31
BOARD MEMBERS INFORMATION (Unaudited)
INDEPENDENT BOARD MEMBERS
|
| Joseph S. DiMartino (71) |
| Chairman of the Board (1995) |
| Principal Occupation During Past 5Years: |
| • Corporate Director and Trustee (1995-present) |
| Other Public Company Board Memberships During Past 5Years: |
| • CBIZ (formerly, Century Business Services, Inc.), a provider of outsourcing functions for small |
| and medium size companies, Director (1997-present) |
| • The Newark Group, a provider of a national market of paper recovery facilities, paperboard |
| mills and paperboard converting plants, Director (2000-2010) |
| • Sunair Services Corporation, a provider of certain outdoor-related services to homes and |
| businesses, Director (2005-2009) |
| No. of Portfolios for which Board Member Serves: 146 |
| ——————— |
| Peggy C. Davis (71) |
| Board Member (2006) |
| Principal Occupation During Past 5Years: |
| • Shad Professor of Law, New York University School of Law (1983-present) |
| No. of Portfolios for which Board Member Serves: 52 |
| ———���——— |
| David P. Feldman (75) |
| Board Member (1994) |
| Principal Occupation During Past 5Years: |
| • Corporate Director and Trustee (1985-present) |
| Other Public Company Board Membership During Past 5Years: |
| • BBH Mutual Funds Group (5 registered mutual funds), Director (1992-present) |
| No. of Portfolios for which Board Member Serves: 38 |
| ——————— |
| Ehud Houminer (74) |
| Board Member (2006) |
| Principal Occupation During Past 5Years: |
| • Executive-in-Residence at the Columbia Business School, Columbia University (1992-present) |
| Other Public Company Board Membership During Past 5Years: |
| • Avnet, Inc., an electronics distributor, Director (1993-2012) |
| No. of Portfolios for which Board Member Serves: 62 |
32
Lynn Martin (75)
Board Member (2012)
|
| Principal Occupation During Past 5Years: |
| • President, of The Martin Hall Group LLC, a human resources consulting firm (2005-2012) |
| Other Public Company Board Memberships During Past 5Years: |
| • AT&T, Inc., a telecommunications company, Director (1999-2012) |
| • Ryder System, Inc., a supply chain and transportation management company, Director (1993-2012) |
| • The Proctor & Gamble Co., a consumer products company, Director (1994-2009) |
| • Constellation Energy Group, Inc., Director (2003-2009) |
| No. of Portfolios for which Board Member Serves: 38 |
| |
| ——————— |
| Robin A. Melvin (51) |
| Board Member (2012) |
| Principal Occupation During Past 5Years: |
| • Board Member, Illinois Mentoring Partnership, non-profit organization dedicated to increasing |
| the quantity and quality of mentoring services in Illinois (2013-present) |
| • Director, Boisi Family Foundation, a private family foundation that supports youth-serving orga- |
| nizations that promote the self sufficiency of youth from disadvantaged circumstances (1995-2012) |
| No. of Portfolios for which Board Member Serves: 114 |
| |
| ——————— |
| Dr. Martin Peretz (75) |
| Board Member (1990) |
| Principal Occupation During Past 5Years: |
| • Editor-in-Chief Emeritus of The New Republic Magazine (2010-2011) (previously, |
| Editor-in-Chief, 1974-2010) |
| • Director of TheStreet.com, a financial information service on the web (1996-2010) |
| No. of Portfolios for which Board Member Serves: 38 |
| |
| ——————— |
| Once elected all Board Members serve for an indefinite term, but achieve Emeritus status upon reaching age 80.The |
| address of the Board Members and Officers is c/o The Dreyfus Corporation, 200 Park Avenue, NewYork, NewYork |
| 10166.Additional information about the Board Members is available in the fund’s Statement of Additional Information |
| which can be obtained from Dreyfus free of charge by calling this toll free number: 1-800-DREYFUS. |
| James F. Henry, Emeritus Board Member |
| Rosalind G. Jacobs, Emeritus Board Member |
| Dr. Paul A. Marks, Emeritus Board Member |
| Philip L.Toia, Emeritus Board Member |
The Fund 33
OFFICERS OF THE FUND (Unaudited)

34

The Fund 35
For More Information

Telephone 1-800-554-4611 or 1-516-338-3300
Mail The Dreyfus Family of Funds, 144 Glenn Curtiss Boulevard, Uniondale, NY 11556-0144
Attn: Investments Division
The fund files its complete schedule of portfolio holdings with the Securities and Exchange Commission (“SEC”) for the first and third quarters of each fiscal year on Form N-Q. The fund’s Forms N-Q are available on the SEC’s website at http://www.sec.gov and may be reviewed and copied at the SEC’s Public Reference Room in Washington, DC. Information on the operation of the Public Reference Room may be obtained by calling 1-800-SEC-0330.
A description of the policies and procedures that the fund uses to determine how to vote proxies relating to portfolio securities, and information regarding how the fund voted these proxies for the most recent 12-month period ended June 30 is available at http://www.dreyfus.com and on the SEC’s website at http://www.sec.gov. The description of the policies and procedures is also available without charge, upon request, by calling 1-800-DREYFUS.

Dreyfus Variable
Investment Fund,
International
Equity Portfolio

The views expressed in this report reflect those of the portfolio manager only through the end of the period covered and do not necessarily represent the views of Dreyfus or any other person in the Dreyfus organization. Any such views are subject to change at any time based upon market or other conditions and Dreyfus disclaims any responsibility to update such views.These views may not be relied on as investment advice and, because investment decisions for a Dreyfus fund are based on numerous factors, may not be relied on as an indication of trading intent on behalf of any Dreyfus fund.

| | Contents |
| | THE FUND |
| 2 | A Letter from the President |
| 3 | Discussion of Fund Performance |
| 6 | Fund Performance |
| 8 | Understanding Your Fund’s Expenses |
| 8 | Comparing Your Fund’s Expenses With Those of Other Funds |
| 9 | Statement of Investments |
| 13 | Statement of Assets and Liabilities |
| 14 | Statement of Operations |
| 15 | Statement of Changes in Net Assets |
| 17 | Financial Highlights |
| 19 | Notes to Financial Statements |
| 33 | Report of Independent Registered Public Accounting Firm |
| 34 | Important Tax Information |
| 35 | Board Members Information |
| 37 | Officers of the Fund |
| | FOR MORE INFORMATION |
| | Back Cover |
Dreyfus Variable Investment Fund,
International Equity Portfolio
The Fund
A LETTER FROM THE PRESIDENT
Dear Shareholder:
We are pleased to present this annual report for Dreyfus Variable Investment Fund, International Equity Portfolio, covering the 12-month period from January 1, 2014, through December 31, 2014. For information about how the fund performed during the reporting period, as well as general market perspectives, we provide a Discussion of Fund Performance on the pages that follow.
U.S. stocks produced moderate gains in 2014, but international stocks generally lost value over the year as Japan struggled with the dampening effects of higher consumption taxes, Europe contended with weak economic growth and mounting deflationary pressures, and China suffered a persistent economic slowdown. Global investors responded to these developments by shifting their focus to markets with better economic fundamentals, especially the United States.
Many economists appear to be cautiously optimistic about the prospects for international equity markets in 2015. Our own analysts agree and, in light of the ongoing benefits of low interest rates and depressed energy prices, see the potential for a somewhat faster pace of global growth in 2015 than in 2014. U.S. economic growth also seems poised to accelerate, largely due to the fading of drags from tight fiscal policies adopted in the wake of the Great Recession. Of course, a number of risks to U.S. and global economic growth remain, and changing conditions in 2015 are likely to benefit some countries and industry groups more than others. That’s why we urge you to talk regularly with your financial advisor about the potential impact of macroeconomic developments on your investments.
Thank you for your continued confidence and support.

J. Charles Cardona
President
The Dreyfus Corporation
January 15, 2015
2
DISCUSSION OF FUND PERFORMANCE
For the period of January 1, 2014, through December 31, 2014, as provided by Paul Markham and Jeff Munroe, Primary Portfolio Managers of Newton Capital Management Limited, Sub-Investment Adviser
Fund and Market Performance Overview
For the 12-month period ended December 31, 2014, Dreyfus Variable Investment Fund, International Equity Portfolio’s Initial shares produced a total return of –2.65%, and its Service shares returned –2.90%.1 This compares with a –4.90% return for the fund’s benchmark, the Morgan Stanley Capital International Europe,Australasia, Far East Index (“MSCI EAFE Index”), for the same period.2
International equity markets lost a degree of value during 2014 due to renewed global economic concerns. Favorable country allocations, sector allocations, and individual security selections enabled the fund to outperform its benchmark.
The Fund’s Investment Approach
The fund seeks to achieve long-term capital growth by investing primarily in stocks of foreign companies.
The process of seeking investment ideas takes place within the framework of Newton’s global investment themes.These themes are based on observable economic, industrial, or social trends that we believe will affect markets, industries, or companies globally, and so help to identify areas of investment opportunity and risk. Such themes currently include debt burden, which asserts that certain economies and institutions need to reduce their budget deficits and debt obligations, which jeopardizes their economic prospects (and provides the rationale for the portfolio’s underweighted exposure to the financial sector). Elsewhere, our net effects theme identifies the investment opportunities and challenges inherent in an interconnected world.
When choosing stocks, we consider trends in economic variables, such as gross domestic product, inflation, and interest rates; investment themes; the relative values of equities, bonds, and cash; company fundamentals; and long-term trends in currency movements.Within markets and sectors determined to be relatively attractive, we seek what we believe are attractively priced companies that possess a sustainable competitive
The Fund 3
DISCUSSION OF FUND PERFORMANCE (continued)
advantage in their market or sector. Securities are generally sold when themes or strategies change, when we determine that the company’s prospects have changed, or when a stock reaches what we determine to be a full valuation.
Markets Faltered amid Headwinds
International equity markets lost value during 2014 when heightened volatility during the fourth quarter of the year wiped out earlier gains. While investors generally responded positively over the first half of the year to aggressively stimulative monetary policies from major central banks, sentiment was later dampened by persistent economic weakness in major markets outside of the United States and the United Kingdom. Most notably, European stocks came under pressure due to disappointing GDP growth rates and deflation fears. Japan struggled with higher consumption taxes and the fading benefits of aggressively stimulative monetary and fiscal policies. Hong Kong and Australian stocks were hampered by slowing economic growth in China. Geopolitical unrest in Russia and Ukraine, combined with collapsing oil prices and a plummeting Russian ruble, also weighed on investor sentiment.
Finally, overseas investment results for U.S. residents were undermined by a strengthening U.S. dollar against the euro, the yen, and other currencies.
Defensive Investment Posture Supported Relative Results
Against this backdrop, the fund outperformed its benchmark. Reduced exposure to the emerging markets in the first quarter, concurrent with an increase in holdings exposed to the U.S. dollar, proved particularly helpful. Other positive factors included underweighted exposure to Australia, which was hurt by falling commodity prices, and the Eurozone, where low sovereign bond yields and a weak currency weighed on markets. Overweighted exposure to and strong stock selections in Japan also helped bolster relative results, as did the use of currency forward contracts to hedge exposure to the depreciating Japanese yen.
Eight out of 10 market sectors represented in the MSCI EAFE Index contributed positively to the fund’s relative performance. In the consumer discretionary sector, Dutch media companies Reed Elsevier and Wolters Kluwer benefited from the move to electronic and subscription-based provision of professional literature, and Japanese discount retailer Don Quijote Holdings continued to take domestic market share. Among technology companies, semiconductor maker Tokyo Electron advanced when it merged with Applied Materials. German real estate company LEG
4
Immobilien gained value when loose monetary policy and relatively high inflation led to higher possible rental increases. Underweighted exposure to the energy and materials sectors buoyed relative performance when oil prices fell sharply.
On the other hand, favorable results from an underweighted position in the financials sector were offset by disappointing stock selections, including Germany’s Commerzbank, Japan’s Nomura Holdings, and Switzerland’s Crédit Suisse Group. In the telecommunications services sector,Vodafone lagged market averages despite a high dividend yield and sale of its stake in Verizon Wireless.
Maintaining Investment Discipline
Economic uncertainty, geopolitical concerns, and possible intervention from monetary policymakers may continue to spark heightened market volatility.Therefore, we intend to maintain our focus on companies meeting our theme-based criteria. We have identified an ample number of opportunities in the consumer discretionary, health care, telecommunications services, consumer staples, and information technology sectors, but fewer in the industrials, materials, energy, financials, and utilities sectors.
January 15, 2015
Equity funds are subject generally to market, market sector, market liquidity, issuer, and investment style risks, among other factors, to varying degrees, all of which are more fully described in the fund’s prospectus.
The fund’s performance will be influenced by political, social, and economic factors affecting investments in foreign companies. Special risks associated with investments in foreign companies include exposure to currency fluctuations, less liquidity, less developed or less efficient trading markets, lack of comprehensive company information, political instability, and differing auditing and legal standards.These risks are enhanced in emerging market countries.
The fund is only available as a funding vehicle under variable life insurance policies or variable annuity contracts issued by insurance companies. Individuals may not purchase shares of the fund directly. A variable annuity is an insurance contract issued by an insurance company that enables investors to accumulate assets on a tax-deferred basis for retirement or other long-term goals.The investment objective and policies of Dreyfus Variable Investment Fund, International Equity Portfolio made available through insurance products may be similar to other funds managed or advised by Dreyfus. However, the investment results of the fund may be higher or lower than, and may not be comparable to, those of any other Dreyfus fund.
|
| 1 Total return includes reinvestment of dividends and any capital gains paid. Past performance is no guarantee of future |
| results. Share price and investment return fluctuate such that upon redemption fund shares may be worth more or less |
| than their original cost.The fund’s performance does not reflect the deduction of additional charges and expenses |
| imposed in connection with investing in variable insurance contracts, which will reduce returns. |
| 2 SOURCE: LIPPER INC. — Reflects reinvestment of net dividends and, where applicable, capital gain |
| distributions.The Morgan Stanley Capital International Europe,Australasia, Far East (MSCI EAFE) Index is an |
| unmanaged index composed of a sample of companies representative of the market structure of European and Pacific |
| Basin countries. Investors cannot invest directly in any index. |
The Fund 5
FUND PERFORMANCE
Years Ended 12/31
Comparison of change in value of $10,000 investment in Dreyfus Variable Investment Fund,
International Equity Portfolio Initial shares and Service shares and the Morgan Stanley Capital
International Europe, Australasia, Far East Index
| | | | | | |
| Average Annual Total Returns as of 12/31/14 | | | | | | |
| | 1 Year | | 5 Years | | 10 Years | |
| Initial shares | –2.65 | % | 5.79 | % | 4.74 | % |
| Service shares | –2.90 | % | 5.52 | % | 4.48 | % |
| Morgan Stanley Capital International | | | | | | |
| Europe, Australasia, Far East Index | –4.90 | % | 5.33 | % | 4.43 | % |
† Source: Lipper Inc.
Past performance is not predictive of future performance.The fund’s performance shown in the graph and table does not
reflect the deduction of taxes that a shareholder would pay on fund distributions or the redemption of fund shares.
The fund’s performance does not reflect the deduction of additional charges and expenses imposed in connection
with investing in variable insurance contracts which will reduce returns.
The above graph compares a $10,000 investment made in Initial and Service shares of Dreyfus Variable Investment
Fund, International Equity Portfolio on 12/31/04 to a $10,000 investment made in the Morgan Stanley Capital
International Europe, Australasia, Far East Index (the “Index”) on that date.
6
The fund’s Initial shares are not subject to a Rule 12b-1 fee.The fund’s Service shares are subject to a 0.25% annual Rule 12b-1 fee. All dividends and capital gain distributions are reinvested.
The fund’s performance shown in the line graph above takes into account all applicable fund fees and expenses for Initial and Service shares.The Index is an unmanaged index composed of a sample of companies representative of the market structure of European and Pacific Basin countries and includes net dividends reinvested. Unlike a mutual fund, the Index is not subject to charges, fees and other expenses. Investors cannot invest directly in any index. Further information relating to fund performance, including expense reimbursements, if applicable, is contained in the Financial Highlights section of the prospectus and elsewhere in this report.
The Fund 7
UNDERSTANDING YOUR FUND’S EXPENSES (Unaudited)
As a mutual fund investor, you pay ongoing expenses, such as management fees and other expenses. Using the information below, you can estimate how these expenses affect your investment and compare them with the expenses of other funds.You also may pay one-time transaction expenses, including sales charges (loads), redemption fees and expenses associated with variable annuity or insurance contracts, which are not shown in this section and would have resulted in higher total expenses. For more information, see your fund’s prospectus or talk to your financial adviser.
Review your fund’s expenses
The table below shows the expenses you would have paid on a $1,000 investment in Dreyfus Variable Investment Fund, International Equity Portfolio from July 1, 2014 to December 31, 2014. It also shows how much a $1,000 investment would be worth at the close of the period, assuming actual returns and expenses.
Expenses and Value of a $1,000 Investment
assuming actual returns for the six months ended December 31, 2014
| | | | |
| | | Initial Shares | | Service Shares |
| Expenses paid per $1,000† | | $5.27 | | $6.48 |
| Ending value (after expenses) | | $934.80 | | $933.20 |
COMPARING YOUR FUND’S EXPENSES
WITH THOSE OF OTHER FUNDS (Unaudited)
Using the SEC’s method to compare expenses
The Securities and Exchange Commission (SEC) has established guidelines to help investors assess fund expenses. Per these guidelines, the table below shows your fund’s expenses based on a $1,000 investment, assuming a hypothetical 5% annualized return. You can use this information to compare the ongoing expenses (but not transaction expenses or total cost) of investing in the fund with those of other funds. All mutual fund shareholder reports will provide this information to help you make this comparison. Please note that you cannot use this information to estimate your actual ending account balance and expenses paid during the period.
Expenses and Value of a $1,000 Investment
assuming a hypothetical 5% annualized return for the six months ended December 31, 2014
| | | | |
| | | Initial Shares | | Service Shares |
| Expenses paid per $1,000† | | $5.50 | | $6.77 |
| Ending value (after expenses) | | $1,019.76 | | $1,018.50 |
|
| † Expenses are equal to the fund’s annualized expense ratio of 1.08% for Initial shares and 1.33% for Service shares, |
| multiplied by the average account value over the period, multiplied by 184/365 (to reflect the one-half year period). |
8
STATEMENT OF INVESTMENTS
December 31, 2014
| | | |
| Common Stocks—98.3% | Shares | | Value ($) |
| Australia—.9% | | | |
| Dexus Property Group | 62,335 | | 352,488 |
| Belgium—1.2% | | | |
| Anheuser-Busch InBev | 4,032 | | 453,737 |
| Brazil—.3% | | | |
| International Meal Company Holdings | 28,947 | | 130,645 |
| China—.4% | | | |
| Sun Art Retail Group | 146,500 | | 145,276 |
| Finland—1.5% | | | |
| Nokia | 77,383 | | 609,047 |
| France—5.1% | | | |
| Air Liquide | 5,588 | | 689,497 |
| Sanofi | 8,791 | | 801,178 |
| Vivendi | 21,376 | a | 533,229 |
| | | | 2,023,904 |
| Germany—11.9% | | | |
| Bayer | 4,839 | | 661,538 |
| Brenntag | 11,834 | | 665,893 |
| Commerzbank | 43,599 | a | 579,202 |
| Continental | 1,749 | | 371,405 |
| Gerry Weber International | 9,722 | | 401,769 |
| Infineon Technologies | 51,126 | | 548,126 |
| LEG Immobilien | 11,894 | a | 892,305 |
| Rocket Internet | 72 | b | 4,449 |
| SAP | 8,424 | | 595,625 |
| | | | 4,720,312 |
| Hong Kong—5.1% | | | |
| AIA Group | 123,400 | | 679,497 |
| Belle International Holdings | 269,000 | | 301,143 |
| Jardine Matheson Holdings | 8,400 | | 511,150 |
| Man Wah Holdings | 314,000 | | 517,115 |
| | | | 2,008,905 |
| Ireland—1.4% | | | |
| CRH | 23,695 | | 562,804 |
| Israel—.9% | | | |
| Bank Hapoalim | 76,592 | | 361,225 |
The Fund 9
STATEMENT OF INVESTMENTS (continued)
| | |
| Common Stocks (continued) | Shares | Value ($) |
| Italy—1.9% | | |
| Pirelli & C | 54,771 | 735,571 |
| Japan—27.6% | | |
| Don Quijote Holdings | 14,300 | 976,747 |
| FANUC | 2,900 | 478,612 |
| Japan Airlines | 17,436 | 509,316 |
| Japan Tobacco | 27,400 | 752,352 |
| Lawson | 8,000 | 483,747 |
| LIXIL Group | 38,900 | 822,659 |
| M3 | 17,400 | 289,347 |
| Mitsubishi UFJ Financial Group | 112,900 | 618,821 |
| NGK Spark Plug | 15,000 | 452,959 |
| Nomura Holdings | 109,600 | 623,688 |
| Sawai Pharmaceutical | 6,000 | 345,664 |
| Skylark | 33,900 | 341,012 |
| SoftBank | 13,400 | 797,464 |
| Stanley Electric | 16,500 | 356,648 |
| Sugi Holdings | 16,900 | 689,636 |
| Suntory Beverage & Food | 9,600 | 331,467 |
| Tokyo Electron | 8,200 | 622,273 |
| TOPCON | 18,000 | 383,752 |
| Toyota Motor | 17,700 | 1,103,782 |
| | | 10,979,946 |
| Mexico—.6% | | |
| Grupo Financiero Santander Mexico, Cl. B, ADR | 24,544 | 254,276 |
| Netherlands—3.3% | | |
| Reed Elsevier | 19,123 | 457,017 |
| Wolters Kluwer | 28,220 | 861,718 |
| | | 1,318,735 |
| Norway—1.0% | | |
| DNB | 27,843 | 410,527 |
| Philippines—1.6% | | |
| Energy Development | 1,993,400 | 363,318 |
10
| | | |
| Common Stocks (continued) | Shares | | Value ($) |
| Philippines (continued) | | | |
| LT Group | 927,200 | | 251,370 |
| | | | 614,688 |
| Portugal—.6% | | | |
| Galp Energia | 24,222 | | 245,053 |
| Russia—.6% | | | |
| TBC Bank, GDR | 20,029 | | 252,365 |
| Sweden—1.4% | | | |
| TeliaSonera | 88,373 | | 568,322 |
| Switzerland—12.6% | | | |
| Actelion | 2,986 | a | 343,531 |
| Credit Suisse Group | 27,372 | a | 686,184 |
| Nestle | 14,967 | | 1,097,104 |
| Novartis | 10,587 | | 973,660 |
| Roche Holding | 3,686 | | 999,055 |
| Zurich Insurance Group | 2,932 | a | 918,135 |
| | | | 5,017,669 |
| United Kingdom—18.4% | | | |
| Associated British Foods | 10,342 | | 502,474 |
| Barclays | 202,352 | | 760,744 |
| British American Tobacco | 11,461 | | 622,721 |
| Centrica | 150,053 | | 645,823 |
| GlaxoSmithKline | 30,885 | | 660,787 |
| Imagination Technologies Group | 45,104 | a | 159,012 |
| Just Eat | 54,312 | | 258,524 |
| Merlin Entertainments | 66,161 | b | 408,453 |
| Prudential | 52,788 | | 1,214,768 |
| Royal Dutch Shell, Cl. B | 19,352 | | 664,818 |
| Vodafone Group | 283,767 | | 972,318 |
| Wolseley | 7,702 | | 438,463 |
| | | | 7,308,905 |
| Total Common Stocks | | | |
| (cost $36,383,657) | | | 39,074,400 |
The Fund 11
STATEMENT OF INVESTMENTS (continued)
| | | |
| Other Investment—.8% | Shares | | Value ($) |
| Registered Investment Company; | | | |
| Dreyfus Institutional Preferred Plus | | | |
| Money Market Fund | | | |
| (cost $332,000) | 332,000 | c | 332,000 |
| Total Investments (cost $36,715,657) | 99.1 | % | 39,406,400 |
| Cash and Receivables (Net) | .9 | % | 346,383 |
| Net Assets | 100.0 | % | 39,752,783 |
ADR—American Depository Receipts
GDR—Global Depository Receipts
|
| a Non-income producing security. |
| b Securities exempt from registration pursuant to Rule 144A under the Securities Act of 1933.These securities may be |
| resold in transactions exempt from registration, normally to qualified institutional buyers.At December 31, 2014, |
| these securities were valued at $412,902 or 1.0% of net assets. |
| c Investment in affiliated money market mutual fund. |
| | | |
| Portfolio Summary (Unaudited)† | | |
| |
| | Value (%) | | Value (%) |
| Financial | 21.6 | Telecommunications | 5.9 |
| Consumer Goods | 20.8 | Basic Materials | 5.1 |
| Consumer Services | 15.3 | Utilities | 2.5 |
| Health Care | 11.3 | Oil & Gas | 2.3 |
| Industrial | 7.1 | Money Market Investment | .8 |
| Technology | 6.4 | | 99.1 |
| |
| † Based on net assets. | | | |
| See notes to financial statements. | | | |
12
STATEMENT OF ASSETS AND LIABILITIES
December 31, 2014
| | | |
| | Cost | Value | |
| Assets ($): | | | |
| Investments in securities—See Statement of Investments: | | | |
| Unaffiliated issuers | 36,383,657 | 39,074,400 | |
| Affiliated issuers | 332,000 | 332,000 | |
| Cash | | 55,824 | |
| Cash denominated in foreign currencies | 18,851 | 18,761 | |
| Unrealized appreciation on forward foreign | | | |
| currency exchange contracts—Note 4 | | 294,202 | |
| Dividends receivable | | 117,936 | |
| Receivable for investment securities sold | | 8,767 | |
| Prepaid expenses | | 33 | |
| | | 39,901,923 | |
| Liabilities ($): | | | |
| Due to The Dreyfus Corporation and affiliates—Note 3(b) | | 49,731 | |
| Payable for shares of Beneficial Interest redeemed | | 23,195 | |
| Unrealized depreciation on forward foreign | | | |
| currency exchange contracts—Note 4 | | 16,297 | |
| Accrued expenses | | 59,917 | |
| | | 149,140 | |
| Net Assets ($) | | 39,752,783 | |
| Composition of Net Assets ($): | | | |
| Paid-in capital | | 45,606,586 | |
| Accumulated undistributed investment income—net | | 1,039,388 | |
| Accumulated net realized gain (loss) on investments | | (9,854,766 | ) |
| Accumulated net unrealized appreciation (depreciation) | | | |
| on investments and foreign currency transactions | | 2,961,575 | |
| Net Assets ($) | | 39,752,783 | |
| |
| |
| Net Asset Value Per Share | | | |
| | Initial Shares | Service Shares | |
| Net Assets ($) | 29,730,669 | 10,022,114 | |
| Shares Outstanding | 1,620,312 | 547,231 | |
| Net Asset Value Per Share ($) | 18.35 | 18.31 | |
| See notes to financial statements. | | | |
The Fund 13
STATEMENT OF OPERATIONS
Year Ended December 31, 2014
| | |
| Investment Income ($): | | |
| Income: | | |
| Cash dividends (net of $106,627 foreign taxes withheld at source): | | |
| Unaffiliated issuers | 1,491,465 | |
| Affiliated issuers | 482 | |
| Interest | 272 | |
| Total Income | 1,492,219 | |
| Expenses: | | |
| Investment advisory fee—Note 3(a) | 316,676 | |
| Professional fees | 74,264 | |
| Custodian fees—Note 3(b) | 33,142 | |
| Distribution fees—Note 3(b) | 27,178 | |
| Prospectus and shareholders’ reports | 15,691 | |
| Trustees’ fees and expenses—Note 3(c) | 2,819 | |
| Loan commitment fees—Note 2 | 420 | |
| Shareholder servicing costs—Note 3(b) | 318 | |
| Miscellaneous | 14,694 | |
| Total Expenses | 485,202 | |
| Less—reduction in fees due to earnings credits—Note 3(b) | (1 | ) |
| Net Expenses | 485,201 | |
| Investment Income—Net | 1,007,018 | |
| Realized and Unrealized Gain (Loss) on Investments—Note 4 ($): | | |
| Net realized gain (loss) on investments and foreign currency transactions | 2,785,464 | |
| Net realized gain (loss) on forward foreign currency exchange contracts | 171,996 | |
| Net Realized Gain (Loss) | 2,957,460 | |
| Net unrealized appreciation (depreciation) on | | |
| investments and foreign currency transactions | (5,198,073 | ) |
| Net unrealized appreciation (depreciation) on | | |
| forward foreign currency exchange contracts | 127,516 | |
| Net Unrealized Appreciation (Depreciation) | (5,070,557 | ) |
| Net Realized and Unrealized Gain (Loss) on Investments | (2,113,097 | ) |
| Net (Decrease) in Net Assets Resulting from Operations | (1,106,079 | ) |
| |
| See notes to financial statements. | | |
14
STATEMENT OF CHANGES IN NET ASSETS
| | | | |
| | Year Ended December 31, | |
| | 2014 | | 2013 | |
| Operations ($): | | | | |
| Investment income—net | 1,007,018 | | 583,940 | |
| Net realized gain (loss) on investments | 2,957,460 | | 3,216,487 | |
| Net unrealized appreciation | | | | |
| (depreciation) on investments | (5,070,557 | ) | 2,806,167 | |
| Net Increase (Decrease) in Net Assets | | | | |
| Resulting from Operations | (1,106,079 | ) | 6,606,594 | |
| Dividends to Shareholders from ($): | | | | |
| Investment income—net: | | | | |
| Initial Shares | (706,951 | ) | (835,411 | ) |
| Service Shares | (224,609 | ) | (275,794 | ) |
| Total Dividends | (931,560 | ) | (1,111,205 | ) |
| Beneficial Interest Transactions ($): | | | | |
| Net proceeds from shares sold: | | | | |
| Initial Shares | 2,642,372 | | 3,746,527 | |
| Service Shares | 871,107 | | 1,890,373 | |
| Dividends reinvested: | | | | |
| Initial Shares | 706,951 | | 835,411 | |
| Service Shares | 224,609 | | 275,794 | |
| Cost of shares redeemed: | | | | |
| Initial Shares | (4,294,625 | ) | (4,501,653 | ) |
| Service Shares | (2,130,320 | ) | (1,777,851 | ) |
| Increase (Decrease) in Net Assets from | | | | |
| Beneficial Interest Transactions | (1,979,906 | ) | 468,601 | |
| Total Increase (Decrease) in Net Assets | (4,017,545 | ) | 5,963,990 | |
| Net Assets ($): | | | | |
| Beginning of Period | 43,770,328 | | 37,806,338 | |
| End of Period | 39,752,783 | | 43,770,328 | |
| Undistributed investment income—net | 1,039,388 | | 795,499 | |
The Fund 15
STATEMENT OF CHANGES IN NET ASSETS (continued)
| | | | |
| | Year Ended December 31, | |
| | 2014 | | 2013 | |
| Capital Share Transactions: | | | | |
| Initial Shares | | | | |
| Shares sold | 139,933 | | 206,669 | |
| Shares issued for dividends reinvested | 37,704 | | 48,068 | |
| Shares redeemed | (227,128 | ) | (249,149 | ) |
| Net Increase (Decrease) in Shares Outstanding | (49,491 | ) | 5,588 | |
| Service Shares | | | | |
| Shares sold | 46,350 | | 104,121 | |
| Shares issued for dividends reinvested | 11,979 | | 15,869 | |
| Shares redeemed | (112,745 | ) | (97,476 | ) |
| Net Increase (Decrease) in Shares Outstanding | (54,416 | ) | 22,514 | |
| See notes to financial statements. | | | | |
16
FINANCIAL HIGHLIGHTS
The following tables describe the performance for each share class for the fiscal periods indicated. All information (except portfolio turnover rate) reflects financial results for a single fund share.Total return shows how much your investment in the fund would have increased (or decreased) during each period, assuming you had reinvested all dividends and distributions. The fund’s total returns do not reflect expenses associated with variable annuity or insurance contracts.These figures have been derived from the fund’s financial statements.
| | | | | | | | | | |
| | | | Year Ended December 31, | | | |
| Initial Shares | 2014 | | 2013 | | 2012 | | 2011 | | 2010 | |
| Per Share Data ($): | | | | | | | | | | |
| Net asset value, beginning of period | 19.28 | | 16.86 | | 13.75 | | 16.44 | | 15.19 | |
| Investment Operations: | | | | | | | | | | |
| Investment income—neta | .46 | | .27 | | .28 | | .21 | | .22 | |
| Net realized and unrealized | | | | | | | | | | |
| gain (loss) on investments | (.96 | ) | 2.66 | | 2.90 | | (2.57 | ) | 1.28 | |
| Total from Investment Operations | (.50 | ) | 2.93 | | 3.18 | | (2.36 | ) | 1.50 | |
| Distributions: | | | | | | | | | | |
| Dividends from investment income—net | (.43 | ) | (.51 | ) | (.07 | ) | (.33 | ) | (.25 | ) |
| Net asset value, end of period | 18.35 | | 19.28 | | 16.86 | | 13.75 | | 16.44 | |
| Total Return (%) | (2.65 | ) | 17.74 | | 23.15 | | (14.68 | ) | 10.03 | |
| Ratios/Supplemental Data (%): | | | | | | | | | | |
| Ratio of total expenses | | | | | | | | | | |
| to average net assets | 1.08 | | 1.11 | | 1.06 | | 1.10 | | 1.06 | |
| Ratio of net expenses | | | | | | | | | | |
| to average net assets | 1.08 | | 1.11 | | 1.06 | | 1.10 | | 1.06 | |
| Ratio of net investment income | | | | | | | | | | |
| to average net assets | 2.44 | | 1.49 | | 1.88 | | 1.35 | | 1.47 | |
| Portfolio Turnover Rate | 44.96 | | 48.07 | | 45.03 | | 56.20 | | 63.67 | |
| Net Assets, end of period ($ x 1,000) | 29,731 | | 32,192 | | 28,058 | | 33,297 | | 47,443 | |
| a Based on average shares outstanding. | | | | | | | | | | |
| See notes to financial statements. | | | | | | | | | | |
The Fund 17
FINANCIAL HIGHLIGHTS (continued)
| | | | | | | | | | |
| | | | Year Ended December 31, | | | |
| Service Shares | 2014 | | 2013 | | 2012 | | 2011 | | 2010 | |
| Per Share Data ($): | | | | | | | | | | |
| Net asset value, beginning of period | 19.24 | | 16.83 | | 13.72 | | 16.41 | | 15.17 | |
| Investment Operations: | | | | | | | | | | |
| Investment income—neta | .42 | | .23 | | .23 | | .17 | | .18 | |
| Net realized and unrealized | | | | | | | | | | |
| gain (loss) on investments | (.97 | ) | 2.65 | | 2.90 | | (2.57 | ) | 1.28 | |
| Total from Investment Operations | (.55 | ) | 2.88 | | 3.13 | | (2.40 | ) | 1.46 | |
| Distributions: | | | | | | | | | | |
| Dividends from investment income—net | (.38 | ) | (.47 | ) | (.02 | ) | (.29 | ) | (.22 | ) |
| Net asset value, end of period | 18.31 | | 19.24 | | 16.83 | | 13.72 | | 16.41 | |
| Total Return (%) | (2.90 | ) | 17.43 | | 22.83 | | (14.91 | ) | 9.74 | |
| Ratios/Supplemental Data (%): | | | | | | | | | | |
| Ratio of total expenses | | | | | | | | | | |
| to average net assets | 1.33 | | 1.36 | | 1.31 | | 1.35 | | 1.31 | |
| Ratio of net expenses | | | | | | | | | | |
| to average net assets | 1.33 | | 1.36 | | 1.31 | | 1.35 | | 1.31 | |
| Ratio of net investment income | | | | | | | | | | |
| to average net assets | 2.22 | | 1.24 | | 1.53 | | 1.09 | | 1.23 | |
| Portfolio Turnover Rate | 44.96 | | 48.07 | | 45.03 | | 56.20 | | 63.67 | |
| Net Assets, end of period ($ x 1,000) | 10,022 | | 11,578 | | 9,749 | | 9,439 | | 13,819 | |
| a Based on average shares outstanding. | | | | | | | | | | |
| See notes to financial statements. | | | | | | | | | | |
18
NOTES TO FINANCIAL STATEMENTS
NOTE 1—Significant Accounting Policies:
Dreyfus Variable Investment Fund (the “Company”) is registered under the Investment Company Act of 1940, as amended (the “Act”), as an open-end management investment company, operating as a series company currently offering seven series, including the International Equity Portfolio (the “fund”). The fund is only offered to separate accounts established by insurance companies to fund variable annuity contracts and variable life insurance policies.The fund is a non-diversified series. The fund’s investment objective is to seek capital growth. The Dreyfus Corporation (the “Manager” or “Dreyfus”), a wholly-owned subsidiary of The Bank of NewYork Mellon Corporation (“BNY Mellon”), serves as the fund’s investment adviser. Newton Capital Management Limited (“Newton”), a wholly-owned subsidiary of BNY Mellon and an affiliate of Dreyfus, serves as the fund’s sub-investment adviser.
MBSC Securities Corporation (the “Distributor”), a wholly-owned subsidiary of Dreyfus, is the distributor of the fund’s shares, which are sold without a sales charge.The fund is authorized to issue an unlimited number of $.001 par value shares of Beneficial Interest in each of the following classes of shares: Initial and Service. Each class of shares has identical rights and privileges, except with respect to the Distribution Plan and the expenses borne by each class, the allocation of certain transfer agency costs, and certain voting rights. Income, expenses (other than expenses attributable to a specific class), and realized and unrealized gains or losses on investments are allocated to each class of shares based on its relative net assets.
The Company accounts separately for the assets, liabilities and operations of each series. Expenses directly attributable to each series are charged to that series’ operations; expenses which are applicable to all series are allocated among them on a pro rata basis.
The Fund 19
NOTES TO FINANCIAL STATEMENTS (continued)
The Financial Accounting Standards Board (“FASB”) Accounting Standards Codification (“ASC”) is the exclusive reference of authoritative U.S. generally accepted accounting principles (“GAAP”) recognized by the FASB to be applied by nongovernmental entities. Rules and interpretive releases of the Securities and Exchange Commission (“SEC”) under authority of federal laws are also sources of authoritative GAAP for SEC registrants. The fund’s financial statements are prepared in accordance with GAAP, which may require the use of management estimates and assumptions. Actual results could differ from those estimates.
The Company enters into contracts that contain a variety of indemnifications. The fund’s maximum exposure under these arrangements is unknown.The fund does not anticipate recognizing any loss related to these arrangements.
(a) Portfolio valuation: The fair value of a financial instrument is the amount that would be received to sell an asset or paid to transfer a liability in an orderly transaction between market participants at the measurement date (i.e., the exit price). GAAP establishes a fair value hierarchy that prioritizes the inputs of valuation techniques used to measure fair value. This hierarchy gives the highest priority to unadjusted quoted prices in active markets for identical assets or liabilities (Level 1 measurements) and the lowest priority to unobservable inputs (Level 3 measurements).
Additionally, GAAP provides guidance on determining whether the volume and activity in a market has decreased significantly and whether such a decrease in activity results in transactions that are not orderly. GAAP requires enhanced disclosures around valuation inputs and techniques used during annual and interim periods.
20
Various inputs are used in determining the value of the fund’s investments relating to fair value measurements.These inputs are summarized in the three broad levels listed below:
Level 1—unadjusted quoted prices in active markets for identical investments.
Level 2—other significant observable inputs (including quoted prices for similar investments, interest rates, prepayment speeds, credit risk, etc.).
Level 3—significant unobservable inputs (including the fund’s own assumptions in determining the fair value of investments).
The inputs or methodology used for valuing securities are not necessarily an indication of the risk associated with investing in those securities.
Changes in valuation techniques may result in transfers in or out of an assigned level within the disclosure hierarchy.Valuation techniques used to value the fund’s investments are as follows:
Investments in securities are valued at the last sales price on the securities exchange or national securities market on which such securities are primarily traded. Securities listed on the National Market System for which market quotations are available are valued at the official closing price or, if there is no official closing price that day, at the last sales price. For open short positions, asked prices are used for valuation purposes. Bid price is used when no asked price is available. Registered investment companies that are not traded on an exchange are valued at their net asset value.All of the preceding securities are generally categorized within Level 1 of the fair value hierarchy.
Securities not listed on an exchange or the national securities market, or securities for which there were no transactions, are valued at the
The Fund 21
NOTES TO FINANCIAL STATEMENTS (continued)
average of the most recent bid and asked prices. These securities are generally categorized within Level 2 of the fair value hierarchy.
Fair valuing of securities may be determined with the assistance of a pricing service using calculations based on indices of domestic securities and other appropriate indicators, such as prices of relevant ADRs and financial futures. Utilizing these techniques may result in transfers between Level 1 and Level 2 of the fair value hierarchy.
When market quotations or official closing prices are not readily available, or are determined not to reflect accurately fair value, such as when the value of a security has been significantly affected by events after the close of the exchange or market on which the security is principally traded (for example, a foreign exchange or market), but before the fund calculates its net asset value, the fund may value these investments at fair value as determined in accordance with the procedures approved by the Company’s Board of Trustees (the “Board”). Certain factors may be considered when fair valuing investments such as: fundamental analytical data, the nature and duration of restrictions on disposition, an evaluation of the forces that influence the market in which the securities are purchased and sold, and public trading in similar securities of the issuer or comparable issuers. These securities are either categorized within Level 2 or 3 of the fair value hierarchy depending on the relevant inputs used.
For restricted securities where observable inputs are limited, assumptions about market activity and risk are used and are generally categorized within Level 3 of the fair value hierarchy.
Investments denominated in foreign currencies are translated to U.S. dollars at the prevailing rates of exchange.
Forward foreign currency exchange contracts (“forward contracts”) are valued at the forward rate and are generally categorized within Level 2 of the fair value hierarchy.
22
The following is a summary of the inputs used as of December 31, 2014 in valuing the fund’s investments:
| | | | | | |
| | | Level 2—Other | | Level 3— | | |
| | Level 1— | Significant | | Significant | | |
| | Unadjusted | Observable | | Unobservable | | |
| | Quoted Prices | Inputs | | Inputs | Total | |
| Assets ($) | | | | | | |
| Investments in Securities: | | | | | |
| Equity Securities— | | | | | | |
| Foreign | | | | | | |
| Common Stocks† | 506,641 | 38,567,759 | †† | — | 39,074,400 | |
| Mutual Funds | 332,000 | — | | — | 332,000 | |
| Other Financial | | | | | | |
| Instruments: | | | | | | |
| Forward Foreign | | | | | | |
| Currency Exchange | | | | | | |
| Contracts††† | — | 294,202 | | — | 294,202 | |
| Liabilities ($) | | | | | | |
| Other Financial | | | | | | |
| Instruments: | | | | | | |
| Forward Foreign | | | | | | |
| Currency Exchange | | | | | | |
| Contracts††† | — | (16,297 | ) | — | (16,297 | ) |
| |
| † | See Statement of Investments for additional detailed categorizations. |
| †† | Securities classified within Level 2 at period end as the values were determined pursuant to the |
| | fund’s fair valuation procedures. See note above for additional information. |
| ††† | Amount shown represents unrealized appreciation (depreciation) at period end. |
At December 31, 2013, no exchange traded foreign equity securities were classified within Level 2 of the fair value hierarchy.
|
| (b) Foreign currency transactions: The fund does not isolate that por- |
| tion of the results of operations resulting from changes in foreign |
| exchange rates on investments from the fluctuations arising from changes |
| in the market prices of securities held. Such fluctuations are included |
| with the net realized and unrealized gain or loss on investments. |
The Fund 23
NOTES TO FINANCIAL STATEMENTS (continued)
Net realized foreign exchange gains or losses arise from sales of foreign currencies, currency gains or losses realized on securities transactions between trade and settlement date, and the difference between the amounts of dividends, interest and foreign withholding taxes recorded on the fund’s books and the U.S. dollar equivalent of the amounts actually received or paid. Net unrealized foreign exchange gains and losses arise from changes in the value of assets and liabilities other than investments resulting from changes in exchange rates. Foreign currency gains and losses on foreign currency transactions are also included with net realized and unrealized gain or loss on investments.
(c) Securities transactions and investment income: Securities transactions are recorded on a trade date basis. Realized gains and losses from securities transactions are recorded on the identified cost basis. Dividend income is recognized on the ex-dividend date and interest income, including, where applicable, accretion of discount and amortization of premium on investments, is recognized on the accrual basis.
(d) Affiliated issuers: Investments in other investment companies advised by Dreyfus are defined as “affiliated” under the Act. Investments in affiliated investment companies during the period ended December 31, 2014 were as follows:
| | | | | |
| Affiliated | | | | | |
| Investment | Value | | | Value | Net |
| Company | 12/31/2013 ($) | Purchases ($) | Sales ($) | 12/31/2014 ($) | Assets (%) |
| Dreyfus | | | | | |
| Institutional | | | | | |
| Preferred | | | | | |
| Plus Money | | | | | |
| Market Fund | 850,000 | 11,708,000 | 12,226,000 | 332,000 | .8 |
(e) Risk: Investing in foreign markets may involve special risks and considerations not typically associated with investing in the U.S.These risks include revaluation of currencies, high rates of inflation, repatriation restrictions on income and capital, and adverse political and economic developments. Moreover, securities issued in these markets may be less liquid, subject to government ownership controls and delayed settlements, and their prices may be more volatile than those of comparable securities in the U.S.
24
(f) Dividends to shareholders: Dividends are recorded on the ex-dividend date. Dividends from investment income-net and dividends from net realized capital gains, if any, are normally declared and paid annually, but the fund may make distributions on a more frequent basis to comply with the distribution requirements of the Internal Revenue Code of 1986, as amended (the “Code”).To the extent that net realized capital gains can be offset by capital loss carryovers, it is the policy of the fund not to distribute such gains. Income and capital gain distributions are determined in accordance with income tax regulations, which may differ from GAAP.
(g) Federal income taxes: It is the policy of the fund to continue to qualify as a regulated investment company, if such qualification is in the best interests of its shareholders, by complying with the applicable provisions of the Code, and to make distributions of taxable income sufficient to relieve it from substantially all federal income and excise taxes.
As of and during the period ended December 31, 2014, the fund did not have any liabilities for any uncertain tax positions. The fund recognizes interest and penalties, if any, related to uncertain tax positions as income tax expense in the Statement of Operations. During the period ended December 31, 2014, the fund did not incur any interest or penalties.
Each tax year in the four-year period ended December 31, 2014 remains subject to examination by the Internal Revenue Service and state taxing authorities.
At December 31, 2014, the components of accumulated earnings on a tax basis were as follows: undistributed ordinary income $1,317,245, accumulated capital losses $9,808,168 and unrealized appreciation $2,637,120.
Under the Regulated Investment Company Modernization Act of 2010 (the “2010 Act”), the fund is permitted to carry forward capital losses incurred in taxable years beginning after December 22, 2010 (“post-enactment losses”) for an unlimited period. Furthermore, post-
The Fund 25
NOTES TO FINANCIAL STATEMENTS (continued)
enactment capital loss carryovers retain their character as either short-term or long-term capital losses rather than short-term as they were under previous statute.The 2010 Act requires post-enactment losses to be utilized before the utilization of losses incurred in taxable years prior to the effective date of the 2010 Act (“pre-enactment losses”). As a result of this ordering rule, pre-enactment losses may be more likely to expire unused.
The accumulated capital loss carryover is available for federal income tax purposes to be applied against future net realized capital gains, if any, realized subsequent to December 31, 2014. If not applied, the carryover expires in fiscal year 2017.
The tax character of distributions paid to shareholders during the fiscal periods ended December 31, 2014 and December 31, 2013 were as follows: ordinary income $931,560 and $1,111,205, respectively.
During the period ended December 31, 2014, as a result of permanent book to tax differences, primarily due to the tax treatment for foreign currency exchange gains and losses and passive foreign investment companies, the fund increased accumulated undistributed investment income-net by $168,431 and decreased accumulated net realized gain (loss) on investments by the same amount. Net assets and net asset value per share were not affected by this reclassification.
NOTE 2—Bank Lines of Credit:
The fund participates with other Dreyfus-managed funds in a $430 million unsecured credit facility led by Citibank, N.A. and a $300 million unsecured credit facility provided by The Bank of New York Mellon, a subsidiary of BNY Mellon and an affiliate of Dreyfus (each, a “Facility”), each to be utilized primarily for temporary or emergency purposes, including the financing of redemptions. Prior to October 8, 2014, the unsecured credit facility with Citibank, N.A. was $265 million. In connection therewith, the fund has agreed to pay its pro rata
26
portion of commitment fees for each Facility. Interest is charged to the fund based on rates determined pursuant to the terms of the respective Facility at the time of borrowing. During the period ended December 31, 2014, the fund did not borrow under the Facilities.
NOTE 3—Investment Advisory Fee, Sub-Investment Advisory Fee and Other Transactions with Affiliates:
(a) Pursuant to an investment advisory agreement with Dreyfus, the investment advisory fee is computed at the annual rate of .75% of the value of the fund’s average daily net assets and is payable monthly.
Pursuant to a sub-investment advisory agreement between Dreyfus and Newton, the sub-investment advisory fee is payable monthly by Dreyfus, and is based upon the value of the fund’s average daily net assets, computed at the following annual rates:
| | |
| Average Net Assets | | |
| 0 up to $100 million | .35 | % |
| $100 million up to $1 billion | .30 | % |
| $1 billion up to $1.5 billion | .26 | % |
| In excess of $1.5 billion | .20 | % |
(b) Under the Distribution Plan adopted pursuant to Rule 12b-1 under the Act, Service shares pay the Distributor for distributing its shares, for servicing and/or maintaining Service shares’ shareholder accounts and for advertising and marketing for Service shares. The Distribution Plan provides for payments to be made at an annual rate of .25% of the value of Service shares’ average daily net assets. The Distributor may make payments to Participating Insurance Companies and to brokers and dealers acting as principal underwriter for their variable insurance products. The fees payable under the Distribution Plan are payable without regard to actual expenses incurred. During the period ended December 31, 2014, Service shares were charged $27,178 pursuant to the Distribution Plan.
The Fund 27
NOTES TO FINANCIAL STATEMENTS (continued)
The fund has arrangements with the transfer agent and the custodian whereby the fund may receive earnings credits when positive cash balances are maintained, which are used to offset transfer agency and custody fees. For financial reporting purposes, the fund includes net earnings credits as an expense offset in the Statement of Operations.
The fund compensates Dreyfus Transfer, Inc., a wholly-owned subsidiary of Dreyfus, under a transfer agency agreement for providing transfer agency and cash management services for the fund. The majority of transfer agency fees are comprised of amounts paid on a per account basis, while cash management fees are related to fund subscriptions and redemptions. During the period ended December 31, 2014, the fund was charged $293 for transfer agency services and $20 for cash management services. These fees are included in Shareholder servicing costs in the Statement of Operations. Cash management fees were partially offset by earnings credits of $1.
The fund compensates The Bank of New York Mellon under a custody agreement for providing custodial services for the fund. These fees are determined based on net assets, geographic region and transaction activity. During the period ended December 31, 2014, the fund was charged $33,142 pursuant to the custody agreement.
During the period ended December 31, 2014, the fund was charged $7,771 for services performed by the Chief Compliance Officer and his staff.
The components of “Due to The Dreyfus Corporation and affiliates” in the Statement of Assets and Liabilities consist of: investment advisory fees $25,693, Distribution Plan fees $2,158, custodian fees $19,891, Chief Compliance Officer fees $1,851 and transfer agency fees $138.
(c) Each Board member also serves as a Board member of other funds within the Dreyfus complex. Annual retainer fees and attendance fees are allocated to each fund based on net assets.
28
NOTE 4—Securities Transactions:
The aggregate amount of purchases and sales of investment securities, excluding short-term securities and forward contracts, during the period ended December 31, 2014, amounted to $18,667,299 and $19,659,312, respectively.
Derivatives: A derivative is a financial instrument whose performance is derived from the performance of another asset. Each type of derivative instrument that was held by the fund during the period ended December 31, 2014 is discussed below.
Master Netting Arrangements: The fund enters into International Swaps and Derivatives Association, Inc. Master Agreements or similar agreements (collectively, “Master Agreements”) with its over-the counter (“OTC”) derivative contract counterparties in order to, among other things, reduce its credit risk to counterparties. Master Agreements include provisions for general obligations, representations, collateral and events of default or termination. Under a Master Agreement, the fund may offset with the counterparty certain derivative financial instrument’s payables and/or receivables with collateral held and/or posted and create one single net payment in the event of default or termination.
Forward Foreign Currency Exchange Contracts: The fund enters into forward contracts in order to hedge its exposure to changes in foreign currency exchange rates on its foreign portfolio holdings, to settle foreign currency transactions or as a part of its investment strat-egy.When executing forward contracts, the fund is obligated to buy or sell a foreign currency at a specified rate on a certain date in the future. With respect to sales of forward contracts, the fund incurs a loss if the value of the contract increases between the date the forward contract is opened and the date the forward contract is closed.The fund realizes a gain if the value of the contract decreases between those dates.With
The Fund 29
NOTES TO FINANCIAL STATEMENTS (continued)
respect to purchases of forward contracts, the fund incurs a loss if the value of the contract decreases between the date the forward contract is opened and the date the forward contract is closed.The fund realizes a gain if the value of the contract increases between those dates. Any realized or unrealized gains or losses which occurred during the period are reflected in the Statement of Operations. The fund is exposed to foreign currency risk as a result of changes in value of underlying financial instruments. The fund is also exposed to credit risk associated with counterparty nonperformance on these forward contracts, which is generally limited to the unrealized gain on each open contract. This risk is mitigated by Master Agreements between the fund and the counterparty. The following summarizes open forward contracts at December 31, 2014:
| | | | | |
| | Foreign | | | Unrealized | |
| Forward Foreign Currency | Currency | | | Appreciation | |
| Exchange Contracts | Amounts | Cost ($) | Value ($) | (Depreciation) ($) | |
| Purchases: | | | | | |
| Japanese Yen, | | | | | |
| Expiring | | | | | |
| 1/15/2015a | 97,700,000 | 832,065 | 815,768 | (16,297 | ) |
| Sales: | | Proceeds ($) | | | |
| Euro, | | | | | |
| Expiring | | | | | |
| 1/2/2015a | 7,245 | 8,814 | 8,766 | 48 | |
| Japanese Yen, | | | | | |
| Expiring | | | | | |
| 1/15/2015b | 355,598,000 | 3,263,300 | 2,969,146 | 294,154 | |
| Gross Unrealized | | | | | |
| Appreciation | | | | 294,202 | |
| Gross Unrealized | | | | | |
| Depreciation | | | | (16,297 | ) |
Counterparties:
| |
| a | JP Morgan Chase Bank |
| b | UBS |
The provisions of ASC Topic 210 “Disclosures about Offsetting Assets and Liabilities” require disclosure on the offsetting of financial assets and liabilities. These disclosures are required for certain investments, including derivative financial instruments subject to Master Agreements which are eligible for offsetting in the Statement of Assets
30
and Liabilities and require the fund to disclose both gross and net information with respect to such investments. For financial reporting purposes, the fund does not offset derivative assets and derivative liabilities that are subject to Master Agreements in the Statement of Assets and Liabilities.
At December 31, 2014, derivative assets and liabilities (by type) on a gross basis are as follows:
| | | |
| Derivative Financial Instruments: | Assets ($) | Liabilities ($) | |
| Forward contracts | 294,202 | (16,297 | ) |
| Total gross amount of derivative assets | | | |
| and liabilities in the Statement of | | | |
| Assets and Liabilities | 294,202 | (16,297 | ) |
| Derivatives not subject to | | | |
| Master Agreements | — | — | |
| Total gross amount of assets and | | | |
| liabilities subject to Master Agreements | 294,202 | (16,297 | ) |
The following tables present derivative assets and liabilities net of amounts available for offsetting under Master Agreements and net of related collateral received or pledged, if any, as of December 31, 2014:
| | | | | | | |
| | | | Financial | | | | |
| | | | Instruments | | | | |
| | | | and | | | | |
| | | | Derivatives | | | | |
| | Gross Amount of | | Available | | Collateral | Net Amount of | |
| Counterparty | Assets ($)1 | | for Offset ($) | | Received ($) | Assets ($) | |
| JP Morgan Chase Bank | 48 | | (48 | ) | — | — | |
| UBS | 294,154 | | — | | — | 294,154 | |
| Total | 294,202 | | (48 | ) | — | 294,154 | |
| |
| | | | Financial | | | | |
| | | | Instruments | | | | |
| | | | and | | | | |
| | | | Derivatives | | | | |
| | Gross Amount of | | Available | | Collateral | Net Amount of | |
| Counterparty | Liabilities ($)1 | | for Offset ($) | | Pledged ($) | Liabilities ($) | |
| JP Morgan Chase Bank | (16,297 | ) | 48 | | — | (16,249 | ) |
| Total | (16,297 | ) | 48 | | — | (16,249 | ) |
| |
| 1 | Absent a default event or early termination, OTC derivative assets and liabilities are presented at |
| | gross amounts and are not offset in the Statement of Assets and Liabilities. |
The Fund 31
NOTES TO FINANCIAL STATEMENTS (continued)
The following summarizes the average market value of derivatives outstanding during the period ended December 31, 2014:
| |
| | Average Market Value ($) |
| Forward contracts | 3,472,126 |
At December 31, 2014, the cost of investments for federal income tax purposes was $36,762,254; accordingly, accumulated net unrealized appreciation on investments was $2,644,146, consisting of $5,942,208 gross unrealized appreciation and $3,298,062 gross unrealized depreciation.
32
REPORT OF INDEPENDENT REGISTERED
PUBLIC ACCOUNTING FIRM
Shareholders and Board of Trustees
Dreyfus Variable Investment Fund, International Equity Portfolio
We have audited the accompanying statement of assets and liabilities, including the statement of investments, of Dreyfus Variable Investment Fund, International Equity Portfolio (one of the series comprising Dreyfus Variable Investment Fund) as of December 31, 2014, and the related statement of operations for the year then ended, the statement of changes in net assets for each of the two years in the period then ended, and the financial highlights for each of the five years in the period then ended.These financial statements and financial highlights are the responsibility of the Fund’s management. Our responsibility is to express an opinion on these financial statements and financial highlights based on our audits.
We conducted our audits in accordance with the standards of the Public Company Accounting Oversight Board (United States).Those standards require that we plan and perform the audit to obtain reasonable assurance about whether the financial statements and financial highlights are free of material misstatement.We were not engaged to perform an audit of the Fund’s internal control over financial reporting. Our audits included consideration of internal control over financial reporting as a basis for designing audit procedures that are appropriate in the circumstances, but not for the purpose of expressing an opinion on the effectiveness of the Fund’s internal control over financial reporting. Accordingly, we express no such opinion. An audit also includes examining, on a test basis, evidence supporting the amounts and disclosures in the financial statements and financial highlights, assessing the accounting principles used and significant estimates made by management, and evaluating the overall financial statement presentation. Our procedures included confirmation of securities owned as of December 31, 2014 by correspondence with the custodian and others. We believe that our audits provide a reasonable basis for our opinion.
In our opinion, the financial statements and financial highlights referred to above present fairly, in all material respects, the financial position of Dreyfus Variable Investment Fund, International Equity Portfolio at December 31, 2014, the results of its operations for the year then ended, the changes in its net assets for each of the two years in the period then ended, and the financial highlights for each of the five years in the period then ended, in conformity with U.S. generally accepted accounting principles.

New York, New York
February 11, 2015
The Fund 33
IMPORTANT TAX INFORMATION (Unaudited)
In accordance with federal tax law, the fund elects to provide each shareholder with their portion of the fund’s foreign taxes paid and the income sourced from foreign countries. Accordingly, the fund hereby reports the following information regarding its fiscal year ended December 31, 2014:
—the total amount of taxes paid to foreign countries was $102,958
—the total amount of income sourced from foreign countries was $1,598,093.
Where required by federal tax law rules, shareholders will receive notification of their proportionate share of foreign taxes paid and foreign sourced income for the 2014 calendar year with Form 1099-DIV which will be mailed in early 2015.
34
BOARD MEMBERS INFORMATION (Unaudited)
INDEPENDENT BOARD MEMBERS
|
| Joseph S. DiMartino (71) |
| Chairman of the Board (1995) |
| Principal Occupation During Past 5Years: |
| • Corporate Director and Trustee (1995-present) |
| Other Public Company Board Memberships During Past 5Years: |
| • CBIZ (formerly, Century Business Services, Inc.), a provider of outsourcing functions for small |
| and medium size companies, Director (1997-present) |
| • The Newark Group, a provider of a national market of paper recovery facilities, paperboard |
| mills and paperboard converting plants, Director (2000-2010) |
| • Sunair Services Corporation, a provider of certain outdoor-related services to homes and |
| businesses, Director (2005-2009) |
| No. of Portfolios for which Board Member Serves: 146 |
| ——————— |
| Peggy C. Davis (71) |
| Board Member (2006) |
| Principal Occupation During Past 5Years: |
| • Shad Professor of Law, New York University School of Law (1983-present) |
| No. of Portfolios for which Board Member Serves: 52 |
| ——————— |
| David P. Feldman (75) |
| Board Member (1994) |
| Principal Occupation During Past 5Years: |
| • Corporate Director and Trustee (1985-present) |
| Other Public Company Board Membership During Past 5Years: |
| • BBH Mutual Funds Group (5 registered mutual funds), Director (1992-present) |
| No. of Portfolios for which Board Member Serves: 38 |
| ——————— |
| Ehud Houminer (74) |
| Board Member (2006) |
| Principal Occupation During Past 5Years: |
| • Executive-in-Residence at the Columbia Business School, Columbia University (1992-present) |
| Other Public Company Board Membership During Past 5Years: |
| • Avnet, Inc., an electronics distributor, Director (1993-2012) |
| No. of Portfolios for which Board Member Serves: 62 |
The Fund 35
BOARD MEMBERS INFORMATION (Unaudited) (continued)
INDEPENDENT BOARD MEMBERS (continued)
Lynn Martin (75)
Board Member (2012)
|
| Principal Occupation During Past 5Years: |
| • President of The Martin Hall Group LLC, a human resources consulting firm (2005-2012) |
| Other Public Company Board Memberships During Past 5Years: |
| • AT&T, Inc., a telecommunications company, Director (1999-2012) |
| • Ryder System, Inc., a supply chain and transportation management company, Director (1993-2012) |
| • The Proctor & Gamble Co., a consumer products company, Director (1994-2009) |
| • Constellation Energy Group, Inc., Director (2003-2009) |
| No. of Portfolios for which Board Member Serves: 38 |
| ——————— |
| Robin A. Melvin (51) |
| Board Member (2012) |
| Principal Occupation During Past 5Years: |
| • Board Member, Illinois Mentoring Partnership, non-profit organization dedicated to increasing |
| the quantity and quality of mentoring services in Illinois (2013-present) |
| • Director, Boisi Family Foundation, a private family foundation that supports youth-serving orga- |
| nizations that promote the self sufficiency of youth from disadvantaged circumstances (1995-2012) |
| No. of Portfolios for which Board Member Serves: 114 |
| ——————— |
| Dr. Martin Peretz (75) |
| Board Member (1990) |
| Principal Occupation During Past 5Years: |
| • Editor-in-Chief Emeritus of The New Republic Magazine (2010-2011) (previously, |
| Editor-in-Chief, 1974-2010) |
| • Director of TheStreet.com, a financial information service on the web (1996-2010) |
| No. of Portfolios for which Board Member Serves: 38 |
| ——————— |
| Once elected all Board Members serve for an indefinite term, but achieve Emeritus status upon reaching age 80.The |
| address of the Board Members and Officers is c/o The Dreyfus Corporation, 200 Park Avenue, NewYork, NewYork |
| 10166.Additional information about the Board Members is available in the fund’s Statement of Additional Information |
| which can be obtained from Dreyfus free of charge by calling this toll free number: 1-800-DREYFUS. |
| James F. Henry, Emeritus Board Member |
| Rosalind G. Jacobs, Emeritus Board Member |
| Dr. Paul A. Marks, Emeritus Board Member |
| Philip L.Toia, Emeritus Board Member |
36
OFFICERS OF THE FUND (Unaudited)

The Fund 37
OFFICERS OF THE FUND (Unaudited) (continued)

38
For More Information
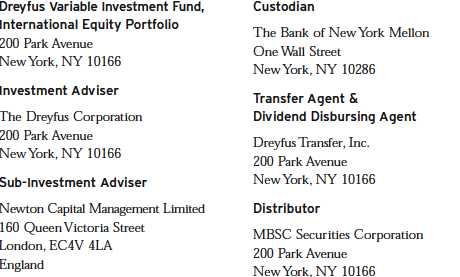
Telephone 1-800-554-4611 or 1-516-338-3300
Mail The Dreyfus Family of Funds, 144 Glenn Curtiss Boulevard, Uniondale, NY 11556-0144
Attn: Investments Division
The fund files its complete schedule of portfolio holdings with the Securities and Exchange Commission (“SEC”) for the first and third quarters of each fiscal year on Form N-Q. The fund’s Forms N-Q are available on the SEC’s website at http://www.sec.gov and may be reviewed and copied at the SEC’s Public Reference Room in Washington, DC. Information on the operation of the Public Reference Room may be obtained by calling 1-800-SEC-0330.
A description of the policies and procedures that the fund uses to determine how to vote proxies relating to portfolio securities, and information regarding how the fund voted these proxies for the most recent 12-month period ended June 30 is available at http://www.dreyfus.com and on the SEC’s website at http://www.sec.gov. The description of the policies and procedures is also available without charge, upon request, by calling 1-800-DREYFUS.

Dreyfus Variable
Investment Fund,
International Value
Portfolio

The views expressed in this report reflect those of the portfolio manager only through the end of the period covered and do not necessarily represent the views of Dreyfus or any other person in the Dreyfus organization. Any such views are subject to change at any time based upon market or other conditions and Dreyfus disclaims any responsibility to update such views.These views may not be relied on as investment advice and, because investment decisions for a Dreyfus fund are based on numerous factors, may not be relied on as an indication of trading intent on behalf of any Dreyfus fund.
| | Contents |
| | THE FUND |
| 2 | A Letter from the President |
| 3 | Discussion of Fund Performance |
| 6 | Fund Performance |
| 8 | Understanding Your Fund’s Expenses |
| 8 | Comparing Your Fund’s Expenses With Those of Other Funds |
| 9 | Statement of Investments |
| 14 | Statement of Assets and Liabilities |
| 15 | Statement of Operations |
| 16 | Statement of Changes in Net Assets |
| 18 | Financial Highlights |
| 20 | Notes to Financial Statements |
| 32 | Report of Independent Registered Public Accounting Firm |
| 33 | Important Tax Information |
| 34 | Board Members Information |
| 36 | Officers of the Fund |
| | FOR MORE INFORMATION |
| | Back Cover |
Dreyfus Variable Investment Fund,
International Value Portfolio
The Fund
A LETTER FROM THE PRESIDENT
Dear Shareholder:
We are pleased to present this annual report for Dreyfus Variable Investment Fund, International Value Portfolio, covering the 12-month period from January 1, 2014, through December 31, 2014. For information about how the fund performed during the reporting period, as well as general market perspectives, we provide a Discussion of Fund Performance on the pages that follow.
U.S. stocks produced moderate gains in 2014, but international stocks generally lost value over the year as Japan struggled with the dampening effects of higher consumption taxes, Europe contended with weak economic growth and mounting deflationary pressures, and China suffered a persistent economic slowdown. Global investors responded to these developments by shifting their focus to markets with better economic fundamentals, especially the United States.
Many economists appear to be cautiously optimistic about the prospects for international equity markets in 2015. Our own analysts agree and, in light of the ongoing benefits of low interest rates and depressed energy prices, see the potential for a somewhat faster pace of global growth in 2015 than in 2014. U.S. economic growth also seems poised to accelerate, largely due to the fading of drags from tight fiscal policies adopted in the wake of the Great Recession. Of course, a number of risks to U.S. and global economic growth remain, and changing conditions in 2015 are likely to benefit some countries and industry groups more than others. That’s why we urge you to talk regularly with your financial advisor about the potential impact of macroeconomic developments on your investments.
Thank you for your continued confidence and support.

J. Charles Cardona
President
The Dreyfus Corporation
January 15, 2015
2
DISCUSSION OF FUND PERFORMANCE
For the period of January 1, 2014, through December 31, 2014, as provided by D. Kirk Henry and Clifford Smith, Portfolio Managers
Fund and Market Performance Overview
For the 12-month period ended December 31, 2014, Dreyfus Variable Investment Fund, International Value Portfolio’s Initial shares produced a total return of –9.32%, and its Service shares produced a total return of –9.57%.1 This compares with a –4.90% return for the fund’s benchmark, the Morgan Stanley Capital International Europe, Australasia, Far East Index (“MSCI EAFE® Index”), for the same period.2
International equities lost value under pressure from persistent global economic weakness and intensifying geopolitical conflicts.The fund produced lower returns than its benchmark, largely due to its emphasis on economically sensitive, value-oriented companies at a time when markets favored more defensive, dividend-paying stocks.
The Fund’s Investment Approach
The fund seeks long-term capital growth. To pursue this goal, the fund normally invests in stocks of foreign companies that we consider to be value companies. The fund may invest in companies of any size, and may also invest in companies located in emerging markets. Our investment approach is value-oriented and research-driven. When selecting stocks, we conduct extensive quantitative and fundamental research that emphasizes individual stock selection rather than economic and industry trends. We focus on how a stock is valued relative to its intrinsic worth based on traditional value measures, the company’s underlying business health as measured by return on assets and return on equity, and the presence of a catalyst that may trigger an increase in the stock price.
Sluggish International Economies Undermined Equities
Although Europe showed signs of continuing to emerge from recession during the first half of 2014, the second half of the year posed new macroeconomic challenges for the region. Germany’s largest trading partner, Russia, faced increasing isolation as a result of the country’s involvement in the conflict in Ukraine, at the same time that its economy was hurt by plummeting oil prices. Slowing growth in Germany
The Fund 3
DISCUSSION OF FUND PERFORMANCE (continued)
was accompanied by weakening economic data in France, Italy, and many of Europe’s peripheral counties, which stoked deflation fears. Leading Asian economies faced their own difficulties, including slowing growth in China and a sluggish response to the Japanese government’s accommodative fiscal and monetary policies.
These developments, along with the weakening of almost all global currencies against the U.S. dollar, led investors to shift holdings away from international equities in general.Within global equity markets, regional economic concerns and exceptionally low interest rates prompted investors to turn away from cyclical and value-oriented stocks in favor of more defensive, dividend-yielding industry groups such as the utilities and consumer staples sectors.
Allocation and Security Selection Strategies Hurt Returns
The fund’s country allocation strategy detracted from its returns compared to the MSCI EAFE® Index. Most notably, underweighted exposure to the relatively stable U.K. market proved responsible for a portion of the fund’s relative underperformance. Underweighted exposure to Australian stocks also hurt the fund’s relative returns. However, favorable allocation decisions, such as the fund’s overweighted exposure to the Israeli market, partly offset these allocation-related losses.
Disappointing security selections also detracted from relative returns. Many of these shortfalls were concentrated in the financial industry, where a variety of companies were hurt by weakening regional economic fundamentals. Underperformers ranged from European investment and money center banks, such as the United Kingdom’s Standard Chartered and Germany’s Deutsche Bank, to Sumitomo Mitsui Financial Group and Credit Saison in Japan. Some consumer staples holdings, such as U.K. grocery chain Tesco and Australian food wholesaler Metcash, were hurt by competitive pressures that caused their stocks to lag market averages. Among industrial stocks, U.K.-based business services and outsourcing provider Serco Group suffered from problems with contract bidding, forcing the company to take unexpected write-downs.
On a more positive note, the fund’s relative performance benefited from key holdings in some smaller markets.Top performers included two Swedish companies, household appliance maker Electrolux and telecommunications equipment maker Ericsson; Israeli drug developer Teva Pharmaceutical Industries; and Norwegian aluminum producer and hydroelectric generating firm Norsk Hydro. Several information technology
4
holdings in Japan also delivered relatively strong returns, including solar panel maker SUMCO and semiconductor manufacturer Tokyo Electronics, as did two of the fund’s telecommunications investments: Orange and Telecom Italia.
Drivers for an Improving Market Environment
While the fourth quarter of 2014 proved exceptionally challenging, we have identified several drivers for potentially better investment outcomes in 2015. In particular, central bankers in Europe and Japan have signaled their intentions to move further on quantitative easing in 2015. At the same time, the strong U.S. dollar makes European and Japanese exports more attractive and sets the stage for improved international credit conditions. The fund is positioned to benefit from improving performance from the Europe, Australasia, and Far East asset class with investments largely focused on companies in developed countries in those regions.
January 15, 2015
Please note, the position in any security highlighted with italicized typeface was sold during the reporting period. Equity funds are subject generally to market, market sector, market liquidity, issuer, and investment style risks, among other factors, to varying degrees, all of which are more fully described in the fund’s prospectus.
The fund’s performance will be influenced by political, social, and economic factors affecting investments in foreign companies. Special risks associated with investments in foreign companies include exposure to currency fluctuations, less liquidity, less developed or less efficient trading markets, lack of comprehensive company information, political instability, and differing auditing and legal standards.These risks are enhanced in emerging markets countries.
The fund is only available as a funding vehicle under variable life insurance policies or variable annuity contracts issued by insurance companies. Individuals may not purchase shares of the fund directly. A variable annuity is an insurance contract issued by an insurance company that enables investors to accumulate assets on a tax-deferred basis for retirement or other long-term goals.
|
| 1 Total return includes reinvestment of dividends and any capital gains paid. Past performance is no guarantee of future |
| results. Share price and investment return fluctuate such that upon redemption, fund shares may be worth more or less |
| than their original cost.The fund’s performance does not reflect the deduction of additional charges and expenses |
| imposed in connection with investing in variable insurance contracts, which will reduce returns. Return figures for the |
| fund reflect the absorption of certain fund expenses by The Dreyfus Corporation pursuant to an undertaking in effect |
| through September 30, 2015, at which time it may be extended, terminated, or modified. Had these expenses not |
| been absorbed, the fund’s returns would have been lower. |
| 2 SOURCE: LIPPER INC. — Reflects reinvestment of net dividends and, where applicable, capital gain |
| distributions.The Morgan Stanley Capital International Europe,Australasia, Far East (MSCI EAFE®) Index is an |
| unmanaged index composed of a sample of companies representative of the market structure of European and Pacific |
| Basin countries. Investors cannot invest directly in any index. |
The Fund 5
FUND PERFORMANCE
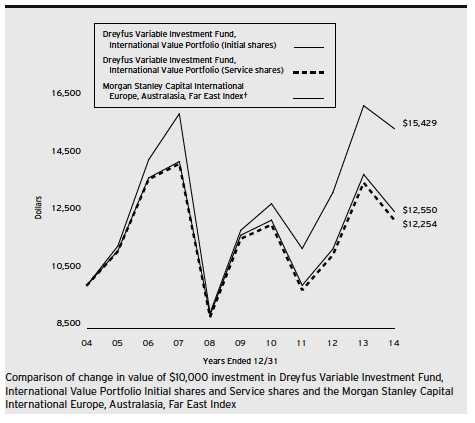
| | | | | | |
| Average Annual Total Returns as of 12/31/14 | | | | | | |
| | 1 | Year | 5 Years | | 10 Years | |
| Initial shares | –9.32 | % | 1.36 | % | 2.30 | % |
| Service shares | –9.57 | % | 1.10 | % | 2.05 | % |
| Morgan Stanley Capital International | | | | | | |
| Europe, Australasia, Far East Index | –4.90 | % | 5.33 | % | 4.43 | % |
† Source: Lipper Inc.
Past performance is not predictive of future performance.The fund’s performance shown in the graph and table does not reflect the deduction of taxes that a shareholder would pay on fund distributions or the redemption of fund shares.
The fund’s performance does not reflect the deduction of additional charges and expenses imposed in connection with investing in variable insurance contracts which will reduce returns.
The above graph compares a $10,000 investment made in Initial and Service shares of Dreyfus Variable Investment Fund, International Value Portfolio on 12/31/04 to a $10,000 investment made in the Morgan Stanley Capital International Europe, Australasia, Far East Index (the “Index”) on that date.
6
The fund’s Initial shares are not subject to a Rule 12b-1 fee.The fund’s Service shares are subject to a 0.25% annual Rule 12b-1 fee.The performance figures for each share class reflect certain expense reimbursements, without which the performance of each share class would have been lower. All dividends and capital gain distributions are reinvested.
The fund’s performance shown in the line graph above takes into account all applicable fund fees and expenses for Initial and Service shares (after any expense reimbursements).The Index is an unmanaged index composed of a sample of companies representative of the market structure of European and Pacific Basin countries and includes net dividends reinvested. Unlike a mutual fund, the Index is not subject to charges, fees and other expenses. Investors cannot invest directly in any index. Further information relating to fund performance, including expense reimbursements, if applicable, is contained in the Financial Highlights section of the prospectus and elsewhere in this report.
The Fund 7
UNDERSTANDING YOUR FUND’S EXPENSES (Unaudited)
As a mutual fund investor, you pay ongoing expenses, such as management fees and other expenses. Using the information below, you can estimate how these expenses affect your investment and compare them with the expenses of other funds.You also may pay one-time transaction expenses, including sales charges (loads), redemption fees and expenses associated with variable annuity or insurance contracts, which are not shown in this section and would have resulted in higher total expenses. For more information, see your fund’s prospectus or talk to your financial adviser.
Review your fund’s expenses
The table below shows the expenses you would have paid on a $1,000 investment in Dreyfus Variable Investment Fund, International Value Portfolio from July 1, 2014 to December 31, 2014. It also shows how much a $1,000 investment would be worth at the close of the period, assuming actual returns and expenses.
Expenses and Value of a $1,000 Investment
assuming actual returns for the six months ended December 31, 2014
| | | | |
| | | Initial Shares | | Service Shares |
| Expenses paid per $1,000† | | $4.82 | | $5.99 |
| Ending value (after expenses) | | $874.10 | | $872.60 |
COMPARING YOUR FUND’S EXPENSES
WITH THOSE OF OTHER FUNDS (Unaudited)
Using the SEC’s method to compare expenses
The Securities and Exchange Commission (SEC) has established guidelines to help investors assess fund expenses. Per these guidelines, the table below shows your fund’s expenses based on a $1,000 investment, assuming a hypothetical 5% annualized return. You can use this information to compare the ongoing expenses (but not transaction expenses or total cost) of investing in the fund with those of other funds. All mutual fund shareholder reports will provide this information to help you make this comparison. Please note that you cannot use this information to estimate your actual ending account balance and expenses paid during the period.
Expenses and Value of a $1,000 Investment
assuming a hypothetical 5% annualized return for the six months ended December 31, 2014
| | | | |
| | | Initial Shares | | Service Shares |
| Expenses paid per $1,000† | | $5.19 | | $6.46 |
| Ending value (after expenses) | | $1,020.06 | | $1,018.80 |
|
| † Expenses are equal to the fund’s annualized expense ratio of 1.02% for Initial shares and 1.27% for Service shares, |
| multiplied by the average account value over the period, multiplied by 184/365 (to reflect the one-half year period). |
8
STATEMENT OF INVESTMENTS
December 31, 2014
| | | |
| Common Stocks—96.8% | Shares | | Value ($) |
| Australia—3.3% | | | |
| Australia & New Zealand Banking Group | 14,671 | | 381,634 |
| Metcash | 187,313 | | 281,679 |
| Primary Health Care | 111,634 | | 426,738 |
| QBE Insurance Group | 82,633 | | 749,514 |
| | | | 1,839,565 |
| Austria—.7% | | | |
| Erste Group Bank | 17,880 | | 409,925 |
| Belgium—.6% | | | |
| bpost | 14,473 | | 362,263 |
| Brazil—.4% | | | |
| Petroleo Brasileiro, ADR | 33,510 | | 244,623 |
| China—2.0% | | | |
| Beijing Capital International Airport, Cl. H | 396,000 | | 316,370 |
| CNOOC | 265,000 | | 358,475 |
| FIH Mobile | 423,000 | a | 189,681 |
| Guangzhou Automobile Group, Cl. H | 308,000 | | 278,366 |
| | | | 1,142,892 |
| Denmark—.8% | | | |
| Carlsberg, Cl. B | 5,980 | | 464,381 |
| France—10.8% | | | |
| BNP Paribas | 7,740 | | 454,837 |
| Bouygues | 17,289 | | 623,881 |
| Carrefour | 16,224 | | 492,919 |
| Cie de St-Gobain | 9,156 | | 385,462 |
| Danone | 7,714 | | 507,478 |
| Electricite de France | 22,227 | | 610,330 |
| GDF Suez | 21,076 | | 492,238 |
| Sanofi | 14,637 | | 1,333,960 |
| Total | 22,832 | | 1,177,203 |
| | | | 6,078,308 |
| Germany—4.8% | | | |
| Aixtron | 35,420 | a | 401,515 |
| Deutsche Bank | 34,678 | | 1,048,171 |
| E.ON | 22,972 | | 394,476 |
| LANXESS | 10,636 | | 494,823 |
The Fund 9
STATEMENT OF INVESTMENTS (continued)
| | | |
| Common Stocks (continued) | Shares | | Value ($) |
| Germany (continued) | | | |
| METRO | 11,470 | a | 351,171 |
| | | | 2,690,156 |
| Hong Kong—4.1% | | | |
| BOC Hong Kong Holdings | 125,500 | | 417,841 |
| CITIC | 250,000 | | 424,296 |
| COSCO Pacific | 328,792 | | 465,689 |
| Esprit Holdings | 372,467 | | 445,176 |
| Pacific Basin Shipping | 451,000 | | 180,616 |
| Yue Yuen Industrial Holdings | 95,500 | | 343,831 |
| | | | 2,277,449 |
| India—1.8% | | | |
| Reliance Industries, GDR | 19,330 | b | 543,267 |
| State Bank of India, GDR | 9,110 | | 447,790 |
| | | | 991,057 |
| Ireland—.9% | | | |
| CRH | 22,227 | | 527,936 |
| Israel—1.4% | | | |
| Teva Pharmaceutical Industries, ADR | 13,240 | | 761,432 |
| Italy—4.4% | | | |
| Anima Holding | 60,547 | b | 304,975 |
| Assicurazioni Generali | 33,000 | | 674,372 |
| Finmeccanica | 47,736 | a | 443,232 |
| Saras | 234,010 | a | 236,112 |
| Telecom Italia | 397,395 | a | 421,446 |
| UniCredit | 64,496 | | 411,067 |
| | | | 2,491,204 |
| Japan—21.4% | | | |
| Aisin Seiki | 11,600 | | 416,935 |
| Credit Saison | 33,100 | | 615,850 |
| East Japan Railway | 9,190 | | 688,521 |
| Fujitsu | 93,000 | | 495,398 |
| Honda Motor | 32,400 | | 942,182 |
| INPEX | 34,700 | | 385,008 |
| LIXIL Group | 15,700 | | 332,024 |
| Matsumotokiyoshi Holdings | 17,730 | | 504,991 |
| Mitsubishi UFJ Financial Group | 195,900 | | 1,073,756 |
10
| | | |
| Common Stocks (continued) | Shares | | Value ($) |
| Japan (continued) | | | |
| Nippon Express | 76,920 | | 391,201 |
| Nippon Shokubai | 42,000 | | 551,234 |
| Nippon Telegraph & Telephone | 11,900 | | 612,350 |
| Nippon Telegraph & Telephone, ADR | 2,780 | | 71,196 |
| Nissan Motor | 37,800 | | 329,247 |
| Nomura Real Estate Holdings | 34,900 | | 599,719 |
| Ricoh | 51,900 | | 527,231 |
| Sawai Pharmaceutical | 8,100 | | 466,647 |
| Shimamura | 6,000 | | 516,948 |
| Sumco | 26,400 | | 379,627 |
| Sumitomo Electric Industries | 45,650 | | 569,567 |
| Sumitomo Mitsui Financial Group | 23,000 | | 831,048 |
| Sumitomo Mitsui Trust Holdings | 79,240 | | 302,410 |
| Yamada Denki | 121,700 | | 406,198 |
| | | | 12,009,288 |
| Netherlands—4.6% | | | |
| Aegon | 53,675 | | 402,725 |
| ING Groep | 33,110 | a | 428,696 |
| Koninklijke Philips | 39,691 | | 1,152,437 |
| Randstad Holding | 11,936 | | 574,022 |
| | | | 2,557,880 |
| Russia—.3% | | | |
| Gazprom, ADR | 38,120 | | 177,258 |
| Singapore—.8% | | | |
| United Overseas Bank | 24,000 | | 443,709 |
| South Korea—2.1% | | | |
| KB Financial Group | 6,750 | a | 220,451 |
| KB Financial Group, ADR | 10,469 | | 341,499 |
| Korea Electric Power | 7,416 | a | 285,607 |
| Samsung Electronics | 268 | | 322,150 |
| | | | 1,169,707 |
| Spain—.8% | | | |
| Banco Popular Espanol | 90,529 | | 448,236 |
| Sweden—3.6% | | | |
| Electrolux, Ser. B | 15,651 | | 459,220 |
| Ericsson, Cl. B | 56,910 | | 689,234 |
The Fund 11
STATEMENT OF INVESTMENTS (continued)
| | | |
| Common Stocks (continued) | Shares | | Value ($) |
| Sweden (continued) | | | |
| Getinge, Cl. B | 25,503 | | 579,271 |
| Svenska Cellulosa, Cl. B | 14,445 | | 311,955 |
| | | | 2,039,680 |
| Switzerland—6.9% | | | |
| ABB | 44,290 | a | 936,809 |
| Credit Suisse Group | 36,430 | a | 913,257 |
| Holcim | 7,540 | a | 535,416 |
| Novartis | 16,349 | | 1,503,576 |
| | | | 3,889,058 |
| United Kingdom—19.8% | | | |
| Anglo American | 22,341 | | 413,353 |
| ArcelorMittal | 35,850 | | 388,301 |
| Barclays | 175,536 | | 659,929 |
| BHP Billiton | 21,040 | | 450,042 |
| BP | 161,442 | | 1,025,117 |
| esure Group | 191,559 | | 607,357 |
| Friends Life Group | 73,177 | | 413,719 |
| GlaxoSmithKline | 50,408 | | 1,078,483 |
| Home Retail Group | 151,202 | | 486,174 |
| HSBC Holdings | 110,266 | | 1,042,069 |
| Royal Bank of Scotland Group | 80,820 | a | 490,620 |
| Royal Dutch Shell, Cl. A | 34,070 | | 1,129,303 |
| Serco Group | 116,204 | | 288,979 |
| Standard Chartered | 73,070 | | 1,095,833 |
| Tesco | 247,754 | | 720,946 |
| Unilever | 20,239 | | 822,125 |
| | | | 11,112,350 |
| United States—.5% | | | |
| iShares MSCI EAFE ETF | 4,892 | | 297,629 |
| Total Common Stocks | | | |
| (cost $67,535,310) | | | 54,425,986 |
| |
| Preferred Stocks—1.5% | | | |
| Germany | | | |
| Volkswagen | | | |
| (cost $879,877) | 3,658 | | 817,096 |
12
| | | |
| Other Investment—.9% | Shares | | Value ($) |
| Registered Investment Company; | | | |
| Dreyfus Institutional Preferred | | | |
| Plus Money Market Fund | | | |
| (cost $487,000) | 487,000 | c | 487,000 |
| Total Investments (cost $68,902,187) | 99.2 | % | 55,730,082 |
| Cash and Receivables (Net) | .8 | % | 454,921 |
| Net Assets | 100.0 | % | 56,185,003 |
ADR—American Depository Receipts
ETF—Exchange-Traded Fund
GDR—Global Depository Receipts
|
| a Non-income producing security. |
| b Securities exempt from registration pursuant to Rule 144A under the Securities Act of 1933.These securities may be |
| resold in transactions exempt from registration, normally to qualified institutional buyers.At December 31, 2014, |
| these securities amounted to $848,242 or 1.5% of net assets. |
| c Investment in affiliated money market mutual fund. |
| | | |
| Portfolio Summary (Unaudited)† | | |
| |
| | Value (%) | | Value (%) |
| Financial | 28.9 | Information Technology | 5.3 |
| Industrial | 13.5 | Utilities | 3.2 |
| Health Care | 10.9 | Telecommunication Services | 2.0 |
| Consumer Discretionary | 10.7 | Money Market Investment | .9 |
| Energy | 9.4 | Exchange-Traded Funds | .5 |
| Consumer Staples | 7.9 | | |
| Materials | 6.0 | | 99.2 |
| |
| † Based on net assets. | | | |
| See notes to financial statements. | | | |
The Fund 13
STATEMENT OF ASSETS AND LIABILITIES
December 31, 2014
| | | |
| | Cost | Value | |
| Assets ($): | | | |
| Investments in securities—See Statement of Investments: | | | |
| Unaffiliated issuers | 68,415,187 | 55,243,082 | |
| Affiliated issuers | 487,000 | 487,000 | |
| Cash | | 6,469 | |
| Cash denominated in foreign currencies | 341,656 | 341,814 | |
| Receivable for investment securities sold | | 655,495 | |
| Dividends receivable | | 128,232 | |
| Prepaid expenses | | 22,960 | |
| | | 56,885,052 | |
| Liabilities ($): | | | |
| Due to The Dreyfus Corporation and affiliates—Note 3(b) | | 88,155 | |
| Payable for investment securities purchased | | 492,485 | |
| Payable for shares of Beneficial Interest redeemed | | 49,336 | |
| Unrealized depreciation on forward foreign | | | |
| currency exchange contracts—Note 4 | | 25 | |
| Accrued expenses | | 70,048 | |
| | | 700,049 | |
| Net Assets ($) | | 56,185,003 | |
| Composition of Net Assets ($): | | | |
| Paid-in capital | | 95,923,193 | |
| Accumulated undistributed investment income—net | | 993,752 | |
| Accumulated net realized gain (loss) on investments | | (27,548,043 | ) |
| Accumulated net unrealized appreciation (depreciation) | | | |
| on investments and foreign currency transactions | | (13,183,899 | ) |
| Net Assets ($) | | 56,185,003 | |
| |
| |
| Net Asset Value Per Share | | | |
| | Initial Shares | Service Shares | |
| Net Assets ($) | 33,147,447 | 23,037,556 | |
| Shares Outstanding | 3,141,533 | 2,183,538 | |
| Net Asset Value Per Share ($) | 10.55 | 10.55 | |
| |
| See notes to financial statements. | | | |
14
STATEMENT OF OPERATIONS
Year Ended December 31, 2014
| | |
| Investment Income ($): | | |
| Income: | | |
| Cash dividends (net of $162,085 foreign taxes withheld at source): | | |
| Unaffiliated issuers | 1,755,047 | |
| Affiliated issuers | 875 | |
| Total Income | 1,755,922 | |
| Expenses: | | |
| Investment advisory fee—Note 3(a) | 658,699 | |
| Professional fees | 78,853 | |
| Distribution fees—Note 3(b) | 66,015 | |
| Custodian fees—Note 3(b) | 62,177 | |
| Prospectus and shareholders’ reports | 24,682 | |
| Trustees’ fees and expenses—Note 3(c) | 4,996 | |
| Interest expense—Note 2 | 1,168 | |
| Loan commitment fees—Note 2 | 1,004 | |
| Shareholder servicing costs—Note 3(b) | 782 | |
| Miscellaneous | 20,483 | |
| Total Expenses | 918,859 | |
| Less—reduction in expenses due to undertaking—Note 3(a) | (197,612 | ) |
| Less—reduction in fees due to earnings credits—Note 3(b) | (3 | ) |
| Net Expenses | 721,244 | |
| Investment Income—Net | 1,034,678 | |
| Realized and Unrealized Gain (Loss) on Investments—Note 4 ($): | | |
| Net realized gain (loss) on investments and foreign currency transactions | 4,095,865 | |
| Net realized gain (loss) on forward foreign currency exchange contracts | (3,015 | ) |
| Net Realized Gain (Loss) | 4,092,850 | |
| Net unrealized appreciation (depreciation) on | | |
| investments and foreign currency transactions | (10,996,499 | ) |
| Net unrealized appreciation (depreciation) on | | |
| forward foreign currency exchange contracts | (47 | ) |
| Net Unrealized Appreciation (Depreciation) | (10,996,546 | ) |
| Net Realized and Unrealized Gain (Loss) on Investments | (6,903,696 | ) |
| Net (Decrease) in Net Assets Resulting from Operations | (5,869,018 | ) |
| |
| See notes to financial statements. | | |
The Fund 15
STATEMENT OF CHANGES IN NET ASSETS
| | | | |
| | Year Ended December 31, | |
| | 2014 | | 2013 | |
| Operations ($): | | | | |
| Investment income—net | 1,034,678 | | 1,091,569 | |
| Net realized gain (loss) on investments | 4,092,850 | | 3,905,514 | |
| Net unrealized appreciation | | | | |
| (depreciation) on investments | (10,996,546 | ) | 8,820,931 | |
| Net Increase (Decrease) in Net Assets | | | | |
| Resulting from Operations | (5,869,018 | ) | 13,818,014 | |
| Dividends to Shareholders from ($): | | | | |
| Investment income—net: | | | | |
| Initial Shares | (668,683 | ) | (753,316 | ) |
| Service Shares | (357,164 | ) | (623,147 | ) |
| Total Dividends | (1,025,847 | ) | (1,376,463 | ) |
| Beneficial Interest Transactions ($): | | | | |
| Net proceeds from shares sold: | | | | |
| Initial Shares | 4,647,859 | | 5,816,902 | |
| Service Shares | 6,597,103 | | 9,388,637 | |
| Dividends reinvested: | | | | |
| Initial Shares | 668,683 | | 753,316 | |
| Service Shares | 357,164 | | 623,147 | |
| Cost of shares redeemed: | | | | |
| Initial Shares | (10,629,784 | ) | (6,891,163 | ) |
| Service Shares | (13,085,279 | ) | (16,836,211 | ) |
| Increase (Decrease) in Net Assets from | | | | |
| Beneficial Interest Transactions | (11,444,254 | ) | (7,145,372 | ) |
| Total Increase (Decrease) in Net Assets | (18,339,119 | ) | 5,296,179 | |
| Net Assets ($): | | | | |
| Beginning of Period | 74,524,122 | | 69,227,943 | |
| End of Period | 56,185,003 | | 74,524,122 | |
| Undistributed investment income—net | 993,752 | | 1,001,942 | |
16
| | | | |
| | Year Ended December 31, | |
| | 2014 | | 2013 | |
| Capital Share Transactions: | | | | |
| Initial Shares | | | | |
| Shares sold | 401,204 | | 540,157 | |
| Shares issued for dividends reinvested | 57,104 | | 75,407 | |
| Shares redeemed | (905,183 | ) | (647,747 | ) |
| Net Increase (Decrease) in Shares Outstanding | (446,875 | ) | (32,183 | ) |
| Service Shares | | | | |
| Shares sold | 563,237 | | 850,157 | |
| Shares issued for dividends reinvested | 30,449 | | 62,315 | |
| Shares redeemed | (1,126,902 | ) | (1,623,635 | ) |
| Net Increase (Decrease) in Shares Outstanding | (533,216 | ) | (711,163 | ) |
| See notes to financial statements. | | | | |
The Fund 17
FINANCIAL HIGHLIGHTS
The following tables describe the performance for each share class for the fiscal periods indicated. All information (except portfolio turnover rate) reflects financial results for a single fund share.Total return shows how much your investment in the fund would have increased (or decreased) during each period, assuming you had reinvested all dividends and distributions. The fund’s total returns do not reflect expenses associated with variable annuity or insurance contracts.These figures have been derived from the fund’s financial statements.
| | | | | | | | | | |
| | | | Year Ended December 31, | | | |
| Initial Shares | 2014 | | 2013 | | 2012 | | 2011 | | 2010 | |
| Per Share Data ($): | | | | | | | | | | |
| Net asset value, beginning of period | 11.82 | | 9.82 | | 8.96 | | 11.21 | | 10.92 | |
| Investment Operations: | | | | | | | | | | |
| Investment income—neta | .19 | | .18 | | .20 | | .24 | | .18 | |
| Net realized and unrealized | | | | | | | | | | |
| gain (loss) on investments | (1.27 | ) | 2.04 | | .93 | | (2.26 | ) | .30 | |
| Total from Investment Operations | (1.08 | ) | 2.22 | | 1.13 | | (2.02 | ) | .48 | |
| Distributions: | | | | | | | | | | |
| Dividends from investment income—net | (.19 | ) | (.22 | ) | (.27 | ) | (.23 | ) | (.19 | ) |
| Net asset value, end of period | 10.55 | | 11.82 | | 9.82 | | 8.96 | | 11.21 | |
| Total Return (%) | (9.32 | ) | 22.99 | | 12.67 | | (18.48 | ) | 4.46 | |
| Ratios/Supplemental Data (%): | | | | | | | | | | |
| Ratio of total expenses | | | | | | | | | | |
| to average net assets | 1.29 | | 1.25 | | 1.28 | | 1.25 | | 1.26 | |
| Ratio of net expenses | | | | | | | | | | |
| to average net assets | .99 | | .95 | | 1.19 | | 1.25 | | 1.26 | |
| Ratio of net investment income | | | | | | | | | | |
| to average net assets | 1.68 | | 1.71 | | 2.19 | | 2.24 | | 1.72 | |
| Portfolio Turnover Rate | 45.43 | | 57.30 | | 45.97 | | 46.71 | | 61.13 | |
| Net Assets, end of period ($ x 1,000) | 33,147 | | 42,421 | | 35,568 | | 40,549 | | 59,242 | |
| |
| a Based on average shares outstanding. | | | | | | | | | | |
| See notes to financial statements. | | | | | | | | | | |
18
| | | | | | | | | | |
| | | | Year Ended December 31, | | | |
| Service Shares | 2014 | | 2013 | | 2012 | | 2011 | | 2010 | |
| Per Share Data ($): | | | | | | | | | | |
| Net asset value, beginning of period | 11.82 | | 9.82 | | 8.95 | | 11.21 | | 10.92 | |
| Investment Operations: | | | | | | | | | | |
| Investment income—neta | .16 | | .16 | | .16 | | .22 | | .15 | |
| Net realized and unrealized | | | | | | | | | | |
| gain (loss) on investments | (1.28 | ) | 2.03 | | .95 | | (2.28 | ) | .31 | |
| Total from Investment Operations | (1.12 | ) | 2.19 | | 1.11 | | (2.06 | ) | .46 | |
| Distributions: | | | | | | | | | | |
| Dividends from investment income—net | (.15 | ) | (.19 | ) | (.24 | ) | (.20 | ) | (.17 | ) |
| Net asset value, end of period | 10.55 | | 11.82 | | 9.82 | | 8.95 | | 11.21 | |
| Total Return (%) | (9.57 | ) | 22.69 | | 12.42 | | (18.76 | ) | 4.22 | |
| Ratios/Supplemental Data (%): | | | | | | | | | | |
| Ratio of total expenses | | | | | | | | | | |
| to average net assets | 1.54 | | 1.50 | | 1.53 | | 1.50 | | 1.51 | |
| Ratio of net expenses | | | | | | | | | | |
| to average net assets | 1.24 | | 1.20 | | 1.43 | | 1.50 | | 1.51 | |
| Ratio of net investment income | | | | | | | | | | |
| to average net assets | 1.40 | | 1.47 | | 1.77 | | 2.03 | | 1.44 | |
| Portfolio Turnover Rate | 45.43 | | 57.30 | | 45.97 | | 46.71 | | 61.13 | |
| Net Assets, end of period ($ x 1,000) | 23,038 | | 32,104 | | 33,660 | | 32,809 | | 48,962 | |
| |
| a Based on average shares outstanding. | | | | | | | | | | |
| See notes to financial statements. | | | | | | | | | | |
The Fund 19
NOTES TO FINANCIAL STATEMENTS
NOTE 1—Significant Accounting Policies:
DreyfusVariable Investment Fund (the “Company”) is registered under the Investment Company Act of 1940, as amended (the “Act”), as an open-end management investment company, operating as a series company currently offering seven series, including the International Value Portfolio (the “fund”). The fund is only offered to separate accounts established by insurance companies to fund variable annuity contracts and variable life insurance policies.The fund is a diversified series.The fund’s investment objective is to seek long-term capital growth. The Dreyfus Corporation (the “Manager” or “Dreyfus”), a wholly-owned subsidiary of The Bank of New York Mellon Corporation (“BNY Mellon”), serves as the fund’s investment adviser.
MBSC Securities Corporation (the “Distributor”), a wholly-owned subsidiary of the Manager, is the distributor of the fund’s shares, which are sold without a sales charge. The fund is authorized to issue an unlimited number of $.001 par value shares of Beneficial Interest in each of the following classes of shares: Initial and Service. Each class of shares has identical rights and privileges, except with respect to the Distribution Plan and the expenses borne by each class, the allocation of certain transfer agency costs, and certain voting rights. Income, expenses (other than expenses attributable to a specific class), and realized and unrealized gains or losses on investments are allocated to each class of shares based on its relative net assets.
The Company accounts separately for the assets, liabilities and operations of each series. Expenses directly attributable to each series are charged to that series’ operations; expenses which are applicable to all series are allocated among them on a pro rata basis.
The Financial Accounting Standards Board (“FASB”) Accounting Standards Codification (“ASC”) is the exclusive reference of authoritative U.S. generally accepted accounting principles (“GAAP”) recognized by the FASB to be applied by nongovernmental entities. Rules and interpretive releases of the Securities and Exchange Commission (“SEC”) under authority of federal laws are also sources of authoritative GAAP for
20
SEC registrants. The fund’s financial statements are prepared in accordance with GAAP, which may require the use of management estimates and assumptions. Actual results could differ from those estimates.
The Company enters into contracts that contain a variety of indemnifications. The fund’s maximum exposure under these arrangements is unknown.The fund does not anticipate recognizing any loss related to these arrangements.
(a) Portfolio valuation: The fair value of a financial instrument is the amount that would be received to sell an asset or paid to transfer a liability in an orderly transaction between market participants at the measurement date (i.e., the exit price). GAAP establishes a fair value hierarchy that prioritizes the inputs of valuation techniques used to measure fair value. This hierarchy gives the highest priority to unadjusted quoted prices in active markets for identical assets or liabilities (Level 1 measurements) and the lowest priority to unobservable inputs (Level 3 measurements).
Additionally, GAAP provides guidance on determining whether the volume and activity in a market has decreased significantly and whether such a decrease in activity results in transactions that are not orderly. GAAP requires enhanced disclosures around valuation inputs and techniques used during annual and interim periods.
Various inputs are used in determining the value of the fund’s investments relating to fair value measurements.These inputs are summarized in the three broad levels listed below:
Level 1—unadjusted quoted prices in active markets for identical investments.
Level 2—other significant observable inputs (including quoted prices for similar investments, interest rates, prepayment speeds, credit risk, etc.).
Level 3—significant unobservable inputs (including the fund’s own assumptions in determining the fair value of investments).
The Fund 21
NOTES TO FINANCIAL STATEMENTS (continued)
The inputs or methodology used for valuing securities are not necessarily an indication of the risk associated with investing in those securities.
Changes in valuation techniques may result in transfers in or out of an assigned level within the disclosure hierarchy. Valuation techniques used to value the fund’s investments are as follows:
Investments in securities are valued at the last sales price on the securities exchange or national securities market on which such securities are primarily traded. Securities listed on the National Market System for which market quotations are available are valued at the official closing price or, if there is no official closing price that day, at the last sales price. For open short positions, asked prices are used for valuation purposes. Bid price is used when no asked price is available. Registered investment companies that are not traded on an exchange are valued at their net asset value.All of the preceding securities are generally categorized within Level 1 of the fair value hierarchy.
Securities not listed on an exchange or the national securities market, or securities for which there were no transactions, are valued at the average of the most recent bid and asked prices. These securities are generally categorized within Level 2 of the fair value hierarchy.
Fair valuing of securities may be determined with the assistance of a pricing service using calculations based on indices of domestic securities and other appropriate indicators, such as prices of relevant ADRs and financial futures. Utilizing these techniques may result in transfers between Level 1 and Level 2 of the fair value hierarchy.
When market quotations or official closing prices are not readily available, or are determined not to reflect accurately fair value, such as when the value of a security has been significantly affected by events after the close of the exchange or market on which the security is principally traded (for example, a foreign exchange or market), but before the fund calculates its net asset value, the fund may value these investments at fair value as determined in accordance with the procedures approved by the Company’s Board of Trustees (the “Board”). Certain factors may be considered when fair valuing investments such as: fundamental analytical data, the nature and duration of restrictions on disposition, an evaluation
22
of the forces that influence the market in which the securities are purchased and sold, and public trading in similar securities of the issuer or comparable issuers.These securities are either categorized within Level 2 or 3 of the fair value hierarchy depending on the relevant inputs used.
For restricted securities where observable inputs are limited, assumptions about market activity and risk are used and are generally categorized within Level 3 of the fair value hierarchy.
Investments denominated in foreign currencies are translated to U.S. dollars at the prevailing rates of exchange.
Forward foreign currency exchange contracts (“forward contracts”) are valued at the forward rate and are generally categorized within Level 2 of the fair value hierarchy.
The following is a summary of the inputs used as of December 31, 2014 in valuing the fund’s investments:
| | | | | | |
| | | Level 2—Other | | Level 3— | | |
| | Level 1— | Significant | | Significant | | |
| | Unadjusted | Observable | | Unobservable | | |
| | Quoted Prices | Inputs | | Inputs | Total | |
| Assets ($) | | | | | | |
| Investments in Securities: | | | | | |
| Equity Securities— | | | | | | |
| Foreign | | | | | | |
| Common Stocks† | 1,596,008 | 52,532,349 | †† | — | 54,128,357 | |
| Equity Securities— | | | | | | |
| Foreign | | | | | | |
| Preferred Stocks† | — | 817,096 | †† | — | 817,096 | |
| Exchange—Traded | | | | | | |
| Funds | 297,629 | — | | — | 297,629 | |
| Mutual Funds | 487,000 | — | | — | 487,000 | |
| Liabilities ($) | | | | | | |
| Other Financial | | | | | | |
| Instruments: | | | | | | |
| Forward Foreign | | | | | | |
| Currency Exchange | | | | | | |
| Contracts††† | — | (25 | ) | — | (25 | ) |
| |
| † | See Statement of Investments for additional detailed categorizations. |
| †† | Securities classified within Level 2 at period end as the values were determined pursuant to the |
| | fund’s fair valuation procedures. See note above for additional information. |
| ††† | Amount shown represents unrealized (depreciation) at period end. |
The Fund 23
NOTES TO FINANCIAL STATEMENTS (continued)
At December 31, 2013, no exchange traded foreign equity securities were classified within Level 2 of the fair value hierarchy.
(b) Foreign currency transactions: The fund does not isolate that portion of the results of operations resulting from changes in foreign exchange rates on investments from the fluctuations arising from changes in the market prices of securities held. Such fluctuations are included with the net realized and unrealized gain or loss on investments.
Net realized foreign exchange gains or losses arise from sales of foreign currencies, currency gains or losses realized on securities transactions between trade and settlement date, and the difference between the amounts of dividends, interest and foreign withholding taxes recorded on the fund’s books and the U.S. dollar equivalent of the amounts actually received or paid. Net unrealized foreign exchange gains and losses arise from changes in the value of assets and liabilities other than investments resulting from changes in exchange rates. Foreign currency gains and losses on foreign currency transactions are also included with net realized and unrealized gain or loss on investments.
(c) Securities transactions and investment income: Securities transactions are recorded on a trade date basis. Realized gains and losses from securities transactions are recorded on the identified cost basis. Dividend income is recognized on the ex-dividend date and interest income, including, where applicable, accretion of discount and amortization of premium on investments, is recognized on the accrual basis.
(d) Affiliated issuers: Investments in other investment companies advised by Dreyfus are defined as “affiliated” under the Act. Investments in affiliated investment companies during the period ended December 31, 2014 were as follows:
| | | | | |
| Affiliated | | | | | |
| Investment | Value | | | Value | Net |
| Company | 12/31/2013 ($) | Purchases ($) | Sales ($) | 12/31/2014 ($) | Assets (%) |
| Dreyfus | | | | | |
| Institutional | | | | | |
| Preferred | | | | | |
| Plus Money | | | | | |
| Market Fund | 1,175,000 | 19,470,000 | 20,158,000 | 487,000 | .9 |
24
(e) Risk: Investing in foreign markets may involve special risks and considerations not typically associated with investing in the U.S.These risks include revaluation of currencies, high rates of inflation, repatriation restrictions on income and capital, and adverse political and economic developments. Moreover, securities issued in these markets may be less liquid, subject to government ownership controls and delayed settlements, and their prices may be more volatile than those of comparable securities in the U.S.
(f) Dividends to shareholders: Dividends are recorded on the ex-dividend date. Dividends from investment income-net and dividends from net realized capital gains, if any, are normally declared and paid annually, but the fund may make distributions on a more frequent basis to comply with the distribution requirements of the Internal Revenue Code of 1986, as amended (the “Code”). To the extent that net realized capital gains can be offset by capital loss carryovers, it is the policy of the fund not to distribute such gains. Income and capital gain distributions are determined in accordance with income tax regulations, which may differ from GAAP.
(g) Federal income taxes: It is the policy of the fund to continue to qualify as a regulated investment company, if such qualification is in the best interests of its shareholders, by complying with the applicable provisions of the Code, and to make distributions of taxable income sufficient to relieve it from substantially all federal income and excise taxes.
As of and during the period ended December 31, 2014, the fund did not have any liabilities for any uncertain tax positions. The fund recognizes interest and penalties, if any, related to uncertain tax positions as income tax expense in the Statement of Operations. During the period ended December 31, 2014, the fund did not incur any interest or penalties.
Each tax year in the four-year period ended December 31, 2014 remains subject to examination by the Internal Revenue Service and state taxing authorities.
The Fund 25
NOTES TO FINANCIAL STATEMENTS (continued)
At December 31, 2014, the components of accumulated earnings on a tax basis were as follows: undistributed ordinary income $993,752, accumulated capital losses $26,945,289 and unrealized depreciation $13,786,653.
Under the Regulated Investment Company Modernization Act of 2010 (the “2010 Act”), the fund is permitted to carry forward capital losses incurred in taxable years beginning after December 22, 2010 (“post-enactment losses”) for an unlimited period. Furthermore, post-enactment capital loss carryovers retain their character as either short-term or long-term capital losses rather than short-term as they were under previous statute. The 2010 Act requires post-enactment losses to be utilized before the utilization of losses incurred in taxable years prior to the effective date of the 2010 Act (“pre-enactment losses”). As a result of this ordering rule, pre-enactment losses may be more likely to expire unused.
The accumulated capital loss carryover is available for federal income tax purposes to be applied against future net realized capital gains, if any, realized subsequent to December 31, 2014. If not applied, $2,290,912 of the carryover expires in fiscal year 2016 and $21,640,693 expires in fiscal year 2017.The fund has $3,013,684 of post-enactment long-term capital losses which can be carried forward for an unlimited period.
The tax character of distributions paid to shareholders during the fiscal periods ended December 31, 2014 and December 31, 2013 were as follows: ordinary income $1,025,847 and $1,376,463, respectively.
During the period ended December 31, 2014, as a result of permanent book to tax differences, primarily due to the tax treatment for foreign currency gains and losses and passive foreign investment companies, the fund decreased accumulated undistributed investment income-net by $17,021 and increased accumulated net realized gain (loss) on investments by the same amount. Net assets and net asset value per share were not affected by this classification.
26
NOTE 2—Bank Lines of Credit:
The fund participates with other Dreyfus-managed funds in a $430 million unsecured credit facility led by Citibank, N.A. and a $300 million unsecured credit facility provided by The Bank of New York Mellon, a subsidiary of BNY Mellon and an affiliate of Dreyfus (each, a “Facility”), each to be utilized primarily for temporary or emergency purposes, including the financing of redemptions. Prior to October 8, 2014, the unsecured credit facility with Citibank, N.A. was $265 million. In connection therewith, the fund has agreed to pay its pro rata portion of commitment fees for each Facility. Interest is charged to the fund based on rates determined pursuant to the terms of the respective Facility at the time of borrowing.
The average amount of borrowings outstanding under the Facilities during the period ended December 31, 2014 was approximately $106,800 with a related weighted average annualized interest rate of 1.09%.
NOTE 3—Investment Advisory Fee and Other Transactions with Affiliates:
(a) Pursuant to an investment advisory agreement with the Manager, the investment advisory fee is computed at an annual rate of 1% of the value of the fund’s average daily net assets and is payable monthly.The Manager has agreed, from January 1, 2014 through September 30, 2015 to waive receipt of a portion of the fund’s investment advisory fee, in the amount of .30% of the value of the fund’s average daily net assets. The reduction in expenses, pursuant to the undertaking, amounted to $197,612 during the period ended December 31, 2014.
(b) Under the Distribution Plan adopted pursuant to Rule 12b-1 under the Act, Service shares pay the Distributor for distributing its shares, for servicing and/or maintaining Service shares’ shareholder accounts and for advertising and marketing for Service shares. The
The Fund 27
NOTES TO FINANCIAL STATEMENTS (continued)
Distribution Plan provides for payments to be made at an annual rate of .25% of the value of the Service shares’ average daily net assets.The Distributor may make payments to Participating Insurance Companies and to brokers and dealers acting as principal underwriter for their variable insurance products. The fees payable under the Distribution Plan are payable without regard to actual expenses incurred. During the period ended December 31, 2014, Service shares were charged $66,015 pursuant to the Distribution Plan.
The fund has arrangements with the transfer agent and the custodian whereby the fund may receive earnings credits when positive cash balances are maintained, which are used to offset transfer agency and custody fees. For financial reporting purposes, the fund includes net earnings credits as an expense offset in the Statement of Operations.
The fund compensates Dreyfus Transfer, Inc., a wholly-owned subsidiary of the Manager, under a transfer agency agreement for providing transfer agency and cash management services for the fund. The majority of transfer agency fees are comprised of amounts paid on a per account basis, while cash management fees are related to fund subscriptions and redemptions. During the period ended December 31, 2014, the fund was charged $705 for transfer agency services and $47 for cash management services.These fees are included in Shareholder servicing costs in the Statement of Operations. Cash management fees were partially offset by earnings credits of $3.
The fund compensates The Bank of NewYork Mellon under a custody agreement for providing custodial services for the fund.These fees are determined based on net assets, geographic region and transaction activity. During the period ended December 31, 2014, the fund was charged $62,177 pursuant to the custody agreement.
During the period ended December 31, 2014, the fund was charged $7,771 for services performed by the Chief Compliance Officer and his staff.
28
The components of “Due to The Dreyfus Corporation and affiliates” in the Statement of Assets and Liabilities consist of: investment advisory fees $48,600, Distribution Plan fees $4,950, custodian fees $46,850, Chief Compliance Officer fees $1,851 and transfer agency fees $390, which are offset against an expense reimbursement currently in effect in the amount $14,486.
(c) Each Board member also serves as a Board member of other funds within the Dreyfus complex. Annual retainer fees and attendance fees are allocated to each fund based on net assets.
NOTE 4—Securities Transactions:
The aggregate amount of purchases and sales of investment securities, excluding short-term securities and forward contracts, during the period ended December 31, 2014, amounted to $29,393,560 and $40,004,405, respectively.
Derivatives: A derivative is a financial instrument whose performance is derived from the performance of another asset. Each type of derivative instrument that was held by the fund during the period ended December 31, 2014 is discussed below.
Master Netting Arrangements: The fund enters into International Swaps and Derivatives Association, Inc. Master Agreements or similar agreements (collectively, “Master Agreements”) with its over-the counter (“OTC”) derivative contract counterparties in order to, among other things, reduce its credit risk to counterparties. Master Agreements include provisions for general obligations, representations, collateral and events of default or termination. Under a Master Agreement, the fund may offset with the counterparty certain derivative financial instrument’s payables and/or receivables with collateral held and/or posted and create one single net payment in the event of default or termination.
The Fund 29
NOTES TO FINANCIAL STATEMENTS (continued)
Forward Foreign Currency Exchange Contracts: The fund enters into forward contracts in order to hedge its exposure to changes in foreign currency exchange rates on its foreign portfolio holdings, to settle foreign currency transactions or as a part of its investment strat-egy.When executing forward contracts, the fund is obligated to buy or sell a foreign currency at a specified rate on a certain date in the future. With respect to sales of forward contracts, the fund incurs a loss if the value of the contract increases between the date the forward contract is opened and the date the forward contract is closed.The fund realizes a gain if the value of the contract decreases between those dates.With respect to purchases of forward contracts, the fund incurs a loss if the value of the contract decreases between the date the forward contract is opened and the date the forward contract is closed.The fund realizes a gain if the value of the contract increases between those dates. Any realized or unrealized gains or losses which occurred during the period are reflected in the Statement of Operations. The fund is exposed to foreign currency risk as a result of changes in value of underlying financial instruments. The fund is also exposed to credit risk associated with counterparty nonperformance on these forward contracts, which is generally limited to the unrealized gain on each open contract. This risk is mitigated by Master Agreements between the fund and the counterparty. The following summarizes open forward contracts at December 31, 2014:
| | | | | | |
| | | Foreign | | | | |
| Forward Foreign Currency | | Currency | | | Unrealized | |
| Exchange Contracts | | Amounts | Cost ($) | Value ($) | (Depreciation) ($) | |
| Purchases: | | | | | | |
| Swedish Krona, | | | | | | |
| Expiring | | | | | | |
| 1/2/2015a | | 800,435 | 102,703 | 102,678 | (25 | ) |
| |
| Counterparty: | | | | | | |
| a Northern Trust | | | | | | |
The provisions of ASC Topic 210 “Disclosures about Offsetting Assets and Liabilities” require disclosure on the offsetting of financial assets and liabilities.These disclosures are required for certain investments, including derivative financial instruments subject to Master Agreements which
30
are eligible for offsetting in the Statement of Assets and Liabilities and require the fund to disclose both gross and net information with respect to such investments. For financial reporting purposes, the fund does not offset derivative assets and derivative liabilities that are subject to Master Agreements in the Statement of Assets and Liabilities.
At December 31, 2014 derivative liabilities (by type) on a gross basis are as follows:
| | |
| Derivative Financial Instruments: | Liabilities ($) | |
| Forward contracts | (25 | ) |
| Total gross amount of derivative liabilities | | |
| in the Statement of Assets and Liabilities | (25 | ) |
| Derivatives not subject to Master Agreements | — | |
| Total gross amount of liabilities | | |
| subject to Master Agreements | (25 | ) |
The following table presents derivative liabilities net of amounts available for offset under Master Agreements and net of related collateral pledged, if any, as of December 31, 2014:
| | | | | | |
| | | | Financial | | | |
| | | | Instruments | | | |
| | | | and | | | |
| | | | Derivatives | | | |
| | Gross Amount of | | Available | Collateral | Net Amount of | |
| Counterparty | Liabilities ($)1 | | for Offset ($) | Pledged ($) | Liabilities ($) | |
| Northern Trust | (25 | ) | — | — | (25 | ) |
| |
| 1 | Absent a default event or early termination, OTC derivative liabilities are presented at gross |
| | amounts and are not offset in the Statement of Assets and Liabilities. |
The following summarizes the average market value of derivatives outstanding during the period ended December 31, 2014:
| |
| | Average Market Value ($) |
| Forward contracts | 244,267 |
At December 31, 2014, the cost of investments for federal income tax purposes was $69,504,941; accordingly, accumulated net unrealized depreciation on investments was $13,774,859, consisting of $1,607,843 gross unrealized appreciation and $15,382,702 gross unrealized depreciation.
The Fund 31
REPORT OF INDEPENDENT REGISTERED
PUBLIC ACCOUNTING FIRM
Shareholders and Board of Trustees
Dreyfus Variable Investment Fund, International Value Portfolio
We have audited the accompanying statement of assets and liabilities, including the statement of investments, of Dreyfus Variable Investment Fund, InternationalValue Portfolio (one of the series comprising Dreyfus Variable Investment Fund) as of December 31, 2014, and the related statement of operations for the year then ended, the statement of changes in net assets for each of the two years in the period then ended, and the financial highlights for each of the five years in the period then ended. These financial statements and financial highlights are the responsibility of the Fund’s management. Our responsibility is to express an opinion on these financial statements and financial highlights based on our audits.
We conducted our audits in accordance with the standards of the Public Company Accounting Oversight Board (United States). Those standards require that we plan and perform the audit to obtain reasonable assurance about whether the financial statements and financial highlights are free of material misstatement. We were not engaged to perform an audit of the Fund’s internal control over financial reporting. Our audits included consideration of internal control over financial reporting as a basis for designing audit procedures that are appropriate in the circumstances, but not for the purpose of expressing an opinion on the effectiveness of the Fund’s internal control over financial reporting. Accordingly, we express no such opinion. An audit also includes examining, on a test basis, evidence supporting the amounts and disclosures in the financial statements and financial highlights, assessing the accounting principles used and significant estimates made by management, and evaluating the overall financial statement presentation. Our procedures included confirmation of securities owned as of December 31, 2014 by correspondence with the custodian and others.We believe that our audits provide a reasonable basis for our opinion.
In our opinion, the financial statements and financial highlights referred to above present fairly, in all material respects, the financial position of Dreyfus Variable Investment Fund, International Value Portfolio at December 31, 2014, the results of its operations for the year then ended, the changes in its net assets for each of the two years in the period then ended, and the financial highlights for each of the five years in the period then ended, in conformity with U. S. generally accepted accounting principles.

New York, New York
February 11, 2015
32
IMPORTANT TAX INFORMATION (Unaudited)
In accordance with federal tax law, the fund elects to provide each shareholder with their portion of the fund’s foreign taxes paid and the income sourced from foreign countries. Accordingly, the fund hereby reports the following information regarding its fiscal year ended December 31, 2014:
—the total amount of taxes paid to foreign countries was $152,571.
—the total amount of income sourced from foreign countries was $1,905,456.
Where required by federal tax law rules, shareholders will receive notification of their proportionate share of foreign taxes paid and foreign sourced income for the 2014 calendar year with Form 1099-DIV which will be mailed in early 2015.
The Fund 33
BOARD MEMBERS INFORMATION (Unaudited)
INDEPENDENT BOARD MEMBERS
|
| Joseph S. DiMartino (71) |
| Chairman of the Board (1995) |
| Principal Occupation During Past 5Years: |
| • Corporate Director and Trustee (1995-present) |
| Other Public Company Board Memberships During Past 5Years: |
| • CBIZ (formerly, Century Business Services, Inc.), a provider of outsourcing functions for small |
| and medium size companies, Director (1997-present) |
| • The Newark Group, a provider of a national market of paper recovery facilities, paperboard |
| mills and paperboard converting plants, Director (2000-2010) |
| • Sunair Services Corporation, a provider of certain outdoor-related services to homes and busi- |
| nesses, Director (2005-2009) |
| No. of Portfolios for which Board Member Serves: 146 |
| ——————— |
| Peggy C. Davis (71) |
| Board Member (2006) |
| Principal Occupation During Past 5Years: |
| • Shad Professor of Law, New York University School of Law (1983-present) |
| No. of Portfolios for which Board Member Serves: 52 |
| ——————— |
| David P. Feldman (75) |
| Board Member (1994) |
| Principal Occupation During Past 5Years: |
| • Corporate Director and Trustee (1985-present) |
| Other Public Company Board Membership During Past 5Years: |
| • BBH Mutual Funds Group (5 registered mutual funds), Director (1992-present) |
| No. of Portfolios for which Board Member Serves: 38 |
| ——————— |
| Ehud Houminer (74) |
| Board Member (2006) |
| Principal Occupation During Past 5Years: |
| • Executive-in-Residence at the Columbia Business School, Columbia University (1992-present) |
| Other Public Company Board Membership During Past 5Years: |
| • Avnet, Inc., an electronics distributor, Director (1993-2012) |
| No. of Portfolios for which Board Member Serves: 62 |
34
Lynn Martin (75)
Board Member (2012)
|
| Principal Occupation During Past 5Years: |
| • President, of The Martin Hall Group LLC, a human resources consulting firm (2005-2012) |
| Other Public Company Board Memberships During Past 5Years: |
| • AT&T, Inc., a telecommunications company, Director (1999-2012) |
| • Ryder System, Inc., a supply chain and transportation management company, Director (1993-2012) |
| • The Proctor & Gamble Co., a consumer products company, Director (1994-2009) |
| • Constellation Energy Group, Inc., Director (2003-2009) |
| No. of Portfolios for which Board Member Serves: 38 |
| |
| ——————— |
| Robin A. Melvin (51) |
| Board Member (2012) |
| Principal Occupation During Past 5Years: |
| • Board Member, Illinois Mentoring Partnership, non-profit organization dedicated to increasing |
| the quantity and quality of mentoring services in Illinois (2013-present) |
| • Director, Boisi Family Foundation, a private family foundation that supports youth-serving orga- |
| nizations that promote the self sufficiency of youth from disadvantaged circumstances (1995-2012) |
| No. of Portfolios for which Board Member Serves: 114 |
| |
| ——————— |
| Dr. Martin Peretz (75) |
| Board Member (1990) |
| Principal Occupation During Past 5Years: |
| • Editor-in-Chief Emeritus of The New Republic Magazine (2010-2011) (previously, |
| Editor-in-Chief, 1974-2010) |
| • Director of TheStreet.com, a financial information service on the web (1996-2010) |
| No. of Portfolios for which Board Member Serves: 38 |
| |
| ——————— |
| Once elected all Board Members serve for an indefinite term, but achieve Emeritus status upon reaching age 80.The |
| address of the Board Members and Officers is c/o The Dreyfus Corporation, 200 Park Avenue, NewYork, NewYork |
| 10166.Additional information about the Board Members is available in the fund’s Statement of Additional Information |
| which can be obtained from Dreyfus free of charge by calling this toll free number: 1-800-DREYFUS. |
| James F. Henry, Emeritus Board Member |
| Rosalind G. Jacobs, Emeritus Board Member |
| Dr. Paul A. Marks, Emeritus Board Member |
| Philip L.Toia, Emeritus Board Member |
The Fund 35
OFFICERS OF THE FUND (Unaudited)

36
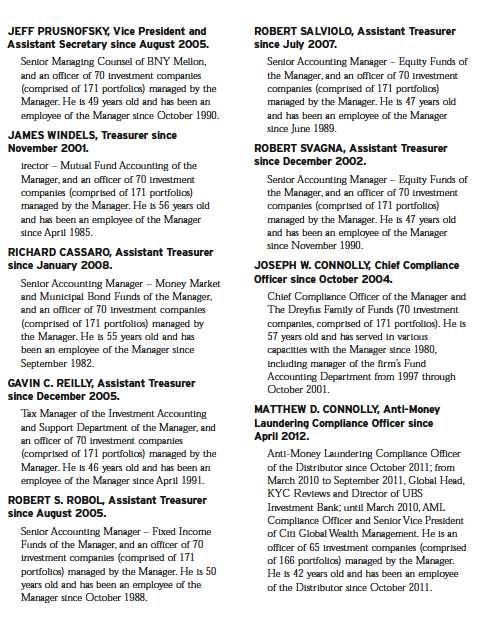
The Fund 37
For More Information

Telephone 1-800-554-4611 or 1-516-338-3300
Mail The Dreyfus Family of Funds, 144 Glenn Curtiss Boulevard, Uniondale, NY 11556-0144 Attn: Investments Division
The fund files its complete schedule of portfolio holdings with the Securities and Exchange Commission (“SEC”) for the first and third quarters of each fiscal year on Form N-Q. The fund’s Forms N-Q are available on the SEC’s website at http://www.sec.gov and may be reviewed and copied at the SEC’s Public Reference Room in Washington, DC. Information on the operation of the Public Reference Room may be obtained by calling 1-800-SEC-0330.
A description of the policies and procedures that the fund uses to determine how to vote proxies relating to portfolio securities, and information regarding how the fund voted these proxies for the most recent 12-month period ended June 30 is available at http://www.dreyfus.com and on the SEC’s website at http://www.sec.gov. The description of the policies and procedures is also available without charge, upon request, by calling 1-800-DREYFUS.

Dreyfus Variable
Investment Fund,
Money Market
Portfolio
The views expressed in this report reflect those of the portfolio manager only through the end of the period covered and do not necessarily represent the views of Dreyfus or any other person in the Dreyfus organization. Any such views are subject to change at any time based upon market or other conditions and Dreyfus disclaims any responsibility to update such views.These views may not be relied on as investment advice and, because investment decisions for a Dreyfus fund are based on numerous factors, may not be relied on as an indication of trading intent on behalf of any Dreyfus fund.

| | Contents |
| | THE FUND |
| 2 | A Letter from the President |
| 3 | Discussion of Fund Performance |
| 6 | Understanding Your Fund’s Expenses |
| 6 | Comparing Your Fund’s Expenses With Those of Other Funds |
| 7 | Statement of Investments |
| 10 | Statement of Assets and Liabilities |
| 11 | Statement of Operations |
| 12 | Statement of Changes in Net Assets |
| 13 | Financial Highlights |
| 14 | Notes to Financial Statements |
| 21 | Report of Independent Registered Public Accounting Firm |
| 22 | Board Members Information |
| 24 | Officers of the Fund |
| | FOR MORE INFORMATION |
| | Back Cover |
Dreyfus Variable Investment Fund,
Money Market Portfolio
The Fund
A LETTER FROM THE PRESIDENT
Dear Shareholder:
We are pleased to present this annual report for Dreyfus Variable Investment Fund, Money Market Portfolio, covering the 12-month period from January 1, 2014, through December 31, 2014. For information about how the fund performed during the reporting period, as well as general market perspectives, we provide a Discussion of Fund Performance on the pages that follow.
Long-term interest rates fell unexpectedly in the midst of a sustained economic recovery in 2014, driven downward by robust demand from investors seeking relatively safe havens in the midst of disappointing global growth and intensifying geopolitical conflicts. In contrast to sluggish global economic conditions, the U.S. economic recovery gained traction as evidenced by falling unemployment, rising consumer spending, and higher levels of capital spending by businesses. Nonetheless, short-term rates and money market yields remained steady throughout the year, anchored near historical lows by an unchanged federal funds rate.
Many economists appear to be optimistic about economic prospects for 2015. Our own analysts agree and, in light of the ongoing benefits of low interest rates and depressed energy prices, see the potential for a somewhat faster pace of global growth in 2015 than in 2014. U.S. economic growth also seems poised to accelerate, largely due to the fading of drags from tight fiscal policies adopted in the wake of the Great Recession.The Federal Reserve Board has indicated that it may begin to raise short-term interest rates in mid-2015, but rate hikes are likely to be modest and gradual to avoid undermining the recovery. Of course, stronger economic growth could create risks for some asset classes, which is why we urge you to talk regularly with your financial advisor about the potential impact of macroeconomic developments on your investments.
Thank you for your continued confidence and support.

J. Charles Cardona
President
The Dreyfus Corporation
January 15, 2015
2
DISCUSSION OF FUND PERFORMANCE
For the period of January 1, 2014, through December 31, 2014, as provided by Bernard W. Kiernan, Jr., Senior Portfolio Manager
Fund and Market Performance Overview
For the 12-month period ended December 31, 2014, Dreyfus Variable Investment Fund, Money Market Portfolio produced a yield of 0.00%. Taking into account the effects of compounding, the fund provided an effective yield of 0.00% for the same period.1
Despite rising long-term interest rates and a recovering U.S. economy during 2014, money market yields remained anchored by an unchanged federal funds rate between 0% and 0.25%.
The Fund’s Investment Approach
The fund seeks as high a level of current income as is consistent with the preservation of capital and the maintenance of liquidity.To pursue this goal, the fund invests in a diversified portfolio of high-quality, dollar-denominated short-term debt securities, including securities issued or guaranteed by the U.S. government or its agencies or instrumentalities, certificates of deposit, time deposits, bankers’ acceptances, and other short-term securities issued by domestic or foreign banks, repurchase agreements, including tri-party repurchase agreements, asset-backed securities, domestic and foreign commercial paper, and other short-term corporate and bank obligations and dollar-denominated foreign bank obligations. Normally, the fund invests at least 25% of its net assets in domestic or dollar-denominated foreign bank obligations.
U.S. Economy Rebounded after Soft Patch
The reporting period began in the midst of a recovering U.S. economy, which prompted the Federal Reserve Board (the “Fed”) to begin tapering its quantitative easing program.This development helped drive yields of 10-year U.S.Treasury securities above 3% by the start of 2014.
Long-term rates moderated in January 2014 amid concerns that global economic instability could derail the U.S. recovery.Yet, corporate earnings remained strong, the unemployment rate declined to 6.6% with the addition of 144,000 jobs, and the Fed
The Fund 3
DISCUSSION OF FUND PERFORMANCE (continued)
continued to reduce quantitative easing. The economy regained strength in February when the manufacturing and service sectors posted gains.The unemployment rate rose to 6.7%, but 222,000 new jobs were created. In March, the unemployment rate stayed unchanged and 203,000 positions were added. Nonetheless, U.S. GDP contracted at a 2.1% annualized rate over the first quarter due to severe winter weather.
304,000 new jobs were created in April, and the unemployment rate fell to 6.3%. In May, payrolls rose by 229,000, and the unemployment rate held steady. Meanwhile, manufacturing activity accelerated and personal incomes posted gains. 267,000 jobs were created in June, and the unemployment rate dipped to 6.1%. Manufacturing activity, personal incomes, and home sales continued to grow. The U.S. economy rebounded at a robust 4.6% annualized rate during the second quarter.
The unemployment rate ticked higher to 6.2% in July, when 243,000 new jobs were created. The Fed implemented additional bond purchasing reductions in June and July, and regulators removed a degree of uncertainty from money market operations by delaying newly enacted rule changes until 2016. August saw higher retail and new home sales, but new job creation fell to 203,000 even as the unemployment rate fell back to 6.1%.
In September, the economic recovery created 271,000 new jobs, and the unemployment rate slid to 5.9%, its lowest level since June 2008. Falling energy prices helped offset rising housing and food prices, contributing to a mild inflation rate of 0.1%. U.S. GDP grew at an estimated annualized 5.0% rate during the third quarter, its strongest quarterly performance since 2003.
Early October saw disappointing growth in Europe, which some believed might threaten the U.S. economy. Markets bounced back over the second half of the month when U.S. economic data stayed strong, including a 5.7% unemployment rate and 261,000 new jobs. Personal incomes rose and fuel prices fell, giving consumers greater confidence. In November, the unemployment rate ticked higher to 5.8% while an estimated 353,000 new jobs were added. Hourly earnings rose by 0.4% during the month, suggesting that the recovery’s benefits may be broadening to more Americans. Meanwhile, falling fuel prices contributed to an inflation rate of 0.3% in November, giving consumers greater buying power during the holiday season.
4
December brought more positive economic news as the unemployment rate slipped to 5.6% and an estimated 252,000 jobs were created. For 2014 overall, 2.95 million jobs were added to the U.S. economy, the largest annual increase since 1999.
Fed in No Hurry to Raise Rates
Although the Fed ended its quantitative easing program in the fall, it reiterated that short-term interest rates are likely to remain unchanged as policymakers “can be patient in beginning to normalize the stance of monetary policy.”
In light of the Fed’s reluctance to raise rates anytime soon, we have set the fund’s weighted average maturity in a range we consider to be slightly longer than market-neutral, and we have remained focused on well-established issuers with good quality and liquidity characteristics. In our view, these remain prudent strategies until we see more solid evidence that short-term interest rates are set to rise.
January 15, 2015
An investment in the fund is not insured or guaranteed by the FDIC or any other government agency. Although the fund seeks to preserve the value of your investment at $1.00 per share, it is possible to lose money by investing in the fund.
Short-term corporate and asset-backed securities holdings, while rated in the highest rating category by one or more NRSRO (or unrated, if deemed of comparable quality by Dreyfus), involve credit and liquidity risks and risk of principal loss.
The fund is only available as a funding vehicle under variable life insurance policies or variable annuity contracts issued by insurance companies. Individuals may not purchase shares of the fund directly. A variable annuity is an insurance contract issued by an insurance company that enables investors to accumulate assets on a tax-deferred basis for retirement or other long-term goals.The investment objective and policies of Dreyfus Variable Investment Fund, Money Market Portfolio made available through insurance products may be similar to other funds managed or advised by Dreyfus. However, the investment results of the fund may be higher or lower than, and may not be comparable to, those of any other Dreyfus fund.
|
| 1 Effective yield is based upon dividends declared daily and reinvested monthly. Past performance is no guarantee of |
| future results.Yields fluctuate.The fund’s performance does not reflect the deduction of additional charges and expenses |
| imposed in connection with investing in variable insurance contracts, which will reduce returns.Yields provided for the |
| fund reflect the absorption of certain fund expenses by The Dreyfus Corporation pursuant to an undertaking in effect |
| that may be extended, terminated, or modified at any time. Had these expenses not been absorbed, fund yields would |
| have been lower, and in some cases, 7-day yields during the reporting period would have been negative absent the |
| expense absorption. |
The Fund 5
UNDERSTANDING YOUR FUND’S EXPENSES (Unaudited)
As a mutual fund investor, you pay ongoing expenses, such as management fees and other expenses. Using the information below, you can estimate how these expenses affect your investment and compare them with the expenses of other funds.You also may pay one-time transaction expenses, including sales charges (loads), redemption fees and expenses associated with variable annuity or insurance contracts, which are not shown in this section and would have resulted in higher total expenses. For more information, see your fund’s prospectus or talk to your financial adviser.
Review your fund’s expenses
The table below shows the expenses you would have paid on a $1,000 investment in Dreyfus Variable Investment Fund, Money Market Portfolio from July 1, 2014 to December 31, 2014. It also shows how much a $1,000 investment would be worth at the close of the period, assuming actual returns and expenses.
Expenses and Value of a $1,000 Investment
assuming actual returns for the six months ended December 31, 2014
| | |
| Expenses paid per $1,000† | $ | .81 |
| Ending value (after expenses) | $ | 1,000.00 |
COMPARING YOUR FUND’S EXPENSES
WITH THOSE OF OTHER FUNDS (Unaudited)
Using the SEC’s method to compare expenses
The Securities and Exchange Commission (SEC) has established guidelines to help investors assess fund expenses. Per these guidelines, the table below shows your fund’s expenses based on a $1,000 investment, assuming a hypothetical 5% annualized return. You can use this information to compare the ongoing expenses (but not transaction expenses or total cost) of investing in the fund with those of other funds. All mutual fund shareholder reports will provide this information to help you make this comparison. Please note that you cannot use this information to estimate your actual ending account balance and expenses paid during the period.
Expenses and Value of a $1,000 Investment
assuming a hypothetical 5% annualized return for the six months ended December 31, 2014
| | |
| Expenses paid per $1,000† | $ | .82 |
| Ending value (after expenses) | $ | 1,024.40 |
|
| † Expenses are equal to the fund’s annualized expense ratio of .16%, multiplied by the average account value over the |
| period, multiplied by 184/365 (to reflect the one-half year period). |
6
STATEMENT OF INVESTMENTS
December 31, 2014
| | | |
| | Principal | | |
| Negotiable Bank Certificates of Deposit—31.1% | Amount ($) | | Value ($) |
| Bank of Montreal (Yankee) | | | |
| 0.22%, 4/8/15 | 5,000,000 | | 5,000,000 |
| BNP Paribas (Yankee) | | | |
| 0.22%, 2/2/15 | 4,000,000 | | 4,000,000 |
| Citibank N.A. | | | |
| 0.19%, 2/19/15 | 5,000,000 | | 5,000,000 |
| Mizuho Bank Ltd/NY (Yankee) | | | |
| 0.20%, 2/4/15 | 5,000,000 | | 5,000,000 |
| Nordea Bank Finland (Yankee) | | | |
| 0.23%, 5/20/15 | 5,000,000 | | 4,999,904 |
| Rabobank Nederland/NY (Yankee) | | | |
| 0.24%, 6/9/15 | 5,000,000 | | 5,000,000 |
| Standard Chartered Bank (Yankee) | | | |
| 0.21%, 3/2/15 | 5,000,000 | a | 5,000,000 |
| Toronto Dominion Bank NY (Yankee) | | | |
| 0.14%, 1/15/15 | 5,000,000 | | 5,000,000 |
| Total Negotiable Bank Certificates of Deposit | | | |
| (cost $38,999,904) | | | 38,999,904 |
| |
| Commercial Paper—35.8% | | | |
| Apple | | | |
| 0.11%, 1/5/15 | 5,000,000 | a | 4,999,939 |
| Australia and New Zealand | | | |
| Banking Group Ltd. | | | |
| 0.25%, 1/12/15 | 5,000,000 | a,b | 5,000,000 |
| Caisse des Depots et Consignations | | | |
| 0.22%, 4/8/15 | 5,000,000 | | 4,997,103 |
| Credit Agricole | | | |
| 0.05%, 1/2/15 | 5,000,000 | | 4,999,993 |
| Erste Abwicklungsanstalt | | | |
| 0.17%, 1/27/15 | 5,000,000 | | 4,999,386 |
| Oversea-Chinese Banking Corp./NY | | | |
| 0.24%, 5/19/15 | 5,000,000 | | 4,995,400 |
The Fund 7
| | | | |
| | STATEMENT OF INVESTMENTS (continued) | | | |
| |
| |
| |
| |
| | | Principal | | |
| | Commercial Paper (continued) | Amount ($) | | Value ($) |
| | State Street Corp. | | | |
| | 0.17%, 3/16/15 | 5,000,000 | | 4,998,253 |
| | Sumitomo Mitsui Banking Corp. | | | |
| | 0.25%, 4/21/15 | 5,000,000 | a | 4,996,180 |
| | Westpac Banking Corp. | | | |
| | 0.24%, 1/2/15 | 5,000,000 | a,b | 5,000,000 |
| | Total Commercial Paper | | | |
| | (cost $44,986,254) | | | 44,986,254 |
| |
| Asset-Backed Commercial Paper—10.3% | | | |
| | Collateralized Commercial Paper Program Co., LLC | | | |
| | 0.30%, 3/17/15 | 3,000,000 | | 2,998,125 |
| | Metlife Short Term Funding LLC | | | |
| | 0.11%, 1/6/15 | 5,000,000 | a | 4,999,924 |
| | Regency Markets No. 1 LLC | | | |
| | 0.16%, 1/20/15 | 5,000,000 | a | 4,999,578 |
| | Total Asset-Backed Commercial Paper | | | |
| | (cost $12,997,627) | | | 12,997,627 |
| |
| | Time Deposits—12.7% | | | |
| | Canadian Imperial Bank of Commerce (Grand Cayman) | | | |
| | 0.04%, 1/2/15 | 5,000,000 | | 5,000,000 |
| | DZ Bank AG (Grand Cayman) | | | |
| | 0.04%, 1/2/15 | 6,000,000 | | 6,000,000 |
| | Lloyds Bank (London) | | | |
| | 0.05%, 1/2/15 | 5,000,000 | | 5,000,000 |
| | Total Time Deposits | | | |
| | (cost $16,000,000) | | | 16,000,000 |
| |
| | U.S. Treasury Notes—2.4% | | | |
| | 0.12%, 5/31/15 | | | |
| | (cost $3,024,844) | 3,000,000 | | 3,024,844 |
8
| | | | |
| | Principal | | | |
| Repurchase Agreement—8.0% | Amount ($) | | Value ($) | |
| ABN AMRO Bank N.V. | | | | |
| 0.10%, dated 12/31/14, due 1/2/15 in the | | | | |
| amount of $10,000,056 (fully collateralized by | | | | |
| $2,109,551 U.S. Treasury Bonds, 2.75%-4.25%, | | | | |
| due 5/15/39-11/15/42, value $2,400,951, | | | | |
| $1,399,640 U.S. Treasury Inflation Protected | | | | |
| Securities, 0.13%-3.63%, due 1/15/18-4/15/28, | | | | |
| value $1,564,725 and $6,176,920 | | | | |
| U.S. Treasury Notes, 1.75%-2.63%, | | | | |
| due 11/30/17-5/15/23, value $6,234,325) | | | | |
| (cost $10,000,000) | 10,000,000 | | 10,000,000 | |
| |
| Total Investments (cost $126,008,629) | 100.3 | % | 126,008,629 | |
| |
| Liabilities, Less Cash and Receivables | (.3 | %) | (387,201 | ) |
| |
| Net Assets | 100.0 | % | 125,621,428 | |
|
| a Securities exempt from registration pursuant to Rule 144A under the Securities Act of 1933.These securities may be |
| resold in transactions exempt from registration, normally to qualified institutional buyers.At December 31, 2014, |
| these securities amounted to $34,995,621 or 27.9% of net assets. |
| b Variable rate security—interest rate subject to periodic change. |
| | | |
| Portfolio Summary (Unaudited)† | | |
| |
| | Value (%) | | Value (%) |
| Banking | 71.6 | Savings and Loans | 4.0 |
| Repurchase Agreement | 8.0 | U.S. Government | 2.4 |
| Asset-Backed/Insurance | 4.0 | Asset-Backed/Banking | 2.3 |
| Asset-Backed/Multi-Seller Programs | 4.0 | | |
| Communications Equipment | 4.0 | | 100.3 |
| |
| † Based on net assets. | | | |
| See notes to financial statements. | | | |
The Fund 9
STATEMENT OF ASSETS AND LIABILITIES
December 31, 2014
| | |
| | Cost | Value |
| Assets ($): | | |
| Investments in securities—See Statement of | | |
| Investments (including Repurchase Agreement | | |
| of $10,000,000)—Note 1(b) | 126,008,629 | 126,008,629 |
| Interest receivable | | 19,604 |
| Prepaid expenses | | 679 |
| | | 126,028,912 |
| Liabilities ($): | | |
| Due to The Dreyfus Corporation and affiliates—Note 2(a) | | 30,553 |
| Cash overdraft due to Custodian | | 290,776 |
| Payable for shares of Beneficial Interest redeemed | | 35,867 |
| Accrued expenses | | 50,288 |
| | | 407,484 |
| Net Assets ($) | | 125,621,428 |
| Composition of Net Assets ($): | | |
| Paid-in capital | | 125,621,428 |
| Net Assets ($) | | 125,621,428 |
| Shares Outstanding | | |
| (unlimited number of $.001 par value shares of Beneficial Interest authorized) | 125,590,154 |
| Net Asset Value, offering and redemption price per share ($) | | 1.00 |
| |
| See notes to financial statements. | | |
10
STATEMENT OF OPERATIONS
Year Ended December 31, 2014
| | |
| Investment Income ($): | | |
| Interest Income | 183,490 | |
| Expenses: | | |
| Investment advisory fee—Note 2(a) | 659,927 | |
| Professional fees | 52,197 | |
| Custodian fees—Note 2(a) | 30,102 | |
| Trustees’ fees and expenses—Note 2(b) | 9,990 | |
| Prospectus and shareholders’ reports | 9,034 | |
| Shareholder servicing costs—Note 2(a) | 360 | |
| Miscellaneous | 14,647 | |
| Total Expenses | 776,257 | |
| Less—reduction in expenses due to undertaking—Note 2(a) | (591,075 | ) |
| Less—reduction in fees due to earnings credits—Note 2(a) | (1,739 | ) |
| Net Expenses | 183,443 | |
| Investment Income—Net, representing net increase | | |
| in net assets resulting from operations | 47 | |
| |
| See notes to financial statements. | | |
The Fund 11
STATEMENT OF CHANGES IN NET ASSETS
| | | | |
| | Year Ended December 31, | |
| | 2014 | | 2013 | |
| Operations ($): | | | | |
| Investment income—net | 47 | | 57 | |
| Net realized gain (loss) on investments | — | | 211 | |
| Net Increase (Decrease) in Net Assets | | | | |
| Resulting from Operations | 47 | | 268 | |
| Dividends to Shareholders from ($): | | | | |
| Investment income—net | (258 | ) | (57 | ) |
| Beneficial Interest Transactions ($1.00 per share): | | | | |
| Net proceeds from shares sold | 240,527,823 | | 349,867,225 | |
| Dividends reinvested | 258 | | 57 | |
| Cost of shares redeemed | (242,850,260 | ) | (370,228,941 | ) |
| Increase (Decrease) in Net Assets from | | | | |
| Beneficial Interest Transactions | (2,322,179 | ) | (20,361,659 | ) |
| Total Increase (Decrease) in Net Assets | (2,322,390 | ) | (20,361,448 | ) |
| Net Assets ($): | | | | |
| Beginning of Period | 127,943,818 | | 148,305,266 | |
| End of Period | 125,621,428 | | 127,943,818 | |
| |
| See notes to financial statements. | | | | |
12
FINANCIAL HIGHLIGHTS
The following table describes the performance for the fiscal periods indicated. Total return shows how much your investment in the fund would have increased (or decreased) during each period, assuming you had reinvested all dividends and distributions.The fund’s total returns do not reflect expenses associated with variable annuity or insurance contracts. These figures have been derived from the fund’s financial statements.
| | | | | | | | | | |
| | | | Year Ended December 31, | | | |
| | 2014 | | 2013 | | 2012 | | 2011 | | 2010 | |
| Per Share Data ($): | | | | | | | | | | |
| Net asset value, beginning of period | 1.00 | | 1.00 | | 1.00 | | 1.00 | | 1.00 | |
| Investment Operations: | | | | | | | | | | |
| Investment income—neta | .000 | | .000 | | .000 | | .000 | | .000 | |
| Distributions: | | | | | | | | | | |
| Dividends from | | | | | | | | | | |
| investment income—neta | (.000 | ) | (.000 | ) | (.000 | ) | (.000 | ) | (.000 | ) |
| Net asset value, end of period | 1.00 | | 1.00 | | 1.00 | | 1.00 | | 1.00 | |
| Total Return (%) | .00 | b | .00 | b | .00 | b | .01 | | .01 | |
| Ratios/Supplemental Data (%): | | | | | | | | | | |
| Ratio of total expenses | | | | | | | | | | |
| to average net assets | .59 | | .60 | | .59 | | .60 | | .58 | |
| Ratio of net expenses | | | | | | | | | | |
| to average net assets | .14 | | .14 | | .21 | | .17 | | .29 | |
| Ratio of net investment income | | | | | | | | | | |
| to average net assetsb | .00 | | .00 | | .00 | | .00 | | .00 | |
| Net Assets, end of period ($ x 1,000) | 125,621 | | 127,944 | | 148,305 | | 221,362 | | 211,094 | |
| |
| a | Amount represents less than $.001 per share. |
| b | Amount represents less than .01%. |
See notes to financial statements.
The Fund 13
NOTES TO FINANCIAL STATEMENTS
NOTE 1—Significant Accounting Policies:
Dreyfus Variable Investment Fund (the “Company”), is registered under the Investment Company Act of 1940, as amended (the “Act”), as an open-end management investment company, operating as a series company currently offering seven series, including the Money Market Portfolio (the “fund”). The fund is only offered to separate accounts established by insurance companies to fund variable annuity contracts and variable life insurance policies.The fund is a diversified series.The fund’s investment objective is to seek as high a level of current income as is consistent with the preservation of capital and the maintenance of liquidity. The Dreyfus Corporation (the “Manager” or “Dreyfus”), a wholly-owned subsidiary of The Bank of New York Mellon Corporation (“BNY Mellon”), serves as the fund’s investment adviser. MBSC Securities Corporation (the “Distributor”), a wholly-owned subsidiary of the Manager, is the distributor of the fund’s shares, which are sold without a sales charge.
It is the fund’s policy to maintain a continuous net asset value per share of $1.00; the fund has adopted certain investment, portfolio valuation and dividend and distribution policies to enable it to do so. There is no assurance, however, that the fund will be able to maintain a stable net asset value per share of $1.00.
The Company accounts separately for the assets, liabilities and operations of each series. Expenses directly attributable to each series are charged to that series’ operations; expenses which are applicable to all series are allocated among them on a pro rata basis.
The Financial Accounting Standards Board (“FASB”) Accounting Standards Codification (“ASC”) is the exclusive reference of authoritative U.S. generally accepted accounting principles (“GAAP”) recognized by the FASB to be applied by nongovernmental entities. Rules and inter-
14
pretive releases of the Securities and Exchange Commission (“SEC”) under authority of federal laws are also sources of authoritative GAAP for SEC registrants. The fund’s financial statements are prepared in accordance with GAAP, which may require the use of management estimates and assumptions. Actual results could differ from those estimates.
The Company enters into contracts that contain a variety of indemnifications. The fund’s maximum exposure under these arrangements is unknown.The fund does not anticipate recognizing any loss related to these arrangements.
(a) Portfolio valuation: Investments in securities are valued at amortized cost in accordance with Rule 2a-7 under the Act. If amortized cost is determined not to approximate market value, the fair value of the portfolio securities will be determined by procedures established by and under the general supervision of the Company’s Board of Trustees (the “Board”).
The fair value of a financial instrument is the amount that would be received to sell an asset or paid to transfer a liability in an orderly transaction between market participants at the measurement date (i.e., the exit price). GAAP establishes a fair value hierarchy that prioritizes the inputs of valuation techniques used to measure fair value.This hierarchy gives the highest priority to unadjusted quoted prices in active markets for identical assets or liabilities (Level 1 measurements) and the lowest priority to unobservable inputs (Level 3 measurements).
Additionally, GAAP provides guidance on determining whether the volume and activity in a market has decreased significantly and whether such a decrease in activity results in transactions that are not orderly. GAAP requires enhanced disclosures around valuation inputs and techniques used during annual and interim periods.
The Fund 15
NOTES TO FINANCIAL STATEMENTS (continued)
Various inputs are used in determining the value of the fund’s investments relating to fair value measurements.These inputs are summarized in the three broad levels listed below:
Level 1—unadjusted quoted prices in active markets for identical investments.
Level 2—other significant observable inputs (including quoted prices for similar investments, interest rates, prepayment speeds, credit risk, etc.).
Level 3—significant unobservable inputs (including the fund’s own assumptions in determining the fair value of investments).
The inputs or methodology used for valuing securities are not necessarily an indication of the risk associated with investing in those securities. For example, money market securities are valued using amortized cost, in accordance with rules under the Act. Generally, amortized cost approximates the current fair value of a security, but since the value is not obtained from a quoted price in an active market, such securities are reflected within Level 2 of the fair value hierarchy.
The following is a summary of the inputs used as of December 31, 2014 in valuing the fund’s investments:
| |
| | Short-Term |
| Valuation Inputs | Investments ($)† |
| Level 1—Unadjusted Quoted Prices | — |
| Level 2—Other Significant Observable Inputs | 126,008,629 |
| Level 3—Significant Unobservable Inputs | — |
| Total | 126,008,629 |
| † See Statement of Investments for additional detailed categorizations. | |
At December 31, 2014, there were no transfers between Level 1 and Level 2 of the fair value hierarchy.
(b) Securities transactions and investment income: Securities transactions are recorded on a trade date basis. Interest income, adjusted for accretion of discount and amortization of premium on investments, is earned from settlement date and is recognized on the accrual basis.
16
Realized gains and losses from securities transactions are recorded on the identified cost basis. Cost of investments represents amortized cost.
The fund may enter into repurchase agreements with financial institutions, deemed to be creditworthy by the Manager, subject to the seller’s agreement to repurchase and the fund’s agreement to resell such securities at a mutually agreed upon price. Pursuant to the terms of the repurchase agreement, such securities must have an aggregate market value greater than or equal to the terms of the repurchase price plus accrued interest at all times. If the value of the underlying securities falls below the value of the repurchase price plus accrued interest, the fund will require the seller to deposit additional collateral by the next business day. If the request for additional collateral is not met, or the seller defaults on its repurchase obligation, the fund maintains its right to sell the underlying securities at market value and may claim any resulting loss against the seller.The fund may also jointly enter into one or more repurchase agreements with other Dreyfus-managed funds in accordance with an exemptive order granted by the SEC pursuant to section 17(d) and Rule 17d-1 under the Act. Any joint repurchase agreements must be collateralized fully by U.S. Government securities.
(c) Dividends to shareholders: It is the policy of the fund to declare dividends daily from investment income-net. Such dividends are paid monthly. Dividends from net realized capital gains, if any, are normally declared and paid annually, but the fund may make distributions on a more frequent basis to comply with the distribution requirements of the Internal Revenue Code of 1986, as amended (the “Code”).To the extent that net realized capital gains can be offset by capital loss carryovers, it is the policy of the fund not to distribute such gains.
(d) Federal income taxes: It is the policy of the fund to continue to qualify as a regulated investment company, if such qualification is in the best interests of its shareholders, by complying with the applicable provisions of the Code, and to make distributions of taxable income sufficient to relieve it from substantially all federal income and excise taxes.
The Fund 17
NOTES TO FINANCIAL STATEMENTS (continued)
As of and during the period ended December 31, 2014, the fund did not have any liabilities for any uncertain tax positions. The fund recognizes interest and penalties, if any, related to uncertain tax positions as income tax expense in the Statement of Operations. During the period ended December 31, 2014, the fund did not incur any interest or penalties.
Each tax year in the four-year period ended December 31, 2014 remains subject to examination by the Internal Revenue Service and state taxing authorities.
At December 31, 2014, the components of accumulated earnings on a tax basis were substantially the same as for financial reporting purposes.
The tax character of distributions paid to shareholders during the fiscal periods ended December 31, 2014 and December 31, 2013 were all ordinary income.
During the period ended December 31, 2014, as a result of permanent book to tax differences, primarily due to the tax treatment for dividend reclassification, the fund increased accumulated undistributed investment income-net by $211 and decreased accumulated net realized gain (loss) on investments by the same amount. Net assets and net asset value per share were not affected by this reclassification.
At December 31, 2014, the cost of investments for federal income tax purposes was substantially the same as the cost for financial reporting purposes (see the Statement of Investments).
NOTE 2—Investment Advisory Fee and Other Transactions with Affiliates:
(a) Pursuant to an investment advisory agreement with the Manager, the investment advisory fee is computed at the annual rate of .50% of the value of the fund’s average daily net assets and is payable monthly. The Manager has undertaken to waive receipt of the investment advisory fee and/or reimburse operating expenses in order to facilitate a daily yield at or above a certain level which may change from time to time. This undertaking is voluntary and not contractual, and may be terminated at
18
any time. The reduction in expenses, pursuant to the undertaking, amounted to $591,075 during the period ended December 31, 2014.
The fund has arrangements with the transfer agent and the custodian whereby the fund may receive earnings credits when positive cash balances are maintained, which are used to offset transfer agency and custody fees. For financial reporting purposes, the fund includes net earnings credits as an expense offset in the Statement of Operations.
The fund compensates Dreyfus Transfer, Inc., a wholly-owned subsidiary of the Manager, under a transfer agency agreement for providing transfer agency and cash management services for the fund. The majority of transfer agency fees are comprised of amounts paid on a per account basis, while cash management fees are related to fund subscriptions and redemptions. During the period ended December 31, 2014, the fund was charged $323 for transfer agency services and $18 for cash management services.These fees are included in Shareholder servicing costs in the Statement of Operations. Cash management fees were partially offset by earnings credits of $1.
The fund compensates The Bank of New York Mellon, a subsidiary of BNY Mellon and an affiliate of Dreyfus, under a custody agreement for providing custodial services for the fund.These fees are determined based on net assets, geographic region and transaction activity. During the period ended December 31, 2014, the fund was charged $30,102 pursuant to the custody agreement.These fees were partially offset by earnings credits of $1,738.
During the period ended December 31, 2014, the fund was charged $7,771 for services performed by the Chief Compliance Officer and his staff.
The components of “Due to The Dreyfus Corporation and affiliates” in the Statement of Assets and Liabilities consist of: investment advisory fees $59,406, custodian fees $13,289, Chief Compliance Officer fees $1,851 and transfer agency fees $93, which are offset against an expense reimbursement currently in effect in the amount of $44,086.
The Fund 19
NOTES TO FINANCIAL STATEMENTS (continued)
(b) Each Board member also serves as a Board member of other funds within the Dreyfus complex. Annual retainer fees and attendance fees are allocated to each fund based on net assets.
NOTE 3—Regulatory Developments:
On July 23, 2014, the SEC adopted amendments to the rules that govern money market mutual funds. In part, the amendments will require structural changes to most types of money market funds to one extent or another; however, the SEC provided for an extended two-year transition period to comply with such structural requirements. At this time, management is evaluating the reforms adopted and the manner for implementing these reforms over time and its impact on the financial statements.
20
REPORT OF INDEPENDENT REGISTERED
PUBLIC ACCOUNTING FIRM
Shareholders and Board of Trustees
Dreyfus Variable Investment Fund, Money Market Portfolio
We have audited the accompanying statement of assets and liabilities, including the statement of investments, of Dreyfus Variable Investment Fund, Money Market Portfolio (one of the series comprising Dreyfus Variable Investment Fund) as of December 31, 2014, and the related statement of operations for the year then ended, the statement of changes in net assets for each of the two years in the period then ended, and the financial highlights for each of the five years in the period then ended. These financial statements and financial highlights are the responsibility of the Fund’s management. Our responsibility is to express an opinion on these financial statements and financial highlights based on our audits.
We conducted our audits in accordance with the standards of the Public Company Accounting Oversight Board (United States). Those standards require that we plan and perform the audit to obtain reasonable assurance about whether the financial statements and financial highlights are free of material misstatement. We were not engaged to perform an audit of the Fund’s internal control over financial reporting. Our audits included consideration of internal control over financial reporting as a basis for designing audit procedures that are appropriate in the circumstances, but not for the purpose of expressing an opinion on the effectiveness of the Fund’s internal control over financial reporting. Accordingly, we express no such opinion. An audit also includes examining, on a test basis, evidence supporting the amounts and disclosures in the financial statements and financial highlights, assessing the accounting principles used and significant estimates made by management, and evaluating the overall financial statement presentation. Our procedures included confirmation of securities owned as of December 31, 2014 by correspondence with the custodian and others.We believe that our audits provide a reasonable basis for our opinion.
In our opinion, the financial statements and financial highlights referred to above present fairly, in all material respects, the financial position of DreyfusVariable Investment Fund, Money Market Portfolio at December 31, 2014, the results of its operations for the year then ended, the changes in its net assets for each of the two years in the period then ended, and the financial highlights for each of the five years in the period then ended, in conformity with U.S. generally accepted accounting principles.

New York, New York
February 11, 2015
The Fund 21
BOARD MEMBERS INFORMATION (Unaudited)
INDEPENDENT BOARD MEMBERS
|
| Joseph S. DiMartino (71) |
| Chairman of the Board (1995) |
| Principal Occupation During Past 5Years: |
| • Corporate Director and Trustee (1995-present) |
| Other Public Company Board Memberships During Past 5Years: |
| • CBIZ (formerly, Century Business Services, Inc.), a provider of outsourcing functions for small |
| and medium size companies, Director (1997-present) |
| • The Newark Group, a provider of a national market of paper recovery facilities, paperboard |
| mills and paperboard converting plants, Director (2000-2010) |
| • Sunair Services Corporation, a provider of certain outdoor-related services to homes and |
| businesses, Director (2005-2009) |
| No. of Portfolios for which Board Member Serves: 146 |
| ——————— |
| Peggy C. Davis (71) |
| Board Member (2006) |
| Principal Occupation During Past 5Years: |
| • Shad Professor of Law, New York University School of Law (1983-present) |
| No. of Portfolios for which Board Member Serves: 52 |
| ——————— |
| David P. Feldman (75) |
| Board Member (1994) |
| Principal Occupation During Past 5Years: |
| • Corporate Director and Trustee (1985-present) |
| Other Public Company Board Membership During Past 5Years: |
| • BBH Mutual Funds Group (5 registered mutual funds), Director (1992-present) |
| No. of Portfolios for which Board Member Serves: 38 |
| ——————— |
| Ehud Houminer (74) |
| Board Member (2006) |
| Principal Occupation During Past 5Years: |
| • Executive-in-Residence at the Columbia Business School, Columbia University (1992-present) |
| Other Public Company Board Membership During Past 5Years: |
| • Avnet, Inc., an electronics distributor, Director (1993-2012) |
| No. of Portfolios for which Board Member Serves: 62 |
22
Lynn Martin (75)
Board Member (2012)
|
| Principal Occupation During Past 5Years: |
| • President of The Martin Hall Group LLC, a human resources consulting firm (2005-2012) |
| Other Public Company Board Memberships During Past 5Years: |
| • AT&T, Inc., a telecommunications company, Director (1999-2012) |
| • Ryder System, Inc., a supply chain and transportation management company, Director (1993-2012) |
| • The Proctor & Gamble Co., a consumer products company, Director (1994-2009) |
| • Constellation Energy Group, Inc., Director (2003-2009) |
| No. of Portfolios for which Board Member Serves: 38 |
| |
| ——————— |
| Robin A. Melvin (51) |
| Board Member (2012) |
| Principal Occupation During Past 5Years: |
| • Board Member, Illinois Mentoring Partnership, non-profit organization dedicated to increasing |
| the quantity and quality of mentoring services in Illinois (2013-present) |
| • Director, Boisi Family Foundation, a private family foundation that supports youth-serving orga- |
| nizations that promote the self sufficiency of youth from disadvantaged circumstances (1995-2012) |
| No. of Portfolios for which Board Member Serves: 114 |
| |
| ——————— |
| Dr. Martin Peretz (75) |
| Board Member (1990) |
| Principal Occupation During Past 5Years: |
| • Editor-in-Chief Emeritus of The New Republic Magazine (2010-2011) (previously, |
| Editor-in-Chief, 1974-2010) |
| • Director of TheStreet.com, a financial information service on the web (1996-2010) |
| No. of Portfolios for which Board Member Serves: 38 |
| |
| ——————— |
| Once elected all Board Members serve for an indefinite term, but achieve Emeritus status upon reaching age 80.The |
| address of the Board Members and Officers is c/o The Dreyfus Corporation, 200 Park Avenue, NewYork, NewYork |
| 10166.Additional information about the Board Members is available in the fund’s Statement of Additional Information |
| which can be obtained from Dreyfus free of charge by calling this toll free number: 1-800-DREYFUS. |
| James F. Henry, Emeritus Board Member |
| Rosalind G. Jacobs, Emeritus Board Member |
| Dr. Paul A. Marks, Emeritus Board Member |
| Philip L.Toia, Emeritus Board Member |
The Fund 23
OFFICERS OF THE FUND (Unaudited)
24
The Fund 25
For More Information
Telephone 1-800-554-4611 or 1-516-338-3300
Mail The Dreyfus Family of Funds, 144 Glenn Curtiss Boulevard, Uniondale, NY 11556-0144
Attn: Investments Division
The fund files its complete schedule of portfolio holdings with the Securities and Exchange
Commission (“SEC”) for the first and third quarters of each fiscal year on Form N-Q. The fund’s
Forms N-Q are available on the SEC’s website at http://www.sec.gov and may be reviewed and
copied at the SEC’s Public Reference Room in Washington, DC. Information on the operation of
the Public Reference Room may be obtained by calling 1-800-SEC-0330.
Information regarding how the fund voted proxies relating to fund securities for the
most recent 12-month period ended June 30 is available on the SEC’s website at
http://www.sec.gov and without charge, upon request, by calling 1-800-DREYFUS.

|
| Dreyfus Variable |
| Investment Fund, |
| Opportunistic |
| Small Cap Portfolio |

The views expressed in this report reflect those of the portfolio manager only through the end of the period covered and do not necessarily represent the views of Dreyfus or any other person in the Dreyfus organization. Any such views are subject to change at any time based upon market or other conditions and Dreyfus disclaims any responsibility to update such views.These views may not be relied on as investment advice and, because investment decisions for a Dreyfus fund are based on numerous factors, may not be relied on as an indication of trading intent on behalf of any Dreyfus fund.
| | Contents |
| | THE FUND |
| 2 | A Letter from the President |
| 3 | Discussion of Fund Performance |
| 6 | Fund Performance |
| 8 | Understanding Your Fund’s Expenses |
| 8 | Comparing Your Fund’s Expenses With Those of Other Funds |
| 9 | Statement of Investments |
| 13 | Statement of Assets and Liabilities |
| 14 | Statement of Operations |
| 15 | Statement of Changes in Net Assets |
| 16 | Financial Highlights |
| 18 | Notes to Financial Statements |
| 27 | Report of Independent Registered Public Accounting Firm |
| 28 | Board Members Information |
| 30 | Officers of the Fund |
| | FOR MORE INFORMATION |
| | Back Cover |
Dreyfus Variable Investment Fund,
Opportunistic Small Cap Portfolio
The Fund
A LETTER FROM THE PRESIDENT
Dear Shareholder:
We are pleased to present this annual report for Dreyfus Variable Investment Fund, Opportunistic Small Cap Portfolio, covering the 12-month period from January 1, 2014, through December 31, 2014. For information about how the fund performed during the reporting period, as well as general market perspectives, we provide a Discussion of Fund Performance on the pages that follow.
While U.S. equities’ 2014 gains fell short of their impressive 2013 performance, some broad measures of stock market performance posted their sixth consecutive year of positive results. Investor sentiment remained strong in an environment of sustained economic growth, rising corporate profits, muted inflation, and historically low interest rates. It also is noteworthy that stocks advanced despite persistent headwinds stemming from a sluggish global economy, which was characterized by economic weakness in Europe, Japan and China; intensifying geopolitical conflicts; and plummeting commodity prices.
Many economists appear to be optimistic about the prospects for 2015. Our own analysts agree and, in light of the ongoing benefits of low interest rates and depressed energy prices, see the potential for a somewhat faster pace of global growth in 2015 than in 2014. U.S. economic growth also seems poised to accelerate, largely due to the fading of drags from tight fiscal policies adopted in the wake of the Great Recession. Of course, a number of risks to U.S. and global economic growth remain, and changing conditions in 2015 are likely to benefit some industry groups more than others. That’s why we urge you to talk regularly with your financial advisor about the potential impact of macroeconomic developments on your investments.
Thank you for your continued confidence and support.

J. Charles Cardona
President
The Dreyfus Corporation
January 15, 2015
2
DISCUSSION OF FUND PERFORMANCE
For the period of January 1, 2014, through December 31, 2014, as provided by David A. Daglio, Primary Portfolio Manager; James Boyd and Dale Dutile, Portfolio Managers
Fund and Market Performance Overview
For the 12-month period ended December 31, 2014, Dreyfus Variable Investment Fund, Opportunistic Small Cap Portfolio’s Initial shares produced a total return of 1.60%, and its Service shares returned 1.32%.1 In comparison, the Russell 2000® Index, the fund’s benchmark, produced a total return of 4.89% for the same period.2
A sustained U.S. economic recovery generally helped support stock prices over the reporting period, but gains were far greater among large-cap stocks than their small-cap counterparts. The fund underperformed its benchmark, mainly due to shortfalls among technology and gold mining stocks.
The Fund’s Investment Approach
The fund seeks capital growth. Stocks are selected for the fund’s portfolio based primarily on bottom-up, fundamental analysis.The fund’s portfolio managers use a disciplined investment process that relies, in general, on proprietary fundamental research and valuation. Generally, elements of the process include analysis of mid-cycle business prospects, estimation of the intrinsic value of the company, and the identification of a revaluation trigger. Intrinsic value is based on the combination of the valuation assessment of the company’s operating divisions with the firm’s economic balance sheet. Mid-cycle estimates, growth prospects, and competitive advantages are some of the factors used in the valuation assessment. A company’s stated and hidden liabilities and assets are included in the portfolio managers’ economic balance sheet calculation. Sector overweights and underweights are a function of the relative attractiveness of securities within the fund’s investable universe.The fund’s portfolio managers invest in stocks that they believe have attractive reward to risk opportunities and may actively adjust the fund’s portfolio to reflect new developments.
Small-Cap Stocks Climbed Despite Bouts of Volatility
Small-cap stocks began 2014 in the midst of a rally fueled by falling unemployment and intensifying manufacturing activity, but stocks across all capitalization ranges gave
The Fund 3
DISCUSSION OF FUND PERFORMANCE (continued)
up some of their previous gains in January, when concerns arose regarding economic and political instability in the emerging markets. In addition, U.S. GDP contracted at a surprising annualized 2.1% rate over the first quarter of 2014 due to the dampening economic effects of severe winter weather.
U.S. stocks began to rebound in February, and some broad market indices climbed to record highs by the beginning of July as investors responded to expectations that the Federal Reserve Board would keep short-term interest rates low even as labor markets, manufacturing activity, and consumer confidence improved. In fact, the U.S. economy rebounded at a robust 4.6% annualized rate during the second quarter of the year.
The market encountered renewed volatility in July and September when disappointing economic data from Europe, China, and Japan sparked concerns that a faltering global economy might derail the U.S. expansion. Strong corporate earnings and solid domestic economic data—including an estimated 5.0% annualized GDP growth rate for the third quarter—generally enabled stocks to rebound, but ongoing turmoil in overseas markets and plummeting commodity prices caused newly risk-averse investors to turn from smaller growth companies toward very large, traditionally defensive stocks with high dividend yields. Consequently, small-cap stocks generally trailed large-cap stocks substantially for the year overall.
Technology and Mining Stocks Dampened Fund Results
Although the fund participated to a degree in the small-cap market’s gains, its relative performance was undermined by our security selection strategy in the information technology sector. Suppliers to the telecommunications equipment industry, such as networking specialist Ciena, were hurt when higher capital spending failed to materialize. A decline in its legacy power PC business hampered results from connectivity solutions provider Applied Micro Circuits.
The fund also encountered disappointments among precious metals producers, such as Allied Nevada Gold, New Gold, and AuRico Gold, which struggled with falling commodity prices. Finally, we missed participating in gains among income-oriented stocks, which we generally avoided due to high valuations.
The fund achieved better relative results among consumer discretionary stocks, where underweighted exposure cushioned generally weak sector performance. In addition, office supplies retailer Office Depot boosted operating margins through
4
store closures and other cost containment efforts, and for-profit educator Apollo Education Group experienced rising enrollment trends. The fund also benefited from an underweighted position in the hard-hit energy sector, and favorable stock selections in the industrial sector included logistics company Landstar System and office furniture suppliers HNI, Steelcase, and Knoll.
Fundamentals and Valuations Appear Attractive
We are optimistic regarding the prospects for small-cap stocks in 2015. Business fundamentals have continued to improve in the recovering economy, and many small U.S. companies have little exposure to troubled overseas markets. Moreover, recent underperformance has kept valuations at reasonable levels.Therefore, we have positioned the fund constructively, including overweighted exposure to information technology, financials, and materials stocks. In contrast, we have identified relatively few opportunities in the energy, utilities, and consumer staples sectors.
January 15, 2015
Please note, the position in any security highlighted with italicized typeface was sold during the reporting period. Equity funds are subject generally to market, market sector, market liquidity, issuer, and investment style risks, among other factors, to varying degrees, all of which are more fully described in the fund’s prospectus.
Stocks of small- and/or midcap companies often experience sharper price fluctuations than stocks of large-cap companies. The fund is only available as a funding vehicle under variable life insurance policies or variable annuity contracts issued by insurance companies. Individuals may not purchase shares of the fund directly. A variable annuity is an insurance contract issued by an insurance company that enables investors to accumulate assets on a tax-deferred basis for retirement or other long-term goals.
|
| 1 Total return includes reinvestment of dividends and any capital gains paid. Past performance is no guarantee of future |
| results. Share price and investment return fluctuate such that upon redemption, fund shares may be worth more or less |
| than their original cost.The fund’s performance does not reflect the deduction of additional charges and expenses |
| imposed in connection with investing in variable insurance contracts, which will reduce returns. |
| 2 SOURCE: LIPPER INC. — Reflects reinvestment of dividends and, where applicable, capital gain distributions. |
| The Russell 2000® Index is an unmanaged index of small-cap stock performance and is composed of the 2,000 |
| smallest companies in the Russell 3000® Index.The Russell 3000® Index is composed of the 3,000 largest U.S. |
| companies based on total market capitalization. Investors cannot invest directly in any index. |
The Fund 5

Comparison of change in value of $10,000 investment in Dreyfus Variable Investment Fund,
Opportunistic Small Cap Portfolio Initial shares and Service shares and the Russell 2000 Index
| | | | | | |
| Average Annual Total Returns as of 12/31/14 | | | | | | |
| | 1 | Year | 5 Years | | 10 Years | |
| Initial shares | 1.60 | % | 15.51 | % | 4.67 | % |
| Service shares | 1.32 | % | 15.21 | % | 4.42 | % |
| Russell 2000 Index | 4.89 | % | 15.55 | % | 7.77 | % |
† Source: Lipper Inc.
Past performance is not predictive of future performance.The fund’s performance shown in the graph and table does not reflect the deduction of taxes that a shareholder would pay on fund distributions or the redemption of fund shares.
The fund’s performance does not reflect the deduction of additional charges and expenses imposed in connection with investing in variable insurance contracts which will reduce returns.
The above graph compares a $10,000 investment made in Initial and Service shares of Dreyfus Variable Investment Fund, Opportunistic Small Cap Portfolio on 12/31/04 to a $10,000 investment made in the Russell 2000 Index (the “Index”) on that date.
6
The fund’s Initial shares are not subject to a Rule 12b-1 fee.The fund’s Service shares are subject to a 0.25% annual Rule 12b-1 fee. All dividends and capital gain distributions are reinvested.
The fund’s performance shown in the line graph above takes into account all applicable fund fees and expenses for Initial and Service shares.The Index is an unmanaged index and is composed of the 2,000 smallest companies in the Russell 3000 Index.The Russell 3000 Index is composed of 3,000 of the largest U.S. companies by market capitalization. Unlike a mutual fund, the Index is not subject to charges, fees and other expenses. Investors cannot invest directly in any index. Further information relating to fund performance, including expense reimbursements, if applicable, is contained in the Financial Highlights section of the prospectus and elsewhere in this report.
The Fund 7
UNDERSTANDING YOUR FUND’S EXPENSES (Unaudited)
As a mutual fund investor, you pay ongoing expenses, such as management fees and other expenses. Using the information below, you can estimate how these expenses affect your investment and compare them with the expenses of other funds.You also may pay one-time transaction expenses, including sales charges (loads), redemption fees and expenses associated with variable annuity or insurance contracts, which are not shown in this section and would have resulted in higher total expenses. For more information, see your fund’s prospectus or talk to your financial adviser.
Review your fund’s expenses
The table below shows the expenses you would have paid on a $1,000 investment in DreyfusVariable Investment Fund, Opportunistic Small Cap Portfolio from July 1, 2014 to December 31, 2014. It also shows how much a $1,000 investment would be worth at the close of the period, assuming actual returns and expenses.
Expenses and Value of a $1,000 Investment
assuming actual returns for the six months ended December 31, 2014
| | | | |
| | | Initial Shares | | Service Shares |
| Expenses paid per $1,000† | | $4.16 | | $5.41 |
| Ending value (after expenses) | | $988.60 | | $987.30 |
COMPARING YOUR FUND’S EXPENSES
WITH THOSE OF OTHER FUNDS (Unaudited)
Using the SEC’s method to compare expenses
The Securities and Exchange Commission (SEC) has established guidelines to help investors assess fund expenses. Per these guidelines, the table below shows your fund’s expenses based on a $1,000 investment, assuming a hypothetical 5% annualized return. You can use this information to compare the ongoing expenses (but not transaction expenses or total cost) of investing in the fund with those of other funds. All mutual fund shareholder reports will provide this information to help you make this comparison. Please note that you cannot use this information to estimate your actual ending account balance and expenses paid during the period.
Expenses and Value of a $1,000 Investment
assuming a hypothetical 5% annualized return for the six months ended December 31, 2014
| | | | |
| | | Initial Shares | | Service Shares |
| Expenses paid per $1,000† | | $4.23 | | $5.50 |
| Ending value (after expenses) | | $1,021.02 | | $1,019.76 |
|
| † Expenses are equal to the fund’s annualized expense ratio of .83% for Initial shares and 1.08% for Service shares, |
| multiplied by the average account value over the period, multiplied by 184/365 (to reflect the one-half year period). |
8
STATEMENT OF INVESTMENTS
December 31, 2014
| | | |
| Common Stocks—98.4% | Shares | | Value ($) |
| Automobiles & Components—2.3% | | | |
| Dana Holding | 117,124 | | 2,546,276 |
| Winnebago Industries | 82,677 | | 1,799,051 |
| | | | 4,345,327 |
| Banks—13.9% | | | |
| Columbia Banking System | 71,196 | | 1,965,721 |
| CVB Financial | 81,124 | | 1,299,606 |
| EverBank Financial | 336,182 | | 6,407,629 |
| Ladder Capital, Cl. A | 114,133 | a | 2,238,148 |
| Sandy Spring Bancorp | 41,095 | | 1,071,758 |
| South State | 43,109 | | 2,891,752 |
| SVB Financial Group | 60,721 | a | 7,047,886 |
| UMB Financial | 38,677 | | 2,200,335 |
| WesBanco | 31,310 | | 1,089,588 |
| | | | 26,212,423 |
| Capital Goods—4.8% | | | |
| Altra Industrial Motion | 32,374 | | 919,098 |
| Encore Wire | 12,950 | | 483,423 |
| Generac Holdings | 63,378 | a,b | 2,963,555 |
| L.B. Foster, Cl. A | 15,972 | | 775,760 |
| Thermon Group Holdings | 162,479 | a | 3,930,367 |
| | | | 9,072,203 |
| Commercial & Professional Services—10.6% | | | |
| Herman Miller | 41,406 | | 1,218,579 |
| HNI | 50,965 | | 2,602,273 |
| Interface | 116,245 | | 1,914,555 |
| Knoll | 86,707 | | 1,835,587 |
| Korn/Ferry International | 101,835 | a | 2,928,775 |
| Steelcase, Cl. A | 332,757 | | 5,972,988 |
| TrueBlue | 158,135 | a | 3,518,504 |
| | | | 19,991,261 |
| Consumer Services—4.6% | | | |
| Apollo Education Group | 132,924 | a | 4,534,038 |
| LifeLock | 224,927 | a | 4,163,399 |
| | | | 8,697,437 |
The Fund 9
STATEMENT OF INVESTMENTS (continued)
| | | |
| Common Stocks (continued) | Shares | | Value ($) |
| Diversified Financials—5.3% | | | |
| FNFV Group | 61,671 | a | 970,701 |
| FXCM, Cl. A | 71,858 | | 1,190,687 |
| Nelnet, Cl. A | 21,496 | | 995,910 |
| Raymond James Financial | 66,995 | | 3,838,144 |
| SLM | 294,482 | | 3,000,772 |
| | | | 9,996,214 |
| Energy—1.3% | | | |
| Western Refining | 67,368 | | 2,545,163 |
| Exchange-Traded Funds—.5% | | | |
| iShares Russell 2000 ETF | 7,339 | | 877,891 |
| Health Care Equipment & Services—.5% | | | |
| Analogic | 11,491 | | 972,253 |
| Insurance—.4% | | | |
| Stewart Information Services | 19,022 | | 704,575 |
| Materials—8.2% | | | |
| AuRico Gold | 652,025 | | 2,138,642 |
| Chemtura | 197,531 | a | 4,884,942 |
| New Gold | 530,038 | a | 2,279,163 |
| OMNOVA Solutions | 281,244 | a | 2,289,326 |
| Royal Gold | 21,525 | | 1,349,618 |
| Trinseo | 93,322 | a | 1,628,469 |
| Yamana Gold | 239,016 | | 960,844 |
| | | | 15,531,004 |
| Media—1.8% | | | |
| Media General | 135,110 | a,b | 2,260,395 |
| Meredith | 10,271 | | 557,921 |
| Nexstar Broadcasting Group, Cl. A | 10,635 | | 550,787 |
| | | | 3,369,103 |
| Pharmaceuticals, Biotech & Life Sciences—7.3% | | | |
| Emergent BioSolutions | 232,553 | a | 6,332,418 |
| GW Pharmaceuticals, ADR | 6,158 | a | 416,773 |
| Revance Therapeutics | 85,374 | | 1,446,236 |
| Sangamo BioSciences | 113,585 | a | 1,727,628 |
| TherapeuticsMD | 853,518 | a,b | 3,798,155 |
| | | | 13,721,210 |
10
| | | |
| Common Stocks (continued) | Shares | | Value ($) |
| Real Estate—1.0% | | | |
| Realogy Holdings | 43,626 | a | 1,940,921 |
| Retailing—4.4% | | | |
| Office Depot | 967,729 | a | 8,298,276 |
| Semiconductors & Semiconductor | | | |
| Equipment—8.3% | | | |
| Applied Micro Circuits | 393,421 | a | 2,565,105 |
| Lattice Semiconductor | 330,426 | a | 2,276,635 |
| Mellanox Technologies | 97,442 | a | 4,163,697 |
| Microsemi | 92,606 | a | 2,628,158 |
| Veeco Instruments | 116,117 | a | 4,050,161 |
| | | | 15,683,756 |
| Software & Services—10.3% | | | |
| Cardtronics | 61,987 | a | 2,391,458 |
| CoreLogic | 124,147 | a | 3,921,804 |
| CSG Systems International | 101,135 | | 2,535,454 |
| Dealertrack Technologies | 107,558 | a | 4,765,895 |
| DST Systems | 6,907 | | 650,294 |
| Infoblox | 210,826 | a | 4,260,793 |
| Tableau Software, Cl. A | 11,134 | a | 943,718 |
| | | | 19,469,416 |
| Technology Hardware & | | | |
| Equipment—12.4% | | | |
| Arrow Electronics | 67,684 | a | 3,918,227 |
| Belden | 14,735 | | 1,161,265 |
| Ciena | 162,375 | a,b | 3,151,699 |
| Jabil Circuit | 239,545 | | 5,229,267 |
| JDS Uniphase | 335,662 | a | 4,605,283 |
| ScanSource | 74,672 | a | 2,998,827 |
| Tech Data | 24,087 | a | 1,523,021 |
| Universal Display | 26,648 | a,b | 739,482 |
| | | | 23,327,071 |
| Transportation—.5% | | | |
| ArcBest | 19,453 | | 902,036 |
| Total Common Stocks | | | |
| (cost $157,538,088) | | | 185,657,540 |
The Fund 11
STATEMENT OF INVESTMENTS (continued)
| | | | |
| Other Investment—.8% | Shares | | Value ($) | |
| Registered Investment Company; | | | | |
| Dreyfus Institutional Preferred | | | | |
| Plus Money Market Fund | | | | |
| (cost $1,512,119) | 1,512,119 | c | 1,512,119 | |
| |
| Investment of Cash Collateral | | | | |
| for Securities Loaned—2.7% | | | | |
| Registered Investment Company; | | | | |
| Dreyfus Institutional Cash Advantage Fund | | | | |
| (cost $5,164,901) | 5,164,901 | c | 5,164,901 | |
| |
| Total Investments (cost $164,215,108) | 101.9 | % | 192,334,560 | |
| Liabilities, Less Cash and Receivables | (1.9 | %) | (3,670,625 | ) |
| Net Assets | 100.0 | % | 188,663,935 | |
ADR—American Depository Receipts
ETF—Exchange-Traded Fund
|
| a Non-income producing security. |
| b Security, or portion thereof, on loan.At December 31, 2014, the value of the fund’s securities on loan was |
| $4,380,502 and the value of the collateral held by the fund was $5,164,901. |
| c Investment in affiliated money market mutual fund. |
| | | |
| Portfolio Summary (Unaudited)† | | |
| |
| | Value (%) | | Value (%) |
| Banks | 13.9 | Retailing | 4.4 |
| Technology Hardware & Equipment | 12.4 | Money Market Investments | 3.5 |
| Commercial & Professional Services | 10.6 | Automobiles & Components | 2.3 |
| Software & Services | 10.3 | Media | 1.8 |
| Semiconductors & | | Energy | 1.3 |
| Semiconductor Equipment | 8.3 | Real Estate | 1.0 |
| Materials | 8.2 | Exchange-Traded Funds | .5 |
| Pharmaceuticals, | | Health Care Equipment & Services | .5 |
| Biotech & Life Sciences | 7.3 | Transportation | .5 |
| Diversified Financials | 5.3 | Insurance | .4 |
| Capital Goods | 4.8 | | |
| Consumer Services | 4.6 | | 101.9 |
| |
| † Based on net assets. | | | |
| See notes to financial statements. | | | |
12
STATEMENT OF ASSETS AND LIABILITIES
December 31, 2014
| | |
| | Cost | Value |
| Assets ($): | | |
| Investments in securities—See Statement of Investments (including | | |
| securities on loan, valued at $4,380,502)—Note 1(b): | | |
| Unaffiliated issuers | 157,538,088 | 185,657,540 |
| Affiliated issuers | 6,677,020 | 6,677,020 |
| Cash | | 489,795 |
| Receivable for investment securities sold | | 1,622,099 |
| Dividends and securities lending income receivable | | 95,485 |
| Prepaid expenses | | 3,314 |
| | | 194,545,253 |
| Liabilities ($): | | |
| Due to The Dreyfus Corporation and affiliates—Note 3(b) | | 139,144 |
| Liability for securities on loan—Note 1(b) | | 5,164,901 |
| Payable for investment securities purchased | | 414,661 |
| Payable for shares of Beneficial Interest redeemed | | 92,634 |
| Accrued expenses | | 69,978 |
| | | 5,881,318 |
| Net Assets ($) | | 188,663,935 |
| Composition of Net Assets ($): | | |
| Paid-in capital | | 157,886,718 |
| Accumulated net realized gain (loss) on investments | | 2,657,765 |
| Accumulated net unrealized appreciation | | |
| (depreciation) on investments | | 28,119,452 |
| Net Assets ($) | | 188,663,935 |
| |
| |
| Net Asset Value Per Share | | |
| | Initial Shares | Service Shares |
| Net Assets ($) | 170,569,882 | 18,094,053 |
| Shares Outstanding | 3,570,172 | 387,060 |
| Net Asset Value Per Share ($) | 47.78 | 46.75 |
| |
| See notes to financial statements. | | |
The Fund 13
STATEMENT OF OPERATIONS
Year Ended December 31, 2014
| | |
| Investment Income ($): | | |
| Income: | | |
| Cash dividends (net of $1,480 foreign taxes withheld at source): | | |
| Unaffiliated issuers | 1,431,200 | |
| Affiliated issuers | 1,372 | |
| Income from securities lending—Note 1(b) | 109,411 | |
| Total Income | 1,541,983 | |
| Expenses: | | |
| Investment advisory fee—Note 3(a) | 1,446,287 | |
| Professional fees | 62,063 | |
| Distribution fees—Note 3(b) | 45,215 | |
| Custodian fees—Note 3(b) | 38,366 | |
| Prospectus and shareholders’ reports | 26,969 | |
| Trustees’ fees and expenses—Note 3(c) | 10,350 | |
| Loan commitment fees—Note 2 | 1,836 | |
| Shareholder servicing costs—Note 3(b) | 1,156 | |
| Interest expense—Note 2 | 549 | |
| Miscellaneous | 15,401 | |
| Total Expenses | 1,648,192 | |
| Less—reduction in fees due to earnings credits—Note 3(b) | (4 | ) |
| Net Expenses | 1,648,188 | |
| Investment (Loss)—Net | (106,205 | ) |
| Realized and Unrealized Gain (Loss) on Investments—Note 4 ($): | | |
| Net realized gain (loss) on investments | 20,642,102 | |
| Net unrealized appreciation (depreciation) on investments | (17,676,537 | ) |
| Net Realized and Unrealized Gain (Loss) on Investments | 2,965,565 | |
| Net Increase in Net Assets Resulting from Operations | 2,859,360 | |
| |
| See notes to financial statements. | | |
14
STATEMENT OF CHANGES IN NET ASSETS
| | | | |
| | Year Ended December 31, | |
| | 2014 | | 2013 | |
| Operations ($): | | | | |
| Investment (loss)—net | (106,205 | ) | (501,775 | ) |
| Net realized gain (loss) on investments | 20,642,102 | | 48,931,199 | |
| Net unrealized appreciation | | | | |
| (depreciation) on investments | (17,676,537 | ) | 30,541,024 | |
| Net Increase (Decrease) in Net Assets | | | | |
| Resulting from Operations | 2,859,360 | | 78,970,448 | |
| Beneficial Interest Transactions ($): | | | | |
| Net proceeds from shares sold: | | | | |
| Initial Shares | 12,156,105 | | 11,920,439 | |
| Service Shares | 1,343,199 | | 2,132,292 | |
| Cost of shares redeemed: | | | | |
| Initial Shares | (32,908,362 | ) | (76,974,354 | ) |
| Service Shares | (3,078,631 | ) | (3,158,122 | ) |
| Increase (Decrease) in Net Assets from | | | | |
| Beneficial Interest Transactions | (22,487,689 | ) | (66,079,745 | ) |
| Total Increase (Decrease) in Net Assets | (19,628,329 | ) | 12,890,703 | |
| Net Assets ($): | | | | |
| Beginning of Period | 208,292,264 | | 195,401,561 | |
| End of Period | 188,663,935 | | 208,292,264 | |
| Capital Share Transactions (Shares): | | | | |
| Initial Shares | | | | |
| Shares sold | 266,416 | | 309,523 | |
| Shares redeemed | (708,339 | ) | (2,024,511 | ) |
| Net Increase (Decrease) in Shares Outstanding | (441,923 | ) | (1,714,988 | ) |
| Service Shares | | | | |
| Shares sold | 29,718 | | 55,811 | |
| Shares redeemed | (67,278 | ) | (83,380 | ) |
| Net Increase (Decrease) in Shares Outstanding | (37,560 | ) | (27,569 | ) |
| See notes to financial statements. | | | | |
The Fund 15
FINANCIAL HIGHLIGHTS
The following tables describe the performance for each share class for the fiscal periods indicated. All information (except portfolio turnover rate) reflects financial results for a single fund share.Total return shows how much your investment in the fund would have increased (or decreased) during each period, assuming you had reinvested all dividends and distributions. The fund’s total returns do not reflect expenses associated with variable annuity or insurance contracts.These figures have been derived from the fund’s financial statements.
| | | | | | | | | | |
| | | | Year Ended December 31, | | | |
| Initial Shares | 2014 | | 2013 | | 2012 | | 2011 | | 2010 | |
| Per Share Data ($): | | | | | | | | | | |
| Net asset value, beginning of period | 47.03 | | 31.66 | | 26.26 | | 30.58 | | 23.49 | |
| Investment Operations: | | | | | | | | | | |
| Investment income (loss)—neta | (.01 | ) | (.09 | ) | (.02 | ) | (.10 | ) | .12 | |
| Net realized and unrealized | | | | | | | | | | |
| gain (loss) on investments | .76 | | 15.46 | | 5.42 | | (4.10 | ) | 7.16 | |
| Total from Investment Operations | .75 | | 15.37 | | 5.40 | | (4.20 | ) | 7.28 | |
| Distributions: | | | | | | | | | | |
| Dividends from investment income—net | — | | — | | — | | (.12 | ) | (.19 | ) |
| Net asset value, end of period | 47.78 | | 47.03 | | 31.66 | | 26.26 | | 30.58 | |
| Total Return (%) | 1.60 | | 48.55 | | 20.56 | | (13.82 | ) | 31.11 | |
| Ratios/Supplemental Data (%): | | | | | | | | | | |
| Ratio of total expenses | | | | | | | | | | |
| to average net assets | .83 | | .93 | | .88 | | .88 | | .86 | |
| Ratio of net expenses | | | | | | | | | | |
| to average net assets | .83 | | .93 | | .88 | | .82 | | .70 | |
| Ratio of net investment income | | | | | | | | | | |
| (loss) to average net assets | (.03 | ) | (.23 | ) | (.05 | ) | (.36 | ) | .46 | |
| Portfolio Turnover Rate | 77.96 | | 84.80 | | 61.38 | | 91.45 | | 192.88 | |
| Net Assets, end of period ($ x 1,000) | 170,570 | | 188,702 | | 181,323 | | 165,656 | | 194,105 | |
| |
| a Based on average shares outstanding. | | | | | | | | | | |
| See notes to financial statements. | | | | | | | | | | |
16
| | | | | | | | | | |
| | | | Year Ended December 31, | | | |
| Service Shares | 2014 | | 2013 | | 2012 | | 2011 | | 2010 | |
| Per Share Data ($): | | | | | | | | | | |
| Net asset value, beginning of period | 46.14 | | 31.13 | | 25.89 | | 30.20 | | 23.24 | |
| Investment Operations: | | | | | | | | | | |
| Investment income (loss)—neta | (.13 | ) | (.18 | ) | (.09 | ) | (.17 | ) | .06 | |
| Net realized and unrealized | | | | | | | | | | |
| gain (loss) on investments | .74 | | 15.19 | | 5.33 | | (4.05 | ) | 7.06 | |
| Total from Investment Operations | .61 | | 15.01 | | 5.24 | | (4.22 | ) | 7.12 | |
| Distributions: | | | | | | | | | | |
| Dividends from investment income—net | — | | — | | — | | (.09 | ) | (.16 | ) |
| Net asset value, end of period | 46.75 | | 46.14 | | 31.13 | | 25.89 | | 30.20 | |
| Total Return (%) | 1.32 | | 48.22 | | 20.24 | | (14.03 | ) | 30.77 | |
| Ratios/Supplemental Data (%): | | | | | | | | | | |
| Ratio of total expenses | | | | | | | | | | |
| to average net assets | 1.08 | | 1.18 | | 1.13 | | 1.13 | | 1.11 | |
| Ratio of net expenses | | | | | | | | | | |
| to average net assets | 1.08 | | 1.18 | | 1.13 | | 1.07 | | .95 | |
| Ratio of net investment income | | | | | | | | | | |
| (loss) to average net assets | (.28 | ) | (.48 | ) | (.30 | ) | (.61 | ) | .22 | |
| Portfolio Turnover Rate | 77.96 | | 84.80 | | 61.38 | | 91.45 | | 192.88 | |
| Net Assets, end of period ($ x 1,000) | 18,094 | | 19,590 | | 14,078 | | 12,902 | | 15,414 | |
| |
| a Based on average shares outstanding. | | | | | | | | | | |
| See notes to financial statements. | | | | | | | | | | |
The Fund 17
NOTES TO FINANCIAL STATEMENTS
NOTE 1—Significant Accounting Policies:
Dreyfus Variable Investment Fund (the “Company”) is registered under the Investment Company Act of 1940, as amended (the “Act”), as an open-end management investment company, operating as a series company currently offering seven series, including the Opportunistic Small Cap Portfolio (the “fund”).The fund is only offered to separate accounts established by insurance companies to fund variable annuity contracts and variable life insurance policies. The fund is a diversified series. The fund’s investment objective is to seek capital growth. The Dreyfus Corporation (the “Manager” or “Dreyfus”), a wholly-owned subsidiary of The Bank of New York Mellon Corporation (“BNY Mellon”), serves as the fund’s investment adviser.
MBSC Securities Corporation (the “Distributor”), a wholly-owned subsidiary of the Manager, is the distributor of the fund’s shares, which are sold without a sales charge. The fund is authorized to issue an unlimited number of $.001 par value shares of Beneficial Interest in each of the following classes of shares: Initial and Service. Each class of shares has identical rights and privileges, except with respect to the Distribution Plan and the expenses borne by each class, the allocation of certain transfer agency costs, and certain voting rights. Income, expenses (other than expenses attributable to a specific class), and realized and unrealized gains or losses on investments are allocated to each class of shares based on its relative net assets.
The Company accounts separately for the assets, liabilities and operations of each series. Expenses directly attributable to each series are charged to that series’ operations; expenses which are applicable to all series are allocated among them on a pro rata basis.
The Financial Accounting Standards Board (“FASB”) Accounting Standards Codification (“ASC”) is the exclusive reference of authoritative U.S. generally accepted accounting principles (“GAAP”) recognized by the FASB to be applied by nongovernmental entities. Rules and interpretive releases of the Securities and Exchange Commission (“SEC”) under authority of federal laws are also sources of authoritative GAAP for
18
SEC registrants. The fund’s financial statements are prepared in accordance with GAAP, which may require the use of management estimates and assumptions. Actual results could differ from those estimates.
The Company enters into contracts that contain a variety of indemnifications. The fund’s maximum exposure under these arrangements is unknown.The fund does not anticipate recognizing any loss related to these arrangements.
(a) Portfolio valuation: The fair value of a financial instrument is the amount that would be received to sell an asset or paid to transfer a liability in an orderly transaction between market participants at the measurement date (i.e., the exit price). GAAP establishes a fair value hierarchy that prioritizes the inputs of valuation techniques used to measure fair value. This hierarchy gives the highest priority to unadjusted quoted prices in active markets for identical assets or liabilities (Level 1 measurements) and the lowest priority to unobservable inputs (Level 3 measurements).
Additionally, GAAP provides guidance on determining whether the volume and activity in a market has decreased significantly and whether such a decrease in activity results in transactions that are not orderly. GAAP requires enhanced disclosures around valuation inputs and techniques used during annual and interim periods.
Various inputs are used in determining the value of the fund’s investments relating to fair value measurements.These inputs are summarized in the three broad levels listed below:
Level 1—unadjusted quoted prices in active markets for identical investments.
Level 2—other significant observable inputs (including quoted prices for similar investments, interest rates, prepayment speeds, credit risk, etc.).
Level 3—significant unobservable inputs (including the fund’s own assumptions in determining the fair value of investments).
The Fund 19
NOTES TO FINANCIAL STATEMENTS (continued)
The inputs or methodology used for valuing securities are not necessarily an indication of the risk associated with investing in those securities.
Changes in valuation techniques may result in transfers in or out of an assigned level within the disclosure hierarchy. Valuation techniques used to value the fund’s investments are as follows:
Investments in securities are valued at the last sales price on the securities exchange or national securities market on which such securities are primarily traded. Securities listed on the National Market System for which market quotations are available are valued at the official closing price or, if there is no official closing price that day, at the last sales price. For open short positions, asked prices are used for valuation purposes. Bid price is used when no asked price is available. Registered investment companies that are not traded on an exchange are valued at their net asset value.All of the preceding securities are generally categorized within Level 1 of the fair value hierarchy.
Securities not listed on an exchange or the national securities market, or securities for which there were no transactions, are valued at the average of the most recent bid and asked prices. These securities are generally categorized within Level 2 of the fair value hierarchy.
Fair valuing of securities may be determined with the assistance of a pricing service using calculations based on indices of domestic securities and other appropriate indicators, such as prices of relevant ADRs and financial futures. Utilizing these techniques may result in transfers between Level 1 and Level 2 of the fair value hierarchy.
When market quotations or official closing prices are not readily available, or are determined not to reflect accurately fair value, such as when the value of a security has been significantly affected by events after the close of the exchange or market on which the security is principally traded (for example, a foreign exchange or market), but before the fund calculates its net asset value, the fund may value these investments at fair value as determined in accordance with the procedures approved by the Company’s Board of Trustees (the “Board”). Certain factors may be considered when fair valuing investments such
20
as: fundamental analytical data, the nature and duration of restrictions on disposition, an evaluation of the forces that influence the market in which the securities are purchased and sold, and public trading in similar securities of the issuer or comparable issuers. These securities are either categorized within Level 2 or 3 of the fair value hierarchy depending on the relevant inputs used.
For restricted securities where observable inputs are limited, assumptions about market activity and risk are used and are generally categorized within Level 3 of the fair value hierarchy.
The following is a summary of the inputs used as of December 31, 2014 in valuing the fund's investments:
| | | | |
| | | Level 2—Other | Level 3— | |
| | Level 1— | Significant | Significant | |
| | Unadjusted | Observable | Unobservable | |
| | Quoted Prices | Inputs | Inputs | Total |
| Assets ($) | | | | |
| Investments in Securities: | | | |
| Equity Securities— | | | | |
| Domestic | | | | |
| Common Stocks† | 178,984,227 | — | — | 178,984,227 |
| Equity Securities— | | | | |
| Foreign | | | | |
| Common Stocks† | 5,795,422 | — | — | 5,795,422 |
| Exchange-Traded | | | | |
| Funds | 877,891 | — | — | 877,891 |
| Mutual Funds | 6,677,020 | — | — | 6,677,020 |
| |
| † See Statement of Investments for additional detailed categorizations. | |
At December 31, 2014, there were no transfers between Level 1 and Level 2 of the fair value hierarchy.
(b) Securities transactions and investment income: Securities transactions are recorded on a trade date basis. Realized gains and losses from securities transactions are recorded on the identified cost basis. Dividend income is recognized on the ex-dividend date and interest income, including, where applicable, accretion of discount and amortization of premium on investments, is recognized on the accrual basis.
The Fund 21
NOTES TO FINANCIAL STATEMENTS (continued)
Pursuant to a securities lending agreement with The Bank of New York Mellon, a subsidiary of BNY Mellon and an affiliate of Dreyfus, the fund may lend securities to qualified institutions. It is the fund’s policy that, at origination, all loans are secured by collateral of at least 102% of the value of U.S. securities loaned and 105% of the value of foreign securities loaned. Collateral equivalent to at least 100% of the market value of securities on loan is maintained at all times. Collateral is either in the form of cash, which can be invested in certain money market mutual funds managed by the Manager or U.S. Government and Agency securities. The fund is entitled to receive all dividends, interest and distributions on securities loaned, in addition to income earned as a result of the lending transaction. Should a borrower fail to return the securities in a timely manner, The Bank of New York Mellon is required to replace the securities for the benefit of the fund or credit the fund with the market value of the unreturned securities and is subrogated to the fund’s rights against the borrower and the collateral. During the period ended December 31, 2014, The Bank of New York Mellon earned $29,435 from lending portfolio securities, pursuant to the securities lending agreement.
(c) Affiliated issuers: Investments in other investment companies advised by Dreyfus are defined as “affiliated” under the Act. Investments in affiliated investment companies during the period ended December 31, 2014 were as follows:
| | | | | |
| Affiliated | | | | | |
| Investment | Value | | | Value | Net |
| Company | 12/31/2013 ($) | Purchases ($) | Sales ($) | 12/31/2014 ($) | Assets (%) |
| Dreyfus | | | | | |
| Institutional | | | | | |
| Preferred | | | | | |
| Plus Money | | | | | |
| Market Fund | 2,841,343 | 62,180,234 | 63,509,458 | 1,512,119 | .8 |
| Dreyfus | | | | | |
| Institutional | | | | | |
| Cash | | | | | |
| Advantage | | | | | |
| Fund | 13,822,960 | 155,263,956 | 163,922,015 | 5,164,901 | 2.7 |
| Total | 16,664,303 | 217,444,190 | 227,431,473 | 6,677,020 | 3.5 |
22
(d) Dividends to shareholders: Dividends are recorded on the ex-dividend date. Dividends from investment income-net and dividends from net realized capital gains, if any, are normally declared and paid annually, but the fund may make distributions on a more frequent basis to comply with the distribution requirements of the Internal Revenue Code of 1986, as amended (the “Code”). To the extent that net realized capital gains can be offset by capital loss carryovers, it is the policy of the fund not to distribute such gains. Income and capital gain distributions are determined in accordance with income tax regulations, which may differ from GAAP.
(e) Federal income taxes: It is the policy of the fund to continue to qualify as a regulated investment company, if such qualification is in the best interests of its shareholders, by complying with the applicable provisions of the Code, and to make distributions of taxable income sufficient to relieve it from substantially all federal income and excise taxes.
As of and during the period ended December 31, 2014, the fund did not have any liabilities for any uncertain tax positions. The fund recognizes interest and penalties, if any, related to uncertain tax positions as income tax expense in the Statement of Operations. During the period ended December 31, 2014, the fund did not incur any interest or penalties.
Each tax year in the four-year period ended December 31, 2014 remains subject to examination by the Internal Revenue Service and state taxing authorities.
At December 31, 2014, the components of accumulated earnings on a tax basis were as follows: undistributed capital gains $2,780,577 and unrealized appreciation $27,996,640.
During the period ended December 31, 2014, as a result of permanent book to tax differences, primarily due to the tax treatment for net operating losses, the fund increased accumulated undistributed invest-
The Fund 23
NOTES TO FINANCIAL STATEMENTS (continued)
ment income-net by $106,205 and decreased paid-in capital by the same amount. Net assets and net asset value per share were not affected by this reclassification.
NOTE 2—Bank Lines of Credit:
The fund participates with other Dreyfus-managed funds in a $430 million unsecured credit facility led by Citibank, N.A. and a $300 million unsecured credit facility provided by The Bank of New York Mellon (each, a “Facility”), each to be utilized primarily for temporary or emergency purposes, including the financing of redemptions. Prior to October 8, 2014, the unsecured credit facility with Citibank, N.A. was $265 million. In connection therewith, the fund has agreed to pay its pro rata portion of commitment fees for each Facility. Interest is charged to the fund based on rates determined pursuant to the terms of the respective Facility at the time of borrowing.
The average amount of borrowings outstanding under the Facilities during the period ended December 31, 2014 was approximately $50,400 with a related weighted average annualized interest rate of 1.09%.
NOTE 3—Investment Advisory Fee and Other Transactions with Affiliates:
(a) Pursuant to an investment advisory agreement with the Manager, the investment advisory fee is computed at the annual rate of .75% of the value of the fund’s average daily net assets and is payable monthly.
(b) Under the Distribution Plan adopted pursuant to Rule 12b-1 under the Act, Service shares pay the Distributor for distributing its shares, for servicing and/or maintaining Service shares’ shareholder accounts and for advertising and marketing for Service shares. The Distribution Plan provides for payments to be made at an annual rate of .25% of the value of the Service shares’ average daily net assets.The Distributor may make payments to Participating Insurance Companies and to brokers and dealers acting as principal underwriter for their variable insurance products. The fees payable under the Distribution
24
Plan are payable without regard to actual expenses incurred. During the period ended December 31, 2014, Service shares were charged $45,215 pursuant to the Distribution Plan.
The fund has arrangements with the transfer agent and the custodian whereby the fund may receive earnings credits when positive cash balances are maintained, which are used to offset transfer agency and custody fees. For financial reporting purposes, the fund includes net earnings credits as an expense offset in the Statement of Operations.
The fund compensates Dreyfus Transfer, Inc., a wholly-owned subsidiary of the Manager, under a transfer agency agreement for providing transfer agency and cash management services for the fund. The majority of transfer agency fees are comprised of amounts paid on a per account basis, while cash management fees are related to fund subscriptions and redemptions. During the period ended December 31, 2014, the fund was charged $961 for transfer agency services and $72 for cash management services.These fees are included in Shareholder servicing costs in the Statement of Operations. Cash management fees were partially offset by earnings credits of $4.
The fund compensates The Bank of NewYork Mellon under a custody agreement for providing custodial services for the fund.These fees are determined based on net assets, geographic region and transaction activity. During the period ended December 31, 2014, the fund was charged $38,366 pursuant to the custody agreement.
During the period ended December 31, 2014, the fund was charged $7,771 for services performed by the Chief Compliance Officer and his staff.
The components of “Due to The Dreyfus Corporation and affiliates” in the Statement of Assets and Liabilities consist of: investment advisory fees $118,020, Distribution Plan fees $3,775, custodian fees $15,300, Chief Compliance Officer fees $1,851 and transfer agency fees $198.
The Fund 25
NOTES TO FINANCIAL STATEMENTS (continued)
(c) Each Board member also serves as a Board member of other funds within the Dreyfus complex. Annual retainer fees and attendance fees are allocated to each fund based on net assets.
NOTE 4—Securities Transactions:
The aggregate amount of purchases and sales of investment securities, excluding short-term securities, during the period ended December 31, 2014, amounted to $149,530,674 and $172,544,948, respectively.
At December 31, 2014, the cost of investments for federal income tax purposes was $164,337,920; accordingly, accumulated net unrealized appreciation on investments was $27,996,640, consisting of $32,018,858 gross unrealized appreciation and $4,022,218 gross unrealized depreciation.
26
REPORT OF INDEPENDENT REGISTERED
PUBLIC ACCOUNTING FIRM
Shareholders and Board of Trustees
Dreyfus Variable Investment Fund,
Opportunistic Small Cap Portfolio
We have audited the accompanying statement of assets and liabilities, including the statement of investments, of Dreyfus Variable Investment Fund, Opportunistic Small Cap Portfolio (one of the series comprising Dreyfus Variable Investment Fund) as of December 31, 2014, and the related statement of operations for the year then ended, the statement of changes in net assets for each of the two years in the period then ended, and the financial highlights for each of the five years in the period then ended.These financial statements and financial highlights are the responsibility of the Fund’s management. Our responsibility is to express an opinion on these financial statements and financial highlights based on our audits.
We conducted our audits in accordance with the standards of the Public Company Accounting Oversight Board (United States). Those standards require that we plan and perform the audit to obtain reasonable assurance about whether the financial statements and financial highlights are free of material misstatement. We were not engaged to perform an audit of the Fund’s internal control over financial reporting. Our audits included consideration of internal control over financial reporting as a basis for designing audit procedures that are appropriate in the circumstances, but not for the purpose of expressing an opinion on the effectiveness of the Fund’s internal control over financial reporting. Accordingly, we express no such opinion. An audit also includes examining, on a test basis, evidence supporting the amounts and disclosures in the financial statements and financial highlights, assessing the accounting principles used and significant estimates made by management, and evaluating the overall financial statement presentation. Our procedures included confirmation of securities owned as of December 31, 2014 by correspondence with the custodian and others.We believe that our audits provide a reasonable basis for our opinion.
In our opinion, the financial statements and financial highlights referred to above present fairly, in all material respects, the financial position of Dreyfus Variable Investment Fund, Opportunistic Small Cap Portfolio at December 31, 2014, the results of its operations for the year then ended, the changes in its net assets for each of the two years in the period then ended, and the financial highlights for each of the five years in the period then ended, in conformity with U.S. generally accepted accounting principles.

New York, New York
February 11, 2015
The Fund 27
BOARD MEMBERS INFORMATION (Unaudited)
INDEPENDENT BOARD MEMBERS
|
| Joseph S. DiMartino (71) |
| Chairman of the Board (1995) |
| Principal Occupation During Past 5Years: |
| • Corporate Director and Trustee (1995-present) |
| Other Public Company Board Memberships During Past 5Years: |
| • CBIZ (formerly, Century Business Services, Inc.), a provider of outsourcing functions for small |
| and medium size companies, Director (1997-present) |
| • The Newark Group, a provider of a national market of paper recovery facilities, paperboard |
| mills and paperboard converting plants, Director (2000-2010) |
| • Sunair Services Corporation, a provider of certain outdoor-related services to homes and |
| businesses, Director (2005-2009) |
| No. of Portfolios for which Board Member Serves: 146 |
| ——————— |
| Peggy C. Davis (71) |
| Board Member (2006) |
| Principal Occupation During Past 5Years: |
| • Shad Professor of Law, New York University School of Law (1983-present) |
| No. of Portfolios for which Board Member Serves: 52 |
| ——————— |
| David P. Feldman (75) |
| Board Member (1994) |
| Principal Occupation During Past 5Years: |
| • Corporate Director and Trustee (1985-present) |
| Other Public Company Board Membership During Past 5Years: |
| • BBH Mutual Funds Group (5 registered mutual funds), Director (1992-present) |
| No. of Portfolios for which Board Member Serves: 38 |
| ——————— |
| Ehud Houminer (74) |
| Board Member (2006) |
| Principal Occupation During Past 5Years: |
| • Executive-in-Residence at the Columbia Business School, Columbia University (1992-present) |
| Other Public Company Board Membership During Past 5Years: |
| • Avnet, Inc., an electronics distributor, Director (1993-2012) |
| No. of Portfolios for which Board Member Serves: 62 |
28
Lynn Martin (75)
Board Member (2012)
|
| Principal Occupation During Past 5Years: |
| • President, of The Martin Hall Group LLC, a human resources consulting firm (2005-2012) |
| Other Public Company Board Memberships During Past 5Years: |
| • AT&T, Inc., a telecommunications company, Director (1999-2012) |
| • Ryder System, Inc., a supply chain and transportation management company, Director (1993-2012) |
| • The Proctor & Gamble Co., a consumer products company, Director (1994-2009) |
| • Constellation Energy Group, Inc., Director (2003-2009) |
| No. of Portfolios for which Board Member Serves: 38 |
| |
| ——————— |
| Robin A. Melvin (51) |
| Board Member (2012) |
| Principal Occupation During Past 5Years: |
| • Board Member, Illinois Mentoring Partnership, non-profit organization dedicated to increasing |
| the quantity and quality of mentoring services in Illinois (2013-present) |
| • Director, Boisi Family Foundation, a private family foundation that supports youth-serving orga- |
| nizations that promote the self sufficiency of youth from disadvantaged circumstances (1995-2012) |
| No. of Portfolios for which Board Member Serves: 114 |
| |
| ——————— |
| Dr. Martin Peretz (75) |
| Board Member (1990) |
| Principal Occupation During Past 5Years: |
| • Editor-in-Chief Emeritus of The New Republic Magazine (2010-2011) (previously, |
| Editor-in-Chief, 1974-2010) |
| • Director of TheStreet.com, a financial information service on the web (1996-2010) |
| No. of Portfolios for which Board Member Serves: 38 |
| |
| ——————— |
| Once elected all Board Members serve for an indefinite term, but achieve Emeritus status upon reaching age 80.The |
| address of the Board Members and Officers is c/o The Dreyfus Corporation, 200 Park Avenue, NewYork, NewYork |
| 10166.Additional information about the Board Members is available in the fund’s Statement of Additional Information |
| which can be obtained from Dreyfus free of charge by calling this toll free number: 1-800-DREYFUS. |
| James F. Henry, Emeritus Board Member |
| Rosalind G. Jacobs, Emeritus Board Member |
| Dr. Paul A. Marks, Emeritus Board Member |
| Philip L.Toia, Emeritus Board Member |
The Fund 29
OFFICERS OF THE FUND (Unaudited)
30

The Fund 31
For More Information

Telephone 1-800-554-4611 or 1-516-338-3300
Mail The Dreyfus Family of Funds, 144 Glenn Curtiss Boulevard, Uniondale, NY 11556-0144
Attn: Investments Division
The fund files its complete schedule of portfolio holdings with the Securities and Exchange Commission (“SEC”) for the first and third quarters of each fiscal year on Form N-Q. The fund’s Forms N-Q are available on the SEC’s website at http://www.sec.gov and may be reviewed and copied at the SEC’s Public Reference Room in Washington, DC. Information on the operation of the Public Reference Room may be obtained by calling 1-800-SEC-0330.
A description of the policies and procedures that the fund uses to determine how to vote proxies relating to portfolio securities, and information regarding how the fund voted these proxies for the most recent 12-month period ended June 30 is available at http://www.dreyfus.com and on the SEC’s website at http://www.sec.gov. The description of the policies and procedures is also available without charge, upon request, by calling 1-800-DREYFUS.

|
| Dreyfus Variable |
| Investment Fund, |
| Quality Bond Portfolio |

The views expressed in this report reflect those of the portfolio manager only through the end of the period covered and do not necessarily represent the views of Dreyfus or any other person in the Dreyfus organization. Any such views are subject to change at any time based upon market or other conditions and Dreyfus disclaims any responsibility to update such views.These views may not be relied on as investment advice and, because investment decisions for a Dreyfus fund are based on numerous factors, may not be relied on as an indication of trading intent on behalf of any Dreyfus fund.

| | Contents |
| | THE FUND |
| 2 | A Letter from the President |
| 3 | Discussion of Fund Performance |
| 6 | Fund Performance |
| 8 | Understanding Your Fund’s Expenses |
| 8 | Comparing Your Fund’s Expenses With Those of Other Funds |
| 9 | Statement of Investments |
| 20 | Statement of Financial Futures |
| 21 | Statement of Assets and Liabilities |
| 22 | Statement of Operations |
| 23 | Statement of Changes in Net Assets |
| 25 | Financial Highlights |
| 27 | Notes to Financial Statements |
| 43 | Report of Independent Registered Public Accounting Firm |
| 44 | Board Members Information |
| 46 | Officers of the Fund |
| | FOR MORE INFORMATION |
| | Back Cover |
Dreyfus Variable Investment Fund,
Quality Bond Portfolio
The Fund
A LETTER FROM THE PRESIDENT
Dear Shareholder:
We are pleased to present this annual report for Dreyfus Variable Investment Fund, Quality Bond Portfolio, covering the 12-month period from January 1, 2014, through December 31, 2014. For information about how the fund performed during the reporting period, as well as general market perspectives, we provide a Discussion of Fund Performance on the pages that follow.
Long-term interest rates fell unexpectedly in the midst of a sustained economic recovery in 2014, driven downward by robust demand from investors seeking relatively safe havens in the midst of disappointing global growth and intensifying geopolitical conflicts. In contrast to sluggish global economic conditions, the U.S. economic recovery gained traction as evidenced by falling unemployment, rising consumer spending, and higher levels of capital spending by businesses. Nonetheless, short-term rates and money market yields remained steady throughout the year, anchored near historical lows by an unchanged federal funds rate.
Many economists appear to be optimistic about economic prospects for 2015. Our own analysts agree and, in light of the ongoing benefits of low interest rates and depressed energy prices, see the potential for a somewhat faster pace of global growth in 2015 than in 2014. U.S. economic growth also seems poised to accelerate, largely due to the fading of drags from tight fiscal policies adopted in the wake of the Great Recession. The Federal Reserve Board has indicated that it may begin to raise short-term interest rates in mid-2015, but rate hikes are likely to be modest and gradual to avoid undermining the recovery. Of course, stronger economic growth could create risks for some asset classes, which is why we urge you to talk regularly with your financial advisor about the potential impact of macroeconomic developments on your investments.
Thank you for your continued confidence and support.

J. Charles Cardona
President
The Dreyfus Corporation
January 15, 2015
2
DISCUSSION OF FUND PERFORMANCE
For the period of January 1, 2014, through December 31, 2014, as provided by David Bowser, CFA, Primary Portfolio Manager
Fund and Market Performance Overview
For the 12-month period ended December 31, 2014, Dreyfus Variable Investment Fund, Quality Bond Portfolio’s Initial shares achieved a total return of 4.79%, and its Service shares achieved a total return of 4.56%.1 The Barclays U.S. Aggregate Bond Index (the “Index”), the fund’s benchmark, achieved a total return of 5.97% for the same period.2
Despite a recovering U.S. economy, renewed global economic uncertainties and supply-and-demand dynamics unexpectedly sent long-term interest rates lower and bond prices higher during 2014. The fund lagged its benchmark, mainly due to a relatively defensive interest-rate strategy.
The Fund’s Investment Approach
The fund seeks to maximize total return consisting of capital appreciation and current income.To pursue this goal, the fund normally invests at least 80% of its net assets in bonds, including corporate bonds, debentures, notes, mortgage-related securities, collateralized mortgage obligations and asset-backed securities, convertible debt obligations, preferred stocks, convertible preferred stocks, municipal obligations, and zero coupon bonds, that, when purchased, are A-rated or better or what we believe are the unrated equivalent, and in securities issued or guaranteed by the U.S. government or its agencies or its instrumentalities.The fund may also invest in fixed income securities rated lower than A (but not lower than B), up to 10% of its net assets in bonds issued by foreign issuers that are denominated in foreign currencies, and up to 20% of its net assets in bonds of foreign issuers whether denominated in U.S. dollars or in a foreign currency.
Technical Factors Drove Market Performance
By the start of 2014, evidence of an accelerating economic recovery and the Federal Reserve Board (the “Fed”)’s decision to gradually reduce its quantitative easing program drove yields of 10-year U.S. Treasury securities above 3%. However, renewed global economic concerns soon caused yields to moderate, and the Fed made clear that
The Fund 3
DISCUSSION OF FUND PERFORMANCE (continued)
short-term interest rates were likely to remain near historically low levels. Meanwhile, harsh winter weather dampened domestic economic activity: U.S. GDP contracted at a 2.1% annualized rate over the first quarter of 2014.
In contrast, economic growth rebounded at a 4.6% annualized rate during the second quarter and an estimated 5.0% annualized rate over the third quarter. Labor markets continued to strengthen, and the Fed continued to taper its bond purchases until the program ended in October. Nonetheless, robust investor demand for a relatively limited supply of U.S. Treasury securities kept yields low. Demand was especially strong from global investors seeking more competitive yields than were available from sovereign bonds in Europe and Japan. Rates fell particularly sharply at the longer end of the market’s maturity spectrum, causing yield differences between short- and long-term bonds to narrow.
Higher yielding bond market sectors—such as lower rated corporate-backed bonds, commercial mortgage-backed securities, and asset-backed securities—generally outperformed U.S. government securities over much of the year as income-oriented investors resumed their reach for more competitive yields. However, a global “flight to quality” during the fourth quarter caused corporate bonds to underperform their long-term, government-issued counterparts for 2014 overall.
Short Duration Dampened Fund Results
We set the fund’s average duration in a relatively defensive position amid widespread expectations that accelerating economic growth would cause long-term bond yields to climb. However, this positioning proved counterproductive when long-term rates fell, preventing the fund from participating more fully in the market’s rally. Our yield curve strategy was more effective, as underweighted exposure to maturities in the two- to 10-year range benefited from narrowing yield differences along the market’s maturity range.
The fund also was undermined to a degree by our asset allocation strategy, which emphasized higher yielding bonds with credit ratings toward the lower end of the investment-grade spectrum.This strategy worked well over much of the year, but the flight to quality during the fourth quarter erased previous performance advantages.
The fund achieved more favorable results through our security selection strategy among corporate securities, which helped to offset sector-wide weakness. Our focus
4
on lower coupon rates among residential mortgage-backed securities also added value, as did holdings of commercial mortgage-backed securities.
At times, the fund employed interest-rate futures contracts and currency forward contracts to establish its duration strategy and hedge against adverse currency fluctuations, respectively.
Strategies for an Improving Economic Environment
The U.S. economic recovery has gained traction despite global headwinds, and the Fed is expected to begin implementing gradual increases in short-term interest rates in 2015. Therefore, we have generally maintained the fund’s mildly short duration posture to guard against the potentially adverse impact of rising rates. We also have retained a slight emphasis on higher yielding market sectors as valuations have become more attractive while credit fundamentals have improved in some industry groups. In our judgment, these are prudent strategies in an expanding U.S. economy.
January 15, 2015
Bond funds are subject generally to interest rate, credit, liquidity, and market risks, to varying degrees, all of which are more fully described in the fund’s prospectus. Generally, all other factors being equal, bond prices are inversely related to interest-rate changes, and rate increases can cause price declines.
Investments in foreign currencies are subject to the risk that those currencies will decline in value relative to the U.S. dollar, or, in the case of hedged positions, that the U.S. dollar will decline relative to the currency being hedged. Each of these risks could increase the fund’s volatility.
High yield bonds are subject to increased credit risk and are considered speculative in terms of the issuer’s perceived ability to continue making interest payments on a timely basis and to repay principal upon maturity.
The fund may use derivative instruments, such as options, futures, and options on futures, forward contracts, swaps (including credit default swaps on corporate bonds and asset-backed securities), options on swaps, and other credit derivatives. A small investment in derivatives could have a potentially large impact on the fund’s performance. The fund is only available as a funding vehicle under variable life insurance policies or variable annuity contracts issued by insurance companies. Individuals may not purchase shares of the fund directly. A variable annuity is an insurance contract issued by an insurance company that enables investors to accumulate assets on a tax-deferred basis for retirement or other long-term goals.The investment objective and policies of Dreyfus Variable Investment Fund, Quality Bond Portfolio made available through insurance products may be similar to other funds managed or advised by Dreyfus. However, the investment results of the fund may be higher or lower than, and may not be comparable to, those of any other Dreyfus fund.
|
| 1 Total return includes reinvestment of dividends and any capital gains paid. Past performance is no guarantee of future |
| results. Share price and investment return fluctuate such that upon redemption fund shares may be worth more or less |
| than their original cost.The fund’s performance does not reflect the deduction of additional charges and expenses |
| imposed in connection with investing in variable insurance contracts, which will reduce returns. |
| 2 SOURCE: LIPPER INC. — Reflects reinvestment of dividends and, where applicable, capital gain distributions. |
| The Barclays U.S.Aggregate Bond Index is a widely accepted, unmanaged total return index of corporate, U.S. |
| government and U.S. government agency debt instruments, mortgage-backed securities, and asset-backed securities with |
| an average maturity of 1-10 years.The Index does not include fees and expenses to which the fund is subject. |
| Investors cannot invest directly in any index. |
The Fund 5
FUND PERFORMANCE

| | | | | | |
| Average Annual Total Returns as of 12/31/14 | | | | | | |
| | 1 | Year | 5 Years | | 10 Years | |
| Initial shares | 4.79 | % | 5.07 | % | 4.55 | % |
| Service shares | 4.56 | % | 4.83 | % | 4.29 | % |
| Barclays U.S. Aggregate Bond Index | 5.97 | % | 4.45 | % | 4.71 | % |
† Source: Lipper Inc.
Past performance is not predictive of future performance.The fund’s performance shown in the graph and table does not reflect the deduction of taxes that a shareholder would pay on fund distributions or the redemption of fund shares.
The fund’s performance does not reflect the deduction of additional charges and expenses imposed in connection with investing in variable insurance contracts which will reduce returns.
The above graph compares a $10,000 investment made in Initial and Service shares of Dreyfus Variable Investment Fund, Quality Bond Portfolio on 12/31/04 to a $10,000 investment made in the Barclays U.S. Aggregate Bond Index (the “Index”) on that date.
6
The fund’s Initial shares are not subject to a Rule 12b-1 fee.The fund’s Service shares are subject to a 0.25% annual Rule 12b-1 fee. All dividends and capital gain distributions are reinvested.
The fund’s performance shown in the line graph above takes into account all applicable fund fees and expenses for Initial and Service shares.The Index is a widely accepted, unmanaged index of corporate, U.S. government and U.S. government agency debt instruments, mortgage-backed securities and asset-backed securities with an average maturity of 1-10 years. Unlike a mutual fund, the Index is not subject to charges, fees and other expenses. Investors cannot invest directly in any index. Further information relating to fund performance, including expense reimbursements, if applicable, is contained in the Financial Highlights section of the prospectus and elsewhere in this report.
The Fund 7
UNDERSTANDING YOUR FUND’S EXPENSES (Unaudited)
As a mutual fund investor, you pay ongoing expenses, such as management fees and other expenses. Using the information below, you can estimate how these expenses affect your investment and compare them with the expenses of other funds.You also may pay one-time transaction expenses, including sales charges (loads), redemption fees and expenses associated with variable annuity or insurance contracts, which are not shown in this section and would have resulted in higher total expenses. For more information, see your fund’s prospectus or talk to your financial adviser.
Review your fund’s expenses
The table below shows the expenses you would have paid on a $1,000 investment in Dreyfus Variable Investment Fund, Quality Bond Portfolio from July 1, 2014 to December 31, 2014. It also shows how much a $1,000 investment would be worth at the close of the period, assuming actual returns and expenses.
Expenses and Value of a $1,000 Investment
assuming actual returns for the six months ended December 31, 2014
| | | | |
| | | Initial Shares | | Service Shares |
| Expenses paid per $1,000† | | $4.35 | | $5.61 |
| Ending value (after expenses) | | $1,008.00 | | $1,006.80 |
COMPARING YOUR FUND’S EXPENSES
WITH THOSE OF OTHER FUNDS (Unaudited)
Using the SEC’s method to compare expenses
The Securities and Exchange Commission (SEC) has established guidelines to help investors assess fund expenses. Per these guidelines, the table below shows your fund’s expenses based on a $1,000 investment, assuming a hypothetical 5% annualized return. You can use this information to compare the ongoing expenses (but not transaction expenses or total cost) of investing in the fund with those of other funds. All mutual fund shareholder reports will provide this information to help you make this comparison. Please note that you cannot use this information to estimate your actual ending account balance and expenses paid during the period.
Expenses and Value of a $1,000 Investment
assuming a hypothetical 5% annualized return for the six months ended December 31, 2014
| | | | |
| | | Initial Shares | | Service Shares |
| Expenses paid per $1,000† | | $4.38 | | $5.65 |
| Ending value (after expenses) | | $1,020.87 | | $1,019.61 |
|
| † Expenses are equal to the fund’s annualized expense ratio of .86% for Initial shares and 1.11% for Service shares, |
| multiplied by the average account value over the period, multiplied by 184/365 (to reflect the one-half year period). |
8
STATEMENT OF INVESTMENTS
December 31, 2014
| | | | | |
| | Coupon | Maturity | Principal | | |
| Bonds and Notes—121.8% | Rate (%) | Date | Amount ($) | | Value ($) |
| Asset-Backed Ctfs./ | | | | | |
| Auto Receivables—5.4% | | | | | |
| AmeriCredit Automobile Receivables | | | | | |
| Trust, Ser. 2013-1, Cl. D | 2.09 | 2/8/19 | 305,000 | | 302,803 |
| AmeriCredit Automobile Receivables | | | | | |
| Trust, Ser. 2012-5, Cl. D | 2.35 | 12/10/18 | 155,000 | | 156,176 |
| AmeriCredit Automobile Receivables | | | | | |
| Trust, Ser. 2014-1, Cl. D | 2.54 | 6/8/20 | 275,000 | | 271,956 |
| AmeriCredit Automobile Receivables | | | | | |
| Trust, Ser. 2012-4, Cl. D | 2.68 | 10/9/18 | 245,000 | | 247,083 |
| AmeriCredit Automobile Receivables | | | | | |
| Trust, Ser. 2011-5, Cl. D | 5.05 | 12/8/17 | 490,000 | | 509,762 |
| Capital Auto Receivables Asset | | | | | |
| Trust, Ser. 2013-1, Cl. D | 2.19 | 9/20/21 | 160,000 | | 160,347 |
| Santander Drive Auto Receivables | | | | | |
| Trust, Ser. 2013-1, Cl. D | 2.27 | 1/15/19 | 210,000 | | 208,734 |
| Santander Drive Auto Receivables | | | | | |
| Trust, Ser. 2012-6, Cl. D | 2.52 | 9/17/18 | 285,000 | | 286,467 |
| Santander Drive Auto Receivables | | | | | |
| Trust, Ser. 2013-2, Cl. D | 2.57 | 3/15/19 | 510,000 | | 516,573 |
| Santander Drive Auto Receivables | | | | | |
| Trust, Ser. 2012-5, Cl. C | 2.70 | 8/15/18 | 440,000 | | 447,743 |
| Santander Drive Auto Receivables | | | | | |
| Trust, Ser. 2012-1, Cl. C | 3.78 | 11/15/17 | 96,002 | | 97,219 |
| Santander Drive Auto Receivables | | | | | |
| Trust, Ser. 2011-3, Cl. D | 4.23 | 5/15/17 | 200,000 | | 205,669 |
| Santander Drive Auto Receivables | | | | | |
| Trust, Ser. 2011-4, Cl. D | 4.74 | 9/15/17 | 235,000 | | 244,021 |
| | | | | | 3,654,553 |
| Asset-Backed Ctfs./ | | | | | |
| Home Equity Loans—.2% | | | | | |
| First NLC Trust, | | | | | |
| Ser. 2005-2, Cl. M1 | 0.65 | 9/25/35 | 125,000 | a | 119,454 |
| Commercial Mortgage | | | | | |
| Pass-Through Ctfs.—4.3% | | | | | |
| Aventura Mall Trust, | | | | | |
| Ser. 2013-AVM, Cl. C | 3.74 | 12/5/32 | 420,000 | a,b | 433,677 |
| Citigroup Commercial Mortgage | | | | | |
| Trust, Ser. 2007-C6, Cl. A4 | 5.71 | 12/10/49 | 200,000 | a | 217,099 |
The Fund 9
STATEMENT OF INVESTMENTS (continued)
| | | | | |
| | Coupon | Maturity | Principal | | |
| Bonds and Notes (continued) | Rate (%) | Date | Amount ($) | | Value ($) |
| Commercial Mortgage | | | | | |
| Pass-Through Ctfs. (continued) | | | | | |
| Commercial Mortgage Trust, | | | | | |
| Ser. 2014-UBS2, Cl. AM | 4.20 | 3/10/47 | 70,000 | | 74,297 |
| Commercial Mortgage Trust, | | | | | |
| Ser. 2014-CR14, Cl. A4 | 4.24 | 2/10/47 | 305,000 | a | 334,421 |
| Commercial Mortgage Trust, | | | | | |
| Ser. 2014-UBS2, Cl. B | 4.70 | 3/10/47 | 50,000 | | 54,631 |
| Commercial Mortgage Trust, | | | | | |
| Ser. 2013-LC13, Cl. C | 5.05 | 8/10/46 | 130,000 | a,b | 142,554 |
| Credit Suisse Mortgage Trust, | | | | | |
| Ser. 2014-USA, Cl. D | 4.37 | 9/15/37 | 175,000 | b | 170,796 |
| Credit Suisse Mortgage Trust, | | | | | |
| Ser. 2014-USA, Cl. E | 4.37 | 9/15/37 | 190,000 | b | 177,171 |
| Extended Stay America Trust, | | | | | |
| Ser. 2013-ESH7, Cl. C7 | 3.90 | 12/5/31 | 225,000 | b | 228,866 |
| Hilton USA Trust, | | | | | |
| Ser. 2013-HLT, Cl. CFX | 3.71 | 11/5/30 | 345,000 | b | 349,526 |
| JP Morgan Chase Commercial | | | | | |
| Mortgage Securities Trust, | | | | | |
| Ser. 2013-LC11, Cl. C | 3.96 | 4/15/46 | 165,000 | a | 166,224 |
| JPMBB Commercial Mortgage | | | | | |
| Securities Trust, | | | | | |
| Ser. 2014-C18, Cl. A5 | 4.08 | 2/15/47 | 340,000 | | 369,404 |
| UBS Commercial Mortgage Trust, | | | | | |
| Ser. 2012-C1, Cl. A3 | 3.40 | 5/10/45 | 135,000 | | 140,264 |
| WFRBS Commercial Mortgage Trust, | | | | | |
| Ser. 2013-C17, Cl. A4 | 4.02 | 12/15/46 | 50,000 | | 54,036 |
| | | | | | 2,912,966 |
| Consumer Discretionary—3.9% | | | | | |
| 21st Century Fox America, | | | | | |
| Gtd. Notes | 4.00 | 10/1/23 | 90,000 | | 95,737 |
| Clear Channel Worldwide Holdings, | | | | | |
| Gtd. Notes, Ser. B | 7.63 | 3/15/20 | 85,000 | c | 89,888 |
| Comcast, | | | | | |
| Gtd. Notes | 6.30 | 11/15/17 | 85,000 | | 96,331 |
| Cox Communications, | | | | | |
| Sr. Unscd. Notes | 6.25 | 6/1/18 | 205,000 | b | 231,652 |
| CVS Pass-Through Trust, | | | | | |
| Pass Thru Certificates Notes | 6.04 | 12/10/28 | 259,288 | | 303,099 |
10
| | | | | |
| | Coupon | Maturity | Principal | | |
| Bonds and Notes (continued) | Rate (%) | Date | Amount ($) | | Value ($) |
| Consumer Discretionary (continued) | | | | | |
| CVS Pass-Through Trust, | | | | | |
| Pass Thru Certificates Notes | 8.35 | 7/10/31 | 485,179 | b | 657,403 |
| NBCUniversal Media, | | | | | |
| Gtd. Notes | 5.15 | 4/30/20 | 170,000 | | 193,143 |
| Sky, | | | | | |
| Gtd. Notes | 3.75 | 9/16/24 | 345,000 | b | 347,814 |
| Staples, | | | | | |
| Sr. Unscd. Notes | 2.75 | 1/12/18 | 190,000 | c | 189,938 |
| Time Warner, | | | | | |
| Gtd. Debs | 5.35 | 12/15/43 | 390,000 | | 444,677 |
| | | | | | 2,649,682 |
| Consumer Staples—2.5% | | | | | |
| Altria Group, | | | | | |
| Gtd. Notes | 4.00 | 1/31/24 | 55,000 | | 57,451 |
| Altria Group, | | | | | |
| Gtd. Notes | 4.75 | 5/5/21 | 105,000 | | 116,292 |
| ConAgra Foods, | | | | | |
| Sr. Unscd. Notes | 4.65 | 1/25/43 | 66,000 | | 69,153 |
| Lorillard Tobacco, | | | | | |
| Gtd. Notes | 3.75 | 5/20/23 | 215,000 | | 213,332 |
| Pernod Ricard, | | | | | |
| Sr. Unscd. Notes | 4.45 | 1/15/22 | 255,000 | b | 273,436 |
| Reynolds American, | | | | | |
| Gtd. Notes | 4.85 | 9/15/23 | 310,000 | c | 334,271 |
| SABMiller Holdings, | | | | | |
| Gtd. Notes | 3.75 | 1/15/22 | 350,000 | b | 365,862 |
| Wm. Wrigley Jr., | | | | | |
| Sr. Unscd. Notes | 3.38 | 10/21/20 | 235,000 | b | 240,515 |
| | | | | | 1,670,312 |
| Energy—4.6% | | | | | |
| Anadarko Petroleum, | | | | | |
| Sr. Unscd. Notes | 6.38 | 9/15/17 | 165,000 | | 183,562 |
| Energy Transfer Partners, | | | | | |
| Sr. Unscd. Notes | 4.90 | 2/1/24 | 210,000 | | 220,447 |
| Energy Transfer Partners, | | | | | |
| Sr. Unscd. Notes | 5.15 | 2/1/43 | 270,000 | | 268,183 |
| Ensco, | | | | | |
| Sr. Unscd. Notes | 4.50 | 10/1/24 | 175,000 | c | 170,427 |
The Fund 11
STATEMENT OF INVESTMENTS (continued)
| | | | | |
| | Coupon | Maturity | Principal | | |
| Bonds and Notes (continued) | Rate (%) | Date | Amount ($) | | Value ($) |
| Energy (continued) | | | | | |
| Freeport-McMoran Oil & Gas, | | | | | |
| Gtd. Notes | 6.88 | 2/15/23 | 310,000 | | 345,650 |
| Kinder Morgan, | | | | | |
| Gtd. Notes | 7.75 | 1/15/32 | 235,000 | | 290,225 |
| Kinder Morgan Energy Partners, | | | | | |
| Gtd. Notes | 6.85 | 2/15/20 | 170,000 | | 195,480 |
| Marathon Petroleum, | | | | | |
| Sr. Unscd. Notes | 3.63 | 9/15/24 | 355,000 | c | 348,605 |
| Spectra Energy Partners, | | | | | |
| Sr. Unscd. Notes | 2.95 | 9/25/18 | 80,000 | | 81,942 |
| Spectra Energy Partners, | | | | | |
| Sr. Unscd. Notes | 4.75 | 3/15/24 | 70,000 | | 75,172 |
| Talisman Energy, | | | | | |
| Sr. Unscd. Notes | 3.75 | 2/1/21 | 135,000 | | 130,725 |
| Transocean, | | | | | |
| Gtd. Notes | 3.80 | 10/15/22 | 160,000 | c | 129,861 |
| Transocean, | | | | | |
| Gtd. Notes | 6.38 | 12/15/21 | 235,000 | c | 217,071 |
| Unit, | | | | | |
| Gtd. Notes | 6.63 | 5/15/21 | 85,000 | | 76,500 |
| Williams Partners, | | | | | |
| Sr. Unscd. Notes | 3.35 | 8/15/22 | 125,000 | | 119,602 |
| Williams Partners, | | | | | |
| Sr. Unscd. Notes | 4.50 | 11/15/23 | 180,000 | | 181,974 |
| Williams Partners, | | | | | |
| Sr. Unscd. Notes | 6.30 | 4/15/40 | 65,000 | | 72,955 |
| | | | | | 3,108,381 |
| Financial—15.1% | | | | | |
| ABN AMRO Bank, | | | | | |
| Sr. Unscd. Notes | 2.50 | 10/30/18 | 230,000 | b | 232,419 |
| Ally Financial, | | | | | |
| Gtd. Notes | 4.63 | 6/26/15 | 180,000 | | 181,575 |
| Bank of America, | | | | | |
| Sr. Unscd. Notes | 1.27 | 1/15/19 | 400,000 | a | 406,081 |
| Bank of America, | | | | | |
| Sr. Unscd. Notes | 4.00 | 4/1/24 | 365,000 | | 380,487 |
| Bank of America, | | | | | |
| Sub. Notes | 4.25 | 10/22/26 | 380,000 | | 379,670 |
| Bank of America, | | | | | |
| Sr. Unscd. Notes | 5.63 | 7/1/20 | 40,000 | | 45,598 |
12
| | | | | |
| | Coupon | Maturity | Principal | | |
| Bonds and Notes (continued) | Rate (%) | Date | Amount ($) | | Value ($) |
| Financial (continued) | | | | | |
| Bank of America, | | | | | |
| Sub. Notes | 5.70 | 5/2/17 | 320,000 | | 346,111 |
| Barclays, | | | | | |
| Sub. Notes | 4.38 | 9/11/24 | 355,000 | | 342,671 |
| CIT Group, | | | | | |
| Sr. Unscd. Notes | 5.00 | 5/15/17 | 85,000 | | 88,400 |
| Citigroup, | | | | | |
| Sr. Unscd. Notes | 5.38 | 8/9/20 | 210,000 | | 238,968 |
| Citigroup, | | | | | |
| Sub. Notes | 5.50 | 9/13/25 | 255,000 | | 282,737 |
| DDR, | | | | | |
| Sr. Unscd. Notes | 4.75 | 4/15/18 | 340,000 | | 363,463 |
| Denali Borrower, | | | | | |
| Sr. Scd. Notes | 5.63 | 10/15/20 | 170,000 | b | 177,310 |
| Discover Financial Services, | | | | | |
| Sr. Unscd. Notes | 5.20 | 4/27/22 | 589,000 | | 651,492 |
| ERAC USA Finance, | | | | | |
| Gtd. Notes | 3.85 | 11/15/24 | 60,000 | b | 60,971 |
| ERAC USA Finance, | | | | | |
| Gtd. Notes | 6.38 | 10/15/17 | 120,000 | b | 134,823 |
| Ford Motor Credit, | | | | | |
| Sr. Unscd. Notes, Ser. 1 | 1.07 | 3/12/19 | 590,000 | a | 587,217 |
| Ford Motor Credit, | | | | | |
| Sr. Unscd. Notes | 5.00 | 5/15/18 | 295,000 | | 320,781 |
| General Electric Capital, | | | | | |
| Sr. Unscd. Notes | 0.74 | 1/14/19 | 360,000 | a | 360,498 |
| Genworth Holdings, | | | | | |
| Gtd. Notes | 4.80 | 2/15/24 | 235,000 | c | 191,836 |
| Genworth Holdings, | | | | | |
| Gtd. Notes | 7.20 | 2/15/21 | 85,000 | | 83,176 |
| Genworth Holdings, | | | | | |
| Gtd. Notes | 7.70 | 6/15/20 | 110,000 | | 110,204 |
| Goldman Sachs Group, | | | | | |
| Sr. Unscd. Notes | 1.33 | 11/15/18 | 385,000 | a | 389,138 |
| Goldman Sachs Group, | | | | | |
| Sr. Unscd. Notes | 1.84 | 11/29/23 | 375,000 | a | 386,062 |
| Goldman Sachs Group, | | | | | |
| Sr. Unscd. Notes | 5.75 | 1/24/22 | 160,000 | | 185,250 |
| Health Care REIT, | | | | | |
| Sr. Unscd. Notes | 5.13 | 3/15/43 | 280,000 | | 309,397 |
The Fund 13
STATEMENT OF INVESTMENTS (continued)
| | | | | |
| | Coupon | Maturity | Principal | | |
| Bonds and Notes (continued) | Rate (%) | Date | Amount ($) | | Value ($) |
| Financial (continued) | | | | | |
| HSBC Holdings, | | | | | |
| Sr. Unscd. Notes | 4.00 | 3/30/22 | 335,000 | | 357,101 |
| JPMorgan Chase & Co., | | | | | |
| Sr. Unscd. Notes | 4.35 | 8/15/21 | 150,000 | | 163,237 |
| Liberty Mutual Group, | | | | | |
| Gtd. Notes | 6.50 | 5/1/42 | 105,000 | b | 129,305 |
| Morgan Stanley, | | | | | |
| Sr. Unscd. Notes | 3.70 | 10/23/24 | 370,000 | | 375,807 |
| Morgan Stanley, | | | | | |
| Sr. Unscd. Notes | 3.75 | 2/25/23 | 65,000 | | 66,795 |
| Morgan Stanley, | | | | | |
| Sr. Unscd. Notes | 5.50 | 7/28/21 | 100,000 | | 113,646 |
| Pacific LifeCorp, | | | | | |
| Sr. Unscd. Notes | 5.13 | 1/30/43 | 360,000 | b | 398,993 |
| Prudential Financial, | | | | | |
| Jr. Sub. Notes | 5.88 | 9/15/42 | 240,000 | a | 254,400 |
| Regency Centers, | | | | | |
| Gtd. Notes | 5.88 | 6/15/17 | 120,000 | | 132,069 |
| Royal Bank of Scotland, | | | | | |
| Sub. Notes | 9.50 | 3/16/22 | 445,000 | a | 506,655 |
| Royal Bank of Scotland Group, | | | | | |
| Sr. Unscd. Notes | 2.55 | 9/18/15 | 270,000 | | 272,750 |
| Synchrony Financial, | | | | | |
| Sr. Unscd. Notes | 3.75 | 8/15/21 | 160,000 | | 163,578 |
| | | | | | 10,170,671 |
| Foreign/Governmental—3.0% | | | | | |
| Comision Federal de Electricidad, | | | | | |
| Sr. Unscd. Notes | 4.88 | 1/15/24 | 310,000 | b | 324,725 |
| Ecopetrol, | | | | | |
| Sr. Unscd. Notes | 5.88 | 9/18/23 | 345,000 | | 366,131 |
| Petroleos Mexicanos, | | | | | |
| Gtd. Notes | 4.88 | 1/24/22 | 200,000 | | 209,982 |
| Petroleos Mexicanos, | | | | | |
| Gtd. Notes | 5.50 | 1/21/21 | 205,000 | | 222,938 |
| Petroleos Mexicanos, | | | | | |
| Gtd. Bonds | 6.63 | 6/15/35 | 315,000 | | 365,400 |
| Portuguese Government, | | | | | |
| Unscd. Notes | 5.13 | 10/15/24 | 180,000 | b | 189,273 |
14
| | | | | |
| | Coupon | Maturity | Principal | | |
| Bonds and Notes (continued) | Rate (%) | Date | Amount ($) | | Value ($) |
| Foreign/Governmental (continued) | | | | | |
| Province of Quebec Canada, | | | | | |
| Sr. Unscd. Notes | 4.60 | 5/26/15 | 305,000 | | 310,104 |
| | | | | | 1,988,553 |
| Health Care—1.6% | | | | | |
| Anthem, | | | | | |
| Sr. Unscd. Notes | 2.30 | 7/15/18 | 300,000 | | 301,915 |
| Becton Dickinson and Company, | | | | | |
| Sr. Unscd. Notes | 3.73 | 12/15/24 | 65,000 | | 67,058 |
| Becton, Dickinson and Company, | | | | | |
| Sr. Unscd. Notes | 4.69 | 12/15/44 | 45,000 | | 48,663 |
| Biomet, | | | | | |
| Gtd. Notes | 6.50 | 8/1/20 | 85,000 | | 91,162 |
| CHS/Community Health Systems, | | | | | |
| Sr. Scd. Notes | 5.13 | 8/1/21 | 25,000 | | 26,063 |
| CHS/Community Health Systems, | | | | | |
| Gtd. Notes | 6.88 | 2/1/22 | 25,000 | c | 26,609 |
| Fresenius Medical Care II, | | | | | |
| Gtd. Notes | 4.13 | 10/15/20 | 110,000 | b | 111,100 |
| Medtronic, | | | | | |
| Sr. Unscd. Notes | 4.63 | 3/15/45 | 195,000 | b | 212,266 |
| Mylan, | | | | | |
| Sr. Unscd. Notes | 5.40 | 11/29/43 | 170,000 | | 189,386 |
| | | | | | 1,074,222 |
| Industrial—.9% | | | | | |
| AECOM Technology, | | | | | |
| Gtd. Notes | 5.75 | 10/15/22 | 175,000 | b | 179,375 |
| Waste Management, | | | | | |
| Gtd. Notes | 6.10 | 3/15/18 | 105,000 | | 118,902 |
| Waste Management, | | | | | |
| Gtd. Notes | 7.38 | 5/15/29 | 200,000 | | 271,921 |
| | | | | | 570,198 |
| Information Technology—.5% | | | | | |
| Hewlett-Packard, | | | | | |
| Sr. Unscd. Notes | 4.30 | 6/1/21 | 85,000 | | 89,572 |
| Hewlett-Packard, | | | | | |
| Sr. Unscd. Notes | 6.00 | 9/15/41 | 230,000 | | 259,600 |
| | | | | | 349,172 |
The Fund 15
STATEMENT OF INVESTMENTS (continued)
| | | | | |
| | Coupon | Maturity | Principal | | |
| Bonds and Notes (continued) | Rate (%) | Date | Amount ($) | | Value ($) |
| Materials—2.6% | | | | | |
| Dow Chemical, | | | | | |
| Sr. Unscd. Notes | 3.50 | 10/1/24 | 355,000 | c | 352,121 |
| Freeport-McMoRan, | | | | | |
| Gtd. Notes | 5.45 | 3/15/43 | 190,000 | | 180,286 |
| Glencore Funding, | | | | | |
| Gtd. Notes | 4.63 | 4/29/24 | 345,000 | b | 348,070 |
| LYB International Finance, | | | | | |
| Gtd. Notes | 4.00 | 7/15/23 | 295,000 | | 302,311 |
| Mosaic, | | | | | |
| Sr. Unscd. Notes | 4.25 | 11/15/23 | 235,000 | c | 248,430 |
| Vale Overseas, | | | | | |
| Gtd. Notes | 4.38 | 1/11/22 | 75,000 | c | 72,263 |
| Vale Overseas, | | | | | |
| Gtd. Notes | 6.88 | 11/21/36 | 200,000 | | 211,838 |
| | | | | | 1,715,319 |
| Municipal Bonds—1.4% | | | | | |
| California, | | | | | |
| GO (Build America Bonds) | 7.30 | 10/1/39 | 340,000 | | 501,157 |
| Chicago, | | | | | |
| GO (Project and Refunding Series) | 6.31 | 1/1/44 | 65,000 | | 68,922 |
| Illinois, | | | | | |
| GO (Pension Funding Series) | 5.10 | 6/1/33 | 110,000 | | 109,306 |
| New York City, | | | | | |
| GO (Build America Bonds) | 5.99 | 12/1/36 | 200,000 | | 253,056 |
| | | | | | 932,441 |
| Telecommunications—3.1% | | | | | |
| AT&T, | | | | | |
| Sr. Unscd. Notes | 1.15 | 11/27/18 | 310,000 | a | 315,282 |
| Digicel, | | | | | |
| Sr. Unscd. Notes | 6.00 | 4/15/21 | 200,000 | b | 187,500 |
| Frontier Communications, | | | | | |
| Sr. Unscd. Notes | 8.75 | 4/15/22 | 75,000 | | 84,188 |
| Intelsat Jackson Holdings, | | | | | |
| Gtd. Notes | 7.25 | 4/1/19 | 85,000 | | 89,038 |
| Rogers Communications, | | | | | |
| Gtd. Notes | 4.10 | 10/1/23 | 185,000 | | 194,726 |
| T-Mobile USA, | | | | | |
| Gtd. Notes | 6.13 | 1/15/22 | 90,000 | | 91,688 |
| Verizon Communications, | | | | | |
| Sr. Unscd. Notes | 5.15 | 9/15/23 | 160,000 | | 176,802 |
16
| | | | | | |
| | | Coupon | Maturity | Principal | | |
| Bonds and Notes (continued) | | Rate (%) | Date | Amount ($) | | Value ($) |
| Telecommunications (continued) | | | | | | |
| Verizon Communications, | | | | | | |
| Sr. Unscd. Notes | | 6.55 | 9/15/43 | 600,000 | | 769,815 |
| Wind Acquisition Finance, | | | | | | |
| Scd. Notes | | 7.38 | 4/23/21 | 200,000 | b | 189,260 |
| | | | | | | 2,098,299 |
| U.S. Government Agencies/ | | | | | | |
| Mortgage-Backed—27.5% | | | | | | |
| Federal Home Loan Mortgage Corp: | | | | | | |
| 4.00% | | | | 2,135,000 | d,e | 2,275,943 |
| 5.50%, 5/1/40 | | | | 25,278 | d | 28,311 |
| Federal National Mortgage Association: | | | | | | |
| 3.00% | | | | 3,250,000 | d,e | 3,287,832 |
| 3.50% | | | | 3,095,000 | d,e | 3,230,034 |
| 4.00% | | | | 2,125,000 | d,e | 2,258,157 |
| 4.50% | | | | 1,520,000 | d,e | 1,650,150 |
| 5.00% | | | | 1,030,000 | d,e | 1,138,130 |
| 3.50%, 9/1/44 | | | | 1,689,065 | d | 1,768,062 |
| 5.00%, 3/1/21—11/1/21 | | | | 219,883 | d | 237,309 |
| 5.50%, 2/1/34—7/1/40 | | | | 304,585 | d | 343,546 |
| 6.00%, 2/1/39 | | | | 28,358 | d | 32,124 |
| 7.00%, 6/1/29—9/1/29 | | | | 20,769 | d | 22,136 |
| Government National Mortgage Association I: | | | | |
| 5.50%, 4/15/33 | | | | 443,835 | | 499,296 |
| Government National Mortgage Association II: | | | | |
| 4.50%, 1/21/45 | | | | 1,555,000 | | 1,699,263 |
| 7.00%, 9/20/28—7/20/29 | | | | 6,078 | | 7,194 |
| | | | | | | 18,477,487 |
| U.S. Government | | | | | | |
| Securities—41.4% | | | | | | |
| U.S. Treasury Bonds: | | | | | | |
| 3.75%, 11/15/43 | | | | 1,585,000 | | 1,905,592 |
| 6.25%, 5/15/30 | | | | 150,000 | | 224,156 |
| U.S. Treasury Floating Rate Notes; | | | | | | |
| 0.11%, 7/31/16 | | | | 12,335,000 | a | 12,335,728 |
| U.S. Treasury Notes: | | | | | | |
| 0.25%, 12/31/15 | | | | 4,905,000 | | 4,904,617 |
| 1.50%, 12/31/18 | | | | 8,475,000 | | 8,486,916 |
| | | | | | | 27,857,009 |
| Utilities—3.8% | | | | | | |
| AES, | | | | | | |
| Sr. Unscd. Notes | | 8.00 | 6/1/20 | 80,000 | | 91,800 |
The Fund 17
STATEMENT OF INVESTMENTS (continued)
| | | | | | |
| | Coupon | Maturity | Principal | | | |
| Bonds and Notes (continued) | Rate (%) | Date | Amount ($) | | | Value ($) |
| Utilities (continued) | | | | | | |
| Consolidated Edison Company of | | | | | | |
| New York, Sr. Unscd. Debs., | | | | | | |
| Ser. 06-D | 5.30 | 12/1/16 | 400,000 | | | 432,588 |
| Dynegy Finance I/II, | | | | | | |
| Sr. Scd. Notes | 6.75 | 11/1/19 | 35,000 | b | | 35,656 |
| Dynegy Finance I/II, | | | | | | |
| Sr. Scd. Notes | 7.38 | 11/1/22 | 90,000 | b | | 91,688 |
| Enel Finance International, | | | | | | |
| Gtd. Notes | 6.00 | 10/7/39 | 160,000 | b | | 188,653 |
| Exelon Generation, | | | | | | |
| Sr. Unscd. Notes | 6.25 | 10/1/39 | 185,000 | | | 222,956 |
| Nevada Power, | | | | | | |
| Mortgage Notes, Ser. R | 6.75 | 7/1/37 | 265,000 | | | 376,367 |
| NiSource Finance, | | | | | | |
| Gtd. Notes | 4.45 | 12/1/21 | 245,000 | | | 265,105 |
| NiSource Finance, | | | | | | |
| Gtd. Notes | 5.65 | 2/1/45 | 320,000 | | | 384,559 |
| Sempra Energy, | | | | | | |
| Sr. Unscd. Notes | 6.50 | 6/1/16 | 295,000 | | | 316,899 |
| Sierra Pacific Power, | | | | | | |
| Mortgage Notes, Ser. P | 6.75 | 7/1/37 | 130,000 | | | 180,396 |
| | | | | | | 2,586,667 |
| Total Bonds and Notes | | | | | | |
| (cost $79,878,476) | | | | | | 81,935,386 |
| |
| Short-Term Investments—.2% | | | | | | |
| U.S. Treasury Bills; | | | | | | |
| 0.01%, 2/19/15 | | | | | | |
| (cost $129,998) | | | 130,000 | f | | 129,998 |
| |
| Other Investment—.6% | | | Shares | | | Value ($) |
| Registered Investment Company; | | | | | | |
| Dreyfus Institutional Preferred | | | | | | |
| Plus Money Market Fund | | | | | | |
| (cost $383,669) | | | 383,669 | g | | 383,669 |
18
| | | | |
| Investment of Cash Collateral | | | | |
| for Securities Loaned—1.0% | Shares | | Value ($) | |
| Registered Investment Company; | | | | |
| Dreyfus Institutional Cash Advantage Fund | | | | |
| (cost $683,250) | 683,250 | g | 683,250 | |
| Total Investments (cost $81,075,393) | 123.6 | % | 83,132,303 | |
| Liabilities, Less Cash and Receivables | (23.6 | %) | (15,892,708 | ) |
| Net Assets | 100.0 | % | 67,239,595 | |
GO—General Obligation
REIT—Real Estate Investment Trust
|
| a Variable rate security—interest rate subject to periodic change. |
| b Securities exempt from registration pursuant to Rule 144A under the Securities Act of 1933.These securities may be |
| resold in transactions exempt from registration, normally to qualified institutional buyers.At December 31, 2014, |
| these securities were valued at $6,810,659 or 10.1% of net assets. |
| c Security, or portion thereof, on loan.At December 31, 2014, the value of the fund’s securities on loan was |
| $2,371,320 and the value of the collateral held by the fund was $2,446,486, consisting of cash collateral of |
| $683,250 and U.S. Government & Agency securities valued at $1,763,236. |
| d The Federal Housing Finance Agency (“FHFA”) placed the Federal Home Loan Mortgage Corporation and Federal |
| National Mortgage Association into conservatorship with FHFA as the conservator.As such, the FHFA oversees the |
| continuing affairs of these companies. |
| e Purchased on a forward commitment basis. |
| f Held by or on behalf of a counterparty for open financial futures contracts. |
| g Investment in affiliated money market mutual fund. |
| | | |
| Portfolio Summary (Unaudited)† | | |
| |
| | Value (%) | | Value (%) |
| U.S. Government & Agencies/ | | Foreign/Governmental | 3.0 |
| Mortgage-Backed | 68.9 | Short-Term/ | |
| Corporate Bonds | 38.6 | Money Market Investments | 1.8 |
| Asset-Backed | 5.6 | Municipal Bonds | 1.4 |
| Commercial Mortgage-Backed | 4.3 | | 123.6 |
| |
| † Based on net assets. | | | |
| See notes to financial statements. | | | |
The Fund 19
STATEMENT OF FINANCIAL FUTURES
December 31, 2014
| | | | | | |
| | | Market Value | | | Unrealized | |
| | | Covered by | | | (Depreciation) | |
| | Contracts | Contracts ($) | | Expiration | at 12/31/2014 | ($) |
| Financial Futures Short | | | | | | |
| U.S. Treasury 10 Year Notes | 37 | (4,691,484 | ) | March 2015 | (19,305 | ) |
| |
| See notes to financial statements. | | | | | | |
20
STATEMENT OF ASSETS AND LIABILITIES
December 31, 2014
| | | |
| | Cost | Value | |
| Assets ($): | | | |
| Investments in securities—See Statement of Investments (including | | | |
| securities on loan, valued at $2,371,320)—Note 1(c): | | | |
| Unaffiliated issuers | 80,008,474 | 82,065,384 | |
| Affiliated issuers | 1,066,919 | 1,066,919 | |
| Cash | | 4,040 | |
| Cash denominated in foreign currencies | 53,159 | 47,662 | |
| Dividends, interest and securities lending income receivable | | 386,474 | |
| Unrealized appreciation on forward foreign | | | |
| currency exchange contracts—Note 4 | | 23,149 | |
| Prepaid expenses | | 704 | |
| | | 83,594,332 | |
| Liabilities ($): | | | |
| Due to The Dreyfus Corporation and affiliates—Note 3(b) | | 49,993 | |
| Payable for open mortgage dollar roll transactions—Note 4 | | 15,473,650 | |
| Liability for securities on loan—Note 1(c) | | 683,250 | |
| Payable for shares of Beneficial Interest redeemed | | 86,814 | |
| Payable for futures variation margin—Note 4 | | 8,094 | |
| Unrealized depreciation on forward foreign | | | |
| currency exchange contracts—Note 4 | | 1,734 | |
| Accrued expenses | | 51,202 | |
| | | 16,354,737 | |
| Net Assets ($) | | 67,239,595 | |
| Composition of Net Assets ($): | | | |
| Paid-in capital | | 66,530,801 | |
| Accumulated undistributed investment income—net | | 209,710 | |
| Accumulated net realized gain (loss) on investments | | (1,554,439 | ) |
| Accumulated net unrealized appreciation (depreciation) on | | | |
| investments and foreign currency transactions [including | | | |
| ($19,305) net unrealized depreciation on financial futures] | | 2,053,523 | |
| Net Assets ($) | | 67,239,595 | |
| |
| |
| Net Asset Value Per Share | | | |
| | Initial Shares | Service Shares | |
| Net Assets ($) | 49,880,392 | 17,359,203 | |
| Shares Outstanding | 4,102,690 | 1,433,619 | |
| Net Asset Value Per Share ($) | 12.16 | 12.11 | |
| |
| See notes to financial statements. | | | |
The Fund 21
STATEMENT OF OPERATIONS
Year Ended December 31, 2014
| | |
| Investment Income ($): | | |
| Income: | | |
| Interest | 1,816,428 | |
| Dividends; | | |
| Affiliated issuers | 1,265 | |
| Income from securities lending—Note 1(c) | 4,385 | |
| Total Income | 1,822,078 | |
| Expenses: | | |
| Management fee—Note 3(a) | 468,184 | |
| Professional fees | 61,117 | |
| Distribution fees—Note 3(b) | 46,270 | |
| Prospectus and shareholders’ reports | 24,644 | |
| Custodian fees—Note 3(b) | 14,063 | |
| Trustees’ fees and expenses—Note 3(c) | 3,974 | |
| Loan commitment fees—Note 2 | 634 | |
| Shareholder servicing costs—Note 3(b) | 403 | |
| Miscellaneous | 36,560 | |
| Total Expenses | 655,849 | |
| Less—reduction in fees due to earnings credits—Note 3(b) | (2 | ) |
| Net Expenses | 655,847 | |
| Investment Income—Net | 1,166,231 | |
| Realized and Unrealized Gain (Loss) on Investments—Note 4 ($): | | |
| Net realized gain (loss) on investments and foreign currency transactions | 1,300,310 | |
| Net realized gain (loss) on financial futures | (157,889 | ) |
| Net realized gain (loss) on forward foreign currency exchange contracts | 16,410 | |
| Net Realized Gain (Loss) | 1,158,831 | |
| Net unrealized appreciation (depreciation) on | | |
| investments and foreign currency transactions | 1,133,021 | |
| Net unrealized appreciation (depreciation) on financial futures | (112,680 | ) |
| Net unrealized appreciation (depreciation) on | | |
| forward foreign currency exchange contracts | 24,962 | |
| Net Unrealized Appreciation (Depreciation) | 1,045,303 | |
| Net Realized and Unrealized Gain (Loss) on Investments | 2,204,134 | |
| Net Increase in Net Assets Resulting from Operations | 3,370,365 | |
| See notes to financial statements. | | |
22
STATEMENT OF CHANGES IN NET ASSETS
| | | | |
| | Year Ended December 31, | |
| | 2014 | | 2013 | |
| Operations ($): | | | | |
| Investment income—net | 1,166,231 | | 1,380,094 | |
| Net realized gain (loss) on investments | 1,158,831 | | 574,464 | |
| Net unrealized appreciation | | | | |
| (depreciation) on investments | 1,045,303 | | (3,314,372 | ) |
| Net Increase (Decrease) in Net Assets | | | | |
| Resulting from Operations | 3,370,365 | | (1,359,814 | ) |
| Dividends to Shareholders from ($): | | | | |
| Investment income—net: | | | | |
| Initial Shares | (1,134,201 | ) | (1,700,400 | ) |
| Service Shares | (348,565 | ) | (556,695 | ) |
| Total Dividends | (1,482,766 | ) | (2,257,095 | ) |
| Beneficial Interest Transactions ($): | | | | |
| Net proceeds from shares sold: | | | | |
| Initial Shares | 2,812,762 | | 5,199,935 | |
| Service Shares | 1,451,337 | | 1,202,045 | |
| Dividends reinvested: | | | | |
| Initial Shares | 1,134,201 | | 1,700,400 | |
| Service Shares | 348,565 | | 556,695 | |
| Cost of shares redeemed: | | | | |
| Initial Shares | (10,808,535 | ) | (15,149,675 | ) |
| Service Shares | (4,484,712 | ) | (5,623,734 | ) |
| Increase (Decrease) in Net Assets from | | | | |
| Beneficial Interest Transactions | (9,546,382 | ) | (12,114,334 | ) |
| Total Increase (Decrease) in Net Assets | (7,658,783 | ) | (15,731,243 | ) |
| Net Assets ($): | | | | |
| Beginning of Period | 74,898,378 | | 90,629,621 | |
| End of Period | 67,239,595 | | 74,898,378 | |
| Undistributed investment income—net | 209,710 | | 521,236 | |
The Fund 23
STATEMENT OF CHANGES IN NET ASSETS (continued)
| | | | |
| | Year Ended December 31, | |
| | 2014 | | 2013 | |
| Capital Share Transactions: | | | | |
| Initial Shares | | | | |
| Shares sold | 233,647 | | 432,084 | |
| Shares issued for dividends reinvested | 94,271 | | 141,107 | |
| Shares redeemed | (896,303 | ) | (1,255,754 | ) |
| Net Increase (Decrease) in Shares Outstanding | (568,385 | ) | (682,563 | ) |
| Service Shares | | | | |
| Shares sold | 120,720 | | 99,571 | |
| Shares issued for dividends reinvested | 29,099 | | 46,348 | |
| Shares redeemed | (373,952 | ) | (465,792 | ) |
| Net Increase (Decrease) in Shares Outstanding | (224,133 | ) | (319,873 | ) |
| See notes to financial statements. | | | | |
24
FINANCIAL HIGHLIGHTS
The following tables describe the performance for each share class for the fiscal periods indicated. All information (except portfolio turnover rate) reflects financial results for a single fund share.Total return shows how much your investment in the fund would have increased (or decreased) during each period, assuming you had reinvested all dividends and distributions. The fund’s total returns do not reflect expenses associated with variable annuity or insurance contracts.These figures have been derived from the fund’s financial statements.
| | | | | | | | | | |
| | | | Year Ended December 31, | | | |
| Initial Shares | 2014 | | 2013 | | 2012 | | 2011 | | 2010 | |
| Per Share Data ($): | | | | | | | | | | |
| Net asset value, beginning of period | 11.85 | | 12.37 | | 11.92 | | 11.55 | | 11.08 | |
| Investment Operations: | | | | | | | | | | |
| Investment income—neta | .20 | | .21 | | .22 | | .29 | | .41 | |
| Net realized and unrealized | | | | | | | | | | |
| gain (loss) on investments | .36 | | (.39 | ) | .59 | | .51 | | .51 | |
| Total from Investment Operations | .56 | | (.18 | ) | .81 | | .80 | | .92 | |
| Distributions: | | | | | | | | | | |
| Dividends from investment income—net | (.25 | ) | (.34 | ) | (.36 | ) | (.43 | ) | (.45 | ) |
| Net asset value, end of period | 12.16 | | 11.85 | | 12.37 | | 11.92 | | 11.55 | |
| Total Return (%) | 4.79 | | (1.54 | ) | 7.00 | | 7.04 | | 8.38 | |
| Ratios/Supplemental Data (%): | | | | | | | | | | |
| Ratio of total expenses | | | | | | | | | | |
| to average net assets | .85 | | .92 | | .84 | | .79 | | .77 | |
| Ratio of net expenses | | | | | | | | | | |
| to average net assets | .85 | | .92 | | .84 | | .79 | | .77 | |
| Ratio of net investment income | | | | | | | | | | |
| to average net assets | 1.68 | | 1.76 | | 1.80 | | 2.54 | | 3.55 | |
| Portfolio Turnover Rateb | 387.86 | | 397.26 | | 518.55 | | 379.94 | | 288.08 | |
| Net Assets, end of period ($ x 1,000) | 49,880 | | 55,337 | | 66,251 | | 69,072 | | 105,205 | |
|
| a Based on average shares outstanding. |
| b The portfolio turnover rates excluding mortgage dollar roll transactions for the periods ended December 31, 2014, |
| 2013, 2012, 2011 and 2010 were 182.67%, 176.37%, 269.42%, 162.19% and 129.47%, respectively. |
See notes to financial statements.
The Fund 25
FINANCIAL HIGHLIGHTS (continued)
| | | | | | | | | | |
| | | | Year Ended December 31, | | | |
| Service Shares | 2014 | | 2013 | | 2012 | | 2011 | | 2010 | |
| Per Share Data ($): | | | | | | | | | | |
| Net asset value, beginning of period | 11.80 | | 12.33 | | 11.88 | | 11.51 | | 11.04 | |
| Investment Operations: | | | | | | | | | | |
| Investment income—neta | .17 | | .18 | | .19 | | .26 | | .38 | |
| Net realized and unrealized | | | | | | | | | | |
| gain (loss) on investments | .36 | | (.40 | ) | .59 | | .51 | | .50 | |
| Total from Investment Operations | .53 | | (.22 | ) | .78 | | .77 | | .88 | |
| Distributions: | | | | | | | | | | |
| Dividends from investment income—net | (.22 | ) | (.31 | ) | (.33 | ) | (.40 | ) | (.41 | ) |
| Net asset value, end of period | 12.11 | | 11.80 | | 12.33 | | 11.88 | | 11.51 | |
| Total Return (%) | 4.56 | | (1.80 | ) | 6.70 | | 6.78 | | 8.20 | |
| Ratios/Supplemental Data (%): | | | | | | | | | | |
| Ratio of total expenses | | | | | | | | | | |
| to average net assets | 1.10 | | 1.17 | | 1.09 | | 1.04 | | 1.02 | |
| Ratio of net expenses | | | | | | | | | | |
| to average net assets | 1.10 | | 1.17 | | 1.09 | | 1.04 | | 1.02 | |
| Ratio of net investment income | | | | | | | | | | |
| to average net assets | 1.43 | | 1.51 | | 1.55 | | 2.22 | | 3.29 | |
| Portfolio Turnover Rateb | 387.86 | | 397.26 | | 518.55 | | 379.94 | | 288.08 | |
| Net Assets, end of period ($ x 1,000) | 17,359 | | 19,561 | | 24,378 | | 26,776 | | 27,780 | |
|
| a Based on average shares outstanding. |
| b The portfolio turnover rates excluding mortgage dollar roll transactions for the periods ended December 31, 2014, |
| 2013, 2012, 2011 and 2010 were 182.67%, 176.37%, 269.42%, 162.19% and 129.47%, respectively. |
See notes to financial statements.
26
NOTES TO FINANCIAL STATEMENTS
NOTE 1—Significant Accounting Policies:
Dreyfus Variable Investment Fund (the “Company”) is registered under the Investment Company Act of 1940, as amended (the “Act”), as an open end management investment company, operating as a series company currently offering seven series, including the Quality Bond Portfolio (the “fund”). The fund is only offered to separate accounts established by insurance companies to fund variable annuity contracts and variable life insurance policies.The fund is a diversified series.The fund’s investment objective seeks to maximize total return, consisting of capital appreciation and current income. The Dreyfus Corporation (the “Manager” or “Dreyfus”), a wholly-owned subsidiary of The Bank of New York Mellon Corporation (“BNY Mellon”), serves as the fund’s investment adviser.
MBSC Securities Corporation (the “Distributor”), a wholly-owned subsidiary of the Manager, is the distributor of the fund’s shares, which are sold without a sales charge. The fund is authorized to issue an unlimited number of $.001 par value shares of Beneficial Interest in each of the following classes of shares: Initial and Service. Each class of shares has identical rights and privileges, except with respect to the Distribution Plan and the expenses borne by each class, the allocation of certain transfer agency costs, and certain voting rights. Income, expenses (other than expenses attributable to a specific class), and realized and unrealized gains or losses on investments are allocated to each class of shares based on its relative net assets.
The Company accounts separately for the assets, liabilities and operations of each series. Expenses directly attributable to each series are charged to that series’ operations; expenses which are applicable to all series are allocated among them on a pro rata basis.
The Financial Accounting Standards Board (“FASB”) Accounting Standards Codification (“ASC”) is the exclusive reference of authoritative U.S. generally accepted accounting principles (“GAAP”) recognized by the FASB to be applied by nongovernmental entities. Rules and interpretive releases of the Securities and Exchange Commission (“SEC”)
The Fund 27
NOTES TO FINANCIAL STATEMENTS (continued)
under authority of federal laws are also sources of authoritative GAAP for SEC registrants. The fund’s financial statements are prepared in accordance with GAAP, which may require the use of management estimates and assumptions. Actual results could differ from those estimates.
The Company enters into contracts that contain a variety of indemnifications. The fund’s maximum exposure under these arrangements is unknown.The fund does not anticipate recognizing any loss related to these arrangements.
(a) Portfolio valuation: The fair value of a financial instrument is the amount that would be received to sell an asset or paid to transfer a liability in an orderly transaction between market participants at the measurement date (i.e., the exit price). GAAP establishes a fair value hierarchy that prioritizes the inputs of valuation techniques used to measure fair value. This hierarchy gives the highest priority to unadjusted quoted prices in active markets for identical assets or liabilities (Level 1 measurements) and the lowest priority to unobservable inputs (Level 3 measurements).
Additionally, GAAP provides guidance on determining whether the volume and activity in a market has decreased significantly and whether such a decrease in activity results in transactions that are not orderly. GAAP requires enhanced disclosures around valuation inputs and techniques used during annual and interim periods.
Various inputs are used in determining the value of the fund’s investments relating to fair value measurements.These inputs are summarized in the three broad levels listed below:
Level 1—unadjusted quoted prices in active markets for identical investments.
Level 2—other significant observable inputs (including quoted prices for similar investments, interest rates, prepayment speeds, credit risk, etc.).
Level 3—significant unobservable inputs (including the fund’s own assumptions in determining the fair value of investments).
28
The inputs or methodology used for valuing securities are not necessarily an indication of the risk associated with investing in those securities.
Changes in valuation techniques may result in transfers in or out of an assigned level within the disclosure hierarchy. Valuation techniques used to value the fund’s investments are as follows:
Registered investment companies that are not traded on an exchange are valued at their net asset value and are generally categorized within Level 1 of the fair value hierarchy.
Investments in securities, excluding short-term investments (other than U.S.Treasury Bills), financial futures and forward foreign currency exchange contracts (“forward contracts”) are valued each business day by an independent pricing service (the “Service”) approved by the Company’s Board of Trustees (the “Board”). Investments for which quoted bid prices are readily available and are representative of the bid side of the market in the judgment of the Service are valued at the mean between the quoted bid prices (as obtained by the Service from dealers in such securities) and asked prices (as calculated by the Service based upon its evaluation of the market for such securities). Other investments (which constitute a majority of the portfolio securities) are valued as determined by the Service, based on methods which include consideration of the following: yields or prices of securities of comparable quality, coupon, maturity and type; indications as to values from dealers; and general market conditions.These securities are generally categorized within Level 2 of the fair value hierarchy.
U.S. Treasury Bills are valued at the mean price between quoted bid prices and asked prices by the Service. These securities are generally categorized within Level 2 of the fair value hierarchy.
The Service’s procedures are reviewed by Dreyfus under the general supervision of the Board.
When market quotations or official closing prices are not readily available, or are determined not to reflect accurately fair value, such as
The Fund 29
NOTES TO FINANCIAL STATEMENTS (continued)
when the value of a security has been significantly affected by events after the close of the exchange or market on which the security is principally traded (for example, a foreign exchange or market), but before the fund calculates its net asset value, the fund may value these investments at fair value as determined in accordance with the procedures approved by the Board. Certain factors may be considered when fair valuing investments such as: fundamental analytical data, the nature and duration of restrictions on disposition, an evaluation of the forces that influence the market in which the securities are purchased and sold, and public trading in similar securities of the issuer or comparable issuers. These securities are either categorized within Level 2 or 3 of the fair value hierarchy depending on the relevant inputs used.
For restricted securities where observable inputs are limited, assumptions about market activity and risk are used and are generally categorized within Level 3 of the fair value hierarchy.
Investments denominated in foreign currencies are translated to U.S. dollars at the prevailing rates of exchange.
Financial futures, which are traded on an exchange, are valued at the last sales price on the securities exchange on which such securities are primarily traded or at the last sales price on the national securities market on each business day and are generally categorized within Level 1 of the fair value hierarchy. Forward contracts are valued at the forward rate and are generally categorized within Level 2 of the fair value hierarchy.
The following is a summary of the inputs used as of December 31, 2014 in valuing the fund’s investments:
| | | | |
| | | Level 2—Other | Level 3— | |
| | Level 1— | Significant | Significant | |
| | Unadjusted | Observable | Unobservable | |
| | Quoted Prices | Inputs | Inputs | Total |
| Assets ($) | | | | |
| Investments in Securities: | | | |
| Asset-Backed | — | 3,774,007 | — | 3,774,007 |
| Commercial | | | | |
| Mortgage-Backed | — | 2,912,966 | — | 2,912,966 |
| Corporate Bonds† | — | 25,992,923 | — | 25,992,923 |
30
| | | | | | | |
| | | | Level 2—Other | | Level 3— | | |
| | Level 1— | | Significant | | Significant | | |
| | Unadjusted | | Observable | | Unobservable | | |
| | Quoted Prices | | Inputs | | Inputs | Total | |
| Assets ($) (continued) | | | | | | | |
| Investments in Securities | | | | | | |
| (continued): | | | | | | | |
| Foreign Government | — | | 1,988,553 | | — | 1,988,553 | |
| Municipal Bonds† | — | | 932,441 | | — | 932,441 | |
| Mutual Funds | 1,066,919 | | — | | — | 1,066,919 | |
| U.S. Government | | | | | | | |
| Agencies/ | | | | | | | |
| Mortgage-Backed | — | | 18,477,487 | | — | 18,477,487 | |
| U.S. Treasury | — | | 27,987,007 | | — | 27,987,007 | |
| Other Financial | | | | | | | |
| Instruments: | | | | | | | |
| Forward Foreign | | | | | | | |
| Currency Exchange | | | | | | | |
| Contracts†† | — | | 23,149 | | — | 23,149 | |
| Liabilities ($) | | | | | | | |
| Other Financial | | | | | | | |
| Instruments: | | | | | | | |
| Financial Futures†† | (19,305 | ) | — | | — | (19,305 | ) |
| Forward Foreign | | | | | | | |
| Currency Exchange | | | | | | | |
| Contracts†† | — | | (1,734 | ) | — | (1,734 | ) |
| |
| † | See Statement of Investments for additional detailed categorizations. |
| †† | Amount shown represents unrealized appreciation (depreciation) at period end. |
At December 31, 2014, there were no transfers between Level 1 and Level 2 of the fair value hierarchy.
(b) Foreign currency transactions: The fund does not isolate that portion of the results of operations resulting from changes in foreign exchange rates on investments from the fluctuations arising from changes in market prices of securities held. Such fluctuations are included with the net realized and unrealized gain or loss on investments.
Net realized foreign exchange gains or losses arise from sales of foreign currencies, currency gains or losses realized on securities transactions between trade and settlement date, and the difference between the
The Fund 31
NOTES TO FINANCIAL STATEMENTS (continued)
amounts of dividends, interest and foreign withholding taxes recorded on the fund’s books and the U.S. dollar equivalent of the amounts actually received or paid. Net unrealized foreign exchange gains and losses arise from changes in the value of assets and liabilities other than investments resulting from changes in exchange rates. Foreign currency gains and losses on foreign currency transactions are also included with net realized and unrealized gain or loss on investments.
(c) Securities transactions and investment income: Securities transactions are recorded on a trade date basis. Realized gains and losses from securities transactions are recorded on the identified cost basis. Dividend income is recognized on the ex-dividend date and interest income, including, where applicable, accretion of discount and amortization of premium on investments, is recognized on the accrual basis.
Pursuant to a securities lending agreement with The Bank of New York Mellon, a subsidiary of BNY Mellon and an affiliate of Dreyfus, the fund may lend securities to qualified institutions. It is the fund’s policy that, at origination, all loans are secured by collateral of at least 102% of the value of U.S. securities loaned and 105% of the value of foreign securities loaned. Collateral equivalent to at least 100% of the market value of securities on loan is maintained at all times. Collateral is either in the form of cash, which can be invested in certain money market mutual funds managed by the Manager or U.S. Government and Agency securities. The fund is entitled to receive all dividends, interest and distributions on securities loaned, in addition to income earned as a result of the lending transaction. Should a borrower fail to return the securities in a timely manner, The Bank of New York Mellon is required to replace the securities for the benefit of the fund or credit the fund with the market value of the unreturned securities and is subrogated to the fund’s rights against the borrower and the collateral. During the period ended December 31, 2014, The Bank of New York Mellon earned $1,157 from lending portfolio securities, pursuant to the securities lending agreement.
32
(d) Affiliated issuers: Investments in other investment companies advised by Dreyfus are defined as “affiliated” under the Act. Investments in affiliated investment companies during the period ended December 31, 2014 were as follows:
| | | | | |
| Affiliated | | | | | |
| Investment | Value | | | Value | Net |
| Company | 12/31/2013 ($) | Purchases ($) | Sales ($) | 12/31/2014 ($) | Assets (%) |
| Dreyfus | | | | | |
| Institutional | | | | | |
| Preferred | | | | | |
| Plus Money | | | | | |
| Market Fund | 590,938 | 48,478,502 | 48,685,771 | 383,669 | .6 |
| Dreyfus | | | | | |
| Institutional | | | | | |
| Cash Advantage | | | | |
| Fund | 309,420 | 20,193,164 | 19,819,334 | 683,250 | 1.0 |
| Total | 900,358 | 68,671,666 | 68,505,105 | 1,066,919 | 1.6 |
(e) Dividends to shareholders: Dividends are recorded on the ex-dividend date. Dividends from investment income-net are normally declared and paid monthly. Dividends from net realized capital gains, if any, are normally declared and paid annually, but the fund may make distributions on a more frequent basis to comply with the distribution requirements of the Internal Revenue Code of 1986, as amended (the “Code”).To the extent that net realized capital gains can be offset by capital loss carryovers, it is the policy of the fund not to distribute such gains. Income and capital gain distributions are determined in accordance with income tax regulations, which may differ from GAAP.
On December 31, 2014, the Board declared a cash dividend of $.022 and $.019 per share for Initial shares and Service shares, respectively, from undistributed investment income-net payable on January 2, 2015 (ex-dividend date) to shareholders of record as of the close of business on December 31, 2014.
(f) Federal income taxes: It is the policy of the fund to continue to qualify as a regulated investment company, if such qualification is in the
The Fund 33
NOTES TO FINANCIAL STATEMENTS (continued)
best interests of its shareholders, by complying with the applicable provisions of the Code, and to make distributions of taxable income sufficient to relieve it from substantially all federal income and excise taxes.
As of and during the period ended December 31, 2014, the fund did not have any liabilities for any uncertain tax positions.The fund recognizes interest and penalties, if any, related to uncertain tax positions as income tax expense in the Statement of Operations. During the period ended December 31, 2014, the fund did not incur any interest or penalties.
Each tax year in the four-year period ended December 31, 2014 remains subject to examination by the Internal Revenue Service and state taxing authorities.
At December 31, 2014, the components of accumulated earnings on a tax basis were as follows: undistributed ordinary income $209,710, accumulated capital and other losses $1,434,066 and unrealized appreciation $1,933,150.
Under the Regulated Investment Company Modernization Act of 2010 (the “2010 Act”), the fund is permitted to carry forward capital losses incurred in taxable years beginning after December 22, 2010 (“post-enactment losses”) for an unlimited period. Furthermore, post-enactment capital loss carryovers retain their character as either short-term or long-term capital losses rather than short-term as they were under previous statute.The 2010 Act requires post-enactment losses to be utilized before the utilization of losses incurred in taxable years prior to the effective date of the 2010 Act (“pre-enactment losses”).As a result of this ordering rule, pre-enactment losses may be more likely to expire unused.
The accumulated capital loss carryover is available for federal income tax purposes to be applied against future net realized capital gains, if any, realized subsequent to December 31, 2014. If not applied, the carryover expires in fiscal year 2017.
The tax character of distributions paid to shareholders during the fiscal periods ended December 31, 2014 and December 31, 2013 were as follows: ordinary income $1,482,766 and $2,257,095, respectively.
34
During the period ended December 31, 2014, as a result of permanent book to tax differences, primarily due to the tax treatment for amortization of premiums, paydown gains and losses, consent fees and foreign currency transactions, the fund increased accumulated undistributed investment income-net by $5,009 and decreased accumulated net realized gain (loss) on investments by the same amount. Net assets and net asset value per share were not affected by this reclassification.
NOTE 2—Bank Lines of Credit:
The fund participates with other Dreyfus-managed funds in a $430 million unsecured credit facility led by Citibank, N.A. and a $300 million unsecured credit facility provided by The Bank of New York Mellon (each, a “Facility”), each to be utilized primarily for temporary or emergency purposes, including the financing of redemptions. Prior to October 8, 2014, the unsecured credit facility with Citibank, N.A. was $265 million. In connection therewith, the fund has agreed to pay its pro rata portion of commitment fees for each Facility. Interest is charged to the fund based on rates determined pursuant to the terms of the respective Facility at the time of borrowing. During the period ended December 31, 2014, the fund did not borrow under the Facilities.
NOTE 3—Investment Advisory Fee and Other Transactions with Affiliates:
(a) Pursuant to an investment advisory agreement with the Manager, the investment advisory fee is computed at the annual rate of .65% of the value of the fund’s average daily net assets and is payable monthly.
(b) Under the Distribution Plan adopted pursuant to Rule 12b-1 under the Act, Service shares pay the Distributor for distributing its shares, for servicing and/or maintaining Service shares’ shareholder accounts and for advertising and marketing for Service shares. The Distribution Plan provides for payments to be made at an annual rate of .25% of the value of the Service shares’ average daily net assets.The Distributor may make payments to Participating Insurance Companies
The Fund 35
NOTES TO FINANCIAL STATEMENTS (continued)
and to brokers and dealers acting as principal underwriter for their variable insurance products. The fees payable under the Distribution Plan are payable without regard to actual expenses incurred. During the period ended December 31, 2014, Service shares were charged $46,270 pursuant to the Distribution Plan.
The fund has arrangements with the transfer agent and the custodian whereby the fund may receive earnings credits when positive cash balances are maintained, which are used to offset transfer agency and custody fees. For financial reporting purposes, the fund includes net earnings credits as an expense offset in the Statement of Operations.
The fund compensates Dreyfus Transfer, Inc., a wholly-owned subsidiary of the Manager, under a transfer agency agreement for providing transfer agency and cash management services for the fund. The majority of transfer agency fees are comprised of amounts paid on a per account basis, while cash management fees are related to fund subscriptions and redemptions. During the period ended December 31, 2014, the fund was charged $366 for transfer agency services and $35 for cash management services.These fees are included in Shareholder servicing costs in the Statement of Operations. Cash management fees were partially offset by earnings credits of $2.
The fund compensates The Bank of NewYork Mellon under a custody agreement for providing custodial services for the fund.These fees are determined based on net assets, geographic region and transaction activity. During the period ended December 31, 2014, the fund was charged $14,063 pursuant to the custody agreement.
During the period ended December 31, 2014, the fund was charged $7,771 for services performed by the Chief Compliance Officer and his staff.
The components of “Due to The Dreyfus Corporation and affiliates” in the Statement of Assets and Liabilities consist of: investment advisory fees $37,688, Distribution Plan fees $3,722, custodian fees $6,670, Chief Compliance Officer fees $1,851 and transfer agency fees $62.
36
(c) Each Board member also serves as a Board member of other funds within the Dreyfus complex. Annual retainer fees and attendance fees are allocated to each fund based on net assets.
NOTE 4—Securities Transactions:
The aggregate amount of purchases and sales (including paydowns) of investment securities, excluding short-term securities, forward contracts and financial futures, during the period ended December 31, 2014, amounted to $339,796,510 and $351,976,427, respectively, of which $179,765,375 in purchases and $180,243,007 in sales were from mortgage dollar roll transactions.
Mortgage Dollar Rolls: A mortgage dollar roll transaction involves a sale by the fund of mortgage related securities that it holds with an agreement by the fund to repurchase similar securities at an agreed upon price and date.The securities purchased will bear the same interest rate as those sold, but generally will be collateralized by pools of mortgages with different prepayment histories than those securities sold.The fund accounts for mortgage dollar rolls as purchases and sales transactions.
Derivatives: A derivative is a financial instrument whose performance is derived from the performance of another asset. Each type of derivative instrument that was held by the fund during the period ended December 31, 2014 is discussed below.
Master Netting Arrangements: The fund enters into International Swaps and Derivatives Association, Inc. Master Agreements or similar agreements (collectively,“Master Agreements”) with its over-the counter (“OTC”) derivative contract counterparties in order to, among other things, reduce its credit risk to counterparties. Master Agreements include provisions for general obligations, representations, collateral and events of default or termination. Under a Master Agreement, the fund may offset with the counterparty certain derivative financial instrument’s payables and/or receivables with collateral held and/or posted and create one single net payment in the event of default or termination.
The Fund 37
NOTES TO FINANCIAL STATEMENTS (continued)
Financial Futures: In the normal course of pursuing its investment objective, the fund is exposed to market risk, including interest rate risk, as a result of changes in the value of underlying financial instruments. The fund invests in financial futures in order to manage its exposure to or protect against changes in the market. A financial futures contract represents a commitment for the future purchase or a sale of an asset at a specified date. Upon entering into such contracts, these investments require initial margin deposits with a counterparty, which consist of cash or cash equivalents.The amount of these deposits is determined by the exchange or Board of Trade on which the contract is traded and is subject to change. Accordingly, variation margin payments are received or made to reflect daily unrealized gains or losses which are recorded in the Statement of Operations.When the contracts are closed, the fund recognizes a realized gain or loss which is reflected in the Statement of Operations.There is minimal counterparty credit risk to the fund with financial futures since they are exchange traded, and the exchange guarantees the financial futures against default. Financial futures open at December 31, 2014 are set forth in the Statement of Financial Futures.
Forward Foreign Currency Exchange Contracts: The fund enters into forward contracts in order to hedge its exposure to changes in foreign currency exchange rates on its foreign portfolio holdings, to settle foreign currency transactions or as a part of its investment strategy. When executing forward contracts, the fund is obligated to buy or sell a foreign currency at a specified rate on a certain date in the future. With respect to sales of forward contracts, the fund incurs a loss if the value of the contract increases between the date the forward contract is opened and the date the forward contract is closed. The fund realizes a gain if the value of the contract decreases between those dates.With respect to purchases of forward contracts, the fund incurs a loss if the value of the contract decreases between the date the forward contract is opened and the date the forward contract is closed.The fund realizes a gain if the value of the contract increases between those dates. Any
38
realized or unrealized gains or losses which occurred during the period are reflected in the Statement of Operations. The fund is exposed to foreign currency risk as a result of changes in the value of underlying financial instruments. The fund is also exposed to credit risk associated with counterparty nonperformance on these forward contracts, which is generally limited to the unrealized gain on each open contract. This risk is mitigated by Master Agreements between the fund and the counterparty. The following summarizes open forward contracts at December 31, 2014:
| | | | | |
| | Foreign | | | Unrealized | |
| Forward Foreign Currency | Currency | | | Appreciation | |
| Exchange Contracts | Amounts | Proceeds ($) | Value ($) | (Depreciation) ($) | |
| Sales: | | | | | |
| Australian Dollar, | | | | | |
| Expiring | | | | | |
| 1/30/2015a | 615,000 | 509,605 | 500,953 | 8,652 | |
| Euro, | | | | | |
| Expiring | | | | | |
| 1/30/2015a | 415,000 | 514,500 | 502,336 | 12,164 | |
| Singapore Dollar, | | | | | |
| Expiring | | | | | |
| 1/30/2015b | 450,000 | 341,764 | 339,431 | 2,333 | |
| South Korean Won, | | | | | |
| Expiring | | | | | |
| 1/30/2015c | 380,545,000 | 343,917 | 345,651 | (1,734 | ) |
| Gross Unrealized | | | | | |
| Appreciation | | | | 23,149 | |
| Gross Unrealized | | | | | |
| Depreciation | | | | (1,734 | ) |
Counterparties:
| |
| a | Goldman Sachs International |
| b | Citigroup |
| c | JP Morgan Chase Bank |
The following tables show the fund’s exposure to different types of market risk as it relates to the Statement of Assets and Liabilities and the Statement of Operations, respectively.
The Fund 39
NOTES TO FINANCIAL STATEMENTS (continued)
Fair value of derivative instruments as of December 31, 2014 is shown below:
| | | | |
| | Derivative | | Derivative | |
| | Assets ($) | | Liabilities ($) | |
| Foreign exchange risk1 | 23,149 | Foreign exchange risk1 | (1,734 | ) |
| | | Interest rate risk2 | (19,305 | ) |
| Gross fair value of | | | | |
| derivatives contracts | 23,149 | | (21,039 | ) |
Statement of Assets and Liabilities location:
| |
| 1 | Unrealized appreciation (depreciation) on forward foreign currency exchange contracts. |
| 2 | Includes cumulative depreciation on financial futures as reported in the Statement of Financial |
| | Futures, but only the unpaid variation margin is reported in the Statement of Assets and Liabilities. |
The effect of derivative instruments in the Statement of Operations during the period ended December 31, 2014 is shown below:
| | | | | |
| Amount of realized gain (loss) on derivatives recognized in income ($) |
|
| | Financial | | Forward | | |
| Underlying risk | Futures3 | | Contracts4 | Total | |
| Interest rate | (157,889 | ) | — | (157,889 | ) |
| Foreign exchange | — | | 16,410 | 16,410 | |
| Total | (157,889 | ) | 16,410 | (141,479 | ) |
Change in unrealized appreciation (depreciation) on derivatives recognized in income ($)
| | | | | |
| | Financial | | Forward | | |
| Underlying risk | Futures5 | | Contracts6 | Total | |
| Interest rate | (112,680 | ) | — | (112,680 | ) |
| Foreign exchange | — | | 24,962 | 24,962 | |
| Total | (112,680 | ) | 24,962 | (87,718 | ) |
Statement of Operations location:
| |
| 3 | Net realized gain (loss) on financial futures. |
| 4 | Net realized gain (loss) on forward foreign currency exchange contracts. |
| 5 | Net unrealized appreciation (depreciation) on financial futures. |
| 6 | Net unrealized appreciation (depreciation) on forward foreign currency exchange contracts. |
The provisions of ASC Topic 210 “Disclosures about Offsetting Assets and Liabilities” require disclosure on the offsetting of financial assets and liabilities.These disclosures are required for certain investments, including derivative financial instruments subject to Master Agreements which are eligible for offsetting in the Statement of Assets and Liabilities and require the fund to disclose both gross and net information with respect
40
to such investments. For financial reporting purposes, the fund does not offset derivative assets and derivative liabilities that are subject to Master Agreements in the Statement of Assets and Liabilities.
At December 31, 2014, derivative assets and liabilities (by type) on a gross basis are as follows:
| | | |
| Derivative Financial Instruments: | Assets ($) | Liabilities ($) | |
| Financial futures | — | (19,305 | ) |
| Forward contracts | 23,149 | (1,734 | ) |
| Total gross amount of derivative assets | | | |
| and liabilities in the Statement of | | | |
| Assets and Liabilities | 23,149 | (21,039 | ) |
| Derivatives not subject | | | |
| to Master Agreements | — | 19,305 | |
| Total gross amount of assets and | | | |
| liabilities subject to Master Agreements | 23,149 | (1,734 | ) |
The following tables present derivative assets and liabilities net of amounts available for offsetting under Master Agreements and net of related collateral received or pledged, if any, as of December 31, 2014:†
| | | | | | |
| | | | Financial | | | |
| | | | Instruments | | | |
| | | | and | | | |
| | | | Derivatives | | | |
| | Gross Amount of | | Available | Collateral | Net Amount of | |
| Counterparty | Assets ($)1 | | for Offset ($) | Received ($) | Assets ($) | |
| Citigroup | 2,333 | | — | — | 2,333 | |
| Goldman Sachs | | | | | | |
| International | 20,816 | | — | — | 20,816 | |
| Total | 23,149 | | — | — | 23,149 | |
| |
| | | | Financial | | | |
| | | | Instruments | | | |
| | | | and | | | |
| | | | Derivatives | | | |
| | Gross Amount of | | Available | Collateral | Net Amount of | |
| Counterparty | Liabilities ($)1 | | for Offset ($) | Pledged ($) | Liabilities ($) | |
| JP Morgan Chase Bank | (1,734 | ) | — | — | (1,734 | ) |
| Total | (1,734 | ) | — | — | (1,734 | ) |
| |
| 1 | Absent a default event or early termination, OTC derivative assets and liabilities are presented at |
| | gross amounts and are not offset in the Statement of Assets and Liabilities. |
| † | See Statement of Investments for detailed information regarding collateral held for open financial |
| | futures contracts. |
The Fund 41
NOTES TO FINANCIAL STATEMENTS (continued)
The following summarizes the average market value of derivatives outstanding during the period ended December 31, 2014:
| |
| | Average Market Value ($) |
| Interest rate financial futures | 4,592,413 |
| Forward contracts | 791,584 |
At December 31, 2014, the cost of investments for federal income tax purposes was $81,195,989; accordingly, accumulated net unrealized appreciation on investments was $1,936,314, consisting of $2,328,780 gross unrealized appreciation and $392,466 gross unrealized depreciation.
42
REPORT OF INDEPENDENT REGISTERED
PUBLIC ACCOUNTING FIRM
Shareholders and Board of Trustees
Dreyfus Variable Investment Fund, Quality Bond Portfolio
We have audited the accompanying statement of assets and liabilities, including the statements of investments and financial futures, of Dreyfus Variable Investment Fund, Quality Bond Portfolio (one of the series comprising DreyfusVariable Investment Fund) as of December 31, 2014, and the related statement of operations for the year then ended, the statement of changes in net assets for each of the two years in the period then ended, and the financial highlights for each of the five years in the period then ended. These financial statements and financial highlights are the responsibility of the Fund’s management. Our responsibility is to express an opinion on these financial statements and financial highlights based on our audits.
We conducted our audits in accordance with the standards of the Public Company Accounting Oversight Board (United States).Those standards require that we plan and perform the audit to obtain reasonable assurance about whether the financial statements and financial highlights are free of material misstatement. We were not engaged to perform an audit of the Fund’s internal control over financial reporting. Our audits included consideration of internal control over financial reporting as a basis for designing audit procedures that are appropriate in the circumstances, but not for the purpose of expressing an opinion on the effectiveness of the Fund’s internal control over financial reporting. Accordingly, we express no such opinion. An audit also includes examining, on a test basis, evidence supporting the amounts and disclosures in the financial statements and financial highlights, assessing the accounting principles used and significant estimates made by management, and evaluating the overall financial statement presentation. Our procedures included confirmation of securities owned as of December 31, 2014 by correspondence with the custodian and others.We believe that our audits provide a reasonable basis for our opinion.
In our opinion, the financial statements and financial highlights referred to above present fairly, in all material respects, the financial position of Dreyfus Variable Investment Fund, Quality Bond Portfolio at December 31, 2014, the results of its operations for the year then ended, the changes in its net assets for each of the two years in the period then ended, and the financial highlights for each of the five years in the period then ended, in conformity with U.S. generally accepted accounting principles.

New York, New York
February 11, 2015
The Fund 43
BOARD MEMBERS INFORMATION (Unaudited)
INDEPENDENT BOARD MEMBERS
|
| Joseph S. DiMartino (71) |
| Chairman of the Board (1995) |
| Principal Occupation During Past 5Years: |
| • Corporate Director and Trustee (1995-present) |
| Other Public Company Board Memberships During Past 5Years: |
| • CBIZ (formerly, Century Business Services, Inc.), a provider of outsourcing functions for small |
| and medium size companies, Director (1997-present) |
| • The Newark Group, a provider of a national market of paper recovery facilities, paperboard |
| mills and paperboard converting plants, Director (2000-2010) |
| • Sunair Services Corporation, a provider of certain outdoor-related services to homes and |
| businesses, Director (2005-2009) |
| No. of Portfolios for which Board Member Serves: 146 |
| ——————— |
| Peggy C. Davis (71) |
| Board Member (2006) |
| Principal Occupation During Past 5Years: |
| • Shad Professor of Law, New York University School of Law (1983-present) |
| No. of Portfolios for which Board Member Serves: 52 |
| ——————— |
| David P. Feldman (75) |
| Board Member (1994) |
| Principal Occupation During Past 5Years: |
| • Corporate Director and Trustee (1985-present) |
| Other Public Company Board Membership During Past 5Years: |
| • BBH Mutual Funds Group (5 registered mutual funds), Director (1992-present) |
| No. of Portfolios for which Board Member Serves: 38 |
| ——————— |
| Ehud Houminer (74) |
| Board Member (2006) |
| Principal Occupation During Past 5Years: |
| • Executive-in-Residence at the Columbia Business School, Columbia University (1992-present) |
| Other Public Company Board Membership During Past 5Years: |
| • Avnet, Inc., an electronics distributor, Director (1993-2012) |
| No. of Portfolios for which Board Member Serves: 62 |
44
|
| Lynn Martin (75) |
| Board Member (2012) |
| Principal Occupation During Past 5Years: |
| • President of The Martin Hall Group LLC, a human resources consulting firm (2005-2012) |
| Other Public Company Board Memberships During Past 5Years: |
| • AT&T, Inc., a telecommunications company, Director (1999-2012) |
| • Ryder System, Inc., a supply chain and transportation management company, Director (1993-2012) |
| • The Proctor & Gamble Co., a consumer products company, Director (1994-2009) |
| • Constellation Energy Group, Inc., Director (2003-2009) |
| No. of Portfolios for which Board Member Serves: 38 |
| |
| ——————— |
| Robin A. Melvin (51) |
| Board Member (2012) |
| Principal Occupation During Past 5Years: |
| • Board Member, Illinois Mentoring Partnership, non-profit organization dedicated to increasing |
| the quantity and quality of mentoring services in Illinois (2013-present) |
| • Director, Boisi Family Foundation, a private family foundation that supports youth-serving orga- |
| nizations that promote the self sufficiency of youth from disadvantaged circumstances (1995-2012) |
| No. of Portfolios for which Board Member Serves: 114 |
| |
| ——————— |
| Dr. Martin Peretz (75) |
| Board Member (1990) |
| Principal Occupation During Past 5Years: |
| • Editor-in-Chief Emeritus of The New Republic Magazine (2010-2011) (previously, |
| Editor-in-Chief, 1974-2010) |
| • Director of TheStreet.com, a financial information service on the web (1996-2010) |
| No. of Portfolios for which Board Member Serves: 38 |
| |
| ——————— |
| Once elected all Board Members serve for an indefinite term, but achieve Emeritus status upon reaching age 80.The |
| address of the Board Members and Officers is c/o The Dreyfus Corporation, 200 Park Avenue, NewYork, NewYork |
| 10166.Additional information about the Board Members is available in the fund’s Statement of Additional Information |
| which can be obtained from Dreyfus free of charge by calling this toll free number: 1-800-DREYFUS. |
| James F. Henry, Emeritus Board Member |
| Rosalind G. Jacobs, Emeritus Board Member |
| Dr. Paul A. Marks, Emeritus Board Member |
| Philip L.Toia, Emeritus Board Member |
The Fund 45
OFFICERS OF THE FUND (Unaudited)

46

The Fund 47
For More Information

Telephone 1-800-554-4611 or 516-338-3300
Mail The Dreyfus Family of Funds, 144 Glenn Curtiss Boulevard, Uniondale, NY 11556-0144
Attn: Investments Division
The fund files its complete schedule of portfolio holdings with the Securities and Exchange Commission (“SEC”) for the first and third quarters of each fiscal year on Form N-Q. The fund’s Forms N-Q are available on the SEC’s website at http://www.sec.gov and may be reviewed and copied at the SEC’s Public Reference Room in Washington, DC. Information on the operation of the Public Reference Room may be obtained by calling 1-800-SEC-0330.
A description of the policies and procedures that the fund uses to determine how to vote proxies relating to portfolio securities, and information regarding how the fund voted these proxies for the most recent 12-month period ended June 30 is available at http://www.dreyfus.com and on the SEC’s website at http://www.sec.gov. The description of the policies and procedures is also available without charge, upon request, by calling 1-800-DREYFUS.

Item 2. Code of Ethics.
The Registrant has adopted a code of ethics that applies to the Registrant's principal executive officer, principal financial officer, principal accounting officer or controller, or persons performing similar functions. There have been no amendments to, or waivers in connection with, the Code of Ethics during the period covered by this Report.
Item 3. Audit Committee Financial Expert.
The Registrant's Board has determined that David P. Feldman, a member of the Audit Committee of the Board, is an audit committee financial expert as defined by the Securities and Exchange Commission (the "SEC"). David P. Feldman is "independent" as defined by the SEC for purposes of audit committee financial expert determinations.
Item 4. Principal Accountant Fees and Services.
(a) Audit Fees. The aggregate fees billed for each of the last two fiscal years (the "Reporting Periods") for professional services rendered by the Registrant's principal accountant (the "Auditor") for the audit of the Registrant's annual financial statements or services that are normally provided by the Auditor in connection with the statutory and regulatory filings or engagements for the Reporting Periods, were $249,463 in 2013 and $254,454 in 2014.
(b) Audit-Related Fees. The aggregate fees billed in the Reporting Periods for assurance and related services by the Auditor that are reasonably related to the performance of the audit of the Registrant's financial statements and are not reported under paragraph (a) of this Item 4 were $ 63,563 in 2013 and $67,253 in 2014. These services consisted of one or more of the following: (i) agreed upon procedures related to compliance with Internal Revenue Code section 817(h), (ii) security counts required by Rule 17f-2 under the Investment Company Act of 1940, as amended, (iii) advisory services as to the accounting or disclosure treatment of Registrant transactions or events and (iv) advisory services to the accounting or disclosure treatment of the actual or potential impact to the Registrant of final or proposed rules, standards or interpretations by the Securities and Exchange Commission, the Financial Accounting Standards Boards or other regulatory or standard-setting bodies.
The aggregate fees billed in the Reporting Periods for non-audit assurance and related services by the Auditor to the Registrant's investment adviser (not including any sub-investment adviser whose role is primarily portfolio management and is subcontracted with or overseen by another investment adviser), and any entity controlling, controlled by or under common control with the investment adviser that provides ongoing services to the Registrant ("Service Affiliates"), that were reasonably related to the performance of the annual audit of the Service Affiliate, which required pre-approval by the Audit Committee were $-0- in 2013 and $-0- in 2014.
(c) Tax Fees. The aggregate fees billed in the Reporting Periods for professional services rendered by the Auditor for tax compliance, tax advice, and tax planning ("Tax Services") were $35,355 in 2013 and $38,121 in 2014. These services consisted of: (i) review or preparation of U.S. federal, state, local and excise tax returns; (ii) U.S. federal, state and local tax planning, advice and assistance regarding statutory, regulatory or administrative developments; (iii) tax advice regarding tax qualification matters and/or treatment of various financial instruments held or proposed to be acquired or held, and (iv) determination of Passive Foreign Investment Companies. The aggregate fees billed in the Reporting Periods for Tax Services by the Auditor to Service Affiliates, which required pre-approval by the Audit Committee were $-0- in 2013 and $-0- in 2014.
(d) All Other Fees. The aggregate fees billed in the Reporting Periods for products and services provided by the Auditor, other than the services reported in paragraphs (a) through (c) of this Item, were $32 in 2013 and $4,204 in 2014. These services included a review of the Registrant's anti-money laundering program.
The aggregate fees billed in the Reporting Periods for Non-Audit Services by the Auditor to Service Affiliates, other than the services reported in paragraphs (b) through (c) of this Item, which required pre-approval by the Audit Committee, were $-0- in 2013 and $-0- in 2014.
(e)(1) Audit Committee Pre-Approval Policies and Procedures. The Registrant's Audit Committee has established policies and procedures (the "Policy") for pre-approval (within specified fee limits) of the Auditor's engagements for non-audit services to the Registrant and Service Affiliates without specific case-by-case consideration. The pre-approved services in the Policy can include pre-approved audit services, pre-approved audit-related services, pre-approved tax services and pre-approved all other services. Pre-approval considerations include whether the proposed services are compatible with maintaining the Auditor's independence. Pre-approvals pursuant to the Policy are considered annually.
(e)(2) Note: None of the services described in paragraphs (b) through (d) of this Item 4 were approved by the Audit Committee pursuant to paragraph (c)(7)(i)(C) of Rule 2-01 of Regulation S-X.
(f) None of the hours expended on the principal accountant's engagement to audit the registrant's financial statements for the most recent fiscal year were attributed to work performed by persons other than the principal account's full-time, permanent employees.
Non-Audit Fees. The aggregate non-audit fees billed by the Auditor for services rendered to the Registrant, and rendered to Service Affiliates, for the Reporting Periods were $50,384,343 in 2013 and $23,307,177 in 2014.
Auditor Independence. The Registrant's Audit Committee has considered whether the provision of non-audit services that were rendered to Service Affiliates, which were not pre-approved (not requiring pre-approval), is compatible with maintaining the Auditor's independence.
Item 5. Audit Committee of Listed Registrants.
Not applicable. [CLOSED-END FUNDS ONLY]
Item 6. Investments.
(a) Not applicable.
Item 7. Disclosure of Proxy Voting Policies and Procedures for Closed-End Management Investment Companies.
Not applicable. [CLOSED-END FUNDS ONLY]
Item 8. Portfolio Managers of Closed-End Management Investment Companies.
Not applicable. [CLOSED-END FUNDS ONLY, beginning with reports for periods ended on and after December 31, 2005]
Item 9. Purchases of Equity Securities by Closed-End Management Investment Companies and Affiliated Purchasers.
Not applicable. [CLOSED-END FUNDS ONLY]
Item 10. Submission of Matters to a Vote of Security Holders.
There have been no material changes to the procedures applicable to Item 10.
Item 11. Controls and Procedures.
(a) The Registrant's principal executive and principal financial officers have concluded, based on their evaluation of the Registrant's disclosure controls and procedures as of a date within 90 days of the filing date of this report, that the Registrant's disclosure controls and procedures are reasonably designed to ensure that information required to be disclosed by the Registrant on Form N-CSR is recorded, processed, summarized and reported within the required time periods and that information required to be disclosed by the Registrant in the reports that it files or submits on Form N-CSR is accumulated and communicated to the Registrant's management, including its principal executive and principal financial officers, as appropriate to allow timely decisions regarding required disclosure.
(b) There were no changes to the Registrant's internal control over financial reporting that occurred during the second fiscal quarter of the period covered by this report that have materially affected, or are reasonably likely to materially affect, the Registrant's internal control over financial reporting.
Item 12. Exhibits.
(a)(1) Code of ethics referred to in Item 2.
(a)(2) Certifications of principal executive and principal financial officers as required by Rule 30a-2(a) under the Investment Company Act of 1940.
(a)(3) Not applicable.
(b) Certification of principal executive and principal financial officers as required by Rule 30a-2(b) under the Investment Company Act of 1940.
SIGNATURES
Pursuant to the requirements of the Securities Exchange Act of 1934 and the Investment Company Act of 1940, the Registrant has duly caused this Report to be signed on its behalf by the undersigned, thereunto duly authorized.
Dreyfus Variable Investment Fund
By: /s/Bradley J. Skapyak
Bradley J. Skapyak,
President
Date: February 10, 2015
Pursuant to the requirements of the Securities Exchange Act of 1934 and the Investment Company Act of 1940, this Report has been signed below by the following persons on behalf of the Registrant and in the capacities and on the dates indicated.
By: /s/Bradley J. Skapyak
Bradley J. Skapyak,
President
Date: February 10, 2015
By: /s/James Windels
James Windels,
Treasurer
Date: February 10, 2015
EXHIBIT INDEX
(a)(1) Code of ethics referred to in Item 2.
(a)(2) Certifications of principal executive and principal financial officers as required by Rule 30a-2(a) under the Investment Company Act of 1940. (EX-99.CERT)
(b) Certification of principal executive and principal financial officers as required by Rule 30a-2(b) under the Investment Company Act of 1940. (EX-99.906CERT)