UNITED STATES
SECURITIES AND EXCHANGE COMMISSION
Washington, D.C. 20549
FORM N-CSR
CERTIFIED SHAREHOLDER REPORT OF REGISTERED MANAGEMENT
INVESTMENT COMPANIES
Investment Company Act file number | 811-05125 |
| |
| Dreyfus Variable Investment Fund | |
| (Exact name of Registrant as specified in charter) | |
| | |
| c/o The Dreyfus Corporation 200 Park Avenue New York, New York 10166 | |
| (Address of principal executive offices) (Zip code) | |
| | |
| Bennett A. MacDougall, Esq. 200 Park Avenue New York, New York 10166 | |
| (Name and address of agent for service) | |
|
Registrant's telephone number, including area code: | (212) 922-6400 |
| |
Date of fiscal year end: | 12/31 | |
Date of reporting period: | 12/31/17 | |
| | | | | | | |
FORM N-CSR
Item 1. Reports to Stockholders.
Dreyfus Variable Investment Fund, Appreciation Portfolio
| | | |

| | ANNUAL REPORT
December 31, 2017 |
| |
The views expressed in this report reflect those of the portfolio manager(s) only through the end of the period covered and do not necessarily represent the views of Dreyfus or any other person in the Dreyfus organization. Any such views are subject to change at any time based upon market or other conditions and Dreyfus disclaims any responsibility to update such views. These views may not be relied on as investment advice and, because investment decisions for a Dreyfus fund are based on numerous factors, may not be relied on as an indication of trading intent on behalf of any Dreyfus fund. |
| |
Not FDIC-Insured • Not Bank-Guaranteed • May Lose Value |
Contents
THE FUND
FOR MORE INFORMATION
Back Cover
| | | | |
| |
Dreyfus Variable Investment Fund, Appreciation Portfolio
| | The Fund |
A LETTER FROM THE PRESIDENT OF DREYFUS
Dear Shareholder:
We are pleased to present this annual report for Dreyfus Variable Investment Fund, Appreciation Portfolio, covering the 12-month period from January 1, 2017 through December 31, 2017. For information about how the fund performed during the reporting period, as well as general market perspectives, we provide a Discussion of Fund Performance on the pages that follow.
Stocks set a series of new record highs and bonds produced modestly positive results during 2017. Financial markets early in the year were dominated by the inauguration of a new U.S. president, as equities and corporate-backed bonds surged higher in anticipation of more business-friendly regulatory, tax, and fiscal policies. U.S. and international stocks continued to rally in the spring as corporate earnings grew and global economic conditions improved. Later in the year, the passage of tax reform legislation fueled additional stock market gains.
Despite three short-term interest rate hikes and concerns early in the year that inflation might accelerate in a growing economy, bonds generally produced positive total returns in 2017. Corporate-backed securities and municipal bonds fared particularly well.
The markets’ strong performance last year was supported by solid underlying fundamentals, including sustained economic growth, a robust labor market, and low inflation. We currently expect these favorable conditions to persist in 2018, but we remain watchful for economic and political developments that could negatively impact the markets. As always, we encourage you to discuss the risks and opportunities of today’s investment environment with your financial advisor.
Thank you for your continued confidence and support.
Sincerely,

Renee Laroche-Morris
President
The Dreyfus Corporation
January 16, 2017
2
DISCUSSION OF FUND PERFORMANCE
For the period from January 1, 2017 through December 31, 2017, as provided by portfolio manager Fayez Sarofim of Fayez Sarofim & Co., Sub-Investment Adviser
Market and Fund Performance Overview
For the 12-month period ended December 31, 2017, Dreyfus Variable Investment Fund, Appreciation Portfolio’s Initial shares achieved a total return of 27.33%, and its Service shares achieved a total return of 27.00%.1 In comparison, the S&P 500® Index (the “Index”), the fund’s benchmark, provided a total return of 21.82% for the same period.2
Stocks gained ground in 2017 amid better-than-expected corporate earnings and in anticipation of more stimulative U.S. government policies. Favorable stock selections in the information technology and health care sectors enabled the fund to outperform the Index.
The Fund’s Investment Approach
The fund seeks long-term capital growth consistent with the preservation of capital. Its secondary goal is current income. To pursue these goals, the fund normally invests at least 80% of its net assets in common stocks. The fund focuses on blue-chip companies with total market capitalizations of more than $5 billion at the time of purchase, including multinational companies. These are established companies that have demonstrated sustained patterns of profitability, strong balance sheets, an expanding global presence, and the potential to achieve predictable, above-average earnings growth.
In choosing stocks, we identify economic sectors we believe will expand over the next three to five years or longer. Using fundamental analysis, we then seek companies within these sectors that have proven track records and dominant positions in their industries. The fund employs a “buy-and-hold” investment strategy, which generally has resulted in an annual portfolio turnover rate of below 15%. A low portfolio turnover rate helps reduce the fund’s trading costs and can help limit the distribution of capital gains generated due to portfolio turnover.3
Rising Corporate Earnings Drove Markets Higher
U.S. equities enjoyed steady gains in 2017 as the economy expanded, corporate profits rebounded, and financial-markets volatility waned, powering the Index to a series of all-time highs and a double-digit return for the year. The Federal Reserve Board’s tightening cycle gained traction while most other central banks continued to ease, and the value of the U.S. dollar declined relative to other major currencies. The softer dollar, coupled with strengthening global growth prospects, helped support the performance of many foreign equity markets as well as domestic companies with ample international sales exposure. The information technology sector proved to be
3
DISCUSSION OF FUND PERFORMANCE (continued)
the best-performing market segment in 2017, contributing almost 40% of the Index’s rise with strength concentrated in mega-cap companies. The telecommunication services and energy sectors were the only segments of the Index to post declines for the year.
Security Selections Drove Relative Performance
The fund meaningfully outperformed the Index in 2017, supported by the overall impact of our stock selection strategy. The fund’s overweighted and selectively focused representation in the top-performing information technology sector was the most significant contributor to relative and absolute results. Correctly emphasized representation in the health care sector also added value compared to the Index. Positions in pharmaceutical developers AbbVie, Abbott Laboratories, and Novo Nordisk generated returns of more than 50% for the year. In the financials sector, the fund’s focus on capital markets, one of the sector’s better-performing segments, also was constructive. The largest contributors to the fund’s return for the year included Apple, Facebook, Microsoft, Philip Morris International, and Texas Instruments.
Factors that modestly constrained relative results during the year included an above-market allocation to the lagging energy sector. This impact, however, was tempered by an emphasis on the major integrated oils, which generally are less sensitive to crude oil prices than oilfield and equipment stocks. Another impediment to relative results was overweighted exposure to the consumer staples sector, though correct stock focus within the sector entirely offset the negative allocation effect, and the sector’s total relative impact on the fund’s performance was positive. The largest detractors from the fund’s returns in 2017 were Exxon Mobil, Occidental Petroleum, Walgreens Boots Alliance, Gilead Sciences, and Air Products and Chemicals.
Positioned for Continued Growth
Although the current bull market is just three months shy of its ninth birthday, we believe that stocks enter 2018 with strong tailwinds, including improving global growth, strong corporate earnings, the impact of tax-reform legislation, and accommodative monetary policies among central banks. However, last year’s supportive combination of positive economic surprises and subdued volatility will be hard to replicate, and we expect market leadership to narrow as the economic cycle matures and as investors seek out fundamentally sound companies with risk-mitigating qualities. Our long-practiced investment approach focuses on such companies. The fund’s portfolio is composed of what we believe are high-quality, competitively advantaged businesses that have proven themselves capable of growing global market share and earnings across market cycles. With their solid balance sheets, ample financial resources, and disciplined capital allocation policies,
4
these multinational industry leaders should be well positioned to build shareholder value even through periods of market fluctuations.
January 16, 2018
1 Total return includes reinvestment of dividends and any capital gains paid. Past performance is no guarantee of future results. Share price and investment return fluctuate such that upon redemption, fund shares may be worth more or less than their original cost. The fund’s performance does not reflect the deduction of additional charges and expenses imposed in connection with investing in variable insurance contracts, which will reduce returns.
2 Source: Lipper Inc. — The S&P 500® Index is widely regarded as the best single gauge of large-cap U.S. equities. The index includes 500 leading companies and captures approximately 80% coverage of available market capitalization. Investors cannot invest directly in any index.
3 Achieving tax efficiency is not a part of the fund’s investment objective, and there can be no guarantee that the fund will achieve any particular level of taxable distributions in future years. In periods when the manager has to sell significant amounts of securities (e.g., during periods of significant net redemptions or changes in index components), the fund can be expected to be less tax efficient than during periods of more stable market conditions and asset flows.
Please note: the position in any security highlighted with italicized typeface was sold during the reporting period.
Equities are subject generally to market, market sector, market liquidity, issuer, and investment style risks, among other factors, to varying degrees, all of which are more fully described in the fund’s prospectus.
The fund is only available as a funding vehicle under variable life insurance policies or variable annuity contracts issued by insurance companies. Individuals may not purchase shares of the fund directly. A variable annuity is an insurance contract issued by an insurance company that enables investors to accumulate assets on a tax-deferred basis for retirement or other long-term goals. The investment objective and policies of Dreyfus Variable Investment Fund, Appreciation Portfolio made available through insurance products may be similar to those of other funds managed by Dreyfus. However, the investment results of the fund may be higher or lower than, and may not be comparable to, those of any other Dreyfus fund.
5
FUND PERFORMANCE

Comparison of change in value of $10,000 investment in Dreyfus Variable Investment Fund, Appreciation Portfolio Initial shares and Service shares and the S&P 500® Index (the “Index”)
† Source: Lipper Inc.
Past performance is not predictive of future performance. The fund’s performance does not reflect the deduction of additional charges and expenses imposed in connection with investing in variable insurance contracts which will reduce returns.
The above graph compares a $10,000 investment made in Initial and Service shares of Dreyfus Variable Investment Fund, Appreciation Portfolio on 12/31/07 to a $10,000 investment made in the Index on that date.
The fund’s performance shown in the line graph above takes into account all applicable fund fees and expenses for Initial and Service shares. The Index is widely regarded as the best single gauge of large-cap U.S. equities. The index includes 500 leading companies and captures approximately 80% coverage of available market capitalization. Unlike a mutual fund, the Index is not subject to charges, fees and other expenses. Investors cannot invest directly in any index. Further information relating to fund performance, including expense reimbursements, if applicable, is contained in the Financial Highlights section of the prospectus and elsewhere in this report.
| | | | |
Average Annual Total Returns as of 12/31/17 |
| 1 Year | 5 Years | 10 Years |
Initial shares | 27.33% | 11.90% | 7.72% |
Service shares | 27.00% | 11.62% | 7.45% |
S&P 500® Index | 21.82% | 15.78% | 8.49% |
The performance data quoted represents past performance, which is no guarantee of future results. Share price and investment return fluctuate and an investor’s shares may be worth more or less than original cost upon redemption. Current performance may be lower or higher than the performance quoted. Go to Dreyfus.com for the fund’s most recent month-end returns.
The fund’s Initial shares are not subject to a Rule 12b-1 fee. The fund’s Service shares are subject to a 0.25% annual Rule 12b-1 fee. All dividends and capital gain distributions are reinvested.
The fund’s performance shown in the graph and table does not reflect the deduction of taxes that a shareholder would pay on fund distributions or the redemption of fund shares.
6
UNDERSTANDING YOUR FUND’S EXPENSES (Unaudited)
As a mutual fund investor, you pay ongoing expenses, such as management fees and other expenses. Using the information below, you can estimate how these expenses affect your investment and compare them with the expenses of other funds. You also may pay one-time transaction expenses, including sales charges (loads), redemption fees and expenses associated with variable annuity or insurance contracts, which are not shown in this section and would have resulted in higher total expenses. For more information, see your fund’s prospectus or talk to your financial adviser.
Review your fund’s expenses
The table below shows the expenses you would have paid on a $1,000 investment in Dreyfus Variable Investment Fund, Appreciation Portfolio from July 1, 2017 to December 31, 2017. It also shows how much a $1,000 investment would be worth at the close of the period, assuming actual returns and expenses.
| | | | | | | | |
Expenses and Value of a $1,000 Investment | | |
assuming actual returns for the six months ended December 31, 2017 | |
| | | | Initial Shares | Service Shares |
Expenses paid per $1,000† | | | $4.28 | | $5.61 |
Ending value (after expenses) | | | $1,122.90 | | $1,121.50 |
COMPARING YOUR FUND’S EXPENSES
WITH THOSE OF OTHER FUNDS (Unaudited)
Using the SEC’s method to compare expenses
The Securities and Exchange Commission (“SEC”) has established guidelines to help investors assess fund expenses. Per these guidelines, the table below shows your fund’s expenses based on a $1,000 investment, assuming a hypothetical 5% annualized return. You can use this information to compare the ongoing expenses (but not transaction expenses or total cost) of investing in the fund with those of other funds. All mutual fund shareholder reports will provide this information to help you make this comparison. Please note that you cannot use this information to estimate your actual ending account balance and expenses paid during the period.
| | | | | | | | |
Expenses and Value of a $1,000 Investment | | |
assuming a hypothetical 5% annualized return for the six months ended December 31, 2017 |
| | | | Initial Shares | Service Shares |
Expenses paid per $1,000† | | | $4.08 | | $5.35 |
Ending value (after expenses) | | | $1,021.17 | | $1,019.91 |
† Expenses are equal to the fund’s annualized expense ratio of .80% for Initial shares and 1.05% for Service shares, multiplied by the average account value over the period, multiplied by 184/365 (to reflect the one-half year period).
7
STATEMENT OF INVESTMENTS
December 31, 2017
| | | | | | | | |
| |
Description | | | | Shares | | Value ($) | |
Common Stocks - 99.4% | | | | | |
Banks - 4.8% | | | | | |
JPMorgan Chase & Co. | | | | 138,000 | | 14,757,720 | |
Wells Fargo & Co. | | | | 87,325 | | 5,298,008 | |
| | | | | 20,055,728 | |
Capital Goods - 1.6% | | | | | |
United Technologies | | | | 51,900 | | 6,620,883 | |
Consumer Durables & Apparel - 2.5% | | | | | |
Hermes International | | | | 2,677 | | 1,432,976 | |
LVMH Moet Hennessy Louis Vuitton | | | | 15,500 | | 4,553,112 | |
NIKE, Cl. B | | | | 72,840 | | 4,556,142 | |
| | | | | 10,542,230 | |
Consumer Services - 1.5% | | | | | |
McDonald's | | | | 36,650 | | 6,308,198 | |
Diversified Financials - 8.9% | | | | | |
American Express | | | | 73,125 | | 7,262,044 | |
BlackRock | | | | 21,750 | | 11,173,192 | |
Intercontinental Exchange | | | | 81,700 | | 5,764,752 | |
S&P Global | | | | 35,675 | | 6,043,345 | |
State Street | | | | 71,425 | | 6,971,794 | |
| | | | | 37,215,127 | |
Energy - 6.7% | | | | | |
Chevron | | | | 86,950 | | 10,885,270 | |
ConocoPhillips | | | | 89,650 | | 4,920,889 | |
Exxon Mobil | | | | 147,614 | | 12,346,435 | |
| | | | | 28,152,594 | |
Food & Staples Retailing - .9% | | | | | |
Walgreens Boots Alliance | | | | 52,100 | | 3,783,502 | |
Food, Beverage & Tobacco - 18.5% | | | | | |
Altria Group | | | | 190,200 | | 13,582,182 | |
Anheuser-Busch, ADR | | | | 37,800 | | 4,216,968 | |
Coca-Cola | | | | 246,125 | | 11,292,215 | |
Constellation Brands, Cl. A | | | | 23,100 | | 5,279,967 | |
Nestle, ADR | | | | 117,575 | | 10,107,923 | |
PepsiCo | | | | 66,575 | | 7,983,674 | |
Philip Morris International | | | | 232,850 | | 24,600,602 | |
| | | | | 77,063,531 | |
Health Care Equipment & Services - 2.6% | | | | | |
Abbott Laboratories | | | | 110,825 | | 6,324,783 | |
UnitedHealth Group | | | | 20,500 | | 4,519,430 | |
| | | | | 10,844,213 | |
Household & Personal Products - 3.7% | | | | | |
Estee Lauder, Cl. A | | | | 84,825 | | 10,793,133 | |
8
| | | | | | | | |
| |
Description | | | | Shares | | Value ($) | |
Common Stocks - 99.4% (continued) | | | | | |
Household & Personal Products - 3.7% (continued) | | | | | |
Procter & Gamble | | | | 49,025 | | 4,504,417 | |
| | | | | 15,297,550 | |
Insurance - 2.8% | | | | | |
Chubb | | | | 79,350 | | 11,595,415 | |
Materials - 2.0% | | | | | |
Air Products & Chemicals | | | | 9,925 | | 1,628,494 | |
Praxair | | | | 42,825 | | 6,624,171 | |
| | | | | 8,252,665 | |
Media - 5.6% | | | | | |
Comcast, Cl. A | | | | 253,375 | | 10,147,669 | |
Twenty-First Century Fox, Cl. A | | | | 140,711 | | 4,858,751 | |
Walt Disney | | | | 75,850 | | 8,154,634 | |
| | | | | 23,161,054 | |
Pharmaceuticals, Biotechnology & Life Sciences - 6.6% | | | | | |
AbbVie | | | | 83,925 | | 8,116,387 | |
Novartis, ADR | | | | 57,925 | | 4,863,383 | |
Novo Nordisk, ADR | | | | 149,175 | | 8,006,222 | |
Roche Holding, ADR | | | | 212,400 | | 6,707,592 | |
| | | | | 27,693,584 | |
Semiconductors & Semiconductor Equipment - 5.0% | | | | | |
ASML Holding | | | | 38,250 | | 6,648,615 | |
Texas Instruments | | | | 136,675 | | 14,274,337 | |
| | | | | 20,922,952 | |
Software & Services - 16.7% | | | | | |
Alphabet, Cl. C | | | | 13,769 | a | 14,407,882 | |
Automatic Data Processing | | | | 18,965 | | 2,222,508 | |
Facebook, Cl. A | | | | 119,185 | a | 21,031,385 | |
Microsoft | | | | 257,010 | | 21,984,635 | |
Visa, Cl. A | | | | 87,900 | b | 10,022,358 | |
| | | | | 69,668,768 | |
Technology Hardware & Equipment - 5.9% | | | | | |
Apple | | | | 145,825 | | 24,677,965 | |
Transportation - 3.1% | | | | | |
Canadian Pacific Railway | | | | 32,575 | | 5,953,407 | |
Union Pacific | | | | 52,200 | | 7,000,020 | |
| | | | | 12,953,427 | |
Total Common Stocks (cost $174,392,042) | | | | 414,809,386 | |
9
STATEMENT OF INVESTMENTS (continued)
| | | | | | | | |
| |
Description | | | | Shares | | Value ($) | |
Other Investment - .5% | | | | | |
Registered Investment Company; | | | | | |
Dreyfus Institutional Preferred Government Plus Money Market Fund
(cost $1,867,769) | | | | 1,867,769 | c | 1,867,769 | |
Total Investments (cost $176,259,811) | | 99.9% | | 416,677,155 | |
Cash and Receivables (Net) | | .1% | | 598,029 | |
Net Assets | | 100.0% | | 417,275,184 | |
ADR—American Depository Receipt
aNon-income producing security.
bSecurity, or portion thereof, on loan. At December 31, 2017, the value of the fund’s securities on loan was $9,922,134 and the value of the collateral held by the fund was $10,150,840, consisting of U.S. Government & Agency securities.
cInvestment in affiliated money market mutual fund.
| | |
Portfolio Summary (Unaudited) † | Value (%) |
Food, Beverage & Tobacco | 18.5 |
Software & Services | 16.7 |
Diversified Financials | 8.9 |
Energy | 6.7 |
Pharmaceuticals, Biotechnology & Life Sciences | 6.6 |
Technology Hardware & Equipment | 5.9 |
Media | 5.6 |
Semiconductors & Semiconductor Equipment | 5.0 |
Banks | 4.8 |
Household & Personal Products | 3.7 |
Transportation | 3.1 |
Insurance | 2.8 |
Health Care Equipment & Services | 2.6 |
Consumer Durables & Apparel | 2.5 |
Materials | 2.0 |
Capital Goods | 1.6 |
Consumer Services | 1.5 |
Food & Staples Retailing | .9 |
Money Market Investment | .5 |
| | 99.9 |
† Based on net assets.
See notes to financial statements.
10
STATEMENT OF INVESTMENTS IN AFFILIATED ISSUERS
| | | | | | | |
Registered Investment Companies | Value
12/31/16($) | Purchases($) | Sales ($) | Value
12/31/17($) | Net
Assets(%) | Dividends/
Distributions($) |
Dreyfus Institutional Preferred Government Money Market Fund, Institutional Shares | 1,363,070 | 125,398,599 | 126,761,669 | – | – | – |
Dreyfus Institutional Preferred Government Plus Money Market Fund | 2,116,167 | 44,868,509 | 45,116,907 | 1,867,769 | .5 | 14,735 |
Total | 3,479,237 | 170,267,108 | 171,878,576 | 1,867,769 | .5 | 14,735 |
See notes to financial statements.
11
STATEMENT OF ASSETS AND LIABILITIES
December 31, 2017
| | | | | | | |
| | | | | | |
| | | Cost | | Value | |
Assets ($): | | | | |
Investments in securities—See Statement of Investments
(including securities on loan, valued at $9,922,134)—Note 1(c): | | | |
Unaffiliated issuers | 174,392,042 | | 414,809,386 | |
Affiliated issuers | | 1,867,769 | | 1,867,769 | |
Cash | | | | | 13,407 | |
Dividends and securities lending income receivable | | 806,913 | |
Receivable for investment securities sold | | 613,104 | |
Prepaid expenses | | | | | 4,239 | |
| | | | | 418,114,818 | |
Liabilities ($): | | | | |
Due to The Dreyfus Corporation and affiliates—Note 3(b) | | | | | 237,695 | |
Due to Fayez Sarofim & Co. | | | | | 76,895 | |
Payable for shares of Beneficial Interest redeemed | | 449,420 | |
Accrued expenses | | | | | 75,624 | |
| | | | | 839,634 | |
Net Assets ($) | | | 417,275,184 | |
Composition of Net Assets ($): | | | | |
Paid-in capital | | | | | 125,908,730 | |
Accumulated undistributed investment income—net | | 313,234 | |
Accumulated net realized gain (loss) on investments | | | | | 50,631,889 | |
Accumulated net unrealized appreciation (depreciation)
on investments and foreign currency transactions | | | | 240,421,331 | |
Net Assets ($) | | | 417,275,184 | |
| | | | |
Net Asset Value Per Share | Initial Shares | Service Shares | |
Net Assets ($) | 271,790,016 | 145,485,168 | |
Shares Outstanding | 6,079,171 | 3,281,330 | |
Net Asset Value Per Share ($) | 44.71 | 44.34 | |
| | | | |
See notes to financial statements. | | | |
12
STATEMENT OF OPERATIONS
Year Ended December 31, 2017
| | | | | | | |
| | | | | | |
| | | | | | |
Investment Income ($): | | | | |
Income: | | | | |
Cash dividends (net of $192,268 foreign taxes withheld at source): | |
Unaffiliated issuers | | | 8,860,481 | |
Affiliated issuers | | | 14,735 | |
Income from securities lending—Note 1(c) | | | 22,012 | |
Total Income | | | 8,897,228 | |
Expenses: | | | | |
Investment advisory fee—Note 3(a) | | | 2,194,334 | |
Sub-investment advisory fee—Note 3(a) | | | 896,277 | |
Distribution fees—Note 3(b) | | | 395,060 | |
Professional fees | | | 108,379 | |
Custodian fees—Note 3(b) | | | 54,102 | |
Trustees’ fees and expenses—Note 3(c) | | | 26,761 | |
Prospectus and shareholders’ reports | | | 18,647 | |
Loan commitment fees—Note 2 | | | 8,176 | |
Shareholder servicing costs—Note 3(b) | | | 2,369 | |
Miscellaneous | | | 19,979 | |
Total Expenses | | | 3,724,084 | |
Less—reduction in fees due to earnings credits—Note 3(b) | | | (175) | |
Net Expenses | | | 3,723,909 | |
Investment Income—Net | | | 5,173,319 | |
Realized and Unrealized Gain (Loss) on Investments—Note 4 ($): | | |
Net realized gain (loss) on investments | 50,697,356 | |
Net unrealized appreciation (depreciation) on investments
and foreign currency transactions | | | 42,703,302 | |
Net Realized and Unrealized Gain (Loss) on Investments | | | 93,400,658 | |
Net Increase in Net Assets Resulting from Operations | | 98,573,977 | |
| | | | | | | |
See notes to financial statements. | | | | | |
13
STATEMENT OF CHANGES IN NET ASSETS
| | | | | | | | | | |
| | | | Year Ended December 31, |
| | | | 2017 | | 2016 | |
Operations ($): | | | | | | | | |
Investment income—net | | | 5,173,319 | | | | 6,615,195 | |
Net realized gain (loss) on investments | | 50,697,356 | | | | 54,795,197 | |
Net unrealized appreciation (depreciation)
on investments | | 42,703,302 | | | | (29,273,746) | |
Net Increase (Decrease) in Net Assets
Resulting from Operations | 98,573,977 | | | | 32,136,646 | |
Distributions to Shareholders from ($): | |
Investment income—net: | | | | | | | | |
Initial Shares | | | (3,397,259) | | | | (4,007,827) | |
Service Shares | | | (1,710,007) | | | | (2,543,769) | |
Net realized gain on investments: | | | | | | | | |
Initial Shares | | | (32,675,856) | | | | (36,865,750) | |
Service Shares | | | (22,119,380) | | | | (33,615,443) | |
Total Distributions | | | (59,902,502) | | | | (77,032,789) | |
Beneficial Interest Transactions ($): | |
Net proceeds from shares sold: | | | | | | | | |
Initial Shares | | | 7,444,269 | | | | 5,270,922 | |
Service Shares | | | 8,089,313 | | | | 8,903,056 | |
Distributions reinvested: | | | | | | | | |
Initial Shares | | | 36,073,115 | | | | 40,873,577 | |
Service Shares | | | 23,829,387 | | | | 36,159,212 | |
Cost of shares redeemed: | | | | | | | | |
Initial Shares | | | (35,224,654) | | | | (42,252,305) | |
Service Shares | | | (61,387,520) | | | | (92,527,613) | |
Increase (Decrease) in Net Assets
from Beneficial Interest Transactions | (21,176,090) | | | | (43,573,151) | |
Total Increase (Decrease) in Net Assets | 17,495,385 | | | | (88,469,294) | |
Net Assets ($): | |
Beginning of Period | | | 399,779,799 | | | | 488,249,093 | |
End of Period | | | 417,275,184 | | | | 399,779,799 | |
Undistributed investment income—net | 313,234 | | | | 247,181 | |
Capital Share Transactions (Shares): | |
Initial Shares | | | | | | | | |
Shares sold | | | 177,820 | | | | 127,906 | |
Shares issued for distributions reinvested | | | 937,609 | | | | 1,041,157 | |
Shares redeemed | | | (847,904) | | | | (1,035,420) | |
Net Increase (Decrease) in Shares Outstanding | 267,525 | | | | 133,643 | |
Service Shares | | | | | | | | |
Shares sold | | | 198,043 | | | | 217,885 | |
Shares issued for distributions reinvested | | | 625,749 | | | | 928,366 | |
Shares redeemed | | | (1,507,252) | | | | (2,328,849) | |
Net Increase (Decrease) in Shares Outstanding | (683,460) | | | | (1,182,598) | |
| | | | | | | | | | |
See notes to financial statements. | | | | | | | | |
14
FINANCIAL HIGHLIGHTS
The following tables describe the performance for each share class for the fiscal periods indicated. All information (except portfolio turnover rate) reflects financial results for a single fund share. Total return shows how much your investment in the fund would have increased (or decreased) during each period, assuming you had reinvested all dividends and distributions. The fund’s total returns do not reflect expenses associated with variable annuity or insurance contracts. These figures have been derived from the fund’s financial statements.
| | | | | | | | | | | | | |
| | | | | | | |
| | | |
Initial Shares | | | Year Ended December 31, |
| | | 2017 | 2016 | 2015 | 2014 | 2013 |
Per Share Data ($): | | | | | | |
Net asset value, beginning of period | | 41.01 | 45.23 | 49.51 | 47.95 | 40.47 |
Investment Operations: | | | | | | |
Investment income—neta | | .56 | .68 | .80 | .89 | .86 |
Net realized and unrealized
gain (loss) on investments | | 9.55 | 2.48 | (1.97) | 2.86 | 7.59 |
Total from Investment Operations | | 10.11 | 3.16 | (1.17) | 3.75 | 8.45 |
Distributions: | | | | | | |
Dividends from
investment income—net | | (.57) | (.69) | (.81) | (.90) | (.87) |
Dividends from net realized
gain on investments | | (5.84) | (6.69) | (2.30) | (1.29) | (.10) |
Total Distributions | | (6.41) | (7.38) | (3.11) | (2.19) | (.97) |
Net asset value, end of period | | 44.71 | 41.01 | 45.23 | 49.51 | 47.95 |
Total Return (%) | | 27.33 | 7.91 | (2.47) | 8.09 | 21.11 |
Ratios/Supplemental Data (%): | | | | | | |
Ratio of total expenses
to average net assets | | .81 | .82 | .80 | .80 | .81 |
Ratio of net expenses
to average net assets | | .81 | .82 | .80 | .80 | .81 |
Ratio of net investment income
to average net assets | | 1.35 | 1.64 | 1.70 | 1.84 | 1.95 |
Portfolio Turnover Rate | | 3.97 | 4.19 | 11.97 | 3.65 | 7.71 |
Net Assets, end of period ($ x 1,000) | | 271,790 | 238,340 | 256,828 | 329,802 | 360,197 |
a Based on average shares outstanding.
See notes to financial statements.
15
FINANCIAL HIGHLIGHTS (continued)
| | | | | | | | | | | |
| | | | | | | |
| | | |
Service Shares | | | Year Ended December 31, |
| | | 2017 | 2016 | 2015 | 2014 | 2013 |
Per Share Data ($): | | | | | | |
Net asset value, beginning of period | | 40.72 | 44.96 | 49.23 | 47.69 | 40.25 |
Investment Operations: | | | | | | |
Investment income—neta | | .46 | .57 | .68 | .76 | .75 |
Net realized and unrealized
gain (loss) on investments | | 9.46 | 2.46 | (1.96) | 2.85 | 7.55 |
Total from Investment Operations | | 9.92 | 3.03 | (1.28) | 3.61 | 8.30 |
Distributions: | | | | | | |
Dividends from
investment income—net | | (.46) | (.58) | (.69) | (.78) | (.76) |
Dividends from net realized
gain on investments | | (5.84) | (6.69) | (2.30) | (1.29) | (.10) |
Total Distributions | | (6.30) | (7.27) | (2.99) | (2.07) | (.86) |
Net asset value, end of period | | 44.34 | 40.72 | 44.96 | 49.23 | 47.69 |
Total Return (%) | | 27.00 | 7.64 | (2.72) | 7.83 | 20.83 |
Ratios/Supplemental Data (%): | | | | | | |
Ratio of total expenses
to average net assets | | 1.06 | 1.07 | 1.05 | 1.05 | 1.06 |
Ratio of net expenses
to average net assets | | 1.06 | 1.07 | 1.05 | 1.05 | 1.06 |
Ratio of net investment income
to average net assets | | 1.11 | 1.41 | 1.45 | 1.59 | 1.70 |
Portfolio Turnover Rate | | 3.97 | 4.19 | 11.97 | 3.65 | 7.71 |
Net Assets, end of period ($ x 1,000) | | 145,485 | 161,440 | 231,421 | 264,795 | 254,928 |
a Based on average shares outstanding.
See notes to financial statements.
16
NOTES TO FINANCIAL STATEMENTS
NOTE 1—Significant Accounting Policies:
Appreciation Portfolio (the “fund”) is a separate diversified series of Dreyfus Variable Investment Fund (the “Company”), which is registered under the Investment Company Act of 1940, as amended (the “Act”), as an open-end management investment company and operates as a series company currently offering seven series, including the fund. The fund is only offered to separate accounts established by insurance companies to fund variable annuity contracts and variable life insurance policies. The fund’s investment objective is to seek long-term capital growth consistent with the preservation of capital. The Dreyfus Corporation (the “Manager” or “Dreyfus”), a wholly-owned subsidiary of The Bank of New York Mellon Corporation (“BNY Mellon”), serves as the fund’s investment adviser. Fayez Sarofim & Co. (“Sarofim & Co.”) serves as the fund’s sub–investment adviser.
MBSC Securities Corporation (the “Distributor”), a wholly-owned subsidiary of Dreyfus, is the distributor of the fund’s shares, which are sold without a sales charge. The fund is authorized to issue an unlimited number of $.001 par value shares of Beneficial Interest in each of the following classes of shares: Initial and Service. Each class of shares has identical rights and privileges, except with respect to the Distribution Plan, and the expenses borne by each class, the allocation of certain transfer agency costs, and certain voting rights. Income, expenses (other than expenses attributable to a specific class), and realized and unrealized gains or losses on investments are allocated to each class of shares based on its relative net assets.
The Company accounts separately for the assets, liabilities and operations of each series. Expenses directly attributable to each series are charged to that series’ operations; expenses which are applicable to all series are allocated among them on a pro rata basis.
The Financial Accounting Standards Board (“FASB”) Accounting Standards Codification is the exclusive reference of authoritative U.S. generally accepted accounting principles (“GAAP”) recognized by the FASB to be applied by nongovernmental entities. Rules and interpretive releases of the Securities and Exchange Commission (“SEC”) under authority of federal laws are also sources of authoritative GAAP for SEC registrants. The fund’s financial statements are prepared in accordance with GAAP, which may require the use of management estimates and assumptions. Actual results could differ from those estimates.
The Company enters into contracts that contain a variety of indemnifications. The fund’s maximum exposure under these
17
NOTES TO FINANCIAL STATEMENTS (continued)
arrangements is unknown. The fund does not anticipate recognizing any loss related to these arrangements.
(a) Portfolio valuation: The fair value of a financial instrument is the amount that would be received to sell an asset or paid to transfer a liability in an orderly transaction between market participants at the measurement date (i.e., the exit price). GAAP establishes a fair value hierarchy that prioritizes the inputs of valuation techniques used to measure fair value. This hierarchy gives the highest priority to unadjusted quoted prices in active markets for identical assets or liabilities (Level 1 measurements) and the lowest priority to unobservable inputs (Level 3 measurements).
Additionally, GAAP provides guidance on determining whether the volume and activity in a market has decreased significantly and whether such a decrease in activity results in transactions that are not orderly. GAAP requires enhanced disclosures around valuation inputs and techniques used during annual and interim periods.
Various inputs are used in determining the value of the fund’s investments relating to fair value measurements. These inputs are summarized in the three broad levels listed below:
Level 1—unadjusted quoted prices in active markets for identical investments.
Level 2—other significant observable inputs (including quoted prices for similar investments, interest rates, prepayment speeds, credit risk, etc.).
Level 3—significant unobservable inputs (including the fund’s own assumptions in determining the fair value of investments).
The inputs or methodology used for valuing securities are not necessarily an indication of the risk associated with investing in those securities.
Changes in valuation techniques may result in transfers in or out of an assigned level within the disclosure hierarchy. Valuation techniques used to value the fund’s investments are as follows:
Investments in securities are valued at the last sales price on the securities exchange or national securities market on which such securities are primarily traded. Securities listed on the National Market System for which market quotations are available are valued at the official closing price or, if there is no official closing price that day, at the last sales price. For open short positions, asked prices are used for valuation purposes. Bid price is used when no asked price is available. Registered investment companies that are not traded on an exchange are valued at their net asset value. All of
18
the preceding securities are generally categorized within Level 1 of the fair value hierarchy.
Securities not listed on an exchange or the national securities market, or securities for which there were no transactions, are valued at the average of the most recent bid and asked prices. These securities are generally categorized within Level 2 of the fair value hierarchy.
Fair valuing of securities may be determined with the assistance of a pricing service using calculations based on indices of domestic securities and other appropriate indicators, such as prices of relevant ADRs and futures. Utilizing these techniques may result in transfers between Level 1 and Level 2 of the fair value hierarchy.
When market quotations or official closing prices are not readily available, or are determined to not accurately reflect fair value, such as when the value of a security has been significantly affected by events after the close of the exchange or market on which the security is principally traded (for example, a foreign exchange or market), but before the fund calculates its net asset value, the fund may value these investments at fair value as determined in accordance with the procedures approved by the Company’s Board of Trustees (the “Board”). Certain factors may be considered when fair valuing investments such as: fundamental analytical data, the nature and duration of restrictions on disposition, an evaluation of the forces that influence the market in which the securities are purchased and sold, and public trading in similar securities of the issuer or comparable issuers. These securities are either categorized within Level 2 or 3 of the fair value hierarchy depending on the relevant inputs used.
For restricted securities where observable inputs are limited, assumptions about market activity and risk are used and are generally categorized within Level 3 of the fair value hierarchy.
Investments denominated in foreign currencies are translated to U.S. dollars at the prevailing rates of exchange.
The following is a summary of the inputs used as of December 31, 2017 in valuing the fund’s investments:
19
NOTES TO FINANCIAL STATEMENTS (continued)
| | | | | | |
| | Level 1 -
Unadjusted
Quoted Prices | Level 2 - Other
Significant
Observable Inputs | Level 3 –
Significant
Unobservable
Inputs | Total |
Assets ($) | | | |
Investments in Securities: | | | |
Equity Securities - Domestic Common Stocks† | 362,319,188 | - | - | 362,319,188 |
Equity Securities - Foreign Common Stocks† | 46,504,110 | 5,986,088†† | - | 52,490,198 |
Registered Investment Company | 1,867,769 | - | - | 1,867,769 |
† See Statement of Investments for additional detailed categorizations.
†† Securities classified within Level 2 at period end as the values were determined pursuant to the fund’s fair valuation procedures.
At December 31, 2017, the amount of securities transferred between levels equals fair value of exchange traded equity securities reported as Level 2 in the table above. It is the fund’s policy to recognize transfers between levels at the end of the reporting period.
(b) Foreign currency transactions: The fund does not isolate that portion of the results of operations resulting from changes in foreign exchange rates on investments from the fluctuations arising from changes in the market prices of securities held. Such fluctuations are included with the net realized and unrealized gain or loss on investments.
Net realized foreign exchange gains or losses arise from sales of foreign currencies, currency gains or losses realized on securities transactions between trade and settlement date, and the difference between the amounts of dividends, interest and foreign withholding taxes recorded on the fund’s books and the U.S. dollar equivalent of the amounts actually received or paid. Net unrealized foreign exchange gains and losses arise from changes in the value of assets and liabilities other than investments resulting from changes in exchange rates. Foreign currency gains and losses on foreign currency transactions are also included with net realized and unrealized gain or loss on investments.
(c) Securities transactions and investment income: Securities transactions are recorded on a trade date basis. Realized gains and losses from securities transactions are recorded on the identified cost basis. Dividend income is recognized on the ex-dividend date and interest income, including, where applicable, accretion of discount and
20
amortization of premium on investments, is recognized on the accrual basis.
Pursuant to a securities lending agreement with The Bank of New York Mellon, a subsidiary of BNY Mellon and an affiliate of Dreyfus, the fund may lend securities to qualified institutions. It is the fund’s policy that, at origination, all loans are secured by collateral of at least 102% of the value of U.S. securities loaned and 105% of the value of foreign securities loaned. Collateral equivalent to at least 100% of the market value of securities on loan is maintained at all times. Collateral is either in the form of cash, which can be invested in certain money market mutual funds managed by Dreyfus, or U.S. Government and Agency securities. The fund is entitled to receive all dividends, interest and distributions on securities loaned, in addition to income earned as a result of the lending transaction. Should a borrower fail to return the securities in a timely manner, The Bank of New York Mellon is required to replace the securities for the benefit of the fund or credit the fund with the market value of the unreturned securities and is subrogated to the fund’s rights against the borrower and the collateral. Additionally, the contractual maturity of security lending transactions are on an overnight and continuous basis. During the period ended December 31, 2017, The Bank of New York Mellon earned $4,048 from lending portfolio securities, pursuant to the securities lending agreement.
(d) Affiliated issuers: Investments in other investment companies advised by Dreyfus are defined as “affiliated” under the Act.
(e) Dividends and distributions to shareholders: Dividends and distributions are recorded on the ex-dividend date. Dividends from investment income-net are normally declared and paid quarterly. Dividends from net realized capital gains, if any, are normally declared and paid annually, but the fund may make distributions on a more frequent basis to comply with the distribution requirements of the Internal Revenue Code of 1986, as amended (the “Code”). To the extent that net realized capital gains can be offset by capital loss carryovers, it is the policy of the fund not to distribute such gains. Income and capital gain distributions are determined in accordance with income tax regulations, which may differ from GAAP.
(f) Federal income taxes: It is the policy of the fund to continue to qualify as a regulated investment company, if such qualification is in the best interests of its shareholders, by complying with the applicable provisions of the Code, and to make distributions of taxable income sufficient to relieve it from substantially all federal income and excise taxes.
21
NOTES TO FINANCIAL STATEMENTS (continued)
As of and during the period ended December 31, 2017, the fund did not have any liabilities for any uncertain tax positions. The fund recognizes interest and penalties, if any, related to uncertain tax positions as income tax expense in the Statement of Operations. During the period ended December 31, 2017, the fund did not incur any interest or penalties.
Each tax year in the four-year period ended December 31, 2017 remains subject to examination by the Internal Revenue Service and state taxing authorities.
At December 31, 2017, the components of accumulated earnings on a tax basis were as follows: undistributed ordinary income $408,388, undistributed capital gains $50,593,970 and unrealized appreciation $240,364,096.
The tax character of distributions paid to shareholders during the fiscal periods ended December 31, 2017 and December 31, 2016 were as follows: ordinary income $5,358,909 and $6,712,726, and long-term capital gains $54,543,593 and $70,320,063, respectively.
NOTE 2—Bank Lines of Credit:
The fund participates with other Dreyfus-managed funds in an $830 million unsecured credit facility led by Citibank, N.A. and a $300 million unsecured credit facility provided by The Bank of New York Mellon (each, a “Facility”), each to be utilized primarily for temporary or emergency purposes, including the financing of redemptions. Prior to October 4, 2017, the unsecured credit facility with Citibank, N.A. was $810 million. In connection therewith, the fund has agreed to pay its pro rata portion of commitment fees for each Facility. Interest is charged to the fund based on rates determined pursuant to the terms of the respective Facility at the time of borrowing. During the period ended December 31, 2017, the fund did not borrow under the Facilities.
NOTE 3—Investment Advisory Fee, Sub-Investment Advisory Fee and Other Transactions with Affiliates:
(a) Pursuant to an investment advisory agreement with Dreyfus, the investment advisory fee is computed at the annual rate of .5325% of the value of the fund’s average daily net assets. Pursuant to a sub-investment advisory agreement with Sarofim & Co., the fund pays Sarofim & Co. a monthly sub-investment advisory fee at the annual rate of .2175% of the value of the fund’s average daily net assets. Both fees are payable monthly.
(b) Under the Distribution Plan adopted pursuant to Rule 12b-1 under the Act, Service shares pay the Distributor for distributing its shares, for servicing and/or maintaining Service shares’ shareholder accounts and for
22
advertising and marketing for Service shares. The Distribution Plan provides for payments to be made at an annual rate of .25% of the value of the Service shares’ average daily net assets. The Distributor may make payments to Participating Insurance Companies and to brokers and dealers acting as principal underwriter for their variable insurance products. The fees payable under the Distribution Plan are payable without regard to actual expenses incurred. During the period ended December 31, 2017, Service shares were charged $395,060 pursuant to the Distribution Plan.
The fund has arrangements with the transfer agent and the custodian whereby the fund may receive earnings credits when positive cash balances are maintained, which are used to offset transfer agency and custody fees. For financial reporting purposes, the fund includes net earnings credits as an expense offset in the Statement of Operations.
The fund compensates Dreyfus Transfer, Inc., a wholly-owned subsidiary of Dreyfus, under a transfer agency agreement for providing transfer agency and cash management services for the fund. The majority of transfer agency fees are comprised of amounts paid on a per account basis, while cash management fees are related to fund subscriptions and redemptions. During the period ended December 31, 2017, the fund was charged $1,980 for transfer agency services and $175 for cash management services. These fees are included in Shareholder servicing costs in the Statement of Operations. Cash management fees were offset by earnings credits of $175.
The fund compensates The Bank of New York Mellon under a custody agreement for providing custodial services for the fund. These fees are determined based on net assets, geographic region and transaction activity. During the period ended December 31, 2017, the fund was charged $54,102 pursuant to the custody agreement.
During the period ended December 31, 2017, the fund was charged $11,202 for services performed by the Chief Compliance Officer and his staff.
The components of “Due to The Dreyfus Corporation and affiliates” in the Statement of Assets and Liabilities consist of: investment advisory fees $188,262, Distribution Plan fees $30,964, custodian fees $9,500, Chief Compliance Officer fees $8,406 and transfer agency fees $563.
(c) Each Board member also serves as a Board member of other funds within the Dreyfus complex. Annual retainer fees and attendance fees are allocated to each fund based on net assets.
23
NOTES TO FINANCIAL STATEMENTS (continued)
NOTE 4—Securities Transactions:
The aggregate amount of purchases and sales of investment securities, excluding short-term securities, during the period ended December 31, 2017, amounted to $16,213,631 and $91,885,608, respectively.
At December 31, 2017, the cost of investments for federal income tax purposes was $176,317,046; accordingly, accumulated net unrealized appreciation on investments was $240,360,109, consisting of gross unrealized appreciation.
24
REPORT OF INDEPENDENT REGISTERED PUBLIC ACCOUNTING FIRM
To the Shareholders and the Board of Trustees of Dreyfus Variable Investment Fund, Appreciation Portfolio
Opinion on the Financial Statements
We have audited the accompanying statement of assets and liabilities of Dreyfus Variable Investment Fund, Appreciation Portfolio (one of the series comprising Dreyfus Variable Investment Fund) (the “Fund”), including the statements of investments and investments in affiliated issuers, as of December 31, 2017, and the related statement of operations for the year then ended, the statements of changes in net assets for each of the two years in the period then ended, the financial highlights for each of the five years in the period then ended and the related notes (collectively referred to as the “financial statements”). In our opinion, the financial statements present fairly, in all material respects, the financial position of Dreyfus Variable Investment Fund, Appreciation Portfolio at December 31, 2017, the results of its operations for the year then ended, the changes in its net assets for each of the two years in the period then ended and its financial highlights for each of the five years in the period then ended, in conformity with U.S. generally accepted accounting principles.
Basis for opinion
These financial statements are the responsibility of the Fund’s management. Our responsibility is to express an opinion on the Fund’s financial statements based on our audits. We are a public accounting firm registered with the Public Company Accounting Oversight Board (United States) (“PCAOB”) and are required to be independent with respect to the Fund in accordance with the U.S. federal securities laws and the applicable rules and regulations of the Securities and Exchange Commission and the PCAOB.
We conducted our audits in accordance with the standards of the PCAOB. Those standards require that we plan and perform the audit to obtain reasonable assurance about whether the financial statements are free of material misstatement, whether due to error or fraud. The Fund is not required to have, nor were we engaged to perform, an audit of the Fund’s internal control over financial reporting. As part of our audits, we are required to obtain an understanding of internal control over financial reporting, but not for the purpose of expressing an opinion on the effectiveness of the Fund’s internal control over financial reporting. Accordingly, we express no such opinion.
Our audits included performing procedures to assess the risks of material misstatement of the financial statements, whether due to error or fraud, and performing procedures that respond to those risks. Such procedures included examining, on a test basis, evidence regarding the amounts and disclosures in the financial statements. Our procedures included confirmation of securities owned as of December 31, 2017, by correspondence with the custodian and others or by other appropriate auditing procedures where replies were not received. Our audits also included evaluating the accounting principles used and significant estimates made by management, as well as evaluating the overall presentation of the financial statements. We believe that our audits provide a reasonable basis for our opinion.

We have served as the auditor of one or more Dreyfus investment companies since at least 1957, but we are unable to determine the specific year.
New York, New York
February 09, 2018
25
IMPORTANT TAX INFORMATION (Unaudited)
For federal tax purposes, the fund hereby reports 100% of the ordinary dividends paid during the fiscal year ended December 31, 2017 as qualifying for the corporate dividends received deduction. Shareholders will receive notification in early 2018 of the percentage applicable to the preparation of their 2017 income tax returns. Also, the fund hereby reports $.0268 per share as a short-term capital gain distribution and $5.8089 per share as a long-term capital gain distribution paid on March 31, 2017.
26
INFORMATION ABOUT THE RENEWAL OF THE FUND’S INVESTMENT ADVISORY AND SUB-INVESTMENT ADVISORY AGREEMENTS (Unaudited)
At a meeting of the fund’s Board of Trustees held on July 18, 2017, the Board considered the renewal of the fund’s Investment Advisory Agreement, pursuant to which Dreyfus provides the fund with investment advisory and administrative services (the “Agreement”), and the Sub-Investment Advisory Agreement (together, the “Agreements”), pursuant to which Fayez Sarofim & Co. (the “Subadviser”) provides day-to-day management of the fund’s investments. The Board members, none of whom are “interested persons” (as defined in the Investment Company Act of 1940, as amended) of the fund, were assisted in their review by independent legal counsel and met with counsel in executive session separate from representatives of Dreyfus and the Subadviser. In considering the renewal of the Agreements, the Board considered all factors that it believed to be relevant, including those discussed below. The Board did not identify any one factor as dispositive, and each Board member may have attributed different weights to the factors considered.
Analysis of Nature, Extent, and Quality of Services Provided to the Fund. The Board considered information provided to them at the meeting and in previous presentations from Dreyfus representatives regarding the nature, extent, and quality of the services provided to funds in the Dreyfus fund complex. Dreyfus provided the number of open accounts in the fund, the fund’s asset size and the allocation of fund assets among distribution channels. Dreyfus also had previously provided information regarding the diverse intermediary relationships and distribution channels of funds in the Dreyfus fund complex (such as retail direct or intermediary, in which intermediaries typically are paid by the fund and/or Dreyfus) and Dreyfus’ corresponding need for broad, deep, and diverse resources to be able to provide ongoing shareholder services to each intermediary or distribution channel, as applicable to the fund.
The Board also considered research support available to, and portfolio management capabilities of, the fund’s portfolio management personnel and that Dreyfus also provides oversight of day-to-day fund operations, including fund accounting and administration and assistance in meeting legal and regulatory requirements. The Board also considered Dreyfus’ extensive administrative, accounting and compliance infrastructures, as well as Dreyfus’ supervisory activities over the Subadviser. The Board also considered portfolio management’s brokerage policies and practices (including policies and practices regarding soft dollars) and the standards applied in seeking best execution.
Comparative Analysis of the Fund’s Performance and Management Fee and Expense Ratio. The Board reviewed reports prepared by Broadridge Financial Solutions, Inc. (“Broadridge”), an independent provider of investment company data, which included information comparing (1) the fund’s performance with the performance of a group of comparable funds (the “Performance Group”) and with a broader group of funds (the “Performance Universe”), all for various periods ended May 31, 2017, and (2) the fund’s actual and contractual management fees and total expenses with those of a group of comparable funds (the “Expense Group”) and with a broader group of funds (the
27
INFORMATION ABOUT THE RENEWAL OF THE FUND’S INVESTMENT ADVISORY AND SUB-INVESTMENT ADVISORY AGREEMENTS (Unaudited) (continued)
“Expense Universe”), the information for which was derived in part from fund financial statements available to Broadridge as of the date of its analysis. Dreyfus previously had furnished the Board with a description of the methodology Broadridge used to select the Performance Group and Performance Universe and the Expense Group and Expense Universe.
Dreyfus representatives stated that the usefulness of performance comparisons may be affected by a number of factors, including different investment limitations that may be applicable to the fund and comparison funds. The Board discussed with representatives of Dreyfus, its affiliates and/or the Subadviser the results of the comparisons and considered that the fund’s total return performance was below the Performance Group and Performance Universe medians, except for the one- and ten-year periods when the fund’s performance was at the Performance Group median and above the Performance Universe median. Dreyfus also provided a comparison of the fund’s calendar year total returns to the returns of the fund’s benchmark index and noted that the fund’s performance was above the return of the index in four of the ten years.
The Board had discussed with representatives of Dreyfus, its affiliates and the Subadviser the investment strategy employed in the management of the fund’s assets and how that strategy affected the fund’s relative performance. They discussed, among other matters, the fact that the economic market in recent years was not of the type best suited to the Subadviser’s specific investment strategy.
The Board also reviewed the range of actual and contractual management fees and total expenses of the Expense Group and Expense Universe funds and discussed the results of the comparisons. The Board considered that the fund’s contractual management fee was at the Expense Group median and the fund’s actual management fee and total expenses were above the Expense Group and Expense Universe medians.
Dreyfus representatives reviewed with the Board the management or investment advisory fees (1) paid by funds advised or administered by Dreyfus that are in the same Broadridge category as the fund and (2) paid to Dreyfus or the Subadviser or its affiliates for advising any separate accounts and/or other types of client portfolios that are considered to have similar investment strategies and policies as the fund (the “Similar Clients”), and explained the nature of the Similar Clients. They discussed differences in fees paid and the relationship of the fees paid in light of any differences in the services provided and other relevant factors. The Board considered the relevance of the fee information provided for the Similar Clients to evaluate the appropriateness of the fund’s management fee.
The Board considered the fee to the Subadviser in relation to the fee paid to Dreyfus by the fund and the respective services provided by the Subadviser and Dreyfus.
Analysis of Profitability and Economies of Scale. Dreyfus representatives reviewed the expenses allocated and profit received by Dreyfus and its affiliates and the resulting profitability percentage for managing the fund and the aggregate profitability percentage to Dreyfus and its affiliates for managing the funds in the Dreyfus fund complex, and the method used to determine the expenses and profit. The Board concluded that the
28
profitability results were not unreasonable, given the services rendered and service levels provided by Dreyfus. The Board also had been provided with information prepared by an independent consulting firm regarding Dreyfus’ approach to allocating costs to, and determining the profitability of, individual funds and the entire Dreyfus fund complex. The consulting firm also had analyzed where any economies of scale might emerge in connection with the management of a fund.
The Board considered on the advice of its counsel the profitability analysis (1) as part of its evaluation of whether the fees under the Agreements, considered in relation to the mix of services provided by Dreyfus and the Subadviser, including the nature, extent and quality of such services, supported the renewal of the Agreements and (2) in light of the relevant circumstances for the fund and the extent to which economies of scale would be realized if the fund grows and whether fee levels reflect these economies of scale for the benefit of fund shareholders. Dreyfus representatives stated that a discussion of economies of scale is predicated on a fund having achieved a substantial size with increasing assets and that, if a fund’s assets had been stable or decreasing, the possibility that Dreyfus may have realized any economies of scale would be less. Dreyfus representatives also stated that, as a result of shared and allocated costs among funds in the Dreyfus fund complex, the extent of economies of scale could depend substantially on the level of assets in the complex as a whole, so that increases and decreases in complex-wide assets can affect potential economies of scale in a manner that is disproportionate to, or even in the opposite direction from, changes in the fund’s asset level. The Board also considered potential benefits to Dreyfus and the Subadviser from acting as investment adviser and sub-investment adviser, respectively, and took into consideration the soft dollar arrangements in effect for trading the fund’s investments.
At the conclusion of these discussions, the Board agreed that it had been furnished with sufficient information to make an informed business decision with respect to the renewal of the Agreements. Based on the discussions and considerations as described above, the Board concluded and determined as follows.
· The Board concluded that the nature, extent and quality of the services provided by Dreyfus and the Subadviser are adequate and appropriate.
· The Board agreed to continue to closely monitor performance and determined to approve renewal of the Agreements through March 31, 2018.
· The Board concluded that the fees paid to Dreyfus and the Subadviser continued to be appropriate under the circumstances and in light of the factors and the totality of the services provided as discussed above, subject to review no later than the next renewal consideration.
· The Board determined that the economies of scale which may accrue to Dreyfus and its affiliates in connection with the management of the fund had been adequately considered by Dreyfus in connection with the fee rate charged to the fund pursuant to the Agreement and that, to the extent in the future it were determined that material economies of scale had not been shared with the
29
INFORMATION ABOUT THE RENEWAL OF THE FUND’S INVESTMENT ADVISORY AND SUB-INVESTMENT ADVISORY AGREEMENTS (Unaudited) (continued)
fund, the Board would seek to have those economies of scale shared with the fund.
In evaluating the Agreements, the Board considered these conclusions and determinations and also relied on its previous knowledge, gained through meetings and other interactions with Dreyfus and its affiliates and the Subadviser, of Dreyfus and the Subadviser and the services provided to the fund by Dreyfus and the Subadviser. The Board also relied on information received on a routine and regular basis throughout the year relating to the operations of the fund and the investment management and other services provided under the Agreements, including information on the investment performance of the fund in comparison to similar mutual funds and benchmark performance indices; general market outlook as applicable to the fund; and compliance reports. In addition, the Board’s consideration of the contractual fee arrangements for this fund had the benefit of a number of years of reviews of the Agreements for the fund, or substantially similar agreements for other Dreyfus funds that the Board oversees, during which lengthy discussions took place between the Board and Dreyfus representatives. Certain aspects of the arrangements may receive greater scrutiny in some years than in others, and the Board’s conclusions may be based, in part, on their consideration of the fund’s arrangements, or substantially similar arrangements for other Dreyfus funds that the Board oversees, in prior years. The Board determined to renew the Agreements through March 31, 2018.
30
BOARD MEMBERS INFORMATION (Unaudited)
INDEPENDENT BOARD MEMBERS
Joseph S. DiMartino (74)
Chairman of the Board (1995)
Principal Occupation During Past 5 Years:
· Corporate Director and Trustee (1995-present)
Other Public Company Board Memberships During Past 5 Years:
· CBIZ (formerly, Century Business Services, Inc.), a provider of outsourcing functions for small and medium size companies, Director (1997-present)
No. of Portfolios for which Board Member Serves: 127
———————
Peggy C. Davis (74)
Board Member (2006)
Principal Occupation During Past 5 Years:
· Shad Professor of Law, New York University School of Law (1983-present)
No. of Portfolios for which Board Member Serves: 46
———————
David P. Feldman (78)
Board Member (1994)
Principal Occupation During Past 5 Years:
· Corporate Director and Trustee (1985-present)
Other Public Company Board Memberships During Past 5 Years:
· BBH Mutual Funds Group (5 registered mutual funds), Director (1992-2014)
No. of Portfolios for which Board Member Serves: 32
———————
Joan Gulley (70)
Board Member (2017)
Principal Occupation During Past 5 Years:
· PNC Financial Services Group, Inc.(1993-2014), Executive Vice President and Chief Human Resources Officer and Executive Committee Member (2008-2014)
No. of Portfolios for which Board Member Serves: 54
———————
31
BOARD MEMBERS INFORMATION (Unaudited) (continued)
INDEPENDENT BOARD MEMBERS (continued)
Ehud Houminer (77)
Board Member (2006)
Principal Occupation During Past 5 Years:
· Board of Overseers at the Columbia Business School, Columbia University (1992-present)
· Trustee, Ben Gurion University
Other Public Company Board Memberships During Past 5 Years:
· Avnet, Inc., an electronics distributor, Director (1993-2012)
No. of Portfolios for which Board Member Serves: 54
———————
Lynn Martin (78)
Board Member (2012)
Principal Occupation During Past 5 Years:
· President of The Martin Hall Group LLC, a human resources consulting firm (2005-2012)
Other Public Company Board Memberships During Past 5 Years:
· AT&T, Inc., a telecommunications company, Director (1999-2012)
· Ryder System, Inc., a supply chain and transportation management company, Director (1993-2012)
No. of Portfolios for which Board Member Serves: 32
———————
Robin A. Melvin (54)
Board Member (2012)
Principal Occupation During Past 5 Years:
· Co-chairman, Illinois Mentoring Partnership, non-profit organization dedicated to increasing the quantity and quality of mentoring services in Illinois; (2014-present; board member since 2013)
· Director, Boisi Family Foundation, a private family foundation that supports youth-serving organizations that promote the self sufficiency of youth from disadvantaged circumstances (1995-2012)
No. of Portfolios for which Board Member Serves: 101
———————
32
Dr. Martin Peretz (78)
Board Member (1990)
Principal Occupation During Past 5 Years:
· Editor-in-Chief Emeritus of The New Republic Magazine (2011-2012) (previously,
Editor-in-Chief, 1974-2011)
· Lecturer at Harvard University (1969-2012)
No. of Portfolios for which Board Member Serves: 32
———————
Once elected all Board Members serve for an indefinite term, but achieve Emeritus status upon reaching age 80. The address of the Board Members and Officers is c/o The Dreyfus Corporation, 200 Park Avenue, New York, New York 10166. Additional information about the Board Members is available in the fund’s Statement of Additional Information which can be obtained from Dreyfus free of charge by calling this toll free number: 1-800-DREYFUS.
James F. Henry, Emeritus Board Member
Philip L. Toia, Emeritus Board Member
33
OFFICERS OF THE FUND (Unaudited)
BRADLEY J. SKAPYAK, President since January 2010.
Chief Operating Officer and a director of the Manager since June 2009, Chairman of Dreyfus Transfer, Inc., an affiliate of the Manager and the transfer agent of the funds, since May 2011 and Chief Executive Officer of MBSC Securities Corporation since August 2016. He is an officer of 63 investment companies (comprised of 127 portfolios) managed by the Manager. He is 59 years old and has been an employee of the Manager since February 1988.
BENNETT A. MACDOUGALL, Chief Legal Officer since October 2015.
Chief Legal Officer of the Manager and Associate General Counsel and Managing Director of BNY Mellon since June 2015; from June 2005 to June 2015, he served in various capacities with Deutsche Bank – Asset & Wealth Management Division, including as Director and Associate General Counsel, and Chief Legal Officer of Deutsche Investment Management Americas Inc. from June 2012 to May 2015. He is an officer of 64 investment companies (comprised of 152 portfolios) managed by the Manager. He is 46 years old and has been an employee of the Manager since June 2015.
JANETTE E. FARRAGHER, Vice President and Secretary since December 2011.
Associate General Counsel of BNY Mellon, and an officer of 64 investment companies (comprised of 152 portfolios) managed by the Manager. She is 55 years old and has been an employee of the Manager since February 1984.
JAMES BITETTO, Vice President and Assistant Secretary since August 2005.
Managing Counsel of BNY Mellon and Secretary of the Manager, and an officer of 64 investment companies (comprised of 152 portfolios) managed by the Manager. He is 51 years old and has been an employee of the Manager since December 1996.
JOSEPH M. CHIOFFI, Vice President and Assistant Secretary since August 2005.
Managing Counsel of BNY Mellon, and an officer of 64 investment companies (comprised of 152 portfolios) managed by the Manager. He is 56 years old and has been an employee of the Manager since June 2000.
MAUREEN E. KANE, Vice President and Assistant Secretary since April 2015.
Managing Counsel of BNY Mellon since July 2014; from October 2004 until July 2014, General Counsel, and from May 2009 until July 2014, Chief Compliance Officer of Century Capital Management. She is an officer of 64 investment companies (comprised of 152 portfolios) managed by the Manager. She is 55 years old and has been an employee of the Manager since July 2014.
SARAH S. KELLEHER, Vice President and Assistant Secretary since April 2014.
Senior Counsel of BNY Mellon since March 2013, from August 2005 to March 2013, Associate General Counsel of Third Avenue Management. She is an officer of 64 investment companies (comprised of 152 portfolios) managed by the Manager. She is 42 years old and has been an employee of the Manager since March 2013.
JEFF PRUSNOFSKY, Vice President and Assistant Secretary since August 2005.
Senior Managing Counsel of BNY Mellon, and an officer of 64 investment companies (comprised of 152 portfolios) managed by the Manager. He is 52 years old and has been an employee of the Manager since October 1990.
NATALYA ZELENSKY, Vice President and Assistant Secretary since March 2017.
Counsel and Vice President of BNY Mellon since May 2016; Attorney at Wildermuth Endowment Strategy Fund/Wildermuth Advisory, LLC from November 2015 until May 2016; Assistant General Counsel at RCS Advisory Services from July 2014 until November 2015; Associate at Sutherland, Asbill & Brennan from January 2013 until January 2014; Associate at K&L Gates from October 2011 until January 2013. She is an officer of 64 investment companies (comprised of 152 portfolios) managed by Dreyfus. She is 32 years old and has been an employee of the Manager since May 2016.
JAMES WINDELS, Treasurer since November 2001.
Director – Mutual Fund Accounting of the Manager, and an officer of 64 investment companies (comprised of 152 portfolios) managed by the Manager. He is 59 years old and has been an employee of the Manager since April 1985.
34
RICHARD CASSARO, Assistant Treasurer since January 2008.
Senior Accounting Manager – Money Market and Municipal Bond Funds of the Manager, and an officer of 64 investment companies (comprised of 152 portfolios) managed by the Manager. He is 58 years old and has been an employee of the Manager since September 1982.
GAVIN C. REILLY, Assistant Treasurer since December 2005.
Tax Manager of the Investment Accounting and Support Department of the Manager, and an officer of 64 investment companies (comprised of 152 portfolios) managed by the Manager. He is 49 years old and has been an employee of the Manager since April 1991.
ROBERT S. ROBOL, Assistant Treasurer since August 2005.
Senior Accounting Manager – Dreyfus Financial Reporting of the Manager, and an officer of 64 investment companies (comprised of 152 portfolios) managed by the Manager. He is 53 years old and has been an employee of the Manager since October 1988.
ROBERT SALVIOLO, Assistant Treasurer since July 2007.
Senior Accounting Manager – Equity Funds of the Manager, and an officer of 64 investment companies (comprised of 152 portfolios) managed by the Manager. He is 50 years old and has been an employee of the Manager since June 1989.
ROBERT SVAGNA, Assistant Treasurer since December 2002.
Senior Accounting Manager – Fixed Income and Equity Funds of the Manager, and an officer of 64 investment companies (comprised of 152 portfolios) managed by the Manager. He is 50 years old and has been an employee of the Manager since November 1990.
JOSEPH W. CONNOLLY, Chief Compliance Officer since October 2004.
Chief Compliance Officer of the Manager and The Dreyfus Family of Funds (64 investment companies, comprised of 152 portfolios). He is 60 years old and has served in various capacities with the Manager since 1980, including manager of the firm’s Fund Accounting Department from 1997 through October 2001.
CARIDAD M. CAROSELLA, Anti-Money Laundering Compliance Officer since January 2016.
Anti-Money Laundering Compliance Officer of the Dreyfus Family of Funds and BNY Mellon Funds Trust since January 2016; from May 2015 to December 2015, Interim Anti-Money Laundering Compliance Officer of the Dreyfus Family of Funds and BNY Mellon Funds Trust and the Distributor; from January 2012 to May 2015, AML Surveillance Officer of the Distributor and from 2007 to December 2011, Financial Processing Manager of the Distributor. She is an officer of 58 investment companies (comprised of 146 portfolios) managed by the Manager. She is 49 years old and has been an employee of the Distributor since 1997.
35
NOTES
36
NOTES
37
Dreyfus Variable Investment Fund, Appreciation Portfolio
200 Park Avenue
New York, NY 10166
Manager
The Dreyfus Corporation
200 Park Avenue
New York, NY 10166
Sub-Investment Adviser
Fayez Sarofim & Co.
Two Houston Center
Suite 2907
Houston, TX 77010
Custodian
The Bank of New York Mellon
225 Liberty Street
New York, NY 10286
Transfer Agent &
Dividend Disbursing Agent
Dreyfus Transfer, Inc.
200 Park Avenue
New York, NY 10166
Distributor
MBSC Securities Corporation
200 Park Avenue
New York, NY 10166
Telephone 1-800-258-4260 or 1-800-258-4261
Mail The Dreyfus Family of Funds, 144 Glenn Curtiss Boulevard, Uniondale, NY 11556-0144 Attn: Institutional Services Department
E-mail Send your request to info@dreyfus.com
Internet Information can be viewed online or downloaded at www.dreyfus.com
The fund files its complete schedule of portfolio holdings with the Securities and Exchange Commission (“SEC”) for the first and third quarters of each fiscal year on Form N-Q. The fund’s Forms N-Q are available on the SEC’s website at http://www.sec.gov and may be reviewed and copied at the SEC’s Public Reference Room in Washington, D.C. Information on the operation of the Public Reference Room may be obtained by calling 1-800-SEC-0330.
A description of the policies and procedures that the fund uses to determine how to vote proxies relating to portfolio securities, and information regarding how the fund voted these proxies for the most recent 12-month period ended June 30 is available at http://www.dreyfus.com and on the SEC’s website at http://www.sec.gov. The description of the policies and procedures is also available without charge, upon request, by calling 1-800-DREYFUS.
| | |
© 2018 MBSC Securities Corporation
0112AR1217 | 
|
Dreyfus Variable Investment Fund, Government Money Market Portfolio
| | | |

| | ANNUAL REPORT
December 31, 2017 |
| |
The views expressed in this report reflect those of the portfolio manager(s) only through the end of the period covered and do not necessarily represent the views of Dreyfus or any other person in the Dreyfus organization. Any such views are subject to change at any time based upon market or other conditions and Dreyfus disclaims any responsibility to update such views. These views may not be relied on as investment advice and, because investment decisions for a Dreyfus fund are based on numerous factors, may not be relied on as an indication of trading intent on behalf of any Dreyfus fund. |
| |
Not FDIC-Insured • Not Bank-Guaranteed • May Lose Value |
Contents
THE FUND
FOR MORE INFORMATION
Back Cover
| | | | |
| |
Dreyfus Variable Investment Fund, Government Money Market Portfolio
| | The Fund |
A LETTER FROM THE PRESIDENT OF DREYFUS
Dear Shareholder:
We are pleased to present this annual report for Dreyfus Variable Investment Fund, Government Money Market Portfolio, covering the 12-month period from January 1, 2017 through December 31, 2017. For information about how the fund performed during the reporting period, as well as general market perspectives, we provide a Discussion of Fund Performance on the pages that follow.
Stocks set a series of new record highs and bonds produced modestly positive results during 2017. Financial markets early in the year were dominated by the inauguration of a new U.S. president, as equities and corporate-backed bonds surged higher in anticipation of more business-friendly regulatory, tax, and fiscal policies. U.S. and international stocks continued to rally in the spring as corporate earnings grew and global economic conditions improved. Later in the year, the passage of tax reform legislation fueled additional stock market gains.
Despite three short-term interest rate hikes and concerns early in the year that inflation might accelerate in a growing economy, bonds generally produced positive total returns in 2017. Corporate-backed securities and municipal bonds fared particularly well.
The markets’ strong performance last year was supported by solid underlying fundamentals, including sustained economic growth, a robust labor market, and low inflation. We currently expect these favorable conditions to persist in 2018, but we remain watchful for economic and political developments that could negatively impact the markets. As always, we encourage you to discuss the risks and opportunities of today’s investment environment with your financial advisor.
Thank you for your continued confidence and support.
Sincerely,

Renee Laroche-Morris
President
The Dreyfus Corporation
January 16, 2018
2
DISCUSSION OF FUND PERFORMANCE
For the period from January 1, 2017 through December 31, 2017, as provided by Bernard W. Kiernan, Jr., Senior Portfolio Manager
Market and Fund Performance Overview
For the 12-month period ended December 31, 2017, Dreyfus Variable Investment Fund, Government Money Market Portfolio produced a yield of 0.34%. Taking into account the effects of compounding, the fund provided an effective yield of 0.34% for the same period.1
Yields of money market instruments climbed during 2017 in response to a series of increases in short-term interest rates from the Federal Reserve Board (the “Fed”).
The Fund’s Investment Approach
The fund seeks as high a level of current income as is consistent with the preservation of capital and the maintenance of liquidity. To pursue its goal, the fund normally invests at least 99.5% of its total assets in securities issued or guaranteed as to principal and interest by the U.S. government or its agencies or instrumentalities, repurchase agreements collateralized solely by cash and/or government securities, and cash (including tri-party repurchase agreements). The securities in which the fund invests include those backed by the full faith and credit of the U.S. government and those that are neither insured nor guaranteed by the U.S. government.
Short-Term Interest Rates Moved Higher
The reporting period began in the wake of a December 2016 interest-rate hike from the Fed—which raised the target for the federal funds rate 0.25 percentage points to between 0.50% and 0.75%—as investors and policymakers looked forward to stronger economic growth stemming, in part, from the business-friendly policies of a newly elected U.S. presidential administration. The economy appeared to maintain its momentum in January 2017, when manufacturing and non-manufacturing activity continued to expand. The economy added 216,000 new jobs in January 2017 but the unemployment rate rose to 4.8% in that month. February saw the addition of 232,000 jobs and an unemployment rate of 4.7%. Corporate earnings exceeded expectations, and consumer and business confidence proved strong. In March, the Fed again raised the federal funds rate, sending it to between 0.75% and 1.00%. Although the unemployment rate fell to 4.5%, job creation declined to 50,000 new positions in March. The U.S. economy produced a 1.2% annualized growth rate over the first quarter of the year.
Consumer confidence moderated in April and U.S. manufacturing activity slowed, but corporate earnings continued to exceed forecasts. The labor market rebounded with 207,000 new jobs and an unemployment rate of 4.4%. In May, 145,000 new jobs were created, and the unemployment rate slid to 4.3%. Manufacturing activity continued to expand in June with 15 of 18 manufacturing industries reporting growth. The unemployment rate ticked higher to 4.4%, and 210,000 new jobs were added. The Fed again raised short-term interest rates, sending the federal funds rate to between 1.00% and 1.25%. The U.S. economy grew at a more robust 3.1% annualized rate during the second quarter of 2017.
The economy generated 138,000 new jobs in July, and the unemployment rate returned to 4.3%. Activity in the manufacturing and services sectors continued to grow but at slower
3
DISCUSSION OF FUND PERFORMANCE (continued)
rates than previously. In August, 208,000 jobs were added, and the unemployment rate rose to 4.4%. Housing starts exceeded forecasts, but retail sales generally disappointed.
September saw U.S. factory activity climb to a 13-year high as companies invested to make their operations more efficient. In that month, the labor market produced only 38,000 new jobs, in part due to hurricanes affecting Florida and Texas. Yet, the unemployment rate fell to 4.2%. The U.S. economy expanded at a 3.2% annualized rate over the third quarter.
The unemployment rate declined to 4.1% in October, its lowest level since December 2000, and 211,000 jobs were created. In October, automobile purchases increased 0.7% as Gulf Coast residents replaced flood-damaged vehicles. November saw a renewed surge in stock prices when tax reform legislation made progress. The holiday shopping season got off to a strong start with a 0.8% increase in retail sales. The U.S. economy added an estimated 252,000 jobs, and the unemployment rate remained at 4.1%. The Fed implemented its third interest-rate hike of 2017 in December, raising the federal funds rate to between 1.25% and 1.50%. In that month, the unemployment rate remained at 4.1% and an estimated 148,000 new jobs were created. Retail sales during the holiday season climbed 4.9% compared to the previous year, and investors responded positively to the enactment of federal tax-reform legislation before year-end.
Additional Rate Hikes Expected
The Fed began in October to further moderate its accommodative monetary policy by unwinding its balance sheet through the sale of U.S. government securities. In addition, we believe more short-term interest-rate hikes are anticipated in 2018.
In the rising-interest-rate environment, we have maintained the fund’s weighted average maturity in a range that is modestly shorter than industry averages. This strategy is intended to capture higher yields as they become available. As always, we have retained our longstanding focus on quality and liquidity.
January 16, 2018
1 Effective yield is based upon dividends declared daily and reinvested monthly. Past performance is no guarantee of future results. Yields fluctuate. The fund’s performance does not reflect the deduction of additional charges and expenses imposed in connection with investing in variable insurance contracts, which will reduce returns. Yields provided for the fund reflect the absorption of certain fund expenses by The Dreyfus Corporation pursuant to an undertaking in effect that may be extended, terminated, or modified at any time. Had these expenses not been absorbed, fund yields would have been lower, and in some cases, seven-day yields during the reporting period would have been negative absent the expense absorption.
You could lose money by investing in a money market fund. Although the fund seeks to preserve the value of your investment at $1.00 per share, it cannot guarantee it will do so. An investment in the fund is not insured or guaranteed by the Federal Deposit Insurance Corporation or any other government agency. The fund’s sponsor has no legal obligation to provide financial support to the fund, and you should not expect that the sponsor will provide financial support to the fund at any time.
Although the fund’s board has no current intention to impose a fee upon the sale of shares or temporarily suspend redemptions if the fund’s liquidity falls below certain levels, the board reserves the ability to do so after providing at least 60 days’ prior written notice to shareholders.
The fund is only available as a funding vehicle under variable life insurance policies or variable annuity contracts issued by insurance companies. Individuals may not purchase shares of the fund directly. A variable annuity is an insurance contract issued by an insurance company that enables investors to accumulate assets on a tax-deferred basis for retirement or other long-term goals. The investment objective and policies of Dreyfus Variable Investment Fund, Government Money Market Portfolio made available through insurance products may be similar to those of other funds managed or advised by Dreyfus. However, the investment results of the fund may be higher or lower than, and may not be comparable to, those of any other Dreyfus fund.
4
UNDERSTANDING YOUR FUND’S EXPENSES (Unaudited)
As a mutual fund investor, you pay ongoing expenses, such as management fees and other expenses. Using the information below, you can estimate how these expenses affect your investment and compare them with the expenses of other funds. You also may pay one-time transaction expenses, including sales charges (loads), redemption fees and expenses associated with variable annuity or insurance contracts, which are not shown in this section and would have resulted in higher total expenses. For more information, see your fund’s prospectus or talk to your financial adviser.
Review your fund’s expenses
The table below shows the expenses you would have paid on a $1,000 investment in Dreyfus Variable Investment Fund, Government Money Market Portfolio from July 1, 2017 to December 31, 2017. It also shows how much a $1,000 investment would be worth at the close of the period, assuming actual returns and expenses.
| | | | | | | | | | |
Expenses and Value of a $1,000 Investment |
assuming actual returns for the six months ended December 31, 2017 | | |
| | | | | | | | | |
Expenses paid per $1,000† | | | | $2.93 | | | |
Ending value (after expenses) | | | | $1,002.60 | | | |
COMPARING YOUR FUND’S EXPENSES
WITH THOSE OF OTHER FUNDS (Unaudited)
Using the SEC’s method to compare expenses
The Securities and Exchange Commission (“SEC”) has established guidelines to help investors assess fund expenses. Per these guidelines, the table below shows your fund’s expenses based on a $1,000 investment, assuming a hypothetical 5% annualized return. You can use this information to compare the ongoing expenses (but not transaction expenses or total cost) of investing in the fund with those of other funds. All mutual fund shareholder reports will provide this information to help you make this comparison. Please note that you cannot use this information to estimate your actual ending account balance and expenses paid during the period.
| | | | | | | | | | |
Expenses and Value of a $1,000 Investment |
assuming a hypothetical 5% annualized return for the six months ended December 31, 2017 |
| | | | | | | | | |
Expenses paid per $1,000† | | | | $2.96 | | | |
Ending value (after expenses) | | | | $1,022.28 | | | |
† Expenses are equal to the fund’s annualized expense ratio of .58%, multiplied by the average account value over the period, multiplied by 184/365 (to reflect the one-half year period).
5
STATEMENT OF INVESTMENTS
December 31, 2017
| | | | | | |
Description | | Principal
Amount ($) | | Value ($) | |
U.S. Government Agencies - 45.5% | | | |
Federal Farm Credit Bank | | | | | |
1.37%, 1/9/18, 1 Month LIBOR + 0.045% | | 175,000 | a | 175,051 | |
Federal Home Loan Bank | | | | | |
1.11%, 1/2/18 | | 15,000,000 | | 14,999,538 | |
Federal Home Loan Bank | | | | | |
1.15%, 1/25/18, 1 Month LIBOR - 0.175% | | 5,000,000 | a | 5,000,000 | |
Federal Home Loan Bank | | | | | |
1.26%, 1/26/18 | | 20,000,000 | | 19,982,569 | |
Federal Home Loan Bank | | | | | |
1.27%, 1/23/18, 1 Month LIBOR - 0.035% | | 5,000,000 | a | 5,000,298 | |
Federal Home Loan Bank | | | | | |
1.35%, 4/5/18 | | 10,000,000 | | 9,965,011 | |
Federal Home Loan Bank | | | | | |
1.35%, 1/19/18, 1 Month LIBOR - 0.1425% | | 10,000,000 | a | 10,000,000 | |
Federal Home Loan Bank | | | | | |
1.37%, 1/17/18, 1 Month LIBOR - 0.12% | | 5,000,000 | a | 5,000,000 | |
Federal Home Loan Bank | | | | | |
1.45%, 2/22/18, 3 Month LIBOR + 0% | | 5,000,000 | a | 5,000,000 | |
Federal Home Loan Mortgage Corp. | | | | | |
1.15%, 1/12/18, Notes, Ser. 1 | | 9,253,000 | b | 9,251,830 | |
Federal National Mortgage Association | | | | | |
1.59%, 3/21/18, 3 Month LIBOR - 0.05% | | 5,000,000 | a,b | 5,000,000 | |
Total U.S. Government Agencies
(cost $89,374,297) | | | |
89,374,297
| |
U.S. Treasury Notes - 17.8% | | | |
U.S. Treasury Notes | | | | | |
1.13%, 2/28/18 | | 15,000,000 | | 14,990,854 | |
U.S. Treasury Notes | | | | | |
1.16%, 2/15/18 | | 20,000,000 | | 19,995,471 | |
Total U.S. Treasury Notes
(cost $34,986,325) | | | |
34,986,325
| |
Repurchase Agreements - 36.2% | | | |
Bank of Nova Scotia | | | | | |
Tri-Party Agreement thru BNY Mellon, 1.36%, dated 12/29/17, due 1/2/18 in the amount of $21,003,173 (fully collateralized by $19,573,555 U.S. Treasuries, 0.13%-6.25%, due 4/15/19-2/15/46, value $21,424,313) | | 21,000,000 | | 21,000,000 | |
BNP Paribas | | | | | |
Tri-Party Agreement thru BNY Mellon, 1.38%, dated 12/29/17, due 1/2/18 in the amount of $40,006,133 (fully collateralized by $42,462,248 U.S. Treasuries (including strips), 0%-2.50%, due 1/4/18-5/15/46, value $40,800,534) | | 40,000,000 | | 40,000,000 | |
6
| | | | | | |
Description | | Principal
Amount ($) | | Value ($) | |
Repurchase Agreements - 36.2% (continued) | | | |
BNP Paribas | | | | | |
Tri-Party Agreement thru BNY Mellon, 1.30%, dated 12/14/17, due 1/12/18 in the amount of $10,010,472 (fully collateralized by $9,872,198 U.S. Treasuries (including strips), 0%-3.63%, due 4/15/28-8/15/45, value $10,201,923) | | 10,000,000 | | 10,000,000 | |
Total Repurchase Agreements
(cost $71,000,000) | | | |
71,000,000
| |
Total Investments (cost $195,360,622) | | 99.5% | | 195,360,622 | |
Cash and Receivables (Net) | | .5% | | 986,556 | |
Net Assets | | 100.0% | | 196,347,178 | |
a Variable rate security—rate shown is the interest rate in effect at period end. Date shown represents the earlier of the next interest reset date or ultimate maturity date.
b The Federal Housing Finance Agency (“FHFA”) placed the Federal Home Loan Mortgage Corporation and Federal National Mortgage Association into conservatorship with FHFA as the conservator. As such, the FHFA oversees the continuing affairs of these companies.
| | |
Portfolio Summary (Unaudited) † | Value (%) |
Federal Home Loan Bank | 38.2 |
Repurchase Agreements | 36.2 |
U.S. Treasury Notes | 17.8 |
Federal Home Loan Mortgage Corporation | 4.7 |
Federal National Mortgage Association | 2.5 |
Federal Farm Credit Bank | .1 |
| | 99.5 |
† Based on net assets.
See notes to financial statements.
7
STATEMENT OF ASSETS AND LIABILITIES
December 31, 2017
| | | | | | | | | | | |
| | | | | | |
| | | Cost | | Value | |
Assets ($): | | | | |
Investments in securities—See Statement of Investments
(including repurchase agreements of $71,000,000)
—Note 1(b) | 195,360,622 | | 195,360,622 | |
Cash | | | | | 1,028,664 | |
Interest receivable | | 180,951 | |
Prepaid expenses | | | | | 689 | |
| | | | | 196,570,926 | |
Liabilities ($): | | | | |
Due to The Dreyfus Corporation and affiliates—Note 2(b) | | | | | 97,308 | |
Payable for shares of Beneficial Interest redeemed | | 77,875 | |
Accrued expenses | | | | | 48,565 | |
| | | | | 223,748 | |
Net Assets ($) | | | 196,347,178 | |
Composition of Net Assets ($): | | | | |
Paid-in capital | | | | | 196,339,352 | |
Accumulated undistributed investment income—net | | 7,826 | |
Net Assets ($) | | | 196,347,178 | |
Shares Outstanding | | |
(unlimited number of $.001 par value shares of Beneficial Interest authorized) | 196,308,078 | |
Net Asset Value Per Share ($) | | 1.00 | |
| | | | | |
See notes to financial statements. | | | | |
8
STATEMENT OF OPERATIONS
Year Ended December 31, 2017
| | | | | | | |
| | | | | | |
| | | | | | |
Investment Income ($): | | | | |
Interest Income | | | 1,528,969 | |
Expenses: | | | | |
Investment advisory fee—Note 2(a) | | | 813,896 | |
Professional fees | | | 73,168 | |
Trustees’ fees and expenses—Note 2(c) | | | 13,362 | |
Custodian fees—Note 2(b) | | | 12,679 | |
Prospectus and shareholders’ reports | | | 12,237 | |
Shareholder servicing costs—Note 2(b) | | | 534 | |
Miscellaneous | | | 16,935 | |
Total Expenses | | | 942,811 | |
Less—reduction in expenses due to undertaking—Note 2(a) | | | (18,661) | |
Less—reduction in fees due to earnings credits—Note 2(b) | | | (2,882) | |
Net Expenses | | | 921,268 | |
Investment Income—Net, representing net increase in
net assets resulting from operations | | | 607,701 | |
| | | | | | | |
See notes to financial statements. | | | | | |
9
STATEMENT OF CHANGES IN NET ASSETS
| | | | | | | | | | |
| | | | Year Ended December 31, |
| | | | 2017 | | 2016 | |
Operations ($): | | | | | | | | |
Investment income—net | | | 607,701 | | | | 15,606 | |
Net realized gain (loss) on investments | | - | | | | 815 | |
Net Increase (Decrease) in Net Assets
Resulting from Operations | 607,701 | | | | 16,421 | |
Distributions to Shareholders from ($): | |
Investment income—net | | | (600,690) | | | | (19,832) | |
Beneficial Interest Transactions ($1.00 per share): | |
Net proceeds from shares sold | | | 502,509,413 | | | | 327,176,459 | |
Distributions reinvested | | | 600,690 | | | | 19,832 | |
Cost of shares redeemed | | | (455,428,616) | | | | (331,110,588) | |
Increase (Decrease) in Net Assets
from Beneficial Interest Transactions | 47,681,487 | | | | (3,914,297) | |
Total Increase (Decrease) in Net Assets | 47,688,498 | | | | (3,917,708) | |
Net Assets ($): | |
Beginning of Period | | | 148,658,680 | | | | 152,576,388 | |
End of Period | | | 196,347,178 | | | | 148,658,680 | |
Undistributed investment income—net | 7,826 | | | | - | |
| | | | | | | | | | |
See notes to financial statements. | | | | | | | | |
10
FINANCIAL HIGHLIGHTS
The following table describes the performance for the fiscal periods indicated. Total return shows how much your investment in the fund would have increased (or decreased) during each period, assuming you had reinvested all dividends and distributions. The fund’s total returns do not reflect expenses associated with variable annuity or insurance contracts. These figures have been derived from the fund’s financial statements.
| | | | | | | | | | | |
| | | | | |
| | |
| | Year Ended December 31, |
| | | 2017 | 2016 | 2015 | 2014 | 2013 |
Per Share Data ($): | | | | | | |
Net asset value, beginning of period | | 1.00 | 1.00 | 1.00 | 1.00 | 1.00 |
Investment Operations: | | | | | | |
Investment income—net | | .003 | .000a | .000a | .000a | .000a |
Distributions: | | | | | | |
Dividends from investment income—net | | (.003) | (.000)a | (.000)a | (.000)a | (.000)a |
Net asset value, end of period | | 1.00 | 1.00 | 1.00 | 1.00 | 1.00 |
Total Return (%) | | .34 | .02 | .00b | .00b | .00b |
Ratios/Supplemental Data (%): | | | | | | |
Ratio of total expenses
to average net assets | | .58 | .62 | .62 | .59 | .60 |
Ratio of net expenses
to average net assets | | .57 | .39 | .23 | .14 | .14 |
Ratio of net investment income
to average net assets | | .37 | .01 | .00b | .00b | .00b |
Net Assets, end of period ($ x 1,000) | | 196,347 | 148,659 | 152,576 | 125,621 | 127,944 |
a Amount represents less than $.001 per share.
b Amount represents less than .01%.
See notes to financial statements.
11
NOTES TO FINANCIAL STATEMENTS
NOTE 1—Significant Accounting Policies:
Government Money Market Portfolio (the “fund”) is a separate diversified series of Dreyfus Variable Investment Fund (the “Company”), which is registered under the Investment Company Act of 1940, as amended (the “Act”), as an open-end management investment company and operates as a series company currently offering seven series, including the fund. The fund is only offered to separate accounts established by insurance companies to fund variable annuity contracts and variable life insurance policies. The fund’s investment objective is to seek as high a level of current income as is consistent with the preservaton of capital and the maintenance of liquidity. The Dreyfus Corporation (the “Manager” or “Dreyfus”), a wholly-owned subsidiary of The Bank of New York Mellon Corporation (“BNY Mellon”), serves as the fund’s investment adviser. MBSC Securities Corporation (the “Distributor”), a wholly-owned subsidiary of Dreyfus, is the distributor of the fund’s shares, which are sold without a sales charge.
The fund operates as a “government money market fund” as that term is defined in Rule 2a-7 under the Act. It is the fund’s policy to maintain a constant net asset value (“NAV”) per share of $1.00 and the fund has adopted certain investment, portfolio valuation and dividend and distribution policies to enable it to do so. There is no assurance, however, that the fund will be able to maintain a constant NAV per share of $1.00.
The Company accounts separately for the assets, liabilities and operations of each series. Expenses directly attributable to each series are charged to that series’ operations; expenses which are applicable to all series are allocated among them on a pro rata basis.
The Financial Accounting Standards Board (“FASB”) Accounting Standards Codification is the exclusive reference of authoritative U.S. generally accepted accounting principles (“GAAP”) recognized by the FASB to be applied by nongovernmental entities. Rules and interpretive releases of the Securities and Exchange Commission (“SEC”) under authority of federal laws are also sources of authoritative GAAP for SEC registrants. The fund’s financial statements are prepared in accordance with GAAP, which may require the use of management estimates and assumptions. Actual results could differ from those estimates.
The Company enters into contracts that contain a variety of indemnifications. The fund’s maximum exposure under these arrangements is unknown. The fund does not anticipate recognizing any loss related to these arrangements.
12
(a) Portfolio valuation: Investments in securities are valued at amortized cost in accordance with Rule 2a-7 under the Act. If amortized cost is determined not to approximate market value, the fair value of the portfolio securities will be determined by procedures established by and under the general supervision of the Board.
The fair value of a financial instrument is the amount that would be received to sell an asset or paid to transfer a liability in an orderly transaction between market participants at the measurement date (i.e., the exit price). GAAP establishes a fair value hierarchy that prioritizes the inputs of valuation techniques used to measure fair value. This hierarchy gives the highest priority to unadjusted quoted prices in active markets for identical assets or liabilities (Level 1 measurements) and the lowest priority to unobservable inputs (Level 3 measurements).
Additionally, GAAP provides guidance on determining whether the volume and activity in a market has decreased significantly and whether such a decrease in activity results in transactions that are not orderly. GAAP requires enhanced disclosures around valuation inputs and techniques used during annual and interim periods.
Various inputs are used in determining the value of the fund’s investments relating to fair value measurements. These inputs are summarized in the three broad levels listed below:
Level 1—unadjusted quoted prices in active markets for identical investments.
Level 2—other significant observable inputs (including quoted prices for similar investments, interest rates, prepayment speeds, credit risk, etc.).
Level 3—significant unobservable inputs (including the fund’s own assumptions in determining the fair value of investments).
The inputs or methodology used for valuing securities are not necessarily an indication of the risk associated with investing in those securities. For example, money market securities are valued using amortized cost, in accordance with rules under the Act. Generally, amortized cost approximates the current fair value of a security, but since the value is not obtained from a quoted price in an active market, such securities are reflected within Level 2 of the fair value hierarchy.
The following is a summary of the inputs used as of December 31, 2017 in valuing the fund’s investments:
13
NOTES TO FINANCIAL STATEMENTS (continued)
| | |
Valuation Inputs | Short-Term Investments ($)† |
Level 1 - Unadjusted Quoted Prices | — |
Level 2 - Other Significant Observable Inputs | 195,360,622 |
Level 3 - Significant Unobservable Inputs | – |
Total | 195,360,622 |
† See Statement of Investments for additional detailed categorizations.
At December 31, 2017, there were no transfers between levels of the fair value hierarchy. It is the fund’s policy to recognize transfers between levels at the end of the reporting period.
(b) Securities transactions and investment income: Securities transactions are recorded on a trade date basis. Interest income, adjusted for accretion of discount and amortization of premium on investments, is earned from settlement date and is recognized on the accrual basis. Realized gains and losses from securities transactions are recorded on the identified cost basis.
The fund may enter into repurchase agreements with financial institutions, deemed to be creditworthy by Dreyfus, subject to the seller’s agreement to repurchase and the fund’s agreement to resell such securities at a mutually agreed upon price. Pursuant to the terms of the repurchase agreement, such securities must have an aggregate market value greater than or equal to the terms of the repurchase price plus accrued interest at all times. If the value of the underlying securities falls below the value of the repurchase price plus accrued interest, the fund will require the seller to deposit additional collateral by the next business day. If the request for additional collateral is not met, or the seller defaults on its repurchase obligation, the fund maintains its right to sell the underlying securities at market value and may claim any resulting loss against the seller. The collateral is held on behalf of the fund by the tri-party administrator with respect to any tri-party agreement. The fund may also jointly enter into one or more repurchase agreements with other Dreyfus-managed funds in accordance with an exemptive order granted by the SEC pursuant to section 17(d) and Rule 17d-1 under the Act. Any joint repurchase agreements must be collateralized fully by U.S. Government securities.
(c) Dividends and distributions to shareholders: It is the policy of the fund to declare dividends daily from investment income-net. Such dividends are paid monthly. Dividends from net realized capital gains, if any, are normally declared and paid annually, but the fund may make distributions on a more frequent basis to comply with the distribution requirements of the Internal Revenue Code of 1986, as amended (the “Code”). To the extent that net realized capital gains can be offset by
14
capital loss carryovers, it is the policy of the fund not to distribute such gains.
(d) Federal income taxes: It is the policy of the fund to continue to qualify as a regulated investment company, if such qualification is in the best interests of its shareholders, by complying with the applicable provisions of the Code, and to make distributions of taxable income sufficient to relieve it from substantially all federal income and excise taxes.
As of and during the period ended December 31, 2017, the fund did not have any liabilities for any uncertain tax positions. The fund recognizes interest and penalties, if any, related to uncertain tax positions as income tax expense in the Statement of Operations. During the period ended December 31, 2017, the fund did not incur any interest or penalties.
Each tax year in the four-year period ended December 31, 2017 remains subject to examination by the Internal Revenue Service and state taxing authorities.
At December 31, 2017, the components of accumulated earnings on a tax basis were substantially the same as for financial reporting purposes.
The tax character of distributions paid to shareholders during the fiscal periods ended December 31, 2017 and December 31, 2016 were all ordinary income.
During the period ended December 31, 2017, as a result of permanent book to tax differences, primarily due to dividend reclassification, the fund increased accumulated undistributed investment income-net by $815 and decreased accumulated net realized gain (loss) on investments by the same amount. Net assets and net asset value per share were not affected by this reclassification.
At December 31, 2017, the cost of investments for federal income tax purposes was substantially the same as the cost for financial reporting purposes (see the Statement of Investments).
NOTE 2―Investment Adivsory Fee and Other Transactions with Affiliates:
(a) Pursuant to an investment advisory agreement with Dreyfus, the investment advisory fee is computed at the annual rate of .50% of the value of the fund’s average daily net assets and is payable monthly. Dreyfus has undertaken to waive receipt of the investment advisory fee and/or reimburse operating expenses in order to facilitate a daily yield at or above a certain level which may change from time to time. This undertaking is voluntary and not contractual, and may be terminated at any time. The
15
NOTES TO FINANCIAL STATEMENTS (continued)
reduction in expenses, pursuant to the undertaking, amounted to $18,661 during the period ended December 31, 2017.
(b) The fund has arrangements with the transfer agent and the custodian whereby the fund may receive earnings credits when positive cash balances are maintained, which are used to offset transfer agency and custody fees. For financial reporting purposes, the fund includes net earnings credits as an expense offset in the Statement of Operations.
The fund compensates Dreyfus Transfer, Inc., a wholly-owned subsidiary of Dreyfus, under a transfer agency agreement for providing transfer agency and cash management services for the fund. The majority of transfer agency fees are comprised of amounts paid on a per account basis, while cash management fees are related to fund subscriptions and redemptions. During the period ended December 31, 2017, the fund was charged $419 for transfer agency services and $28 for cash management services. These fees are included in Shareholder servicing costs in the Statement of Operations. Cash management fees were offset by earnings credits of $28.
The fund compensates The Bank of New York Mellon, a subsidiary of BNY Mellon and an affiliate of Dreyfus, under a custody agreement for providing custodial services for the fund. These fees are determined based on net assets, geographic region and transaction activity. During the period ended December 31, 2017, the fund was charged $12,679 pursuant to the custody agreement. These fees were partially offset by earnings credits of $2,854.
During the period ended December 31, 2017, the fund was charged $11,202 for services performed by the Chief Compliance Officer and his staff.
The components of “Due to The Dreyfus Corporation and affiliates” in the Statement of Assets and Liabilities consist of: investment advisory fees $84,277, custodian fees $4,399, Chief Compliance Officer fees $8,406 and transfer agency fees $226.
(c) Each Board member also serves as a Board member of other funds within the Dreyfus complex. Annual retainer fees and attendance fees are allocated to each fund based on net assets.
16
REPORT OF INDEPENDENT REGISTERED PUBLIC ACCOUNTING FIRM
To the Shareholders and the Board of Trustees of Dreyfus Variable Investment Fund, Government Money Market Portfolio
Opinion on the Financial Statements
We have audited the accompanying statement of assets and liabilities of Dreyfus Variable Investment Fund, Government Money Market Portfolio (one of the series comprising Dreyfus Variable Investment Fund) (the “Fund”), including the statement of investments, as of December 31, 2017, and the related statement of operations for the year then ended, the statements of changes in net assets for each of the two years in the period then ended, the financial highlights for each of the five years in the period then ended and the related notes (collectively referred to as the “financial statements”). In our opinion, the financial statements present fairly, in all material respects, the financial position of Dreyfus Variable Investment Fund, Government Money Market Portfolio at December 31, 2017, the results of its operations for the year then ended, the changes in its net assets for each of the two years in the period then ended and its financial highlights for each of the five years in the period then ended, in conformity with U.S. generally accepted accounting principles.
Basis for opinion
These financial statements are the responsibility of the Fund’s management. Our responsibility is to express an opinion on the Fund’s financial statements based on our audits. We are a public accounting firm registered with the Public Company Accounting Oversight Board (United States) (“PCAOB”) and are required to be independent with respect to the Fund in accordance with the U.S. federal securities laws and the applicable rules and regulations of the Securities and Exchange Commission and the PCAOB.
We conducted our audits in accordance with the standards of the PCAOB. Those standards require that we plan and perform the audit to obtain reasonable assurance about whether the financial statements are free of material misstatement, whether due to error or fraud. The Fund is not required to have, nor were we engaged to perform, an audit of the Fund’s internal control over financial reporting. As part of our audits, we are required to obtain an understanding of internal control over financial reporting, but not for the purpose of expressing an opinion on the effectiveness of the Fund’s internal control over financial reporting. Accordingly, we express no such opinion.
Our audits included performing procedures to assess the risks of material misstatement of the financial statements, whether due to error or fraud, and performing procedures that respond to those risks. Such procedures included examining, on a test basis, evidence regarding the amounts and disclosures in the financial statements. Our procedures included confirmation of securities owned as of December 31, 2017, by correspondence with the custodian and others or by other appropriate auditing procedures where replies were not received. Our audits also included evaluating the accounting principles used and significant estimates made by management, as well as evaluating the overall presentation of the financial statements. We believe that our audits provide a reasonable basis for our opinion.

We have served as the auditor of one or more Dreyfus investment companies since at least 1957, but we are unable to determine the specific year.
New York, New York
February 09, 2018
17
BOARD MEMBERS INFORMATION (Unaudited)
INDEPENDENT BOARD MEMBERS
Joseph S. DiMartino (74)
Chairman of the Board (1995)
Principal Occupation During Past 5 Years:
· Corporate Director and Trustee (1995-present)
Other Public Company Board Memberships During Past 5 Years:
· CBIZ (formerly, Century Business Services, Inc.), a provider of outsourcing functions for small and medium size companies, Director (1997-present)
No. of Portfolios for which Board Member Serves: 127
———————
Peggy C. Davis (74)
Board Member (2006)
Principal Occupation During Past 5 Years:
· Shad Professor of Law, New York University School of Law (1983-present)
No. of Portfolios for which Board Member Serves: 46
———————
David P. Feldman (78)
Board Member (1994)
Principal Occupation During Past 5 Years:
· Corporate Director and Trustee (1985-present)
Other Public Company Board Memberships During Past 5 Years:
· BBH Mutual Funds Group (5 registered mutual funds), Director (1992-2014)
No. of Portfolios for which Board Member Serves: 32
———————
Joan Gulley (70)
Board Member (2017)
Principal Occupation During Past 5 Years:
· PNC Financial Services Group, Inc.(1993-2014), Executive Vice President and Chief Human Resources Officer and Executive Committee Member (2008-2014)
No. of Portfolios for which Board Member Serves: 54
———————
18
Ehud Houminer (77)
Board Member (2006)
Principal Occupation During Past 5 Years:
· Board of Overseers at the Columbia Business School, Columbia University (1992-present)
· Trustee, Ben Gurion University
Other Public Company Board Memberships During Past 5 Years:
· Avnet, Inc., an electronics distributor, Director (1993-2012)
No. of Portfolios for which Board Member Serves: 54
———————
Lynn Martin (78)
Board Member (2012)
Principal Occupation During Past 5 Years:
· President of The Martin Hall Group LLC, a human resources consulting firm (2005-2012)
Other Public Company Board Memberships During Past 5 Years:
· AT&T, Inc., a telecommunications company, Director (1999-2012)
· Ryder System, Inc., a supply chain and transportation management company, Director (1993-2012)
No. of Portfolios for which Board Member Serves: 32
———————
Robin A. Melvin (54)
Board Member (2012)
Principal Occupation During Past 5 Years:
· Co-chairman, Illinois Mentoring Partnership, non-profit organization dedicated to increasing the quantity and quality of mentoring services in Illinois; (2014-present; board member since 2013)
· Director, Boisi Family Foundation, a private family foundation that supports youth-serving organizations that promote the self sufficiency of youth from disadvantaged circumstances (1995-2012)
No. of Portfolios for which Board Member Serves: 101
———————
19
BOARD MEMBERS INFORMATION (Unaudited) (continued)
INDEPENDENT BOARD MEMBERS (continued)
Dr. Martin Peretz (78)
Board Member (1990)
Principal Occupation During Past 5 Years:
· Editor-in-Chief Emeritus of The New Republic Magazine (2011-2012) (previously,
Editor-in-Chief, 1974-2011)
· Lecturer at Harvard University (1969-2012)
No. of Portfolios for which Board Member Serves: 32
———————
Once elected all Board Members serve for an indefinite term, but achieve Emeritus status upon reaching age 80. The address of the Board Members and Officers is c/o The Dreyfus Corporation, 200 Park Avenue, New York, New York 10166. Additional information about the Board Members is available in the fund’s Statement of Additional Information which can be obtained from Dreyfus free of charge by calling this toll free number: 1-800-DREYFUS.
James F. Henry, Emeritus Board Member
Philip L. Toia, Emeritus Board Member
20
OFFICERS OF THE FUND (Unaudited)
BRADLEY J. SKAPYAK, President since January 2010.
Chief Operating Officer and a director of the Manager since June 2009, Chairman of Dreyfus Transfer, Inc., an affiliate of the Manager and the transfer agent of the funds, since May 2011 and Chief Executive Officer of MBSC Securities Corporation since August 2016. He is an officer of 63 investment companies (comprised of 127 portfolios) managed by the Manager. He is 59 years old and has been an employee of the Manager since February 1988.
BENNETT A. MACDOUGALL, Chief Legal Officer since October 2015.
Chief Legal Officer of the Manager and Associate General Counsel and Managing Director of BNY Mellon since June 2015; from June 2005 to June 2015, he served in various capacities with Deutsche Bank – Asset & Wealth Management Division, including as Director and Associate General Counsel, and Chief Legal Officer of Deutsche Investment Management Americas Inc. from June 2012 to May 2015. He is an officer of 64 investment companies (comprised of 152 portfolios) managed by the Manager. He is 46 years old and has been an employee of the Manager since June 2015.
JANETTE E. FARRAGHER, Vice President and Secretary since December 2011.
Associate General Counsel of BNY Mellon, and an officer of 64 investment companies (comprised of 152 portfolios) managed by the Manager. She is 55 years old and has been an employee of the Manager since February 1984.
JAMES BITETTO, Vice President and Assistant Secretary since August 2005.
Managing Counsel of BNY Mellon and Secretary of the Manager, and an officer of 64 investment companies (comprised of 152 portfolios) managed by the Manager. He is 51 years old and has been an employee of the Manager since December 1996.
JOSEPH M. CHIOFFI, Vice President and Assistant Secretary since August 2005.
Managing Counsel of BNY Mellon, and an officer of 64 investment companies (comprised of 152 portfolios) managed by the Manager. He is 56 years old and has been an employee of the Manager since June 2000.
MAUREEN E. KANE, Vice President and Assistant Secretary since April 2015.
Managing Counsel of BNY Mellon since July 2014; from October 2004 until July 2014, General Counsel, and from May 2009 until July 2014, Chief Compliance Officer of Century Capital Management. She is an officer of 64 investment companies (comprised of 152 portfolios) managed by the Manager. She is 55 years old and has been an employee of the Manager since July 2014.
SARAH S. KELLEHER, Vice President and Assistant Secretary since April 2014.
Senior Counsel of BNY Mellon since March 2013, from August 2005 to March 2013, Associate General Counsel of Third Avenue Management. She is an officer of 64 investment companies (comprised of 152 portfolios) managed by the Manager. She is 42 years old and has been an employee of the Manager since March 2013.
JEFF PRUSNOFSKY, Vice President and Assistant Secretary since August 2005.
Senior Managing Counsel of BNY Mellon, and an officer of 64 investment companies (comprised of 152 portfolios) managed by the Manager. He is 52 years old and has been an employee of the Manager since October 1990.
NATALYA ZELENSKY, Vice President and Assistant Secretary since March 2017.
Counsel and Vice President of BNY Mellon since May 2016; Attorney at Wildermuth Endowment Strategy Fund/Wildermuth Advisory, LLC from November 2015 until May 2016; Assistant General Counsel at RCS Advisory Services from July 2014 until November 2015; Associate at Sutherland, Asbill & Brennan from January 2013 until January 2014; Associate at K&L Gates from October 2011 until January 2013. She is an officer of 64 investment companies (comprised of 152 portfolios) managed by Dreyfus. She is 32 years old and has been an employee of the Manager since May 2016.
JAMES WINDELS, Treasurer since November 2001.
Director – Mutual Fund Accounting of the Manager, and an officer of 64 investment companies (comprised of 152 portfolios) managed by the Manager. He is 59 years old and has been an employee of the Manager since April 1985.
21
OFFICERS OF THE FUND (Unaudited) (continued)
RICHARD CASSARO, Assistant Treasurer since January 2008.
Senior Accounting Manager – Money Market and Municipal Bond Funds of the Manager, and an officer of 64 investment companies (comprised of 152 portfolios) managed by the Manager. He is 58 years old and has been an employee of the Manager since September 1982.
GAVIN C. REILLY, Assistant Treasurer since December 2005.
Tax Manager of the Investment Accounting and Support Department of the Manager, and an officer of 64 investment companies (comprised of 152 portfolios) managed by the Manager. He is 49 years old and has been an employee of the Manager since April 1991.
ROBERT S. ROBOL, Assistant Treasurer since August 2005.
Senior Accounting Manager – Dreyfus Financial Reporting of the Manager, and an officer of 64 investment companies (comprised of 152 portfolios) managed by the Manager. He is 53 years old and has been an employee of the Manager since October 1988.
ROBERT SALVIOLO, Assistant Treasurer since July 2007.
Senior Accounting Manager – Equity Funds of the Manager, and an officer of 64 investment companies (comprised of 152 portfolios) managed by the Manager. He is 50 years old and has been an employee of the Manager since June 1989.
ROBERT SVAGNA, Assistant Treasurer since December 2002.
Senior Accounting Manager – Fixed Income and Equity Funds of the Manager, and an officer of 64 investment companies (comprised of 152 portfolios) managed by the Manager. He is 50 years old and has been an employee of the Manager since November 1990.
JOSEPH W. CONNOLLY, Chief Compliance Officer since October 2004.
Chief Compliance Officer of the Manager and The Dreyfus Family of Funds (64 investment companies, comprised of 152 portfolios). He is 60 years old and has served in various capacities with the Manager since 1980, including manager of the firm’s Fund Accounting Department from 1997 through October 2001.
CARIDAD M. CAROSELLA, Anti-Money Laundering Compliance Officer since January 2016.
Anti-Money Laundering Compliance Officer of the Dreyfus Family of Funds and BNY Mellon Funds Trust since January 2016; from May 2015 to December 2015, Interim Anti-Money Laundering Compliance Officer of the Dreyfus Family of Funds and BNY Mellon Funds Trust and the Distributor; from January 2012 to May 2015, AML Surveillance Officer of the Distributor and from 2007 to December 2011, Financial Processing Manager of the Distributor. She is an officer of 58 investment companies (comprised of 146 portfolios) managed by the Manager. She is 49 years old and has been an employee of the Distributor since 1997.
22
NOTES
23
NOTES
24
NOTES
25
Dreyfus Variable Investment Fund, Government Money Market Portfolio
200 Park Avenue
New York, NY 10166
Investment Adviser
The Dreyfus Corporation
200 Park Avenue
New York, NY 10166
Custodian
The Bank of New York Mellon
225 Liberty Street
New York, NY 10286
Transfer Agent &
Dividend Disbursing Agent
Dreyfus Transfer, Inc.
200 Park Avenue
New York, NY 10166
Distributor
MBSC Securities Corporation
200 Park Avenue
New York, NY 10166
Telephone 1-800-258-4260 or 1-800-258-4261
Mail The Dreyfus Family of Funds, 144 Glenn Curtiss Boulevard, Uniondale, NY 11556-0144
Attn: Institutional Services Department
E-mail Send your request to info@dreyfus.com
Internet Information can be viewed online or downloaded at www.dreyfus.com
The fund will disclose daily, on www.dreyfus.com, the fund’s complete schedule of holdings as of the end of the previous business day. The schedule of holdings will remain on the website until the fund files its Form N-Q or Form N-CSR for the period that includes the date of the posted holdings.
The fund files its complete schedule of portfolio holdings with the Securities and Exchange Commission (“SEC”) for the first and third quarters of each fiscal year on Form N-Q. The fund’s Forms N-Q are available on the SEC’s website at www.sec.gov and may be reviewed and copied at the SEC’s Public Reference Room in Washington, D.C. (phone 1-800-SEC-0330 for information).
Information regarding how the fund voted proxies related to portfolio securities for the most recent 12-month period ended June 30 is available at www.dreyfus.com and on the SEC’s website at www.sec.gov and without charge, upon request, by calling 1-800-DREYFUS.
| | |
© 2018 MBSC Securities Corporation
0117AR1217 | 
|
Dreyfus Variable Investment Fund, Growth and Income Portfolio
| | | |

| | ANNUAL REPORT
December 31, 2017 |
| |
The views expressed in this report reflect those of the portfolio manager(s) only through the end of the period covered and do not necessarily represent the views of Dreyfus or any other person in the Dreyfus organization. Any such views are subject to change at any time based upon market or other conditions and Dreyfus disclaims any responsibility to update such views. These views may not be relied on as investment advice and, because investment decisions for a Dreyfus fund are based on numerous factors, may not be relied on as an indication of trading intent on behalf of any Dreyfus fund. |
| |
Not FDIC-Insured • Not Bank-Guaranteed • May Lose Value |
Contents
THE FUND
FOR MORE INFORMATION
Back Cover
| | | | |
| |
Dreyfus Variable Investment Fund, Growth and Income Portfolio
| | The Fund |
A LETTER FROM THE PRESIDENT OF DREYFUS
Dear Shareholder:
We are pleased to present this annual report for Dreyfus Variable Investment Fund, Growth and Income Portfolio, covering the 12-month period from January 1, 2017 through December 31, 2017. For information about how the fund performed during the reporting period, as well as general market perspectives, we provide a Discussion of Fund Performance on the pages that follow.
Stocks set a series of new record highs and bonds produced modestly positive results during 2017. Financial markets early in the year were dominated by the inauguration of a new U.S. president, as equities and corporate-backed bonds surged higher in anticipation of more business-friendly regulatory, tax, and fiscal policies. U.S. and international stocks continued to rally in the spring as corporate earnings grew and global economic conditions improved. Later in the year, the passage of tax reform legislation fueled additional stock market gains.
Despite three short-term interest rate hikes and concerns early in the year that inflation might accelerate in a growing economy, bonds generally produced positive total returns in 2017. Corporate-backed securities and municipal bonds fared particularly well.
The markets’ strong performance last year was supported by solid underlying fundamentals, including sustained economic growth, a robust labor market, and low inflation. We currently expect these favorable conditions to persist in 2018, but we remain watchful for economic and political developments that could negatively impact the markets. As always, we encourage you to discuss the risks and opportunities of today’s investment environment with your financial advisor.
Thank you for your continued confidence and support.
Sincerely,

Renee Laroche-Morris
President
The Dreyfus Corporation
January 16, 2018
2
DISCUSSION OF FUND PERFORMANCE
For the period from January 1, 2017 through December 31, 2017, as provided by John Bailer and Elizabeth Slover, Portfolio Managers
Market and Fund Performance Overview
For the 12-month period ended December 31, 2017, Dreyfus Variable Investment Fund, Growth and Income Portfolio’s Initial shares achieved a total return of 19.71%, and its Service shares achieved a total return of 19.38%.1 In comparison, the fund’s benchmark, the S&P 500® Index (the “Index”), produced a total return of 21.82% for the same period.2
Stocks gained considerable ground during 2017 amid better-than-expected corporate earnings, improved economic conditions, and expectations of more stimulative U.S. government policies. The fund produced double-digit returns but lagged its benchmark, largely due to security selection shortfalls in the consumer staples, consumer discretionary, health care, and materials sectors.
The Fund’s Investment Approach
The fund seeks long-term capital growth, current income, and growth of income consistent with reasonable investment risk. To pursue its goal, the fund normally invests primarily in stocks of domestic and foreign issuers. We seek to create a portfolio that includes a blend of growth and dividend-paying stocks, as well as other investments that provide income. We choose stocks through a disciplined investment process that combines computer-modeling techniques, “bottom-up” fundamental analysis, and risk management. The investment process is designed to provide investors with investment exposure to sector weightings and risk characteristics similar to those of the Index.
In selecting securities, we seek companies that possess some or all of the following characteristics: growth of earnings potential; operating margin improvement; revenue growth prospects; business improvement; good business fundamentals; dividend yield consistent with the fund’s strategy pertaining to income; value, or how a stock is priced relative to its perceived intrinsic worth; and healthy financial profile, which measures the financial well-being of the company.
The fund may use listed equity options to seek to enhance and/or mitigate risk. The fund will engage in “covered” option transactions where the fund has in its possession, for the duration of the strategy, the underlying physical asset or cash to satisfy any obligation the fund may have with respect to the option strategy.
Favorable Economic and Political Conditions Drove Stocks
Better-than-expected corporate earnings and encouraging economic data—including strong GDP growth and low unemployment—propelled the Index to a series of record highs during 2017. Economically sensitive, growth-oriented market segments fared particularly well, led by the information technology sector. The materials, financials, health care and consumer discretionary sectors also outperformed market averages, though to a lesser
3
DISCUSSION OF FUND PERFORMANCE (continued)
degree. In contrast, high-yielding and traditionally defensive market sectors lagged, with the telecommunication services, real estate, and energy sectors proving weakest.
Worries regarding the administration’s ability to implement some of its pro-business policy initiatives briefly derailed the market rally in the spring, but passage of major tax-reform legislation during the fourth quarter, as well as reduced regulatory burdens on a wide range of business activities, alleviated those concerns.
Gains Were Limited by Some Disappointing Stock Selections
In the consumer staples sector, food products companies, such as Kellogg and Kraft Heinz, came under pressure from competitive challenges in the grocery industry, while beverage maker Molson Coors Brewing also disappointed when anticipated business synergies failed to materialize. In the consumer discretionary sector, lack of exposure to surging fast-food giant McDonald’s undermined the fund’s relative results. Investments in household durables company Newell Brands and advertising agency Omnicom Group also trailed market averages. In the health care sector, relative performance suffered from lack of exposure to the sector’s leading performers, as well as a slump in biotechnology developer Celgene. In the materials sector, the fund’s returns lagged those of the Index due to overweighted exposure to construction aggregate producers, such as Vulcan Materials and Martin Marietta Materials, and metals-and-mining holdings Nucor and Newmont Mining. Other significant detractors during 2017 included real estate investment trust Uniti Group, financial services provider Synchrony Financial, and telecommunication services provider AT&T.
The fund achieved better relative results in other areas. In the industrials sector, the fund avoided lagging conglomerate General Electric, focusing instead on Honeywell International, which outperformed sector averages. Likewise, among energy companies, the fund steered clear of slower-growing industry giants Exxon Mobil and Chevron in favor of smaller, better-performing companies, such as Kinder Morgan and Phillips 66. In the high-flying information technology sector, enterprise software developers ServiceNow and Oracle bolstered returns, as did semiconductor holdings, such as Texas Instruments, and payment services provider Square. Other top holdings included health care services providers Aetna and UnitedHealth Group, telecommunications provider Verizon Communications, wealth manager Ameriprise Financial, and biotechnology firm Neurocrine Biosciences. Relative results further benefited from underweighted exposure to the lagging utilities sector.
A Continued Positive Outlook
The strengthening U.S. economy, prospects for additional business-friendly government policies, and global economic improvements have increased the likelihood of further market advances in 2018. We believe we have positioned the fund to benefit from this constructive environment through overweighted exposure to the financials, materials, telecommunication services, information technology, and energy sectors. In contrast, the fund currently holds
4
relatively little exposure to the utilities, consumer staples, real estate, health care, consumer discretionary, and industrial sectors.
January 16, 2018
1 Total return includes reinvestment of dividends and any capital gains paid. Past performance is no guarantee of future results. Share price and investment return fluctuate such that upon redemption, fund shares may be worth more or less than their original cost. The fund’s performance does not reflect the deduction of additional charges and expenses imposed in connection with investing in variable insurance contracts, which will reduce returns.
2 Source: Lipper Inc. — The S&P 500® Index is widely regarded as the best single gauge of large-cap U.S. equities. The index includes 500 leading companies and captures approximately 80% coverage of available market capitalization. Investors cannot invest directly in any index.
Please note: the position in any security highlighted with italicized typeface was sold during the reporting period.
Equities are subject generally to market, market sector, market liquidity, issuer, and investment style risks, among other factors, to varying degrees, all of which are more fully described in the fund’s prospectus.
The use of derivatives involves risks different from, or possibly greater than, the risks associated with investing directly in the underlying assets. Derivatives can be highly volatile, illiquid, and difficult to value, and there is the risk that changes in the value of a derivative held by the fund will not correlate with the underlying instruments or the fund’s other investments.
The fund is only available as a funding vehicle under variable life insurance policies or variable annuity contracts issued by insurance companies. Individuals may not purchase shares of the fund directly. A variable annuity is an insurance contract issued by an insurance company that enables investors to accumulate assets on a tax-deferred basis for retirement or other long-term goals. The investment objective and policies of Dreyfus Variable Investment Fund, Growth and Income Portfolio made available through insurance products may be similar to those of other funds managed or advised by Dreyfus. However, the investment results of the fund may be higher or lower than, and may not be comparable to, those of any other Dreyfus fund.
5
FUND PERFORMANCE
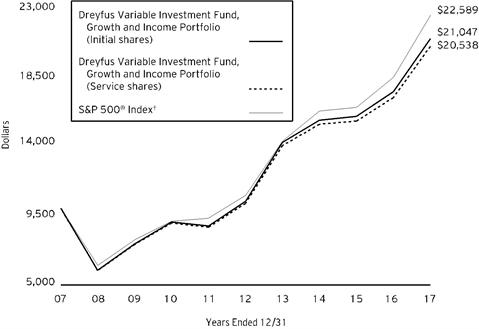
Comparison of change in value of $10,000 investment in Dreyfus Variable Investment Fund, Growth and Income Portfolio Initial shares and Service shares and the S&P 500® Index (the “Index”)
† Source: Lipper Inc.
Past performance is not predictive of future performance. The fund’s performance does not reflect the deduction of additional charges and expenses imposed in connection with investing in variable insurance contracts which will reduce returns.
The above graph compares a $10,000 investment made in Initial and Service shares of Dreyfus Variable Investment Fund, Growth and Income Portfolio on 12/31/07 to a $10,000 investment made in the Index on that date.
The fund’s performance shown in the line graph above takes into account all applicable fees and expenses. The Index is widely regarded as the best single gauge of large-cap U.S. equities. The Index includes 500 leading companies and captures approximately 80% coverage of available market capitalization. Unlike a mutual fund, the Index is not subject to charges, fees and other expenses. Investors cannot invest directly in any index. Further information relating to fund performance, including expense reimbursements, if applicable, is contained in the Financial Highlights section of the prospectus and elsewhere in this report.
| | | | |
Average Annual Total Returns as of 12/31/17 | |
| 1 Year | 5 Years | 10 Years |
Initial shares | 19.71% | 15.04% | 7.73% |
Service shares | 19.38% | 14.75% | 7.46% |
S&P 500® Index | 21.82% | 15.78% | 8.49% |
The performance data quoted represents past performance, which is no guarantee of future results. Share price and investment return fluctuate and an investor’s shares may be worth more or less than original cost upon redemption. Current performance may be lower or higher than the performance quoted. Go to Dreyfus.com for the fund’s most recent month-end returns.
The fund’s Initial shares are not subject to a Rule 12b-1 fee. The fund’s Service shares are subject to a 0.25% annual Rule 12b-1 fee. All dividends and capital gain distributions are reinvested.
The fund’s performance shown in the graph and table does not reflect the deduction of taxes that a shareholder would pay on fund distributions or the redemption of fund shares.
6
UNDERSTANDING YOUR FUND’S EXPENSES (Unaudited)
As a mutual fund investor, you pay ongoing expenses, such as management fees and other expenses. Using the information below, you can estimate how these expenses affect your investment and compare them with the expenses of other funds. You also may pay one-time transaction expenses, including sales charges (loads), redemption fees and expenses associated with variable annuity or insurance contracts, which are not shown in this section and would have resulted in higher total expenses. For more information, see your fund’s prospectus or talk to your financial adviser.
Review your fund’s expenses
The table below shows the expenses you would have paid on a $1,000 investment in Dreyfus Variable Investment Fund, Growth and Income Portfolio from July 1, 2017 to December 31, 2017. It also shows how much a $1,000 investment would be worth at the close of the period, assuming actual returns and expenses.
| | | | | | | | |
Expenses and Value of a $1,000 Investment | | |
assuming actual returns for the six months ended December 31, 2017 | |
| | | | Initial Shares | Service Shares |
Expenses paid per $1,000† | | | $4.79 | | $6.12 |
Ending value (after expenses) | | | $1,112.10 | | $1,110.50 |
COMPARING YOUR FUND’S EXPENSES
WITH THOSE OF OTHER FUNDS (Unaudited)
Using the SEC’s method to compare expenses
The Securities and Exchange Commission (“SEC”) has established guidelines to help investors assess fund expenses. Per these guidelines, the table below shows your fund’s expenses based on a $1,000 investment, assuming a hypothetical 5% annualized return. You can use this information to compare the ongoing expenses (but not transaction expenses or total cost) of investing in the fund with those of other funds. All mutual fund shareholder reports will provide this information to help you make this comparison. Please note that you cannot use this information to estimate your actual ending account balance and expenses paid during the period.
| | | | | | | | |
Expenses and Value of a $1,000 Investment | | |
assuming a hypothetical 5% annualized return for the six months ended December 31, 2017 |
| | | | Initial Shares | Service Shares |
Expenses paid per $1,000† | | | $4.58 | | $5.85 |
Ending value (after expenses) | | | $1,020.67 | | $1,019.41 |
† Expenses are equal to the fund’s annualized expense ratio of .90% for Initial shares and 1.15% for Service shares, multiplied by the average account value over the period, multiplied by 184/365 (to reflect the one-half year period).
7
STATEMENT OF INVESTMENTS
December 31, 2017
| | | | | | | | |
| |
Description | | | | Shares | | Value ($) | |
Common Stocks - 99.7% | | | | | |
Automobiles & Components - 1.4% | | | | | |
Aptiv | | | | 4,457 | | 378,087 | |
Goodyear Tire & Rubber | | | | 10,981 | | 354,796 | |
Tesla | | | | 1,558 | a,b | 485,083 | |
| | | | | 1,217,966 | |
Banks - 9.2% | | | | | |
Bank of America | | | | 56,487 | | 1,667,496 | |
BB&T | | | | 11,057 | | 549,754 | |
Citigroup | | | | 11,083 | | 824,686 | |
JPMorgan Chase & Co. | | | | 19,576 | | 2,093,457 | |
PNC Financial Services Group | | | | 4,620 | | 666,620 | |
SunTrust Banks | | | | 15,153 | | 978,732 | |
U.S. Bancorp | | | | 5,971 | | 319,926 | |
Wells Fargo & Co. | | | | 14,663 | | 889,604 | |
| | | | | 7,990,275 | |
Capital Goods - 8.5% | | | | | |
Fortive | | | | 9,069 | | 656,142 | |
Harris | | | | 2,349 | | 332,736 | |
Honeywell International | | | | 10,163 | | 1,558,598 | |
L3 Technologies | | | | 3,415 | | 675,658 | |
PACCAR | | | | 7,383 | | 524,784 | |
Quanta Services | | | | 10,931 | b | 427,511 | |
Raytheon | | | | 8,425 | | 1,582,636 | |
United Technologies | | | | 12,960 | | 1,653,307 | |
| | | | | 7,411,372 | |
Consumer Durables & Apparel - .4% | | | | | |
PVH | | | | 2,403 | | 329,716 | |
Consumer Services - .9% | | | | | |
Las Vegas Sands | | | | 11,198 | | 778,149 | |
Diversified Financials - 6.5% | | | | | |
American Express | | | | 3,369 | | 334,575 | |
Ameriprise Financial | | | | 6,154 | | 1,042,918 | |
Berkshire Hathaway, Cl. B | | | | 10,758 | b | 2,132,451 | |
Capital One Financial | | | | 3,806 | | 379,002 | |
Goldman Sachs Group | | | | 1,441 | | 367,109 | |
Morgan Stanley | | | | 6,407 | | 336,175 | |
Synchrony Financial | | | | 11,436 | | 441,544 | |
Voya Financial | | | | 13,053 | | 645,732 | |
| | | | | 5,679,506 | |
Energy - 6.4% | | | | | |
EOG Resources | | | | 9,434 | | 1,018,023 | |
Hess | | | | 14,845 | | 704,692 | |
8
| | | | | | | | |
| |
Description | | | | Shares | | Value ($) | |
Common Stocks - 99.7% (continued) | | | | | |
Energy - 6.4% (continued) | | | | | |
Occidental Petroleum | | | | 20,619 | | 1,518,796 | |
Phillips 66 | | | | 11,003 | | 1,112,953 | |
Schlumberger | | | | 12,061 | | 812,791 | |
Valero Energy | | | | 5,000 | | 459,550 | |
| | | | | 5,626,805 | |
Exchange-Traded Funds - .5% | | | | | |
iShares Russell 1000 Value ETF | | | | 3,594 | | 446,878 | |
Food & Staples Retailing - .8% | | | | | |
Costco Wholesale | | | | 3,783 | | 704,092 | |
Food, Beverage & Tobacco - 5.0% | | | | | |
Coca-Cola | | | | 9,784 | | 448,890 | |
Coca-Cola European Partners | | | | 7,995 | | 318,601 | |
Conagra Brands | | | | 18,960 | | 714,223 | |
Kellogg | | | | 8,728 | a | 593,329 | |
Kraft Heinz | | | | 10,492 | | 815,858 | |
Monster Beverage | | | | 7,681 | b | 486,131 | |
PepsiCo | | | | 8,472 | | 1,015,962 | |
| | | | | 4,392,994 | |
Health Care Equipment & Services - 4.9% | | | | | |
Abbott Laboratories | | | | 7,680 | | 438,298 | |
AmerisourceBergen | | | | 3,588 | | 329,450 | |
Boston Scientific | | | | 20,387 | b | 505,394 | |
Humana | | | | 1,869 | | 463,643 | |
IDEXX Laboratories | | | | 2,711 | b | 423,946 | |
UnitedHealth Group | | | | 7,679 | | 1,692,912 | |
WellCare Health Plans | | | | 2,015 | b | 405,237 | |
| | | | | 4,258,880 | |
Insurance - 2.8% | | | | | |
Allstate | | | | 3,337 | | 349,417 | |
American International Group | | | | 6,568 | | 391,322 | |
Hartford Financial Services Group | | | | 6,409 | | 360,699 | |
Progressive | | | | 13,454 | | 757,729 | |
Prudential Financial | | | | 5,446 | | 626,181 | |
| | | | | 2,485,348 | |
Materials - 5.4% | | | | | |
CF Industries Holdings | | | | 14,840 | | 631,294 | |
DowDuPont | | | | 22,384 | | 1,594,189 | |
Martin Marietta Materials | | | | 2,047 | | 452,469 | |
Newmont Mining | | | | 11,973 | | 449,227 | |
Packaging Corporation of America | | | | 1,851 | | 223,138 | |
Praxair | | | | 2,935 | | 453,986 | |
Vulcan Materials | | | | 7,205 | | 924,906 | |
| | | | | 4,729,209 | |
9
STATEMENT OF INVESTMENTS (continued)
| | | | | | | | |
| |
Description | | | | Shares | | Value ($) | |
Common Stocks - 99.7% (continued) | | | | | |
Media - 3.0% | | | | | |
Charter Communications, Cl. A | | | | 1,004 | b | 337,304 | |
Comcast, Cl. A | | | | 31,507 | | 1,261,855 | |
Omnicom Group | | | | 8,719 | a | 635,005 | |
Twenty-First Century Fox, Cl. A | | | | 10,082 | | 348,131 | |
| | | | | 2,582,295 | |
Pharmaceuticals, Biotechnology & Life Sciences - 6.7% | | | | | |
Biogen | | | | 2,464 | b | 784,957 | |
BioMarin Pharmaceutical | | | | 2,922 | b | 260,555 | |
Bristol-Myers Squibb | | | | 11,771 | | 721,327 | |
Celgene | | | | 6,231 | b | 650,267 | |
Gilead Sciences | | | | 2,580 | | 184,831 | |
Johnson & Johnson | | | | 9,198 | | 1,285,145 | |
Merck & Co. | | | | 5,246 | | 295,192 | |
Neurocrine Biosciences | | | | 4,520 | a,b | 350,707 | |
Pfizer | | | | 22,688 | | 821,759 | |
Zoetis | | | | 6,747 | | 486,054 | |
| | | | | 5,840,794 | |
Real Estate - .7% | | | | | |
Lamar Advertising, Cl. A | | | | 5,606 | a,c | 416,189 | |
Uniti Group | | | | 12,634 | a,c | 224,759 | |
| | | | | 640,948 | |
Retailing - 5.5% | | | | | |
Amazon.com | | | | 1,536 | b | 1,796,306 | |
Dollar Tree | | | | 4,935 | b | 529,575 | |
Home Depot | | | | 5,554 | | 1,052,650 | |
Nordstrom | | | | 6,387 | a | 302,616 | |
Priceline Group | | | | 460 | b | 799,360 | |
Wayfair, Cl. A | | | | 3,987 | a,b | 320,037 | |
| | | | | 4,800,544 | |
Semiconductors & Semiconductor Equipment - 4.1% | | | | | |
Broadcom | | | | 4,407 | | 1,132,158 | |
Microchip Technology | | | | 2,511 | a | 220,667 | |
NVIDIA | | | | 4,017 | | 777,290 | |
Texas Instruments | | | | 13,849 | | 1,446,390 | |
| | | | | 3,576,505 | |
Software & Services - 14.5% | | | | | |
Activision Blizzard | | | | 9,735 | | 616,420 | |
Alphabet, Cl. C | | | | 1,583 | b | 1,656,451 | |
Facebook, Cl. A | | | | 9,525 | b | 1,680,782 | |
First Data, Cl. A | | | | 22,440 | b | 374,972 | |
Fortinet | | | | 10,479 | b | 457,828 | |
HubSpot | | | | 4,456 | a,b | 393,910 | |
Microsoft | | | | 28,161 | | 2,408,892 | |
10
| | | | | | | | |
| |
Description | | | | Shares | | Value ($) | |
Common Stocks - 99.7% (continued) | | | | | |
Software & Services - 14.5% (continued) | | | | | |
Oracle | | | | 13,947 | | 659,414 | |
PayPal Holdings | | | | 11,045 | b | 813,133 | |
salesforce.com | | | | 6,901 | b | 705,489 | |
ServiceNow | | | | 3,614 | b | 471,230 | |
Splunk | | | | 4,626 | b | 383,218 | |
Square, Cl. A | | | | 8,593 | b | 297,919 | |
Teradata | | | | 9,624 | a,b | 370,139 | |
Twilio, Cl. A | | | | 8,038 | a,b | 189,697 | |
Visa, Cl. A | | | | 10,322 | | 1,176,914 | |
| | | | | 12,656,408 | |
Technology Hardware & Equipment - 6.2% | | | | | |
Apple | | | | 20,592 | | 3,484,784 | |
Arista Networks | | | | 1,268 | b | 298,715 | |
Cisco Systems | | | | 42,297 | | 1,619,975 | |
| | | | | 5,403,474 | |
Telecommunication Services - 4.1% | | | | | |
AT&T | | | | 28,035 | | 1,090,001 | |
T-Mobile US | | | | 5,896 | b | 374,455 | |
Verizon Communications | | | | 36,155 | | 1,913,684 | |
Vodafone Group, ADR | | | | 7,165 | | 228,564 | |
| | | | | 3,606,704 | |
Transportation - 1.7% | | | | | |
Delta Air Lines | | | | 11,827 | | 662,312 | |
Union Pacific | | | | 6,342 | | 850,462 | |
| | | | | 1,512,774 | |
Utilities - .5% | | | | | |
FirstEnergy | | | | 12,944 | | 396,345 | |
Total Common Stocks (cost $64,505,516) | | | | 87,067,981 | |
| | | | | | | | |
Other Investment - .5% | | | | | |
Registered Investment Company; | | | | | |
Dreyfus Institutional Preferred Government Plus Money Market Fund
(cost $439,494) | | | | 439,494 | d | 439,494 | |
11
STATEMENT OF INVESTMENTS (continued)
| | | | | | | | |
| |
Description | | | | Shares | | Value ($) | |
Investment of Cash Collateral for Securities Loaned - 2.3% | | | | | |
Registered Investment Company; | | | | | |
Dreyfus Institutional Preferred Government Money Market Fund, Institutional Shares
(cost $2,023,897) | | | | 2,023,897 | d | 2,023,897 | |
Total Investments (cost $66,968,907) | | 102.5% | | 89,531,372 | |
Liabilities, Less Cash and Receivables | | (2.5%) | | (2,155,082) | |
Net Assets | | 100.0% | | 87,376,290 | |
ADR—American Depository Receipt
ETF—Exchange-Traded Fund
aSecurity, or portion thereof, on loan. At December 31, 2017, the value of the fund’s securities on loan was $4,289,862 and the value of the collateral held by the fund was $4,403,742, consisting of cash collateral of $2,023,897 and U.S. Government & Agency securities valued at $2,379,845.
bNon-income producing security.
cInvestment in real estate investment trust.
dInvestment in affiliated money market mutual fund.
| | |
Portfolio Summary (Unaudited) † | Value (%) |
Software & Services | 14.5 |
Banks | 9.2 |
Capital Goods | 8.5 |
Pharmaceuticals, Biotechnology & Life Sciences | 6.7 |
Diversified Financials | 6.5 |
Energy | 6.4 |
Technology Hardware & Equipment | 6.2 |
Retailing | 5.5 |
Materials | 5.4 |
Food, Beverage & Tobacco | 5.0 |
Health Care Equipment & Services | 4.9 |
Telecommunication Services | 4.1 |
Semiconductors & Semiconductor Equipment | 4.1 |
Media | 3.0 |
Insurance | 2.8 |
Money Market Investments | 2.8 |
Transportation | 1.7 |
Automobiles & Components | 1.4 |
Consumer Services | .9 |
Food & Staples Retailing | .8 |
Real Estate | .7 |
Exchange-Traded Funds | .5 |
Utilities | .5 |
Consumer Durables & Apparel | .4 |
| | 102.5 |
† Based on net assets.
See notes to financial statements.
12
STATEMENT OF INVESTMENTS IN AFFILIATED ISSUERS
| | | | | | | |
Registered Investment Companies | Value
12/31/16 ($) | Purchases ($) | Sales ($) | Value
12/31/17 ($) | Net
Assets (%) | Dividends/
Distributions ($) |
Dreyfus Institutional Preferred Government Money Market Fund, Institutional Shares | 948,439 | 25,972,006 | 24,896,548 | 2,023,897 | 2.3 | — |
Dreyfus Institutional Preferred Government Plus Money Market Fund | 465,283 | 17,685,784 | 17,711,573 | 439,494 | .5 | 7,253 |
Total | 1,413,722 | 43,657,790 | 42,608,121 | 2,463,391 | 2.8 | 7,253 |
13
STATEMENT OF ASSETS AND LIABILITIES
December 31, 2017
| | | | | | | |
| | | | | | |
| | | Cost | | Value | |
Assets ($): | | | | |
Investments in securities—See Statement of Investments
(including securities on loan, valued at $4,289,862)—Note 1(b): | | | |
Unaffiliated issuers | 64,505,516 | | 87,067,981 | |
Affiliated issuers | | 2,463,391 | | 2,463,391 | |
Cash | | | | | 11,517 | |
Receivable for investment securities sold | | 753,160 | |
Dividends and securities lending income receivable | | 64,403 | |
Prepaid expenses | | | | | 550 | |
| | | | | 90,361,002 | |
Liabilities ($): | | | | |
Due to The Dreyfus Corporation and affiliates—Note 3(b) | | | | | 69,700 | |
Liability for securities on loan—Note 1(b) | | 2,023,897 | |
Payable for investment securities purchased | | 773,204 | |
Payable for shares of Beneficial Interest redeemed | | 62,911 | |
Accrued expenses | | | | | 55,000 | |
| | | | | 2,984,712 | |
Net Assets ($) | | | 87,376,290 | |
Composition of Net Assets ($): | | | | |
Paid-in capital | | | | | 57,233,896 | |
Accumulated undistributed investment income—net | | 104,590 | |
Accumulated net realized gain (loss) on investments | | | | | 7,475,339 | |
Accumulated net unrealized appreciation (depreciation)
on investments | | | | 22,562,465 | |
Net Assets ($) | | | 87,376,290 | |
| | | | |
Net Asset Value Per Share | Initial Shares | Service Shares | |
Net Assets ($) | 82,070,349 | 5,305,941 | |
Shares Outstanding | 2,508,369 | 161,954 | |
Net Asset Value Per Share ($) | 32.72 | 32.76 | |
| | | | |
See notes to financial statements. | | | |
14
STATEMENT OF OPERATIONS
Year Ended December 31, 2017
| | | | | | | |
| | | | | | |
| | | | | | |
Investment Income ($): | | | | |
Income: | | | | |
Cash dividends: | |
Unaffiliated issuers | | | 1,441,629 | |
Affiliated issuers | | | 7,253 | |
Income from securities lending—Note 1(b) | | | 9,818 | |
Total Income | | | 1,458,700 | |
Expenses: | | | | |
Investment advisory fee—Note 3(a) | | | 623,580 | |
Professional fees | | | 63,236 | |
Prospectus and shareholders’ reports | | | 19,571 | |
Custodian fees—Note 3(b) | | | 17,916 | |
Distribution fees—Note 3(b) | | | 13,493 | |
Trustees’ fees and expenses—Note 3(c) | | | 6,595 | |
Loan commitment fees—Note 2 | | | 1,299 | |
Shareholder servicing costs—Note 3(b) | | | 652 | |
Miscellaneous | | | 19,016 | |
Total Expenses | | | 765,358 | |
Less—reduction in fees due to earnings credits—Note 3(b) | | | (66) | |
Net Expenses | | | 765,292 | |
Investment Income—Net | | | 693,408 | |
Realized and Unrealized Gain (Loss) on Investments—Note 4 ($): | | |
Net realized gain (loss) on investments | 7,904,298 | |
Net unrealized appreciation (depreciation) on investments | | | 6,378,459 | |
Net Realized and Unrealized Gain (Loss) on Investments | | | 14,282,757 | |
Net Increase in Net Assets Resulting from Operations | | 14,976,165 | |
| | | | | | | |
See notes to financial statements. | | | | | |
15
STATEMENT OF CHANGES IN NET ASSETS
| | | | | | | | | | |
| | | | Year Ended December 31, |
| | | | 2017 | | 2016 | |
Operations ($): | | | | | | | | |
Investment income—net | | | 693,408 | | | | 914,214 | |
Net realized gain (loss) on investments | | 7,904,298 | | | | 3,677,533 | |
Net unrealized appreciation (depreciation)
on investments | | 6,378,459 | | | | 2,834,430 | |
Net Increase (Decrease) in Net Assets
Resulting from Operations | 14,976,165 | | | | 7,426,177 | |
Distributions to Shareholders from ($): | |
Investment income—net: | | | | | | | | |
Initial Shares | | | (575,664) | | | | (889,195) | |
Service Shares | | | (26,116) | | | | (49,766) | |
Net realized gain on investments: | | | | | | | | |
Initial Shares | | | (3,384,893) | | | | (8,761,675) | |
Service Shares | | | (241,113) | | | | (613,919) | |
Total Distributions | | | (4,227,786) | | | | (10,314,555) | |
Beneficial Interest Transactions ($): | |
Net proceeds from shares sold: | | | | | | | | |
Initial Shares | | | 3,050,148 | | | | 2,121,289 | |
Service Shares | | | 267,978 | | | | 194,912 | |
Distributions reinvested: | | | | | | | | |
Initial Shares | | | 3,960,557 | | | | 9,650,870 | |
Service Shares | | | 267,229 | | | | 663,685 | |
Cost of shares redeemed: | | | | | | | | |
Initial Shares | | | (9,798,754) | | | | (12,585,623) | |
Service Shares | | | (1,199,596) | | | | (1,111,240) | |
Increase (Decrease) in Net Assets
from Beneficial Interest Transactions | (3,452,438) | | | | (1,066,107) | |
Total Increase (Decrease) in Net Assets | 7,295,941 | | | | (3,954,485) | |
Net Assets ($): | |
Beginning of Period | | | 80,080,349 | | | | 84,034,834 | |
End of Period | | | 87,376,290 | | | | 80,080,349 | |
Undistributed investment income—net | 104,590 | | | | 12,962 | |
Capital Share Transactions (Shares): | |
Initial Shares | | | | | | | | |
Shares sold | | | 100,546 | | | | 77,659 | |
Shares issued for distributions reinvested | | | 135,968 | | | | 368,489 | |
Shares redeemed | | | (324,338) | | | | (461,673) | |
Net Increase (Decrease) in Shares Outstanding | (87,824) | | | | (15,525) | |
Service Shares | | | | | | | | |
Shares sold | | | 8,785 | | | | 7,014 | |
Shares issued for distributions reinvested | | | 9,184 | | | | 25,321 | |
Shares redeemed | | | (39,159) | | | | (40,424) | |
Net Increase (Decrease) in Shares Outstanding | (21,190) | | | | (8,089) | |
| | | | | | | | | | |
See notes to financial statements. | | | | | | | | |
16
FINANCIAL HIGHLIGHTS
The following tables describe the performance for each share class for the fiscal periods indicated. All information (except portfolio turnover rate) reflects financial results for a single fund share. Total return shows how much your investment in the fund would have increased (or decreased) during each period, assuming you had reinvested all dividends and distributions. The fund’s total returns do not reflect expenses associated with variable annuity or insurance contracts. These figures have been derived from the fund’s financial statements.
| | | | | | | | | | |
| | | | | |
| | |
| | Year Ended December 31, |
Initial Shares | | 2017 | 2016 | 2015 | 2014 | 2013 |
Per Share Data ($): | | | | | | |
Net asset value, beginning of period | | 28.81 | 29.98 | 32.68 | 29.92 | 22.07 |
Investment Operations: | | | | | | |
Investment income—neta | | .26 | .33 | .26 | .24 | .23 |
Net realized and unrealized
gain (loss) on investments | | 5.22 | 2.27 | .28 | 2.77 | 7.86 |
Total from Investment Operations | | 5.48 | 2.60 | .54 | 3.01 | 8.09 |
Distributions: | | | | | | |
Dividends from investment income—net | | (.23) | (.34) | (.27) | (.25) | (.24) |
Dividends from net realized
gain on investments | | (1.34) | (3.43) | (2.97) | – | – |
Total Distributions | | (1.57) | (3.77) | (3.24) | (.25) | (.24) |
Net asset value, end of period | | 32.72 | 28.81 | 29.98 | 32.68 | 29.92 |
Total Return (%) | | 19.71 | 10.04 | 1.59 | 10.07 | 36.78 |
Ratios/Supplemental Data (%): | | | | | | |
Ratio of total expenses
to average net assets | | .90 | .90 | .88 | .87 | .89 |
Ratio of net expenses
to average net assets | | .90 | .90 | .88 | .87 | .89 |
Ratio of net investment income
to average net assets | | .85 | 1.17 | .84 | .78 | .91 |
Portfolio Turnover Rate | | 61.00 | 64.41 | 62.03 | 51.99 | 50.46 |
Net Assets, end of period ($ x 1,000) | | 82,070 | 74,797 | 78,296 | 85,534 | 84,479 |
a Based on average shares outstanding.
See notes to financial statements.
17
FINANCIAL HIGHLIGHTS (continued)
| | | | | | | | | | | |
| | | | | |
| | |
| | Year Ended December 31, |
Service Shares | | 2017 | 2016 | 2015 | 2014 | 2013 |
Per Share Data ($): | | | | | | |
Net asset value, beginning of period | | 28.85 | 30.01 | 32.71 | 29.94 | 22.09 |
Investment Operations: | | | | | | |
Investment income—neta | | .18 | .25 | .18 | .16 | .17 |
Net realized and unrealized
gain (loss) on investments | | 5.22 | 2.29 | .27 | 2.78 | 7.85 |
Total from Investment Operations | | 5.40 | 2.54 | .45 | 2.94 | 8.02 |
Distributions: | | | | | | |
Dividends from investment income—net | | (.15) | (.27) | (.18) | (.17) | (.17) |
Dividends from net
realized gain on investments | | (1.34) | (3.43) | (2.97) | – | – |
Total Distributions | | (1.49) | (3.70) | (3.15) | (.17) | (.17) |
Net asset value, end of period | | 32.76 | 28.85 | 30.01 | 32.71 | 29.94 |
Total Return (%) | | 19.38 | 9.78 | 1.32 | 9.83 | 36.43 |
Ratios/Supplemental Data (%): | | | | | | |
Ratio of total expenses
to average net assets | | 1.15 | 1.15 | 1.13 | 1.12 | 1.14 |
Ratio of net expenses
to average net assets | | 1.15 | 1.15 | 1.13 | 1.12 | 1.14 |
Ratio of net investment income
to average net assets | | .60 | .92 | .59 | .52 | .65 |
Portfolio Turnover Rate | | 61.00 | 64.41 | 62.03 | 51.99 | 50.46 |
Net Assets, end of period ($ x 1,000) | | 5,306 | 5,283 | 5,739 | 7,162 | 8,051 |
a Based on average shares outstanding.
See notes to financial statements.
18
NOTES TO FINANCIAL STATEMENTS
NOTE 1—Significant Accounting Policies:
Growth and Income Portfolio (the “fund”) is a separate non-diversified series of Dreyfus Variable Investment Fund (the “Company”), which is registered under the Investment Company Act of 1940, as amended (the “Act”), as an open-end management investment company and operates as a series company currently offering seven series, including the fund. The fund is only offered to separate accounts established by insurance companies to fund variable annuity contracts and variable life insurance policies. The fund’s investment objective is to seek long-term capital growth, current income and growth of income consistent with reasonable investment risk. The Dreyfus Corporation (the “Manager” or “Dreyfus”), a wholly-owned subsidiary of The Bank of New York Mellon Corporation (“BNY Mellon”), serves as the fund’s investment adviser.
MBSC Securities Corporation (the “Distributor”), a wholly-owned subsidiary of Dreyfus, is the distributor of the fund’s shares, which are sold without a sales charge. The fund is authorized to issue an unlimited number of $.001 par value shares of Beneficial Interest in each of the following classes of shares: Initial and Service. Each class of shares has identical rights and privileges, except with respect to the Distribution Plan, and the expenses borne by each class, the allocation of certain transfer agency costs, and certain voting rights. Income, expenses (other than expenses attributable to a specific class), and realized and unrealized gains or losses on investments are allocated to each class of shares based on its relative net assets.
The Company accounts separately for the assets, liabilities and operations of each series. Expenses directly attributable to each series are charged to that series’ operations; expenses which are applicable to all series are allocated among them on a pro rata basis.
The Financial Accounting Standards Board (“FASB”) Accounting Standards Codification is the exclusive reference of authoritative U.S. generally accepted accounting principles (“GAAP”) recognized by the FASB to be applied by nongovernmental entities. Rules and interpretive releases of the Securities and Exchange Commission (“SEC”) under authority of federal laws are also sources of authoritative GAAP for SEC registrants. The fund’s financial statements are prepared in accordance with GAAP, which may require the use of management estimates and assumptions. Actual results could differ from those estimates.
The Company enters into contracts that contain a variety of indemnifications. The fund’s maximum exposure under these
19
NOTES TO FINANCIAL STATEMENTS (continued)
arrangements is unknown. The fund does not anticipate recognizing any loss related to these arrangements.
(a) Portfolio valuation: The fair value of a financial instrument is the amount that would be received to sell an asset or paid to transfer a liability in an orderly transaction between market participants at the measurement date (i.e., the exit price). GAAP establishes a fair value hierarchy that prioritizes the inputs of valuation techniques used to measure fair value. This hierarchy gives the highest priority to unadjusted quoted prices in active markets for identical assets or liabilities (Level 1 measurements) and the lowest priority to unobservable inputs (Level 3 measurements).
Additionally, GAAP provides guidance on determining whether the volume and activity in a market has decreased significantly and whether such a decrease in activity results in transactions that are not orderly. GAAP requires enhanced disclosures around valuation inputs and techniques used during annual and interim periods.
Various inputs are used in determining the value of the fund’s investments relating to fair value measurements. These inputs are summarized in the three broad levels listed below:
Level 1—unadjusted quoted prices in active markets for identical investments.
Level 2—other significant observable inputs (including quoted prices for similar investments, interest rates, prepayment speeds, credit risk, etc.).
Level 3—significant unobservable inputs (including the fund’s own assumptions in determining the fair value of investments).
The inputs or methodology used for valuing securities are not necessarily an indication of the risk associated with investing in those securities.
Changes in valuation techniques may result in transfers in or out of an assigned level within the disclosure hierarchy. Valuation techniques used to value the fund’s investments are as follows:
Investments in securities are valued at the last sales price on the securities exchange or national securities market on which such securities are primarily traded. Securities listed on the National Market System for which market quotations are available are valued at the official closing price or, if there is no official closing price that day, at the last sales price. For open short positions, asked prices are used for valuation purposes. Bid price is used when no asked price is available. Registered investment companies that are not traded on an exchange are valued at their net asset value. All of
20
the preceding securities are generally categorized within Level 1 of the fair value hierarchy.
Securities not listed on an exchange or the national securities market, or securities for which there were no transactions, are valued at the average of the most recent bid and asked prices. These securities are generally categorized within Level 2 of the fair value hierarchy.
Fair valuing of securities may be determined with the assistance of a pricing service using calculations based on indices of domestic securities and other appropriate indicators, such as prices of relevant ADRs and futures. Utilizing these techniques may result in transfers between Level 1 and Level 2 of the fair value hierarchy.
When market quotations or official closing prices are not readily available, or are determined to not accurately reflect fair value, such as when the value of a security has been significantly affected by events after the close of the exchange or market on which the security is principally traded (for example, a foreign exchange or market), but before the fund calculates its net asset value, the fund may value these investments at fair value as determined in accordance with the procedures approved by the Company’s Board of Trustees (the “Board”). Certain factors may be considered when fair valuing investments such as: fundamental analytical data, the nature and duration of restrictions on disposition, an evaluation of the forces that influence the market in which the securities are purchased and sold, and public trading in similar securities of the issuer or comparable issuers. These securities are either categorized within Level 2 or 3 of the fair value hierarchy depending on the relevant inputs used.
For restricted securities where observable inputs are limited, assumptions about market activity and risk are used and are generally categorized within Level 3 of the fair value hierarchy.
The following is a summary of the inputs used as of December 31, 2017 in valuing the fund’s investments:
| | | | | |
| | Level 1-Unadjusted Quoted Prices | Level 2-Other Significant Observable Inputs | Level 3-Significant Unobservable Inputs | Total |
Assets ($) | | | | |
Investments in Securities: | | |
Equity Securities—Domestic Common Stocks† | 84,941,780 | – | – | 84,941,780 |
21
NOTES TO FINANCIAL STATEMENTS (continued)
| | | | | |
| | Level 1-Unadjusted Quoted Prices | Level 2-Other Significant Observable Inputs | Level 3-Significant Unobservable Inputs | Total |
Assets ($) | | | | |
Equity Securities—Foreign Common Stocks† | 1,679,323 | – | – | 1,679,323 |
Exchange-Traded Funds | 446,878 | – | – | 446,878 |
Registered Investment Companies | 2,463,391 | – | – | 2,463,391 |
† See Statement of Investments for additional detailed categorizations.
At December 31, 2017, there were no transfers between levels of the fair value hierarchy. It is the fund’s policy to recognize transfers between levels at the end of the reporting period.
(b) Securities transactions and investment income: Securities transactions are recorded on a trade date basis. Realized gains and losses from securities transactions are recorded on the identified cost basis. Dividend income is recognized on the ex-dividend date and interest income, including, where applicable, accretion of discount and amortization of premium on investments, is recognized on the accrual basis.
Pursuant to a securities lending agreement with The Bank of New York Mellon, a subsidiary of BNY Mellon and an affiliate of Dreyfus, the fund may lend securities to qualified institutions. It is the fund’s policy that, at origination, all loans are secured by collateral of at least 102% of the value of U.S. securities loaned and 105% of the value of foreign securities loaned. Collateral equivalent to at least 100% of the market value of securities on loan is maintained at all times. Collateral is either in the form of cash, which can be invested in certain money market mutual funds managed by Dreyfus, or U.S. Government and Agency securities. The fund is entitled to receive all dividends, interest and distributions on securities loaned, in addition to income earned as a result of the lending transaction. Should a borrower fail to return the securities in a timely manner, The Bank of New York Mellon is required to replace the securities for the benefit of the fund or credit the fund with the market value of the unreturned securities and is subrogated to the fund’s rights against the borrower and the collateral. Additionally, the contractual maturity of security lending transactions are on an overnight and continuous basis. During the period ended December 31, 2017, The Bank of New York Mellon earned $1,761 from lending portfolio securities, pursuant to the securities lending agreement.
22
(c) Affiliated issuers: Investments in other investment companies advised by Dreyfus are defined as “affiliated” under the Act.
(d) Dividends and distributions to shareholders: Dividends and distributions are recorded on the ex-dividend date. Dividends from investment income-net are normally declared and paid quarterly. Dividends from net realized capital gains, if any, are normally declared and paid annually, but the fund may make distributions on a more frequent basis to comply with the distribution requirements of the Internal Revenue Code of 1986, as amended (the “Code”). To the extent that net realized capital gains can be offset by capital loss carryovers, it is the policy of the fund not to distribute such gains. Income and capital gain distributions are determined in accordance with income tax regulations, which may differ from GAAP.
(e) Federal income taxes: It is the policy of the fund to continue to qualify as a regulated investment company, if such qualification is in the best interests of its shareholders, by complying with the applicable provisions of the Code, and to make distributions of taxable income sufficient to relieve it from substantially all federal income and excise taxes.
As of and during the period ended December 31, 2017, the fund did not have any liabilities for any uncertain tax positions. The fund recognizes interest and penalties, if any, related to uncertain tax positions as income tax expense in the Statement of Operations. During the period ended December 31, 2017, the fund did not incur any interest or penalties.
Each tax year in the four-year period ended December 31, 2017 remains subject to examination by the Internal Revenue Service and state taxing authorities.
At December 31, 2017, the components of accumulated earnings on a tax basis were as follows: undistributed ordinary income $1,992,481 undistributed capital gains $5,970,861 and unrealized appreciation $22,166,733.
The tax character of distributions paid to shareholders during the fiscal periods ended December 31, 2017 and December 31, 2016 were as follows: ordinary income $601,780 and $980,382, and long-term capital gains $3,626,006 and $9,334,173, respectively.
NOTE 2—Bank Lines of Credit:
The fund participates with other Dreyfus-managed funds in an $830 million unsecured credit facility led by Citibank, N.A. and a $300 million unsecured credit facility provided by The Bank of New York Mellon (each, a “Facility”), each to be utilized primarily for temporary or emergency
23
NOTES TO FINANCIAL STATEMENTS (continued)
purposes, including the financing of redemptions. Prior to October 4, 2017, the unsecured credit facility with Citibank, N.A. was $810 million. In connection therewith, the fund has agreed to pay its pro rata portion of commitment fees for each Facility. Interest is charged to the fund based on rates determined pursuant to the terms of the respective Facility at the time of borrowing. During the period ended December 31, 2017, the fund did not borrow under the Facilities.
NOTE 3—Investment Advisory Fee and Other Transactions with Affiliates:
(a) Pursuant to an investment advisory agreement with Dreyfus, the investment advisory fee is computed at the annual rate of .75% of the value of the fund’s average daily net assets and is payable monthly.
(b) Under the Distribution Plan adopted pursuant to Rule 12b-1 under the Act, Service shares pay the Distributor for distributing its shares, for servicing and/or maintaining Service shares’ shareholder accounts and for advertising and marketing for Service shares. The Distribution Plan provides for payments to be made at an annual rate of .25% of the value of the Service shares’ average daily net assets. The Distributor may make payments to Participating Insurance Companies and to brokers and dealers acting as principal underwriter for their variable insurance products. The fees payable under the Distribution Plan are payable without regard to actual expenses incurred. During the period ended December 31, 2017, Service shares were charged $13,493 pursuant to the Distribution Plan.
The fund has arrangements with the transfer agent and the custodian whereby the fund may receive earnings credits when positive cash balances are maintained, which are used to offset transfer agency and custody fees. For financial reporting purposes, the fund includes net earnings credits as an expense offset in the Statement of Operations.
The fund compensates Dreyfus Transfer, Inc., a wholly-owned subsidiary of Dreyfus, under a transfer agency agreement for providing transfer agency and cash management services for the fund. The majority of transfer agency fees are comprised of amounts paid on a per account basis, while cash management fees are related to fund subscriptions and redemptions. During the period ended December 31, 2017, the fund was charged $458 for transfer agency services and $59 for cash management services. These fees are included in Shareholder servicing costs in the Statement of Operations. Cash management fees were offset by earnings credits of $59.
The fund compensates The Bank of New York Mellon under a custody agreement for providing custodial services for the fund. These fees are
24
determined based on net assets, geographic region and transaction activity. During the period ended December 31, 2017, the fund was charged $17,916 pursuant to the custody agreement. These fees were partially offset by earnings credits of $7.
During the period ended December 31, 2017, the fund was charged $11,202 for services performed by the Chief Compliance Officer and his staff.
The components of “Due to The Dreyfus Corporation and affiliates” in the Statement of Assets and Liabilities consist of: investment advisory fees $55,557, Distribution Plan fees $1,140, custodian fees $4,400, Chief Compliance Officer fees $8,406 and transfer agency fees $197.
(c) Each Board member also serves as a Board member of other funds within the Dreyfus complex. Annual retainer fees and attendance fees are allocated to each fund based on net assets.
NOTE 4—Securities Transactions:
The aggregate amount of purchases and sales of investment securities, excluding short-term securities, during the period ended December 31, 2017, amounted to $50,244,539 and $56,786,277, respectively.
At December 31, 2017, the cost of investments for federal income tax purposes was $67,364,639; accordingly, accumulated net unrealized appreciation on investments was $22,166,733, consisting of $23,111,572 gross unrealized appreciation and $944,839 gross unrealized depreciation.
25
REPORT OF INDEPENDENT REGISTERED PUBLIC ACCOUNTING FIRM
To the Shareholders and the Board of Trustees of Dreyfus Variable Investment Fund, Growth and Income Portfolio
Opinion on the Financial Statements
We have audited the accompanying statement of assets and liabilities of Dreyfus Variable Investment Fund, Growth and Income Portfolio (one of the series comprising Dreyfus Variable Investment Fund) (the “Fund”), including the statements of investments and investments in affiliated issuers, as of December 31, 2017, and the related statement of operations for the year then ended, the statements of changes in net assets for each of the two years in the period then ended, the financial highlights for each of the five years in the period then ended and the related notes (collectively referred to as the “financial statements”). In our opinion, the financial statements present fairly, in all material respects, the financial position of Dreyfus Variable Investment Fund, Growth and Income Portfolio at December 31, 2017, the results of its operations for the year then ended, the changes in its net assets for each of the two years in the period then ended and its financial highlights for each of the five years in the period then ended, in conformity with U.S. generally accepted accounting principles.
Basis for opinion
These financial statements are the responsibility of the Fund’s management. Our responsibility is to express an opinion on the Fund’s financial statements based on our audits. We are a public accounting firm registered with the Public Company Accounting Oversight Board (United States) (“PCAOB”) and are required to be independent with respect to the Fund in accordance with the U.S. federal securities laws and the applicable rules and regulations of the Securities and Exchange Commission and the PCAOB.
We conducted our audits in accordance with the standards of the PCAOB. Those standards require that we plan and perform the audit to obtain reasonable assurance about whether the financial statements are free of material misstatement, whether due to error or fraud. The Fund is not required to have, nor were we engaged to perform, an audit of the Fund’s internal control over financial reporting. As part of our audits, we are required to obtain an understanding of internal control over financial reporting, but not for the purpose of expressing an opinion on the effectiveness of the Fund’s internal control over financial reporting. Accordingly, we express no such opinion.
Our audits included performing procedures to assess the risks of material misstatement of the financial statements, whether due to error or fraud, and performing procedures that respond to those risks. Such procedures included examining, on a test basis, evidence regarding the amounts and disclosures in the financial statements. Our procedures included confirmation of securities owned as of December 31, 2017, by correspondence with the custodian and others or by other appropriate auditing procedures where replies were not received. Our audits also included evaluating the accounting principles used and significant estimates made by management, as well as evaluating the overall presentation of the financial statements. We believe that our audits provide a reasonable basis for our opinion.

We have served as the auditor of one or more Dreyfus investment companies since at least 1957, but we are unable to determine the specific year.
New York, New York
February 09, 2018
26
IMPORTANT TAX INFORMATION (Unaudited)
For federal tax purposes, the portfolio hereby reports 54.04% of the ordinary dividends paid during the fiscal year ended December 31, 2017 as qualifying for the corporate dividends received deduction. Shareholders will receive notification in early 2018 of the percentage applicable to the preparation of their 2017 income tax returns. Also, the fund hereby reports $1.3400 per share as a long-term capital gain distribution paid on March 31, 2017.
27
BOARD MEMBERS INFORMATION (Unaudited)
INDEPENDENT BOARD MEMBERS
Joseph S. DiMartino (74)
Chairman of the Board (1995)
Principal Occupation During Past 5 Years:
· Corporate Director and Trustee (1995-present)
Other Public Company Board Memberships During Past 5 Years:
· CBIZ (formerly, Century Business Services, Inc.), a provider of outsourcing functions for small and medium size companies, Director (1997-present)
No. of Portfolios for which Board Member Serves: 127
———————
Peggy C. Davis (74)
Board Member (2006)
Principal Occupation During Past 5 Years:
· Shad Professor of Law, New York University School of Law (1983-present)
No. of Portfolios for which Board Member Serves: 46
———————
David P. Feldman (78)
Board Member (1994)
Principal Occupation During Past 5 Years:
· Corporate Director and Trustee (1985-present)
Other Public Company Board Memberships During Past 5 Years:
· BBH Mutual Funds Group (5 registered mutual funds), Director (1992-2014)
No. of Portfolios for which Board Member Serves: 32
———————
Joan Gulley (70)
Board Member (2017)
Principal Occupation During Past 5 Years:
· PNC Financial Services Group, Inc.(1993-2014), Executive Vice President and Chief Human Resources Officer and Executive Committee Member (2008-2014)
No. of Portfolios for which Board Member Serves: 54
———————
28
Ehud Houminer (77)
Board Member (2006)
Principal Occupation During Past 5 Years:
· Board of Overseers at the Columbia Business School, Columbia University (1992-present)
· Trustee, Ben Gurion University
Other Public Company Board Memberships During Past 5 Years:
· Avnet, Inc., an electronics distributor, Director (1993-2012)
No. of Portfolios for which Board Member Serves: 54
———————
Lynn Martin (78)
Board Member (2012)
Principal Occupation During Past 5 Years:
· President of The Martin Hall Group LLC, a human resources consulting firm (2005-2012)
Other Public Company Board Memberships During Past 5 Years:
· AT&T, Inc., a telecommunications company, Director (1999-2012)
· Ryder System, Inc., a supply chain and transportation management company, Director (1993-2012)
No. of Portfolios for which Board Member Serves: 32
———————
Robin A. Melvin (54)
Board Member (2012)
Principal Occupation During Past 5 Years:
· Co-chairman, Illinois Mentoring Partnership, non-profit organization dedicated to increasing the quantity and quality of mentoring services in Illinois; (2014-present; board member since 2013)
· Director, Boisi Family Foundation, a private family foundation that supports youth-serving organizations that promote the self sufficiency of youth from disadvantaged circumstances (1995-2012)
No. of Portfolios for which Board Member Serves: 101
———————
29
BOARD MEMBERS INFORMATION (Unaudited) (continued)
INDEPENDENT BOARD MEMBERS (continued)
Dr. Martin Peretz (78)
Board Member (1990)
Principal Occupation During Past 5 Years:
· Editor-in-Chief Emeritus of The New Republic Magazine (2011-2012) (previously,
Editor-in-Chief, 1974-2011)
· Lecturer at Harvard University (1969-2012)
No. of Portfolios for which Board Member Serves: 32
———————
Once elected all Board Members serve for an indefinite term, but achieve Emeritus status upon reaching age 80. The address of the Board Members and Officers is c/o The Dreyfus Corporation, 200 Park Avenue, New York, New York 10166. Additional information about the Board Member is available in the fund’s Statement of Additional Information which can be obtained from Dreyfus free of charge by calling this toll free number: 1-800-DREYFUS.
James F. Henry, Emeritus Board Member
Philip L. Toia, Emeritus Board Member
30
OFFICERS OF THE FUND (Unaudited)
BRADLEY J. SKAPYAK, President since January 2010.
Chief Operating Officer and a director of the Manager since June 2009, Chairman of Dreyfus Transfer, Inc., an affiliate of the Manager and the transfer agent of the funds, since May 2011 and Chief Executive Officer of MBSC Securities Corporation since August 2016. He is an officer of 63 investment companies (comprised of 127 portfolios) managed by the Manager. He is 59 years old and has been an employee of the Manager since February 1988.
BENNETT A. MACDOUGALL, Chief Legal Officer since October 2015.
Chief Legal Officer of the Manager and Associate General Counsel and Managing Director of BNY Mellon since June 2015; from June 2005 to June 2015, he served in various capacities with Deutsche Bank – Asset & Wealth Management Division, including as Director and Associate General Counsel, and Chief Legal Officer of Deutsche Investment Management Americas Inc. from June 2012 to May 2015. He is an officer of 64 investment companies (comprised of 152 portfolios) managed by the Manager. He is 46 years old and has been an employee of the Manager since June 2015.
JANETTE E. FARRAGHER, Vice President and Secretary since December 2011.
Associate General Counsel of BNY Mellon, and an officer of 64 investment companies (comprised of 152 portfolios) managed by the Manager. She is 55 years old and has been an employee of the Manager since February 1984.
JAMES BITETTO, Vice President and Assistant Secretary since August 2005.
Managing Counsel of BNY Mellon and Secretary of the Manager, and an officer of 64 investment companies (comprised of 152 portfolios) managed by the Manager. He is 51 years old and has been an employee of the Manager since December 1996.
JOSEPH M. CHIOFFI, Vice President and Assistant Secretary since August 2005.
Managing Counsel of BNY Mellon, and an officer of 64 investment companies (comprised of 152 portfolios) managed by the Manager. He is 56 years old and has been an employee of the Manager since June 2000.
MAUREEN E. KANE, Vice President and Assistant Secretary since April 2015.
Managing Counsel of BNY Mellon since July 2014; from October 2004 until July 2014, General Counsel, and from May 2009 until July 2014, Chief Compliance Officer of Century Capital Management. She is an officer of 64 investment companies (comprised of 152 portfolios) managed by the Manager. She is 55 years old and has been an employee of the Manager since July 2014.
SARAH S. KELLEHER, Vice President and Assistant Secretary since April 2014.
Senior Counsel of BNY Mellon since March 2013, from August 2005 to March 2013, Associate General Counsel of Third Avenue Management. She is an officer of 64 investment companies (comprised of 152 portfolios) managed by the Manager. She is 42 years old and has been an employee of the Manager since March 2013.
JEFF PRUSNOFSKY, Vice President and Assistant Secretary since August 2005.
Senior Managing Counsel of BNY Mellon, and an officer of 64 investment companies (comprised of 152 portfolios) managed by the Manager. He is 52 years old and has been an employee of the Manager since October 1990.
NATALYA ZELENSKY, Vice President and Assistant Secretary since March 2017.
Counsel and Vice President of BNY Mellon since May 2016; Attorney at Wildermuth Endowment Strategy Fund/Wildermuth Advisory, LLC from November 2015 until May 2016; Assistant General Counsel at RCS Advisory Services from July 2014 until November 2015; Associate at Sutherland, Asbill & Brennan from January 2013 until January 2014; Associate at K&L Gates from October 2011 until January 2013. She is an officer of 64 investment companies (comprised of 152 portfolios) managed by Dreyfus. She is 32 years old and has been an employee of the Manager since May 2016.
JAMES WINDELS, Treasurer since November 2001.
Director – Mutual Fund Accounting of the Manager, and an officer of 64 investment companies (comprised of 152 portfolios) managed by the Manager. He is 59 years old and has been an employee of the Manager since April 1985.
31
OFFICERS OF THE FUND (Unaudited) (continued)
RICHARD CASSARO, Assistant Treasurer since January 2008.
Senior Accounting Manager – Money Market and Municipal Bond Funds of the Manager, and an officer of 64 investment companies (comprised of 152 portfolios) managed by the Manager. He is 58 years old and has been an employee of the Manager since September 1982.
GAVIN C. REILLY, Assistant Treasurer since December 2005.
Tax Manager of the Investment Accounting and Support Department of the Manager, and an officer of 64 investment companies (comprised of 152 portfolios) managed by the Manager. He is 49 years old and has been an employee of the Manager since April 1991.
ROBERT S. ROBOL, Assistant Treasurer since August 2005.
Senior Accounting Manager – Dreyfus Financial Reporting of the Manager, and an officer of 64 investment companies (comprised of 152 portfolios) managed by the Manager. He is 53 years old and has been an employee of the Manager since October 1988.
ROBERT SALVIOLO, Assistant Treasurer since July 2007.
Senior Accounting Manager – Equity Funds of the Manager, and an officer of 64 investment companies (comprised of 152 portfolios) managed by the Manager. He is 50 years old and has been an employee of the Manager since June 1989.
ROBERT SVAGNA, Assistant Treasurer since December 2002.
Senior Accounting Manager – Fixed Income and Equity Funds of the Manager, and an officer of 64 investment companies (comprised of 152 portfolios) managed by the Manager. He is 50 years old and has been an employee of the Manager since November 1990.
JOSEPH W. CONNOLLY, Chief Compliance Officer since October 2004.
Chief Compliance Officer of the Manager and The Dreyfus Family of Funds (64 investment companies, comprised of 152 portfolios). He is 60 years old and has served in various capacities with the Manager since 1980, including manager of the firm’s Fund Accounting Department from 1997 through October 2001.
CARIDAD M. CAROSELLA, Anti-Money Laundering Compliance Officer since January 2016.
Anti-Money Laundering Compliance Officer of the Dreyfus Family of Funds and BNY Mellon Funds Trust since January 2016; from May 2015 to December 2015, Interim Anti-Money Laundering Compliance Officer of the Dreyfus Family of Funds and BNY Mellon Funds Trust and the Distributor; from January 2012 to May 2015, AML Surveillance Officer of the Distributor and from 2007 to December 2011, Financial Processing Manager of the Distributor. She is an officer of 58 investment companies (comprised of 146 portfolios) managed by the Manager. She is 49 years old and has been an employee of the Distributor since 1997.
32
NOTES
33
Dreyfus Variable Investment Fund, Growth and Income Portfolio
200 Park Avenue
New York, NY 10166
Investment Adviser
The Dreyfus Corporation
200 Park Avenue
New York, NY 10166
Custodian
The Bank of New York Mellon
225 Liberty Street
New York, NY 10286
Transfer Agent &
Dividend Disbursing Agent
Dreyfus Transfer, Inc.
200 Park Avenue
New York, NY 10166
Distributor
MBSC Securities Corporation
200 Park Avenue
New York, NY 10166
Telephone 1-800-258-4260 or 1-800-258-4261
Mail The Dreyfus Family of Funds, 144 Glenn Curtiss Boulevard, Uniondale, NY 11556-0144 Attn: Institutional Services Department
E-mail Send your request to info@dreyfus.com
Internet Information can be viewed online or downloaded at www.dreyfus.com
The fund files its complete schedule of portfolio holdings with the Securities and Exchange Commission (“SEC”) for the first and third quarters of each fiscal year on Form N-Q. The fund’s Forms N-Q are available on the SEC’s website at http://www.sec.gov and may be reviewed and copied at the SEC’s Public Reference Room in Washington, D.C. Information on the operation of the Public Reference Room may be obtained by calling 1-800-SEC-0330.
A description of the policies and procedures that the fund uses to determine how to vote proxies relating to portfolio securities, and information regarding how the fund voted these proxies for the most recent 12-month period ended June 30 is available at http://www.dreyfus.com and on the SEC’s website at http://www.sec.gov. The description of the policies and procedures is also available without charge, upon request, by calling 1-800-DREYFUS.
| | |
© 2018 MBSC Securities Corporation
0108AR1217 | 
|
Dreyfus Variable Investment Fund, International Equity Portfolio
| | | |

| | ANNUAL REPORT
December 31, 2017 |
| |
The views expressed in this report reflect those of the portfolio manager(s) only through the end of the period covered and do not necessarily represent the views of Dreyfus or any other person in the Dreyfus organization. Any such views are subject to change at any time based upon market or other conditions and Dreyfus disclaims any responsibility to update such views. These views may not be relied on as investment advice and, because investment decisions for a Dreyfus fund are based on numerous factors, may not be relied on as an indication of trading intent on behalf of any Dreyfus fund. |
| |
Not FDIC-Insured • Not Bank-Guaranteed • May Lose Value |
Contents
THE FUND
FOR MORE INFORMATION
Back Cover
| | | | |
| |
Dreyfus Variable Investment Fund, International Equity Portfolio
| | The Fund |
A LETTER FROM THE PRESIDENT OF DREYFUS
Dear Shareholder:
We are pleased to present this annual report for Dreyfus Variable Investment Fund, International Equity Portfolio, covering the 12-month period from January 1, 2017 through December 31, 2017. For information about how the fund performed during the reporting period, as well as general market perspectives, we provide a Discussion of Fund Performance on the pages that follow.
Stocks set a series of new record highs and bonds produced modestly positive results during 2017. Financial markets early in the year were dominated by the inauguration of a new U.S. president, as equities and corporate-backed bonds surged higher in anticipation of more business-friendly regulatory, tax, and fiscal policies. U.S. and international stocks continued to rally in the spring as corporate earnings grew and global economic conditions improved. Later in the year, the passage of tax reform legislation fueled additional stock market gains.
Despite three short-term interest rate hikes and concerns early in the year that inflation might accelerate in a growing economy, bonds generally produced positive total returns in 2017. Corporate-backed securities and municipal bonds fared particularly well.
The markets’ strong performance last year was supported by solid underlying fundamentals, including sustained economic growth, a robust labor market, and low inflation. We currently expect these favorable conditions to persist in 2018, but we remain watchful for economic and political developments that could negatively impact the markets. As always, we encourage you to discuss the risks and opportunities of today’s investment environment with your financial advisor.
Thank you for your continued confidence and support.
Sincerely,

Renee Laroche-Morris
President
The Dreyfus Corporation
January 16, 2018
2
DISCUSSION OF FUND PERFORMANCE
For the period from January 1, 2017 through December 31, 2017, as provided by the fund’s primary portfolio managers, Paul Markham, Jeff Munroe, and Yuko Takano of Newton Investment Management (North America) Limited, Sub-Investment Adviser
Market and Fund Performance Overview
For the 12-month period ended December 31, 2017, Dreyfus Variable Investment Fund, International Equity Portfolio’s Initial Shares produced a total return of 27.32%, and its Service Shares produced a total return of 27.02%.1 This compares with a 25.03% return produced by the fund’s benchmark, the MSCI EAFE Index (the “Index”), for the same period.2
International equities posted robust gains on the strength of better-than-expected corporate earnings and improving economic conditions. The fund outperformed the Index, largely due to favorable individual stock selections across several market sectors.
The Fund’s Investment Approach
The fund seeks capital growth by investing at least 80% of its net assets in stocks of foreign companies.
The process of seeking investment ideas takes place within the framework of Newton’s global investment themes. These themes are based on observable economic, industrial, or social trends that we believe will affect markets, industries, or companies globally, and so help to identify areas of investment opportunity and risk. As of the end of the reporting period, such themes included debt burden, which asserts that certain economies and institutions need to reduce their budget deficits and debt obligations, which jeopardizes their economic prospects (and provided the rationale for the portfolio’s underweighted exposure during the reporting period to the financials sector). Elsewhere, our net effects theme identifies the investment opportunities and challenges inherent in an interconnected world.
When choosing stocks, we consider trends in economic variables, such as gross domestic product, inflation, and interest rates; investment themes; the relative values of equities, bonds, and cash; company fundamentals; and long-term trends in currency movements. Within markets and sectors determined to be relatively attractive, we seek what we believe are attractively priced companies that possess a sustainable competitive advantage in their market or sector. Securities are generally sold when themes or strategies change, when we determine that the company’s prospects have changed, or when a stock reaches what we determine to be a full valuation.
Economic and Political Developments Supported Gains
Stocks rallied in early 2017 amid optimism that a new U.S. presidential administration would reinvigorate the U.S. economy. However, economic data painted a rather less robust picture, and political distractions soon dampened investor enthusiasm regarding stimulative U.S. government policy reforms. In Europe, elections in France and the United Kingdom gave rise to contrasting results, the former providing greater certainty
3
DISCUSSION OF FUND PERFORMANCE (continued)
and the latter weakening the government’s perceived stability. Toward the end of the year, the composition of the next German government became uncertain after parliamentary elections.
U.S. and U.K. central banks raised short-term interest rates in 2017 as developed markets backed away from their previously accommodative monetary policies. However, investors generally took these well-telegraphed interest-rate hikes in stride, focusing instead on rising corporate earnings and sending stock prices higher.
Global markets ended 2017 with a flourish. Economic data and corporate earnings proved broadly supportive of equities, while positive political developments included the reelection of Japan’s incumbent government, the conclusion of the first phase of negotiations between the United Kingdom and the European Union, and the passage of U.S. tax-reform legislation.
Stock Selections Bolstered Relative Returns
The fund outperformed the Index in 2017 due to favorable stock selections across several market sectors. Among Japanese industrial companies, staffing firms TechnoPro Holdings and Recruit Holdings advanced due to favorable supply-and-demand dynamics in a tight labor market. In the information technology sector, Infineon Technologies proved well positioned to benefit from secular trends toward electric vehicle adoption, factory automation, alternative energy, and reduced automobile emissions. In the consumer discretionary sector, information services provider Wolters Kluwer appears poised for higher revenues and profit margins.
On the other hand, health care company China Biologic Products Holdings was undermined by industrywide policy changes, competitive pressures, and a suspension of production prior to opening a new plant. Teva Pharmaceutical Industries struggled with U.S. generic drug pricing pressures, greater competition for a branded drug, management turmoil, and delays in U.S. regulatory approvals for new generic drugs. Japan Tobacco lost value due to concerns about its ability to compete in “next-generation” products in its home market.
At times during the year, the fund employed currency forward contracts to protect certain overweighted positions.
Positioned for Further Growth
Stocks have maintained strong momentum as a result of easy monetary policy, cheap debt financing, and expectations of more stimulative government policies. Nonetheless, economic and market turbulence could increase as central banks withdraw monetary stimulus and the world contends with challenging demographics, technological change, and a heavy debt burden.
Against this backdrop, we have continued to emphasize long-term investments with the capacity to grow under a variety of market and economic conditions, particularly among information technology companies benefiting from secular growth trends. In contrast,
4
we have identified relatively few opportunities in the materials, utilities, and financials sectors.
January 16, 2018
1 Total return includes reinvestment of dividends and any capital gains paid. Past performance is no guarantee of future results. Share price and investment return fluctuate such that upon redemption, fund shares may be worth more or less than their original cost. The fund’s performance does not reflect the deduction of additional charges and expenses imposed in connection with investing in variable insurance contracts, which will reduce returns.
2 Source: Lipper Inc. — Reflects reinvestment of net dividends and, where applicable, capital gain distributions. The MSCI EAFE Index (Europe, Australasia, Far East) is a free float-adjusted market capitalization-weighted index that is designed to measure the equity market performance of developed markets, excluding the U.S. and Canada. Investors cannot invest directly in any index.
Please note: the position in any security highlighted with italicized typeface was sold during the reporting period.
Equities are subject generally to market, market sector, market liquidity, issuer, and investment style risks, among other factors, to varying degrees, all of which are more fully described in the fund’s prospectus.
The fund’s performance will be influenced by political, social, and economic factors affecting investments in foreign companies. Special risks associated with investments in foreign companies include exposure to currency fluctuations, less liquidity, less developed or less efficient trading markets, lack of comprehensive company information, political instability, and differing auditing and legal standards. These risks are enhanced in emerging market countries.
The fund is only available as a funding vehicle under variable life insurance policies or variable annuity contracts issued by insurance companies. Individuals may not purchase shares of the fund directly. A variable annuity is an insurance contract issued by an insurance company that enables investors to accumulate assets on a tax-deferred basis for retirement or other long-term goals. The investment objective and policies of Dreyfus Variable Investment Fund, International Equity Portfolio made available through insurance products may be similar to those of other funds managed or advised by Dreyfus. However, the investment results of the fund may be higher or lower than, and may not be comparable to, those of any other Dreyfus fund.
5
FUND PERFORMANCE
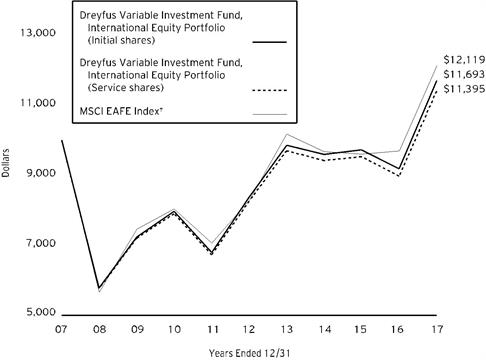
Comparison of change in value of $10,000 investment in Dreyfus Variable Investment Fund, International Equity Portfolio Initial shares and Service shares and the MSCI EAFE Index (the “Index”)
† Source: Lipper Inc.
Past performance is not predictive of future performance. The fund’s performance does not reflect the deduction of additional charges and expenses imposed in connection with investing in variable insurance contracts which will reduce returns.
The above graph compares a $10,000 investment made in Initial and Service shares of Dreyfus Variable Investment Fund, International Equity Portfolio on 12/31/07 to a $10,000 investment made in the Index on that date.
The fund’s performance shown in the line graph above takes into account all applicable fund fees and expenses for Initial and Service shares. The Index (Europe, Australasia, Far East) is a free float adjusted market capitalization-weighted index that is designed to measure the equity market performance of developed markets, excluding the U.S. and Canada. Unlike a mutual fund, the Index is not subject to charges, fees and other expenses. Investors cannot invest directly in any index. Further information relating to fund performance, including expense reimbursements, if applicable, is contained in the Financial Highlights section of the prospectus and elsewhere in this report.
6
| | | | |
Average Annual Total Returns as of 12/31/17 |
| 1 Year | 5 Years | 10 Years |
Initial shares | 27.32% | 6.92% | 1.58% |
Service shares | 27.02% | 6.65% | 1.31% |
MSCI EAFE Index | 25.03% | 7.90% | 1.94% |
The performance data quoted represents past performance, which is no guarantee of future results. Share price and investment return fluctuate and an investor’s shares may be worth more or less than original cost upon redemption. Current performance may be lower or higher than the performance quoted. Go to Dreyfus.com for the fund’s most recent month-end returns.
The fund’s Initial shares are not subject to a Rule 12b-1 fee. The fund’s Service shares are subject to a 0.25% annual Rule 12b-1 fee. All dividends and capital gain distributions are reinvested.
The fund’s performance shown in the graph and table does not reflect the deduction of taxes that a shareholder would pay on fund distributions or the redemption of fund shares.
7
UNDERSTANDING YOUR FUND’S EXPENSES (Unaudited)
As a mutual fund investor, you pay ongoing expenses, such as management fees and other expenses. Using the information below, you can estimate how these expenses affect your investment and compare them with the expenses of other funds. You also may pay one-time transaction expenses, including sales charges (loads), redemption fees and expenses associated with variable annuity or insurance contracts, which are not shown in this section and would have resulted in higher total expenses. For more information, see your fund’s prospectus or talk to your financial adviser.
Review your fund’s expenses
The table below shows the expenses you would have paid on a $1,000 investment in Dreyfus Variable Investment Fund, International Equity Portfolio from July 1, 2017 to December 31, 2017. It also shows how much a $1,000 investment would be worth at the close of the period, assuming actual returns and expenses.
| | | | | | | | |
Expenses and Value of a $1,000 Investment | | |
assuming actual returns for the six months ended December 31, 2017 | |
| | | | Initial Shares | Service Shares |
Expenses paid per $1,000† | | | $6.12 | | $7.45 |
Ending value (after expenses) | | | $1,112.70 | | $1,111.20 |
COMPARING YOUR FUND’S EXPENSES
WITH THOSE OF OTHER FUNDS (Unaudited)
Using the SEC’s method to compare expenses
The Securities and Exchange Commission (“SEC”) has established guidelines to help investors assess fund expenses. Per these guidelines, the table below shows your fund’s expenses based on a $1,000 investment, assuming a hypothetical 5% annualized return. You can use this information to compare the ongoing expenses (but not transaction expenses or total cost) of investing in the fund with those of other funds. All mutual fund shareholder reports will provide this information to help you make this comparison. Please note that you cannot use this information to estimate your actual ending account balance and expenses paid during the period.
| | | | | | | | |
Expenses and Value of a $1,000 Investment |
assuming a hypothetical 5% annualized return for the six months ended December 31, 2017 |
| | | | Initial Shares | Service Shares |
Expenses paid per $1,000† | | | $5.85 | | $7.12 |
Ending value (after expenses) | | | $1,019.41 | | $1,018.15 |
† Expenses are equal to the fund’s annualized expense ratio of 1.15% for Initial shares and 1.40% for Service shares, multiplied by the average account value over the period, multiplied by 184/365 (to reflect the one-half year period).
8
STATEMENT OF INVESTMENTS
December 31, 2017
| | | | | | | | |
| |
Description | | | | Shares | | Value ($) | |
Common Stocks - 97.5% | | | | | |
Australia - .9% | | | | | |
Dexus | | | | 44,667 | | 339,216 | |
China - 2.9% | | | | | |
Baidu, ADR | | | | 2,633 | a | 616,675 | |
China Biologic Products Holdings | | | | 5,527 | a | 435,362 | |
| | | | | 1,052,037 | |
France - 6.5% | | | | | |
BNP Paribas | | | | 9,191 | | 685,407 | |
L'Oreal | | | | 2,259 | | 500,435 | |
Total | | | | 11,780 | | 649,963 | |
Vivendi | | | | 20,541 | | 552,347 | |
| | | | | 2,388,152 | |
Georgia - 1.0% | | | | | |
TBC Bank Group | | | | 15,235 | | 358,851 | |
Germany - 12.9% | | | | | |
Bayer | | | | 3,396 | | 422,377 | |
Deutsche Post | | | | 10,124 | | 480,938 | |
Deutsche Wohnen-BR | | | | 8,177 | | 356,524 | |
Hella KGaA Hueck & Co. | | | | 10,044 | | 621,479 | |
Infineon Technologies | | | | 44,682 | | 1,220,364 | |
LEG Immobilien | | | | 5,075 | | 579,262 | |
SAP | | | | 5,410 | | 606,621 | |
Telefonica Deutschland Holding | | | | 88,736 | | 445,613 | |
| | | | | 4,733,178 | |
Hong Kong - 3.6% | | | | | |
AIA Group | | | | 106,000 | | 904,002 | |
Man Wah Holdings | | | | 440,800 | | 417,415 | |
| | | | | 1,321,417 | |
India - 1.7% | | | | | |
HDFC Bank, ADR | | | | 5,985 | | 608,495 | |
Ireland - 3.8% | | | | | |
AIB Group | | | | 100,077 | | 660,424 | |
CRH | | | | 20,529 | | 735,769 | |
| | | | | 1,396,193 | |
Japan - 30.1% | | | | | |
Don Quijote Holdings | | | | 14,300 | | 747,565 | |
Ebara | | | | 17,400 | | 663,537 | |
FANUC | | | | 2,000 | | 480,517 | |
Invincible Investment | | | | 879 | | 373,614 | |
Japan Airlines | | | | 14,036 | | 549,228 | |
Japan Tobacco | | | | 25,900 | | 834,190 | |
M3 | | | | 12,300 | | 430,604 | |
9
STATEMENT OF INVESTMENTS (continued)
| | | | | | | | |
| |
Description | | | | Shares | | Value ($) | |
Common Stocks - 97.5% (continued) | | | | | |
Japan - 30.1% (continued) | | | | | |
Macromill | | | | 13,600 | | 324,616 | |
Mitsubishi UFJ Financial Group | | | | 67,600 | | 496,008 | |
Recruit Holdings | | | | 19,805 | | 491,876 | |
Seven & i Holdings | | | | 7,900 | | 328,124 | |
Skylark | | | | 22,000 | | 312,661 | |
SoftBank Group | | | | 7,600 | | 600,424 | |
Sony | | | | 21,500 | | 965,759 | |
Sugi Holdings | | | | 12,100 | | 617,086 | |
Suntory Beverage & Food | | | | 11,000 | | 489,172 | |
Suzuki Motor | | | | 4,900 | | 283,808 | |
TechnoPro Holdings | | | | 20,400 | | 1,108,204 | |
Topcon | | | | 23,800 | | 514,160 | |
Yokogawa Electric | | | | 24,500 | | 468,359 | |
| | | | | 11,079,512 | |
Netherlands - 6.5% | | | | | |
RELX | | | | 22,966 | | 527,961 | |
Unilever | | | | 9,638 | | 541,503 | |
Wolters Kluwer | | | | 25,656 | | 1,336,000 | |
| | | | | 2,405,464 | |
Norway - 1.1% | | | | | |
DNB | | | | 22,199 | | 410,455 | |
Portugal - 1.1% | | | | | |
Galp Energia | | | | 22,507 | | 413,477 | |
South Korea - 1.5% | | | | | |
Samsung SDI | | | | 2,869 | | 544,754 | |
Switzerland - 5.9% | | | | | |
Credit Suisse Group | | | | 36,735 | a | 653,894 | |
Novartis | | | | 9,412 | | 795,707 | |
Roche Holding | | | | 2,924 | | 739,606 | |
| | | | | 2,189,207 | |
United Kingdom - 18.0% | | | | | |
Associated British Foods | | | | 9,481 | | 360,433 | |
Barclays | | | | 234,044 | | 638,146 | |
British American Tobacco | | | | 8,645 | | 583,454 | |
Diageo | | | | 10,457 | | 382,708 | |
Ferguson | | | | 10,157 | | 726,759 | |
GlaxoSmithKline | | | | 21,462 | | 379,615 | |
Prudential | | | | 21,015 | | 540,298 | |
Royal Bank of Scotland Group | | | | 347,123 | a | 1,294,711 | |
Royal Dutch Shell, Cl. B | | | | 27,132 | | 915,077 | |
Vodafone Group | | | | 257,052 | | 812,043 | |
| | | | | 6,633,244 | |
Total Common Stocks (cost $29,583,742) | | | | 35,873,652 | |
10
| | | | | | | | |
| |
Description | | Preferred Dividend
Yield (%) | | Shares | | Value ($) | |
Preferred Stocks - 1.8% | | | | | |
Germany - 1.8% | | | | | |
Volkswagen
(cost $510,651) | | 1.14 | | 3,275 | | 652,673 | |
| | | | | | | | |
Other Investment - .4% | | | | | |
Registered Investment Company; | | | | | |
Dreyfus Institutional Preferred Government Plus Money Market Fund
(cost $161,206) | | | | 161,206 | b | 161,206 | |
Total Investments (cost $30,255,599) | | 99.7% | | 36,687,531 | |
Cash and Receivables (Net) | | .3% | | 109,067 | |
Net Assets | | 100.0% | | 36,796,598 | |
ADR—American Depository Receipt
BR—Bearer Certificate
aNon-income producing security.
bInvestment in affiliated money market mutual fund.
| | |
Portfolio Summary (Unaudited) † | Value (%) |
Financial | 19.7 |
Consumer Goods | 18.0 |
Consumer Services | 15.6 |
Industrial | 12.5 |
Technology | 9.7 |
Health Care | 7.8 |
Oil & Gas | 5.4 |
Telecommunications | 5.0 |
Real Estate | 4.5 |
Basic Materials | 1.1 |
Money Market Investment | .4 |
| | 99.7 |
† Based on net assets.
See notes to financial statements.
11
STATEMENT OF INVESTMENTS IN AFFILIATED ISSUERS
| | | | | | | |
Registered Investment Company | Value
12/31/16($) | Purchases($) | Sales($) | Value
12/31/17($) | Net
Assets(%) | Dividends/
Distributions($) |
Dreyfus Institutional Preferred Government Plus Money Market Fund | 123,284 | 9,327,727 | 9,289,805 | 161,206 | .4 | 3,736 |
See notes to financial statements.
12
STATEMENT OF FORWARD FOREIGN CURRENCY EXCHANGE CONTRACTS December 31, 2017
| | | | | | |
Counterparty/ Purchased
Currency | Purchased Currency
Amounts | Currency
Sold | Sold
Currency
Amounts | Settlement Date | Unrealized Appreciation (Depreciation)($) |
Citigroup | | | |
United States Dollar | 23,390 | Hong Kong Dollar | 182,802 | 1/2/18 | (7) |
United States Dollar | 40,113 | Hong Kong Dollar | 313,418 | 1/3/18 | (3) |
State Street Bank and Trust Co | | | |
United States Dollar | 1,062,024 | Japanese Yen | 119,100,000 | 3/16/18 | 816 |
Gross Unrealized Appreciation | | | 816 |
Gross Unrealized Depreciation | | | (10) |
See notes to financial statements.
13
STATEMENT OF ASSETS AND LIABILITIES
December 31, 2017
| | | | | | | |
| | | | | | |
| | | Cost | | Value | |
Assets ($): | | | | |
Investments in securities—See Statement of Investments: | | | |
Unaffiliated issuers | 30,094,393 | | 36,526,325 | |
Affiliated issuers | | 161,206 | | 161,206 | |
Cash | | | | | 3,841 | |
Cash denominated in foreign currency | | | 1,591 | | 1,588 | |
Dividends receivable | | 91,484 | |
Tax reclaim receivable | | 64,522 | |
Receivable for investment securities sold | | 63,513 | |
Unrealized appreciation on forward foreign
currency exchange contracts—Note 4 | | 816 | |
Prepaid expenses | | | | | 1,319 | |
| | | | | 36,914,614 | |
Liabilities ($): | | | | |
Due to The Dreyfus Corporation and affiliates—Note 3(b) | | | | | 40,989 | |
Payable for shares of Beneficial Interest redeemed | | 11,448 | |
Unrealized depreciation on forward foreign
currency exchange contracts—Note 4 | | 10 | |
Accrued expenses | | | | | 65,569 | |
| | | | | 118,016 | |
Net Assets ($) | | | 36,796,598 | |
Composition of Net Assets ($): | | | | |
Paid-in capital | | | | | 30,037,902 | |
Accumulated undistributed investment income—net | | 325,291 | |
Accumulated net realized gain (loss) on investments | | | | | (538) | |
Accumulated net unrealized appreciation (depreciation)
on investments and foreign currency transactions | | | | 6,433,943 | |
Net Assets ($) | | | 36,796,598 | |
| | | | |
Net Asset Value Per Share | Initial Shares | Service Shares | |
Net Assets ($) | 29,036,972 | 7,759,626 | |
Shares Outstanding | 1,368,733 | 366,189 | |
Net Asset Value Per Share ($) | 21.21 | 21.19 | |
| | | | |
See notes to financial statements. | | | |
14
STATEMENT OF OPERATIONS
Year Ended December 31, 2017
| | | | | | | |
| | | | | | |
| | | | | | |
Investment Income ($): | | | | |
Income: | | | | |
Cash dividends (net of $61,773 foreign taxes withheld at source): | |
Unaffiliated issuers | | | 729,788 | |
Affiliated issuers | | | 3,736 | |
Total Income | | | 733,524 | |
Expenses: | | | | |
Investment advisory fee—Note 3(a) | | | 260,088 | |
Professional fees | | | 78,761 | |
Prospectus and shareholders’ reports | | | 20,868 | |
Distribution fees—Note 3(b) | | | 19,192 | |
Custodian fees—Note 3(b) | | | 12,126 | |
Trustees’ fees and expenses—Note 3(c) | | | 2,144 | |
Loan commitment fees—Note 2 | | | 716 | |
Shareholder servicing costs—Note 3(b) | | | 344 | |
Miscellaneous | | | 20,983 | |
Total Expenses | | | 415,222 | |
Less—reduction in fees due to earnings credits—Note 3(b) | | | (28) | |
Net Expenses | | | 415,194 | |
Investment Income—Net | | | 318,330 | |
Realized and Unrealized Gain (Loss) on Investments—Note 4 ($): | | |
Net realized gain (loss) on investments and foreign currency transactions | 1,666,311 | |
Net realized gain (loss) on forward foreign currency exchange contracts | 15,918 | |
Net Realized Gain (Loss) | | | 1,682,229 | |
Net unrealized appreciation (depreciation) on investments
and foreign currency transactions | | | 6,278,497 | |
Net unrealized appreciation (depreciation) on
forward foreign currency exchange contracts | | | 12,103 | |
Net Unrealized Appreciation (Depreciation) | | | 6,290,600 | |
Net Realized and Unrealized Gain (Loss) on Investments | | | 7,972,829 | |
Net Increase from Payment by Affiliate | | | 4,470 | |
Net Increase in Net Assets Resulting from Operations | | 8,295,629 | |
| | | | | | | |
See notes to financial statements. | | | | | |
15
STATEMENT OF CHANGES IN NET ASSETS
| | | | | | | | | | |
| | | | Year Ended December 31, |
| | | | 2017 | | 2016 | |
Operations ($): | | | | | | | | |
Investment income—net | | | 318,330 | | | | 418,725 | |
Net realized gain (loss) on investments | | 1,682,229 | | | | (58,494) | |
Net unrealized appreciation (depreciation)
on investments | | 6,290,600 | | | | (2,486,353) | |
Net increase from payment by affiliate | | 4,470 | | | | 31,398 | |
Net Increase (Decrease) in Net Assets
Resulting from Operations | 8,295,629 | | | | (2,094,724) | |
Distributions to Shareholders from ($): | |
Investment income—net: | | | | | | | | |
Initial Shares | | | (280,462) | | | | (242,714) | |
Service Shares | | | (61,227) | | | | (54,086) | |
Total Distributions | | | (341,689) | | | | (296,800) | |
Beneficial Interest Transactions ($): | |
Net proceeds from shares sold: | | | | | | | | |
Initial Shares | | | 1,710,528 | | | | 1,881,286 | |
Service Shares | | | 579,595 | | | | 505,501 | |
Distributions reinvested: | | | | | | | | |
Initial Shares | | | 280,462 | | | | 242,714 | |
Service Shares | | | 61,227 | | | | 54,086 | |
Cost of shares redeemed: | | | | | | | | |
Initial Shares | | | (3,712,719) | | | | (4,065,315) | |
Service Shares | | | (2,104,373) | | | | (1,917,468) | |
Increase (Decrease) in Net Assets
from Beneficial Interest Transactions | (3,185,280) | | | | (3,299,196) | |
Total Increase (Decrease) in Net Assets | 4,768,660 | | | | (5,690,720) | |
Net Assets ($): | |
Beginning of Period | | | 32,027,938 | | | | 37,718,658 | |
End of Period | | | 36,796,598 | | | | 32,027,938 | |
Undistributed investment income—net | 325,291 | | | | 314,530 | |
Capital Share Transactions (Shares): | |
Initial Shares | | | | | | | | |
Shares sold | | | 89,932 | | | | 110,020 | |
Shares issued for distributions reinvested | | | 15,783 | | | | 14,062 | |
Shares redeemed | | | (195,697) | | | | (238,821) | |
Net Increase (Decrease) in Shares Outstanding | (89,982) | | | | (114,739) | |
Service Shares | | | | | | | | |
Shares sold | | | 30,986 | | | | 29,706 | |
Shares issued for distributions reinvested | | | 3,442 | | | | 3,132 | |
Shares redeemed | | | (111,339) | | | | (112,165) | |
Net Increase (Decrease) in Shares Outstanding | (76,911) | | | | (79,327) | |
| | | | | | | | | | |
See notes to financial statements. | | | | | | | | |
16
FINANCIAL HIGHLIGHTS
The following tables describe the performance for each share class for the fiscal periods indicated. All information (except portfolio turnover rate) reflects financial results for a single fund share. Total return shows how much your investment in the fund would have increased (or decreased) during each period, assuming you had reinvested all dividends and distributions. The fund’s total returns do not reflect expenses associated with variable annuity or insurance contracts. These figures have been derived from the fund’s financial statements.
| | | | | | | |
| | | |
| | | Year Ended December 31, |
Initial Shares | | 2017 | 2016 | 2015 | 2014 | 2013 |
Per Share Data ($): | | | | | | |
Net asset value, beginning of period | | 16.85 | 18.00 | 18.35 | 19.28 | 16.86 |
Investment Operations: | | | | | | |
Investment income—neta | | .19 | .22 | .21 | .46 | .27 |
Net realized and unrealized
gain (loss) on investments | | 4.37 | (1.23) | .07 | (.96) | 2.66 |
Total from Investment Operations | | 4.56 | (1.01) | .28 | (.50) | 2.93 |
Distributions: | | | | | | |
Dividends from
investment income—net | | (.20) | (.16) | (.63) | (.43) | (.51) |
Payment by affiliate | | .00b,c | .02c | - | - | - |
Net asset value, end of period | | 21.21 | 16.85 | 18.00 | 18.35 | 19.28 |
Total Return (%) | | 27.32c | (5.54)c | 1.38 | (2.65) | 17.74 |
Ratios/Supplemental Data (%): | | | | | | |
Ratio of total expenses
to average net assets | | 1.14 | 1.17 | 1.14 | 1.08 | 1.11 |
Ratio of net expenses
to average net assets | | 1.14 | 1.17 | 1.14 | 1.08 | 1.11 |
Ratio of net investment income
to average net assets | | .97 | 1.28 | 1.13 | 2.44 | 1.49 |
Portfolio Turnover Rate | | 28.36 | 36.91 | 32.28 | 44.96 | 48.07 |
Net Assets, end of period ($ x 1,000) | | 29,037 | 24,574 | 28,330 | 29,731 | 32,192 |
a Based on average shares outstanding.
b Amount represents less than $.01 per share.
c In 2017 and 2016, the fund received proceeds from a class action settlement from The Bank of New York Mellon Corporation. In 2017, this payment had no impact on total return. In 2016, the total return would have been (5.65%) had payment not been made by The Bank of New York Mellon Corporation.
See notes to financial statements.
17
FINANCIAL HIGHLIGHTS (continued)
| | | | | | | |
| | | |
| | | Year Ended December 31, |
Service Shares | | 2017 | 2016 | 2015 | 2014 | 2013 |
Per Share Data ($): | | | | | | |
Net asset value, beginning of period | | 16.82 | 17.97 | 18.31 | 19.24 | 16.83 |
Investment Operations: | | | | | | |
Investment income—neta | | .14 | .18 | .17 | .42 | .23 |
Net realized and unrealized
gain (loss) on investments | | 4.38 | (1.24) | .07 | (.97) | 2.65 |
Total from Investment Operations | | 4.52 | (1.06) | .24 | (.55) | 2.88 |
Distributions: | | | | | | |
Dividends from
investment income—net | | (.15) | (.11) | (.58) | (.38) | (.47) |
Payment by affiliate | | .00b,c | .02c | - | - | - |
Net asset value, end of period | | 21.19 | 16.82 | 17.97 | 18.31 | 19.24 |
Total Return (%) | | 27.02c | (5.83)c | 1.17 | (2.90) | 17.43 |
Ratios/Supplemental Data (%): | | | | | | |
Ratio of total expenses
to average net assets | | 1.39 | 1.42 | 1.39 | 1.33 | 1.36 |
Ratio of net expenses
to average net assets | | 1.39 | 1.42 | 1.39 | 1.33 | 1.36 |
Ratio of net investment income
to average net assets | | .73 | 1.05 | .90 | 2.22 | 1.24 |
Portfolio Turnover Rate | | 28.36 | 36.91 | 32.28 | 44.96 | 48.07 |
Net Assets, end of period ($ x 1,000) | | 7,760 | 7,454 | 9,389 | 10,022 | 11,578 |
a Based on average shares outstanding.
b Amount represents less than $.01 per share.
c In 2017 and 2016, the fund received proceeds from a class action settlement from The Bank of New York Mellon Corporation. In 2017, this payment had no impact on total return. In 2016, the total return would have been (5.94%) had payment not been made by The Bank of New York Mellon Corporation.
See notes to financial statements.
18
NOTES TO FINANCIAL STATEMENTS
NOTE 1—Significant Accounting Policies:
International Equity Portfolio (the “fund”) is a separate non-diversified series of Dreyfus Variable Investment Fund (the “Company”), which is registered under the Investment Company Act of 1940, as amended (the “Act”), as an open-end management investment company and operates as a series company currently offering seven series, including the fund. The fund is only offered to separate accounts established by insurance companies to fund variable annuity contracts and variable life insurance policies. The fund’s investment objective is to seek capital growth. The Dreyfus Corporation (the “Manager” or “Dreyfus”), a wholly-owned subsidiary of The Bank of New York Mellon Corporation (“BNY Mellon”), serves as the fund’s investment adviser. Newton Investment Management (North America) Limited (“Newton”), a wholly-owned subsidiary of BNY Mellon and an affiliate of Dreyfus, serves as the fund’s sub-investment adviser.
MBSC Securities Corporation (the “Distributor”), a wholly-owned subsidiary of Dreyfus, is the distributor of the fund’s shares, which are sold without a sales charge. The fund is authorized to issue an unlimited number of $.001 par value shares of Beneficial Interest in each of the following classes of shares: Initial and Service. Each class of shares has identical rights and privileges, except with respect to the Distribution Plan, and the expenses borne by each class, the allocation of certain transfer agency costs and certain voting rights. Income, expenses (other than expenses attributable to a specific class), and realized and unrealized gains or losses on investments are allocated to each class of shares based on its relative net assets.
The Company accounts separately for the assets, liabilities and operations of each series. Expenses directly attributable to each series are charged to that series’ operations; expenses which are applicable to all series are allocated among them on a pro rata basis.
The Financial Accounting Standards Board (“FASB”) Accounting Standards Codification (“ASC”) is the exclusive reference of authoritative U.S. generally accepted accounting principles (“GAAP”) recognized by the FASB to be applied by nongovernmental entities. Rules and interpretive releases of the Securities and Exchange Commission (“SEC”) under authority of federal laws are also sources of authoritative GAAP for SEC registrants. The fund’s financial statements are prepared in accordance with GAAP, which may require the use of management estimates and assumptions. Actual results could differ from those estimates.
19
NOTES TO FINANCIAL STATEMENTS (continued)
The Company enters into contracts that contain a variety of indemnifications. The fund’s maximum exposure under these arrangements is unknown. The fund does not anticipate recognizing any loss related to these arrangements.
(a) Portfolio valuation: The fair value of a financial instrument is the amount that would be received to sell an asset or paid to transfer a liability in an orderly transaction between market participants at the measurement date (i.e., the exit price). GAAP establishes a fair value hierarchy that prioritizes the inputs of valuation techniques used to measure fair value. This hierarchy gives the highest priority to unadjusted quoted prices in active markets for identical assets or liabilities (Level 1 measurements) and the lowest priority to unobservable inputs (Level 3 measurements).
Additionally, GAAP provides guidance on determining whether the volume and activity in a market has decreased significantly and whether such a decrease in activity results in transactions that are not orderly. GAAP requires enhanced disclosures around valuation inputs and techniques used during annual and interim periods.
Various inputs are used in determining the value of the fund’s investments relating to fair value measurements. These inputs are summarized in the three broad levels listed below:
Level 1—unadjusted quoted prices in active markets for identical investments.
Level 2—other significant observable inputs (including quoted prices for similar investments, interest rates, prepayment speeds, credit risk, etc.).
Level 3—significant unobservable inputs (including the fund’s own assumptions in determining the fair value of investments).
The inputs or methodology used for valuing securities are not necessarily an indication of the risk associated with investing in those securities.
Changes in valuation techniques may result in transfers in or out of an assigned level within the disclosure hierarchy. Valuation techniques used to value the fund’s investments are as follows:
Investments in securities are valued at the last sales price on the securities exchange or national securities market on which such securities are primarily traded. Securities listed on the National Market System for which market quotations are available are valued at the official closing price or, if there is no official closing price that day, at the last sales price. For open short positions, asked prices are used for valuation purposes. Bid price is
20
used when no asked price is available. Registered investment companies that are not traded on an exchange are valued at their net asset value. All of the preceding securities are generally categorized within Level 1 of the fair value hierarchy.
Securities not listed on an exchange or the national securities market, or securities for which there were no transactions, are valued at the average of the most recent bid and asked prices. These securities are generally categorized within Level 2 of the fair value hierarchy.
Fair valuing of securities may be determined with the assistance of a pricing service using calculations based on indices of domestic securities and other appropriate indicators, such as prices of relevant ADRs and futures. Utilizing these techniques may result in transfers between Level 1 and Level 2 of the fair value hierarchy.
When market quotations or official closing prices are not readily available, or are determined to not accurately reflect fair value, such as when the value of a security has been significantly affected by events after the close of the exchange or market on which the security is principally traded (for example, a foreign exchange or market), but before the fund calculates its net asset value, the fund may value these investments at fair value as determined in accordance with the procedures approved by the Company’s Board of Trustees (the “Board”). Certain factors may be considered when fair valuing investments such as: fundamental analytical data, the nature and duration of restrictions on disposition, an evaluation of the forces that influence the market in which the securities are purchased and sold, and public trading in similar securities of the issuer or comparable issuers. These securities are either categorized within Level 2 or 3 of the fair value hierarchy depending on the relevant inputs used.
For restricted securities where observable inputs are limited, assumptions about market activity and risk are used and are generally categorized within Level 3 of the fair value hierarchy.
Investments denominated in foreign currencies are translated to U.S. dollars at the prevailing rates of exchange.
Forward foreign currency exchange contracts (“forward contracts”) are valued at the forward rate and are generally categorized within Level 2 of the fair value hierarchy.
The following is a summary of the inputs used as of December 31, 2017 in valuing the fund’s investments:
21
NOTES TO FINANCIAL STATEMENTS (continued)
| | | | | |
| | Level 1- Unadjusted Quoted Prices | Level 2 - Other Significant Observable Inputs | Level 3- Significant Unobservable Inputs | Total |
Assets ($) |
Investments in Securities: |
Equity Securities - Foreign Common Stocks | 1,660,532 | 34,213,120† | - | 35,873,652 |
Equity Securities - Foreign Preferred Stocks | - | 652,673† | - | 652,673 |
Registered Investment Company | 161,206 | - | - | 161,206 |
Forward Foreign Currency Exchange Contracts†† | - | 816 | - | 816 |
Liabilities ($) |
Other Financial Instruments: |
Forward Foreign Currency Exchange Contracts†† | - | (10) | - | (10) |
† Securities classified within Level 2 at period end as the values were determined pursuant to the fund’s fair valuation procedures.
†† Amount shown represents unrealized appreciation (depreciation) at period end.
At December 31, 2017, the amount of securities transferred between levels equals fair value of exchange traded equity securities reported as Level 2 in the table above. It is the fund’s policy to recognize transfers between levels at the end of the reporting period.
(b) Foreign currency transactions: The fund does not isolate that portion of the results of operations resulting from changes in foreign exchange rates on investments from the fluctuations arising from changes in the market prices of securities held. Such fluctuations are included with the net realized and unrealized gain or loss on investments.
Net realized foreign exchange gains or losses arise from sales of foreign currencies, currency gains or losses realized on securities transactions between trade and settlement date, and the difference between the amounts of dividends, interest and foreign withholding taxes recorded on the fund’s books and the U.S. dollar equivalent of the amounts actually received or paid. Net unrealized foreign exchange gains and losses arise from changes in the value of assets and liabilities other than investments resulting from changes in exchange rates. Foreign currency gains and losses on foreign currency transactions are also included with net realized and unrealized gain or loss on investments.
(c) Securities transactions and investment income: Securities transactions are recorded on a trade date basis. Realized gains and losses from securities transactions are recorded on the identified cost basis. Dividend income is recognized on the ex-dividend date and interest
22
income, including, where applicable, accretion of discount and amortization of premium on investments, is recognized on the accrual basis.
(d) Affiliated issuers: Investments in other investment companies advised by Dreyfus are defined as “affiliated” under the Act.
(e) Risk: Investing in foreign markets may involve special risks and considerations not typically associated with investing in the U.S. These risks include revaluation of currencies, high rates of inflation, repatriation restrictions on income and capital, and adverse political and economic developments. Moreover, securities issued in these markets may be less liquid, subject to government ownership controls and delayed settlements, and their prices may be more volatile than those of comparable securities in the U.S.
(f) Dividends and distributions to shareholders: Dividends and distributions are recorded on the ex-dividend date. Dividends from investment income-net and dividends from net realized capital gains, if any, are normally declared and paid annually, but the fund may make distributions on a more frequent basis to comply with the distribution requirements of the Internal Revenue Code of 1986, as amended (the “Code”). To the extent that net realized capital gains can be offset by capital loss carryovers, it is the policy of the fund not to distribute such gains. Income and capital gain distributions are determined in accordance with income tax regulations, which may differ from GAAP.
(g) Federal income taxes: It is the policy of the fund to continue to qualify as a regulated investment company, if such qualification is in the best interests of its shareholders, by complying with the applicable provisions of the Code, and to make distributions of taxable income sufficient to relieve it from substantially all federal income and excise taxes.
As of and during the period ended December 31, 2017, the fund did not have any liabilities for any uncertain tax positions. The fund recognizes interest and penalties, if any, related to uncertain tax positions as income tax expense in the Statement of Operations. During the period ended December 31, 2017, the fund did not incur any interest or penalties.
Each tax year in the four-year period ended December 31, 2017 remains subject to examination by the Internal Revenue Service and state taxing authorities.
At December 31, 2017, the components of accumulated earnings on a tax basis were as follows: undistributed ordinary income $412,919 and unrealized appreciation $6,345,777.
23
NOTES TO FINANCIAL STATEMENTS (continued)
The tax character of distributions paid to shareholders during the fiscal periods ended December 31, 2017 and December 31, 2016 were as follows: ordinary income $341,689 and $296,800, respectively.
During the period ended December 31, 2017, as a result of permanent book to tax differences, primarily due to the tax treatment for foreign currency exchange gains and losses, class action settlement, passive foreign investment companies and capital loss carryover expiration, the fund increased accumulated undistributed investment income-net by $34,120, increased accumulated net realized gain (loss) on investments by $7,705,094 and decreased paid-in capital by $7,739,214. Net assets and net asset value per share were not affected by this reclassification.
NOTE 2—Bank Lines of Credit:
The fund participates with other Dreyfus-managed funds in an $830 million unsecured credit facility led by Citibank, N.A. and a $300 million unsecured credit facility provided by The Bank of New York Mellon, a subsidiary of BNY Mellon and an affiliate of Dreyfus (each, a “Facility”), each to be utilized primarily for temporary or emergency purposes, including the financing of redemptions. Prior to October 4, 2017, the unsecured credit facility with Citibank, N.A. was $810 million. In connection therewith, the fund has agreed to pay its pro rata portion of commitment fees for each Facility. Interest is charged to the fund based on rates determined pursuant to the terms of the respective Facility at the time of borrowing. During the period ended December 31, 2017, the fund did not borrow under the Facilities.
NOTE 3—Investment Advisory Fee, Sub-Investment Advisory Fee and Other Transactions with Affiliates:
(a) Pursuant to an investment advisory agreement with Dreyfus, the investment advisory fee is computed at the annual rate of .75% of the value of the fund’s average daily net assets and is payable monthly.
Pursuant to a sub-investment advisory agreement between Dreyfus and Newton, the sub-investment advisory fee is payable monthly by Dreyfus, and is based upon the value of the fund’s average daily net assets, computed at the following rates:
24
Average Net Assets
0 up to $100 million ....................................... .35%
$100 million up to $1 billion .......................... .30%
$1 billion up to $1.5 billion ............................ .26%
In excess of $1.5 billion .................................. .20%
(b) Under the Distribution Plan adopted pursuant to Rule 12b-1 under the Act, Service shares pay the Distributor for distributing its shares, for servicing and/or maintaining Service shares’ shareholder accounts and for advertising and marketing for Service shares. The Distribution Plan provides for payments to be made at an annual rate of .25% of the value of the Service shares’ average daily net assets. The Distributor may make payments to Participating Insurance Companies and to brokers and dealers acting as principal underwriter for their variable insurance products. The fees payable under the Distribution Plan are payable without regard to actual expenses incurred. During the period ended December 31, 2017, Service shares were charged $19,192 pursuant to the Distribution Plan.
The fund has arrangements with the transfer agent and the custodian whereby the fund may receive earnings credits when positive cash balances are maintained, which are used to offset transfer agency and custody fees. For financial reporting purposes, the fund includes net earnings credits as an expense offset in the Statement of Operations.
The fund compensates Dreyfus Transfer, Inc., a wholly-owned subsidiary of Dreyfus, under a transfer agency agreement for providing transfer agency and cash management services for the fund. The majority of transfer agency fees are comprised of amounts paid on a per account basis, while cash management fees are related to fund subscriptions and redemptions. During the period ended December 31, 2017, the fund was charged $291 for transfer agency services and $28 for cash management services. These fees are included in Shareholder servicing costs in the Statement of Operations. Cash management fees were offset by earnings credits of $28.
The fund compensates The Bank of New York Mellon under a custody agreement for providing custodial services for the fund. These fees are determined based on net assets, geographic region and transaction activity. During the period ended December 31, 2017, the fund was charged $12,126 pursuant to the custody agreement.
25
NOTES TO FINANCIAL STATEMENTS (continued)
During the period ended December 31, 2017, the fund was charged $11,202 for services performed by the Chief Compliance Officer and his staff.
The components of “Due to The Dreyfus Corporation and affiliates” in the Statement of Assets and Liabilities consist of: investment advisory fees $23,257, Distribution Plan fees $1,644, custodian fees $7,525, Chief Compliance Officer fees $8,406 and transfer agency fees $157.
(c) Each Board member also serves as a Board member of other funds within the Dreyfus complex. Annual retainer fees and attendance fees are allocated to each fund based on net assets.
(d) During the period ended December 31, 2017, the fund received proceeds of $4,470 from a class action settlement from BNY Mellon related to foreign exchange transactions.
NOTE 4—Securities Transactions:
The aggregate amount of purchases and sales of investment securities, excluding short-term securities and forward contracts, during the period ended December 31, 2017, amounted to $9,686,624 and $12,897,833, respectively.
Derivatives: A derivative is a financial instrument whose performance is derived from the performance of another asset. The fund enters into International Swaps and Derivatives Association, Inc. Master Agreements or similar agreements (collectively, “Master Agreements”) with its over-the counter (“OTC”) derivative contract counterparties in order to, among other things, reduce its credit risk to counterparties. Master Agreements include provisions for general obligations, representations, collateral and events of default or termination. Under a Master Agreement, the fund may offset with the counterparty certain derivative financial instrument’s payables and/or receivables with collateral held and/or posted and create one single net payment in the event of default or termination.
Each type of derivative instrument that was held by the fund during the period ended December 31, 2017 is discussed below.
Forward Foreign Currency Exchange Contracts: The fund enters into forward contracts in order to hedge its exposure to changes in foreign currency exchange rates on its foreign portfolio holdings, to settle foreign currency transactions or as a part of its investment strategy. When executing forward contracts, the fund is obligated to buy or sell a foreign currency at a specified rate on a certain date in the future. With respect to sales of forward contracts, the fund incurs a loss if the value of the contract increases between the date the forward contract is opened and the
26
date the forward contract is closed. The fund realizes a gain if the value of the contract decreases between those dates. With respect to purchases of forward contracts, the fund incurs a loss if the value of the contract decreases between the date the forward contract is opened and the date the forward contract is closed. The fund realizes a gain if the value of the contract increases between those dates. Any realized or unrealized gains or losses which occurred during the period are reflected in the Statement of Operations. The fund is exposed to foreign currency risk as a result of changes in value of underlying financial instruments. The fund is also exposed to credit risk associated with counterparty nonperformance on these forward contracts, which is generally limited to the unrealized gain on each open contract. This risk may be mitigated by Master Agreements, if any, between the fund and the counterparty and the posting of collateral, if any, by the counterparty to the fund to cover the fund’s exposure to the counterparty. Forward contracts open at December 31, 2017 are set forth in the Statement of Forward Foreign Currency Exchange Contracts.
The provisions of ASC Topic 210 “Disclosures about Offsetting Assets and Liabilities” require disclosure on the offsetting of financial assets and liabilities. These disclosures are required for certain investments, including derivative financial instruments subject to Master Agreements which are eligible for offsetting in the Statement of Assets and Liabilities and require the fund to disclose both gross and net information with respect to such investments. For financial reporting purposes, the fund does not offset derivative assets and derivative liabilities that are subject to Master Agreements in the Statement of Assets and Liabilities.
At December 31, 2017, derivative assets and liabilities (by type) on a gross basis are as follows:
| | | | | | |
Derivative Financial Instruments: | | Assets ($) | | Liabilities ($) | |
Forward contracts | | 816 | | (10) | |
Total gross amount of derivative | | | | | |
assets and liabilities in the | | | | | |
Statement of Assets and Liabilities | | 816 | | (10) | |
Derivatives not subject to | | | | | |
Master Agreements | | - | | - | |
Total gross amount of assets | | | | | |
and liabilities subject to | | | | | |
Master Agreements | | 816 | | (10) | |
27
NOTES TO FINANCIAL STATEMENTS (continued)
The following tables present derivative assets and liabilities net of amounts available for offsetting under Master Agreements and net of related collateral received or pledged, if any, as of December 31, 2017:
| | | | | | | |
| | | | Financial | | | |
| | | | Instruments | | | |
| | | | and Derivatives | | | |
| | Gross Amount of | | Available | Collateral | | Net Amount of |
Counterparty | Assets ($) | 1 | for Offset ($) | Received ($) | | Assets ($) |
State Street Bank
and Trust Company | 816 | | - | - | | 816 |
Total | 816 | | - | - | | 816 |
| | | | | | | |
| | | | Financial | | | |
| | | | Instruments | | | |
| | | | and Derivatives | | | |
| | Gross Amount of | | Available | Collateral | | Net Amount of |
Counterparty | Liabilities ($) | 1 | for Offset ($) | Pledged ($) | | Liabilities ($) |
Citigroup | (10) | | - | - | | (10) |
| | | | | | | |
1 Absent a default event or early termination, OTC derivative assets and liabilities are presented at gross amounts and are not offset in the Statement of Assets and Liabilities. |
The following summarizes the average market value of derivatives outstanding during the period ended December 31, 2017:
| | | |
| | Average Market Value ($) |
Forward contracts | | 1,737,703 |
| | | |
At December 31, 2017, the cost of investments for federal income tax purposes was $30,342,949; accordingly, accumulated net unrealized appreciation on investments inclusive derivative contracts was $6,344,572, consisting of $8,001,769 gross unrealized appreciation and $1,657,197 gross unrealized depreciation.
28
REPORT OF INDEPENDENT REGISTERED PUBLIC ACCOUNTING FIRM
To the Shareholders and the Board of Trustees of Dreyfus Variable Investment Fund, International Equity Portfolio
Opinion on the Financial Statements
We have audited the accompanying statement of assets and liabilities of Dreyfus Variable Investment Fund, International Equity Portfolio (one of the series comprising Dreyfus Variable Investment Fund) (the “Fund”), including the statements of investments, investments in affiliated issuers and forward foreign currency exchange contracts, as of December 31, 2017, and the related statement of operations for the year then ended, the statements of changes in net assets for each of the two years in the period then ended, the financial highlights for each of the five years in the period then ended and the related notes (collectively referred to as the “financial statements”). In our opinion, the financial statements present fairly, in all material respects, the financial position of Dreyfus Variable Investment Fund, International Equity Portfolio at December 31, 2017, the results of its operations for the year then ended, the changes in its net assets for each of the two years in the period then ended and its financial highlights for each of the five years in the period then ended, in conformity with U.S. generally accepted accounting principles.
Basis for opinion
These financial statements are the responsibility of the Fund’s management. Our responsibility is to express an opinion on the Fund’s financial statements based on our audits. We are a public accounting firm registered with the Public Company Accounting Oversight Board (United States) (“PCAOB”) and are required to be independent with respect to the Fund in accordance with the U.S. federal securities laws and the applicable rules and regulations of the Securities and Exchange Commission and the PCAOB.
We conducted our audits in accordance with the standards of the PCAOB. Those standards require that we plan and perform the audit to obtain reasonable assurance about whether the financial statements are free of material misstatement, whether due to error or fraud. The Fund is not required to have, nor were we engaged to perform, an audit of the Fund’s internal control over financial reporting. As part of our audits, we are required to obtain an understanding of internal control over financial reporting, but not for the purpose of expressing an opinion on the effectiveness of the Fund’s internal control over financial reporting. Accordingly, we express no such opinion.
Our audits included performing procedures to assess the risks of material misstatement of the financial statements, whether due to error or fraud, and performing procedures that respond to those risks. Such procedures included examining, on a test basis, evidence regarding the amounts and disclosures in the financial statements. Our procedures included confirmation of securities owned as of December 31, 2017, by correspondence with the custodian and others or by other appropriate auditing procedures where replies were not received. Our audits also included evaluating the accounting principles used and significant estimates made by management, as well as evaluating the overall presentation of the financial statements. We believe that our audits provide a reasonable basis for our opinion.

We have served as the auditor of one or more Dreyfus investment companies since at least 1957, but we are unable to determine the specific year.
New York, New York
February 09, 2018
29
IMPORTANT TAX INFORMATION (Unaudited)
In accordance with federal tax law, the fund elects to provide each shareholder with their portion of the fund’s foreign taxes paid and the income sourced from foreign countries. Accordingly, the fund hereby reports the following information regarding its fiscal year ended December 31, 2017:
- the total amount of taxes paid to foreign countries was $61,773.
- the total amount of income sourced from foreign countries was $793,354.
Where required by federal tax law rules, shareholders will receive notification of their proportionate share of foreign taxes paid and foreign sourced income for the 2017 calendar year with Form 1099-DIV which will be mailed in early 2018.
30
BOARD MEMBERS INFORMATION (Unaudited)
INDEPENDENT BOARD MEMBERS
Joseph S. DiMartino (74)
Chairman of the Board (1995)
Principal Occupation During Past 5 Years:
· Corporate Director and Trustee (1995-present)
Other Public Company Board Memberships During Past 5 Years:
· CBIZ (formerly, Century Business Services, Inc.), a provider of outsourcing functions for small and medium size companies, Director (1997-present)
No. of Portfolios for which Board Member Serves: 127
———————
Peggy C. Davis (74)
Board Member (2006)
Principal Occupation During Past 5 Years:
· Shad Professor of Law, New York University School of Law (1983-present)
No. of Portfolios for which Board Member Serves: 46
———————
David P. Feldman (78)
Board Member (1994)
Principal Occupation During Past 5 Years:
· Corporate Director and Trustee (1985-present)
Other Public Company Board Memberships During Past 5 Years:
· BBH Mutual Funds Group (5 registered mutual funds), Director (1992-2014)
No. of Portfolios for which Board Member Serves: 32
———————
Joan Gulley (70)
Board Member (2017)
Principal Occupation During Past 5 Years:
· PNC Financial Services Group, Inc.(1993-2014), Executive Vice President and Chief Human Resources Officer and Executive Committee Member (2008-2014)
No. of Portfolios for which Board Member Serves: 54
———————
31
BOARD MEMBERS INFORMATION (Unaudited) (continued)
INDEPENDENT BOARD MEMBERS (continued)
Ehud Houminer (77)
Board Member (2006)
Principal Occupation During Past 5 Years:
· Board of Overseers at the Columbia Business School, Columbia University (1992-present)
· Trustee, Ben Gurion University
Other Public Company Board Memberships During Past 5 Years:
· Avnet, Inc., an electronics distributor, Director (1993-2012)
No. of Portfolios for which Board Member Serves: 54
———————
Lynn Martin (78)
Board Member (2012)
Principal Occupation During Past 5 Years:
· President of The Martin Hall Group LLC, a human resources consulting firm (2005-2012)
Other Public Company Board Memberships During Past 5 Years:
· AT&T, Inc., a telecommunications company, Director (1999-2012)
· Ryder System, Inc., a supply chain and transportation management company, Director (1993-2012)
No. of Portfolios for which Board Member Serves: 32
———————
Robin A. Melvin (54)
Board Member (2012)
Principal Occupation During Past 5 Years:
· Co-chairman, Illinois Mentoring Partnership, non-profit organization dedicated to increasing the quantity and quality of mentoring services in Illinois; (2014-present; board member since 2013)
· Director, Boisi Family Foundation, a private family foundation that supports youth-serving organizations that promote the self sufficiency of youth from disadvantaged circumstances (1995-2012)
No. of Portfolios for which Board Member Serves: 101
———————
32
Dr. Martin Peretz (78)
Board Member (1990)
Principal Occupation During Past 5 Years:
· Editor-in-Chief Emeritus of The New Republic Magazine (2011-2012) (previously,
Editor-in-Chief, 1974-2011)
· Lecturer at Harvard University (1969-2012)
No. of Portfolios for which Board Member Serves: 32
———————
Once elected all Board Members serve for an indefinite term, but achieve Emeritus status upon reaching age 80. The address of the Board Members and Officers is c/o The Dreyfus Corporation, 200 Park Avenue, New York, New York 10166. Additional information about the Board Members is available in the fund’s Statement of Additional Information which can be obtained from Dreyfus free of charge by calling this toll free number: 1-800-DREYFUS.
James F. Henry, Emeritus Board Member
Philip L. Toia, Emeritus Board Member
33
OFFICERS OF THE FUND (Unaudited)
BRADLEY J. SKAPYAK, President since January 2010.
Chief Operating Officer and a director of the Manager since June 2009, Chairman of Dreyfus Transfer, Inc., an affiliate of the Manager and the transfer agent of the funds, since May 2011 and Chief Executive Officer of MBSC Securities Corporation since August 2016. He is an officer of 63 investment companies (comprised of 127 portfolios) managed by the Manager. He is 59 years old and has been an employee of the Manager since February 1988.
BENNETT A. MACDOUGALL, Chief Legal Officer since October 2015.
Chief Legal Officer of the Manager and Associate General Counsel and Managing Director of BNY Mellon since June 2015; from June 2005 to June 2015, he served in various capacities with Deutsche Bank – Asset & Wealth Management Division, including as Director and Associate General Counsel, and Chief Legal Officer of Deutsche Investment Management Americas Inc. from June 2012 to May 2015. He is an officer of 64 investment companies (comprised of 152 portfolios) managed by the Manager. He is 46 years old and has been an employee of the Manager since June 2015.
JANETTE E. FARRAGHER, Vice President and Secretary since December 2011.
Associate General Counsel of BNY Mellon, and an officer of 64 investment companies (comprised of 152 portfolios) managed by the Manager. She is 55 years old and has been an employee of the Manager since February 1984.
JAMES BITETTO, Vice President and Assistant Secretary since August 2005.
Managing Counsel of BNY Mellon and Secretary of the Manager, and an officer of 64 investment companies (comprised of 152 portfolios) managed by the Manager. He is 51 years old and has been an employee of the Manager since December 1996.
JOSEPH M. CHIOFFI, Vice President and Assistant Secretary since August 2005.
Managing Counsel of BNY Mellon, and an officer of 64 investment companies (comprised of 152 portfolios) managed by the Manager. He is 56 years old and has been an employee of the Manager since June 2000.
MAUREEN E. KANE, Vice President and Assistant Secretary since April 2015.
Managing Counsel of BNY Mellon since July 2014; from October 2004 until July 2014, General Counsel, and from May 2009 until July 2014, Chief Compliance Officer of Century Capital Management. She is an officer of 64 investment companies (comprised of 152 portfolios) managed by the Manager. She is 55 years old and has been an employee of the Manager since July 2014.
SARAH S. KELLEHER, Vice President and Assistant Secretary since April 2014.
Senior Counsel of BNY Mellon since March 2013, from August 2005 to March 2013, Associate General Counsel of Third Avenue Management. She is an officer of 64 investment companies (comprised of 152 portfolios) managed by the Manager. She is 42 years old and has been an employee of the Manager since March 2013.
JEFF PRUSNOFSKY, Vice President and Assistant Secretary since August 2005.
Senior Managing Counsel of BNY Mellon, and an officer of 64 investment companies (comprised of 152 portfolios) managed by the Manager. He is 52 years old and has been an employee of the Manager since October 1990.
NATALYA ZELENSKY, Vice President and Assistant Secretary since March 2017.
Counsel and Vice President of BNY Mellon since May 2016; Attorney at Wildermuth Endowment Strategy Fund/Wildermuth Advisory, LLC from November 2015 until May 2016; Assistant General Counsel at RCS Advisory Services from July 2014 until November 2015; Associate at Sutherland, Asbill & Brennan from January 2013 until January 2014; Associate at K&L Gates from October 2011 until January 2013. She is an officer of 64 investment companies (comprised of 152 portfolios) managed by Dreyfus. She is 32 years old and has been an employee of the Manager since May 2016.
JAMES WINDELS, Treasurer since November 2001.
Director – Mutual Fund Accounting of the Manager, and an officer of 64 investment companies (comprised of 152 portfolios) managed by the Manager. He is 59 years old and has been an employee of the Manager since April 1985.
34
RICHARD CASSARO, Assistant Treasurer since January 2008.
Senior Accounting Manager – Money Market and Municipal Bond Funds of the Manager, and an officer of 64 investment companies (comprised of 152 portfolios) managed by the Manager. He is 58 years old and has been an employee of the Manager since September 1982.
GAVIN C. REILLY, Assistant Treasurer since December 2005.
Tax Manager of the Investment Accounting and Support Department of the Manager, and an officer of 64 investment companies (comprised of 152 portfolios) managed by the Manager. He is 49 years old and has been an employee of the Manager since April 1991.
ROBERT S. ROBOL, Assistant Treasurer since August 2005.
Senior Accounting Manager – Dreyfus Financial Reporting of the Manager, and an officer of 64 investment companies (comprised of 152 portfolios) managed by the Manager. He is 53 years old and has been an employee of the Manager since October 1988.
ROBERT SALVIOLO, Assistant Treasurer since July 2007.
Senior Accounting Manager – Equity Funds of the Manager, and an officer of 64 investment companies (comprised of 152 portfolios) managed by the Manager. He is 50 years old and has been an employee of the Manager since June 1989.
ROBERT SVAGNA, Assistant Treasurer since December 2002.
Senior Accounting Manager – Fixed Income and Equity Funds of the Manager, and an officer of 64 investment companies (comprised of 152 portfolios) managed by the Manager. He is 50 years old and has been an employee of the Manager since November 1990.
JOSEPH W. CONNOLLY, Chief Compliance Officer since October 2004.
Chief Compliance Officer of the Manager and The Dreyfus Family of Funds (64 investment companies, comprised of 152 portfolios). He is 60 years old and has served in various capacities with the Manager since 1980, including manager of the firm’s Fund Accounting Department from 1997 through October 2001.
CARIDAD M. CAROSELLA, Anti-Money Laundering Compliance Officer since January 2016.
Anti-Money Laundering Compliance Officer of the Dreyfus Family of Funds and BNY Mellon Funds Trust since January 2016; from May 2015 to December 2015, Interim Anti-Money Laundering Compliance Officer of the Dreyfus Family of Funds and BNY Mellon Funds Trust and the Distributor; from January 2012 to May 2015, AML Surveillance Officer of the Distributor and from 2007 to December 2011, Financial Processing Manager of the Distributor. She is an officer of 58 investment companies (comprised of 146 portfolios) managed by the Manager. She is 49 years old and has been an employee of the Distributor since 1997.
35
NOTES
36
NOTES
37
Dreyfus Variable Investment Fund, International Equity Portfolio
200 Park Avenue
New York, NY 10166
Investment Adviser
The Dreyfus Corporation
200 Park Avenue
New York, NY 10166
Sub-Investment Adviser
Newton Investment Management
(North America) Limited
160 Queen Victoria Street
London, EC4V 4LA
UK
Custodian
The Bank of New York Mellon
225 Liberty Street
New York, NY 10286
Transfer Agent &
Dividend Disbursing Agent
Dreyfus Transfer, Inc.
200 Park Avenue
New York, NY 10166
Distributor
MBSC Securities Corporation
200 Park Avenue
New York, NY 10166
Telephone 1-800-258-4260 or 1-800-258-4261
Mail The Dreyfus Family of Funds, 144 Glenn Curtiss Boulevard, Uniondale, NY 11556-0144 Attn: Institutional Services Department
E-mail Send your request to info@dreyfus.com
Internet Information can be viewed online or downloaded at www.dreyfus.com
The fund files its complete schedule of portfolio holdings with the Securities and Exchange Commission (“SEC”) for the first and third quarters of each fiscal year on Form N-Q. The fund’s Forms N-Q are available on the SEC’s website at http://www.sec.gov and may be reviewed and copied at the SEC’s Public Reference Room in Washington, D.C. Information on the operation of the Public Reference Room may be obtained by calling 1-800-SEC-0330.
A description of the policies and procedures that the fund uses to determine how to vote proxies relating to portfolio securities, and information regarding how the fund voted these proxies for the most recent 12-month period ended June 30 is available at http://www.dreyfus.com and on the SEC’s website at http://www.sec.gov. The description of the policies and procedures is also available without charge, upon request, by calling 1-800-DREYFUS.
| | |
© 2018 MBSC Securities Corporation
0109AR1217 | 
|
Dreyfus Variable Investment Fund, International Value Portfolio
| | | |

| | ANNUAL REPORT
December 31, 2017 |
| |
The views expressed in this report reflect those of the portfolio manager(s) only through the end of the period covered and do not necessarily represent the views of Dreyfus or any other person in the Dreyfus organization. Any such views are subject to change at any time based upon market or other conditions and Dreyfus disclaims any responsibility to update such views. These views may not be relied on as investment advice and, because investment decisions for a Dreyfus fund are based on numerous factors, may not be relied on as an indication of trading intent on behalf of any Dreyfus fund. |
| |
Not FDIC-Insured • Not Bank-Guaranteed • May Lose Value |
Contents
THE FUND
FOR MORE INFORMATION
Back Cover
| | | | |
| |
Dreyfus Variable Investment Fund, International Value Portfolio
| | The Fund |
A LETTER FROM THE PRESIDENT OF DREYFUS
Dear Shareholder:
We are pleased to present this annual report for Dreyfus Variable Investment Fund, International Value Portfolio, covering the 12-month period from January 1, 2017 through December 31, 2017. For information about how the fund performed during the reporting period, as well as general market perspectives, we provide a Discussion of Fund Performance on the pages that follow.
Stocks set a series of new record highs and bonds produced modestly positive results during 2017. Financial markets early in the year were dominated by the inauguration of a new U.S. president, as equities and corporate-backed bonds surged higher in anticipation of more business-friendly regulatory, tax, and fiscal policies. U.S. and international stocks continued to rally in the spring as corporate earnings grew and global economic conditions improved. Later in the year, the passage of tax reform legislation fueled additional stock market gains.
Despite three short-term interest rate hikes and concerns early in the year that inflation might accelerate in a growing economy, bonds generally produced positive total returns in 2017. Corporate-backed securities and municipal bonds fared particularly well.
The markets’ strong performance last year was supported by solid underlying fundamentals, including sustained economic growth, a robust labor market, and low inflation. We currently expect these favorable conditions to persist in 2018, but we remain watchful for economic and political developments that could negatively impact the markets. As always, we encourage you to discuss the risks and opportunities of today’s investment environment with your financial advisor.
Thank you for your continued confidence and support.
Sincerely,

Renee Laroche-Morris
President
The Dreyfus Corporation
January 16, 2018
2
DISCUSSION OF FUND PERFORMANCE
For the period from January 1, 2017 through December 31, 2017, as provided by Mark A. Bogar, CFA, James A. Lydotes, CFA, and Andrew Leger, Portfolio Managers
Market and Fund Performance Overview
For the 12-month period ended December 31, 2017, Dreyfus Variable Investment Fund, International Value Portfolio’s Initial Shares produced a total return of 28.52%, and its Service Shares produced a total return of 28.14%.1 This compares with a 25.03% return produced by the fund’s benchmark, the MSCI EAFE Index (the “Index”), for the same period.2
International equities posted robust gains on the strength of better-than-expected corporate earnings and improving global economic conditions. The fund outperformed the Index, largely due to favorable individual stock selections in Japan, Germany, and the Netherlands.
The Fund’s Investment Approach
The fund seeks long-term capital growth. To pursue its goal, the fund normally invests at least 80% of its net assets, plus any borrowings for investment purposes, in stocks. The fund normally invests substantially all of its assets in the stocks of foreign companies, including those located in emerging market countries. The fund’s investment approach is value-oriented and research-driven. In selecting stocks, the portfolio managers identify potential investments through extensive quantitative and fundamental research.
Emphasizing individual stock selection rather than economic and industry trends, the fund focuses on three key factors: value, or how a stock is valued relative to its intrinsic worth based on traditional value measures: business health, or overall efficiency and profitability as measured by return on assets and return on equity: and business momentum, or the presence of a catalyst (such as corporate restructuring, change in management or spin-off) that potentially will trigger a price increase near-term to midterm.
Economic and Political Developments Supported Gains
2017 marked the first year of sustained, synchronized global growth since the financial crisis a decade ago. As Europe and Asia joined the United States in producing accelerating economic growth and rising corporate earnings, equity markets responded by climbing steadily throughout the year. Consequently, the Index ended 2017 at its highest level since mid-2008.
In the European Union (EU), political worries receded as anti-EU candidates for national office were rejected by voters in favor of more centrist, pro-EU figures, first in the Netherlands in March 2017 and then three months later in France. The region’s economic growth was underscored by greater economic activity, strengthening labor markets, and less need for monetary stimulus from the European Central Bank. While the U.K. market also advanced, it lagged most of Europe in part due to unresolved issues regarding the country’s impending exit from the EU. In Japan, the country’s central bank revised its growth estimates upwards amid a slew of unexpectedly strong corporate earnings reports, and the reelection of the incumbent government in October’s snap elections further bolstered the local market’s momentum.
Stock Selections Bolstered Relative Returns
Relatively strong individual stock selections enabled the fund to produce higher returns than the Index in 2017. Japanese holdings generated particularly strong gains, led by electronics manufacturer Sony, which made progress in corporate restructurings designed to increase profitability. Vehicle manufacturer Suzuki Motor rose sharply due to higher sales volumes in
3
DISCUSSION OF FUND PERFORMANCE (continued)
India, the European Union, and Japan. Chemicals maker Tosoh reported improving business trends and reduced production costs. Among German holdings, electric utility E.ON benefited from a favorable court settlement, while financial services provider Allianz posted strong financial results. In the Netherlands, banking group ABN AMRO Group was buoyed by an improving capital position and a reduction in non-performing loans, while brewer Heineken exceeded earnings expectations due to rising sales volumes and strategic acquisitions in the craft brewing area. Other top performers during 2017 included U.K.-based Fiat Chrysler Automobiles and Hong Kong-based financial firm AIA Group.
Although disappointments proved relatively mild during the year, underweighted exposure to U.K.-based energy companies detracted from the fund’s relative results, as did a position in advertising agency WPP, which faced competitive pricing pressures arising from the shift to digital media. In France, lack of exposure to high-flying luxury goods producers proved counterproductive, while grocery chain Carrefour missed quarterly earnings expectations. In Israel, pharmaceutical company Teva Pharmaceutical Industries was hurt by pricing pressures and a heavy debt load. Other notable disappointments included two Japanese holdings, drug manufacturer Astellas Pharma and retail store operator Seven & I Holdings.
A Positive Environment for International Equities
Encouraging global economic trends and relatively attractive valuations continue to portend well for the world’s developed equity markets. As of the end of the reporting period, our stock selection process has identified an ample number of attractive opportunities among Dutch and Swiss equities, while leading us to trim the fund’s exposure to Australian and German stocks. From a sector allocation perspective, we have added to financial and utilities holdings, but we have reduced the fund’s exposure to the energy and industrials sectors.
January 16, 2018
1 Total return includes reinvestment of dividends and any capital gains paid. Past performance is no guarantee of future results. Share price and investment return fluctuate such that upon redemption, fund shares may be worth more or less than their original cost. The fund’s performance does not reflect the deduction of additional charges and expenses imposed in connection with investing in variable insurance contracts, which will reduce returns. Return figures for the fund reflect the absorption of certain fund expenses by The Dreyfus Corporation pursuant to an undertaking in effect through May 1, 2018, at which time it may be extended, terminated, or modified. Had these expenses not been absorbed, the fund’s returns would have been lower.
2 Source: Lipper Inc. — Reflects reinvestment of net dividends and, where applicable, capital gain distributions. The MSCI EAFE Index (Europe, Australasia, Far East) is a free float-adjusted market capitalization-weighted index that is designed to measure the equity market performance of developed markets, excluding the U.S. and Canada. Investors cannot invest directly in any index.
Please note: the position in any security highlighted with italicized typeface was sold during the reporting period.
Equities are subject generally to market, market sector, market liquidity, issuer, and investment style risks, among other factors, to varying degrees, all of which are more fully described in the fund’s prospectus.
The fund’s performance will be influenced by political, social, and economic factors affecting investments in foreign companies. Special risks associated with investments in foreign companies include exposure to currency fluctuations, less liquidity, less developed or less efficient trading markets, lack of comprehensive company information, political instability, and differing auditing and legal standards. These risks are enhanced in emerging market countries.
The fund is only available as a funding vehicle under variable life insurance policies or variable annuity contracts issued by insurance companies. Individuals may not purchase shares of the fund directly. A variable annuity is an insurance contract issued by an insurance company that enables investors to accumulate assets on a tax-deferred basis for retirement or other long-term goals. The investment objective and policies of Dreyfus Variable Investment Fund, International Value Portfolio made available through insurance products may be similar to those of other funds managed or advised by Dreyfus. However, the investment results of the fund may be higher or lower than, and may not be comparable to, those of any other Dreyfus fund.
4
FUND PERFORMANCE

Comparison of change in value of $10,000 investment in Dreyfus Variable Investment Fund, International Value Portfolio Initial shares and Service shares and the MSCI EAFE Index (the “Index”)
† Source: Lipper Inc.
Past performance is not predictive of future performance. The fund’s performance does not reflect the deduction of additional charges and expenses imposed in connection with investing in variable insurance contracts which will reduce returns.
The above graph compares a $10,000 investment made in Initial and Service shares of Dreyfus Variable Investment Fund, International Value Portfolio on 12/31/07 to a $10,000 investment made in the Index on that date.
The fund’s performance shown in the line graph above takes into account all applicable fees and expenses. The Index (Europe, Australasia, Far East) is a free float-adjusted market capitalization-weighted index that is designed to measure the equity market performance of developed markets, excluding the U.S. and Canada. Unlike a mutual fund, the Index is not subject to charges, fees and other expenses. Investors cannot invest directly in any index. Further information relating to fund performance, including expense reimbursements, if applicable, is contained in the Financial Highlights section of the prospectus and elsewhere in this report.
| | | | |
Average Annual Total Returns as of 12/31/17 |
| 1 Year | 5 Years | 10 Years |
Initial shares | 28.52% | 6.56% | 0.79% |
Service shares | 28.14% | 6.30% | 0.54% |
MSCI EAFE Index | 25.03% | 7.90% | 1.94% |
The performance data quoted represents past performance, which is no guarantee of future results. Share price and investment return fluctuate and an investor’s shares may be worth more or less than original cost upon redemption. Current performance may be lower or higher than the performance quoted. Go to Dreyfus.com for the fund’s most recent month-end returns.
The fund’s Initial shares are not subject to a Rule 12b-1 fee. The fund’s Service shares are subject to a 0.25% annual Rule 12b-1 fee. All dividends and capital gain distributions are reinvested.
The fund’s performance shown in the graph and table does not reflect the deduction of taxes that a shareholder would pay on fund distributions or the redemption of fund shares.
5
UNDERSTANDING YOUR FUND’S EXPENSES (Unaudited)
As a mutual fund investor, you pay ongoing expenses, such as management fees and other expenses. Using the information below, you can estimate how these expenses affect your investment and compare them with the expenses of other funds. You also may pay one-time transaction expenses, including sales charges (loads), redemption fees and expenses associated with variable annuity or insurance contracts, which are not shown in this section and would have resulted in higher total expenses. For more information, see your fund’s prospectus or talk to your financial adviser.
Review your fund’s expenses
The table below shows the expenses you would have paid on a $1,000 investment in Dreyfus Variable Investment Fund, International Value Portfolio from July 1, 2017 to December 31, 2017. It also shows how much a $1,000 investment would be worth at the close of the period, assuming actual returns and expenses.
| | | | | | | | |
Expenses and Value of a $1,000 Investment | | |
assuming actual returns for the six months ended December 31, 2017 | |
| | | | Initial Shares | Service Shares |
Expenses paid per $1,000† | | | $4.59 | | $5.92 |
Ending value (after expenses) | | | $1,115.50 | | $1,114.30 |
COMPARING YOUR FUND’S EXPENSES
WITH THOSE OF OTHER FUNDS (Unaudited)
Using the SEC’s method to compare expenses
The Securities and Exchange Commission (“SEC”) has established guidelines to help investors assess fund expenses. Per these guidelines, the table below shows your fund’s expenses based on a $1,000 investment, assuming a hypothetical 5% annualized return. You can use this information to compare the ongoing expenses (but not transaction expenses or total cost) of investing in the fund with those of other funds. All mutual fund shareholder reports will provide this information to help you make this comparison. Please note that you cannot use this information to estimate your actual ending account balance and expenses paid during the period.
| | | | | | | | |
Expenses and Value of a $1,000 Investment | | |
assuming a hypothetical 5% annualized return for the six months ended December 31, 2017 |
| | | | Initial Shares | Service Shares |
Expenses paid per $1,000† | | | $4.38 | | $5.65 |
Ending value (after expenses) | | | $1,020.87 | | $1,019.61 |
† Expenses are equal to the fund’s annualized expense ratio of .86% for Initial shares and 1.11% for Service shares, multiplied by the average account value over the period, multiplied by 184/365 (to reflect the one-half year period).
6
STATEMENT OF INVESTMENTS
December 31, 2017
| | | | | | | | |
| |
Description | | | | Shares | | Value ($) | |
Common Stocks - 99.4% | | | | | |
Australia - 5.1% | | | | | |
Australia & New Zealand Banking Group | | | | 25,746 | | 575,074 | |
BHP Billiton | | | | 23,061 | | 530,824 | |
Macquarie Group | | | | 10,421 | | 807,935 | |
Woodside Petroleum | | | | 20,751 | | 536,324 | |
Woolworths Group | | | | 24,546 | | 522,460 | |
| | | | | 2,972,617 | |
Belgium - 1.4% | | | | | |
bpost | | | | 14,620 | | 444,874 | |
UCB | | | | 4,516 | | 357,867 | |
| | | | | 802,741 | |
Brazil - .9% | | | | | |
APERAM | | | | 10,648 | | 548,104 | |
Denmark - 1.4% | | | | | |
Chr. Hansen Holding | | | | 8,893 | | 834,037 | |
Finland - .9% | | | | | |
UPM-Kymmene | | | | 16,366 | | 507,809 | |
France - 9.4% | | | | | |
Arkema | | | | 3,783 | | 459,708 | |
Atos | | | | 4,246 | | 618,050 | |
BNP Paribas | | | | 16,987 | | 1,266,783 | |
Cie Generale des Etablissements Michelin | | | | 3,984 | | 570,684 | |
Orange | | | | 63,225 | | 1,097,132 | |
Renault | | | | 5,262 | | 528,871 | |
Thales | | | | 2,475 | | 266,336 | |
Vinci | | | | 6,377 | | 650,625 | |
| | | | | 5,458,189 | |
Germany - 7.2% | | | | | |
Allianz | | | | 4,340 | | 993,917 | |
Continental | | | | 1,994 | | 538,329 | |
Deutsche Post | | | | 15,067 | | 715,755 | |
Evonik Industries | | | | 15,285 | | 573,440 | |
Fresenius & Co. | | | | 10,039 | | 781,637 | |
Infineon Technologies | | | | 21,336 | | 582,733 | |
| | | | | 4,185,811 | |
Hong Kong - 3.2% | | | | | |
AIA Group | | | | 146,000 | | 1,245,134 | |
Sun Hung Kai Properties | | | | 39,000 | | 649,656 | |
| | | | | 1,894,790 | |
Italy - 5.5% | | | | | |
Enel | | | | 126,845 | | 779,664 | |
7
STATEMENT OF INVESTMENTS (continued)
| | | | | | | | |
| |
Description | | | | Shares | | Value ($) | |
Common Stocks - 99.4% (continued) | | | | | |
Italy - 5.5% (continued) | | | | | |
Fiat Chrysler Automobiles | | | | 38,798 | a | 691,790 | |
Leonardo | | | | 33,104 | | 393,607 | |
Moncler | | | | 19,944 | | 623,100 | |
Telecom Italia | | | | 838,485 | a | 723,832 | |
| | | | | 3,211,993 | |
Japan - 23.9% | | | | | |
Alps Electric | | | | 30,000 | | 853,741 | |
Chubu Electric Power | | | | 33,400 | | 414,815 | |
Daiwa Securities Group | | | | 52,000 | | 326,337 | |
Denso | | | | 13,500 | | 810,514 | |
Hitachi | | | | 146,000 | | 1,135,748 | |
ITOCHU | | | | 25,600 | | 477,973 | |
Japan Airlines | | | | 13,900 | | 543,906 | |
JTEKT | | | | 17,000 | | 292,214 | |
KDDI | | | | 21,000 | | 522,844 | |
MinebeaMitsumi | | | | 21,900 | | 459,506 | |
Mitsubishi Electric | | | | 39,200 | | 651,338 | |
Nintendo | | | | 1,300 | | 473,268 | |
Recruit Holdings | | | | 16,200 | | 402,342 | |
Seven & i Holdings | | | | 19,900 | | 826,539 | |
Shionogi & Co. | | | | 8,500 | | 459,569 | |
Showa Denko | | | | 10,500 | | 447,948 | |
Showa Shell Sekiyu | | | | 53,400 | | 725,438 | |
Sony | | | | 28,900 | | 1,298,159 | |
Sumitomo Mitsui Financial Group | | | | 34,600 | | 1,494,374 | |
Suzuki Motor | | | | 14,000 | | 810,881 | |
Zeon | | | | 34,000 | | 492,337 | |
| | | | | 13,919,791 | |
Macau - 1.5% | | | | | |
Sands China | | | | 168,800 | | 868,792 | |
Netherlands - 5.2% | | | | | |
ABN AMRO Group | | | | 32,999 | b | 1,061,843 | |
Heineken | | | | 8,180 | | 852,635 | |
NN Group | | | | 25,242 | | 1,091,437 | |
| | | | | 3,005,915 | |
Norway - .5% | | | | | |
Telenor | | | | 13,643 | | 292,242 | |
Portugal - 1.3% | | | | | |
Galp Energia | | | | 40,356 | | 741,382 | |
Spain - 3.4% | | | | | |
ACS Actividades de Construccion y Servicios | | | | 13,863 | | 542,403 | |
8
| | | | | | | | |
| |
Description | | | | Shares | | Value ($) | |
Common Stocks - 99.4% (continued) | | | | | |
Spain - 3.4% (continued) | | | | | |
Banco Santander | | | | 218,361 | | 1,431,867 | |
| | | | | 1,974,270 | |
Sweden - 1.5% | | | | | |
Alfa Laval | | | | 18,715 | | 441,274 | |
Volvo, Cl. B | | | | 22,499 | | 418,626 | |
| | | | | 859,900 | |
Switzerland - 8.8% | | | | | |
ABB | | | | 21,270 | | 568,811 | |
Adecco Group | | | | 7,097 | | 542,421 | |
Julius Baer Group | | | | 16,274 | a | 994,944 | |
Lonza Group | | | | 2,341 | a | 632,384 | |
Novartis | | | | 13,260 | | 1,121,024 | |
Roche Holding | | | | 5,094 | | 1,288,493 | |
| | | | | 5,148,077 | |
United Kingdom - 16.5% | | | | | |
Anglo American | | | | 23,043 | | 481,600 | |
Compass Group | | | | 19,581 | | 423,398 | |
Diageo | | | | 36,418 | | 1,332,835 | |
Ferguson | | | | 6,068 | | 434,181 | |
Imperial Brands | | | | 23,312 | | 996,236 | |
Prudential | | | | 40,784 | | 1,048,561 | |
Royal Dutch Shell, Cl. B | | | | 24,457 | | 824,857 | |
Shire | | | | 14,383 | | 746,021 | |
Smiths Group | | | | 14,703 | | 294,135 | |
SSE | | | | 57,903 | | 1,031,522 | |
Standard Chartered | | | | 81,124 | a | 853,697 | |
Unilever | | | | 21,231 | | 1,176,185 | |
| | | | | 9,643,228 | |
United States - 1.8% | | | | | |
iShares MSCI EAFE ETF | | | | 14,926 | | 1,049,447 | |
Total Common Stocks (cost $49,670,354) | | | | 57,919,135 | |
9
STATEMENT OF INVESTMENTS (continued)
| | | | | | | | |
| |
Description | | | | Shares | | Value ($) | |
Other Investment - .4% | | | | | |
Registered Investment Company; | | | | | |
Dreyfus Institutional Preferred Government Plus Money Market Fund
(cost $243,064) | | | | 243,064 | c | 243,064 | |
Total Investments (cost $49,913,418) | | 99.8% | | 58,162,199 | |
Cash and Receivables (Net) | | .2% | | 135,265 | |
Net Assets | | 100.0% | | 58,297,464 | |
ETF—Exchange-Traded Fund
aNon-income producing security.
bSecurity exempt from registration pursuant to Rule 144A under the Securities Act of 1933. These securities may be resold in transactions exempt from registration, normally to qualified institutional buyers. At December 31, 2017, these securities were valued at $1,061,843 or 1.82% of net assets.
cInvestment in affiliated money market mutual fund.
| | |
Portfolio Summary (Unaudited) † | Value (%) |
Financials | 22.6 |
Industrials | 14.7 |
Consumer Discretionary | 12.3 |
Consumer Staples | 9.8 |
Health Care | 9.2 |
Materials | 8.4 |
Information Technology | 6.3 |
Energy | 4.9 |
Telecommunication Services | 4.5 |
Utilities | 3.8 |
Exchange-Traded Funds | 1.8 |
Real Estate | 1.1 |
Money Market Investment | .4 |
| | 99.8 |
† Based on net assets.
See notes to financial statements.
10
STATEMENT OF INVESTMENTS IN AFFILIATED ISSUERS
| | | | | | | |
Registered Investment Company | Value
12/31/16($) | Purchases($) | Sales ($) | Value
12/31/17($) | Net
Assets(%) | Dividends/
Distributions($) |
Dreyfus Institutional Preferred Government Plus Money Market Fund | 328,652 | 17,153,871 | 17,239,459 | 243,064 | .4 | 2,303 |
See notes to financial statements.
11
STATEMENT OF FORWARD FOREIGN CURRENCY EXCHANGE CONTRACTS December 31, 2017
| | | | | | |
Counterparty/ Purchased
Currency | Purchased Currency
Amounts | Currency
Sold | Sold
Currency
Amounts | Settlement Date | Unrealized Appreciation ($) |
Barclays Bank | | | |
Euro | 37,315 | United States Dollar | 44,746 | 1/2/18 | 26 |
Gross Unrealized Appreciation | | | 26 |
See notes to financial statements.
12
STATEMENT OF ASSETS AND LIABILITIES
December 31, 2017
| | | | | | | |
| | | | | | |
| | | Cost | | Value | |
Assets ($): | | | | |
Investments in securities—See Statement of Investments: | | | |
Unaffiliated issuers | 49,670,354 | | 57,919,135 | |
Affiliated issuers | | 243,064 | | 243,064 | |
Cash | | | | | 32,784 | |
Cash denominated in foreign currency | | | 129,257 | | 132,333 | |
Receivable for investment securities sold | | 148,454 | |
Tax reclaim receivable | | 88,190 | |
Dividends receivable | | 10,422 | |
Unrealized appreciation on forward foreign
currency exchange contracts—Note 4 | | 26 | |
Prepaid expenses | | | | | 629 | |
| | | | | 58,575,037 | |
Liabilities ($): | | | | |
Due to The Dreyfus Corporation and affiliates—Note 3(b) | | | | | 52,361 | |
Payable for investment securities purchased | | 138,524 | |
Payable for shares of Beneficial Interest redeemed | | 28,888 | |
Accrued expenses | | | | | 57,800 | |
| | | | | 277,573 | |
Net Assets ($) | | | 58,297,464 | |
Composition of Net Assets ($): | | | | |
Paid-in capital | | | | | 65,932,830 | |
Accumulated undistributed investment income—net | | 836,598 | |
Accumulated net realized gain (loss) on investments | | | | | (16,722,713) | |
Accumulated net unrealized appreciation (depreciation)
on investments and foreign currency transactions | | | | 8,250,749 | |
Net Assets ($) | | | 58,297,464 | |
| | | | |
Net Asset Value Per Share | Initial Shares | Service Shares | |
Net Assets ($) | 22,044,575 | 36,252,889 | |
Shares Outstanding | 1,796,342 | 2,952,593 | |
Net Asset Value Per Share ($) | 12.27 | 12.28 | |
| | | | |
See notes to financial statements. | | | |
13
STATEMENT OF OPERATIONS
Year Ended December 31, 2017
| | | | | | | |
| | | | | | |
| | | | | | |
Investment Income ($): | | | | |
Income: | | | | |
Cash dividends (net of $136,781 foreign taxes withheld at source): | |
Unaffiliated issuers | | | 1,341,181 | |
Affiliated issuers | | | 2,303 | |
Total Income | | | 1,343,484 | |
Expenses: | | | | |
Investment advisory fee—Note 3(a) | | | 515,832 | |
Distribution fees—Note 3(b) | | | 78,054 | |
Professional fees | | | 77,862 | |
Custodian fees—Note 3(b) | | | 62,685 | |
Prospectus and shareholders’ reports | | | 19,085 | |
Trustees’ fees and expenses—Note 3(c) | | | 6,012 | |
Shareholder servicing costs—Note 3(b) | | | 1,866 | |
Loan commitment fees—Note 2 | | | 1,017 | |
Miscellaneous | | | 24,209 | |
Total Expenses | | | 786,622 | |
Less—reduction in expenses due to undertaking—Note 3(a) | | | (264,641) | |
Less—reduction in fees due to earnings credits—Note 3(b) | | | (62) | |
Net Expenses | | | 521,919 | |
Investment Income—Net | | | 821,565 | |
Realized and Unrealized Gain (Loss) on Investments—Note 4 ($): | | |
Net realized gain (loss) on investments and foreign currency transactions | 2,744,060 | |
Net realized gain (loss) on forward foreign currency exchange contracts | 11,323 | |
Net Realized Gain (Loss) | | | 2,755,383 | |
Net unrealized appreciation (depreciation) on investments
and foreign currency transactions | | | 9,080,482 | |
Net unrealized appreciation (depreciation) on
forward foreign currency exchange contracts | | | 185 | |
Net Unrealized Appreciation (Depreciation) | | | 9,080,667 | |
Net Realized and Unrealized Gain (Loss) on Investments | | | 11,836,050 | |
Net Increase from Payment by Affiliate | | | 1,201 | |
Net Increase in Net Assets Resulting from Operations | | 12,658,816 | |
| | | | | | | |
See notes to financial statements. | | | | | |
14
STATEMENT OF CHANGES IN NET ASSETS
| | | | | | | | | | |
| | | | Year Ended December 31, |
| | | | 2017 | | 2016 | |
Operations ($): | | | | | | | | |
Investment income—net | | | 821,565 | | | | 607,447 | |
Net realized gain (loss) on investments | | 2,755,383 | | | | (2,713,802) | |
Net unrealized appreciation (depreciation)
on investments | | 9,080,667 | | | | 1,387,600 | |
Net increase from payment by affiliate | | 1,201 | | | | 8,436 | |
Net Increase (Decrease) in Net Assets
Resulting from Operations | 12,658,816 | | | | (710,319) | |
Distributions to Shareholders from ($): | |
Investment income—net: | | | | | | | | |
Initial Shares | | | (293,637) | | | | (402,054) | |
Service Shares | | | (394,293) | | | | (263,458) | |
Total Distributions | | | (687,930) | | | | (665,512) | |
Beneficial Interest Transactions ($): | |
Net proceeds from shares sold: | | | | | | | | |
Initial Shares | | | 2,586,028 | | | | 2,924,740 | |
Service Shares | | | 8,168,542 | | | | 15,004,825 | |
Distributions reinvested: | | | | | | | | |
Initial Shares | | | 293,637 | | | | 402,054 | |
Service Shares | | | 394,293 | | | | 263,458 | |
Cost of shares redeemed: | | | | | | | | |
Initial Shares | | | (2,796,223) | | | | (7,162,172) | |
Service Shares | | | (6,422,662) | | | | (6,333,479) | |
Increase (Decrease) in Net Assets
from Beneficial Interest Transactions | 2,223,615 | | | | 5,099,426 | |
Total Increase (Decrease) in Net Assets | 14,194,501 | | | | 3,723,595 | |
Net Assets ($): | |
Beginning of Period | | | 44,102,963 | | | | 40,379,368 | |
End of Period | | | 58,297,464 | | | | 44,102,963 | |
Undistributed investment income—net | 836,598 | | | | 684,963 | |
Capital Share Transactions (Shares): | |
Initial Shares | | | | | | | | |
Shares sold | | | 239,807 | | | | 307,789 | |
Shares issued for distributions reinvested | | | 28,619 | | | | 42,863 | |
Shares redeemed | | | (249,081) | | | | (747,037) | |
Net Increase (Decrease) in Shares Outstanding | 19,345 | | | | (396,385) | |
Service Shares | | | | | | | | |
Shares sold | | | 731,930 | | | | 1,553,523 | |
Shares issued for distributions reinvested | | | 38,318 | | | | 27,998 | |
Shares redeemed | | | (582,351) | | | | (665,882) | |
Net Increase (Decrease) in Shares Outstanding | 187,897 | | | | 915,639 | |
| | | | | | | | | | |
See notes to financial statements. | | | | | | | | |
15
FINANCIAL HIGHLIGHTS
The following tables describe the performance for each share class for the fiscal periods indicated. All information (except portfolio turnover rate) reflects financial results for a single fund share. Total return shows how much your investment in the fund would have increased (or decreased) during each period, assuming you had reinvested all dividends and distributions. The fund’s total returns do not reflect expenses associated with variable annuity or insurance contracts. These figures have been derived from the fund’s financial statements.
| | | | | | | | | | | |
| | | | | | | |
| | | |
Initial Shares | | | Year Ended December 31, |
| | | 2017 | 2016 | 2015 | 2014 | 2013 |
Per Share Data ($): | | | | | | |
Net asset value, beginning of period | | 9.70 | 10.04 | 10.55 | 11.82 | 9.82 |
Investment Operations: | | | | | | |
Investment income—neta | | .19 | .18 | .18 | .19 | .18 |
Net realized and unrealized
gain (loss) on investments | | 2.54 | (.33) | (.45) | (1.27) | 2.04 |
Total from Investment Operations | | 2.73 | (.15) | (.27) | (1.08) | 2.22 |
Distributions: | | | | | | |
Dividends from
investment income—net | | (.16) | (.19) | (.24) | (.19) | (.22) |
Payment by affiliate | | .00b,c | .00b,c | - | - | - |
Net asset value, end of period | | 12.27 | 9.70 | 10.04 | 10.55 | 11.82 |
Total Return (%) | | 28.52c | (1.45)c | (2.72) | (9.32) | 22.99 |
Ratios/Supplemental Data (%): | | | | | | |
Ratio of total expenses
to average net assets | | 1.37 | 1.38 | 1.38 | 1.29 | 1.25 |
Ratio of net expenses
to average net assets | | .86 | .85 | .83 | .99 | .95 |
Ratio of net investment income
to average net assets | | 1.75 | 1.87 | 1.66 | 1.68 | 1.71 |
Portfolio Turnover Rate | | 62.39 | 108.21 | 147.24 | 45.43 | 57.30 |
Net Assets, end of period ($ x 1,000) | | 22,045 | 17,241 | 21,814 | 33,147 | 42,421 |
a Based on average shares outstanding.
b Amount represents less than $.01.
c The fund received proceeds from a class action settlement from The Bank of New York Mellon Corporation. This payment had no impact on total return.
See notes to financial statements.
16
| | | | | | | | | | | | | | |
| | | | | | | |
| | | | |
Service Shares | | | Year Ended December 31, |
| | | 2017 | 2016 | 2015 | 2014 | 2013 |
Per Share Data ($): | | | | | | |
Net asset value, beginning of period | | 9.72 | 10.04 | 10.55 | 11.82 | 9.82 |
Investment Operations: | | | | | | |
Investment income—neta | | .17 | .13 | .17 | .16 | .16 |
Net realized and unrealized
gain (loss) on investments | | 2.54 | (.29) | (.47) | (1.28) | 2.03 |
Total from Investment Operations | | 2.71 | (.16) | (.30) | (1.12) | 2.19 |
Distributions: | | | | | | |
Dividends from
investment income—net | | (.15) | (.16) | (.21) | (.15) | (.19) |
Payment by affiliate | | .00b,c | .00b,c | - | - | - |
Net asset value, end of period | | 12.28 | 9.72 | 10.04 | 10.55 | 11.82 |
Total Return (%) | | 28.14c | (1.58)c | (2.98) | (9.57) | 22.69 |
Ratios/Supplemental Data (%): | | | | | | |
Ratio of total expenses
to average net assets | | 1.62 | 1.61 | 1.63 | 1.54 | 1.50 |
Ratio of net expenses
to average net assets | | 1.11 | 1.10 | 1.08 | 1.24 | 1.20 |
Ratio of net investment income
to average net assets | | 1.49 | 1.41 | 1.53 | 1.40 | 1.47 |
Portfolio Turnover Rate | | 62.39 | 108.21 | 147.24 | 45.43 | 57.30 |
Net Assets, end of period ($ x 1,000) | | 36,253 | 26,862 | 18,566 | 23,038 | 32,104 |
a Based on average shares outstanding.
b Amount represents less than $.01.
c The fund received proceeds from a class action settlement from The Bank of New York Mellon Corporation. This payment had no impact on total return.
See notes to financial statements.
17
NOTES TO FINANCIAL STATEMENTS
NOTE 1—Significant Accounting Policies:
International Value Portfolio (the “fund”) is a separate diversified series of Dreyfus Variable Investment Fund (the “Company”), which is registered under the Investment Company Act of 1940, as amended (the “Act”), as an open-end management investment company and operates as a series company currently offering seven series, including the fund. The fund is only offered to separate accounts established by insurance companies to fund variable annuity contracts and variable life insurance policies. The fund’s investment objective is to seek long-term capital growth. The Dreyfus Corporation (the “Manager” or “Dreyfus”), a wholly-owned subsidiary of The Bank of New York Mellon Corporation (“BNY Mellon”), serves as the fund’s investment adviser.
MBSC Securities Corporation (the “Distributor”), a wholly-owned subsidiary of Dreyfus, is the distributor of the fund’s shares, which are sold without a sales charge. The fund is authorized to issue an unlimited number of $.001 par value shares of Beneficial Interest in each of the following classes of shares: Initial and Service. Each class of shares has identical rights and privileges, except with respect to the Distribution Plan, and the expenses borne by each class, the allocation of certain transfer agency costs, and certain voting rights. Income, expenses (other than expenses attributable to a specific class), and realized and unrealized gains or losses on investments are allocated to each class of shares based on its relative net assets.
The Company accounts separately for the assets, liabilities and operations of each series. Expenses directly attributable to each series are charged to that series’ operations; expenses which are applicable to all series are allocated among them on a pro rata basis.
The Financial Accounting Standards Board (“FASB”) Accounting Standards Codification (“ASC”) is the exclusive reference of authoritative U.S. generally accepted accounting principles (“GAAP”) recognized by the FASB to be applied by nongovernmental entities. Rules and interpretive releases of the Securities and Exchange Commission (“SEC”) under authority of federal laws are also sources of authoritative GAAP for SEC registrants. The fund’s financial statements are prepared in accordance with GAAP, which may require the use of management estimates and assumptions. Actual results could differ from those estimates.
The Company enters into contracts that contain a variety of indemnifications. The fund’s maximum exposure under these arrangements is unknown. The fund does not anticipate recognizing any loss related to these arrangements.
18
(a) Portfolio valuation: The fair value of a financial instrument is the amount that would be received to sell an asset or paid to transfer a liability in an orderly transaction between market participants at the measurement date (i.e., the exit price). GAAP establishes a fair value hierarchy that prioritizes the inputs of valuation techniques used to measure fair value. This hierarchy gives the highest priority to unadjusted quoted prices in active markets for identical assets or liabilities (Level 1 measurements) and the lowest priority to unobservable inputs (Level 3 measurements).
Additionally, GAAP provides guidance on determining whether the volume and activity in a market has decreased significantly and whether such a decrease in activity results in transactions that are not orderly. GAAP requires enhanced disclosures around valuation inputs and techniques used during annual and interim periods.
Various inputs are used in determining the value of the fund’s investments relating to fair value measurements. These inputs are summarized in the three broad levels listed below:
Level 1—unadjusted quoted prices in active markets for identical investments.
Level 2—other significant observable inputs (including quoted prices for similar investments, interest rates, prepayment speeds, credit risk, etc.).
Level 3—significant unobservable inputs (including the fund’s own assumptions in determining the fair value of investments).
The inputs or methodology used for valuing securities are not necessarily an indication of the risk associated with investing in those securities.
Changes in valuation techniques may result in transfers in or out of an assigned level within the disclosure hierarchy. Valuation techniques used to value the fund’s investments are as follows:
Investments in securities are valued at the last sales price on the securities exchange or national securities market on which such securities are primarily traded. Securities listed on the National Market System for which market quotations are available are valued at the official closing price or, if there is no official closing price that day, at the last sales price. For open short positions, asked prices are used for valuation purposes. Bid price is used when no asked price is available. Registered investment companies that are not traded on an exchange are valued at their net asset value. All of the preceding securities are generally categorized within Level 1 of the fair value hierarchy.
19
NOTES TO FINANCIAL STATEMENTS (continued)
Securities not listed on an exchange or the national securities market, or securities for which there were no transactions, are valued at the average of the most recent bid and asked prices. These securities are generally categorized within Level 2 of the fair value hierarchy.
Fair valuing of securities may be determined with the assistance of a pricing service using calculations based on indices of domestic securities and other appropriate indicators, such as prices of relevant American Depository Receipts and futures. Utilizing these techniques may result in transfers between Level 1 and Level 2 of the fair value hierarchy.
When market quotations or official closing prices are not readily available, or are determined to not accurately reflect fair value, such as when the value of a security has been significantly affected by events after the close of the exchange or market on which the security is principally traded (for example, a foreign exchange or market), but before the fund calculates its net asset value, the fund may value these investments at fair value as determined in accordance with the procedures approved by the Company’s Board of Trustees (the “Board”). Certain factors may be considered when fair valuing investments such as: fundamental analytical data, the nature and duration of restrictions on disposition, an evaluation of the forces that influence the market in which the securities are purchased and sold, and public trading in similar securities of the issuer or comparable issuers. These securities are either categorized within Level 2 or 3 of the fair value hierarchy depending on the relevant inputs used.
For restricted securities where observable inputs are limited, assumptions about market activity and risk are used and are generally categorized within Level 3 of the fair value hierarchy.
Investments denominated in foreign currencies are translated to U.S. dollars at the prevailing rates of exchange.
Forward foreign currency exchange contracts (“forward contracts”) are valued at the forward rate and are generally categorized within Level 2 of the fair value hierarchy.
The following is a summary of the inputs used as of December 31, 2017 in valuing the fund’s investments:
20
| | | | | | | | |
| | Level 1 - Unadjusted Quoted Prices | Level 2 - Other Significant Observable Inputs | Level 3 -Significant Unobservable Inputs | Total |
Assets ($) | | | |
Investments in Securities: | | | |
Equity Securities - Foreign Common Stocks | - | 56,869,688 | † | - | 56,869,688 |
Exchange-Traded Funds | 1,049,447 | - | - | 1,049,447 |
Registered Investment Company | 243,064 | - | | - | 243,064 |
Other Financial Instruments: | | | | |
Forward Foreign Currency
Exchange Contracts†† | - | 26 | | - | 26 |
† Securities classified within Level 2 at period end as the values were determined pursuant to the fund’s fair valuation procedures.
†† Amount shown represents unrealized appreciation at period end.
At December 31, 2017, the amount of securities transferred between levels equals fair value of exchange traded equity securities reported as Level 2 in the table above. It is the fund’s policy to recognize transfers between levels at the end of the reporting period.
(b) Foreign currency transactions: The fund does not isolate that portion of the results of operations resulting from changes in foreign exchange rates on investments from the fluctuations arising from changes in the market prices of securities held. Such fluctuations are included with the net realized and unrealized gain or loss on investments.
Net realized foreign exchange gains or losses arise from sales of foreign currencies, currency gains or losses realized on securities transactions between trade and settlement date, and the difference between the amounts of dividends, interest and foreign withholding taxes recorded on the fund’s books and the U.S. dollar equivalent of the amounts actually received or paid. Net unrealized foreign exchange gains and losses arise from changes in the value of assets and liabilities other than investments resulting from changes in exchange rates. Foreign currency gains and losses on foreign currency transactions are also included with net realized and unrealized gain or loss on investments.
(c) Securities transactions and investment income: Securities transactions are recorded on a trade date basis. Realized gains and losses from securities transactions are recorded on the identified cost basis. Dividend income is recognized on the ex-dividend date and interest income, including, where applicable, accretion of discount and
21
NOTES TO FINANCIAL STATEMENTS (continued)
amortization of premium on investments, is recognized on the accrual basis.
(d) Affiliated issuers: Investments in other investment companies advised by Dreyfus are defined as “affiliated” under the Act.
(e) Risk: Investing in foreign markets may involve special risks and considerations not typically associated with investing in the U.S. These risks include revaluation of currencies, high rates of inflation, repatriation restrictions on income and capital, and adverse political and economic developments. Moreover, securities issued in these markets may be less liquid, subject to government ownership controls and delayed settlements, and their prices may be more volatile than those of comparable securities in the U.S.
(f) Dividends and distributions to shareholders: Dividends and distributions are recorded on the ex-dividend date. Dividends from investment income-net and dividends from net realized capital gains, if any, are normally declared and paid annually, but the fund may make distributions on a more frequent basis to comply with the distribution requirements of the Internal Revenue Code of 1986, as amended (the “Code”). To the extent that net realized capital gains can be offset by capital loss carryovers, it is the policy of the fund not to distribute such gains. Income and capital gain distributions are determined in accordance with income tax regulations, which may differ from GAAP.
(g) Federal income taxes: It is the policy of the fund to continue to qualify as a regulated investment company, if such qualification is in the best interests of its shareholders, by complying with the applicable provisions of the Code, and to make distributions of taxable income sufficient to relieve it from substantially all federal income and excise taxes.
As of and during the period ended December 31, 2017, the fund did not have any liabilities for any uncertain tax positions. The fund recognizes interest and penalties, if any, related to uncertain tax positions as income tax expense in the Statement of Operations. During the period ended December 31, 2017, the fund did not incur any interest or penalties.
Each tax year in the four-year period ended December 31, 2017 remains subject to examination by the Internal Revenue Service and state taxing authorities.
At December 31, 2017, the components of accumulated earnings on a tax basis were as follows: undistributed ordinary income $836,598, accumulated capital losses $16,716,592 and unrealized appreciation $8,244,628.
22
Under the Regulated Investment Company Modernization Act of 2010, the fund is permitted to carry forward capital losses for an unlimited period. Furthermore, capital loss carryovers retain their character as either short-term or long-term capital losses.
The accumulated capital loss carryover is available for federal income tax purposes to be applied against future net realized capital gains, if any, realized subsequent to December 31, 2017. The fund has $16,716,592 of long-term capital losses which can be carried forward for an unlimited period.
The tax character of distributions paid to shareholders during the fiscal periods ended December 31, 2017 and December 31, 2016 were as follows: ordinary income $687,930 and $665,512, respectively.
During the period ended December 31, 2017, as a result of permanent book to tax differences, primarily due to the tax treatment for foreign currency gains and losses, class action settlement, capital loss carryover expiration and passive foreign investment companies, the fund increased accumulated undistributed investment income-net by $18,000, increased accumulated net realized gain (loss) on investments by $21,622,693 and decreased paid-in capital by $21,640,693. Net assets and net asset value per share were not affected by this reclassification.
NOTE 2—Bank Lines of Credit:
The fund participates with other Dreyfus-managed funds in an $830 million unsecured credit facility led by Citibank, N.A. and a $300 million unsecured credit facility provided by The Bank of New York Mellon, a subsidiary of BNY Mellon and an affiliate of Dreyfus (each, a “Facility”), each to be utilized primarily for temporary or emergency purposes, including the financing of redemptions. Prior to October 4, 2017, the unsecured credit facility with Citibank, N.A. was $810 million. In connection therewith, the fund has agreed to pay its pro rata portion of commitment fees for each Facility. Interest is charged to the fund based on rates determined pursuant to the terms of the respective Facility at the time of borrowing. During the period ended December 31, 2017, the fund did not borrow under the Facilities.
NOTE 3—Investment Advisory Fee and Other Transactions with Affiliates:
(a) Pursuant to an investment advisory agreement with Dreyfus, the investment advisory fee is computed at the annual rate of 1% of the value of the fund’s average daily net assets and is payable monthly. Dreyfus has contractually agreed, from January 1, 2017 through May 1, 2018, to waive
23
NOTES TO FINANCIAL STATEMENTS (continued)
receipt of its fees and/or assume the direct expenses of the fund, so that the expenses of none of the classes (excluding Rule 12b-1 Distribution Plan fees, taxes, interest expense, brokerage commissions, commitment fees on borrowings and extraordinary expenses) exceed .86% of the value of the fund’s average daily net assets. The reduction in expenses, pursuant to the undertaking, amounted to $264,641 during the period ended December 31, 2017.
(b) Under the Distribution Plan adopted pursuant to Rule 12b-1 under the Act, Service shares pay the Distributor for distributing its shares, for servicing and/or maintaining Service shares’ shareholder accounts and for advertising and marketing for Service shares. The Distribution Plan provides for payments to be made at an annual rate of .25% of the value of the Service shares’ average daily net assets. The Distributor may make payments to Participating Insurance Companies and to brokers and dealers acting as principal underwriter for their variable insurance products. The fees payable under the Distribution Plan are payable without regard to actual expenses incurred. During the period ended December 31, 2017, Service shares were charged $78,054 pursuant to the Distribution Plan.
The fund has arrangements with the transfer agent and the custodian whereby the fund may receive earnings credits when positive cash balances are maintained, which are used to offset transfer agency and custody fees. For financial reporting purposes, the fund includes net earnings credits as an expense offset in the Statement of Operations.
The fund compensates Dreyfus Transfer, Inc., a wholly-owned subsidiary of Dreyfus, under a transfer agency agreement for providing transfer agency and cash management services for the fund. The majority of transfer agency fees are comprised of amounts paid on a per account basis, while cash management fees are related to fund subscriptions and redemptions. During the period ended December 31, 2017, the fund was charged $1,739 for transfer agency services and $62 for cash management services. These fees are included in Shareholder servicing costs in the Statement of Operations. Cash management fees were offset by earnings credits of $62.
The fund compensates The Bank of New York Mellon under a custody agreement for providing custodial services for the fund. These fees are determined based on net assets, geographic region and transaction activity. During the period ended December 31, 2017, the fund was charged $62,685 pursuant to the custody agreement.
24
During the period ended December 31, 2017, the fund was charged $11,202 for services performed by the Chief Compliance Officer and his staff.
The components of “Due to The Dreyfus Corporation and affiliates” in the Statement of Assets and Liabilities consist of: investment advisory fees $48,023, Distribution Plan fees $7,366, custodian fees $13,071, Chief Compliance Officer fees $8,406 and transfer agency fees $135, which are offset against an expense reimbursement currently in effect in the amount of $24,640.
(c) Each Board member also serves as a Board member of other funds within the Dreyfus complex. Annual retainer fees and attendance fees are allocated to each fund based on net assets.
(d) During the period ended December 31, 2017, the fund received proceeds of $1,201 from a class action settlement from BNY Mellon related to foreign exchange transactions.
NOTE 4—Securities Transactions:
The aggregate amount of purchases and sales of investment securities, excluding short-term securities and forward contracts, during the period ended December 31, 2017, amounted to $34,163,431 and $31,912,816, respectively.
Derivatives: A derivative is a financial instrument whose performance is derived from the performance of another asset. The fund enters into International Swaps and Derivatives Association, Inc. Master Agreements or similar agreements (collectively, “Master Agreements”) with its over-the counter (“OTC”) derivative contract counterparties in order to, among other things, reduce its credit risk to counterparties. Master Agreements include provisions for general obligations, representations, collateral and events of default or termination. Under a Master Agreement, the fund may offset with the counterparty certain derivative financial instrument’s payables and/or receivables with collateral held and/or posted and create one single net payment in the event of default or termination.
Each type of derivative instrument that was held by the fund during the period ended December 31, 2017 is discussed below.
Forward Foreign Currency Exchange Contracts: The fund enters into forward contracts in order to hedge its exposure to changes in foreign currency exchange rates on its foreign portfolio holdings, to settle foreign currency transactions or as a part of its investment strategy. When executing forward contracts, the fund is obligated to buy or sell a foreign currency at a specified rate on a certain date in the future. With respect to
25
NOTES TO FINANCIAL STATEMENTS (continued)
sales of forward contracts, the fund incurs a loss if the value of the contract increases between the date the forward contract is opened and the date the forward contract is closed. The fund realizes a gain if the value of the contract decreases between those dates. With respect to purchases of forward contracts, the fund incurs a loss if the value of the contract decreases between the date the forward contract is opened and the date the forward contract is closed. The fund realizes a gain if the value of the contract increases between those dates. Any realized or unrealized gains or losses which occurred during the period are reflected in the Statement of Operations. The fund is exposed to foreign currency risk as a result of changes in value of underlying financial instruments. The fund is also exposed to credit risk associated with counterparty nonperformance on these forward contracts, which is generally limited to the unrealized gain on each open contract. This risk may be mitigated by Master Agreements, if any, between the fund and the counterparty and the posting of collateral, if any, by the counterparty to the fund to cover the fund’s exposure to the counterparty. Forward contracts open at December 31, 2017 are set forth in the Statement of Forward Foreign Currency Exchange Contracts.
The provisions of ASC Topic 210 “Disclosures about Offsetting Assets and Liabilities” require disclosure on the offsetting of financial assets and liabilities. These disclosures are required for certain investments, including derivative financial instruments subject to Master Agreements which are eligible for offsetting in the Statement of Assets and Liabilities and require the fund to disclose both gross and net information with respect to such investments. For financial reporting purposes, the fund does not offset derivative assets and derivative liabilities that are subject to Master Agreements in the Statement of Assets and Liabilities.
At December 31, 2017, derivative assets and liabilities (by type) on a gross basis are as follows:
| | | | | | |
Derivative Financial Instruments: | | Assets ($) | | Liabilities ($) | |
Forward contracts | | 26 | | - | |
Total gross amount of derivative | | | | | |
assets and liabilities in the | | | | | |
Statement of Assets and Liabilities | | 26 | | - | |
Derivatives not subject to | | | | | |
Master Agreements | | - | | - | |
Total gross amount of assets | | | | | |
and liabilities subject to | | | | | |
Master Agreements | | 26 | | - | |
The following table presents derivative assets net of amounts available for offsetting under Master Agreements and net of related collateral received or pledged, if any, as of December 31, 2017:
26
| | | | | | | |
| | | | Financial | | | |
| | | | Instruments | | | |
| | | | and Derivatives | | | |
| | Gross Amount of | | Available | Collateral | | Net Amount of |
Counterparty | Assets ($) | 1 | for Offset ($) | Received ($) | | Assets ($) |
Barclays Bank | 26 | | - | - | | 26 |
| | | | | | | |
| | | | | | | |
1 Absent a default event or early termination, OTC derivative assets and liabilities are presented at gross amounts and are not offset in the Statement of Assets and Liabilities. |
The following summarizes the average market value of derivatives outstanding during the period ended December 31, 2017:
| | | |
| | Average Market Value ($) |
Forward contracts | | 583,648 |
| | | |
At December 31, 2017, the cost of investments for federal income tax purposes was $49,919,539; accordingly, accumulated net unrealized appreciation on investments inclusive of derivative contracts was $8,242,686, consisting of $9,345,981 gross unrealized appreciation and $1,103,295 gross unrealized depreciation.
27
REPORT OF INDEPENDENT REGISTERED PUBLIC ACCOUNTING FIRM
To the Shareholders and the Board of Trustees of Dreyfus Variable Investment Fund, International Value Portfolio
Opinion on the Financial Statements
We have audited the accompanying statement of assets and liabilities of Dreyfus Variable Investment Fund, International Value Portfolio (one of the series comprising Dreyfus Variable Investment Fund) (the “Fund”), including the statements of investments and investments in affiliated issuers, as of December 31, 2017, and the related statement of operations for the year then ended, the statements of changes in net assets for each of the two years in the period then ended, the financial highlights for each of the five years in the period then ended and the related notes (collectively referred to as the “financial statements”). In our opinion, the financial statements present fairly, in all material respects, the financial position of Dreyfus Variable Investment Fund, International Value Portfolio at December 31, 2017, the results of its operations for the year then ended, the changes in its net assets for each of the two years in the period then ended and its financial highlights for each of the five years in the period then ended, in conformity with U.S. generally accepted accounting principles.
Basis for opinion
These financial statements are the responsibility of the Fund’s management. Our responsibility is to express an opinion on the Fund’s financial statements based on our audits. We are a public accounting firm registered with the Public Company Accounting Oversight Board (United States) (“PCAOB”) and are required to be independent with respect to the Fund in accordance with the U.S. federal securities laws and the applicable rules and regulations of the Securities and Exchange Commission and the PCAOB.
We conducted our audits in accordance with the standards of the PCAOB. Those standards require that we plan and perform the audit to obtain reasonable assurance about whether the financial statements are free of material misstatement, whether due to error or fraud. The Fund is not required to have, nor were we engaged to perform, an audit of the Fund’s internal control over financial reporting. As part of our audits, we are required to obtain an understanding of internal control over financial reporting, but not for the purpose of expressing an opinion on the effectiveness of the Fund’s internal control over financial reporting. Accordingly, we express no such opinion.
Our audits included performing procedures to assess the risks of material misstatement of the financial statements, whether due to error or fraud, and performing procedures that respond to those risks. Such procedures included examining, on a test basis, evidence regarding the amounts and disclosures in the financial statements. Our procedures included confirmation of securities owned as of December 31, 2017, by correspondence with the custodian and others or by other appropriate auditing procedures where replies were not received. Our audits also included evaluating the accounting principles used and significant estimates made by management, as well as evaluating the overall presentation of the financial statements. We believe that our audits provide a reasonable basis for our opinion.

We have served as the auditor of one or more Dreyfus investment companies since at least 1957, but we are unable to determine the specific year.
New York, New York
February 09, 2018
28
IMPORTANT TAX INFORMATION (Unaudited)
In accordance with federal tax law, the fund elects to provide each shareholder with their portion of the fund’s foreign taxes paid and the income sourced from foreign countries. Accordingly, the fund hereby reports the following information regarding its fiscal year ended December 31, 2017:
- the total amount of taxes paid to foreign countries was $136,781.
- the total amount of income sourced from foreign countries was $1,455,260.
Where required by federal tax law rules, shareholders will receive notification of their proportionate share of foreign taxes paid and foreign sourced income for the 2017 calendar year with Form 1099-DIV which will be mailed in early 2018.
29
INFORMATION ABOUT THE RENEWAL OF THE FUND’S INVESTMENT ADVISORY AGREEMENT (Unaudited)
At a meeting of the fund’s Board of Trustees held on July 18, 2017, the Board considered the renewal of the fund’s Investment Advisory Agreement pursuant to which Dreyfus provides the fund with investment advisory and administrative services (the “Agreement”). The Board members, none of whom are “interested persons” (as defined in the Investment Company Act of 1940, as amended) of the fund, were assisted in their review by independent legal counsel and met with counsel in executive session separate from Dreyfus representatives. In considering the renewal of the Agreement, the Board considered all factors that it believed to be relevant, including those discussed below. The Board did not identify any one factor as dispositive, and each Board member may have attributed different weights to the factors considered.
Analysis of Nature, Extent, and Quality of Services Provided to the Fund. The Board considered information provided to them at the meeting and in previous presentations from Dreyfus representatives regarding the nature, extent, and quality of the services provided to funds in the Dreyfus fund complex. Dreyfus provided the number of open accounts in the fund, the fund’s asset size and the allocation of fund assets among distribution channels. Dreyfus also had previously provided information regarding the diverse intermediary relationships and distribution channels of funds in the Dreyfus fund complex (such as retail direct or intermediary, in which intermediaries typically are paid by the fund and/or Dreyfus) and Dreyfus’ corresponding need for broad, deep, and diverse resources to be able to provide ongoing shareholder services to each intermediary or distribution channel, as applicable to the fund.
The Board also considered research support available to, and portfolio management capabilities of, the fund’s portfolio management personnel and that Dreyfus also provides oversight of day-to-day fund operations, including fund accounting and administration and assistance in meeting legal and regulatory requirements. The Board also considered Dreyfus’ extensive administrative, accounting and compliance infrastructures. The Board also considered portfolio management’s brokerage policies and practices (including policies and practices regarding soft dollars) and the standards applied in seeking best execution.
Comparative Analysis of the Fund’s Performance and Management Fee and Expense Ratio. The Board reviewed reports prepared by Broadridge Financial Solutions, Inc. (“Broadridge”), an independent provider of investment company data, which included information comparing (1) the fund’s performance with the performance of a group of comparable funds (the “Performance Group”) and with a broader group of funds (the “Performance Universe”), all for various periods ended May 31, 2017, and (2) the fund’s actual and contractual management fees and total expenses with those of a group of comparable funds (the “Expense Group”) and with a broader group of funds (the “Expense Universe”), the information for which was derived in part from fund financial statements available to Broadridge as of the date of its analysis. Dreyfus previously had furnished the Board with a description of the methodology Broadridge used to select the Performance Group and Performance Universe and the Expense Group and Expense Universe.
30
Dreyfus representatives stated that the usefulness of performance comparisons may be affected by a number of factors, including different investment limitations that may be applicable to the fund and comparison funds. The Board discussed with representatives of Dreyfus and/or its affiliates the results of the comparisons and considered that the fund’s total return performance was below the Performance Group and Performance Universe medians for all periods. Dreyfus also provided a comparison of the fund’s calendar year total returns to the returns of the fund’s benchmark index. Dreyfus representatives reviewed the fund’s recent short-term performance, which had shown improvement relative to the Performance Universe.
The Board had discussed with representatives of Dreyfus and its affiliates the investment strategy employed in the management of the fund’s assets and how that strategy affected the fund’s relative performance. The Board members also considered that the portfolio management team is relatively new to the fund.
The Board also reviewed the range of actual and contractual management fees and total expenses of the Expense Group and Expense Universe funds and discussed the results of the comparisons. The Board considered that the fund’s contractual management fee was above the Expense Group median and the fund’s actual management fee (second lowest in the Expense Group and Expense Universe) and total expenses were below the Expense Group and Expense Universe medians.
Dreyfus representatives stated that Dreyfus has contractually agreed to waive receipt of its fees and/or assume the direct expenses of the fund, until May 1, 2018, so that the expenses of none of its classes (excluding Rule 12b-1 fees, shareholder services fees, taxes, interest, brokerage commissions, commitment fees on borrowings and extraordinary expenses) exceed .86%.
Dreyfus representatives reviewed with the Board the management or investment advisory fees (1) paid by funds advised or administered by Dreyfus that are in the same Broadridge category as the fund and (2) paid to Dreyfus or the Dreyfus-affiliated primary employer of the fund’s primary portfolio manager(s) for advising any separate accounts and/or other types of client portfolios that are considered to have similar investment strategies and policies as the fund (the “Similar Clients”), and explained the nature of the Similar Clients. They discussed differences in fees paid and the relationship of the fees paid in light of any differences in the services provided and other relevant factors. The Board considered the relevance of the fee information provided for the Similar Clients to evaluate the appropriateness of the fund’s management fee.
Analysis of Profitability and Economies of Scale. Dreyfus representatives reviewed the expenses allocated and profit received by Dreyfus and its affiliates and the resulting profitability percentage for managing the fund and the aggregate profitability percentage to Dreyfus and its affiliates for managing the funds in the Dreyfus fund complex, and the method used to determine the expenses and profit. The Board concluded that the profitability results were not unreasonable, given the services rendered and service levels provided by Dreyfus. The Board also considered the expense limitation arrangement and its effect on the profitability of Dreyfus and its affiliates. The Board also had been
31
INFORMATION ABOUT THE RENEWAL OF THE FUND’S INVESTMENT ADVISORY AGREEMENT (Unaudited) (continued)
provided with information prepared by an independent consulting firm regarding Dreyfus’ approach to allocating costs to, and determining the profitability of, individual funds and the entire Dreyfus fund complex. The consulting firm also had analyzed where any economies of scale might emerge in connection with the management of a fund.
The Board considered, on the advice of its counsel, the profitability analysis (1) as part of its evaluation of whether the fees under the Agreement, considered in relation to the mix of services provided by Dreyfus, including the nature, extent and quality of such services, supported the renewal of the Agreement and (2) in light of the relevant circumstances for the fund and the extent to which economies of scale would be realized if the fund grows and whether fee levels reflect these economies of scale for the benefit of fund shareholders. Dreyfus representatives stated that a discussion of economies of scale is predicated on a fund having achieved a substantial size with increasing assets and that, if a fund’s assets had been stable or decreasing, the possibility that Dreyfus may have realized any economies of scale would be less. Dreyfus representatives also stated that, as a result of shared and allocated costs among funds in the Dreyfus fund complex, the extent of economies of scale could depend substantially on the level of assets in the complex as a whole, so that increases and decreases in complex-wide assets can affect potential economies of scale in a manner that is disproportionate to, or even in the opposite direction from, changes in the fund’s asset level. The Board also considered potential benefits to Dreyfus from acting as investment adviser and took into consideration the soft dollar arrangements in effect for trading the fund’s investments.
At the conclusion of these discussions, the Board agreed that it had been furnished with sufficient information to make an informed business decision with respect to the renewal of the Agreement. Based on the discussions and considerations as described above, the Board concluded and determined as follows.
· The Board concluded that the nature, extent and quality of the services provided by Dreyfus are adequate and appropriate.
· The Board expressed concern about the fund’s relative performance and agreed to closely monitor performance and to approve renewal of the Agreement through March 31, 2018.
· The Board concluded that the fee paid to Dreyfus continued to be appropriate under the circumstances and in light of the factors and the totality of the services provided as discussed above, subject to review no later than the next renewal consideration.
· The Board determined that the economies of scale which may accrue to Dreyfus and its affiliates in connection with the management of the fund had been adequately considered by Dreyfus in connection with the fee rate charged to the fund pursuant to the Agreement and that, to the extent in the future it were determined that material economies of scale had not been shared with the
32
fund, the Board would seek to have those economies of scale shared with the fund.
In evaluating the Agreement, the Board considered these conclusions and determinations and also relied on its previous knowledge, gained through meetings and other interactions with Dreyfus and its affiliates, of Dreyfus and the services provided to the fund by Dreyfus. The Board also relied on information received on a routine and regular basis throughout the year relating to the operations of the fund and the investment management and other services provided under the Agreement, including information on the investment performance of the fund in comparison to similar mutual funds and benchmark performance indices; general market outlook as applicable to the fund; and compliance reports. In addition, the Board’s consideration of the contractual fee arrangements for this fund had the benefit of a number of years of reviews of the Agreement for the fund, or substantially similar agreements for other Dreyfus funds that the Board oversees, during which lengthy discussions took place between the Board and Dreyfus representatives. Certain aspects of the arrangements may receive greater scrutiny in some years than in others, and the Board’s conclusions may be based, in part, on their consideration of the fund’s arrangements, or similar arrangements for other Dreyfus funds that the Board oversees, in prior years. The Board determined to renew the Agreement through March 31, 2018.
33
BOARD MEMBERS INFORMATION (Unaudited)
INDEPENDENT BOARD MEMBERS
Joseph S. DiMartino (74)
Chairman of the Board (1995)
Principal Occupation During Past 5 Years:
· Corporate Director and Trustee (1995-present)
Other Public Company Board Memberships During Past 5 Years:
· CBIZ (formerly, Century Business Services, Inc.), a provider of outsourcing functions for small and medium size companies, Director (1997-present)
No. of Portfolios for which Board Member Serves: 127
———————
Peggy C. Davis (74)
Board Member (2006)
Principal Occupation During Past 5 Years:
· Shad Professor of Law, New York University School of Law (1983-present)
No. of Portfolios for which Board Member Serves: 46
———————
David P. Feldman (78)
Board Member (1994)
Principal Occupation During Past 5 Years:
· Corporate Director and Trustee (1985-present)
Other Public Company Board Memberships During Past 5 Years:
· BBH Mutual Funds Group (5 registered mutual funds), Director (1992-2014)
No. of Portfolios for which Board Member Serves: 32
———————
Joan Gulley (70)
Board Member (2017)
Principal Occupation During Past 5 Years:
· PNC Financial Services Group, Inc.(1993-2014), Executive Vice President and Chief Human Resources Officer and Executive Committee Member (2008-2014)
No. of Portfolios for which Board Member Serves: 54
———————
34
Ehud Houminer (77)
Board Member (2006)
Principal Occupation During Past 5 Years:
· Board of Overseers at the Columbia Business School, Columbia University (1992-present)
· Trustee, Ben Gurion University
Other Public Company Board Memberships During Past 5 Years:
· Avnet, Inc., an electronics distributor, Director (1993-2012)
No. of Portfolios for which Board Member Serves: 54
———————
Lynn Martin (78)
Board Member (2012)
Principal Occupation During Past 5 Years:
· President of The Martin Hall Group LLC, a human resources consulting firm (2005-2012)
Other Public Company Board Memberships During Past 5 Years:
· AT&T, Inc., a telecommunications company, Director (1999-2012)
· Ryder System, Inc., a supply chain and transportation management company, Director (1993-2012)
No. of Portfolios for which Board Member Serves: 32
———————
Robin A. Melvin (54)
Board Member (2012)
Principal Occupation During Past 5 Years:
· Co-chairman, Illinois Mentoring Partnership, non-profit organization dedicated to increasing the quantity and quality of mentoring services in Illinois; (2014-present; board member since 2013)
· Director, Boisi Family Foundation, a private family foundation that supports youth-serving organizations that promote the self sufficiency of youth from disadvantaged circumstances (1995-2012)
No. of Portfolios for which Board Member Serves: 101
———————
35
BOARD MEMBERS INFORMATION (Unaudited) (continued)
INDEPENDENT BOARD MEMBERS (continued)
Dr. Martin Peretz (78)
Board Member (1990)
Principal Occupation During Past 5 Years:
· Editor-in-Chief Emeritus of The New Republic Magazine (2011-2012) (previously,
Editor-in-Chief, 1974-2011)
· Lecturer at Harvard University (1969-2012)
No. of Portfolios for which Board Member Serves: 32
———————
Once elected all Board Members serve for an indefinite term, but achieve Emeritus status upon reaching age 80. The address of the Board Members and Officers is c/o The Dreyfus Corporation, 200 Park Avenue, New York, New York 10166. Additional information about the Board Members is available in the fund’s Statement of Additional Information which can be obtained from Dreyfus free of charge by calling this toll free number: 1-800-DREYFUS.
James F. Henry, Emeritus Board Member
Philip L. Toia, Emeritus Board Member
36
OFFICERS OF THE FUND (Unaudited)
BRADLEY J. SKAPYAK, President since January 2010.
Chief Operating Officer and a director of the Manager since June 2009, Chairman of Dreyfus Transfer, Inc., an affiliate of the Manager and the transfer agent of the funds, since May 2011 and Chief Executive Officer of MBSC Securities Corporation since August 2016. He is an officer of 63 investment companies (comprised of 127 portfolios) managed by the Manager. He is 59 years old and has been an employee of the Manager since February 1988.
BENNETT A. MACDOUGALL, Chief Legal Officer since October 2015.
Chief Legal Officer of the Manager and Associate General Counsel and Managing Director of BNY Mellon since June 2015; from June 2005 to June 2015, he served in various capacities with Deutsche Bank – Asset & Wealth Management Division, including as Director and Associate General Counsel, and Chief Legal Officer of Deutsche Investment Management Americas Inc. from June 2012 to May 2015. He is an officer of 64 investment companies (comprised of 152 portfolios) managed by the Manager. He is 46 years old and has been an employee of the Manager since June 2015.
JANETTE E. FARRAGHER, Vice President and Secretary since December 2011.
Associate General Counsel of BNY Mellon, and an officer of 64 investment companies (comprised of 152 portfolios) managed by the Manager. She is 55 years old and has been an employee of the Manager since February 1984.
JAMES BITETTO, Vice President and Assistant Secretary since August 2005.
Managing Counsel of BNY Mellon and Secretary of the Manager, and an officer of 64 investment companies (comprised of 152 portfolios) managed by the Manager. He is 51 years old and has been an employee of the Manager since December 1996.
JOSEPH M. CHIOFFI, Vice President and Assistant Secretary since August 2005.
Managing Counsel of BNY Mellon, and an officer of 64 investment companies (comprised of 152 portfolios) managed by the Manager. He is 56 years old and has been an employee of the Manager since June 2000.
MAUREEN E. KANE, Vice President and Assistant Secretary since April 2015.
Managing Counsel of BNY Mellon since July 2014; from October 2004 until July 2014, General Counsel, and from May 2009 until July 2014, Chief Compliance Officer of Century Capital Management. She is an officer of 64 investment companies (comprised of 152 portfolios) managed by the Manager. She is 55 years old and has been an employee of the Manager since July 2014.
SARAH S. KELLEHER, Vice President and Assistant Secretary since April 2014.
Senior Counsel of BNY Mellon since March 2013, from August 2005 to March 2013, Associate General Counsel of Third Avenue Management. She is an officer of 64 investment companies (comprised of 152 portfolios) managed by the Manager. She is 42 years old and has been an employee of the Manager since March 2013.
JEFF PRUSNOFSKY, Vice President and Assistant Secretary since August 2005.
Senior Managing Counsel of BNY Mellon, and an officer of 64 investment companies (comprised of 152 portfolios) managed by the Manager. He is 52 years old and has been an employee of the Manager since October 1990.
NATALYA ZELENSKY, Vice President and Assistant Secretary since March 2017.
Counsel and Vice President of BNY Mellon since May 2016; Attorney at Wildermuth Endowment Strategy Fund/Wildermuth Advisory, LLC from November 2015 until May 2016; Assistant General Counsel at RCS Advisory Services from July 2014 until November 2015; Associate at Sutherland, Asbill & Brennan from January 2013 until January 2014; Associate at K&L Gates from October 2011 until January 2013. She is an officer of 64 investment companies (comprised of 152 portfolios) managed by Dreyfus. She is 32 years old and has been an employee of the Manager since May 2016.
JAMES WINDELS, Treasurer since November 2001.
Director – Mutual Fund Accounting of the Manager, and an officer of 64 investment companies (comprised of 152 portfolios) managed by the Manager. He is 59 years old and has been an employee of the Manager since April 1985.
37
OFFICERS OF THE FUND (Unaudited) (continued)
RICHARD CASSARO, Assistant Treasurer since January 2008.
Senior Accounting Manager – Money Market and Municipal Bond Funds of the Manager, and an officer of 64 investment companies (comprised of 152 portfolios) managed by the Manager. He is 58 years old and has been an employee of the Manager since September 1982.
GAVIN C. REILLY, Assistant Treasurer since December 2005.
Tax Manager of the Investment Accounting and Support Department of the Manager, and an officer of 64 investment companies (comprised of 152 portfolios) managed by the Manager. He is 49 years old and has been an employee of the Manager since April 1991.
ROBERT S. ROBOL, Assistant Treasurer since August 2005.
Senior Accounting Manager – Dreyfus Financial Reporting of the Manager, and an officer of 64 investment companies (comprised of 152 portfolios) managed by the Manager. He is 53 years old and has been an employee of the Manager since October 1988.
ROBERT SALVIOLO, Assistant Treasurer since July 2007.
Senior Accounting Manager – Equity Funds of the Manager, and an officer of 64 investment companies (comprised of 152 portfolios) managed by the Manager. He is 50 years old and has been an employee of the Manager since June 1989.
ROBERT SVAGNA, Assistant Treasurer since December 2002.
Senior Accounting Manager – Fixed Income and Equity Funds of the Manager, and an officer of 64 investment companies (comprised of 152 portfolios) managed by the Manager. He is 50 years old and has been an employee of the Manager since November 1990.
JOSEPH W. CONNOLLY, Chief Compliance Officer since October 2004.
Chief Compliance Officer of the Manager and The Dreyfus Family of Funds (64 investment companies, comprised of 152 portfolios). He is 60 years old and has served in various capacities with the Manager since 1980, including manager of the firm’s Fund Accounting Department from 1997 through October 2001.
CARIDAD M. CAROSELLA, Anti-Money Laundering Compliance Officer since January 2016.
Anti-Money Laundering Compliance Officer of the Dreyfus Family of Funds and BNY Mellon Funds Trust since January 2016; from May 2015 to December 2015, Interim Anti-Money Laundering Compliance Officer of the Dreyfus Family of Funds and BNY Mellon Funds Trust and the Distributor; from January 2012 to May 2015, AML Surveillance Officer of the Distributor and from 2007 to December 2011, Financial Processing Manager of the Distributor. She is an officer of 58 investment companies (comprised of 146 portfolios) managed by the Manager. She is 49 years old and has been an employee of the Distributor since 1997.
38
NOTES
39
NOTES
40
NOTES
41
Dreyfus Variable Investment Fund, International Value Portfolio
200 Park Avenue
New York, NY 10166
Investment Adviser
The Dreyfus Corporation
200 Park Avenue
New York, NY 10166
Custodian
The Bank of New York Mellon
225 Liberty Street
New York, NY 10286
Transfer Agent &
Dividend Disbursing Agent
Dreyfus Transfer, Inc.
200 Park Avenue
New York, NY 10166
Distributor
MBSC Securities Corporation
200 Park Avenue
New York, NY 10166
Telephone 1-800-258-4260 or 1-800-258-4261
Mail The Dreyfus Family of Funds, 144 Glenn Curtiss Boulevard, Uniondale, NY 11556-0144 Attn: Institutional Services Department
E-mail Send your request to info@dreyfus.com
Internet Information can be viewed online or downloaded at www.dreyfus.com
The fund files its complete schedule of portfolio holdings with the Securities and Exchange Commission (“SEC”) for the first and third quarters of each fiscal year on Form N-Q. The fund’s Forms N-Q are available on the SEC’s website at http://www.sec.gov and may be reviewed and copied at the SEC’s Public Reference Room in Washington, D.C. Information on the operation of the Public Reference Room may be obtained by calling 1-800-SEC-0330.
A description of the policies and procedures that the fund uses to determine how to vote proxies relating to portfolio securities, and information regarding how the fund voted these proxies for the most recent 12-month period ended June 30 is available at http://www.dreyfus.com and on the SEC’s website at http://www.sec.gov. The description of the policies and procedures is also available without charge, upon request, by calling 1-800-DREYFUS.
| | |
© 2018 MBSC Securities Corporation
0152AR1217 | 
|
Dreyfus Variable Investment Fund, Opportunistic Small Cap Portfolio
| | | |

| | ANNUAL REPORT
December 31, 2017 |
| |
The views expressed in this report reflect those of the portfolio manager(s) only through the end of the period covered and do not necessarily represent the views of Dreyfus or any other person in the Dreyfus organization. Any such views are subject to change at any time based upon market or other conditions and Dreyfus disclaims any responsibility to update such views. These views may not be relied on as investment advice and, because investment decisions for a Dreyfus fund are based on numerous factors, may not be relied on as an indication of trading intent on behalf of any Dreyfus fund. |
| |
Not FDIC-Insured • Not Bank-Guaranteed • May Lose Value |
Contents
THE FUND
FOR MORE INFORMATION
Back Cover
| | | | |
| |
Dreyfus Variable Investment Fund, Opportunistic Small Cap Portfolio
| | The Fund |
A LETTER FROM THE PRESIDENT OF DREYFUS
Dear Shareholder:
We are pleased to present this annual report for Dreyfus Variable Investment Fund, Opportunistic Small Cap Portfolio, covering the 12-month period from January 1, 2017 through December 31, 2017. For information about how the fund performed during the reporting period, as well as general market perspectives, we provide a Discussion of Fund Performance on the pages that follow.
Stocks set a series of new record highs and bonds produced modestly positive results during 2017. Financial markets early in the year were dominated by the inauguration of a new U.S. president, as equities and corporate-backed bonds surged higher in anticipation of more business-friendly regulatory, tax, and fiscal policies. U.S. and international stocks continued to rally in the spring as corporate earnings grew and global economic conditions improved. Later in the year, the passage of tax reform legislation fueled additional stock market gains.
Despite three short-term interest rate hikes and concerns early in the year that inflation might accelerate in a growing economy, bonds generally produced positive total returns in 2017. Corporate-backed securities and municipal bonds fared particularly well.
The markets’ strong performance last year was supported by solid underlying fundamentals, including sustained economic growth, a robust labor market, and low inflation. We currently expect these favorable conditions to persist in 2018, but we remain watchful for economic and political developments that could negatively impact the markets. As always, we encourage you to discuss the risks and opportunities of today’s investment environment with your financial advisor.
Thank you for your continued confidence and support.
Sincerely,

Renee Laroche-Morris
President
The Dreyfus Corporation
January 16, 2018
2
DISCUSSION OF FUND PERFORMANCE
For the period from January 1, 2017 through December 31, 2017, as provided by David A. Daglio, Primary Portfolio Manager; James Boyd, Dale Dutile, and Brian Duncan, Portfolio Managers
Market and Fund Performance Overview
For the 12-month period ended December 31, 2017, Dreyfus Variable Investment Fund, Opportunistic Small Cap Portfolio’s Initial shares produced a total return of 24.69%, and its Service shares produced a total return of 24.37%.1 In comparison, the Russell 2000® Index (the “Index”), the fund’s benchmark, produced a total return of 14.65% for the same period.2
Small-cap stocks gained ground amid better-than-expected corporate earnings and expectations of more stimulative U.S. government policies. Strong stock selections across a variety of market sectors enabled the fund to outperform the Index.
As of November 13, 2017, Brian Duncan became a portfolio manager for the fund.
The Fund’s Investment Approach
The fund seeks capital growth. To pursue its goal, the fund normally invests at least 80% of its net assets, plus any borrowings for investment purposes, in the stocks of small-cap companies. The fund currently considers small-cap companies to be those companies with market capitalizations that fall within the range of the companies in the Index. Stocks are selected for the fund’s portfolio based primarily on bottom-up fundamental analysis. The fund’s portfolio managers use a disciplined investment process that relies, in general, on proprietary fundamental research and valuation.
Generally, elements of the process include analysis of mid-cycle business prospects, estimation of the intrinsic value of the company, and the identification of a revaluation trigger catalyst. In general, the fund seeks exposure to securities and sectors that are perceived to be attractive from a valuation and fundamental standpoint.
Rising Corporate Earnings Drove Markets Higher
Equity markets across all capitalization ranges were reenergized in the weeks before the start of 2017 in anticipation of more business-friendly policies from a new presidential administration, which were expected to stimulate greater economic growth. In early 2017, better-than-expected corporate earnings and encouraging global economic developments drove the Index to a series of new highs. Small-cap stocks gave back most of the year’s previous gains in August, but the market resumed its rally over the final four months of the year as investors looked forward to the passage of federal tax-reform legislation that contained provisions to substantially reduce corporate tax rates.
In addition, the market’s advance was supported throughout the year by well-telegraphed shifts in monetary policy. Although rising interest rates historically have tended to undermine investor sentiment toward stocks, the Federal Reserve Board’s gradual approach to raising short-term interest rates was received calmly by investors, who focused more on improving business conditions.
Security Selections Drove Relative Performance
The fund achieved strongly positive results across a variety of market sectors. Most notably, relative performance in the consumer discretionary sector was bolstered by favorable stock picks, such as fitness center franchiser Planet Fitness, which saw robust membership growth. Broadcasters Gray Television and Nexstar Media Group benefited from regulatory changes regarding audience reach. Automotive electronics supplier Visteon encountered greater adoption of its technologies by major automobile manufacturers. The fund also fared well in the information technology sector, where merchant services provider Square satisfied previously unmet needs among small businesses for payment processing and other financial services. Display and lighting specialist Universal Display encountered robust demand for its organic light-emitting diode (OLED) technology. Automatic test
3
DISCUSSION OF FUND PERFORMANCE (continued)
equipment maker Teradyne saw rising demand for its semiconductor test equipment and collaborative robots.
In the financials sector, prepaid credit card issuer Green Dot gained value when some major corporations adopted its payment-processing platform. Lender MGIC Investment benefited from growth in new home ownership and moderating loan losses. Commercial bank SVB Financial Group advanced amid rising lending volumes and higher interest margins. Although the energy sector produced relatively weak results for the Index, the fund’s successful stock selections included oil services provider Select Energy Services, Arch Coal, and natural gas transporter GasLog. Among health care companies, SAGE Therapeutics and Revance Therapeutics climbed after receiving positive clinical trial results for new products.
Disappointments proved relatively mild during 2017. In the consumer staples sector, beauty products seller Avon Products failed to achieve a turnaround in its North American cosmetics operations, leading to its sale from the portfolio.
Positioned for Continued Growth
We are optimistic that the U.S. economy will continue to expand in 2018, and that corporate earnings will continue to grow. Due to their focus on domestic sources of revenue, small-cap companies may be particularly well positioned to benefit from lower U.S. corporate tax rates. However, in the wake of 2017’s robust stock market returns, we believe that market gains may be more modest over the months ahead.
As of year-end, we have identified an ample number of opportunities meeting our investment criteria in the financials, information technology, consumer discretionary, and materials sectors. In contrast, the fund holds underweighted exposure to the real estate, utilities, and telecommunication services sectors.
January 16, 2018
¹ Total return includes reinvestment of dividends and any capital gains paid. Past performance is no guarantee of future results. Share price and investment return fluctuate such that upon redemption, fund shares may be worth more or less than their original cost. The fund’s performance does not reflect the deduction of additional charges and expenses imposed in connection with investing in variable insurance contracts, which will reduce returns.
² Source: Lipper Inc. — The Russell 2000® Index measures the performance of the small-cap segment of the U.S. equity universe. The Russell 2000 Index is a subset of the Russell 3000® Index representing approximately 10% of the total market capitalization of that index. It includes approximately 2,000 of the smallest securities based on a combination of their market cap and current index membership. The Russell 2000 is constructed to provide a comprehensive and unbiased small-cap barometer and is completely reconstituted annually to ensure larger stocks do not distort the performance and characteristics of the true small-cap opportunity set. Investors cannot invest directly in any index.
Please note: the position in any security highlighted with italicized typeface was sold during the reporting period.
Equities are subject generally to market, market sector, market liquidity, issuer, and investment style risks, among other factors, to varying degrees, all of which are more fully described in the fund’s prospectus.
Stocks of small- and/or mid-cap companies often experience sharper price fluctuations than stocks of large-cap companies.
The fund is only available as a funding vehicle under variable life insurance policies or variable annuity contracts issued by insurance companies. Individuals may not purchase shares of the fund directly. A variable annuity is an insurance contract issued by an insurance company that enables investors to accumulate assets on a tax-deferred basis for retirement or other long-term goals. The investment objective and policies of Dreyfus Variable Investment Fund, Opportunistic Small Cap Portfolio made available through insurance products may be similar to those of other funds managed or advised by Dreyfus. However, the investment results of the fund may be higher or lower than, and may not be comparable to, those of any other Dreyfus fund.
4
FUND PERFORMANCE
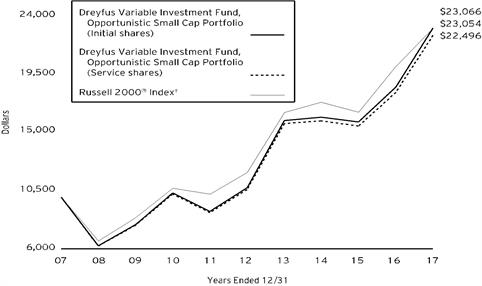
Comparison of change in value of $10,000 investment in Dreyfus Variable Investment Fund, Opportunistic Small Cap Portfolio Initial shares and Service shares and the Russell 2000® Index (the “Index”)
† Source: Lipper Inc.
Past performance is not predictive of future performance.
The fund’s performance does not reflect the deduction of additional charges and expenses imposed in connection with investing in variable insurance contracts which will reduce returns.
The above graph compares a $10,000 investment made in Initial and Service shares of Dreyfus Variable Investment Fund, Opportunistic Small Cap Portfolio on 12/31/07 to a $10,000 investment made in the Index on that date.
The fund’s performance shown in the line graph above takes into account all applicable fees and expenses. The Index measures the performance of the small-cap segment of the U.S. equity universe. The Index is a subset of the Russell 3000® Index representing approximately 10% of the total market capitalization of that index. It includes approximately 2,000 of the smallest securities based on a combination of their market cap and current index membership. The Index is constructed to provide a comprehensive and unbiased small-cap barometer and is completely reconstituted annually to ensure larger stocks do not distort the performance and characteristics of the true small-cap opportunity set. Unlike a mutual fund, the Index is not subject to charges, fees and other expenses. Investors cannot invest directly in any index. Further information relating to fund performance, including expense reimbursements, if applicable, is contained in the Financial Highlights section of the prospectus and elsewhere in this report.
| | | | |
Average Annual Total Returns as of 12/31/17 |
| 1 Year | 5 Years | 10 Years |
Initial shares | 24.69% | 16.57% | 8.72% |
Service shares | 24.37% | 16.29% | 8.45% |
Russell 2000® Index | 14.65% | 14.12% | 8.71% |
The performance data quoted represents past performance, which is no guarantee of future results. Share price and investment return fluctuate and an investor’s shares may be worth more or less than original cost upon redemption. Current performance may be lower or higher than the performance quoted. Go to Dreyfus.com for the fund’s most recent month-end returns.
The fund’s Initial shares are not subject to a Rule 12b-1 fee. The fund’s Service shares are subject to a 0.25% annual Rule 12b-1 fee. All dividends and capital gain distributions are reinvested.
The fund’s performance shown in the graph and table does not reflect the deduction of taxes that a shareholder would pay on fund distributions or the redemption of fund shares.
5
UNDERSTANDING YOUR FUND’S EXPENSES (Unaudited)
As a mutual fund investor, you pay ongoing expenses, such as management fees and other expenses. Using the information below, you can estimate how these expenses affect your investment and compare them with the expenses of other funds. You also may pay one-time transaction expenses, including sales charges (loads), redemption fees and expenses associated with variable annuity or insurance contracts, which are not shown in this section and would have resulted in higher total expenses. For more information, see your fund’s prospectus or talk to your financial adviser.
Review your fund’s expenses
The table below shows the expenses you would have paid on a $1,000 investment in Dreyfus Variable Investment Fund, Opportunistic Small Cap Portfolio from July 1, 2017 to December 31, 2017. It also shows how much a $1,000 investment would be worth at the close of the period, assuming actual returns and expenses.
| | | | | | | | | |
Expenses and Value of a $1,000 Investment |
assuming actual returns for the six months ended December 31, 2017 |
| | | | | | Initial Shares | Service Shares |
Expenses paid per $1,000† | | | | | | $4.58 | | $5.92 |
Ending value (after expenses) | | | | | | $1,137.20 | | $1,136.00 |
COMPARING YOUR FUND’S EXPENSES
WITH THOSE OF OTHER FUNDS (Unaudited)
Using the SEC’s method to compare expenses
The Securities and Exchange Commission (“SEC”) has established guidelines to help investors assess fund expenses. Per these guidelines, the table below shows your fund’s expenses based on a $1,000 investment, assuming a hypothetical 5% annualized return. You can use this information to compare the ongoing expenses (but not transaction expenses or total cost) of investing in the fund with those of other funds. All mutual fund shareholder reports will provide this information to help you make this comparison. Please note that you cannot use this information to estimate your actual ending account balance and expenses paid during the period.
| | | | | | | | | |
Expenses and Value of a $1,000 Investment |
assuming a hypothetical 5% annualized return for the six months ended December 31, 2017 |
| | | | | | Initial Shares | Service Shares |
Expenses paid per $1,000† | | | | | | $4.33 | | $5.60 |
Ending value (after expenses) | | | | | | $1,020.92 | | $1,019.66 |
† Expenses are equal to the fund’s annualized expense ratio of .85% for Initial shares and 1.10% for Service shares, multiplied by the average account value over the period, multiplied by 184/365 (to reflect the one-half year period).
6
STATEMENT OF INVESTMENTS
December 31, 2017
| | | | | | | | |
| |
Description | | | | Shares | | Value ($) | |
Common Stocks - 98.5% | | | | | |
Automobiles & Components - 1.0% | | | | | |
Visteon | | | | 16,102 | a | 2,015,004 | |
Banks - 13.7% | | | | | |
Ameris Bancorp | | | | 32,982 | | 1,589,732 | |
Atlantic Capital Bancshares | | | | 106,254 | a | 1,870,070 | |
Banner | | | | 55,784 | | 3,074,814 | |
FCB Financial Holdings, Cl. A | | | | 53,152 | a | 2,700,122 | |
First Interstate BancSystem, Cl. A | | | | 78,469 | | 3,142,683 | |
First Merchants | | | | 40,116 | | 1,687,279 | |
Great Western Bancorp | | | | 78,838 | | 3,137,752 | |
MGIC Investment | | | | 284,194 | a | 4,009,977 | |
Midland States Bancorp | | | | 28,864 | | 937,503 | |
SVB Financial Group | | | | 9,568 | a | 2,236,711 | |
Union Bankshares | | | | 92,481 | | 3,345,038 | |
Univest Corporation of Pennsylvania | | | | 37,174 | b | 1,042,731 | |
| | | | | 28,774,412 | |
Capital Goods - 2.4% | | | | | |
Simpson Manufacturing | | | | 54,283 | b | 3,116,387 | |
Tennant | | | | 27,578 | b | 2,003,542 | |
| | | | | 5,119,929 | |
Commercial & Professional Services - 1.8% | | | | | |
Deluxe | | | | 41,264 | | 3,170,726 | |
Knoll | | | | 28,618 | | 659,359 | |
| | | | | 3,830,085 | |
Consumer Durables & Apparel - 2.4% | | | | | |
G-III Apparel Group | | | | 135,549 | a | 5,000,403 | |
Consumer Services - 5.4% | | | | | |
Eldorado Resorts | | | | 18,441 | a | 611,319 | |
Houghton Mifflin Harcourt | | | | 160,677 | a | 1,494,296 | |
Pinnacle Entertainment | | | | 63,814 | a | 2,088,632 | |
Planet Fitness, Cl. A | | | | 197,176 | a | 6,828,205 | |
Zoe's Kitchen | | | | 24,912 | a | 416,529 | |
| | | | | 11,438,981 | |
Diversified Financials - 8.6% | | | | | |
Cannae Holdings | | | | 95,204 | a | 1,621,324 | |
Capitol Investment Corp. IV | | | | 127,394 | | 1,275,214 | |
Donnelley Financial Solutions | | | | 113,018 | a | 2,202,721 | |
Green Dot, Cl. A | | | | 46,832 | a | 2,822,096 | |
Investment Technology Group | | | | 108,963 | | 2,097,538 | |
Raymond James Financial | | | | 21,255 | | 1,898,072 | |
SLM | | | | 461,611 | a | 5,216,204 | |
7
STATEMENT OF INVESTMENTS (continued)
| | | | | | | | |
| |
Description | | | | Shares | | Value ($) | |
Common Stocks - 98.5% (continued) | | | | | |
Diversified Financials - 8.6% (continued) | | | | | |
TPG Pace Holdings | | | | 89,822 | | 929,658 | |
| | | | | 18,062,827 | |
Energy - 5.4% | | | | | |
Arch Coal, Cl. A | | | | 29,938 | b | 2,789,024 | |
Ardmore Shipping | | | | 71,271 | a,b | 570,168 | |
Delek US Holdings | | | | 36,492 | | 1,275,030 | |
GasLog | | | | 55,080 | b | 1,225,530 | |
PDC Energy | | | | 9,277 | a | 478,137 | |
Scorpio Tankers | | | | 553,162 | | 1,687,144 | |
Select Energy Services, Cl. A | | | | 181,119 | | 3,303,611 | |
| | | | | 11,328,644 | |
Exchange-Traded Funds - .9% | | | | | |
iShares Russell 2000 ETF | | | | 11,749 | | 1,791,253 | |
Food & Staples Retailing - .5% | | | | | |
US Foods Holding | | | | 32,754 | a | 1,045,835 | |
Health Care Equipment & Services - 2.8% | | | | | |
AxoGen | | | | 57,621 | a | 1,630,674 | |
Evolent Health, Cl. A | | | | 130,915 | a,b | 1,610,255 | |
HMS Holdings | | | | 150,752 | a | 2,555,246 | |
| | | | | 5,796,175 | |
Insurance - .3% | | | | | |
Landcadia Holdings | | | | 60,324 | a | 634,608 | |
Materials - 7.1% | | | | | |
Alamos Gold, Cl. A | | | | 38,653 | | 251,631 | |
Cabot | | | | 86,667 | | 5,337,821 | |
Eagle Materials | | | | 5,476 | | 620,431 | |
IAMGOLD | | | | 85,971 | a | 501,211 | |
Methanex | | | | 43,168 | b | 2,613,822 | |
OMNOVA Solutions | | | | 177,288 | a | 1,772,880 | |
US Concrete | | | | 45,460 | a,b | 3,802,729 | |
| | | | | 14,900,525 | |
Media - 4.9% | | | | | |
Gray Television | | | | 42,187 | a | 706,632 | |
Nexstar Media Group, Cl. A | | | | 62,275 | b | 4,869,905 | |
Sinclair Broadcast Group, Cl. A | | | | 121,733 | b | 4,607,594 | |
| | | | | 10,184,131 | |
Pharmaceuticals, Biotechnology & Life Sciences - 10.0% | | | | | |
Flexion Therapeutics | | | | 113,708 | a,b | 2,847,248 | |
PRA Health Sciences | | | | 7,759 | a | 706,612 | |
Revance Therapeutics | | | | 151,648 | a | 5,421,416 | |
Sage Therapeutics | | | | 33,371 | a,b | 5,496,537 | |
TherapeuticsMD | | | | 1,091,831 | a | 6,594,659 | |
| | | | | 21,066,472 | |
8
| | | | | | | | |
| |
Description | | | | Shares | | Value ($) | |
Common Stocks - 98.5% (continued) | | | | | |
Retailing - 1.5% | | | | | |
Lithia Motors, Cl. A | | | | 28,125 | b | 3,194,719 | |
Semiconductors & Semiconductor Equipment - 2.3% | | | | | |
Microsemi | | | | 49,983 | a | 2,581,622 | |
Teradyne | | | | 51,922 | | 2,173,974 | |
| | | | | 4,755,596 | |
Software & Services - 5.6% | | | | | |
Acxiom | | | | 157,711 | a | 4,346,515 | |
Cardtronics, Cl. A | | | | 35,175 | a | 651,441 | |
CommVault Systems | | | | 37,948 | a | 1,992,270 | |
Envestnet | | | | 9,882 | a | 492,618 | |
Talend, ADR | | | | 84,742 | a,b | 3,176,130 | |
Teradata | | | | 28,667 | a,b | 1,102,533 | |
| | | | | 11,761,507 | |
Technology Hardware & Equipment - 11.0% | | | | | |
Ciena | | | | 236,857 | a | 4,957,417 | |
Infinera | | | | 557,596 | a,b | 3,529,583 | |
Methode Electronics | | | | 59,238 | | 2,375,444 | |
Sierra Wireless | | | | 123,411 | a,b | 2,523,755 | |
VeriFone Systems | | | | 232,794 | a | 4,122,782 | |
Viavi Solutions | | | | 642,618 | a | 5,616,481 | |
| | | | | 23,125,462 | |
Transportation - 10.5% | | | | | |
Avis Budget Group | | | | 141,034 | a | 6,188,572 | |
Covenant Transportation Group, Cl. A | | | | 2,427 | a | 69,728 | |
Knight-Swift Transportation Holdings | | | | 162,532 | | 7,105,899 | |
SkyWest | | | | 50,599 | | 2,686,807 | |
Werner Enterprises | | | | 155,190 | | 5,998,093 | |
| | | | | 22,049,099 | |
Utilities - .4% | | | | | |
Dynegy | | | | 72,995 | a,b | 864,991 | |
Total Common Stocks (cost $162,256,385) | | | | 206,740,658 | |
| | | | | | | | |
Other Investment - 1.8% | | | | | |
Registered Investment Company; | | | | | |
Dreyfus Institutional Preferred Government Plus Money Market Fund
(cost $3,920,146) | | | | 3,920,146 | c | 3,920,146 | |
9
STATEMENT OF INVESTMENTS (continued)
| | | | | | | | |
| |
Description | | | | Shares | | Value ($) | |
Investment of Cash Collateral for Securities Loaned - 8.1% | | | | | |
Registered Investment Company; | | | | | |
Dreyfus Institutional Preferred Government Money Market Fund, Institutional Shares
(cost $16,964,289) | | | | 16,964,289 | c | 16,964,289 | |
Total Investments (cost $183,140,820) | | 108.4% | | 227,625,093 | |
Liabilities, Less Cash and Receivables | | (8.4%) | | (17,721,097) | |
Net Assets | | 100.0% | | 209,903,996 | |
ADR—American Depository Receipt
ETF—Exchange-Traded Fund
aNon-income producing security.
bSecurity, or portion thereof, on loan. At December 31, 2017, the value of the fund’s securities on loan was $31,146,272 and the value of the collateral held by the fund was $32,150,956, consisting of cash collateral of $16,964,289 and U.S. Government & Agency securities valued at $15,186,667.
cInvestment in affiliated money market mutual fund.
| | |
Portfolio Summary (Unaudited) † | Value (%) |
Banks | 13.7 |
Technology Hardware & Equipment | 11.0 |
Transportation | 10.5 |
Pharmaceuticals, Biotechnology & Life Sciences | 10.0 |
Money Market Investments | 9.9 |
Diversified Financials | 8.6 |
Materials | 7.1 |
Software & Services | 5.6 |
Consumer Services | 5.4 |
Energy | 5.4 |
Media | 4.9 |
Health Care Equipment & Services | 2.8 |
Capital Goods | 2.4 |
Consumer Durables & Apparel | 2.4 |
Semiconductors & Semiconductor Equipment | 2.3 |
Commercial & Professional Services | 1.8 |
Retailing | 1.5 |
Automobiles & Components | 1.0 |
Exchange-Traded Funds | .9 |
Food & Staples Retailing | .5 |
Utilities | .4 |
Insurance | .3 |
| | 108.4 |
† Based on net assets.
See notes to financial statements.
10
STATEMENT OF INVESTMENTS IN AFFILIATED ISSUERS
| | | | | | | |
Registered Investment Company | Value
12/31/16($) | Purchases($) | Sales($) | Value
12/31/17($) | Net
Assets(%) | Dividends/
Distributions($) |
Dreyfus Institutional Preferred Government Plus Money Market Fund | 2,950,570 | 54,342,171 | 53,372,595 | 3,920,146 | 1.8 | 17,523 |
Dreyfus Institutional Preferred Government Money Market Fund, Institutional Shares | 11,023,751 | 197,331,398 | 191,390,860 | 16,964,289 | 8.1 | - |
Total | 13,974,321 | 251,673,569 | 244,763,455 | 20,884,435 | 9.9 | 17,523 |
See notes to financial statements.
11
STATEMENT OF ASSETS AND LIABILITIES
December 31, 2017
| | | | | | | |
| | | | | | |
| | | Cost | | Value | |
Assets ($): | | | | |
Investments in securities—See Statement of Investments
(including securities on loan, valued at $31,146,272)—Note 1(b): | | | |
Unaffiliated issuers | 162,256,385 | | 206,740,658 | |
Affiliated issuers | | 20,884,435 | | 20,884,435 | |
Cash | | | | | 131,279 | |
Receivable for investment securities sold | | 1,672,490 | |
Dividends and securities lending income receivable | | 40,088 | |
Prepaid expenses | | | | | 2,192 | |
| | | | | 229,471,142 | |
Liabilities ($): | | | | |
Due to The Dreyfus Corporation and affiliates—Note 3(b) | | | | | 157,916 | |
Liability for securities on loan—Note 1(b) | | 16,964,289 | |
Payable for investment securities purchased | | 2,358,869 | |
Payable for shares of Beneficial Interest redeemed | | 31,072 | |
Accrued expenses | | | | | 55,000 | |
| | | | | 19,567,146 | |
Net Assets ($) | | | 209,903,996 | |
Composition of Net Assets ($): | | | | |
Paid-in capital | | | | | 130,870,765 | |
Accumulated net realized gain (loss) on investments | | | | | 34,548,958 | |
Accumulated net unrealized appreciation (depreciation)
on investments | | | | 44,484,273 | |
Net Assets ($) | | | 209,903,996 | |
| | | | |
Net Asset Value Per Share | Initial Shares | Service Shares | |
Net Assets ($) | 189,582,339 | 20,321,657 | |
Shares Outstanding | 3,112,270 | 344,537 | |
Net Asset Value Per Share ($) | 60.91 | 58.98 | |
| | | | |
See notes to financial statements. | | | |
12
STATEMENT OF OPERATIONS
Year Ended December 31, 2017
| | | | | | | |
| | | | | | |
| | | | | | |
Investment Income ($): | | | | |
Income: | | | | |
Cash dividends (net of $16,422 foreign taxes withheld at source): | |
Unaffiliated issuers | | | 1,095,925 | |
Affiliated issuers | | | 17,523 | |
Income from securities lending—Note 1(b) | | | 84,904 | |
Total Income | | | 1,198,352 | |
Expenses: | | | | |
Investment advisory fee—Note 3(a) | | | 1,427,975 | |
Professional fees | | | 71,304 | |
Distribution fees—Note 3(b) | | | 45,885 | |
Prospectus and shareholders’ reports | | | 38,692 | |
Custodian fees—Note 3(b) | | | 37,944 | |
Trustees’ fees and expenses—Note 3(c) | | | 15,682 | |
Loan commitment fees—Note 2 | | | 3,595 | |
Shareholder servicing costs—Note 3(b) | | | 1,207 | |
Interest expense—Note 2 | | | 398 | |
Miscellaneous | | | 21,265 | |
Total Expenses | | | 1,663,947 | |
Less—reduction in fees due to earnings credits—Note 3(b) | | | (99) | |
Net Expenses | | | 1,663,848 | |
Investment (Loss)—Net | | | (465,496) | |
Realized and Unrealized Gain (Loss) on Investments—Note 4 ($): | | |
Net realized gain (loss) on investments | 35,249,723 | |
Net unrealized appreciation (depreciation) on investments | | | 7,783,367 | |
Net Realized and Unrealized Gain (Loss) on Investments | | | 43,033,090 | |
Net Increase in Net Assets Resulting from Operations | | 42,567,594 | |
| | | | | | | |
See notes to financial statements. | | | | | |
13
STATEMENT OF CHANGES IN NET ASSETS
| | | | | | | | | | |
| | | | Year Ended December 31, |
| | | | 2017 | | 2016 | |
Operations ($): | | | | | | | | |
Investment (loss)—net | | | (465,496) | | | | (120,754) | |
Net realized gain (loss) on investments | | 35,249,723 | | | | 2,249,818 | |
Net unrealized appreciation (depreciation)
on investments | | 7,783,367 | | | | 24,622,888 | |
Net Increase (Decrease) in Net Assets
Resulting from Operations | 42,567,594 | | | | 26,751,952 | |
Distributions to Shareholders from ($): | |
Net realized gain on investments: | | | | | | | | |
Initial Shares | | | (2,000,341) | | | | (11,879,783) | |
Service Shares | | | (218,974) | | | | (1,317,375) | |
Total Distributions | | | (2,219,315) | | | | (13,197,158) | |
Beneficial Interest Transactions ($): | |
Net proceeds from shares sold: | | | | | | | | |
Initial Shares | | | 10,596,553 | | | | 9,923,649 | |
Service Shares | | | 1,191,330 | | | | 1,314,657 | |
Distributions reinvested: | | | | | | | | |
Initial Shares | | | 2,000,341 | | | | 11,879,783 | |
Service Shares | | | 218,974 | | | | 1,317,375 | |
Cost of shares redeemed: | | | | | | | | |
Initial Shares | | | (21,682,843) | | | | (23,977,290) | |
Service Shares | | | (2,291,881) | | | | (3,009,833) | |
Increase (Decrease) in Net Assets
from Beneficial Interest Transactions | (9,967,526) | | | | (2,551,659) | |
Total Increase (Decrease) in Net Assets | 30,380,753 | | | | 11,003,135 | |
Net Assets ($): | |
Beginning of Period | | | 179,523,243 | | | | 168,520,108 | |
End of Period | | | 209,903,996 | | | | 179,523,243 | |
Capital Share Transactions (Shares): | |
Initial Shares | | | | | | | | |
Shares sold | | | 197,277 | | | | 235,244 | |
Shares issued for distributions reinvested | | | 38,007 | | | | 293,836 | |
Shares redeemed | | | (403,156) | | | | (551,658) | |
Net Increase (Decrease) in Shares Outstanding | (167,872) | | | | (22,578) | |
Service Shares | | | | | | | | |
Shares sold | | | 22,928 | | | | 31,258 | |
Shares issued for distributions reinvested | | | 4,288 | | | | 33,495 | |
Shares redeemed | | | (44,121) | | | | (71,395) | |
Net Increase (Decrease) in Shares Outstanding | (16,905) | | | | (6,642) | |
| | | | | | | | | | |
See notes to financial statements. | | | | | | | | |
14
FINANCIAL HIGHLIGHTS
The following tables describe the performance for each share class for the fiscal periods indicated. All information (except portfolio turnover rate) reflects financial results for a single fund share. Total return shows how much your investment in the fund would have increased (or decreased) during each period, assuming you had reinvested all dividends and distributions. The fund’s total returns do not reflect expenses associated with variable annuity or insurance contracts. These figures have been derived from the fund’s financial statements.
| | | | | | | |
| | | |
| | Year Ended December 31, |
Initial Shares | 2017 | 2016 | 2015 | 2014 | 2013 |
Per Share Data ($): | | | | | | |
Net asset value, beginning of period | | 49.44 | 46.02 | 47.78 | 47.03 | 31.66 |
Investment Operations: | | | | | | |
Investment (loss)—neta | | (.12) | (.02) | (.13) | (.01) | (.09) |
Net realized and unrealized
gain (loss) on investments | | 12.21 | 7.07 | (.91) | .76 | 15.46 |
Total from Investment Operations | | 12.09 | 7.05 | (1.04) | .75 | 15.37 |
Distributions: | | | | | | |
Dividends from net realized
gain on investments | | (.62) | (3.63) | (.72) | - | - |
Net asset value, end of period | | 60.91 | 49.44 | 46.02 | 47.78 | 47.03 |
Total Return (%) | | 24.69 | 17.07 | (2.28) | 1.60 | 48.55 |
Ratios/Supplemental Data (%): | | | | | | |
Ratio of total expenses
to average net assets | | .85 | .86 | .85 | .83 | .93 |
Ratio of net expenses
to average net assets | | .85 | .86 | .85 | .83 | .93 |
Ratio of net investment (loss)
to average net assets | | (.22) | (.05) | (.27) | (.03) | (.23) |
Portfolio Turnover Rate | | 70.11 | 88.08 | 65.26 | 77.96 | 84.80 |
Net Assets, end of period ($ x 1,000) | | 189,582 | 162,171 | 151,992 | 170,570 | 188,702 |
a Based on average shares outstanding.
See notes to financial statements.
15
FINANCIAL HIGHLIGHTS (continued)
| | | | | | | |
| | | |
| | Year Ended December 31, |
Service Shares | 2017 | 2016 | 2015 | 2014 | 2013 |
Per Share Data ($): | | | | | | |
Net asset value, beginning of period | | 48.01 | 44.90 | 46.75 | 46.14 | 31.13 |
Investment Operations: | | | | | | |
Investment (loss)—neta | | (.25) | (.13) | (.24) | (.13) | (.18) |
Net realized and unrealized
gain (loss) on investments | | 11.84 | 6.87 | (.89) | .74 | 15.19 |
Total from Investment Operations | | 11.59 | 6.74 | (1.13) | .61 | 15.01 |
Distributions: | | | | | | |
Dividends from net realized
gain on investments | | (.62) | (3.63) | (.72) | - | - |
Net asset value, end of period | | 58.98 | 48.01 | 44.90 | 46.75 | 46.14 |
Total Return (%) | | 24.37 | 16.79 | (2.52) | 1.32 | 48.22 |
Ratios/Supplemental Data (%): | | | | | | |
Ratio of total expenses
to average net assets | | 1.10 | 1.11 | 1.10 | 1.08 | 1.18 |
Ratio of net expenses
to average net assets | | 1.10 | 1.11 | 1.10 | 1.08 | 1.18 |
Ratio of net investment (loss)
to average net assets | | (.47) | (.30) | (.52) | (.28) | (.48) |
Portfolio Turnover Rate | | 70.11 | 88.08 | 65.26 | 77.96 | 84.80 |
Net Assets, end of period ($ x 1,000) | | 20,322 | 17,353 | 16,528 | 18,094 | 19,590 |
a Based on average shares outstanding.
See notes to financial statements.
16
NOTES TO FINANCIAL STATEMENTS
NOTE 1—Significant Accounting Policies:
Opportunistic Small Cap Portfolio (the “fund”) is a separate diversified series of Dreyfus Variable Investment Fund (the “Company”), which is registered under the Investment Company Act of 1940, as amended (the “Act”), as an open-end management investment company and operates as a series company currently offering seven series, including the fund. The fund is only offered to separate accounts established by insurance companies to fund variable annuity contracts and variable life insurance policies. The fund’s investment objective is to seek capital growth. The Dreyfus Corporation (the “Manager” or “Dreyfus”), a wholly-owned subsidiary of The Bank of New York Mellon Corporation (“BNY Mellon”), serves as the fund’s investment adviser.
MBSC Securities Corporation (the “Distributor”), a wholly-owned subsidiary of Dreyfus, is the distributor of the fund’s shares, which are sold without a sales charge. The fund is authorized to issue an unlimited number of $.001 par value shares of Beneficial Interest in each of the following classes of shares: Initial and Service. Each class of shares has identical rights and privileges, except with respect to the Distribution Plan, and the expenses borne by each class, the allocation of certain transfer agency costs, and certain voting rights. Income, expenses (other than expenses attributable to a specific class), and realized and unrealized gains or losses on investments are allocated to each class of shares based on its relative net assets.
The Company accounts separately for the assets, liabilities and operations of each series. Expenses directly attributable to each series are charged to that series’ operations; expenses which are applicable to all series are allocated among them on a pro rata basis.
The Financial Accounting Standards Board (“FASB”) Accounting Standards Codification is the exclusive reference of authoritative U.S. generally accepted accounting principles (“GAAP”) recognized by the FASB to be applied by nongovernmental entities. Rules and interpretive releases of the Securities and Exchange Commission (“SEC”) under authority of federal laws are also sources of authoritative GAAP for SEC registrants. The fund’s financial statements are prepared in accordance with GAAP, which may require the use of management estimates and assumptions. Actual results could differ from those estimates.
The Company enters into contracts that contain a variety of indemnifications. The fund’s maximum exposure under these arrangements is unknown. The fund does not anticipate recognizing any loss related to these arrangements.
17
NOTES TO FINANCIAL STATEMENTS (continued)
(a) Portfolio valuation: The fair value of a financial instrument is the amount that would be received to sell an asset or paid to transfer a liability in an orderly transaction between market participants at the measurement date (i.e., the exit price). GAAP establishes a fair value hierarchy that prioritizes the inputs of valuation techniques used to measure fair value. This hierarchy gives the highest priority to unadjusted quoted prices in active markets for identical assets or liabilities (Level 1 measurements) and the lowest priority to unobservable inputs (Level 3 measurements).
Additionally, GAAP provides guidance on determining whether the volume and activity in a market has decreased significantly and whether such a decrease in activity results in transactions that are not orderly. GAAP requires enhanced disclosures around valuation inputs and techniques used during annual and interim periods.
Various inputs are used in determining the value of the fund’s investments relating to fair value measurements. These inputs are summarized in the three broad levels listed below:
Level 1—unadjusted quoted prices in active markets for identical investments.
Level 2—other significant observable inputs (including quoted prices for similar investments, interest rates, prepayment speeds, credit risk, etc.).
Level 3—significant unobservable inputs (including the fund’s own assumptions in determining the fair value of investments).
The inputs or methodology used for valuing securities are not necessarily an indication of the risk associated with investing in those securities.
Changes in valuation techniques may result in transfers in or out of an assigned level within the disclosure hierarchy. Valuation techniques used to value the fund’s investments are as follows:
Investments in securities are valued at the last sales price on the securities exchange or national securities market on which such securities are primarily traded. Securities listed on the National Market System for which market quotations are available are valued at the official closing price or, if there is no official closing price that day, at the last sales price. For open short positions, asked prices are used for valuation purposes. Bid price is used when no asked price is available. Registered investment companies that are not traded on an exchange are valued at their net asset value. All of the preceding securities are generally categorized within Level 1 of the fair value hierarchy.
18
Securities not listed on an exchange or the national securities market, or securities for which there were no transactions, are valued at the average of the most recent bid and asked prices. These securities are generally categorized within Level 2 of the fair value hierarchy.
Fair valuing of securities may be determined with the assistance of a pricing service using calculations based on indices of domestic securities and other appropriate indicators, such as prices of relevant ADRs and futures. Utilizing these techniques may result in transfers between Level 1 and Level 2 of the fair value hierarchy.
When market quotations or official closing prices are not readily available, or are determined to not accurately reflect fair value, such as when the value of a security has been significantly affected by events after the close of the exchange or market on which the security is principally traded (for example, a foreign exchange or market), but before the fund calculates its net asset value, the fund may value these investments at fair value as determined in accordance with the procedures approved by the Company’s Board of Trustees (the “Board”). Certain factors may be considered when fair valuing investments such as: fundamental analytical data, the nature and duration of restrictions on disposition, an evaluation of the forces that influence the market in which the securities are purchased and sold, and public trading in similar securities of the issuer or comparable issuers. These securities are either categorized within Level 2 or 3 of the fair value hierarchy depending on the relevant inputs used.
For restricted securities where observable inputs are limited, assumptions about market activity and risk are used and are generally categorized within Level 3 of the fair value hierarchy.
The following is a summary of the inputs used as of December 31, 2017 in valuing the fund’s investments:
| | | | | |
| | Level 1-
Unadjusted
Quoted
Prices | Level 2 – Other
Significant
Observable
Inputs | Level 3 -
Significant
Unobservable
Inputs | Total |
Assets ($) | | | |
Investments in Securities: | | | |
Equity Securities - Domestic Common Stocks† | 193,157,500 | 929,658 | - | 194,087,158 |
Equity Securities - Foreign Common Stocks† | 10,862,247 | - | - | 10,862,247 |
Exchange-Traded Fund | 1,791,253 | - | - | 1,791,253 |
19
NOTES TO FINANCIAL STATEMENTS (continued)
| | | | | |
| | Level 1-
Unadjusted
Quoted
Prices | Level 2 – Other
Significant
Observable
Inputs | Level 3 -
Significant
Unobservable
Inputs | Total |
Registered Investment Companies | 20,884,435 | - | - | 20,884,435 |
† See Statement of Investments for additional detailed categorizations.
At December 31, 2017, the amount of securities transferred between levels equals fair value of exchange traded equity securities reported as Level 2 in the table above. It is the fund’s policy to recognize transfers between levels at the end of the reporting period.
(b) Securities transactions and investment income: Securities transactions are recorded on a trade date basis. Realized gains and losses from securities transactions are recorded on the identified cost basis. Dividend income is recognized on the ex-dividend date and interest income, including, where applicable, accretion of discount and amortization of premium on investments, is recognized on the accrual basis.
Pursuant to a securities lending agreement with The Bank of New York Mellon, a subsidiary of BNY Mellon and an affiliate of Dreyfus, the fund may lend securities to qualified institutions. It is the fund’s policy that, at origination, all loans are secured by collateral of at least 102% of the value of U.S. securities loaned and 105% of the value of foreign securities loaned. Collateral equivalent to at least 100% of the market value of securities on loan is maintained at all times. Collateral is either in the form of cash, which can be invested in certain money market mutual funds managed by Dreyfus, or U.S. Government and Agency securities. The fund is entitled to receive all dividends, interest and distributions on securities loaned, in addition to income earned as a result of the lending transaction. Should a borrower fail to return the securities in a timely manner, The Bank of New York Mellon is required to replace the securities for the benefit of the fund or credit the fund with the market value of the unreturned securities and is subrogated to the fund’s rights against the borrower and the collateral. Additionally, the contractual maturity of security lending transactions are on an overnight and continuous basis. During the period ended December 31, 2017, The Bank of New York Mellon earned $14,666 from lending portfolio securities, pursuant to the securities lending agreement.
(c) Affiliated issuers: Investments in other investment companies advised by Dreyfus are defined as “affiliated” under the Act.
20
(d) Dividends and distributions to shareholders: Dividends and distributions are recorded on the ex-dividend date. Dividends from investment income-net and dividends from net realized capital gains, if any, are normally declared and paid annually, but the fund may make distributions on a more frequent basis to comply with the distribution requirements of the Internal Revenue Code of 1986, as amended (the “Code”). To the extent that net realized capital gains can be offset by capital loss carryovers, it is the policy of the fund not to distribute such gains. Income and capital gain distributions are determined in accordance with income tax regulations, which may differ from GAAP.
(e) Federal income taxes: It is the policy of the fund to continue to qualify as a regulated investment company, if such qualification is in the best interests of its shareholders, by complying with the applicable provisions of the Code, and to make distributions of taxable income sufficient to relieve it from substantially all federal income and excise taxes.
As of and during the period ended December 31, 2017, the fund did not have any liabilities for any uncertain tax positions. The fund recognizes interest and penalties, if any, related to uncertain tax positions as income tax expense in the Statement of Operations. During the period ended December 31, 2017, the fund did not incur any interest or penalties.
Each tax year in the four-year period ended December 31, 2017 remains subject to examination by the Internal Revenue Service and state taxing authorities.
At December 31, 2017, the components of accumulated earnings on a tax basis were as follows: undistributed ordinary income $10,667,430, undistributed capital gains $24,084,873 and unrealized appreciation $44,280,928.
The tax character of distributions paid to shareholders during the fiscal periods ended December 31, 2017 and December 31, 2016 were as follows: long-term capital gains $2,219,315 and $13,197,158, respectively.
During the period ended December 31, 2017, as a result of permanent book to tax differences, primarily due to the tax treatment for net operating losses and passive foreign investment companies, the fund increased accumulated undistributed investment income-net by $465,496 and decreased accumulated net realized gain (loss) on investments by the same amount. Net assets and net asset value per share were not affected by this reclassification.
21
NOTES TO FINANCIAL STATEMENTS (continued)
NOTE 2—Bank Lines of Credit:
The fund participates with other Dreyfus-managed funds in an $830 million unsecured credit facility led by Citibank, N.A. and a $300 million unsecured credit facility provided by The Bank of New York Mellon (each, a “Facility”), each to be utilized primarily for temporary or emergency purposes, including the financing of redemptions. Prior to October 4, 2017, the unsecured credit facility with Citibank, N.A. was $810 million. In connection therewith, the fund has agreed to pay its pro rata portion of commitment fees for each Facility. Interest is charged to the fund based on rates determined pursuant to the terms of the respective Facility at the time of borrowing.
The average amount of borrowings outstanding under the Facilities during the period ended December 31, 2017 was approximately $18,900 with a related weighted average annualized interest rate of 2.11%.
NOTE 3—Investment Advisory Fee and Other Transactions with Affiliates:
(a) Pursuant to an investment advisory agreement with Dreyfus, the investment advisory fee is computed at the annual rate of .75% of the value of the fund’s average daily net assets and is payable monthly.
(b) Under the Distribution Plan adopted pursuant to Rule 12b-1 under the Act, Service shares pay the Distributor for distributing its shares, for servicing and/or maintaining Service shares’ shareholder accounts and for advertising and marketing for Service shares. The Distribution Plan provides for payments to be made at an annual rate of .25% of the value of the Service shares’ average daily net assets. The Distributor may make payments to Participating Insurance Companies and to brokers and dealers acting as principal underwriter for their variable insurance products. The fees payable under the Distribution Plan are payable without regard to actual expenses incurred. During the period ended December 31, 2017, Service shares were charged $45,885 pursuant to the Distribution Plan.
The fund has arrangements with the transfer agent and the custodian whereby the fund may receive earnings credits when positive cash balances are maintained, which are used to offset transfer agency and custody fees. For financial reporting purposes, the fund includes net earnings credits as an expense offset in the Statement of Operations.
The fund compensates Dreyfus Transfer, Inc., a wholly-owned subsidiary of Dreyfus, under a transfer agency agreement for providing transfer agency and cash management services for the fund. The majority of transfer agency fees are comprised of amounts paid on a per account basis,
22
while cash management fees are related to fund subscriptions and redemptions. During the period ended December 31, 2017, the fund was charged $756 for transfer agency services and $99 for cash management services. These fees are included in Shareholder servicing costs in the Statement of Operations. Cash management fees were offset by earnings credits of $99.
The fund compensates The Bank of New York Mellon under a custody agreement for providing custodial services for the fund. These fees are determined based on net assets, geographic region and transaction activity. During the period ended December 31, 2017, the fund was charged $37,944 pursuant to the custody agreement.
During the period ended December 31, 2017, the fund was charged $11,202 for services performed by the Chief Compliance Officer and his staff.
The components of “Due to The Dreyfus Corporation and affiliates” in the Statement of Assets and Liabilities consist of: investment advisory fees $132,820, Distribution Plan fees $4,282, custodian fees $12,066, Chief Compliance Officer fees $8,406 and transfer agency fees $342.
(c) Each Board member also serves as a Board member of other funds within the Dreyfus complex. Annual retainer fees and attendance fees are allocated to each fund based on net assets.
NOTE 4—Securities Transactions:
The aggregate amount of purchases and sales of investment securities, excluding short-term securities, during the period ended December 31, 2017, amounted to $132,585,940 and $146,114,010, respectively.
At December 31, 2017, the cost of investments for federal income tax purposes was $183,344,165; accordingly, accumulated net unrealized appreciation on investments was $44,280,928, consisting of $48,419,825 gross unrealized appreciation and $4,138,897 gross unrealized depreciation.
23
REPORT OF INDEPENDENT REGISTERED PUBLIC ACCOUNTING FIRM
To the Shareholders and the Board of Trustees of Dreyfus Variable Investment Fund, Opportunistic Small Cap Portfolio
Opinion on the Financial Statements
We have audited the accompanying statement of assets and liabilities of Dreyfus Variable Investment Fund, Opportunistic Small Cap Portfolio (one of the series comprising Dreyfus Variable Investment Fund)(the “Fund”), including the statements of investments and investments in affiliated issuers, as of December 31, 2017, and the related statement of operations for the year then ended, the statements of changes in net assets for each of the two years in the period then ended, the financial highlights for each of the five years in the period then ended and the related notes (collectively referred to as the “financial statements”). In our opinion, the financial statements present fairly, in all material respects, the financial position of Dreyfus Variable Investment Fund, Opportunistic Small Cap Portfolio at December 31, 2017, the results of its operations for the year then ended, the changes in its net assets for each of the two years in the period then ended and its financial highlights for each of the five years in the period then ended, in conformity with U.S. generally accepted accounting principles.
Basis for opinion
These financial statements are the responsibility of the Fund’s management. Our responsibility is to express an opinion on the Fund’s financial statements based on our audits. We are a public accounting firm registered with the Public Company Accounting Oversight Board (United States) (“PCAOB”) and are required to be independent with respect to the Fund in accordance with the U.S. federal securities laws and the applicable rules and regulations of the Securities and Exchange Commission and the PCAOB.
We conducted our audits in accordance with the standards of the PCAOB. Those standards require that we plan and perform the audit to obtain reasonable assurance about whether the financial statements are free of material misstatement, whether due to error or fraud. The Fund is not required to have, nor were we engaged to perform, an audit of the Fund’s internal control over financial reporting. As part of our audits, we are required to obtain an understanding of internal control over financial reporting, but not for the purpose of expressing an opinion on the effectiveness of the Fund’s internal control over financial reporting. Accordingly, we express no such opinion.
Our audits included performing procedures to assess the risks of material misstatement of the financial statements, whether due to error or fraud, and performing procedures that respond to those risks. Such procedures included examining, on a test basis, evidence regarding the amounts and disclosures in the financial statements. Our procedures included confirmation of securities owned as of December 31, 2017, by correspondence with the custodian and others or by other appropriate auditing procedures where replies were not received. Our audits also included evaluating the accounting principles used and significant estimates made by management, as well as evaluating the overall presentation of the financial statements. We believe that our audits provide a reasonable basis for our opinion.

We have served as the auditor of one or more Dreyfus investment companies since at least 1957, but we are unable to determine the specific year.
New York, New York
February 09, 2018
24
IMPORTANT TAX INFORMATION (Unaudited)
For federal tax purposes, the fund hereby reports $0.6233 per share as a long-term capital gain distribution paid on March 20, 2017.
25
BOARD MEMBERS INFORMATION (Unaudited)
INDEPENDENT BOARD MEMBERS
Joseph S. DiMartino (74)
Chairman of the Board (1995)
Principal Occupation During Past 5 Years:
· Corporate Director and Trustee (1995-present)
Other Public Company Board Memberships During Past 5 Years:
· CBIZ (formerly, Century Business Services, Inc.), a provider of outsourcing functions for small and medium size companies, Director (1997-present)
No. of Portfolios for which Board Member Serves: 127
———————
Peggy C. Davis (74)
Board Member (2006)
Principal Occupation During Past 5 Years:
· Shad Professor of Law, New York University School of Law (1983-present)
No. of Portfolios for which Board Member Serves: 46
———————
David P. Feldman (78)
Board Member (1994)
Principal Occupation During Past 5 Years:
· Corporate Director and Trustee (1985-present)
Other Public Company Board Memberships During Past 5 Years:
· BBH Mutual Funds Group (5 registered mutual funds), Director (1992-2014)
No. of Portfolios for which Board Member Serves: 32
———————
Joan Gulley (70)
Board Member (2017)
Principal Occupation During Past 5 Years:
· PNC Financial Services Group, Inc.(1993-2014), Executive Vice President and Chief Human Resources Officer and Executive Committee Member (2008-2014)
No. of Portfolios for which Board Member Serves: 54
———————
26
Ehud Houminer (77)
Board Member (2006)
Principal Occupation During Past 5 Years:
· Board of Overseers at the Columbia Business School, Columbia University (1992-present)
· Trustee, Ben Gurion University
Other Public Company Board Memberships During Past 5 Years:
· Avnet, Inc., an electronics distributor, Director (1993-2012)
No. of Portfolios for which Board Member Serves: 54
———————
Lynn Martin (78)
Board Member (2012)
Principal Occupation During Past 5 Years:
· President of The Martin Hall Group LLC, a human resources consulting firm (2005-2012)
Other Public Company Board Memberships During Past 5 Years:
· AT&T, Inc., a telecommunications company, Director (1999-2012)
· Ryder System, Inc., a supply chain and transportation management company, Director (1993-2012)
No. of Portfolios for which Board Member Serves: 32
———————
Robin A. Melvin (54)
Board Member (2012)
Principal Occupation During Past 5 Years:
· Co-chairman, Illinois Mentoring Partnership, non-profit organization dedicated to increasing the quantity and quality of mentoring services in Illinois; (2014-present; board member since 2013)
· Director, Boisi Family Foundation, a private family foundation that supports youth-serving organizations that promote the self sufficiency of youth from disadvantaged circumstances (1995-2012)
No. of Portfolios for which Board Member Serves: 101
———————
27
BOARD MEMBERS INFORMATION (Unaudited) (continued)
INDEPENDENT BOARD MEMBERS (continued)
Dr. Martin Peretz (78)
Board Member (1990)
Principal Occupation During Past 5 Years:
· Editor-in-Chief Emeritus of The New Republic Magazine (2011-2012) (previously,
Editor-in-Chief, 1974-2011)
· Lecturer at Harvard University (1969-2012)
No. of Portfolios for which Board Member Serves: 32
———————
Once elected all Board Members serve for an indefinite term, but achieve Emeritus status upon reaching age 80. The address of the Board Members and Officers is c/o The Dreyfus Corporation, 200 Park Avenue, New York, New York 10166. Additional information about the Board Members is available in the fund’s Statement of Additional Information which can be obtained from Dreyfus free of charge by calling this toll free number: 1-800-DREYFUS.
James F. Henry, Emeritus Board Member
Philip L. Toia, Emeritus Board Member
28
OFFICERS OF THE FUND (Unaudited)
BRADLEY J. SKAPYAK, President since January 2010.
Chief Operating Officer and a director of the Manager since June 2009, Chairman of Dreyfus Transfer, Inc., an affiliate of the Manager and the transfer agent of the funds, since May 2011 and Chief Executive Officer of MBSC Securities Corporation since August 2016. He is an officer of 63 investment companies (comprised of 127 portfolios) managed by the Manager. He is 59 years old and has been an employee of the Manager since February 1988.
BENNETT A. MACDOUGALL, Chief Legal Officer since October 2015.
Chief Legal Officer of the Manager and Associate General Counsel and Managing Director of BNY Mellon since June 2015; from June 2005 to June 2015, he served in various capacities with Deutsche Bank – Asset & Wealth Management Division, including as Director and Associate General Counsel, and Chief Legal Officer of Deutsche Investment Management Americas Inc. from June 2012 to May 2015. He is an officer of 64 investment companies (comprised of 152 portfolios) managed by the Manager. He is 46 years old and has been an employee of the Manager since June 2015.
JANETTE E. FARRAGHER, Vice President and Secretary since December 2011.
Associate General Counsel of BNY Mellon, and an officer of 64 investment companies (comprised of 152 portfolios) managed by the Manager. She is 55 years old and has been an employee of the Manager since February 1984.
JAMES BITETTO, Vice President and Assistant Secretary since August 2005.
Managing Counsel of BNY Mellon and Secretary of the Manager, and an officer of 64 investment companies (comprised of 152 portfolios) managed by the Manager. He is 51 years old and has been an employee of the Manager since December 1996.
JOSEPH M. CHIOFFI, Vice President and Assistant Secretary since August 2005.
Managing Counsel of BNY Mellon, and an officer of 64 investment companies (comprised of 152 portfolios) managed by the Manager. He is 56 years old and has been an employee of the Manager since June 2000.
MAUREEN E. KANE, Vice President and Assistant Secretary since April 2015.
Managing Counsel of BNY Mellon since July 2014; from October 2004 until July 2014, General Counsel, and from May 2009 until July 2014, Chief Compliance Officer of Century Capital Management. She is an officer of 64 investment companies (comprised of 152 portfolios) managed by the Manager. She is 55 years old and has been an employee of the Manager since July 2014.
SARAH S. KELLEHER, Vice President and Assistant Secretary since April 2014.
Senior Counsel of BNY Mellon since March 2013, from August 2005 to March 2013, Associate General Counsel of Third Avenue Management. She is an officer of 64 investment companies (comprised of 152 portfolios) managed by the Manager. She is 42 years old and has been an employee of the Manager since March 2013.
JEFF PRUSNOFSKY, Vice President and Assistant Secretary since August 2005.
Senior Managing Counsel of BNY Mellon, and an officer of 64 investment companies (comprised of 152 portfolios) managed by the Manager. He is 52 years old and has been an employee of the Manager since October 1990.
NATALYA ZELENSKY, Vice President and Assistant Secretary since March 2017.
Counsel and Vice President of BNY Mellon since May 2016; Attorney at Wildermuth Endowment Strategy Fund/Wildermuth Advisory, LLC from November 2015 until May 2016; Assistant General Counsel at RCS Advisory Services from July 2014 until November 2015; Associate at Sutherland, Asbill & Brennan from January 2013 until January 2014; Associate at K&L Gates from October 2011 until January 2013. She is an officer of 64 investment companies (comprised of 152 portfolios) managed by Dreyfus. She is 32 years old and has been an employee of the Manager since May 2016.
JAMES WINDELS, Treasurer since November 2001.
Director – Mutual Fund Accounting of the Manager, and an officer of 64 investment companies (comprised of 152 portfolios) managed by the Manager. He is 59 years old and has been an employee of the Manager since April 1985.
29
OFFICERS OF THE FUND (Unaudited) (continued)
RICHARD CASSARO, Assistant Treasurer since January 2008.
Senior Accounting Manager – Money Market and Municipal Bond Funds of the Manager, and an officer of 64 investment companies (comprised of 152 portfolios) managed by the Manager. He is 58 years old and has been an employee of the Manager since September 1982.
GAVIN C. REILLY, Assistant Treasurer since December 2005.
Tax Manager of the Investment Accounting and Support Department of the Manager, and an officer of 64 investment companies (comprised of 152 portfolios) managed by the Manager. He is 49 years old and has been an employee of the Manager since April 1991.
ROBERT S. ROBOL, Assistant Treasurer since August 2005.
Senior Accounting Manager – Dreyfus Financial Reporting of the Manager, and an officer of 64 investment companies (comprised of 152 portfolios) managed by the Manager. He is 53 years old and has been an employee of the Manager since October 1988.
ROBERT SALVIOLO, Assistant Treasurer since July 2007.
Senior Accounting Manager – Equity Funds of the Manager, and an officer of 64 investment companies (comprised of 152 portfolios) managed by the Manager. He is 50 years old and has been an employee of the Manager since June 1989.
ROBERT SVAGNA, Assistant Treasurer since December 2002.
Senior Accounting Manager – Fixed Income and Equity Funds of the Manager, and an officer of 64 investment companies (comprised of 152 portfolios) managed by the Manager. He is 50 years old and has been an employee of the Manager since November 1990.
JOSEPH W. CONNOLLY, Chief Compliance Officer since October 2004.
Chief Compliance Officer of the Manager and The Dreyfus Family of Funds (64 investment companies, comprised of 152 portfolios). He is 60 years old and has served in various capacities with the Manager since 1980, including manager of the firm’s Fund Accounting Department from 1997 through October 2001.
CARIDAD M. CAROSELLA, Anti-Money Laundering Compliance Officer since January 2016.
Anti-Money Laundering Compliance Officer of the Dreyfus Family of Funds and BNY Mellon Funds Trust since January 2016; from May 2015 to December 2015, Interim Anti-Money Laundering Compliance Officer of the Dreyfus Family of Funds and BNY Mellon Funds Trust and the Distributor; from January 2012 to May 2015, AML Surveillance Officer of the Distributor and from 2007 to December 2011, Financial Processing Manager of the Distributor. She is an officer of 58 investment companies (comprised of 146 portfolios) managed by the Manager. She is 49 years old and has been an employee of the Distributor since 1997.
30
NOTES
31
NOTES
32
NOTES
33
Dreyfus Variable Investment Fund, Opportunistic Small Cap Portfolio
200 Park Avenue
New York, NY 10166
Investment Adviser
The Dreyfus Corporation
200 Park Avenue
New York, NY 10166
Custodian
The Bank of New York Mellon
225 Liberty Street
New York, NY 10286
Transfer Agent &
Dividend Disbursing Agent
Dreyfus Transfer, Inc.
200 Park Avenue
New York, NY 10166
Distributor
MBSC Securities Corporation
200 Park Avenue
New York, NY 10166
Telephone 1-800-258-4260 or 1-800-258-4261
Mail The Dreyfus Family of Funds, 144 Glenn Curtiss Boulevard, Uniondale, NY 11556-0144 Attn: Institutional Services Department
E-mail Send your request to info@dreyfus.com
Internet Information can be viewed online or downloaded at www.dreyfus.com
The fund files its complete schedule of portfolio holdings with the Securities and Exchange Commission (“SEC”) for the first and third quarters of each fiscal year on Form N-Q. The fund’s Forms N-Q are available on the SEC’s website at http://www.sec.gov and may be reviewed and copied at the SEC’s Public Reference Room in Washington, D.C. Information on the operation of the Public Reference Room may be obtained by calling 1-800-SEC-0330.
A description of the policies and procedures that the fund uses to determine how to vote proxies relating to portfolio securities, and information regarding how the fund voted these proxies for the most recent 12-month period ended June 30 is available at http://www.dreyfus.com and on the SEC’s website at http://www.sec.gov. The description of the policies and procedures is also available without charge, upon request, by calling 1-800-DREYFUS.
| | |
© 2018 MBSC Securities Corporation
0121AR1217 | 
|
Dreyfus Variable Investment Fund, Quality Bond Portfolio
| | | |

| | ANNUAL REPORT
December 31, 2017 |
| |
The views expressed in this report reflect those of the portfolio manager(s) only through the end of the period covered and do not necessarily represent the views of Dreyfus or any other person in the Dreyfus organization. Any such views are subject to change at any time based upon market or other conditions and Dreyfus disclaims any responsibility to update such views. These views may not be relied on as investment advice and, because investment decisions for a Dreyfus fund are based on numerous factors, may not be relied on as an indication of trading intent on behalf of any Dreyfus fund. |
| |
Not FDIC-Insured • Not Bank-Guaranteed • May Lose Value |
Contents
THE FUND
FOR MORE INFORMATION
Back Cover
| | | | |
| |
Dreyfus Variable Investment Fund, Quality Bond Portfolio
| | The Fund |
A LETTER FROM THE PRESIDENT OF DREYFUS
Dear Shareholder:
We are pleased to present this annual report for Dreyfus Variable Investment Fund, Quality Bond Portfolio, covering the 12-month period from January 1, 2017 through December 31, 2017. For information about how the fund performed during the reporting period, as well as general market perspectives, we provide a Discussion of Fund Performance on the pages that follow.
Stocks set a series of new record highs and bonds produced modestly positive results during 2017. Financial markets early in the year were dominated by the inauguration of a new U.S. president, as equities and corporate-backed bonds surged higher in anticipation of more business-friendly regulatory, tax, and fiscal policies. U.S. and international stocks continued to rally in the spring as corporate earnings grew and global economic conditions improved. Later in the year, the passage of tax reform legislation fueled additional stock market gains.
Despite three short-term interest rate hikes and concerns early in the year that inflation might accelerate in a growing economy, bonds generally produced positive total returns in 2017. Corporate-backed securities and municipal bonds fared particularly well.
The markets’ strong performance last year was supported by solid underlying fundamentals, including sustained economic growth, a robust labor market, and low inflation. We currently expect these favorable conditions to persist in 2018, but we remain watchful for economic and political developments that could negatively impact the markets. As always, we encourage you to discuss the risks and opportunities of today’s investment environment with your financial advisor.
Thank you for your continued confidence and support.
Sincerely,

Renee Laroche-Morris
President
The Dreyfus Corporation
January 16, 2018
2
DISCUSSION OF FUND PERFORMANCE
For the period from January 1, 2017 through December 31, 2017, as provided by David Bowser, CFA , Portfolio Manager
Market and Fund Performance Overview
For the 12-month period ended December 31, 2017, Dreyfus Variable Investment Fund, Quality Bond Portfolio’s Initial shares produced a total return of 4.50%, and its Service shares produced a total return of 4.25%.1 The Bloomberg Barclays U.S. Aggregate Bond Index (the “Index”), the fund’s benchmark, achieved a total return of 3.54% for the same period.2
Bonds produced positive total returns over the reporting period, on average, when moderating long-term interest rates and muted inflation offset bouts of market weakness stemming from expectations of greater economic growth and more business-friendly government policies. The fund produced higher returns than the Index, primarily due to the success of its sector allocation and security selection strategies.
The Fund’s Investment Approach
The fund seeks to maximize total return, consisting of capital appreciation and current income. To pursue its goal, the fund normally invests at least 80% of its net assets, plus any borrowings for investment purposes, in bonds. The fund’s investments include corporate bonds, debentures, notes, mortgage-related securities, collateralized mortgage obligations and asset-backed securities, convertible debt obligations, preferred stocks, convertible preferred stocks, municipal obligations, and zero coupon bonds, that, when purchased, typically are rated A or better or are the unrated equivalent as determined by The Dreyfus Corporation and in securities issued or guaranteed by the U.S. government or its agencies or instrumentalities, including Treasury inflation-protected securities (“TIPS”).
The fund also may invest up to 10% of its net assets in bonds issued by foreign issuers that are denominated in foreign currencies, and up to 20% of its net assets in bonds issued by foreign issuers whether denominated in U.S. dollars or in a foreign currency.
The fund has no limit with respect to its portfolio maturity or duration.
Economic and Political Developments Drove Bond Markets
Longer-term interest rates rose sharply in the weeks prior to the start of 2017 in response to expectations that a new presidential administration’s more business-friendly regulatory, tax, and fiscal policies would boost U.S. economic growth and inflationary pressures.
In 2017, evidence of stronger economic growth in domestic and overseas markets prompted a gradual move among central banks away from the aggressively accommodative monetary policies of the past few years. In the United States, short-term interest rates continued to rise when the Federal Reserve Board (the “Fed”) implemented three increases in the overnight federal funds rate and began to unwind its balance sheet through sales of U.S. government securities. In contrast, long-term interest rates moderated over much of the year, giving back much of the post-election spike when inflationary pressures remained muted. Rising long-term interest rates in the fall were not enough to fully offset those gains.
Higher-Yielding Market Sectors Fared Best
The fund’s overweighted allocation to corporate-backed bonds helped support its performance compared to the Index. Corporate bond prices were supported by growing earnings, upbeat business sentiment, and investors’ preference for higher levels of current income. Likewise, a relatively heavy position in emerging-market bonds fared well when local interest rates moderated and economic conditions strengthened.
3
DISCUSSION OF FUND PERFORMANCE (continued)
From a security selection perspective, the fund participated in solid returns from a variety of industry groups in the corporate bond market, most notably banks and energy pipeline companies. An emphasis on bonds with credit ratings toward the bottom of the investment-grade range also bolstered relative results.
The fund’s interest-rate strategies worked well as we maintained, at times, a relatively long average duration among U.S. bonds and a relatively short average duration among German bunds. These paired positions enabled the fund to participate in narrowing yield differences between the two markets. Finally, an emphasis on emerging-market currencies such as the Russian ruble and Colombian peso added value when oil prices stabilized. The fund employed currency and interest-rate futures contracts to establish its currency and duration positions.
On a more negative note, the fund’s security selections among mortgage-backed securities hurt relative performance when yield differences narrowed along the market’s maturity spectrum. The fund’s holdings of U.S. and Japanese inflation-adjusted securities also underperformed broad market averages in the low-inflation environment.
Positioned for Modestly Higher Interest Rates
Most analysts expect additional short-term interest-rate hikes by the Fed in 2018, and we anticipate that long-term interest rates will rise modestly in response to continued economic growth and higher inflationary pressures. These developments could constrain total returns from U.S. government securities, but corporate securities currently appear likely to continue to benefit from the global economic expansion and reduced U.S. tax rates.
Therefore, as of year-end, we have maintained the fund’s average duration in a modestly defensive position to protect against rising interest rates, and we have retained overweighted exposure to corporate-backed bonds and inflation-adjusted securities. In contrast, we have established underweighted positions in mortgage-backed securities that could be vulnerable to the Fed’s balance-sheet reduction program.
January 16, 2018
1 Total return includes reinvestment of dividends and any capital gains paid. Past performance is no guarantee of future results. Share price and investment return fluctuate such that upon redemption, fund shares may be worth more or less than their original cost. The fund’s performance does not reflect the deduction of additional charges and expenses imposed in connection with investing in variable insurance contracts, which will reduce returns.
2 Source: Lipper Inc. — The Bloomberg Barclays U.S. Aggregate Bond Index is a broad-based flagship benchmark that measures the investment-grade, U.S. dollar-denominated, fixed-rate taxable bond market. The index includes Treasuries, government-related and corporate securities, MBS (agency fixed-rate and hybrid ARM pass-throughs), ABS, and CMBS (agency and nonagency). Investors cannot invest directly in any index.
Bonds are subject generally to interest-rate, credit, liquidity, and market risks, to varying degrees, all of which are more fully described in the fund’s prospectus. Generally, all other factors being equal, bond prices are inversely related to interest-rate changes, and rate increases can cause price declines.
Investments in foreign currencies are subject to the risk that those currencies will decline in value relative to the U.S. dollar, or, in the case of hedged positions, that the U.S. dollar will decline relative to the currency being hedged. Each of these risks could increase the fund’s volatility.
High yield bonds are subject to increased credit risk and are considered speculative in terms of the issuer’s perceived ability to continue making interest payments on a timely basis and to repay principal upon maturity.
The fund may use derivative instruments, such as options, futures, options on futures, forward contracts, swaps (including credit default swaps on corporate bonds and asset-backed securities), options on swaps, and other credit derivatives. A small investment in derivatives could have a potentially large impact on the fund’s performance.
The fund is only available as a funding vehicle under variable life insurance policies or variable annuity contracts issued by insurance companies. Individuals may not purchase shares of the fund directly. A variable annuity is an insurance contract issued by an insurance company that enables investors to accumulate assets on a tax-deferred basis for retirement or other long-term goals. The investment objective and policies of Dreyfus Variable Investment Fund, Quality Bond Portfolio made available through insurance products may be similar to those of other funds managed or advised by Dreyfus. However, the investment results of the fund may be higher or lower than, and may not be comparable to, those of any other Dreyfus fund.
4
FUND PERFORMANCE

Comparison of change in value of $10,000 investment in Dreyfus Variable Investment Fund, Quality Bond Portfolio Initial shares and Service shares and the Bloomberg Barclays U.S. Aggregate Bond Index (the “Index”)
† Source: Lipper Inc.
Past performance is not predictive of future performance. The fund’s performance does not reflect the deduction of additional charges and expenses imposed in connection with investing in variable insurance contracts which will reduce returns.
The above graph compares a $10,000 investment made in Initial and Service shares of Dreyfus Variable Investment Fund, Quality Bond Portfolio on 12/31/07 to a $10,000 investment made in the Index on that date.
The fund’s performance shown in the line graph above takes into account all applicable fund fees and expenses for Initial and Service shares. The Index is a broad-based flagship benchmark that measures the investment-grade, U.S. dollar-denominated, fixed-rate taxable bond market. The Index includes Treasuries, government-related and corporate securities, MBS (agency fixed-rate and hybrid ARM pass-throughs), ABS and CMBS (agency and nonagency). Unlike a mutual fund, the Index is not subject to charges, fees and other expenses. Investors cannot invest directly in any index. Further information relating to fund performance, including expense reimbursements, if applicable, is contained in the Financial Highlights section of the prospectus and elsewhere in this report.
5
FUND PERFORMANCE (continued)
| | | | |
Average Annual Total Returns as of 12/31/17 |
| | 1 Year | 5 Years | 10 Years |
Initial shares | 4.50% | 1.48% | 3.94% |
Service shares | 4.25% | 1.24% | 3.68% |
Bloomberg Barclays U. S. Aggregate Bond Index | 3.54% | 2.10% | 4.01% |
The performance data quoted represents past performance, which is no guarantee of future results. Share price and investment return fluctuate and an investor’s shares may be worth more or less than original cost upon redemption. Current performance may be lower or higher than the performance quoted. Go to Dreyfus.com for the fund’s most recent month-end returns.
The fund’s Initial shares are not subject to a Rule 12b-1 fee. The fund’s Service shares are subject to a 0.25% annual Rule 12b-1 fee. All dividends and capital gain distributions are reinvested.
The fund’s performance shown in the graph and table does not reflect the deduction of taxes that a shareholder would pay on fund distributions or the redemption of fund shares.
6
UNDERSTANDING YOUR FUND’S EXPENSES (Unaudited)
As a mutual fund investor, you pay ongoing expenses, such as management fees and other expenses. Using the information below, you can estimate how these expenses affect your investment and compare them with the expenses of other funds. You also may pay one-time transaction expenses, including sales charges (loads), redemption fees and expenses associated with variable annuity or insurance contracts, which are not shown in this section and would have resulted in higher total expenses. For more information, see your fund’s prospectus or talk to your financial adviser.
Review your fund’s expenses
The table below shows the expenses you would have paid on a $1,000 investment in Dreyfus Variable Investment Fund, Quality Bond Portfolio from July 1, 2017 to December 31, 2017. It also shows how much a $1,000 investment would be worth at the close of the period, assuming actual returns and expenses.
COMPARING YOUR FUND’S EXPENSES
WITH THOSE OF OTHER FUNDS (Unaudited)
Using the SEC’s method to compare expenses
The Securities and Exchange Commission (“SEC”) has established guidelines to help investors assess fund expenses. Per these guidelines, the table below shows your fund’s expenses based on a $1,000 investment, assuming a hypothetical 5% annualized return. You can use this information to compare the ongoing expenses (but not transaction expenses or total cost) of investing in the fund with those of other funds. All mutual fund shareholder reports will provide this information to help you make this comparison. Please note that you cannot use this information to estimate your actual ending account balance and expenses paid during the period.
| | | | | | | | |
Expenses and Value of a $1,000 Investment | | |
assuming a hypothetical 5% annualized return for the six months ended December 31, 2017 |
| | | | Initial Shares | Service Shares |
Expenses paid per $1,000† | | | $ 5.24 | | $ 6.51 |
Ending value (after expenses) | | | $ 1,020.01 | | $ 1,018.75 |
† Expenses are equal to the fund’s annualized expense ratio of 1.03% for Initial shares and 1.28% for Service shares, multiplied by the average account value over the period, multiplied by 184/365 (to reflect the one-half year period).
7
STATEMENT OF INVESTMENTS
December 31, 2017
| | | | | | | | | | |
| |
Description | Coupon
Rate (%) | | Maturity
Date | | Principal
Amount ($) | a | Value ($) | |
Bonds and Notes - 103.8% | | | | | |
Asset-Backed Certificates - 1.0% | | | | | |
Dell Equipment Finance Trust,
Ser. 2017-2, Cl. A3 | | 2.19 | | 10/24/22 | | 105,000 | b | 104,676 | |
Starwood Waypoint Homes Trust,
Ser. 2017-1, Cl. A, 1 Month LIBOR + .95% | | 2.44 | | 1/17/35 | | 189,308 | b,c | 190,452 | |
Tricon American Homes,
Ser. 2017-SFR2, Cl. A | | 2.93 | | 1/17/36 | | 125,000 | b | 124,565 | |
| | 419,693 | |
Asset-Backed Ctfs./Auto Receivables - 1.8% | | | | | |
AmeriCredit Automobile Receivables Trust,
Ser. 2014-1, Cl. D | | 2.54 | | 6/8/20 | | 275,000 | | 275,795 | |
CarMax Auto Owner Trust,
Ser. 2017-4, Cl. A4 | | 2.33 | | 5/15/23 | | 85,000 | | 84,525 | |
Enterprise Fleet Financing,
Ser. 2017-3, Cl. A2 | | 2.13 | | 5/20/23 | | 100,000 | b | 99,859 | |
Nissan Auto Receivables Owner Trust,
Ser. 2017-B, Cl. A4 | | 1.95 | | 10/16/23 | | 190,000 | | 188,466 | |
OSCAR US Funding Trust VII,
Ser. 2017-2A, Cl. A3 | | 2.45 | | 12/10/21 | | 40,000 | b | 39,780 | |
OSCAR US Funding Trust VII,
Ser. 2017-2A, Cl. A4 | | 2.76 | | 12/10/24 | | 50,000 | b | 49,677 | |
| | 738,102 | |
Commercial Mortgage Pass-Through Ctfs. - 1.6% | | | | | |
Commercial Mortgage Trust,
Ser. 2014-UBS2, Cl. AM | | 4.20 | | 3/10/47 | | 70,000 | | 73,660 | |
Commercial Mortgage Trust,
Ser. 2015-DC1, Cl. A5 | | 3.35 | | 2/10/48 | | 170,000 | | 173,360 | |
Commercial Mortgage Trust,
Ser. 2017-CD3, Cl. A4 | | 3.63 | | 2/10/50 | | 290,000 | | 303,390 | |
Houston Galleria Mall Trust,
Ser. 2015-HGLR, Cl. A1A2 | | 3.09 | | 3/5/37 | | 100,000 | b | 99,203 | |
| | 649,613 | |
Consumer Discretionary - 2.1% | | | | | |
21st Century Fox America,
Gtd. Notes | | 4.00 | | 10/1/23 | | 90,000 | | 94,217 | |
21st Century Fox America,
Gtd. Notes | | 4.75 | | 11/15/46 | | 55,000 | | 63,870 | |
Amazon.com,
Sr. Unscd. Notes | | 4.05 | | 8/22/47 | | 105,000 | b | 113,546 | |
AMC Networks,
Gtd. Notes | | 4.75 | | 8/1/25 | | 35,000 | | 34,781 | |
Charter Communications Operating,
Sr. Scd. Notes | | 5.38 | | 5/1/47 | | 100,000 | | 102,830 | |
8
| | | | | | | | | | |
| |
Description | Coupon
Rate (%) | | Maturity
Date | | Principal
Amount ($) | a | Value ($) | |
Bonds and Notes - 103.8% (continued) | | | | | |
Consumer Discretionary - 2.1% (continued) | | | | | |
Comcast,
Gtd. Notes | | 3.15 | | 3/1/26 | | 155,000 | | 156,274 | |
Cox Communications,
Sr. Unscd. Notes | | 4.60 | | 8/15/47 | | 85,000 | b | 86,057 | |
Newell Brands,
Sr. Unscd. Notes | | 4.20 | | 4/1/26 | | 95,000 | | 99,295 | |
Time Warner,
Gtd. Debs. | | 5.35 | | 12/15/43 | | 110,000 | | 121,659 | |
| | 872,529 | |
Consumer Staples - 1.9% | | | | | |
Anheuser-Busch InBev Finance,
Gtd. Notes | | 4.90 | | 2/1/46 | | 115,000 | | 133,699 | |
Kraft Heinz Foods,
Gtd. Notes | | 3.95 | | 7/15/25 | | 155,000 | | 160,311 | |
Kraft Heinz Foods,
Gtd. Notes | | 6.88 | | 1/26/39 | | 100,000 | | 131,957 | |
Post Holdings,
Gtd. Notes | | 5.50 | | 3/1/25 | | 130,000 | b | 134,875 | |
Reynolds American,
Gtd. Notes | | 4.85 | | 9/15/23 | | 185,000 | | 201,672 | |
| | 762,514 | |
Energy - 4.3% | | | | | |
Andeavor Logistics,
Gtd. Notes | | 3.50 | | 12/1/22 | | 40,000 | | 39,963 | |
Cenovus Energy,
Sr. Unscd. Notes | | 5.25 | | 6/15/37 | | 80,000 | | 82,585 | |
Cheniere Corpus Christi Holdings,
Sr. Scd. Notes | | 5.13 | | 6/30/27 | | 75,000 | | 77,767 | |
Concho Resources,
Gtd. Notes | | 4.88 | | 10/1/47 | | 30,000 | | 32,911 | |
Energy Transfer,
Sr. Unscd. Notes | | 5.15 | | 2/1/43 | | 195,000 | | 185,148 | |
Energy Transfer Partners,
Jr. Sub. Notes, Ser. A | | 6.25 | | 12/15/49 | | 195,000 | | 189,759 | |
EQT,
Sr. Unscd. Notes | | 3.00 | | 10/1/22 | | 10,000 | | 9,903 | |
EQT,
Sr. Unscd. Notes | | 3.90 | | 10/1/27 | | 85,000 | | 84,646 | |
Genesis Energy,
Gtd. Notes | | 6.75 | | 8/1/22 | | 135,000 | | 140,737 | |
Kinder Morgan,
Gtd. Notes | | 7.75 | | 1/15/32 | | 235,000 | | 304,067 | |
Marathon Petroleum,
Sr. Unscd. Notes | | 3.63 | | 9/15/24 | | 150,000 | | 153,161 | |
MPLX,
Sr. Unscd. Notes | | 4.13 | | 3/1/27 | | 70,000 | | 71,810 | |
9
STATEMENT OF INVESTMENTS (continued)
| | | | | | | | | | |
| |
Description | Coupon
Rate (%) | | Maturity
Date | | Principal
Amount ($) | a | Value ($) | |
Bonds and Notes - 103.8% (continued) | | | | | |
Energy - 4.3% (continued) | | | | | |
MPLX,
Sr. Unscd. Notes | | 5.20 | | 3/1/47 | | 60,000 | | 66,044 | |
Petrobras Global Finance,
Gtd. Notes | | 7.38 | | 1/17/27 | | 115,000 | | 126,845 | |
Williams Partners,
Sr. Unscd. Notes | | 4.50 | | 11/15/23 | | 130,000 | | 137,635 | |
Williams Partners,
Sr. Unscd. Notes | | 6.30 | | 4/15/40 | | 65,000 | | 80,148 | |
| | 1,783,129 | |
Financials - 13.4% | | | | | |
ABN AMRO Bank,
Sr. Unscd. Notes | | 2.50 | | 10/30/18 | | 230,000 | b | 231,069 | |
AerCap Ireland Capital,
Gtd. Notes | | 3.50 | | 5/26/22 | | 150,000 | | 152,362 | |
American Express Credit,
Sr. Unscd. Notes, Ser. F | | 2.60 | | 9/14/20 | | 135,000 | | 135,725 | |
American International Group,
Sr. Unscd. Notes | | 4.88 | | 6/1/22 | | 135,000 | | 146,925 | |
Bank of America,
Sr. Unscd. Notes | | 3.00 | | 12/20/23 | | 43,000 | b | 43,134 | |
Bank of America,
Sr. Unscd. Notes | | 4.00 | | 4/1/24 | | 122,000 | | 129,050 | |
Bank of America,
Sr. Unscd. Notes | | 3.50 | | 4/19/26 | | 125,000 | | 127,904 | |
Bank of America,
Sr. Unscd. Notes | | 3.42 | | 12/20/28 | | 109,000 | b | 109,127 | |
Barclays,
Sr. Unscd. Notes | | 4.38 | | 1/12/26 | | 200,000 | | 208,499 | |
Citigroup,
Sr. Unscd. Bonds | | 3.40 | | 5/1/26 | | 205,000 | | 206,542 | |
Citigroup,
Sr. Unscd. Notes | | 3.89 | | 1/10/28 | | 120,000 | | 124,317 | |
Citigroup,
Sr. Unscd. Notes | | 4.65 | | 7/30/45 | | 185,000 | | 211,229 | |
Citigroup,
Sub. Notes | | 4.75 | | 5/18/46 | | 145,000 | | 160,343 | |
Cooperatieve Rabobank,
Gtd. Notes | | 3.75 | | 7/21/26 | | 250,000 | | 253,652 | |
Discover Financial Services,
Sr. Unscd. Notes | | 5.20 | | 4/27/22 | | 274,000 | | 295,174 | |
ERAC USA Finance,
Gtd. Notes | | 3.85 | | 11/15/24 | | 60,000 | b | 62,232 | |
Ford Motor Credit,
Sr. Unscd. Notes, Ser. 1, 3 Month LIBOR + .83% | | 2.38 | | 3/12/19 | | 315,000 | c | 316,642 | |
Goldman Sachs Group,
Sr. Unscd. Notes | | 2.75 | | 9/15/20 | | 105,000 | | 105,584 | |
10
| | | | | | | | | | |
| |
Description | Coupon
Rate (%) | | Maturity
Date | | Principal
Amount ($) | a | Value ($) | |
Bonds and Notes - 103.8% (continued) | | | | | |
Financials - 13.4% (continued) | | | | | |
Goldman Sachs Group,
Sr. Unscd. Notes, 3 Month LIBOR + 1.10% | | 2.52 | | 11/15/18 | | 245,000 | c | 246,548 | |
Goldman Sachs Group,
Sr. Unscd. Notes, 3 Month LIBOR + 1.60% | | 3.08 | | 11/29/23 | | 230,000 | c | 239,584 | |
JPMorgan Chase & Co.,
Sub. Notes | | 4.25 | | 10/1/27 | | 205,000 | | 218,257 | |
JPMorgan Chase & Co.,
Sub. Notes | | 3.63 | | 12/1/27 | | 305,000 | | 308,820 | |
KeyBank,
Sr. Unscd. Bonds | | 2.50 | | 11/22/21 | | 250,000 | | 248,796 | |
Lloyds Banking Group,
Sub. Notes | | 4.65 | | 3/24/26 | | 205,000 | | 216,776 | |
Morgan Stanley,
Sr. Unscd. Notes | | 5.50 | | 7/28/21 | | 100,000 | | 109,462 | |
Morgan Stanley,
Sr. Unscd. Notes | | 3.75 | | 2/25/23 | | 65,000 | | 67,401 | |
Principal Financial Group,
Gtd. Notes | | 4.30 | | 11/15/46 | | 90,000 | | 96,578 | |
Prudential Financial,
Jr. Sub. Notes | | 5.88 | | 9/15/42 | | 240,000 | | 262,500 | |
Quicken Loans,
Gtd. Notes | | 5.75 | | 5/1/25 | | 140,000 | b | 145,601 | |
Visa,
Sr. Unscd. Notes | | 3.15 | | 12/14/25 | | 110,000 | | 112,539 | |
Wells Fargo & Co.,
Sr. Unscd. Notes | | 3.07 | | 1/24/23 | | 110,000 | | 110,876 | |
Wells Fargo & Co.,
Sub. Notes | | 4.30 | | 7/22/27 | | 95,000 | | 101,247 | |
| | 5,504,495 | |
Foreign/Governmental - 7.2% | | | | | |
Argentine Government,
Bonds | ARS | 21.20 | | 9/19/18 | | 3,715,000 | | 194,713 | |
Argentine Government,
Bonds, Ser. POM, Argentine 7-Day Reference Rate | ARS | 27.28 | | 6/21/20 | | 980,000 | c | 56,012 | |
Argentine Government,
Sr. Unscd. Bonds | EUR | 5.25 | | 1/15/28 | | 100,000 | | 125,056 | |
Argentine Government,
Sr. Unscd. Notes | ARS | 5.83 | | 12/31/33 | | 116,000 | d | 49,140 | |
Buenos Aires Province,
Unscd. Bonds, 3 Month BADLAR + 3.83% | ARS | 25.36 | | 5/31/22 | | 2,400,000 | c | 130,512 | |
Japanese Government,
Sr. Unscd.Bonds, Ser. 21 | JPY | 0.10 | | 3/10/26 | | 111,900,000 | e | 1,060,328 | |
11
STATEMENT OF INVESTMENTS (continued)
| | | | | | | | | | |
| |
Description | Coupon
Rate (%) | | Maturity
Date | | Principal
Amount ($) | a | Value ($) | |
Bonds and Notes - 103.8% (continued) | | | | | |
Foreign/Governmental - 7.2% (continued) | | | | | |
Mexican Government,
Bonds, Ser. M | MXN | 5.75 | | 3/5/26 | | 2,705,000 | | 121,745 | |
Mexican Government,
Sr. Unscd. Notes | | 4.75 | | 3/8/44 | | 90,000 | | 91,215 | |
Portuguese Government,
Sr. Unscd. Bonds | EUR | 4.10 | | 2/15/45 | | 150,000 | | 211,577 | |
Senegalese Government,
Unscd. Notes | | 6.25 | | 5/23/33 | | 200,000 | b | 211,691 | |
Turkish Government,
Bonds | TRY | 11.00 | | 2/24/27 | | 1,450,000 | | 366,759 | |
Ukrainian Government,
Sr. Unscd. Notes | | 0.00 | | 5/31/40 | | 95,000 | f | 52,614 | |
Uruguayan Government,
Sr. Unscd. Notes | | 4.38 | | 10/27/27 | | 150,000 | | 161,119 | |
Uruguayan Government,
Sr. Unscd.Bonds | UYU | 8.50 | | 3/15/28 | | 2,900,000 | b | 101,288 | |
| | 2,933,769 | |
Health Care - 3.5% | | | | | |
Abbott Laboratories,
Sr. Unscd. Notes | | 4.90 | | 11/30/46 | | 120,000 | | 138,013 | |
AbbVie,
Sr. Unscd. Notes | | 3.20 | | 5/14/26 | | 135,000 | | 134,810 | |
Aetna,
Sr. Unscd. Notes | | 2.80 | | 6/15/23 | | 265,000 | | 261,095 | |
AmerisourceBergen,
Sr. Unscd. Notes | | 3.25 | | 3/1/25 | | 95,000 | | 95,646 | |
Gilead Sciences,
Sr. Unscd. Notes | | 3.65 | | 3/1/26 | | 55,000 | | 57,101 | |
Gilead Sciences,
Sr. Unscd. Notes | | 4.75 | | 3/1/46 | | 80,000 | | 92,681 | |
HCA,
Gtd. Notes | | 5.38 | | 2/1/25 | | 135,000 | | 140,062 | |
Medtronic,
Gtd. Notes | | 4.63 | | 3/15/45 | | 90,000 | | 105,016 | |
Mylan,
Gtd. Notes | | 3.15 | | 6/15/21 | | 140,000 | | 140,880 | |
Shire Acquisitions Investments Ireland,
Gtd. Notes | | 2.88 | | 9/23/23 | | 135,000 | | 132,867 | |
UnitedHealth Group,
Sr. Unscd. Notes | | 4.75 | | 7/15/45 | | 115,000 | | 136,048 | |
| | 1,434,219 | |
Industrials - 2.5% | | | | | |
Corning,
Sr. Unscd. Notes | | 4.38 | | 11/15/57 | | 80,000 | | 79,706 | |
CSX,
Sr. Unscd. Notes | | 2.60 | | 11/1/26 | | 175,000 | | 167,275 | |
12
| | | | | | | | | | |
| |
Description | Coupon
Rate (%) | | Maturity
Date | | Principal
Amount ($) | a | Value ($) | |
Bonds and Notes - 103.8% (continued) | | | | | |
Industrials - 2.5% (continued) | | | | | |
FedEx,
Gtd. Notes | | 4.40 | | 1/15/47 | | 125,000 | | 133,809 | |
General Electric,
Jr. Sub. Debs., Ser. D | | 5.00 | | 12/29/49 | | 200,000 | | 206,370 | |
General Electric,
Sr. Unscd. Notes, 3 Month LIBOR + .51% | | 1.87 | | 1/14/19 | | 155,000 | c | 155,526 | |
Republic Services,
Sr. Unscd. Notes | | 3.38 | | 11/15/27 | | 40,000 | | 40,369 | |
United Rentals North America,
Gtd. Notes | | 5.75 | | 11/15/24 | | 125,000 | | 132,031 | |
Waste Management,
Gtd. Notes | | 4.10 | | 3/1/45 | | 110,000 | | 118,505 | |
| | 1,033,591 | |
Information Technology - 1.3% | | | | | |
Broadcom,
Gtd. Notes | | 3.00 | | 1/15/22 | | 190,000 | b | 188,546 | |
Dell International,
Sr. Scd. Notes | | 6.02 | | 6/15/26 | | 110,000 | b | 121,457 | |
Hewlett Packard Enterprise,
Sr. Unscd. Notes | | 4.40 | | 10/15/22 | | 70,000 | | 73,631 | |
Oracle,
Sr. Unscd. Notes | | 2.65 | | 7/15/26 | | 140,000 | | 136,610 | |
| | 520,244 | |
Materials - 1.8% | | | | | |
Ardagh Packaging Finance Holdings,
Gtd. Notes | | 6.00 | | 2/15/25 | | 200,000 | b | 211,000 | |
Chemours,
Gtd. Notes | | 5.38 | | 5/15/27 | | 35,000 | | 36,313 | |
Dow Chemical,
Sr. Unscd. Notes | | 3.50 | | 10/1/24 | | 195,000 | | 200,873 | |
Glencore Funding,
Gtd. Notes | | 4.63 | | 4/29/24 | | 165,000 | b | 174,573 | |
LYB International Finance,
Gtd. Bonds | | 4.00 | | 7/15/23 | | 95,000 | | 99,553 | |
| | 722,312 | |
Municipal Bonds - 2.6% | | | | | |
California,
GO (Build America Bonds) | | 7.30 | | 10/1/39 | | 340,000 | | 508,443 | |
New Jersey Economic Development Authority,
School Facilities Construction Revenue | | 4.45 | | 6/15/20 | | 305,000 | | 312,677 | |
New York City,
GO (Build America Bonds) | | 5.99 | | 12/1/36 | | 200,000 | | 258,764 | |
| | 1,079,884 | |
13
STATEMENT OF INVESTMENTS (continued)
| | | | | | | | | | |
| |
Description | Coupon
Rate (%) | | Maturity
Date | | Principal
Amount ($) | a | Value ($) | |
Bonds and Notes - 103.8% (continued) | | | | | |
Telecommunications - 2.1% | | | | | |
AT&T,
Sr. Unscd. Notes | | 4.90 | | 8/14/37 | | 305,000 | | 310,222 | |
AT&T,
Sr. Unscd. Notes | | 5.45 | | 3/1/47 | | 205,000 | | 219,734 | |
Rogers Communications,
Gtd. Notes | | 4.10 | | 10/1/23 | | 80,000 | | 84,035 | |
Verizon Communications,
Sr. Unscd. Notes | | 3.38 | | 2/15/25 | | 159,000 | b | 159,815 | |
Zayo Group,
Gtd. Notes | | 5.75 | | 1/15/27 | | 75,000 | b | 76,687 | |
| | 850,493 | |
U.S. Government Agencies Mortgage-Backed - 25.5% | | | | | |
Federal Home Loan Mortgage Corp.: | | | |
4.00% | | | 2,135,000 | g,h | 2,233,590 | |
3.00%, 11/1/46 | | | 329,055 | h | 329,758 | |
3.50%, 8/1/45 | | | 192,571 | h | 198,780 | |
5.50%, 5/1/40 | | | 4,828 | h | 5,281 | |
Federal National Mortgage Association: | | | |
3.00%, 11/1/30 | | | 1,028,294 | h | 1,050,204 | |
3.19%, 3/1/27 | | | 1,008,629 | h | 1,034,476 | |
3.50%, 5/1/30-11/1/45 | | | 2,657,571 | h | 2,743,583 | |
4.50%, 10/1/40 | | | 610,779 | h | 652,706 | |
5.00%, 3/1/21-10/1/33 | | | 356,278 | h | 383,319 | |
7.00%, 6/1/29-9/1/29 | | | 15,878 | h | 16,593 | |
Government National Mortgage Association I: | | | |
5.50%, 4/15/33 | | | 259,373 | | 288,394 | |
Government National Mortgage Association II: | | | |
3.00%, 11/20/45 | | | 952,155 | | 961,768 | |
4.00%, 10/20/47 | | | 492,317 | | 515,881 | |
7.00%, 9/20/28-7/20/29 | | | 3,452 | | 4,005 | |
| | 10,418,338 | |
U.S. Government Securities - 29.6% | | | | | |
U.S. Treasury Bonds | | 4.50 | | 2/15/36 | | 545,000 | | 701,314 | |
U.S. Treasury Bonds | | 2.75 | | 8/15/47 | | 505,000 | | 505,172 | |
U.S. Treasury Bonds | | 2.75 | | 11/15/47 | | 550,000 | | 550,369 | |
U.S. Treasury Floating Rate Notes,
3 Month U.S. T-BILL + .06% | | 1.51 | | 7/31/19 | | 4,025,000 | c | 4,028,116 | |
U.S. Treasury Floating Rate Notes,
3 Month U.S. T-BILL + .19% | | 1.64 | | 4/30/18 | | 290,000 | c | 290,224 | |
U.S. Treasury Inflation Protected Securities,
Notes | | 0.63 | | 1/15/26 | | 773,429 | i,j | 786,608 | |
U.S. Treasury Inflation Protected Securities,
Notes | | 0.38 | | 1/15/27 | | 1,644,116 | i | 1,634,050 | |
14
| | | | | | | | | | |
| |
Description | Coupon
Rate (%) | | Maturity
Date | | Principal
Amount ($) | a | Value ($) | |
Bonds and Notes - 103.8% (continued) | | | | | |
U.S. Government Securities - 29.6% (continued) | | | | | |
U.S. Treasury Notes | | 1.63 | | 10/15/20 | | 1,010,000 | | 1,001,070 | |
U.S. Treasury Notes | | 1.75 | | 11/15/20 | | 780,000 | | 775,547 | |
U.S. Treasury Notes | | 2.00 | | 10/31/22 | | 1,845,000 | | 1,828,943 | |
| | 12,101,413 | |
Utilities - 1.6% | | | | | |
Dominion Energy,
Sr. Unscd. Notes, Ser. D | | 2.85 | | 8/15/26 | | 165,000 | | 159,604 | |
Exelon Generation,
Sr. Unscd. Notes | | 6.25 | | 10/1/39 | | 85,000 | | 99,678 | |
Kentucky Utilities,
First Mortgage Bonds | | 4.38 | | 10/1/45 | | 80,000 | | 89,152 | |
Louisville Gas & Electric,
First Mortgage Bonds | | 4.38 | | 10/1/45 | | 90,000 | | 100,296 | |
Nevada Power,
Mortgage Notes, Ser. R | | 6.75 | | 7/1/37 | | 150,000 | | 212,429 | |
| | 661,159 | |
Total Bonds and Notes
(cost $41,834,494) | | 42,485,497 | |
Description /Number of Contracts/Counterparty | Exercise
Price | | Expiration Date | | Notional
Amount | a | Value ($) | |
Options Purchased - .0% | | | | | |
Call Options - .0% | | | | | |
10 Year Interest Rate Swaption,
Contracts 2,090 Citigroup | | 2.10 | | 4/2018 | | 2,090,000 | | 4,780 | |
Swedish Krona Cross Currency,
Contracts 995 Goldman Sachs International | NOK | 1.04 | | 1/2018 | | 995,000 | | 23 | |
| | 4,803 | |
Put Options - .0% | | | | | |
British Pound Cross Currency,
Contracts 50 Goldman Sachs International | EUR | 0.87 | | 2/2018 | | 50,000 | | 139 | |
Japanese Yen Cross Currency,
Contracts 155 JP Morgan Chase Bank | CAD | 86.00 | | 1/2018 | | 155,000 | | 2 | |
Norwegian Krone Cross Currency,
Contracts 55 Citigroup | EUR | 9.30 | | 2/2018 | | 55,000 | | 3 | |
Norwegian Krone Cross Currency,
Contracts 50 Citigroup | EUR | 9.75 | | 3/2018 | | 50,000 | | 437 | |
Swedish Krona Cross Currency,
Contracts 55 Goldman Sachs International | EUR | 9.80 | | 3/2018 | | 55,000 | | 669 | |
Turkish Lira,
Contracts 60 Citigroup | | 3.93 | | 2/2018 | | 60,000 | | 1,906 | |
15
STATEMENT OF INVESTMENTS (continued)
| | | | | | | | | | |
| |
Description /Number of Contracts/Counterparty | Exercise
Price | | Expiration Date | | Notional
Amount | a | Value ($) | |
Options Purchased - .0% (continued) | | | | | |
Put Options - .0% (continued) | | | | | |
Turkish Lira,
Contracts 120 JP Morgan Chase Bank | | 3.86 | | 3/2018 | | 120,000 | | 2,476 | |
| | 5,632 | |
Total Options Purchased
(cost $18,267) | | 10,435 | |
Description | Yield at
Date of
Purchase (%) | | Maturity Date | | Principal Amount ($) | | Value ($) | |
Short-Term Investments - .2% | | | | | |
U.S. Treasury Bills
(cost $59,891) | | 1.11 | | 3/1/18 | | 60,000 | k | 59,877 | |
Description | | | | | Shares | | Value ($) | |
Other Investment - .9% | | | | | |
Registered Investment Company; | | | | | |
Dreyfus Institutional Preferred Government Plus Money Market Fund
(cost $364,281) | | | | | | 364,281 | l | 364,281 | |
Total Investments (cost $42,276,933) | | 104.9% | 42,920,090 | |
Liabilities, Less Cash and Receivables | | (4.9%) | (1,998,556) | |
Net Assets | | 100.0% | 40,921,534 | |
BADLAR—Buenos Aires Interbank Offer Rate
GO—General Obligation
LIBOR—London Interbank Offered Rate
ARS—Argentine Peso
CAD—Canadian Dollar
EUR—Euro
JPY—Japanese Yen
MXN—Mexican Peso
TRY—Turkish Lira
UYU—Uruguayan Peso
a Amount stated in U.S. Dollars unless otherwise noted above.
b Security exempt from registration pursuant to Rule 144A under the Securities Act of 1933. These securities may be resold in transactions exempt from registration, normally to qualified institutional buyers. At December 31, 2017, these securities were valued at $2,878,910 or 7.04% of net assets.
c Variable rate security—rate shown is the interest rate in effect at period end.
d Principal amount for accrual purposes is periodically adjusted based on changes in the Argentine Consumer Price Index.
e Principal amount for accrual purposes is periodically adjusted based on changes in the Japanese Consumer Price Index.
f Security issued with a zero coupon. Income is recognized through the accretion of discount.
g Purchased on a forward commitment basis.
h The Federal Housing Finance Agency (“FHFA”) placed the Federal Home Loan Mortgage Corporation and Federal National Mortgage Association into conservatorship with FHFA as the conservator. As such, the FHFA oversees the continuing affairs of these companies.
i Principal amount for accrual purposes is periodically adjusted based on changes in the Consumer Price Index.
j Security, or portion thereof, on loan. At December 31, 2017, the value of the fund’s securities on loan was $786,608 and the value of the collateral held by the fund was $801,841, consisting of U.S. Government & Agency securities.
k Held by a counterparty for open futures contracts.
l Investment in affiliated money market mutual fund.
16
| | |
Portfolio Summary (Unaudited) † | Value (%) |
U.S. Government and Agencies/Mortgage-Backed | 55.1 |
Corporate Bonds | 34.5 |
Foreign/Governmental | 7.2 |
Asset-Backed | 2.8 |
Municipal Bonds | 2.6 |
Commercial Mortgage-Backed | 1.6 |
Short-Term/Money Market Investment | 1.1 |
Options Purchased | .0 |
| | 104.9 |
† Based on net assets.
See notes to financial statements.
17
STATEMENT OF INVESTMENTS IN AFFILIATED ISSUERS
| | | | | | | |
Registered Investment Company | Value
12/31/16($) | Purchases($) | Sales($) | Value
12/31/17($) | Net
Assets(%) | Dividends/
Distributions($) |
Dreyfus Institutional Preferred Government Plus Money Market Fund | 175,460 | 18,468,420 | 18,279,599 | 364,281 | .9 | 3,891 |
Dreyfus Institutional Preferred Government Money Market Fund, Institutional Shares | 1,507,254 | 10,085,295 | 11,592,549 | - | - | - |
Total | 1,682,714 | 28,553,715 | 29,872,148 | 364,281 | .9 | 3,891 |
See notes to financial statements.
18
STATEMENT OF FUTURES
December 31, 2017
| | | | | | | |
Description | Number of
Contracts | Expiration | Notional
Value ($) | Value ($) | Unrealized Appreciation (Depreciation) ($) | |
Futures Long | | |
Euro BTP Italian Government Bond | 1 | 3/2018 | 167,439a | 163,347 | (4,092) | |
U.S. Treasury 2 Year Notes | 23 | 3/2018 | 4,935,340 | 4,924,516 | (10,824) | |
U.S. Treasury 5 Year Notes | 16 | 3/2018 | 1,867,212 | 1,858,625 | (8,587) | |
Futures Short | | |
Euro 30 Year Bond | 1 | 3/2018 | (201,094)a | (196,607) | 4,487 | |
Euro-Bond | 1 | 3/2018 | (195,886)a | (193,991) | 1,895 | |
Japanese 10 Year Bond | 1 | 3/2018 | (1,338,892)a | (1,338,185) | 707 | |
Ultra 10 Year U.S. Treasury Notes | 24 | 3/2018 | (3,223,210) | (3,205,500) | 17,710 | |
Gross Unrealized Appreciation | | 24,799 | |
Gross Unrealized Depreciation | | (23,503) | |
a Notional amounts in foreign currency have been converted to USD using relevant foreign exchange rates.
See notes to financial statements.
19
STATEMENT OF OPTIONS WRITTEN
December 31, 2017
| | | | | | | |
Description/ Expiration Date/ Exercise Price | Counterparty | Number of Contracts | Notional Amount | a | Value ($) | |
Call Options: | | | | | | |
British Pound Cross Currency,
February 2018 @ 0.915 | Goldman Sachs International | 50 | 50,000 | EUR | (167) | |
Japanese Yen Cross Currency,
January 2018 @ 92 | JP Morgan Chase Bank | 155 | 155,000 | CAD | (5) | |
Norwegian Krone Cross Currency,
February 2018 @ 9.7 | Citigroup | 55 | 55,000 | EUR | (1,290) | |
Norwegian Krone Cross Currency,
March 2018 @ 10.05 | Citigroup | 50 | 50,000 | EUR | (377) | |
Russian Ruble,
March 2018 @ 62 | Citigroup | 60 | 60,000 | | (180) | |
South African Rand,
February 2018 @ 15.5 | Citigroup | 60 | 60,000 | | (7) | |
Swedish Krona Cross Currency,
March 2018 @ 10.2 | Goldman Sachs International | 55 | 55,000 | EUR | (171) | |
Turkish Lira,
February 2018 @ 4.32 | Citigroup | 60 | 60,000 | | (75) | |
Turkish Lira,
March 2018 @ 4.21 | JP Morgan Chase Bank | 120 | 120,000 | | (559) | |
Put Options: | | | | | | |
Swedish Krona Cross Currency,
January 2018 @ 1 | Goldman Sachs International | 995 | 995,000 | NOK | (1,017) | |
Total Options Written (premiums received $6,368) | | | | (3,848) | |
a Notional amount stated in U.S. Dollars unless otherwise indicated.
CAD—Canadian Dollar
EUR—Euro
NOK—Norwegian Krone
See notes to financial statements.
20
STATEMENT OF FORWARD FOREIGN CURRENCY EXCHANGE CONTRACTS December 31, 2017
| | | | | | |
Counterparty/ Purchased
Currency | Purchased Currency
Amounts | Currency
Sold | Sold
Currency
Amounts | Settlement Date | Unrealized Appreciation (Depreciation)($) |
Bank of America | | | |
United States Dollar | 124,871 | Thai Baht | 4,133,000 | 1/31/18 | (2,068) |
Barclays Bank | | | |
Czech Koruna | 1,570,000 | United States Dollar | 71,921 | 1/31/18† | 1,950 |
Malaysian Ringgit | 325,000 | United States Dollar | 77,078 | 1/30/18 | 3,124 |
United States Dollar | 71,921 | Euro | 61,445 | 1/31/18† | (1,955) |
Citigroup | | | |
United States Dollar | 285,101 | Argentine Peso | 5,230,000 | 3/15/18 | 15,509 |
United States Dollar | 625,635 | Euro | 529,000 | 1/31/18 | (10,392) |
United States Dollar | 75,262 | Peruvian New Sol | 245,000 | 1/31/18 | (182) |
United States Dollar | 249,377 | Taiwan Dollar | 7,505,000 | 1/31/18 | (3,319) |
United States Dollar | 86,979 | South African Rand | 1,254,000 | 1/31/18 | (13,827) |
HSBC | | | |
Argentine Peso | 2,980,000 | United States Dollar | 161,081 | 1/31/18 | (4,107) |
Norwegian Krone | 1,525,000 | United States Dollar | 182,509 | 1/31/18 | 3,414 |
Swedish Krona | 2,090,000 | United States Dollar | 248,344 | 1/31/18 | 6,975 |
United States Dollar | 74,163 | Canadian Dollar | 95,000 | 1/31/18 | (1,452) |
United States Dollar | 955,585 | Japanese Yen | 108,110,000 | 1/31/18 | (5,485) |
JP Morgan Chase Bank | | | |
Colombian Peso | 224,815,000 | United States Dollar | 73,268 | 1/31/18 | 1,814 |
British Pound | 105,000 | United States Dollar | 140,169 | 1/31/18 | 1,760 |
Indonesian Rupiah | 1,663,575,000 | United States Dollar | 122,075 | 1/31/18 | 137 |
Indian Rupee | 3,970,000 | United States Dollar | 60,841 | 1/31/18 | 1,111 |
Peruvian New Sol | 245,000 | United States Dollar | 75,281 | 1/31/18 | 163 |
United States Dollar | 125,145 | Hong Kong Dollar | 970,000 | 1/12/18 | 952 |
United States Dollar | 115,574 | South Korean Won | 128,550,000 | 1/31/18 | (4,572) |
21
STATEMENT OF FORWARD FOREIGN CURRENCY EXCHANGE CONTRACTS (continued)
| | | | | | |
Counterparty/ Purchased
Currency | Purchased Currency
Amounts | Currency
Sold | Sold
Currency
Amounts | Settlement Date | Unrealized Appreciation (Depreciation)($) |
JP Morgan Chase Bank (continued) |
United States Dollar | 112,474 | Philippine Peso | 5,800,000 | 1/31/18 | (3,532) |
United States Dollar | 91,427 | Romanian Leu | 360,000 | 1/31/18 | (1,093) |
UBS | | | |
Czech Koruna | 6,645,000 | United States Dollar | 304,405 | 1/31/18† | 8,253 |
Euro | 30,000 | United States Dollar | 35,723 | 1/31/18 | 347 |
Singapore Dollar | 120,000 | United States Dollar | 87,973 | 1/31/18 | 1,798 |
United States Dollar | 304,406 | Euro | 259,974 | 1/31/18† | (8,166) |
Gross Unrealized Appreciation | | | 47,307 |
Gross Unrealized Depreciation | | | (60,150) |
† Cross currency forward exchange contracts.
See notes to financial statements.
22
STATEMENT OF SWAP AGREEMENTS
December 31, 2017
| | | | | |
Centrally Cleared Interest Rate Swaps | |
Notional
Amount($)† | Currency/
Floating Rate | (Pay) Receive
Fixed Rate (%) | Expiration | Unrealized Appreciation ($) |
15,375,000 | USD - 3 Month US CPI Urban Consumers NSA | (1.68) | 4/25/2018 | 14,329 |
Gross Unrealized Appreciation | 14,329 |
CPI—Consumer Price Index
USD—United States Dollar
† Clearing House-Chicago Mercantile Exchange or LCH (Clearing)
See notes to financial statements.
23
STATEMENT OF ASSETS AND LIABILITIES
December 31, 2017
| | | | | | | |
| | | | | | |
| | | Cost | | Value | |
Assets ($): | | | | |
Investments in securities—See Statement of Investments
(including securities on loan, valued at $786,608)—Note 1(c): | | | |
Unaffiliated issuers | 41,912,652 | | 42,555,809 | |
Affiliated issuers | | 364,281 | | 364,281 | |
Cash | | | | | 8,007 | |
Cash denominated in foreign currency | | | 12,446 | | 11,742 | |
Dividends, interest and securities lending income receivable | | 288,402 | |
Cash collateral held by broker—Note 4 | | 56,017 | |
Unrealized appreciation on forward foreign
currency exchange contracts—Note 4 | | 47,307 | |
Receivable for swap variation margin—Note 4 | | 6,095 | |
Receivable for investment securities sold | | 4,187 | |
Prepaid expenses | | | | | 457 | |
| | | | | 43,342,304 | |
Liabilities ($): | | | | |
Due to The Dreyfus Corporation and affiliates—Note 3(b) | | | | | 36,117 | |
Payable for open mortgage dollar roll transactions—Note 4 | | 2,230,778 | |
Unrealized depreciation on forward foreign
currency exchange contracts—Note 4 | | 60,150 | |
Payable for shares of Beneficial Interest redeemed | | 4,889 | |
Payable for futures variation margin—Note 4 | | 4,383 | |
Outstanding options written, at value
(premiums received $6,368)—Note 4 | | 3,848 | |
Payable for investment securities purchased | | 1,537 | |
Accrued expenses | | | | | 79,068 | |
| | | | | 2,420,770 | |
Net Assets ($) | | | 40,921,534 | |
Composition of Net Assets ($): | | | | |
Paid-in capital | | | | | 40,564,695 | |
Accumulated undistributed investment income—net | | 352,800 | |
Accumulated net realized gain (loss) on investments | | | | | (644,338) | |
Accumulated net unrealized appreciation (depreciation)
on investments, options transactions and foreign currency
transactions (including $1,296 net unrealized
appreciation on futures and $14,329
net unrealized appreciation on centrally cleared swap
agreements) | | | | 648,377 | |
Net Assets ($) | | | 40,921,534 | |
| | | | |
Net Asset Value Per Share | Initial Shares | Service Shares | |
Net Assets ($) | 37,583,522 | 3,338,012 | |
Shares Outstanding | 3,142,292 | 280,205 | |
Net Asset Value Per Share ($) | 11.96 | 11.91 | |
| | | | |
See notes to financial statements. | | | |
24
STATEMENT OF OPERATIONS
Year Ended December 31, 2017
| | | | | | | |
| | | | | | |
| | | | | | |
Investment Income ($): | | | | |
Income: | | | | |
Interest (net of $1,062 foreign taxes withheld at source) | | | 1,386,467 | |
Dividends from affiliated issuers | | | 3,891 | |
Income from securities lending—Note 1(c) | | | 5,269 | |
Total Income | | | 1,395,627 | |
Expenses: | | | | |
Investment advisory fee—Note 3(a) | | | 308,468 | |
Professional fees | | | 66,286 | |
Pricing service fees | | | 31,082 | |
Distribution fees—Note 3(b) | | | 22,569 | �� |
Prospectus and shareholders’ reports | | | 21,798 | |
Custodian fees—Note 3(b) | | | 6,677 | |
Trustees’ fees and expenses—Note 3(c) | | | 4,172 | |
Loan commitment fees—Note 2 | | | 1,835 | |
Shareholder servicing costs—Note 3(b) | | | 600 | |
Interest expense—Note 2 | | | 492 | |
Miscellaneous | | | 25,469 | |
Total Expenses | | | 489,448 | |
Less—reduction in fees due to earnings credits—Note 3(b) | | | (170) | |
Net Expenses | | | 489,278 | |
Investment Income—Net | | | 906,349 | |
Realized and Unrealized Gain (Loss) on Investments—Note 4 ($): | | |
Net realized gain (loss) on investments and foreign currency transactions | 318,938 | |
Net realized gain (loss) on options transactions | 53,724 | |
Net realized gain (loss) on futures | (46,634) | |
Net realized gain (loss) on forward foreign currency exchange contracts | 38,237 | |
Net Realized Gain (Loss) | | | 364,265 | |
Net unrealized appreciation (depreciation) on investments
and foreign currency transactions | | | 854,527 | |
Net unrealized appreciation (depreciation) on options transactions | (4,743) | |
Net unrealized appreciation (depreciation) on futures | | | 14,617 | |
Net unrealized appreciation (depreciation) on swap agreements | | | 14,329 | |
Net unrealized appreciation (depreciation) on
forward foreign currency exchange contracts | | | (2,322) | |
Net Unrealized Appreciation (Depreciation) | | | 876,408 | |
Net Realized and Unrealized Gain (Loss) on Investments | | | 1,240,673 | |
Net Increase in Net Assets Resulting from Operations | | 2,147,022 | |
| | | | | | | |
See notes to financial statements. | | | | | |
25
STATEMENT OF CHANGES IN NET ASSETS
| | | | | | | | | | |
| | | | Year Ended December 31, |
| | | | 2017 | | 2016 | |
Operations ($): | | | | | | | | |
Investment income—net | | | 906,349 | | | | 887,775 | |
Net realized gain (loss) on investments | | 364,265 | | | | (414,564) | |
Net unrealized appreciation (depreciation)
on investments | | 876,408 | | | | 513,638 | |
Net Increase (Decrease) in Net Assets
Resulting from Operations | 2,147,022 | | | | 986,849 | |
Distributions to Shareholders from ($): | |
Investment income—net: | | | | | | | | |
Initial Shares | | | (813,417) | | | | (752,627) | |
Service Shares | | | (171,803) | | | | (207,733) | |
Total Distributions | | | (985,220) | | | | (960,360) | |
Beneficial Interest Transactions ($): | |
Net proceeds from shares sold: | | | | | | | | |
Initial Shares | | | 3,032,116 | | | | 2,604,787 | |
Service Shares | | | 743,815 | | | | 967,075 | |
Distributions reinvested: | | | | | | | | |
Initial Shares | | | 813,417 | | | | 752,627 | |
Service Shares | | | 171,803 | | | | 207,733 | |
Cost of shares redeemed: | | | | | | | | |
Initial Shares | | | (6,262,415) | | | | (8,298,954) | |
Service Shares | | | (10,408,658) | | | | (2,961,558) | |
Increase (Decrease) in Net Assets
from Beneficial Interest Transactions | (11,909,922) | | | | (6,728,290) | |
Total Increase (Decrease) in Net Assets | (10,748,120) | | | | (6,701,801) | |
Net Assets ($): | |
Beginning of Period | | | 51,669,654 | | | | 58,371,455 | |
End of Period | | | 40,921,534 | | | | 51,669,654 | |
Undistributed investment income—net | 352,800 | | | | 436,344 | |
Capital Share Transactions (Shares): | |
Initial Shares | | | | | | | | |
Shares sold | | | 254,562 | | | | 218,738 | |
Shares issued for distributions reinvested | | | 68,573 | | | | 63,301 | |
Shares redeemed | | | (527,187) | | | | (695,459) | |
Net Increase (Decrease) in Shares Outstanding | (204,052) | | | | (413,420) | |
Service Shares | | | | | | | | |
Shares sold | | | 63,079 | | | | 82,087 | |
Shares issued for distributions reinvested | | | 14,585 | | | | 17,550 | |
Shares redeemed | | | (874,202) | | | | (249,761) | |
Net Increase (Decrease) in Shares Outstanding | (796,538) | | | | (150,124) | |
| | | | | | | | | | |
See notes to financial statements. | | | | | | | | |
26
FINANCIAL HIGHLIGHTS
The following tables describe the performance for each share class for the fiscal periods indicated. All information (except portfolio turnover rate) reflects financial results for a single fund share. Total return shows how much your investment in the fund would have increased (or decreased) during each period, assuming you had reinvested all dividends and distributions. The fund’s total returns do not reflect expenses associated with variable annuity or insurance contracts. These figures have been derived from the fund’s financial statements.
| | | | | | | |
| | | |
| | | Year Ended December 31, |
Initial Shares | | 2017 | 2016 | 2015 | 2014 | 2013 |
Per Share Data ($): | | | | | | |
Net asset value, beginning of period | | 11.69 | 11.72 | 12.16 | 11.85 | 12.37 |
Investment Operations: | | | | | | |
Investment income—neta | | .23 | .20 | .23 | .20 | .21 |
Net realized and unrealized
gain (loss) on investments | | .29 | (.02)b | (.43) | .36 | (.39) |
Total from Investment Operations | | .52 | .18 | (.20) | .56 | (.18) |
Distributions: | | | | | | |
Dividends from
investment income—net | | (.25) | (.21) | (.24) | (.25) | (.34) |
Net asset value, end of period | | 11.96 | 11.69 | 11.72 | 12.16 | 11.85 |
Total Return (%) | | 4.50 | 1.52 | (1.65) | 4.79 | (1.54) |
Ratios/Supplemental Data (%): | | | | | | |
Ratio of total expenses
to average net assets | | .98 | .94 | .92 | .85 | .92 |
Ratio of net expenses
to average net assets | | .98 | .94 | .92 | .85 | .92 |
Ratio of net investment income
to average net assets | | 1.97 | 1.65 | 1.91 | 1.68 | 1.76 |
Portfolio Turnover Ratec | | 161.74 | 227.98 | 314.50 | 387.86 | 397.26 |
Net Assets, end of period ($ x 1,000) | | 37,584 | 39,133 | 44,057 | 49,880 | 55,337 |
a Based on average shares outstanding.
b In addition to net realized and unrealized gains on investments, this amount includes a decrease in net asset value per share resulting from the timing of issuances and redemptions of shares in relation to fluctuating market values for the portfolio investments.
c The portfolio turnover rates excluding mortgage dollar roll transactions for the periods ended December 31, 2017, 2016, 2015, 2014 and 2013 were 106.51%, 172.50%, 120.54%, 182.67% and 176.37% %, respectively.
See notes to financial statements.
27
FINANCIAL HIGHLIGHTS (continued)
| | | | | | | |
| | | |
| | | Year Ended December 31, |
Service Shares | | 2017 | 2016 | 2015 | 2014 | 2013 |
Per Share Data ($): | | | | | | |
Net asset value, beginning of period | | 11.64 | 11.67 | 12.11 | 11.80 | 12.33 |
Investment Operations: | | | | | | |
Investment income—neta | | .20 | .17 | .20 | .17 | .18 |
Net realized and unrealized
gain (loss) on investments | | .29 | (.02)b | (.42) | .36 | (.40) |
Total from Investment Operations | | .49 | .15 | (.22) | .53 | (.22) |
Distributions: | | | | | | |
Dividends from
investment income—net | | (.22) | (.18) | (.22) | (.22) | (.31) |
Net asset value, end of period | | 11.91 | 11.64 | 11.67 | 12.11 | 11.80 |
Total Return (%) | | 4.25 | 1.27 | (1.89) | 4.56 | (1.80) |
Ratios/Supplemental Data (%): | | | | | | |
Ratio of total expenses
to average net assets | | 1.23 | 1.19 | 1.17 | 1.10 | 1.17 |
Ratio of net expenses
to average net assets | | 1.23 | 1.19 | 1.17 | 1.10 | 1.17 |
Ratio of net investment income
to average net assets | | 1.64 | 1.40 | 1.66 | 1.43 | 1.51 |
Portfolio Turnover Ratec | | 161.74 | 227.98 | 314.50 | 387.86 | 397.26 |
Net Assets, end of period ($ x 1,000) | | 3,338 | 12,537 | 14,314 | 17,359 | 19,561 |
a Based on average shares outstanding.
b In addition to net realized and unrealized gains on investments, this amount includes a decrease in net asset value per share resulting from the timing of issuances and redemptions of shares in relation to fluctuating market values for the portfolio investments.
c The portfolio turnover rates excluding mortgage dollar roll transactions for the periods ended December 31, 2017, 2016, 2015, 2014 and 2013 were 106.51%, 172.50%, 120.54%, 182.67% and 176.37% %, respectively.
See notes to financial statements.
28
NOTES TO FINANCIAL STATEMENTS
NOTE 1—Significant Accounting Policies:
Quality Bond Portfolio (the “fund”) is a separate diversified series of Dreyfus Variable Investment Fund (the “Company”), which is registered under the Investment Company Act of 1940, as amended (the “Act”), as an open-end management investment company and operates as a series company currently offering seven series, including the fund. The fund is only offered to separate accounts established by insurance companies to fund variable annuity contracts and variable life insurance policies. The fund’s investment objective is to seek to maximize total return, consisting of capital appreciation and current income. The Dreyfus Corporation (the “Manager” or “Dreyfus”), a wholly-owned subsidiary of The Bank of New York Mellon Corporation (“BNY Mellon”), serves as the fund’s investment adviser.
MBSC Securities Corporation (the “Distributor”), a wholly-owned subsidiary of Dreyfus, is the distributor of the fund’s shares, which are sold without a sales charge. The fund is authorized to issue an unlimited number of $.001 par value shares of Beneficial Interest in each of the following classes of shares: Initial and Service. Each class of shares has identical rights and privileges, except with respect to the Distribution Plan, and the expenses borne by each class, the allocation of certain transfer agency costs and certain voting rights. Income, expenses (other than expenses attributable to a specific class), and realized and unrealized gains or losses on investments are allocated to each class of shares based on its relative net assets.
The Company accounts separately for the assets, liabilities and operations of each series. Expenses directly attributable to each series are charged to that series’ operations; expenses which are applicable to all series are allocated among them on a pro rata basis.
The Financial Accounting Standards Board (“FASB”) Accounting Standards Codification (“ASC”) is the exclusive reference of authoritative U.S. generally accepted accounting principles (“GAAP”) recognized by the FASB to be applied by nongovernmental entities. Rules and interpretive releases of the Securities and Exchange Commission (“SEC”) under authority of federal laws are also sources of authoritative GAAP for SEC registrants. The fund’s financial statements are prepared in accordance with GAAP, which may require the use of management estimates and assumptions. Actual results could differ from those estimates.
The Company enters into contracts that contain a variety of indemnifications. The fund’s maximum exposure under these
29
NOTES TO FINANCIAL STATEMENTS (continued)
arrangements is unknown. The fund does not anticipate recognizing any loss related to these arrangements.
(a) Portfolio valuation: The fair value of a financial instrument is the amount that would be received to sell an asset or paid to transfer a liability in an orderly transaction between market participants at the measurement date (i.e., the exit price). GAAP establishes a fair value hierarchy that prioritizes the inputs of valuation techniques used to measure fair value. This hierarchy gives the highest priority to unadjusted quoted prices in active markets for identical assets or liabilities (Level 1 measurements) and the lowest priority to unobservable inputs (Level 3 measurements).
Additionally, GAAP provides guidance on determining whether the volume and activity in a market has decreased significantly and whether such a decrease in activity results in transactions that are not orderly. GAAP requires enhanced disclosures around valuation inputs and techniques used during annual and interim periods.
Various inputs are used in determining the value of the fund’s investments relating to fair value measurements. These inputs are summarized in the three broad levels listed below:
Level 1—unadjusted quoted prices in active markets for identical investments.
Level 2—other significant observable inputs (including quoted prices for similar investments, interest rates, prepayment speeds, credit risk, etc.).
Level 3—significant unobservable inputs (including the fund’s own assumptions in determining the fair value of investments).
The inputs or methodology used for valuing securities are not necessarily an indication of the risk associated with investing in those securities.
Changes in valuation techniques may result in transfers in or out of an assigned level within the disclosure hierarchy. Valuation techniques used to value the fund’s investments are as follows:
Registered investment companies that are not traded on an exchange are valued at their net asset value and are generally categorized within Level 1 of the fair value hierarchy.
Investments in securities, excluding short-term investments (other than U.S. Treasury Bills), futures, options and forward foreign currency exchange contracts (“forward contracts”) are valued each business day by an independent pricing service (the “Service”) approved by the Company’s Board of Trustees (the “Board”). Investments for which quoted bid prices
30
are readily available and are representative of the bid side of the market in the judgment of the Service are valued at the mean between the quoted bid prices (as obtained by the Service from dealers in such securities) and asked prices (as calculated by the Service based upon its evaluation of the market for such securities). Other investments (which constitute a majority of the portfolio securities) are valued as determined by the Service, based on methods which include consideration of the following: yields or prices of securities of comparable quality, coupon, maturity and type; indications as to values from dealers; and general market conditions. These securities are generally categorized within Level 2 of the fair value hierarchy.
U.S. Treasury Bills are valued at the mean price between quoted bid prices and asked prices by the Service. These securities are generally categorized within Level 2 of the fair value hierarchy.
The Service is engaged under the general supervision of the Board.
When market quotations or official closing prices are not readily available, or are determined to not accurately reflect fair value, such as when the value of a security has been significantly affected by events after the close of the exchange or market on which the security is principally traded (for example, a foreign exchange or market), but before the fund calculates its net asset value, the fund may value these investments at fair value as determined in accordance with the procedures approved by the Board. Certain factors may be considered when fair valuing investments such as: fundamental analytical data, the nature and duration of restrictions on disposition, an evaluation of the forces that influence the market in which the securities are purchased and sold, and public trading in similar securities of the issuer or comparable issuers. These securities are either categorized within Level 2 or 3 of the fair value hierarchy depending on the relevant inputs used.
For restricted securities where observable inputs are limited, assumptions about market activity and risk are used and are generally categorized within Level 3 of the fair value hierarchy.
Investments denominated in foreign currencies are translated to U.S. dollars at the prevailing rates of exchange.
Futures and options, which are traded on an exchange, are valued at the last sales price on the securities exchange on which such securities are primarily traded or at the last sales price on the national securities market on each business day and are generally categorized within Level 1 of the fair value hierarchy. Options traded over-the-counter (“OTC”) are valued at the mean between the bid and asked price and are generally categorized within Level 2 of the fair value hierarchy. Investments in swap agreements
31
NOTES TO FINANCIAL STATEMENTS (continued)
are valued each business day by the Service. Swaps are valued by the Service by using a swap pricing model which incorporates among other factors, default probabilities, recovery rates, credit curves of the underlying issuer and swap spreads on interest rates and are generally categorized within Level 2 of the fair value hierarchy. Forward contracts are valued at the forward rate and are generally categorized within Level 2 of the fair value hierarchy.
The following is a summary of the inputs used as of December 31, 2017 in valuing the fund’s investments:
| | | | | |
| | Level 1 -Unadjusted Quoted Prices | Level 2 - Other Significant Observable Inputs | Level 3 -Significant Unobservable Inputs | Total |
Assets ($) |
Investments in Securities: | | | | |
Asset-Backed | - | 1,157,795 | - | 1,157,795 |
Commercial
Mortgage-Backed | - | 649,613 | - | 649,613 |
Corporate Bonds† | - | 14,144,685 | - | 14,144,685 |
Foreign Government | - | 2,933,769 | - | 2,933,769 |
Municipal Bonds | - | 1,079,884 | - | 1,079,884 |
Registered Investment Companies | 364,281 | - | - | 364,281 |
U.S. Government
Agencies/
Mortgage-Backed | - | 10,418,338 | - | 10,418,338 |
U.S. Treasury | - | 12,161,290 | - | 12,161,290 |
Other Financial Instruments: |
Futures†† | 24,799 | - | - | 24,799 |
Forward Foreign
Currency Exchange
Contracts†† | - | 47,307 | - | 47,307 |
Options Purchased | - | 10,435 | - | 10,435 |
Swaps†† | - | 14,329 | - | 14,329 |
Liabilities ($) |
Other Financial Instruments: |
Futures†† | (23,503) | - | - | (23,503) |
Forward Foreign
Currency Exchange
Contracts†† | - | (60,150) | - | (60,150) |
Options Written | - | (3,848) | - | (3,848) |
† See Statement of Investments for additional detailed categorizations.
†† Amount shown represents unrealized appreciation (depreciation) at period end.
32
At December 31, 2017, there were no transfers between levels of the fair value hierarchy. It is the fund’s policy to recognize transfers between levels at the end of the reporting period.
(b) Foreign currency transactions: The fund does not isolate that portion of the results of operations resulting from changes in foreign exchange rates on investments from the fluctuations arising from changes in the market prices of securities held. Such fluctuations are included with the net realized and unrealized gain or loss on investments.
Net realized foreign exchange gains or losses arise from sales of foreign currencies, currency gains or losses realized on securities transactions between trade and settlement date, and the difference between the amounts of dividends, interest and foreign withholding taxes recorded on the fund’s books and the U.S. dollar equivalent of the amounts actually received or paid. Net unrealized foreign exchange gains and losses arise from changes in the value of assets and liabilities other than investments resulting from changes in exchange rates. Foreign currency gains and losses on foreign currency transactions are also included with net realized and unrealized gain or loss on investments.
(c) Securities transactions and investment income: Securities transactions are recorded on a trade date basis. Realized gains and losses from securities transactions are recorded on the identified cost basis. Dividend income is recognized on the ex-dividend date and interest income, including, where applicable, accretion of discount and amortization of premium on investments, is recognized on the accrual basis.
Pursuant to a securities lending agreement with The Bank of New York Mellon, a subsidiary of BNY Mellon and an affiliate of Dreyfus, the fund may lend securities to qualified institutions. It is the fund’s policy that, at origination, all loans are secured by collateral of at least 102% of the value of U.S. securities loaned and 105% of the value of foreign securities loaned. Collateral equivalent to at least 100% of the market value of securities on loan is maintained at all times. Collateral is either in the form of cash, which can be invested in certain money market mutual funds managed by Dreyfus, or U.S. Government and Agency securities. The fund is entitled to receive all dividends, interest and distributions on securities loaned, in addition to income earned as a result of the lending transaction. Should a borrower fail to return the securities in a timely manner, The Bank of New York Mellon is required to replace the securities for the benefit of the fund or credit the fund with the market value of the unreturned securities and is subrogated to the fund’s rights against the borrower and the collateral. Additionally, the contractual maturity of
33
NOTES TO FINANCIAL STATEMENTS (continued)
security lending transactions are on an overnight and continuous basis. During the period ended December 31, 2017, The Bank of New York Mellon earned $1,032 from lending portfolio securities, pursuant to the securities lending agreement.
(d) Affiliated issuers: Investments in other investment companies advised by Dreyfus are defined as “affiliated” under the Act.
(e) Dividends and distributions to shareholders: Dividends and distributions are recorded on the ex-dividend date. Dividends from investment income-net are normally declared and paid on a monthly basis. Dividends from net realized capital gains, if any, are normally declared and paid annually, but the fund may make distributions on a more frequent basis to comply with the distribution requirements of the Internal Revenue Code of 1986, as amended (the “Code”). To the extent that net realized capital gains can be offset by capital loss carryovers, it is the policy of the fund not to distribute such gains. Income and capital gain distributions are determined in accordance with income tax regulations, which may differ from GAAP.
On December 29, 2017, the Board declared a cash dividend of $.022 and $.020 per share for the Initial shares and Service shares, respectively, from undistributed investment income-net payable on January 2, 2018 (ex-dividend date) to shareholders of record as of the close of business on December 29, 2017.
(f) Federal income taxes: It is the policy of the fund to continue to qualify as a regulated investment company, if such qualification is in the best interests of its shareholders, by complying with the applicable provisions of the Code, and to make distributions of taxable income sufficient to relieve it from substantially all federal income and excise taxes.
As of and during the period ended December 31, 2017, the fund did not have any liabilities for any uncertain tax positions. The fund recognizes interest and penalties, if any, related to uncertain tax positions as income tax expense in the Statement of Operations. During the period ended December 31, 2017, the fund did not incur any interest or penalties.
Each tax year in the four-year period ended December 31, 2017 remains subject to examination by the Internal Revenue Service and state taxing authorities.
At December 31, 2017, the components of accumulated earnings on a tax basis were as follows: undistributed ordinary income $345,521, accumulated capital and other losses $610,958 and unrealized appreciation $622,276.
34
Under the Regulated Investment Company Modernization Act of 2010, the fund is permitted to carry forward capital losses for an unlimited period. Furthermore, capital loss carryovers retain their character as either short-term or long-term capital losses.
The accumulated capital loss carryover is available for federal income tax purposes to be applied against future net realized capital gains, if any, realized subsequent to December 31, 2017. The fund has $187,473 of short-term losses and $410,074 of long-term capital losses which can be carried forward for an unlimited period.
The tax character of distributions paid to shareholders during the fiscal periods ended December 31, 2017 and December 31, 2016 were as follows: ordinary income $985,220 and $960,360, respectively.
During the period ended December 31, 2017, as a result of permanent book to tax differences, primarily due to the tax treatment for amortization of premiums, paydown gains and losses, swap periodic payments, capital loss carryover expiration and foreign currency transactions, the fund decreased accumulated undistributed investment income-net by $4,673, increased accumulated net realized gain (loss) on investments by $722,750 and decreased paid-in capital by $718,077. Net assets and net asset value per share were not affected by this reclassification.
NOTE 2—Bank Lines of Credit:
The fund participates with other Dreyfus-managed funds in an $830 million unsecured credit facility led by Citibank, N.A. and a $300 million unsecured credit facility provided by The Bank of New York Mellon (each, a “Facility”), each to be utilized primarily for temporary or emergency purposes, including the financing of redemptions. Prior to October 4, 2017, the unsecured credit facility with Citibank, N.A. was $810 million. In connection therewith, the fund has agreed to pay its pro rata portion of commitment fees for each Facility. Interest is charged to the fund based on rates determined pursuant to the terms of the respective Facility at the time of borrowing.
The average amount of borrowings outstanding under the Facilities during the period ended December 31, 2017, was approximately $23,300 with a related weighted average annualized interest rate of 2.11%.
NOTE 3—Investment Advisory Fee and Other Transactions with Affiliates:
(a) Pursuant to an investment advisory agreement with Dreyfus, the investment advisory fee is computed at the annual rate of .65% of the value of the fund’s average daily net assets and is payable monthly.
35
NOTES TO FINANCIAL STATEMENTS (continued)
(b) Under the Distribution Plan adopted pursuant to Rule 12b-1 under the Act, Service shares pay the Distributor for distributing its shares, for servicing and/or maintaining Service shares’ shareholder accounts and for advertising and marketing for Service shares. The Distribution Plan provides for payments to be made at an annual rate of .25% of the value of the Service shares’ average daily net assets. The Distributor may make payments to Participating Insurance Companies and to brokers and dealers acting as principal underwriter for their variable insurance products. The fees payable under the Distribution Plan are payable without regard to actual expenses incurred. During the period ended December 31, 2017, Service shares were charged $22,569 pursuant to the Distribution Plan.
The fund has arrangements with the transfer agent and the custodian whereby the fund may receive earnings credits when positive cash balances are maintained, which are used to offset transfer agency and custody fees. For financial reporting purposes, the fund includes net earnings credits as an expense offset in the Statement of Operations.
The fund compensates Dreyfus Transfer, Inc., a wholly-owned subsidiary of Dreyfus, under a transfer agency agreement for providing transfer agency and cash management services for the fund. The majority of transfer agency fees are comprised of amounts paid on a per account basis, while cash management fees are related to fund subscriptions and redemptions. During the period ended December 31, 2017, the fund was charged $500 for transfer agency services and $47 for cash management services. These fees are included in Shareholder servicing costs in the Statement of Operations. Cash management fees were offset by earnings credits of $47.
The fund compensates The Bank of New York Mellon under a custody agreement for providing custodial services for the fund. These fees are determined based on net assets, geographic region and transaction activity. During the period ended December 31, 2017, the fund was charged $6,677 pursuant to the custody agreement. These fees were partially offset by earnings credits of $123.
During the period ended December 31, 2017, the fund was charged $11,202 for services performed by the Chief Compliance Officer and his staff.
The components of “Due to The Dreyfus Corporation and affiliates” in the Statement of Assets and Liabilities consist of: investment advisory fees $22,602, Distribution Plan fees $698, custodian fees $4,036, Chief Compliance Officer fees $8,685 and transfer agency fees $96.
36
(c) Each Board member also serves as a Board member of other funds within the Dreyfus complex. Annual retainer fees and attendance fees are allocated to each fund based on net assets.
NOTE 4—Securities Transactions:
The aggregate amount of purchases and sales (including paydowns) of investment securities, excluding short-term securities, forward contracts, futures, options transactions and swap agreements, during the period ended December 31, 2017, amounted to $78,765,439 and $90,735,290, respectively, of which $26,897,497 in purchases and $26,943,116 in sales were from mortgage dollar roll transactions.
Mortgage Dollar Rolls: A mortgage dollar roll transaction involves a sale by the fund of mortgage related securities that it holds with an agreement by the fund to repurchase similar securities at an agreed upon price and date. The securities purchased will bear the same interest rate as those sold, but generally will be collateralized by pools of mortgages with different prepayment histories than those securities sold. The fund accounts for mortgage dollar rolls as purchases and sales transactions.
Derivatives: A derivative is a financial instrument whose performance is derived from the performance of another asset. The fund enters into International Swaps and Derivatives Association, Inc. Master Agreements or similar agreements (collectively, “Master Agreements”) with its OTC derivative contract counterparties in order to, among other things, reduce its credit risk to counterparties. Master Agreements include provisions for general obligations, representations, collateral and events of default or termination. Under a Master Agreement, the fund may offset with the counterparty certain derivative financial instrument’s payables and/or receivables with collateral held and/or posted and create one single net payment in the event of default or termination.
Each type of derivative instrument that was held by the fund during the period ended December 31, 2017 is discussed below.
Futures: In the normal course of pursuing its investment objective, the fund is exposed to market risk, including interest rate risk, as a result of changes in value of underlying financial instruments. The fund invests in futures in order to manage its exposure to or protect against changes in the market. A futures contract represents a commitment for the future purchase or a sale of an asset at a specified date. Upon entering into such contracts, these investments require initial margin deposits with a counterparty, which consist of cash or cash equivalents. The amount of these deposits is determined by the exchange or Board of Trade on which the contract is traded and is subject to change. Accordingly, variation
37
NOTES TO FINANCIAL STATEMENTS (continued)
margin payments are received or made to reflect daily unrealized gains or losses which are recorded in the Statement of Operations. When the contracts are closed, the fund recognizes a realized gain or loss which is reflected in the Statement of Operations. There is minimal counterparty credit risk to the fund with futures since they are exchange traded, and the exchange guarantees the futures against default. Futures open at December 31, 2017 are set forth in the Statement of Futures.
Options Transactions: The fund purchases and writes (sells) put and call options to hedge against changes in the values of interest rate and foreign currencies or as a substitute for an investment. The fund is subject to market risk, interest rate risk and currency risk in the course of pursuing its investment objectives through its investments in options contracts. A call option gives the purchaser of the option the right (but not the obligation) to buy, and obligates the writer to sell, the underlying financial instrument at the exercise price at any time during the option period, or at a specified date. Conversely, a put option gives the purchaser of the option the right (but not the obligation) to sell, and obligates the writer to buy the underlying financial instrument at the exercise price at any time during the option period, or at a specified date.
As a writer of call options, the fund receives a premium at the outset and then bears the market risk of unfavorable changes in the price of the financial instrument underlying the option. Generally, the fund realizes a gain, to the extent of the premium, if the price of the underlying financial instrument decreases between the date the option is written and the date on which the option is terminated. Generally, the fund incurs a loss if the price of the financial instrument increases between those dates.
As a writer of put options, the fund receives a premium at the outset and then bears the market risk of unfavorable changes in the price of the financial instrument underlying the option. Generally, the fund realizes a gain, to the extent of the premium, if the price of the underlying financial instrument increases between the date the option is written and the date on which the option is terminated. Generally, the fund incurs a loss if the price of the financial instrument decreases between those dates. The maximum payout for those contracts is limited to the number of put option contracts written and the related strike prices, respectively.
As a writer of an option, the fund has no control over whether the underlying financial instrument may be sold (call) or purchased (put) and as a result bears the market risk of an unfavorable change in the price of the financial instrument underlying the written option. There is a risk of loss from a change in value of such options which may exceed the related premiums received. This risk is mitigated by Master Agreements between
38
the fund and the counterparty and the posting of collateral, if any, by the counterparty to the fund to cover the fund’s exposure to the counterparty. The Statement of Operations reflects any unrealized gains or losses which occurred during the period as well as any realized gains or losses which occurred upon the expiration or closing of the option transaction. Options written open at December 31, 2017 are set forth in the Statement of Options Written.
Forward Foreign Currency Exchange Contracts: The fund enters into forward contracts in order to hedge its exposure to changes in foreign currency exchange rates on its foreign portfolio holdings, to settle foreign currency transactions or as a part of its investment strategy. When executing forward contracts, the fund is obligated to buy or sell a foreign currency at a specified rate on a certain date in the future. With respect to sales of forward contracts, the fund incurs a loss if the value of the contract increases between the date the forward contract is opened and the date the forward contract is closed. The fund realizes a gain if the value of the contract decreases between those dates. With respect to purchases of forward contracts, the fund incurs a loss if the value of the contract decreases between the date the forward contract is opened and the date the forward contract is closed. The fund realizes a gain if the value of the contract increases between those dates. Any realized or unrealized gains or losses which occurred during the period are reflected in the Statement of Operations. The fund is exposed to foreign currency risk as a result of changes in value of underlying financial instruments. The fund is also exposed to credit risk associated with counterparty nonperformance on these forward contracts, which is generally limited to the unrealized gain on each open contract. This risk may be mitigated by Master Agreements, if any, between the fund and the counterparty and the posting of collateral, if any, by the counterparty to the fund to cover the fund’s exposure to the counterparty. Forward contracts open at December 31, 2017 are set forth in the Statement of Forward Foreign Currency Exchange Contracts.
Swap Agreements: The fund enters into swap agreements to exchange the interest rate on, or return generated by, one nominal instrument for the return generated by another nominal instrument. Swap agreements are privately negotiated in the OTC market or centrally cleared. The fund enters into these agreements to hedge certain market or interest rate risks, to manage the interest rate sensitivity (sometimes called duration) of fixed income securities, to provide a substitute for purchasing or selling particular securities or to increase potential returns.
For OTC swaps, the fund accrues for interim payments on a daily basis, with the net amount recorded within unrealized appreciation (depreciation)
39
NOTES TO FINANCIAL STATEMENTS (continued)
on swap agreements in the Statement of Assets and Liabilities. Once the interim payments are settled in cash, the net amount is recorded as a realized gain (loss) on swaps, in addition to realized gain (loss) recorded upon the termination of swap agreements in the Statement of Operations. Upfront payments made and/or received by the fund, are recorded as an asset and/or liability in the Statement of Assets and Liabilities and are recorded as a realized gain or loss ratably over the agreement’s term/event with the exception of forward starting interest rate swaps which are recorded as realized gains or losses on the termination date.
Upon entering into centrally cleared swap agreements, an initial margin deposit is required with a counterparty, which consists of cash or cash equivalents. The amount of these deposits is determined by the exchange on which the agreement is traded and is subject to change. The change in valuation of centrally cleared swaps is recorded as a receivable or payable for variation margin in the Statement of Assets and Liabilities. Payments received from (paid to) the counterparty, including upon termination, are recorded as realized gain (loss) in the Statement of Operations.
Fluctuations in the value of swap agreements are recorded for financial statement purposes as unrealized appreciation or depreciation on swap agreements.
Interest Rate Swaps: Interest rate swaps involve the exchange of commitments to pay and receive interest based on a notional principal amount. The fund may elect to pay a fixed rate and receive a floating rate, or receive a fixed rate and pay a floating rate on a notional principal amount. The net interest received or paid on interest rate swap agreements is included within realized gain (loss) on swap agreements in the Statement of Operations. Interest rate swap agreements are subject to general market risk, liquidity risk, counterparty risk and interest rate risk.
For OTC swaps, the fund’s maximum risk of loss from counterparty risk is the discounted value of the cash flows to be received from the counterparty over the agreement’s remaining life, to the extent that the amount is positive. This risk may be mitigated by Master Agreements, if any, between the fund and the counterparty and the posting of collateral, if any, by the counterparty to the fund to cover the fund’s exposure to the counterparty. There is minimal counterparty risk to the fund with centrally cleared swaps since they are exchange traded and the exchange guarantees these swaps against default. Interest rate swaps open at December 31, 2017 are set forth in the Statement of Swap Agreements.
40
The following tables show the fund’s exposure to different types of market risk as it relates to the Statement of Assets and Liabilities and the Statement of Operations, respectively.
Fair value of derivative instruments as of December 31, 2017 is shown below:
| | | | | | | | |
| | Derivative
Assets ($) | | | | Derivative
Liabilities ($) | |
Interest rate risk | 43,908 | 1,2,3 | Interest rate risk | (23,503) | 1 |
Foreign exchange risk | 52,962 | 3,4 | Foreign exchange risk | (63,998) | 4,5 |
Gross fair value of
derivative contracts | 96,870 | | | | (87,501) | |
| | | | | | | |
Statement of Assets and Liabilities location: | |
1 Includes cumulative appreciation (depreciation) on futures as reported in the Statement of Futures, but only the unpaid variation margin is reported in the Statement of Assets and Liabilities. |
2 Includes cumulative appreciation (depreciation) on swap agreements as reported in the Statement of Swap Agreements. Unrealized appreciation (depreciation) on OTC swap agreements and only unpaid variation margin on cleared swap agreements, are reported in the Statement of Assets and Liabilities. |
3 Options purchased are included in Investments in securities—Unaffiliated issuers, at value. |
4 Unrealized appreciation (depreciation) on forward foreign currency exchange contracts. |
5 Outstanding options written, at value. | |
The effect of derivative instruments in the Statement of Operations during the period ended December 31, 2017 is shown below:
| | | | | | | | | | | |
Amount of realized gain (loss) on derivatives recognized in income ($) | |
Underlying
risk | Futures | 1 | Options
Transactions | 2 | Forward
Contracts | 3 | Total | | | |
Interest
rate | (46,634) | | 23,690 | | - | | (22,944) | | | |
Foreign
exchange | - | | 30,034 | | 38,237 | | 68,271 | | | |
Total | (46,634) | | 53,724 | | 38,237 | | 45,327 | | | |
| | | | | | | | | | | |
41
NOTES TO FINANCIAL STATEMENTS (continued)
| | | | | | | | | | | | |
Change in unrealized appreciation (depreciation)
on derivatives recognized in income ($) | |
Underlying
risk | Futures | 4 | Options
Transactions | 5 | Forward
Contracts | 6 | Swap
Agreements | 7 | Total | |
Interest
rate | 14,617 | | (8,021) | | - | | 14,329 | | 20,925 | |
Foreign
exchange | - | | 3,278 | | (2,322) | | - | | 956 | |
Total | 14,617 | | (4,743) | | (2,322) | | 14,329 | | 21,881 | |
| | | | | | | | | | | | |
Statement of Operations location: | |
1 Net realized gain (loss) on futures. | | |
2 Net realized gain (loss) on options transactions. |
3 Net realized gain (loss) on forward foreign currency exchange contracts. | | |
4 Net unrealized appreciation (depreciation) on futures. | | |
5 Net unrealized appreciation (depreciation) on options transactions. | | |
6 Net unrealized appreciation (depreciation) on forward foreign currency exchange contracts. | |
7 Net unrealized appreciation (depreciation) on swap agreements. | | |
The provisions of ASC Topic 210 “Disclosures about Offsetting Assets and Liabilities” require disclosure on the offsetting of financial assets and liabilities. These disclosures are required for certain investments, including derivative financial instruments subject to Master Agreements which are eligible for offsetting in the Statement of Assets and Liabilities and require the fund to disclose both gross and net information with respect to such investments. For financial reporting purposes, the fund does not offset derivative assets and derivative liabilities that are subject to Master Agreements in the Statement of Assets and Liabilities.
At December 31, 2017, derivative assets and liabilities (by type) on a gross basis are as follows:
| | | | | | |
Derivative Financial Instruments: | | Assets ($) | | Liabilities ($) | |
Futures | | 24,799 | | (23,503) | |
Options | | 10,435 | | (3,848) | |
Forward contracts | | 47,307 | | (60,150) | |
Swaps | | 14,329 | | - | |
Total gross amount of derivative | | | | | |
assets and liabilities in the | | | | | |
Statement of Assets and Liabilities | | 96,870 | | (87,501) | |
Derivatives not subject to | | | | | |
Master Agreements | | (39,128) | | 23,503 | |
Total gross amount of assets | | | | | |
and liabilities subject to | | | | | |
Master Agreements | | 57,742 | | (63,998) | |
42
The following tables present derivative assets and liabilities net of amounts available for offsetting under Master Agreements and net of related collateral received or pledged, if any, as of December 31, 2017:†
| | | | | | | |
| | | | Financial | | | |
| | | | Instruments | | | |
| | | | and Derivatives | | | |
| | Gross Amount of | | Available | Collateral | | Net Amount of |
Counterparty | Assets ($) | 1 | for Offset ($) | Received ($) | | Assets ($) |
Barclays Bank | 5,074 | | (1,955) | - | | 3,119 |
Citigroup | 22,635 | | (22,635) | - | | - |
Goldman Sachs
International | 831 | | (831) | - | | - |
HSBC | 10,389 | | (10,389) | - | | - |
JP Morgan
Chase Bank | 8,415 | | (8,415) | - | | - |
UBS | 10,398 | | (8,166) | - | | 2,232 |
Total | 57,742 | | (52,391) | - | | 5,351 |
| | | | | | | |
| | | | Financial | | | |
| | | | Instruments | | | |
| | | | and Derivatives | | | |
| | Gross Amount of | | Available | Collateral | | Net Amount of |
Counterparty | Liabilities ($) | 1 | for Offset ($) | Pledged ($) | | Liabilities ($) |
Bank of America | (2,068) | | - | - | | (2,068) |
Barclays Bank | (1,955) | | 1,955 | - | | - |
Citigroup | (29,649) | | 22,635 | - | | (7,014) |
Goldman Sachs
International | (1,355) | | 831 | - | | (524) |
HSBC | (11,044) | | 10,389 | - | | (655) |
JP Morgan
Chase Bank | (9,761) | | 8,415 | - | | (1,346) |
UBS | (8,166) | | 8,166 | - | | - |
Total | (63,998) | | 52,391 | - | | (11,607) |
| | | | | | | |
1 Absent a default event or early termination, OTC derivative assets and liabilities are presented at gross amounts and are not offset in the Statement of Assets and Liabilities. |
† See Statement of Investments for detailed information regarding collateral held for open futures contracts. |
The following summarizes the average market value of derivatives outstanding during the period ended December 31, 2017:
| | | |
| | Average Market Value ($) |
Interest rate futures | | 14,951,978 |
Interest rate options contracts | | 4,142 |
Foreign currency options contracts | | 6,880 |
Forward contracts | | 9,885,362 |
| | | |
43
NOTES TO FINANCIAL STATEMENTS (continued)
The following summarizes the average notional value of swap agreements outstanding during the period ended December 31, 2017:
| | | |
| | Average Notional Value ($) |
Interest rate swap agreements | | 10,644,231 |
| | | |
At December 31, 2017, the cost of investments for federal income tax purposes was $42,327,308; accordingly, accumulated net unrealized appreciation on investments inclusive of derivative contracts was $617,737, consisting of $970,083 gross unrealized appreciation and $352,346 gross unrealized depreciation.
44
REPORT OF INDEPENDENT REGISTERED PUBLIC ACCOUNTING FIRM
To the Shareholders and the Board of Trustees of Dreyfus Variable Investment Fund, Quality Bond Portfolio
Opinion on the Financial Statements
We have audited the accompanying statement of assets and liabilities of Dreyfus Variable Investment Fund, Quality Bond Portfolio (one of the series comprising Dreyfus Variable Investment Fund) (the “Fund”), including the statements of investments, investments in affiliated issuers, futures, options written, forward foreign currency exchange contracts and swap agreements, as of December 31, 2017, and the related statement of operations for the year then ended, the statements of changes in net assets for each of the two years in the period then ended, the financial highlights for each of the five years in the period then ended and the related notes (collectively referred to as the “financial statements”). In our opinion, the financial statements present fairly, in all material respects, the financial position of Dreyfus Variable Investment Fund, Quality Bond Portfolio at December 31, 2017, the results of its operations for the year then ended, the changes in its net assets for each of the two years in the period then ended and its financial highlights for each of the five years in the period then ended, in conformity with U.S. generally accepted accounting principles.
Basis for opinion
These financial statements are the responsibility of the Fund’s management. Our responsibility is to express an opinion on the Fund’s financial statements based on our audits. We are a public accounting firm registered with the Public Company Accounting Oversight Board (United States) (“PCAOB”) and are required to be independent with respect to the Fund in accordance with the U.S. federal securities laws and the applicable rules and regulations of the Securities and Exchange Commission and the PCAOB.
We conducted our audits in accordance with the standards of the PCAOB. Those standards require that we plan and perform the audit to obtain reasonable assurance about whether the financial statements are free of material misstatement, whether due to error or fraud. The Fund is not required to have, nor were we engaged to perform, an audit of the Fund’s internal control over financial reporting. As part of our audits, we are required to obtain an understanding of internal control over financial reporting, but not for the purpose of expressing an opinion on the effectiveness of the Fund’s internal control over financial reporting. Accordingly, we express no such opinion.
Our audits included performing procedures to assess the risks of material misstatement of the financial statements, whether due to error or fraud, and performing procedures that respond to those risks. Such procedures included examining, on a test basis, evidence regarding the amounts and disclosures in the financial statements. Our procedures included confirmation of securities owned as of December 31, 2017, by correspondence with the custodian and others or by other appropriate auditing procedures where replies were not received. Our audits also included evaluating the accounting principles used and significant estimates made by management, as well as evaluating the overall presentation of the financial statements. We believe that our audits provide a reasonable basis for our opinion.

We have served as the auditor of one or more Dreyfus investment companies since at least 1957, but we are unable to determine the specific year.
New York, New York
February 09, 2018
45
BOARD MEMBERS INFORMATION (Unaudited)
INDEPENDENT BOARD MEMBERS
Joseph S. DiMartino (74)
Chairman of the Board (1995)
Principal Occupation During Past 5 Years:
· Corporate Director and Trustee (1995-present)
Other Public Company Board Memberships During Past 5 Years:
· CBIZ (formerly, Century Business Services, Inc.), a provider of outsourcing functions for small and medium size companies, Director (1997-present)
No. of Portfolios for which Board Member Serves: 127
———————
Peggy C. Davis (74)
Board Member (2006)
Principal Occupation During Past 5 Years:
· Shad Professor of Law, New York University School of Law (1983-present)
No. of Portfolios for which Board Member Serves: 46
———————
David P. Feldman (78)
Board Member (1994)
Principal Occupation During Past 5 Years:
· Corporate Director and Trustee (1985-present)
Other Public Company Board Memberships During Past 5 Years:
· BBH Mutual Funds Group (5 registered mutual funds), Director (1992-2014)
No. of Portfolios for which Board Member Serves: 32
———————
Joan Gulley (70)
Board Member (2017)
Principal Occupation During Past 5 Years:
· PNC Financial Services Group, Inc.(1993-2014), Executive Vice President and Chief Human Resources Officer and Executive Committee Member (2008-2014)
No. of Portfolios for which Board Member Serves: 54
———————
46
Ehud Houminer (77)
Board Member (2006)
Principal Occupation During Past 5 Years:
· Board of Overseers at the Columbia Business School, Columbia University (1992-present)
· Trustee, Ben Gurion University
Other Public Company Board Memberships During Past 5 Years:
· Avnet, Inc., an electronics distributor, Director (1993-2012)
No. of Portfolios for which Board Member Serves: 54
———————
Lynn Martin (78)
Board Member (2012)
Principal Occupation During Past 5 Years:
· President of The Martin Hall Group LLC, a human resources consulting firm (2005-2012)
Other Public Company Board Memberships During Past 5 Years:
· AT&T, Inc., a telecommunications company, Director (1999-2012)
· Ryder System, Inc., a supply chain and transportation management company, Director (1993-2012)
No. of Portfolios for which Board Member Serves: 32
———————
Robin A. Melvin (54)
Board Member (2012)
Principal Occupation During Past 5 Years:
· Co-chairman, Illinois Mentoring Partnership, non-profit organization dedicated to increasing the quantity and quality of mentoring services in Illinois; (2014-present; board member since 2013)
· Director, Boisi Family Foundation, a private family foundation that supports youth-serving organizations that promote the self sufficiency of youth from disadvantaged circumstances (1995-2012)
No. of Portfolios for which Board Member Serves: 101
———————
47
BOARD MEMBERS INFORMATION (Unaudited) (continued)
INDEPENDENT BOARD MEMBERS (continued)
Dr. Martin Peretz (78)
Board Member (1990)
Principal Occupation During Past 5 Years:
· Editor-in-Chief Emeritus of The New Republic Magazine (2011-2012) (previously,
Editor-in-Chief, 1974-2011)
· Lecturer at Harvard University (1969-2012)
No. of Portfolios for which Board Member Serves: 32
———————
Once elected all Board Members serve for an indefinite term, but achieve Emeritus status upon reaching age 80. The address of the Board Members and Officers is c/o The Dreyfus Corporation, 200 Park Avenue, New York, New York 10166. Additional information about the Board Members is available in the fund’s Statement of Additional Information which can be obtained from Dreyfus free of charge by calling this toll free number: 1-800-DREYFUS.
James F. Henry, Emeritus Board Member
Philip L. Toia, Emeritus Board Member
48
OFFICERS OF THE FUND (Unaudited)
BRADLEY J. SKAPYAK, President since January 2010.
Chief Operating Officer and a director of the Manager since June 2009, Chairman of Dreyfus Transfer, Inc., an affiliate of the Manager and the transfer agent of the funds, since May 2011 and Chief Executive Officer of MBSC Securities Corporation since August 2016. He is an officer of 63 investment companies (comprised of 127 portfolios) managed by the Manager. He is 59 years old and has been an employee of the Manager since February 1988.
BENNETT A. MACDOUGALL, Chief Legal Officer since October 2015.
Chief Legal Officer of the Manager and Associate General Counsel and Managing Director of BNY Mellon since June 2015; from June 2005 to June 2015, he served in various capacities with Deutsche Bank – Asset & Wealth Management Division, including as Director and Associate General Counsel, and Chief Legal Officer of Deutsche Investment Management Americas Inc. from June 2012 to May 2015. He is an officer of 64 investment companies (comprised of 152 portfolios) managed by the Manager. He is 46 years old and has been an employee of the Manager since June 2015.
JANETTE E. FARRAGHER, Vice President and Secretary since December 2011.
Associate General Counsel of BNY Mellon, and an officer of 64 investment companies (comprised of 152 portfolios) managed by the Manager. She is 55 years old and has been an employee of the Manager since February 1984.
JAMES BITETTO, Vice President and Assistant Secretary since August 2005.
Managing Counsel of BNY Mellon and Secretary of the Manager, and an officer of 64 investment companies (comprised of 152 portfolios) managed by the Manager. He is 51 years old and has been an employee of the Manager since December 1996.
JOSEPH M. CHIOFFI, Vice President and Assistant Secretary since August 2005.
Managing Counsel of BNY Mellon, and an officer of 64 investment companies (comprised of 152 portfolios) managed by the Manager. He is 56 years old and has been an employee of the Manager since June 2000.
MAUREEN E. KANE, Vice President and Assistant Secretary since April 2015.
Managing Counsel of BNY Mellon since July 2014; from October 2004 until July 2014, General Counsel, and from May 2009 until July 2014, Chief Compliance Officer of Century Capital Management. She is an officer of 64 investment companies (comprised of 152 portfolios) managed by the Manager. She is 55 years old and has been an employee of the Manager since July 2014.
SARAH S. KELLEHER, Vice President and Assistant Secretary since April 2014.
Senior Counsel of BNY Mellon since March 2013, from August 2005 to March 2013, Associate General Counsel of Third Avenue Management. She is an officer of 64 investment companies (comprised of 152 portfolios) managed by the Manager. She is 42 years old and has been an employee of the Manager since March 2013.
JEFF PRUSNOFSKY, Vice President and Assistant Secretary since August 2005.
Senior Managing Counsel of BNY Mellon, and an officer of 64 investment companies (comprised of 152 portfolios) managed by the Manager. He is 52 years old and has been an employee of the Manager since October 1990.
NATALYA ZELENSKY, Vice President and Assistant Secretary since March 2017.
Counsel and Vice President of BNY Mellon since May 2016; Attorney at Wildermuth Endowment Strategy Fund/Wildermuth Advisory, LLC from November 2015 until May 2016; Assistant General Counsel at RCS Advisory Services from July 2014 until November 2015; Associate at Sutherland, Asbill & Brennan from January 2013 until January 2014; Associate at K&L Gates from October 2011 until January 2013. She is an officer of 64 investment companies (comprised of 152 portfolios) managed by Dreyfus. She is 32 years old and has been an employee of the Manager since May 2016.
JAMES WINDELS, Treasurer since November 2001.
Director – Mutual Fund Accounting of the Manager, and an officer of 64 investment companies (comprised of 152 portfolios) managed by the Manager. He is 59 years old and has been an employee of the Manager since April 1985.
49
OFFICERS OF THE FUND (Unaudited) (continued)
RICHARD CASSARO, Assistant Treasurer since January 2008.
Senior Accounting Manager – Money Market and Municipal Bond Funds of the Manager, and an officer of 64 investment companies (comprised of 152 portfolios) managed by the Manager. He is 58 years old and has been an employee of the Manager since September 1982.
GAVIN C. REILLY, Assistant Treasurer since December 2005.
Tax Manager of the Investment Accounting and Support Department of the Manager, and an officer of 64 investment companies (comprised of 152 portfolios) managed by the Manager. He is 49 years old and has been an employee of the Manager since April 1991.
ROBERT S. ROBOL, Assistant Treasurer since August 2005.
Senior Accounting Manager – Dreyfus Financial Reporting of the Manager, and an officer of 64 investment companies (comprised of 152 portfolios) managed by the Manager. He is 53 years old and has been an employee of the Manager since October 1988.
ROBERT SALVIOLO, Assistant Treasurer since July 2007.
Senior Accounting Manager – Equity Funds of the Manager, and an officer of 64 investment companies (comprised of 152 portfolios) managed by the Manager. He is 50 years old and has been an employee of the Manager since June 1989.
ROBERT SVAGNA, Assistant Treasurer since December 2002.
Senior Accounting Manager – Fixed Income and Equity Funds of the Manager, and an officer of 64 investment companies (comprised of 152 portfolios) managed by the Manager. He is 50 years old and has been an employee of the Manager since November 1990.
JOSEPH W. CONNOLLY, Chief Compliance Officer since October 2004.
Chief Compliance Officer of the Manager and The Dreyfus Family of Funds (64 investment companies, comprised of 152 portfolios). He is 60 years old and has served in various capacities with the Manager since 1980, including manager of the firm’s Fund Accounting Department from 1997 through October 2001.
CARIDAD M. CAROSELLA, Anti-Money Laundering Compliance Officer since January 2016.
Anti-Money Laundering Compliance Officer of the Dreyfus Family of Funds and BNY Mellon Funds Trust since January 2016; from May 2015 to December 2015, Interim Anti-Money Laundering Compliance Officer of the Dreyfus Family of Funds and BNY Mellon Funds Trust and the Distributor; from January 2012 to May 2015, AML Surveillance Officer of the Distributor and from 2007 to December 2011, Financial Processing Manager of the Distributor. She is an officer of 58 investment companies (comprised of 146 portfolios) managed by the Manager. She is 49 years old and has been an employee of the Distributor since 1997.
50
NOTES
51
NOTES
52
NOTES
53
Dreyfus Variable Investment Fund, Quality Bond Portfolio
200 Park Avenue
New York, NY 10166
Investment Adviser
The Dreyfus Corporation
200 Park Avenue
New York, NY 10166
Custodian
The Bank of New York Mellon
225 Liberty Street
New York, NY 10286
Transfer Agent &
Dividend Disbursing Agent
Dreyfus Transfer, Inc.
200 Park Avenue
New York, NY 10166
Distributor
MBSC Securities Corporation
200 Park Avenue
New York, NY 10166
Telephone 1-800-258-4260 or 1-800-258-4261
Mail The Dreyfus Family of Funds, 144 Glenn Curtiss Boulevard, Uniondale, NY 11556-0144 Attn: Institutional Services Department
E-mail Send your request to info@dreyfus.com
Internet Information can be viewed online or downloaded at www.dreyfus.com
The fund files its complete schedule of portfolio holdings with the Securities and Exchange Commission (“SEC”) for the first and third quarters of each fiscal year on Form N-Q. The fund’s Forms N-Q are available on the SEC’s website at http://www.sec.gov and may be reviewed and copied at the SEC’s Public Reference Room in Washington, D.C. Information on the operation of the Public Reference Room may be obtained by calling 1-800-SEC-0330.
A description of the policies and procedures that the fund uses to determine how to vote proxies relating to portfolio securities, and information regarding how the fund voted these proxies for the most recent 12-month period ended June 30 is available at http://www.dreyfus.com and on the SEC’s website at http://www.sec.gov. The description of the policies and procedures is also available without charge, upon request, by calling 1-800-DREYFUS.
| | |
© 2018 MBSC Securities Corporation
0120AR1217 | 
|
Item 2. Code of Ethics.
The Registrant has adopted a code of ethics that applies to the Registrant's principal executive officer, principal financial officer, principal accounting officer or controller, or persons performing similar functions. There have been no amendments to, or waivers in connection with, the Code of Ethics during the period covered by this Report.
Item 3. Audit Committee Financial Expert.
The Registrant's Board has determined that David P. Feldman, a member of the Audit Committee of the Board, is an audit committee financial expert as defined by the Securities and Exchange Commission (the "SEC"). Mr. Feldman is "independent" as defined by the SEC for purposes of audit committee financial expert determinations.
Item 4. Principal Accountant Fees and Services.
(a) Audit Fees. The aggregate fees billed for each of the last two fiscal years (the "Reporting Periods") for professional services rendered by the Registrant's principal accountant (the "Auditor") for the audit of the Registrant's annual financial statements or services that are normally provided by the Auditor in connection with the statutory and regulatory filings or engagements for the Reporting Periods, were $267,326 in 2016 and $274,008 in 2017.
(b) Audit-Related Fees. The aggregate fees billed in the Reporting Periods for assurance and related services by the Auditor that are reasonably related to the performance of the audit of the Registrant's financial statements and are not reported under paragraph (a) of this Item 4 were $66,548 in 2016 and $99,156 in 2017. These services consisted of one or more of the following: (i) agreed upon procedures related to compliance with Internal Revenue Code section 817(h), (ii) security counts required by Rule 17f-2 under the Investment Company Act of 1940, as amended, (iii) advisory services as to the accounting or disclosure treatment of Registrant transactions or events and (iv) advisory services to the accounting or disclosure treatment of the actual or potential impact to the Registrant of final or proposed rules, standards or interpretations by the Securities and Exchange Commission, the Financial Accounting Standards Boards or other regulatory or standard-setting bodies.
The aggregate fees billed in the Reporting Periods for non-audit assurance and related services by the Auditor to the Registrant's investment adviser (not including any sub-investment adviser whose role is primarily portfolio management and is subcontracted with or overseen by another investment adviser), and any entity controlling, controlled by or under common control with the investment adviser that provides ongoing services to the Registrant ("Service Affiliates"), that were reasonably related to the performance of the annual audit of the Service Affiliate, which required pre-approval by the Audit Committee were $0 in 2016 and $0 in 2017.
(c) Tax Fees. The aggregate fees billed in the Reporting Periods for professional services rendered by the Auditor for tax compliance, tax advice, and tax planning ("Tax Services") were $26,909 in 2016 and $24,500 in 2017. These services consisted of: (i) review or preparation of U.S. federal, state, local and excise tax returns; (ii) U.S. federal, state and local tax planning, advice and assistance regarding statutory, regulatory or administrative developments; (iii) tax advice regarding tax qualification matters and/or treatment of various financial instruments held or proposed to be acquired or held, and (iv) determination of Passive Foreign Investment Companies. The aggregate fees billed in the Reporting Periods for Tax Services by the Auditor to Service Affiliates, which required pre-approval by the Audit Committee were $0 in 2016 and $0 in 2017.
(d) All Other Fees. The aggregate fees billed in the Reporting Periods for products and services provided by the Auditor, other than the services reported in paragraphs (a) through (c) of this Item, were $76 in 2016 and $86 in 2017. These services consisted of a review of the Registrant's anti-money laundering program.
The aggregate fees billed in the Reporting Periods for Non-Audit Services by the Auditor to Service Affiliates, other than the services reported in paragraphs (b) through (c) of this Item, which required pre-approval by the Audit Committee, were $0 in 2016 and $0 in 2017.
(e)(1) Audit Committee Pre-Approval Policies and Procedures. The Registrant's Audit Committee has established policies and procedures (the "Policy") for pre-approval (within specified fee limits) of the Auditor's engagements for non-audit services to the Registrant and Service Affiliates without specific case-by-case consideration. The pre-approved services in the Policy can include pre-approved audit services, pre-approved audit-related services, pre-approved tax services and pre-approved all other services. Pre-approval considerations include whether the proposed services are compatible with maintaining the Auditor's independence. Pre-approvals pursuant to the Policy are considered annually.
(e)(2) Note. None of the services described in paragraphs (b) through (d) of this Item 4 were approved by the Audit Committee pursuant to paragraph (c)(7)(i)(C) of Rule 2-01 of Regulation S-X.
(f) None of the hours expended on the principal accountant's engagement to audit the registrant's financial statements for the most recent fiscal year were attributed to work performed by persons other than the principal account's full-time, permanent employees.
Non-Audit Fees. The aggregate non-audit fees billed by the Auditor for services rendered to the Registrant, and rendered to Service Affiliates, for the Reporting Periods were $17,871,092 in 2016 and $31,379,272 in 2017.
Auditor Independence. The Registrant's Audit Committee has considered whether the provision of non-audit services that were rendered to Service Affiliates, which were not pre-approved (not requiring pre-approval), is compatible with maintaining the Auditor's independence.
Item 5. Audit Committee of Listed Registrants.
Not applicable.
Item 6. Investments.
(a) Not applicable.
Item 7. Disclosure of Proxy Voting Policies and Procedures for Closed-End Management Investment Companies.
Not applicable
Item 8. Portfolio Managers of Closed-End Management Investment Companies.
Not applicable.
Item 9. Purchases of Equity Securities by Closed-End Management Investment Companies and Affiliated Purchasers.
Not applicable.
Item 10. Submission of Matters to a Vote of Security Holders.
There have been no material changes to the procedures applicable to Item 10.
Item 11. Controls and Procedures.
(a) The Registrant's principal executive and principal financial officers have concluded, based on their evaluation of the Registrant's disclosure controls and procedures as of a date within 90 days of the filing date of this report, that the Registrant's disclosure controls and procedures are reasonably designed to ensure that information required to be disclosed by the Registrant on Form N-CSR is recorded, processed, summarized and reported within the required time periods and that information required to be disclosed by the Registrant in the reports that it files or submits on Form N-CSR is accumulated and communicated to the Registrant's management, including its principal executive and principal financial officers, as appropriate to allow timely decisions regarding required disclosure.
(b) There were no changes to the Registrant's internal control over financial reporting that occurred during the second fiscal quarter of the period covered by this report that have materially affected, or are reasonably likely to materially affect, the Registrant's internal control over financial reporting.
Item 12. Exhibits.
(a)(1) Code of ethics referred to in Item 2.
(a)(2) Certifications of principal executive and principal financial officers as required by Rule 30a-2(a) under the Investment Company Act of 1940.
(a)(3) Not applicable.
(b) Certification of principal executive and principal financial officers as required by Rule 30a-2(b) under the Investment Company Act of 1940.
SIGNATURES
Pursuant to the requirements of the Securities Exchange Act of 1934 and the Investment Company Act of 1940, the Registrant has duly caused this Report to be signed on its behalf by the undersigned, thereunto duly authorized.
Dreyfus Variable Investment Fund
By: /s/ Bradley J. Skapyak
Bradley J. Skapyak
President
Date: February 9, 2018
Pursuant to the requirements of the Securities Exchange Act of 1934 and the Investment Company Act of 1940, this Report has been signed below by the following persons on behalf of the Registrant and in the capacities and on the dates indicated.
By: /s/ Bradley J. Skapyak
Bradley J. Skapyak
President
Date: February 9, 2018
By: /s/ James Windels
James Windels
Treasurer
Date: February 9, 2018
EXHIBIT INDEX
(a)(1) Code of ethics referred to in Item 2.
(a)(2) Certifications of principal executive and principal financial officers as required by Rule 30a-2(a) under the Investment Company Act of 1940. (EX-99.CERT)
(b) Certification of principal executive and principal financial officers as required by Rule 30a-2(b) under the Investment Company Act of 1940. (EX-99.906CERT)


