UNITED STATES
SECURITIES AND EXCHANGE COMMISSION
Washington, D.C. 20549
FORM N-CSR
CERTIFIED SHAREHOLDER REPORT OF REGISTERED MANAGEMENT
INVESTMENT COMPANIES
Investment Company Act file number | 811-05125 |
| |
| Dreyfus Variable Investment Fund | |
| (Exact name of Registrant as specified in charter) | |
| | |
| c/o The Dreyfus Corporation 200 Park Avenue New York, New York 10166 | |
| (Address of principal executive offices) (Zip code) | |
| | |
| Bennett A. MacDougall, Esq. 200 Park Avenue New York, New York 10166 | |
| (Name and address of agent for service) | |
|
Registrant's telephone number, including area code: | (212) 922-6400 |
| |
Date of fiscal year end: | 12/31 | |
Date of reporting period: | 12/31/18 | |
| | | | | | | |
FORM N-CSR
Item 1. Reports to Stockholders.
Dreyfus Variable Investment Fund, Appreciation Portfolio
| | | |

| | ANNUAL REPORT December 31, 2018 |
| |
The views expressed in this report reflect those of the portfolio manager(s) only through the end of the period covered and do not necessarily represent the views of Dreyfus or any other person in the Dreyfus organization. Any such views are subject to change at any time based upon market or other conditions and Dreyfus disclaims any responsibility to update such views. These views may not be relied on as investment advice and, because investment decisions for a Dreyfus fund are based on numerous factors, may not be relied on as an indication of trading intent on behalf of any Dreyfus fund. |
| |
Not FDIC-Insured • Not Bank-Guaranteed • May Lose Value |
Contents
T H E F U N D
F O R M O R E I N F O R M AT I O N
Back Cover
| | | | |
| |
Dreyfus Variable Investment Fund, Appreciation Portfolio
| | The Fund |
A LETTER FROM THE PRESIDENT OF DREYFUS
Dear Shareholder:
We are pleased to present this annual report for Dreyfus Variable Investment Fund, Appreciation Portfolio, covering the 12-month period from January 1, 2018 through December 31, 2018. For information about how the fund performed during the reporting period, as well as general market perspectives, we provide a Discussion of Fund Performance on the pages that follow.
The reporting period began with major global economies achieving above-trend growth. In the United States, a robust economy and strong labor market encouraged the Federal Reserve to continue moving away from its accommodative monetary policy while other major central banks began to consider monetary tightening. Both U.S. and non-U.S. equity markets remained on an uptrend. Interest rates rose across the yield curve, putting pressure on bond prices.
A few months into the reporting period, global growth trends began to diverge and market volatility returned. While the U.S. economy continued to grow at a healthy rate, other developed markets began to weaken. However, robust growth and strong corporate earnings continued to support U.S. stock returns while other developed markets declined throughout the summer. In the fall, a broad sell-off occurred, partially offsetting earlier U.S. gains. Emerging markets remained under pressure as weakness in their currencies relative to the U.S. dollar added to investors’ uneasiness. Global equities continued their general decline through the end of the period.
Fixed income markets struggled during the first half of the period as interest rates rose and favorable U.S. equity markets fed investor risk appetites. However, in autumn volatility crept in, the yield curve began a flattening trend that continued through the end of December. As long-term debt yields fell, prices rose for many bonds, leading to moderately positive returns for several fixed income market sectors.
Despite continuing political variables, U.S. inflationary pressures and flagging growth rates, we are optimistic that the U.S. economy will remain strong in the near term. However, we remain attentive to signs that point to potential changes on the horizon. As always, we encourage you to discuss the risks and opportunities in today’s investment environment with your financial advisor.
Thank you for your continued confidence and support.
Sincerely,

Renee Laroche-Morris
President
The Dreyfus Corporation
January 15, 2019
2
DISCUSSION OF FUND PERFORMANCE(Unaudited)
For the period from January 1, 2018 through December 31, 2018, as provided by portfolio manager Fayez Sarofim of Fayez Sarofim& Co., Sub-Investment Adviser
Market and Fund Performance Overview
For the 12-month period ended December 31, 2018, Dreyfus Variable Investment Fund, Appreciation Portfolio’s Initial shares achieved a total return of -6.86%, and its Service shares achieved a total return of -7.10%.1 In comparison, the fund’s benchmark, the S&P 500® Index (the “Index”), produced a total return of -4.38% for the same period.2
U.S. stocks posted losses during the reporting period amid sustained economic growth, rising interest rates and intensifying trade tensions. The fund underperformed its benchmark, largely due to overweighted exposure to the consumer staples and communication services sectors, and to underweighted exposure to the market-leading health care sector. Certain positions in the pharmaceutical industry also detracted from relative returns.
The Fund’s Investment Approach
The fund seeks long-term capital growth consistent with the preservation of capital. Its secondary goal is current income. To pursue its goals, the fund normally invests at least 80% of its net assets, plus any borrowings for investment purposes, in common stocks. The fund focuses on blue-chip companies with total market capitalizations of more than $5 billion at the time of purchase, including multinational companies. These are established companies that have demonstrated sustained patterns of profitability, strong balance sheets, an expanding global presence, and the potential to achieve predictable, above-average earnings growth.
In choosing stocks, we identify economic sectors we believe will expand over the next three to five years or longer. Using fundamental analysis, we then seek companies within these sectors that have proven track records and dominant positions in their industries. The fund employs a “buy-and-hold” investment strategy, which generally has resulted in an annual portfolio turnover rate below 15%. A low portfolio turnover rate helps reduce the fund’s trading costs.3
Stocks Sold Off Amid Uncertainty
In sharp contrast to 2017, when equity markets rose steadily without any meaningful setbacks, 2018 was a turbulent year punctuated by several sharp sell-offs. Despite robust domestic economic data and earnings results, uncertainty increased throughout the year as ongoing Federal Reserve tightening, escalating trade conflicts and signs of weakening momentum abroad led investors to reassess expectations for future growth. The Index entered into correction territory three times in 2018, ultimately registering its first annual decline since 2008. The energy sector, which was pressured by plunging crude oil prices in the face of a deteriorating demand outlook, recorded the biggest loss.
Fund Strategies Produced Mixed Results
The fund declined more than the Index for the year but registered good relative results in the final quarter amid the market turmoil. The fund’s relative underperformance for the full year was primarily a result of sector allocations that differed from those of the benchmark. Specifically, overweighted representation in the lagging consumer staples and communication services sectors penalized relative results. The fund’s underweighted allocation to the market-leading health care sector, as well as weakness in key holdings within the pharmaceuticals segment, also detracted from relative returns.
3
DISCUSSION OF FUND PERFORMANCE(Unaudited) (continued)
The overall impact of stock selection, on the other hand, was positive and helped to offset these negative allocation effects. Industrials and materials issues generally struggled with the prospect of weaker demand associated with trade conflicts, and the fund’s selective positioning within these sectors supported relative results. Advantageous stock selection in the energy sector, which emphasized the major integrated oil companies and avoided the more volatile oilfield service and equipment stocks, also added value. Selection decisions in the information technology sector also proved rewarding due to strong relative performance from holdings such as Visa, Automatic Data Processing and Microsoft. The largest positive contributors to the fund’s 12-month return included Microsoft, Twenty-First Century Fox, Abbott Laboratories, Visa and Nike. The largest detractors from return included Philip Morris International, Facebook, Altria Group, State Street and BlackRock.
Industry Leaders May Be Able to Weather Macroeconomic Headwinds
While the U.S. economy is expected to continue powering ahead in 2019, some slowing from the buoyant pace of growth seen last year is likely given the continued withdrawal of monetary accommodation, the fading boost from tax reform and the potential for more tariffs. In the near term, growth concerns and market pessimism appear set to persist and equity markets will likely continue to struggle until growth signals improve. Over the medium term, however, slower but steady economic growth should drive positive, albeit volatile, returns for equities.
Moderating economic growth alongside rising labor and borrowing costs has created a backdrop that should favor companies with solid balance sheets and pricing power that are capable of maintaining revenue growth and passing on higher costs. The fund’s investment strategy has long focused on such companies. We believe the high-quality industry leaders in our portfolios, with their ample financial resources, durable competitive advantages and operational scale, are well positioned to deliver consistent results through challenging business cycles. Dominant market positions and disciplined cost controls generally provide these companies with more options to protect their margins while strong recurring cash flows enable them to continue investing prudently for sustained growth in the future. Furthermore, their seasoned management teams have established records of creating long-term value for shareholders through strategic capital redeployment, dividend increases and share repurchases, providing a degree of stability as market conditions change.
January 15, 2019
1 Total return includes reinvestment of dividends and any capital gains paid. Past performance is no guarantee of future results. Share price and investment return fluctuate such that upon redemption, fund shares may be worth more or less than their original cost. The fund’s performance does not reflect the deduction of additional charges and expenses imposed in connection with investing in variable insurance contracts, which will reduce returns.
2 Source: Lipper Inc. — The S&P 500® Index is widely regarded as the best single gauge of large-cap U.S. equities. The index includes 500 leading companies and captures approximately 80% coverage of available market capitalization. Investors cannot invest directly in any index.
3 Achieving tax efficiency is not a part of the fund’s investment objective, and there can be no guarantee that the fund will achieve any particular level of taxable distributions in future years. In periods when the manager has to sell significant amounts of securities (e.g., during periods of significant net redemptions or changes in index components), the fund can be expected to be less tax efficient than during periods of more stable market conditions and asset flows.
Equities are subject generally to market, market sector, market liquidity, issuer, and investment style risks, among other factors, to varying degrees, all of which are more fully described in the fund’s prospectus.
The fund is only available as a funding vehicle under variable life insurance policies or variable annuity contracts issued by insurance companies. Individuals may not purchase shares of the fund directly. A variable annuity is an insurance contract issued by an insurance company that enables investors to accumulate assets on a tax-deferred basis for retirement or other long-term goals. The investment objective and policies of Dreyfus Variable Investment Fund, Appreciation Portfolio made available through insurance products may be similar to those of other funds managed by Dreyfus. However, the investment results of the fund may be higher or lower than, and may not be comparable to, those of any other Dreyfus fund.
4
FUND PERFORMANCE(Unaudited)
 Comparison of change in value of $10,000 investment in Dreyfus Variable Investment Fund, Appreciation Portfolio Initial shares and Service shares and the S&P 500® Index (the “Index”)
† Source: Lipper Inc.
Past performance is not predictive of future performance. The fund’s performance does not reflect the deduction of additional charges and expenses imposed in connection with investing in variable insurance contracts which will reduce returns.
The above graph compares a $10,000 investment made in Initial and Service shares of Dreyfus Variable Investment Fund, Appreciation Portfolio on 12/31/08 to a $10,000 investment made in the Index on that date.
The fund’s performance shown in the line graph above takes into account all applicable fund fees and expenses for Initial and Service shares. The Index is widely regarded as the best single gauge of large-cap U.S. equities. The index includes 500 leading companies and captures approximately 80% coverage of available market capitalization. Unlike a mutual fund, the Index is not subject to charges, fees and other expenses. Investors cannot invest directly in any index. Further information relating to fund performance, including expense reimbursements, if applicable, is contained in the Financial Highlights section of the prospectus and elsewhere in this report.
| | | | |
Average Annual Total Returns as of 12/31/18 |
| 1 Year | 5 Years | 10 Years |
Initial shares | -6.86% | 6.17% | 10.77% |
Service shares | -7.10% | 5.90% | 10.49% |
S&P 500® Index | -4.38% | 8.49% | 13.11% |
The performance data quoted represents past performance, which is no guarantee of future results. Share price and investment return fluctuate and an investor’s shares may be worth more or less than original cost upon redemption. Current performance may be lower or higher than the performance quoted. Go to Dreyfus.com for the fund’s most recent month-end returns.
The fund’s Initial shares are not subject to a Rule 12b-1 fee. The fund’s Service shares are subject to a 0.25% annual Rule 12b-1 fee. All dividends and capital gain distributions are reinvested.
The fund’s performance shown in the graph and table does not reflect the deduction of taxes that a shareholder would pay on fund distributions or the redemption of fund shares.
5
UNDERSTANDING YOUR FUND’S EXPENSES(Unaudited)
As a mutual fund investor, you pay ongoing expenses, such as management fees and other expenses. Using the information below, you can estimate how these expenses affect your investment and compare them with the expenses of other funds. You also may pay one-time transaction expenses, including sales charges (loads), redemption fees and expenses associated with variable annuity or insurance contracts, which are not shown in this section and would have resulted in higher total expenses. For more information, see your fund’s prospectus or talk to your financial adviser.
Review your fund’s expenses
The table below shows the expenses you would have paid on a $1,000 investment in Dreyfus Variable Investment Fund, Appreciation Portfolio from July 1, 2018 to December 31, 2018. It also shows how much a $1,000 investment would be worth at the close of the period, assuming actual returns and expenses.
| | | | | | | | |
Expenses and Value of a $1,000 Investment | | |
assuming actual returns for the six months ended December 31, 2018 | |
| | | | Initial Shares | Service Shares |
Expenses paid per $1,000† | | | $3.87 | | $5.08 |
Ending value (after expenses) | | | $920.80 | | $919.40 |
COMPARING YOUR FUND’S EXPENSES
WITH THOSE OF OTHER FUNDS(Unaudited)
Using the SEC’s method to compare expenses
The Securities and Exchange Commission (“SEC”) has established guidelines to help investors assess fund expenses. Per these guidelines, the table below shows your fund’s expenses based on a $1,000 investment, assuming a hypothetical 5% annualized return. You can use this information to compare the ongoing expenses (but not transaction expenses or total cost) of investing in the fund with those of other funds. All mutual fund shareholder reports will provide this information to help you make this comparison. Please note that you cannot use this information to estimate your actual ending account balance and expenses paid during the period.
| | | | | | | | |
Expenses and Value of a $1,000 Investment | | |
assuming a hypothetical 5% annualized return for the six months ended December 31, 2018 |
| | | | Initial Shares | Service Shares |
Expenses paid per $1,000† | | | $4.08 | | $5.35 |
Ending value (after expenses) | | | $1,021.17 | | $1,019.91 |
† Expenses are equal to the fund’s annualized expense ratio of .80% for Initial shares and 1.05% for Service shares, multiplied by the average account value over the period, multiplied by 184/365 (to reflect the one-half year period).
6
STATEMENT OF INVESTMENTS
December 31, 2018
| | | | | | | | |
| |
Description | | | | Shares | | Value ($) | |
Common Stocks - 99.3% | | | | | |
Banks - 3.5% | | | | | |
JPMorgan Chase & Co. | | | | 121,825 | | 11,892,556 | |
Capital Goods - 1.6% | | | | | |
United Technologies | | | | 49,875 | | 5,310,690 | |
Commercial & Professional Services - .8% | | | | | |
Verisk Analytics | | | | 23,740 | a | 2,588,610 | |
Consumer Durables & Apparel - 3.0% | | | | | |
Hermes International | | | | 2,677 | | 1,480,506 | |
LVMH Moet Hennessy Louis Vuitton | | | | 15,250 | | 4,481,149 | |
NIKE, Cl. B | | | | 58,115 | | 4,308,647 | |
| | | | | 10,270,302 | |
Consumer Services - 1.9% | | | | | |
McDonald's | | | | 35,775 | | 6,352,567 | |
Diversified Financials - 8.4% | | | | | |
American Express | | | | 65,175 | | 6,212,481 | |
BlackRock | | | | 19,400 | | 7,620,708 | |
Intercontinental Exchange | | | | 48,800 | | 3,676,104 | |
S&P Global | | | | 35,250 | | 5,990,385 | |
State Street | | | | 79,625 | | 5,021,949 | |
| | | | | 28,521,627 | |
Energy - 6.6% | | | | | |
Chevron | | | | 79,550 | | 8,654,245 | |
ConocoPhillips | | | | 71,250 | | 4,442,437 | |
Exxon Mobil | | | | 134,639 | | 9,181,033 | |
| | | | | 22,277,715 | |
Food, Beverage & Tobacco - 14.1% | | | | | |
Altria Group | | | | 169,175 | | 8,355,553 | |
Anheuser-Busch InBev, ADR | | | | 34,150 | b | 2,247,411 | |
Coca-Cola | | | | 203,600 | | 9,640,460 | |
Constellation Brands, Cl. A | | | | 22,450 | | 3,610,409 | |
Nestle, ADR | | | | 72,075 | | 5,835,192 | |
PepsiCo | | | | 59,675 | | 6,592,894 | |
Philip Morris International | | | | 171,575 | | 11,454,347 | |
| | | | | 47,736,266 | |
Health Care Equipment & Services - 3.6% | | | | | |
Abbott Laboratories | | | | 100,075 | | 7,238,425 | |
UnitedHealth Group | | | | 20,450 | | 5,094,504 | |
| | | | | 12,332,929 | |
Household & Personal Products - 2.9% | | | | | |
Estee Lauder, Cl. A | | | | 75,425 | | 9,812,792 | |
Insurance - 3.1% | | | | | |
Chubb | | | | 79,900 | | 10,321,482 | |
7
STATEMENT OF INVESTMENTS (continued)
| | | | | | | | |
| |
Description | | | | Shares | | Value ($) | |
Common Stocks - 99.3% (continued) | | | | | |
Materials - 2.9% | | | | | |
Air Products & Chemicals | | | | 9,900 | | 1,584,495 | |
Linde | | | | 39,150 | | 6,108,966 | |
Sherwin-Williams | | | | 5,250 | | 2,065,665 | |
| | | | | 9,759,126 | |
Media & Entertainment - 14.1% | | | | | |
Alphabet, Cl. C | | | | 13,394 | a | 13,870,960 | |
Comcast, Cl. A | | | | 261,840 | | 8,915,652 | |
Facebook, Cl. A | | | | 114,085 | a | 14,955,403 | |
Twenty-First Century Fox, Cl. A | | | | 137,661 | | 6,624,247 | |
Walt Disney | | | | 29,875 | | 3,275,794 | |
| | | | | 47,642,056 | |
Pharmaceuticals Biotechnology & Life Sciences - 5.5% | | | | | |
AbbVie | | | | 82,250 | | 7,582,628 | |
Novo Nordisk, ADR | | | | 132,275 | | 6,093,909 | |
Roche Holding, ADR | | | | 157,525 | | 4,895,877 | |
| | | | | 18,572,414 | |
Retailing - 2.1% | | | | | |
Amazon.com | | | | 4,700 | a | 7,059,259 | |
Semiconductors & Semiconductor Equipment - 5.5% | | | | | |
ASML Holding | | | | 35,975 | | 5,598,429 | |
Infineon Technologies, ADR | | | | 85,000 | | 1,698,725 | |
Texas Instruments | | | | 121,375 | | 11,469,937 | |
| | | | | 18,767,091 | |
Software & Services - 11.1% | | | | | |
Automatic Data Processing | | | | 16,665 | | 2,185,115 | |
Microsoft | | | | 226,585 | | 23,014,238 | |
Visa, Cl. A | | | | 93,225 | b | 12,300,106 | |
| | | | | 37,499,459 | |
Technology Hardware & Equipment - 5.1% | | | | | |
Apple | | | | 110,200 | | 17,382,948 | |
Transportation - 3.5% | | | | | |
Canadian Pacific Railway | | | | 28,925 | b | 5,137,659 | |
Union Pacific | | | | 47,750 | | 6,600,482 | |
| | | | | 11,738,141 | |
Total Common Stocks(cost $167,111,219) | | | | 335,838,030 | |
| | | 1-Day
Yield (%) | | | | | |
Investment Companies - .5% | | | | | |
Registered Investment Companies - .5% | | | | | |
Dreyfus Institutional Preferred Government Plus Money Market Fund
(cost $1,633,898) | | 2.32 | | 1,633,898 | c | 1,633,898 | |
8
| | | | | | | | |
| |
Description | | 1-Day
Yield (%) | | Shares | | Value ($) | |
Investment of Cash Collateral for Securities Loaned - .6% | | | | | |
Registered Investment Companies - .6% | | | | | |
Dreyfus Institutional Preferred Government Money Market Fund, Institutional Shares
(cost $2,043,845) | | 2.69 | | 2,043,845 | c | 2,043,845 | |
Total Investments(cost $170,788,962) | | 100.4% | | 339,515,773 | |
Liabilities, Less Cash and Receivables | | (.4%) | | (1,496,912) | |
Net Assets | | 100.0% | | 338,018,861 | |
ADR—American Depository Receipt
a Non-income producing security.
b Security, or portion thereof, on loan. At December 31, 2018, the value of the fund’s securities on loan was $13,394,577 and the value of the collateral held by the fund was $13,578,089, consisting of cash collateral of $2,043,845 and U.S. Government & Agency securities valued at $11,534,244.
c Investment in affiliated issuer. The investment objective of this investment company is publicly available and can be found within the investment company’s prospectus.
| | |
Portfolio Summary (Unaudited)† | Value (%) |
Information Technology | 21.8 |
Consumer Staples | 17.0 |
Financials | 15.0 |
Communication Services | 14.1 |
Health Care | 9.1 |
Consumer Discretionary | 7.0 |
Energy | 6.6 |
Industrials | 5.8 |
Materials | 2.9 |
Investment Companies | 1.1 |
| | 100.4 |
† Based on net assets.
See notes to financial statements.
9
STATEMENT OF INVESTMENTS IN AFFILIATED ISSUERS
| | | | | | | |
Registered Investment Companies | Value
12/31/17($) | Purchases($) | Sales ($) | Value
12/31/18($) | Net
Assets(%) | Dividends/
Distributions($) |
Dreyfus Institutional Preferred Government Money Market Fund, Institutional Shares | - | 51,138,013 | 49,094,168 | 2,043,845 | .6 | - |
Dreyfus Institutional Preferred Government Plus Money Market Fund | 1,867,769 | 37,713,975 | 37,947,846 | 1,633,898 | .5 | 26,183 |
Total | 1,867,769 | 88,851,988 | 87,042,014 | 3,677,743 | 1.1 | 26,183 |
See notes to financial statements.
10
STATEMENT OF ASSETS AND LIABILITIES
December 31, 2018
| | | | | | | |
| | | | | | |
| | | Cost | | Value | |
Assets ($): | | | | |
Investments in securities—See Statement of Investments
(including securities on loan, valued at $13,394,577)—Note 1(c): | | | |
Unaffiliated issuers | 167,111,219 | | 335,838,030 | |
Affiliated issuers | | 3,677,743 | | 3,677,743 | |
Cash denominated in foreign currency | | | 29,826 | | 30,204 | |
Dividends and securities lending income receivable | | 846,086 | |
Receivable for shares of Beneficial Interest subscribed | | 100,011 | |
Receivable for investment securities sold | | 70,876 | |
Prepaid expenses | | | | | 3,088 | |
| | | | | 340,566,038 | |
Liabilities ($): | | | | |
Due to The Dreyfus Corporation and affiliates—Note 3(b) | | | | 196,327 | |
Due to Fayez Sarofim & Co. | | | | | 64,301 | |
Liability for securities on loan—Note 1(c) | | 2,043,845 | |
Payable for shares of Beneficial Interest redeemed | | 168,114 | |
Trustees fees and expenses payable | | 2,231 | |
Unrealized depreciation on foreign currency transactions | | 400 | |
Accrued expenses | | | | | 71,959 | |
| | | | | 2,547,177 | |
Net Assets ($) | | | 338,018,861 | |
Composition of Net Assets ($): | | | | |
Paid-in capital | | | | | 126,241,519 | |
Total distributable earnings (loss) | | | | | 211,777,342 | |
Net Assets ($) | | | 338,018,861 | |
| | | | |
Net Asset Value Per Share | Initial Shares | Service Shares | |
Net Assets ($) | 225,631,491 | 112,387,370 | |
Shares Outstanding | 6,295,681 | 3,166,291 | |
Net Asset Value Per Share ($) | 35.84 | 35.49 | |
| | | | |
See notes to financial statements. | | | |
11
STATEMENT OF OPERATIONS
Year Ended December 31, 2018
| | | | | | | |
| | | | | | |
| | | | | | |
Investment Income ($): | | | | |
Income: | | | | |
Cash dividends (net of $180,090 foreign taxes withheld at source): | |
Unaffiliated issuers | | | 8,236,118 | |
Affiliated issuers | | | 26,183 | |
Income from securities lending—Note 1(c) | �� | | 41,654 | |
Total Income | | | 8,303,955 | |
Expenses: | | | | |
Investment advisory fee—Note 3(a) | | | 2,099,871 | |
Sub-investment advisory fee—Note 3(a) | | | 857,694 | |
Distribution fees—Note 3(b) | | | 336,109 | |
Professional fees | | | 92,425 | |
Prospectus and shareholders’ reports | | | 43,946 | |
Trustees’ fees and expenses—Note 3(c) | | | 30,776 | |
Custodian fees—Note 3(b) | | | 16,548 | |
Loan commitment fees—Note 2 | | | 8,301 | |
Shareholder servicing costs—Note 3(b) | | | 2,095 | |
Interest expense—Note 2 | | | 228 | |
Miscellaneous | | | 38,565 | |
Total Expenses | | | 3,526,558 | |
Investment Income—Net | | | 4,777,397 | |
Realized and Unrealized Gain (Loss) on Investments—Note 4 ($): | | |
Net realized gain (loss) on investments and foreign currency transactions | 42,632,807 | |
Net unrealized appreciation (depreciation) on investments
and foreign currency transactions | | | (71,694,542) | |
Net Realized and Unrealized Gain (Loss) on Investments | | | (29,061,735) | |
Net (Decrease) in Net Assets Resulting from Operations | | (24,284,338) | |
| | | | | | | |
See notes to financial statements. | | | | | |
12
STATEMENT OF CHANGES IN NET ASSETS
| | | | | | | | | | |
| | | | Year Ended December 31, |
| | | | 2018 | | 2017 | a |
Operations ($): | | | | | | | | |
Investment income—net | | | 4,777,397 | | | | 5,173,319 | |
Net realized gain (loss) on investments | | 42,632,807 | | | | 50,697,356 | |
Net unrealized appreciation (depreciation)
on investments | | (71,694,542) | | | | 42,703,302 | |
Net Increase (Decrease) in Net Assets
Resulting from Operations | (24,284,338) | | | | 98,573,977 | |
Distributions ($): | |
Distributions to shareholders: | | | | | | | | |
Initial Shares | | | (36,501,235) | | | | (36,073,115) | |
Service Shares | | | (18,803,539) | | | | (23,829,387) | |
Total Distributions | | | (55,304,774) | | | | (59,902,502) | |
Beneficial Interest Transactions ($): | |
Net proceeds from shares sold: | | | | | | | | |
Initial Shares | | | 6,205,656 | | | | 7,444,269 | |
Service Shares | | | 7,827,922 | | | | 8,089,313 | |
Distributions reinvested: | | | | | | | | |
Initial Shares | | | 36,501,235 | | | | 36,073,115 | |
Service Shares | | | 18,803,539 | | | | 23,829,387 | |
Cost of shares redeemed: | | | | | | | | |
Initial Shares | | | (36,212,750) | | | | (35,224,654) | |
Service Shares | | | (32,792,813) | | | | (61,387,520) | |
Increase (Decrease) in Net Assets
from Beneficial Interest Transactions | 332,789 | | | | (21,176,090) | |
Total Increase (Decrease) in Net Assets | (79,256,323) | | | | 17,495,385 | |
Net Assets ($): | |
Beginning of Period | | | 417,275,184 | | | | 399,779,799 | |
End of Period | | | 338,018,861 | | | | 417,275,184 | |
Capital Share Transactions (Shares): | |
Initial Shares | | | | | | | | |
Shares sold | | | 151,190 | | | | 177,820 | |
Shares issued for distributions reinvested | | | 957,001 | | | | 937,609 | |
Shares redeemed | | | (891,681) | | | | (847,904) | |
Net Increase (Decrease) in Shares Outstanding | 216,510 | | | | 267,525 | |
Service Shares | | | | | | | | |
Shares sold | | | 194,324 | | | | 198,043 | |
Shares issued for distributions reinvested | | | 497,903 | | | | 625,749 | |
Shares redeemed | | | (807,266) | | | | (1,507,252) | |
Net Increase (Decrease) in Shares Outstanding | (115,039) | | | | (683,460) | |
| | | | | | | | | | |
aDistributions to shareholders include $3,397,259 Initial shares and $1,710,007 Service shares distributions from net investment income and $32,675,856 Initial shares and $22,119,380 Service shares distributions from net realized gains. Undistributed investment income—net was $313,234 in 2017 and is no longer presented as a result of the adoption of SEC’s Disclosure Update and Simplification Rule. | |
See notes to financial statements. | | | | | | | | |
13
FINANCIAL HIGHLIGHTS
The following tables describe the performance for each share class for the fiscal periods indicated. All information (except portfolio turnover rate) reflects financial results for a single fund share. Total return shows how much your investment in the fund would have increased (or decreased) during each period, assuming you had reinvested all dividends and distributions. The fund’s total returns do not reflect expenses associated with variable annuity or insurance contracts. These figures have been derived from the fund’s financial statements.
| | | | | | | | | | | | | | |
| | | | | | | |
| | | |
Initial Shares | | | Year Ended December 31, |
| | | 2018 | 2017 | 2016 | 2015 | 2014 |
Per Share Data ($): | | | | | | |
Net asset value, beginning of period | | 44.71 | 41.01 | 45.23 | 49.51 | 47.95 |
Investment Operations: | | | | | | |
Investment income—neta | | .53 | .56 | .68 | .80 | .89 |
Net realized and unrealized
gain (loss) on investments | | (3.27) | 9.55 | 2.48 | (1.97) | 2.86 |
Total from Investment Operations | | (2.74) | 10.11 | 3.16 | (1.17) | 3.75 |
Distributions: | | | | | | |
Dividends from
investment income—net | | (.52) | (.57) | (.69) | (.81) | (.90) |
Dividends from net realized
gain on investments | | (5.61) | (5.84) | (6.69) | (2.30) | (1.29) |
Total Distributions | | (6.13) | (6.41) | (7.38) | (3.11) | (2.19) |
Net asset value, end of period | | 35.84 | 44.71 | 41.01 | 45.23 | 49.51 |
Total Return (%) | | (6.86) | 27.33 | 7.91 | (2.47) | 8.09 |
Ratios/Supplemental Data (%): | | | | | | |
Ratio of total expenses
to average net assets | | .81 | .81 | .82 | .80 | .80 |
Ratio of net expenses
to average net assets | | .81 | .81 | .82 | .80 | .80 |
Ratio of net investment income
to average net assets | | 1.30 | 1.35 | 1.64 | 1.70 | 1.84 |
Portfolio Turnover Rate | | 6.50 | 3.97 | 4.19 | 11.97 | 3.65 |
Net Assets, end of period ($ x 1,000) | | 225,631 | 271,790 | 238,340 | 256,828 | 329,802 |
a Based on average shares outstanding.
See notes to financial statements.
14
| | | | | | | | | | | | | |
| | | | | | | |
| | | |
Service Shares | | | Year Ended December 31, |
| | | 2018 | 2017 | 2016 | 2015 | 2014 |
Per Share Data ($): | | | | | | |
Net asset value, beginning of period | | 44.34 | 40.72 | 44.96 | 49.23 | 47.69 |
Investment Operations: | | | | | | |
Investment income—neta | | .42 | .46 | .57 | .68 | .76 |
Net realized and unrealized
gain (loss) on investments | | (3.25) | 9.46 | 2.46 | (1.96) | 2.85 |
Total from Investment Operations | | (2.83) | 9.92 | 3.03 | (1.28) | 3.61 |
Distributions: | | | | | | |
Dividends from
investment income—net | | (.41) | (.46) | (.58) | (.69) | (.78) |
Dividends from net realized
gain on investments | | (5.61) | (5.84) | (6.69) | (2.30) | (1.29) |
Total Distributions | | (6.02) | (6.30) | (7.27) | (2.99) | (2.07) |
Net asset value, end of period | | 35.49 | 44.34 | 40.72 | 44.96 | 49.23 |
Total Return (%) | | (7.10) | 27.00 | 7.64 | (2.72) | 7.83 |
Ratios/Supplemental Data (%): | | | | | | |
Ratio of total expenses
to average net assets | | 1.06 | 1.06 | 1.07 | 1.05 | 1.05 |
Ratio of net expenses
to average net assets | | 1.06 | 1.06 | 1.07 | 1.05 | 1.05 |
Ratio of net investment income
to average net assets | | 1.05 | 1.11 | 1.41 | 1.45 | 1.59 |
Portfolio Turnover Rate | | 6.50 | 3.97 | 4.19 | 11.97 | 3.65 |
Net Assets, end of period ($ x 1,000) | | 112,387 | 145,485 | 161,440 | 231,421 | 264,795 |
a Based on average shares outstanding.
See notes to financial statements.
15
NOTES TO FINANCIAL STATEMENTS
NOTE 1—Significant Accounting Policies:
Appreciation Portfolio (the “fund”) is a separate diversified series of Dreyfus Variable Investment Fund (the “Company”), which is registered under the Investment Company Act of 1940, as amended (the “Act”), as an open-end management investment company and operates as a series company currently offering seven series, including the fund. The fund is only offered to separate accounts established by insurance companies to fund variable annuity contracts and variable life insurance policies. The fund’s investment objective is to seek long-term capital growth consistent with the preservation of capital. The Dreyfus Corporation (the “Manager” or “Dreyfus”), a wholly-owned subsidiary of The Bank of New York Mellon Corporation (“BNY Mellon”), serves as the fund’s investment adviser. Fayez Sarofim & Co. (“Sarofim & Co.”) serves as the fund’s sub–investment adviser.
MBSC Securities Corporation (the “Distributor”), a wholly-owned subsidiary of Dreyfus, is the distributor of the fund’s shares, which are sold without a sales charge. The fund is authorized to issue an unlimited number of $.001 par value shares of Beneficial Interest in each of the following classes of shares: Initial and Service. Each class of shares has identical rights and privileges, except with respect to the Distribution Plan, and the expenses borne by each class, the allocation of certain transfer agency costs, and certain voting rights. Income, expenses (other than expenses attributable to a specific class), and realized and unrealized gains or losses on investments are allocated to each class of shares based on its relative net assets.
The Company accounts separately for the assets, liabilities and operations of each series. Expenses directly attributable to each series are charged to that series’ operations; expenses which are applicable to all series are allocated among them on a pro rata basis.
The Financial Accounting Standards Board (“FASB”) Accounting Standards Codification is the exclusive reference of authoritative U.S. generally accepted accounting principles (“GAAP”) recognized by the FASB to be applied by nongovernmental entities. Rules and interpretive releases of the Securities and Exchange Commission (“SEC”) under authority of federal laws are also sources of authoritative GAAP for SEC registrants. The fund’s financial statements are prepared in accordance with GAAP, which may require the use of management estimates and assumptions. Actual results could differ from those estimates.
The Companyenters into contracts that contain a variety of indemnifications. The fund’s maximum exposure under these
16
arrangements is unknown. The fund does not anticipate recognizing any loss related to these arrangements.
(a) Portfolio valuation: The fair value of a financial instrument is the amount that would be received to sell an asset or paid to transfer a liability in an orderly transaction between market participants at the measurement date (i.e., the exit price). GAAP establishes a fair value hierarchy that prioritizes the inputs of valuation techniques used to measure fair value. This hierarchy gives the highest priority to unadjusted quoted prices in active markets for identical assets or liabilities (Level 1 measurements) and the lowest priority to unobservable inputs (Level 3 measurements).
Additionally, GAAP provides guidance on determining whether the volume and activity in a market has decreased significantly and whether such a decrease in activity results in transactions that are not orderly. GAAP requires enhanced disclosures around valuation inputs and techniques used during annual and interim periods.
Various inputs are used in determining the value of the fund’s investments relating to fair value measurements. These inputs are summarized in the three broad levels listed below:
Level 1—unadjusted quoted prices in active markets for identical investments.
Level 2—other significant observable inputs (including quoted prices for similar investments, interest rates, prepayment speeds, credit risk, etc.).
Level 3—significant unobservable inputs (including the fund’s own assumptions in determining the fair value of investments).
The inputs or methodology used for valuing securities are not necessarily an indication of the risk associated with investing in those securities.
Changes in valuation techniques may result in transfers in or out of an assigned level within the disclosure hierarchy. Valuation techniques used to value the fund’s investments are as follows:
Investments in securities are valued at the last sales price on the securities exchange or national securities market on which such securities are primarily traded. Securities listed on the National Market System for which market quotations are available are valued at the official closing price or, if there is no official closing price that day, at the last sales price. For open short positions, asked prices are used for valuation purposes. Bid price is used when no asked price is available. Registered investment companies that are not traded on an exchange are valued at their net asset value. All of
17
NOTES TO FINANCIAL STATEMENTS(continued)
the preceding securities are generally categorized within Level 1 of the fair value hierarchy.
Securities not listed on an exchange or the national securities market, or securities for which there were no transactions, are valued at the average of the most recent bid and asked prices. These securities are generally categorized within Level 2 of the fair value hierarchy.
Fair valuing of securities may be determined with the assistance of a pricing service using calculations based on indices of domestic securities and other appropriate indicators, such as prices of relevant ADRs and futures. Utilizing these techniques may result in transfers between Level 1 and Level 2 of the fair value hierarchy.
When market quotations or official closing prices are not readily available, or are determined not to accurately reflect fair value, such as when the value of a security has been significantly affected by events after the close of the exchange or market on which the security is principally traded (for example, a foreign exchange or market), but before the fund calculates its net asset value, the fund may value these investments at fair value as determined in accordance with the procedures approved by the Company’s Board of Trustees (the “Board”). Certain factors may be considered when fair valuing investments such as: fundamental analytical data, the nature and duration of restrictions on disposition, an evaluation of the forces that influence the market in which the securities are purchased and sold, and public trading in similar securities of the issuer or comparable issuers. These securities are either categorized within Level 2 or 3 of the fair value hierarchy depending on the relevant inputs used.
For restricted securities where observable inputs are limited, assumptions about market activity and risk are used and such securities are generally categorized within Level 3 of the fair value hierarchy.
Investments denominated in foreign currencies are translated to U.S. dollars at the prevailing rates of exchange.
The following is a summary of the inputs used as of December 31, 2018in valuing the fund’s investments:
18
| | | | | | |
| | Level 1 -
Unadjusted
Quoted Prices | Level 2 - Other
Significant
Observable Inputs | Level 3 – Significant
Unobservable
Inputs | Total |
Assets ($) | | | |
Investments in Securities: | | | |
Equity Securities - Common Stocks† | 329,876,375 | 5,961,655†† | - | 335,838,030 |
Investment Companies | 3,677,743 | - | - | 3,677,743 |
† See Statement of Investments for additional detailed categorizations.
†† Securities classified within Level 2 at period end as the values were determined pursuant to the fund’s fair valuation procedures.
At December 31, 2018, there were no transfers between levels of the fair value hierarchy. It is the fund’s policy to recognize transfers between levels at the end of the reporting period.
(b) Foreign currency transactions: The fund does not isolate that portion of the results of operations resulting from changes in foreign exchange rates on investments from the fluctuations arising from changes in the market prices of securities held. Such fluctuations are included with the net realized and unrealized gain or loss on investments.
Net realized foreign exchange gains or losses arise from sales of foreign currencies, currency gains or losses realized on securities transactions between trade and settlement date, and the difference between the amounts of dividends, interest and foreign withholding taxes recorded on the fund’s books and the U.S. dollar equivalent of the amounts actually received or paid. Net unrealized foreign exchange gains and losses arise from changes in the value of assets and liabilities other than investments resulting from changes in exchange rates. Foreign currency gains and losses on foreign currency transactions are also included with net realized and unrealized gain or loss on investments.
(c)Securities transactions and investment income: Securities transactions are recorded on a trade date basis. Realized gains and losses from securities transactions are recorded on the identified cost basis. Dividend income is recognized on the ex-dividend date and interest income, including, where applicable, accretion of discount and amortization of premium on investments, is recognized on the accrual basis.
Pursuant to a securities lending agreement with The Bank of New York Mellon, a subsidiary of BNY Mellon and an affiliate of Dreyfus, the fund may lend securities to qualified institutions. It is the fund’s policy that, at
19
NOTES TO FINANCIAL STATEMENTS(continued)
origination, all loans are secured by collateral of at least 102% of the value of U.S. securities loaned and 105% of the value of foreign securities loaned. Collateral equivalent to at least 100% of the market value of securities on loan is maintained at all times. Collateral is either in the form of cash, which can be invested in certain money market mutual funds managed by Dreyfus, or U.S. Government and Agency securities. The fund is entitled to receive all dividends, interest and distributions on securities loaned, in addition to income earned as a result of the lending transaction. Should a borrower fail to return the securities in a timely manner, The Bank of New York Mellon is required to replace the securities for the benefit of the fund or credit the fund with the market value of the unreturned securities and is subrogated to the fund’s rights against the borrower and the collateral. Additionally, the contractual maturity of security lending transactions are on an overnight and continuous basis. During the period ended December 31, 2018, The Bank of New York Mellon earned $7,598 from lending portfolio securities, pursuant to the securities lending agreement.
(d) Affiliated issuers: Investments in other investment companies advised by Dreyfus are considered “affiliated” under the Act.
(e) Dividends and distributions to shareholders:Dividends and distributions are recorded on the ex-dividend date. Dividends from investment income-net are normally declared and paid quarterly. Dividends from net realized capital gains, if any, are normally declared and paid annually, but the fund may make distributions on a more frequent basis to comply with the distribution requirements of the Internal Revenue Code of 1986, as amended (the “Code”). To the extent that net realized capital gains can be offset by capital loss carryovers, it is the policy of the fund not to distribute such gains. Income and capital gain distributions are determined in accordance with income tax regulations, which may differ from GAAP.
(f) Federal income taxes: It is the policy of the fund to continue to qualify as a regulated investment company, if such qualification is in the best interests of its shareholders, by complying with the applicable provisions of the Code, and to make distributions of taxable income and net realized capital gain sufficient to relieve it from substantially all federal income and excise taxes.
As of and during the period ended December 31, 2018, the fund did not have any liabilities for any uncertain tax positions. The fund recognizes interest and penalties, if any, related to uncertain tax positions as income tax expense in the Statement of Operations. During the period ended December 31, 2018, the fund did not incur any interest or penalties.
20
Each tax year in the four-year period ended December 31, 2018 remains subject to examination by the Internal Revenue Service and state taxing authorities.
At December 31, 2018, the components of accumulated earnings on a tax basis were as follows: undistributed ordinary income $677,631, undistributed capital gains $42,436,296 and unrealized appreciation $168,663,415.
The tax character of distributions paid to shareholders during the fiscal periods ended December 31, 2018 and December 31, 2017 were as follows: ordinary income $4,703,453 and $5,358,909, and long-term capital gains $50,601,321 and $54,543,593, respectively.
(g) New Accounting Pronouncements: In August 2018, the FASB issued Accounting Standards Update 2018-13, Fair Value Measurement (Topic 820): Disclosure Framework—Changes to the Disclosure Requirements for Fair Value Measurement (“ASU 2018-13”). The update provides guidance that eliminates, adds and modifies certain disclosure requirements for fair value measurements. ASU 2018-13 will be effective for annual periods beginning after December 15, 2019. Management is currently assessing the potential impact of these changes to future financial statements.
NOTE 2—Bank Lines of Credit:
The fund participates with other Dreyfus-managed long-term open-end funds in a $1.030 billion unsecured credit facility led by Citibank, N.A. (the “Citibank Credit Facility”) and a $300 million unsecured credit facility provided by The Bank of New York Mellon (the “BNYM Credit Facility”), each to be utilized primarily for temporary or emergency purposes, including the financing of redemptions (each, a “Facility”). The Citibank Credit Facility is available in two tranches: (i) Tranche A is in an amount equal to $830 million and is available to all long-term open-ended funds, including the fund, and (ii) Tranche B is in amount equal to $200 million and is available only to the Dreyfus Floating Rate Income Fund, a series of The Dreyfus/Laurel Funds, Inc. Prior to October 3, 2018, the unsecured credit facility with Citibank, N.A. was $830 million. In connection therewith, the fund has agreed to pay its pro rata portion of commitment fees for Tranche A of the Citibank Credit Facility and the BNYM Credit Facility. Interest is charged to the fund based on rates determined pursuant to the terms of the respective Facility at the time of borrowing.
The average amount of borrowings outstanding under the Facilities during the period ended December 31, 2018 was approximately $7,670 with a related weighted average annualized interest rate of 2.97%.
21
NOTES TO FINANCIAL STATEMENTS(continued)
NOTE 3—Investment Advisory Fee, Sub-Investment Advisory Fee and Other Transactions with Affiliates:
(a)Pursuant to an investment advisory agreement with Dreyfus, the investment advisory fee is computed at the annual rate of .5325% of the value of the fund’s average daily net assets. Pursuant to a sub-investment advisory agreement with Sarofim & Co., the fund pays Sarofim & Co. a monthly sub-investment advisory fee at the annual rate of .2175% of the value of the fund’s average daily net assets. Both fees are payable monthly.
(b)Under the Distribution Plan adopted pursuant to Rule 12b-1 under the Act, Service shares pay the Distributor for distributing its shares, for servicing and/or maintaining Service shares’ shareholder accounts and for advertising and marketing for Service shares. The Distribution Plan provides for payments to be made at an annual rate of .25% of the value of the Service shares’ average daily net assets. The Distributor may make payments to Participating Insurance Companies and to brokers and dealers acting as principal underwriter for their variable insurance products. The fees payable under the Distribution Plan are payable without regard to actual expenses incurred. During the period ended December 31, 2018,Service shares were charged $336,109 pursuant to the Distribution Plan.
The fund has arrangements with the transfer agent and the custodian whereby the fund may receive earnings credits when positive cash balances are maintained, which are used to offset transfer agency and custody fees. For financial reporting purposes, the fund includes net earnings credits, if any, as an expense offset in the Statement of Operations.
The fund compensates Dreyfus Transfer, Inc., a wholly-owned subsidiary of Dreyfus, under a transfer agency agreement for providing transfer agency and cash management services for the fund. The majority of transfer agency fees are comprised of amounts paid on a per account basis, while cash management fees are related to fund subscriptions and redemptions. During the period ended December 31, 2018, the fund was charged $1,996 for transfer agency services. These fees are included in Shareholder servicing costs in the Statement of Operations.
The fund compensates The Bank of New York Mellon under a custody agreement for providing custodial services for the fund. These fees are determined based on net assets, geographic region and transaction activity. During the period ended December 31, 2018, the fund was charged $16,548 pursuant to the custody agreement.
During the period ended December 31, 2018, the fund was charged $12,774 for services performed by the Chief Compliance Officer and his
22
staff. These fees are included in Miscellaneous in the Statement of Operations.
The components of “Due to The Dreyfus Corporation and affiliates” in the Statement of Assets and Liabilities consist of: investment advisory fees $157,428, Distribution Plan fees $24,612, custodian fees $7,526, Chief Compliance Officer fees $6,289 and transfer agency fees $472.
(c) Each Board member also serves as a Board member of other funds within the Dreyfus complex. Annual retainer fees and attendance fees are allocated to each fund based on net assets.
NOTE 4—Securities Transactions:
The aggregate amount of purchases and sales of investment securities, excluding short-term securities, during the period ended December 31, 2018, amounted to $25,489,672 and $75,362,409, respectively.
At December 31, 2018, the cost of investments for federal income tax purposes was $170,852,336; accordingly, accumulated net unrealized appreciation on investments was $168,663,437, consisting of $172,982,044 gross unrealized appreciation and $4,318,607 gross unrealized depreciation.
23
REPORT OF INDEPENDENT REGISTERED PUBLIC ACCOUNTING FIRM
To the Shareholders and the Board of Trustees of Appreciation Portfolio
Opinion on the Financial Statements
We have audited the accompanying statement of assets and liabilities of Appreciation Portfolio (the “Fund”) (one of the funds constituting Dreyfus Variable Investment Fund), including the statements of investments and investments in affiliated issuers, as of December 31, 2018, and the related statement of operations for the year then ended, the statements of changes in net assets for each of the two years in the period then ended, the financial highlights for each of the five years in the period then ended and the related notes (collectively referred to as the “financial statements”). In our opinion, the financial statements present fairly, in all material respects, the financial position of the Fund (one of the funds constituting Dreyfus Variable Investment Fund) at December 31, 2018, the results of its operations for the year then ended, the changes in its net assets for each of the two years in the period then ended and its financial highlights for each of the five years in the period then ended, in conformity with U.S. generally accepted accounting principles.
Basis for Opinion
These financial statements are the responsibility of the Fund’s management. Our responsibility is to express an opinion on the Fund’s financial statements based on our audits. We are a public accounting firm registered with the Public Company Accounting Oversight Board (United States) (“PCAOB”) and are required to be independent with respect to the Fund in accordance with the U.S. federal securities laws and the applicable rules and regulations of the Securities and Exchange Commission and the PCAOB.
We conducted our audits in accordance with the standards of the PCAOB. Those standards require that we plan and perform the audit to obtain reasonable assurance about whether the financial statements are free of material misstatement, whether due to error or fraud. The Fund is not required to have, nor were we engaged to perform, an audit of the Fund’s internal control over financial reporting. As part of our audits, we are required to obtain an understanding of internal control over financial reporting, but not for the purpose of expressing an opinion on the effectiveness of the Fund’s internal control over financial reporting. Accordingly, we express no such opinion.
Our audits included performing procedures to assess the risks of material misstatement of the financial statements, whether due to error or fraud, and performing procedures that respond to those risks. Such procedures included examining, on a test basis, evidence regarding the amounts and disclosures in the financial statements. Our procedures included confirmation of securities owned as of December 31, 2018, by correspondence with the custodian and others or by other appropriate auditing procedures where replies from others were not received. Our audits also included evaluating the accounting principles used and significant estimates made by management, as well as evaluating the overall presentation of the financial statements. We believe that our audits provide a reasonable basis for our opinion.

We have served as the auditor of one or more Dreyfus investment companies since at least 1957, but we are unable to determine the specific year.
New York, New York
February 11, 2019
24
IMPORTANT TAX INFORMATION(Unaudited)
For federal tax purposes, the fund hereby reports 100% of the ordinary dividends paid during the fiscal year ended December 31, 2018 as qualifying for the corporate dividends received deduction. Shareholders will receive notification in early 2019 of the percentage applicable to the preparation of their 2018 income tax returns. Also, the fund hereby reports $.0109 per share as a short-term capital gain distribution and $5.5963 per share as a long-term capital gain distribution paid on March 29, 2018.
25
BOARD MEMBERS INFORMATION(Unaudited)
INDEPENDENT BOARD MEMBERS
Joseph S. DiMartino (75)
Chairman of the Board (1995)
Principal Occupation During Past 5 Years:
· Corporate Director and Trustee (1995-present)
Other Public Company Board Memberships During Past 5 Years:
· CBIZ (formerly, Century Business Services, Inc.), a provider of outsourcing functions for small and medium size companies, Director (1997-present)
No. of Portfolios for which Board Member Serves:122
———————
Peggy C. Davis (75)
Board Member (2006)
Principal Occupation During Past 5 Years:
· Shad Professor of Law, New York University School of Law (1983-present)
No. of Portfolios for which Board Member Serves: 45
———————
David P. Feldman (79)
Board Member (1994)
Principal Occupation During Past 5 Years:
· Corporate Director and Trustee (1985-present)
Other Public Company Board Memberships During Past 5 Years:
· BBH Mutual Funds Group (5 registered mutual funds), Director (1992-2014)
No. of Portfolios for which Board Member Serves:31
———————
Joan Gulley (71)
Board Member (2017)
Principal Occupation During Past 5 Years:
· PNC Financial Services Group, Inc.(1993-2014), Executive Vice President and Chief Human Resources Officer and Executive Committee Member (2008-2014)
No. of Portfolios for which Board Member Serves:52
———————
26
Ehud Houminer (78)
Board Member (2006)
Principal Occupation During Past 5 Years:
· Board of Overseers at the Columbia Business School, Columbia University (1992-present)
· Trustee, Ben Gurion University
No. of Portfolios for which Board Member Serves: 52
———————
Lynn Martin (79)
Board Member (2012)
Principal Occupation During Past 5 Years:
· President of The Martin Hall Group LLC, a human resources consulting firm (2005-2012)
No. of Portfolios for which Board Member Serves:31
———————
Robin A. Melvin (55)
Board Member (2012)
Principal Occupation During Past 5 Years:
· Co-chairman, Illinois Mentoring Partnership, non-profit organization dedicated to increasing the quantity and quality of mentoring services in Illinois; (2014-present; board member since 2013)
No. of Portfolios for which Board Member Serves:99
———————
Dr. Martin Peretz (79)
Board Member (1990)
Principal Occupation During Past 5 Years:
· Editor-in-Chief Emeritus of The New Republic Magazine (2011-2012) (previously,
Editor-in-Chief, 1974-2011)
· Lecturer at Harvard University (1968-2010)
No. of Portfolios for which Board Member Serves:31
———————
Once elected all Board Members serve for an indefinite term, but achieve Emeritus status upon reaching age 80. The address of the Board Members and Officers is c/o The Dreyfus Corporation, 200 Park Avenue, New York, New York 10166. Additional information about the Board Members is available in the fund’s Statement of Additional Information which can be obtained from Dreyfus free of charge by calling this toll free number: 1-800-DREYFUS.
James F. Henry, Emeritus Board Member
Philip L. Toia, Emeritus Board Member
27
OFFICERS OF THE FUND(Unaudited)
BRADLEY J. SKAPYAK, President since January 2010.
Chief Operating Officer and a director of the Manager since June 2009, Chairman of Dreyfus Transfer, Inc., an affiliate of the Manager and the transfer agent of the funds, since May 2011 and Chief Executive Officer of MBSC Securities Corporation since August 2016. He is an officer of 62 investment companies (comprised of 122 portfolios) managed by the Manager. He is 60 years old and has been an employee of the Manager since February 1988.
BENNETT A. MACDOUGALL, Chief Legal Officer since October 2015.
Chief Legal Officer of the Manager and Associate General Counsel and Managing Director of BNY Mellon since June 2015; from June 2005 to June 2015, he served in various capacities with Deutsche Bank – Asset & Wealth Management Division, including as Director and Associate General Counsel, and Chief Legal Officer of Deutsche Investment Management Americas Inc. from June 2012 to May 2015. He is an officer of 63 investment companies (comprised of 147 portfolios) managed by the Manager. He is 47 years old and has been an employee of the Manager since June 2015.
JAMES BITETTO, Vice President since August 2005 and Secretary since February 2018.
Managing Counsel of BNY Mellon and Secretary of the Manager, and an officer of 63 investment companies (comprised of 147 portfolios) managed by the Manager. He is 52 years old and has been an employee of the Manager since December 1996.
SONALEE CROSS, Vice President and Assistant Secretary since March 2018.
Counsel of BNY Mellon since October 2016; Associate at Proskauer Rose LLP from April 2016 to September 2016; Attorney at EnTrust Capital from August 2015 to February 2016; Associate at Sidley Austin LLP from September 2013 until August 2015. She is an officer of 63 investment companies (comprised of 147 portfolios) managed by Dreyfus. She is 31 years old and has been an employee of the Manager since October 2016.
SARAH S. KELLEHER, Vice President and Assistant Secretary since April 2014.
Managing Counsel of BNY Mellon since December 2017, from March 2013 to December 2017, Senior Counsel of BNY Mellon. She is an officer of 63 investment companies (comprised of 147 portfolios) managed by the Manager. She is 43 years old and has been an employee of the Manager since March 2013.
JEFF PRUSNOFSKY, Vice President and Assistant Secretary since August 2005.
Senior Managing Counsel of BNY Mellon, and an officer of 63 investment companies (comprised of 147 portfolios) managed by the Manager. He is 53 years old and has been an employee of the Manager since October 1990.
NATALYA ZELENSKY, Vice President and Assistant Secretary since March 2017.
Counsel of BNY Mellon since May 2016; Attorney at Wildermuth Endowment Strategy Fund/Wildermuth Advisory, LLC from November 2015 until May 2016; Assistant General Counsel at RCS Advisory Services from July 2014 until November 2015; Associate at Sutherland, Asbill & Brennan from January 2013 until January 2014. She is an officer of 63 investment companies (comprised of 147 portfolios) managed by Dreyfus. She is 33 years old and has been an employee of the Manager since May 2016.
JAMES WINDELS, Treasurer since November 2001.
Director – Mutual Fund Accounting of the Manager, and an officer of 63 investment companies (comprised of 147 portfolios) managed by the Manager. He is 60 years old and has been an employee of the Manager since April 1985.
GAVIN C. REILLY, Assistant Treasurer since December 2005.
Tax Manager of the Investment Accounting and Support Department of the Manager, and an officer of 63 investment companies (comprised of 147 portfolios) managed by the Manager. He is 50 years old and has been an employee of the Manager since April 1991.
ROBERT S. ROBOL, Assistant Treasurer since August 2005.
Senior Accounting Manager – Dreyfus Financial Reporting of the Manager, and an officer of 63 investment companies (comprised of 147 portfolios) managed by the Manager. He is 54 years old and has been an employee of the Manager since October 1988.
28
ROBERT SALVIOLO, Assistant Treasurer since July 2007.
Senior Accounting Manager – Equity Funds of the Manager, and an officer of 63 investment companies (comprised of 147 portfolios) managed by the Manager. He is 51 years old and has been an employee of the Manager since June 1989.
ROBERT SVAGNA, Assistant Treasurer since December 2002.
Senior Accounting Manager – Fixed Income and Equity Funds of the Manager, and an officer of 63 investment companies (comprised of 147 portfolios) managed by the Manager. He is 51 years old and has been an employee of the Manager since November 1990.
JOSEPH W. CONNOLLY, Chief Compliance Officer since October 2004.
Chief Compliance Officer of the Manager, the Dreyfus Family of Funds and BNY Mellon Funds Trust (63 investment companies, comprised of 147 portfolios). He is 61 years old and has served in various capacities with the Manager since 1980, including manager of the firm’s Fund Accounting Department from 1997 through October 2001.
CARIDAD M. CAROSELLA, Anti-Money Laundering Compliance Officer since January 2016.
Anti-Money Laundering Compliance Officer of the Dreyfus Family of Funds and BNY Mellon Funds Trust since January 2016; from May 2015 to December 2015, Interim Anti-Money Laundering Compliance Officer of the Dreyfus Family of Funds and BNY Mellon Funds Trust and the Distributor; from January 2012 to May 2015, AML Surveillance Officer of the Distributor and from 2007 to December 2011, Financial Processing Manager of the Distributor. She is an officer of 57 investment companies (comprised of 141 portfolios) managed by the Manager. She is 50 years old and has been an employee of the Distributor since 1997.
29
Dreyfus Variable Investment Fund, Appreciation Portfolio
200 Park Avenue
New York, NY 10166
Manager
The Dreyfus Corporation
200 Park Avenue
New York, NY 10166
Sub-Investment Adviser
Fayez Sarofim & Co.
Two Houston Center
Suite 2907
Houston, TX 77010
Custodian
The Bank of New York Mellon
240 Greenwich Street
New York, NY 10286
Transfer Agent &
Dividend Disbursing Agent
Dreyfus Transfer, Inc.
200 Park Avenue
New York, NY 10166
Distributor
MBSC Securities Corporation
200 Park Avenue
New York, NY 10166
Telephone 1-800-258-4260 or 1-800-258-4261
Mail The Dreyfus Family of Funds, 144 Glenn Curtiss Boulevard, Uniondale, NY 11556-0144 Attn: Institutional Services Department
E-mailSend your request toinfo@dreyfus.com
InternetInformation can be viewed online or downloaded atwww.dreyfus.com
The fund files its complete schedule of portfolio holdings with the Securities and Exchange Commission (“SEC”) for the first and third quarters of each fiscal year on Form N-Q. The fund’s Forms N-Q are available on the SEC’s website at http://www.sec.gov and may be reviewed and copied at the SEC’s Public Reference Room in Washington, D.C. Information on the operation of the Public Reference Room may be obtained by calling 1-800-SEC-0330.
A description of the policies and procedures that the fund uses to determine how to vote proxies relating to portfolio securities, and information regarding how the fund voted these proxies for the most recent 12-month period ended June 30 is available at http://www.dreyfus.com and on the SEC’s website at http://www.sec.gov. The description of the policies and procedures is also available without charge, upon request, by calling 1-800-DREYFUS.
| | |
© 2019 MBSC Securities Corporation
0112AR1218 | 
|
Dreyfus Variable Investment Fund, Government Money Market Portfolio
| | | |

| | ANNUAL REPORT December 31, 2018 |
| |
The views expressed in this report reflect those of the portfolio manager(s) only through the end of the period covered and do not necessarily represent the views of Dreyfus or any other person in the Dreyfus organization. Any such views are subject to change at any time based upon market or other conditions and Dreyfus disclaims any responsibility to update such views. These views may not be relied on as investment advice and, because investment decisions for a Dreyfus fund are based on numerous factors, may not be relied on as an indication of trading intent on behalf of any Dreyfus fund. |
| |
Not FDIC-Insured • Not Bank-Guaranteed • May Lose Value |
Contents
T H E F U N D
F O R M O R E I N F O R M AT I O N
Back Cover
| | | | |
| |
Dreyfus Variable Investment Fund, Government Money Market Portfolio
| | The Fund |
A LETTER FROM THE PRESIDENT OF DREYFUS
Dear Shareholder:
We are pleased to present this annual report for Dreyfus Variable Investment Fund, Government Money Market Portfolio, covering the 12-month period from January 1, 2018 through December 31, 2018. For information about how the fund performed during the reporting period, as well as general market perspectives, we provide a Discussion of Fund Performance on the pages that follow.
The reporting period began with major global economies achieving above-trend growth. In the United States, a robust economy and strong labor market encouraged the Federal Reserve to continue moving away from its accommodative monetary policy while other major central banks began to consider monetary tightening. Both U.S. and non-U.S. equity markets remained on an uptrend. Interest rates rose across the yield curve, putting pressure on bond prices.
A few months into the reporting period, global growth trends began to diverge and market volatility returned. While the U.S. economy continued to grow at a healthy rate, other developed markets began to weaken. However, robust growth and strong corporate earnings continued to support U.S. stock returns while other developed markets declined throughout the summer. In the fall, a broad sell-off occurred, partially offsetting earlier U.S. gains. Emerging markets remained under pressure as weakness in their currencies relative to the U.S. dollar added to investors’ uneasiness. Global equities continued their general decline through the end of the period.
Fixed income markets struggled during the first half of the period as interest rates rose and favorable U.S. equity markets fed investor risk appetites. However, in autumn volatility crept in, the yield curve began a flattening trend that continued through the end of December. As long-term debt yields fell, prices rose for many bonds, leading to moderately positive returns for several fixed income market sectors.
Despite continuing political variables, U.S. inflationary pressures and flagging growth rates, we are optimistic that the U.S. economy will remain strong in the near term. However, we remain attentive to signs that point to potential changes on the horizon. As always, we encourage you to discuss the risks and opportunities in today’s investment environment with your financial advisor.
Thank you for your continued confidence and support.
Sincerely,

Renee Laroche-Morris
President
The Dreyfus Corporation
January 15, 2019
2
DISCUSSION OF FUND PERFORMANCE(Unaudited)
For the period from January 1, 2018 through December 31, 2018, as provided by Bernard W. Kiernan, Jr., Senior Portfolio Manager
Market and Fund Performance Overview
For the 12-month period ended December 31, 2018, Dreyfus Variable Investment Fund, Government Money Market Portfolio produced a yield of 1.27%. Taking into account the effects of compounding, the fund provided an effective yield of 1.28% for the same period.1
Yields of money market instruments climbed over the reporting period in response to sustained economic growth, more stimulative fiscal policies, and four increases in short-term interest rates by the Federal Reserve Board (the “Fed”).
The Fund’s Investment Approach
The fund seeks as high a level of current income as is consistent with the preservation of capital and the maintenance of liquidity. The fund pursues its investment objective by investing only in government securities (i.e., securities issued or guaranteed as to principal and interest by the U.S. government or its agencies or instrumentalities, including those with floating or variable rates of interest), repurchase agreements collateralized solely by government securities and/or cash, and cash. The fund is a money market fund subject to the maturity, quality, liquidity and diversification requirements of Rule 2a-7 and seeks to maintain a stable share price of $1.00. The fund has been designated as a “government money market fund” as that term is defined in Rule 2a-7, and as such is required to invest at least 99.5% of its total assets in securities issued or guaranteed as to principal and interest by the U.S. government or its agencies or instrumentalities, repurchase agreements collateralized solely by government securities and/or cash, and cash. The fund normally invests at least 80% of its net assets in government securities and repurchase agreements collateralized solely by government securities (i.e., under normal circumstances, the fund will not invest more than 20% of its net assets in cash and/or repurchase agreements collateralized by cash).
Short-Term Interest Rates Rise
The months before the start of the reporting period saw a continued economic expansion, robust labor market gains, and rising short-term interest rates as the Fed continued to move away from its aggressively accommodative monetary policy of the past decade. The Fed implemented another interest-rate hike in mid-December 2017, raising the federal funds rate to between 1.25% and 1.50%. Meanwhile, investors responded positively to the enactment of federal tax-reform legislation that sharply reduced corporate tax rates.
In January 2018, 171,000 new jobs were added, and the unemployment rate stayed at 4.1%. Corporate earnings growth continued to exceed expectations, and hiring activity proved brisk. Hourly wages began to rise at their strongest pace since the 2008 recession, suggesting that inflation might begin to accelerate.
February saw renewed volatility in the financial markets, as inflation fears mounted in response to the addition of 330,000 jobs and an unemployment rate that stayed steady at 4.1%. Manufacturing activity continued to expand, and consumer confidence remained high.
3
DISCUSSION OF FUND PERFORMANCE(Unaudited) (continued)
Heightened volatility in the financial markets persisted in March, when investors reacted nervously to political rhetoric regarding potential new trade tariffs. Job creation trailed off, compared with the previous month, with 182,000 new jobs, but the manufacturing industry posted its strongest job gains in more than three years. The unemployment rate fell to 4.0%, but consumer confidence fell slightly due to worries about potential trade disputes. The U.S. economy grew at a 2.2% annualized rate over the first quarter of 2018.
In April, the unemployment rate slid to 3.9%, and 196,000 new jobs were added to the workforce. Retail sales grew by 0.3% amid persistently strong consumer confidence, which showed no sign of deterioration despite sharply rising fuel prices. In addition, long-term interest rates continued to climb, as the yield on 10-year U.S. Treasury bonds topped 3% for the first time since 2014.
May saw a further decrease in the unemployment rate to 3.8%, its lowest level since December 1969, as 270,000 new jobs were added during the month. Meanwhile, retail sales grew at a faster-than-expected 1.2% rate in May. The Fed’s preferred measure of inflation, the “core” Personal Consumption Expenditures (PCE) Price Index, which excludes food and energy prices, rose to 2.0%, matching the Fed’s target, while average hourly wages increased 2.8% above year-ago levels, suggesting that inflation could accelerate.
In June, the unemployment rate ticked up to 4.0%, and 208,000 new jobs were added. The Fed raised short-term interest rates for the second time in 2018, sending the federal funds rate to between 1.75% and 2.00%. The core PCE Price Index remained at 2.0%.
The economy generated 178,000 new jobs in July, and the unemployment rate declined to 3.9%. Activity in the manufacturing sector rebounded, and retail sales beat expectations. In August, 282,000 jobs were added, while the unemployment rate slid to 3.8%. Housing starts were disappointing, possibly due to capacity constraints, while the core PCE Price Index slipped to 1.9%.
In September, the labor market produced 108,000 new jobs, and the unemployment rate fell to 3.7%. The U.S. economy expanded at a 3.4% annualized rate in the third quarter of 2018, according to the final estimate, down from 4.2% in the second quarter. Consumer spending remained strong, while business investment declined modestly. The Fed continued on its path of monetary tightening, raising the federal funds target rate for a third time in 2018, bringing it to between 2.00% and 2.25%. The core PCE Price Index ticked up to 2.0%.
The unemployment rate ticked up to 3.8% in October, and 277,000 jobs were created. Industrial production improved only slightly, as utility-related output was hindered by Hurricane Michael. The core PCE Price Index slipped to 1.8%. In November, job growth came in lower than expected, at 196,000, but the unemployment rate held steady at 3.7%, and average hourly wages rose 3.1%.
In December, job creation surpassed expectations, hitting an estimated 222,000, and the unemployment rate ticked up to 3.9%. Year over year, wages rose 3.2%.
Additional Rate Hikes Expected
The Fed continued to moderate its accommodative monetary policy by raising the overnight federal funds rate to between 2.25% and 2.50%. The Fed also continued to unwind its
4
balance sheet through the sale of U.S. government securities, and more short-term interest-rate hikes are anticipated in 2019.
In the rising interest-rate environment, we have maintained the fund’s weighted-average maturity in a range that is shorter than industry averages. This strategy is intended to capture higher yields as they become available. As always, we have retained our longstanding focus on quality and liquidity.
January 15, 2019
1 Effective yield is based upon dividends declared daily and reinvested monthly. Past performance is no guarantee of future results. Yields fluctuate. The fund’s performance does not reflect the deduction of additional charges and expenses imposed in connection with investing in variable insurance contracts, which will reduce returns.
You could lose money by investing in a money market fund. Although the fund seeks to preserve the value of your investment at $1.00 per share, it cannot guarantee it will do so. An investment in the fund is not insured or guaranteed by the Federal Deposit Insurance Corporation or any other government agency. The fund’s sponsor has no legal obligation to provide financial support to the fund, and you should not expect that the sponsor will provide financial support to the fund at any time.
Although the fund’s board has no current intention to impose a fee upon the sale of shares or temporarily suspend redemptions if the fund’s liquidity falls below certain levels, the board reserves the ability to do so after providing at least 60 days’ prior written notice to shareholders.
The fund is only available as a funding vehicle under variable life insurance policies or variable annuity contracts issued by insurance companies. Individuals may not purchase shares of the fund directly. A variable annuity is an insurance contract issued by an insurance company that enables investors to accumulate assets on a tax-deferred basis for retirement or other long-term goals. The investment objective and policies of Dreyfus Variable Investment Fund, Government Money Market Portfolio, made available through insurance products, may be similar to those of other funds managed or advised by Dreyfus. However, the investment results of the fund may be higher or lower than, and may not be comparable to, those of any other Dreyfus fund.
Personal Consumption Expenditures (PCE) Price Index reflects changes in the prices of goods and services purchased by consumers in the United States. It is known for capturing inflation (or deflation) across a wide range of consumer expenses and reflecting changes in consumer behavior.
5
UNDERSTANDING YOUR FUND’S EXPENSES(Unaudited)
As a mutual fund investor, you pay ongoing expenses, such as management fees and other expenses. Using the information below, you can estimate how these expenses affect your investment and compare them with the expenses of other funds. You also may pay one-time transaction expenses, including sales charges (loads), redemption fees and expenses associated with variable annuity or insurance contracts, which are not shown in this section and would have resulted in higher total expenses. For more information, see your fund’s prospectus or talk to your financial adviser.
Review your fund’s expenses
The table below shows the expenses you would have paid on a $1,000 investment in Dreyfus Variable Investment Fund, Government Money Market Portfolio from July 1, 2018 to December 31, 2018. It also shows how much a $1,000 investment would be worth at the close of the period, assuming actual returns and expenses.
| | | | | | | | | | |
Expenses and Value of a $1,000 Investment |
assuming actual returns for the six months ended December 31, 2018 | | |
| | | | | | | | | |
Expenses paid per $1,000† | | | | $2.94 | | | |
Ending value (after expenses) | | | | $1,007.70 | | | |
COMPARING YOUR FUND’S EXPENSES
WITH THOSE OF OTHER FUNDS(Unaudited)
Using the SEC’s method to compare expenses
The Securities and Exchange Commission (“SEC”) has established guidelines to help investors assess fund expenses. Per these guidelines, the table below shows your fund’s expenses based on a $1,000 investment, assuming a hypothetical 5% annualized return. You can use this information to compare the ongoing expenses (but not transaction expenses or total cost) of investing in the fund with those of other funds. All mutual fund shareholder reports will provide this information to help you make this comparison. Please note that you cannot use this information to estimate your actual ending account balance and expenses paid during the period.
| | | | | | | | | | |
Expenses and Value of a $1,000 Investment |
assuming a hypothetical 5% annualized return for the six months ended December 31, 2018 |
| | | | | | | | | |
Expenses paid per $1,000† | | | | $2.96 | | | |
Ending value (after expenses) | | | | $1,022.28 | | | |
† Expenses are equal to the fund’s annualized expense ratio of .58%, multiplied by the average account value over the period, multiplied by 184/365 (to reflect the one-half year period).
6
STATEMENT OF INVESTMENTS
December 31, 2018
| | | | | | | |
| |
Repurchase Agreements - 40.2% | Annualized Yield (%) | | Principal Amount($) | | Value($) | |
ABN AMRO Bank, Tri-Party Agreement thru BNY Mellon, dated 12/31/18, due 1/2/19 in the amount of $35,005,736 (fully collateralized by $35,604,468 U.S. Treasuries, 1.13%-3.38%, due 2/15/19-5/15/44, value $35,700,013) | 2.95 | | 35,000,000 | | 35,000,000 | |
Bank of Nova Scotia, Tri-Party Agreement thru BNY Mellon, dated 12/31/18, due 1/2/19 in the amount of $30,004,917 (fully collateralized by $30,492,314 U.S. Treasuries (including strips), 0%-7.88%, due 1/2/19-2/15/47, value $30,600,000) | 2.95 | | 30,000,000 | | 30,000,000 | |
Credit Agricole CIB, Tri-Party Agreement thru BNY Mellon, dated 12/31/18, due 1/2/19 in the amount of $8,001,311 (fully collateralized by $8,977,709 U.S. Treasuries (including strips), 0%-8.13%, due 1/15/19-2/15/47, value $8,160,000) | 2.95 | | 8,000,000 | | 8,000,000 | |
Total Repurchase Agreements (cost $73,000,000) | | | | | 73,000,000 | |
U.S. Treasury Floating Rate Notes - 3.8% | | | | | | |
1/8/19, 3 Month U.S. T-BILL + .05%
(cost $6,999,849) | 2.47 | | 7,000,000 | a | 6,999,849 | |
U.S. Government Agencies - 49.5% | | | | | | |
1/15/19 | 2.28 | | 20,000,000 | b | 19,982,500 | |
1/23/19, 1 Month LIBOR - .04% | 2.47 | | 5,000,000 | a | 5,000,017 | |
1/24/19, 1 Month LIBOR - .11% | 2.40 | | 10,000,000 | a | 9,999,869 | |
1/30/19 | 2.29 | | 20,000,000 | b | 19,963,750 | |
4/29/19 | 2.51 | | 10,000,000 | b | 9,919,531 | |
1/4/19, 1 Month LIBOR - .10% | 2.25 | | 5,000,000 | a | 5,000,000 | |
3/25/19, 3 Month LIBOR - .21% | 2.61 | | 10,000,000 | a | 10,000,000 | |
1/6/19, 1 Month LIBOR - .09% | 2.29 | | 10,000,000 | a | 9,996,836 | |
Total U.S. Government Agencies (cost $89,862,503) | | | | | 89,862,503 | |
7
STATEMENT OF INVESTMENTS (continued)
| | | | | | | |
| |
U.S. Treasury Bills - 5.5% | Annualized Yield (%) | | Principal Amount($) | | Value($) | |
2/28/19
(cost $9,964,394) | 2.25 | | 10,000,000 | b | 9,964,394 | |
Total Investments(cost $179,826,746) | | 99.0% | | 179,826,746 | |
Cash and Receivables (Net) | | 1.0% | | 1,769,301 | |
Net Assets | | 100.0% | | 181,596,047 | |
a Variable rate security—rate shown is the interest rate in effect at period end. Date shown represents the earlier of the next interest reset date or ultimate maturity date.
b Security is a discount security. Income is recognized through the accretion of discount.
| | |
Portfolio Summary (Unaudited)† | Value (%) |
U.S. Government Securities | 58.8 |
Repurchase Agreements | 40.2 |
| | 99.0 |
† Based on net assets.
See notes to financial statements.
8
STATEMENT OF ASSETS AND LIABILITIES
December 31, 2018
| | | | | | | | | |
| | | | | | |
| | | Cost | | Value | |
Assets ($): | | | | |
Investments in securities—See Statement of Investments
(including repurchase agreements of $73,000,000)
—Note 1(b) | 179,826,746 | | 179,826,746 | |
Receivable for shares of Beneficial Interest subscribed | | 3,307,218 | |
Interest receivable | | 75,993 | |
Prepaid expenses | | | | | 504 | |
| | | | | 183,210,461 | |
Liabilities ($): | | | | |
Due to The Dreyfus Corporation and affiliates—Note 2(b) | | | | 87,877 | |
Cash overdraft due to Custodian | | | | | 15,182 | |
Payable for shares of Beneficial Interest redeemed | | 1,460,028 | |
Trustees fees and expenses payable | | 856 | |
Accrued expenses | | | | | 50,471 | |
| | | | | 1,614,414 | |
Net Assets ($) | | | 181,596,047 | |
Composition of Net Assets ($): | | | | |
Paid-in capital | | | | | 181,597,645 | |
Total distributable earnings (loss) | | | | | (1,598) | |
Net Assets ($) | | | 181,596,047 | |
Shares Outstanding | | |
(unlimited number of $.001 par value shares of Beneficial Interest authorized) | 181,566,371 | |
Net Asset Value Per Share ($) | | 1.00 | |
| | | | | |
See notes to financial statements. | | | | |
9
STATEMENT OF OPERATIONS
Year Ended December 31, 2018
| | | | | | | |
| | | | | | |
| | | | | | |
Investment Income ($): | | | | |
Interest Income | | | 3,217,945 | |
Expenses: | | | | |
Investment advisory fee—Note 2(a) | | | 874,121 | |
Professional fees | | | 88,394 | |
Trustees’ fees and expenses—Note 2(c) | | | 13,171 | |
Custodian fees—Note 2(b) | | | 9,505 | |
Prospectus and shareholders’ reports | | | 8,809 | |
Shareholder servicing costs—Note 2(b) | | | 369 | |
Miscellaneous | | | 18,712 | |
Total Expenses | | | 1,013,081 | |
Less—reduction in fees due to earnings credits—Note 2(b) | | | (5,180) | |
Net Expenses | | | 1,007,901 | |
Investment Income—Net | | | 2,210,044 | |
Net Realized Gain (Loss) on Investments—Note 1(b) ($) | (1,598) | |
Net Increase in Net Assets Resulting from Operations | | 2,208,446 | |
| | | | | | | |
See notes to financial statements. | | | | | |
10
STATEMENT OF CHANGES IN NET ASSETS
| | | | | | | | | | |
| | | | Year Ended December 31, |
| | | | 2018 | | 2017a | |
Operations ($): | | | | | | | | |
Investment income—net | | | 2,210,044 | | | | 607,701 | |
Net realized gain (loss) on investments | | (1,598) | | | | - | |
Net Increase (Decrease) in Net Assets
Resulting from Operations | 2,208,446 | | | | 607,701 | |
Distributions ($): | |
Distributions to shareholders | | | (2,217,870) | | | | (600,690) | |
Beneficial Interest Transactions ($1.00 per share): | |
Net proceeds from shares sold | | | 606,814,742 | | | | 502,509,413 | |
Distributions reinvested | | | 2,217,870 | | | | 600,690 | |
Cost of shares redeemed | | | (623,774,319) | | | | (455,428,616) | |
Increase (Decrease) in Net Assets
from Beneficial Interest Transactions | (14,741,707) | | | | 47,681,487 | |
Total Increase (Decrease) in Net Assets | (14,751,131) | | | | 47,688,498 | |
Net Assets ($): | |
Beginning of Period | | | 196,347,178 | | | | 148,658,680 | |
End of Period | | | 181,596,047 | | | | 196,347,178 | |
| | | | | | | | | | |
aDistributions to shareholders include only distributions from net investment income. Undistributed investment income—net was $7,826 in 2017 and is no longer presented as a result of the adoption of SEC’s Disclosure Update and Simplification Rule. | |
See notes to financial statements. | | | | | | | | |
11
FINANCIAL HIGHLIGHTS
The following table describes the performance for the fiscal periods indicated. Total return shows how much your investment in the fund would have increased (or decreased) during each period, assuming you had reinvested all dividends and distributions. The fund’s total returns do not reflect expenses associated with variable annuity or insurance contracts. These figures have been derived from the fund’s financial statements.
| | | | | | | | | | | |
| | | | | |
| | |
| | Year Ended December 31, |
| | 2018 | 2017 | 2016 | 2015 | 2014 |
Per Share Data ($): | | | | | | |
Net asset value, beginning of period | | 1.00 | 1.00 | 1.00 | 1.00 | 1.00 |
Investment Operations: | | | | | | |
Investment income—net | | .013 | .003 | .000a | .000a | .000a |
Distributions: | | | | | | |
Dividends from
investment income—net | | (.013) | (.003) | (.000)a | (.000)a | (.000)a |
Net asset value, end of period | | 1.00 | 1.00 | 1.00 | 1.00 | 1.00 |
Total Return (%) | | 1.28 | .34 | .02 | .00b | .00b |
Ratios/Supplemental Data (%): | | | | | | |
Ratio of total expenses
to average net assets | | .58 | .58 | .62 | .62 | .59 |
Ratio of net expenses
to average net assets | | .58 | .57 | .39 | .23 | .14 |
Ratio of net investment income
to average net assets | | 1.26 | .37 | .01 | .00c | .00c |
Net Assets, end of period ($ x 1,000) | | 181,596 | 196,347 | 148,659 | 152,576 | 125,621 |
a Amount represents less than $.001 per share.
b Amount represents less than .01%.
See notes to financial statements.
12
NOTES TO FINANCIAL STATEMENTS
NOTE 1—Significant Accounting Policies:
Government Money Market Portfolio (the “fund”) is a separate diversified series of Dreyfus Variable Investment Fund (the “Company”), which is registered under the Investment Company Act of 1940, as amended (the “Act”), as an open-end management investment company and operates as a series company currently offering seven series, including the fund. The fund is only offered to separate accounts established by insurance companies to fund variable annuity contracts and variable life insurance policies. The fund’s investment objective is to seek as high a level of current income as is consistent with the preservaton of capital and the maintenance of liquidity. The Dreyfus Corporation (the “Manager” or “Dreyfus”), a wholly-owned subsidiary of The Bank of New York Mellon Corporation (“BNY Mellon”), serves as the fund’s investment adviser. MBSC Securities Corporation (the “Distributor”), a wholly-owned subsidiary of Dreyfus, is the distributor of the fund’s shares, which are sold without a sales charge.
The fund operates as a “government money market fund” as that term is defined in Rule 2a-7 under the Act. It is the fund’s policy to maintain a constant net asset value (“NAV”) per share of $1.00 and the fund has adopted certain investment, portfolio valuation and dividend and distribution policies to enable it to do so. There is no assurance, however, that the fund will be able to maintain a constant NAV per share of $1.00.
The Company accounts separately for the assets, liabilities and operations of each series. Expenses directly attributable to each series are charged to that series’ operations; expenses which are applicable to all series are allocated among them on a pro rata basis.
The Financial Accounting Standards Board (“FASB”) Accounting Standards Codification is the exclusive reference of authoritative U.S. generally accepted accounting principles (“GAAP”) recognized by the FASB to be applied by nongovernmental entities. Rules and interpretive releases of the Securities and Exchange Commission (“SEC”) under authority of federal laws are also sources of authoritative GAAP for SEC registrants. The fund’s financial statements are prepared in accordance with GAAP, which may require the use of management estimates and assumptions. Actual results could differ from those estimates.
The Companyenters into contracts that contain a variety of indemnifications. The fund’s maximum exposure under these arrangements is unknown. The fund does not anticipate recognizing any loss related to these arrangements.
13
NOTES TO FINANCIAL STATEMENTS(continued)
(a) Portfolio valuation:Investments in securities are valued at amortized cost in accordance with Rule 2a-7 under the Act. If amortized cost is determined not to approximate market value, the fair value of the portfolio securities will be determined by procedures established by and under the general supervision of the Board.
The fair value of a financial instrument is the amount that would be received to sell an asset or paid to transfer a liability in an orderly transaction between market participants at the measurement date (i.e., the exit price). GAAP establishes a fair value hierarchy that prioritizes the inputs of valuation techniques used to measure fair value. This hierarchy gives the highest priority to unadjusted quoted prices in active markets for identical assets or liabilities (Level 1 measurements) and the lowest priority to unobservable inputs (Level 3 measurements).
Additionally, GAAP provides guidance on determining whether the volume and activity in a market has decreased significantly and whether such a decrease in activity results in transactions that are not orderly. GAAP requires enhanced disclosures around valuation inputs and techniques used during annual and interim periods.
Various inputs are used in determining the value of the fund’s investments relating to fair value measurements. These inputs are summarized in the three broad levels listed below:
Level 1—unadjusted quoted prices in active markets for identical investments.
Level 2—other significant observable inputs (including quoted prices for similar investments, interest rates, prepayment speeds, credit risk, etc.).
Level 3—significant unobservable inputs (including the fund’s own assumptions in determining the fair value of investments).
The inputs or methodology used for valuing securities are not necessarily an indication of the risk associated with investing in those securities. For example, money market securities are valued using amortized cost, in accordance with rules under the Act. Generally, amortized cost approximates the current fair value of a security, but since the value is not obtained from a quoted price in an active market, such securities are reflected within Level 2 of the fair value hierarchy.
The following is a summary of the inputs used as of December 31, 2018in valuing the fund’s investments:
14
| | |
Valuation Inputs | Short-Term Investments ($)† |
Level 1 - Unadjusted Quoted Prices | — |
Level 2 - Other Significant Observable Inputs | 179,826,746 |
Level 3 - Significant Unobservable Inputs | – |
Total | 179,826,746 |
† See Statement of Investments for additional detailed categorizations.
At December 31, 2018, there were no transfers between levels of the fair value hierarchy. It is the fund’s policy to recognize transfers between levels at the end of the reporting period.
(b) Securities transactions and investment income:Securities transactions are recorded on a trade date basis. Interest income, adjusted for accretion of discount and amortization of premium on investments, is earned from settlement date and is recognized on the accrual basis. Realized gains and losses from securities transactions are recorded on the identified cost basis.
The fund may enter into repurchase agreements with financial institutions, deemed to be creditworthy by Dreyfus, subject to the seller’s agreement to repurchase and the fund’s agreement to resell such securities at a mutually agreed upon price. Pursuant to the terms of the repurchase agreement, such securities must have an aggregate market value greater than or equal to the terms of the repurchase price plus accrued interest at all times. If the value of the underlying securities falls below the value of the repurchase price plus accrued interest, the fund will require the seller to deposit additional collateral by the next business day. If the request for additional collateral is not met, or the seller defaults on its repurchase obligation, the fund maintains its right to sell the underlying securities at market value and may claim any resulting loss against the seller. The collateral is held on behalf of the fund by the tri-party administrator with respect to any tri-party agreement. The fund may also jointly enter into one or more repurchase agreements with other Dreyfus-managed funds in accordance with an exemptive order granted by the SEC pursuant to section 17(d) and Rule 17d-1 under the Act. Any joint repurchase agreements must be collateralized fully by U.S. Government securities.
(c) Dividends and distributions to shareholders:It is the policy of the fund to declare dividends daily from investment income-net. Such dividends are paid monthly. Dividends from net realized capital gains, if any, are normally declared and paid annually, but the fund may make distributions on a more frequent basis to comply with the distribution requirements of the Internal Revenue Code of 1986, as amended (the “Code”). To the extent that net realized capital gains can be offset by
15
NOTES TO FINANCIAL STATEMENTS(continued)
capital loss carryovers, it is the policy of the fund not to distribute such gains.
(d) Federal income taxes: It is the policy of the fund to continue to qualify as a regulated investment company, if such qualification is in the best interests of its shareholders, by complying with the applicable provisions of the Code, and to make distributions of taxable income and net realized capital gain sufficient to relieve it from substantially all federal income and excise taxes.
As of and during the period ended December 31, 2018, the fund did not have any liabilities for any uncertain tax positions. The fund recognizes interest and penalties, if any, related to uncertain tax positions as income tax expense in the Statement of Operations. During the period ended December 31, 2018, the fund did not incur any interest or penalties.
Each tax year in the four-year period ended December 31, 2018 remains subject to examination by the Internal Revenue Service and state taxing authorities.
At December 31, 2018, the components of accumulated earnings on a tax basis were substantially the same as for financial reporting purposes. The fund is permitted to carry forward capital losses for an unlimited period. Furthermore, capital loss carryovers retain their character as either short-term or long-term capital losses.
The accumulated capital loss carryover is available for federal income tax purposes to be applied against future netrealized capital gains, if any, realized subsequent to December 31, 2018. The fund has $1,598 of short-term capital losses which can be carried forward for an unlimited period.
The tax character of distributions paid to shareholders during the fiscal periods ended December 31, 2018 and December 31, 2017 were all ordinary income.
At December 31, 2018, the cost of investments for federal income tax purposes was substantially the same as the cost for financial reporting purposes (see the Statement of Investments).
(e) New Accounting Pronouncements: In March 2017, the FASB issued Accounting Standards Update 2017-08, Receivables—Nonrefundable Fees and Other Costs (Subtopic 310-20): Premium Amortization On Purchased Callable Debt Securities (“ASU 2017-08”). The update shortens the amortization period for the premium on certain purchased callable debt securities to the earliest call date. ASU 2017-08 will be effective for annual periods beginning after December 15, 2018.
16
Also in August 2018, the FASB issued Accounting Standards Update 2018-13, Fair Value Measurement (Topic 820): Disclosure Framework—Changes to the Disclosure Requirements for Fair Value Measurement (“ASU 2018-13”). The update provides guidance that eliminates, adds and modifies certain disclosure requirements for fair value measurements. ASU 2018-13 will be effective for annual periods beginning after December 15, 2019. Management is currently assessing the potential impact of these changes to future financial statements.
NOTE 2―Investment Adivsory Fee and Other Transactions with Affiliates:
(a)Pursuant to an investment advisory agreement with Dreyfus, the investment advisory fee is computed at the annual rate of .50% of the value of the fund’s average daily net assets and is payable monthly.
(b)The fund has arrangements with the transfer agent and the custodian whereby the fund may receive earnings credits when positive cash balances are maintained, which are used to offset transfer agency and custody fees. For financial reporting purposes, the fund includes net earnings credits, if any, as an expense offset in the Statement of Operations.
The fund compensates Dreyfus Transfer, Inc., a wholly-owned subsidiary of Dreyfus, under a transfer agency agreement for providing transfer agency and cash management services for the fund. The majority of transfer agency fees are comprised of amounts paid on a per account basis, while cash management fees are related to fund subscriptions and redemptions. During the period ended December 31, 2018, the fund was charged $369 for transfer agency services. These fees are included in Shareholder servicing costs in the Statement of Operations.
The fund compensates The Bank of New York Mellon, a subsidiary of BNY Mellon and an affiliate of Dreyfus, under a custody agreement for providing custodial services for the fund. These fees are determined based on net assets, geographic region and transaction activity. During the period ended December 31, 2018, the fund was charged $9,505 pursuant to the custody agreement. These fees were partially offset by earnings credits of $5,180.
During the period ended December 31, 2018, the fund was charged $12,774 for services performed by the Chief Compliance Officer and his staff. These fees are included in Miscellaneous in the Statement of Operations.
The components of “Due to The Dreyfus Corporation and affiliates” in the Statement of Assets and Liabilities consist of: investment advisory fees
17
NOTES TO FINANCIAL STATEMENTS(continued)
$77,148, custodian fees $4,331, Chief Compliance Officer fees $6,289 and transfer agency fees $109.
(c) Each Board member also serves as a Board member of other funds within the Dreyfus complex. Annual retainer fees and attendance fees are allocated to each fund based on net assets.
18
REPORT OF INDEPENDENT REGISTERED PUBLIC ACCOUNTING FIRM
To the Shareholders and the Board of Trustees of Government Money Market Portfolio
Opinion on the Financial Statements
We have audited the accompanying statement of assets and liabilities of Government Money Market Portfolio (the “Fund”) (one of the funds constituting Dreyfus Variable Investment Fund), including the statement of investments, as of December 31, 2018, and the related statement of operations for the year then ended, the statements of changes in net assets for each of the two years in the period then ended, the financial highlights for each of the five years in the period then ended and the related notes (collectively referred to as the “financial statements”). In our opinion, the financial statements present fairly, in all material respects, the financial position of the Fund (one of the funds constituting Dreyfus Variable Investment Fund) at December 31, 2018, the results of its operations for the year then ended, the changes in its net assets for each of the two years in the period then ended and its financial highlights for each of the five years in the period then ended, in conformity with U.S. generally accepted accounting principles.
Basis for Opinion
These financial statements are the responsibility of the Fund’s management. Our responsibility is to express an opinion on the Fund’s financial statements based on our audits. We are a public accounting firm registered with the Public Company Accounting Oversight Board (United States) (“PCAOB”) and are required to be independent with respect to the Fund in accordance with the U.S. federal securities laws and the applicable rules and regulations of the Securities and Exchange Commission and the PCAOB.
We conducted our audits in accordance with the standards of the PCAOB. Those standards require that we plan and perform the audit to obtain reasonable assurance about whether the financial statements are free of material misstatement, whether due to error or fraud. The Fund is not required to have, nor were we engaged to perform, an audit of the Fund’s internal control over financial reporting. As part of our audits, we are required to obtain an understanding of internal control over financial reporting, but not for the purpose of expressing an opinion on the effectiveness of the Fund’s internal control over financial reporting. Accordingly, we express no such opinion.
Our audits included performing procedures to assess the risks of material misstatement of the financial statements, whether due to error or fraud, and performing procedures that respond to those risks. Such procedures included examining, on a test basis, evidence regarding the amounts and disclosures in the financial statements. Our procedures included confirmation of securities owned as of December 31, 2018, by correspondence with the custodian and others or by other appropriate auditing procedures where replies from others were not received. Our audits also included evaluating the accounting principles used and significant estimates made by management, as well as evaluating the overall presentation of the financial statements. We believe that our audits provide a reasonable basis for our opinion.

We have served as the auditor of one or more Dreyfus investment companies since at least 1957, but we are unable to determine the specific year.
New York, New York
February 11, 2019
19
BOARD MEMBERS INFORMATION(Unaudited)
INDEPENDENT BOARD MEMBERS
Joseph S. DiMartino (75)
Chairman of the Board (1995)
Principal Occupation During Past 5 Years:
· Corporate Director and Trustee (1995-present)
Other Public Company Board Memberships During Past 5 Years:
· CBIZ (formerly, Century Business Services, Inc.), a provider of outsourcing functions for small and medium size companies, Director (1997-present)
No. of Portfolios for which Board Member Serves:122
———————
Peggy C. Davis (75)
Board Member (2006)
Principal Occupation During Past 5 Years:
· Shad Professor of Law, New York University School of Law (1983-present)
No. of Portfolios for which Board Member Serves: 45
———————
David P. Feldman (79)
Board Member (1994)
Principal Occupation During Past 5 Years:
· Corporate Director and Trustee (1985-present)
Other Public Company Board Memberships During Past 5 Years:
· BBH Mutual Funds Group (5 registered mutual funds), Director (1992-2014)
No. of Portfolios for which Board Member Serves:31
———————
Joan Gulley (71)
Board Member (2017)
Principal Occupation During Past 5 Years:
· PNC Financial Services Group, Inc.(1993-2014), Executive Vice President and Chief Human Resources Officer and Executive Committee Member (2008-2014)
No. of Portfolios for which Board Member Serves:52
———————
20
Ehud Houminer (78)
Board Member (2006)
Principal Occupation During Past 5 Years:
· Board of Overseers at the Columbia Business School, Columbia University (1992-present)
· Trustee, Ben Gurion University
No. of Portfolios for which Board Member Serves: 52
———————
Lynn Martin (79)
Board Member (2012)
Principal Occupation During Past 5 Years:
· President of The Martin Hall Group LLC, a human resources consulting firm (2005-2012)
No. of Portfolios for which Board Member Serves:31
———————
Robin A. Melvin (55)
Board Member (2012)
Principal Occupation During Past 5 Years:
· Co-chairman, Illinois Mentoring Partnership, non-profit organization dedicated to increasing the quantity and quality of mentoring services in Illinois; (2014-present; board member since 2013)
No. of Portfolios for which Board Member Serves:99
———————
Dr. Martin Peretz (79)
Board Member (1990)
Principal Occupation During Past 5 Years:
· Editor-in-Chief Emeritus of The New Republic Magazine (2011-2012) (previously,
Editor-in-Chief, 1974-2011)
· Lecturer at Harvard University (1968-2010)
No. of Portfolios for which Board Member Serves:31
———————
Once elected all Board Members serve for an indefinite term, but achieve Emeritus status upon reaching age 80. The address of the Board Members and Officers is c/o The Dreyfus Corporation, 200 Park Avenue, New York, New York 10166. Additional information about the Board Members is available in the fund’s Statement of Additional Information which can be obtained from Dreyfus free of charge by calling this toll free number: 1-800-DREYFUS.
James F. Henry, Emeritus Board Member
Philip L. Toia, Emeritus Board Member
21
OFFICERS OF THE FUND(Unaudited)
BRADLEY J. SKAPYAK, President since January 2010.
Chief Operating Officer and a director of the Manager since June 2009, Chairman of Dreyfus Transfer, Inc., an affiliate of the Manager and the transfer agent of the funds, since May 2011 and Chief Executive Officer of MBSC Securities Corporation since August 2016. He is an officer of 62 investment companies (comprised of 122 portfolios) managed by the Manager. He is 60 years old and has been an employee of the Manager since February 1988.
BENNETT A. MACDOUGALL, Chief Legal Officer since October 2015.
Chief Legal Officer of the Manager and Associate General Counsel and Managing Director of BNY Mellon since June 2015; from June 2005 to June 2015, he served in various capacities with Deutsche Bank – Asset & Wealth Management Division, including as Director and Associate General Counsel, and Chief Legal Officer of Deutsche Investment Management Americas Inc. from June 2012 to May 2015. He is an officer of 63 investment companies (comprised of 147 portfolios) managed by the Manager. He is 47 years old and has been an employee of the Manager since June 2015.
JAMES BITETTO, Vice President since August 2005 and Secretary since February 2018.
Managing Counsel of BNY Mellon and Secretary of the Manager, and an officer of 63 investment companies (comprised of 147 portfolios) managed by the Manager. He is 52 years old and has been an employee of the Manager since December 1996.
SONALEE CROSS, Vice President and Assistant Secretary since March 2018.
Counsel of BNY Mellon since October 2016; Associate at Proskauer Rose LLP from April 2016 to September 2016; Attorney at EnTrust Capital from August 2015 to February 2016; Associate at Sidley Austin LLP from September 2013 until August 2015. She is an officer of 63 investment companies (comprised of 147 portfolios) managed by Dreyfus. She is 31 years old and has been an employee of the Manager since October 2016.
SARAH S. KELLEHER, Vice President and Assistant Secretary since April 2014.
Managing Counsel of BNY Mellon since December 2017, from March 2013 to December 2017, Senior Counsel of BNY Mellon. She is an officer of 63 investment companies (comprised of 147 portfolios) managed by the Manager. She is 43 years old and has been an employee of the Manager since March 2013.
JEFF PRUSNOFSKY, Vice President and Assistant Secretary since August 2005.
Senior Managing Counsel of BNY Mellon, and an officer of 63 investment companies (comprised of 147 portfolios) managed by the Manager. He is 53 years old and has been an employee of the Manager since October 1990.
NATALYA ZELENSKY, Vice President and Assistant Secretary since March 2017.
Counsel of BNY Mellon since May 2016; Attorney at Wildermuth Endowment Strategy Fund/Wildermuth Advisory, LLC from November 2015 until May 2016; Assistant General Counsel at RCS Advisory Services from July 2014 until November 2015; Associate at Sutherland, Asbill & Brennan from January 2013 until January 2014. She is an officer of 63 investment companies (comprised of 147 portfolios) managed by Dreyfus. She is 33 years old and has been an employee of the Manager since May 2016.
JAMES WINDELS, Treasurer since November 2001.
Director – Mutual Fund Accounting of the Manager, and an officer of 63 investment companies (comprised of 147 portfolios) managed by the Manager. He is 60 years old and has been an employee of the Manager since April 1985.
GAVIN C. REILLY, Assistant Treasurer since December 2005.
Tax Manager of the Investment Accounting and Support Department of the Manager, and an officer of 63 investment companies (comprised of 147 portfolios) managed by the Manager. He is 50 years old and has been an employee of the Manager since April 1991.
ROBERT S. ROBOL, Assistant Treasurer since August 2005.
Senior Accounting Manager – Dreyfus Financial Reporting of the Manager, and an officer of 63 investment companies (comprised of 147 portfolios) managed by the Manager. He is 54 years old and has been an employee of the Manager since October 1988.
22
ROBERT SALVIOLO, Assistant Treasurer since July 2007.
Senior Accounting Manager – Equity Funds of the Manager, and an officer of 63 investment companies (comprised of 147 portfolios) managed by the Manager. He is 51 years old and has been an employee of the Manager since June 1989.
ROBERT SVAGNA, Assistant Treasurer since December 2002.
Senior Accounting Manager – Fixed Income and Equity Funds of the Manager, and an officer of 63 investment companies (comprised of 147 portfolios) managed by the Manager. He is 51 years old and has been an employee of the Manager since November 1990.
JOSEPH W. CONNOLLY, Chief Compliance Officer since October 2004.
Chief Compliance Officer of the Manager, the Dreyfus Family of Funds and BNY Mellon Funds Trust (63 investment companies, comprised of 147 portfolios). He is 61 years old and has served in various capacities with the Manager since 1980, including manager of the firm’s Fund Accounting Department from 1997 through October 2001.
CARIDAD M. CAROSELLA, Anti-Money Laundering Compliance Officer since January 2016.
Anti-Money Laundering Compliance Officer of the Dreyfus Family of Funds and BNY Mellon Funds Trust since January 2016; from May 2015 to December 2015, Interim Anti-Money Laundering Compliance Officer of the Dreyfus Family of Funds and BNY Mellon Funds Trust and the Distributor; from January 2012 to May 2015, AML Surveillance Officer of the Distributor and from 2007 to December 2011, Financial Processing Manager of the Distributor. She is an officer of 57 investment companies (comprised of 141 portfolios) managed by the Manager. She is 50 years old and has been an employee of the Distributor since 1997.
23
NOTES
24
NOTES
25
Dreyfus Variable Investment Fund, Government Money Market Portfolio
200 Park Avenue
New York, NY 10166
Investment Adviser
The Dreyfus Corporation
200 Park Avenue
New York, NY 10166
Custodian
The Bank of New York Mellon
240 Greenwich Street
New York, NY 10286
Transfer Agent &
Dividend Disbursing Agent
Dreyfus Transfer, Inc.
200 Park Avenue
New York, NY 10166
Distributor
MBSC Securities Corporation
200 Park Avenue
New York, NY 10166
Telephone1-800-258-4260 or 1-800-258-4261
Mail The Dreyfus Family of Funds, 144 Glenn Curtiss Boulevard, Uniondale, NY 11556-0144
Attn: Institutional Services Department
E-mail Send your request toinfo@dreyfus.com
Internet Information can be viewed online or downloaded atwww.dreyfus.com
The fund will disclose daily, onwww.dreyfus.com, the fund’s complete schedule of holdings as of the end of the previous business day. The schedule of holdings will remain on the website until the fund files its Form N-Q or Form N-CSR for the period that includes the date of the posted holdings.
The fund files its complete schedule of portfolio holdings with the Securities and Exchange Commission (“SEC”) for the first and third quarters of each fiscal year on Form N-Q. The fund’s Forms N-Q are available on the SEC’s website atwww.sec.gov.
Information regarding how the fund voted proxies related to portfolio securities for the most recent 12-month period ended June 30 is available atwww.dreyfus.com and on the SEC’s website atwww.sec.gov and without charge, upon request, by calling 1-800-DREYFUS.
| | |
© 2019 MBSC Securities Corporation
0117AR1218 | 
|
Dreyfus Variable Investment Fund, Growth and Income Portfolio
| | | |

| | ANNUAL REPORT December 31, 2018 |
| |
The views expressed in this report reflect those of the portfolio manager(s) only through the end of the period covered and do not necessarily represent the views of Dreyfus or any other person in the Dreyfus organization. Any such views are subject to change at any time based upon market or other conditions and Dreyfus disclaims any responsibility to update such views. These views may not be relied on as investment advice and, because investment decisions for a Dreyfus fund are based on numerous factors, may not be relied on as an indication of trading intent on behalf of any Dreyfus fund. |
| |
Not FDIC-Insured • Not Bank-Guaranteed • May Lose Value |
Contents
T H E F U N D
F O R M O R E I N F O R M AT I O N
Back Cover
| | | | |
| |
Dreyfus Variable Investment Fund, Growth and Income Portfolio
| | The Fund |
A LETTER FROM THE PRESIDENT OF DREYFUS
Dear Shareholder:
We are pleased to present this annual report for Dreyfus Variable Investment Fund, Growth and Income Portfolio, covering the 12-month period from January 1, 2018 through December 31, 2018. For information about how the fund performed during the reporting period, as well as general market perspectives, we provide a Discussion of Fund Performance on the pages that follow.
The reporting period began with major global economies achieving above-trend growth. In the United States, a robust economy and strong labor market encouraged the Federal Reserve to continue moving away from its accommodative monetary policy while other major central banks began to consider monetary tightening. Both U.S. and non-U.S. equity markets remained on an uptrend. Interest rates rose across the yield curve, putting pressure on bond prices.
A few months into the reporting period, global growth trends began to diverge and market volatility returned. While the U.S. economy continued to grow at a healthy rate, other developed markets began to weaken. However, robust growth and strong corporate earnings continued to support U.S. stock returns while other developed markets declined throughout the summer. In the fall, a broad sell-off occurred, partially offsetting earlier U.S. gains. Emerging markets remained under pressure as weakness in their currencies relative to the U.S. dollar added to investors’ uneasiness. Global equities continued their general decline through the end of the period.
Fixed income markets struggled during the first half of the period as interest rates rose and favorable U.S. equity markets fed investor risk appetites. However, in autumn volatility crept in, the yield curve began a flattening trend that continued through the end of December. As long-term debt yields fell, prices rose for many bonds, leading to moderately positive returns for several fixed income market sectors.
Despite continuing political variables, U.S. inflationary pressures and flagging growth rates, we are optimistic that the U.S. economy will remain strong in the near term. However, we remain attentive to signs that point to potential changes on the horizon. As always, we encourage you to discuss the risks and opportunities in today’s investment environment with your financial advisor.
Thank you for your continued confidence and support.
Sincerely,

Renee Laroche-Morris
President
The Dreyfus Corporation
January 15, 2019
2
DISCUSSION OF FUND PERFORMANCE(Unaudited)
For the period from January 1, 2018 through December 31, 2018, as provided by John Bailer and Elizabeth Slover, Portfolio Managers
Market and Fund Performance Overview
For the 12-month period ended December 31, 2018, Dreyfus Variable Investment Fund, Growth and Income Portfolio’s Initial shares achieved a total return of -4.68%, and its Service shares achieved a total return of -4.90%.1 In comparison, the fund’s benchmark, the S&P 500® Index (the “Index”), produced a total return of -4.38% for the same period.2
U.S. stocks posted losses during the reporting period amid concerns about global economic growth, rising interest rates and international trade tensions. The fund modestly underperformed the Index largely due to overweight positions in energy and materials sectors and unfavorable security selection in the financials.
The Fund’s Investment Approach
The fund seeks long-term capital growth, current income, and growth of income consistent with reasonable investment risk. To pursue its goal, the fund normally invests primarily in stocks of domestic and foreign issuers. We seek to create a portfolio that includes a blend of growth and dividend-paying stocks, as well as other investments that provide income. We choose stocks through a disciplined investment process that combines computer-modeling techniques, “bottom-up” fundamental analysis and risk management. The fund’s investment process is designed to provide investors with investment exposure to sector weightings and risk characteristics similar to those of the Index.
In selecting securities, we seek companies that possess some or all of the following characteristics: growth of earnings potential; operating margin improvement; revenue growth prospects; business improvement; good business fundamentals; dividend yield consistent with the fund’s strategy pertaining to income; value, or how a stock is priced relative to its perceived intrinsic worth; and healthy financial profile, which measures the financial well-being of the company.
The fund may use listed equity options to seek to enhance and/or mitigate risk. The fund will engage in “covered” option transactions where the fund has in its possession, for the duration of the strategy, the underlying physical asset or cash to satisfy any obligation the fund may have with respect to the option strategy.
Stocks Sold Off Late in the Year
A growing U.S. economy and business-friendly tax reforms drove U.S. stocks sharply higher early in the reporting period, but stocks soon reversed course and volatility soared in response to rising wage pressures, which signaled a possible acceleration of inflation. Although the market recovered as these concerns eased, escalating political rhetoric regarding more protectionist U.S. trade policies soon sparked additional volatility.
3
DISCUSSION OF FUND PERFORMANCE(Unaudited) (continued)
Positive U.S. economic data continued to accrue as the reporting period progressed, and stocks gradually recouped lost ground. However, the market’s advance was constrained by concerns about U.S. tariffs on steel and aluminum imports, which were followed by retaliation from trading partners. The industrials and materials sectors were hit particularly hard by escalating trade tensions. The communication services, consumer staples and financials sectors also trailed market averages.
Late in the reporting period, growing concerns about rising interest rates, geopolitical turmoil and ongoing trade tensions with China weighed on returns. In addition, falling oil prices suggested that global economic growth could be weakening. These factors, combined with high market valuations and disappointing earnings reports, particularly among technology companies, resulted in a sharp sell-off at year-end.
Stock Selection Drove Fund Performance
The fund’s stock selection strategy proved ineffective in a few sectors such as financials and communication services. In the financials sector, the fund’s position in Ameriprise Financial, a wealth management company, came under pressure along with most of the asset management industry. In addition, Goldman Sachs Group and Morgan Stanley faced concerns about slowing GDP growth restraining earnings while AIG, an insurance company, experienced difficulty meeting earnings expectations. In communication services, the fund’s performance was hurt by Activision Blizzard, a gaming company, which has experienced intense competitive pressures, by a lack of exposure to entertainment giant Netflix. An overweight to the energy sector also weighed on our relative returns as energy prices declined.
On the other hand, selections in the information technology, health care, and industrials sectors were beneficial to the fund’s performance. Positions inFortinet, a leading cybersecurity software firm, and ServiceNow, a specialist in cloud-based software, gained from ongoing enterprise spending. In semiconductors, Qualcomm continues to benefit from its leadership position in 5G telecom system. In information technology services, Twilio advanced on strength in cloud computing and internet infrastructure. In health care, we focused on stronger-performing equipment and supply companies, such asIDEXX Laboratories and Boston Scientific, as well as health care providers such as UnitedHealth Group. Among industrials companies, the fund benefited by avoiding General Electric. Other positions that supported the fund’s performance included telecommunications giant Verizon Communications, which has improved profits and continues to be a leader in 5G.
Portfolio Positioned for Gains
Despite rising interest rates and ongoing trade tensions, we believe the economy remains strong. Consumer spending remains supportive, wage gains have been strong and a decline in energy prices should provide additional support to U.S. consumers. These factors, combined with strong earnings, should support continued stock market advances. Therefore, we have emphasized cyclical sectors, including materials, financials, information technology, communications services and energy. We have underweighted exposure to the utilities,
4
consumer staples, real estate and consumer discretionary sectors, and we are neutral on the health care sector.
January 15, 2019
1 Total return includes reinvestment of dividends and any capital gains paid. Past performance is no guarantee of future results. Share price and investment return fluctuate such that upon redemption, fund shares may be worth more or less than their original cost. The fund’s performance does not reflect the deduction of additional charges and expenses imposed in connection with investing in variable insurance contracts, which will reduce returns.
2 Source: Lipper Inc. — The S&P 500® Index is widely regarded as the best single gauge of large-cap U.S. equities. The index includes 500 leading companies and captures approximately 80% coverage of available market capitalization. Investors cannot invest directly in any index.
Please note: the position in any security highlighted with italicized typeface was sold during the reporting period.
Equities are subject generally to market, market sector, market liquidity, issuer, and investment style risks, among other factors, to varying degrees, all of which are more fully described in the fund’s prospectus.
The fund’s performance will be influenced by political, social, and economic factors affecting investments in foreign companies. Special risks associated with investments in foreign companies include exposure to currency fluctuations, less liquidity, less developed or less efficient trading markets, lack of comprehensive company information, political instability, and differing auditing and legal standards. These risks are enhanced in emerging market countries.
The use of derivatives involves risks different from, or possibly greater than, the risks associated with investing directly in the underlying assets. Derivatives can be highly volatile, illiquid, and difficult to value, and there is the risk that changes in the value of a derivative held by the fund will not correlate with the underlying instruments or the fund’s other investments.
The fund is only available as a funding vehicle under variable life insurance policies or variable annuity contracts issued by insurance companies. Individuals may not purchase shares of the fund directly. A variable annuity is an insurance contract issued by an insurance company that enables investors to accumulate assets on a tax-deferred basis for retirement or other long-term goals. The investment objective and policies of Dreyfus Variable Investment Fund, Growth and Income Portfolio made available through insurance products may be similar to those of other funds managed or advised by Dreyfus. However, the investment results of the fund may be higher or lower than, and may not be comparable to, those of any other Dreyfus fund.
5
FUND PERFORMANCE(Unaudited)
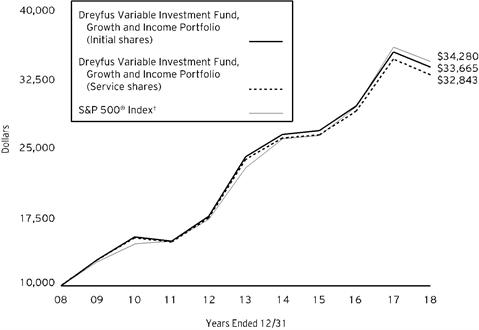
Comparison of change in value of $10,000 investment in Dreyfus Variable Investment Fund, Growth and Income Portfolio Initial shares and Service shares and the S&P 500® Index (the “Index”)
† Source: Lipper Inc.
Past performance is not predictive of future performance. The fund’s performance does not reflect the deduction of additional charges and expenses imposed in connection with investing in variable insurance contracts which will reduce returns.
The above graph compares a $10,000 investment made in Initial and Service shares of Dreyfus Variable Investment Fund, Growth and Income Portfolio on 12/31/08 to a $10,000 investment made in the Index on that date.
The fund’s performance shown in the line graph above takes into account all applicable fees and expenses. The Index is widely regarded as the best single gauge of large-cap U.S. equities. The Index includes 500 leading companies and captures approximately 80% coverage of available market capitalization. Unlike a mutual fund, the Index is not subject to charges, fees and other expenses. Investors cannot invest directly in any index. Further information relating to fund performance, including expense reimbursements, if applicable, is contained in the Financial Highlights section of the prospectus and elsewhere in this report.
| | | | |
Average Annual Total Returns as of 12/31/18 | |
| 1 Year | 5 Years | 10 Years |
Initial shares | -4.68% | 7.02% | 12.91% |
Service shares | -4.90% | 6.76% | 12.63% |
S&P 500® Index | -4.38% | 8.49% | 13.11% |
The performance data quoted represents past performance, which is no guarantee of future results. Share price and investment return fluctuate and an investor’s shares may be worth more or less than original cost upon redemption. Current performance may be lower or higher than the performance quoted. Go to Dreyfus.com for the fund’s most recent month-end returns.
The fund’s Initial shares are not subject to a Rule 12b-1 fee. The fund’s Service shares are subject to a 0.25% annual Rule 12b-1 fee. All dividends and capital gain distributions are reinvested.
The fund’s performance shown in the graph and table does not reflect the deduction of taxes that a shareholder would pay on fund distributions or the redemption of fund shares.
6
UNDERSTANDING YOUR FUND’S EXPENSES(Unaudited)
As a mutual fund investor, you pay ongoing expenses, such as management fees and other expenses. Using the information below, you can estimate how these expenses affect your investment and compare them with the expenses of other funds. You also may pay one-time transaction expenses, including sales charges (loads), redemption fees and expenses associated with variable annuity or insurance contracts, which are not shown in this section and would have resulted in higher total expenses. For more information, see your fund’s prospectus or talk to your financial adviser.
Review your fund’s expenses
The table below shows the expenses you would have paid on a $1,000 investment in Dreyfus Variable Investment Fund, Growth and Income Portfolio from July 1, 2018 to December 31, 2018. It also shows how much a $1,000 investment would be worth at the close of the period, assuming actual returns and expenses.
| | | | | | | | |
Expenses and Value of a $1,000 Investment | | |
assuming actual returns for the six months ended December 31, 2018 | |
| | | | Initial Shares | Service Shares |
Expenses paid per $1,000† | | | $4.48 | | $5.68 |
Ending value (after expenses) | | | $911.20 | | $910.40 |
COMPARING YOUR FUND’S EXPENSES
WITH THOSE OF OTHER FUNDS(Unaudited)
Using the SEC’s method to compare expenses
The Securities and Exchange Commission (“SEC”) has established guidelines to help investors assess fund expenses. Per these guidelines, the table below shows your fund’s expenses based on a $1,000 investment, assuming a hypothetical 5% annualized return. You can use this information to compare the ongoing expenses (but not transaction expenses or total cost) of investing in the fund with those of other funds. All mutual fund shareholder reports will provide this information to help you make this comparison. Please note that you cannot use this information to estimate your actual ending account balance and expenses paid during the period.
| | | | | | | | |
Expenses and Value of a $1,000 Investment | | |
assuming a hypothetical 5% annualized return for the six months ended December 31, 2018 |
| | | | Initial Shares | Service Shares |
Expenses paid per $1,000† | | | $4.74 | | $6.01 |
Ending value (after expenses) | | | $1,020.52 | | $1,019.26 |
† Expenses are equal to the fund’s annualized expense ratio of .93% for Initial shares and 1.18% for Service shares, multiplied by the average account value over the period, multiplied by 184/365 (to reflect the one-half year period).
7
STATEMENT OF INVESTMENTS
December 31, 2018
| | | | | | | | |
| |
Description | | | | Shares | | Value ($) | |
Common Stocks - 98.9% | | | | | |
Automobiles & Components - .4% | | | | | |
General Motors | | | | 9,599 | | 321,087 | |
Banks - 6.9% | | | | | |
Bank of America | | | | 44,786 | | 1,103,527 | |
Citigroup | | | | 15,365 | | 799,902 | |
JPMorgan Chase & Co. | | | | 17,096 | | 1,668,912 | |
U.S. Bancorp | | | | 14,292 | | 653,144 | |
Wells Fargo & Co. | | | | 18,901 | | 870,958 | |
| | | | | 5,096,443 | |
Capital Goods - 6.5% | | | | | |
Fortive | | | | 9,688 | | 655,490 | |
General Electric | | | | 33,428 | | 253,050 | |
Harris | | | | 1,907 | | 256,778 | |
Honeywell International | | | | 9,616 | | 1,270,466 | |
Quanta Services | | | | 9,569 | | 288,027 | |
Raytheon | | | | 5,759 | | 883,143 | |
United Technologies | | | | 11,008 | | 1,172,132 | |
| | | | | 4,779,086 | |
Commercial & Professional Services - 1.1% | | | | | |
Cintas | | | | 2,443 | | 410,400 | |
CoStar Group | | | | 1,127 | a | 380,182 | |
| | | | | 790,582 | |
Consumer Durables & Apparel - .3% | | | | | |
PVH | | | | 2,187 | | 203,282 | |
Consumer Services - 2.5% | | | | | |
Chipotle Mexican Grill | | | | 1,075 | a | 464,174 | |
Las Vegas Sands | | | | 13,196 | | 686,852 | |
McDonald's | | | | 3,994 | | 709,215 | |
| | | | | 1,860,241 | |
Diversified Financials - 6.1% | | | | | |
American Express | | | | 2,554 | | 243,447 | |
Ameriprise Financial | | | | 7,515 | | 784,341 | |
Berkshire Hathaway | | | | 6,957 | a | 1,420,480 | |
Capital One Financial | | | | 3,000 | | 226,770 | |
Goldman Sachs Group | | | | 2,434 | | 406,600 | |
LPL Financial Holdings | | | | 4,272 | | 260,934 | |
Morgan Stanley | | | | 13,338 | | 528,852 | |
Raymond James Financial | | | | 2,938 | | 218,617 | |
Voya Financial | | | | 10,571 | b | 424,320 | |
| | | | | 4,514,361 | |
Energy - 5.8% | | | | | |
Anadarko Petroleum | | | | 11,247 | | 493,068 | |
8
| | | | | | | | |
| |
Description | | | | Shares | | Value ($) | |
Common Stocks - 98.9% (continued) | | | | | |
Energy - 5.8% (continued) | | | | | |
Apergy | | | | 6,423 | | 173,935 | |
Hess | | | | 10,262 | | 415,611 | |
Marathon Petroleum | | | | 22,603 | | 1,333,803 | |
Occidental Petroleum | | | | 10,689 | | 656,091 | |
Phillips 66 | | | | 7,792 | | 671,281 | |
Schlumberger | | | | 6,764 | | 244,045 | |
Valero Energy | | | | 3,657 | | 274,165 | |
| | | | | 4,261,999 | |
Food & Staples Retailing - 1.2% | | | | | |
Costco Wholesale | | | | 2,259 | | 460,181 | |
Walmart | | | | 4,619 | | 430,260 | |
| | | | | 890,441 | |
Food, Beverage & Tobacco - 2.9% | | | | | |
Coca-Cola European Partners | | | | 3,285 | | 150,617 | |
Conagra Brands | | | | 22,959 | | 490,404 | |
Kraft Heinz | | | | 3,318 | | 142,807 | |
Monster Beverage | | | | 6,046 | a | 297,584 | |
PepsiCo | | | | 9,822 | | 1,085,135 | |
| | | | | 2,166,547 | |
Health Care Equipment & Services - 9.6% | | | | | |
Abbott Laboratories | | | | 7,888 | | 570,539 | |
Align Technology | | | | 1,708 | a | 357,706 | |
Becton Dickinson and Company | | | | 2,195 | | 494,577 | |
Boston Scientific | | | | 19,366 | a | 684,394 | |
CVS Health | | | | 8,375 | | 548,730 | |
Danaher | | | | 4,016 | | 414,130 | |
Edwards Lifesciences | | | | 2,202 | a | 337,280 | |
HCA Healthcare | | | | 1,990 | | 247,656 | |
Humana | | | | 725 | | 207,698 | |
McKesson | | | | 1,534 | | 169,461 | |
Medtronic | | | | 7,874 | | 716,219 | |
Quest Diagnostics | | | | 2,205 | | 183,610 | |
UnitedHealth Group | | | | 6,737 | | 1,678,321 | |
WellCare Health Plans | | | | 1,928 | a | 455,182 | |
| | | | | 7,065,503 | |
Household & Personal Products - 1.0% | | | | | |
Colgate-Palmolive | | | | 6,168 | | 367,119 | |
Procter & Gamble | | | | 3,557 | | 326,959 | |
| | | | | 694,078 | |
Insurance - 2.5% | | | | | |
American International Group | | | | 11,570 | | 455,974 | |
Assurant | | | | 2,773 | | 248,017 | |
Hartford Financial Services Group | | | | 8,812 | | 391,693 | |
9
STATEMENT OF INVESTMENTS (continued)
| | | | | | | | |
| |
Description | | | | Shares | | Value ($) | |
Common Stocks - 98.9% (continued) | | | | | |
Insurance - 2.5% (continued) | | | | | |
Progressive | | | | 11,963 | | 721,728 | |
| | | | | 1,817,412 | |
Materials - 5.2% | | | | | |
CF Industries Holdings | | | | 17,334 | | 754,202 | |
DowDuPont | | | | 9,678 | | 517,579 | |
Freeport-McMoRan | | | | 20,863 | | 215,098 | |
Linde | | | | 4,574 | | 713,727 | |
Martin Marietta Materials | | | | 3,020 | b | 519,047 | |
Mosaic | | | | 17,857 | | 521,603 | |
Vulcan Materials | | | | 6,233 | | 615,820 | |
| | | | | 3,857,076 | |
Media & Entertainment - 6.1% | | | | | |
Activision Blizzard | | | | 8,557 | | 398,500 | |
Alphabet, Cl. A | | | | 710 | a | 741,922 | |
Alphabet, Cl. C | | | | 2,132 | a | 2,207,921 | |
Comcast, Cl. A | | | | 17,978 | | 612,151 | |
Omnicom Group | | | | 7,327 | b | 536,629 | |
| | | | | 4,497,123 | |
Pharmaceuticals Biotechnology & Life Sciences - 5.7% | | | | | |
Biogen | | | | 979 | a | 294,601 | |
BioMarin Pharmaceutical | | | | 3,588 | a,b | 305,518 | |
Eli Lilly & Co. | | | | 6,532 | | 755,883 | |
Illumina | | | | 1,460 | a | 437,898 | |
Merck & Co. | | | | 14,927 | | 1,140,572 | |
Neurocrine Biosciences | | | | 2,670 | a,b | 190,665 | |
Pfizer | | | | 17,060 | | 744,669 | |
Vertex Pharmaceuticals | | | | 1,956 | a | 324,129 | |
| | | | | 4,193,935 | |
Real Estate - .9% | | | | | |
Lamar Advertising, Cl. A | | | | 5,293 | c | 366,170 | |
Outfront Media | | | | 16,947 | c | 307,080 | |
| | | | | 673,250 | |
Retailing - 5.1% | | | | | |
Amazon.com | | | | 1,698 | a | 2,550,345 | |
GrubHub | | | | 2,661 | a,b | 204,391 | |
O'Reilly Automotive | | | | 2,309 | a | 795,058 | |
Wayfair, Cl. A | | | | 2,524 | a,b | 227,362 | |
| | | | | 3,777,156 | |
Semiconductors & Semiconductor Equipment - 4.5% | | | | | |
Broadcom | | | | 3,449 | | 877,012 | |
Qualcomm | | | | 18,928 | | 1,077,192 | |
Texas Instruments | | | | 8,317 | | 785,957 | |
10
| | | | | | | | |
| |
Description | | | | Shares | | Value ($) | |
Common Stocks - 98.9% (continued) | | | | | |
Semiconductors & Semiconductor Equipment - 4.5% (continued) | | | | | |
Xilinx | | | | 7,146 | | 608,625 | |
| | | | | 3,348,786 | |
Software & Services - 11.9% | | | | | |
FleetCor Technologies | | | | 2,032 | a | 377,383 | |
HubSpot | | | | 2,246 | a | 282,390 | |
International Business Machines | | | | 11,078 | | 1,259,236 | |
Microsoft | | | | 20,785 | | 2,111,132 | |
Oracle | | | | 6,255 | | 282,413 | |
PayPal Holdings | | | | 8,811 | a | 740,917 | |
salesforce.com | | | | 5,485 | a | 751,280 | |
ServiceNow | | | | 2,689 | a | 478,776 | |
Splunk | | | | 3,226 | a,b | 338,246 | |
SS&C Technologies Holdings | | | | 8,369 | | 377,526 | |
Teradata | | | | 8,170 | a,b | 313,401 | |
Twilio, Cl. A | | | | 2,690 | a,b | 240,217 | |
Visa, Cl. A | | | | 9,446 | | 1,246,305 | |
| | | | | 8,799,222 | |
Technology Hardware & Equipment - 5.3% | | | | | |
Apple | | | | 10,981 | | 1,732,143 | |
Cisco Systems | | | | 27,783 | | 1,203,837 | |
Corning | | | | 17,502 | | 528,735 | |
Palo Alto Networks | | | | 2,393 | a | 450,722 | |
| | | | | 3,915,437 | |
Telecommunication Services - 5.1% | | | | | |
AT&T | | | | 39,309 | | 1,121,879 | |
T-Mobile US | | | | 10,563 | a | 671,912 | |
Verizon Communications | | | | 34,583 | | 1,944,256 | |
| | | | | 3,738,047 | |
Transportation - 1.9% | | | | | |
Delta Air Lines | | | | 12,018 | | 599,698 | |
Union Pacific | | | | 5,818 | | 804,222 | |
| | | | | 1,403,920 | |
Utilities - .4% | | | | | |
PPL | | | | 10,894 | b | 308,627 | |
Total Common Stocks(cost $63,542,350) | | | | 72,973,641 | |
| | | | | | | | |
Exchange-Traded Funds - .2% | | | | | |
Registered Investment Companies - .2% | | | | | |
iShares Russell 1000 Value ETF
(cost $194,253) | | | | 1,630 | | 181,012 | |
11
STATEMENT OF INVESTMENTS (continued)
| | | | | | | | |
| |
Description | | 1-Day
Yield (%) | | Shares | | Value ($) | |
Investment Companies - .8% | | | | | |
Registered Investment Companies - .8% | | | | | |
Dreyfus Institutional Preferred Government Plus Money Market Fund
(cost $605,949) | | 2.32 | | 605,949 | d | 605,949 | |
Total Investments(cost $64,342,552) | | 99.9% | | 73,760,602 | |
Cash and Receivables (Net) | | .1% | | 51,973 | |
Net Assets | | 100.0% | | 73,812,575 | |
aNon-income producing security.
b Security, or portion thereof, on loan. At December 31, 2018, the value of the fund’s securities on loan was $3,036,099 and the value of the collateral held by the fund was $3,050,523, consisting of U.S. Government & Agency securities.
c Investment in real estate investment trust.
d Investment in affiliated issuer. The investment objective of this investment company is publicly available and can be found within the investment company’s prospectus.
| | |
Portfolio Summary (Unaudited)† | Value (%) |
Information Technology | 21.8 |
Financials | 15.5 |
Health Care | 15.2 |
Communication Services | 11.2 |
Industrials | 9.4 |
Consumer Discretionary | 8.3 |
Energy | 5.8 |
Materials | 5.2 |
Consumer Staples | 5.1 |
Investment Companies | 1.1 |
Real Estate | .9 |
Utilities | .4 |
| | 99.9 |
† Based on net assets.
See notes to financial statements.
12
STATEMENT OF INVESTMENTS IN AFFILIATED ISSUERS
| | | | | | | |
Registered Investment Companies | Value
12/31/17 ($) | Purchases ($) | Sales ($) | Value
12/31/18 ($) | Net
Assets (%) | Dividends/
Distributions ($) |
Dreyfus Institutional Preferred Government Money Market Fund, Institutional Shares | 2,023,897 | 10,312,784 | 12,336,681 | - | - | - |
Dreyfus Institutional Preferred Government Plus Money Market Fund | 439,494 | 19,012,145 | 18,845,689 | 605,949 | .8 | 17,444 |
Total | 2,463,391 | 29,324,929 | 31,182,370 | 605,949 | .8 | 17,444 |
See notes to financial statements.
13
STATEMENT OF ASSETS AND LIABILITIES
December 31, 2018
| | | | | | | |
| | | | | | |
| | | Cost | | Value | |
Assets ($): | | | | |
Investments in securities—See Statement of Investments
(including securities on loan, valued at $3,036,099)—Note 1(c): | | | |
Unaffiliated issuers | 63,736,603 | | 73,154,653 | |
Affiliated issuers | | 605,949 | | 605,949 | |
Receivable for investment securities sold | | 1,177,149 | |
Dividends and securities lending income receivable | | 68,007 | |
Receivable for shares of Beneficial Interest subscribed | | 16,944 | |
Prepaid expenses | | | | | 854 | |
| | | | | 75,023,556 | |
Liabilities ($): | | | | |
Due to The Dreyfus Corporation and affiliates—Note 3(b) | | | | 61,343 | |
Payable for investment securities purchased | | 1,082,180 | |
Payable for shares of Beneficial Interest redeemed | | 9,916 | |
Trustees fees and expenses payable | | 698 | |
Accrued expenses | | | | | 56,844 | |
| | | | | 1,210,981 | |
Net Assets ($) | | | 73,812,575 | |
Composition of Net Assets ($): | | | | |
Paid-in capital | | | | | 55,456,102 | |
Total distributable earnings (loss) | | | | | 18,356,473 | |
Net Assets ($) | | | 73,812,575 | |
| | | | |
Net Asset Value Per Share | Initial Shares | Service Shares | |
Net Assets ($) | 69,774,039 | 4,038,536 | |
Shares Outstanding | 2,488,880 | 143,823 | |
Net Asset Value Per Share ($) | 28.03 | 28.08 | |
| | | | |
See notes to financial statements. | | | |
14
STATEMENT OF OPERATIONS
Year Ended December 31, 2018
| | | | | | | |
| | | | | | |
| | | | | | |
Investment Income ($): | | | | |
Income: | | | | |
Cash dividends: | |
Unaffiliated issuers | | | 1,511,800 | |
Affiliated issuers | | | 17,444 | |
Income from securities lending—Note 1(c) | | | 12,068 | |
Total Income | | | 1,541,312 | |
Expenses: | | | | |
Investment advisory fee—Note 3(a) | | | 642,676 | |
Professional fees | | | 91,839 | |
Distribution fees—Note 3(b) | | | 12,242 | |
Custodian fees—Note 3(b) | | | 10,173 | |
Prospectus and shareholders’ reports | | | 8,012 | |
Trustees’ fees and expenses—Note 3(c) | | | 7,070 | |
Loan commitment fees—Note 2 | | | 2,257 | |
Shareholder servicing costs—Note 3(b) | | | 644 | |
Miscellaneous | | | 32,746 | |
Total Expenses | | | 807,659 | |
Investment Income—Net | | | 733,653 | |
Realized and Unrealized Gain (Loss) on Investments—Note 4 ($): | | |
Net realized gain (loss) on investments and foreign currency transactions | 9,174,467 | |
Net unrealized appreciation (depreciation) on investments | | | (13,144,415) | |
Net Realized and Unrealized Gain (Loss) on Investments | | | (3,969,948) | |
Net (Decrease) in Net Assets Resulting from Operations | | (3,236,295) | |
| | | | | | | |
See notes to financial statements. | | | | | |
15
STATEMENT OF CHANGES IN NET ASSETS
| | | | | | | | | | |
| | | | Year Ended December 31, |
| | | | 2018 | | 2017 | a |
Operations ($): | | | | | | | | |
Investment income—net | | | 733,653 | | | | 693,408 | |
Net realized gain (loss) on investments | | 9,174,467 | | | | 7,904,298 | |
Net unrealized appreciation (depreciation)
on investments | | (13,144,415) | | | | 6,378,459 | |
Net Increase (Decrease) in Net Assets
Resulting from Operations | (3,236,295) | | | | 14,976,165 | |
Distributions ($): | |
Distributions to shareholders: | | | | | | | | |
Initial Shares | | | (8,070,416) | | | | (3,960,557) | |
Service Shares | | | (479,210) | | | | (267,229) | |
Total Distributions | | | (8,549,626) | | | | (4,227,786) | |
Beneficial Interest Transactions ($): | |
Net proceeds from shares sold: | | | | | | | | |
Initial Shares | | | 2,953,110 | | | | 3,050,148 | |
Service Shares | | | 219,876 | | | | 267,978 | |
Distributions reinvested: | | | | | | | | |
Initial Shares | | | 8,070,416 | | | | 3,960,557 | |
Service Shares | | | 479,210 | | | | 267,229 | |
Cost of shares redeemed: | | | | | | | | |
Initial Shares | | | (12,182,314) | | | | (9,798,754) | |
Service Shares | | | (1,318,092) | | | | (1,199,596) | |
Increase (Decrease) in Net Assets
from Beneficial Interest Transactions | (1,777,794) | | | | (3,452,438) | |
Total Increase (Decrease) in Net Assets | (13,563,715) | | | | 7,295,941 | |
Net Assets ($): | |
Beginning of Period | | | 87,376,290 | | | | 80,080,349 | |
End of Period | | | 73,812,575 | | | | 87,376,290 | |
Capital Share Transactions (Shares): | |
Initial Shares | | | | | | | | |
Shares sold | | | 92,133 | | | | 100,546 | |
Shares issued for distributions reinvested | | | 273,936 | | | | 135,968 | |
Shares redeemed | | | (385,558) | | | | (324,338) | |
Net Increase (Decrease) in Shares Outstanding | (19,489) | | | | (87,824) | |
Service Shares | | | | | | | | |
Shares sold | | | 6,747 | | | | 8,785 | |
Shares issued for distributions reinvested | | | 16,250 | | | | 9,184 | |
Shares redeemed | | | (41,128) | | | | (39,159) | |
Net Increase (Decrease) in Shares Outstanding | (18,131) | | | | (21,190) | |
| | | | | | | | | | |
aDistributions to shareholders include $575,664 Initial shares and $26,116 Service shares of distributions from net investment income and $3,384,893 Initial shares and $241,113 Service shares distributions from net realized gains. Undistributed investment income—net was $104,590 in 2017 and is no longer presented as a result of the adoption of SEC’s Disclosure Update and Simplification Rule. | |
See notes to financial statements. | | | | | | | | |
16
FINANCIAL HIGHLIGHTS
The following tables describe the performance for each share class for the fiscal periods indicated. All information (except portfolio turnover rate) reflects financial results for a single fund share. Total return shows how much your investment in the fund would have increased (or decreased) during each period, assuming you had reinvested all dividends and distributions. The fund’s total returns do not reflect expenses associated with variable annuity or insurance contracts. These figures have been derived from the fund’s financial statements.
| | | | | | | | | | |
| | | | | |
| | |
| | Year Ended December 31, |
Initial Shares | | 2018 | 2017 | 2016 | 2015 | 2014 |
Per Share Data ($): | | | | | | |
Net asset value,
beginning of period | | 32.72 | 28.81 | 29.98 | 32.68 | 29.92 |
Investment Operations: | | | | | | |
Investment income—neta | | .27 | .26 | .33 | .26 | .24 |
Net realized and unrealized
gain (loss) on investments | | (1.66) | 5.22 | 2.27 | .28 | 2.77 |
Total from Investment Operations | | (1.39) | 5.48 | 2.60 | .54 | 3.01 |
Distributions: | | | | | | |
Dividends from
investment income—net | | (.26) | (.23) | (.34) | (.27) | (.25) |
Dividends from net realized
gain on investments | | (3.04) | (1.34) | (3.43) | (2.97) | – |
Total Distributions | | (3.30) | (1.57) | (3.77) | (3.24) | (.25) |
Net asset value, end of period | | 28.03 | 32.72 | 28.81 | 29.98 | 32.68 |
Total Return (%) | | (4.68) | 19.71 | 10.04 | 1.59 | 10.07 |
Ratios/Supplemental Data (%): | | | | | | |
Ratio of total expenses
to average net assets | | .93 | .90 | .90 | .88 | .87 |
Ratio of net expenses
to average net assets | | .93 | .90 | .90 | .88 | .87 |
Ratio of net investment income
to average net assets | | .87 | .85 | 1.17 | .84 | .78 |
Portfolio Turnover Rate | | 63.89 | 61.00 | 64.41 | 62.03 | 51.99 |
Net Assets, end of period ($ x 1,000) | | 69,774 | 82,070 | 74,797 | 78,296 | 85,534 |
a Based on average shares outstanding.
See notes to financial statements.
17
FINANCIAL HIGHLIGHTS (continued)
| | | | | | | | | | | |
| | | | | |
| | |
| | Year Ended December 31, |
Service Shares | | 2018 | 2017 | 2016 | 2015 | 2014 |
Per Share Data ($): | | | | | | |
Net asset value,
beginning of period | | 32.76 | 28.85 | 30.01 | 32.71 | 29.94 |
Investment Operations: | | | | | | |
Investment income—neta | | .19 | .18 | .25 | .18 | .16 |
Net realized and unrealized
gain (loss) on investments | | (1.65) | 5.22 | 2.29 | .27 | 2.78 |
Total from Investment Operations | | (1.46) | 5.40 | 2.54 | .45 | 2.94 |
Distributions: | | | | | | |
Dividends from
investment income—net | | (.18) | (.15) | (.27) | (.18) | (.17) |
Dividends from net
realized gain on investments | | (3.04) | (1.34) | (3.43) | (2.97) | – |
Total Distributions | | (3.22) | (1.49) | (3.70) | (3.15) | (.17) |
Net asset value, end of period | | 28.08 | 32.76 | 28.85 | 30.01 | 32.71 |
Total Return (%) | | (4.90) | 19.38 | 9.78 | 1.32 | 9.83 |
Ratios/Supplemental Data (%): | | | | | | |
Ratio of total expenses
to average net assets | | 1.18 | 1.15 | 1.15 | 1.13 | 1.12 |
Ratio of net expenses
to average net assets | | 1.18 | 1.15 | 1.15 | 1.13 | 1.12 |
Ratio of net investment income
to average net assets | | .62 | .60 | .92 | .59 | .52 |
Portfolio Turnover Rate | | 63.89 | 61.00 | 64.41 | 62.03 | 51.99 |
Net Assets, end of period ($ x 1,000) | | 4,039 | 5,306 | 5,283 | 5,739 | 7,162 |
a Based on average shares outstanding.
See notes to financial statements.
18
NOTES TO FINANCIAL STATEMENTS
NOTE 1—Significant Accounting Policies:
Growth and Income Portfolio (the “fund”) is a separate non-diversified series of Dreyfus Variable Investment Fund (the “Company”), which is registered under the Investment Company Act of 1940, as amended (the “Act”), as an open-end management investment company and operates as a series company currently offering seven series, including the fund. The fund is only offered to separate accounts established by insurance companies to fund variable annuity contracts and variable life insurance policies. The fund’s investment objective is to seek long-term capital growth, current income and growth of income consistent with reasonable investment risk. The Dreyfus Corporation (the “Manager” or “Dreyfus”), a wholly-owned subsidiary of The Bank of New York Mellon Corporation (“BNY Mellon”), serves as the fund’s investment adviser.
MBSC Securities Corporation (the “Distributor”), a wholly-owned subsidiary of Dreyfus, is the distributor of the fund’s shares, which are sold without a sales charge. The fund is authorized to issue an unlimited number of $.001 par value shares of Beneficial Interest in each of the following classes of shares: Initial and Service. Each class of shares has identical rights and privileges, except with respect to the Distribution Plan, and the expenses borne by each class, the allocation of certain transfer agency costs, and certain voting rights. Income, expenses (other than expenses attributable to a specific class), and realized and unrealized gains or losses on investments are allocated to each class of shares based on its relative net assets.
The Company accounts separately for the assets, liabilities and operations of each series. Expenses directly attributable to each series are charged to that series’ operations; expenses which are applicable to all series are allocated among them on a pro rata basis.
The Financial Accounting Standards Board (“FASB”) Accounting Standards Codification is the exclusive reference of authoritative U.S. generally accepted accounting principles (“GAAP”) recognized by the FASB to be applied by nongovernmental entities. Rules and interpretive releases of the Securities and Exchange Commission (“SEC”) under authority of federal laws are also sources of authoritative GAAP for SEC registrants. The fund’s financial statements are prepared in accordance with GAAP, which may require the use of management estimates and assumptions. Actual results could differ from those estimates.
The Companyenters into contracts that contain a variety of indemnifications. The fund’s maximum exposure under these
19
NOTES TO FINANCIAL STATEMENTS(continued)
arrangements is unknown. The fund does not anticipate recognizing any loss related to these arrangements.
(a) Portfolio valuation: The fair value of a financial instrument is the amount that would be received to sell an asset or paid to transfer a liability in an orderly transaction between market participants at the measurement date (i.e., the exit price). GAAP establishes a fair value hierarchy that prioritizes the inputs of valuation techniques used to measure fair value. This hierarchy gives the highest priority to unadjusted quoted prices in active markets for identical assets or liabilities (Level 1 measurements) and the lowest priority to unobservable inputs (Level 3 measurements).
Additionally, GAAP provides guidance on determining whether the volume and activity in a market has decreased significantly and whether such a decrease in activity results in transactions that are not orderly. GAAP requires enhanced disclosures around valuation inputs and techniques used during annual and interim periods.
Various inputs are used in determining the value of the fund’s investments relating to fair value measurements. These inputs are summarized in the three broad levels listed below:
Level 1—unadjusted quoted prices in active markets for identical investments.
Level 2—other significant observable inputs (including quoted prices for similar investments, interest rates, prepayment speeds, credit risk, etc.).
Level 3—significant unobservable inputs (including the fund’s own assumptions in determining the fair value of investments).
The inputs or methodology used for valuing securities are not necessarily an indication of the risk associated with investing in those securities.
Changes in valuation techniques may result in transfers in or out of an assigned level within the disclosure hierarchy. Valuation techniques used to value the fund’s investments are as follows:
Investments in securities are valued at the last sales price on the securities exchange or national securities market on which such securities are primarily traded. Securities listed on the National Market System for which market quotations are available are valued at the official closing price or, if there is no official closing price that day, at the last sales price. For open short positions, asked prices are used for valuation purposes. Bid price is used when no asked price is available. Registered investment companies that are not traded on an exchange are valued at their net asset value. All of
20
the preceding securities are generally categorized within Level 1 of the fair value hierarchy.
Securities not listed on an exchange or the national securities market, or securities for which there were no transactions, are valued at the average of the most recent bid and asked prices. These securities are generally categorized within Level 2 of the fair value hierarchy.
Fair valuing of securities may be determined with the assistance of a pricing service using calculations based on indices of domestic securities and other appropriate indicators, such as prices of relevant American Depository Receipts and futures. Utilizing these techniques may result in transfers between Level 1 and Level 2 of the fair value hierarchy.
When market quotations or official closing prices are not readily available, or are determined not to accurately reflect fair value, such as when the value of a security has been significantly affected by events after the close of the exchange or market on which the security is principally traded (for example, a foreign exchange or market), but before the fund calculates its net asset value, the fund may value these investments at fair value as determined in accordance with the procedures approved by the Company’s Board of Trustees (the “Board”). Certain factors may be considered when fair valuing investments such as: fundamental analytical data, the nature and duration of restrictions on disposition, an evaluation of the forces that influence the market in which the securities are purchased and sold, and public trading in similar securities of the issuer or comparable issuers. These securities are either categorized within Level 2 or 3 of the fair value hierarchy depending on the relevant inputs used.
For restricted securities where observable inputs are limited, assumptions about market activity and risk are used and such securities are generally categorized within Level 3 of the fair value hierarchy.
Investments denominated in foreign currencies are translated to U.S. dollars at the prevailing rates of exchange.
The following is a summary of the inputs used as of December 31, 2018in valuing the fund’s investments:
21
NOTES TO FINANCIAL STATEMENTS(continued)
| | | | | |
| | Level 1-Unadjusted Quoted Prices | Level 2-Other Significant Observable Inputs | Level 3-Significant Unobservable Inputs | Total |
Assets ($) | | | | |
Investments in Securities: | | |
Equity Securities—Common Stocks† | 72,973,641 | – | – | 72,973,641 |
Exchange-Traded
Funds | 181,012 | – | – | 181,012 |
Investment Company | 605,949 | – | – | 605,949 |
† See Statement of Investments for additional detailed categorizations.
At December 31, 2018, there were no transfers between levels of the fair value hierarchy. It is the fund’s policy to recognize transfers between levels at the end of the reporting period.
(b) Foreign currency transactions: The fund does not isolate that portion of the results of operations resulting from changes in foreign exchange rates on investments from the fluctuations arising from changes in the market prices of securities held. Such fluctuations are included with the net realized and unrealized gain or loss on investments.
Net realized foreign exchange gains or losses arise from sales of foreign currencies, currency gains or losses realized on securities transactions between trade and settlement date, and the difference between the amounts of dividends, interest and foreign withholding taxes recorded on the fund’s books and the U.S. dollar equivalent of the amounts actually received or paid. Net unrealized foreign exchange gains and losses arise from changes in the value of assets and liabilities other than investments resulting from changes in exchange rates. Foreign currency gains and losses on foreign currency transactions are also included with net realized and unrealized gain or loss on investments.
(c)Securities transactions and investment income: Securities transactions are recorded on a trade date basis. Realized gains and losses from securities transactions are recorded on the identified cost basis. Dividend income is recognized on the ex-dividend date and interest income, including, where applicable, accretion of discount and amortization of premium on investments, is recognized on the accrual basis.
Pursuant to a securities lending agreement with The Bank of New York Mellon, a subsidiary of BNY Mellon and an affiliate of Dreyfus, the fund may lend securities to qualified institutions. It is the fund’s policy that, at origination, all loans are secured by collateral of at least 102% of the value
22
of U.S. securities loaned and 105% of the value of foreign securities loaned. Collateral equivalent to at least 100% of the market value of securities on loan is maintained at all times. Collateral is either in the form of cash, which can be invested in certain money market mutual funds managed by Dreyfus, or U.S. Government and Agency securities. The fund is entitled to receive all dividends, interest and distributions on securities loaned, in addition to income earned as a result of the lending transaction. Should a borrower fail to return the securities in a timely manner, The Bank of New York Mellon is required to replace the securities for the benefit of the fund or credit the fund with the market value of the unreturned securities and is subrogated to the fund’s rights against the borrower and the collateral. Additionally, the contractual maturity of security lending transactions are on an overnight and continuous basis. During the period ended December 31, 2018, The Bank of New York Mellon earned $2,257 from lending portfolio securities, pursuant to the securities lending agreement.
(d) Affiliated issuers: Investments in other investment companies advised by Dreyfus are considered “affiliated” under the Act.
(e) Dividends and distributions to shareholders:Dividends and distributions are recorded on the ex-dividend date. Dividends from investment income-net are normally declared and paid quarterly. Dividends from net realized capital gains, if any, are normally declared and paid annually, but the fund may make distributions on a more frequent basis to comply with the distribution requirements of the Internal Revenue Code of 1986, as amended (the “Code”). To the extent that net realized capital gains can be offset by capital loss carryovers, it is the policy of the fund not to distribute such gains. Income and capital gain distributions are determined in accordance with income tax regulations, which may differ from GAAP.
(f) Federal income taxes: It is the policy of the fund to continue to qualify as a regulated investment company, if such qualification is in the best interests of its shareholders, by complying with the applicable provisions of the Code, and to make distributions of taxable income and net realized capital gain sufficient to relieve it from substantially all federal income and excise taxes.
As of and during the period ended December 31, 2018, the fund did not have any liabilities for any uncertain tax positions. The fund recognizes interest and penalties, if any, related to uncertain tax positions as income tax expense in the Statement of Operations. During the period ended December 31, 2018, the fund did not incur any interest or penalties.
23
NOTES TO FINANCIAL STATEMENTS(continued)
Each tax year in the four year period ended December 31, 2018 remains subject to examination by the Internal Revenue Service and state taxing authorities.
At December 31, 2018, the components of accumulated earnings on a tax basis were as follows: undistributed ordinary income $242,864 undistributed capital gains $9,074,722 and unrealized appreciation $9,038,887.
The tax character of distributions paid to shareholders during the fiscal periods ended December 31, 2018 and December 31, 2017 were as follows: ordinary income $2,574,824 and $601,780, and long-term capital gains $5,974,802 and $3,626,006, respectively.
(g) New Accounting Pronouncements: In August 2018, the FASB issued Accounting Standards Update 2018-13, Fair Value Measurement (Topic 820): Disclosure Framework—Changes to the Disclosure Requirements for Fair Value Measurement (“ASU 2018-13”). The update provides guidance that eliminates, adds and modifies certain disclosure requirements for fair value measurements. ASU 2018-13 will be effective for annual periods beginning after December 15, 2019. Management is currently assessing the potential impact of these changes to future financial statements.
NOTE 2—Bank Lines of Credit:
The fund participates with other Dreyfus-managed long-term open-end funds in a $1.030 billion unsecured credit facility led by Citibank, N.A. (the “Citibank Credit Facility”) and a $300 million unsecured credit facility provided by The Bank of New York Mellon (the “BNYM Credit Facility”), each to be utilized primarily for temporary or emergency purposes, including the financing of redemptions (each, a “Facility”). The Citibank Credit Facility is available in two tranches: (i) Tranche A is in an amount equal to $830 million and is available to all long-term open-ended funds, including the fund, and (ii) Tranche B is in amount equal to $200 million and is available only to the Dreyfus Floating Rate Income Fund, a series of The Dreyfus/Laurel Funds, Inc. Prior to October 3, 2018, the unsecured credit facility with Citibank, N.A. was $830 million. In connection therewith, the fund has agreed to pay its pro rata portion of commitment fees for Tranche A of the Citibank Credit Facility and the BNYM Credit Facility. Interest is charged to the fund based on rates determined pursuant to the terms of the respective Facility at the time of borrowing. During the period ended December 31, 2018, the fund did not borrow under the Facilities.
24
NOTE 3—Investment Advisory Fee and Other Transactions with Affiliates:
(a)Pursuant to an investment advisory agreement with Dreyfus, the investment advisory fee is computed at the annual rate of .75% of the value of the fund’s average daily net assets and is payable monthly.
(b)Under the Distribution Plan adopted pursuant to Rule 12b-1 under the Act, Service shares pay the Distributor for distributing its shares, for servicing and/or maintaining Service shares’ shareholder accounts and for advertising and marketing for Service shares. The Distribution Plan provides for payments to be made at an annual rate of .25% of the value of the Service shares’ average daily net assets. The Distributor may make payments to Participating Insurance Companies and to brokers and dealers acting as principal underwriter for their variable insurance products. The fees payable under the Distribution Plan are payable without regard to actual expenses incurred. During the period ended December 31, 2018,Service shares were charged $12,242 pursuant to the Distribution Plan.
The fund has arrangements with the transfer agent and the custodian whereby the fund may receive earnings credits when positive cash balances are maintained, which are used to offset transfer agency and custody fees. For financial reporting purposes, the fund includes net earnings credits, if any, as an expense offset in the Statement of Operations.
The fund compensates Dreyfus Transfer, Inc., a wholly-owned subsidiary of Dreyfus, under a transfer agency agreement for providing transfer agency and cash management services for the fund. The majority of transfer agency fees are comprised of amounts paid on a per account basis, while cash management fees are related to fund subscriptions and redemptions. During the period ended December 31, 2018, the fund was charged $613 for transfer agency services. These fees are included in Shareholder servicing costs in the Statement of Operations.
The fund compensates The Bank of New York Mellon under a custody agreement for providing custodial services for the fund. These fees are determined based on net assets, geographic region and transaction activity. During the period ended December 31, 2018, the fund was charged $10,173 pursuant to the custody agreement.
During the period ended December 31, 2018, the fund was charged $12,774 for services performed by the Chief Compliance Officer and his staff. These fees are included in Miscellaneous in the Statement of Operations.
25
NOTES TO FINANCIAL STATEMENTS(continued)
The components of “Due to The Dreyfus Corporation and affiliates” in the Statement of Assets and Liabilities consist of: investment advisory fees $48,329, Distribution Plan fees $883, custodian fees $5,705, Chief Compliance Officer fees $6,289 and transfer agency fees $137.
(c) Each Board member also serves as a Board member of other funds within the Dreyfus complex. Annual retainer fees and attendance fees are allocated to each fund based on net assets.
NOTE 4—Securities Transactions:
The aggregate amount of purchases and sales of investment securities, excluding short-term securities, during the period ended December 31, 2018, amounted to $53,989,874 and $63,872,068, respectively.
At December 31, 2018, the cost of investments for federal income tax purposes was $64,721,715; accordingly, accumulated net unrealized appreciation on investments was $9,038,887, consisting of $14,245,085 gross unrealized appreciation and $5,206,198 gross unrealized depreciation.
26
REPORT OF INDEPENDENT REGISTERED PUBLIC ACCOUNTING FIRM
To the Shareholders and the Board of Trustees of Growth and Income Portfolio
Opinion on the Financial Statements
We have audited the accompanying statement of assets and liabilities of Growth and Income Portfolio (the “Fund”) (one of the funds constituting Dreyfus Variable Investment Fund), including the statements of investments and investments in affiliated issuers, as of December 31, 2018, and the related statement of operations for the year then ended, the statements of changes in net assets for each of the two years in the period then ended, the financial highlights for each of the five years in the period then ended and the related notes (collectively referred to as the “financial statements”). In our opinion, the financial statements present fairly, in all material respects, the financial position of the Fund (one of the funds constituting Dreyfus Variable Investment Fund) at December 31, 2018, the results of its operations for the year then ended, the changes in its net assets for each of the two years in the period then ended and its financial highlights for each of the five years in the period then ended, in conformity with U.S. generally accepted accounting principles.
Basis for Opinion
These financial statements are the responsibility of the Fund’s management. Our responsibility is to express an opinion on the Fund’s financial statements based on our audits. We are a public accounting firm registered with the Public Company Accounting Oversight Board (United States) (“PCAOB”) and are required to be independent with respect to the Fund in accordance with the U.S. federal securities laws and the applicable rules and regulations of the Securities and Exchange Commission and the PCAOB.
We conducted our audits in accordance with the standards of the PCAOB. Those standards require that we plan and perform the audit to obtain reasonable assurance about whether the financial statements are free of material misstatement, whether due to error or fraud. The Fund is not required to have, nor were we engaged to perform, an audit of the Fund’s internal control over financial reporting. As part of our audits, we are required to obtain an understanding of internal control over financial reporting, but not for the purpose of expressing an opinion on the effectiveness of the Fund’s internal control over financial reporting. Accordingly, we express no such opinion.
Our audits included performing procedures to assess the risks of material misstatement of the financial statements, whether due to error or fraud, and performing procedures that respond to those risks. Such procedures included examining, on a test basis, evidence regarding the amounts and disclosures in the financial statements. Our procedures included confirmation of securities owned as of December 31, 2018, by correspondence with the custodian and others or by other appropriate auditing procedures where replies from others were not received. Our audits also included evaluating the accounting principles used and significant estimates made by management, as well as evaluating the overall presentation of the financial statements. We believe that our audits provide a reasonable basis for our opinion.

We have served as the auditor of one or more Dreyfus investment companies since at least 1957, but we are unable to determine the specific year.
New York, New York
February 11, 2019
27
IMPORTANT TAX INFORMATION(Unaudited)
For federal tax purposes, the portfolio hereby reports 64.44% of the ordinary dividends paid during the fiscal year ended December 31, 2018 as qualifying for the corporate dividends received deduction. Shareholders will receive notification in early 2019 of the percentage applicable to the preparation of their 2018 income tax returns. Also, the portfolio hereby reports $.7350 per share as a short-term capital gain distribution and $2.3070 per share as a long-term capital gain distribution paid on March 29, 2018.
28
BOARD MEMBERS INFORMATION(Unaudited)
INDEPENDENT BOARD MEMBERS
Joseph S. DiMartino (75)
Chairman of the Board (1995)
Principal Occupation During Past 5 Years:
· Corporate Director and Trustee (1995-present)
Other Public Company Board Memberships During Past 5 Years:
· CBIZ (formerly, Century Business Services, Inc.), a provider of outsourcing functions for small and medium size companies, Director (1997-present)
No. of Portfolios for which Board Member Serves:122
———————
Peggy C. Davis (75)
Board Member (2006)
Principal Occupation During Past 5 Years:
· Shad Professor of Law, New York University School of Law (1983-present)
No. of Portfolios for which Board Member Serves: 45
———————
David P. Feldman (79)
Board Member (1994)
Principal Occupation During Past 5 Years:
· Corporate Director and Trustee (1985-present)
Other Public Company Board Memberships During Past 5 Years:
· BBH Mutual Funds Group (5 registered mutual funds), Director (1992-2014)
No. of Portfolios for which Board Member Serves:31
———————
Joan Gulley (71)
Board Member (2017)
Principal Occupation During Past 5 Years:
· PNC Financial Services Group, Inc.(1993-2014), Executive Vice President and Chief Human Resources Officer and Executive Committee Member (2008-2014)
No. of Portfolios for which Board Member Serves:52
———————
29
BOARD MEMBERS INFORMATION (Unaudited) (continued)
INDEPENDENT BOARD MEMBERS (continued)
Ehud Houminer (78)
Board Member (2006)
Principal Occupation During Past 5 Years:
· Board of Overseers at the Columbia Business School, Columbia University (1992-present)
· Trustee, Ben Gurion University
No. of Portfolios for which Board Member Serves: 52
———————
Lynn Martin (79)
Board Member (2012)
Principal Occupation During Past 5 Years:
· President of The Martin Hall Group LLC, a human resources consulting firm (2005-2012)
No. of Portfolios for which Board Member Serves:31
———————
Robin A. Melvin (55)
Board Member (2012)
Principal Occupation During Past 5 Years:
· Co-chairman, Illinois Mentoring Partnership, non-profit organization dedicated to increasing the quantity and quality of mentoring services in Illinois; (2014-present; board member since 2013)
No. of Portfolios for which Board Member Serves:99
———————
Dr. Martin Peretz (79)
Board Member (1990)
Principal Occupation During Past 5 Years:
· Editor-in-Chief Emeritus of The New Republic Magazine (2011-2012) (previously,
Editor-in-Chief, 1974-2011)
· Lecturer at Harvard University (1968-2010)
No. of Portfolios for which Board Member Serves:31
———————
Once elected all Board Members serve for an indefinite term, but achieve Emeritus status upon reaching age 80. The address of the Board Members and Officers is c/o The Dreyfus Corporation, 200 Park Avenue, New York, New York 10166. Additional information about the Board Member is available in the fund’s Statement of Additional Information which can be obtained from Dreyfus free of charge by calling this toll free number: 1-800-DREYFUS.
James F. Henry, Emeritus Board Member
Philip L. Toia, Emeritus Board Member
30
OFFICERS OF THE FUND(Unaudited)
BRADLEY J. SKAPYAK, President since January 2010.
Chief Operating Officer and a director of the Manager since June 2009, Chairman of Dreyfus Transfer, Inc., an affiliate of the Manager and the transfer agent of the funds, since May 2011 and Chief Executive Officer of MBSC Securities Corporation since August 2016. He is an officer of 62 investment companies (comprised of 122 portfolios) managed by the Manager. He is 60 years old and has been an employee of the Manager since February 1988.
BENNETT A. MACDOUGALL, Chief Legal Officer since October 2015.
Chief Legal Officer of the Manager and Associate General Counsel and Managing Director of BNY Mellon since June 2015; from June 2005 to June 2015, he served in various capacities with Deutsche Bank – Asset & Wealth Management Division, including as Director and Associate General Counsel, and Chief Legal Officer of Deutsche Investment Management Americas Inc. from June 2012 to May 2015. He is an officer of 63 investment companies (comprised of 147 portfolios) managed by the Manager. He is 47 years old and has been an employee of the Manager since June 2015.
JAMES BITETTO, Vice President since August 2005 and Secretary since February 2018.
Managing Counsel of BNY Mellon and Secretary of the Manager, and an officer of 63 investment companies (comprised of 147 portfolios) managed by the Manager. He is 52 years old and has been an employee of the Manager since December 1996.
SONALEE CROSS, Vice President and Assistant Secretary since March 2018.
Counsel of BNY Mellon since October 2016; Associate at Proskauer Rose LLP from April 2016 to September 2016; Attorney at EnTrust Capital from August 2015 to February 2016; Associate at Sidley Austin LLP from September 2013 until August 2015. She is an officer of 63 investment companies (comprised of 147 portfolios) managed by Dreyfus. She is 31 years old and has been an employee of the Manager since October 2016.
SARAH S. KELLEHER, Vice President and Assistant Secretary since April 2014.
Managing Counsel of BNY Mellon since December 2017, from March 2013 to December 2017, Senior Counsel of BNY Mellon. She is an officer of 63 investment companies (comprised of 147 portfolios) managed by the Manager. She is 43 years old and has been an employee of the Manager since March 2013.
JEFF PRUSNOFSKY, Vice President and Assistant Secretary since August 2005.
Senior Managing Counsel of BNY Mellon, and an officer of 63 investment companies (comprised of 147 portfolios) managed by the Manager. He is 53 years old and has been an employee of the Manager since October 1990.
NATALYA ZELENSKY, Vice President and Assistant Secretary since March 2017.
Counsel of BNY Mellon since May 2016; Attorney at Wildermuth Endowment Strategy Fund/Wildermuth Advisory, LLC from November 2015 until May 2016; Assistant General Counsel at RCS Advisory Services from July 2014 until November 2015; Associate at Sutherland, Asbill & Brennan from January 2013 until January 2014. She is an officer of 63 investment companies (comprised of 147 portfolios) managed by Dreyfus. She is 33 years old and has been an employee of the Manager since May 2016.
JAMES WINDELS, Treasurer since November 2001.
Director – Mutual Fund Accounting of the Manager, and an officer of 63 investment companies (comprised of 147 portfolios) managed by the Manager. He is 60 years old and has been an employee of the Manager since April 1985.
GAVIN C. REILLY, Assistant Treasurer since December 2005.
Tax Manager of the Investment Accounting and Support Department of the Manager, and an officer of 63 investment companies (comprised of 147 portfolios) managed by the Manager. He is 50 years old and has been an employee of the Manager since April 1991.
ROBERT S. ROBOL, Assistant Treasurer since August 2005.
Senior Accounting Manager – Dreyfus Financial Reporting of the Manager, and an officer of 63 investment companies (comprised of 147 portfolios) managed by the Manager. He is 54 years old and has been an employee of the Manager since October 1988.
31
OFFICERS OF THE FUND (Unaudited)(continued)
ROBERT SALVIOLO, Assistant Treasurer since July 2007.
Senior Accounting Manager – Equity Funds of the Manager, and an officer of 63 investment companies (comprised of 147 portfolios) managed by the Manager. He is 51 years old and has been an employee of the Manager since June 1989.
ROBERT SVAGNA, Assistant Treasurer since December 2002.
Senior Accounting Manager – Fixed Income and Equity Funds of the Manager, and an officer of 63 investment companies (comprised of 147 portfolios) managed by the Manager. He is 51 years old and has been an employee of the Manager since November 1990.
JOSEPH W. CONNOLLY, Chief Compliance Officer since October 2004.
Chief Compliance Officer of the Manager, the Dreyfus Family of Funds and BNY Mellon Funds Trust (63 investment companies, comprised of 147 portfolios). He is 61 years old and has served in various capacities with the Manager since 1980, including manager of the firm’s Fund Accounting Department from 1997 through October 2001.
CARIDAD M. CAROSELLA, Anti-Money Laundering Compliance Officer since January 2016.
Anti-Money Laundering Compliance Officer of the Dreyfus Family of Funds and BNY Mellon Funds Trust since January 2016; from May 2015 to December 2015, Interim Anti-Money Laundering Compliance Officer of the Dreyfus Family of Funds and BNY Mellon Funds Trust and the Distributor; from January 2012 to May 2015, AML Surveillance Officer of the Distributor and from 2007 to December 2011, Financial Processing Manager of the Distributor. She is an officer of 57 investment companies (comprised of 141 portfolios) managed by the Manager. She is 50 years old and has been an employee of the Distributor since 1997.
32
NOTES
33
Dreyfus Variable Investment Fund, Growth and Income Portfolio
200 Park Avenue
New York, NY 10166
Investment Adviser
The Dreyfus Corporation
200 Park Avenue
New York, NY 10166
Custodian
The Bank of New York Mellon
240 Greenwich Street
New York, NY 10286
Transfer Agent &
Dividend Disbursing Agent
Dreyfus Transfer, Inc.
200 Park Avenue
New York, NY 10166
Distributor
MBSC Securities Corporation
200 Park Avenue
New York, NY 10166
Telephone 1-800-258-4260 or 1-800-258-4261
Mail The Dreyfus Family of Funds, 144 Glenn Curtiss Boulevard, Uniondale, NY 11556-0144 Attn: Institutional Services Department
E-mailSend your request toinfo@dreyfus.com
InternetInformation can be viewed online or downloaded atwww.dreyfus.com
The fund files its complete schedule of portfolio holdings with the Securities and Exchange Commission (“SEC”) for the first and third quarters of each fiscal year on Form N-Q. The fund’s Forms N-Q are available on the SEC’s website at http://www.sec.gov and may be reviewed and copied at the SEC’s Public Reference Room in Washington, D.C. Information on the operation of the Public Reference Room may be obtained by calling 1-800-SEC-0330.
A description of the policies and procedures that the fund uses to determine how to vote proxies relating to portfolio securities, and information regarding how the fund voted these proxies for the most recent 12-month period ended June 30 is available at http://www.dreyfus.com and on the SEC’s website at http://www.sec.gov. The description of the policies and procedures is also available without charge, upon request, by calling 1-800-DREYFUS.
| | |
© 2019 MBSC Securities Corporation
0108AR1218 | 
|
Dreyfus Variable Investment Fund, International Equity Portfolio
| | | |

| | ANNUAL REPORT December 31, 2018 |
| |
The views expressed in this report reflect those of the portfolio manager(s) only through the end of the period covered and do not necessarily represent the views of Dreyfus or any other person in the Dreyfus organization. Any such views are subject to change at any time based upon market or other conditions and Dreyfus disclaims any responsibility to update such views. These views may not be relied on as investment advice and, because investment decisions for a Dreyfus fund are based on numerous factors, may not be relied on as an indication of trading intent on behalf of any Dreyfus fund. |
| |
Not FDIC-Insured • Not Bank-Guaranteed • May Lose Value |
Contents
T H E F U N D
F O R M O R E I N F O R M AT I O N
Back Cover
| | | | |
| |
Dreyfus Variable Investment Fund, International Equity Portfolio
| | The Fund |
A LETTER FROM THE PRESIDENT OF DREYFUS
Dear Shareholder:
We are pleased to present this annual report for Dreyfus Variable Investment Fund, International Equity Portfolio, covering the 12-month period from January 1, 2018 through December 31, 2018. For information about how the fund performed during the reporting period, as well as general market perspectives, we provide a Discussion of Fund Performance on the pages that follow.
The reporting period began with major global economies achieving above-trend growth. In the United States, a robust economy and strong labor market encouraged the Federal Reserve to continue moving away from its accommodative monetary policy while other major central banks began to consider monetary tightening. Both U.S. and non-U.S. equity markets remained on an uptrend. Interest rates rose across the yield curve, putting pressure on bond prices.
A few months into the reporting period, global growth trends began to diverge and market volatility returned. While the U.S. economy continued to grow at a healthy rate, other developed markets began to weaken. However, robust growth and strong corporate earnings continued to support U.S. stock returns while other developed markets declined throughout the summer. In the fall, a broad sell-off occurred, partially offsetting earlier U.S. gains. Emerging markets remained under pressure as weakness in their currencies relative to the U.S. dollar added to investors’ uneasiness. Global equities continued their general decline through the end of the period.
Fixed income markets struggled during the first half of the period as interest rates rose and favorable U.S. equity markets fed investor risk appetites. However, in autumn volatility crept in, the yield curve began a flattening trend that continued through the end of December. As long-term debt yields fell, prices rose for many bonds, leading to moderately positive returns for several fixed income market sectors.
Despite continuing political variables, U.S. inflationary pressures and flagging growth rates, we are optimistic that the U.S. economy will remain strong in the near term. However, we remain attentive to signs that point to potential changes on the horizon. As always, we encourage you to discuss the risks and opportunities in today’s investment environment with your financial advisor.
Thank you for your continued confidence and support.
Sincerely,

Renee Laroche-Morris
President
The Dreyfus Corporation
January 15, 2019
2
DISCUSSION OF FUND PERFORMANCE(Unaudited)
For the period from January 1, 2018 through December 31, 2018, as provided by the fund’s primary portfolio managers, Paul Markham, Jeff Munroe, and Yuko Takano of Newton Investment Management (North America) Limited (“Newton”), Sub-Investment Adviser
Market and Fund Performance Overview
For the 12-month period ended December 31, 2018, Dreyfus Variable Investment Fund, International Equity Portfolio’s Initial Shares produced a total return of -15.72%, and its Service Shares produced a total return of -15.91%.1This compares with a -13.79% return produced by the fund’s benchmark, the MSCI EAFE Index (the “Index”), for the same period.2
International equities lost value over the reporting period amid geopolitical uncertainty, more protectionist U.S. trade policies, and slowing developed market growth. Shortfalls in the financials and communication services sectors, along with a lack of exposure to utilities, dampened the fund’s results compared with the Index.
The Fund’s Investment Approach
The fund seeks capital growth by investing at least 80% of its net assets, plus any borrowings for investment purposes, in stocks of foreign companies and depositary receipts evidencing ownership in such securities. At least 75% of the fund’s net assets will be invested in countries represented in the Index. The fund may invest up to 25% of its net assets in stocks of companies located in countries (other than the United States) not represented in the Index, including up to 20% in emerging market countries.
The core of the investment philosophy of Newton, an affiliate of The Dreyfus Corporation, is the belief that no company, market or economy can be considered in isolation; each must be understood within a global context. Newton believes that a global comparison of companies is the most effective method of stock analysis, and Newton’s global analysts research investment opportunities by global sector rather than by region. The process begins by identifying a core list of investment themes that Newton believes will positively or negatively affect certain sectors or industries and cause stocks within these sectors or industries to outperform or underperform others. Newton then identifies specific companies using these investment themes to help focus on areas where thematic and strategic research indicates superior returns are likely to be achieved.
Sell decisions for individual stocks will typically be a result of one or more of the following: a change in investment theme or strategy; profit-taking; a significant change in the prospects of the company; price movement and market activity have created an extreme valuation; or the valuation of a company has become expensive against its peers.
Rising Volatility Amid Political Worries
The first quarter of 2018 witnessed the return of volatility to international markets. Equities came under pressure toward the end of January, with the proximate cause being the steep rise in government-bond yields since the start of 2018. Following a period of stabilization, equity markets soon succumbed once again; however, this time, investor caution was motivated by the Trump administration’s move to impose tariffs upon aluminum and steel imports. The second quarter of the year was equally lively, as President Donald Trump
3
DISCUSSION OF FUND PERFORMANCE(Unaudited) (continued)
stepped up his protectionist rhetoric on trade. Another major focus of investors’ attention was Italy, where a constitutional crisis at the end of May briefly roiled markets.
In the third quarter, President Trump’s trade hostilities with China escalated, as billions more dollars’ worth of trade became subject to new tariffs. Across the Atlantic, Brexit remained a significant concern for investors, while Italian politics returned to dominate financial headlines, as the populist coalition government unveiled its long-awaited spending plans, which threatened to breach European Union (EU) deficit restrictions. Monetary policy remained on a tightening trajectory. In the developing world, certain structurally weaker economies and their currencies (principally Argentina and Turkey) succumbed to some of the spillover effects arising from the continued tightening of U.S. monetary conditions and the associated contraction of international dollar liquidity, contributing to a broader malaise within emerging markets.
Equity investors endured challenging and more volatile market conditions in a particularly difficult final quarter of 2018. Much of the damage sustained by equity indices took place in October and stemmed, in large measure, from a renewed articulation of a hawkish narrative by Federal Reserve officials. November brought some respite and a brief rebound in stock markets, as Jerome Powell, chair of the Federal Reserve, moderated his earlier stance. However, a “Santa Claus” rally failed to materialize in December, and instead, international equities plunged to new lows for the year, as the tone of the Federal Reserve’s forward-looking commentary once again unnerved investors. While the renewed focus on monetary conditions superseded political concerns as the principal preoccupation of global investors, the latter continued to contribute to the broader malaise, including the ongoing trade dispute between the U.S. and China, as signs emerged that this was beginning to affect growth. In Europe, uncertainty around Brexit persisted, with UK Prime Minister Theresa May forced to postpone the parliamentary vote on her proposed deal with the EU. Meanwhile, Angela Merkel’s Christian Democratic Union struggled in an election in the German state of Hesse and in France, President Emmanuel Macron was cowed by the actions of the “gilets jaunes” protest movement.
Security Selections Dampened Fund Results
An overweight to financials for much of the review period detracted from relative returns, as did stock selection within the sector. Elsewhere, stock picking in communication services weighed on performance, alongside a utilities void. BNP Paribas shares were hit particularly hard by turmoil in Italian politics, driven down by a growing nervousness in the market around the outlook for Italian government debt. Although BNP only derives around 8% of its revenues from Italy, concerns that the European Central Bank may delay monetary tightening in response to the crisis negatively impacted the stock and financials in general. We reduced our position during the period. Royal Bank of Scotland Group was also subject to share-price weakness. The stock fell sharply towards the end of the review period as Theresa May’s government appeared on the verge of unraveling, when several ministers resigned in response to her proposed Brexit deal. Despite our favorable opinion of management, we acknowledged that near-term upside may be limited and chose to reduce our holding. Various sets of results hindered machinery company Ebara’s share price over the year. For the first quarter of the fiscal year, there was a negative impact from a delay in the oil and gas-related recovery. The stock fell again, following results for the third quarter, as the market took exception to a downward revision to full-year margin.
4
Consumer discretionary stock selection provided a boost to the relative performance of the fund. Stock picking in real estate was also beneficial, as was an underweight to materials. Wolters Kluwer’s business model found favor with investors during the period. Wolters is experiencing growth due to the fact that it has a range of well-invested products that possess advantages over those of its competitors. Shares in Don Quijote Holdings rose after it was announced that the company would be taking 100% control of Uny, thereby providing it with full control over the turnaround of stores. Sony was also a positive contributor for the period. Semiconductors tend to remain a focus for investors in the company, although the Game & Network business looks set to remain the company’s key earnings driver. We also continue to see value in its Music division, another high-return business.
Finding Opportunities in Volatile Markets
International equity markets have not enjoyed the strong performance that U.S. equities have achieved over the last several years, driven to some extent by a strong dollar. The relative slowness of other central banks and economies to respond to the considerable challenges posed by the global financial crisis and its aftermath were also a major detractor to performance, and this important differential is now very much incorporated into valuations. Although headwinds certainly continue to exist — some of them structural — for global investors, we do see relative value opportunities in international markets. As we move closer to the end of the global economic cycle, we believe being selective will be key. Given this outlook, we have recently reduced our overweight to financials and have shifted into high-quality consumer staples.
January 15, 2019
1 Total return includes reinvestment of dividends and any capital gains paid. Past performance is no guarantee of future results. Share price and investment return fluctuate such that upon redemption, fund shares may be worth more or less than their original cost. The fund’s performance does not reflect the deduction of additional charges and expenses imposed in connection with investing in variable insurance contracts, which will reduce returns.
2 Source: Lipper Inc. — The MSCI EAFE Index (Europe, Australasia, Far East) is a free float-adjusted market capitalization-weighted index that is designed to measure the equity market performance of developed markets, excluding the U.S. and Canada. It reflects reinvestment of net dividends and, where applicable, capital gain distributions. Investors cannot invest directly in any index.
Equities are subject generally to market, market sector, market liquidity, issuer, and investment style risks, among other factors, to varying degrees, all of which are more fully described in the fund’s prospectus.
The fund’s performance will be influenced by political, social, and economic factors affecting investments in foreign companies. Special risks associated with investments in foreign companies include exposure to currency fluctuations, less liquidity, less developed or less efficient trading markets, lack of comprehensive company information, political instability, and differing auditing and legal standards. These risks are enhanced in emerging market countries.
The fund is only available as a funding vehicle under variable life insurance policies or variable annuity contracts issued by insurance companies. Individuals may not purchase shares of the fund directly. A variable annuity is an insurance contract issued by an insurance company that enables investors to accumulate assets on a tax-deferred basis for retirement or other long-term goals. The investment objective and policies of Dreyfus Variable Investment Fund, International Equity Portfolio, made available through insurance products, may be similar to those of other funds managed or advised by Dreyfus. However, the investment results of the fund may be higher or lower than, and may not be comparable to, those of any other Dreyfus fund.
5
FUND PERFORMANCE(Unaudited)
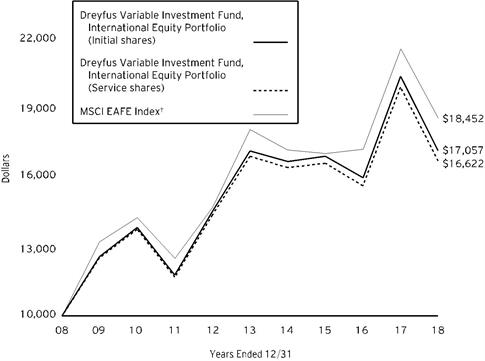
Comparison of change in value of $10,000 investment inDreyfus Variable Investment Fund, International Equity Portfolio Initial shares and Service shares and theMSCI EAFE Index (the “Index”)
† Source: Lipper Inc.
Past performance is not predictive of future performance. The fund’s performance does not reflect the deduction of additional charges and expenses imposed in connection with investing in variable insurance contracts which will reduce returns.
The above graph compares a $10,000 investment made in Initial and Service shares of Dreyfus Variable Investment Fund, International Equity Portfolio on 12/31/08 to a $10,000 investment made in the Index on that date.
The fund’s performance shown in the line graph above takes into account all applicable fund fees and expenses for Initial and Service shares. The Index (Europe, Australasia, Far East) is a free float-adjusted market capitalization-weighted index that is designed to measure the equity market performance of developed markets, excluding the U.S. and Canada. Unlike a mutual fund, the Index is not subject to charges, fees and other expenses. Investors cannot invest directly in any index. Further information relating to fund performance, including expense reimbursements, if applicable, is contained in the Financial Highlights section of the prospectus and elsewhere in this report.
6
| | | | |
Average Annual Total Returns as of 12/31/18 |
| 1 Year | 5 Years | 10 Years |
Initial shares | -15.72% | 0.01% | 5.49% |
Service shares | -15.91% | -0.24% | 5.21% |
MSCI EAFE Index | -13.79% | 0.53% | 6.32% |
The performance data quoted represents past performance, which is no guarantee of future results. Share price and investment return fluctuate and an investor’s shares may be worth more or less than original cost upon redemption. Current performance may be lower or higher than the performance quoted. Go to Dreyfus.com for the fund’s most recent month-end returns.
The fund’s Initial shares are not subject to a Rule 12b-1 fee. The fund’s Service shares are subject to a 0.25% annual Rule 12b-1 fee. All dividends and capital gain distributions are reinvested.
The fund’s performance shown in the graph and table does not reflect the deduction of taxes that a shareholder would pay on fund distributions or the redemption of fund shares.
7
UNDERSTANDING YOUR FUND’S EXPENSES(Unaudited)
As a mutual fund investor, you pay ongoing expenses, such as management fees and other expenses. Using the information below, you can estimate how these expenses affect your investment and compare them with the expenses of other funds. You also may pay one-time transaction expenses, including sales charges (loads), redemption fees and expenses associated with variable annuity or insurance contracts, which are not shown in this section and would have resulted in higher total expenses. For more information, see your fund’s prospectus or talk to your financial adviser.
Review your fund’s expenses
The table below shows the expenses you would have paid on a $1,000 investment in Dreyfus Variable Investment Fund, International Equity Portfolio from July 1, 2018 to December 31, 2018. It also shows how much a $1,000 investment would be worth at the close of the period, assuming actual returns and expenses.
| | | | | | | | |
Expenses and Value of a $1,000 Investment | | |
assuming actual returns for the six months ended December 31, 2018 | |
| | | | Initial Shares | Service Shares |
Expenses paid per $1,000† | | | $5.91 | | $7.09 |
Ending value (after expenses) | | | $875.60 | | $874.60 |
COMPARING YOUR FUND’S EXPENSES
WITH THOSE OF OTHER FUNDS(Unaudited)
Using the SEC’s method to compare expenses
The Securities and Exchange Commission (“SEC”) has established guidelines to help investors assess fund expenses. Per these guidelines, the table below shows your fund’s expenses based on a $1,000 investment, assuming a hypothetical 5% annualized return. You can use this information to compare the ongoing expenses (but not transaction expenses or total cost) of investing in the fund with those of other funds. All mutual fund shareholder reports will provide this information to help you make this comparison. Please note that you cannot use this information to estimate your actual ending account balance and expenses paid during the period.
| | | | | | | | |
Expenses and Value of a $1,000 Investment |
assuming a hypothetical 5% annualized return for the six months ended December 31, 2018 |
| | | | Initial Shares | Service Shares |
Expenses paid per $1,000† | | | $6.36 | | $7.63 |
Ending value (after expenses) | | | $1,018.90 | | $1,017.64 |
† Expenses are equal to the fund’s annualized expense ratio of 1.25% for Initial shares and 1.50% for Service shares, multiplied by the average account value over the period, multiplied by 184/365 (to reflect the one-half year period).
8
STATEMENT OF INVESTMENTS
December 31, 2018
| | | | | | | | |
| |
Description | | | | Shares | | Value ($) | |
Common Stocks - 95.7% | | | | | |
China - .8% | | | | | |
Baidu, ADR | | | | 1,359 | a | 215,537 | |
France - 10.1% | | | | | |
AXA | | | | 13,540 | | 291,728 | |
BNP Paribas | | | | 6,249 | | 281,444 | |
L'Oreal | | | | 2,910 | | 667,997 | |
Thales | | | | 4,362 | | 507,416 | |
Total | | | | 11,993 | | 633,567 | |
Vivendi | | | | 20,542 | | 499,116 | |
| | | | | 2,881,268 | |
Georgia - .3% | | | | | |
TBC Bank Group | | | | 5,005 | | 96,659 | |
Germany - 8.7% | | | | | |
Deutsche Post | | | | 11,921 | | 326,503 | |
Deutsche Wohnen-BR | | | | 9,721 | | 445,578 | |
Hella KGaA Hueck & Co. | | | | 8,088 | | 322,278 | |
Infineon Technologies | | | | 16,161 | | 321,583 | |
LEG Immobilien | | | | 4,738 | | 494,719 | |
SAP | | | | 5,759 | | 573,652 | |
| | | | | 2,484,313 | |
Hong Kong - 3.5% | | | | | |
AIA Group | | | | 106,000 | | 871,983 | |
Man Wah Holdings | | | | 322,800 | | 129,311 | |
| | | | | 1,001,294 | |
Ireland - 1.1% | | | | | |
AIB Group | | | | 71,818 | | 301,898 | |
Japan - 28.7% | | | | | |
Don Quijote Holdings Co. | | | | 12,100 | | 750,637 | |
Ebara | | | | 19,800 | | 440,621 | |
FANUC | | | | 1,300 | | 195,439 | |
Invincible Investment | | | | 1,126 | | 464,795 | |
Japan Airlines | | | | 10,336 | | 366,092 | |
Japan Tobacco | | | | 11,800 | | 279,954 | |
M3 | | | | 14,800 | | 200,551 | |
Macromill | | | | 13,600 | | 175,366 | |
Mitsubishi UFJ Financial Group | | | | 80,100 | | 394,984 | |
Recruit Holdings Co. | | | | 10,505 | | 251,498 | |
Seven & i Holdings | | | | 12,000 | | 522,509 | |
SoftBank Group | | | | 4,600 | | 303,208 | |
Sony | | | | 16,000 | | 770,510 | |
Sugi Holdings Co. | | | | 11,700 | | 462,362 | |
Suntory Beverage & Food | | | | 8,700 | | 392,679 | |
9
STATEMENT OF INVESTMENTS (continued)
| | | | | | | | |
| |
Description | | | | Shares | | Value ($) | |
Common Stocks - 95.7% (continued) | | | | | |
Japan - 28.7% (continued) | | | | | |
Suzuki Motor | | | | 12,000 | | 607,206 | |
TechnoPro Holdings | | | | 21,300 | | 870,046 | |
Topcon | | | | 26,400 | | 346,376 | |
Yokogawa Electric | | | | 20,800 | | 356,776 | |
| | | | | 8,151,609 | |
Netherlands - 7.1% | | | | | |
Royal Dutch Shell, Cl. B | | | | 34,724 | | 1,033,274 | |
Wolters Kluwer | | | | 16,562 | | 978,041 | |
| | | | | 2,011,315 | |
Norway - 1.1% | | | | | |
DNB | | | | 19,376 | | 310,790 | |
Portugal - .8% | | | | | |
Galp Energia | | | | 15,112 | | 239,302 | |
South Korea - 2.0% | | | | | |
Samsung SDI | | | | 2,877 | | 560,922 | |
Switzerland - 12.3% | | | | | |
ABB | | | | 14,956 | | 285,145 | |
Credit Suisse Group | | | | 25,646 | a | 282,623 | |
Ferguson | | | | 7,461 | | 477,847 | |
Novartis | | | | 11,139 | | 954,037 | |
Roche Holding | | | | 3,434 | | 849,140 | |
Zurich Insurance Group | | | | 2,146 | | 641,203 | |
| | | | | 3,489,995 | |
United Kingdom - 19.2% | | | | | |
Anglo American | | | | 19,106 | | 422,358 | |
Associated British Foods | | | | 14,801 | | 384,943 | |
Barclays | | | | 343,297 | | 658,520 | |
Diageo | | | | 16,809 | | 597,451 | |
GlaxoSmithKline | | | | 45,900 | | 871,166 | |
Informa | | | | 22,834 | | 183,099 | |
Prudential | | | | 29,162 | | 521,039 | |
RELX | | | | 16,591 | a | 341,548 | |
Royal Bank of Scotland Group | | | | 111,066 | | 305,384 | |
Unilever | | | | 16,837 | | 914,838 | |
Vodafone Group | | | | 141,835 | | 275,604 | |
| | | | | 5,475,950 | |
Total Common Stocks(cost $29,116,564) | | | | 27,220,852 | |
| | | Preferred Dividend
Yield (%) | | | | | |
Preferred Stocks - 1.8% | | | | | |
Germany - 1.8% | | | | | |
Volkswagen
(cost $506,635) | | 2.72 | | 3,186 | | 506,999 | |
10
| | | | | | | | |
| |
Description | | 1-Day
Yield (%) | | Shares | | Value ($) | |
Investment Companies - 1.1% | | | | | |
Registered Investment Companies - 1.1% | | | | | |
Dreyfus Institutional Preferred Government Plus Money Market Fund
(cost $313,118) | | 2.32 | | 313,118 | b | 313,118 | |
Total Investments(cost $29,936,317) | | 98.6% | | 28,040,969 | |
Cash and Receivables (Net) | | 1.4% | | 412,375 | |
Net Assets | | 100.0% | | 28,453,344 | |
ADR—American Depository Receipt
BR—Bearer Certificate
a Non-income producing security.
b Investment in affiliated issuer. The investment objective of this investment company is publicly available and can be found within the investment company’s prospectus.
| | |
Portfolio Summary (Unaudited)† | Value (%) |
Pharmaceuticals Biotechnology & Life Sciences | 9.4 |
Commercial & Professional Services | 8.6 |
Banks | 8.3 |
Insurance | 8.2 |
Capital Goods | 6.7 |
Energy | 6.7 |
Food, Beverage & Tobacco | 5.8 |
Household & Personal Products | 5.6 |
Automobiles & Components | 5.1 |
Real Estate | 4.9 |
Technology Hardware & Equipment | 4.4 |
Media & Entertainment | 3.8 |
Food & Staples Retailing | 3.5 |
Consumer Durables & Apparel | 3.2 |
Retailing | 2.6 |
Transportation | 2.4 |
Telecommunication Services | 2.0 |
Software & Services | 2.0 |
Materials | 1.5 |
Semiconductors & Semiconductor Equipment | 1.1 |
Investment Companies | 1.1 |
Diversified Financials | 1.0 |
Health Care Equipment & Services | .7 |
| | 98.6 |
† Based on net assets.
See notes to financial statements.
11
STATEMENT OF INVESTMENTS IN AFFILIATED ISSUERS
| | | | | | | |
Registered Investment Company | Value
12/31/17($) | Purchases($) | Sales($) | Value
12/31/18($) | Net
Assets(%) | Dividends/
Distributions($) |
Dreyfus Institutional Preferred Government Plus Money Market Fund | 161,206 | 8,527,384 | 8,375,472 | 313,118 | 1.1 | 8,394 |
See notes to financial statements.
12
STATEMENT OF FORWARD FOREIGN CURRENCY EXCHANGE CONTRACTSDecember 31, 2018
| | | | | | |
Counterparty/ Purchased
Currency | Purchased Currency
Amounts | Currency
Sold | Sold
Currency
Amounts | Settlement Date | Unrealized Appreciation (Depreciation)($) |
Citigroup | | | |
United States Dollar | 1,527,292 | British Pound | 1,187,000 | 2/14/19 | 10,924 |
RBS Securities | | | |
United States Dollar | 322 | Euro | 281 | 1/2/19 | - |
United States Dollar | 1,433 | British Pound | 1,125 | 1/2/19 | (1) |
United States Dollar | 325,353 | Japanese Yen | 35,912,806 | 1/7/19 | (2,515) |
State Street Bank and Trust Company | | | |
Japanese Yen | 188,505,000 | United States Dollar | 1,675,049 | 1/16/19 | 47,091 |
United States Dollar | 1,676,770 | Japanese Yen | 188,505,000 | 1/16/19 | (45,370) |
Gross Unrealized Appreciation | | | 58,015 |
Gross Unrealized Depreciation | | | (47,886) |
See notes to financial statements.
13
STATEMENT OF ASSETS AND LIABILITIES
December 31, 2018
| | | | | | | |
| | | | | | |
| | | Cost | | Value | |
Assets ($): | | | | |
Investments in securities—See Statement of Investments: | | | |
Unaffiliated issuers | 29,623,199 | | 27,727,851 | |
Affiliated issuers | | 313,118 | | 313,118 | |
Cash denominated in foreign currency | | | 1,591 | | 1,538 | |
Receivable for investment securities sold | | 329,833 | |
Tax reclaim receivable | | 108,807 | |
Dividends receivable | | 82,108 | |
Unrealized appreciation on forward foreign
currency exchange contracts—Note 4 | | 58,015 | |
Receivable for shares of Beneficial Interest subscribed | | 5,773 | |
Unrealized appreciation on foreign currency transactions | | 1,522 | |
Prepaid expenses | | | | | 1,668 | |
| | | | | 28,630,233 | |
Liabilities ($): | | | | |
Due to The Dreyfus Corporation and affiliates—Note 3(b) | | | | 34,907 | |
Unrealized depreciation on forward foreign
currency exchange contracts—Note 4 | | 47,886 | |
Payable for shares of Beneficial Interest redeemed | | 13,307 | |
Trustees fees and expenses payable | | 194 | |
Accrued expenses | | | | | 80,595 | |
| | | | | 176,889 | |
Net Assets ($) | | | 28,453,344 | |
Composition of Net Assets ($): | | | | |
Paid-in capital | | | | | 27,555,610 | |
Total distributable earnings (loss) | | | | | 897,734 | |
Net Assets ($) | | | 28,453,344 | |
| | | | |
Net Asset Value Per Share | Initial Shares | Service Shares | |
Net Assets ($) | 22,895,789 | 5,557,555 | |
Shares Outstanding | 1,295,637 | 314,854 | |
Net Asset Value Per Share ($) | 17.67 | 17.65 | |
| | | | |
See notes to financial statements. | | | |
14
STATEMENT OF OPERATIONS
Year Ended December 31, 2018
| | | | | | | |
| | | | | | |
| | | | | | |
Investment Income ($): | | | | |
Income: | | | | |
Cash dividends (net of $82,719 foreign taxes withheld at source): | |
Unaffiliated issuers | | | 839,829 | |
Affiliated issuers | | | 8,394 | |
Total Income | | | 848,223 | |
Expenses: | | | | |
Investment advisory fee—Note 3(a) | | | 256,388 | |
Professional fees | | | 112,853 | |
Prospectus and shareholders’ reports | | | 27,011 | |
Distribution fees—Note 3(b) | | | 17,360 | |
Custodian fees—Note 3(b) | | | 16,487 | |
Trustees’ fees and expenses—Note 3(c) | | | 2,706 | |
Loan commitment fees—Note 2 | | | 838 | |
Shareholder servicing costs—Note 3(b) | | | 202 | |
Miscellaneous | | | 31,981 | |
Total Expenses | | | 465,826 | |
Investment Income—Net | | | 382,397 | |
Realized and Unrealized Gain (Loss) on Investments—Note 4 ($): | | |
Net realized gain (loss) on investments and foreign currency transactions | 2,521,569 | |
Net realized gain (loss) on forward foreign currency exchange contracts | (31,199) | |
Net Realized Gain (Loss) | | | 2,490,370 | |
Net unrealized appreciation (depreciation) on investments
and foreign currency transactions | | | (8,327,016) | |
Net unrealized appreciation (depreciation) on
forward foreign currency exchange contracts | | | 9,323 | |
Net Unrealized Appreciation (Depreciation) | | | (8,317,693) | |
Net Realized and Unrealized Gain (Loss) on Investments | | | (5,827,323) | |
Net Increase from Payment by Affiliate | | | 198 | |
Net (Decrease) in Net Assets Resulting from Operations | | (5,444,728) | |
| | | | | | | |
See notes to financial statements. | | | | | |
15
STATEMENT OF CHANGES IN NET ASSETS
| | | | | | | | | | |
| | | | Year Ended December 31, |
| | | | 2018 | | 2017 | a |
Operations ($): | | | | | | | | |
Investment income—net | | | 382,397 | | | | 318,330 | |
Net realized gain (loss) on investments | | 2,490,370 | | | | 1,682,229 | |
Net unrealized appreciation (depreciation)
on investments | | (8,317,693) | | | | 6,290,600 | |
Net increase from payment by affiliate | | 198 | | | | 4,470 | |
Net Increase (Decrease) in Net Assets
Resulting from Operations | (5,444,728) | | | | 8,295,629 | |
Distributions ($): | |
Distributions to shareholders: | | | | | | | | |
Initial Shares | | | (343,225) | | | | (280,462) | |
Service Shares | | | (73,009) | | | | (61,227) | |
Total Distributions | | | (416,234) | | | | (341,689) | |
Beneficial Interest Transactions ($): | |
Net proceeds from shares sold: | | | | | | | | |
Initial Shares | | | 2,198,806 | | | | 1,710,528 | |
Service Shares | | | 531,637 | | | | 579,595 | |
Distributions reinvested: | | | | | | | | |
Initial Shares | | | 343,225 | | | | 280,462 | |
Service Shares | | | 73,009 | | | | 61,227 | |
Cost of shares redeemed: | | | | | | | | |
Initial Shares | | | (3,974,146) | | | | (3,712,719) | |
Service Shares | | | (1,654,823) | | | | (2,104,373) | |
Increase (Decrease) in Net Assets
from Beneficial Interest Transactions | (2,482,292) | | | | (3,185,280) | |
Total Increase (Decrease) in Net Assets | (8,343,254) | | | | 4,768,660 | |
Net Assets ($): | |
Beginning of Period | | | 36,796,598 | | | | 32,027,938 | |
End of Period | | | 28,453,344 | | | | 36,796,598 | |
Capital Share Transactions (Shares): | |
Initial Shares | | | | | | | | |
Shares sold | | | 107,479 | | | | 89,932 | |
Shares issued for distributions reinvested | | | 16,383 | | | | 15,783 | |
Shares redeemed | | | (196,958) | | | | (195,697) | |
Net Increase (Decrease) in Shares Outstanding | (73,096) | | | | (89,982) | |
Service Shares | | | | | | | | |
Shares sold | | | 25,709 | | | | 30,986 | |
Shares issued for distributions reinvested | | | 3,481 | | | | 3,442 | |
Shares redeemed | | | (80,525) | | | | (111,339) | |
Net Increase (Decrease) in Shares Outstanding | (51,335) | | | | (76,911) | |
| | | | | | | | | | |
aDistributions to shareholders include only distributions from net investment income. Undistributed investment income-net was $325,291 in 2017 and is no longer presented as a result of the adoption of SEC’s Disclosure Update and Simplification Rule. | |
See notes to financial statements. | | | | | | | | |
16
FINANCIAL HIGHLIGHTS
The following tables describe the performance for each share class for the fiscal periods indicated. All information (except portfolio turnover rate) reflects financial results for a single fund share. Total return shows how much your investment in the fund would have increased (or decreased) during each period, assuming you had reinvested all dividends and distributions. The fund’s total returns do not reflect expenses associated with variable annuity or insurance contracts. These figures have been derived from the fund’s financial statements.
| | | | | | | |
| | | |
| | | Year Ended December 31, |
Initial Shares | | 2018 | 2017 | 2016 | 2015 | 2014 |
Per Share Data ($): | | | | | | |
Net asset value, beginning of period | | 21.21 | 16.85 | 18.00 | 18.35 | 19.28 |
Investment Operations: | | | | | | |
Investment income—neta | | .24 | .19 | .22 | .21 | .46 |
Net realized and unrealized
gain (loss) on investments | | (3.52) | 4.37 | (1.23) | .07 | (.96) |
Total from Investment Operations | | (3.28) | 4.56 | (1.01) | .28 | (.50) |
Distributions: | | | | | | |
Dividends from
investment income—net | | (.26) | (.20) | (.16) | (.63) | (.43) |
Payment by affiliate | | .00b,c | .00b,c | .02c | - | - |
Net asset value, end of period | | 17.67 | 21.21 | 16.85 | 18.00 | 18.35 |
Total Return (%) | | (15.72) | 27.32c | (5.54)c | 1.38 | (2.65) |
Ratios/Supplemental Data (%): | | | | | | |
Ratio of total expenses
to average net assets | | 1.31 | 1.14 | 1.17 | 1.14 | 1.08 |
Ratio of net expenses
to average net assets | | 1.31 | 1.14 | 1.17 | 1.14 | 1.08 |
Ratio of net investment income
to average net assets | | 1.17 | .97 | 1.28 | 1.13 | 2.44 |
Portfolio Turnover Rate | | 35.83 | 28.36 | 36.91 | 32.28 | 44.96 |
Net Assets, end of period ($ x 1,000) | | 22,896 | 29,037 | 24,574 | 28,330 | 29,731 |
a Based on average shares outstanding.
b Amount represents less than $.01 per share.
c In 2018, 2017 and 2016, the fund received proceeds from a class action settlement from The Bank of New York Mellon Corporation. In 2018 and 2017, this payment had no impact on total return. In 2016, the total return would have been (5.65%) had payment not been made by The Bank of New York Mellon Corporation.
See notes to financial statements.
17
FINANCIAL HIGHLIGHTS (continued)
| | | | | | | |
| | | |
| | | Year Ended December 31, |
Service Shares | | 2018 | 2017 | 2016 | 2015 | 2014 |
Per Share Data ($): | | | | | | |
Net asset value, beginning of period | | 21.19 | 16.82 | 17.97 | 18.31 | 19.24 |
Investment Operations: | | | | | | |
Investment income—neta | | .19 | .14 | .18 | .17 | .42 |
Net realized and unrealized
gain (loss) on investments | | (3.53) | 4.38 | (1.24) | .07 | (.97) |
Total from Investment Operations | | (3.34) | 4.52 | (1.06) | .24 | (.55) |
Distributions: | | | | | | |
Dividends from
investment income—net | | (.20) | (.15) | (.11) | (.58) | (.38) |
Payment by affiliate | | .00b,c | .00b,c | .02c | - | - |
Net asset value, end of period | | 17.65 | 21.19 | 16.82 | 17.97 | 18.31 |
Total Return (%) | | (15.91) | 27.02c | (5.83)c | 1.17 | (2.90) |
Ratios/Supplemental Data (%): | | | | | | |
Ratio of total expenses
to average net assets | | 1.56 | 1.39 | 1.42 | 1.39 | 1.33 |
Ratio of net expenses
to average net assets | | 1.56 | 1.39 | 1.42 | 1.39 | 1.33 |
Ratio of net investment income
to average net assets | | .94 | .73 | 1.05 | .90 | 2.22 |
Portfolio Turnover Rate | | 35.83 | 28.36 | 36.91 | 32.28 | 44.96 |
Net Assets, end of period ($ x 1,000) | | 5,558 | 7,760 | 7,454 | 9,389 | 10,022 |
a Based on average shares outstanding.
b Amount represents less than $.01 per share.
c In 2018, 2017 and 2016, the fund received proceeds from a class action settlement from The Bank of New York Mellon Corporation. In 2018 and 2017, this payment had no impact on total return. In 2016, the total return would have been (5.94%) had payment not been made by The Bank of New York Mellon Corporation.
See notes to financial statements.
18
NOTES TO FINANCIAL STATEMENTS
NOTE 1—Significant Accounting Policies:
International Equity Portfolio (the “fund”) is a separate non-diversified series of Dreyfus Variable Investment Fund (the “Company”), which is registered under the Investment Company Act of 1940, as amended (the “Act”), as an open-end management investment company and operates as a series company currently offering seven series, including the fund. The fund is only offered to separate accounts established by insurance companies to fund variable annuity contracts and variable life insurance policies. The fund’s investment objective is to seek capital growth. The Dreyfus Corporation (the “Manager” or “Dreyfus”), a wholly-owned subsidiary of The Bank of New York Mellon Corporation (“BNY Mellon”), serves as the fund’s investment adviser. Newton Investment Management (North America) Limited (“Newton”), a wholly-owned subsidiary of BNY Mellon and an affiliate of Dreyfus, serves as the fund’s sub-investment adviser.
MBSC Securities Corporation (the “Distributor”), a wholly-owned subsidiary of Dreyfus, is the distributor of the fund’s shares, which are sold without a sales charge. The fund is authorized to issue an unlimited number of $.001 par value shares of Beneficial Interest in each of the following classes of shares: Initial and Service. Each class of shares has identical rights and privileges, except with respect to the Distribution Plan, and the expenses borne by each class, the allocation of certain transfer agency costs and certain voting rights. Income, expenses (other than expenses attributable to a specific class), and realized and unrealized gains or losses on investments are allocated to each class of shares based on its relative net assets.
The Company accounts separately for the assets, liabilities and operations of each series. Expenses directly attributable to each series are charged to that series’ operations; expenses which are applicable to all series are allocated among them on a pro rata basis.
The Financial Accounting Standards Board (“FASB”) Accounting Standards Codification (“ASC”) is the exclusive reference of authoritative U.S. generally accepted accounting principles (“GAAP”) recognized by the FASB to be applied by nongovernmental entities. Rules and interpretive releases of the Securities and Exchange Commission (“SEC”) under authority of federal laws are also sources of authoritative GAAP for SEC registrants. The fund’s financial statements are prepared in accordance with GAAP, which may require the use of management estimates and assumptions. Actual results could differ from those estimates.
19
NOTES TO FINANCIAL STATEMENTS(continued)
The Companyenters into contracts that contain a variety of indemnifications. The fund’s maximum exposure under these arrangements is unknown. The fund does not anticipate recognizing any loss related to these arrangements.
(a) Portfolio valuation: The fair value of a financial instrument is the amount that would be received to sell an asset or paid to transfer a liability in an orderly transaction between market participants at the measurement date (i.e., the exit price). GAAP establishes a fair value hierarchy that prioritizes the inputs of valuation techniques used to measure fair value. This hierarchy gives the highest priority to unadjusted quoted prices in active markets for identical assets or liabilities (Level 1 measurements) and the lowest priority to unobservable inputs (Level 3 measurements).
Additionally, GAAP provides guidance on determining whether the volume and activity in a market has decreased significantly and whether such a decrease in activity results in transactions that are not orderly. GAAP requires enhanced disclosures around valuation inputs and techniques used during annual and interim periods.
Various inputs are used in determining the value of the fund’s investments relating to fair value measurements. These inputs are summarized in the three broad levels listed below:
Level 1—unadjusted quoted prices in active markets for identical investments.
Level 2—other significant observable inputs (including quoted prices for similar investments, interest rates, prepayment speeds, credit risk, etc.).
Level 3—significant unobservable inputs (including the fund’s own assumptions in determining the fair value of investments).
The inputs or methodology used for valuing securities are not necessarily an indication of the risk associated with investing in those securities.
Changes in valuation techniques may result in transfers in or out of an assigned level within the disclosure hierarchy. Valuation techniques used to value the fund’s investments are as follows:
Investments in securities are valued at the last sales price on the securities exchange or national securities market on which such securities are primarily traded. Securities listed on the National Market System for which market quotations are available are valued at the official closing price or, if there is no official closing price that day, at the last sales price. For open short positions, asked prices are used for valuation purposes. Bid price is
20
used when no asked price is available. Registered investment companies that are not traded on an exchange are valued at their net asset value. All of the preceding securities are generally categorized within Level 1 of the fair value hierarchy.
Securities not listed on an exchange or the national securities market, or securities for which there were no transactions, are valued at the average of the most recent bid and asked prices. These securities are generally categorized within Level 2 of the fair value hierarchy.
Fair valuing of securities may be determined with the assistance of a pricing service using calculations based on indices of domestic securities and other appropriate indicators, such as prices of relevant ADRs and futures. Utilizing these techniques may result in transfers between Level 1 and Level 2 of the fair value hierarchy.
When market quotations or official closing prices are not readily available, or are determined not to accurately reflect fair value, such as when the value of a security has been significantly affected by events after the close of the exchange or market on which the security is principally traded (for example, a foreign exchange or market), but before the fund calculates its net asset value, the fund may value these investments at fair value as determined in accordance with the procedures approved by the Company’s Board of Trustees (the “Board”). Certain factors may be considered when fair valuing investments such as: fundamental analytical data, the nature and duration of restrictions on disposition, an evaluation of the forces that influence the market in which the securities are purchased and sold, and public trading in similar securities of the issuer or comparable issuers. These securities are either categorized within Level 2 or 3 of the fair value hierarchy depending on the relevant inputs used.
For restricted securities where observable inputs are limited, assumptions about market activity and risk are used and such securities are generally categorized within Level 3 of the fair value hierarchy.
Investments denominated in foreign currencies are translated to U.S. dollars at the prevailing rates of exchange.
Forward foreign currency exchange contracts (“forward contracts”) are valued at the forward rate and are generally categorized within Level 2 of the fair value hierarchy.
The following is a summary of the inputs used as of December 31, 2018in valuing the fund’s investments:
21
NOTES TO FINANCIAL STATEMENTS(continued)
| | | | | |
| | Level 1- Unadjusted Quoted Prices | Level 2 - Other Significant Observable Inputs | Level 3- Significant Unobservable Inputs | Total |
Assets ($) |
Investments in Securities: |
Equity Securities - Common Stocks | 215,537 | 27,005,315† | - | 27,220,852 |
Equity Securities - Preferred Stocks | - | 506,999† | - | 506,999 |
Investment Company | 313,118 | - | - | 313,118 |
Other Financial Instruments: | | | | |
Forward Foreign Currency Exchange Contracts†† | - | 58,015 | - | 58,015 |
Liabilities ($) |
Other Financial Instruments: |
Forward Foreign Currency Exchange Contracts†† | - | (47,886) | - | (47,886) |
† Securities classified within Level 2 at period end as the values were determined pursuant to the fund’s fair valuation procedures.
†† Amount shown represents unrealized appreciation (depreciation) at period end.
At December 31, 2018, there were no transfers between levels of the fair value hierarchy. It is the fund’s policy to recognize transfers between levels at the end of the reporting period.
(b) Foreign currency transactions: The fund does not isolate that portion of the results of operations resulting from changes in foreign exchange rates on investments from the fluctuations arising from changes in the market prices of securities held. Such fluctuations are included with the net realized and unrealized gain or loss on investments.
Net realized foreign exchange gains or losses arise from sales of foreign currencies, currency gains or losses realized on securities transactions between trade and settlement date, and the difference between the amounts of dividends, interest and foreign withholding taxes recorded on the fund’s books and the U.S. dollar equivalent of the amounts actually received or paid. Net unrealized foreign exchange gains and losses arise from changes in the value of assets and liabilities other than investments resulting from changes in exchange rates. Foreign currency gains and losses on foreign currency transactions are also included with net realized and unrealized gain or loss on investments.
(c)Securities transactions and investment income: Securities transactions are recorded on a trade date basis. Realized gains and losses from securities transactions are recorded on the identified cost basis. Dividend income is recognized on the ex-dividend date and interest
22
income, including, where applicable, accretion of discount and amortization of premium on investments, is recognized on the accrual basis.
(d) Affiliated issuers: Investments in other investment companies advised by Dreyfus are considered “affiliated” under the Act.
(e) Risk: Investing in foreign markets may involve special risks and considerations not typically associated with investing in the U.S. These risks include revaluation of currencies, high rates of inflation, repatriation restrictions on income and capital, and adverse political and economic developments. Moreover, securities issued in these markets may be less liquid, subject to government ownership controls and delayed settlements, and their prices may be more volatile than those of comparable securities in the U.S.
(f) Dividends and distributions to shareholders: Dividends and distributions are recorded on the ex-dividend date. Dividends from investment income-net and dividends from net realized capital gains, if any, are normally declared and paid annually, but the fund may make distributions on a more frequent basis to comply with the distribution requirements of the Internal Revenue Code of 1986, as amended (the “Code”). To the extent that net realized capital gains can be offset by capital loss carryovers, it is the policy of the fund not to distribute such gains. Income and capital gain distributions are determined in accordance with income tax regulations, which may differ from GAAP.
(g) Federal income taxes: It is the policy of the fund to continue to qualify as a regulated investment company, if such qualification is in the best interests of its shareholders, by complying with the applicable provisions of the Code, and to make distributions of taxable income and net realized capital gain sufficient to relieve it from substantially all federal income and excise taxes.
As of and during the period ended December 31, 2018, the fund did not have any liabilities for any uncertain tax positions. The fund recognizes interest and penalties, if any, related to uncertain tax positions as income tax expense in the Statement of Operations. During the period ended December 31, 2018, the fund did not incur any interest or penalties.
Each tax year in the four-year period ended December 31, 2018 remains subject to examination by the Internal Revenue Service and state taxing authorities.
At December 31, 2018, the components of accumulated earnings on a tax basis were as follows: undistributed ordinary income $372,047,
23
NOTES TO FINANCIAL STATEMENTS(continued)
undistributed capital gains $2,463,936 and unrealized depreciation $1,938,249.
The tax character of distributions paid to shareholders during the fiscal periods ended December 31, 2018 and December 31, 2018 were as follows: ordinary income $416,234 and $341,689, respectively.
(h) New Accounting Pronouncements: In August 2018, the FASB issued Accounting Standards Update 2018-13, Fair Value Measurement (Topic 820): Disclosure Framework—Changes to the Disclosure Requirements for Fair Value Measurement (“ASU 2018-13”). The update provides guidance that eliminates, adds and modifies certain disclosure requirements for fair value measurements. ASU 2018-13 will be effective for annual periods beginning after December 15, 2019. Management is currently assessing the potential impact of these changes to future financial statements.
NOTE 2—Bank Lines of Credit:
The fund participates with other Dreyfus-managed long-term open-end funds in a $1.030 billion unsecured credit facility led by Citibank, N.A. (the “Citibank Credit Facility”) and a $300 million unsecured credit facility provided by The Bank of New York Mellon (the “BNYM Credit Facility”), a subsidiary of BNY Mellon and an affiliate of Dreyfus, each to be utilized primarily for temporary or emergency purposes, including the financing of redemptions (each, a “Facility”). The Citibank Credit Facility is available in two tranches: (i) Tranche A is in an amount equal to $830 million and is available to all long-term open-ended funds, including the fund, and (ii) Tranche B is in amount equal to $200 million and is available only to the Dreyfus Floating Rate Income Fund, a series of The Dreyfus/Laurel Funds, Inc. Prior to October 3, 2018, the unsecured credit facility with Citibank, N.A. was $830 million. In connection therewith, the fund has agreed to pay its pro rata portion of commitment fees for Tranche A of the Citibank Credit Facility and the BNYM Credit Facility. Interest is charged to the fund based on rates determined pursuant to the terms of the respective Facility at the time of borrowing. During the period ended December 31, 2018, the fund did not borrow under the Facilities.
NOTE 3—Investment Advisory Fee, Sub-Investment Advisory Fee and Other Transactions with Affiliates:
(a)Pursuant to an investment advisory agreement with Dreyfus, the investment advisory fee is computed at the annual rate of .75% of the value of the fund’s average daily net assets and is payable monthly.
24
Pursuant to a sub-investment advisory agreement between Dreyfus and Newton, the sub-investment advisory fee is payable monthly by Dreyfus, and is based upon the value of the fund’s average daily net assets, computed at the following rates:
Average Net Assets
0 up to $100 million ....................................... .35%
$100 million up to $1 billion .......................... .30%
$1 billion up to $1.5 billion ............................ .26%
In excess of $1.5 billion .................................. .20%
(b)Under the Distribution Plan adopted pursuant to Rule 12b-1 under the Act, Service shares pay the Distributor for distributing its shares, for servicing and/or maintaining Service shares’ shareholder accounts and for advertising and marketing for Service shares. The Distribution Plan provides for payments to be made at an annual rate of .25% of the value of the Service shares’ average daily net assets. The Distributor may make payments to Participating Insurance Companies and to brokers and dealers acting as principal underwriter for their variable insurance products. The fees payable under the Distribution Plan are payable without regard to actual expenses incurred. During the period ended December 31, 2018,Service shares were charged $17,360 pursuant to the Distribution Plan.
The fund has arrangements with the transfer agent and the custodian whereby the fund may receive earnings credits when positive cash balances are maintained, which are used to offset transfer agency and custody fees. For financial reporting purposes, the fund includes net earnings credits, if any, as an expense offset in the Statement of Operations.
The fund compensates Dreyfus Transfer, Inc., a wholly-owned subsidiary of Dreyfus, under a transfer agency agreement for providing transfer agency and cash management services for the fund. The majority of transfer agency fees are comprised of amounts paid on a per account basis, while cash management fees are related to fund subscriptions and redemptions. During the period ended December 31, 2018, the fund was charged $202 for transfer agency services. These fees are included in Shareholder servicing costs in the Statement of Operations.
The fund compensates The Bank of New York Mellon under a custody agreement for providing custodial services for the fund. These fees are determined based on net assets, geographic region and transaction activity. During the period ended December 31, 2018, the fund was charged $16,487 pursuant to the custody agreement.
25
NOTES TO FINANCIAL STATEMENTS(continued)
During the period ended December 31, 2018, the fund was charged $12,774 for services performed by the Chief Compliance Officer and his staff. These fees are included in Miscellaneous in the Statement of Operations.
The components of “Due to The Dreyfus Corporation and affiliates” in the Statement of Assets and Liabilities consist of: investment advisory fees $18,581, Distribution Plan fees $1,198, custodian fees $8,800, Chief Compliance Officer fees $6,289 and transfer agency fees $39.
(c) Each Board member also serves as a Board member of other funds within the Dreyfus complex. Annual retainer fees and attendance fees are allocated to each fund based on net assets.
(d) During the period ended December 31, 2018, the fund received proceeds of $198 from a class action settlement from BNY Mellon related to foreign exchange transactions.
NOTE 4—Securities Transactions:
The aggregate amount of purchases and sales of investment securities, excluding short-term securities and forward contracts, during the period ended December 31, 2018, amounted to $12,025,921 and $15,011,641, respectively.
Derivatives: A derivative is a financial instrument whose performance is derived from the performance of another asset. The fund enters into International Swaps and Derivatives Association, Inc. Master Agreements or similar agreements (collectively, “Master Agreements”) with its over-the counter (“OTC”) derivative contract counterparties in order to, among other things, reduce its credit risk to counterparties. Master Agreements include provisions for general obligations, representations, collateral and events of default or termination. Under a Master Agreement, the fund may offset with the counterparty certain derivative financial instrument’s payables and/or receivables with collateral held and/or posted and create one single net payment in the event of default or termination.
Each type of derivative instrument that was held by the fund during the period ended December 31, 2018 is discussed below.
Forward Foreign Currency Exchange Contracts: The fund enters into forward contracts in order to hedge its exposure to changes in foreign currency exchange rates on its foreign portfolio holdings, to settle foreign currency transactions or as a part of its investment strategy. When executing forward contracts, the fund is obligated to buy or sell a foreign currency at a specified rate on a certain date in the future. With respect to sales of forward contracts, the fund incurs a loss if the value of the
26
contract increases between the date the forward contract is opened and the date the forward contract is closed. The fund realizes a gain if the value of the contract decreases between those dates. With respect to purchases of forward contracts, the fund incurs a loss if the value of the contract decreases between the date the forward contract is opened and the date the forward contract is closed. The fund realizes a gain if the value of the contract increases between those dates. Any realized or unrealized gains or losses which occurred during the period are reflected in the Statement of Operations. The fund is exposed to foreign currency risk as a result of changes in value of underlying financial instruments. The fund is also exposed to credit risk associated with counterparty nonperformance on these forward contracts, which is generally limited to the unrealized gain on each open contract. This risk may be mitigated by Master Agreements, if any, between the fund and the counterparty and the posting of collateral, if any, by the counterparty to the fund to cover the fund’s exposure to the counterparty. Forward contracts open at December 31, 2018 are set forth in the Statement of Forward Foreign Currency Exchange Contracts.
The provisions of ASC Topic 210 “Disclosures about Offsetting Assets and Liabilities” require disclosure on the offsetting of financial assets and liabilities. These disclosures are required for certain investments, including derivative financial instruments subject to Master Agreements which are eligible for offsetting in the Statement of Assets and Liabilities and require the fund to disclose both gross and net information with respect to such investments. For financial reporting purposes, the fund does not offset derivative assets and derivative liabilities that are subject to Master Agreements in the Statement of Assets and Liabilities.
At December 31, 2018, derivative assets and liabilities (by type) on a gross basis are as follows:
| | | | | | |
Derivative Financial Instruments: | | Assets ($) | | Liabilities ($) | |
Forward contracts | | 58,015 | | (47,886) | |
Total gross amount of derivative | | | | | |
assets and liabilities in the | | | | | |
Statement of Assets and Liabilities | | 58,015 | | (47,886) | |
Derivatives not subject to | | | | | |
Master Agreements | | - | | - | |
Total gross amount of assets | | | | | |
and liabilities subject to | | | | | |
Master Agreements | | 58,015 | | (47,886) | |
27
NOTES TO FINANCIAL STATEMENTS(continued)
The following tables present derivative assets and liabilities net of amounts available for offsetting under Master Agreements and net of related collateral received or pledged, if any, as of December 31, 2018:
| | | | | | | |
| | | | Financial | | | |
| | | | Instruments | | | |
| | | | and Derivatives | | | |
| | Gross Amount of | | Available | Collateral | | Net Amount of |
Counterparty | Assets ($) | 1 | for Offset ($) | Received ($) | | Assets ($) |
Citigroup | 10,924 | | - | - | | 10,924 |
State Street Bank
and Trust Company | 47,091 | | (45,370) | - | | 1,721 |
Total | 58,015 | | (45,370) | - | | 12,645 |
| | | | | | | |
| | | | Financial | | | |
| | | | Instruments | | | |
| | | | and Derivatives | | | |
| | Gross Amount of | | Available | Collateral | | Net Amount of |
Counterparty | Liabilities ($) | 1 | for Offset ($) | Pledged ($) | | Liabilities ($) |
RBS Securities | (2,516) | | - | - | | (2,516) |
State Street Bank
and Trust Company | (45,370) | | 45,370 | - | | - |
Total | (47,886) | | 45,370 | - | | (2,516) |
| | | | | | | |
1 Absent a default event or early termination, OTC derivative assets and liabilities are presented at gross amounts and are not offset in the Statement of Assets and Liabilities. |
The following summarizes the average market value of derivatives outstanding duringthe period ended December 31, 2018:
| | | |
| | Average Market Value ($) |
Forward contracts | | 3,818,439 |
| | | |
At December 31, 2018, the cost of investments for federal income tax purposes was $29,980,686; accordingly, accumulated net unrealized depreciation on investments was $1,939,718, consisting of $2,445,124 gross unrealized appreciation and $4,384,842 gross unrealized depreciation.
28
REPORT OF INDEPENDENT REGISTERED PUBLIC ACCOUNTING FIRM
To the Shareholders and the Board of Trustees of International Equity Portfolio
Opinion on the Financial Statements
We have audited the accompanying statement of assets and liabilities of International Equity Portfolio (the “Fund”) (one of the funds constituting Dreyfus Variable Investment Fund), including the statements of investments, investments in affiliated issuers and forward foreign currency exchange contracts, as of December 31, 2018, and the related statement of operations for the year then ended, the statements of changes in net assets for each of the two years in the period then ended, the financial highlights for each of the five years in the period then ended and the related notes (collectively referred to as the “financial statements”). In our opinion, the financial statements present fairly, in all material respects, the financial position of the Fund (one of the funds constituting Dreyfus Variable Investment Fund) at December 31, 2018, the results of its operations for the year then ended, the changes in its net assets for each of the two years in the period then ended and its financial highlights for each of the five years in the period then ended, in conformity with U.S. generally accepted accounting principles.
Basis for Opinion
These financial statements are the responsibility of the Fund’s management. Our responsibility is to express an opinion on the Fund’s financial statements based on our audits. We are a public accounting firm registered with the Public Company Accounting Oversight Board (United States) (“PCAOB”) and are required to be independent with respect to the Fund in accordance with the U.S. federal securities laws and the applicable rules and regulations of the Securities and Exchange Commission and the PCAOB.
We conducted our audits in accordance with the standards of the PCAOB. Those standards require that we plan and perform the audit to obtain reasonable assurance about whether the financial statements are free of material misstatement, whether due to error or fraud. The Fund is not required to have, nor were we engaged to perform, an audit of the Fund’s internal control over financial reporting. As part of our audits, we are required to obtain an understanding of internal control over financial reporting, but not for the purpose of expressing an opinion on the effectiveness of the Fund’s internal control over financial reporting. Accordingly, we express no such opinion.
Our audits included performing procedures to assess the risks of material misstatement of the financial statements, whether due to error or fraud, and performing procedures that respond to those risks. Such procedures included examining, on a test basis, evidence regarding the amounts and disclosures in the financial statements. Our procedures included confirmation of securities owned as of December 31, 2018, by correspondence with the custodian and others or by other appropriate auditing procedures where replies from others were not received. Our audits also included evaluating the accounting principles used and significant estimates made by management, as well as evaluating the overall presentation of the financial statements. We believe that our audits provide a reasonable basis for our opinion.

We have served as the auditor of one or more Dreyfus investment companies since at least 1957, but we are unable to determine the specific year.
New York, New York
February 11, 2019
29
IMPORTANT TAX INFORMATION(Unaudited)
In accordance with federal tax law, the fund elects to provide each shareholder with their portion of the fund’s foreign taxes paid and the income sourced from foreign countries. Accordingly, the fund hereby reports the following information regarding its fiscal year ended December 31, 2018:
- the total amount of taxes paid to foreign countries was $79,986.
- the total amount of income sourced from foreign countries was $922,707.
Where required by federal tax law rules, shareholders will receive notification of their proportionate share of foreign taxes paid and foreign sourced income for the 2018 calendar year with Form 1099-DIV which will be mailed in early 2019.
30
BOARD MEMBERS INFORMATION(Unaudited)
INDEPENDENT BOARD MEMBERS
Joseph S. DiMartino (75)
Chairman of the Board (1995)
Principal Occupation During Past 5 Years:
· Corporate Director and Trustee (1995-present)
Other Public Company Board Memberships During Past 5 Years:
· CBIZ (formerly, Century Business Services, Inc.), a provider of outsourcing functions for small and medium size companies, Director (1997-present)
No. of Portfolios for which Board Member Serves:122
———————
Peggy C. Davis (75)
Board Member (2006)
Principal Occupation During Past 5 Years:
· Shad Professor of Law, New York University School of Law (1983-present)
No. of Portfolios for which Board Member Serves: 45
———————
David P. Feldman (79)
Board Member (1994)
Principal Occupation During Past 5 Years:
· Corporate Director and Trustee (1985-present)
Other Public Company Board Memberships During Past 5 Years:
· BBH Mutual Funds Group (5 registered mutual funds), Director (1992-2014)
No. of Portfolios for which Board Member Serves:31
———————
Joan Gulley (71)
Board Member (2017)
Principal Occupation During Past 5 Years:
· PNC Financial Services Group, Inc.(1993-2014), Executive Vice President and Chief Human Resources Officer and Executive Committee Member (2008-2014)
No. of Portfolios for which Board Member Serves:52
———————
31
BOARD MEMBERS INFORMATION (Unaudited) (continued)
INDEPENDENT BOARD MEMBERS (continued)
Ehud Houminer (78)
Board Member (2006)
Principal Occupation During Past 5 Years:
· Board of Overseers at the Columbia Business School, Columbia University (1992-present)
· Trustee, Ben Gurion University
No. of Portfolios for which Board Member Serves: 52
———————
Lynn Martin (79)
Board Member (2012)
Principal Occupation During Past 5 Years:
· President of The Martin Hall Group LLC, a human resources consulting firm (2005-2012)
No. of Portfolios for which Board Member Serves:31
———————
Robin A. Melvin (55)
Board Member (2012)
Principal Occupation During Past 5 Years:
· Co-chairman, Illinois Mentoring Partnership, non-profit organization dedicated to increasing the quantity and quality of mentoring services in Illinois; (2014-present; board member since 2013)
No. of Portfolios for which Board Member Serves:99
———————
Dr. Martin Peretz (79)
Board Member (1990)
Principal Occupation During Past 5 Years:
· Editor-in-Chief Emeritus of The New Republic Magazine (2011-2012) (previously,
Editor-in-Chief, 1974-2011)
· Lecturer at Harvard University (1968-2010)
No. of Portfolios for which Board Member Serves:31
———————
Once elected all Board Members serve for an indefinite term, but achieve Emeritus status upon reaching age 80. The address of the Board Members and Officers is c/o The Dreyfus Corporation, 200 Park Avenue, New York, New York 10166. Additional information about the Board Members is available in the fund’s Statement of Additional Information which can be obtained from Dreyfus free of charge by calling this toll free number: 1-800-DREYFUS.
James F. Henry, Emeritus Board Member
Philip L. Toia, Emeritus Board Member
32
OFFICERS OF THE FUND(Unaudited)
BRADLEY J. SKAPYAK, President since January 2010.
Chief Operating Officer and a director of the Manager since June 2009, Chairman of Dreyfus Transfer, Inc., an affiliate of the Manager and the transfer agent of the funds, since May 2011 and Chief Executive Officer of MBSC Securities Corporation since August 2016. He is an officer of 62 investment companies (comprised of 122 portfolios) managed by the Manager. He is 60 years old and has been an employee of the Manager since February 1988.
BENNETT A. MACDOUGALL, Chief Legal Officer since October 2015.
Chief Legal Officer of the Manager and Associate General Counsel and Managing Director of BNY Mellon since June 2015; from June 2005 to June 2015, he served in various capacities with Deutsche Bank – Asset & Wealth Management Division, including as Director and Associate General Counsel, and Chief Legal Officer of Deutsche Investment Management Americas Inc. from June 2012 to May 2015. He is an officer of 63 investment companies (comprised of 147 portfolios) managed by the Manager. He is 47 years old and has been an employee of the Manager since June 2015.
JAMES BITETTO, Vice President since August 2005 and Secretary since February 2018.
Managing Counsel of BNY Mellon and Secretary of the Manager, and an officer of 63 investment companies (comprised of 147 portfolios) managed by the Manager. He is 52 years old and has been an employee of the Manager since December 1996.
SONALEE CROSS, Vice President and Assistant Secretary since March 2018.
Counsel of BNY Mellon since October 2016; Associate at Proskauer Rose LLP from April 2016 to September 2016; Attorney at EnTrust Capital from August 2015 to February 2016; Associate at Sidley Austin LLP from September 2013 until August 2015. She is an officer of 63 investment companies (comprised of 147 portfolios) managed by Dreyfus. She is 31 years old and has been an employee of the Manager since October 2016.
SARAH S. KELLEHER, Vice President and Assistant Secretary since April 2014.
Managing Counsel of BNY Mellon since December 2017, from March 2013 to December 2017, Senior Counsel of BNY Mellon. She is an officer of 63 investment companies (comprised of 147 portfolios) managed by the Manager. She is 43 years old and has been an employee of the Manager since March 2013.
JEFF PRUSNOFSKY, Vice President and Assistant Secretary since August 2005.
Senior Managing Counsel of BNY Mellon, and an officer of 63 investment companies (comprised of 147 portfolios) managed by the Manager. He is 53 years old and has been an employee of the Manager since October 1990.
NATALYA ZELENSKY, Vice President and Assistant Secretary since March 2017.
Counsel of BNY Mellon since May 2016; Attorney at Wildermuth Endowment Strategy Fund/Wildermuth Advisory, LLC from November 2015 until May 2016; Assistant General Counsel at RCS Advisory Services from July 2014 until November 2015; Associate at Sutherland, Asbill & Brennan from January 2013 until January 2014. She is an officer of 63 investment companies (comprised of 147 portfolios) managed by Dreyfus. She is 33 years old and has been an employee of the Manager since May 2016.
JAMES WINDELS, Treasurer since November 2001.
Director – Mutual Fund Accounting of the Manager, and an officer of 63 investment companies (comprised of 147 portfolios) managed by the Manager. He is 60 years old and has been an employee of the Manager since April 1985.
GAVIN C. REILLY, Assistant Treasurer since December 2005.
Tax Manager of the Investment Accounting and Support Department of the Manager, and an officer of 63 investment companies (comprised of 147 portfolios) managed by the Manager. He is 50 years old and has been an employee of the Manager since April 1991.
ROBERT S. ROBOL, Assistant Treasurer since August 2005.
Senior Accounting Manager – Dreyfus Financial Reporting of the Manager, and an officer of 63 investment companies (comprised of 147 portfolios) managed by the Manager. He is 54 years old and has been an employee of the Manager since October 1988.
33
OFFICERS OF THE FUND (Unaudited)(continued)
ROBERT SALVIOLO, Assistant Treasurer since July 2007.
Senior Accounting Manager – Equity Funds of the Manager, and an officer of 63 investment companies (comprised of 147 portfolios) managed by the Manager. He is 51 years old and has been an employee of the Manager since June 1989.
ROBERT SVAGNA, Assistant Treasurer since December 2002.
Senior Accounting Manager – Fixed Income and Equity Funds of the Manager, and an officer of 63 investment companies (comprised of 147 portfolios) managed by the Manager. He is 51 years old and has been an employee of the Manager since November 1990.
JOSEPH W. CONNOLLY, Chief Compliance Officer since October 2004.
Chief Compliance Officer of the Manager, the Dreyfus Family of Funds and BNY Mellon Funds Trust (63 investment companies, comprised of 147 portfolios). He is 61 years old and has served in various capacities with the Manager since 1980, including manager of the firm’s Fund Accounting Department from 1997 through October 2001.
CARIDAD M. CAROSELLA, Anti-Money Laundering Compliance Officer since January 2016.
Anti-Money Laundering Compliance Officer of the Dreyfus Family of Funds and BNY Mellon Funds Trust since January 2016; from May 2015 to December 2015, Interim Anti-Money Laundering Compliance Officer of the Dreyfus Family of Funds and BNY Mellon Funds Trust and the Distributor; from January 2012 to May 2015, AML Surveillance Officer of the Distributor and from 2007 to December 2011, Financial Processing Manager of the Distributor. She is an officer of 57 investment companies (comprised of 141 portfolios) managed by the Manager. She is 50 years old and has been an employee of the Distributor since 1997.
34
NOTES
35
NOTES
36
NOTES
37
Dreyfus Variable Investment Fund, International Equity Portfolio
200 Park Avenue
New York, NY 10166
Investment Adviser
The Dreyfus Corporation
200 Park Avenue
New York, NY 10166
Sub-Investment Adviser
Newton Investment Management
(North America) Limited
160 Queen Victoria Street
London, EC4V 4LA
UK
Custodian
The Bank of New York Mellon
240 Greenwich Street
New York, NY 10286
Transfer Agent &
Dividend Disbursing Agent
Dreyfus Transfer, Inc.
200 Park Avenue
New York, NY 10166
Distributor
MBSC Securities Corporation
200 Park Avenue
New York, NY 10166
Telephone 1-800-258-4260 or 1-800-258-4261
Mail The Dreyfus Family of Funds, 144 Glenn Curtiss Boulevard, Uniondale, NY 11556-0144 Attn: Institutional Services Department
E-mailSend your request toinfo@dreyfus.com
InternetInformation can be viewed online or downloaded atwww.dreyfus.com
The fund files its complete schedule of portfolio holdings with the Securities and Exchange Commission (“SEC”) for the first and third quarters of each fiscal year on Form N-Q. The fund’s Forms N-Q are available on the SEC’s website at http://www.sec.gov and may be reviewed and copied at the SEC’s Public Reference Room in Washington, D.C. Information on the operation of the Public Reference Room may be obtained by calling 1-800-SEC-0330.
A description of the policies and procedures that the fund uses to determine how to vote proxies relating to portfolio securities, and information regarding how the fund voted these proxies for the most recent 12-month period ended June 30 is available at http://www.dreyfus.com and on the SEC’s website at http://www.sec.gov. The description of the policies and procedures is also available without charge, upon request, by calling 1-800-DREYFUS.
| | |
© 2019 MBSC Securities Corporation
0109AR1218 | 
|
Dreyfus Variable Investment Fund, International Value Portfolio
| | | |

| | ANNUAL REPORT December 31, 2018 |
| |
The views expressed in this report reflect those of the portfolio manager(s) only through the end of the period covered and do not necessarily represent the views of Dreyfus or any other person in the Dreyfus organization. Any such views are subject to change at any time based upon market or other conditions and Dreyfus disclaims any responsibility to update such views. These views may not be relied on as investment advice and, because investment decisions for a Dreyfus fund are based on numerous factors, may not be relied on as an indication of trading intent on behalf of any Dreyfus fund. |
| |
Not FDIC-Insured • Not Bank-Guaranteed • May Lose Value |
Contents
T H E F U N D
F O R M O R E I N F O R M AT I O N
Back Cover
| | | | |
| |
Dreyfus Variable Investment Fund, International Value Portfolio
| | The Fund |
A LETTER FROM THE PRESIDENT OF DREYFUS
Dear Shareholder:
We are pleased to present this annual report for Dreyfus Variable Investment Fund, International Value Portfolio, covering the 12-month period from January 1, 2018 through December 31, 2018. For information about how the fund performed during the reporting period, as well as general market perspectives, we provide a Discussion of Fund Performance on the pages that follow.
The reporting period began with major global economies achieving above-trend growth. In the United States, a robust economy and strong labor market encouraged the Federal Reserve to continue moving away from its accommodative monetary policy while other major central banks began to consider monetary tightening. Both U.S. and non-U.S. equity markets remained on an uptrend. Interest rates rose across the yield curve, putting pressure on bond prices.
A few months into the reporting period, global growth trends began to diverge and market volatility returned. While the U.S. economy continued to grow at a healthy rate, other developed markets began to weaken. However, robust growth and strong corporate earnings continued to support U.S. stock returns while other developed markets declined throughout the summer. In the fall, a broad sell-off occurred, partially offsetting earlier U.S. gains. Emerging markets remained under pressure as weakness in their currencies relative to the U.S. dollar added to investors’ uneasiness. Global equities continued their general decline through the end of the period.
Fixed income markets struggled during the first half of the period as interest rates rose and favorable U.S. equity markets fed investor risk appetites. However, in autumn volatility crept in, the yield curve began a flattening trend that continued through the end of December. As long-term debt yields fell, prices rose for many bonds, leading to moderately positive returns for several fixed income market sectors.
Despite continuing political variables, U.S. inflationary pressures and flagging growth rates, we are optimistic that the U.S. economy will remain strong in the near term. However, we remain attentive to signs that point to potential changes on the horizon. As always, we encourage you to discuss the risks and opportunities in today’s investment environment with your financial advisor.
Thank you for your continued confidence and support.
Sincerely,

Renee Laroche-Morris
President
The Dreyfus Corporation
January 15, 2019
2
DISCUSSION OF FUND PERFORMANCE(Unaudited)
For the period from January 1, 2018 through December 31, 2018, as provided by Mark A. Bogar, CFA, James A. Lydotes, CFA, and Andrew Leger, Portfolio Managers
Market and Fund Performance Overview
For the 12-month period ended December 31, 2018, Dreyfus Variable Investment Fund, International Value Portfolio’s Initial Shares produced a total return of -16.81%, and its Service Shares produced a total return of -16.98%.1 This compares with a -13.79% return produced by the fund’s benchmark, the MSCI EAFE Index (the “Index”), for the same period.2
International equities lost ground as a result of high levels of market volatility, exacerbated by U.S. inflationary pressures and international trade conflicts. The fund underperformed the Index during the reporting period, largely due to disappointing stock selection in French, Swiss, and Japanese markets.
The Fund’s Investment Approach
The fund seeks long-term capital growth. To pursue its goal, the fund normally invests at least 80% of its net assets, plus any borrowings for investment purposes, in stocks. The fund normally invests substantially all of its assets in the stocks of foreign companies (i.e., those organized under the laws of countries other than the U.S.), including those located in emerging market countries. The fund ordinarily invests most of its assets in securities of foreign companies which The Dreyfus Corporation considers to be value companies. The fund’s investment approach is value-oriented and research-driven. In selecting stocks, the portfolio managers identify potential investments through extensive quantitative and fundamental research.
Emphasizing individual stock selection rather than economic and industry trends, the fund focuses on three key factors: value, or how a stock is valued relative to its intrinsic worth based on traditional value measures; business health, or overall efficiency and profitability as measured by return on assets and return on equity; and business momentum, or the presence of a catalyst (such as corporate restructuring, change in management or spin-off) that potentially will trigger a price increase in the near term to medium term.
Stocks Pressured by Trade Tensions
The positive global economic growth trends that characterized 2017 remained in place during the first quarter of 2018, with most European and Asian economies continuing to expand and corporate earnings continuing to rise. However, international equities came under pressure from intensifying inflation concerns in the United States and heightened protectionist rhetoric and actions by the U.S. government. Consequently, stocks of companies deemed vulnerable to international trade disruptions were hit particularly hard. European stocks were further undermined by a recent budget crisis between Italy and the European Union (EU) which exacerbated sovereign risk worries. In Japan, cyclical industries tied to Chinese demand pulled back due to investor uncertainties associated with targeted U.S. tariffs on China.
Concerns surrounding U.S. inflationary pressures eased later in the reporting period and international trade issues focused more narrowly on the relationship between the United
3
DISCUSSION OF FUND PERFORMANCE(Unaudited) (continued)
States and China. In response, European and Japanese equity markets recouped much of the ground they had lost earlier. Asian markets, on the other hand, continued to dip after the U.S. imposed tariffs on Chinese imports, followed by Chinese retaliation and threats of additional tariffs from both countries.
Stocks gained ground early in the second half of the reporting period, led by U.S. and Japanese markets. In the U.S. market, economic and earnings data remained robust, offsetting the effects of interest-rate hikes by the Federal Reserve. In Japan, stocks benefited from a weaker yen and the leadership election for the Liberal Democratic Party that once again supported Prime Minister Shinzo Abe, which reduced uncertainty regarding economic policy. In Europe, stocks gained despite concerns about budget negotiations between Italy and the EU as well as uncertainty surrounding Brexit negotiations.
Late in the reporting period, however, stocks sold off on concerns about slowing global economic and earnings growth. Pressures on tariff-sensitive industries and lower-than-expected earnings in the information technology sector in particular weighed on returns.
Stock Selection Undermined Relative Performance
The fund lagged the Index most significantly in France, largely due to a disappointing performance from Atos, an information technology consulting firm, which missed expectations in two consecutive quarters. Global tire maker Cie Générale des Établissements Michelin also hurt the fund’s performance due to rising U.S. trade tensions and higher input costs. In Switzerland, the fund’s position in Julius Baer Group, a wealth management firm, was hindered by its sensitivity to equity markets, which largely declined.Adecco Group, a Swiss-based global staffing firm, was hampered by trade tensions and anticipated global economic weakness. In Japan, industrial robotics parts manufacturerHarmonic Drive Systems declined on weaker-than-expected earnings, while Mitsubishi Electric faced headwinds from rising raw-material costs.
On a more positive note, the fund enhanced returns in the lagging Australian market, partly through underweighted exposure and partly through relatively strong individual stock selection, including diversified financial firm Macquarie Group and mining company BHP Group. Favorable stock selection also bolstered the fund’s performance in Italy, where luxury apparel manufacturerMoncler and telecom operatorTelecom Italia gained ground in a down market. In the Netherlands, insurance company NN Group performed well on continued benefits from its acquisition of Delta Lloyd Group, a Dutch insurer, as well as its continued stock buybacks. Koninklijke Philips also added to the fund’s performance as it has benefited from a corporate restructuring that now focuses on its higher-growth medical devices business.
Finding Opportunities in a Challenging Environment
While the current political environment of heightened international trade tensions may pose challenges for many trade-dependent companies going forward, we believe underlying economic fundamentals in most of the developed world remain steady.
As of the end of the reporting period, we have positioned the fund to benefit from the positive economic environment while keeping a watchful eye on political developments. The sell-off that occurred at the end of the reporting period resulted in attractive valuations given that earnings are expected to remain relatively resilient. In addition, an agreement between
4
China and the U.S. would reduce uncertainties regarding international trade and thus provide additional support to markets.
The fund has added to its holdings in Finland and Germany and trimmed its positions in Switzerland and the U.K. The fund has also added to the consumer staples and health care sectors and has reduced exposure to the financials and industrials sectors.
January 15, 2019
1 Total return includes reinvestment of dividends and any capital gains paid. Past performance is no guarantee of future results. Share price and investment return fluctuate such that upon redemption, fund shares may be worth more or less than their original cost. The fund’s performance does not reflect the deduction of additional charges and expenses imposed in connection with investing in variable insurance contracts, which will reduce returns. Return figures for the fund reflect the absorption of certain fund expenses by The Dreyfus Corporation pursuant to an undertaking in effect through May 1, 2019, at which time it may be extended, terminated, or modified. Had these expenses not been absorbed, the fund’s returns would have been lower.
2 Source: Lipper Inc. — The MSCI EAFE Index (Europe, Australasia, Far East) is a free float-adjusted market capitalization-weighted index that is designed to measure the equity market performance of developed markets, excluding the U.S. and Canada. It reflects reinvestment of net dividends and, where applicable, capital gain distributions. Investors cannot invest directly in any index.
Please note: the position in any security highlighted with italicized typeface was sold during the reporting period.
Equities are subject generally to market, market sector, market liquidity, issuer, and investment style risks, among other factors, to varying degrees, all of which are more fully described in the fund’s prospectus.
The fund’s performance will be influenced by political, social, and economic factors affecting investments in foreign companies. Special risks associated with investments in foreign companies include exposure to currency fluctuations, less liquidity, less developed or less efficient trading markets, lack of comprehensive company information, political instability, and differing auditing and legal standards. These risks are enhanced in emerging market countries.
The fund is only available as a funding vehicle under variable life insurance policies or variable annuity contracts issued by insurance companies. Individuals may not purchase shares of the fund directly. A variable annuity is an insurance contract issued by an insurance company that enables investors to accumulate assets on a tax-deferred basis for retirement or other long-term goals. The investment objective and policies of Dreyfus Variable Investment Fund, International Value Portfolio made available through insurance products may be similar to those of other funds managed or advised by Dreyfus. However, the investment results of the fund may be higher or lower than, and may not be comparable to, those of any other Dreyfus fund.
5
FUND PERFORMANCE(Unaudited)
 Comparison of change in value of $10,000 investment in Dreyfus Variable Investment Fund, International Value Portfolio Initial shares and Service shares and the MSCI EAFE Index (the “Index”)
† Source: Lipper Inc.
Past performance is not predictive of future performance. The fund’s performance does not reflect the deduction of additional charges and expenses imposed in connection with investing in variable insurance contracts which will reduce returns.
The above graph compares a $10,000 investment made in Initial and Service shares of Dreyfus Variable Investment Fund, International Value Portfolio on 12/31/08 to a $10,000 investment made in the Index on that date.
The fund’s performance shown in the line graph above takes into account all applicable fees and expenses. The Index (Europe, Australasia, Far East) is a free float-adjusted market capitalization-weighted index that is designed to measure the equity market performance of developed markets, excluding the U.S. and Canada. Unlike a mutual fund, the Index is not subject to charges, fees and other expenses. Investors cannot invest directly in any index. Further information relating to fund performance, including expense reimbursements, if applicable, is contained in the Financial Highlights section of the prospectus and elsewhere in this report.
| | | | |
Average Annual Total Returns as of 12/31/18 |
| 1 Year | 5 Years | 10 Years |
Initial shares | -16.81% | -1.45% | 3.69% |
Service shares | -16.98% | -1.69% | 3.43% |
MSCI EAFE Index | -13.79% | 0.53% | 6.32% |
The performance data quoted represents past performance, which is no guarantee of future results. Share price and investment return fluctuate and an investor’s shares may be worth more or less than original cost upon redemption. Current performance may be lower or higher than the performance quoted. Go to Dreyfus.com for the fund’s most recent month-end returns.
The fund’s Initial shares are not subject to a Rule 12b-1 fee. The fund’s Service shares are subject to a 0.25% annual Rule 12b-1 fee. All dividends and capital gain distributions are reinvested.
The fund’s performance shown in the graph and table does not reflect the deduction of taxes that a shareholder would pay on fund distributions or the redemption of fund shares.
6
UNDERSTANDING YOUR FUND’S EXPENSES(Unaudited)
As a mutual fund investor, you pay ongoing expenses, such as management fees and other expenses. Using the information below, you can estimate how these expenses affect your investment and compare them with the expenses of other funds. You also may pay one-time transaction expenses, including sales charges (loads), redemption fees and expenses associated with variable annuity or insurance contracts, which are not shown in this section and would have resulted in higher total expenses. For more information, see your fund’s prospectus or talk to your financial adviser.
Review your fund’s expenses
The table below shows the expenses you would have paid on a $1,000 investment in Dreyfus Variable Investment Fund, International Value Portfolio from July 1, 2018 to December 31, 2018. It also shows how much a $1,000 investment would be worth at the close of the period, assuming actual returns and expenses.
| | | | | | | | |
Expenses and Value of a $1,000 Investment | | |
assuming actual returns for the six months ended December 31, 2018 | |
| | | | Initial Shares | Service Shares |
Expenses paid per $1,000† | | | $4.03 | | $5.20 |
Ending value (after expenses) | | | $857.40 | | $857.50 |
COMPARING YOUR FUND’S EXPENSES
WITH THOSE OF OTHER FUNDS(Unaudited)
Using the SEC’s method to compare expenses
The Securities and Exchange Commission (“SEC”) has established guidelines to help investors assess fund expenses. Per these guidelines, the table below shows your fund’s expenses based on a $1,000 investment, assuming a hypothetical 5% annualized return. You can use this information to compare the ongoing expenses (but not transaction expenses or total cost) of investing in the fund with those of other funds. All mutual fund shareholder reports will provide this information to help you make this comparison. Please note that you cannot use this information to estimate your actual ending account balance and expenses paid during the period.
| | | | | | | | |
Expenses and Value of a $1,000 Investment | | |
assuming a hypothetical 5% annualized return for the six months ended December 31, 2018 |
| | | | Initial Shares | Service Shares |
Expenses paid per $1,000† | | | $4.38 | | $5.65 |
Ending value (after expenses) | | | $1,020.87 | | $1,019.61 |
† Expenses are equal to the fund’s annualized expense ratio of .86% for Initial shares and 1.11% for Service shares, multiplied by the average account value over the period, multiplied by 184/365 (to reflect the one-half year period).
7
STATEMENT OF INVESTMENTS
December 31, 2018
| | | | | | | | |
| |
Description | | | | Shares | | Value ($) | |
Common Stocks - 98.2% | | | | | |
Australia - 5.4% | | | | | |
Aristocrat Leisure | | | | 28,405 | | 433,817 | |
BHP Group | | | | 20,119 | | 485,401 | |
Macquarie Group | | | | 8,994 | | 688,221 | |
South32 | | | | 121,229 | | 286,016 | |
Woodside Petroleum | | | | 18,103 | | 399,831 | |
| | | | | 2,293,286 | |
Austria - 1.8% | | | | | |
Erste Group Bank | | | | 7,985 | a | 266,063 | |
OMV | | | | 11,995 | | 524,629 | |
| | | | | 790,692 | |
Belgium - 1.0% | | | | | |
UCB | | | | 5,437 | | 443,266 | |
Finland - 2.2% | | | | | |
Nokia | | | | 99,647 | | 575,751 | |
UPM-Kymmene | | | | 14,276 | | 363,001 | |
| | | | | 938,752 | |
France - 9.9% | | | | | |
Atos | | | | 7,145 | | 581,345 | |
BNP Paribas | | | | 13,087 | | 589,415 | |
Cie Generale des Etablissements Michelin | | | | 6,830 | | 675,277 | |
Edenred | | | | 10,942 | | 401,103 | |
LVMH Moet Hennessy Louis Vuitton | | | | 1,073 | | 315,296 | |
Sanofi | | | | 11,212 | | 968,930 | |
Thales | | | | 2,161 | | 251,382 | |
Vinci | | | | 5,564 | | 457,238 | |
| | | | | 4,239,986 | |
Germany - 9.5% | | | | | |
Allianz | | | | 3,398 | | 681,865 | |
Deutsche Boerse | | | | 2,803 | | 337,081 | |
Deutsche Post | | | | 13,428 | | 367,778 | |
Deutsche Telekom | | | | 94,273 | | 1,601,383 | |
Evonik Industries | | | | 13,622 | | 340,227 | |
Fresenius & Co. | | | | 10,526 | | 508,802 | |
Hapag-Lloyd | | | | 7,832 | b | 201,836 | |
| | | | | 4,038,972 | |
Hong Kong - 3.0% | | | | | |
AIA Group | | | | 79,600 | | 654,810 | |
Sun Hung Kai Properties | | | | 43,500 | | 616,786 | |
| | | | | 1,271,596 | |
8
| | | | | | | | |
| |
Description | | | | Shares | | Value ($) | |
Common Stocks - 98.2% (continued) | | | | | |
Ireland - .9% | | | | | |
ICON | | | | 2,880 | a | 372,125 | |
Italy - 3.8% | | | | | |
Enel | | | | 109,832 | | 633,629 | |
Leonardo | | | | 42,344 | | 372,719 | |
UniCredit | | | | 54,479 | | 618,006 | |
| | | | | 1,624,354 | |
Japan - 22.5% | | | | | |
Asahi Kasei | | | | 36,600 | | 373,434 | |
Chubu Electric Power | | | | 44,800 | | 637,057 | |
Denso | | | | 14,200 | | 630,197 | |
Fujitsu | | | | 5,700 | | 357,338 | |
Hitachi | | | | 26,400 | | 701,760 | |
ITOCHU | | | | 17,800 | | 300,214 | |
Kirin Holdings | | | | 31,400 | | 660,495 | |
Mitsubishi Electric | | | | 53,400 | | 585,419 | |
Nintendo | | | | 1,200 | | 317,053 | |
Panasonic | | | | 26,700 | | 239,571 | |
Recruit Holdings | | | | 19,000 | | 454,874 | |
Seven & i Holdings | | | | 20,200 | | 879,556 | |
Shionogi & Co. | | | | 7,600 | | 430,948 | |
Shiseido | | | | 6,400 | | 397,664 | |
Showa Denko KK | | | | 7,600 | | 222,923 | |
Sony | | | | 15,500 | | 746,432 | |
Sumitomo Mitsui Financial Group | | | | 30,100 | | 992,603 | |
Suzuki Motor | | | | 13,400 | | 678,047 | |
| | | | | 9,605,585 | |
Macau - 1.2% | | | | | |
Sands China | | | | 117,600 | | 509,269 | |
Netherlands - 7.6% | | | | | |
Heineken | | | | 6,457 | | 569,103 | |
Koninklijke Ahold Delhaize | | | | 20,710 | | 522,463 | |
Koninklijke DSM | | | | 4,705 | | 382,829 | |
Koninklijke Philips | | | | 10,939 | | 385,524 | |
NN Group | | | | 15,517 | | 616,408 | |
Royal Dutch Shell, Cl. B | | | | 25,975 | | 772,932 | |
| | | | | 3,249,259 | |
Norway - .9% | | | | | |
Aker BP | | | | 15,832 | | 400,923 | |
Portugal - 1.1% | | | | | |
Galp Energia | | | | 28,417 | | 449,990 | |
Singapore - .8% | | | | | |
United Overseas Bank | | | | 18,400 | | 329,798 | |
9
STATEMENT OF INVESTMENTS (continued)
| | | | | | | | |
| |
Description | | | | Shares | | Value ($) | |
Common Stocks - 98.2% (continued) | | | | | |
Spain - 4.1% | | | | | |
ACS Actividades de Construccion y Servicios | | | | 12,094 | | 464,933 | |
Amadeus IT Group | | | | 7,973 | | 555,153 | |
Banco Santander | | | | 158,738 | | 716,360 | |
| | | | | 1,736,446 | |
Sweden - 2.4% | | | | | |
Alfa Laval | | | | 16,329 | | 348,598 | |
Swedbank, Cl. A | | | | 14,584 | | 325,106 | |
Swedish Match | | | | 8,575 | | 338,068 | |
| | | | | 1,011,772 | |
Switzerland - 7.9% | | | | | |
Ferguson | | | | 5,015 | | 321,190 | |
Julius Baer Group | | | | 13,151 | a | 469,935 | |
Lonza Group | | | | 2,008 | a | 522,034 | |
Novartis | | | | 17,273 | | 1,479,404 | |
OC Oerlikon | | | | 24,720 | a | 278,431 | |
STMicroelectronics | | | | 21,094 | | 301,024 | |
| | | | | 3,372,018 | |
United Kingdom - 12.2% | | | | | |
Anglo American | | | | 20,102 | | 444,376 | |
BAE Systems | | | | 69,521 | | 405,761 | |
Cineworld Group | | | | 86,490 | | 289,461 | |
Diageo | | | | 13,197 | | 469,068 | |
Fiat Chrysler Automobiles | | | | 43,451 | a | 631,723 | |
Legal & General Group | | | | 230,505 | | 676,366 | |
Melrose Industries | | | | 110,052 | | 227,890 | |
Prudential | | | | 26,738 | | 477,730 | |
SSE | | | | 50,516 | | 694,556 | |
Tesco | | | | 168,294 | | 407,800 | |
Unilever | | | | 9,640 | | 504,535 | |
| | | | | 5,229,266 | |
Total Common Stocks(cost $46,800,090) | | | | 41,907,355 | |
10
| | | | | | | | |
| |
Description | | | | Shares | | Value ($) | |
Exchange-Traded Funds - .9% | | | | | |
United States - .9% | | | | | |
iShares MSCI EAFE ETF
(cost $385,174) | | | | 6,341 | | 372,724 | |
Total Investments(cost $47,185,264) | | 99.1% | | 42,280,079 | |
Cash and Receivables (Net) | | .9% | | 394,279 | |
Net Assets | | 100.0% | | 42,674,358 | |
ETF—Exchange-Traded Fund
a Non-income producing security.
b Security exempt from registration pursuant to Rule 144A under the Securities Act of 1933. These securities may be resold in transactions exempt from registration, normally to qualified institutional buyers. At December 31, 2018, these securities were valued at $201,836 or .47% of net assets.
| | |
Portfolio Summary (Unaudited)† | Value (%) |
Pharmaceuticals Biotechnology & Life Sciences | 9.9 |
Capital Goods | 9.4 |
Banks | 9.0 |
Insurance | 7.3 |
Materials | 6.8 |
Automobiles & Components | 6.1 |
Energy | 6.0 |
Food, Beverage & Tobacco | 4.8 |
Utilities | 4.6 |
Food & Staples Retailing | 4.2 |
Telecommunication Services | 3.8 |
Diversified Financials | 3.5 |
Software & Services | 3.5 |
Consumer Durables & Apparel | 3.1 |
Technology Hardware & Equipment | 3.0 |
Consumer Services | 2.2 |
Household & Personal Products | 2.1 |
Health Care Equipment & Services | 2.1 |
Commercial & Professional Services | 2.0 |
Real Estate | 1.4 |
Media & Entertainment | 1.4 |
Transportation | 1.3 |
Registered Investment Companies | .9 |
Semiconductors & Semiconductor Equipment | .7 |
| | 99.1 |
† Based on net assets.
See notes to financial statements.
11
STATEMENT OF INVESTMENTS IN AFFILIATED ISSUERS
| | | | | | | |
Registered Investment Company | Value
12/31/17($) | Purchases($) | Sales ($) | Value
12/31/18($) | Net
Assets(%) | Dividends/
Distributions($) |
Dreyfus Institutional Preferred Government Plus Money Market Fund | 243,064 | 14,377,506 | 14,620,570 | - | - | 4,407 |
See notes to financial statements.
12
STATEMENT OF FORWARD FOREIGN CURRENCY EXCHANGE CONTRACTSDecember 31, 2018
| | | | | | |
Counterparty/ Purchased
Currency | Purchased Currency
Amounts | Currency
Sold | Sold
Currency
Amounts | Settlement Date | Unrealized Appreciation (Depreciation)($) |
Citigroup | | | |
United States Dollar | 115,657 | British Pound | 90,350 | 1/2/19 | 485 |
United States Dollar | 250,980 | Euro | 219,532 | 1/2/19 | (590) |
Gross Unrealized Appreciation | | | 485 |
Gross Unrealized Depreciation | | | (590) |
See notes to financial statements.
13
STATEMENT OF ASSETS AND LIABILITIES
December 31, 2018
| | | | | | | |
| | | | | | |
| | | Cost | | Value | |
Assets ($): | | | | |
Investments in securities—See Statement of Investments | 47,185,264 | | 42,280,079 | |
Cash denominated in foreign currency | | | 154,456 | | 153,542 | |
Receivable for investment securities sold | | 561,250 | |
Tax reclaim receivable | | 124,088 | |
Dividends receivable | | 12,806 | |
Receivable for shares of Beneficial Interest subscribed | | 9,940 | |
Unrealized appreciation on forward foreign
currency exchange contracts—Note 4 | | 485 | |
Prepaid expenses | | | | | 2,894 | |
| | | | | 43,145,084 | |
Liabilities ($): | | | | |
Due to The Dreyfus Corporation and affiliates—Note 3(b) | | | | 21,713 | |
Cash overdraft due to Custodian | | | | | 146,351 | |
Payable for investment securities purchased | | 179,534 | |
Payable for shares of Beneficial Interest redeemed | | 43,075 | |
Unrealized depreciation on foreign currency transactions | | 3,398 | |
Trustees fees and expenses payable | | 2,191 | |
Unrealized depreciation on forward foreign
currency exchange contracts—Note 4 | | 590 | |
Accrued expenses | | | | | 73,874 | |
| | | | | 470,726 | |
Net Assets ($) | | | 42,674,358 | |
Composition of Net Assets ($): | | | | |
Paid-in capital | | | | | 60,139,906 | |
Total distributable earnings (loss) | | | | | (17,465,548) | |
Net Assets ($) | | | 42,674,358 | |
| | | | |
Net Asset Value Per Share | Initial Shares | Service Shares | |
Net Assets ($) | 17,017,686 | 25,656,672 | |
Shares Outstanding | 1,694,237 | 2,553,552 | |
Net Asset Value Per Share ($) | 10.04 | 10.05 | |
| | | | |
See notes to financial statements. | | | |
14
STATEMENT OF OPERATIONS
Year Ended December 31, 2018
| | | | | | | |
| | | | | | |
| | | | | | |
Investment Income ($): | | | | |
Income: | | | | |
Cash dividends (net of $128,060 foreign taxes withheld at source): | |
Unaffiliated issuers | | | 1,420,771 | |
Affiliated issuers | | | 4,407 | |
Total Income | | | 1,425,178 | |
Expenses: | | | | |
Investment advisory fee—Note 3(a) | | | 524,975 | |
Professional fees | | | 121,807 | |
Distribution fees—Note 3(b) | | | 79,951 | |
Custodian fees—Note 3(b) | | | 36,807 | |
Prospectus and shareholders’ reports | | | 15,873 | |
Shareholder servicing costs—Note 3(b) | | | 1,587 | |
Loan commitment fees—Note 2 | | | 1,363 | |
Trustees’ fees and expenses—Note 3(c) | | | 901 | |
Interest expense—Note 2 | | | 375 | |
Miscellaneous | | | 44,328 | |
Total Expenses | | | 827,967 | |
Less—reduction in expenses due to undertaking—Note 3(a) | | | (294,031) | |
Net Expenses | | | 533,936 | |
Investment Income—Net | | | 891,242 | |
Realized and Unrealized Gain (Loss) on Investments—Note 4 ($): | | |
Net realized gain (loss) on investments and foreign currency transactions | 3,301,864 | |
Net realized gain (loss) on forward foreign currency exchange contracts | (20,406) | |
Net Realized Gain (Loss) | | | 3,281,458 | |
Net unrealized appreciation (depreciation) on investments
and foreign currency transactions | | | (13,160,220) | |
Net unrealized appreciation (depreciation) on
forward foreign currency exchange contracts | | | (131) | |
Net Unrealized Appreciation (Depreciation) | | | (13,160,351) | |
Net Realized and Unrealized Gain (Loss) on Investments | | | (9,878,893) | |
Net Increase from Payment by Affiliate | | | 102 | |
Net (Decrease) in Net Assets Resulting from Operations | | (8,987,549) | |
| | | | | | | |
See notes to financial statements. | | | | | |
15
STATEMENT OF CHANGES IN NET ASSETS
| | | | | | | | | | |
| | | | Year Ended December 31, |
| | | | 2018 | | 2017 | a |
Operations ($): | | | | | | | | |
Investment income—net | | | 891,242 | | | | 821,565 | |
Net realized gain (loss) on investments | | 3,281,458 | | | | 2,755,383 | |
Net unrealized appreciation (depreciation)
on investments | | (13,160,351) | | | | 9,080,667 | |
Net increase from payment by affiliate | | 102 | | | | 1,201 | |
Net Increase (Decrease) in Net Assets
Resulting from Operations | (8,987,549) | | | | 12,658,816 | |
Distributions ($): | |
Distributions to shareholders: | | | | | | | | |
Initial Shares | | | (342,309) | | | | (293,637) | |
Service Shares | | | (500,324) | | | | (394,293) | |
Total Distributions | | | (842,633) | | | | (687,930) | |
Beneficial Interest Transactions ($): | |
Net proceeds from shares sold: | | | | | | | | |
Initial Shares | | | 2,634,951 | | | | 2,586,028 | |
Service Shares | | | 5,976,338 | | | | 8,168,542 | |
Distributions reinvested: | | | | | | | | |
Initial Shares | | | 342,309 | | | | 293,637 | |
Service Shares | | | 500,324 | | | | 394,293 | |
Cost of shares redeemed: | | | | | | | | |
Initial Shares | | | (4,135,642) | | | | (2,796,223) | |
Service Shares | | | (11,111,204) | | | | (6,422,662) | |
Increase (Decrease) in Net Assets
from Beneficial Interest Transactions | (5,792,924) | | | | 2,223,615 | |
Total Increase (Decrease) in Net Assets | (15,623,106) | | | | 14,194,501 | |
Net Assets ($): | |
Beginning of Period | | | 58,297,464 | | | | 44,102,963 | |
End of Period | | | 42,674,358 | | | | 58,297,464 | |
Capital Share Transactions (Shares): | |
Initial Shares | | | | | | | | |
Shares sold | | | 221,877 | | | | 239,807 | |
Shares issued for distributions reinvested | | | 28,313 | | | | 28,619 | |
Shares redeemed | | | (352,295) | | | | (249,081) | |
Net Increase (Decrease) in Shares Outstanding | (102,105) | | | | 19,345 | |
Service Shares | | | | | | | | |
Shares sold | | | 501,536 | | | | 731,930 | |
Shares issued for distributions reinvested | | | 41,315 | | | | 38,318 | |
Shares redeemed | | | (941,892) | | | | (582,351) | |
Net Increase (Decrease) in Shares Outstanding | (399,041) | | | | 187,897 | |
| | | | | | | | | | |
aDistributions to shareholders include only distributions from net investment income. Undistributed investment income—net was $836,598 in 2017 and is no longer presented as a result of the adoption of SEC’s Disclosure Update and Simplification Rule | |
See notes to financial statements. | | | | | | | | |
16
FINANCIAL HIGHLIGHTS
The following tables describe the performance for each share class for the fiscal periods indicated. All information (except portfolio turnover rate) reflects financial results for a single fund share. Total return shows how much your investment in the fund would have increased (or decreased) during each period, assuming you had reinvested all dividends and distributions. The fund’s total returns do not reflect expenses associated with variable annuity or insurance contracts. These figures have been derived from the fund’s financial statements.
| | | | | | | | | | | | | |
| | | | | | | |
| | | |
Initial Shares | | | Year Ended December 31, |
| | | 2018 | 2017 | 2016 | 2015 | 2014 |
Per Share Data ($): | | | | | | |
Net asset value, beginning of period | | 12.27 | 9.70 | 10.04 | 10.55 | 11.82 |
Investment Operations: | | | | | | |
Investment income—neta | | .21 | .19 | .18 | .18 | .19 |
Net realized and unrealized
gain (loss) on investments | | (2.24) | 2.54 | (.33) | (.45) | (1.27) |
Total from Investment Operations | | (2.03) | 2.73 | (.15) | (.27) | (1.08) |
Distributions: | | | | | | |
Dividends from
investment income—net | | (.20) | (.16) | (.19) | (.24) | (.19) |
Payment by affiliate | | .00b,c | .00b,c | .00b,c | - | - |
Net asset value, end of period | | 10.04 | 12.27 | 9.70 | 10.04 | 10.55 |
Total Return (%) | | (16.81)c | 28.52c | (1.45)c | (2.72) | (9.32) |
Ratios/Supplemental Data (%): | | | | | | |
Ratio of total expenses
to average net assets | | 1.42 | 1.37 | 1.38 | 1.38 | 1.29 |
Ratio of net expenses
to average net assets | | .86 | .86 | .85 | .83 | .99 |
Ratio of net investment income
to average net assets | | 1.82 | 1.75 | 1.87 | 1.66 | 1.68 |
Portfolio Turnover Rate | | 78.31 | 62.39 | 108.21 | 147.24 | 45.43 |
Net Assets, end of period ($ x 1,000) | | 17,018 | 22,045 | 17,241 | 21,814 | 33,147 |
a Based on average shares outstanding.
b Amount represents less than $.01.
c The fund received proceeds from a class action settlement from The Bank of New York Mellon Corporation. This payment had no impact on total return.
See notes to financial statements.
17
FINANCIAL HIGHLIGHTS (continued)
| | | | | | | | | | | | | | |
| | | | | | | |
| | | | |
Service Shares | | | Year Ended December 31, |
| | | 2018 | 2017 | 2016 | 2015 | 2014 |
Per Share Data ($): | | | | | | |
Net asset value, beginning of period | | 12.28 | 9.72 | 10.04 | 10.55 | 11.82 |
Investment Operations: | | | | | | |
Investment income—neta | | .19 | .17 | .13 | .17 | .16 |
Net realized and unrealized
gain (loss) on investments | | (2.25) | 2.54 | (.29) | (.47) | (1.28) |
Total from Investment Operations | | (2.06) | 2.71 | (.16) | (.30) | (1.12) |
Distributions: | | | | | | |
Dividends from
investment income—net | | (.17) | (.15) | (.16) | (.21) | (.15) |
Payment by affiliate | | .00b,c | .00b,c | .00b,c | - | - |
Net asset value, end of period | | 10.05 | 12.28 | 9.72 | 10.04 | 10.55 |
Total Return (%) | | (16.98)c | 28.14c | (1.58)c | (2.98) | (9.57) |
Ratios/Supplemental Data (%): | | | | | | |
Ratio of total expenses
to average net assets | | 1.67 | 1.62 | 1.61 | 1.63 | 1.54 |
Ratio of net expenses
to average net assets | | 1.11 | 1.11 | 1.10 | 1.08 | 1.24 |
Ratio of net investment income
to average net assets | | 1.62 | 1.49 | 1.41 | 1.53 | 1.40 |
Portfolio Turnover Rate | | 78.31 | 62.39 | 108.21 | 147.24 | 45.43 |
Net Assets, end of period ($ x 1,000) | | 25,657 | 36,253 | 26,862 | 18,566 | 23,038 |
a Based on average shares outstanding.
b Amount represents less than $.01.
c The fund received proceeds from a class action settlement from The Bank of New York Mellon Corporation. This payment had no impact on total return.
See notes to financial statements.
18
NOTES TO FINANCIAL STATEMENTS
NOTE 1—Significant Accounting Policies:
International Value Portfolio (the “fund”) is a separate diversified series of Dreyfus Variable Investment Fund (the “Company”), which is registered under the Investment Company Act of 1940, as amended (the “Act”), as an open-end management investment company and operates as a series company currently offering seven series, including the fund. The fund is only offered to separate accounts established by insurance companies to fund variable annuity contracts and variable life insurance policies. The fund’s investment objective is to seek long-term capital growth. The Dreyfus Corporation (the “Manager” or “Dreyfus”), a wholly-owned subsidiary of The Bank of New York Mellon Corporation (“BNY Mellon”), serves as the fund’s investment adviser.
MBSC Securities Corporation (the “Distributor”), a wholly-owned subsidiary of Dreyfus, is the distributor of the fund’s shares, which are sold without a sales charge. The fund is authorized to issue an unlimited number of $.001 par value shares of Beneficial Interest in each of the following classes of shares: Initial and Service. Each class of shares has identical rights and privileges, except with respect to the Distribution Plan, and the expenses borne by each class, the allocation of certain transfer agency costs, and certain voting rights. Income, expenses (other than expenses attributable to a specific class), and realized and unrealized gains or losses on investments are allocated to each class of shares based on its relative net assets.
The Company accounts separately for the assets, liabilities and operations of each series. Expenses directly attributable to each series are charged to that series’ operations; expenses which are applicable to all series are allocated among them on a pro rata basis.
The Financial Accounting Standards Board (“FASB”) Accounting Standards Codification (“ASC”) is the exclusive reference of authoritative U.S. generally accepted accounting principles (“GAAP”) recognized by the FASB to be applied by nongovernmental entities. Rules and interpretive releases of the Securities and Exchange Commission (“SEC”) under authority of federal laws are also sources of authoritative GAAP for SEC registrants. The fund’s financial statements are prepared in accordance with GAAP, which may require the use of management estimates and assumptions. Actual results could differ from those estimates.
The Companyenters into contracts that contain a variety of indemnifications. The fund’s maximum exposure under these arrangements is unknown. The fund does not anticipate recognizing any loss related to these arrangements.
19
NOTES TO FINANCIAL STATEMENTS(continued)
(a) Portfolio valuation: The fair value of a financial instrument is the amount that would be received to sell an asset or paid to transfer a liability in an orderly transaction between market participants at the measurement date (i.e., the exit price). GAAP establishes a fair value hierarchy that prioritizes the inputs of valuation techniques used to measure fair value. This hierarchy gives the highest priority to unadjusted quoted prices in active markets for identical assets or liabilities (Level 1 measurements) and the lowest priority to unobservable inputs (Level 3 measurements).
Additionally, GAAP provides guidance on determining whether the volume and activity in a market has decreased significantly and whether such a decrease in activity results in transactions that are not orderly. GAAP requires enhanced disclosures around valuation inputs and techniques used during annual and interim periods.
Various inputs are used in determining the value of the fund’s investments relating to fair value measurements. These inputs are summarized in the three broad levels listed below:
Level 1—unadjusted quoted prices in active markets for identical investments.
Level 2—other significant observable inputs (including quoted prices for similar investments, interest rates, prepayment speeds, credit risk, etc.).
Level 3—significant unobservable inputs (including the fund’s own assumptions in determining the fair value of investments).
The inputs or methodology used for valuing securities are not necessarily an indication of the risk associated with investing in those securities.
Changes in valuation techniques may result in transfers in or out of an assigned level within the disclosure hierarchy. Valuation techniques used to value the fund’s investments are as follows:
Investments in securities are valued at the last sales price on the securities exchange or national securities market on which such securities are primarily traded. Securities listed on the National Market System for which market quotations are available are valued at the official closing price or, if there is no official closing price that day, at the last sales price. For open short positions, asked prices are used for valuation purposes. Bid price is used when no asked price is available. Registered investment companies that are not traded on an exchange are valued at their net asset value. All of the preceding securities are generally categorized within Level 1 of the fair value hierarchy.
20
Securities not listed on an exchange or the national securities market, or securities for which there were no transactions, are valued at the average of the most recent bid and asked prices. These securities are generally categorized within Level 2 of the fair value hierarchy.
Fair valuing of securities may be determined with the assistance of a pricing service using calculations based on indices of domestic securities and other appropriate indicators, such as prices of relevant American Depository Receipts and futures. Utilizing these techniques may result in transfers between Level 1 and Level 2 of the fair value hierarchy.
When market quotations or official closing prices are not readily available, or are determined not to accurately reflect fair value, such as when the value of a security has been significantly affected by events after the close of the exchange or market on which the security is principally traded (for example, a foreign exchange or market), but before the fund calculates its net asset value, the fund may value these investments at fair value as determined in accordance with the procedures approved by the Company’s Board of Trustees (the “Board”). Certain factors may be considered when fair valuing investments such as: fundamental analytical data, the nature and duration of restrictions on disposition, an evaluation of the forces that influence the market in which the securities are purchased and sold, and public trading in similar securities of the issuer or comparable issuers. These securities are either categorized within Level 2 or 3 of the fair value hierarchy depending on the relevant inputs used.
For restricted securities where observable inputs are limited, assumptions about market activity and risk are used and such securities are generally categorized within Level 3 of the fair value hierarchy.
Investments denominated in foreign currencies are translated to U.S. dollars at the prevailing rates of exchange.
Forward foreign currency exchange contracts (“forward contracts”) are valued at the forward rate and are generally categorized within Level 2 of the fair value hierarchy.
The following is a summary of the inputs used as of December 31, 2018in valuing the fund’s investments:
21
NOTES TO FINANCIAL STATEMENTS(continued)
| | | | | | | | |
| | Level 1 - Unadjusted Quoted Prices | Level 2 - Other Significant Observable Inputs | Level 3 -Significant Unobservable Inputs | Total |
Assets ($) | | | |
Investments in Securities: | | | |
Equity Securities -
Common Stocks | 372,125 | 41,535,230 | † | - | 41,907,355 |
Exchange-Traded Funds | 372,724 | - | - | 372,724 |
Other Financial Instruments: | | | | |
Forward Foreign Currency
Exchange Contracts†† | - | 485 | | - | 485 |
Liabilities ($) | | | | | |
Other Financial Instruments: | | | | |
Forward Foreign Currency
Exchange Contracts†† | - | (590) | | - | (590) |
† Securities classified within Level 2 at period end as the values were determined pursuant to the fund’s fair valuation procedures.
†† Amount shown represents unrealized appreciation (depreciation) at period end.
At December 31, 2018, there were no transfers between levels of the fair value hierarchy. It is the fund’s policy to recognize transfers between levels at the end of the reporting period.
(b) Foreign currency transactions: The fund does not isolate that portion of the results of operations resulting from changes in foreign exchange rates on investments from the fluctuations arising from changes in the market prices of securities held. Such fluctuations are included with the net realized and unrealized gain or loss on investments.
Net realized foreign exchange gains or losses arise from sales of foreign currencies, currency gains or losses realized on securities transactions between trade and settlement date, and the difference between the amounts of dividends, interest and foreign withholding taxes recorded on the fund’s books and the U.S. dollar equivalent of the amounts actually received or paid. Net unrealized foreign exchange gains and losses arise from changes in the value of assets and liabilities other than investments resulting from changes in exchange rates. Foreign currency gains and losses on foreign currency transactions are also included with net realized and unrealized gain or loss on investments.
(c)Securities transactions and investment income: Securities transactions are recorded on a trade date basis. Realized gains and losses from securities transactions are recorded on the identified cost basis. Dividend income is recognized on the ex-dividend date and interest income, including, where applicable, accretion of discount and
22
amortization of premium on investments, is recognized on the accrual basis.
(d) Affiliated issuers: Investments in other investment companies advised by Dreyfus are considered “affiliated” under the Act.
(e) Risk: Investing in foreign markets may involve special risks and considerations not typically associated with investing in the U.S. These risks include revaluation of currencies, high rates of inflation, repatriation restrictions on income and capital, and adverse political and economic developments. Moreover, securities issued in these markets may be less liquid, subject to government ownership controls and delayed settlements, and their prices may be more volatile than those of comparable securities in the U.S.
(f) Dividends and distributions to shareholders: Dividends and distributions are recorded on the ex-dividend date. Dividends from investment income-net and dividends from net realized capital gains, if any, are normally declared and paid annually, but the fund may make distributions on a more frequent basis to comply with the distribution requirements of the Internal Revenue Code of 1986, as amended (the “Code”). To the extent that net realized capital gains can be offset by capital loss carryovers, it is the policy of the fund not to distribute such gains. Income and capital gain distributions are determined in accordance with income tax regulations, which may differ from GAAP.
(g) Federal income taxes: It is the policy of the fund to continue to qualify as a regulated investment company, if such qualification is in the best interests of its shareholders, by complying with the applicable provisions of the Code, and to make distributions of taxable income and net realized capital gain sufficient to relieve it from substantially all federal income and excise taxes.
As of and during the period ended December 31, 2018, the fund did not have any liabilities for any uncertain tax positions. The fund recognizes interest and penalties, if any, related to uncertain tax positions as income tax expense in the Statement of Operations. During the period ended December 31, 2018, the fund did not incur any interest or penalties.
Each tax year in the four-year period ended December 31, 2018 remains subject to examination by the Internal Revenue Service and state taxing authorities.
At December 31, 2018, the components of accumulated earnings on a tax basis were as follows: undistributed ordinary income $901,594,
23
NOTES TO FINANCIAL STATEMENTS(continued)
accumulated capital losses $13,360,089 and unrealized depreciation $5,007,053.
The fund is permitted to carry forward capital losses for an unlimited period. Furthermore, capital loss carryovers retain their character as either short-term or long-term capital losses.
The accumulated capital loss carryover is available for federal income tax purposes to be applied against future netrealized capital gains, if any, realized subsequent to December 31, 2018. The fund has $13,360,089 of long-term capital losses which can be carried forward for an unlimited period.
The tax character of distributions paid to shareholders during the fiscal periods ended December 31, 2018 and December 31, 2017 were as follows: ordinary income $842,633 and $687,930, respectively.
(h) New Accounting Pronouncements: In August 2018, the FASB issued Accounting Standards Update 2018-13, Fair Value Measurement (Topic 820): Disclosure Framework—Changes to the Disclosure Requirements for Fair Value Measurement (“ASU 2018-13”). The update provides guidance that eliminates, adds and modifies certain disclosure requirements for fair value measurements. ASU 2018-13 will be effective for annual periods beginning after December 15, 2019. Management is currently assessing the potential impact of these changes to future financial statements.
NOTE 2—Bank Lines of Credit:
The fund participates with other Dreyfus-managed long-term open-end funds in a $1.030 billion unsecured credit facility led by Citibank, N.A. (the “Citibank Credit Facility”) and a $300 million unsecured credit facility provided by The Bank of New York Mellon (the “BNYM Credit Facility”), a subsidiary of BNY Mellon and an affiliate of Dreyfus, each to be utilized primarily for temporary or emergency purposes, including the financing of redemptions (each, a “Facility”). The Citibank Credit Facility is available in two tranches: (i) Tranche A is in an amount equal to $830 million and is available to all long-term open-ended funds, including the fund, and (ii) Tranche B is in amount equal to $200 million and is available only to the Dreyfus Floating Rate Income Fund, a series of The Dreyfus/Laurel Funds, Inc. Prior to October 3, 2018, the unsecured credit facility with Citibank, N.A. was $830 million. In connection therewith, the fund has agreed to pay its pro rata portion of commitment fees for Tranche A of the Citibank Credit Facility and the BNYM Credit Facility. Interest is charged to the fund based on rates determined pursuant to the terms of the respective Facility at the time of borrowing.
24
The average amount of borrowings outstanding under the Facilities during the period ended December 31, 2018 was approximately $12,600 with a related weighted average annualized interest rate of 2.98%.
NOTE 3—Investment Advisory Fee and Other Transactions with Affiliates:
(a)Pursuant to an investment advisory agreement with Dreyfus, the investment advisory fee is computed at the annual rate of 1% of the value of the fund’s average daily net assets and is payable monthly. Dreyfus has contractually agreed, from January 1, 2018 through May 1, 2019, to waive receipt of its fees and/or assume the direct expenses of the fund, so that the direct expenses of none of the classes (excluding Rule 12b-1 Distribution Plan fees, taxes, interest expense, brokerage commissions, commitment fees on borrowings and extraordinary expenses) exceed .86% of the value of the fund’s average daily net assets. On or after May 1, 2019, Dreyfus may terminate this expense limitation agreement at any time. The reduction in expenses, pursuant to the undertaking, amounted to $294,031 during the period ended December 31, 2018.
(b)Under the Distribution Plan adopted pursuant to Rule 12b-1 under the Act, Service shares pay the Distributor for distributing its shares, for servicing and/or maintaining Service shares’ shareholder accounts and for advertising and marketing for Service shares. The Distribution Plan provides for payments to be made at an annual rate of .25% of the value of the Service shares’ average daily net assets. The Distributor may make payments to Participating Insurance Companies and to brokers and dealers acting as principal underwriter for their variable insurance products. The fees payable under the Distribution Plan are payable without regard to actual expenses incurred. During the period ended December 31, 2018,Service shares were charged $79,951 pursuant to the Distribution Plan.
The fund has arrangements with the transfer agent and the custodian whereby the fund may receive earnings credits when positive cash balances are maintained, which are used to offset transfer agency and custody fees. For financial reporting purposes, the fund includes net earnings credits, if any, as an expense offset in the Statement of Operations.
The fund compensates Dreyfus Transfer, Inc., a wholly-owned subsidiary of Dreyfus, under a transfer agency agreement for providing transfer agency and cash management services for the fund. The majority of transfer agency fees are comprised of amounts paid on a per account basis, while cash management fees are related to fund subscriptions and redemptions. During the period ended December 31, 2018, the fund was
25
NOTES TO FINANCIAL STATEMENTS(continued)
charged $1,529 for transfer agency services. These fees are included in Shareholder servicing costs in the Statement of Operations.
The fund compensates The Bank of New York Mellon under a custody agreement for providing custodial services for the fund. These fees are determined based on net assets, geographic region and transaction activity. During the period ended December 31, 2018, the fund was charged $36,807 pursuant to the custody agreement.
During the period ended December 31, 2018, the fund was charged $12,774 for services performed by the Chief Compliance Officer and his staff. These fees are included in Miscellaneous in the Statement of Operations.
The components of “Due to The Dreyfus Corporation and affiliates” in the Statement of Assets and Liabilities consist of: investment advisory fees $37,175, Distribution Plan fees $5,586, custodian fees $19,419, Chief Compliance Officer fees $6,289 and transfer agency fees $147, which are offset against an expense reimbursement currently in effect in the amount of $46,903.
(c) Each Board member also serves as a Board member of other funds within the Dreyfus complex. Annual retainer fees and attendance fees are allocated to each fund based on net assets.
(d) During the period ended December 31, 2018, the fund received proceeds of $102 from a class action settlement from BNY Mellon related to foreign exchange transactions.
NOTE 4—Securities Transactions:
The aggregate amount of purchases and sales of investment securities, excluding short-term securities and forward contracts, during the period ended December 31, 2018, amounted to $40,726,917 and $46,411,517, respectively.
Derivatives: A derivative is a financial instrument whose performance is derived from the performance of another asset. The fund enters into International Swaps and Derivatives Association, Inc. Master Agreements or similar agreements (collectively, “Master Agreements”) with its over-the counter (“OTC”) derivative contract counterparties in order to, among other things, reduce its credit risk to counterparties. Master Agreements include provisions for general obligations, representations, collateral and events of default or termination. Under a Master Agreement, the fund may offset with the counterparty certain derivative financial instrument’s payables and/or receivables with collateral held and/or posted and create one single net payment in the event of default or termination.
26
Each type of derivative instrument that was held by the fund during the period ended December 31, 2018 is discussed below.
Forward Foreign Currency Exchange Contracts: The fund enters into forward contracts in order to hedge its exposure to changes in foreign currency exchange rates on its foreign portfolio holdings, to settle foreign currency transactions or as a part of its investment strategy. When executing forward contracts, the fund is obligated to buy or sell a foreign currency at a specified rate on a certain date in the future. With respect to sales of forward contracts, the fund incurs a loss if the value of the contract increases between the date the forward contract is opened and the date the forward contract is closed. The fund realizes a gain if the value of the contract decreases between those dates. With respect to purchases of forward contracts, the fund incurs a loss if the value of the contract decreases between the date the forward contract is opened and the date the forward contract is closed. The fund realizes a gain if the value of the contract increases between those dates. Any realized or unrealized gains or losses which occurred during the period are reflected in the Statement of Operations. The fund is exposed to foreign currency risk as a result of changes in value of underlying financial instruments. The fund is also exposed to credit risk associated with counterparty nonperformance on these forward contracts, which is generally limited to the unrealized gain on each open contract. This risk may be mitigated by Master Agreements, if any, between the fund and the counterparty and the posting of collateral, if any, by the counterparty to the fund to cover the fund’s exposure to the counterparty. Forward contracts open at December 31, 2018 are set forth in the Statement of Forward Foreign Currency Exchange Contracts.
The provisions of ASC Topic 210 “Disclosures about Offsetting Assets and Liabilities” require disclosure on the offsetting of financial assets and liabilities. These disclosures are required for certain investments, including derivative financial instruments subject to Master Agreements which are eligible for offsetting in the Statement of Assets and Liabilities and require the fund to disclose both gross and net information with respect to such investments. For financial reporting purposes, the fund does not offset derivative assets and derivative liabilities that are subject to Master Agreements in the Statement of Assets and Liabilities.
27
NOTES TO FINANCIAL STATEMENTS(continued)
At December 31, 2018, derivative assets and liabilities (by type) on a gross basis are as follows:
| | | | | | |
Derivative Financial Instruments: | | Assets ($) | | Liabilities ($) | |
Forward contracts | | 485 | | (590) | |
Total gross amount of derivative | | | | | |
assets and liabilities in the | | | | | |
Statement of Assets and Liabilities | | 485 | | (590) | |
Derivatives not subject to | | | | | |
Master Agreements | | - | | - | |
Total gross amount of assets | | | | | |
and liabilities subject to | | | | | |
Master Agreements | | 485 | | (590) | |
The following table presents derivative assets net of amounts available for offsetting under Master Agreements and net of related collateral received or pledged, if any, as of December 31, 2018:
| | | | | | | |
| | | | Financial | | | |
| | | | Instruments | | | |
| | | | and Derivatives | | | |
| | Gross Amount of | | Available | Collateral | | Net Amount of |
Counterparty | Assets ($) | 1 | for Offset ($) | Received ($) | | Assets ($) |
Citigroup | 485 | | (485) | - | | - |
| | | | | | | |
| | | | Financial | | | |
| | | | Instruments | | | |
| | | | and Derivatives | | | |
| | Gross Amount of | | Available | Collateral | | Net Amount of |
Counterparty | Liabilities ($) | 1 | for Offset ($) | Pledged ($) | | Liabilities ($) |
Citigroup | (590) | | 485 | - | | (105) |
| | | | | | | |
1 Absent a default event or early termination, OTC derivative assets and liabilities are presented at gross amounts and are not offset in the Statement of Assets and Liabilities. |
The following summarizes the average market value of derivatives outstanding duringthe period ended December 31, 2018:
| | | |
| | Average Market Value ($) |
Forward contracts | | 173,720 |
| | | |
At December 31, 2018, the cost of investments for federal income tax purposes was $47,282,715; accordingly, accumulated net unrealized depreciation on investments inclusive of derivative contracts was $5,002,741, consisting of $1,433,510 gross unrealized appreciation and $6,436,251 gross unrealized depreciation.
28
REPORT OF INDEPENDENT REGISTERED PUBLIC ACCOUNTING FIRM
To the Shareholders and the Board of Trustees of International Value Portfolio
Opinion on the Financial Statements
We have audited the accompanying statement of assets and liabilities of International Value Portfolio (the “Fund”) (one of the funds constituting Dreyfus Variable Investment Fund), including the statements of investments, investments in affiliated issuers and forward foreign currency exchange contracts, as of December 31, 2018, and the related statement of operations for the year then ended, the statements of changes in net assets for each of the two years in the period then ended, the financial highlights for each of the five years in the period then ended and the related notes (collectively referred to as the “financial statements”). In our opinion, the financial statements present fairly, in all material respects, the financial position of the Fund (one of the funds constituting Dreyfus Variable Investment Fund) at December 31, 2018, the results of its operations for the year then ended, the changes in its net assets for each of the two years in the period then ended and its financial highlights for each of the five years in the period then ended, in conformity with U.S. generally accepted accounting principles.
Basis for Opinion
These financial statements are the responsibility of the Fund’s management. Our responsibility is to express an opinion on the Fund’s financial statements based on our audits. We are a public accounting firm registered with the Public Company Accounting Oversight Board (United States) (“PCAOB”) and are required to be independent with respect to the Fund in accordance with the U.S. federal securities laws and the applicable rules and regulations of the Securities and Exchange Commission and the PCAOB.
We conducted our audits in accordance with the standards of the PCAOB. Those standards require that we plan and perform the audit to obtain reasonable assurance about whether the financial statements are free of material misstatement, whether due to error or fraud. The Fund is not required to have, nor were we engaged to perform, an audit of the Fund’s internal control over financial reporting. As part of our audits, we are required to obtain an understanding of internal control over financial reporting, but not for the purpose of expressing an opinion on the effectiveness of the Fund’s internal control over financial reporting. Accordingly, we express no such opinion.
Our audits included performing procedures to assess the risks of material misstatement of the financial statements, whether due to error or fraud, and performing procedures that respond to those risks. Such procedures included examining, on a test basis, evidence regarding the amounts and disclosures in the financial statements. Our procedures included confirmation of securities owned as of December 31, 2018, by correspondence with the custodian and others or by other appropriate auditing procedures where replies from others were not received. Our audits also included evaluating the accounting principles used and significant estimates made by management, as well as evaluating the overall presentation of the financial statements. We believe that our audits provide a reasonable basis for our opinion.

We have served as the auditor of one or more Dreyfus investment companies since at least 1957, but we are unable to determine the specific year.
New York, New York
February 11, 2019
29
IMPORTANT TAX INFORMATION(Unaudited)
In accordance with federal tax law, the fund elects to provide each shareholder with their portion of the fund’s foreign taxes paid and the income sourced from foreign countries. Accordingly, the fund hereby reports the following information regarding its fiscal year ended December 31, 2018:
- the total amount of taxes paid to foreign countries was $128,060.
- the total amount of income sourced from foreign countries was $1,545,122.
Where required by federal tax law rules, shareholders will receive notification of their proportionate share of foreign taxes paid and foreign sourced income for the 2018 calendar year with Form 1099-DIV which will be mailed in early 2019.
30
BOARD MEMBERS INFORMATION(Unaudited)
INDEPENDENT BOARD MEMBERS
Joseph S. DiMartino (75)
Chairman of the Board (1995)
Principal Occupation During Past 5 Years:
· Corporate Director and Trustee (1995-present)
Other Public Company Board Memberships During Past 5 Years:
· CBIZ (formerly, Century Business Services, Inc.), a provider of outsourcing functions for small and medium size companies, Director (1997-present)
No. of Portfolios for which Board Member Serves:122
———————
Peggy C. Davis (75)
Board Member (2006)
Principal Occupation During Past 5 Years:
· Shad Professor of Law, New York University School of Law (1983-present)
No. of Portfolios for which Board Member Serves: 45
———————
David P. Feldman (79)
Board Member (1994)
Principal Occupation During Past 5 Years:
· Corporate Director and Trustee (1985-present)
Other Public Company Board Memberships During Past 5 Years:
· BBH Mutual Funds Group (5 registered mutual funds), Director (1992-2014)
No. of Portfolios for which Board Member Serves:31
———————
Joan Gulley (71)
Board Member (2017)
Principal Occupation During Past 5 Years:
· PNC Financial Services Group, Inc.(1993-2014), Executive Vice President and Chief Human Resources Officer and Executive Committee Member (2008-2014)
No. of Portfolios for which Board Member Serves:52
———————
31
BOARD MEMBERS INFORMATION (Unaudited) (continued)
INDEPENDENT BOARD MEMBERS (continued)
Ehud Houminer (78)
Board Member (2006)
Principal Occupation During Past 5 Years:
· Board of Overseers at the Columbia Business School, Columbia University (1992-present)
· Trustee, Ben Gurion University
No. of Portfolios for which Board Member Serves: 52
———————
Lynn Martin (79)
Board Member (2012)
Principal Occupation During Past 5 Years:
· President of The Martin Hall Group LLC, a human resources consulting firm (2005-2012)
No. of Portfolios for which Board Member Serves:31
———————
Robin A. Melvin (55)
Board Member (2012)
Principal Occupation During Past 5 Years:
· Co-chairman, Illinois Mentoring Partnership, non-profit organization dedicated to increasing the quantity and quality of mentoring services in Illinois; (2014-present; board member since 2013)
No. of Portfolios for which Board Member Serves:99
———————
Dr. Martin Peretz (79)
Board Member (1990)
Principal Occupation During Past 5 Years:
· Editor-in-Chief Emeritus of The New Republic Magazine (2011-2012) (previously,
Editor-in-Chief, 1974-2011)
· Lecturer at Harvard University (1968-2010)
No. of Portfolios for which Board Member Serves:31
———————
Once elected all Board Members serve for an indefinite term, but achieve Emeritus status upon reaching age 80. The address of the Board Members and Officers is c/o The Dreyfus Corporation, 200 Park Avenue, New York, New York 10166. Additional information about the Board Members is available in the fund’s Statement of Additional Information which can be obtained from Dreyfus free of charge by calling this toll free number: 1-800-DREYFUS.
James F. Henry, Emeritus Board Member
Philip L. Toia, Emeritus Board Member
32
OFFICERS OF THE FUND(Unaudited)
BRADLEY J. SKAPYAK, President since January 2010.
Chief Operating Officer and a director of the Manager since June 2009, Chairman of Dreyfus Transfer, Inc., an affiliate of the Manager and the transfer agent of the funds, since May 2011 and Chief Executive Officer of MBSC Securities Corporation since August 2016. He is an officer of 62 investment companies (comprised of 122 portfolios) managed by the Manager. He is 60 years old and has been an employee of the Manager since February 1988.
BENNETT A. MACDOUGALL, Chief Legal Officer since October 2015.
Chief Legal Officer of the Manager and Associate General Counsel and Managing Director of BNY Mellon since June 2015; from June 2005 to June 2015, he served in various capacities with Deutsche Bank – Asset & Wealth Management Division, including as Director and Associate General Counsel, and Chief Legal Officer of Deutsche Investment Management Americas Inc. from June 2012 to May 2015. He is an officer of 63 investment companies (comprised of 147 portfolios) managed by the Manager. He is 47 years old and has been an employee of the Manager since June 2015.
JAMES BITETTO, Vice President since August 2005 and Secretary since February 2018.
Managing Counsel of BNY Mellon and Secretary of the Manager, and an officer of 63 investment companies (comprised of 147 portfolios) managed by the Manager. He is 52 years old and has been an employee of the Manager since December 1996.
SONALEE CROSS, Vice President and Assistant Secretary since March 2018.
Counsel of BNY Mellon since October 2016; Associate at Proskauer Rose LLP from April 2016 to September 2016; Attorney at EnTrust Capital from August 2015 to February 2016; Associate at Sidley Austin LLP from September 2013 until August 2015. She is an officer of 63 investment companies (comprised of 147 portfolios) managed by Dreyfus. She is 31 years old and has been an employee of the Manager since October 2016.
SARAH S. KELLEHER, Vice President and Assistant Secretary since April 2014.
Managing Counsel of BNY Mellon since December 2017, from March 2013 to December 2017, Senior Counsel of BNY Mellon. She is an officer of 63 investment companies (comprised of 147 portfolios) managed by the Manager. She is 43 years old and has been an employee of the Manager since March 2013.
JEFF PRUSNOFSKY, Vice President and Assistant Secretary since August 2005.
Senior Managing Counsel of BNY Mellon, and an officer of 63 investment companies (comprised of 147 portfolios) managed by the Manager. He is 53 years old and has been an employee of the Manager since October 1990.
NATALYA ZELENSKY, Vice President and Assistant Secretary since March 2017.
Counsel of BNY Mellon since May 2016; Attorney at Wildermuth Endowment Strategy Fund/Wildermuth Advisory, LLC from November 2015 until May 2016; Assistant General Counsel at RCS Advisory Services from July 2014 until November 2015; Associate at Sutherland, Asbill & Brennan from January 2013 until January 2014. She is an officer of 63 investment companies (comprised of 147 portfolios) managed by Dreyfus. She is 33 years old and has been an employee of the Manager since May 2016.
JAMES WINDELS, Treasurer since November 2001.
Director – Mutual Fund Accounting of the Manager, and an officer of 63 investment companies (comprised of 147 portfolios) managed by the Manager. He is 60 years old and has been an employee of the Manager since April 1985.
GAVIN C. REILLY, Assistant Treasurer since December 2005.
Tax Manager of the Investment Accounting and Support Department of the Manager, and an officer of 63 investment companies (comprised of 147 portfolios) managed by the Manager. He is 50 years old and has been an employee of the Manager since April 1991.
ROBERT S. ROBOL, Assistant Treasurer since August 2005.
Senior Accounting Manager – Dreyfus Financial Reporting of the Manager, and an officer of 63 investment companies (comprised of 147 portfolios) managed by the Manager. He is 54 years old and has been an employee of the Manager since October 1988.
33
OFFICERS OF THE FUND (Unaudited)(continued)
ROBERT SALVIOLO, Assistant Treasurer since July 2007.
Senior Accounting Manager – Equity Funds of the Manager, and an officer of 63 investment companies (comprised of 147 portfolios) managed by the Manager. He is 51 years old and has been an employee of the Manager since June 1989.
ROBERT SVAGNA, Assistant Treasurer since December 2002.
Senior Accounting Manager – Fixed Income and Equity Funds of the Manager, and an officer of 63 investment companies (comprised of 147 portfolios) managed by the Manager. He is 51 years old and has been an employee of the Manager since November 1990.
JOSEPH W. CONNOLLY, Chief Compliance Officer since October 2004.
Chief Compliance Officer of the Manager, the Dreyfus Family of Funds and BNY Mellon Funds Trust (63 investment companies, comprised of 147 portfolios). He is 61 years old and has served in various capacities with the Manager since 1980, including manager of the firm’s Fund Accounting Department from 1997 through October 2001.
CARIDAD M. CAROSELLA, Anti-Money Laundering Compliance Officer since January 2016.
Anti-Money Laundering Compliance Officer of the Dreyfus Family of Funds and BNY Mellon Funds Trust since January 2016; from May 2015 to December 2015, Interim Anti-Money Laundering Compliance Officer of the Dreyfus Family of Funds and BNY Mellon Funds Trust and the Distributor; from January 2012 to May 2015, AML Surveillance Officer of the Distributor and from 2007 to December 2011, Financial Processing Manager of the Distributor. She is an officer of 57 investment companies (comprised of 141 portfolios) managed by the Manager. She is 50 years old and has been an employee of the Distributor since 1997.
34
NOTES
35
NOTES
36
NOTES
37
Dreyfus Variable Investment Fund, International Value Portfolio
200 Park Avenue
New York, NY 10166
Investment Adviser
The Dreyfus Corporation
200 Park Avenue
New York, NY 10166
Custodian
The Bank of New York Mellon
240 Greenwich Street
New York, NY 10286
Transfer Agent &
Dividend Disbursing Agent
Dreyfus Transfer, Inc.
200 Park Avenue
New York, NY 10166
Distributor
MBSC Securities Corporation
200 Park Avenue
New York, NY 10166
Telephone 1-800-258-4260 or 1-800-258-4261
Mail The Dreyfus Family of Funds, 144 Glenn Curtiss Boulevard, Uniondale, NY 11556-0144 Attn: Institutional Services Department
E-mailSend your request toinfo@dreyfus.com
InternetInformation can be viewed online or downloaded atwww.dreyfus.com
The fund files its complete schedule of portfolio holdings with the Securities and Exchange Commission (“SEC”) for the first and third quarters of each fiscal year on Form N-Q. The fund’s Forms N-Q are available on the SEC’s website at http://www.sec.gov and may be reviewed and copied at the SEC’s Public Reference Room in Washington, D.C. Information on the operation of the Public Reference Room may be obtained by calling 1-800-SEC-0330.
A description of the policies and procedures that the fund uses to determine how to vote proxies relating to portfolio securities, and information regarding how the fund voted these proxies for the most recent 12-month period ended June 30 is available at http://www.dreyfus.com and on the SEC’s website at http://www.sec.gov. The description of the policies and procedures is also available without charge, upon request, by calling 1-800-DREYFUS.
| | |
© 2019 MBSC Securities Corporation
0152AR1218 | 
|
Dreyfus Variable Investment Fund, Opportunistic Small Cap Portfolio
| | | |

| | ANNUAL REPORT December 31, 2018 |
| |
The views expressed in this report reflect those of the portfolio manager(s) only through the end of the period covered and do not necessarily represent the views of Dreyfus or any other person in the Dreyfus organization. Any such views are subject to change at any time based upon market or other conditions and Dreyfus disclaims any responsibility to update such views. These views may not be relied on as investment advice and, because investment decisions for a Dreyfus fund are based on numerous factors, may not be relied on as an indication of trading intent on behalf of any Dreyfus fund. |
| |
Not FDIC-Insured • Not Bank-Guaranteed • May Lose Value |
Contents
T H E F U N D
F O R M O R E I N F O R M AT I O N
Back Cover
| | | | |
| |
Dreyfus Variable Investment Fund, Opportunistic Small Cap Portfolio
| | The Fund |
A LETTER FROM THE PRESIDENT OF DREYFUS
Dear Shareholder:
We are pleased to present this annual report for Dreyfus Variable Investment Fund, Opportunistic Small Cap Portfolio, covering the 12-month period from January 1, 2018 through December 31, 2018. For information about how the fund performed during the reporting period, as well as general market perspectives, we provide a Discussion of Fund Performance on the pages that follow.
The reporting period began with major global economies achieving above-trend growth. In the United States, a robust economy and strong labor market encouraged the Federal Reserve to continue moving away from its accommodative monetary policy while other major central banks began to consider monetary tightening. Both U.S. and non-U.S. equity markets remained on an uptrend. Interest rates rose across the yield curve, putting pressure on bond prices.
A few months into the reporting period, global growth trends began to diverge and market volatility returned. While the U.S. economy continued to grow at a healthy rate, other developed markets began to weaken. However, robust growth and strong corporate earnings continued to support U.S. stock returns while other developed markets declined throughout the summer. In the fall, a broad sell-off occurred, partially offsetting earlier U.S. gains. Emerging markets remained under pressure as weakness in their currencies relative to the U.S. dollar added to investors’ uneasiness. Global equities continued their general decline through the end of the period.
Fixed income markets struggled during the first half of the period as interest rates rose and favorable U.S. equity markets fed investor risk appetites. However, in autumn volatility crept in, the yield curve began a flattening trend that continued through the end of December. As long-term debt yields fell, prices rose for many bonds, leading to moderately positive returns for several fixed income market sectors.
Despite continuing political variables, U.S. inflationary pressures and flagging growth rates, we are optimistic that the U.S. economy will remain strong in the near term. However, we remain attentive to signs that point to potential changes on the horizon. As always, we encourage you to discuss the risks and opportunities in today’s investment environment with your financial advisor.
Thank you for your continued confidence and support.
Sincerely,

Renee Laroche-Morris
President
The Dreyfus Corporation
January 15, 2019
2
DISCUSSION OF FUND PERFORMANCE(Unaudited)
For the period from January 1, 2018 through December 31, 2018, as provided by David A. Daglio, Primary Portfolio Manager; James Boyd, Dale Dutile, and Brian Duncan, Portfolio Managers
Market and Fund Performance Overview
For the 12-month period ended December 31, 2018, Dreyfus Variable Investment Fund, Opportunistic Small Cap Portfolio’s Initial shares produced a total return of -19.08% and its Service shares produced a total return of -19.29%.1In comparison, the Russell 2000® Index (the “Index”), the fund’s benchmark, produced a total return of -11.01% for the same period.2
Small cap stocks sold off late in the reporting period amid market volatility and growing concerns about rising interest rates, corporate earnings and global economic growth. The fund lagged the Index mainly due to security selection shortfalls in the health care, materials, and industrials sectors.
The Fund’s Investment Approach
The fund seeks capital growth. To pursue its goal, the fund normally invests at least 80% of its net assets, plus any borrowings for investment purposes, in the stocks of small cap companies. The fund currently considers small cap companies to be those companies with market capitalizations that fall within the range of the companies in the Index. Stocks are selected for the fund’s portfolio based primarily on bottom-up fundamental analysis. The fund’s portfolio managers use a disciplined investment process that relies, in general, on proprietary fundamental research and valuation.
Generally, elements of the process include analysis of mid-cycle business prospects, estimation of the intrinsic value of the company, and the identification of a revaluation trigger catalyst. In general, the fund seeks exposure to securities and sectors that are perceived to be attractive from a valuation and fundamental standpoint.
Markets Hurt by Late Sell-Off
U.S. equity markets were supported at the start of 2018 by a positive economic backdrop including moderate GDP growth, robust labor markets and higher growth forecasts from the Federal Reserve Board (the “Fed”). Enactment of corporate tax cuts, as part of major tax reform legislation in late December 2017 sparked additional market gains, driving the Index to new all-time highs in January.
Economic data in January indicated robust levels of consumer spending during the critical year-end shopping season and long-awaited signs of wage growth began to appear. However, concerns about rising inflationary pressures and prospects for more aggressive interest-rate hikes soon began to weigh on market sentiment, sparking renewed volatility that sent stock prices sharply lower in early February. Political rhetoric regarding potentially protectionist U.S. trade policies also took a toll on many stocks, while rising bond yields further contributed to heightened volatility.
Small cap stocks fared particularly well over the second quarter of 2018. Despite an additional interest rate hike from the Fed, the Index rallied in an environment of persistently strong economic growth, rising corporate earnings and higher levels of merger-and-acquisitions activity. In addition, investors concerned about the impact of trade tariffs on large, multinational companies increasingly rotated to more domestically oriented small cap companies.
Stocks gained ground early in the second half of the reporting period, as economic and earnings data remained robust, offsetting the effects of interest rate hikes by the Fed, political turmoil in Europe and the currency crisis in Turkey.
Late in the reporting period, however, stocks sold off broadly on concerns about rising interest rates and slowing global economic growth. Stocks were also hindered by ongoing trade tensions with China and by an anticipated slowdown in the Chinese economy. Pressures on tariff-sensitive industries and lower-than-expected earnings in the technology sector, in particular, weighed on returns.
3
DISCUSSION OF FUND PERFORMANCE(Unaudited) (continued)
Security Selection Constrained Fund Performance
The fund’s performance versus the Index was mainly the result of a broad-based compression of valuations in the health care, materials and industrials sectors. In the health care sector, SAGE Therapeutics and Flexion Therapeutics lagged due to a lack of new product announcements and marketing arrangements. While TherapeuticsMD received approval for a new product, the market has been slow to react to news of their 2019 scheduled launch. In the materials sector, US Concrete and Eagle Materials encountered sluggish demand for building materials due to weather-related construction delays. Among industrials companies, car rental agency Avis Budget Group was hurt by concerns regarding pricing pressures, while freight carrier Knight-Swift Transportation Holdings struggled to improve its overall operating effectiveness.
The fund achieved better relative results in the information technology sector, particularly in communications equipment and IT services. In communications equipment, Ciena performed well on strong orders whileFinisar received a takeover offer from II-VI, Inc. at a premium to its market price. In IT services,LiveRamp received an offer for its marketing services division, which caused the stock to rally. The fund also benefited from its position in electronic payments specialistVerifone Systems, which was purchased at a substantial premium to its stock price at the time. The fund gained further from an underweight to the lagging consumer staples sector.
Late Sell-Off Likely Represents an Overreaction
We believe the market sell-off of late 2018 represents an overreaction to legitimate, but short-term, concerns, and that given still-favorable economic and business fundamentals, the decline has resulted in attractive investment opportunities. In addition, with trade tensions likely to continue, we believe investors are likely to continue favoring smaller companies that are not expected to be as affected by protectionist U.S. policies. Although the market’s current volatility is likely to continue, the team remains optimistic given the fund’s historical performance in similar conditions.
January 15, 2019
¹ Total return includes reinvestment of dividends and any capital gains paid. Past performance is no guarantee of future results. Share price and investment return fluctuate such that upon redemption, fund shares may be worth more or less than their original cost. The fund’s performance does not reflect the deduction of additional charges and expenses imposed in connection with investing in variable insurance contracts, which will reduce returns.
² Source: Lipper Inc. — The Russell 2000®Index measures the performance of the small-cap segment of the U.S. equity universe. The Russell 2000 Index is a subset of the Russell 3000® Index representing approximately 10% of the total market capitalization of that index. It includes approximately 2,000 of the smallest securities based on a combination of their market cap and current index membership. The Russell 2000 is constructed to provide a comprehensive and unbiased small-cap barometer and is completely reconstituted annually to ensure larger stocks do not distort the performance and characteristics of the true small-cap opportunity set. Investors cannot invest directly in any index.
Please note: the position in any security highlighted with italicized typeface was sold during the reporting period.
Equities are subject generally to market, market sector, market liquidity, issuer, and investment style risks, among other factors, to varying degrees, all of which are more fully described in the fund’s prospectus.
Stocks of small- and/or mid-cap companies often experience sharper price fluctuations than stocks of large-cap companies.
The fund is only available as a funding vehicle under variable life insurance policies or variable annuity contracts issued by insurance companies. Individuals may not purchase shares of the fund directly. A variable annuity is an insurance contract issued by an insurance company that enables investors to accumulate assets on a tax-deferred basis for retirement or other long-term goals. The investment objective and policies of Dreyfus Variable Investment Fund, Opportunistic Small Cap Portfolio made available through insurance products may be similar to those of other funds managed or advised by Dreyfus. However, the investment results of the fund may be higher or lower than, and may not be comparable to, those of any other Dreyfus fund.
4
FUND PERFORMANCE(Unaudited)

Comparison of change in value of $10,000 investment in Dreyfus Variable Investment Fund, Opportunistic Small Cap Portfolio Initial shares and Service shares and the Russell 2000® Index (the “Index”)
† Source: Lipper Inc.
Past performance is not predictive of future performance. The fund’s performance does not reflect the deduction of additional charges and expenses imposed in connection with investing in variable insurance contracts which will reduce returns.
The above graph compares a $10,000 investment made in Initial and Service shares of Dreyfus Variable Investment Fund, Opportunistic Small Cap Portfolio on 12/31/08 to a $10,000 investment made in the Index on that date.
The fund’s performance shown in the line graph above takes into account all applicable fees and expenses. The Index measures the performance of the small-cap segment of the U.S. equity universe. The Index is a subset of the Russell 3000®Index representing approximately 10% of the total market capitalization of that index. It includes approximately 2,000 of the smallest securities based on a combination of their market cap and current index membership. The Index is constructed to provide a comprehensive and unbiased small-cap barometer and is completely reconstituted annually to ensure larger stocks do not distort the performance and characteristics of the true small-cap opportunity set. Unlike a mutual fund, the Index is not subject to charges, fees and other expenses. Investors cannot invest directly in any index. Further information relating to fund performance, including expense reimbursements, if applicable, is contained in the Financial Highlights section of the prospectus and elsewhere in this report.
| | | | |
Average Annual Total Returns as of 12/31/18 |
| 1 Year | 5 Years | 10 Years |
Initial shares | -19.08% | 3.24% | 11.58% |
Service shares | -19.29% | 2.98% | 11.30% |
Russell 2000® Index | -11.01% | 4.41% | 11.97% |
The performance data quoted represents past performance, which is no guarantee of future results. Share price and investment return fluctuate and an investor’s shares may be worth more or less than original cost upon redemption. Current performance may be lower or higher than the performance quoted. Go to Dreyfus.com for the fund’s most recent month-end returns.
The fund’s Initial shares are not subject to a Rule 12b-1 fee. The fund’s Service shares are subject to a 0.25% annual Rule 12b-1 fee. All dividends and capital gain distributions are reinvested.
The fund’s performance shown in the graph and table does not reflect the deduction of taxes that a shareholder would pay on fund distributions or the redemption of fund shares.
5
UNDERSTANDING YOUR FUND’S EXPENSES(Unaudited)
As a mutual fund investor, you pay ongoing expenses, such as management fees and other expenses. Using the information below, you can estimate how these expenses affect your investment and compare them with the expenses of other funds. You also may pay one-time transaction expenses, including sales charges (loads), redemption fees and expenses associated with variable annuity or insurance contracts, which are not shown in this section and would have resulted in higher total expenses. For more information, see your fund’s prospectus or talk to your financial adviser.
Review your fund’s expenses
The table below shows the expenses you would have paid on a $1,000 investment in Dreyfus Variable Investment Fund, Opportunistic Small Cap Portfolio from July 1, 2018 to December 31, 2018. It also shows how much a $1,000 investment would be worth at the close of the period, assuming actual returns and expenses.
| | | | | | | | | |
Expenses and Value of a $1,000 Investment |
assuming actual returns for the six months ended December 31, 2018 |
| | | | | | Initial Shares | Service Shares |
Expenses paid per $1,000† | | | | | | $3.74 | | $4.85 |
Ending value (after expenses) | | | | | | $767.30 | | $766.40 |
COMPARING YOUR FUND’S EXPENSES
WITH THOSE OF OTHER FUNDS(Unaudited)
Using the SEC’s method to compare expenses
The Securities and Exchange Commission (“SEC”) has established guidelines to help investors assess fund expenses. Per these guidelines, the table below shows your fund’s expenses based on a $1,000 investment, assuming a hypothetical 5% annualized return. You can use this information to compare the ongoing expenses (but not transaction expenses or total cost) of investing in the fund with those of other funds. All mutual fund shareholder reports will provide this information to help you make this comparison. Please note that you cannot use this information to estimate your actual ending account balance and expenses paid during the period.
| | | | | | | | | |
Expenses and Value of a $1,000 Investment |
assuming a hypothetical 5% annualized return for the six months ended December 31, 2018 |
| | | | | | Initial Shares | Service Shares |
Expenses paid per $1,000† | | | | | | $4.28 | | $5.55 |
Ending value (after expenses) | | | | | | $1,020.97 | | $1,019.71 |
† Expenses are equal to the fund’s annualized expense ratio of .84% for Initial shares and 1.09% for Service shares, multiplied by the average account value over the period, multiplied by 184/365 (to reflect the one-half year period).
6
STATEMENT OF INVESTMENTS
December 31, 2018
| | | | | | | | |
| |
Description | | | | Shares | | Value ($) | |
Common Stocks - 99.4% | | | | | |
Automobiles & Components - 2.2% | | | | | |
Delphi Technologies | | | | 189,431 | a | 2,712,652 | |
Visteon | | | | 13,521 | a,b | 815,046 | |
| | | | | 3,527,698 | |
Banks - 8.1% | | | | | |
Ameris Bancorp | | | | 38,312 | | 1,213,341 | |
Atlantic Capital Bancshares | | | | 105,507 | b | 1,727,150 | |
First BanCorp | | | | 323,111 | | 2,778,755 | |
First Interstate BancSystem, Cl. A | | | | 64,053 | | 2,341,778 | |
First Merchants | | | | 37,287 | | 1,277,825 | |
Great Western Bancorp | | | | 42,811 | | 1,337,844 | |
Union Bankshares | | | | 85,958 | | 2,426,594 | |
| | | | | 13,103,287 | |
Capital Goods - 4.8% | | | | | |
Capitol Investment Corp. IV | | | | 127,394 | b | 1,317,254 | |
Simpson Manufacturing Co. | | | | 56,045 | | 3,033,716 | |
Tennant Co. | | | | 26,192 | | 1,364,865 | |
TPG Pace Holdings | | | | 89,822 | b | 935,945 | |
Wesco Aircraft Holdings | | | | 139,728 | b | 1,103,851 | |
| | | | | 7,755,631 | |
Commercial & Professional Services - .7% | | | | | |
Covanta Holding | | | | 88,800 | a | 1,191,696 | |
Consumer Durables & Apparel - .8% | | | | | |
G-III Apparel Group | | | | 45,821 | b | 1,277,948 | |
Consumer Services - 5.6% | | | | | |
Adtalem Global Education | | | | 82,444 | b | 3,901,250 | |
Dave & Buster's Entertainment | | | | 83,202 | a | 3,707,481 | |
Penn National Gaming | | | | 75,415 | a,b | 1,420,065 | |
| | | | | 9,028,796 | |
Diversified Financials - 5.3% | | | | | |
Green Dot, Cl. A | | | | 34,441 | b | 2,738,748 | |
OneMain Holdings | | | | 151,468 | b | 3,679,158 | |
SLM | | | | 268,179 | b | 2,228,567 | |
| | | | | 8,646,473 | |
Energy - 10.7% | | | | | |
Arch Coal | | | | 6,084 | a | 504,911 | |
Ardmore Shipping | | | | 146,155 | b | 682,544 | |
Comstock Resources | | | | 138,646 | a,b | 628,066 | |
Delek US Holdings | | | | 111,867 | a | 3,636,796 | |
Euronav | | | | 105,266 | | 729,493 | |
GasLog | | | | 53,589 | | 882,075 | |
Green Plains | | | | 192,747 | a | 2,526,913 | |
7
STATEMENT OF INVESTMENTS (continued)
| | | | | | | | |
| |
Description | | | | Shares | | Value ($) | |
Common Stocks - 99.4% (continued) | | | | | |
Energy - 10.7% (continued) | | | | | |
Laredo Petroleum | | | | 364,097 | b | 1,318,031 | |
Navigator Holdings | | | | 46,432 | b | 436,461 | |
PBF Energy, Cl. A | | | | 58,681 | | 1,917,108 | |
Scorpio Tankers | | | | 1,353,356 | a | 2,381,907 | |
Select Energy Services, Cl. A | | | | 263,562 | a,b | 1,665,712 | |
| | | | | 17,310,017 | |
Food & Staples Retailing - .6% | | | | | |
US Foods Holding | | | | 31,103 | b | 984,099 | |
Food, Beverage & Tobacco - 1.1% | | | | | |
Darling Ingredients | | | | 93,684 | b | 1,802,480 | |
Health Care Equipment & Services - 4.0% | | | | | |
AxoGen | | | | 113,026 | a,b | 2,309,121 | |
Evolent Health, Cl. A | | | | 208,319 | a,b | 4,155,964 | |
| | | | | 6,465,085 | |
Materials - 15.5% | | | | | |
Alamos Gold | | | | 819,190 | | 2,949,084 | |
Cabot | | | | 103,010 | | 4,423,249 | |
Eagle Materials | | | | 35,789 | | 2,184,203 | |
IAMGOLD | | | | 672,867 | b | 2,476,151 | |
Methanex | | | | 33,969 | | 1,636,287 | |
OMNOVA Solutions | | | | 373,285 | b | 2,736,179 | |
Orion Engineered Carbons | | | | 70,768 | | 1,789,015 | |
Tahoe Resources | | | | 783,177 | b | 2,858,596 | |
TimkenSteel | | | | 79,761 | a,b | 697,111 | |
US Concrete | | | | 94,753 | a,b | 3,342,886 | |
| | | | | 25,092,761 | |
Media & Entertainment - 6.5% | | | | | |
Criteo, ADR | | | | 213,178 | a,b | 4,843,404 | |
Gray Television | | | | 93,101 | a,b | 1,372,309 | |
Nexstar Media Group, Cl. A | | | | 28,073 | a | 2,207,661 | |
Sinclair Broadcast Group, Cl. A | | | | 82,515 | | 2,173,445 | |
| | | | | 10,596,819 | |
Pharmaceuticals Biotechnology & Life Sciences - 13.3% | | | | | |
Aerie Pharmaceuticals | | | | 52,646 | a,b | 1,900,521 | |
DBV Technologies, ADR | | | | 188,534 | a,b | 1,210,388 | |
Flexion Therapeutics | | | | 140,552 | a,b | 1,591,049 | |
G1 Therapeutics | | | | 46,030 | a,b | 881,475 | |
PRA Health Sciences | | | | 8,773 | b | 806,765 | |
Revance Therapeutics | | | | 228,475 | a,b | 4,599,202 | |
SAGE Therapeutics | | | | 24,617 | a,b | 2,358,062 | |
TherapeuticsMD | | | | 1,258,312 | b | 4,794,169 | |
Zogenix | | | | 92,157 | b | 3,360,044 | |
| | | | | 21,501,675 | |
8
| | | | | | | | |
| |
Description | | | | Shares | | Value ($) | |
Common Stocks - 99.4% (continued) | | | | | |
Software & Services - 5.4% | | | | | |
Cardtronics | | | | 129,588 | b | 3,369,288 | |
CommVault Systems | | | | 21,418 | b | 1,265,590 | |
Talend, ADR | | | | 112,185 | a,b | 4,159,820 | |
| | | | | 8,794,698 | |
Technology Hardware & Equipment - 4.9% | | | | | |
Ciena | | | | 173,773 | b | 5,892,642 | |
Sierra Wireless | | | | 154,133 | b | 2,070,006 | |
| | | | | 7,962,648 | |
Transportation - 9.9% | | | | | |
Avis Budget Group | | | | 35,582 | b | 799,883 | |
Knight-Swift Transportation Holdings | | | | 125,506 | a | 3,146,435 | |
Mesa Air Group | | | | 97,115 | | 748,757 | |
Scorpio Bulkers | | | | 282,792 | | 1,563,840 | |
SkyWest | | | | 89,467 | | 3,978,598 | |
Werner Enterprises | | | | 196,249 | a | 5,797,195 | |
| | | | | 16,034,708 | |
Total Common Stocks(cost $185,673,600) | | | | 161,076,519 | |
| | | | | Number of Warrants | | | |
Warrants - .1% | | | | | |
Retailing - .1% | | | | | |
Waitr Holdings (6/1/23)
(cost $42,227) | | | | 60,324 | | 87,470 | |
| | | 1-Day
Yield (%) | | Shares | | | |
Investment Companies - .6% | | | | | |
Registered Investment Companies - .6% | | | | | |
Dreyfus Institutional Preferred Government Plus Money Market Fund
(cost $982,326) | | 2.32 | | 982,326 | c | 982,326 | |
9
STATEMENT OF INVESTMENTS (continued)
| | | | | | | | |
| |
Description | | 1-Day
Yield (%) | | Shares | | Value ($) | |
Investment of Cash Collateral for Securities Loaned - 2.1% | | | | | |
Registered Investment Companies - 2.1% | | | | | |
Dreyfus Institutional Preferred Government Money Market Fund, Institutional Shares
(cost $3,449,708) | | 2.69 | | 3,449,708 | c | 3,449,708 | |
Total Investments(cost $190,147,861) | | 102.2% | | 165,596,023 | |
Liabilities, Less Cash and Receivables | | (2.2%) | | (3,575,028) | |
Net Assets | | 100.0% | | 162,020,995 | |
ADR—American Depository Receipt
a Security, or portion thereof, on loan. At December 31, 2018, the value of the fund’s securities on loan was $35,717,811 and the value of the collateral held by the fund was $36,167,037, consisting of cash collateral of $3,449,708 and U.S. Government & Agency securities valued at $32,717,329.
b Non-income producing security.
c Investment in affiliated issuer. The investment objective of this investment company is publicly available and can be found within the investment company’s prospectus.
| | |
Portfolio Summary (Unaudited)† | Value (%) |
Health Care | 17.3 |
Materials | 15.5 |
Industrials | 14.0 |
Financials | 13.4 |
Energy | 10.7 |
Information Technology | 10.4 |
Consumer Discretionary | 8.6 |
Communication Services | 6.5 |
Investment Companies | 2.7 |
Consumer Staples | 1.7 |
Diversified | 1.4 |
| | 102.2 |
† Based on net assets.
See notes to financial statements.
10
STATEMENT OF INVESTMENTS IN AFFILIATED ISSUERS
| | | | | | | |
Registered Investment Company | Value
12/31/17($) | Purchases($) | Sales($) | Value
12/31/18($) | Net
Assets(%) | Dividends/
Distributions($) |
Dreyfus Institutional Preferred Government Plus Money Market Fund | 3,920,146 | 56,295,846 | 59,233,666 | 982,326 | .6 | 62,954 |
Dreyfus Institutional Preferred Government Money Market Fund, Institutional Shares | 16,964,289 | 106,379,097 | 119,893,678 | 3,449,708 | 2.1 | - |
Total | 20,884,435 | 162,674,943 | 179,127,344 | 4,432,034 | 2.7 | 62,954 |
See notes to financial statements.
11
STATEMENT OF ASSETS AND LIABILITIES
December 31, 2018
| | | | | | | |
| | | | | | |
| | | Cost | | Value | |
Assets ($): | | | | |
Investments in securities—See Statement of Investments
(including securities on loan, valued at $35,717,811)—Note 1(b): | | | |
Unaffiliated issuers | 185,715,827 | | 161,163,989 | |
Affiliated issuers | | 4,432,034 | | 4,432,034 | |
Receivable for shares of Beneficial Interest subscribed | | 98,059 | |
Dividends and securities lending income receivable | | 78,219 | |
Receivable for investment securities sold | | 4,013 | |
Prepaid expenses | | | | | 5,782 | |
| | | | | 165,782,096 | |
Liabilities ($): | | | | |
Due to The Dreyfus Corporation and affiliates—Note 3(b) | | | | 125,813 | |
Liability for securities on loan—Note 1(b) | | 3,449,708 | |
Payable for shares of Beneficial Interest redeemed | | 129,084 | |
Trustees fees and expenses payable | | 1,400 | |
Accrued expenses | | | | | 55,096 | |
| | | | | 3,761,101 | |
Net Assets ($) | | | 162,020,995 | |
Composition of Net Assets ($): | | | | |
Paid-in capital | | | | | 155,619,038 | |
Total distributable earnings (loss) | | | | | 6,401,957 | |
Net Assets ($) | | | 162,020,995 | |
| | | | |
Net Asset Value Per Share | Initial Shares | Service Shares | |
Net Assets ($) | 146,730,156 | 15,290,839 | |
Shares Outstanding | 3,561,279 | 386,780 | |
Net Asset Value Per Share ($) | 41.20 | 39.53 | |
| | | | |
See notes to financial statements. | | | |
12
STATEMENT OF OPERATIONS
Year Ended December 31, 2018
| | | | | | | |
| | | | | | |
| | | | | | |
Investment Income ($): | | | | |
Income: | | | | |
Cash dividends (net of $7,049 foreign taxes withheld at source): | |
Unaffiliated issuers | | | 1,364,479 | |
Affiliated issuers | | | 62,954 | |
Income from securities lending—Note 1(b) | | | 79,637 | |
Total Income | | | 1,507,070 | |
Expenses: | | | | |
Investment advisory fee—Note 3(a) | | | 1,549,849 | |
Professional fees | | | 87,892 | |
Distribution fees—Note 3(b) | | | 50,226 | |
Prospectus and shareholders’ reports | | | 38,549 | |
Trustees’ fees and expenses—Note 3(c) | | | 16,484 | |
Custodian fees—Note 3(b) | | | 11,897 | |
Loan commitment fees—Note 2 | | | 5,179 | |
Shareholder servicing costs—Note 3(b) | | | 1,035 | |
Miscellaneous | | | 34,786 | |
Total Expenses | | | 1,795,897 | |
Less—reduction in fees due to earnings credits—Note 3(b) | | | (113) | |
Net Expenses | | | 1,795,784 | |
Investment (Loss)—Net | | | (288,714) | |
Realized and Unrealized Gain (Loss) on Investments—Note 4 ($): | | |
Net realized gain (loss) on investments | 31,450,070 | |
Net unrealized appreciation (depreciation) on investments | | | (69,036,111) | |
Net Realized and Unrealized Gain (Loss) on Investments | | | (37,586,041) | |
Net (Decrease) in Net Assets Resulting from Operations | | (37,874,755) | |
| | | | | | | |
See notes to financial statements. | | | | | |
13
STATEMENT OF CHANGES IN NET ASSETS
| | | | | | | | | | |
| | | | Year Ended December 31, |
| | | | 2018 | | 2017a | |
Operations ($): | | | | | | | | |
Investment (loss)—net | | | (288,714) | | | | (465,496) | |
Net realized gain (loss) on investments | | 31,450,070 | | | | 35,249,723 | |
Net unrealized appreciation (depreciation)
on investments | | (69,036,111) | | | | 7,783,367 | |
Net Increase (Decrease) in Net Assets
Resulting from Operations | (37,874,755) | | | | 42,567,594 | |
Distributions ($): | |
Distributions to shareholders: | | | | | | | | |
Initial Shares | | | (31,237,676) | | | | (2,000,341) | |
Service Shares | | | (3,518,843) | | | | (218,974) | |
Total Distributions | | | (34,756,519) | | | | (2,219,315) | |
Beneficial Interest Transactions ($): | |
Net proceeds from shares sold: | | | | | | | | |
Initial Shares | | | 14,974,835 | | | | 10,596,553 | |
Service Shares | | | 1,651,834 | | | | 1,191,330 | |
Distributions reinvested: | | | | | | | | |
Initial Shares | | | 31,237,676 | | | | 2,000,341 | |
Service Shares | | | 3,518,843 | | | | 218,974 | |
Cost of shares redeemed: | | | | | | | | |
Initial Shares | | | (23,537,641) | | | | (21,682,843) | |
Service Shares | | | (3,097,274) | | | | (2,291,881) | |
Increase (Decrease) in Net Assets
from Beneficial Interest Transactions | 24,748,273 | | | | (9,967,526) | |
Total Increase (Decrease) in Net Assets | (47,883,001) | | | | 30,380,753 | |
Net Assets ($): | |
Beginning of Period | | | 209,903,996 | | | | 179,523,243 | |
End of Period | | | 162,020,995 | | | | 209,903,996 | |
Capital Share Transactions (Shares): | |
Initial Shares | | | | | | | | |
Shares sold | | | 280,806 | | | | 197,277 | |
Shares issued for distributions reinvested | | | 603,626 | | | | 38,007 | |
Shares redeemed | | | (435,423) | | | | (403,156) | |
Net Increase (Decrease) in Shares Outstanding | 449,009 | | | | (167,872) | |
Service Shares | | | | | | | | |
Shares sold | | | 31,795 | | | | 22,928 | |
Shares issued for distributions reinvested | | | 70,731 | | | | 4,288 | |
Shares redeemed | | | (60,283) | | | | (44,121) | |
Net Increase (Decrease) in Shares Outstanding | 42,243 | | | | (16,905) | |
| | | | | | | | | | |
aDistributions to shareholders include only distributions from net realized gain on investments. | |
See notes to financial statements. | | | | | | | | |
14
FINANCIAL HIGHLIGHTS
The following tables describe the performance for each share class for the fiscal periods indicated. All information (except portfolio turnover rate) reflects financial results for a single fund share. Total return shows how much your investment in the fund would have increased (or decreased) during each period, assuming you had reinvested all dividends and distributions. The fund’s total returns do not reflect expenses associated with variable annuity or insurance contracts. These figures have been derived from the fund’s financial statements.
| | | | | | | |
| | | |
| | | |
| | | Year Ended December 31, |
Initial Shares | | 2018 | 2017 | 2016 | 2015 | 2014 |
Per Share Data ($): | | | | | | |
Net asset value, beginning of period | | 60.91 | 49.44 | 46.02 | 47.78 | 47.03 |
Investment Operations: | | | | | | |
Investment (loss)—neta | | (.06) | (.12) | (.02) | (.13) | (.01) |
Net realized and unrealized
gain (loss) on investments | | (9.48) | 12.21 | 7.07 | (.91) | .76 |
Total from Investment Operations | | (9.54) | 12.09 | 7.05 | (1.04) | .75 |
Distributions: | | | | | | |
Dividends from net realized
gain on investments | | (10.17) | (.62) | (3.63) | (.72) | - |
Net asset value, end of period | | 41.20 | 60.91 | 49.44 | 46.02 | 47.78 |
Total Return (%) | | (19.08) | 24.69 | 17.07 | (2.28) | 1.60 |
Ratios/Supplemental Data (%): | | | | | | |
Ratio of total expenses
to average net assets | | .84 | .85 | .86 | .85 | .83 |
Ratio of net expenses
to average net assets | | .84 | .85 | .86 | .85 | .83 |
Ratio of net investment (loss)
to average net assets | | (.12) | (.22) | (.05) | (.27) | (.03) |
Portfolio Turnover Rate | | 67.90 | 70.11 | 88.08 | 65.26 | 77.96 |
Net Assets, end of period ($ x 1,000) | | 146,730 | 189,582 | 162,171 | 151,992 | 170,570 |
a Based on average shares outstanding.
See notes to financial statements.
15
FINANCIAL HIGHLIGHTS (continued)
| | | | | | | |
| | | |
| | | |
| | | Year Ended December 31, |
Service Shares | | 2018 | 2017 | 2016 | 2015 | 2014 |
Per Share Data ($): | | | | | | |
Net asset value, beginning of period | | 58.98 | 48.01 | 44.90 | 46.75 | 46.14 |
Investment Operations: | | | | | | |
Investment (loss)—neta | | (.19) | (.25) | (.13) | (.24) | (.13) |
Net realized and unrealized
gain (loss) on investments | | (9.09) | 11.84 | 6.87 | (.89) | .74 |
Total from Investment Operations | | (9.28) | 11.59 | 6.74 | (1.13) | .61 |
Distributions: | | | | | | |
Dividends from net realized
gain on investments | | (10.17) | (.62) | (3.63) | (.72) | - |
Net asset value, end of period | | 39.53 | 58.98 | 48.01 | 44.90 | 46.75 |
Total Return (%) | | (19.29) | 24.37 | 16.79 | (2.52) | 1.32 |
Ratios/Supplemental Data (%): | | | | | | |
Ratio of total expenses
to average net assets | | 1.09 | 1.10 | 1.11 | 1.10 | 1.08 |
Ratio of net expenses
to average net assets | | 1.09 | 1.10 | 1.11 | 1.10 | 1.08 |
Ratio of net investment (loss)
to average net assets | | (.37) | (.47) | (.30) | (.52) | (.28) |
Portfolio Turnover Rate | | 67.90 | 70.11 | 88.08 | 65.26 | 77.96 |
Net Assets, end of period ($ x 1,000) | | 15,291 | 20,322 | 17,353 | 16,528 | 18,094 |
a Based on average shares outstanding.
See notes to financial statements.
16
NOTES TO FINANCIAL STATEMENTS
NOTE 1—Significant Accounting Policies:
Opportunistic Small Cap Portfolio (the “fund”) is a separate diversified series of Dreyfus Variable Investment Fund (the “Company”), which is registered under the Investment Company Act of 1940, as amended (the “Act”), as an open-end management investment company and operates as a series company currently offering seven series, including the fund. The fund is only offered to separate accounts established by insurance companies to fund variable annuity contracts and variable life insurance policies. The fund’s investment objective is to seek capital growth. The Dreyfus Corporation (the “Manager” or “Dreyfus”), a wholly-owned subsidiary of The Bank of New York Mellon Corporation (“BNY Mellon”), serves as the fund’s investment adviser.
MBSC Securities Corporation (the “Distributor”), a wholly-owned subsidiary of Dreyfus, is the distributor of the fund’s shares, which are sold without a sales charge. The fund is authorized to issue an unlimited number of $.001 par value shares of Beneficial Interest in each of the following classes of shares: Initial and Service. Each class of shares has identical rights and privileges, except with respect to the Distribution Plan, and the expenses borne by each class, the allocation of certain transfer agency costs, and certain voting rights. Income, expenses (other than expenses attributable to a specific class), and realized and unrealized gains or losses on investments are allocated to each class of shares based on its relative net assets.
The Company accounts separately for the assets, liabilities and operations of each series. Expenses directly attributable to each series are charged to that series’ operations; expenses which are applicable to all series are allocated among them on a pro rata basis.
The Financial Accounting Standards Board (“FASB”) Accounting Standards Codification is the exclusive reference of authoritative U.S. generally accepted accounting principles (“GAAP”) recognized by the FASB to be applied by nongovernmental entities. Rules and interpretive releases of the Securities and Exchange Commission (“SEC”) under authority of federal laws are also sources of authoritative GAAP for SEC registrants. The fund’s financial statements are prepared in accordance with GAAP, which may require the use of management estimates and assumptions. Actual results could differ from those estimates.
The Companyenters into contracts that contain a variety of indemnifications. The fund’s maximum exposure under these arrangements is unknown. The fund does not anticipate recognizing any loss related to these arrangements.
17
NOTES TO FINANCIAL STATEMENTS(continued)
(a) Portfolio valuation: The fair value of a financial instrument is the amount that would be received to sell an asset or paid to transfer a liability in an orderly transaction between market participants at the measurement date (i.e., the exit price). GAAP establishes a fair value hierarchy that prioritizes the inputs of valuation techniques used to measure fair value. This hierarchy gives the highest priority to unadjusted quoted prices in active markets for identical assets or liabilities (Level 1 measurements) and the lowest priority to unobservable inputs (Level 3 measurements).
Additionally, GAAP provides guidance on determining whether the volume and activity in a market has decreased significantly and whether such a decrease in activity results in transactions that are not orderly. GAAP requires enhanced disclosures around valuation inputs and techniques used during annual and interim periods.
Various inputs are used in determining the value of the fund’s investments relating to fair value measurements. These inputs are summarized in the three broad levels listed below:
Level 1—unadjusted quoted prices in active markets for identical investments.
Level 2—other significant observable inputs (including quoted prices for similar investments, interest rates, prepayment speeds, credit risk, etc.).
Level 3—significant unobservable inputs (including the fund’s own assumptions in determining the fair value of investments).
The inputs or methodology used for valuing securities are not necessarily an indication of the risk associated with investing in those securities.
Changes in valuation techniques may result in transfers in or out of an assigned level within the disclosure hierarchy. Valuation techniques used to value the fund’s investments are as follows:
Investments in securities are valued at the last sales price on the securities exchange or national securities market on which such securities are primarily traded. Securities listed on the National Market System for which market quotations are available are valued at the official closing price or, if there is no official closing price that day, at the last sales price. For open short positions, asked prices are used for valuation purposes. Bid price is used when no asked price is available. Registered investment companies that are not traded on an exchange are valued at their net asset value. All of the preceding securities are generally categorized within Level 1 of the fair value hierarchy.
18
Securities not listed on an exchange or the national securities market, or securities for which there were no transactions, are valued at the average of the most recent bid and asked prices. These securities are generally categorized within Level 2 of the fair value hierarchy.
Fair valuing of securities may be determined with the assistance of a pricing service using calculations based on indices of domestic securities and other appropriate indicators, such as prices of relevant ADRs and futures. Utilizing these techniques may result in transfers between Level 1 and Level 2 of the fair value hierarchy.
When market quotations or official closing prices are not readily available, or are determined not to accurately reflect fair value, such as when the value of a security has been significantly affected by events after the close of the exchange or market on which the security is principally traded (for example, a foreign exchange or market), but before the fund calculates its net asset value, the fund may value these investments at fair value as determined in accordance with the procedures approved by the Company’s Board of Trustees (the “Board”). Certain factors may be considered when fair valuing investments such as: fundamental analytical data, the nature and duration of restrictions on disposition, an evaluation of the forces that influence the market in which the securities are purchased and sold, and public trading in similar securities of the issuer or comparable issuers. These securities are either categorized within Level 2 or 3 of the fair value hierarchy depending on the relevant inputs used.
For restricted securities where observable inputs are limited, assumptions about market activity and risk are used and such securities are generally categorized within Level 3 of the fair value hierarchy.
The following is a summary of the inputs used as of December 31, 2018in valuing the fund’s investments:
| | | | | |
| | Level 1-
Unadjusted
Quoted
Prices | Level 2 – Other
Significant
Observable
Inputs | Level 3 -
Significant
Unobservable
Inputs | Total |
Assets ($) | | | |
Investments in Securities: | | | |
Equity Securities - Common Stocks† | 161,076,519 | - | - | 161,076,519 |
Investment Companies | 4,432,034 | - | - | 4,432,034 |
Warrants† | 87,470 | - | - | 87,470 |
† See Statement of Investments for additional detailed categorizations.
19
NOTES TO FINANCIAL STATEMENTS(continued)
At December 31, 2018, there were no transfers between levels of the fair value hierarchy. It is the fund’s policy to recognize transfers between levels at the end of the reporting period.
(b)Securities transactions and investment income: Securities transactions are recorded on a trade date basis. Realized gains and losses from securities transactions are recorded on the identified cost basis. Dividend income is recognized on the ex-dividend date and interest income, including, where applicable, accretion of discount and amortization of premium on investments, is recognized on the accrual basis.
Pursuant to a securities lending agreement with The Bank of New York Mellon, a subsidiary of BNY Mellon and an affiliate of Dreyfus, the fund may lend securities to qualified institutions. It is the fund’s policy that, at origination, all loans are secured by collateral of at least 102% of the value of U.S. securities loaned and 105% of the value of foreign securities loaned. Collateral equivalent to at least 100% of the market value of securities on loan is maintained at all times. Collateral is either in the form of cash, which can be invested in certain money market mutual funds managed by Dreyfus, or U.S. Government and Agency securities. The fund is entitled to receive all dividends, interest and distributions on securities loaned, in addition to income earned as a result of the lending transaction. Should a borrower fail to return the securities in a timely manner, The Bank of New York Mellon is required to replace the securities for the benefit of the fund or credit the fund with the market value of the unreturned securities and is subrogated to the fund’s rights against the borrower and the collateral. Additionally, the contractual maturity of security lending transactions are on an overnight and continuous basis. During the period ended December 31, 2018, The Bank of New York Mellon earned $15,159 from lending portfolio securities, pursuant to the securities lending agreement.
(c) Affiliated issuers: Investments in other investment companies advised by Dreyfus are considered “affiliated” under the Act.
(d) Dividends and distributions to shareholders: Dividends and distributions are recorded on the ex-dividend date. Dividends from investment income-net and dividends from net realized capital gains, if any, are normally declared and paid annually, but the fund may make distributions on a more frequent basis to comply with the distribution requirements of the Internal Revenue Code of 1986, as amended (the “Code”). To the extent that net realized capital gains can be offset by capital loss carryovers, it is the policy of the fund not to distribute such
20
gains. Income and capital gain distributions are determined in accordance with income tax regulations, which may differ from GAAP.
(e) Federal income taxes: It is the policy of the fund to continue to qualify as a regulated investment company, if such qualification is in the best interests of its shareholders, by complying with the applicable provisions of the Code, and to make distributions of taxable income and net realized capital gain sufficient to relieve it from substantially all federal income and excise taxes.
As of and during the period ended December 31, 2018, the fund did not have any liabilities for any uncertain tax positions. The fund recognizes interest and penalties, if any, related to uncertain tax positions as income tax expense in the Statement of Operations. During the period ended December 31, 2018, the fund did not incur any interest or penalties.
Each tax year in the four-year period ended December 31, 2018 remains subject to examination by the Internal Revenue Service and state taxing authorities.
At December 31, 2018, the components of accumulated earnings on a tax basis were as follows: undistributed ordinary income $6,550,346, undistributed capital gains $24,907,527 and unrealized depreciation $25,055,916.
The tax character of distributions paid to shareholders during the fiscal periods ended December 31, 2018 and December 31, 2017 were as follows: Ordinary income $10,670,292 and $0, and long-term capital gains $24,086,227 and $2,219,315, respectively.
(f) New Accounting Pronouncements: In August 2018, the FASB issued Accounting Standards Update 2018-13, Fair Value Measurement (Topic 820): Disclosure Framework—Changes to the Disclosure Requirements for Fair Value Measurement (“ASU 2018-13”). The update provides guidance that eliminates, adds and modifies certain disclosure requirements for fair value measurements. ASU 2018-13 will be effective for annual periods beginning after December 15, 2019. Management is currently assessing the potential impact of these changes to future financial statements.
NOTE 2—Bank Lines of Credit:
The fund participates with other Dreyfus-managed long-term open-end funds in a $1.030 billion unsecured credit facility led by Citibank, N.A. (the “Citibank Credit Facility”) and a $300 million unsecured credit facility provided by The Bank of New York Mellon (the “BNYM Credit Facility”), each to be utilized primarily for temporary or emergency purposes,
21
NOTES TO FINANCIAL STATEMENTS(continued)
including the financing of redemptions (each, a “Facility”). The Citibank Credit Facility is available in two tranches: (i) Tranche A is in an amount equal to $830 million and is available to all long-term open-ended funds, including the fund, and (ii) Tranche B is in amount equal to $200 million and is available only to the Dreyfus Floating Rate Income Fund, a series of The Dreyfus/Laurel Funds, Inc. Prior to October 3, 2018, the unsecured credit facility with Citibank, N.A. was $830 million. In connection therewith, the fund has agreed to pay its pro rata portion of commitment fees for Tranche A of the Citibank Credit Facility and the BNYM Credit Facility. Interest is charged to the fund based on rates determined pursuant to the terms of the respective Facility at the time of borrowing. During the period ended December 31, 2018, the fund did not borrow under the Facilities.
NOTE 3—Investment Advisory Fee and Other Transactions with Affiliates:
(a)Pursuant to an investment advisory agreement with Dreyfus, the investment advisory fee is computed at the annual rate of .75% of the value of the fund’s average daily net assets and is payable monthly.
(b)Under the Distribution Plan adopted pursuant to Rule 12b-1 under the Act, Service shares pay the Distributor for distributing its shares, for servicing and/or maintaining Service shares’ shareholder accounts and for advertising and marketing for Service shares. The Distribution Plan provides for payments to be made at an annual rate of .25% of the value of the Service shares’ average daily net assets. The Distributor may make payments to Participating Insurance Companies and to brokers and dealers acting as principal underwriter for their variable insurance products. The fees payable under the Distribution Plan are payable without regard to actual expenses incurred. During the period ended December 31, 2018,Service shares were charged $50,226 pursuant to the Distribution Plan.
The fund has arrangements with the transfer agent and the custodian whereby the fund may receive earnings credits when positive cash balances are maintained, which are used to offset transfer agency and custody fees. For financial reporting purposes, the fund includes net earnings credits, if any, as an expense offset in the Statement of Operations.
The fund compensates Dreyfus Transfer, Inc., a wholly-owned subsidiary of Dreyfus, under a transfer agency agreement for providing transfer agency and cash management services for the fund. The majority of transfer agency fees are comprised of amounts paid on a per account basis, while cash management fees are related to fund subscriptions and redemptions. During the period ended December 31, 2018, the fund was
22
charged $966 for transfer agency services. These fees are included in Shareholder servicing costs in the Statement of Operations.
The fund compensates The Bank of New York Mellon under a custody agreement for providing custodial services for the fund. These fees are determined based on net assets, geographic region and transaction activity. During the period ended December 31, 2018, the fund was charged $11,897 pursuant to the custody agreement. These fees were partially offset by earnings credits of $113.
During the period ended December 31, 2018, the fund was charged $12,774 for services performed by the Chief Compliance Officer and his staff. These fees are included in Miscellaneous in the Statement of Operations.
The components of “Due to The Dreyfus Corporation and affiliates” in the Statement of Assets and Liabilities consist of: investment advisory fees $108,127, Distribution Plan fees $3,404, custodian fees $7,847, Chief Compliance Officer fees $6,289 and transfer agency fees $146.
(c) Each Board member also serves as a Board member of other funds within the Dreyfus complex. Annual retainer fees and attendance fees are allocated to each fund based on net assets.
NOTE 4—Securities Transactions:
The aggregate amount of purchases and sales of investment securities, excluding short-term securities, during the period ended December 31, 2018, amounted to $136,329,490 and $144,165,295, respectively.
At December 31, 2018, the cost of investments for federal income tax purposes was $190,651,939; accordingly, accumulated net unrealized depreciation on investments was $25,055,916, consisting of $10,363,770 gross unrealized appreciation and $35,419,686 gross unrealized depreciation.
23
REPORT OF INDEPENDENT REGISTERED PUBLIC ACCOUNTING FIRM
To the Shareholders and the Board of Trustees of Opportunistic Small Cap Portfolio
Opinion on the Financial Statements
We have audited the accompanying statement of assets and liabilities of Opportunistic Small Cap Portfolio (the “Fund”) (one of the funds constituting Dreyfus Variable Investment Fund), including the statements of investments and investments in affiliated issuers, as of December 31, 2018, and the related statement of operations for the year then ended, the statements of changes in net assets for each of the two years in the period then ended, the financial highlights for each of the five years in the period then ended and the related notes (collectively referred to as the “financial statements”). In our opinion, the financial statements present fairly, in all material respects, the financial position of the Fund (one of the funds constituting Dreyfus Variable Investment Fund) at December 31, 2018, the results of its operations for the year then ended, the changes in its net assets for each of the two years in the period then ended and its financial highlights for each of the five years in the period then ended, in conformity with U.S. generally accepted accounting principles.
Basis for Opinion
These financial statements are the responsibility of the Fund’s management. Our responsibility is to express an opinion on the Fund’s financial statements based on our audits. We are a public accounting firm registered with the Public Company Accounting Oversight Board (United States) (“PCAOB”) and are required to be independent with respect to the Fund in accordance with the U.S. federal securities laws and the applicable rules and regulations of the Securities and Exchange Commission and the PCAOB.
We conducted our audits in accordance with the standards of the PCAOB. Those standards require that we plan and perform the audit to obtain reasonable assurance about whether the financial statements are free of material misstatement, whether due to error or fraud. The Fund is not required to have, nor were we engaged to perform, an audit of the Fund’s internal control over financial reporting. As part of our audits, we are required to obtain an understanding of internal control over financial reporting, but not for the purpose of expressing an opinion on the effectiveness of the Fund’s internal control over financial reporting. Accordingly, we express no such opinion.
Our audits included performing procedures to assess the risks of material misstatement of the financial statements, whether due to error or fraud, and performing procedures that respond to those risks. Such procedures included examining, on a test basis, evidence regarding the amounts and disclosures in the financial statements. Our procedures included confirmation of securities owned as of December 31, 2018, by correspondence with the custodian and others or by other appropriate auditing procedures where replies from others were not received. Our audits also included evaluating the accounting principles used and significant estimates made by management, as well as evaluating the overall presentation of the financial statements. We believe that our audits provide a reasonable basis for our opinion.

We have served as the auditor of one or more Dreyfus investment companies since at least 1957, but we are unable to determine the specific year.
New York, New York
February 11, 2019
24
IMPORTANT TAX INFORMATION(Unaudited)
For federal tax purposes, the portfolio hereby reports 9.18% of the ordinary dividends paid during the fiscal year ended December 31, 2018 as qualifying for the corporate dividends received deduction. Shareholders will receive notification in early 2019 of the percentage applicable to the preparation of their 2018 income tax returns. Also, the portfolio hereby reports $3.1230 per share as a short-term capital gain distribution and $7.0496 per share as a long-term capital gain distribution paid on March 19, 2018.
25
BOARD MEMBERS INFORMATION(Unaudited)
INDEPENDENT BOARD MEMBERS
Joseph S. DiMartino (75)
Chairman of the Board (1995)
Principal Occupation During Past 5 Years:
· Corporate Director and Trustee (1995-present)
Other Public Company Board Memberships During Past 5 Years:
· CBIZ (formerly, Century Business Services, Inc.), a provider of outsourcing functions for small and medium size companies, Director (1997-present)
No. of Portfolios for which Board Member Serves:122
———————
Peggy C. Davis (75)
Board Member (2006)
Principal Occupation During Past 5 Years:
· Shad Professor of Law, New York University School of Law (1983-present)
No. of Portfolios for which Board Member Serves: 45
———————
David P. Feldman (79)
Board Member (1994)
Principal Occupation During Past 5 Years:
· Corporate Director and Trustee (1985-present)
Other Public Company Board Memberships During Past 5 Years:
· BBH Mutual Funds Group (5 registered mutual funds), Director (1992-2014)
No. of Portfolios for which Board Member Serves:31
———————
Joan Gulley (71)
Board Member (2017)
Principal Occupation During Past 5 Years:
· PNC Financial Services Group, Inc.(1993-2014), Executive Vice President and Chief Human Resources Officer and Executive Committee Member (2008-2014)
No. of Portfolios for which Board Member Serves:52
———————
26
Ehud Houminer (78)
Board Member (2006)
Principal Occupation During Past 5 Years:
· Board of Overseers at the Columbia Business School, Columbia University (1992-present)
· Trustee, Ben Gurion University
No. of Portfolios for which Board Member Serves: 52
———————
Lynn Martin (79)
Board Member (2012)
Principal Occupation During Past 5 Years:
· President of The Martin Hall Group LLC, a human resources consulting firm (2005-2012)
No. of Portfolios for which Board Member Serves:31
———————
Robin A. Melvin (55)
Board Member (2012)
Principal Occupation During Past 5 Years:
· Co-chairman, Illinois Mentoring Partnership, non-profit organization dedicated to increasing the quantity and quality of mentoring services in Illinois; (2014-present; board member since 2013)
No. of Portfolios for which Board Member Serves:99
———————
Dr. Martin Peretz (79)
Board Member (1990)
Principal Occupation During Past 5 Years:
· Editor-in-Chief Emeritus of The New Republic Magazine (2011-2012) (previously,
Editor-in-Chief, 1974-2011)
· Lecturer at Harvard University (1968-2010)
No. of Portfolios for which Board Member Serves:31
———————
Once elected all Board Members serve for an indefinite term, but achieve Emeritus status upon reaching age 80. The address of the Board Members and Officers is c/o The Dreyfus Corporation, 200 Park Avenue, New York, New York 10166. Additional information about the Board Members is available in the fund’s Statement of Additional Information which can be obtained from Dreyfus free of charge by calling this toll free number: 1-800-DREYFUS.
James F. Henry, Emeritus Board Member
Philip L. Toia, Emeritus Board Member
27
OFFICERS OF THE FUND(Unaudited)
BRADLEY J. SKAPYAK, President since January 2010.
Chief Operating Officer and a director of the Manager since June 2009, Chairman of Dreyfus Transfer, Inc., an affiliate of the Manager and the transfer agent of the funds, since May 2011 and Chief Executive Officer of MBSC Securities Corporation since August 2016. He is an officer of 62 investment companies (comprised of 122 portfolios) managed by the Manager. He is 60 years old and has been an employee of the Manager since February 1988.
BENNETT A. MACDOUGALL, Chief Legal Officer since October 2015.
Chief Legal Officer of the Manager and Associate General Counsel and Managing Director of BNY Mellon since June 2015; from June 2005 to June 2015, he served in various capacities with Deutsche Bank – Asset & Wealth Management Division, including as Director and Associate General Counsel, and Chief Legal Officer of Deutsche Investment Management Americas Inc. from June 2012 to May 2015. He is an officer of 63 investment companies (comprised of 147 portfolios) managed by the Manager. He is 47 years old and has been an employee of the Manager since June 2015.
JAMES BITETTO, Vice President since August 2005 and Secretary since February 2018.
Managing Counsel of BNY Mellon and Secretary of the Manager, and an officer of 63 investment companies (comprised of 147 portfolios) managed by the Manager. He is 52 years old and has been an employee of the Manager since December 1996.
SONALEE CROSS, Vice President and Assistant Secretary since March 2018.
Counsel of BNY Mellon since October 2016; Associate at Proskauer Rose LLP from April 2016 to September 2016; Attorney at EnTrust Capital from August 2015 to February 2016; Associate at Sidley Austin LLP from September 2013 until August 2015. She is an officer of 63 investment companies (comprised of 147 portfolios) managed by Dreyfus. She is 31 years old and has been an employee of the Manager since October 2016.
SARAH S. KELLEHER, Vice President and Assistant Secretary since April 2014.
Managing Counsel of BNY Mellon since December 2017, from March 2013 to December 2017, Senior Counsel of BNY Mellon. She is an officer of 63 investment companies (comprised of 147 portfolios) managed by the Manager. She is 43 years old and has been an employee of the Manager since March 2013.
JEFF PRUSNOFSKY, Vice President and Assistant Secretary since August 2005.
Senior Managing Counsel of BNY Mellon, and an officer of 63 investment companies (comprised of 147 portfolios) managed by the Manager. He is 53 years old and has been an employee of the Manager since October 1990.
NATALYA ZELENSKY, Vice President and Assistant Secretary since March 2017.
Counsel of BNY Mellon since May 2016; Attorney at Wildermuth Endowment Strategy Fund/Wildermuth Advisory, LLC from November 2015 until May 2016; Assistant General Counsel at RCS Advisory Services from July 2014 until November 2015; Associate at Sutherland, Asbill & Brennan from January 2013 until January 2014. She is an officer of 63 investment companies (comprised of 147 portfolios) managed by Dreyfus. She is 33 years old and has been an employee of the Manager since May 2016.
JAMES WINDELS, Treasurer since November 2001.
Director – Mutual Fund Accounting of the Manager, and an officer of 63 investment companies (comprised of 147 portfolios) managed by the Manager. He is 60 years old and has been an employee of the Manager since April 1985.
GAVIN C. REILLY, Assistant Treasurer since December 2005.
Tax Manager of the Investment Accounting and Support Department of the Manager, and an officer of 63 investment companies (comprised of 147 portfolios) managed by the Manager. He is 50 years old and has been an employee of the Manager since April 1991.
ROBERT S. ROBOL, Assistant Treasurer since August 2005.
Senior Accounting Manager – Dreyfus Financial Reporting of the Manager, and an officer of 63 investment companies (comprised of 147 portfolios) managed by the Manager. He is 54 years old and has been an employee of the Manager since October 1988.
28
ROBERT SALVIOLO, Assistant Treasurer since July 2007.
Senior Accounting Manager – Equity Funds of the Manager, and an officer of 63 investment companies (comprised of 147 portfolios) managed by the Manager. He is 51 years old and has been an employee of the Manager since June 1989.
ROBERT SVAGNA, Assistant Treasurer since December 2002.
Senior Accounting Manager – Fixed Income and Equity Funds of the Manager, and an officer of 63 investment companies (comprised of 147 portfolios) managed by the Manager. He is 51 years old and has been an employee of the Manager since November 1990.
JOSEPH W. CONNOLLY, Chief Compliance Officer since October 2004.
Chief Compliance Officer of the Manager, the Dreyfus Family of Funds and BNY Mellon Funds Trust (63 investment companies, comprised of 147 portfolios). He is 61 years old and has served in various capacities with the Manager since 1980, including manager of the firm’s Fund Accounting Department from 1997 through October 2001.
CARIDAD M. CAROSELLA, Anti-Money Laundering Compliance Officer since January 2016.
Anti-Money Laundering Compliance Officer of the Dreyfus Family of Funds and BNY Mellon Funds Trust since January 2016; from May 2015 to December 2015, Interim Anti-Money Laundering Compliance Officer of the Dreyfus Family of Funds and BNY Mellon Funds Trust and the Distributor; from January 2012 to May 2015, AML Surveillance Officer of the Distributor and from 2007 to December 2011, Financial Processing Manager of the Distributor. She is an officer of 57 investment companies (comprised of 141 portfolios) managed by the Manager. She is 50 years old and has been an employee of the Distributor since 1997.
29
Dreyfus Variable Investment Fund, Opportunistic Small Cap Portfolio
200 Park Avenue
New York, NY 10166
Investment Adviser
The Dreyfus Corporation
200 Park Avenue
New York, NY 10166
Custodian
The Bank of New York Mellon
240 Greenwich Street
New York, NY 10286
Transfer Agent &
Dividend Disbursing Agent
Dreyfus Transfer, Inc.
200 Park Avenue
New York, NY 10166
Distributor
MBSC Securities Corporation
200 Park Avenue
New York, NY 10166
Telephone 1-800-258-4260 or 1-800-258-4261
Mail The Dreyfus Family of Funds, 144 Glenn Curtiss Boulevard, Uniondale, NY 11556-0144 Attn: Institutional Services Department
E-mailSend your request toinfo@dreyfus.com
InternetInformation can be viewed online or downloaded atwww.dreyfus.com
The fund files its complete schedule of portfolio holdings with the Securities and Exchange Commission (“SEC”) for the first and third quarters of each fiscal year on Form N-Q. The fund’s Forms N-Q are available on the SEC’s website at http://www.sec.gov and may be reviewed and copied at the SEC’s Public Reference Room in Washington, D.C. Information on the operation of the Public Reference Room may be obtained by calling 1-800-SEC-0330.
A description of the policies and procedures that the fund uses to determine how to vote proxies relating to portfolio securities, and information regarding how the fund voted these proxies for the most recent 12-month period ended June 30 is available at http://www.dreyfus.com and on the SEC’s website at http://www.sec.gov. The description of the policies and procedures is also available without charge, upon request, by calling 1-800-DREYFUS.
| | |
© 2019 MBSC Securities Corporation
0121AR1218 | 
|
Dreyfus Variable Investment Fund, Quality Bond Portfolio
| | | |

| | ANNUAL REPORT December 31, 2018 |
| |
The views expressed in this report reflect those of the portfolio manager(s) only through the end of the period covered and do not necessarily represent the views of Dreyfus or any other person in the Dreyfus organization. Any such views are subject to change at any time based upon market or other conditions and Dreyfus disclaims any responsibility to update such views. These views may not be relied on as investment advice and, because investment decisions for a Dreyfus fund are based on numerous factors, may not be relied on as an indication of trading intent on behalf of any Dreyfus fund. |
| |
Not FDIC-Insured • Not Bank-Guaranteed • May Lose Value |
Contents
T H E F U N D
F O R M O R E I N F O R M AT I O N
Back Cover
| | | | |
| |
Dreyfus Variable Investment Fund, Quality Bond Portfolio
| | The Fund |
A LETTER FROM THE PRESIDENT OF DREYFUS
Dear Shareholder:
We are pleased to present this annual report for Dreyfus Variable Investment Fund, Quality Bond Portfolio, covering the 12-month period from January 1, 2018 through December 31, 2018. For information about how the fund performed during the reporting period, as well as general market perspectives, we provide a Discussion of Fund Performance on the pages that follow.
The reporting period began with major global economies achieving above-trend growth. In the United States, a robust economy and strong labor market encouraged the Federal Reserve to continue moving away from its accommodative monetary policy while other major central banks began to consider monetary tightening. Both U.S. and non-U.S. equity markets remained on an uptrend. Interest rates rose across the yield curve, putting pressure on bond prices.
A few months into the reporting period, global growth trends began to diverge and market volatility returned. While the U.S. economy continued to grow at a healthy rate, other developed markets began to weaken. However, robust growth and strong corporate earnings continued to support U.S. stock returns while other developed markets declined throughout the summer. In the fall, a broad sell-off occurred, partially offsetting earlier U.S. gains. Emerging markets remained under pressure as weakness in their currencies relative to the U.S. dollar added to investors’ uneasiness. Global equities continued their general decline through the end of the period.
Fixed income markets struggled during the first half of the period as interest rates rose and favorable U.S. equity markets fed investor risk appetites. However, in autumn volatility crept in, the yield curve began a flattening trend that continued through the end of December. As long-term debt yields fell, prices rose for many bonds, leading to moderately positive returns for several fixed income market sectors.
Despite continuing political variables, U.S. inflationary pressures and flagging growth rates, we are optimistic that the U.S. economy will remain strong in the near term. However, we remain attentive to signs that point to potential changes on the horizon. As always, we encourage you to discuss the risks and opportunities in today’s investment environment with your financial advisor.
Thank you for your continued confidence and support.
Sincerely,

Renee Laroche-Morris
President
The Dreyfus Corporation
January 15, 2019
2
DISCUSSION OF FUND PERFORMANCE(Unaudited)
For the period from January 1, 2018 through December 31, 2018, as provided by David Bowser, CFA, Portfolio Manager
Market and Fund Performance Overview
For the 12-month period ended December 31, 2018, Dreyfus Variable Investment Fund, Quality Bond Portfolio’s Initial shares produced a total return of -2.55%, and its Service shares produced a total return of -2.73%.1In comparison, the Bloomberg Barclays U.S. Aggregate Bond Index (the “Index”), the fund’s benchmark, achieved a total return of 0.01% for the same period.2
Different types of bonds experienced markedly different performance during the period. The Index, a large portion of which consists of U.S. Treasuries, ended flat for the reporting period in a volatile environment of shifting interest rates and a flattening yield curve. The fund underperformed the Index, mainly due to its exposure to emerging-market securities that were hurt during the reporting period by a strengthening U.S. dollar against local currencies.
The Fund’s Investment Approach
The fund seeks to maximize total return, consisting of capital appreciation and current income. To pursue its goal, the fund normally invests at least 80% of its net assets, plus any borrowings for investment purposes, in bonds. The fund’s investments include corporate bonds, debentures, notes, mortgage-related securities, collateralized mortgage obligations and asset-backed securities, convertible debt obligations, preferred stocks, convertible preferred stocks, municipal obligations and zero coupon bonds that, when purchased, typically are rated A or better or are the unrated equivalent as determined by The Dreyfus Corporation and in securities issued or guaranteed by the U.S. government or its agencies or instrumentalities, including treasury inflation-protected securities (TIPS).
The fund also may invest up to 10% of its net assets in bonds issued by foreign issuers that are denominated in foreign currencies, and up to 20% of its net assets in bonds issued by foreign issuers whether denominated in U.S. dollars or in a foreign currency.
The fund has no limit with respect to its portfolio maturity or duration.
Market Volatility Dampened Fixed-Income Returns
In general, spread products lost varying degrees of value over the period. In late 2017, the U.S. Federal Reserve (the “Fed”) began to unwind its balance sheet through a reduction in purchases of mortgage-backed securities. Longer-term interest rates climbed during this time and into the early months of 2018. Corporate debt soundly outperformed like-duration Treasuries during this time. While the U.S. economy continued to strengthen, a shift occurred in early 2018 as other developed countries’ economies began to slow. Equity markets corrected, due to investor concerns over rising interest rates and talk of potential changes to U.S. trade policies. The volatility caused concerns, sparking a flight to safety and quality. Corporate debt gave up some of its earlier return and Treasuries rallied.
As U.S. equity markets calmed, so did the nerves of bond investors. Some asset classes, such as corporate high yield debt, recovered and outperformed during the summer and fall. TIPS gained ground for much of the period on mounting inflationary pressures. Investment-grade corporate debt, despite high supply levels, staged a rebound in the third quarter. However, as equity volatility spiked in December, bond investors’ nerves once again frayed. Another flight to quality suppressed rates and Treasuries rallied. Spreads widened, particularly for corporate bonds, which gave up their previous gains and went negative for the year. TIPS, mortgage-backed securities and high yield corporate debt followed suit. By period-end, much of the bond market was in negative territory and the only sector that outperformed Treasuries was asset-backed securities.
3
DISCUSSION OF FUND PERFORMANCE(Unaudited) (continued)
Emerging-Market Bonds Constrained Fund Performance
The fund’s performance compared to the Index was undermined during the reporting period by overweight exposure to emerging-market bonds denominated in local currencies, particularly the Argentine peso. These bonds lost value significantly as the U.S. dollar strengthened. In addition, the fund held investment-grade corporate bonds. Corporate bonds outperformed during a portion of the reporting period, but lost ground during periods of heavy equity volatility, particularly in the fourth calendar quarter of the year. They ended the period in negative territory. These two positions were the primary detractors from relative results.
In contrast, other strategies added value. Most notably, relatively short duration positioning helped performance on a one-year basis. Although the yield curve flattened, rates across many maturities rose for a significant portion of the reporting period. Shorter duration positioning with less sensitivity to rising interest rates helped insulate the portfolio from decreases in value due to rising rates.
A Cautiously Opportunistic Investment Posture
We currently expect that while rates fell during the fourth calendar quarter, they will reverse course and increase over the coming year. We also believe that we are late in the economic cycle, meaning that the rate of growth in the U.S. will slow. We also expect that the dollar will begin to weaken, easing pressure on emerging-market currencies and bonds.
Given these expectations, we maintain a modest overweight to corporate bonds. We expect the potential additional yield will benefit investors despite the headwinds that can come from a slowing economy. In addition, we maintain exposure to emerging-market bonds. We are underweight to positions in mortgage-backed securities due to concerns regarding supply-and-demand dynamics. We are currently avoiding exposure to high yield bonds and maintain a short duration posture relative to the benchmark.
January 15, 2019
1 Total return includes reinvestment of dividends and any capital gains paid. Past performance is no guarantee of future results. Share price and investment return fluctuate such that upon redemption, fund shares may be worth more or less than their original cost. The fund’s performance does not reflect the deduction of additional charges and expenses imposed in connection with investing in variable insurance contracts, which will reduce returns.
2 Source: Lipper Inc. — The Bloomberg Barclays U.S. Aggregate Bond Index is a broad-based flagship benchmark that measures the investment-grade, U.S. dollar-denominated, fixed-rate taxable bond market. The index includes Treasuries, government-related and corporate securities, MBS (agency fixed-rate and hybrid ARM pass-throughs), ABS, and CMBS (agency and nonagency). Investors cannot invest directly in any index.
Bonds are subject generally to interest-rate, credit, liquidity, and market risks, to varying degrees, all of which are more fully described in the fund’s prospectus. Generally, all other factors being equal, bond prices are inversely related to interest-rate changes, and rate increases can cause price declines.
Investments in foreign currencies are subject to the risk that those currencies will decline in value relative to the U.S. dollar, or, in the case of hedged positions, that the U.S. dollar will decline relative to the currency being hedged. Each of these risks could increase the fund’s volatility.
High yield bonds are subject to increased credit risk and are considered speculative in terms of the issuer’s perceived ability to continue making interest payments on a timely basis and to repay principal upon maturity.
The fund may use derivative instruments, such as options, futures, options on futures, forward contracts, swaps (including credit default swaps on corporate bonds and asset-backed securities), options on swaps, and other credit derivatives. A small investment in derivatives could have a potentially large impact on the fund’s performance.
The fund is only available as a funding vehicle under variable life insurance policies or variable annuity contracts issued by insurance companies. Individuals may not purchase shares of the fund directly. A variable annuity is an insurance contract issued by an insurance company that enables investors to accumulate assets on a tax-deferred basis for retirement or other long-term goals. The investment objective and policies of Dreyfus Variable Investment Fund, Quality Bond Portfolio made available through insurance products may be similar to those of other funds managed or advised by Dreyfus. However, the investment results of the fund may be higher or lower than, and may not be comparable to, those of any other Dreyfus fund.
4
FUND PERFORMANCE(Unaudited)

Comparison of change in value of $10,000 investment in Dreyfus Variable Investment Fund, Quality Bond Portfolio Initial shares and Service shares and the Bloomberg Barclays U.S. Aggregate Bond Index (the “Index”)
† Source: Lipper Inc.
Past performance is not predictive of future performance. The fund’s performance does not reflect the deduction of additional charges and expenses imposed in connection with investing in variable insurance contracts which will reduce returns.
The above graph compares a $10,000 investment made in Initial and Service shares of Dreyfus Variable Investment Fund, Quality Bond Portfolio on 12/31/08 to a $10,000 investment made in the Index on that date.
The fund’s performance shown in the line graph above takes into account all applicable fund fees and expenses for Initial and Service shares. The Index is a broad-based flagship benchmark that measures the investment-grade, U.S. dollar-denominated, fixed-rate taxable bond market. The Index includes Treasuries, government-related and corporate securities, MBS (agency fixed-rate and hybrid ARM pass-throughs), ABS and CMBS (agency and nonagency). Unlike a mutual fund, the Index is not subject to charges, fees and other expenses. Investors cannot invest directly in any index. Further information relating to fund performance, including expense reimbursements, if applicable, is contained in the Financial Highlights section of the prospectus and elsewhere in this report.
5
FUND PERFORMANCE(Unaudited) (continued)
| | | | |
Average Annual Total Returns asof12/31/18 |
| | 1 Year | 5 Years | 10 Years |
Initial shares | -2.55% | 1.28% | 4.12% |
Service shares | -2.73% | 1.05% | 3.87% |
Bloomberg Barclays U. S. Aggregate Bond Index | 0.01% | 2.52% | 3.48% |
The performance data quoted represents past performance, which is no guarantee of future results. Share price and investment return fluctuate and an investor’s shares may be worth more or less than original cost upon redemption. Current performance may be lower or higher than the performance quoted. Go to Dreyfus.com for the fund’s most recent month-end returns.
The fund’s Initial shares are not subject to a Rule 12b-1 fee. The fund’s Service shares are subject to a 0.25% annual Rule 12b-1 fee. All dividends and capital gain distributions are reinvested.
The fund’s performance shown in the graph and table does not reflect the deduction of taxes that a shareholder would pay on fund distributions or the redemption of fund shares.
6
UNDERSTANDING YOUR FUND’S EXPENSES(Unaudited)
As a mutual fund investor, you pay ongoing expenses, such as management fees and other expenses. Using the information below, you can estimate how these expenses affect your investment and compare them with the expenses of other funds. You also may pay one-time transaction expenses, including sales charges (loads), redemption fees and expenses associated with variable annuity or insurance contracts, which are not shown in this section and would have resulted in higher total expenses. For more information, see your fund’s prospectus or talk to your financial adviser.
Review your fund’s expenses
The table below shows the expenses you would have paid on a $1,000 investment in Dreyfus Variable Investment Fund, Quality Bond Portfolio from July 1, 2018 to December 31, 2018. It also shows how much a $1,000 investment would be worth at the close of the period, assuming actual returns and expenses.
| | | | | | | | |
Expenses and Value of a $1,000 Investment | | |
assuming actual returns for the six months ended December 31, 2018 | |
| | | | Initial Shares | Service Shares |
Expenses paid per $1,000† | | | $5.86 | | $7.12 |
Ending value (after expenses) | | | $1,003.70 | | $1,002.40 |
COMPARING YOUR FUND’S EXPENSES
WITH THOSE OF OTHER FUNDS(Unaudited)
Using the SEC’s method to compare expenses
The Securities and Exchange Commission (“SEC”) has established guidelines to help investors assess fund expenses. Per these guidelines, the table below shows your fund’s expenses based on a $1,000 investment, assuming a hypothetical 5% annualized return. You can use this information to compare the ongoing expenses (but not transaction expenses or total cost) of investing in the fund with those of other funds. All mutual fund shareholder reports will provide this information to help you make this comparison. Please note that you cannot use this information to estimate your actual ending account balance and expenses paid during the period.
| | | | | | | | |
Expenses and Value of a $1,000 Investment | | |
assuming a hypothetical 5% annualized return for the six months ended December 31, 2018 |
| | | | Initial Shares | Service Shares |
Expenses paid per $1,000† | | | $5.90 | | $7.17 |
Ending value (after expenses) | | | $1,019.36 | | $1,018.10 |
† Expenses are equal to the fund’s annualized expense ratio of 1.16% for Initial shares and 1.41% for Service shares, multiplied by the average account value over the period, multiplied by 184/365 (to reflect the one-half year period).
7
STATEMENT OF INVESTMENTS
December 31, 2018
| | | | | | | | | | |
| |
Description | Coupon
Rate (%) | | Maturity
Date | | Principal
Amount ($) | a | Value ($) | |
Bonds and Notes - 98.9% | | | | | |
Agriculture - .2% | | | | | |
Reynolds American,
Gtd. Notes | | 4.85 | | 9/15/2023 | | 90,000 | | 91,167 | |
Asset-Backed Certificates - 1.2% | | | | | |
Dell Equipment Finance Trust,
Ser. 2017-2, Cl. A3 | | 2.19 | | 10/24/2022 | | 105,000 | b | 104,267 | |
Starwood Waypoint Homes,
Ser. 2017-1, Cl. A, 1 Month LIBOR + 0.10% | | 3.41 | | 1/17/2035 | | 187,256 | b,c | 186,435 | |
Tricon American Homes,
Ser. 2017-SFR2, Cl. A | | 2.93 | | 1/17/2036 | | 124,867 | b | 121,255 | |
| | 411,957 | |
Asset-Backed Ctfs./Auto Receivables - 2.6% | | | | | |
CarMax Auto Owner Trust,
Ser. 2017-4, Cl. A4 | | 2.33 | | 5/15/2023 | | 85,000 | | 83,784 | |
CarMax Auto Owner Trust,
Ser. 2018-1, Cl. A4 | | 2.64 | | 6/15/2023 | | 180,000 | | 178,304 | |
Enterprise Fleet Financing,
Ser. 2017-3, Cl. A2 | | 2.13 | | 5/20/2023 | | 85,638 | b | 84,899 | |
Nissan Auto Receivables Owner Trust,
Ser. 2017-B, Cl. A4 | | 1.95 | | 10/16/2023 | | 190,000 | | 186,862 | |
Oscar US Funding Trust IX,
Ser. 2018-2A, Cl. A4 | | 3.63 | | 9/10/2025 | | 130,000 | b | 129,602 | |
Oscar US Funding Trust VII,
Ser. 2017-2A, Cl. A3 | | 2.45 | | 12/10/2021 | | 40,000 | b | 39,620 | |
Oscar US Funding Trust VII,
Ser. 2017-2A, Cl. A4 | | 2.76 | | 12/10/2024 | | 50,000 | b | 49,459 | |
Oscar US Funding Trust VIII,
Ser. 2018-1A, Cl. A4 | | 3.50 | | 5/12/2025 | | 190,000 | b | 191,940 | |
| | 944,470 | |
Asset-Backed Ctfs./Credit Cards - .5% | | | | | |
Delamare Cards MTN Issuer,
Ser. 2018-A1, Cl. A1, 1 Month LIBOR + 0.07% | | 3.16 | | 11/19/2025 | | 175,000 | b,c | 174,872 | |
Banks - 6.7% | | | | | |
Bank of America,
Sr. Unscd. Notes | | 3.00 | | 12/20/2023 | | 43,000 | | 41,770 | |
Bank of America,
Sr. Unscd. Notes | | 3.42 | | 12/20/2028 | | 109,000 | | 101,999 | |
Bank of America,
Sr. Unscd. Notes | | 3.50 | | 4/19/2026 | | 125,000 | | 120,506 | |
Bank of America,
Sr. Unscd. Notes | | 3.97 | | 3/5/2029 | | 100,000 | | 97,372 | |
Bank of America,
Sr. Unscd. Notes | | 4.00 | | 4/1/2024 | | 122,000 | | 122,754 | |
8
| | | | | | | | | | |
| |
Description | Coupon
Rate (%) | | Maturity
Date | | Principal
Amount ($) | a | Value ($) | |
Bonds and Notes - 98.9% (continued) | | | | | |
Banks - 6.7% (continued) | | | | | |
Barclays,
Sr. Unscd. Notes | | 4.38 | | 1/12/2026 | | 200,000 | | 190,386 | |
Citigroup,
Sr. Unscd. Bonds | | 3.40 | | 5/1/2026 | | 205,000 | | 193,231 | |
Citigroup,
Sr. Unscd. Notes | | 3.89 | | 1/10/2028 | | 120,000 | | 115,547 | |
Citigroup,
Sr. Unscd. Notes | | 4.65 | | 7/30/2045 | | 40,000 | | 39,160 | |
Goldman Sachs Group,
Sr. Unscd. Notes | | 2.75 | | 9/15/2020 | | 105,000 | | 103,939 | |
Goldman Sachs Group,
Sr. Unscd. Notes | | 3.69 | | 6/5/2028 | | 50,000 | | 46,544 | |
Goldman Sachs Group,
Sr. Unscd. Notes | | 3.81 | | 4/23/2029 | | 50,000 | | 46,763 | |
Goldman Sachs Group,
Sr. Unscd. Notes, 3 Month LIBOR + 1.60% | | 4.31 | | 11/29/2023 | | 55,000 | c | 54,542 | |
JPMorgan Chase & Co.,
Sr. Unscd. Notes | | 4.45 | | 12/5/2029 | | 300,000 | | 305,700 | |
Keybank,
Sr. Unscd. Notes | | 2.50 | | 11/22/2021 | | 250,000 | | 245,248 | |
Lloyds Banking Group,
Sub. Notes | | 4.65 | | 3/24/2026 | | 205,000 | | 193,119 | |
Morgan Stanley,
Sr. Unscd. Notes | | 3.75 | | 2/25/2023 | | 65,000 | | 64,919 | |
Morgan Stanley,
Sr. Unscd. Notes | | 5.50 | | 7/28/2021 | | 100,000 | | 104,781 | |
Wells Fargo & Co.,
Sr. Unscd. Notes | | 3.07 | | 1/24/2023 | | 110,000 | | 107,195 | |
Wells Fargo & Co.,
Sub. Notes | | 4.30 | | 7/22/2027 | | 95,000 | | 93,665 | |
| | 2,389,140 | |
Beverage Products - .5% | | | | | |
Anheuser-Busch Cos.,
Gtd. Notes | | 3.65 | | 2/1/2026 | | 15,000 | b | 14,192 | |
Anheuser-Busch Cos.,
Gtd. Notes | | 4.90 | | 2/1/2046 | | 115,000 | b | 107,017 | |
Anheuser-Busch InBev Worldwide,
Gtd. Notes | | 4.00 | | 4/13/2028 | | 35,000 | d | 33,563 | |
Keurig Dr Pepper,
Gtd. Notes | | 4.06 | | 5/25/2023 | | 20,000 | b | 19,937 | |
| | 174,709 | |
Chemicals - .9% | | | | | |
Dow Chemical,
Sr. Unscd. Notes | | 3.50 | | 10/1/2024 | | 100,000 | | 96,609 | |
9
STATEMENT OF INVESTMENTS (continued)
| | | | | | | | | | |
| |
Description | Coupon
Rate (%) | | Maturity
Date | | Principal
Amount ($) | a | Value ($) | |
Bonds and Notes - 98.9% (continued) | | | | | |
Chemicals - .9% (continued) | | | | | |
Office Cherifien des Phosphates,
Sr. Unscd. Notes | | 6.88 | | 4/25/2044 | | 200,000 | | 208,571 | |
| | 305,180 | |
Commercial & Professional Services - .2% | | | | | |
ERAC USA Finance,
Gtd. Notes | | 3.85 | | 11/15/2024 | | 60,000 | b | 59,785 | |
Commercial Mortgage Pass-Through Ctfs. - 1.8% | | | | | |
Commercial Mortgage Trust,
Ser. 2014-UBS2, Cl. AM | | 4.20 | | 3/10/2047 | | 70,000 | | 70,988 | |
Commercial Mortgage Trust,
Ser. 2015-DC1, Cl. A5 | | 3.35 | | 2/10/2048 | | 170,000 | | 168,939 | |
Commercial Mortgage Trust,
Ser. 2017-CD3, Cl. A4 | | 3.63 | | 2/10/2050 | | 290,000 | | 291,222 | |
Houston Galleria Mall Trust,
Ser. 2015-HGLR, Cl. A1A2 | | 3.09 | | 3/5/2037 | | 100,000 | b | 97,065 | |
| | 628,214 | |
Diversified Financials - .8% | | | | | |
American Express Credit,
Sr. Unscd. Notes, Ser. F | | 2.60 | | 9/14/2020 | | 135,000 | | 133,627 | |
Quicken Loans,
Gtd. Notes | | 5.75 | | 5/1/2025 | | 40,000 | b | 37,600 | |
Visa,
Sr. Unscd. Notes | | 3.15 | | 12/14/2025 | | 110,000 | | 108,249 | |
| | 279,476 | |
Electronic Components - .2% | | | | | |
Corning,
Sr. Unscd. Notes | | 4.38 | | 11/15/2057 | | 80,000 | | 67,228 | |
Energy - 2.9% | | | | | |
Andeavor Logistics,
Gtd. Notes | | 3.50 | | 12/1/2022 | | 40,000 | | 38,748 | |
Cheniere Corpus Christi Holdings,
Sr. Scd. Notes | | 5.13 | | 6/30/2027 | | 35,000 | | 33,173 | |
Concho Resources,
Gtd. Notes | | 4.88 | | 10/1/2047 | | 30,000 | | 28,673 | |
Ecopetrol,
Sr. Unscd. Notes | | 5.88 | | 5/28/2045 | | 25,000 | | 23,663 | |
Energy Transfer Partners,
Gtd. Notes | | 5.15 | | 2/1/2043 | | 195,000 | | 169,717 | |
EQT,
Sr. Unscd. Notes | | 3.90 | | 10/1/2027 | | 35,000 | | 30,244 | |
Genesis Energy,
Gtd. Notes | | 6.75 | | 8/1/2022 | | 35,000 | d | 34,300 | |
Kinder Morgan,
Gtd. Notes | | 7.75 | | 1/15/2032 | | 160,000 | | 192,364 | |
MPLX LP,
Sr. Unscd. Notes | | 4.13 | | 3/1/2027 | | 70,000 | | 66,797 | |
10
| | | | | | | | | | |
| |
Description | Coupon
Rate (%) | | Maturity
Date | | Principal
Amount ($) | a | Value ($) | |
Bonds and Notes - 98.9% (continued) | | | | | |
Energy - 2.9% (continued) | | | | | |
MPLX LP,
Sr. Unscd. Notes | | 5.20 | | 3/1/2047 | | 60,000 | | 55,495 | |
Petrobras Global Finance,
Gtd. Notes | | 7.38 | | 1/17/2027 | | 50,000 | | 51,475 | |
TransCanada PipeLines,
Sr. Unscd. Notes | | 4.25 | | 5/15/2028 | | 90,000 | | 89,355 | |
Western Gas Partners,
Sr. Unscd. Notes | | 4.50 | | 3/1/2028 | | 35,000 | | 32,794 | |
Williams Partners,
Sr. Unscd. Notes | | 4.50 | | 11/15/2023 | | 130,000 | | 130,812 | |
Williams Partners,
Sr. Unscd. Notes | | 6.30 | | 4/15/2040 | | 65,000 | | 69,167 | |
| | 1,046,777 | |
Environmental Control - .4% | | | | | |
Republic Services,
Sr. Unscd. Notes | | 3.38 | | 11/15/2027 | | 40,000 | | 38,413 | |
Waste Management,
Gtd. Notes | | 4.10 | | 3/1/2045 | | 110,000 | | 106,752 | |
| | 145,165 | |
Food Products - .6% | | | | | |
Kraft Heinz Foods,
Gtd. Notes | | 3.95 | | 7/15/2025 | | 155,000 | | 150,282 | |
Kraft Heinz Foods,
Gtd. Notes | | 6.88 | | 1/26/2039 | | 10,000 | | 11,200 | |
Post Holdings,
Gtd. Notes | | 5.50 | | 3/1/2025 | | 40,000 | b | 38,542 | |
| | 200,024 | |
Foreign/Governmental - 8.4% | | | | | |
Argentine Government,
Sr. Unscd. Bonds | EUR | 5.25 | | 1/15/2028 | | 100,000 | | 82,563 | |
Bonos de la Nacion Argentina con Ajuste por CER,
Unscd. Bonds | ARS | 3.75 | | 2/8/2019 | | 5,483,164 | e | 145,551 | |
Canadian Government,
Unscd. Bonds | CAD | 0.50 | | 12/1/2050 | | 185,724 | e | 125,989 | |
French Government,
Unscd. Bonds | EUR | 2.00 | | 5/25/2048 | | 245,000 | b | 305,233 | |
Hellenic Republic Government,
Unscd. Bonds | EUR | 3.90 | | 1/30/2033 | | 85,000 | | 88,801 | |
Hungarian Government,
Sr. Unscd. Notes | | 5.38 | | 3/25/2024 | | 45,000 | | 48,269 | |
International Finance,
Sr. Unscd. Notes | INR | 6.30 | | 11/25/2024 | | 3,950,000 | | 54,222 | |
Ivory Coast Government,
Sr. Unscd. Notes | EUR | 5.25 | | 3/22/2030 | | 100,000 | b | 101,325 | |
11
STATEMENT OF INVESTMENTS (continued)
| | | | | | | | | | |
| |
Description | Coupon
Rate (%) | | Maturity
Date | | Principal
Amount ($) | a | Value ($) | |
Bonds and Notes - 98.9% (continued) | | | | | |
Foreign/Governmental - 8.4% (continued) | | | | | |
Japanese Government,
Sr. Unscd. Bonds, Ser. 21 | JPY | 0.10 | | 3/10/2026 | | 144,626,346 | e | 1,363,727 | |
Provincia de Buenos Aires/Argentina,
Unscd. Bonds, BADLAR + 3.83% | ARS | 49.22 | | 5/31/2022 | | 2,400,000 | c | 57,336 | |
Qatari Government,
Sr. Unscd. Notes | | 5.10 | | 4/23/2048 | | 200,000 | | 210,525 | |
Romanian Government,
Sr. Unscd. Notes | EUR | 2.50 | | 2/8/2030 | | 75,000 | b | 80,195 | |
Senegalese Government,
Sr. Unscd. Bonds | EUR | 4.75 | | 3/13/2028 | | 100,000 | | 105,779 | |
Spanish Government,
Sr. Unscd. Bonds | EUR | 2.90 | | 10/31/2046 | | 75,000 | b | 92,157 | |
Spanish Government,
Sr. Unscd. Bonds, Ser. 30Y | EUR | 2.70 | | 10/31/2048 | | 75,000 | b | 87,620 | |
Ukrainian Government,
Sr. Unscd. Notes | | 0.00 | | 5/31/2040 | | 95,000 | f | 55,093 | |
| | 3,004,385 | |
Health Care - 2.9% | | | | | |
Abbott Laboratories,
Sr. Unscd. Notes | | 4.90 | | 11/30/2046 | | 120,000 | | 126,622 | |
Aetna,
Sr. Unscd. Notes | | 2.80 | | 6/15/2023 | | 265,000 | | 252,262 | |
AmerisourceBergen,
Sr. Unscd. Notes | | 3.25 | | 3/1/2025 | | 95,000 | | 90,892 | |
CVS Health,
Sr. Unscd. Notes | | 4.30 | | 3/25/2028 | | 115,000 | | 112,819 | |
Gilead Sciences,
Sr. Unscd. Notes | | 3.65 | | 3/1/2026 | | 55,000 | | 53,988 | |
Gilead Sciences,
Sr. Unscd. Notes | | 4.75 | | 3/1/2046 | | 30,000 | | 29,870 | |
Medtronic,
Gtd. Notes | | 4.63 | | 3/15/2045 | | 90,000 | | 94,707 | |
Shire Acquisitions Investments Ireland,
Gtd. Notes | | 2.88 | | 9/23/2023 | | 135,000 | | 127,748 | |
Teva Pharmaceutical Finance Netherlands III,
Gtd. Notes | | 3.15 | | 10/1/2026 | | 45,000 | | 34,419 | |
UnitedHealth Group,
Sr. Unscd. Notes | | 4.75 | | 7/15/2045 | | 115,000 | | 122,116 | |
| | 1,045,443 | |
Industrials - 1.0% | | | | | |
General Electric,
Jr. Sub. Debs., Ser. D | | 5.00 | | 12/29/2049 | | 455,000 | | 348,644 | |
Information Technology - .4% | | | | | |
Oracle,
Sr. Unscd. Notes | | 2.65 | | 7/15/2026 | | 140,000 | | 129,946 | |
12
| | | | | | | | | | |
| |
Description | Coupon
Rate (%) | | Maturity
Date | | Principal
Amount ($) | a | Value ($) | |
Bonds and Notes - 98.9% (continued) | | | | | |
Insurance - .6% | | | | | |
American International Group,
Sr. Unscd. Notes | | 4.20 | | 4/1/2028 | | 120,000 | | 116,066 | |
Principal Financial Group,
Gtd. Notes | | 4.30 | | 11/15/2046 | | 90,000 | | 83,246 | |
| | 199,312 | |
Internet Software & Services - .3% | | | | | |
Amazon.com,
Sr. Unscd. Notes | | 4.05 | | 8/22/2047 | | 105,000 | | 103,005 | |
Media - 1.7% | | | | | |
21st Century Fox America,
Gtd. Notes | | 4.00 | | 10/1/2023 | | 90,000 | | 92,424 | |
21st Century Fox America,
Gtd. Notes | | 4.75 | | 11/15/2046 | | 55,000 | | 59,960 | |
Charter Communications Operating,
Sr. Scd. Notes | | 5.38 | | 5/1/2047 | | 100,000 | | 91,041 | |
Comcast,
Gtd. Notes | | 3.15 | | 3/1/2026 | | 155,000 | | 148,521 | |
Comcast,
Gtd. Notes | | 4.70 | | 10/15/2048 | | 45,000 | | 45,896 | |
Cox Communications,
Sr. Unscd. Notes | | 4.60 | | 8/15/2047 | | 85,000 | b | 76,856 | |
Warner Media,
Gtd. Debs. | | 5.35 | | 12/15/2043 | | 110,000 | | 106,512 | |
| | 621,210 | |
Metals & Mining - .2% | | | | | |
Glencore Funding,
Gtd. Notes | | 4.63 | | 4/29/2024 | | 70,000 | b | 69,631 | |
Municipal Bonds - 2.9% | | | | | |
California,
GO (Build America Bonds) | | 7.30 | | 10/1/2039 | | 340,000 | | 467,776 | |
New Jersey Economic Development Authority,
School Facilities Construction Revenue | | 4.45 | | 6/15/2020 | | 305,000 | | 309,734 | |
New York City,
GO (Build America Bonds) | | 5.99 | | 12/1/2036 | | 200,000 | | 242,314 | |
| | 1,019,824 | |
Retailing - .1% | | | | | |
Dollar Tree,
Sr. Unscd. Notes | | 4.20 | | 5/15/2028 | | 25,000 | | 23,739 | |
Technology Hardware & Equipment - .5% | | | | | |
Diamond 1 Finance,
Sr. Scd. Notes | | 6.02 | | 6/15/2026 | | 110,000 | b | 110,707 | |
Hewlett Packard Enterprise,
Sr. Unscd. Notes | | 4.40 | | 10/15/2022 | | 70,000 | | 71,442 | |
| | 182,149 | |
13
STATEMENT OF INVESTMENTS (continued)
| | | | | | | | | | | |
| |
Description | Coupon
Rate (%) | | Maturity
Date | | Principal
Amount ($) | a | Value ($) | |
Bonds and Notes - 98.9% (continued) | | | | | |
Telecommunication Services - 1.0% | | | | | |
AT&T,
Sr. Unscd. Bonds | | 4.90 | | 8/15/2037 | | 150,000 | | 140,421 | |
AT&T,
Sr. Unscd. Notes | | 4.25 | | 3/1/2027 | | 50,000 | | 49,057 | |
Verizon Communications,
Sr. Unscd. Notes | | 3.38 | | 2/15/2025 | | 159,000 | | 154,472 | |
| | 343,950 | |
Transportation - .5% | | | | | |
CSX,
Sr. Unscd. Notes | | 2.60 | | 11/1/2026 | | 75,000 | | 68,371 | |
FedEx,
Gtd. Notes | | 4.40 | | 1/15/2047 | | 125,000 | | 112,879 | |
| | 181,250 | |
U.S. Government Agencies Mortgage-Backed - 22.3% | | | | | |
Federal Home Loan Mortgage Corp. | | | |
3.00%, 11/1/46 | | | 299,218 | g | 292,048 | |
3.50%, 8/1/45 | | | 175,259 | g | 175,954 | |
5.50%, 5/1/40 | | | 2,122 | g | 2,248 | |
Federal National Mortgage Association | | | |
2.87%, 1/1/48 | | | 287,389 | g | 288,118 | |
3.00%, 11/1/30 | | | 344,435 | g | 344,886 | |
3.50%, 5/1/30-9/1/47 | | | 3,348,749 | g | 3,363,407 | |
4.00%, 6/1/47 | | | 306,679 | g | 314,420 | |
4.50%, 10/1/40-8/1/48 | | | 811,934 | g | 849,639 | |
5.00%, 3/1/21-10/1/33 | | | 272,649 | g | 288,341 | |
7.00%, 6/1/29-9/1/29 | | | 7,806 | g | 7,964 | |
Government National Mortgage Association I | | | |
5.50%, 4/15/33 | | | 225,434 | | 245,959 | |
Government National Mortgage Association II | | | |
3.00%, 11/20/45 | | | 814,988 | | 804,434 | |
4.00%, 10/20/47-1/20/48 | | | 533,755 | | 547,225 | |
4.50%, 7/20/48 | | | 403,506 | | 418,029 | |
7.00%, 9/20/28-7/20/29 | | | 2,886 | | 3,286 | |
| | 7,945,958 | |
U.S. Government Securities - 34.9% | | | | | |
U.S. Treasury Bonds | | 3.13 | | 5/15/2048 | | 940,000 | | 959,773 | |
U.S. Treasury Bonds | | 3.38 | | 11/15/2048 | | 170,000 | | 182,142 | |
U.S. Treasury Bonds | | 4.50 | | 2/15/2036 | | 545,000 | | 672,564 | |
U.S. Treasury Floating Rate Notes,
3 Month T-Bill Flat | | 2.48 | | 1/31/2020 | | 1,710,000 | c | 1,709,431 | |
U.S. Treasury Floating Rate Notes,
3 Month T-Bill LIBOR + 0.05% | | 2.53 | | 10/31/2020 | | 1,170,000 | c | 1,168,443 | |
U.S. Treasury Floating Rate Notes,
3 Month T-Bill LIBOR + 0.06% | | 2.54 | | 7/31/2019 | | 1,435,000 | c | 1,435,608 | |
14
| | | | | | | | | | |
| |
Description | Coupon
Rate (%) | | Maturity
Date | | Principal
Amount ($) | a | Value ($) | |
Bonds and Notes - 98.9% (continued) | | | | | |
U.S. Government Securities - 34.9% (continued) | | | | | |
U.S. Treasury Inflation Protected Securities,
Bonds | | 0.88 | | 2/15/2047 | | 141,427 | e | 130,142 | |
U.S. Treasury Notes | | 2.63 | | 12/15/2021 | | 775,000 | | 778,536 | |
U.S. Treasury Notes | | 2.88 | | 11/15/2021 | | 700,000 | | 707,841 | |
U.S. Treasury Notes | | 2.88 | | 11/30/2023 | | 2,745,000 | | 2,793,084 | |
U.S. Treasury Notes | | 3.13 | | 11/15/2028 | | 1,825,000 | | 1,894,588 | |
| | 12,432,152 | |
Utilities - 1.7% | | | | | |
Dominion Resources,
Sr. Unscd. Notes, Ser. D | | 2.85 | | 8/15/2026 | | 165,000 | | 152,380 | |
Exelon Generation,
Sr. Unscd. Notes | | 6.25 | | 10/1/2039 | | 85,000 | | 88,995 | |
Kentucky Utilities,
First Mortgage Bonds | | 4.38 | | 10/1/2045 | | 80,000 | | 80,303 | |
Louisville Gas & Electric,
First Mortgage Bonds | | 4.38 | | 10/1/2045 | | 90,000 | | 90,340 | |
Nevada Power,
Mortgage Notes, Ser. R | | 6.75 | | 7/1/2037 | | 150,000 | | 194,927 | |
| | 606,945 | |
TotalBonds and Notes
(cost $35,738,895) | | 35,175,707 | |
Description /Number of Contracts/Counterparty | Exercise
Price | | Expiration Date | | Notional Amount ($) | a | Value ($) | |
Options Purchased - .0% | | | | | |
Call Options - .0% | | | | | |
British Pound
Contracts 140,000 Barclays Capital | GBP | 1.30 | | 2/15/2019 | | 140,000 | | 1,950 | |
British Pound
Contracts 140,000 Barclays Capital | GBP | 1.32 | | 2/7/2019 | | 140,000 | | 786 | |
Chinese Yuan Renminbi
Contracts 180,000 HSBC | | 6.96 | | 1/18/2019 | | 180,000 | | 188 | |
New Zealand Dollar Cross Currency
Contracts 70,000 J.P. Morgan Securities | AUD | 1.08 | | 5/24/2019 | | 70,000 | | 285 | |
South Korean Won Cross Currency
Contracts 20,000,000 HSBC | JPY | 10.20 | | 1/18/2019 | | 20,000,000 | | 1,461 | |
| | 4,670 | |
Put Options - .0% | | | | | |
British Pound Cross Currency
Contracts 50,000 Goldman Sachs | EUR | 0.87 | | 5/23/2019 | | 50,000 | | 617 | |
Chilean Peso
Contracts 50,000 J.P. Morgan Securities | | 660.00 | | 1/17/2019 | | 50,000 | | 14 | |
Indian Rupee
Contracts 90,000 HSBC | | 71.85 | | 2/22/2019 | | 90,000 | | 2,771 | |
15
STATEMENT OF INVESTMENTS (continued)
| | | | | | | | | | |
| |
Description /Number of Contracts/Counterparty | Exercise
Price | | Expiration Date | | Notional Amount ($) | a | Value ($) | |
Options Purchased - .0%(continued) | | | | | |
Put Options - .0% (continued) | | | | | |
Indonesian Rupiah
Contracts 90,000 J.P. Morgan Securities | | 14,750 | | 2/21/2019 | | 90,000 | | 2,173 | |
Japanese Yen Cross Currency
Contracts 50,000 Barclays Capital | EUR | 127.00 | | 4/12/2019 | | 50,000 | | 1,456 | |
Polish Zloty
Contracts 180,000 J.P. Morgan Securities | | 3.71 | | 1/15/2019 | | 180,000 | | 574 | |
| | 7,605 | |
TotalOptions Purchased
(cost $25,415) | | 12,275 | |
Description | Annualized
Yield (%) | | Maturity Date | | Principal Amount ($) | | | |
Short-Term Investments - .3% | | | | | |
U.S. Government Securities | | | | | |
U.S. Treasury Bills
(cost $99,988) | | 2.13 | | 1/3/2019 | | 100,000 | h,i | 99,994 | |
Description | 1-Day
Yield (%) | | | | Shares | | | |
Investment Companies - 1.5% | | | | | |
Registered Investment Companies - 1.5% | | | | | |
Dreyfus Institutional Preferred Government Plus Money Market Fund
(cost $534,430) | | 2.32 | | | | 534,430 | j | 534,430 | |
16
| | | | | | | | | | |
| |
Description | 1-Day
Yield (%) | | | | Shares | | Value ($) | |
Investment of Cash Collateral for Securities Loaned - .1% | | | | | |
Registered Investment Companies - .1% | | | | | |
Dreyfus Institutional Preferred Government Money Market Fund, Institutional Shares
(cost $34,650) | | 2.69 | | | | 34,650 | j | 34,650 | |
Total Investments(cost $36,433,378) | | 100.8% | 35,857,056 | |
Liabilities, Less Cash and Receivables | | (0.8%) | (270,773) | |
Net Assets | | 100.0% | 35,586,283 | |
BADLAR—Buenos Aires Interbank Offer Rate
LIBOR—London Interbank Offered Rate
ARS—Argentine Peso
AUD—Australian Dollar
CAD—Canadian Dollar
EUR—Euro
GBP—British Pound
INR—Indian Rupee
JPY—Japanese Yen
a Amount stated in U.S. Dollars unless otherwise noted above.
b Security exempt from registration pursuant to Rule 144A under the Securities Act of 1933. These securities may be resold in transactions exempt from registration, normally to qualified institutional buyers. At December 31, 2018, these securities were valued at $2,380,211 or 6.69% of net assets.
c Variable rate security—rate shown is the interest rate in effect at period end.
d Security, or portion thereof, on loan. At December 31, 2018, the value of the fund’s securities on loan was $67,863 and the value of the collateral held by the fund was $70,793, consisting of cash collateral of $34,650 and U.S. Government & Agency securities valued at $36,143.
e Principal amount for accrual purposes is periodically adjusted based on changes in the Consumer Price Index.
f Zero coupon until a specified date at which time the stated coupon rate becomes effective until maturity.
g The Federal Housing Finance Agency (“FHFA”) placed the Federal Home Loan Mortgage Corporation and Federal National Mortgage Association into conservatorship with FHFA as the conservator. As such, the FHFA oversees the continuing affairs of these companies.
h Held by a counterparty for open exchange traded derivative contracts.
i Security is a discount security. Income is recognized through the accretion of discount.
j Investment in affiliated issuer. The investment objective of this investment company is publicly available and can be found within the investment company’s prospectus.
17
STATEMENT OF INVESTMENTS (continued)
| | |
Portfolio Summary (Unaudited)† | Value (%) |
Government | 46.5 |
Mortgage Securities | 24.1 |
Financial | 8.1 |
Consumer, Non-cyclical | 4.4 |
Asset Backed Securities | 4.3 |
Communications | 3.0 |
Energy | 2.9 |
Industrial | 2.1 |
Utilities | 1.7 |
Investment Companies | 1.6 |
Basic Materials | 1.1 |
Technology | .9 |
Consumer, Cyclical | .1 |
Options Purchased | .0 |
| | 100.8 |
† Based on net assets.
See notes to financial statements.
18
STATEMENT OF INVESTMENTS IN AFFILIATED ISSUERS
| | | | | | | |
Registered Investment Company | Value
12/31/17($) | Purchases($) | Sales($) | Value
12/31/18($) | Net
Assets(%) | Dividends/
Distributions($) |
Dreyfus Institutional Preferred Government Plus Money Market Fund | 364,281 | 12,761,355 | 12,591,206 | 534,430 | 1.5 | 9,684 |
Dreyfus Institutional Preferred Government Money Market Fund, Institutional Shares | - | 9,790,005 | 9,755,355 | 34,650 | .1 | - |
Total | 364,281 | 22,551,360 | 22,346,561 | 569,080 | 1.6 | 9,684 |
See notes to financial statements.
19
STATEMENT OF FUTURES
December 31, 2018
| | | | | | | |
Description | Number of
Contracts | Expiration | Notional
Value ($) | Value ($) | Unrealized Appreciation (Depreciation) ($) | |
Futures Long | | |
Euro BTP Italian Government Bond | 3 | 3/19 | 433,219a | 439,349 | 6,130 | |
U.S. Treasury 2 Year Notes | 17 | 3/19 | 3,586,229 | 3,609,313 | 23,084 | |
U.S. Treasury 5 Year Notes | 5 | 3/19 | 564,422 | 573,438 | 9,016 | |
Ultra 10 Year U.S. Treasury Notes | 3 | 3/19 | 377,465 | 390,234 | 12,769 | |
Futures Short | | |
Canadian 10 Year Bond | 5 | 3/19 | 487,006a | 500,916 | (13,910) | |
Euro 30 Year Bond | 1 | 3/19 | 202,751a | 206,945 | (4,194) | |
Euro-Bobl | 9 | 3/19 | 1,363,206a | 1,366,513 | (3,307) | |
Euro-Bond | 5 | 3/19 | 931,777a | 936,880 | (5,103) | |
Japanese 10 Year Bond | 1 | 3/19 | 1,386,706a | 1,391,177 | (4,471) | |
Gross Unrealized Appreciation | | 50,999 | |
Gross Unrealized Depreciation | | (30,985) | |
a Notional amounts in foreign currency have been converted to USD using relevant foreign exchange rates.
See notes to financial statements.
20
STATEMENT OF OPTIONS WRITTEN
December 31, 2018
| | | | | | | |
Description/ Contracts/ Counterparties | Exercise Price | Expiration Date | Notional Amount | a | Value ($) | |
Call Options: | | | | | | |
British Pound Cross Currency
Contracts 50,000, Goldman Sachs | 0.94 | 5/23/19 | 50,000 | EUR | (802) | |
Chilean Peso
Contracts 50,000, J.P. Morgan Securities | 690 | 1/17/19 | 50,000 | | (633) | |
Japanese Yen Cross Currency
Contracts 50,000, Barclays Capital | 134 | 4/12/19 | 50,000 | EUR | (96) | |
Put Options: | | | | | | |
New Zealand Dollar Cross Currency
Contracts 70,000, J.P. Morgan Securities | 1.05 | 5/24/19 | 70,000 | AUD | (780) | |
Total Options Written
(premiums received $2,516) | | | | (2,311) | |
a Notional amount stated in U.S. Dollars unless otherwise indicated.
AUD—Australian Dollar
EUR—Euro
See notes to financial statements.
21
STATEMENT OF FORWARD FOREIGN CURRENCY EXCHANGE CONTRACTSDecember 31, 2018
| | | | | | |
Counterparty/ Purchased
Currency | Purchased Currency
Amounts | Currency
Sold | Sold
Currency
Amounts | Settlement Date | Unrealized Appreciation (Depreciation)($) |
Barclays Capital | | | |
United States Dollar | 1,173,701 | Japanese Yen | 132,600,000 | 1/31/19 | (39,081) |
Indonesian Rupiah | 1,663,575,000 | United States Dollar | 113,153 | 2/25/19 | 1,850 |
Russian Ruble | 3,320,000 | United States Dollar | 49,402 | 2/25/19 | (2,124) |
United States Dollar | 54,867 | New Zealand Dollar | 80,000 | 1/31/19 | 1,141 |
Brazilian Real | 200,000 | United States Dollar | 51,160 | 2/4/19 | 330 |
United States Dollar | 54,807 | Malaysian Ringgit | 230,000 | 2/25/19 | (807) |
Czech Koruna | 1,570,000 | Euro | 60,500 | 2/25/19 | 367 |
Citigroup | | | |
Colombian Peso | 89,555,000 | United States Dollar | 27,321 | 2/25/19 | 179 |
United States Dollar | 1,116,819 | Euro | 979,000 | 1/31/19 | (7,866) |
Australian Dollar | 80,000 | United States Dollar | 57,804 | 1/31/19 | (1,419) |
Norwegian Krone | 2,855,000 | United States Dollar | 333,983 | 1/31/19 | (3,307) |
Swedish Krona | 2,450,000 | United States Dollar | 269,631 | 1/31/19 | 7,516 |
Singapore Dollar | 160,000 | United States Dollar | 117,304 | 2/25/19 | 237 |
Chilean Peso | 18,450,000 | United States Dollar | 26,817 | 2/25/19 | (209) |
United States Dollar | 103,215 | Mexican Peso | 2,140,000 | 2/25/19 | (4,727) |
British Pound | 85,000 | United States Dollar | 107,683 | 1/31/19 | 830 |
J.P. Morgan Securities | | | |
United States Dollar | 106,322 | Philippine Peso | 5,620,000 | 2/26/19 | 23 |
United States Dollar | 136,884 | South Korean Won | 153,940,000 | 2/25/19 | (1,343) |
United States Dollar | 77,717 | Argentine Peso | 3,140,000 | 2/8/19 | (1,268) |
Indian Rupee | 3,739,500 | United States Dollar | 52,377 | 2/25/19 | 847 |
United States Dollar | 114,070 | Swedish Krona | 1,030,000 | 1/31/19 | (2,445) |
Chilean Peso | 54,830,000 | United States Dollar | 80,939 | 2/25/19 | (1,864) |
United States Dollar | 109,358 | Peruvian Nuevo Sol | 370,000 | 2/14/19 | (292) |
22
| | | | | | |
Counterparty/ Purchased
Currency | Purchased Currency
Amounts | Currency
Sold | Sold
Currency
Amounts | Settlement Date | Unrealized Appreciation (Depreciation)($) |
J.P. Morgan Securities (continued) |
United States Dollar | 110,406 | Hong Kong Dollar | 860,000 | 4/10/19 | 259 |
United States Dollar | 143,991 | Romanian Leu | 590,000 | 2/25/19 | (1,079) |
Norwegian Krone | 950,000 | United States Dollar | 110,321 | 1/31/19 | (289) |
United States Dollar | 124,718 | Hong Kong Dollar | 970,000 | 1/8/19 | 815 |
United States Dollar | 110,379 | Hungarian Forint | 31,160,000 | 2/25/19 | (1,264) |
UBS Securities | | | |
United States Dollar | 127,511 | Canadian Dollar | 170,000 | 1/31/19 | 2,884 |
Czech Koruna | 5,865,000 | Euro | 226,177 | 2/25/19 | 1,176 |
Gross Unrealized Appreciation | | | 18,454 |
Gross Unrealized Depreciation | | | (69,384) |
See notes to financial statements.
23
STATEMENT OF ASSETS AND LIABILITIES
December 31, 2018
| | | | | | | |
| | | | | | |
| | | Cost | | Value | |
Assets ($): | | | | |
Investments in securities—See Statement of Investments
(including securities on loan, valued at $67,863)—Note 1(c): | | | |
Unaffiliated issuers | 35,864,298 | | 35,287,976 | |
Affiliated issuers | | 569,080 | | 569,080 | |
Cash denominated in foreign currency | | | 26,475 | | 26,264 | |
Interest and securities lending income receivable | | 226,957 | |
Unrealized appreciation on forward foreign
currency exchange contracts—Note 4 | | 18,454 | |
Receivable for futures variation margin—Note 4 | | 5,230 | |
Receivable for shares of Beneficial Interest subscribed | | 2,455 | |
Prepaid expenses | | | | | 207 | |
| | | | | 36,136,623 | |
Liabilities ($): | | | | |
Due to The Dreyfus Corporation and affiliates—Note 3(b) | | | | 30,723 | |
Cash overdraft due to Custodian | | | | | 4,629 | |
Payable for investment securities purchased | | 296,056 | |
Unrealized depreciation on forward foreign
currency exchange contracts—Note 4 | | 69,384 | |
Liability for securities on loan—Note 1(c) | | 34,650 | |
Payable for shares of Beneficial Interest redeemed | | 19,946 | |
Unrealized depreciation on foreign currency transactions | | 3,051 | |
Outstanding options written, at value
(premiums received $2,516)—Note 4 | | 2,311 | |
Trustees fees and expenses payable | | 369 | |
Accrued expenses | | | | | 89,221 | |
| | | | | 550,340 | |
Net Assets ($) | | | 35,586,283 | |
Composition of Net Assets ($): | | | | |
Paid-in capital | | | | | 37,278,077 | |
Total distributable earnings (loss) | | | | | (1,691,794) | |
Net Assets ($) | | | 35,586,283 | |
| | | | |
Net Asset Value Per Share | Initial Shares | Service Shares | |
Net Assets ($) | 32,611,200 | 2,975,083 | |
Shares Outstanding | 2,873,391 | 263,096 | |
Net Asset Value Per Share ($) | 11.35 | 11.31 | |
| | | | |
See notes to financial statements. | | | |
24
STATEMENT OF OPERATIONS
Year Ended December 31, 2018
| | | | | | | |
| | | | | | |
| | | | | | |
Investment Income ($): | | | | |
Income: | | | | |
Interest (net of $688 foreign taxes withheld at source) | | | 1,328,088 | |
Dividends from affiliated issuers | | | 9,684 | |
Income from securities lending—Note 1(c) | | | 1,572 | |
Total Income | | | 1,339,344 | |
Expenses: | | | | |
Investment advisory fee—Note 3(a) | | | 244,927 | |
Professional fees | | | 119,796 | |
Pricing fees | | | 28,816 | |
Prospectus and shareholders’ reports | | | 16,558 | |
Distribution fees—Note 3(b) | | | 7,950 | |
Custodian fees—Note 3(b) | | | 7,091 | |
Trustees’ fees and expenses—Note 3(c) | | | 2,845 | |
Shareholder servicing costs—Note 3(b) | | | 489 | |
Loan commitment fees—Note 2 | | | 475 | |
Miscellaneous | | | 33,955 | |
Total Expenses | | | 462,902 | |
Less—reduction in fees due to earnings credits—Note 3(b) | | | (75) | |
Net Expenses | | | 462,827 | |
Investment Income—Net | | | 876,517 | |
Realized and Unrealized Gain (Loss) on Investments—Note 4 ($): | | |
Net realized gain (loss) on investments and foreign currency transactions | (643,712) | |
Net realized gain (loss) on options transactions | (60,910) | |
Net realized gain (loss) on futures | (104,927) | |
Net realized gain (loss) on swap agreements | 64,112 | |
Net realized gain (loss) on forward foreign currency exchange contracts | 109,033 | |
Net Realized Gain (Loss) | | | (636,404) | |
Net unrealized appreciation (depreciation) on investments
and foreign currency transactions | | | (1,217,352) | |
Net unrealized appreciation (depreciation) on options transactions | (7,623) | |
Net unrealized appreciation (depreciation) on futures | | | 18,718 | |
Net unrealized appreciation (depreciation) on swap agreements | | | (14,329) | |
Net unrealized appreciation (depreciation) on
forward foreign currency exchange contracts | | | (38,087) | |
Net Unrealized Appreciation (Depreciation) | | | (1,258,673) | |
Net Realized and Unrealized Gain (Loss) on Investments | | | (1,895,077) | |
Net (Decrease) in Net Assets Resulting from Operations | | (1,018,560) | |
| | | | | | | |
See notes to financial statements. | | | | | |
25
STATEMENT OF CHANGES IN NET ASSETS
| | | | | | | | | | |
| | | | Year Ended December 31, |
| | | | 2018 | | 2017 | a |
Operations ($): | | | | | | | | |
Investment income—net | | | 876,517 | | | | 906,349 | |
Net realized gain (loss) on investments | | (636,404) | | | | 364,265 | |
Net unrealized appreciation (depreciation)
on investments | | (1,258,673) | | | | 876,408 | |
Net Increase (Decrease) in Net Assets
Resulting from Operations | (1,018,560) | | | | 2,147,022 | |
Distributions ($): | |
Distributions to shareholders: | | | | | | | | |
Initial Shares | | | (950,428) | | | | (813,417) | |
Service Shares | | | (79,645) | | | | (171,803) | |
Total Distributions | | | (1,030,073) | | | | (985,220) | |
Beneficial Interest Transactions ($): | |
Net proceeds from shares sold: | | | | | | | | |
Initial Shares | | | 2,291,682 | | | | 3,032,116 | |
Service Shares | | | 314,608 | | | | 743,815 | |
Distributions reinvested: | | | | | | | | |
Initial Shares | | | 950,428 | | | | 813,417 | |
Service Shares | | | 79,645 | | | | 171,803 | |
Cost of shares redeemed: | | | | | | | | |
Initial Shares | | | (6,337,684) | | | | (6,262,415) | |
Service Shares | | | (585,297) | | | | (10,408,658) | |
Increase (Decrease) in Net Assets
from Beneficial Interest Transactions | (3,286,618) | | | | (11,909,922) | |
Total Increase (Decrease) in Net Assets | (5,335,251) | | | | (10,748,120) | |
Net Assets ($): | |
Beginning of Period | | | 40,921,534 | | | | 51,669,654 | |
End of Period | | | 35,586,283 | | | | 40,921,534 | |
Capital Share Transactions (Shares): | |
Initial Shares | | | | | | | | |
Shares sold | | | 199,820 | | | | 254,562 | |
Shares issued for distributions reinvested | | | 82,633 | | | | 68,573 | |
Shares redeemed | | | (551,354) | | | | (527,187) | |
Net Increase (Decrease) in Shares Outstanding | (268,901) | | | | (204,052) | |
Service Shares | | | | | | | | |
Shares sold | | | 27,330 | | | | 63,079 | |
Shares issued for distributions reinvested | | | 6,953 | | | | 14,585 | |
Shares redeemed | | | (51,392) | | | | (874,202) | |
Net Increase (Decrease) in Shares Outstanding | (17,109) | | | | (796,538) | |
| | | | | | | | | | |
aDistributions to shareholders include only distributions from net investment income. Undistributed investment income-net was $352,800 in 2017 and is no longer presented as a result of the adoption of SEC’s Disclosure Update and Simplification Rule. | |
See notes to financial statements. | | | | | | | | |
26
FINANCIAL HIGHLIGHTS
The following tables describe the performance for each share class for the fiscal periods indicated. All information (except portfolio turnover rate) reflects financial results for a single fund share. Total return shows how much your investment in the fund would have increased (or decreased) during each period, assuming you had reinvested all dividends and distributions. The fund’s total returns do not reflect expenses associated with variable annuity or insurance contracts. These figures have been derived from the fund’s financial statements.
| | | | | | | |
| | | |
| | | Year Ended December 31, |
Initial Shares | | 2018 | 2017 | 2016 | 2015 | 2014 |
Per Share Data ($): | | | | | | |
Net asset value, beginning of period | | 11.96 | 11.69 | 11.72 | 12.16 | 11.85 |
Investment Operations: | | | | | | |
Investment income—neta | | .27 | .23 | .20 | .23 | .20 |
Net realized and unrealized
gain (loss) on investments | | (.56) | .29 | (.02)b | (.43) | .36 |
Total from Investment Operations | | (.29) | .52 | .18 | (.20) | .56 |
Distributions: | | | | | | |
Dividends from
investment income—net | | (.32) | (.25) | (.21) | (.24) | (.25) |
Net asset value, end of period | | 11.35 | 11.96 | 11.69 | 11.72 | 12.16 |
Total Return (%) | | (2.55) | 4.50 | 1.52 | (1.65) | 4.79 |
Ratios/Supplemental Data (%): | | | | | | |
Ratio of total expenses
to average net assets | | 1.21 | .98 | .94 | .92 | .85 |
Ratio of net expenses
to average net assets | | 1.21 | .98 | .94 | .92 | .85 |
Ratio of net investment income
to average net assets | | 2.36 | 1.97 | 1.65 | 1.91 | 1.68 |
Portfolio Turnover Ratec | | 109.04 | 161.74 | 227.98 | 314.50 | 387.86 |
Net Assets, end of period ($ x 1,000) | | 32,611 | 37,584 | 39,133 | 44,057 | 49,880 |
a Based on average shares outstanding.
b In addition to net realized and unrealized gains on investments, this amount includes a decrease in net asset value per share resulting from the timing of issuances and redemptions of shares in relation to fluctuating market values for the portfolio investments.
c The portfolio turnover rates excluding mortgage dollar roll transactions for the periods ended December 31, 2018, 2017, 2016, 2015 and 2014 were 98.22%, 106.51%, 172.50%, 120.54% and 182.67% , respectively.
See notes to financial statements.
27
FINANCIAL HIGHLIGHTS (continued)
| | | | | | | |
| | | |
| | | Year Ended December 31, |
Service Shares | | 2018 | 2017 | 2016 | 2015 | 2014 |
Per Share Data ($): | | | | | | |
Net asset value, beginning of period | | 11.91 | 11.64 | 11.67 | 12.11 | 11.80 |
Investment Operations: | | | | | | |
Investment income—neta | | .22 | .20 | .17 | .20 | .17 |
Net realized and unrealized
gain (loss) on investments | | (.53) | .29 | (.02)b | (.42) | .36 |
Total from Investment Operations | | (.31) | .49 | .15 | (.22) | .53 |
Distributions: | | | | | | |
Dividends from
investment income—net | | (.29) | (.22) | (.18) | (.22) | (.22) |
Net asset value, end of period | | 11.31 | 11.91 | 11.64 | 11.67 | 12.11 |
Total Return (%) | | (2.73) | 4.25 | 1.27 | (1.89) | 4.56 |
Ratios/Supplemental Data (%): | | | | | | |
Ratio of total expenses
to average net assets | | 1.46 | 1.23 | 1.19 | 1.17 | 1.10 |
Ratio of net expenses
to average net assets | | 1.46 | 1.23 | 1.19 | 1.17 | 1.10 |
Ratio of net investment income
to average net assets | | 1.94 | 1.64 | 1.40 | 1.66 | 1.43 |
Portfolio Turnover Ratec | | 109.04 | 161.74 | 227.98 | 314.50 | 387.86 |
Net Assets, end of period ($ x 1,000) | | 2,975 | 3,338 | 12,537 | 14,314 | 17,359 |
a Based on average shares outstanding.
b In addition to net realized and unrealized gains on investments, this amount includes a decrease in net asset value per share resulting from the timing of issuances and redemptions of shares in relation to fluctuating market values for the portfolio investments.
c The portfolio turnover rates excluding mortgage dollar roll transactions for the periods ended December 31, 2018, 2017, 2016, 2015 and 2014 were 98.22%, 106.51%, 172.50%, 120.54% and 182.67% , respectively.
See notes to financial statements.
28
NOTES TO FINANCIAL STATEMENTS
NOTE 1—Significant Accounting Policies:
Quality Bond Portfolio (the “fund”) is a separate diversified series of Dreyfus Variable Investment Fund (the “Company”), which is registered under the Investment Company Act of 1940, as amended (the “Act”), as an open-end management investment company and operates as a series company currently offering seven series, including the fund. The fund is only offered to separate accounts established by insurance companies to fund variable annuity contracts and variable life insurance policies. The fund’s investment objective is to seek to maximize total return, consisting of capital appreciation and current income. The Dreyfus Corporation (the “Manager” or “Dreyfus”), a wholly-owned subsidiary of The Bank of New York Mellon Corporation (“BNY Mellon”), serves as the fund’s investment adviser.
MBSC Securities Corporation (the “Distributor”), a wholly-owned subsidiary of Dreyfus, is the distributor of the fund’s shares, which are sold without a sales charge. The fund is authorized to issue an unlimited number of $.001 par value shares of Beneficial Interest in each of the following classes of shares: Initial and Service. Each class of shares has identical rights and privileges, except with respect to the Distribution Plan, and the expenses borne by each class, the allocation of certain transfer agency costs and certain voting rights. Income, expenses (other than expenses attributable to a specific class), and realized and unrealized gains or losses on investments are allocated to each class of shares based on its relative net assets.
The Company accounts separately for the assets, liabilities and operations of each series. Expenses directly attributable to each series are charged to that series’ operations; expenses which are applicable to all series are allocated among them on a pro rata basis.
The Financial Accounting Standards Board (“FASB”) Accounting Standards Codification (“ASC”) is the exclusive reference of authoritative U.S. generally accepted accounting principles (“GAAP”) recognized by the FASB to be applied by nongovernmental entities. Rules and interpretive releases of the Securities and Exchange Commission (“SEC”) under authority of federal laws are also sources of authoritative GAAP for SEC registrants. The fund’s financial statements are prepared in accordance with GAAP, which may require the use of management estimates and assumptions. Actual results could differ from those estimates.
The Companyenters into contracts that contain a variety of indemnifications. The fund’s maximum exposure under these
29
NOTES TO FINANCIAL STATEMENTS(continued)
arrangements is unknown. The fund does not anticipate recognizing any loss related to these arrangements.
(a) Portfolio valuation: The fair value of a financial instrument is the amount that would be received to sell an asset or paid to transfer a liability in an orderly transaction between market participants at the measurement date (i.e., the exit price). GAAP establishes a fair value hierarchy that prioritizes the inputs of valuation techniques used to measure fair value. This hierarchy gives the highest priority to unadjusted quoted prices in active markets for identical assets or liabilities (Level 1 measurements) and the lowest priority to unobservable inputs (Level 3 measurements).
Additionally, GAAP provides guidance on determining whether the volume and activity in a market has decreased significantly and whether such a decrease in activity results in transactions that are not orderly. GAAP requires enhanced disclosures around valuation inputs and techniques used during annual and interim periods.
Various inputs are used in determining the value of the fund’s investments relating to fair value measurements. These inputs are summarized in the three broad levels listed below:
Level 1—unadjusted quoted prices in active markets for identical investments.
Level 2—other significant observable inputs (including quoted prices for similar investments, interest rates, prepayment speeds, credit risk, etc.).
Level 3—significant unobservable inputs (including the fund’s own assumptions in determining the fair value of investments).
The inputs or methodology used for valuing securities are not necessarily an indication of the risk associated with investing in those securities.
Changes in valuation techniques may result in transfers in or out of an assigned level within the disclosure hierarchy. Valuation techniques used to value the fund’s investments are as follows:
Registered investment companies that are not traded on an exchange are valued at their net asset value and are generally categorized within Level 1 of the fair value hierarchy.
Investments in securities, excluding short-term investments (other than U.S. Treasury Bills), futures, options and forward foreign currency exchange contracts (“forward contracts”) are valued each business day by an independent pricing service (the “Service”) approved by the Company’s Board of Trustees (the “Board”).Investments for which quoted bid prices
30
are readily available and are representative of the bid side of the market in the judgment of the Service are valued at the mean between the quoted bid prices (as obtained by the Service from dealers in such securities) and asked prices (as calculated by the Service based upon its evaluation of the market for such securities). Other investments (which constitute a majority of the portfolio securities) are valued as determined by the Service, based on methods which include consideration of the following: yields or prices of securities of comparable quality, coupon, maturity and type; indications as to values from dealers; and general market conditions. These securities are generally categorized within Level 2 of the fair value hierarchy.
U.S. Treasury Bills are valued at the mean price between quoted bid prices and asked prices by the Service. These securities are generally categorized within Level 2 of the fair value hierarchy.
The Service is engaged under the general supervision of the Board.
When market quotations or official closing prices are not readily available, or are determined not to accurately reflect fair value, such as when the value of a security has been significantly affected by events after the close of the exchange or market on which the security is principally traded (for example, a foreign exchange or market), but before the fund calculates its net asset value, the fund may value these investments at fair value as determined in accordance with the procedures approved by the Board. Certain factors may be considered when fair valuing investments such as: fundamental analytical data, the nature and duration of restrictions on disposition, an evaluation of the forces that influence the market in which the securities are purchased and sold, and public trading in similar securities of the issuer or comparable issuers. These securities are either categorized within Level 2 or 3 of the fair value hierarchy depending on the relevant inputs used.
For restricted securities where observable inputs are limited, assumptions about market activity and risk are used and such securities are generally categorized within Level 3 of the fair value hierarchy.
Investments denominated in foreign currencies are translated to U.S. dollars at the prevailing rates of exchange.
Futures and options, which are traded on an exchange, are valued at the last sales price on the securities exchange on which such securities are primarily traded or at the last sales price on the national securities market on each business day and are generally categorized within Level 1 of the fair value hierarchy. Options traded over-the-counter (“OTC”) are valued at the mean between the bid and asked price and are generally categorized within Level 2 of the fair value hierarchy. Investments in swap agreements
31
NOTES TO FINANCIAL STATEMENTS(continued)
are valued each business day by the Service. Forward contracts are valued at the forward rate and are generally categorized within Level 2 of the fair value hierarchy.
The following is a summary of the inputs used as of December 31, 2018in valuing the fund’s investments:
| | | | | |
| | Level 1 -Unadjusted Quoted Prices | Level 2 - Other Significant Observable Inputs | Level 3 -Significant Unobservable Inputs | Total |
Assets ($) |
Investments in Securities: | | | | |
Asset-Backed | - | 1,531,299 | - | 1,531,299 |
Commercial
Mortgage-Backed | - | 628,214 | - | 628,214 |
Corporate Bonds† | - | 8,613,875 | - | 8,613,875 |
Foreign Government | - | 3,004,385 | - | 3,004,385 |
Investment Companies | 569,080 | - | - | 569,080 |
Municipal Bonds | - | 1,019,824 | - | 1,019,824 |
U.S. Government
Agencies/
Mortgage-Backed | - | 7,945,958 | - | 7,945,958 |
U.S. Treasury | - | 12,532,146 | - | 12,532,146 |
Other Financial Instruments: |
Futures†† | 50,999 | - | - | 50,999 |
Forward Foreign
Currency Exchange
Contracts†† | - | 18,454 | - | 18,454 |
Options Purchased | - | 12,275 | - | 12,275 |
Liabilities ($) |
Other Financial Instruments: |
Futures†† | (30,985) | - | - | (30,985) |
Forward Foreign
Currency Exchange
Contracts†† | - | (69,384) | - | (69,384) |
Options Written | - | (2,311) | - | (2,311) |
† See Statement of Investments for additional detailed categorizations.
†† Amount shown represents unrealized appreciation (depreciation) at period end, but only variation margin on exchanged traded and centrally cleared derivativesare reported in the Statement of Assets and Liabilities.
At December 31, 2018, there were no transfers between levels of the fair value hierarchy. It is the fund’s policy to recognize transfers between levels at the end of the reporting period.
(b) Foreign currency transactions: The fund does not isolate that portion of the results of operations resulting from changes in foreign exchange rates on investments from the fluctuations arising from changes
32
in the market prices of securities held. Such fluctuations are included with the net realized and unrealized gain or loss on investments.
Net realized foreign exchange gains or losses arise from sales of foreign currencies, currency gains or losses realized on securities transactions between trade and settlement date, and the difference between the amounts of dividends, interest and foreign withholding taxes recorded on the fund’s books and the U.S. dollar equivalent of the amounts actually received or paid. Net unrealized foreign exchange gains and losses arise from changes in the value of assets and liabilities other than investments resulting from changes in exchange rates. Foreign currency gains and losses on foreign currency transactions are also included with net realized and unrealized gain or loss on investments.
(c)Securities transactions and investment income: Securities transactions are recorded on a trade date basis. Realized gains and losses from securities transactions are recorded on the identified cost basis. Dividend income is recognized on the ex-dividend date and interest income, including, where applicable, accretion of discount and amortization of premium on investments, is recognized on the accrual basis.
Pursuant to a securities lending agreement with The Bank of New York Mellon, a subsidiary of BNY Mellon and an affiliate of Dreyfus, the fund may lend securities to qualified institutions. It is the fund’s policy that, at origination, all loans are secured by collateral of at least 102% of the value of U.S. securities loaned and 105% of the value of foreign securities loaned. Collateral equivalent to at least 100% of the market value of securities on loan is maintained at all times. Collateral is either in the form of cash, which can be invested in certain money market mutual funds managed by Dreyfus, or U.S. Government and Agency securities. The fund is entitled to receive all dividends, interest and distributions on securities loaned, in addition to income earned as a result of the lending transaction. Should a borrower fail to return the securities in a timely manner, The Bank of New York Mellon is required to replace the securities for the benefit of the fund or credit the fund with the market value of the unreturned securities and is subrogated to the fund’s rights against the borrower and the collateral. Additionally, the contractual maturity of security lending transactions are on an overnight and continuous basis. During the period ended December 31, 2018, The Bank of New York Mellon earned $308 from lending portfolio securities, pursuant to the securities lending agreement.
(d) Affiliated issuers: Investments in other investment companies advised by Dreyfus are considered “affiliated” under the Act.
33
NOTES TO FINANCIAL STATEMENTS(continued)
(e) Dividends and distributions to shareholders: Dividends and distributions are recorded on the ex-dividend date. Dividends from investment income-net are normally declared and paid on a monthly basis. Dividends from net realized capital gains, if any, are normally declared and paid annually, but the fund may make distributions on a more frequent basis to comply with the distribution requirements of the Internal Revenue Code of 1986, as amended (the “Code”). To the extent that net realized capital gains can be offset by capital loss carryovers, it is the policy of the fund not to distribute such gains. Income and capital gain distributions are determined in accordance with income tax regulations, which may differ from GAAP.
On December 31, 2018, the Board declared a cash dividend of $.024 and $.021 per share for the Initial shares and Service shares, respectively, from undistributed investment income-net payable on January 2, 2019 (ex-dividend date) to shareholders of record as of the close of business on December 31, 2018.
(f) Federal income taxes: It is the policy of the fund to continue to qualify as a regulated investment company, if such qualification is in the best interests of its shareholders, by complying with the applicable provisions of the Code, and to make distributions of taxable income and net realized capital gain sufficient to relieve it from substantially all federal income and excise taxes.
As of and during the period ended December 31, 2018, the fund did not have any liabilities for any uncertain tax positions. The fund recognizes interest and penalties, if any, related to uncertain tax positions as income tax expense in the Statement of Operations. During the period ended December 31, 2018, the fund did not incur any interest or penalties.
Each tax year in the four-year period ended December 31, 2018 remains subject to examination by the Internal Revenue Service and state taxing authorities.
At December 31, 2018, the components of accumulated earnings on a tax basis were as follows: undistributed ordinary income $195,378, accumulated capital and other losses $1,229,579 and unrealized depreciation $657,593.
The fund is permitted to carry forward capital losses for an unlimited period. Furthermore, capital loss carryovers retain their character as either short-term or long-term capital losses.
The accumulated capital loss carryover is available for federal income tax purposes to be applied against future netrealized capital gains, if any,
34
realized subsequent to December 31, 2018. The fund has $524,561 of short-term losses and $693,792 of long-term capital losses which can be carried forward for an unlimited period.
The tax character of distributions paid to shareholders during the fiscal periods ended December 31, 2018 and December 31, 2017 were as follows: ordinary income $1,030,073 and $985,220, respectively.
(g) New Accounting Pronouncements: In March 2017, the FASB issued Accounting Standards Update 2017-08, Receivables—Nonrefundable Fees and Other Costs (Subtopic 310-20): Premium Amortization On Purchased Callable Debt Securities (“ASU 2017-08”). The update shortens the amortization period for the premium on certain purchased callable debt securities to the earliest call date. ASU 2017-08 will be effective for annual periods beginning after December 15, 2018.
Also in August 2018, the FASB issued Accounting Standards Update 2018-13, Fair Value Measurement (Topic 820): Disclosure Framework—Changes to the Disclosure Requirements for Fair Value Measurement (“ASU 2018-13”). The update provides guidance that eliminates, adds and modifies certain disclosure requirements for fair value measurements. ASU 2018-13 will be effective for annual periods beginning after December 15, 2019. Management is currently assessing the potential impact of these changes to future financial statements.
NOTE 2—Bank Lines of Credit:
The fund participates with other Dreyfus-managed long-term open-end funds in a $1.030 billion unsecured credit facility led by Citibank, N.A. (the “Citibank Credit Facility”) and a $300 million unsecured credit facility provided by The Bank of New York Mellon (the “BNYM Credit Facility”), each to be utilized primarily for temporary or emergency purposes, including the financing of redemptions (each, a “Facility”). The Citibank Credit Facility is available in two tranches: (i) Tranche A is in an amount equal to $830 million and is available to all long-term open-ended funds, including the fund, and (ii) Tranche B is in amount equal to $200 million and is available only to the Dreyfus Floating Rate Income Fund, a series of The Dreyfus/Laurel Funds, Inc. Prior to October 3, 2018, the unsecured credit facility with Citibank, N.A. was $830 million. In connection therewith, the fund has agreed to pay its pro rata portion of commitment fees for Tranche A of the Citibank Credit Facility and the BNYM Credit Facility. Interest is charged to the fund based on rates determined pursuant to the terms of the respective Facility at the time of borrowing. During the period ended December 31, 2018, the fund did not borrow under the Facilities.
35
NOTES TO FINANCIAL STATEMENTS(continued)
NOTE 3—Investment Advisory Fee and Other Transactions with Affiliates:
(a)Pursuant to an investment advisory agreement with Dreyfus, the investment advisory fee is computed at the annual rate of .65% of the value of the fund’s average daily net assets and is payable monthly.
(b)Under the Distribution Plan adopted pursuant to Rule 12b-1 under the Act, Service shares pay the Distributor for distributing its shares, for servicing and/or maintaining Service shares’ shareholder accounts and for advertising and marketing for Service shares. The Distribution Plan provides for payments to be made at an annual rate of .25% of the value of the Service shares’ average daily net assets. The Distributor may make payments to Participating Insurance Companies and to brokers and dealers acting as principal underwriter for their variable insurance products. The fees payable under the Distribution Plan are payable without regard to actual expenses incurred. During the period ended December 31, 2018,Service shares were charged $7,950 pursuant to the Distribution Plan.
The fund has arrangements with the transfer agent and the custodian whereby the fund may receive earnings credits when positive cash balances are maintained, which are used to offset transfer agency and custody fees. For financial reporting purposes, the fund includes net earnings credits, if any, as an expense offset in the Statement of Operations.
The fund compensates Dreyfus Transfer, Inc., a wholly-owned subsidiary of Dreyfus, under a transfer agency agreement for providing transfer agency and cash management services for the fund. The majority of transfer agency fees are comprised of amounts paid on a per account basis, while cash management fees are related to fund subscriptions and redemptions. During the period ended December 31, 2018, the fund was charged $465 for transfer agency services. These fees are included in Shareholder servicing costs in the Statement of Operations.
The fund compensates The Bank of New York Mellon under a custody agreement for providing custodial services for the fund. These fees are determined based on net assets, geographic region and transaction activity. During the period ended December 31, 2018, the fund was charged $7,091 pursuant to the custody agreement. These fees were partially offset by earnings credits of $75.
During the period ended December 31, 2018, the fund was charged $12,774 for services performed by the Chief Compliance Officer and his staff. These fees are included in Miscellaneous in the Statement of Operations.
36
The components of “Due to The Dreyfus Corporation and affiliates” in the Statement of Assets and Liabilities consist of: investment advisory fees $19,535, Distribution Plan fees $630, custodian fees $4,208, Chief Compliance Officer fees $6,289 and transfer agency fees $61.
(c) Each Board member also serves as a Board member of other funds within the Dreyfus complex. Annual retainer fees and attendance fees are allocated to each fund based on net assets.
NOTE 4—Securities Transactions:
The aggregate amount of purchases and sales (including paydowns) of investment securities, excluding short-term securities, forward contracts, futures, options transactions and swap agreements, during the period ended December 31, 2018, amounted to $40,502,820 and $46,040,176, respectively, of which $4,019,517 in purchases and $4,525,924 in sales were from mortgage dollar roll transactions.
Mortgage Dollar Rolls:A mortgage dollar roll transaction involves a sale by the fund of mortgage related securities that it holds with an agreement by the fund to repurchase similar securities at an agreed upon price and date. The securities purchased will bear the same interest rate as those sold, but generally will be collateralized by pools of mortgages with different prepayment histories than those securities sold. The fund accounts for mortgage dollar rolls as purchases and sales transactions. The fund executes mortgage dollar rolls entirely in the To-Be-Announced (“TBA”) market.
Derivatives: A derivative is a financial instrument whose performance is derived from the performance of another asset. The fund enters into International Swaps and Derivatives Association, Inc. Master Agreements or similar agreements (collectively, “Master Agreements”) with its OTC derivative contract counterparties in order to, among other things, reduce its credit risk to counterparties. Master Agreements include provisions for general obligations, representations, collateral and events of default or termination. Under a Master Agreement, the fund may offset with the counterparty certain derivative financial instrument’s payables and/or receivables with collateral held and/or posted and create one single net payment in the event of default or termination.
Each type of derivative instrument that was held by the fund during the period ended December 31, 2018 is discussed below.
Futures:In the normal course of pursuing its investment objective, the fund is exposed to market risk, including interest rate risk,as a result of changes in value of underlying financial instruments. The fund invests in
37
NOTES TO FINANCIAL STATEMENTS(continued)
futures in order to manage its exposure to or protect against changes in the market. A futures contract represents a commitment for the future purchase or a sale of an asset at a specified date. Upon entering into such contracts, these investments require initial margin deposits with a counterparty, which consist of cash or cash equivalents. The amount of these deposits is determined by the exchange or Board of Trade on which the contract is traded and is subject to change. Accordingly, variation margin payments are received or made to reflect daily unrealized gains or losses which are recorded in the Statement of Operations. When the contracts are closed, the fund recognizes a realized gain or loss which is reflected in the Statement of Operations. There is minimal counterparty credit risk to the fund with futures since they are exchange traded, and the exchange guarantees the futures against default. Futures open at December 31, 2018 are set forth in the Statement of Futures.
Options Transactions: The fund purchases and writes (sells) put and call options to hedge against changes in the values of interest rate and foreign currencies or as a substitute for an investment. The fund is subject to market risk, interest rate risk and currency risk in the course of pursuing its investment objectives through its investments in options contracts. A call option gives the purchaser of the option the right (but not the obligation) to buy, and obligates the writer to sell, the underlying financial instrument at the exercise price at any time during the option period, or at a specified date. Conversely, a put option gives the purchaser of the option the right (but not the obligation) to sell, and obligates the writer to buy the underlying financial instrument at the exercise price at any time during the option period, or at a specified date.
As a writer of call options, the fund receives a premium at the outset and then bears the market risk of unfavorable changes in the price of the financial instrument underlying the option. Generally, the fund realizes a gain, to the extent of the premium, if the price of the underlying financial instrument decreases between the date the option is written and the date on which the option is terminated. Generally, the fund incurs a loss if the price of the financial instrument increases between those dates.The maximum payout for those contracts is limited to the number of call option contracts written and the related strike prices, respectively.
As a writer of put options, the fund receives a premium at the outset and then bears the market risk of unfavorable changes in the price of the financial instrument underlying the option. Generally, the fund realizes a gain, to the extent of the premium, if the price of the underlying financial instrument increases between the date the option is written and the date on which the option is terminated. Generally, the fund incurs a loss if the
38
price of the financial instrument decreases between those dates. The maximum payout for those contracts is limited to the number of put option contracts written and the related strike prices, respectively.
As a writer of an option, the fund has no control over whether the underlying financial instrument may be sold (call) or purchased (put) and as a result bears the market risk of an unfavorable change in the price of the financial instrument underlying the written option. There is a risk of loss from a change in value of such options which may exceed the related premiums received. This risk is mitigated by Master Agreements between the fund and the counterparty and the posting of collateral, if any, by the counterparty to the fund to cover the fund’s exposure to the counterparty. The Statement of Operations reflects any unrealized gains or losses which occurred during the period as well as any realized gains or losses which occurred upon the expiration or closing of the option transaction.Options written open at December 31, 2018 are set forth in the Statement of Options Written.
Forward Foreign Currency Exchange Contracts: The fund enters into forward contracts in order to hedge its exposure to changes in foreign currency exchange rates on its foreign portfolio holdings, to settle foreign currency transactions or as a part of its investment strategy. When executing forward contracts, the fund is obligated to buy or sell a foreign currency at a specified rate on a certain date in the future. With respect to sales of forward contracts, the fund incurs a loss if the value of the contract increases between the date the forward contract is opened and the date the forward contract is closed. The fund realizes a gain if the value of the contract decreases between those dates. With respect to purchases of forward contracts, the fund incurs a loss if the value of the contract decreases between the date the forward contract is opened and the date the forward contract is closed. The fund realizes a gain if the value of the contract increases between those dates. Any realized or unrealized gains or losses which occurred during the period are reflected in the Statement of Operations. The fund is exposed to foreign currency risk as a result of changes in value of underlying financial instruments. The fund is also exposed to credit risk associated with counterparty nonperformance on these forward contracts, which is generally limited to the unrealized gain on each open contract. This risk may be mitigated by Master Agreements, if any, between the fund and the counterparty and the posting of collateral, if any, by the counterparty to the fund to cover the fund’s exposure to the counterparty. Forward contracts open at December 31, 2018 are set forth in the Statement of Forward Foreign Currency Exchange Contracts.
39
NOTES TO FINANCIAL STATEMENTS(continued)
Swap Agreements:The fund enters into swap agreements to exchange the interest rate on, or return generated by, one nominal instrument for the return generated by another nominal instrument. Swap agreements are privately negotiated in the OTC market or centrally cleared. The fund enters into these agreements to hedge certain market or interest rate risks, to manage the interest rate sensitivity (sometimes called duration) of fixed income securities, to provide a substitute for purchasing or selling particular securities or to increase potential returns.
For OTC swaps, the fund accrues for interim payments on a daily basis, with the net amount recorded within unrealized appreciation (depreciation) on swap agreements in the Statement of Assets and Liabilities. Once the interim payments are settled in cash, the net amount is recorded as a realized gain (loss) on swaps, in addition to realized gain (loss) recorded upon the termination of swap agreements in the Statement of Operations. Upfront payments made and/or received by the fund, are recorded as an asset and/or liability in the Statement of Assets and Liabilities and are recorded as a realized gain or loss ratably over the agreement’s term/event with the exception of forward starting interest rate swaps which are recorded as realized gains or losses on the termination date.
Upon entering into centrally cleared swap agreements, an initial margin deposit is required with a counterparty, which consists of cash or cash equivalents. The amount of these deposits is determined by the exchange on which the agreement is traded and is subject to change. The change in valuation of centrally cleared swaps is recorded as a receivable or payable for variation margin in the Statement of Assets and Liabilities. Payments received from (paid to) the counterparty, including upon termination, are recorded as realized gain (loss) in the Statement of Operations.
Fluctuations in the value of swap agreements are recorded for financial statement purposes as unrealized appreciation or depreciation on swap agreements.
Interest Rate Swaps: Interest rate swaps involve the exchange of commitments to pay and receive interest based on a notional principal amount. The fund may elect to pay a fixed rate and receive a floating rate, or receive a fixed rate and pay a floating rate on a notional principal amount. The net interest received or paid on interest rate swap agreements is included within realized gain (loss) on swap agreements in the Statement of Operations. Interest rate swap agreements are subject to general market risk, liquidity risk, counterparty risk and interest rate risk. At December 31, 2018, there were no outstanding interest rate swaps.
40
The following tables show the fund’s exposure to different types of market risk as it relates to the Statement of Assets and Liabilities and the Statement of Operations, respectively.
Fair value of derivative instruments as of December 31, 2018 is shown below:
| | | | | | | | |
| | Derivative
Assets ($) | | | | Derivative
Liabilities ($) | |
Interest rate risk | 50,999 | 1 | Interest rate risk | (30,985) | 1 |
Foreign exchange risk | 30,729 | 2,3 | Foreign exchange risk | (71,695) | 3,4 |
Gross fair value of
derivative contracts | 81,728 | | | | (102,680) | |
| | | | | | | |
Statement of Assets and Liabilities location: | |
1Includes cumulative appreciation (depreciation) on futures as reported in the Statement of Futures, but only the
unpaid variation margin is reported in the Statement of Assets and Liabilities. |
2Options purchased are included in Investments in securities—Unaffiliated issuers, at value. |
3Unrealized appreciation (depreciation) on forward foreign currency exchange contracts. |
4Outstanding options written, at value. | |
The effect of derivative instruments in the Statement of Operations during the period ended December 31, 2018 is shown below:
| | | | | | | | | | | |
Amount of realized gain (loss) on derivatives recognized in income ($) | |
Underlying
risk | Futures | 1 | Options
Transactions | 2 | Forward
Contracts | 3 | Swap
Agreements | 4 | Total | |
Interest
rate | (104,927) | | (12,801) | | - | | 64,112 | | (53,616) | |
Foreign
exchange | - | | (48,109) | | 109,033 | | - | | 60,924 | |
Total | (104,927) | | (60,910) | | 109,033 | | 64,112 | | 7,308 | |
| | | | | | | | | | | |
41
NOTES TO FINANCIAL STATEMENTS(continued)
| | | | | | | | | | | | |
Change in unrealized appreciation (depreciation)
on derivatives recognized in income ($) | |
Underlying
risk | Futures | 5 | Options
Transactions | 6 | Forward
Contracts | 7 | Swap
Agreements | 8 | Total | |
Interest
rate | 18,718 | | 8,021 | | - | | (14,329) | | 12,410 | |
Foreign
exchange | - | | (15,644) | | (38,087) | | - | | (53,731) | |
Total | 18,718 | | (7,623) | | (38,087) | | (14,329) | | (41,321) | |
| | | | | | | | | | | | |
Statement of Operations location: | |
1Net realized gain (loss) on futures. | | |
2Net realized gain (loss) on options transactions. |
3Net realized gain (loss) on forward foreign currency exchange contracts. | | |
4Net realized gain (loss) on swap agreements. | | |
5Net unrealized appreciation (depreciation) on futures. | | |
6Net unrealized appreciation (depreciation) on options transactions. | | |
7Net unrealized appreciation (depreciation) on forward foreign currency exchange contracts. | |
8Net unrealized appreciation (depreciation) on swap agreements. | |
The provisions of ASC Topic 210 “Disclosures about Offsetting Assets and Liabilities” require disclosure on the offsetting of financial assets and liabilities. These disclosures are required for certain investments, including derivative financial instruments subject to Master Agreements which are eligible for offsetting in the Statement of Assets and Liabilities and require the fund to disclose both gross and net information with respect to such investments. For financial reporting purposes, the fund does not offset derivative assets and derivative liabilities that are subject to Master Agreements in the Statement of Assets and Liabilities.
At December 31, 2018, derivative assets and liabilities (by type) on a gross basis are as follows:
| | | | | | |
Derivative Financial Instruments: | | Assets ($) | | Liabilities ($) | |
Futures | | 50,999 | | (30,985) | |
Options | | 12,275 | | (2,311) | |
Forward contracts | | 18,454 | | (69,384) | |
Total gross amount of derivative | | | | | |
assets and liabilities in the | | | | | |
Statement of Assets and Liabilities | | 81,728 | | (102,680) | |
Derivatives not subject to | | | | | |
Master Agreements | | (50,999) | | 30,985 | |
Total gross amount of assets | | | | | |
and liabilities subject to | | | | | |
Master Agreements | | 30,729 | | (71,695) | |
42
The following tables present derivative assets and liabilities net of amounts available for offsetting under Master Agreements and net of related collateral received or pledged, if any, as of December 31, 2018:†
| | | | | | | |
| | | | Financial | | | |
| | | | Instruments | | | |
| | | | and Derivatives | | | |
| | Gross Amount of | | Available | Collateral | | Net Amount of |
Counterparty | Assets ($) | 1 | for Offset ($) | Received ($) | | Assets ($) |
Barclays Capital | 7,880 | | (7,880) | - | | - |
Citigroup | 8,762 | | (8,762) | - | | - |
Goldman Sachs
International | 617 | | (617) | - | | - |
HSBC | 4,420 | | - | - | | 4,420 |
J.P. Morgan Securities | 4,990 | | (4,990) | - | | - |
UBS Securities | 4,060 | | - | - | | 4,060 |
Total | 30,729 | | (22,249) | - | | 8,480 |
| | | | | | | |
| | | | Financial | | | |
| | | | Instruments | | | |
| | | | and Derivatives | | | |
| | Gross Amount of | | Available | Collateral | | Net Amount of |
Counterparty | Liabilities ($) | 1 | for Offset ($) | Pledged ($) | | Liabilities ($) |
Barclays Capital | (42,108) | | 7,880 | - | | (34,228) |
Citigroup | (17,528) | | 8,762 | - | | (8,766) |
Goldman Sachs
International | (802) | | 617 | - | | (185) |
J.P. Morgan Securities | (11,257) | | 4,990 | - | | (6,267) |
Total | (71,695) | | 22,249 | - | | (49,446) |
| | | | | | | |
1Absent a default event or early termination, OTC derivative assets and liabilities are presented at gross amounts and are not offset in the Statement of Assets and Liabilities. |
†See Statement of Investments for detailed information regarding collateral held for open exchange traded derivative contracts. |
The following summarizes the average market value of derivatives outstanding duringthe period ended December 31, 2018:
| | | |
| | Average Market Value ($) |
Interest rate futures | | 12,339,513 |
Interest rate options contracts | | 400 |
Foreign currency options contracts | | 15,475 |
Forward contracts | | 8,655,780 |
| | | |
The following summarizes the average notional value of swap agreements outstanding during the period ended December 31, 2018:
43
NOTES TO FINANCIAL STATEMENTS(continued)
| | | |
| | Average Notional Value ($) |
Interest rate swap agreements | | 4,916,744 |
| | | |
At December 31, 2018, the cost of investments for federal income tax purposes was $36,492,950; accordingly, accumulated net unrealized depreciation on investments inclusive of derivative contracts was $654,330, consisting of $461,047 gross unrealized appreciation and $1,115,377 gross unrealized depreciation.
44
REPORT OF INDEPENDENT REGISTERED PUBLIC ACCOUNTING FIRM
To the Shareholders and the Board of Trustees of Quality Bond Portfolio
Opinion on the Financial Statements
We have audited the accompanying statement of assets and liabilities of Quality Bond Portfolio (the “Fund”) (one of the funds constituting Dreyfus Variable Investment Fund), including the statements of investments, investments in affiliated issuers, futures, options written and forward foreign currency exchange contracts, as of December 31, 2018, and the related statement of operations for the year then ended, the statements of changes in net assets for each of the two years in the period then ended, the financial highlights for each of the five years in the period then ended and the related notes (collectively referred to as the “financial statements”). In our opinion, the financial statements present fairly, in all material respects, the financial position of the Fund (one of the funds constituting Dreyfus Variable Investment Fund) at December 31, 2018, the results of its operations for the year then ended, the changes in its net assets for each of the two years in the period then ended and its financial highlights for each of the five years in the period then ended, in conformity with U.S. generally accepted accounting principles.
Basis for Opinion
These financial statements are the responsibility of the Fund’s management. Our responsibility is to express an opinion on the Fund’s financial statements based on our audits. We are a public accounting firm registered with the Public Company Accounting Oversight Board (United States) (“PCAOB”) and are required to be independent with respect to the Fund in accordance with the U.S. federal securities laws and the applicable rules and regulations of the Securities and Exchange Commission and the PCAOB.
We conducted our audits in accordance with the standards of the PCAOB. Those standards require that we plan and perform the audit to obtain reasonable assurance about whether the financial statements are free of material misstatement, whether due to error or fraud. The Fund is not required to have, nor were we engaged to perform, an audit of the Fund’s internal control over financial reporting. As part of our audits, we are required to obtain an understanding of internal control over financial reporting, but not for the purpose of expressing an opinion on the effectiveness of the Fund’s internal control over financial reporting. Accordingly, we express no such opinion.
Our audits included performing procedures to assess the risks of material misstatement of the financial statements, whether due to error or fraud, and performing procedures that respond to those risks. Such procedures included examining, on a test basis, evidence regarding the amounts and disclosures in the financial statements. Our procedures included confirmation of securities owned as of December 31, 2018, by correspondence with the custodian and others or by other appropriate auditing procedures where replies from others were not received. Our audits also included evaluating the accounting principles used and significant estimates made by management, as well as evaluating the overall presentation of the financial statements. We believe that our audits provide a reasonable basis for our opinion.

We have served as the auditor of one or more Dreyfus investment companies since at least 1957, but we are unable to determine the specific year.
New York, New York
February 11, 2019
45
BOARD MEMBERS INFORMATION(Unaudited)
INDEPENDENT BOARD MEMBERS
Joseph S. DiMartino (75)
Chairman of the Board (1995)
Principal Occupation During Past 5 Years:
· Corporate Director and Trustee (1995-present)
Other Public Company Board Memberships During Past 5 Years:
· CBIZ (formerly, Century Business Services, Inc.), a provider of outsourcing functions for small and medium size companies, Director (1997-present)
No. of Portfolios for which Board Member Serves:122
———————
Peggy C. Davis (75)
Board Member (2006)
Principal Occupation During Past 5 Years:
· Shad Professor of Law, New York University School of Law (1983-present)
No. of Portfolios for which Board Member Serves: 45
———————
David P. Feldman (79)
Board Member (1994)
Principal Occupation During Past 5 Years:
· Corporate Director and Trustee (1985-present)
Other Public Company Board Memberships During Past 5 Years:
· BBH Mutual Funds Group (5 registered mutual funds), Director (1992-2014)
No. of Portfolios for which Board Member Serves:31
———————
Joan Gulley (71)
Board Member (2017)
Principal Occupation During Past 5 Years:
· PNC Financial Services Group, Inc.(1993-2014), Executive Vice President and Chief Human Resources Officer and Executive Committee Member (2008-2014)
No. of Portfolios for which Board Member Serves:52
———————
46
Ehud Houminer (78)
Board Member (2006)
Principal Occupation During Past 5 Years:
· Board of Overseers at the Columbia Business School, Columbia University (1992-present)
· Trustee, Ben Gurion University
No. of Portfolios for which Board Member Serves: 52
———————
Lynn Martin (79)
Board Member (2012)
Principal Occupation During Past 5 Years:
· President of The Martin Hall Group LLC, a human resources consulting firm (2005-2012)
No. of Portfolios for which Board Member Serves:31
———————
Robin A. Melvin (55)
Board Member (2012)
Principal Occupation During Past 5 Years:
· Co-chairman, Illinois Mentoring Partnership, non-profit organization dedicated to increasing the quantity and quality of mentoring services in Illinois; (2014-present; board member since 2013)
No. of Portfolios for which Board Member Serves:99
———————
Dr. Martin Peretz (79)
Board Member (1990)
Principal Occupation During Past 5 Years:
· Editor-in-Chief Emeritus of The New Republic Magazine (2011-2012) (previously,
Editor-in-Chief, 1974-2011)
· Lecturer at Harvard University (1968-2010)
No. of Portfolios for which Board Member Serves:31
———————
Once elected all Board Members serve for an indefinite term, but achieve Emeritus status upon reaching age 80. The address of the Board Members and Officers is c/o The Dreyfus Corporation, 200 Park Avenue, New York, New York 10166. Additional information about the Board Members is available in the fund’s Statement of Additional Information which can be obtained from Dreyfus free of charge by calling this toll free number: 1-800-DREYFUS.
James F. Henry, Emeritus Board Member
Philip L. Toia, Emeritus Board Member
47
OFFICERS OF THE FUND(Unaudited)
BRADLEY J. SKAPYAK, President since January 2010.
Chief Operating Officer and a director of the Manager since June 2009, Chairman of Dreyfus Transfer, Inc., an affiliate of the Manager and the transfer agent of the funds, since May 2011 and Chief Executive Officer of MBSC Securities Corporation since August 2016. He is an officer of 62 investment companies (comprised of 122 portfolios) managed by the Manager. He is 60 years old and has been an employee of the Manager since February 1988.
BENNETT A. MACDOUGALL, Chief Legal Officer since October 2015.
Chief Legal Officer of the Manager and Associate General Counsel and Managing Director of BNY Mellon since June 2015; from June 2005 to June 2015, he served in various capacities with Deutsche Bank – Asset & Wealth Management Division, including as Director and Associate General Counsel, and Chief Legal Officer of Deutsche Investment Management Americas Inc. from June 2012 to May 2015. He is an officer of 63 investment companies (comprised of 147 portfolios) managed by the Manager. He is 47 years old and has been an employee of the Manager since June 2015.
JAMES BITETTO, Vice President since August 2005 and Secretary since February 2018.
Managing Counsel of BNY Mellon and Secretary of the Manager, and an officer of 63 investment companies (comprised of 147 portfolios) managed by the Manager. He is 52 years old and has been an employee of the Manager since December 1996.
SONALEE CROSS, Vice President and Assistant Secretary since March 2018.
Counsel of BNY Mellon since October 2016; Associate at Proskauer Rose LLP from April 2016 to September 2016; Attorney at EnTrust Capital from August 2015 to February 2016; Associate at Sidley Austin LLP from September 2013 until August 2015. She is an officer of 63 investment companies (comprised of 147 portfolios) managed by Dreyfus. She is 31 years old and has been an employee of the Manager since October 2016.
SARAH S. KELLEHER, Vice President and Assistant Secretary since April 2014.
Managing Counsel of BNY Mellon since December 2017, from March 2013 to December 2017, Senior Counsel of BNY Mellon. She is an officer of 63 investment companies (comprised of 147 portfolios) managed by the Manager. She is 43 years old and has been an employee of the Manager since March 2013.
JEFF PRUSNOFSKY, Vice President and Assistant Secretary since August 2005.
Senior Managing Counsel of BNY Mellon, and an officer of 63 investment companies (comprised of 147 portfolios) managed by the Manager. He is 53 years old and has been an employee of the Manager since October 1990.
NATALYA ZELENSKY, Vice President and Assistant Secretary since March 2017.
Counsel of BNY Mellon since May 2016; Attorney at Wildermuth Endowment Strategy Fund/Wildermuth Advisory, LLC from November 2015 until May 2016; Assistant General Counsel at RCS Advisory Services from July 2014 until November 2015; Associate at Sutherland, Asbill & Brennan from January 2013 until January 2014. She is an officer of 63 investment companies (comprised of 147 portfolios) managed by Dreyfus. She is 33 years old and has been an employee of the Manager since May 2016.
JAMES WINDELS, Treasurer since November 2001.
Director – Mutual Fund Accounting of the Manager, and an officer of 63 investment companies (comprised of 147 portfolios) managed by the Manager. He is 60 years old and has been an employee of the Manager since April 1985.
GAVIN C. REILLY, Assistant Treasurer since December 2005.
Tax Manager of the Investment Accounting and Support Department of the Manager, and an officer of 63 investment companies (comprised of 147 portfolios) managed by the Manager. He is 50 years old and has been an employee of the Manager since April 1991.
ROBERT S. ROBOL, Assistant Treasurer since August 2005.
Senior Accounting Manager – Dreyfus Financial Reporting of the Manager, and an officer of 63 investment companies (comprised of 147 portfolios) managed by the Manager. He is 54 years old and has been an employee of the Manager since October 1988.
48
ROBERT SALVIOLO, Assistant Treasurer since July 2007.
Senior Accounting Manager – Equity Funds of the Manager, and an officer of 63 investment companies (comprised of 147 portfolios) managed by the Manager. He is 51 years old and has been an employee of the Manager since June 1989.
ROBERT SVAGNA, Assistant Treasurer since December 2002.
Senior Accounting Manager – Fixed Income and Equity Funds of the Manager, and an officer of 63 investment companies (comprised of 147 portfolios) managed by the Manager. He is 51 years old and has been an employee of the Manager since November 1990.
JOSEPH W. CONNOLLY, Chief Compliance Officer since October 2004.
Chief Compliance Officer of the Manager, the Dreyfus Family of Funds and BNY Mellon Funds Trust (63 investment companies, comprised of 147 portfolios). He is 61 years old and has served in various capacities with the Manager since 1980, including manager of the firm’s Fund Accounting Department from 1997 through October 2001.
CARIDAD M. CAROSELLA, Anti-Money Laundering Compliance Officer since January 2016.
Anti-Money Laundering Compliance Officer of the Dreyfus Family of Funds and BNY Mellon Funds Trust since January 2016; from May 2015 to December 2015, Interim Anti-Money Laundering Compliance Officer of the Dreyfus Family of Funds and BNY Mellon Funds Trust and the Distributor; from January 2012 to May 2015, AML Surveillance Officer of the Distributor and from 2007 to December 2011, Financial Processing Manager of the Distributor. She is an officer of 57 investment companies (comprised of 141 portfolios) managed by the Manager. She is 50 years old and has been an employee of the Distributor since 1997.
49
Dreyfus Variable Investment Fund, Quality Bond Portfolio
200 Park Avenue
New York, NY 10166
Investment Adviser
The Dreyfus Corporation
200 Park Avenue
New York, NY 10166
Custodian
The Bank of New York Mellon
240 Greenwich Street
New York, NY 10286
Transfer Agent &
Dividend Disbursing Agent
Dreyfus Transfer, Inc.
200 Park Avenue
New York, NY 10166
Distributor
MBSC Securities Corporation
200 Park Avenue
New York, NY 10166
Telephone 1-800-258-4260 or 1-800-258-4261
Mail The Dreyfus Family of Funds, 144 Glenn Curtiss Boulevard, Uniondale, NY 11556-0144 Attn: Institutional Services Department
E-mailSend your request toinfo@dreyfus.com
InternetInformation can be viewed online or downloaded atwww.dreyfus.com
The fund files its complete schedule of portfolio holdings with the Securities and Exchange Commission (“SEC”) for the first and third quarters of each fiscal year on Form N-Q. The fund’s Forms N-Q are available on the SEC’s website at http://www.sec.gov and may be reviewed and copied at the SEC’s Public Reference Room in Washington, D.C. Information on the operation of the Public Reference Room may be obtained by calling 1-800-SEC-0330.
A description of the policies and procedures that the fund uses to determine how to vote proxies relating to portfolio securities, and information regarding how the fund voted these proxies for the most recent 12-month period ended June 30 is available at http://www.dreyfus.com and on the SEC’s website at http://www.sec.gov. The description of the policies and procedures is also available without charge, upon request, by calling 1-800-DREYFUS.
| | |
© 2019 MBSC Securities Corporation
0120AR1218 | 
|
Item 2. Code of Ethics.
The Registrant has adopted a code of ethics that applies to the Registrant's principal executive officer, principal financial officer, principal accounting officer or controller, or persons performing similar functions. There have been no amendments to, or waivers in connection with, the Code of Ethics during the period covered by this Report.
Item 3. Audit Committee Financial Expert.
The Registrant's Board has determined that David P. Feldman, a member of the Audit Committee of the Board, is an audit committee financial expert as defined by the Securities and Exchange Commission (the "SEC"). Mr. Feldman is "independent" as defined by the SEC for purposes of audit committee financial expert determinations.
Item 4. Principal Accountant Fees and Services.
(a) Audit Fees. The aggregate fees billed for each of the last two fiscal years (the "Reporting Periods") for professional services rendered by the Registrant's principal accountant (the "Auditor") for the audit of the Registrant's annual financial statements or services that are normally provided by the Auditor in connection with the statutory and regulatory filings or engagements for the Reporting Periods, were $274,008 in 2017 and $278,115 in 2018.
(b) Audit-Related Fees. The aggregate fees billed in the Reporting Periods for assurance and related services by the Auditor that are reasonably related to the performance of the audit of the Registrant's financial statements and are not reported under paragraph (a) of this Item 4 were $99,156 in 2017 and $89,579 in 2018. These services consisted of one or more of the following: (i) agreed upon procedures related to compliance with Internal Revenue Code section 817(h), (ii) security counts required by Rule 17f-2 under the Investment Company Act of 1940, as amended, (iii) advisory services as to the accounting or disclosure treatment of Registrant transactions or events and (iv) advisory services to the accounting or disclosure treatment of the actual or potential impact to the Registrant of final or proposed rules, standards or interpretations by the Securities and Exchange Commission, the Financial Accounting Standards Boards or other regulatory or standard-setting bodies.
The aggregate fees billed in the Reporting Periods for non-audit assurance and related services by the Auditor to the Registrant's investment adviser (not including any sub-investment adviser whose role is primarily portfolio management and is subcontracted with or overseen by another investment adviser), and any entity controlling, controlled by or under common control with the investment adviser that provides ongoing services to the Registrant ("Service Affiliates"), that were reasonably related to the performance of the annual audit of the Service Affiliate, which required pre-approval by the Audit Committee were $0 in 2017 and $0 in 2018.
(c) Tax Fees. The aggregate fees billed in the Reporting Periods for professional services rendered by the Auditor for tax compliance, tax advice, and tax planning ("Tax Services") were $24,500 in 2017 and $34,833 in 2018. These services consisted of: (i) review or preparation of U.S. federal, state, local and excise tax returns; (ii) U.S. federal, state and local tax planning, advice and assistance regarding statutory, regulatory or administrative developments; (iii) tax advice regarding tax qualification matters and/or treatment of various financial instruments held or proposed to be acquired or held, and (iv) determination of Passive Foreign Investment Companies. The aggregate fees billed in the Reporting Periods for Tax Services by the Auditor to Service Affiliates, which required pre-approval by the Audit Committee were $0 in 2017 and $0 in 2018.
(d) All Other Fees. The aggregate fees billed in the Reporting Periods for products and services provided by the Auditor, other than the services reported in paragraphs (a) through (c) of this Item, were $86 in 2017 and $93 in 2018. These services consisted of a review of the Registrant's anti-money laundering program.
The aggregate fees billed in the Reporting Periods for Non-Audit Services by the Auditor to Service Affiliates, other than the services reported in paragraphs (b) through (c) of this Item, which required pre-approval by the Audit Committee, were $0 in 2017 and $0 in 2018.
(e)(1) Audit Committee Pre-Approval Policies and Procedures. The Registrant's Audit Committee has established policies and procedures (the "Policy") for pre-approval (within specified fee limits) of the Auditor's engagements for non-audit services to the Registrant and Service Affiliates without specific case-by-case consideration. The pre-approved services in the Policy can include pre-approved audit services, pre-approved audit-related services, pre-approved tax services and pre-approved all other services. Pre-approval considerations include whether the proposed services are compatible with maintaining the Auditor's independence. Pre-approvals pursuant to the Policy are considered annually.
(e)(2) Note. None of the services described in paragraphs (b) through (d) of this Item 4 were approved by the Audit Committee pursuant to paragraph (c)(7)(i)(C) of Rule 2-01 of Regulation S-X.
(f) None of the hours expended on the principal accountant's engagement to audit the registrant's financial statements for the most recent fiscal year were attributed to work performed by persons other than the principal account's full-time, permanent employees.
Non-Audit Fees. The aggregate non-audit fees billed by the Auditor for services rendered to the Registrant, and rendered to Service Affiliates, for the Reporting Periods were $31,379,272 in 2017 and $53,294,289 in 2018.
Auditor Independence. The Registrant's Audit Committee has considered whether the provision of non-audit services that were rendered to Service Affiliates, which were not pre-approved (not requiring pre-approval), is compatible with maintaining the Auditor's independence.
Item 5. Audit Committee of Listed Registrants.
Not applicable.
Item 6. Investments.
(a) Not applicable.
Item 7. Disclosure of Proxy Voting Policies and Procedures for Closed-End Management Investment Companies.
Not applicable.
Item 8. Portfolio Managers of Closed-End Management Investment Companies.
Not applicable.
Item 9. Purchases of Equity Securities by Closed-End Management Investment Companies and Affiliated Purchasers.
Not applicable.
Item 10. Submission of Matters to a Vote of Security Holders.
There have been no material changes to the procedures applicable to Item 10.
Item 11. Controls and Procedures.
(a) The Registrant's principal executive and principal financial officers have concluded, based on their evaluation of the Registrant's disclosure controls and procedures as of a date within 90 days of the filing date of this report, that the Registrant's disclosure controls and procedures are reasonably designed to ensure that information required to be disclosed by the Registrant on Form N-CSR is recorded, processed, summarized and reported within the required time periods and that information required to be disclosed by the Registrant in the reports that it files or submits on Form N-CSR is accumulated and communicated to the Registrant's management, including its principal executive and principal financial officers, as appropriate to allow timely decisions regarding required disclosure.
(b) There were no changes to the Registrant's internal control over financial reporting that occurred during the second fiscal quarter of the period covered by this report that have materially affected, or are reasonably likely to materially affect, the Registrant's internal control over financial reporting.
Item 12. Disclosure of Securities Lending Activities for Closed-End Management Investment Companies.
Not applicable.
Item 13. Exhibits.
(a)(1) Code of ethics referred to in Item 2.
(a)(2) Certifications of principal executive and principal financial officers as required by Rule 30a-2(a) under the Investment Company Act of 1940.
(a)(3) Not applicable.
(b) Certification of principal executive and principal financial officers as required by Rule 30a-2(b) under the Investment Company Act of 1940.
SIGNATURES
Pursuant to the requirements of the Securities Exchange Act of 1934 and the Investment Company Act of 1940, the Registrant has duly caused this Report to be signed on its behalf by the undersigned, thereunto duly authorized.
Dreyfus Variable Investment Fund
By: /s/ Bradley J. Skapyak
Bradley J. Skapyak
President
Date: February 8, 2019
Pursuant to the requirements of the Securities Exchange Act of 1934 and the Investment Company Act of 1940, this Report has been signed below by the following persons on behalf of the Registrant and in the capacities and on the dates indicated.
By: /s/ Bradley J. Skapyak
Bradley J. Skapyak
President
Date: February 8, 2019
By: /s/ James Windels
James Windels
Treasurer
Date: February 8, 2019
EXHIBIT INDEX
(a)(1) Code of ethics referred to in Item 2.
(a)(2) Certifications of principal executive and principal financial officers as required by Rule 30a-2(a) under the Investment Company Act of 1940. (EX-99.CERT)
(b) Certification of principal executive and principal financial officers as required by Rule 30a-2(b) under the Investment Company Act of 1940. (EX-99.906CERT)


