UNITED STATES
SECURITIES AND EXCHANGE COMMISSION
Washington, D.C. 20549
FORM N-CSR
CERTIFIED SHAREHOLDER REPORT OF REGISTERED MANAGEMENT
INVESTMENT COMPANIES
| Investment Company Act file number | 811-05125 |
| | |
| | BNY Mellon Variable Investment Fund | |
| | (Exact name of Registrant as specified in charter) | |
| | | |
| | c/o BNY Mellon Investment Adviser, Inc. 240 Greenwich Street New York, New York 10286 | |
| | (Address of principal executive offices) (Zip code) | |
| | | |
| | Deirdre Cunnane, Esq. 240 Greenwich Street New York, New York 10286 | |
| | (Name and address of agent for service) | |
| |
| Registrant's telephone number, including area code: | (212) 922-6400 |
| | |
Date of fiscal year end: | 12/31 | |
| Date of reporting period: | 12/31/2021 | |
| | | | | | | |
FORM N-CSR
Item 1. Reports to Stockholders.
BNY Mellon Variable Investment Fund, Appreciation Portfolio
| |
ANNUAL REPORT December 31, 2021 |

| |
Save time. Save paper. View your next shareholder report online as soon as it’s available. Log into www.im.bnymellon.com and sign up for eCommunications. It’s simple and only takes a few minutes. |
| |
The views expressed in this report reflect those of the portfolio manager(s) only through the end of the period covered and do not necessarily represent the views of BNY Mellon Investment Adviser, Inc. or any other person in the BNY Mellon Investment Adviser, Inc. organization. Any such views are subject to change at any time based upon market or other conditions and BNY Mellon Investment Adviser, Inc. disclaims any responsibility to update such views. These views may not be relied on as investment advice and, because investment decisions for a fund in the BNY Mellon Family of Funds are based on numerous factors, may not be relied on as an indication of trading intent on behalf of any fund in the BNY Mellon Family of Funds. |
| |
Not FDIC-Insured • Not Bank-Guaranteed • May Lose Value |
Contents
T H E F U N D
F O R M O R E I N F O R M AT I O N
Back Cover
DISCUSSION OF FUND PERFORMANCE (Unaudited)
For the period from January 1, 2021 through December 31, 2021, as provided by portfolio managers Alan Christensen, Catherine Crain, Gentry Lee, Christopher Sarofim, Charles Sheedy and Fayez Sarofim of Fayez Sarofim & Co., Sub-Investment Adviser
Market and Fund Performance Overview
For the 12-month period ended December 31, 2021, BNY Mellon Variable Investment Fund, Appreciation Portfolio’s (the “fund”) Initial shares achieved a total return of 27.13%, and its Service shares achieved a total return of 26.78%.1 In comparison, the fund’s benchmark, the S&P 500® Index (the “Index”), produced a total return of 28.70% for the same period.2
The reporting period was characterized by market gains and volatility as the world recovered from the COVID-19 pandemic and the global shutdown to contain the spread. The fund underperformed the benchmark, driven by the dual effects of a negative stock-selection effect and a negative allocation effect.
The Fund’s Investment Approach
The fund seeks long-term capital growth consistent with the preservation of capital. Its secondary goal is current income. To pursue these goals, the fund normally invests at least 80% of its net assets, plus any borrowings for investment purposes, in common stocks. The fund focuses on blue-chip companies with total market capitalizations of more than $5 billion at the time of purchase, including multinational companies. These are established companies that have demonstrated sustained patterns of profitability, strong balance sheets, an expanding global presence and the potential to achieve predictable, above-average earnings growth.
In choosing stocks, we identify economic sectors we believe will expand over the next three to five years or longer. Using fundamental analysis, we then seek companies within these sectors that have proven track records and dominant positions in their industries. The fund employs a “buy-and-hold” investment strategy, which generally has resulted in an annual portfolio turnover rate of below 15%. A low portfolio turnover rate helps reduce the fund’s trading costs and can help limit the distribution of capital gains generated due to portfolio turnover.3
Market Recovery Continues
The U.S. economy continued on the path of economic recovery during 2021, as reflected by the strong Index performance of 28.70%. President Biden began his presidency by passing a stimulus bill, a domestic infrastructure investment bill, and ramped up vaccination efforts.
Focusing on the pandemic, a trio of vaccines were approved, and inoculations around the country were underway. Businesses began to reopen, and the pent-up demand from consumers to buy, travel, and experience the world outside of their homes drove strong corporate earnings results. These developments added to positive sentiment as investors focused on a path to normalization and recovery. Strong corporate earnings were
2
reported in the period as the consumer drove sales and earnings beats, while the companies noted pressure from rising input costs and supply-chain disruptions.
The Federal Reserve (the “Fed”) largely maintained its accommodative monetary policies but, toward the end of the year, acknowledged inflation’s rapid rise and moved to tame it. Burgeoning demand, coupled with supply-chain issues, have pushed prices up across all categories. Inflation rose to its highest reading in decades. The inflation data was ahead of the Fed’s 2% goal and prompted Fed Chairman Jerome Powell to acknowledge its persistence and shift focus to taming it. With inflation high and the economy on a steady footing, the Fed began tapering asset purchases by $30 billion per month to wind down its asset purchase program by March 2022. Fed members projected three interest-rate increases annually over the next two years, as the Fed shifts focus to controlling inflation.
Investors reacted positively to the Fed’s acknowledgment of inflation and the clearly laid-out plans to tame it. The certainty of the policies spelled out by the Fed, coupled with data showing the economy on a strong footing, provided a backdrop of optimism. While the positive trajectory led the Index to new record highs, the year wasn’t without volatility as investors were spooked by the arrival of the Delta and subsequent Omicron variants of the coronavirus. But concerns quickly dissipated as vaccines proved effective, and studies indicated less severe symptoms despite higher transmissibility of the Omicron variant. Investors weighed the myriad of concerns but, on balance, believed the economic outlook remained bright with strong consumer demand, clarity around monetary policy and society’s increasing ability to cope with the virus. Within the Index, every sector posted double-digit gains for the year. Notable outperformers include the energy, real estate, financials and information technology sectors.
Asset Allocation and Stock Selection Drove Performance
The fund underperformed the benchmark, driven by the impact of a negative allocation effect. The fund’s holdings in the insurance subsectors resulted in a negative stock-selection effect for the financials sector, detracting from the overall performance in the period. Within the consumer discretionary sector, the fund’s stock selection underperformed and contributed negatively to results. Within the best-performing energy sector, the fund’s performance was held back by, both a negative allocation effect from its underweight allocation and a negative stock-selection effect. The top detractors from relative performance include Netflix, Clarivate Analytics, Walt Disney, Exxon Mobil and Mastercard.
Within the communication services sector, a positive stock-selection effect driven by the fund’s interactive media holdings contributed to performance for the period. Within the health care sector, the positive impact from stock selection added value to the fund, as holdings in the health care providers & services and pharmaceutical subsectors outpaced sector peers. A positive allocation effect stemming from the fund’s underweight allocation to the worst-performing utilities sector supported performance. The top contributors to relative performance include Microsoft, Alphabet, Apple, ASML Holding and Meta Platforms.
3
DISCUSSION OF FUND PERFORMANCE (Unaudited) (continued)
Continued Economic Recovery Expected
As monetary policy normalizes, and the world learns to cope with subsequent variants of the coronavirus, the economy is expected to continue on a path of recovery and growth. It is, however, not without risks, including inflation, supply-chain issues and geopolitical tensions. On balance, the economic outlook remains positive. The Fund’s investment approach remains unchanged with a focus on the long term. The fund invests in companies with resilient cash flows, solid balance sheets, seasoned management teams and geographically diverse revenue streams. Those characteristics provide the fund a ballast in times of volatility, while positioning us to benefit from growth.
January 18, 2022
1 Total return includes reinvestment of dividends and any capital gains paid. Past performance is no guarantee of future results. Share price and investment return fluctuate such that upon redemption, fund shares may be worth more or less than their original cost. The fund’s performance does not reflect the deduction of additional charges and expenses imposed in connection with investing in variable insurance contracts, which will reduce returns.
2 Source: Lipper Inc. — The S&P 500® Index is widely regarded as the best single gauge of large-cap U.S. equities. The index includes 500 leading companies and captures approximately 80% coverage of available market capitalization. Investors cannot invest directly in any index.
3 Achieving tax efficiency is not a part of the fund’s investment objective, and there can be no guarantee that the fund will achieve any particular level of taxable distributions in future years. In periods when the manager has to sell significant amounts of securities (e.g., during periods of significant net redemptions or changes in index components), the fund can be expected to be less tax efficient than during periods of more stable market conditions and asset flows.
Please note: the position in any security highlighted with italicized typeface was sold during the reporting period.
Equities are subject generally to market, market sector, market liquidity, issuer and investment style risks, among other factors, to varying degrees, all of which are more fully described in the fund’s prospectus.
The fund may, but is not required to, use derivative instruments. A small investment in derivatives could have a potentially large impact on the fund’s performance. The use of derivatives involves risks different from, or possibly greater than, the risk associated with investing directly in the underlying assets.
The fund is only available as a funding vehicle under variable life insurance policies or variable annuity contracts issued by insurance companies. Individuals may not purchase shares of the fund directly. A variable annuity is an insurance contract issued by an insurance company that enables investors to accumulate assets on a tax-deferred basis for retirement or other long-term goals. The investment objective and policies of BNY Mellon Variable Investment Fund, Appreciation Portfolio made available through insurance products may be similar to those of other funds managed by BNY Mellon. However, the investment results of the fund may be higher or lower than, and may not be comparable to, those of any other BNY Mellon fund.
Recent market risks include pandemic risks related to COVID-19. The effects of COVID-19 have contributed to increased volatility in global markets and will likely affect certain countries, companies, industries and market sectors more dramatically than others. To the extent the fund may overweight its investments in certain countries, companies, industries or market sectors, such positions will increase the fund’s exposure to risk of loss from adverse developments affecting those countries, companies, industries or sectors.
4
FUND PERFORMANCE (Unaudited)

Comparison of change in value of a $10,000 investment in Initial shares and Service shares of BNY Mellon Variable Investment Fund, Appreciation Portfolio with a hypothetical investment of $10,000 in the S&P 500® Index (the “Index”).
† Source: Lipper Inc.
Past performance is not predictive of future performance. The fund’s performance does not reflect the deduction of additional charges and expenses imposed in connection with investing in variable insurance contracts which will reduce returns.
The above graph compares a hypothetical investment of $10,000 made in each Initial shares and Service shares of BNY Mellon Variable Investment Fund, Appreciation Portfolio on 12/31/11 to a hypothetical investment of $10,000 made in the Index on that date.
The fund’s performance shown in the line graph above takes into account all applicable fund fees and expenses for Initial shares and Service shares. The Index is widely regarded as the best single gauge of large-cap U.S. equities. The index includes 500 leading companies and captures approximately 80% coverage of available market capitalization. Unlike a mutual fund, the Index is not subject to charges, fees and other expenses. Investors cannot invest directly in any index. Further information relating to fund performance, including expense reimbursements, if applicable, is contained in the Financial Highlights section of the prospectus and elsewhere in this report.
| | | | |
Average Annual Total Returns as of 12/31/2021 |
| 1 Year | 5 Years | 10 Years |
Initial shares | 27.13% | 20.48% | 14.47% |
Service shares | 26.78% | 20.17% | 14.18% |
S&P 500® Index | 28.70% | 18.47% | 16.54% |
The performance data quoted represents past performance, which is no guarantee of future results. Share price and investment return fluctuate and an investor’s shares may be worth more or less than original cost upon redemption. Current performance may be lower or higher than the performance quoted. Go to www.im.bnymellon.com for the fund’s most recent month-end returns.
The fund’s Initial shares are not subject to a Rule 12b-1 fee. The fund’s Service shares are subject to a 0.25% annual Rule 12b-1 fee. All dividends and capital gain distributions are reinvested.
The fund’s performance shown in the graph and table does not reflect the deduction of taxes that a shareholder would pay on fund distributions or the redemption of fund shares.
5
UNDERSTANDING YOUR FUND’S EXPENSES (Unaudited)
As a mutual fund investor, you pay ongoing expenses, such as management fees and other expenses. Using the information below, you can estimate how these expenses affect your investment and compare them with the expenses of other funds. You also may pay one-time transaction expenses, including sales charges (loads), redemption fees and expenses associated with variable annuity or insurance contracts, which are not shown in this section and would have resulted in higher total expenses. For more information, see your fund’s prospectus or talk to your financial adviser.
Review your fund’s expenses
The table below shows the expenses you would have paid on a $1,000 investment in BNY Mellon Variable Investment Fund, Appreciation Portfolio from July 1, 2021 to December 31, 2021. It also shows how much a $1,000 investment would be worth at the close of the period, assuming actual returns and expenses.
| | | | | |
Expenses and Value of a $1,000 Investment | |
Assume actual returns for the six months ended December 31, 2021 | |
| | | | |
| | Initial Shares | Service Shares | |
Expenses paid per $1,000† | $4.20 | $5.52 | |
Ending value (after expenses) | $1,108.50 | $1,106.80 | |
COMPARING YOUR FUND’S EXPENSES
WITH THOSE OF OTHER FUNDS (Unaudited)
Using the SEC’s method to compare expenses
The Securities and Exchange Commission (“SEC”) has established guidelines to help investors assess fund expenses. Per these guidelines, the table below shows your fund’s expenses based on a $1,000 investment, assuming a hypothetical 5% annualized return. You can use this information to compare the ongoing expenses (but not transaction expenses or total cost) of investing in the fund with those of other funds. All mutual fund shareholder reports will provide this information to help you make this comparison. Please note that you cannot use this information to estimate your actual ending account balance and expenses paid during the period.
| | | | | |
Expenses and Value of a $1,000 Investment | |
Assuming a hypothetical 5% annualized return for the six months ended December 31, 2021 | |
| | | | |
| | Initial Shares | Service Shares | |
Expenses paid per $1,000† | $4.02 | $5.30 | |
Ending value (after expenses) | $1,021.22 | $1,019.96 | |
† | Expenses are equal to the fund’s annualized expense ratio of .79% for Initial Shares and 1.04% for Service Shares, multiplied by the average account value over the period, multiplied by 184/365 (to reflect the one-half year period). |
6
STATEMENT OF INVESTMENTS
December 31, 2021
| | | | | | | | |
| |
Description | | | | Shares | | Value ($) | |
Common Stocks - 99.1% | | | | | |
Banks - 2.1% | | | | | |
JPMorgan Chase & Co. | | | | 33,235 | | 5,262,762 | |
Capital Goods - 1.0% | | | | | |
Otis Worldwide | | | | 11,370 | | 989,986 | |
Raytheon Technologies | | | | 18,070 | | 1,555,104 | |
| | | | | 2,545,090 | |
Commercial & Professional Services - 2.5% | | | | | |
Clarivate | | | | 75,110 | a | 1,766,587 | |
IHS Markit | | | | 14,920 | | 1,983,166 | |
Verisk Analytics | | | | 10,615 | | 2,427,969 | |
| | | | | 6,177,722 | |
Consumer Durables & Apparel - 4.2% | | | | | |
Hermes International | | | | 800 | | 1,398,989 | |
LVMH | | | | 6,380 | | 5,280,659 | |
NIKE, Cl. B | | | | 22,405 | | 3,734,241 | |
| | | | | 10,413,889 | |
Consumer Services - 3.1% | | | | | |
Marriott International, Cl. A | | | | 21,690 | a | 3,584,056 | |
McDonald's | | | | 16,025 | | 4,295,822 | |
| | | | | 7,879,878 | |
Diversified Financials - 6.2% | | | | | |
BlackRock | | | | 6,965 | | 6,376,875 | |
Intercontinental Exchange | | | | 36,035 | | 4,928,507 | |
S&P Global | | | | 9,245 | | 4,362,993 | |
| | | | | 15,668,375 | |
Energy - 1.5% | | | | | |
Chevron | | | | 32,365 | | 3,798,033 | |
Food, Beverage & Tobacco - 6.7% | | | | | |
Altria Group | | | | 26,135 | | 1,238,538 | |
Nestle, ADR | | | | 26,845 | | 3,768,233 | |
PepsiCo | | | | 21,295 | | 3,699,154 | |
Philip Morris International | | | | 40,615 | | 3,858,425 | |
The Coca-Cola Company | | | | 71,565 | | 4,237,364 | |
| | | | | 16,801,714 | |
Health Care Equipment & Services - 8.1% | | | | | |
Abbott Laboratories | | | | 41,780 | | 5,880,117 | |
Intuitive Surgical | | | | 11,435 | a | 4,108,595 | |
Masimo | | | | 9,185 | a | 2,689,184 | |
UnitedHealth Group | | | | 15,110 | | 7,587,335 | |
| | | | | 20,265,231 | |
Household & Personal Products - 3.5% | | | | | |
The Estee Lauder Companies, Cl. A | | | | 23,655 | | 8,757,081 | |
7
STATEMENT OF INVESTMENTS (continued)
| | | | | | | | |
| |
Description | | | | Shares | | Value ($) | |
Common Stocks - 99.1% (continued) | | | | | |
Insurance - 1.7% | | | | | |
The Progressive | | | | 42,080 | | 4,319,512 | |
Materials - 4.1% | | | | | |
Air Products & Chemicals | | | | 20,565 | | 6,257,107 | |
The Sherwin-Williams Company | | | | 11,730 | | 4,130,837 | |
| | | | | 10,387,944 | |
Media & Entertainment - 13.2% | | | | | |
Alphabet, Cl. C | | | | 4,795 | a | 13,874,764 | |
Comcast, Cl. A | | | | 78,710 | | 3,961,474 | |
Meta Platforms, Cl. A | | | | 37,580 | a | 12,640,033 | |
Netflix | | | | 4,420 | a | 2,662,785 | |
| | | | | 33,139,056 | |
Pharmaceuticals Biotechnology & Life Sciences - 2.1% | | | | | |
Novo Nordisk, ADR | | | | 47,340 | | 5,302,080 | |
Retailing - 5.3% | | | | | |
Amazon.com | | | | 4,000 | a | 13,337,360 | |
Semiconductors & Semiconductor Equipment - 5.2% | | | | | |
ASML Holding | | | | 7,055 | | 5,616,768 | |
Texas Instruments | | | | 39,160 | | 7,380,485 | |
| | | | | 12,997,253 | |
Software & Services - 19.1% | | | | | |
Adobe | | | | 7,595 | a | 4,306,821 | |
Automatic Data Processing | | | | 6,285 | | 1,549,755 | |
Gartner | | | | 4,305 | a | 1,439,248 | |
Intuit | | | | 8,205 | | 5,277,620 | |
Mastercard, Cl. A | | | | 7,050 | | 2,533,206 | |
Microsoft | | | | 67,350 | | 22,651,152 | |
ServiceNow | | | | 2,970 | a | 1,927,857 | |
Visa, Cl. A | | | | 37,710 | b | 8,172,134 | |
| | | | | 47,857,793 | |
Technology Hardware & Equipment - 6.7% | | | | | |
Apple | | | | 94,945 | | 16,859,384 | |
Transportation - 2.8% | | | | | |
Canadian Pacific Railway | | | | 31,880 | | 2,293,447 | |
Union Pacific | | | | 18,275 | | 4,604,021 | |
| | | | | 6,897,468 | |
Total Common Stocks (cost $72,334,958) | | | | 248,667,625 | |
8
| | | | | | | | |
| |
Description | | 1-Day
Yield (%) | | Shares | | Value ($) | |
Investment Companies - .7% | | | | | |
Registered Investment Companies - .7% | | | | | |
Dreyfus Institutional Preferred Government Plus Money Market Fund, Institutional Shares
(cost $1,682,704) | | 0.07 | | 1,682,704 | c | 1,682,704 | |
Total Investments (cost $74,017,662) | | 99.8% | | 250,350,329 | |
Cash and Receivables (Net) | | .2% | | 433,979 | |
Net Assets | | 100.0% | | 250,784,308 | |
ADR—American Depository Receipt
a Non-income producing security.
b Security, or portion thereof, on loan. At December 31, 2021, the value of the fund’s securities on loan was $8,090,218 and the value of the collateral was $8,296,414, consisting of U.S. Government & Agency securities. In addition, the value of collateral may include pending sales that are also on loan.
c Investment in affiliated issuer. The investment objective of this investment company is publicly available and can be found within the investment company’s prospectus.
| | |
Portfolio Summary (Unaudited) † | Value (%) |
Information Technology | 31.0 |
Communication Services | 13.2 |
Consumer Discretionary | 12.6 |
Health Care | 10.2 |
Consumer Staples | 10.2 |
Financials | 10.1 |
Industrials | 6.2 |
Materials | 4.1 |
Energy | 1.5 |
Investment Companies | .7 |
| | 99.8 |
† Based on net assets.
See notes to financial statements.
9
STATEMENT OF INVESTMENTS IN AFFILIATED ISSUERS
| | | | | | | |
Description | Value ($) 12/31/2020 | Purchases ($)† | Sales ($) | Value ($) 12/31/2021 | Dividends/
Distributions ($) | |
Registered Investment Companies - .7% | | |
Dreyfus Institutional Preferred Government Plus Money Market Fund, Institutional Shares - .7% | 1,537,249 | 42,827,178 | (42,681,723) | 1,682,704 | 653 | |
Investment of Cash Collateral for Securities Loaned - .0% | | |
Dreyfus Institutional Preferred Government Plus Money Market Fund, SL Shares - .0% | - | 18,711,498 | (18,711,498) | - | 22,730 | †† |
Total - .7% | 1,537,249 | 61,538,676 | (61,393,221) | 1,682,704 | 23,383 | |
† Includes reinvested dividends/distributions.
†† Represents securities lending income earned from the reinvestment of cash collateral from loaned securities, net of fees and collateral investment expenses, and other payments to and from borrowers of securities.
See notes to financial statements.
10
STATEMENT OF ASSETS AND LIABILITIES
December 31, 2021
| | | | | | | |
| | | | | | |
| | | Cost | | Value | |
Assets ($): | | | | |
Investments in securities—See Statement of Investments
(including securities on loan, valued at $8,090,218)—Note 1(c): | | | |
Unaffiliated issuers | 72,334,958 | | 248,667,625 | |
Affiliated issuers | | 1,682,704 | | 1,682,704 | |
Receivable for shares of Beneficial Interest subscribed | | 558,693 | |
Dividends and securities lending income receivable | | 140,602 | |
Tax reclaim receivable—Note 1(b) | | 117,796 | |
Prepaid expenses | | | | | 2,174 | |
| | | | | 251,169,594 | |
Liabilities ($): | | | | |
Due to BNY Mellon Investment Adviser, Inc. and affiliates—Note 3(b) | | 131,852 | |
Due to Fayez Sarofim & Co. | | | | | 45,967 | |
Payable for shares of Beneficial Interest redeemed | | 131,886 | |
Trustees’ fees and expenses payable | | 1,487 | |
Other accrued expenses | | | | | 74,094 | |
| | | | | 385,286 | |
Net Assets ($) | | | 250,784,308 | |
Composition of Net Assets ($): | | | | |
Paid-in capital | | | | | (142,662,474) | |
Total distributable earnings (loss) | | | | | 393,446,782 | |
Net Assets ($) | | | 250,784,308 | |
| | | | |
Net Asset Value Per Share | Initial Shares | Service Shares | |
Net Assets ($) | 200,724,776 | 50,059,532 | |
Shares Outstanding | 3,736,761 | 945,211 | |
Net Asset Value Per Share ($) | 53.72 | 52.96 | |
| | | |
See notes to financial statements. | | | |
11
STATEMENT OF OPERATIONS
Year Ended December 31, 2021
| | | | | | | |
| | | | | | |
| | | | | | |
Investment Income ($): | | | | |
Income: | | | | |
Cash dividends (net of $111,299 foreign taxes withheld at source): | |
Unaffiliated issuers | | | 5,444,036 | |
Affiliated issuers | | | 653 | |
Income from securities lending—Note 1(c) | | | 22,730 | |
Total Income | | | 5,467,419 | |
Expenses: | | | | |
Investment advisory fee—Note 3(a) | | | 2,313,219 | |
Sub-investment advisory fee—Note 3(a) | | | 944,836 | |
Distribution fees—Note 3(b) | | | 320,865 | |
Professional fees | | | 102,154 | |
Prospectus and shareholders’ reports | | | 30,526 | |
Trustees’ fees and expenses—Note 3(c) | | | 23,148 | |
Custodian fees—Note 3(b) | | | 18,105 | |
Chief Compliance Officer fees—Note 3(b) | | | 14,276 | |
Loan commitment fees—Note 2 | | | 9,997 | |
Shareholder servicing costs—Note 3(b) | | | 2,386 | |
Interest expense—Note 2 | | | 876 | |
Miscellaneous | | | 20,862 | |
Total Expenses | | | 3,801,250 | |
Investment Income—Net | | | 1,666,169 | |
Realized and Unrealized Gain (Loss) on Investments—Note 4 ($): | | |
Net realized gain (loss) on investments and foreign currency transactions | 216,800,860 | |
Net change in unrealized appreciation (depreciation) on investments
and foreign currency transactions | (110,430,149) | |
Net Realized and Unrealized Gain (Loss) on Investments | | | 106,370,711 | |
Net Increase in Net Assets Resulting from Operations | | 108,036,880 | |
| | | | | | |
See notes to financial statements. | | | | | |
12
STATEMENT OF CHANGES IN NET ASSETS
| | | | | | | | | | |
| | | | Year Ended December 31, |
| | | | 2021 | | 2020 | |
Operations ($): | | | | | | | | |
Investment income—net | | | 1,666,169 | | | | 2,840,348 | |
Net realized gain (loss) on investments | | 216,800,860 | | | | 44,313,337 | |
Net change in unrealized appreciation
(depreciation) on investments | | (110,430,149) | | | | 39,126,298 | |
Net Increase (Decrease) in Net Assets
Resulting from Operations | 108,036,880 | | | | 86,279,983 | |
Distributions ($): | |
Distributions to shareholders: | | | | | | | | |
Initial Shares | | | (31,784,721) | | | | (24,163,384) | |
Service Shares | | | (14,100,431) | | | | (10,803,682) | |
Total Distributions | | | (45,885,152) | | | | (34,967,066) | |
Beneficial Interest Transactions ($): | |
Net proceeds from shares sold: | | | | | | | | |
Initial Shares | | | 8,890,258 | | | | 8,597,229 | |
Service Shares | | | 9,494,352 | | | | 15,542,813 | |
Distributions reinvested: | | | | | | | | |
Initial Shares | | | 31,784,721 | | | | 24,163,384 | |
Service Shares | | | 14,100,431 | | | | 10,803,682 | |
Cost of shares redeemed: | | | | | | | | |
Initial Shares | | | (182,479,259) | | | | (42,643,713) | |
Service Shares | | | (127,733,452) | | | | (35,436,301) | |
Increase (Decrease) in Net Assets
from Beneficial Interest Transactions | (245,942,949) | | | | (18,972,906) | |
Total Increase (Decrease) in Net Assets | (183,791,221) | | | | 32,340,011 | |
Net Assets ($): | |
Beginning of Period | | | 434,575,529 | | | | 402,235,518 | |
End of Period | | | 250,784,308 | | | | 434,575,529 | |
Capital Share Transactions (Shares): | |
Initial Shares | | | | | | | | |
Shares sold | | | 183,200 | | | | 212,187 | |
Shares issued for distributions reinvested | | | 721,370 | | | | 746,129 | |
Shares redeemed | | | (3,493,168) | | | | (1,036,750) | |
Net Increase (Decrease) in Shares Outstanding | (2,588,598) | | | | (78,434) | |
Service Shares | | | | | | | | |
Shares sold | | | 192,253 | | | | 412,412 | |
Shares issued for distributions reinvested | | | 325,030 | | | | 339,325 | |
Shares redeemed | | | (2,492,895) | | | | (867,172) | |
Net Increase (Decrease) in Shares Outstanding | (1,975,612) | | | | (115,435) | |
| | | | | | | | | |
See notes to financial statements. | | | | | | | | |
13
FINANCIAL HIGHLIGHTS
The following tables describe the performance for each share class for the fiscal periods indicated. All information (except portfolio turnover rate) reflects financial results for a single fund share. Net asset value total return is calculated assuming an initial investment made at the net asset value at the beginning of the period, reinvestment of all dividends and distributions at net asset value during the period, and redemption at net asset value on the last day of the period. Net asset value total return includes adjustments in accordance with accounting principles generally accepted in the United States of America and as such, the net asset value for financial reporting purposes and the returns based upon those net asset values may differ from the net asset value and returns for shareholder transactions. The fund’s total returns do not reflect expenses associated with variable annuity or insurance contracts. These figures have been derived from the fund’s financial statements.
| | | | | | | | | | | | | |
| | | | | | | |
| | | |
Initial Shares | | | Year Ended December 31, |
| | | 2021 | 2020 | 2019 | 2018 | 2017 |
Per Share Data ($): | | | | | | |
Net asset value, beginning of period | | 47.18 | 42.76 | 35.84 | 44.71 | 41.01 |
Investment Operations: | | | | | | |
Investment income—neta | | .23 | .33 | .43 | .53 | .56 |
Net realized and unrealized
gain (loss) on investments | | 11.43 | 7.99 | 11.58 | (3.27) | 9.55 |
Total from Investment Operations | | 11.66 | 8.32 | 12.01 | (2.74) | 10.11 |
Distributions: | | | | | | |
Dividends from
investment income—net | | (.22) | (.33) | (.46) | (.52) | (.57) |
Dividends from net realized
gain on investments | | (4.90) | (3.57) | (4.63) | (5.61) | (5.84) |
Total Distributions | | (5.12) | (3.90) | (5.09) | (6.13) | (6.41) |
Net asset value, end of period | | 53.72 | 47.18 | 42.76 | 35.84 | 44.71 |
Total Return (%) | | 27.13 | 23.69 | 36.10 | (6.86) | 27.33 |
Ratios/Supplemental Data (%): | | | | | | |
Ratio of total expenses
to average net assets | | .80 | .81 | .81 | .81 | .81 |
Ratio of net investment income
to average net assets | | .46 | .80 | 1.10 | 1.30 | 1.35 |
Portfolio Turnover Rate | | 3.81 | 8.82 | 6.71 | 6.50 | 3.97 |
Net Assets,
end of period ($ x 1,000) | | 200,725 | 298,456 | 273,832 | 225,631 | 271,790 |
a Based on average shares outstanding.
See notes to financial statements.
14
| | | | | | | | | | |
| | | | | | | |
| | | |
Service Shares | | | Year Ended December 31, |
| | | 2021 | 2020 | 2019 | 2018 | 2017 |
Per Share Data ($): | | | | | | |
Net asset value, beginning of period | | 46.60 | 42.29 | 35.49 | 44.34 | 40.72 |
Investment Operations: | | | | | | |
Investment income—neta | | .10 | .22 | .33 | .42 | .46 |
Net realized and unrealized
gain (loss) on investments | | 11.26 | 7.89 | 11.46 | (3.25) | 9.46 |
Total from Investment Operations | | 11.36 | 8.11 | 11.79 | (2.83) | 9.92 |
Distributions: | | | | | | |
Dividends from
investment income—net | | (.10) | (.23) | (.36) | (.41) | (.46) |
Dividends from net realized
gain on investments | | (4.90) | (3.57) | (4.63) | (5.61) | (5.84) |
Total Distributions | | (5.00) | (3.80) | (4.99) | (6.02) | (6.30) |
Net asset value, end of period | | 52.96 | 46.60 | 42.29 | 35.49 | 44.34 |
Total Return (%) | | 26.78 | 23.38 | 35.78 | (7.10) | 27.00 |
Ratios/Supplemental Data (%): | | | | | | |
Ratio of total expenses
to average net assets | | 1.05 | 1.06 | 1.06 | 1.06 | 1.06 |
Ratio of net investment income
to average net assets | | .21 | .55 | .85 | 1.05 | 1.11 |
Portfolio Turnover Rate | | 3.81 | 8.82 | 6.71 | 6.50 | 3.97 |
Net Assets,
end of period ($ x 1,000) | | 50,060 | 136,119 | 128,404 | 112,387 | 145,485 |
a Based on average shares outstanding.
See notes to financial statements.
15
NOTES TO FINANCIAL STATEMENTS
NOTE 1—Significant Accounting Policies:
Appreciation Portfolio (the “fund”) is a separate diversified series of BNY Mellon Variable Investment Fund (the “Trust”), which is registered under the Investment Company Act of 1940, as amended (the “Act”), as an open-end management investment company and operates as a series company currently offering four series, including the fund. The fund is only offered to separate accounts established by insurance companies to fund variable annuity contracts and variable life insurance policies. The fund’s investment objective is to seek long-term capital growth consistent with the preservation of capital. BNY Mellon Investment Adviser, Inc. (the “Adviser”), a wholly-owned subsidiary of The Bank of New York Mellon Corporation (“BNY Mellon”), serves as the fund’s investment adviser. Fayez Sarofim & Co. (the “Sub-Adviser”), serves as the fund’s sub-investment adviser.
BNY Mellon Securities Corporation (the “Distributor”), a wholly-owned subsidiary of the Adviser, is the distributor of the fund’s shares, which are sold without a sales charge. The fund is authorized to issue an unlimited number of $.001 par value shares of Beneficial Interest in each of the following classes of shares: Initial and Service. Each class of shares has identical rights and privileges, except with respect to the Distribution Plan, and the expenses borne by each class, the allocation of certain transfer agency costs, and certain voting rights. Income, expenses (other than expenses attributable to a specific class), and realized and unrealized gains or losses on investments are allocated to each class of shares based on its relative net assets.
The Trust accounts separately for the assets, liabilities and operations of each series. Expenses directly attributable to each series are charged to that series’ operations; expenses which are applicable to all series are allocated among them on a pro rata basis.
The Financial Accounting Standards Board (“FASB”) Accounting Standards Codification (“ASC”) is the exclusive reference of authoritative U.S. generally accepted accounting principles (“GAAP”) recognized by the FASB to be applied by nongovernmental entities. Rules and interpretive releases of the SEC under authority of federal laws are also sources of authoritative GAAP for SEC registrants. The fund is an investment company and applies the accounting and reporting guidance of the FASB ASC Topic 946 Financial Services-Investment Companies. The fund’s financial statements are prepared in accordance with GAAP, which may require the use of management estimates and assumptions. Actual results could differ from those estimates.
16
The Trust enters into contracts that contain a variety of indemnifications. The fund’s maximum exposure under these arrangements is unknown. The fund does not anticipate recognizing any loss related to these arrangements.
(a) Portfolio valuation: The fair value of a financial instrument is the amount that would be received to sell an asset or paid to transfer a liability in an orderly transaction between market participants at the measurement date (i.e., the exit price). GAAP establishes a fair value hierarchy that prioritizes the inputs of valuation techniques used to measure fair value. This hierarchy gives the highest priority to unadjusted quoted prices in active markets for identical assets or liabilities (Level 1 measurements) and the lowest priority to unobservable inputs (Level 3 measurements).
Additionally, GAAP provides guidance on determining whether the volume and activity in a market has decreased significantly and whether such a decrease in activity results in transactions that are not orderly. GAAP requires enhanced disclosures around valuation inputs and techniques used during annual and interim periods.
Various inputs are used in determining the value of the fund’s investments relating to fair value measurements. These inputs are summarized in the three broad levels listed below:
Level 1—unadjusted quoted prices in active markets for identical investments.
Level 2—other significant observable inputs (including quoted prices for similar investments, interest rates, prepayment speeds, credit risk, etc.).
Level 3—significant unobservable inputs (including the fund’s own assumptions in determining the fair value of investments).
The inputs or methodology used for valuing securities are not necessarily an indication of the risk associated with investing in those securities.
Changes in valuation techniques may result in transfers in or out of an assigned level within the disclosure hierarchy. Valuation techniques used to value the fund’s investments are as follows:
Investments in equity securities are valued at the last sales price on the securities exchange or national securities market on which such securities are primarily traded. Securities listed on the National Market System for which market quotations are available are valued at the official closing price or, if there is no official closing price that day, at the last sales price. For open short positions, asked prices are used for valuation purposes. Bid
17
NOTES TO FINANCIAL STATEMENTS (continued)
price is used when no asked price is available. Registered investment companies that are not traded on an exchange are valued at their net asset value. All of the preceding securities are generally categorized within Level 1 of the fair value hierarchy.
Securities not listed on an exchange or the national securities market, or securities for which there were no transactions, are valued at the average of the most recent bid and asked prices. These securities are generally categorized within Level 2 of the fair value hierarchy.
Fair valuing of securities may be determined with the assistance of a pricing service using calculations based on indices of domestic securities and other appropriate indicators, such as prices of relevant ADRs and futures. Utilizing these techniques may result in transfers between Level 1 and Level 2 of the fair value hierarchy.
When market quotations or official closing prices are not readily available, or are determined not to accurately reflect fair value, such as when the value of a security has been significantly affected by events after the close of the exchange or market on which the security is principally traded (for example, a foreign exchange or market), but before the fund calculates its net asset value, the fund may value these investments at fair value as determined in accordance with the procedures approved by the Trust’s Board of Trustees (the “Board”). Certain factors may be considered when fair valuing investments such as: fundamental analytical data, the nature and duration of restrictions on disposition, an evaluation of the forces that influence the market in which the securities are purchased and sold, and public trading in similar securities of the issuer or comparable issuers. These securities are either categorized within Level 2 or 3 of the fair value hierarchy depending on the relevant inputs used.
For securities where observable inputs are limited, assumptions about market activity and risk are used and such securities are generally categorized within Level 3 of the fair value hierarchy.
Investments denominated in foreign currencies are translated to U.S. dollars at the prevailing rates of exchange.
The following is a summary of the inputs used as of December 31, 2021 in valuing the fund’s investments:
18
| | | | | | | |
| | Level 1-Unadjusted Quoted Prices | Level 2- Other Significant Observable Inputs | | Level 3-Significant Unobservable Inputs | Total | |
Assets ($) | | |
Investments In Securities:† | | |
Equity Securities - Common Stocks | 248,667,625 | - | | - | 248,667,625 | |
Investment Companies | 1,682,704 | - | | - | 1,682,704 | |
† See Statement of Investments for additional detailed categorizations, if any.
(b) Foreign currency transactions: The fund does not isolate that portion of the results of operations resulting from changes in foreign exchange rates on investments from the fluctuations arising from changes in the market prices of securities held. Such fluctuations are included with the net realized and unrealized gain or loss on investments.
Net realized foreign exchange gains or losses arise from sales of foreign currencies, currency gains or losses realized on securities transactions between trade and settlement date, and the difference between the amounts of dividends, interest and foreign withholding taxes recorded on the fund’s books and the U.S. dollar equivalent of the amounts actually received or paid. Net unrealized foreign exchange gains and losses arise from changes in the value of assets and liabilities other than investments resulting from changes in exchange rates. Foreign currency gains and losses on foreign currency transactions are also included with net realized and unrealized gain or loss on investments.
Foreign taxes: The fund may be subject to foreign taxes (a portion of which may be reclaimable) on income, stock dividends, realized and unrealized capital gains on investments or certain foreign currency transactions. Foreign taxes are recorded in accordance with the applicable foreign tax regulations and rates that exist in the foreign jurisdictions in which the fund invests. These foreign taxes, if any, are paid by the fund and are reflected in the Statement of Operations, if applicable. Foreign taxes payable or deferred or those subject to reclaims as of December 31, 2021, if any, are disclosed in the fund’s Statement of Assets and Liabilities.
(c) Securities transactions and investment income: Securities transactions are recorded on a trade date basis. Realized gains and losses from securities transactions are recorded on the identified cost basis. Dividend income is recognized on the ex-dividend date and interest income, including, where applicable, accretion of discount and amortization of premium on investments, is recognized on the accrual basis.
19
NOTES TO FINANCIAL STATEMENTS (continued)
Pursuant to a securities lending agreement with The Bank of New York Mellon, a subsidiary of BNY Mellon and an affiliate of the Adviser, the fund may lend securities to qualified institutions. It is the fund’s policy that, at origination, all loans are secured by collateral of at least 102% of the value of U.S. securities loaned and 105% of the value of foreign securities loaned. Collateral equivalent to at least 100% of the market value of securities on loan is maintained at all times. Collateral is either in the form of cash, which can be invested in certain money market mutual funds managed by the Adviser, or U.S. Government and Agency securities. The fund is entitled to receive all dividends, interest and distributions on securities loaned, in addition to income earned as a result of the lending transaction. Should a borrower fail to return the securities in a timely manner, The Bank of New York Mellon is required to replace the securities for the benefit of the fund or credit the fund with the market value of the unreturned securities and is subrogated to the fund’s rights against the borrower and the collateral. Additionally, the contractual maturity of security lending transactions are on an overnight and continuous basis. During the period ended December 31, 2021, The Bank of New York Mellon earned $3,099 from the lending of the fund’s portfolio securities, pursuant to the securities lending agreement.
(d) Affiliated issuers: Investments in other investment companies advised by the Adviser are considered “affiliated” under the Act.
(e) Risk: Certain events particular to the industries in which the fund’s investments conduct their operations, as well as general economic, political and public health conditions, may have a significant negative impact on the investee’s operations and profitability. In addition, turbulence in financial markets and reduced liquidity in equity, credit and/or fixed income markets may negatively affect many issuers, which could adversely affect the fund. Global economies and financial markets are becoming increasingly interconnected, and conditions and events in one country, region or financial market may adversely impact issuers in a different country, region or financial market. These risks may be magnified if certain events or developments adversely interrupt the global supply chain; in these and other circumstances, such risks might affect companies world-wide. Recent examples include pandemic risks related to COVID-19 and aggressive measures taken world-wide in response by governments, including closing borders, restricting international and domestic travel, and the imposition of prolonged quarantines of large populations, and by businesses, including changes to operations and reducing staff. The effects of COVID-19 have contributed to increased volatility in global markets and will likely affect certain countries, companies, industries and market sectors more dramatically than others. The COVID-19 pandemic has had,
20
and any other outbreak of an infectious disease or other serious public health concern could have, a significant negative impact on economic and market conditions and could trigger a prolonged period of global economic slowdown. To the extent the fund may overweight its investments in certain countries, companies, industries or market sectors, such positions will increase the fund’s exposure to risk of loss from adverse developments affecting those countries, companies, industries or sectors.
(f) Dividends and distributions to shareholders: Dividends and distributions are recorded on the ex-dividend date. Dividends from investment income-net are normally declared and paid quarterly. Dividends from net realized capital gains, if any, are normally declared and paid annually, but the fund may make distributions on a more frequent basis to comply with the distribution requirements of the Internal Revenue Code of 1986, as amended (the “Code”). To the extent that net realized capital gains can be offset by capital loss carryovers, it is the policy of the fund not to distribute such gains. Income and capital gain distributions are determined in accordance with income tax regulations, which may differ from GAAP.
(g) Federal income taxes: It is the policy of the fund to continue to qualify as a regulated investment company, if such qualification is in the best interests of its shareholders, by complying with the applicable provisions of the Code, and to make distributions of taxable income and net realized capital gain sufficient to relieve it from substantially all federal income and excise taxes.
As of and during the period ended December 31, 2021, the fund did not have any liabilities for any uncertain tax positions. The fund recognizes interest and penalties, if any, related to uncertain tax positions as income tax expense in the Statement of Operations. During the period ended December 31, 2021, the fund did not incur any interest or penalties.
Each tax year in the four-year period ended December 31, 2021 remains subject to examination by the Internal Revenue Service and state taxing authorities.
At December 31, 2021, the components of accumulated earnings on a tax basis were as follows: undistributed ordinary income $1,170,697, undistributed capital gains $215,943,992 and unrealized appreciation $176,332,093.
The tax character of distributions paid to shareholders during the fiscal periods ended December 31, 2021 and December 31, 2020 were as follows: ordinary income $1,630,599 and $2,791,417, and long-term capital gains $44,254,553 and $32,175,649, respectively.
21
NOTES TO FINANCIAL STATEMENTS (continued)
NOTE 2—Bank Lines of Credit:
The fund participates with other long-term open-end funds managed by the Adviser in a $823.5 million unsecured credit facility led by Citibank, N.A. (the “Citibank Credit Facility”) and a $300 million unsecured credit facility provided by The Bank of New York Mellon (the “BNYM Credit Facility”), each to be utilized primarily for temporary or emergency purposes, including the financing of redemptions (each, a “Facility”). The Citibank Credit Facility is available in two tranches: (i) Tranche A is in an amount equal to $688.5 million and is available to all long-term open-ended funds, including the fund, and (ii) Tranche B is an amount equal to $135 million and is available only to BNY Mellon Floating Rate Income Fund, a series of BNY Mellon Investment Funds IV, Inc. In connection therewith, the fund has agreed to pay its pro rata portion of commitment fees for Tranche A of the Citibank Credit Facility and the BNYM Credit Facility. Interest is charged to the fund based on rates determined pursuant to the terms of the respective Facility at the time of borrowing.
The average amount of borrowings outstanding under the Facilities during the period ended December 31, 2021 was approximately $85,205 with a related weighted average annualized interest rate of 1.03%.
NOTE 3—Investment Advisory Fee, Sub-Investment Advisory Fee and Other Transactions with Affiliates:
(a) Pursuant to an investment advisory agreement with the Adviser, the investment advisory fee is computed at the annual rate of .5325% of the value of the fund’s average daily net assets. Pursuant to a sub-investment advisory agreement with the Sub-Adviser, the fund pays the Sub-Adviser a monthly sub-investment advisory fee at the annual rate of .2175% of the value of the fund’s average daily net assets. Both fees are payable monthly.
(b) Under the Distribution Plan adopted pursuant to Rule 12b-1 under the Act, Service shares pay the Distributor for distributing its shares, for servicing and/or maintaining Service shares’ shareholder accounts and for advertising and marketing for Service shares. The Distribution Plan provides for payments to be made at an annual rate of .25% of the value of the Service shares’ average daily net assets. The Distributor may make payments to Participating Insurance Companies and to brokers and dealers acting as principal underwriter for their variable insurance products. The fees payable under the Distribution Plan are payable without regard to actual expenses incurred. During the period ended December 31, 2021, Service shares were charged $320,865 pursuant to the Distribution Plan.
The fund has an arrangement with the transfer agent whereby the fund may receive earnings credits when positive cash balances are maintained,
22
which are used to offset transfer agency fees. For financial reporting purposes, the fund includes net earnings credits, if any, as shareholder servicing costs in the Statement of Operations.
The fund has an arrangement with the custodian whereby the fund will receive interest income or be charged overdraft fees when cash balances are maintained. For financial reporting purposes, the fund includes this interest income and overdraft fees, if any, as interest income in the Statement of Operations.
The fund compensates BNY Mellon Transfer, Inc., a wholly-owned subsidiary of the Adviser, under a transfer agency agreement for providing transfer agency and cash management services inclusive of earnings credits, if any, for the fund. The majority of transfer agency fees are comprised of amounts paid on a per account basis, while cash management fees are related to fund subscriptions and redemptions. During the period ended December 31, 2021, the fund was charged $2,077 for transfer agency services, inclusive of earnings credit, if any. These fees are included in Shareholder servicing costs in the Statement of Operations.
The fund compensates The Bank of New York Mellon under a custody agreement for providing custodial services for the fund. These fees are determined based on net assets, geographic region and transaction activity. During the period ended December 31, 2021, the fund was charged $18,105 pursuant to the custody agreement.
During the period ended December 31, 2021, the fund was charged $14,276 for services performed by the Chief Compliance Officer and his staff. These fees are included in Chief Compliance Officer fees in the Statement of Operations.
The components of “Due to BNY Mellon Investment Adviser, Inc. and affiliates” in the Statement of Assets and Liabilities consist of: investment advisory fees of $112,539, Distribution Plan fees of $10,486, custodian fees of $4,800, Chief Compliance Officer fees of $3,627 and transfer agency fees of $400.
(c) Each Board member also serves as a Board member of other funds in the BNY Mellon Family of Funds complex. Annual retainer fees and attendance fees are allocated to each fund based on net assets.
NOTE 4—Securities Transactions:
The aggregate amount of purchases and sales of investment securities, excluding short-term securities during the period ended December 31, 2021, amounted to $16,154,096 and $306,219,705, respectively.
23
NOTES TO FINANCIAL STATEMENTS (continued)
At December 31, 2021, the cost of investments for federal income tax purposes was $74,017,816; accordingly, accumulated net unrealized appreciation on investments was $176,332,513, consisting of $176,606,976 gross unrealized appreciation and $274,463 gross unrealized depreciation.
24
REPORT OF INDEPENDENT REGISTERED PUBLIC ACCOUNTING FIRM
To the Shareholders and the Board of Trustees of Appreciation Portfolio
Opinion on the Financial Statements
We have audited the accompanying statement of assets and liabilities of Appreciation Portfolio (the “Fund”) (one of the funds constituting BNY Mellon Variable Investment Fund), including the statements of investments and investments in affiliated issuers, as of December 31, 2021, and the related statement of operations for the year then ended, the statements of changes in net assets for each of the two years in the period then ended, the financial highlights for each of the five years in the period then ended and the related notes (collectively referred to as the “financial statements”). In our opinion, the financial statements present fairly, in all material respects, the financial position of the Fund (one of the funds constituting BNY Mellon Variable Investment Fund) at December 31, 2021, the results of its operations for the year then ended, the changes in its net assets for each of the two years in the period then ended and its financial highlights for each of the five years in the period then ended, in conformity with U.S. generally accepted accounting principles.
Basis for Opinion
These financial statements are the responsibility of the Fund’s management. Our responsibility is to express an opinion on the Fund’s financial statements based on our audits. We are a public accounting firm registered with the Public Company Accounting Oversight Board (United States) (“PCAOB”) and are required to be independent with respect to the Fund in accordance with the U.S. federal securities laws and the applicable rules and regulations of the Securities and Exchange Commission and the PCAOB.
We conducted our audits in accordance with the standards of the PCAOB. Those standards require that we plan and perform the audit to obtain reasonable assurance about whether the financial statements are free of material misstatement, whether due to error or fraud. The Fund is not required to have, nor were we engaged to perform, an audit of the Fund’s internal control over financial reporting. As part of our audits, we are required to obtain an understanding of internal control over financial reporting, but not for the purpose of expressing an opinion on the effectiveness of the Fund’s internal control over financial reporting. Accordingly, we express no such opinion.
Our audits included performing procedures to assess the risks of material misstatement of the financial statements, whether due to error or fraud, and performing procedures that respond to those risks. Such procedures included examining, on a test basis, evidence regarding the amounts and disclosures in the financial statements. Our procedures included confirmation of securities owned as of December 31, 2021, by correspondence with the custodian and others or by other appropriate auditing procedures where replies from others were not received. Our audits also included evaluating the accounting principles used and significant estimates made by management, as well as evaluating the overall presentation of the financial statements. We believe that our audits provide a reasonable basis for our opinion.

We have served as the auditor of one or more investment companies in the BNY Mellon Family of Funds since at least 1957, but we are unable to determine the specific year.
New York, New York
February 8, 2022
25
IMPORTANT TAX INFORMATION (Unaudited)
For federal tax purposes, the fund hereby reports 100% of the ordinary dividends paid during the fiscal year ended December 31, 2021 as qualifying for the corporate dividends received deduction. Shareholders will receive notification in early 2022 of the percentage applicable to the preparation of their 2021 income tax returns. Also, the fund hereby reports $4.9037 per share as a long-term capital gain distribution paid on March 31, 2021.
26
BOARD MEMBERS INFORMATION (Unaudited)
Independent Board Members
Joseph S. DiMartino (78)
Chairman of the Board (1995)
Principal Occupation During Past 5 Years:
· Director or Trustee of funds in the BNY Mellon Family of Funds and certain other entities (as described in the fund’s Statement of Additional Information) (1995-Present)
Other Public Company Board Memberships During Past 5 Years:
· CBIZ, Inc., a public company providing professional business services, products and solutions, Director (1997-Present)
No. of Portfolios for which Board Member Serves: 96
———————
Peggy C. Davis (78)
Board Member (2006)
Principal Occupation During Past 5 Years:
· Shad Professor of Law, New York University School of Law (1983-Present)
No. of Portfolios for which Board Member Serves: 34
———————
Gina D. France (63)
Board Member (2019)
Principal Occupation During Past 5 Years:
· France Strategic Partners, a strategy and advisory firm serving corporate clients across the United States, Founder, President and Chief Executive Officer (2003-Present)
Other Public Company Board Memberships During Past 5 Years:
· Huntington Bancshares, a bank holding company headquartered in Columbus, Ohio, Director (2016-Present)
· Cedar Fair, L.P., a publicly-traded partnership that owns and operates amusement parks and hotels in the U.S. and Canada, Director (2011-Present)
· CBIZ, Inc., a public company providing professional business services, products and solutions, Director (2015-Present)
· FirstMerit Corporation, a diversified financial services company, Director (2004-2016)
No. of Portfolios for which Board Member Serves: 24
———————
Joan Gulley (74)
Board Member (2017)
Principal Occupation During Past 5 Years:
· Nantucket Atheneum, public library, Chair (2018-June 2021) and Director (2015-June 2021)
· Orchard Island Club, golf and beach club, Governor (2016-Present)
No. of Portfolios for which Board Member Serves: 42
———————
27
BOARD MEMBERS INFORMATION (Unaudited) (continued)
Robin A. Melvin (58)
Board Member (2012)
Principal Occupation During Past 5 Years:
· Westover School, a private girls’ boarding school in Middlebury, Connecticut, Trustee (2019-Present)
· Mentor Illinois, a non-profit organization dedicated to increasing the quality of mentoring services in Illinois, Co-Chair (2014–2020); Board Member, Mentor Illinois (2013-2020)
· JDRF, a non-profit juvenile diabetes research foundation, Board Member (June 2021-Present)
Other Public Company Board Memberships During Past 5 Years:
· HPS Corporate Lending Fund, a closed-end management investment company regulated as a business development company, Trustee (August 2021-Present)
No. of Portfolios for which Board Member Serves: 74
———————
Once elected all Board Members serve for an indefinite term, but achieve Emeritus status upon reaching age 80. The address of the Board Members and Officers is c/o BNY Mellon Investment Adviser, Inc. 240 Greenwich Street, New York, New York 10286. Additional information about the Board Members is available in the fund’s Statement of Additional Information which can be obtained from the Adviser free of charge by calling this toll free number: 1-800-373-9387.
David P. Feldman, Emeritus Board Member
Ehud Houminer, Emeritus Board Member
Lynn Martin, Emeritus Board Member
Dr. Martin Peretz, Emeritus Board Member
Philip L. Toia, Emeritus Board Member
28
OFFICERS OF THE FUND (Unaudited)
DAVID DIPETRILLO, President since January 2021.
Vice President and Director of the Adviser since February 2021; Head of North America Product, BNY Mellon Investment Management since January 2018; Director of Product Strategy, BNY Mellon Investment Management from January 2016 to December 2017. He is an officer of 56 investment companies (comprised of 109 portfolios) managed by the Adviser or an affiliate of the Adviser. He is 43 years old and has been an employee of BNY Mellon since 2005.
JAMES WINDELS, Treasurer since November 2001.
Vice President of the Adviser since September 2020; Director–BNY Mellon Fund Administration, and an officer of 57 investment companies (comprised of 130 portfolios) managed by the Adviser or an affiliate of the Adviser. He is 63 years old and has been an employee of the Adviser since April 1985.
PETER M. SULLIVAN, Chief Legal Officer since July 2021 and Vice President and Assistant Secretary since March 2019.
Chief Legal Officer of the Adviser and Associate General Counsel of BNY Mellon since July 2021; Senior Managing Counsel of BNY Mellon from December 2020 to July 2021; Managing Counsel of BNY Mellon from March 2009 to December 2020, and an officer of 57 investment companies (comprised of 130 portfolios) managed by the Adviser or an affiliate of the Adviser. He is 53 years old and has been an employee of BNY Mellon since April 2004.
JAMES BITETTO, Vice President since August 2005 and Secretary since February 2018.
Senior Managing Counsel of BNY Mellon since December 2019; Managing Counsel of BNY Mellon from April 2014 to December 2019; Secretary of the Adviser, and an officer of 57 investment companies (comprised of 130 portfolios) managed by the Adviser or an affiliate of the Adviser. He is 55 years old and has been an employee of the Adviser since December 1996.
DEIRDRE CUNNANE, Vice President and Assistant Secretary since March 2019.
Managing Counsel of BNY Mellon since December 2021, Counsel of BNY Mellon from August 2018 to December 2021; and Senior Regulatory Specialist at BNY Mellon Investment Management Services from February 2016 to August 2018. She is an officer of 57 investment companies (comprised of 130 portfolios) managed by the Adviser or an affiliate of the Adviser. She is 31 years old and has been an employee of the Adviser since August 2018.
SARAH S. KELLEHER, Vice President and Assistant Secretary since April 2014.
Vice President of BNY Mellon ETF Investment Adviser; LLC since February 2020; Senior Managing Counsel of BNY Mellon since September 2021; Managing Counsel of BNY Mellon from December 2017 to September 2021; and Senior Counsel of BNY Mellon from March 2013 to December 2017. She is an officer of 57 investment companies (comprised of 130 portfolios) managed by the Adviser or an affiliate of the Adviser. She is 46 years old and has been an employee of the Adviser since March 2013.
JEFF PRUSNOFSKY, Vice President and Assistant Secretary since August 2005.
Senior Managing Counsel of BNY Mellon, and an officer of 57 investment companies (comprised of 130 portfolios) managed by the Adviser or an affiliate of the Adviser. He is 56 years old and has been an employee of the Adviser since October 1990.
AMANDA QUINN, Vice President and Assistant Secretary since March 2020.
Counsel of BNY Mellon since June 2019; Regulatory Administration Manager at BNY Mellon Investment Management Services from September 2018 to May 2019; and Senior Regulatory Specialist at BNY Mellon Investment Management Services from April 2015 to August 2018. She is an officer of 57 investment companies (comprised of 130 portfolios) managed by the Adviser or an affiliate of the Adviser. She is 36 years old and has been an employee of the Adviser since June 2019.
29
OFFICERS OF THE FUND (Unaudited) (continued)
NATALYA ZELENSKY, Vice President and Assistant Secretary since March 2017.
Chief Compliance Officer since August 2021 and Vice President since February 2020 of BNY Mellon ETF Investment Adviser, LLC; Chief Compliance Officer since August 2021 and Vice President and Assistant Secretary since February 2020 of BNY Mellon ETF Trust; Managing Counsel of BNY Mellon from December 2019 to August 2021; Counsel of BNY Mellon from May 2016 to December 2019; Assistant Secretary of the Adviser from April 2018 to August 2021. She is an officer of 56 investment companies (comprised of 129 portfolios) managed by the Adviser or an affiliate of the Adviser. She is 36 years old and has been an employee of BNY Mellon since May 2016.
GAVIN C. REILLY, Assistant Treasurer since December 2005.
Tax Manager–BNY Mellon Fund Administration, and an officer of 57 investment companies (comprised of 130 portfolios) managed by the Adviser or an affiliate of the Adviser. He is 53 years old and has been an employee of the Adviser since April 1991.
ROBERT SALVIOLO, Assistant Treasurer since July 2007.
Senior Accounting Manager–BNY Mellon Fund Administration, and an officer of 57 investment companies (comprised of 130 portfolios) managed by the Adviser or an affiliate of the Adviser. He is 54 years old and has been an employee of the Adviser since June 1989.
ROBERT SVAGNA, Assistant Treasurer since December 2002.
Senior Accounting Manager–BNY Mellon Fund Administration, and an officer of 57 investment companies (comprised of 130 portfolios) managed by the Adviser or an affiliate of the Adviser. He is 54 years old and has been an employee of the Adviser since November 1990.
JOSEPH W. CONNOLLY, Chief Compliance Officer since October 2004.
Chief Compliance Officer of the BNY Mellon Family of Funds and BNY Mellon Funds Trust since 2004; Chief Compliance Officer of the Adviser from 2004 until June 2021. He is an officer of 56 investment companies (comprised of 117 portfolios) managed by the Adviser. He is 64 years old.
CARIDAD M. CAROSELLA, Anti-Money Laundering Compliance Officer since January 2016.
Anti-Money Laundering Compliance Officer of the BNY Mellon Family of Funds and BNY Mellon Funds Trust. She is an officer of 49 investment companies (comprised of 122 portfolios) managed by the Adviser or an affiliate of the Adviser. She is 53 years old and has been an employee of the Distributor since 1997.
30
This page intentionally left blank.
31
This page intentionally left blank.
32
This page intentionally left blank.
33
BNY Mellon Variable Investment Fund, Appreciation Portfolio
240 Greenwich Street
New York, NY 10286
Adviser
BNY Mellon Investment Adviser, Inc.
240 Greenwich Street
New York, NY 10286
Sub-Adviser
Fayez Sarofim & Co.
Two Houston Center
Suite 2907
Houston, TX 77010
Custodian
The Bank of New York Mellon
240 Greenwich Street
New York, NY 10286
Transfer Agent &
Dividend Disbursing Agent
BNY Mellon Transfer, Inc.
240 Greenwich Street
New York, NY 10286
Distributor
BNY Mellon Securities Corporation
240 Greenwich Street
New York, NY 10286
Telephone 1-800-258-4260 or 1-800-258-4261
Mail The BNY Mellon Family of Funds, 144 Glenn Curtiss Boulevard, Uniondale, NY 11556-0144 Attn: Institutional Services Department
E-mail Send your request to info@bnymellon.com
Internet Information can be viewed online or downloaded at www.im.bnymellon.com
The fund files its complete schedule of portfolio holdings with the Securities and Exchange Commission (“SEC”) for the first and third quarters of each fiscal year on Form N-PORT. The fund’s Forms N-PORT are available on the SEC’s website at www.sec.gov.
A description of the policies and procedures that the fund uses to determine how to vote proxies relating to portfolio securities and information regarding how the fund voted these proxies for the most recent 12-month period ended June 30 is available at www.im.bnymellon.com and on the SEC’s website at www.sec.gov and without charge, upon request, by calling 1-800-373-9387.
| | |
© 2022 BNY Mellon Securities Corporation
0112AR1221 | 
|
BNY Mellon Variable Investment Fund, Government Money Market Portfolio
| |
ANNUAL REPORT December 31, 2021 |

| |
Save time. Save paper. View your next shareholder report online as soon as it’s available. Log into www.im.bnymellon.com and sign up for eCommunications. It’s simple and only takes a few minutes. |
| |
The views expressed in this report reflect those of the portfolio manager(s) only through the end of the period covered and do not necessarily represent the views of BNY Mellon Investment Adviser, Inc. or any other person in the BNY Mellon Investment Adviser, Inc. organization. Any such views are subject to change at any time based upon market or other conditions and BNY Mellon Investment Adviser, Inc. disclaims any responsibility to update such views. These views may not be relied on as investment advice and, because investment decisions for a fund in the BNY Mellon Family of Funds are based on numerous factors, may not be relied on as an indication of trading intent on behalf of any fund in the BNY Mellon Family of Funds. |
| |
Not FDIC-Insured • Not Bank-Guaranteed • May Lose Value |
Contents
T H E F U N D
F O R M O R E I N F O R M AT I O N
Back Cover
UNDERSTANDING YOUR FUND’S EXPENSES (Unaudited)
As a mutual fund investor, you pay ongoing expenses, such as management fees and other expenses. Using the information below, you can estimate how these expenses affect your investment and compare them with the expenses of other funds. You also may pay one-time transaction expenses, including sales charges (loads), redemption fees and expenses associated with variable annuity or insurance contracts, which are not shown in this section and would have resulted in higher total expenses. For more information, see your fund’s prospectus or talk to your financial adviser.
Review your fund’s expenses
The table below shows the expenses you would have paid on a $1,000 investment in BNY Mellon Variable Investment Fund, Government Money Market Portfolio from July 1, 2021 to December 31, 2021. It also shows how much a $1,000 investment would be worth at the close of the period, assuming actual returns and expenses.
| | | | |
Expenses and Value of a $1,000 Investment | |
Assume actual returns for the six months ended December 31, 2021 | |
| | | |
| | | |
Expenses paid per $1,000† | $.25 | |
Ending value (after expenses) | $1,000.10 | |
COMPARING YOUR FUND’S EXPENSES
WITH THOSE OF OTHER FUNDS (Unaudited)
Using the SEC’s method to compare expenses
The Securities and Exchange Commission (“SEC”) has established guidelines to help investors assess fund expenses. Per these guidelines, the table below shows your fund’s expenses based on a $1,000 investment, assuming a hypothetical 5% annualized return. You can use this information to compare the ongoing expenses (but not transaction expenses or total cost) of investing in the fund with those of other funds. All mutual fund shareholder reports will provide this information to help you make this comparison. Please note that you cannot use this information to estimate your actual ending account balance and expenses paid during the period.
| | | | |
Expenses and Value of a $1,000 Investment | |
Assuming a hypothetical 5% annualized return for the six months ended December 31, 2021 | |
| | | |
| | | |
Expenses paid per $1,000† | $.26 | |
Ending value (after expenses) | $1,024.95 | |
† | Expenses are equal to the fund’s annualized expense ratio of .05%, multiplied by the average account value over the period, multiplied by 184/365 (to reflect the one-half year period). |
2
STATEMENT OF INVESTMENTS
December 31, 2021
| | | | | | | |
| |
U.S. Government Agencies Obligations - 6.9% | Annualized
Yield (%) | | Principal
Amount ($) | | Value ($) | |
Federal Farm Credit Banks: | | | | | |
1/18/2022 | 0.05 | | 2,000,000 | a | 1,999,953 | |
5/25/2022 | 0.07 | | 5,000,000 | a | 4,998,600 | |
1/3/2022, 3 Month SOFR +.04% | 0.09 | | 5,000,000 | b | 5,000,000 | |
Federal Home Loan Banks: | | | | | |
1/3/2022, 3 Month SOFR +.04% | 0.09 | | 3,000,000 | b | 3,000,000 | |
Federal National Mortgage Association: | | | | | |
1/3/2022, 3 Month SOFR +.19% | 0.24 | | 5,000,000 | b,c | 5,000,000 | |
Total U.S. Government Agencies Obligations (cost $19,998,553) | | | | | 19,998,553 | |
U.S. Cash Management Bills - 18.0% |
| |
| | | |
1/25/2022 | 0.04 | | 28,000,000 | a | 27,999,253 | |
2/15/2022 | 0.05 | | 10,000,000 | a | 9,999,375 | |
2/22/2022 | 0.05 | | 14,000,000 | a | 13,998,989 | |
Total U.S. Cash Management Bills (cost $51,997,617) | | | | | 51,997,617 | |
U.S. Treasury Bills - 23.1% |
| |
| | | |
1/13/2022 | 0.04 | | 50,000,000 | a | 49,999,333 | |
3/24/2022 | 0.08 | | 10,000,000 | a | 9,998,292 | |
6/2/2022 | 0.10 | | 5,000,000 | a | 4,997,889 | |
12/1/2022 | 0.23 | | 2,000,000 | a | 1,995,732 | |
Total U.S. Treasury Bills (cost $66,991,246) | | | | | 66,991,246 | |
U.S. Treasury Floating Rate Notes - 5.9% |
| |
| | | |
1/4/2022, 3 Month U.S. T-BILL +.03% | 0.12 | | 10,000,000 | b | 10,000,000 | |
1/4/2022, 3 Month U.S. T-BILL +.06% | 0.14 | | 7,000,000 | b | 7,000,471 | |
Total U.S. Treasury Floating Rate Notes (cost $17,000,471) | | | | | 17,000,471 | |
U.S. Treasury Notes - 1.7% |
| |
| | | |
9/30/2022
(cost $4,993,715) | 0.13 | | 5,000,000 | | 4,993,715 | |
Repurchase Agreements - 43.5% |
| |
| | | |
ABN Amro Bank, Tri-Party Agreement thru BNY Mellon, dated 12/31/2021, due at 1/3/2022 in the amount of $40,000,167 (fully collateralized by: U.S. Treasuries (including strips), 1.38%-3.38%, due 8/15/2024-2/15/2051, valued at $40,800,006) | 0.05 | | 40,000,000 | | 40,000,000 | |
3
STATEMENT OF INVESTMENTS (continued)
| | | | | | | |
| |
Repurchase Agreements - 43.5%(continued) | Annualized
Yield (%) | | Principal
Amount ($) | | Value ($) | |
Bank of Montreal, Tri-Party Agreement thru BNY Mellon, dated 12/31/2021, due at 1/3/2022 in the amount of $30,000,125 (fully collateralized by: Federal Home Loan Mortgage Corp Agency Collateralized Mortgage Obligation, 0.41%-11.74%, due 2/15/2027-5/15/2049, Federal Home Loan Mortgage Corp Agency Debentures and Agency Strips, 1.50%-6.25%, due 6/25/2032-11/25/2051, Federal National Mortgage Association Agency Collateralized Mortgage Obligation, 0.04%-6.50%, due 1/25/2023-10/25/2060, Federal National Mortgage Association Agency Debentures and Agency Strips, 3.50%, due 11/1/2044, Federal National Mortgage Association Agency Mortgage-Backed Securities, 0.70%, due 11/25/2024, Government National Mortgage Association Agency Collateralized Mortgage Obligation, 0.36%-6.20%, due 6/16/2028-5/20/2069, valued at $32,392,445) | 0.05 | | 30,000,000 | | 30,000,000 | |
Credit Agricole CIB, Tri-Party Agreement thru BNY Mellon, dated 12/31/2021, due at 1/3/2022 in the amount of $6,000,025 (fully collateralized by: U.S. Treasuries (including strips), 0.13%-2.63%, due 9/30/2022-11/15/2029, valued at $6,120,000) | 0.05 | | 6,000,000 | | 6,000,000 | |
4
| | | | | | | |
| |
Repurchase Agreements - 43.5%(continued) | Annualized
Yield (%) | | Principal
Amount ($) | | Value ($) | |
Fixed Income Clearing, Tri-Party Agreement thru State Street, dated 12/31/2021, due at 1/3/2022 in the amount of $50,000,208 (fully collateralized by: U.S. Treasuries (including strips), 4.50%, due 5/15/2038, valued at $51,000,080) | 0.05 | | 50,000,000 | | 50,000,000 | |
Total Repurchase Agreements (cost $126,000,000) | | | | | 126,000,000 | |
Total Investments (cost $286,981,602) | | 99.1% | | 286,981,602 | |
Cash and Receivables (Net) | | .9% | | 2,497,719 | |
Net Assets | | 100.0% | | 289,479,321 | |
SOFR—Secured Overnight Financing Rate
U.S. T-BILL—U.S. Treasury Bill Money Market Yield
a Security is a discount security. Income is recognized through the accretion of discount.
b Variable rate security—interest rate resets periodically and rate shown is the interest rate in effect at period end. Date shown represents the earlier of the next interest reset date or ultimate maturity date. Security description also includes the reference rate and spread if published and available.
c The Federal Housing Finance Agency (“FHFA”) placed the Federal Home Loan Mortgage Corporation and Federal National Mortgage Association into conservatorship with FHFA as the conservator. As such, the FHFA oversees the continuing affairs of these companies.
| | |
Portfolio Summary (Unaudited) † | Value (%) |
U.S. Treasury Securities | 48.7 |
Repurchase Agreements | 43.5 |
U.S. Government Agencies Obligations | 6.9 |
| | 99.1 |
† Based on net assets.
See notes to financial statements.
5
STATEMENT OF ASSETS AND LIABILITIES
December 31, 2021
| | | | | | | |
| | | | | | |
| | | Cost | | Value | |
Assets ($): | | | | |
Investments in securities—See Statement of Investments
(including repurchase agreements of $126,000,000)
—Note 1(b) | 286,981,602 | | 286,981,602 | |
Cash | | | | | 2,559,150 | |
Receivable for shares of Beneficial Interest subscribed | | 28,671 | |
Interest receivable | | 9,311 | |
Prepaid expenses | | | | | 1,277 | |
| | | | | 289,580,011 | |
Liabilities ($): | | | | |
Due to BNY Mellon Investment Adviser, Inc. and affiliates—Note 2(b) | | 5,687 | |
Payable for shares of Beneficial Interest redeemed | | 41,670 | |
Trustees’ fees and expenses payable | | 670 | |
Other accrued expenses | | | | | 52,663 | |
| | | | | 100,690 | |
Net Assets ($) | | | 289,479,321 | |
Composition of Net Assets ($): | | | | |
Paid-in capital | | | | | 289,480,919 | |
Total distributable earnings (loss) | | | | | (1,598) | |
Net Assets ($) | | | 289,479,321 | |
| | | | | |
Shares Outstanding | | |
(unlimited number of $.001 par value shares of Beneficial Interest authorized) | 289,449,645 | |
Net Asset Value Per Share ($) | | 1.00 | |
| | | | |
See notes to financial statements. | | | | |
6
STATEMENT OF OPERATIONS
Year Ended December 31, 2021
| | | | | | | |
| | | | | | |
| | | | | | |
Investment Income ($): | | | | |
Interest Income | | | 158,307 | |
Expenses: | | | | |
Investment advisory fee—Note 2(a) | | | 1,429,029 | |
Professional fees | | | 95,986 | |
Chief Compliance Officer fees—Note 2(b) | | | 14,276 | |
Trustees’ fees and expenses—Note 2(c) | | | 13,843 | |
Custodian fees—Note 2(b) | | | 12,561 | |
Prospectus and shareholders’ reports | | | 11,813 | |
Shareholder servicing costs—Note 2(b) | | | 579 | |
Miscellaneous | | | 6,834 | |
Total Expenses | | | 1,584,921 | |
Less—reduction in expenses due to undertaking—Note 2(a) | | | (1,455,243) | |
Net Expenses | | | 129,678 | |
Investment Income—Net, representing net increase in
net assets resulting from operations | | | 28,629 | |
| | | | | | |
See notes to financial statements. | | | | | |
7
STATEMENT OF CHANGES IN NET ASSETS
| | | | | | | | | | |
| | | | Year Ended December 31, |
| | | | 2021 | | 2020 | |
Operations ($): | | | | | | | | |
Investment Income—Net, representing net
increase in net assets resulting from operations | 28,629 | | | | 414,281 | |
Distributions ($): | |
Distributions to shareholders | | | (28,629) | | | | (414,281) | |
Beneficial Interest Transactions ($1.00 per share): | |
Net proceeds from shares sold | | | 1,152,356,151 | | | | 889,695,845 | |
Distributions reinvested | | | 28,629 | | | | 414,281 | |
Cost of shares redeemed | | | (1,104,175,296) | | | | (830,774,471) | |
Increase (Decrease) in Net Assets
from Beneficial Interest Transactions | 48,209,484 | | | | 59,335,655 | |
Total Increase (Decrease) in Net Assets | 48,209,484 | | | | 59,335,655 | |
Net Assets ($): | |
Beginning of Period | | | 241,269,837 | | | | 181,934,182 | |
End of Period | | | 289,479,321 | | | | 241,269,837 | |
| | | | | | | | | |
See notes to financial statements. | | | | | | | | |
8
FINANCIAL HIGHLIGHTS
The following table describes the performance for the fiscal periods indicated. Net asset value total return is calculated assuming an initial investment made at the net asset value at the beginning of the period, reinvestment of all dividends and distributions at net asset value during the period, and redemption at net asset value on the last day of the period. Net asset value total return includes adjustments in accordance with accounting principles generally accepted in the United States of America and as such, the net asset value for financial reporting purposes and the returns based upon those net asset values may differ from the net asset value and returns for shareholder transactions. The fund’s total returns do not reflect expenses associated with variable annuity or insurance contracts. These figures have been derived from the fund’s financial statements.
| | | | | | | | | | | |
| | | | | |
| | |
| | Year Ended December 31, |
| | 2021 | 2020 | 2019 | 2018 | 2017 |
Per Share Data ($): | | | | | | |
Net asset value, beginning of period | | 1.00 | 1.00 | 1.00 | 1.00 | 1.00 |
Investment Operations: | | | | | | |
Investment income—net | | .000a | .002 | .017 | .013 | .003 |
Distributions: | | | | | | |
Dividends from
investment income—net | | (.000)a | (.002) | (.017) | (.013) | (.003) |
Net asset value, end of period | | 1.00 | 1.00 | 1.00 | 1.00 | 1.00 |
Total Return (%) | | .01 | .21 | 1.67 | 1.28 | .34 |
Ratios/Supplemental Data (%): | | | | | | |
Ratio of total expenses
to average net assets | | .55 | .56 | .58 | .58 | .58 |
Ratio of net expenses
to average net assets | | .05 | .26 | .57 | .58 | .57 |
Ratio of net investment income
to average net assets | | .01 | .17 | 1.65 | 1.26 | .37 |
Net Assets, end of period ($ x 1,000) | | 289,479 | 241,270 | 181,934 | 181,596 | 196,347 |
a Amount represents less than $.001 per share.
See notes to financial statements.
9
NOTES TO FINANCIAL STATEMENTS
NOTE 1—Significant Accounting Policies:
Government Money Market Portfolio (the “fund”) is a separate diversified series of BNY Mellon Variable Investment Fund (the “Trust”), which is registered under the Investment Company Act of 1940, as amended (the “Act”), as an open-end management investment company and operates as a series company currently offering four series, including the fund. The fund is only offered to separate accounts established by insurance companies to fund variable annuity contracts and variable life insurance policies. The fund’s investment objective is to seek as high a level of current income as is consistent with the preservation of capital and the maintenance of liquidity. The fund is managed by Dreyfus Cash Investment Strategies, a division of BNY Mellon Investment Adviser, Inc. (the “Adviser”), the fund’s investment adviser and a wholly-owned subsidiary of The Bank of New York Mellon Corporation (“BNY Mellon”). BNY Mellon Securities Corporation (the “Distributor”), a wholly-owned subsidiary of BNY Mellon, is the distributor of the fund’s shares, which are sold to the public without a sales charge.
The fund operates as a “government money market fund” as that term is defined in Rule 2a-7 under the Act. It is the fund’s policy to maintain a constant net asset value (“NAV”) per share of $1.00 and the fund has adopted certain investment, portfolio valuation and dividend and distribution policies to enable it to do so. There is no assurance, however, that the fund will be able to maintain a constant NAV per share of $1.00.
The Trust accounts separately for the assets, liabilities and operations of each series. Expenses directly attributable to each series are charged to that series’ operations; expenses which are applicable to all series are allocated among them on a pro rata basis.
The Financial Accounting Standards Board (“FASB”) Accounting Standards Codification (“ASC”) is the exclusive reference of authoritative U.S. generally accepted accounting principles (“GAAP”) recognized by the FASB to be applied by nongovernmental entities. Rules and interpretive releases of the SEC under authority of federal laws are also sources of authoritative GAAP for SEC registrants. The fund is an investment company and applies the accounting and reporting guidance of the FASB ASC Topic 946 Financial Services-Investment Companies. The fund’s financial statements are prepared in accordance with GAAP, which may require the use of management estimates and assumptions. Actual results could differ from those estimates.
The Trust enters into contracts that contain a variety of indemnifications. The fund’s maximum exposure under these arrangements is unknown. The
10
fund does not anticipate recognizing any loss related to these arrangements.
(a) Portfolio valuation: Investments in securities are valued at amortized cost in accordance with Rule 2a-7 under the Act. If amortized cost is determined not to approximate fair market value, the fair value of the portfolio securities will be determined by procedures established by and under the general oversight of the Trust’s Board of Trustees (the “Board”).
The fair value of a financial instrument is the amount that would be received to sell an asset or paid to transfer a liability in an orderly transaction between market participants at the measurement date (i.e., the exit price). GAAP establishes a fair value hierarchy that prioritizes the inputs of valuation techniques used to measure fair value. This hierarchy gives the highest priority to unadjusted quoted prices in active markets for identical assets or liabilities (Level 1 measurements) and the lowest priority to unobservable inputs (Level 3 measurements).
Additionally, GAAP provides guidance on determining whether the volume and activity in a market has decreased significantly and whether such a decrease in activity results in transactions that are not orderly. GAAP requires enhanced disclosures around valuation inputs and techniques used during annual and interim periods.
Various inputs are used in determining the value of the fund’s investments relating to fair value measurements. These inputs are summarized in the three broad levels listed below:
Level 1—unadjusted quoted prices in active markets for identical investments.
Level 2—other significant observable inputs (including quoted prices for similar investments, interest rates, prepayment speeds, credit risk, etc.).
Level 3—significant unobservable inputs (including the fund’s own assumptions in determining the fair value of investments).
The inputs or methodology used for valuing securities are not necessarily an indication of the risk associated with investing in those securities. For example, money market securities are valued using amortized cost, in accordance with rules under the Act. Generally, amortized cost approximates the current fair value of a security, but since the value is not obtained from a quoted price in an active market, such securities are reflected within Level 2 of the fair value hierarchy.
11
NOTES TO FINANCIAL STATEMENTS (continued)
The following is a summary of the inputs used as of December 31, 2021 in valuing the fund’s investments:
| | | | | | | |
| | Level 1-Unadjusted Quoted Prices | Level 2- Other Significant Observable Inputs | | Level 3-Significant Unobservable Inputs | Total | |
Assets ($) | | |
Investments in Securities:† | | |
Short-Term Investments | - | 286,981,602 | | - | 286,981,602 | |
† See Statement of Investments for additional detailed categorizations, if any.
(b) Securities transactions and investment income: Securities transactions are recorded on a trade date basis. Interest income, adjusted for accretion of discount and amortization of premium on investments, is earned from settlement date and is recognized on the accrual basis. Realized gains and losses from securities transactions are recorded on the identified cost basis.
The fund may enter into repurchase agreements with financial institutions, deemed to be creditworthy by the Adviser, subject to the seller’s agreement to repurchase and the fund’s agreement to resell such securities at a mutually agreed upon price. Pursuant to the terms of the repurchase agreement, such securities must have an aggregate market value greater than or equal to the terms of the repurchase price plus accrued interest at all times. If the value of the underlying securities falls below the value of the repurchase price plus accrued interest, the fund will require the seller to deposit additional collateral by the next business day. If the request for additional collateral is not met, or the seller defaults on its repurchase obligation, the fund maintains its right to sell the underlying securities at market value and may claim any resulting loss against the seller. The collateral is held on behalf of the fund by the tri-party administrator with respect to any tri-party agreement. The fund may also jointly enter into one or more repurchase agreements with other funds managed by the Adviser in accordance with an exemptive order granted by the SEC pursuant to section 17(d) and Rule 17d-1 under the Act. Any joint repurchase agreements must be collateralized fully by U.S. Government securities.
(c) Risk: Certain events particular to the industries in which the fund’s investments conduct their operations, as well as general economic, political and public health conditions, may have a significant negative impact on the investee’s operations and profitability. In addition, turbulence in financial markets and reduced liquidity in equity, credit and/or fixed income markets may negatively affect many issuers, which could adversely affect the fund. Global economies and financial markets are becoming
12
increasingly interconnected, and conditions and events in one country, region or financial market may adversely impact issuers in a different country, region or financial market. These risks may be magnified if certain events or developments adversely interrupt the global supply chain; in these and other circumstances, such risks might affect companies world-wide. Recent examples include pandemic risks related to COVID-19 and aggressive measures taken world-wide in response by governments, including closing borders, restricting international and domestic travel, and the imposition of prolonged quarantines of large populations, and by businesses, including changes to operations and reducing staff. The effects of COVID-19 have contributed to increased volatility in global markets and will likely affect certain countries, companies, industries and market sectors more dramatically than others. The COVID-19 pandemic has had, and any other outbreak of an infectious disease or other serious public health concern could have, a significant negative impact on economic and market conditions and could trigger a prolonged period of global economic slowdown. To the extent the fund may overweight its investments in certain countries, companies, industries or market sectors, such positions will increase the fund’s exposure to risk of loss from adverse developments affecting those countries, companies, industries or sectors.
(d) Dividends and distributions to shareholders: It is the policy of the fund to declare dividends daily from investment income-net. Such dividends are paid monthly. Dividends from net realized capital gains, if any, are normally declared and paid annually, but the fund may make distributions on a more frequent basis to comply with the distribution requirements of the Internal Revenue Code of 1986, as amended (the “Code”). To the extent that net realized capital gains can be offset by capital loss carryovers, it is the policy of the fund not to distribute such gains.
(e) Federal income taxes: It is the policy of the fund to continue to qualify as a regulated investment company, if such qualification is in the best interests of its shareholders, by complying with the applicable provisions of the Code, and to make distributions of taxable income and net realized capital gain sufficient to relieve it from substantially all federal income and excise taxes.
As of and during the period ended December 31, 2021, the fund did not have any liabilities for any uncertain tax positions. The fund recognizes interest and penalties, if any, related to uncertain tax positions as income tax expense in the Statement of Operations. During the period ended December 31, 2021, the fund did not incur any interest or penalties.
13
NOTES TO FINANCIAL STATEMENTS (continued)
Each tax year in the four-year period ended December 31, 2021 remains subject to examination by the Internal Revenue Service and state taxing authorities.
At December 31, 2021, the components of total distributable earnings (loss) on a tax basis were substantially the same as for financial reporting purposes.
The fund is permitted to carry forward capital losses for an unlimited period. Furthermore, capital loss carryovers retain their character as either short-term or long-term capital losses.
The accumulated capital loss carryover is available for federal income tax purposes to be applied against future net realized capital gains, if any, realized subsequent to December 31, 2021. The fund has $1,598 of short-term capital losses which can be carried forward for an unlimited period.
The tax character of distributions paid to shareholders during the fiscal periods ended December 31, 2021 and December 31, 2020 were all ordinary income.
At December 31, 2021, the cost of investments for federal income tax purposes was substantially the same as the cost for financial reporting purposes (see the Statement of Investments).
(f) New accounting pronouncements: In March 2020, the FASB issued Accounting Standards Update 2020-04, Reference Rate Reform (Topic 848): Facilitation of the Effects of Reference Rate Reform on Financial Reporting (“ASU 2020-04”), and in January 2021, the FASB issued Accounting Standards Update 2021-01, Reference Rate Reform (Topic 848): Scope (“ASU 2021-01”), which provides optional, temporary relief with respect to the financial reporting of contracts subject to certain types of modifications due to the planned discontinuation of the London Interbank Offered Rate (“LIBOR”) and other interbank offered rates as of the end of 2021. The temporary relief provided by ASU 2020-04 and ASU 2021-01 is effective for certain reference rate-related contract modifications that occur during the period from March 12, 2020 through December 31, 2022. Management is evaluating the impact of ASU 2020-04 and ASU 2021-01 on the fund’s investments, derivatives, debt and other contracts that will undergo reference rate-related modifications as a result of the reference rate reform. Management is also currently actively working with other financial institutions and counterparties to modify contracts as required by applicable regulation and within the regulatory deadlines.
14
NOTE 2―Investment Adivsory Fee and Other Transactions with Affiliates:
(a) Pursuant to an investment advisory agreement with the Adviser, the investment advisory fee is computed at the annual rate of .50% of the value of the fund’s average daily net assets and is payable monthly.
The Adviser has undertaken to waive receipt of the investment advisory fee and/or reimburse operating expenses in order to facilitate a daily yield at or above a certain level which may change from time to time. This undertaking is voluntary and not contractual, and may be terminated at any time. The reduction in expenses, pursuant to the undertaking, amounted to $1,455,243 during the period ended December 31, 2021.
(b) The fund has an arrangement with the transfer agent whereby the fund may receive earnings credits when positive cash balances are maintained, which are used to offset transfer agency fees. For financial reporting purposes, the fund includes net earnings credits, if any, as shareholder servicing costs in the Statement of Operations.
The fund has an arrangement with the custodian whereby the fund will receive interest income or be charged overdraft fees when cash balances are maintained. For financial reporting purposes, the fund includes this interest income and overdraft fees, if any, as interest income in the Statement of Operations.
The fund compensates BNY Mellon Transfer, Inc., a wholly-owned subsidiary of the Adviser, under a transfer agency agreement for providing transfer agency and cash management services inclusive of earnings credits, if any, for the fund. The majority of transfer agency fees are comprised of amounts paid on a per account basis, while cash management fees are related to fund subscriptions and redemptions. During the period ended December 31, 2021, the fund was charged $475 for transfer agency services, inclusive of earnings credit, if any. These fees are included in Shareholder servicing costs in the Statement of Operations.
The fund compensates The Bank of New York Mellon, a subsidiary of BNY Mellon and an affiliate of the Adviser, under a custody agreement for providing custodial services for the fund. These fees are determined based on net assets, geographic region and transaction activity. During the period ended December 31, 2021, the fund was charged $12,561 pursuant to the custody agreement.
During the period ended December 31, 2021, the fund was charged $14,276 for services performed by the Chief Compliance Officer and his
15
NOTES TO FINANCIAL STATEMENTS (continued)
staff. These fees are included in Chief Compliance Officer fees in the Statement of Operations.
The components of “Due to BNY Mellon Investment Adviser, Inc. and affiliates” in the Statement of Assets and Liabilities consist of: investment advisory fees of $117,605, custodian fees of $3,938, Chief Compliance Officer fees of $3,627 and transfer agency fees of $102, which are offset against an expense reimbursement currently in effect in the amount of $119,585.
(c) Each Board member also serves as a Board member of other funds in the BNY Mellon Family of Funds complex. Annual retainer fees and attendance fees are allocated to each fund based on net assets.
16
REPORT OF INDEPENDENT REGISTERED PUBLIC ACCOUNTING FIRM
To the Shareholders and the Board of Trustees of Government Money Market Portfolio
Opinion on the Financial Statements
We have audited the accompanying statement of assets and liabilities of Government Money Market Portfolio (the “Fund”) (one of the funds constituting BNY Mellon Variable Investment Fund), including the statement of investments, as of December 31, 2021, and the related statement of operations for the year then ended, the statements of changes in net assets for each of the two years in the period then ended, the financial highlights for each of the five years in the period then ended and the related notes (collectively referred to as the “financial statements”). In our opinion, the financial statements present fairly, in all material respects, the financial position of the Fund (one of the funds constituting BNY Mellon Variable Investment Fund) at December 31, 2021, the results of its operations for the year then ended, the changes in its net assets for each of the two years in the period then ended and its financial highlights for each of the five years in the period then ended, in conformity with U.S. generally accepted accounting principles.
Basis for Opinion
These financial statements are the responsibility of the Fund’s management. Our responsibility is to express an opinion on the Fund’s financial statements based on our audits. We are a public accounting firm registered with the Public Company Accounting Oversight Board (United States) (“PCAOB”) and are required to be independent with respect to the Fund in accordance with the U.S. federal securities laws and the applicable rules and regulations of the Securities and Exchange Commission and the PCAOB.
We conducted our audits in accordance with the standards of the PCAOB. Those standards require that we plan and perform the audit to obtain reasonable assurance about whether the financial statements are free of material misstatement, whether due to error or fraud. The Fund is not required to have, nor were we engaged to perform, an audit of the Fund’s internal control over financial reporting. As part of our audits, we are required to obtain an understanding of internal control over financial reporting, but not for the purpose of expressing an opinion on the effectiveness of the Fund’s internal control over financial reporting. Accordingly, we express no such opinion.
Our audits included performing procedures to assess the risks of material misstatement of the financial statements, whether due to error or fraud, and performing procedures that respond to those risks. Such procedures included examining, on a test basis, evidence regarding the amounts and disclosures in the financial statements. Our procedures included confirmation of securities owned as of December 31, 2021, by correspondence with the custodian and others or by other appropriate auditing procedures where replies from others were not received. Our audits also included evaluating the accounting principles used and significant estimates made by management, as well as evaluating the overall presentation of the financial statements. We believe that our audits provide a reasonable basis for our opinion.

We have served as the auditor of one or more investment companies in the BNY Mellon Family of Funds since at least 1957, but we are unable to determine the specific year.
New York, New York
February 8, 2022
17
BOARD MEMBERS INFORMATION (Unaudited)
Independent Board Members
Joseph S. DiMartino (78)
Chairman of the Board (1995)
Principal Occupation During Past 5 Years:
· Director or Trustee of funds in the BNY Mellon Family of Funds and certain other entities (as described in the fund’s Statement of Additional Information) (1995-Present)
Other Public Company Board Memberships During Past 5 Years:
· CBIZ, Inc., a public company providing professional business services, products and solutions, Director (1997-Present)
No. of Portfolios for which Board Member Serves: 96
———————
Peggy C. Davis (78)
Board Member (2006)
Principal Occupation During Past 5 Years:
· Shad Professor of Law, New York University School of Law (1983-Present)
No. of Portfolios for which Board Member Serves: 34
———————
Gina D. France (63)
Board Member (2019)
Principal Occupation During Past 5 Years:
· France Strategic Partners, a strategy and advisory firm serving corporate clients across the United States, Founder, President and Chief Executive Officer (2003-Present)
Other Public Company Board Memberships During Past 5 Years:
· Huntington Bancshares, a bank holding company headquartered in Columbus, Ohio, Director (2016-Present)
· Cedar Fair, L.P., a publicly-traded partnership that owns and operates amusement parks and hotels in the U.S. and Canada, Director (2011-Present)
· CBIZ, Inc., a public company providing professional business services, products and solutions, Director (2015-Present)
· FirstMerit Corporation, a diversified financial services company, Director (2004-2016)
No. of Portfolios for which Board Member Serves: 24
———————
Joan Gulley (74)
Board Member (2017)
Principal Occupation During Past 5 Years:
· Nantucket Atheneum, public library, Chair (2018-June 2021) and Director (2015-June 2021)
· Orchard Island Club, golf and beach club, Governor (2016-Present)
No. of Portfolios for which Board Member Serves: 42
———————
18
Robin A. Melvin (58)
Board Member (2012)
Principal Occupation During Past 5 Years:
· Westover School, a private girls’ boarding school in Middlebury, Connecticut, Trustee (2019-Present)
· Mentor Illinois, a non-profit organization dedicated to increasing the quality of mentoring services in Illinois, Co-Chair (2014–2020); Board Member, Mentor Illinois (2013-2020)
· JDRF, a non-profit juvenile diabetes research foundation, Board Member (June 2021-Present)
Other Public Company Board Memberships During Past 5 Years:
· HPS Corporate Lending Fund, a closed-end management investment company regulated as a business development company, Trustee (August 2021-Present)
No. of Portfolios for which Board Member Serves: 74
———————
Once elected all Board Members serve for an indefinite term, but achieve Emeritus status upon reaching age 80. The address of the Board Members and Officers is c/o BNY Mellon Investment Adviser, Inc. 240 Greenwich Street, New York, New York 10286. Additional information about the Board Members is available in the fund’s Statement of Additional Information which can be obtained from the Adviser free of charge by calling this toll free number: 1-800-373-9387.
David P. Feldman, Emeritus Board Member
Ehud Houminer, Emeritus Board Member
Lynn Martin, Emeritus Board Member
Dr. Martin Peretz, Emeritus Board Member
Philip L. Toia, Emeritus Board Member
19
OFFICERS OF THE FUND (Unaudited)
DAVID DIPETRILLO, President since January 2021.
Vice President and Director of the Adviser since February 2021; Head of North America Product, BNY Mellon Investment Management since January 2018; Director of Product Strategy, BNY Mellon Investment Management from January 2016 to December 2017. He is an officer of 56 investment companies (comprised of 109 portfolios) managed by the Adviser or an affiliate of the Adviser. He is 43 years old and has been an employee of BNY Mellon since 2005.
JAMES WINDELS, Treasurer since November 2001.
Vice President of the Adviser since September 2020; Director–BNY Mellon Fund Administration, and an officer of 57 investment companies (comprised of 130 portfolios) managed by the Adviser or an affiliate of the Adviser. He is 63 years old and has been an employee of the Adviser since April 1985.
PETER M. SULLIVAN, Chief Legal Officer since July 2021 and Vice President and Assistant Secretary since March 2019.
Chief Legal Officer of the Adviser and Associate General Counsel of BNY Mellon since July 2021; Senior Managing Counsel of BNY Mellon from December 2020 to July 2021; Managing Counsel of BNY Mellon from March 2009 to December 2020, and an officer of 57 investment companies (comprised of 130 portfolios) managed by the Adviser or an affiliate of the Adviser. He is 53 years old and has been an employee of BNY Mellon since April 2004.
JAMES BITETTO, Vice President since August 2005 and Secretary since February 2018.
Senior Managing Counsel of BNY Mellon since December 2019; Managing Counsel of BNY Mellon from April 2014 to December 2019; Secretary of the Adviser, and an officer of 57 investment companies (comprised of 130 portfolios) managed by the Adviser or an affiliate of the Adviser. He is 55 years old and has been an employee of the Adviser since December 1996.
DEIRDRE CUNNANE, Vice President and Assistant Secretary since March 2019.
Managing Counsel of BNY Mellon since December 2021, Counsel of BNY Mellon from August 2018 to December 2021; and Senior Regulatory Specialist at BNY Mellon Investment Management Services from February 2016 to August 2018. She is an officer of 57 investment companies (comprised of 130 portfolios) managed by the Adviser or an affiliate of the Adviser. She is 31 years old and has been an employee of the Adviser since August 2018.
SARAH S. KELLEHER, Vice President and Assistant Secretary since April 2014.
Vice President of BNY Mellon ETF Investment Adviser; LLC since February 2020; Senior Managing Counsel of BNY Mellon since September 2021; Managing Counsel of BNY Mellon from December 2017 to September 2021; and Senior Counsel of BNY Mellon from March 2013 to December 2017. She is an officer of 57 investment companies (comprised of 130 portfolios) managed by the Adviser or an affiliate of the Adviser. She is 46 years old and has been an employee of the Adviser since March 2013.
JEFF PRUSNOFSKY, Vice President and Assistant Secretary since August 2005.
Senior Managing Counsel of BNY Mellon, and an officer of 57 investment companies (comprised of 130 portfolios) managed by the Adviser or an affiliate of the Adviser. He is 56 years old and has been an employee of the Adviser since October 1990.
AMANDA QUINN, Vice President and Assistant Secretary since March 2020.
Counsel of BNY Mellon since June 2019; Regulatory Administration Manager at BNY Mellon Investment Management Services from September 2018 to May 2019; and Senior Regulatory Specialist at BNY Mellon Investment Management Services from April 2015 to August 2018. She is an officer of 57 investment companies (comprised of 130 portfolios) managed by the Adviser or an affiliate of the Adviser. She is 36 years old and has been an employee of the Adviser since June 2019.
20
NATALYA ZELENSKY, Vice President and Assistant Secretary since March 2017.
Chief Compliance Officer since August 2021 and Vice President since February 2020 of BNY Mellon ETF Investment Adviser, LLC; Chief Compliance Officer since August 2021 and Vice President and Assistant Secretary since February 2020 of BNY Mellon ETF Trust; Managing Counsel of BNY Mellon from December 2019 to August 2021; Counsel of BNY Mellon from May 2016 to December 2019; Assistant Secretary of the Adviser from April 2018 to August 2021. She is an officer of 56 investment companies (comprised of 129 portfolios) managed by the Adviser or an affiliate of the Adviser. She is 36 years old and has been an employee of BNY Mellon since May 2016.
GAVIN C. REILLY, Assistant Treasurer since December 2005.
Tax Manager–BNY Mellon Fund Administration, and an officer of 57 investment companies (comprised of 130 portfolios) managed by the Adviser or an affiliate of the Adviser. He is 53 years old and has been an employee of the Adviser since April 1991.
ROBERT SALVIOLO, Assistant Treasurer since July 2007.
Senior Accounting Manager–BNY Mellon Fund Administration, and an officer of 57 investment companies (comprised of 130 portfolios) managed by the Adviser or an affiliate of the Adviser. He is 54 years old and has been an employee of the Adviser since June 1989.
ROBERT SVAGNA, Assistant Treasurer since December 2002.
Senior Accounting Manager–BNY Mellon Fund Administration, and an officer of 57 investment companies (comprised of 130 portfolios) managed by the Adviser or an affiliate of the Adviser. He is 54 years old and has been an employee of the Adviser since November 1990.
JOSEPH W. CONNOLLY, Chief Compliance Officer since October 2004.
Chief Compliance Officer of the BNY Mellon Family of Funds and BNY Mellon Funds Trust since 2004; Chief Compliance Officer of the Adviser from 2004 until June 2021. He is an officer of 56 investment companies (comprised of 117 portfolios) managed by the Adviser. He is 64 years old.
CARIDAD M. CAROSELLA, Anti-Money Laundering Compliance Officer since January 2016.
Anti-Money Laundering Compliance Officer of the BNY Mellon Family of Funds and BNY Mellon Funds Trust. She is an officer of 49 investment companies (comprised of 122 portfolios) managed by the Adviser or an affiliate of the Adviser. She is 53 years old and has been an employee of the Distributor since 1997.
21
BNY Mellon Variable Investment Fund, Government Money Market Portfolio
240 Greenwich Street
New York, NY 10286
Adviser
BNY Mellon Investment Adviser, Inc.
240 Greenwich Street
New York, NY 10286
Custodian
The Bank of New York Mellon
240 Greenwich Street
New York, NY 10286
Transfer Agent &
Dividend Disbursing Agent
BNY Mellon Transfer, Inc.
240 Greenwich Street
New York, NY 10286
Distributor
BNY Mellon Securities Corporation
240 Greenwich Street
New York, NY 10286
Telephone Call your representative or 1-800-373-9387
Mail BNY Mellon Family of Funds to: BNY Mellon Institutional Services, 144 Glenn Curtiss Boulevard, Uniondale, NY 11556-0144
E-mail Send your request to instserv@bnymellon.com
Internet Access Dreyfus Money Market Funds at www.dreyfus.com
The fund will disclose daily, on www.dreyfus.com, the fund’s complete schedule of holdings as of the end of the previous business day. The schedule of holdings will remain on the website for a period of five months. The fund files a monthly schedule of portfolio holdings with the Securities and Exchange Commission (“SEC”) on Form N-MFP. The fund’s Forms N-MFP are available on the SEC’s website at www.sec.gov.
Information regarding how the fund voted proxies related to portfolio securities for the most recent 12-month period ended June 30 is available at www.dreyfus.com and on the SEC’s website at www.sec.gov and without charge, upon request, by calling 1-800-373-9387
| | |
© 2022 BNY Mellon Securities Corporation
0117AR1221 
| 
|
BNY Mellon Variable Investment Fund, Growth and Income Portfolio
| |
ANNUAL REPORT December 31, 2021 |

| |
Save time. Save paper. View your next shareholder report online as soon as it’s available. Log into www.im.bnymellon.com and sign up for eCommunications. It’s simple and only takes a few minutes. |
| |
The views expressed in this report reflect those of the portfolio manager(s) only through the end of the period covered and do not necessarily represent the views of BNY Mellon Investment Adviser, Inc. or any other person in the BNY Mellon Investment Adviser, Inc. organization. Any such views are subject to change at any time based upon market or other conditions and BNY Mellon Investment Adviser, Inc. disclaims any responsibility to update such views. These views may not be relied on as investment advice and, because investment decisions for a fund in the BNY Mellon Family of Funds are based on numerous factors, may not be relied on as an indication of trading intent on behalf of any fund in the BNY Mellon Family of Funds. |
| |
Not FDIC-Insured • Not Bank-Guaranteed • May Lose Value |
Contents
T H E F U N D
F O R M O R E I N F O R M AT I O N
Back Cover
DISCUSSION OF FUND PERFORMANCE (Unaudited)
For the period from January 1, 2021 through December 31, 2021, as provided by portfolio managers John Bailer, Karen Behr, Brian Ferguson, Keith Howell, David Intoppa and John Porter III of Newton Investment Management North America, LLC, Sub-Investment Adviser
Market and Fund Performance Overview
For the 12-month period ended December 31, 2021, BNY Mellon Variable Investment Fund, Growth and Income Portfolio’s (the “fund”) Initial shares achieved a total return of 25.63%, and its Service shares achieved a total return of 25.31%.1 In comparison, the fund’s benchmark, the S&P 500® Index (the “Index”), produced a total return of 28.70% for the same period.2
U.S. stocks rose during the reporting period as the economy continued to recover from the COVID-19 pandemic. The fund underperformed the Index largely due to unfavorable selections in the information technology and consumer discretionary sectors.
The Fund’s Investment Approach
The fund seeks long-term capital growth, current income and growth of income, consistent with reasonable investment risk. To pursue its goal, the fund normally invests primarily in stocks of domestic and foreign issuers. We seek to create a portfolio that includes a blend of growth and dividend-paying stocks, as well as other investments that provide income. We choose stocks through a disciplined investment process that combines computer-modeling techniques, “bottom-up” fundamental analysis and risk management. The investment process is designed to provide investors with investment exposure to sector weightings and risk characteristics similar to those of the Index.
In selecting securities, we seek companies that possess some or all of the following characteristics: growth of earnings potential; operating margin improvement; revenue growth prospects; business improvement; good business fundamentals; dividend yield consistent with the fund’s strategy pertaining to income; value, or how a stock is priced relative to its perceived intrinsic worth; and healthy financial profile, which measures the financial well-being of the company.
The fund may use listed equity options to seek to enhance and/or mitigate risk. The fund will engage in “covered” option transactions where the fund has in its possession, for the duration of the strategy, the underlying physical asset or cash to satisfy any obligation the fund may have with respect to the option strategy.
Stocks Weather COVID-19 Variants, Supply Bottlenecks, Inflation and Monetary Policy
Markets performed well during the reporting period, supported generally by strong corporate earnings. Early in the period, stocks benefited from the approval of multiple COVID-19 vaccines in November 2020, which brightened the global economic outlook and improved investor sentiment. Investors also factored the likelihood of additional stimulus and infrastructure spending into their calculations. Returns were also boosted by interest rates, which remained low.
With the end of the pandemic apparently in view early in 2021, government lockdowns were eased, and businesses that had been hard hit by the pandemic began to show signs of recovery. Businesses also became more confident and increased their capital spending. With continued economic rebound likely, investors began to shift away from growth-oriented stocks and into value-oriented stocks.
2
But with the emergence of the Delta variant of COVID-19 midway through 2021, questions about whether the economic recovery would stall weighed on the market. In addition, supply-chain bottlenecks hindered sales in some industries and created winners and losers. Supply-chain bottlenecks, combined with loose monetary policy and massive federal spending, caused inflation to rise during the reporting period. While the Federal Reserve (the “Fed”) initially called it “transitory,” it acknowledged late in the period that pricing pressures were more permanent. In response, the Fed announced that in addition to tapering its bond purchases late in 2021, it was likely to hike interest rate hikes in 2022.
Growth stocks came into, and fell out of, favor at times. When concerns about the economy rose, the market favored growth stocks, but when positive news on the pandemic emerged, value and cyclical stocks came into favor. When expectations that the Fed would begin to tighten monetary policy rose, the performance of growth stocks lagged, and when the Omicron variant of the COVID-19 posed a threat to the economic recovery, growth stocks benefited, while cyclical stocks lagged.
While markets wavered at times as investors digested pandemic news, rising inflation and Fed policy, markets were supported by strong corporate earnings worldwide, especially in the U.S.
Stock Selection Hindered Performance
The fund’s performance was hampered primarily by stock selections in the information technology and consumer discretionary sectors. In the information technology sector, an underweight position hurt returns somewhat, but the primary detractors were positions in Microsoft and Zoom Video Communications. The fund had an underweight position in Microsoft, but shares rose 52% during the period. Shares of Zoom Video Communications fell 45% as the company had difficulty maintaining the momentum of 2020, and investors viewed shares as too expensive. Shares of Block (formerly Square) and Twilio also detracted as valuations on both were too high, given growth expectations. In the consumer discretionary sector, shares of Peloton Interactive, an exercise equipment company, declined 60% as sales growth failed to keep pace with that of 2020. In the hotel and leisure industry, the fund’s positions in Las Vegas Sands and Wynn Resorts detracted. Both companies are exposed to the gaming market in Macau, which has failed to recover from the pandemic as quickly as expected.
On the other hand, positions in the materials and financials sectors contributed positively. In the materials sector, the fund’s overweight position was beneficial as was a position in CF Industries Holdings, an agricultural chemicals company. The company benefited from higher commodity prices and improved pricing, and shares rose 87%. A position in Freeport-McMoRan, a copper mining company, was also advantageous. Shares rose 61%, not only because of a surge in commodity prices in response to inflationary pressures, but also due to growing long-term demand for copper from the electric vehicle industry. Shares of Alcoa, an aluminum company, also contributed positively, rising due to strong demand, higher prices and limited supply due to China’s constraint on exports. In the financials sector, the fund’s overweight position was beneficial, and shares in the capital markets and consumer finance industries were especially advantageous. In the capital markets industry, shares of Goldman Sachs and Morgan Stanley benefited from strong proprietary trading and merger and acquisition activity. In the consumer finance industry, Capital One Financial gained due to healthy consumer demand fueled in part by federal stimulus spending.
Positioned for Further Economic Recovery
We believe that with the strong rebound from the bottom in 2020 and the rotation into value stocks to some degree in 2021, the market is moving toward a mid-cycle environment. We
3
DISCUSSION OF FUND PERFORMANCE (Unaudited) (continued)
anticipate that earnings will continue to grow, but with federal stimulus spending coming to an end and interest rates rising, markets will no longer enjoy the tailwinds that occurred over the past two years. Consumer spending and employment remain strong, however, though markets may be choppy in the coming year. In this environment, we believe that an actively managed approach will perform well, and that a fund that incorporates both growth and income stocks will be well positioned.
The fund’s largest overweight positions are in the financials and health care sectors, and we have added to both. The largest underweight positions are in the consumer staples and consumer discretionary sectors, and we have reduced our holdings in both.
January 18, 2022
1 Total return includes reinvestment of dividends and any capital gains paid. Past performance is no guarantee of future results. Share price and investment return fluctuate such that upon redemption, fund shares may be worth more or less than their original cost. The fund’s performance does not reflect the deduction of additional charges and expenses imposed in connection with investing in variable insurance contracts, which will reduce returns. The fund’s returns reflect the absorption of certain fund expenses by BNY Mellon Investment Adviser, Inc. pursuant to an agreement in effect through April 30, 2022, at which time it may be extended, modified or terminated. Had these expenses not been absorbed, returns would have been lower.
2 Source: Lipper Inc. — The S&P 500® Index is widely regarded as the best single gauge of large-cap U.S. equities. The Index includes 500 leading companies and captures approximately 80% coverage of available market capitalization. Investors cannot invest directly in any index.
Please note: the position in any security highlighted with italicized typeface was sold during the reporting period.
Equities are subject generally to market, market sector, market liquidity, issuer and investment style risks, among other factors, to varying degrees, all of which are more fully described in the fund’s prospectus.
The fund is only available as a funding vehicle under variable life insurance policies or variable annuity contracts issued by insurance companies. Individuals may not purchase shares of the fund directly. A variable annuity is an insurance contract issued by an insurance company that enables investors to accumulate assets on a tax-deferred basis for retirement or other long-term goals. The investment objective and policies of BNY Mellon Variable Investment Fund, Growth and Income Portfolio made available through insurance products may be similar to those of other funds managed or advised by BNY Mellon Investment Adviser, Inc. However, the investment results of the fund may be higher or lower than, and may not be comparable to, those of any other BNY Mellon fund.
Recent market risks include pandemic risks related to COVID-19. The effects of COVID-19 have contributed to increased volatility in global markets and will likely affect certain countries, companies, industries and market sectors more dramatically than others. To the extent the fund may overweight its investments in certain countries, companies, industries or market sectors, such positions will increase the fund’s exposure to risk of loss from adverse developments affecting those countries, companies, industries or sectors.
4
FUND PERFORMANCE (Unaudited)
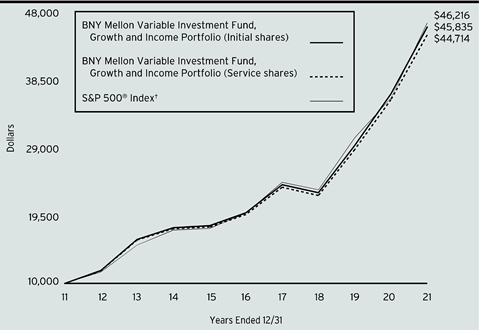
Comparison of change in value of a $10,000 investment in Initial shares and Service shares of BNY Mellon Variable Investment Fund, Growth and Income Portfolio with a hypothetical investment of $10,000 in the S&P 500® Index (the “Index”).
† Source: Lipper Inc.
Past performance is not predictive of future performance. The fund’s performance does not reflect the deduction of additional charges and expenses imposed in connection with investing in variable insurance contracts which will reduce returns.
The above graph compares a hypothetical $10,000 investment made in Initial shares and Service shares of BNY Mellon Variable Investment Fund, Growth and Income Portfolio on 12/31/11 to a hypothetical investment of $10,000 made in the Index on that date.
The fund’s performance shown in the line graph above takes into account all applicable fees and expenses. The Index is widely regarded as the best single gauge of large-cap U.S. equities. The Index includes 500 leading companies and captures approximately 80% coverage of available market capitalization. Unlike a mutual fund, the Index is not subject to charges, fees and other expenses. Investors cannot invest directly in any index. Further information relating to fund performance, including expense reimbursements, if applicable, is contained in the Financial Highlights section of the prospectus and elsewhere in this report.
| | | | |
Average Annual Total Returns as of 12/31/2021 | |
| 1 Year | 5 Years | 10 Years |
Initial shares | 25.63% | 18.20% | 16.45% |
Service shares | 25.31% | 17.90% | 16.16% |
S&P 500® Index | 28.70% | 18.47% | 16.54% |
The performance data quoted represents past performance, which is no guarantee of future results. Share price and investment return fluctuate and an investor’s shares may be worth more or less than original cost upon redemption. Current performance may be lower or higher than the performance quoted. Go to www.im.bnymellon.com for the fund’s most recent month-end returns.
The fund’s Initial shares are not subject to a Rule 12b-1 fee. The fund’s Service shares are subject to a 0.25% annual Rule 12b-1 fee. All dividends and capital gain distributions are reinvested.
The fund’s performance shown in the graph and table does not reflect the deduction of taxes that a shareholder would pay on fund distributions or the redemption of fund shares.
5
UNDERSTANDING YOUR FUND’S EXPENSES (Unaudited)
As a mutual fund investor, you pay ongoing expenses, such as management fees and other expenses. Using the information below, you can estimate how these expenses affect your investment and compare them with the expenses of other funds. You also may pay one-time transaction expenses, including sales charges (loads), redemption fees and expenses associated with variable annuity or insurance contracts, which are not shown in this section and would have resulted in higher total expenses. For more information, see your fund’s prospectus or talk to your financial adviser.
Review your fund’s expenses
The table below shows the expenses you would have paid on a $1,000 investment in BNY Mellon Variable Investment Fund, Growth and Income Portfolio from July 1, 2021 to December 31, 2021. It also shows how much a $1,000 investment would be worth at the close of the period, assuming actual returns and expenses.
| | | | | |
Expenses and Value of a $1,000 Investment | |
Assume actual returns for the six months ended December 31, 2021 | |
| | | | |
| | Initial Shares | Service Shares | |
Expenses paid per $1,000† | $4.20 | $5.51 | |
Ending value (after expenses) | $1,083.40 | $1,082.30 | |
COMPARING YOUR FUND’S EXPENSES
WITH THOSE OF OTHER FUNDS (Unaudited)
Using the SEC’s method to compare expenses
The Securities and Exchange Commission (“SEC”) has established guidelines to help investors assess fund expenses. Per these guidelines, the table below shows your fund’s expenses based on a $1,000 investment, assuming a hypothetical 5% annualized return. You can use this information to compare the ongoing expenses (but not transaction expenses or total cost) of investing in the fund with those of other funds. All mutual fund shareholder reports will provide this information to help you make this comparison. Please note that you cannot use this information to estimate your actual ending account balance and expenses paid during the period.
| | | | | |
Expenses and Value of a $1,000 Investment | |
Assuming a hypothetical 5% annualized return for the six months ended December 31, 2021 | |
| | | | |
| | Initial Shares | Service Shares | |
Expenses paid per $1,000† | $4.08 | $5.35 | |
Ending value (after expenses) | $1,021.17 | $1,019.91 | |
† | Expenses are equal to the fund’s annualized expense ratio of .80% for Initial Shares and 1.05% for Service Shares, multiplied by the average account value over the period, multiplied by 184/365 (to reflect the one-half year period). |
6
STATEMENT OF INVESTMENTS
December 31, 2021
| | | | | | | | |
| |
Description | | | | Shares | | Value ($) | |
Common Stocks - 98.4% | | | | | |
Automobiles & Components - 1.6% | | | | | |
General Motors | | | | 12,593 | a | 738,328 | |
Tesla | | | | 975 | a | 1,030,360 | |
| | | | | 1,768,688 | |
Banks - 3.4% | | | | | |
Bank of America | | | | 19,398 | | 863,017 | |
Comerica | | | | 8,003 | | 696,261 | |
JPMorgan Chase & Co. | | | | 8,941 | | 1,415,807 | |
U.S. Bancorp | | | | 14,412 | | 809,522 | |
| | | | | 3,784,607 | |
Capital Goods - 8.3% | | | | | |
AMETEK | | | | 5,779 | | 849,744 | |
Armstrong World Industries | | | | 4,837 | | 561,672 | |
Eaton | | | | 3,854 | | 666,048 | |
Howmet Aerospace | | | | 36,807 | | 1,171,567 | |
Hubbell | | | | 3,028 | | 630,642 | |
Ingersoll Rand | | | | 26,463 | | 1,637,266 | |
L3Harris Technologies | | | | 3,565 | | 760,201 | |
Northrop Grumman | | | | 1,754 | | 678,921 | |
Quanta Services | | | | 4,911 | | 563,095 | |
Rockwell Automation | | | | 1,713 | | 597,580 | |
Trane Technologies | | | | 5,365 | | 1,083,891 | |
| | | | | 9,200,627 | |
Commercial & Professional Services - .6% | | | | | |
Cintas | | | | 1,576 | | 698,436 | |
Consumer Durables & Apparel - .8% | | | | | |
Newell Brands | | | | 11,491 | | 250,963 | |
Peloton Interactive, Cl. A | | | | 17,769 | a | 635,419 | |
| | | | | 886,382 | |
Consumer Services - 1.3% | | | | | |
Booking Holdings | | | | 386 | a | 926,103 | |
International Game Technology | | | | 17,640 | | 509,972 | |
| | | | | 1,436,075 | |
Diversified Financials - 7.8% | | | | | |
Ameriprise Financial | | | | 5,773 | | 1,741,483 | |
Berkshire Hathaway, Cl. B | | | | 5,604 | a | 1,675,596 | |
Capital One Financial | | | | 1,860 | | 269,867 | |
CME Group | | | | 1,743 | | 398,206 | |
Equitable Holdings | | | | 8,151 | | 267,271 | |
LPL Financial Holdings | | | | 2,762 | | 442,169 | |
Morgan Stanley | | | | 13,744 | | 1,349,111 | |
State Street | | | | 6,868 | | 638,724 | |
7
STATEMENT OF INVESTMENTS (continued)
| | | | | | | | |
| |
Description | | | | Shares | | Value ($) | |
Common Stocks - 98.4% (continued) | | | | | |
Diversified Financials - 7.8% (continued) | | | | | |
The Charles Schwab | | | | 12,608 | | 1,060,333 | |
Voya Financial | | | | 12,280 | b | 814,287 | |
| | | | | 8,657,047 | |
Energy - 4.9% | | | | | |
ConocoPhillips | | | | 7,333 | | 529,296 | |
Devon Energy | | | | 26,199 | | 1,154,066 | |
EQT | | | | 56,773 | a | 1,238,219 | |
Exxon Mobil | | | | 12,217 | | 747,558 | |
Hess | | | | 8,018 | | 593,573 | |
Marathon Petroleum | | | | 18,279 | | 1,169,673 | |
| | | | | 5,432,385 | |
Food & Staples Retailing - .6% | | | | | |
Sysco | | | | 8,573 | | 673,409 | |
Food, Beverage & Tobacco - .4% | | | | | |
PepsiCo | | | | 2,550 | | 442,961 | |
Health Care Equipment & Services - 8.8% | | | | | |
Becton Dickinson & Co. | | | | 1,877 | | 472,028 | |
CVS Health | | | | 12,240 | | 1,262,678 | |
DexCom | | | | 1,349 | a | 724,346 | |
Edwards Lifesciences | | | | 5,261 | a | 681,563 | |
HCA Healthcare | | | | 1,001 | | 257,177 | |
Intuitive Surgical | | | | 2,722 | a | 978,015 | |
Laboratory Corp. of America Holdings | | | | 1,305 | a | 410,044 | |
Masimo | | | | 1,751 | a | 512,658 | |
McKesson | | | | 3,534 | | 878,446 | |
Medtronic | | | | 8,033 | | 831,014 | |
Teladoc Health | | | | 5,856 | a | 537,698 | |
UnitedHealth Group | | | | 2,975 | | 1,493,866 | |
Zimmer Biomet Holdings | | | | 5,952 | | 756,142 | |
| | | | | 9,795,675 | |
Insurance - 3.7% | | | | | |
Aon, Cl. A | | | | 2,755 | | 828,043 | |
Assurant | | | | 7,487 | | 1,166,924 | |
Chubb | | | | 3,600 | | 695,916 | |
The Hartford Financial Services Group | | | | 5,643 | | 389,593 | |
Willis Towers Watson | | | | 4,139 | | 982,971 | |
| | | | | 4,063,447 | |
Materials - 2.9% | | | | | |
Alcoa | | | | 16,082 | | 958,165 | |
CF Industries Holdings | | | | 15,379 | | 1,088,526 | |
Freeport-McMoRan | | | | 21,856 | | 912,051 | |
Vulcan Materials | | | | 1,401 | | 290,820 | |
| | | | | 3,249,562 | |
8
| | | | | | | | |
| |
Description | | | | Shares | | Value ($) | |
Common Stocks - 98.4% (continued) | | | | | |
Media & Entertainment - 8.9% | | | | | |
Alphabet, Cl. A | | | | 928 | a | 2,688,453 | |
Alphabet, Cl. C | | | | 1,030 | a | 2,980,398 | |
Comcast, Cl. A | | | | 15,796 | | 795,013 | |
Match Group | | | | 3,070 | a | 406,008 | |
Meta Platforms, Cl. A | | | | 4,208 | a | 1,415,361 | |
Pinterest, Cl. A | | | | 10,642 | a | 386,837 | |
Roku | | | | 1,794 | a | 409,391 | |
Snap, Cl. A | | | | 11,260 | a | 529,558 | |
The Walt Disney Company | | | | 1,819 | a | 281,745 | |
| | | | | 9,892,764 | |
Pharmaceuticals Biotechnology & Life Sciences - 7.5% | | | | | |
AbbVie | | | | 20,606 | | 2,790,052 | |
Danaher | | | | 4,606 | | 1,515,420 | |
Eli Lilly & Co. | | | | 6,364 | | 1,757,864 | |
Horizon Therapeutics | | | | 6,502 | a | 700,656 | |
Merck & Co. | | | | 7,618 | | 583,844 | |
Organon & Co. | | | | 17,823 | | 542,710 | |
Seagen | | | | 2,929 | a | 452,823 | |
| | | | | 8,343,369 | |
Real Estate - .5% | | | | | |
Medical Properties Trust | | | | 21,526 | c | 508,659 | |
Retailing - 4.5% | | | | | |
Amazon.com | | | | 1,385 | a | 4,618,061 | |
Farfetch, Cl. A | | | | 10,033 | a | 335,403 | |
| | | | | 4,953,464 | |
Semiconductors & Semiconductor Equipment - 6.7% | | | | | |
Applied Materials | | | | 11,062 | | 1,740,716 | |
Marvell Technology | | | | 9,041 | | 790,997 | |
NVIDIA | | | | 8,918 | | 2,622,873 | |
Qualcomm | | | | 12,614 | | 2,306,722 | |
| | | | | 7,461,308 | |
Software & Services - 12.7% | | | | | |
Ansys | | | | 1,629 | a | 653,424 | |
Bill.com Holdings | | | | 1,067 | a | 265,843 | |
Block | | | | 7,906 | a | 1,276,898 | |
CrowdStrike Holdings, CI. A | | | | 2,202 | a,b | 450,859 | |
Datadog, Cl. A | | | | 3,911 | a | 696,588 | |
Dolby Laboratories, Cl. A | | | | 6,803 | | 647,782 | |
HubSpot | | | | 1,204 | a | 793,617 | |
Microsoft | | | | 14,871 | | 5,001,415 | |
PayPal Holdings | | | | 1,491 | a | 281,173 | |
salesforce.com | | | | 4,317 | a | 1,097,079 | |
Snowflake, Cl. A | | | | 1,701 | a | 576,214 | |
9
STATEMENT OF INVESTMENTS (continued)
| | | | | | | | |
| |
Description | | | | Shares | | Value ($) | |
Common Stocks - 98.4% (continued) | | | | | |
Software & Services - 12.7% (continued) | | | | | |
SS&C Technologies Holdings | | | | 5,747 | | 471,139 | |
Twilio, Cl. A | | | | 3,907 | a | 1,028,869 | |
Visa, Cl. A | | | | 2,530 | b | 548,276 | |
Zoom Video Communications, CI. A | | | | 1,864 | a | 342,808 | |
| | | | | 14,131,984 | |
Technology Hardware & Equipment - 6.6% | | | | | |
Apple | | | | 22,308 | | 3,961,232 | |
Cisco Systems | | | | 28,440 | | 1,802,243 | |
Corning | | | | 14,273 | | 531,384 | |
Zebra Technologies, Cl. A | | | | 1,762 | a | 1,048,742 | |
| | | | | 7,343,601 | |
Telecommunication Services - .6% | | | | | |
Vodafone Group, ADR | | | | 42,154 | b | 629,359 | |
Transportation - 1.3% | | | | | |
Norfolk Southern | | | | 2,875 | | 855,916 | |
Uber Technologies | | | | 13,200 | a | 553,476 | |
| | | | | 1,409,392 | |
Utilities - 4.0% | | | | | |
Clearway Energy, Cl. C | | | | 20,653 | b | 744,128 | |
Exelon | | | | 32,436 | | 1,873,503 | |
NextEra Energy Partners | | | | 7,363 | | 621,437 | |
The AES | | | | 29,160 | | 708,588 | |
Vistra Energy | | | | 21,578 | | 491,331 | |
| | | | | 4,438,987 | |
Total Common Stocks (cost $69,502,461) | | | | 109,202,188 | |
| | | 1-Day
Yield (%) | | | | | |
Investment Companies - 1.4% | | | | | |
Registered Investment Companies - 1.4% | | | | | |
Dreyfus Institutional Preferred Government Plus Money Market Fund, Institutional Shares
(cost $1,584,938) | | 0.07 | | 1,584,938 | d | 1,584,938 | |
10
| | | | | | | | |
| |
Description | | 1-Day
Yield (%) | | Shares | | Value ($) | |
Investment of Cash Collateral for Securities Loaned - .6% | | | | | |
Registered Investment Companies - .6% | | | | | |
Dreyfus Institutional Preferred Government Plus Money Market Fund, SL Shares
(cost $622,733) | | 0.07 | | 622,733 | d | 622,733 | |
Total Investments (cost $71,710,132) | | 100.4% | | 111,409,859 | |
Liabilities, Less Cash and Receivables | | (.4%) | | (459,407) | |
Net Assets | | 100.0% | | 110,950,452 | |
ADR—American Depository Receipt
a Non-income producing security.
b Security, or portion thereof, on loan. At December 31, 2021, the value of the fund’s securities on loan was $2,853,154 and the value of the collateral was $2,958,009, consisting of cash collateral of $622,733 and U.S. Government & Agency securities valued at $2,335,276. In addition, the value of collateral may include pending sales that are also on loan.
c Investment in real estate investment trust within the United States.
d Investment in affiliated issuer. The investment objective of this investment company is publicly available and can be found within the investment company’s prospectus.
| | |
Portfolio Summary (Unaudited) † | Value (%) |
Information Technology | 26.1 |
Health Care | 16.3 |
Financials | 14.9 |
Industrials | 10.2 |
Communication Services | 9.5 |
Consumer Discretionary | 8.1 |
Energy | 4.9 |
Utilities | 4.0 |
Materials | 2.9 |
Investment Companies | 2.0 |
Consumer Staples | 1.0 |
Real Estate | .5 |
| | 100.4 |
† Based on net assets.
See notes to financial statements.
11
STATEMENT OF INVESTMENTS IN AFFILIATED ISSUERS
| | | | | | | |
Description | Value ($) 12/31/2020 | Purchases ($)† | Sales ($) | Value ($) 12/31/2021 | Dividends/
Distributions ($) | |
Registered Investment Companies - 1.4% | | |
Dreyfus Institutional Preferred Government Plus Money Market Fund, Institutional Shares - 1.4% | 1,591,806 | 23,882,889 | (23,889,757) | 1,584,938 | 1,209 | |
Investment of Cash Collateral for Securities Loaned - .6% | | |
Dreyfus Institutional Preferred Government Plus Money Market Fund, SL Shares - .6% | 567,336 | 7,250,875 | (7,195,478) | 622,733 | 5,482 | †† |
Total - 2.0% | 2,159,142 | 31,133,764 | (31,085,235) | 2,207,671 | 6,691 | |
† Includes reinvested dividends/distributions.
†† Represents securities lending income earned from the reinvestment of cash collateral from loaned securities, net of fees and collateral investment expenses, and other payments to and from borrowers of securities.
See notes to financial statements.
12
STATEMENT OF ASSETS AND LIABILITIES
December 31, 2021
| | | | | | | |
| | | | | | |
| | | Cost | | Value | |
Assets ($): | | | | |
Investments in securities—See Statement of Investments
(including securities on loan, valued at $2,853,154)—Note 1(c): | | | |
Unaffiliated issuers | 69,502,461 | | 109,202,188 | |
Affiliated issuers | | 2,207,671 | | 2,207,671 | |
Receivable for investment securities sold | | 538,680 | |
Dividends and securities lending income receivable | | 72,747 | |
Receivable for shares of Beneficial Interest subscribed | | 21,170 | |
Prepaid expenses | | | | | 852 | |
| | | | | 112,043,308 | |
Liabilities ($): | | | | |
Due to BNY Mellon Investment Adviser, Inc. and affiliates—Note 3(b) | | 68,126 | |
Liability for securities on loan—Note 1(c) | | 622,733 | |
Payable for investment securities purchased | | 320,882 | |
Payable for shares of Beneficial Interest redeemed | | 14,534 | |
Trustees’ fees and expenses payable | | 900 | |
Other accrued expenses | | | | | 65,681 | |
| | | | | 1,092,856 | |
Net Assets ($) | | | 110,950,452 | |
Composition of Net Assets ($): | | | | |
Paid-in capital | | | | | 52,769,134 | |
Total distributable earnings (loss) | | | | | 58,181,318 | |
Net Assets ($) | | | 110,950,452 | |
| | | | |
Net Asset Value Per Share | Initial Shares | Service Shares | |
Net Assets ($) | 106,014,838 | 4,935,614 | |
Shares Outstanding | 2,549,561 | 118,429 | |
Net Asset Value Per Share ($) | 41.58 | 41.68 | |
| | | |
See notes to financial statements. | | | |
13
STATEMENT OF OPERATIONS
Year Ended December 31, 2021
| | | | | | | |
| | | | | | |
| | | | | | |
Investment Income ($): | | | | |
Income: | | | | |
Cash dividends (net of $126 foreign taxes withheld at source): | |
Unaffiliated issuers | | | 1,353,656 | |
Affiliated issuers | | | 1,209 | |
Income from securities lending—Note 1(c) | | | 5,482 | |
Total Income | | | 1,360,347 | |
Expenses: | | | | |
Investment advisory fee—Note 3(a) | | | 799,768 | |
Professional fees | | | 102,561 | |
Chief Compliance Officer fees—Note 3(b) | | | 14,276 | |
Prospectus and shareholders’ reports | | | 13,910 | |
Distribution fees—Note 3(b) | | | 12,631 | |
Custodian fees—Note 3(b) | | | 7,938 | |
Trustees’ fees and expenses—Note 3(c) | | | 6,461 | |
Loan commitment fees—Note 2 | | | 2,157 | |
Shareholder servicing costs—Note 3(b) | | | 767 | |
Miscellaneous | | | 17,285 | |
Total Expenses | | | 977,754 | |
Less—reduction in expenses due to undertaking—Note 3(a) | | | (110,008) | |
Net Expenses | | | 867,746 | |
Investment Income—Net | | | 492,601 | |
Realized and Unrealized Gain (Loss) on Investments—Note 4 ($): | | |
Net realized gain (loss) on investments | 19,072,590 | |
Net change in unrealized appreciation (depreciation) on investments | 4,407,570 | |
Net Realized and Unrealized Gain (Loss) on Investments | | | 23,480,160 | |
Net Increase in Net Assets Resulting from Operations | | 23,972,761 | |
| | | | | | |
See notes to financial statements. | | | | | |
14
STATEMENT OF CHANGES IN NET ASSETS
| | | | | | | | | | |
| | | | Year Ended December 31, |
| | | | 2021 | | 2020 | |
Operations ($): | | | | | | | | |
Investment income—net | | | 492,601 | | | | 631,905 | |
Net realized gain (loss) on investments | | 19,072,590 | | | | 6,549,576 | |
Net change in unrealized appreciation
(depreciation) on investments | | 4,407,570 | | | | 12,103,813 | |
Net Increase (Decrease) in Net Assets
Resulting from Operations | 23,972,761 | | | | 19,285,294 | |
Distributions ($): | |
Distributions to shareholders: | | | | | | | | |
Initial Shares | | | (7,014,637) | | | | (6,409,913) | |
Service Shares | | | (343,017) | | | | (336,298) | |
Total Distributions | | | (7,357,654) | | | | (6,746,211) | |
Beneficial Interest Transactions ($): | |
Net proceeds from shares sold: | | | | | | | | |
Initial Shares | | | 3,095,610 | | | | 1,960,181 | |
Service Shares | | | 43,155 | | | | 193,323 | |
Distributions reinvested: | | | | | | | | |
Initial Shares | | | 7,014,637 | | | | 6,409,913 | |
Service Shares | | | 343,017 | | | | 336,298 | |
Cost of shares redeemed: | | | | | | | | |
Initial Shares | | | (11,743,048) | | | | (10,813,413) | |
Service Shares | | | (1,013,964) | | | | (841,513) | |
Increase (Decrease) in Net Assets
from Beneficial Interest Transactions | (2,260,593) | | | | (2,755,211) | |
Total Increase (Decrease) in Net Assets | 14,354,514 | | | | 9,783,872 | |
Net Assets ($): | |
Beginning of Period | | | 96,595,938 | | | | 86,812,066 | |
End of Period | | | 110,950,452 | | | | 96,595,938 | |
Capital Share Transactions (Shares): | |
Initial Shares | | | | | | | | |
Shares sold | | | 80,423 | | | | 70,955 | |
Shares issued for distributions reinvested | | | 196,863 | | | | 279,286 | |
Shares redeemed | | | (301,041) | | | | (364,347) | |
Net Increase (Decrease) in Shares Outstanding | (23,755) | | | | (14,106) | |
Service Shares | | | | | | | | |
Shares sold | | | 1,110 | | | | 6,673 | |
Shares issued for distributions reinvested | | | 9,633 | | | | 14,719 | |
Shares redeemed | | | (25,957) | | | | (28,426) | |
Net Increase (Decrease) in Shares Outstanding | (15,214) | | | | (7,034) | |
| | | | | | | | | |
See notes to financial statements. | | | | | | | | |
15
FINANCIAL HIGHLIGHTS
The following tables describe the performance for each share class for the fiscal periods indicated. All information (except portfolio turnover rate) reflects financial results for a single fund share. Net asset value total return is calculated assuming an initial investment made at the net asset value at the beginning of the period, reinvestment of all dividends and distributions at net asset value during the period, and redemption at net asset value on the last day of the period. Net asset value total return includes adjustments in accordance with accounting principles generally accepted in the United States of America and as such, the net asset value for financial reporting purposes and the returns based upon those net asset values may differ from the net asset value and returns for shareholder transactions. The fund’s total returns do not reflect expenses associated with variable annuity or insurance contracts. These figures have been derived from the fund’s financial statements.
| | | | | | | |
| | | |
| | | Year Ended December 31, |
Initial Shares | | 2021 | 2020 | 2019 | 2018 | 2017 |
Per Share Data ($): | | | | | | |
Net asset value,
beginning of period | | 35.68 | 31.82 | 28.03 | 32.72 | 28.81 |
Investment Operations: | | | | | | |
Investment income—neta | | .18 | .23 | .30 | .27 | .26 |
Net realized and unrealized
gain (loss) on investments | | 8.50 | 6.17 | 7.36 | (1.66) | 5.22 |
Total from Investment Operations | | 8.68 | 6.40 | 7.66 | (1.39) | 5.48 |
Distributions: | | | | | | |
Dividends from
investment income—net | | (.19) | (.23) | (.33) | (.26) | (.23) |
Dividends from net realized
gain on investments | | (2.59) | (2.31) | (3.54) | (3.04) | (1.34) |
Total Distributions | | (2.78) | (2.54) | (3.87) | (3.30) | (1.57) |
Net asset value, end of period | | 41.58 | 35.68 | 31.82 | 28.03 | 32.72 |
Total Return (%) | | 25.63 | 24.63 | 29.12 | (4.68) | 19.71 |
Ratios/Supplemental Data (%): | | | | | | |
Ratio of total expenses
to average net assets | | .91 | .93 | .93 | .93 | .90 |
Ratio of net expenses
to average net assets | | .80 | .82 | .93 | .93 | .90 |
Ratio of net investment income
to average net assets | | .47 | .77 | 1.00 | .87 | .85 |
Portfolio Turnover Rate | | 53.70 | 66.45 | 61.08 | 63.89 | 61.00 |
Net Assets, end of period ($ x 1,000) | | 106,015 | 91,818 | 82,328 | 69,774 | 82,070 |
a Based on average shares outstanding.
See notes to financial statements.
16
| | | | | | | |
| | | |
| | | Year Ended December 31, |
Service Shares | | 2021 | 2020 | 2019 | 2018 | 2017 |
Per Share Data ($): | | | | | | |
Net asset value,
beginning of period | | 35.76 | 31.88 | 28.08 | 32.76 | 28.85 |
Investment Operations: | | | | | | |
Investment income—neta | | .09 | .16 | .22 | .19 | .18 |
Net realized and unrealized
gain (loss) on investments | | 8.51 | 6.19 | 7.37 | (1.65) | 5.22 |
Total from Investment Operations | | 8.60 | 6.35 | 7.59 | (1.46) | 5.40 |
Distributions: | | | | | | |
Dividends from
investment income—net | | (.09) | (.16) | (.25) | (.18) | (.15) |
Dividends from net
realized gain on investments | | (2.59) | (2.31) | (3.54) | (3.04) | (1.34) |
Total Distributions | | (2.68) | (2.47) | (3.79) | (3.22) | (1.49) |
Net asset value, end of period | | 41.68 | 35.76 | 31.88 | 28.08 | 32.76 |
Total Return (%) | | 25.31 | 24.33 | 28.79 | (4.90) | 19.38 |
Ratios/Supplemental Data (%): | | | | | | |
Ratio of total expenses
to average net assets | | 1.16 | 1.18 | 1.18 | 1.18 | 1.15 |
Ratio of net expenses
to average net assets | | 1.05 | 1.07 | 1.18 | 1.18 | 1.15 |
Ratio of net investment income
to average net assets | | .22 | .52 | .76 | .62 | .60 |
Portfolio Turnover Rate | | 53.70 | 66.45 | 61.08 | 63.89 | 61.00 |
Net Assets, end of period ($ x 1,000) | | 4,936 | 4,778 | 4,484 | 4,039 | 5,306 |
a Based on average shares outstanding.
See notes to financial statements.
17
NOTES TO FINANCIAL STATEMENTS
NOTE 1—Significant Accounting Policies:
Growth and Income Portfolio (the “fund”) is a separate diversified series of BNY Mellon Variable Investment Fund (the “Trust”), which is registered under the Investment Company Act of 1940, as amended (the “Act”), as an open-end management investment company and operates as a series company currently offering four series, including the fund. The fund is only offered to separate accounts established by insurance companies to fund variable annuity contracts and variable life insurance policies. The fund’s investment objective is to seek long-term capital growth, current income and growth of income consistent with reasonable investment risk. BNY Mellon Investment Adviser, Inc. (the “Adviser”), a wholly-owned subsidiary of The Bank of New York Mellon Corporation (“BNY Mellon”), serves as the fund’s investment adviser. Effective September 1, 2021 (the “Effective Date”), the Adviser has engaged its affiliate, Newton Investment Management North America, LLC (the “Sub-Adviser”) as the fund’s sub-investment adviser pursuant to a sub-investment advisory agreement between the Adviser and the Sub-Adviser. As the fund’s sub-investment adviser, the Sub-Adviser provides the day-to-day management of the fund’s investments, subject to the Adviser’s supervision and approval. The Adviser (and not the fund) pays the Sub-Adviser for its sub-advisory services. As of the Effective Date, portfolio managers responsible for managing the fund’s investments who were employees of Mellon Investments Corporation (“Mellon”) in a dual employment arrangement with the Adviser, have become employees of the Sub-Adviser, and are no longer employees of Mellon.
BNY Mellon Securities Corporation (the “Distributor”), a wholly-owned subsidiary of the Adviser, is the distributor of the fund’s shares, which are sold without a sales charge. The fund is authorized to issue an unlimited number of $.001 par value shares of Beneficial Interest in each of the following classes of shares: Initial and Service. Each class of shares has identical rights and privileges, except with respect to the Distribution Plan, and the expenses borne by each class, the allocation of certain transfer agency costs, and certain voting rights. Income, expenses (other than expenses attributable to a specific class), and realized and unrealized gains or losses on investments are allocated to each class of shares based on its relative net assets.
The Trust accounts separately for the assets, liabilities and operations of each series. Expenses directly attributable to each series are charged to that series’ operations; expenses which are applicable to all series are allocated among them on a pro rata basis.
18
The Financial Accounting Standards Board (“FASB”) Accounting Standards Codification (“ASC”) is the exclusive reference of authoritative U.S. generally accepted accounting principles (“GAAP”) recognized by the FASB to be applied by nongovernmental entities. Rules and interpretive releases of the SEC under authority of federal laws are also sources of authoritative GAAP for SEC registrants. The fund is an investment company and applies the accounting and reporting guidance of the FASB ASC Topic 946 Financial Services-Investment Companies. The fund’s financial statements are prepared in accordance with GAAP, which may require the use of management estimates and assumptions. Actual results could differ from those estimates.
The Trust enters into contracts that contain a variety of indemnifications. The fund’s maximum exposure under these arrangements is unknown. The fund does not anticipate recognizing any loss related to these arrangements.
(a) Portfolio valuation: The fair value of a financial instrument is the amount that would be received to sell an asset or paid to transfer a liability in an orderly transaction between market participants at the measurement date (i.e., the exit price). GAAP establishes a fair value hierarchy that prioritizes the inputs of valuation techniques used to measure fair value. This hierarchy gives the highest priority to unadjusted quoted prices in active markets for identical assets or liabilities (Level 1 measurements) and the lowest priority to unobservable inputs (Level 3 measurements).
Additionally, GAAP provides guidance on determining whether the volume and activity in a market has decreased significantly and whether such a decrease in activity results in transactions that are not orderly. GAAP requires enhanced disclosures around valuation inputs and techniques used during annual and interim periods.
Various inputs are used in determining the value of the fund’s investments relating to fair value measurements. These inputs are summarized in the three broad levels listed below:
Level 1—unadjusted quoted prices in active markets for identical investments.
Level 2—other significant observable inputs (including quoted prices for similar investments, interest rates, prepayment speeds, credit risk, etc.).
Level 3—significant unobservable inputs (including the fund’s own assumptions in determining the fair value of investments).
19
NOTES TO FINANCIAL STATEMENTS (continued)
The inputs or methodology used for valuing securities are not necessarily an indication of the risk associated with investing in those securities.
Changes in valuation techniques may result in transfers in or out of an assigned level within the disclosure hierarchy. Valuation techniques used to value the fund’s investments are as follows:
Investments in equity securities are valued at the last sales price on the securities exchange or national securities market on which such securities are primarily traded. Securities listed on the National Market System for which market quotations are available are valued at the official closing price or, if there is no official closing price that day, at the last sales price. For open short positions, asked prices are used for valuation purposes. Bid price is used when no asked price is available. Registered investment companies that are not traded on an exchange are valued at their net asset value. All of the preceding securities are generally categorized within Level 1 of the fair value hierarchy.
Securities not listed on an exchange or the national securities market, or securities for which there were no transactions, are valued at the average of the most recent bid and asked prices. These securities are generally categorized within Level 2 of the fair value hierarchy.
Fair valuing of securities may be determined with the assistance of a pricing service using calculations based on indices of domestic securities and other appropriate indicators, such as prices of relevant ADRs and futures. Utilizing these techniques may result in transfers between Level 1 and Level 2 of the fair value hierarchy.
When market quotations or official closing prices are not readily available, or are determined not to accurately reflect fair value, such as when the value of a security has been significantly affected by events after the close of the exchange or market on which the security is principally traded (for example, a foreign exchange or market), but before the fund calculates its net asset value, the fund may value these investments at fair value as determined in accordance with the procedures approved by the Trust’s Board of Trustees (the “Board”). Certain factors may be considered when fair valuing investments such as: fundamental analytical data, the nature and duration of restrictions on disposition, an evaluation of the forces that influence the market in which the securities are purchased and sold, and public trading in similar securities of the issuer or comparable issuers. These securities are either categorized within Level 2 or 3 of the fair value hierarchy depending on the relevant inputs used.
20
For securities where observable inputs are limited, assumptions about market activity and risk are used and such securities are generally categorized within Level 3 of the fair value hierarchy.
The following is a summary of the inputs used as of December 31, 2021 in valuing the fund’s investments:
| | | | | | | |
| | Level 1-Unadjusted Quoted Prices | Level 2- Other Significant Observable Inputs | | Level 3-Significant Unobservable Inputs | Total | |
Assets ($) | | |
Investments in Securities:† | | |
Equity Securities - Common Stocks | 109,202,188 | - | | - | 109,202,188 | |
Investment Companies | 2,207,671 | - | | - | 2,207,671 | |
† See Statement of Investments for additional detailed categorizations, if any.
(b) Foreign taxes: The fund may be subject to foreign taxes (a portion of which may be reclaimable) on income, stock dividends, realized and unrealized capital gains on investments or certain foreign currency transactions. Foreign taxes are recorded in accordance with the applicable foreign tax regulations and rates that exist in the foreign jurisdictions in which the fund invests. These foreign taxes, if any, are paid by the fund and are reflected in the Statement of Operations, if applicable. Foreign taxes payable or deferred or those subject to reclaims as of December 31, 2021, if any, are disclosed in the fund’s Statement of Assets and Liabilities.
(c) Securities transactions and investment income: Securities transactions are recorded on a trade date basis. Realized gains and losses from securities transactions are recorded on the identified cost basis. Dividend income is recognized on the ex-dividend date and interest income, including, where applicable, accretion of discount and amortization of premium on investments, is recognized on the accrual basis.
Pursuant to a securities lending agreement with The Bank of New York Mellon, a subsidiary of BNY Mellon and an affiliate of the Adviser, the fund may lend securities to qualified institutions. It is the fund’s policy that, at origination, all loans are secured by collateral of at least 102% of the value of U.S. securities loaned and 105% of the value of foreign securities loaned. Collateral equivalent to at least 100% of the market value of securities on loan is maintained at all times. Collateral is either in the form of cash, which can be invested in certain money market mutual funds managed by the Adviser, or U.S. Government and Agency securities. The fund is entitled to receive all dividends, interest and distributions on
21
NOTES TO FINANCIAL STATEMENTS (continued)
securities loaned, in addition to income earned as a result of the lending transaction. Should a borrower fail to return the securities in a timely manner, The Bank of New York Mellon is required to replace the securities for the benefit of the fund or credit the fund with the market value of the unreturned securities and is subrogated to the fund’s rights against the borrower and the collateral. Additionally, the contractual maturity of security lending transactions are on an overnight and continuous basis. During the period ended December 31, 2021, The Bank of New York Mellon earned $746 from the lending of the fund’s portfolio securities, pursuant to the securities lending agreement.
(d) Affiliated issuers: Investments in other investment companies advised by the Adviser are considered “affiliated” under the Act.
(e) Risk: Certain events particular to the industries in which the fund’s investments conduct their operations, as well as general economic, political and public health conditions, may have a significant negative impact on the investee’s operations and profitability. In addition, turbulence in financial markets and reduced liquidity in equity, credit and/or fixed income markets may negatively affect many issuers, which could adversely affect the fund. Global economies and financial markets are becoming increasingly interconnected, and conditions and events in one country, region or financial market may adversely impact issuers in a different country, region or financial market. These risks may be magnified if certain events or developments adversely interrupt the global supply chain; in these and other circumstances, such risks might affect companies world-wide. Recent examples include pandemic risks related to COVID-19 and aggressive measures taken world-wide in response by governments, including closing borders, restricting international and domestic travel, and the imposition of prolonged quarantines of large populations, and by businesses, including changes to operations and reducing staff. The effects of COVID-19 have contributed to increased volatility in global markets and will likely affect certain countries, companies, industries and market sectors more dramatically than others. The COVID-19 pandemic has had, and any other outbreak of an infectious disease or other serious public health concern could have, a significant negative impact on economic and market conditions and could trigger a prolonged period of global economic slowdown. To the extent the fund may overweight its investments in certain countries, companies, industries or market sectors, such positions will increase the fund’s exposure to risk of loss from adverse developments affecting those countries, companies, industries or sectors.
(f) Dividends and distributions to shareholders: Dividends and distributions are recorded on the ex-dividend date. Dividends from
22
investment income-net are normally declared and paid quarterly. Dividends from net realized capital gains, if any, are normally declared and paid annually, but the fund may make distributions on a more frequent basis to comply with the distribution requirements of the Internal Revenue Code of 1986, as amended (the “Code”). To the extent that net realized capital gains can be offset by capital loss carryovers, it is the policy of the fund not to distribute such gains. Income and capital gain distributions are determined in accordance with income tax regulations, which may differ from GAAP.
(g) Federal income taxes: It is the policy of the fund to continue to qualify as a regulated investment company, if such qualification is in the best interests of its shareholders, by complying with the applicable provisions of the Code, and to make distributions of taxable income and net realized capital gain sufficient to relieve it from substantially all federal income and excise taxes.
As of and during the period ended December 31, 2021, the fund did not have any liabilities for any uncertain tax positions. The fund recognizes interest and penalties, if any, related to uncertain tax positions as income tax expense in the Statement of Operations. During the period ended December 31, 2021, the fund did not incur any interest or penalties.
Each tax year in the four year period ended December 31, 2021 remains subject to examination by the Internal Revenue Service and state taxing authorities.
At December 31, 2021, the components of accumulated earnings on a tax basis were as follows: undistributed ordinary income $2,129,480 undistributed capital gains $16,634,174 and unrealized appreciation $39,417,664.
The tax character of distributions paid to shareholders during the fiscal periods ended December 31, 2021 and December 31, 2020 were as follows: ordinary income $1,257,376 and $630,155, and long-term capital gains $6,100,278 and $6,116,056, respectively.
NOTE 2—Bank Lines of Credit:
The fund participates with other long-term open-end funds managed by the Adviser in a $823.5 million unsecured credit facility led by Citibank, N.A. (the “Citibank Credit Facility”) and a $300 million unsecured credit facility provided by The Bank of New York Mellon (the “BNYM Credit Facility”), each to be utilized primarily for temporary or emergency purposes, including the financing of redemptions (each, a “Facility”). The Citibank Credit Facility is available in two tranches: (i) Tranche A is in an
23
NOTES TO FINANCIAL STATEMENTS (continued)
amount equal to $688.5 million and is available to all long-term open-ended funds, including the fund, and (ii) Tranche B is an amount equal to $135 million and is available only to BNY Mellon Floating Rate Income Fund, a series of BNY Mellon Investment Funds IV, Inc. In connection therewith, the fund has agreed to pay its pro rata portion of commitment fees for Tranche A of the Citibank Credit Facility and the BNYM Credit Facility. Interest is charged to the fund based on rates determined pursuant to the terms of the respective Facility at the time of borrowing. During the period ended December 31, 2021, the fund did not borrow under the Facilities.
NOTE 3—Investment Advisory Fee, Sub-Investment Advisory Fee and Other Transactions with Affiliates:
(a) Pursuant to an investment advisory agreement with the Adviser, the investment advisory fee is computed at the annual rate of .75% of the value of the fund’s average daily net assets and is payable monthly. The Adviser has contractually agreed, from January 1, 2021 through April 30, 2022, to waive receipt of its fees and/or assume the direct expenses of the fund, so that the direct expenses of none of the classes (excluding Rule 12b-1 Distribution Plan fees, taxes, interest expense, brokerage commissions, commitment fees on borrowings and extraordinary expenses) exceed .80% of the value of the fund’s average daily net assets. On or after April 30, 2022, the Adviser may terminate this expense limitation at any time. The reduction in expenses, pursuant to the undertaking, amounted to $110,008 during the period ended December 31, 2021.
As of the Effective Date, pursuant to a sub-investment advisory agreement between the Adviser and the Sub-Adviser, the Adviser pays the Sub-Adviser a monthly fee at an annual rate of .36% of the value of the fund’s average daily net assets.
(b) Under the Distribution Plan adopted pursuant to Rule 12b-1 under the Act, Service shares pay the Distributor for distributing its shares, for servicing and/or maintaining Service shares’ shareholder accounts and for advertising and marketing for Service shares. The Distribution Plan provides for payments to be made at an annual rate of .25% of the value of the Service shares’ average daily net assets. The Distributor may make payments to Participating Insurance Companies and to brokers and dealers acting as principal underwriter for their variable insurance products. The fees payable under the Distribution Plan are payable without regard to actual expenses incurred. During the period ended December 31, 2021, Service shares were charged $12,631 pursuant to the Distribution Plan.
24
The fund has an arrangement with the transfer agent whereby the fund may receive earnings credits when positive cash balances are maintained, which are used to offset transfer agency fees. For financial reporting purposes, the fund includes net earnings credits, if any, as shareholder servicing costs in the Statement of Operations.
The fund has an arrangement with the custodian whereby the fund will receive interest income or be charged overdraft fees when cash balances are maintained. For financial reporting purposes, the fund includes this interest income and overdraft fees, if any, as interest income in the Statement of Operations.
The fund compensates BNY Mellon Transfer, Inc., a wholly-owned subsidiary of the Adviser, under a transfer agency agreement for providing transfer agency and cash management services inclusive of earnings credits, if any, for the fund. The majority of transfer agency fees are comprised of amounts paid on a per account basis, while cash management fees are related to fund subscriptions and redemptions. During the period ended December 31, 2021, the fund was charged $674 for transfer agency services, inclusive of earnings credit, if any. These fees are included in Shareholder servicing costs in the Statement of Operations.
The fund compensates The Bank of New York Mellon under a custody agreement for providing custodial services for the fund. These fees are determined based on net assets, geographic region and transaction activity. During the period ended December 31, 2021, the fund was charged $7,938 pursuant to the custody agreement.
During the period ended December 31, 2021, the fund was charged $14,276 for services performed by the Chief Compliance Officer and his staff. These fees are included in Chief Compliance Officer fees in the Statement of Operations.
The components of “Due to BNY Mellon Investment Adviser, Inc. and affiliates” in the Statement of Assets and Liabilities consist of: investment advisory fees of $69,976, Distribution Plan fees of $1,036, custodian fees of $2,400, Chief Compliance Officer fees of $3,627 and transfer agency fees of $133, which are offset against an expense reimbursement currently in effect in the amount of $9,046.
(c) Each Board member also serves as a Board member of other funds in the BNY Mellon Family of Funds complex. Annual retainer fees and attendance fees are allocated to each fund based on net assets.
25
NOTES TO FINANCIAL STATEMENTS (continued)
NOTE 4—Securities Transactions:
The aggregate amount of purchases and sales of investment securities, excluding short-term securities, during the period ended December 31, 2021, amounted to $55,680,017 and $65,067,077, respectively.
At December 31, 2021, the cost of investments for federal income tax purposes was $71,992,195 accordingly, accumulated net unrealized appreciation on investments was $39,417,664, consisting of $41,875,975 gross unrealized appreciation and $2,458,311 gross unrealized depreciation.
26
REPORT OF INDEPENDENT REGISTERED PUBLIC ACCOUNTING FIRM
To the Shareholders and the Board of Trustees of Growth and Income Portfolio
Opinion on the Financial Statements
We have audited the accompanying statement of assets and liabilities of Growth and Income Portfolio (the “Fund”) (one of the funds constituting BNY Mellon Variable Investment Fund), including the statements of investments and investments in affiliated issuers, as of December 31, 2021, and the related statement of operations for the year then ended, the statements of changes in net assets for each of the two years in the period then ended, the financial highlights for each of the five years in the period then ended and the related notes (collectively referred to as the “financial statements”). In our opinion, the financial statements present fairly, in all material respects, the financial position of the Fund (one of the funds constituting BNY Mellon Variable Investment Fund) at December 31, 2021, the results of its operations for the year then ended, the changes in its net assets for each of the two years in the period then ended and its financial highlights for each of the five years in the period then ended, in conformity with U.S. generally accepted accounting principles.
Basis for Opinion
These financial statements are the responsibility of the Fund’s management. Our responsibility is to express an opinion on the Fund’s financial statements based on our audits. We are a public accounting firm registered with the Public Company Accounting Oversight Board (United States) (“PCAOB”) and are required to be independent with respect to the Fund in accordance with the U.S. federal securities laws and the applicable rules and regulations of the Securities and Exchange Commission and the PCAOB.
We conducted our audits in accordance with the standards of the PCAOB. Those standards require that we plan and perform the audit to obtain reasonable assurance about whether the financial statements are free of material misstatement, whether due to error or fraud. The Fund is not required to have, nor were we engaged to perform, an audit of the Fund’s internal control over financial reporting. As part of our audits, we are required to obtain an understanding of internal control over financial reporting, but not for the purpose of expressing an opinion on the effectiveness of the Fund’s internal control over financial reporting. Accordingly, we express no such opinion.
Our audits included performing procedures to assess the risks of material misstatement of the financial statements, whether due to error or fraud, and performing procedures that respond to those risks. Such procedures included examining, on a test basis, evidence regarding the amounts and disclosures in the financial statements. Our procedures included confirmation of securities owned as of December 31, 2021, by correspondence with the custodian and others or by other appropriate auditing procedures where replies from others were not received. Our audits also included evaluating the accounting principles used and significant estimates made by management, as well as evaluating the overall presentation of the financial statements. We believe that our audits provide a reasonable basis for our opinion.

We have served as the auditor of one or more investment companies in the BNY Mellon Family of Funds since at least 1957, but we are unable to determine the specific year.
New York, New York
February 8, 2022
27
IMPORTANT TAX INFORMATION (Unaudited)
For federal tax purposes, the portfolio hereby reports 70.52% of the ordinary dividends paid during the fiscal year ended December 31, 2021 as qualifying for the corporate dividends received deduction. Shareholders will receive notification in early 2022 of the percentage applicable to the preparation of their 2021 income tax returns. Also, the portfolio hereby reports $2.2969 per share as a long-term capital gain distribution and $.2889 per share as a short-term capital gain distribution paid on March 31, 2021.
28
BOARD MEMBERS INFORMATION (Unaudited)
Independent Board Members
Joseph S. DiMartino (78)
Chairman of the Board (1995)
Principal Occupation During Past 5 Years:
· Director or Trustee of funds in the BNY Mellon Family of Funds and certain other entities (as described in the fund’s Statement of Additional Information) (1995-Present)
Other Public Company Board Memberships During Past 5 Years:
· CBIZ, Inc., a public company providing professional business services, products and solutions, Director (1997-Present)
No. of Portfolios for which Board Member Serves: 96
———————
Peggy C. Davis (78)
Board Member (2006)
Principal Occupation During Past 5 Years:
· Shad Professor of Law, New York University School of Law (1983-Present)
No. of Portfolios for which Board Member Serves: 34
———————
Gina D. France (63)
Board Member (2019)
Principal Occupation During Past 5 Years:
· France Strategic Partners, a strategy and advisory firm serving corporate clients across the United States, Founder, President and Chief Executive Officer (2003-Present)
Other Public Company Board Memberships During Past 5 Years:
· Huntington Bancshares, a bank holding company headquartered in Columbus, Ohio, Director (2016-Present)
· Cedar Fair, L.P., a publicly-traded partnership that owns and operates amusement parks and hotels in the U.S. and Canada, Director (2011-Present)
· CBIZ, Inc., a public company providing professional business services, products and solutions, Director (2015-Present)
· FirstMerit Corporation, a diversified financial services company, Director (2004-2016)
No. of Portfolios for which Board Member Serves: 24
———————
29
BOARD MEMBERS INFORMATION (Unaudited) (continued)
Joan Gulley (74)
Board Member (2017)
Principal Occupation During Past 5 Years:
· Nantucket Atheneum, public library, Chair (2018-June 2021) and Director (2015-June 2021)
· Orchard Island Club, golf and beach club, Governor (2016-Present)
No. of Portfolios for which Board Member Serves: 42
———————
Robin A. Melvin (58)
Board Member (2012)
Principal Occupation During Past 5 Years:
· Westover School, a private girls’ boarding school in Middlebury, Connecticut, Trustee (2019-Present)
· Mentor Illinois, a non-profit organization dedicated to increasing the quality of mentoring services in Illinois, Co-Chair (2014–2020); Board Member, Mentor Illinois (2013-2020)
· JDRF, a non-profit juvenile diabetes research foundation, Board Member (June 2021-Present)
Other Public Company Board Memberships During Past 5 Years:
· HPS Corporate Lending Fund, a closed-end management investment company regulated as a business development company, Trustee (August 2021-Present)
No. of Portfolios for which Board Member Serves: 74
———————
Once elected all Board Members serve for an indefinite term, but achieve Emeritus status upon reaching age 80. The address of the Board Members and Officers is c/o BNY Mellon Investment Adviser, Inc. 240 Greenwich Street, New York, New York 10286. Additional information about the Board Members is available in the fund’s Statement of Additional Information which can be obtained from the Adviser free of charge by calling this toll free number: 1-800-373-9387.
David P. Feldman, Emeritus Board Member
Ehud Houminer, Emeritus Board Member
Lynn Martin, Emeritus Board Member
Dr. Martin Peretz, Emeritus Board Member
Philip L. Toia, Emeritus Board Member
30
OFFICERS OF THE FUND (Unaudited)
DAVID DIPETRILLO, President since January 2021.
Vice President and Director of the Adviser since February 2021; Head of North America Product, BNY Mellon Investment Management since January 2018; Director of Product Strategy, BNY Mellon Investment Management from January 2016 to December 2017. He is an officer of 56 investment companies (comprised of 109 portfolios) managed by the Adviser or an affiliate of the Adviser. He is 43 years old and has been an employee of BNY Mellon since 2005.
JAMES WINDELS, Treasurer since November 2001.
Vice President of the Adviser since September 2020; Director–BNY Mellon Fund Administration, and an officer of 57 investment companies (comprised of 130 portfolios) managed by the Adviser or an affiliate of the Adviser. He is 63 years old and has been an employee of the Adviser since April 1985.
PETER M. SULLIVAN, Chief Legal Officer since July 2021 and Vice President and Assistant Secretary since March 2019.
Chief Legal Officer of the Adviser and Associate General Counsel of BNY Mellon since July 2021; Senior Managing Counsel of BNY Mellon from December 2020 to July 2021; Managing Counsel of BNY Mellon from March 2009 to December 2020, and an officer of 57 investment companies (comprised of 130 portfolios) managed by the Adviser or an affiliate of the Adviser. He is 53 years old and has been an employee of BNY Mellon since April 2004.
JAMES BITETTO, Vice President since August 2005 and Secretary since February 2018.
Senior Managing Counsel of BNY Mellon since December 2019; Managing Counsel of BNY Mellon from April 2014 to December 2019; Secretary of the Adviser, and an officer of 57 investment companies (comprised of 130 portfolios) managed by the Adviser or an affiliate of the Adviser. He is 55 years old and has been an employee of the Adviser since December 1996.
DEIRDRE CUNNANE, Vice President and Assistant Secretary since March 2019.
Managing Counsel of BNY Mellon since December 2021, Counsel of BNY Mellon from August 2018 to December 2021; and Senior Regulatory Specialist at BNY Mellon Investment Management Services from February 2016 to August 2018. She is an officer of 57 investment companies (comprised of 130 portfolios) managed by the Adviser or an affiliate of the Adviser. She is 31 years old and has been an employee of the Adviser since August 2018.
SARAH S. KELLEHER, Vice President and Assistant Secretary since April 2014.
Vice President of BNY Mellon ETF Investment Adviser; LLC since February 2020; Senior Managing Counsel of BNY Mellon since September 2021; Managing Counsel of BNY Mellon from December 2017 to September 2021; and Senior Counsel of BNY Mellon from March 2013 to December 2017. She is an officer of 57 investment companies (comprised of 130 portfolios) managed by the Adviser or an affiliate of the Adviser. She is 46 years old and has been an employee of the Adviser since March 2013.
JEFF PRUSNOFSKY, Vice President and Assistant Secretary since August 2005.
Senior Managing Counsel of BNY Mellon, and an officer of 57 investment companies (comprised of 130 portfolios) managed by the Adviser or an affiliate of the Adviser. He is 56 years old and has been an employee of the Adviser since October 1990.
AMANDA QUINN, Vice President and Assistant Secretary since March 2020.
Counsel of BNY Mellon since June 2019; Regulatory Administration Manager at BNY Mellon Investment Management Services from September 2018 to May 2019; and Senior Regulatory Specialist at BNY Mellon Investment Management Services from April 2015 to August 2018. She is an officer of 57 investment companies (comprised of 130 portfolios) managed by the Adviser or an affiliate of the Adviser. She is 36 years old and has been an employee of the Adviser since June 2019.
31
OFFICERS OF THE FUND (Unaudited) (continued)
NATALYA ZELENSKY, Vice President and Assistant Secretary since March 2017.
Chief Compliance Officer since August 2021 and Vice President since February 2020 of BNY Mellon ETF Investment Adviser, LLC; Chief Compliance Officer since August 2021 and Vice President and Assistant Secretary since February 2020 of BNY Mellon ETF Trust; Managing Counsel of BNY Mellon from December 2019 to August 2021; Counsel of BNY Mellon from May 2016 to December 2019; Assistant Secretary of the Adviser from April 2018 to August 2021. She is an officer of 56 investment companies (comprised of 129 portfolios) managed by the Adviser or an affiliate of the Adviser. She is 36 years old and has been an employee of BNY Mellon since May 2016.
GAVIN C. REILLY, Assistant Treasurer since December 2005.
Tax Manager–BNY Mellon Fund Administration, and an officer of 57 investment companies (comprised of 130 portfolios) managed by the Adviser or an affiliate of the Adviser. He is 53 years old and has been an employee of the Adviser since April 1991.
ROBERT SALVIOLO, Assistant Treasurer since July 2007.
Senior Accounting Manager–BNY Mellon Fund Administration, and an officer of 57 investment companies (comprised of 130 portfolios) managed by the Adviser or an affiliate of the Adviser. He is 54 years old and has been an employee of the Adviser since June 1989.
ROBERT SVAGNA, Assistant Treasurer since December 2002.
Senior Accounting Manager–BNY Mellon Fund Administration, and an officer of 57 investment companies (comprised of 130 portfolios) managed by the Adviser or an affiliate of the Adviser. He is 54 years old and has been an employee of the Adviser since November 1990.
JOSEPH W. CONNOLLY, Chief Compliance Officer since October 2004.
Chief Compliance Officer of the BNY Mellon Family of Funds and BNY Mellon Funds Trust since 2004; Chief Compliance Officer of the Adviser from 2004 until June 2021. He is an officer of 56 investment companies (comprised of 117 portfolios) managed by the Adviser. He is 64 years old.
CARIDAD M. CAROSELLA, Anti-Money Laundering Compliance Officer since January 2016.
Anti-Money Laundering Compliance Officer of the BNY Mellon Family of Funds and BNY Mellon Funds Trust. She is an officer of 49 investment companies (comprised of 122 portfolios) managed by the Adviser or an affiliate of the Adviser. She is 53 years old and has been an employee of the Distributor since 1997.
32
This page intentionally left blank.
33
BNY Mellon Variable Investment Fund, Growth and Income Portfolio
240 Greenwich Street
New York, NY 10286
Adviser
BNY Mellon Investment Adviser, Inc.
240 Greenwich Street
New York, NY 10286
Sub-Adviser
Newton Investment Management
North America, LLC
BNY Mellon Center
201 Washington Place
Boston, MA 02108
Custodian
The Bank of New York Mellon
240 Greenwich Street
New York, NY 10286
Transfer Agent &
Dividend Disbursing Agent
BNY Mellon Transfer, Inc.
240 Greenwich Street
New York, NY 10286
Distributor
BNY Mellon Securities Corporation
240 Greenwich Street
New York, NY 10286
Telephone 1-800-258-4260 or 1-800-258-4261
Mail The BNY Mellon Family of Funds, 144 Glenn Curtiss Boulevard, Uniondale, NY 11556-0144 Attn: Institutional Services Department
E-mail Send your request to info@bnymellon.com
Internet Information can be viewed online or downloaded at www.im.bnymellon.com
The fund files its complete schedule of portfolio holdings with the Securities and Exchange Commission (“SEC”) for the first and third quarters of each fiscal year on Form N-PORT. The fund’s Forms N-PORT are available on the SEC’s website at www.sec.gov.
A description of the policies and procedures that the fund uses to determine how to vote proxies relating to portfolio securities and information regarding how the fund voted these proxies for the most recent 12-month period ended June 30 is available at www.im.bnymellon.com and on the SEC’s website at www.sec.gov and without charge, upon request, by calling 1-800-373-9387.
| | |
© 2022 BNY Mellon Securities Corporation
0108AR1221 | 
|
BNY Mellon Variable Investment Fund, Opportunistic Small Cap Portfolio
| |
ANNUAL REPORT December 31, 2021 |

| |
Save time. Save paper. View your next shareholder report online as soon as it’s available. Log into www.im.bnymellon.com and sign up for eCommunications. It’s simple and only takes a few minutes. |
| |
The views expressed in this report reflect those of the portfolio manager(s) only through the end of the period covered and do not necessarily represent the views of BNY Mellon Investment Adviser, Inc. or any other person in the BNY Mellon Investment Adviser, Inc. organization. Any such views are subject to change at any time based upon market or other conditions and BNY Mellon Investment Adviser, Inc. disclaims any responsibility to update such views. These views may not be relied on as investment advice and, because investment decisions for a fund in the BNY Mellon Family of Funds are based on numerous factors, may not be relied on as an indication of trading intent on behalf of any fund in the BNY Mellon Family of Funds. |
| |
Not FDIC-Insured • Not Bank-Guaranteed • May Lose Value |
Contents
T H E F U N D
F O R M O R E I N F O R M AT I O N
Back Cover
DISCUSSION OF FUND PERFORMANCE (Unaudited)
For the period from January 1, 2021 through December 31, 2021, as provided by portfolio managers Patrick Kent, James Boyd and Andrew Leger of Newton Investment Management North America, LLC, Sub-Investment Adviser
Market and Fund Performance Overview
For the 12-month period ended December 31, 2021, BNY Mellon Variable Investment Fund, Opportunistic Small Cap Portfolio’s (the “fund”) Initial shares produced a total return of 16.46%, and its Service shares produced a total return of 16.16%.1 In comparison, the Russell 2000® Index (the “Index”), the fund’s benchmark, produced a total return of 14.82% for the same period.2
Small-cap stocks rose over the reporting period, as the economy recovered in response to easing government shutdowns and the prospect of COVID-19 vaccines. The fund outperformed the Index, mainly due to stock selection decisions.
The Fund’s Investment Approach
The fund seeks capital growth. To pursue its goal, the fund normally invests at least 80% of its net assets, plus any borrowings for investment purposes, in the stocks of small-cap companies. The fund currently considers small-cap companies to be those companies with market capitalizations that fall within the range of the companies in the Index. Stocks are selected for the fund’s portfolio based primarily on bottom-up, fundamental analysis. The fund’s portfolio managers use a disciplined investment process that relies, in general, on proprietary fundamental research and valuation.
Generally, elements of the process include analysis of mid-cycle business prospects, estimation of the intrinsic value of the company. In general, the fund seeks exposure to securities and sectors that are perceived to be attractive from a valuation and fundamental standpoint.
Stocks Weather COVID-19 Variants, Supply Bottlenecks, Inflation and Monetary Policy
Markets performed well during the reporting period, supported generally by strong corporate earnings. Early in the period, stocks benefited from the approval of multiple COVID-19 vaccines in November 2020, which brightened the global economic outlook and improved investor sentiment. Investors also factored the likelihood of additional stimulus and infrastructure spending into their calculations. Returns were also boosted by interest rates, which remained low.
With the end of the pandemic apparently in view early in 2021, government lockdowns were eased, and businesses that had been hard hit by the pandemic began to show signs of recovery. Businesses also became more confident and increased their capital spending. With continued economic rebound likely, investors began to shift away from growth-oriented stocks and into value-oriented stocks.
But with the emergence of the Delta variant of COVID-19 midway through 2021, questions about whether the economic recovery would stall weighed on the market. In addition, supply-chain bottlenecks hindered sales in some industries and created winners and losers. Supply-chain bottlenecks, combined with loose monetary policy and massive federal spending, caused inflation to rise during the reporting period. While the Federal Reserve (the “Fed”) initially called it “transitory,” it acknowledged late in the period that pricing pressures were more permanent. In response, the Fed announced that in addition to tapering its bond purchases late in 2021, it was likely to hike interest rate hikes in 2022.
Growth stocks came into, and fell out of, favor at times. When concerns about the economy rose, the market favored growth stocks, but when positive news on the pandemic emerged, value and cyclical stocks came into favor. When expectations that the Fed would begin to tighten monetary policy rose, the performance of growth stocks lagged, and when the Omicron variant of the COVID-19 posed a threat to the economic recovery, growth stocks benefited, while cyclical stocks lagged.
While markets wavered at times as investors digested pandemic news, rising inflation and Fed policy, markets were supported by strong corporate earnings worldwide, especially in the U.S.
2
Security Selection Decisions Benefited Fund Performance
The fund’s performance versus the Index was primarily the result of stock selection decisions. Selections in the health care, consumer discretionary and utilities sector were the leading positive contributors. In the health care sector, an underweight position was also advantageous. In the health care sector, an underweight to the biotechnology industry was beneficial, and a position in Xenon Pharmaceutical also contributed positively. Similarly, in the pharmaceuticals industry, an underweight was beneficial, and a position in GW Pharmaceuticals also was advantageous. Selections in the health care providers & services industry also were favorable. Apria, which makes products for sleep apnea and other illnesses, performed especially well. In the consumer discretionary sector, shares of publisher Houghton Mifflin Harcourt were the primary driver of performance as the company continued to benefit from a move into digital products. In the utilities sector, the leading positive contributor was NextEra Energy Partners, which focuses on renewable energy.
On a less positive note, the communication services sector was the primary detractor. An overweight position in the interactive media & services industry hindered performance as did shares of EverQuote, an online insurance portal. In the media industry, Cardlytics, a digital advertising company serving the banking industry, was the leading detractor. Positions in SOC Telemed, an acute care telemedicine firm, Array Technologies, which makes solar panel tracking systems, and Paya Holdings, a payments company, were also primary detractors.
An Optimistic Outlook for Small-Cap Stocks
Given their more reasonable valuations, we remain positive on small-cap stocks in the U.S. market. While the valuation of the S&P 500® Index is at the high end of its historical range, valuations on small caps are closer to their average. Importantly, many segments of the domestic economy, which small caps are more exposed to, remain constrained by lingering concerns over the pandemic. This is likely to continue to abate. Moreover, in our view earnings growth for small caps is likely to be higher than for large caps in 2022 and 2023.
January 18, 2022
¹ Total return includes reinvestment of dividends and any capital gains paid. Past performance is no guarantee of future results. Share price and investment return fluctuate such that upon redemption, fund shares may be worth more or less than their original cost. The fund’s performance does not reflect the deduction of additional charges and expenses imposed in connection with investing in variable insurance contracts, which will reduce returns.
² Source: Lipper Inc. — The Russell 2000® Index measures the performance of the small-cap segment of the U.S. equity universe. The Russell 2000® Index is a subset of the Russell 3000® Index, representing approximately 10% of the total market capitalization of that index. It includes approximately 2,000 of the smallest securities based on a combination of their market cap and current index membership. The Russell 2000® Index is constructed to provide a comprehensive and unbiased, small-cap barometer and is completely reconstituted annually to ensure larger stocks do not distort the performance and characteristics of the true, small-cap opportunity set. Investors cannot invest directly in any index.
Please note: the position in any security highlighted with italicized typeface was sold during the reporting period.
Equities are subject generally to market, market sector, market liquidity, issuer and investment style risks, among other factors, to varying degrees, all of which are more fully described in the fund’s prospectus.
Stocks of small- and/or mid-cap companies often experience sharper price fluctuations than stocks of large-cap companies.
The fund is only available as a funding vehicle under variable life insurance policies or variable annuity contracts issued by insurance companies. Individuals may not purchase shares of the fund directly. A variable annuity is an insurance contract issued by an insurance company that enables investors to accumulate assets on a tax-deferred basis for retirement or other long-term goals. The investment objective and policies of BNY Mellon Variable Investment Fund, Opportunistic Small Cap Portfolio made available through insurance products may be similar to those of other funds managed or advised by BNY Mellon Investment Adviser, Inc. However, the investment results of the fund may be higher or lower than, and may not be comparable to, those of any other BNY Mellon fund.
Recent market risks include pandemic risks related to COVID-19. The effects of COVID-19 have contributed to increased volatility in global markets and will likely affect certain countries, companies, industries and market sectors more dramatically than others. To the extent the fund may overweight its investments in certain countries, companies, industries or market sectors, such positions will increase the fund’s exposure to risk of loss from adverse developments affecting those countries, companies, industries or sectors.
3
FUND PERFORMANCE (Unaudited)
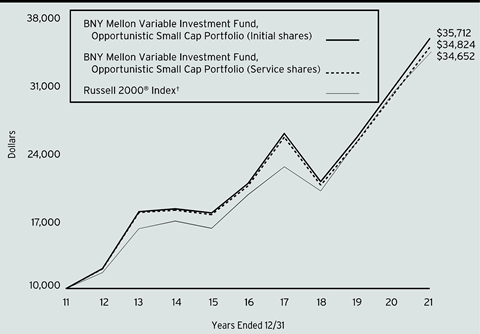
Comparison of change in value of a $10,000 investment in Initial shares and Service shares of BNY Mellon Variable Investment Fund, Opportunistic Small Cap Portfolio with a hypothetical investment of $10,000 in the Russell 2000® Index (the “Index”).
† Source: Lipper Inc.
Past performance is not predictive of future performance. The fund’s performance does not reflect the deduction of additional charges and expenses imposed in connection with investing in variable insurance contracts which will reduce returns.
The above graph compares a hypothetical investment of $10,000 made in Initial and Service shares of BNY Mellon Variable Investment Fund, Opportunistic Small Cap Portfolio on 12/31/11 to a hypothetical investment of $10,000 made in the Index on that date.
The fund’s performance shown in the line graph above takes into account all applicable fees and expenses. The Index measures the performance of the small-cap segment of the U.S. equity universe. The Index is a subset of the Russell 3000® Index representing approximately 10% of the total market capitalization of that index. It includes approximately 2,000 of the smallest securities based on a combination of their market cap and current index membership. The Index is constructed to provide a comprehensive and unbiased small-cap barometer and is completely reconstituted annually to ensure larger stocks do not distort the performance and characteristics of the true small-cap opportunity set. Unlike a mutual fund, the Index is not subject to charges, fees and other expenses. Investors cannot invest directly in any index. Further information relating to fund performance, including expense reimbursements, if applicable, is contained in the Financial Highlights section of the prospectus and elsewhere in this report.
4
| | | | |
Average Annual Total Returns as of 12/31/2021 |
| 1 Year | 5 Years | 10 Years |
Initial shares | 16.46% | 11.40% | 13.58% |
Service shares | 16.16% | 11.12% | 13.29% |
Russell 2000® Index | 14.82% | 12.02% | 13.23% |
The performance data quoted represents past performance, which is no guarantee of future results. Share price and investment return fluctuate and an investor’s shares may be worth more or less than original cost upon redemption. Current performance may be lower or higher than the performance quoted. Go to www.im.bnymellon.com for the fund’s most recent month-end returns.
The fund’s Initial shares are not subject to a Rule 12b-1 fee. The fund’s Service shares are subject to a 0.25% annual Rule 12b-1 fee. All dividends and capital gain distributions are reinvested.
The fund’s performance shown in the graph and table does not reflect the deduction of taxes that a shareholder would pay on fund distributions or the redemption of fund shares.
5
UNDERSTANDING YOUR FUND’S EXPENSES (Unaudited)
As a mutual fund investor, you pay ongoing expenses, such as management fees and other expenses. Using the information below, you can estimate how these expenses affect your investment and compare them with the expenses of other funds. You also may pay one-time transaction expenses, including sales charges (loads), redemption fees and expenses associated with variable annuity or insurance contracts, which are not shown in this section and would have resulted in higher total expenses. For more information, see your fund’s prospectus or talk to your financial adviser.
Review your fund’s expenses
The table below shows the expenses you would have paid on a $1,000 investment in BNY Mellon Variable Investment Fund, Opportunistic Small Cap Portfolio from July 1, 2021 to December 31, 2021. It also shows how much a $1,000 investment would be worth at the close of the period, assuming actual returns and expenses.
| | | | | |
Expenses and Value of a $1,000 Investment | |
Assume actual returns for the six months ended December 31, 2021 | |
| | | | |
| | Initial Shares | Service Shares | |
Expenses paid per $1,000† | $4.09 | $5.35 | |
Ending value (after expenses) | $1,005.20 | $1,003.80 | |
COMPARING YOUR FUND’S EXPENSES
WITH THOSE OF OTHER FUNDS (Unaudited)
Using the SEC’s method to compare expenses
The Securities and Exchange Commission (“SEC”) has established guidelines to help investors assess fund expenses. Per these guidelines, the table below shows your fund’s expenses based on a $1,000 investment, assuming a hypothetical 5% annualized return. You can use this information to compare the ongoing expenses (but not transaction expenses or total cost) of investing in the fund with those of other funds. All mutual fund shareholder reports will provide this information to help you make this comparison. Please note that you cannot use this information to estimate your actual ending account balance and expenses paid during the period.
| | | | | |
Expenses and Value of a $1,000 Investment | |
Assuming a hypothetical 5% annualized return for the six months ended December 31, 2021 | |
| | | | |
| | Initial Shares | Service Shares | |
Expenses paid per $1,000† | $4.13 | $5.40 | |
Ending value (after expenses) | $1,021.12 | $1,019.86 | |
† | Expenses are equal to the fund’s annualized expense ratio of .81% for Initial Shares and 1.06% for Service Shares, multiplied by the average account value over the period, multiplied by 184/365 (to reflect the one-half year period). |
6
STATEMENT OF INVESTMENTS
December 31, 2021
| | | | | | | | |
| |
Description | | | | Shares | | Value ($) | |
Common Stocks - 96.3% | | | | | |
Banks - 9.8% | | | | | |
BankUnited | | | | 136,634 | | 5,780,985 | |
Essent Group | | | | 104,804 | | 4,771,726 | |
First Bancorp | | | | 491,990 | | 6,779,622 | |
First Interstate BancSystem, Cl. A | | | | 92,477 | | 3,761,040 | |
First Merchants | | | | 80,386 | | 3,367,370 | |
Silvergate Capital, Cl. A | | | | 20,158 | a | 2,987,416 | |
Synovus Financial | | | | 120,513 | | 5,768,957 | |
| | | | | 33,217,116 | |
Capital Goods - 16.3% | | | | | |
Array Technologies | | | | 260,380 | a,b | 4,085,362 | |
EnerSys | | | | 53,375 | | 4,219,827 | |
Fluor | | | | 268,696 | a | 6,655,600 | |
Gibraltar Industries | | | | 53,274 | a | 3,552,310 | |
GrafTech International | | | | 485,243 | | 5,740,425 | |
Matrix Service | | | | 234,662 | a | 1,764,658 | |
Maxar Technologies | | | | 121,766 | | 3,595,750 | |
Regal Rexnord | | | | 17,367 | | 2,955,516 | |
Terex | | | | 56,125 | | 2,466,694 | |
Titan Machinery | | | | 89,876 | a | 3,027,922 | |
Triumph Group | | | | 92,434 | a | 1,712,802 | |
Valmont Industries | | | | 15,838 | | 3,967,419 | |
Wabash National | | | | 256,667 | | 5,010,140 | |
WESCO International | | | | 47,061 | a | 6,192,757 | |
| | | | | 54,947,182 | |
Commercial & Professional Services - 1.9% | | | | | |
The Brink's Company | | | | 46,036 | | 3,018,580 | |
U.S. Ecology | | | | 102,215 | a | 3,264,747 | |
| | | | | 6,283,327 | |
Consumer Durables & Apparel - 2.3% | | | | | |
Callaway Golf | | | | 139,443 | a | 3,826,316 | |
GoPro, Cl. A | | | | 393,862 | a | 4,060,717 | |
| | | | | 7,887,033 | |
Consumer Services - 7.4% | | | | | |
Bloomin‘ Brands | | | | 222,899 | a | 4,676,421 | |
Cracker Barrel Old Country Store | | | | 17,151 | | 2,206,305 | |
Houghton Mifflin Harcourt | | | | 743,306 | a | 11,967,227 | |
OneSpaWorld Holdings | | | | 137,927 | a,b | 1,382,029 | |
Papa John's International | | | | 35,476 | | 4,734,982 | |
| | | | | 24,966,964 | |
Diversified Financials - 1.3% | | | | | |
PJT Partners, Cl. A | | | | 57,743 | | 4,278,179 | |
7
STATEMENT OF INVESTMENTS (continued)
| | | | | | | | |
| |
Description | | | | Shares | | Value ($) | |
Common Stocks - 96.3% (continued) | | | | | |
Energy - 4.1% | | | | | |
CNX Resources | | | | 355,040 | a,b | 4,881,800 | |
PBF Energy, Cl. A | | | | 379,161 | a,b | 4,917,718 | |
Viper Energy Partners | | | | 186,032 | | 3,964,342 | |
| | | | | 13,763,860 | |
Food & Staples Retailing - 1.2% | | | | | |
The Chefs' Warehouse | | | | 125,547 | a | 4,180,715 | |
Health Care Equipment & Services - 9.3% | | | | | |
Acadia Healthcare | | | | 71,343 | a | 4,330,520 | |
Apria | | | | 171,273 | a | 5,583,500 | |
Health Catalyst | | | | 103,004 | a,b | 4,081,018 | |
Innovage Holding | | | | 164,705 | a,b | 823,525 | |
ModivCare | | | | 23,951 | a | 3,551,694 | |
NuVasive | | | | 50,241 | a | 2,636,648 | |
Privia Health Group | | | | 192,909 | a,b | 4,990,556 | |
R1 RCM | | | | 121,873 | a | 3,106,543 | |
SOC Telemed | | | | 402,735 | a | 515,501 | |
TransMedics Group | | | | 97,265 | a | 1,863,597 | |
| | | | | 31,483,102 | |
Household & Personal Products - 1.1% | | | | | |
Spectrum Brands Holdings | | | | 35,052 | | 3,565,489 | |
Insurance - 2.3% | | | | | |
BRP Group, Cl. A | | | | 115,776 | a | 4,180,671 | |
The Hanover Insurance Group | | | | 28,264 | | 3,704,280 | |
| | | | | 7,884,951 | |
Materials - 6.6% | | | | | |
Alamos Gold, Cl. A | | | | 588,092 | | 4,522,428 | |
IAMGOLD | | | | 725,728 | a,b | 2,271,529 | |
Largo | | | | 186,019 | a | 1,722,536 | |
MP Materials | | | | 111,926 | a,b | 5,083,679 | |
Summit Materials, Cl. A | | | | 115,134 | a | 4,621,479 | |
Tronox Holdings, Cl. A | | | | 174,635 | | 4,196,479 | |
| | | | | 22,418,130 | |
Media & Entertainment - 2.5% | | | | | |
Cardlytics | | | | 27,071 | a,b | 1,789,122 | |
Eventbrite, Cl. A | | | | 284,965 | a,b | 4,969,790 | |
TrueCar | | | | 465,484 | a | 1,582,646 | |
| | | | | 8,341,558 | |
Pharmaceuticals Biotechnology & Life Sciences - 5.7% | | | | | |
Alkermes | | | | 210,495 | a | 4,896,114 | |
Arena Pharmaceuticals | | | | 41,601 | a | 3,866,397 | |
Generation Bio | | | | 62,985 | a | 445,934 | |
Quanterix | | | | 96,938 | a | 4,110,171 | |
Ultragenyx Pharmaceutical | | | | 23,547 | a | 1,980,067 | |
8
| | | | | | | | |
| |
Description | | | | Shares | | Value ($) | |
Common Stocks - 96.3% (continued) | | | | | |
Pharmaceuticals Biotechnology & Life Sciences - 5.7% (continued) | | | | | |
Xenon Pharmaceuticals | | | | 130,305 | a | 4,070,728 | |
| | | | | 19,369,411 | |
Real Estate - 1.9% | | | | | |
Colliers International Group | | | | 42,976 | b | 6,388,382 | |
Retailing - 1.4% | | | | | |
Party City Holdco | | | | 824,529 | a | 4,592,627 | |
Semiconductors & Semiconductor Equipment - 3.7% | | | | | |
Diodes | | | | 48,604 | a | 5,337,205 | |
MaxLinear | | | | 94,513 | a | 7,125,335 | |
| | | | | 12,462,540 | |
Software & Services - 6.5% | | | | | |
ChannelAdvisor | | | | 311,175 | a | 7,679,799 | |
Everbridge | | | | 32,503 | a,b | 2,188,427 | |
Limelight Networks | | | | 446,789 | a | 1,532,486 | |
Paya Holdings | | | | 661,666 | a,b | 4,194,962 | |
Zuora, Cl. A | | | | 343,820 | a | 6,422,558 | |
| | | | | 22,018,232 | |
Technology Hardware & Equipment - 5.2% | | | | | |
ADTRAN | | | | 277,228 | | 6,329,115 | |
Arlo Technologies | | | | 385,186 | a | 4,040,601 | |
Extreme Networks | | | | 409,353 | a | 6,426,842 | |
Ondas Holdings | | | | 93,380 | a,b | 626,580 | |
| | | | | 17,423,138 | |
Transportation - 1.9% | | | | | |
SkyWest | | | | 163,691 | a | 6,433,056 | |
Utilities - 3.9% | | | | | |
Clearway Energy, Cl. C | | | | 191,976 | b | 6,916,895 | |
NextEra Energy Partners | | | | 76,343 | b | 6,443,349 | |
| | | | | 13,360,244 | |
Total Common Stocks (cost $266,028,316) | | | | 325,265,236 | |
| | | | | | | | |
Exchange-Traded Funds - 1.4% | | | | | |
Registered Investment Companies - 1.4% | | | | | |
iShares Russell 2000 ETF
(cost $4,891,712) | | | | 21,988 | b | 4,891,231 | |
| | | 1-Day
Yield (%) | | | | | |
Investment Companies - 2.3% | | | | | |
Registered Investment Companies - 2.3% | | | | | |
Dreyfus Institutional Preferred Government Plus Money Market Fund, Institutional Shares
(cost $7,865,339) | | 0.07 | | 7,865,339 | c | 7,865,339 | |
9
STATEMENT OF INVESTMENTS (continued)
| | | | | | | | |
| |
Description | | 1-Day
Yield (%) | | Shares | | Value ($) | |
Investment of Cash Collateral for Securities Loaned - 4.9% | | | | | |
Registered Investment Companies - 4.9% | | | | | |
Dreyfus Institutional Preferred Government Plus Money Market Fund, SL Shares
(cost $16,400,206) | | 0.07 | | 16,400,206 | c | 16,400,206 | |
Total Investments (cost $295,185,573) | | 104.9% | | 354,422,012 | |
Liabilities, Less Cash and Receivables | | (4.9%) | | (16,595,828) | |
Net Assets | | 100.0% | | 337,826,184 | |
ETF—Exchange-Traded Fund
a Non-income producing security.
b Security, or portion thereof, on loan. At December 31, 2021, the value of the fund’s securities on loan was $36,812,405 and the value of the collateral was $37,744,226, consisting of cash collateral of $16,400,206 and U.S. Government & Agency securities valued at $21,344,020. In addition, the value of collateral may include pending sales that are also on loan.
c Investment in affiliated issuer. The investment objective of this investment company is publicly available and can be found within the investment company’s prospectus.
| | |
Portfolio Summary (Unaudited) † | Value (%) |
Industrials | 20.0 |
Information Technology | 15.4 |
Health Care | 15.0 |
Financials | 13.4 |
Consumer Discretionary | 11.1 |
Investment Companies | 8.6 |
Materials | 6.6 |
Energy | 4.1 |
Utilities | 4.0 |
Communication Services | 2.5 |
Consumer Staples | 2.3 |
Real Estate | 1.9 |
| | 104.9 |
† Based on net assets.
See notes to financial statements.
10
STATEMENT OF INVESTMENTS IN AFFILIATED ISSUERS
| | | | | | | |
Description | Value ($) 12/31/2020 | Purchases ($)† | Sales ($) | Value ($) 12/31/2021 | Dividends/
Distributions ($) | |
Registered Investment Companies - 2.3% | | |
Dreyfus Institutional Preferred Government Plus Money Market Fund, Institutional Shares - 2.3% | 7,330,027 | 82,511,295 | (81,975,983) | 7,865,339 | 3,338 | |
Investment of Cash Collateral for Securities Loaned - 4.9% | | |
Dreyfus Institutional Preferred Government Plus Money Market Fund, SL Shares - 4.9% | 11,599,220 | 140,150,478 | (135,349,492) | 16,400,206 | 112,068 | †† |
Total - 7.2% | 18,929,247 | 222,661,773 | (217,325,475) | 24,265,545 | 115,406 | |
† Includes reinvested dividends/distributions.
†† Represents securities lending income earned from the reinvestment of cash collateral from loaned securities, net of fees and collateral investment expenses, and other payments to and from borrowers of securities.
See notes to financial statements.
11
STATEMENT OF ASSETS AND LIABILITIES
December 31, 2021
| | | | | | | |
| | | | | | |
| | | Cost | | Value | |
Assets ($): | | | | |
Investments in securities—See Statement of Investments
(including securities on loan, valued at $36,812,405)—Note 1(c): | | | |
Unaffiliated issuers | 270,920,028 | | 330,156,467 | |
Affiliated issuers | | 24,265,545 | | 24,265,545 | |
Receivable for shares of Beneficial Interest subscribed | | 116,466 | |
Receivable for investment securities sold | | 66,003 | |
Dividends and securities lending income receivable | | 64,062 | |
Prepaid expenses | | | | | 4,999 | |
| | | | | 354,673,542 | |
Liabilities ($): | | | | |
Due to BNY Mellon Investment Adviser, Inc. and affiliates—Note 3(b) | | 223,174 | |
Liability for securities on loan—Note 1(c) | | 16,400,206 | |
Payable for shares of Beneficial Interest redeemed | | 91,671 | |
Payable for investment securities purchased | | 42,638 | |
Trustees’ fees and expenses payable | | 3,143 | |
Other accrued expenses | | | | | 86,526 | |
| | | | | 16,847,358 | |
Net Assets ($) | | | 337,826,184 | |
Composition of Net Assets ($): | | | | |
Paid-in capital | | | | | 219,330,992 | |
Total distributable earnings (loss) | | | | | 118,495,192 | |
Net Assets ($) | | | 337,826,184 | |
| | | | |
Net Asset Value Per Share | Initial Shares | Service Shares | |
Net Assets ($) | 316,091,896 | 21,734,288 | |
Shares Outstanding | 5,471,953 | 396,810 | |
Net Asset Value Per Share ($) | 57.77 | 54.77 | |
| | | |
See notes to financial statements. | | | |
12
STATEMENT OF OPERATIONS
Year Ended December 31, 2021
| | | | | | | |
| | | | | | |
| | | | | | |
Investment Income ($): | | | | |
Income: | | | | |
Cash dividends (net of $26,551 foreign taxes withheld at source): | |
Unaffiliated issuers | | | 2,287,398 | |
Affiliated issuers | | | 3,338 | |
Income from securities lending—Note 1(c) | | | 112,068 | |
Total Income | | | 2,402,804 | |
Expenses: | | | | |
Investment advisory fee—Note 3(a) | | | 2,528,255 | |
Professional fees | | | 103,981 | |
Distribution fees—Note 3(b) | | | 54,470 | |
Prospectus and shareholders’ reports | | | 42,070 | |
Trustees’ fees and expenses—Note 3(c) | | | 19,550 | |
Chief Compliance Officer fees—Note 3(b) | | | 14,276 | |
Custodian fees—Note 3(b) | | | 13,566 | |
Loan commitment fees—Note 2 | | | 7,457 | |
Shareholder servicing costs—Note 3(b) | | | 1,352 | |
Miscellaneous | | | 25,861 | |
Total Expenses | | | 2,810,838 | |
Investment (Loss)—Net | | | (408,034) | |
Realized and Unrealized Gain (Loss) on Investments—Note 4 ($): | | |
Net realized gain (loss) on investments | 64,142,601 | |
Net change in unrealized appreciation (depreciation) on investments | (14,081,002) | |
Net Realized and Unrealized Gain (Loss) on Investments | | | 50,061,599 | |
Net Increase in Net Assets Resulting from Operations | | 49,653,565 | |
| | | | | | |
See notes to financial statements. | | | | | |
13
STATEMENT OF CHANGES IN NET ASSETS
| | | | | | | | | | |
| | | | Year Ended December 31, |
| | | | 2021 | | 2020 | |
Operations ($): | | | | | | | | |
Investment income (loss)—net | | | (408,034) | | | | 342,943 | |
Net realized gain (loss) on investments | | 64,142,601 | | | | 2,161,849 | |
Net change in unrealized appreciation
(depreciation) on investments | | (14,081,002) | | | | 49,035,655 | |
Net Increase (Decrease) in Net Assets
Resulting from Operations | 49,653,565 | | | | 51,540,447 | |
Distributions ($): | |
Distributions to shareholders: | | | | | | | | |
Initial Shares | | | (342,095) | | | | (1,469,047) | |
Service Shares | | | - | | | | (66,238) | |
Total Distributions | | | (342,095) | | | | (1,535,285) | |
Beneficial Interest Transactions ($): | |
Net proceeds from shares sold: | | | | | | | | |
Initial Shares | | | 16,726,030 | | | | 13,882,857 | |
Service Shares | | | 1,470,360 | | | | 1,214,440 | |
Distributions reinvested: | | | | | | | | |
Initial Shares | | | 342,095 | | | | 1,469,047 | |
Service Shares | | | - | | | | 66,238 | |
Cost of shares redeemed: | | | | | | | | |
Initial Shares | | | (33,340,521) | | | | (36,150,285) | |
Service Shares | | | (2,872,363) | | | | (2,247,850) | |
Increase (Decrease) in Net Assets
from Beneficial Interest Transactions | (17,674,399) | | | | (21,765,553) | |
Total Increase (Decrease) in Net Assets | 31,637,071 | | | | 28,239,609 | |
Net Assets ($): | |
Beginning of Period | | | 306,189,113 | | | | 277,949,504 | |
End of Period | | | 337,826,184 | | | | 306,189,113 | |
Capital Share Transactions (Shares): | |
Initial Shares | | | | | | | | |
Shares sold | | | 296,401 | | | | 409,112 | |
Shares issued for distributions reinvested | | | 6,297 | | | | 51,564 | |
Shares redeemed | | | (594,724) | | | | (927,661) | |
Net Increase (Decrease) in Shares Outstanding | (292,026) | | | | (466,985) | |
Service Shares | | | | | | | | |
Shares sold | | | 27,690 | | | | 36,881 | |
Shares issued for distributions reinvested | | | - | | | | 2,444 | |
Shares redeemed | | | (53,728) | | | | (61,128) | |
Net Increase (Decrease) in Shares Outstanding | (26,038) | | | | (21,803) | |
| | | | | | | | | |
See notes to financial statements. | | | | | | | | |
14
FINANCIAL HIGHLIGHTS
The following tables describe the performance for each share class for the fiscal periods indicated. All information (except portfolio turnover rate) reflects financial results for a single fund share. Net asset value total return is calculated assuming an initial investment made at the net asset value at the beginning of the period, reinvestment of all dividends and distributions at net asset value during the period, and redemption at net asset value on the last day of the period. Net asset value total return includes adjustments in accordance with accounting principles generally accepted in the United States of America and as such, the net asset value for financial reporting purposes and the returns based upon those net asset values may differ from the net asset value and returns for shareholder transactions. The fund’s total returns do not reflect expenses associated with variable annuity or insurance contracts. These figures have been derived from the fund’s financial statements.
| | | | | | | |
| | | |
| | | Year Ended December 31, |
Initial Shares | | 2021 | 2020 | 2019 | 2018 | 2017 |
Per Share Data ($): | | | | | | |
Net asset value, beginning of period | | 49.66 | 41.78 | 41.20 | 60.91 | 49.44 |
Investment Operations: | | | | | | |
Investment income (loss)—neta | | (.06) | .06 | .26 | (.06) | (.12) |
Net realized and unrealized
gain (loss) on investments | | 8.23 | 8.07 | 8.35 | (9.48) | 12.21 |
Total from Investment Operations | | 8.17 | 8.13 | 8.61 | (9.54) | 12.09 |
Distributions: | | | | | | |
Dividends from investment
income-net | | (.06) | (.25) | - | - | - |
Dividends from net realized
gain on investments | | - | - | (8.03) | (10.17) | (.62) |
Total distributions | | (.06) | (.25) | (8.03) | (10.17) | (.62) |
Net asset value, end of period | | 57.77 | 49.66 | 41.78 | 41.20 | 60.91 |
Total Return (%) | | 16.46 | 19.89 | 21.78 | (19.08) | 24.69 |
Ratios/Supplemental Data (%): | | | | | | |
Ratio of total expenses
to average net assets | | .82 | .85 | .84 | .84 | .85 |
Ratio of net investment income
(loss) to average net assets | | (.10) | .16 | .64 | (.12) | (.22) |
Portfolio Turnover Rate | | 59.71 | 68.67 | 65.42 | 67.90 | 70.11 |
Net Assets, end of period ($ x 1,000) | | 316,092 | 286,250 | 260,321 | 146,730 | 189,582 |
a Based on average shares outstanding.
See notes to financial statements.
15
FINANCIAL HIGHLIGHTS (continued)
| | | | | | | |
| | | |
| | | Year Ended December 31, |
Service Shares | | 2021 | 2020 | 2019 | 2018 | 2017 |
Per Share Data ($): | | | | | | |
Net asset value, beginning of period | | 47.15 | 39.65 | 39.53 | 58.98 | 48.01 |
Investment Operations: | | | | | | |
Investment income (loss)—neta | | (.19) | (.03) | .16 | (.19) | (.25) |
Net realized and unrealized
gain (loss) on investments | | 7.81 | 7.68 | 7.99 | (9.09) | 11.84 |
Total from Investment Operations | | 7.62 | 7.65 | 8.15 | (9.28) | 11.59 |
Distributions: | | | | | | |
Dividends from investment
income-net | | - | (.15) | - | - | - |
Dividends from net realized
gain on investments | | - | - | (8.03) | (10.17) | (.62) |
Total distributions | | - | (.15) | (8.03) | (10.17) | (.62) |
Net asset value, end of period | | 54.77 | 47.15 | 39.65 | 39.53 | 58.98 |
Total Return (%) | | 16.16 | 19.58 | 21.49 | (19.29) | 24.37 |
Ratios/Supplemental Data (%): | | | | | | |
Ratio of total expenses
to average net assets | | 1.07 | 1.10 | 1.09 | 1.09 | 1.10 |
Ratio of net investment income
(loss) to average net assets | | (.36) | (.09) | .41 | (.37) | (.47) |
Portfolio Turnover Rate | | 59.71 | 68.67 | 65.42 | 67.90 | 70.11 |
Net Assets, end of period ($ x 1,000) | | 21,734 | 19,939 | 17,628 | 15,291 | 20,322 |
a Based on average shares outstanding.
See notes to financial statements.
16
NOTES TO FINANCIAL STATEMENTS
NOTE 1—Significant Accounting Policies:
Opportunistic Small Cap Portfolio (the “fund”) is a separate diversified series of BNY Mellon Variable Investment Fund (the “Trust”), which is registered under the Investment Company Act of 1940, as amended (the “Act”), as an open-end management investment company and operates as a series company currently offering four series, including the fund. The fund is only offered to separate accounts established by insurance companies to fund variable annuity contracts and variable life insurance policies. The fund’s investment objective is to seek capital growth. BNY Mellon Investment Adviser, Inc. (the “Adviser”), a wholly-owned subsidiary of The Bank of New York Mellon Corporation (“BNY Mellon”), serves as the fund’s investment adviser. Effective September 1, 2021 (the “Effective Date”), the Adviser has engaged its affiliate, Newton Investment Management North America, LLC (the “Sub-Adviser”) as the fund’s sub-investment adviser pursuant to a sub-investment advisory agreement between the Adviser and the Sub-Adviser. As the fund’s sub-investment adviser, the Sub-Adviser provides the day-to-day management of the fund’s investments, subject to the Adviser’s supervision and approval. The Adviser (and not the fund) pays the Sub-Adviser for its sub-advisory services. As of the Effective Date, portfolio managers responsible for managing the fund’s investments who were employees of Mellon Investments Corporation (“Mellon”) in a dual employment arrangement with the Adviser, have become employees of the Sub-Adviser, and are no longer employees of Mellon.
BNY Mellon Securities Corporation (the “Distributor”), a wholly-owned subsidiary of the Adviser, is the distributor of the fund’s shares, which are sold to the public without a sales charge. The fund is authorized to issue an unlimited number of $.001 par value shares of Beneficial Interest in each of the following classes of shares: Initial and Service. Each class of shares has identical rights and privileges, except with respect to the Distribution Plan, and the expenses borne by each class, the allocation of certain transfer agency costs, and certain voting rights. Income, expenses (other than expenses attributable to a specific class), and realized and unrealized gains or losses on investments are allocated to each class of shares based on its relative net assets.
The Trust accounts separately for the assets, liabilities and operations of each series. Expenses directly attributable to each series are charged to that series’ operations; expenses which are applicable to all series are allocated among them on a pro rata basis.
17
NOTES TO FINANCIAL STATEMENTS (continued)
The Financial Accounting Standards Board (“FASB”) Accounting Standards Codification (“ASC”) is the exclusive reference of authoritative U.S. generally accepted accounting principles (“GAAP”) recognized by the FASB to be applied by nongovernmental entities. Rules and interpretive releases of the SEC under authority of federal laws are also sources of authoritative GAAP for SEC registrants. The fund is an investment company and applies the accounting and reporting guidance of the FASB ASC Topic 946 Financial Services-Investment Companies. The fund’s financial statements are prepared in accordance with GAAP, which may require the use of management estimates and assumptions. Actual results could differ from those estimates.
The Trust enters into contracts that contain a variety of indemnifications. The fund’s maximum exposure under these arrangements is unknown. The fund does not anticipate recognizing any loss related to these arrangements.
(a) Portfolio valuation: The fair value of a financial instrument is the amount that would be received to sell an asset or paid to transfer a liability in an orderly transaction between market participants at the measurement date (i.e., the exit price). GAAP establishes a fair value hierarchy that prioritizes the inputs of valuation techniques used to measure fair value. This hierarchy gives the highest priority to unadjusted quoted prices in active markets for identical assets or liabilities (Level 1 measurements) and the lowest priority to unobservable inputs (Level 3 measurements).
Additionally, GAAP provides guidance on determining whether the volume and activity in a market has decreased significantly and whether such a decrease in activity results in transactions that are not orderly. GAAP requires enhanced disclosures around valuation inputs and techniques used during annual and interim periods.
Various inputs are used in determining the value of the fund’s investments relating to fair value measurements. These inputs are summarized in the three broad levels listed below:
Level 1—unadjusted quoted prices in active markets for identical investments.
Level 2—other significant observable inputs (including quoted prices for similar investments, interest rates, prepayment speeds, credit risk, etc.).
Level 3—significant unobservable inputs (including the fund’s own assumptions in determining the fair value of investments).
18
The inputs or methodology used for valuing securities are not necessarily an indication of the risk associated with investing in those securities.
Changes in valuation techniques may result in transfers in or out of an assigned level within the disclosure hierarchy. Valuation techniques used to value the fund’s investments are as follows:
Investments in equity securities are valued at the last sales price on the securities exchange or national securities market on which such securities are primarily traded. Securities listed on the National Market System for which market quotations are available are valued at the official closing price or, if there is no official closing price that day, at the last sales price. For open short positions, asked prices are used for valuation purposes. Bid price is used when no asked price is available. Registered investment companies that are not traded on an exchange are valued at their net asset value. All of the preceding securities are generally categorized within Level 1 of the fair value hierarchy.
Securities not listed on an exchange or the national securities market, or securities for which there were no transactions, are valued at the average of the most recent bid and asked prices. These securities are generally categorized within Level 2 of the fair value hierarchy.
Fair valuing of securities may be determined with the assistance of a pricing service using calculations based on indices of domestic securities and other appropriate indicators, such as prices of relevant American Depository Receipts and futures. Utilizing these techniques may result in transfers between Level 1 and Level 2 of the fair value hierarchy.
When market quotations or official closing prices are not readily available, or are determined not to accurately reflect fair value, such as when the value of a security has been significantly affected by events after the close of the exchange or market on which the security is principally traded (for example, a foreign exchange or market), but before the fund calculates its net asset value, the fund may value these investments at fair value as determined in accordance with the procedures approved by the Trust’s Board of Trustees (the “Board”). Certain factors may be considered when fair valuing investments such as: fundamental analytical data, the nature and duration of restrictions on disposition, an evaluation of the forces that influence the market in which the securities are purchased and sold, and public trading in similar securities of the issuer or comparable issuers. These securities are either categorized within Level 2 or 3 of the fair value hierarchy depending on the relevant inputs used.
19
NOTES TO FINANCIAL STATEMENTS (continued)
For securities where observable inputs are limited, assumptions about market activity and risk are used and such securities are generally categorized within Level 3 of the fair value hierarchy.
The following is a summary of the inputs used as of December 31, 2021 in valuing the fund’s investments:
| | | | | | | |
| | Level 1-Unadjusted Quoted Prices | Level 2- Other Significant Observable Inputs | | Level 3-Significant Unobservable Inputs | Total | |
Assets ($) | | |
Investments in Securities:† | | |
Equity Securities - Common Stocks | 325,265,236 | - | | - | 325,265,236 | |
Exchange-Traded Funds | 4,891,231 | - | | - | 4,891,231 | |
Investment Companies | 24,265,545 | - | | - | 24,265,545 | |
† See Statement of Investments for additional detailed categorizations, if any.
(b) Foreign taxes: The fund may be subject to foreign taxes (a portion of which may be reclaimable) on income, stock dividends, realized and unrealized capital gains on investments or certain foreign currency transactions. Foreign taxes are recorded in accordance with the applicable foreign tax regulations and rates that exist in the foreign jurisdictions in which the fund invests. These foreign taxes, if any, are paid by the fund and are reflected in the Statement of Operations, if applicable. Foreign taxes payable or deferred or those subject to reclaims as of December 31, 2021, if any, are disclosed in the fund’s Statement of Assets and Liabilities.
(c) Securities transactions and investment income: Securities transactions are recorded on a trade date basis. Realized gains and losses from securities transactions are recorded on the identified cost basis. Dividend income is recognized on the ex-dividend date and interest income, including, where applicable, accretion of discount and amortization of premium on investments, is recognized on the accrual basis.
Pursuant to a securities lending agreement with The Bank of New York Mellon, a subsidiary of BNY Mellon and an affiliate of the Adviser, the fund may lend securities to qualified institutions. It is the fund’s policy that, at origination, all loans are secured by collateral of at least 102% of the value of U.S. securities loaned and 105% of the value of foreign securities loaned. Collateral equivalent to at least 100% of the market value of securities on loan is maintained at all times. Collateral is either in the form of cash, which can be invested in certain money market mutual funds
20
managed by the Adviser, or U.S. Government and Agency securities. The fund is entitled to receive all dividends, interest and distributions on securities loaned, in addition to income earned as a result of the lending transaction. Should a borrower fail to return the securities in a timely manner, The Bank of New York Mellon is required to replace the securities for the benefit of the fund or credit the fund with the market value of the unreturned securities and is subrogated to the fund’s rights against the borrower and the collateral. Additionally, the contractual maturity of security lending transactions are on an overnight and continuous basis. During the period ended December 31, 2021, The Bank of New York Mellon earned $15,275 from the lending of the fund’s portfolio securities, pursuant to the securities lending agreement.
(d) Affiliated issuers: Investments in other investment companies advised by the Adviser are considered “affiliated” under the Act.
(e) Risk: Certain events particular to the industries in which the fund’s investments conduct their operations, as well as general economic, political and public health conditions, may have a significant negative impact on the investee’s operations and profitability. In addition, turbulence in financial markets and reduced liquidity in equity, credit and/or fixed income markets may negatively affect many issuers, which could adversely affect the fund. Global economies and financial markets are becoming increasingly interconnected, and conditions and events in one country, region or financial market may adversely impact issuers in a different country, region or financial market. These risks may be magnified if certain events or developments adversely interrupt the global supply chain; in these and other circumstances, such risks might affect companies world-wide. Recent examples include pandemic risks related to COVID-19 and aggressive measures taken world-wide in response by governments, including closing borders, restricting international and domestic travel, and the imposition of prolonged quarantines of large populations, and by businesses, including changes to operations and reducing staff. The effects of COVID-19 have contributed to increased volatility in global markets and will likely affect certain countries, companies, industries and market sectors more dramatically than others. The COVID-19 pandemic has had, and any other outbreak of an infectious disease or other serious public health concern could have, a significant negative impact on economic and market conditions and could trigger a prolonged period of global economic slowdown. To the extent the fund may overweight its investments in certain countries, companies, industries or market sectors, such positions will increase the fund’s exposure to risk of loss from adverse developments affecting those countries, companies, industries or sectors.
21
NOTES TO FINANCIAL STATEMENTS (continued)
(f) Dividends and distributions to shareholders: Dividends and distributions are recorded on the ex-dividend date. Dividends from investment income-net and dividends from net realized capital gains, if any, are normally declared and paid annually, but the fund may make distributions on a more frequent basis to comply with the distribution requirements of the Internal Revenue Code of 1986, as amended (the “Code”). To the extent that net realized capital gains can be offset by capital loss carryovers, it is the policy of the fund not to distribute such gains. Income and capital gain distributions are determined in accordance with income tax regulations, which may differ from GAAP.
(g) Federal income taxes: It is the policy of the fund to continue to qualify as a regulated investment company, if such qualification is in the best interests of its shareholders, by complying with the applicable provisions of the Code, and to make distributions of taxable income and net realized capital gain sufficient to relieve it from substantially all federal income and excise taxes.
As of and during the period ended December 31, 2021, the fund did not have any liabilities for any uncertain tax positions. The fund recognizes interest and penalties, if any, related to uncertain tax positions as income tax expense in the Statement of Operations. During the period ended December 31, 2021, the fund did not incur any interest or penalties.
Each tax year in the four-year period ended December 31, 2021 remains subject to examination by the Internal Revenue Service and state taxing authorities.
At December 31, 2021, the components of accumulated earnings on a tax basis were as follows: undistributed ordinary income $16,288,499, undistributed capital gains $43,530,432 and unrealized appreciation $58,676,261.
The tax character of distributions paid to shareholders during the fiscal periods ended December 31, 2021 and December 31, 2020 were as follows: ordinary income $342,095 and $1,535,285, respectively.
NOTE 2—Bank Lines of Credit:
The fund participates with other long-term open-end funds managed by the Adviser in a $823.5 million unsecured credit facility led by Citibank, N.A. (the “Citibank Credit Facility”) and a $300 million unsecured credit facility provided by The Bank of New York Mellon (the “BNYM Credit Facility”), each to be utilized primarily for temporary or emergency purposes, including the financing of redemptions (each, a “Facility”). The Citibank Credit Facility is available in two tranches: (i) Tranche A is in an
22
amount equal to $688.5 million and is available to all long-term open-ended funds, including the fund, and (ii) Tranche B is an amount equal to $135 million and is available only to BNY Mellon Floating Rate Income Fund, a series of BNY Mellon Investment Funds IV, Inc. In connection therewith, the fund has agreed to pay its pro rata portion of commitment fees for Tranche A of the Citibank Credit Facility and the BNYM Credit Facility. Interest is charged to the fund based on rates determined pursuant to the terms of the respective Facility at the time of borrowing. During the period ended December 31, 2021, the fund did not borrow under the Facilities.
NOTE 3—Investment Advisory Fee, Sub-Investment Advisory Fee and Other Transactions with Affiliates:
(a) Pursuant to an investment advisory agreement with the Adviser, the investment advisory fee is computed at the annual rate of .75% of the value of the fund’s average daily net assets and is payable monthly.
As of the Effective Date, pursuant to a sub-investment advisory agreement between the Adviser and the Sub-Adviser, the Adviser pays the Sub-Adviser a monthly fee at an annual rate of .36% of the value of the fund’s average daily net assets.
(b) Under the Distribution Plan adopted pursuant to Rule 12b-1 under the Act, Service shares pay the Distributor for distributing its shares, for servicing and/or maintaining Service shares’ shareholder accounts and for advertising and marketing for Service shares. The Distribution Plan provides for payments to be made at an annual rate of .25% of the value of the Service shares’ average daily net assets. The Distributor may make payments to Participating Insurance Companies and to brokers and dealers acting as principal underwriter for their variable insurance products. The fees payable under the Distribution Plan are payable without regard to actual expenses incurred. During the period ended December 31, 2021, Service shares were charged $54,470 pursuant to the Distribution Plan.
The fund has an arrangement with the transfer agent whereby the fund may receive earnings credits when positive cash balances are maintained, which are used to offset transfer agency fees. For financial reporting purposes, the fund includes net earnings credits, if any, as shareholder servicing costs in the Statement of Operations.
The fund has an arrangement with the custodian whereby the fund will receive interest income or be charged overdraft fees when cash balances are maintained. For financial reporting purposes, the fund includes this interest income and overdraft fees, if any, as interest income in the Statement of Operations.
23
NOTES TO FINANCIAL STATEMENTS (continued)
The fund compensates BNY Mellon Transfer, Inc., a wholly-owned subsidiary of the Adviser, under a transfer agency agreement for providing transfer agency and cash management services inclusive of earnings credits, if any, for the fund. The majority of transfer agency fees are comprised of amounts paid on a per account basis, while cash management fees are related to fund subscriptions and redemptions. During the period ended December 31, 2021, the fund was charged $1,158 for transfer agency services, inclusive of earnings credit, if any. These fees are included in Shareholder servicing costs in the Statement of Operations.
The fund compensates The Bank of New York Mellon under a custody agreement for providing custodial services for the fund. These fees are determined based on net assets, geographic region and transaction activity. During the period ended December 31, 2021, the fund was charged $13,566 pursuant to the custody agreement.
During the period ended December 31, 2021, the fund was charged $14,276 for services performed by the Chief Compliance Officer and his staff. These fees are included in Chief Compliance Officer fees in the Statement of Operations.
The components of “Due to BNY Mellon Investment Adviser, Inc. and affiliates” in the Statement of Assets and Liabilities consist of: investment advisory fees of $211,148, Distribution Plan fees of $4,517, custodian fees of $3,600, Chief Compliance Officer fees of $3,627 and transfer agency fees of $282.
(c) Each Board member also serves as a Board member of other funds in the BNY Mellon Family of Funds complex. Annual retainer fees and attendance fees are allocated to each fund based on net assets.
NOTE 4—Securities Transactions:
The aggregate amount of purchases and sales of investment securities, excluding short-term securities, during the period ended December 31, 2021, amounted to $195,581,221 and $214,047,545, respectively.
At December 31, 2021, the cost of investments for federal income tax purposes was $295,745,751; accordingly, accumulated net unrealized appreciation on investments was $58,676,261, consisting of $84,232,573 gross unrealized appreciation and $25,556,312 gross unrealized depreciation.
24
REPORT OF INDEPENDENT REGISTERED PUBLIC ACCOUNTING FIRM
To the Shareholders and the Board of Trustees of Opportunistic Small Cap Portfolio
Opinion on the Financial Statements
We have audited the accompanying statement of assets and liabilities of Opportunistic Small Cap Portfolio (the “Fund”) (one of the funds constituting BNY Mellon Variable Investment Fund), including the statements of investments and investments in affiliated issuers, as of December 31, 2021, and the related statement of operations for the year then ended, the statements of changes in net assets for each of the two years in the period then ended, the financial highlights for each of the five years in the period then ended and the related notes (collectively referred to as the “financial statements”). In our opinion, the financial statements present fairly, in all material respects, the financial position of the Fund (one of the funds constituting BNY Mellon Variable Investment Fund) at December 31, 2021, the results of its operations for the year then ended, the changes in its net assets for each of the two years in the period then ended and its financial highlights for each of the five years in the period then ended, in conformity with U.S. generally accepted accounting principles.
Basis for Opinion
These financial statements are the responsibility of the Fund’s management. Our responsibility is to express an opinion on the Fund’s financial statements based on our audits. We are a public accounting firm registered with the Public Company Accounting Oversight Board (United States) (“PCAOB”) and are required to be independent with respect to the Fund in accordance with the U.S. federal securities laws and the applicable rules and regulations of the Securities and Exchange Commission and the PCAOB.
We conducted our audits in accordance with the standards of the PCAOB. Those standards require that we plan and perform the audit to obtain reasonable assurance about whether the financial statements are free of material misstatement, whether due to error or fraud. The Fund is not required to have, nor were we engaged to perform, an audit of the Fund’s internal control over financial reporting. As part of our audits, we are required to obtain an understanding of internal control over financial reporting, but not for the purpose of expressing an opinion on the effectiveness of the Fund’s internal control over financial reporting. Accordingly, we express no such opinion.
Our audits included performing procedures to assess the risks of material misstatement of the financial statements, whether due to error or fraud, and performing procedures that respond to those risks. Such procedures included examining, on a test basis, evidence regarding the amounts and disclosures in the financial statements. Our procedures included confirmation of securities owned as of December 31, 2021, by correspondence with the custodian and others or by other appropriate auditing procedures where replies from others were not received. Our audits also included evaluating the accounting principles used and significant estimates made by management, as well as evaluating the overall presentation of the financial statements. We believe that our audits provide a reasonable basis for our opinion.

We have served as the auditor of one or more investment companies in the BNY Mellon Family of Funds since at least 1957, but we are unable to determine the specific year.
New York, New York
February 8, 2022
25
IMPORTANT TAX INFORMATION (Unaudited)
For federal tax purposes, the portfolio hereby reports 99.47% of the ordinary dividends paid during the fiscal year ended December 31, 2021 as qualifying for the corporate dividends received deduction. Shareholders will receive notification in early 2022 of the percentage applicable to the preparation of their 2021 income tax returns.
26
BOARD MEMBERS INFORMATION (Unaudited)
Independent Board Members
Joseph S. DiMartino (78)
Chairman of the Board (1995)
Principal Occupation During Past 5 Years:
· Director or Trustee of funds in the BNY Mellon Family of Funds and certain other entities (as described in the fund’s Statement of Additional Information) (1995-Present)
Other Public Company Board Memberships During Past 5 Years:
· CBIZ, Inc., a public company providing professional business services, products and solutions, Director (1997-Present)
No. of Portfolios for which Board Member Serves: 96
———————
Peggy C. Davis (78)
Board Member (2006)
Principal Occupation During Past 5 Years:
· Shad Professor of Law, New York University School of Law (1983-Present)
No. of Portfolios for which Board Member Serves: 34
———————
Gina D. France (63)
Board Member (2019)
Principal Occupation During Past 5 Years:
· France Strategic Partners, a strategy and advisory firm serving corporate clients across the United States, Founder, President and Chief Executive Officer (2003-Present)
Other Public Company Board Memberships During Past 5 Years:
· Huntington Bancshares, a bank holding company headquartered in Columbus, Ohio, Director (2016-Present)
· Cedar Fair, L.P., a publicly-traded partnership that owns and operates amusement parks and hotels in the U.S. and Canada, Director (2011-Present)
· CBIZ, Inc., a public company providing professional business services, products and solutions, Director (2015-Present)
· FirstMerit Corporation, a diversified financial services company, Director (2004-2016)
No. of Portfolios for which Board Member Serves: 24
———————
Joan Gulley (74)
Board Member (2017)
Principal Occupation During Past 5 Years:
· Nantucket Atheneum, public library, Chair (2018-June 2021) and Director (2015-June 2021)
· Orchard Island Club, golf and beach club, Governor (2016-Present)
No. of Portfolios for which Board Member Serves: 42
———————
27
BOARD MEMBERS INFORMATION (Unaudited) (continued)
Robin A. Melvin (58)
Board Member (2012)
Principal Occupation During Past 5 Years:
· Westover School, a private girls’ boarding school in Middlebury, Connecticut, Trustee (2019-Present)
· Mentor Illinois, a non-profit organization dedicated to increasing the quality of mentoring services in Illinois, Co-Chair (2014–2020); Board Member, Mentor Illinois (2013-2020)
· JDRF, a non-profit juvenile diabetes research foundation, Board Member (June 2021-Present)
Other Public Company Board Memberships During Past 5 Years:
· HPS Corporate Lending Fund, a closed-end management investment company regulated as a business development company, Trustee (August 2021-Present)
No. of Portfolios for which Board Member Serves: 74
———————
Once elected all Board Members serve for an indefinite term, but achieve Emeritus status upon reaching age 80. The address of the Board Members and Officers is c/o BNY Mellon Investment Adviser, Inc. 240 Greenwich Street, New York, New York 10286. Additional information about the Board Members is available in the fund’s Statement of Additional Information which can be obtained from the Adviser free of charge by calling this toll free number: 1-800-373-9387.
David P.Feldman, Emeritus Board Member
Ehud Houminer, Emeritus Board Member
Lynn Martin, Emeritus Board Member
Dr. Martin Peretz, Emeritus Board Member
Philip L. Toia, Emeritus Board Member
28
OFFICERS OF THE FUND (Unaudited)
DAVID DIPETRILLO, President since January 2021.
Vice President and Director of the Adviser since February 2021; Head of North America Product, BNY Mellon Investment Management since January 2018; Director of Product Strategy, BNY Mellon Investment Management from January 2016 to December 2017. He is an officer of 56 investment companies (comprised of 109 portfolios) managed by the Adviser or an affiliate of the Adviser. He is 43 years old and has been an employee of BNY Mellon since 2005.
JAMES WINDELS, Treasurer since November 2001.
Vice President of the Adviser since September 2020; Director–BNY Mellon Fund Administration, and an officer of 57 investment companies (comprised of 130 portfolios) managed by the Adviser or an affiliate of the Adviser. He is 63 years old and has been an employee of the Adviser since April 1985.
PETER M. SULLIVAN, Chief Legal Officer since July 2021 and Vice President and Assistant Secretary since March 2019.
Chief Legal Officer of the Adviser and Associate General Counsel of BNY Mellon since July 2021; Senior Managing Counsel of BNY Mellon from December 2020 to July 2021; Managing Counsel of BNY Mellon from March 2009 to December 2020, and an officer of 57 investment companies (comprised of 130 portfolios) managed by the Adviser or an affiliate of the Adviser. He is 53 years old and has been an employee of BNY Mellon since April 2004.
JAMES BITETTO, Vice President since August 2005 and Secretary since February 2018.
Senior Managing Counsel of BNY Mellon since December 2019; Managing Counsel of BNY Mellon from April 2014 to December 2019; Secretary of the Adviser, and an officer of 57 investment companies (comprised of 130 portfolios) managed by the Adviser or an affiliate of the Adviser. He is 55 years old and has been an employee of the Adviser since December 1996.
DEIRDRE CUNNANE, Vice President and Assistant Secretary since March 2019.
Managing Counsel of BNY Mellon since December 2021, Counsel of BNY Mellon from August 2018 to December 2021; and Senior Regulatory Specialist at BNY Mellon Investment Management Services from February 2016 to August 2018. She is an officer of 57 investment companies (comprised of 130 portfolios) managed by the Adviser or an affiliate of the Adviser. She is 31 years old and has been an employee of the Adviser since August 2018.
SARAH S. KELLEHER, Vice President and Assistant Secretary since April 2014.
Vice President of BNY Mellon ETF Investment Adviser; LLC since February 2020; Senior Managing Counsel of BNY Mellon since September 2021; Managing Counsel of BNY Mellon from December 2017 to September 2021; and Senior Counsel of BNY Mellon from March 2013 to December 2017. She is an officer of 57 investment companies (comprised of 130 portfolios) managed by the Adviser or an affiliate of the Adviser. She is 46 years old and has been an employee of the Adviser since March 2013.
JEFF PRUSNOFSKY, Vice President and Assistant Secretary since August 2005.
Senior Managing Counsel of BNY Mellon, and an officer of 57 investment companies (comprised of 130 portfolios) managed by the Adviser or an affiliate of the Adviser. He is 56 years old and has been an employee of the Adviser since October 1990.
AMANDA QUINN, Vice President and Assistant Secretary since March 2020.
Counsel of BNY Mellon since June 2019; Regulatory Administration Manager at BNY Mellon Investment Management Services from September 2018 to May 2019; and Senior Regulatory Specialist at BNY Mellon Investment Management Services from April 2015 to August 2018. She is an officer of 57 investment companies (comprised of 130 portfolios) managed by the Adviser or an affiliate of the Adviser. She is 36 years old and has been an employee of the Adviser since June 2019.
29
OFFICERS OF THE FUND (Unaudited) (continued)
NATALYA ZELENSKY, Vice President and Assistant Secretary since March 2017.
Chief Compliance Officer since August 2021 and Vice President since February 2020 of BNY Mellon ETF Investment Adviser, LLC; Chief Compliance Officer since August 2021 and Vice President and Assistant Secretary since February 2020 of BNY Mellon ETF Trust; Managing Counsel of BNY Mellon from December 2019 to August 2021; Counsel of BNY Mellon from May 2016 to December 2019; Assistant Secretary of the Adviser from April 2018 to August 2021. She is an officer of 56 investment companies (comprised of 129 portfolios) managed by the Adviser or an affiliate of the Adviser. She is 36 years old and has been an employee of BNY Mellon since May 2016.
GAVIN C. REILLY, Assistant Treasurer since December 2005.
Tax Manager–BNY Mellon Fund Administration, and an officer of 57 investment companies (comprised of 130 portfolios) managed by the Adviser or an affiliate of the Adviser. He is 53 years old and has been an employee of the Adviser since April 1991.
ROBERT SALVIOLO, Assistant Treasurer since July 2007.
Senior Accounting Manager–BNY Mellon Fund Administration, and an officer of 57 investment companies (comprised of 130 portfolios) managed by the Adviser or an affiliate of the Adviser. He is 54 years old and has been an employee of the Adviser since June 1989.
ROBERT SVAGNA, Assistant Treasurer since December 2002.
Senior Accounting Manager–BNY Mellon Fund Administration, and an officer of 57 investment companies (comprised of 130 portfolios) managed by the Adviser or an affiliate of the Adviser. He is 54 years old and has been an employee of the Adviser since November 1990.
JOSEPH W. CONNOLLY, Chief Compliance Officer since October 2004.
Chief Compliance Officer of the BNY Mellon Family of Funds and BNY Mellon Funds Trust since 2004; Chief Compliance Officer of the Adviser from 2004 until June 2021. He is an officer of 56 investment companies (comprised of 117 portfolios) managed by the Adviser. He is 64 years old.
CARIDAD M. CAROSELLA, Anti-Money Laundering Compliance Officer since January 2016.
Anti-Money Laundering Compliance Officer of the BNY Mellon Family of Funds and BNY Mellon Funds Trust. She is an officer of 49 investment companies (comprised of 122 portfolios) managed by the Adviser or an affiliate of the Adviser. She is 53 years old and has been an employee of the Distributor since 1997.
30
This page intentionally left blank.
31
This page intentionally left blank.
32
This page intentionally left blank.
33
BNY Mellon Variable Investment Fund, Opportunistic Small Cap Portfolio
240 Greenwich Street
New York, NY 10286
Adviser
BNY Mellon Investment Adviser, Inc.
240 Greenwich Street
New York, NY 10286
Sub-Adviser
Newton Investment Management
North America, LLC
BNY Mellon Center
201 Washington Place
Boston, MA 02108
Custodian
The Bank of New York Mellon
240 Greenwich Street
New York, NY 10286
Transfer Agent &
Dividend Disbursing Agent
BNY Mellon Transfer, Inc.
240 Greenwich Street
New York, NY 10286
Distributor
BNY Mellon Securities Corporation
240 Greenwich Street
New York, NY 10286
Telephone 1-800-258-4260 or 1-800-258-4261
Mail The BNY Mellon Family of Funds, 144 Glenn Curtiss Boulevard, Uniondale, NY 11556-0144 Attn: Institutional Services Department
E-mail Send your request to info@bnymellon.com
Internet Information can be viewed online or downloaded at www.im.bnymellon.com
The fund files its complete schedule of portfolio holdings with the Securities and Exchange Commission (“SEC”) for the first and third quarters of each fiscal year on Form N-PORT. The fund’s Forms N-PORT are available on the SEC’s website at www.sec.gov.
A description of the policies and procedures that the fund uses to determine how to vote proxies relating to portfolio securities and information regarding how the fund voted these proxies for the most recent 12-month period ended June 30 is available at www.im.bnymellon.com and on the SEC’s website at www.sec.gov and without charge, upon request, by calling 1-800-373-9387.
| | |
© 2022 BNY Mellon Securities Corporation
0121AR1221 | 
|
Item 2. Code of Ethics.
The Registrant has adopted a code of ethics that applies to the Registrant's principal executive officer, principal financial officer, principal accounting officer or controller, or persons performing similar functions. There have been no amendments to, or waivers in connection with, the Code of Ethics during the period covered by this Report.
Item 3. Audit Committee Financial Expert.
The Registrant's Board has determined that Gina D. France, a member of the Audit Committee of the Board, is an audit committee financial expert as defined by the Securities and Exchange Commission (the "SEC"). Ms. France is "independent" as defined by the SEC for purposes of audit committee financial expert determinations.
Item 4. Principal Accountant Fees and Services.
(a) Audit Fees. The aggregate fees billed for each of the last two fiscal years (the "Reporting Periods") for professional services rendered by the Registrant's principal accountant (the "Auditor") for the audit of the Registrant's annual financial statements or services that are normally provided by the Auditor in connection with the statutory and regulatory filings or engagements for the Reporting Periods, were $139,412 in 2020 and $139,412 in 2021.
(b) Audit-Related Fees. The aggregate fees billed in the Reporting Periods for assurance and related services by the Auditor that are reasonably related to the performance of the audit of the Registrant's financial statements and are not reported under paragraph (a) of this Item 4 were $45,186 in 2020 and $31,535 in 2021. These services consisted of one or more of the following: (i) agreed upon procedures related to compliance with Internal Revenue Code section 817(h), (ii) security counts required by Rule 17f-2 under the Investment Company Act of 1940, as amended, (iii) advisory services as to the accounting or disclosure treatment of Registrant transactions or events and (iv) advisory services to the accounting or disclosure treatment of the actual or potential impact to the Registrant of final or proposed rules, standards or interpretations by the Securities and Exchange Commission, the Financial Accounting Standards Boards or other regulatory or standard-setting bodies.
The aggregate fees billed in the Reporting Periods for non-audit assurance and related services by the Auditor to the Registrant's investment adviser (not including any sub-investment adviser whose role is primarily portfolio management and is subcontracted with or overseen by another investment adviser), and any entity controlling, controlled by or under common control with the investment adviser that provides ongoing services to the Registrant ("Service Affiliates"), that were reasonably related to the performance of the annual audit of the Service Affiliate, which required pre-approval by the Audit Committee were $0 in 2020 and $0 in 2021.
(c) Tax Fees. The aggregate fees billed in the Reporting Periods for professional services rendered by the Auditor for tax compliance, tax advice, and tax planning ("Tax Services") were $12,416 in 2020 and $19,008 in 2021. These services consisted of: (i) review or preparation of U.S. federal, state, local and excise tax returns; (ii) U.S. federal, state and local tax planning, advice and assistance regarding statutory, regulatory or administrative developments; (iii) tax advice regarding tax qualification matters and/or treatment of various financial instruments held or proposed to be acquired or held, and (iv) determination of Passive Foreign Investment Companies. The aggregate fees billed in the Reporting Periods for Tax Services by the Auditor to Service Affiliates, which required pre-approval by the Audit Committee were $0 in 2020 and $12,369 in 2021.
(d) All Other Fees. The aggregate fees billed in the Reporting Periods for products and services provided by the Auditor, other than the services reported in paragraphs (a) through (c) of this Item, were $0 in 2020 and $201 in 2021. These services consisted of a review of the Registrant's anti-money laundering program.
The aggregate fees billed in the Reporting Periods for Non-Audit Services by the Auditor to Service Affiliates, other than the services reported in paragraphs (b) through (c) of this Item, which required pre-approval by the Audit Committee, were $0 in 2020 and $0 in 2021.
(e)(1) Audit Committee Pre-Approval Policies and Procedures. The Registrant's Audit Committee has established policies and procedures (the "Policy") for pre-approval (within specified fee limits) of the Auditor's engagements for non-audit services to the Registrant and Service Affiliates without specific case-by-case consideration. The pre-approved services in the Policy can include pre-approved audit services, pre-approved audit-related services, pre-approved tax services and pre-approved all other services. Pre-approval considerations include whether the proposed services are compatible with maintaining the Auditor's independence. Pre-approvals pursuant to the Policy are considered annually.
(e)(2) Note. None of the services described in paragraphs (b) through (d) of this Item 4 were approved by the Audit Committee pursuant to paragraph (c)(7)(i)(C) of Rule 2-01 of Regulation S-X.
(f) None of the hours expended on the principal accountant's engagement to audit the registrant's financial statements for the most recent fiscal year were attributed to work performed by persons other than the principal accountant's full-time, permanent employees.
Non-Audit Fees. The aggregate non-audit fees billed by the Auditor for services rendered to the Registrant, and rendered to Service Affiliates, for the Reporting Periods were $1,264,899 in 2020 and $3,095,435 in 2021.
Auditor Independence. The Registrant's Audit Committee has considered whether the provision of non-audit services that were rendered to Service Affiliates, which were not pre-approved (not requiring pre-approval), is compatible with maintaining the Auditor's independence.
Item 5. Audit Committee of Listed Registrants.
Not applicable.
Item 6. Investments.
(a) Not applicable.
| Item 7. | Disclosure of Proxy Voting Policies and Procedures for Closed-End Management Investment Companies. |
Not applicable.
Item 8. Portfolio Managers of Closed-End Management Investment Companies.
Not applicable.
| Item 9. | Purchases of Equity Securities by Closed-End Management Investment Companies and Affiliated Purchasers. |
Not applicable.
| Item 10. | Submission of Matters to a Vote of Security Holders. |
There have been no material changes to the procedures applicable to Item 10.
| Item 11. | Controls and Procedures. |
(a) The Registrant's principal executive and principal financial officers have concluded, based on their evaluation of the Registrant's disclosure controls and procedures as of a date within 90 days of the filing date of this report, that the Registrant's disclosure controls and procedures are reasonably designed to ensure that information required to be disclosed by the Registrant on Form N-CSR is recorded, processed, summarized and reported within the required time periods and that information required to be disclosed by the Registrant in the reports that it files or submits on Form N-CSR is accumulated and communicated to the Registrant's management, including its principal executive and principal financial officers, as appropriate to allow timely decisions regarding required disclosure.
(b) There were no changes to the Registrant's internal control over financial reporting that occurred during the period covered by this report that have materially affected, or are reasonably likely to materially affect, the Registrant's internal control over financial reporting.
| Item 12. | Disclosure of Securities Lending Activities for Closed-End Management Investment Companies. |
Not applicable.
(a)(1) Code of ethics referred to in Item 2.
(a)(2) Certifications of principal executive and principal financial officers as required by Rule 30a-2(a) under the Investment Company Act of 1940.
(a)(3) Not applicable.
(b) Certification of principal executive and principal financial officers as required by Rule 30a-2(b) under the Investment Company Act of 1940.
SIGNATURES
Pursuant to the requirements of the Securities Exchange Act of 1934 and the Investment Company Act of 1940, the Registrant has duly caused this Report to be signed on its behalf by the undersigned, thereunto duly authorized.
BNY Mellon Variable Investment Fund
By: /s/ David DiPetrillo
David DiPetrillo
President (Principal Executive Officer)
Date: February 7, 2022
Pursuant to the requirements of the Securities Exchange Act of 1934 and the Investment Company Act of 1940, this Report has been signed below by the following persons on behalf of the Registrant and in the capacities and on the dates indicated.
By: /s/ David DiPetrillo
David DiPetrillo
President (Principal Executive Officer)
Date: February 7, 2022
By: /s/ James Windels
James Windels
Treasurer (Principal Financial Officer)
Date: February 7, 2022
EXHIBIT INDEX
(a)(1) Code of ethics referred to in Item 2.
(a)(2) Certifications of principal executive and principal financial officers as required by Rule 30a-2(a) under the Investment Company Act of 1940. (EX-99.CERT)
(b) Certification of principal executive and principal financial officers as required by Rule 30a-2(b) under the Investment Company Act of 1940. (EX-99.906CERT)