UNITED STATES
SECURITIES AND EXCHANGE COMMISSION
Washington, D.C. 20549
FORM N-CSR
CERTIFIED SHAREHOLDER REPORT OF REGISTERED MANAGEMENT
INVESTMENT COMPANIES
| Investment Company Act file number | 811-05125 |
| | |
| | BNY Mellon Variable Investment Fund | |
| | (Exact name of Registrant as specified in charter) | |
| | | |
| | c/o BNY Mellon Investment Adviser, Inc. 240 Greenwich Street New York, New York 10286 | |
| | (Address of principal executive offices) (Zip code) | |
| | | |
| | Deirdre Cunnane, Esq. 240 Greenwich Street New York, New York 10286 | |
| | (Name and address of agent for service) | |
| |
| Registrant's telephone number, including area code: | (212) 922-6400 |
| | |
Date of fiscal year end: | 12/31 | |
| Date of reporting period: | 12/31/2022 | |
| | | | | | | |
FORM N-CSR
Item 1. Reports to Stockholders.
BNY Mellon Variable Investment Fund, Appreciation Portfolio
| |
ANNUAL REPORT December 31, 2022 |

| |
Save time. Save paper. View your next shareholder report online as soon as it’s available. Log into www.im.bnymellon.com and sign up for eCommunications. It’s simple and only takes a few minutes. |
| |
The views expressed in this report reflect those of the portfolio manager(s) only through the end of the period covered and do not necessarily represent the views of BNY Mellon Investment Adviser, Inc. or any other person in the BNY Mellon Investment Adviser, Inc. organization. Any such views are subject to change at any time based upon market or other conditions and BNY Mellon Investment Adviser, Inc. disclaims any responsibility to update such views. These views may not be relied on as investment advice and, because investment decisions for a fund in the BNY Mellon Family of Funds are based on numerous factors, may not be relied on as an indication of trading intent on behalf of any fund in the BNY Mellon Family of Funds. |
| |
Not FDIC-Insured • Not Bank-Guaranteed • May Lose Value |
Contents
THE FUND
FOR MORE INFORMATION
Back Cover
DISCUSSION OF FUND PERFORMANCE (Unaudited)
For the period from January 1, 2022, through December 31, 2022, as provided portfolio managers Alan Christensen, Catherine Crain, Gentry Lee, Christopher Sarofim, and Charles Sheedy of Fayez Sarofim & Co., sub-adviser
Market and Fund Performance Overview
For the 12-month period ended December 31, 2022, BNY Mellon Variable Investment Fund, Appreciation Portfolio’s (the “fund”) Initial shares achieved a total return of −18.06%, and its Service shares achieved a total return of −18.26%.1 In comparison, the fund’s benchmark, the S&P 500® Index (the “Index”), produced a total return of −18.10% for the same period.2
The reporting period was defined by a significant shift from positive to negative investor sentiment that led to steep declines in the equity market. The fund’s Initial shares outperformed the Index, while the Service shares underperformed.
The Fund’s Investment Approach
The fund seeks long-term capital growth consistent with the preservation of capital. Its secondary goal is current income. To pursue these goals, the fund normally invests at least 80% of its net assets in common stocks. The fund focuses on blue-chip companies with total market capitalizations of more than $5 billion at the time of purchase, including multinational companies. These are established companies that have demonstrated sustained patterns of profitability, strong balance sheets, an expanding global presence and the potential to achieve predictable, above-average earnings growth.
In choosing stocks, we identify economic sectors we believe will expand over the next three-to-five years or longer. Using fundamental analysis, we then seek companies within these sectors that have proven track records and dominant positions in their industries. The fund employs a “buy-and-hold” investment strategy, which generally has resulted in an annual portfolio turnover rate of below 15%. A low portfolio turnover rate helps reduce the fund’s trading costs.3
Inflation, Interest Rates and Geopolitics Hindered the Market
The Index reached new all-time highs in early January before concerns over high inflation and central bank policy turned investor sentiment negative. Inflation data and the Federal Reserve’s (the “Fed”) monetary tightening policies dominated the market narrative in 2022. Inflation continued to rise and reached a multi-decade high of 9.1% in June of 2022, as measured by the annual headline CPI, worrying consumers and investors alike. The adverse impact of the sanctions against Russia and China’s stringent “Zero COVID” policies on global supply chains put upward pressure on prices across the globe. U.S. consumers continued to exhibit strong demand for goods and services, anchored by robust savings and low unemployment.
In response, the Fed shifted its policy from helping the economy recover from the pandemic to fighting inflation by raising the federal funds rate and reducing its balance sheet. Higher rates are intended to help tame inflation as consumers and businesses cut back on consumption and investments due to higher borrowing costs, but an overly aggressive increase could go too far and tip the economy into a recession. At year-end, data indicated
2
inflation had consistently slowed from its mid-year peak to 6.5%. The ultimate result of the Fed’s monetary tightening policy continues to be debated, with a recession as the worst-case scenario and a “soft landing” as the best-case scenario.
While the first three quarters delivered losses, the market posted a fourth-quarter gain to reduce losses for the year. Investor sentiment was boosted by a slower pace of interest-rate increases, China’s loosening its Zero COVID policy and corporate earnings holding up against a tougher macroeconomic environment. As inflation decelerated, the Fed downshifted and raised the federal funds rate by 50 basis points (bps) in December after six hikes earlier in the year, including four-consecutive hikes of 75 bps. While the last increase of the year was lower, the Fed reiterated its outlook that rates need to remain higher for longer to tame inflation. Investors weighed both the Fed’s hawkishness against data showing inflation had peaked and economic activity was beginning to slow, which supported a Fed pivot to a narrative of rate cuts.
Taken together, the prospects of slower growth and higher interest rates dampened the growth outlook and negatively impacted stock valuation. Within the S&P 500 Index, strong demand from economic reopening and high energy prices drove the energy sector’s standout 66% gain for the year. Every other sector in the Index struggled, with notable underperformance from the communication services, consumer discretionary and information technology sectors.
Energy Allocation and Stock Selection Drove Performance
The fund’s performance versus the Index was mixed. Positive contributions were driven by the impact of a favorable sector allocation effect. The fund benefited from both a strategic overweight in the energy sector, which contributed to a positive allocation effect, and a smaller, positive stock selection effect stemming from the fund’s holdings. Within the information technology sector, the fund’s strategic group of holdings supported fund results. In the consumer discretionary sector, the fund’s performance benefited from a positive selection effect as its holdings outpaced sector peers. The top contributors to relative performance included Chevron Corp., Hess Corp., Novo Nordisk A/S, Exxon Mobil Corp. and UnitedHealth Group Inc.
Conversely, fund performance was hindered by certain sector allocation and stock selection decisions. In the communication services sector, the fund’s stock selections lagged sector peers and negatively contributed to results. Within the health care sector, the dual impact of a negative allocation effect and a negative selection effect also detracted from relative results. The fund’s underweight allocation and holdings in the industrials sector negatively impacted relative results as well. The top detractors from relative performance included Meta Platforms Inc., Amazon.com Inc., Microsoft Corp., Apple Inc. and Alphabet Inc.
Volatility Creates Opportunities
A volatile market environment is one that may hold opportunities for investors with a long-term focus on high-quality companies. The fund remains focused on companies with solid pricing power, high margins and strong balance sheets. Corporate stewardship, evidenced by prudent capital allocation, always matters, but more so in uncertain times. Therefore, we remain intensely focused on how the businesses we own deploy capital for the benefit of their shareholders. Capital allocation and operational excellence remain paramount, with
3
DISCUSSION OF FUND PERFORMANCE (Unaudited) (continued)
missteps quickly punished in the current market environment. While we do not see reasons to be overly aggressive, as the Fed is raising interest rates, we are beginning to see more attractive valuations in companies that we believe may have unique competitive advantages. On behalf of our clients, we remain dedicated to identifying the best businesses and management teams at attractive prices.
January 17, 2023
1 Total return includes reinvestment of dividends and any capital gains paid. Past performance is no guarantee of future results. Share price and investment return fluctuate such that upon redemption, fund shares may be worth more or less than their original cost. The fund’s performance does not reflect the deduction of additional charges and expenses imposed in connection with investing in variable insurance contracts, which will reduce returns.
2 Source: Lipper Inc. — The S&P 500® Index is widely regarded as the best single gauge of large-cap U.S. equities. The Index includes 500 leading companies and captures approximately 80% coverage of available market capitalization. Investors cannot invest directly in any index.
3 Achieving tax efficiency is not a part of the fund’s investment objective, and there can be no guarantee that the fund will achieve any particular level of taxable distributions in future years. In periods when the manager has to sell significant amounts of securities (e.g., during periods of significant net redemptions or changes in index components), the fund can be expected to be less tax efficient than during periods of more stable market conditions and asset flows.
Please note: the position in security highlighted with italicized typeface was sold during the reporting period.
Equities are subject generally to market, market sector, market liquidity, issuer and investment style risks, among other factors, to varying degrees, all of which are more fully described in the fund’s prospectus.
The fund is only available as a funding vehicle under variable life insurance policies or variable annuity contracts issued by insurance companies. Individuals may not purchase shares of the fund directly. A variable annuity is an insurance contract issued by an insurance company that enables investors to accumulate assets on a tax-deferred basis for retirement or other long-term goals. The investment objective and policies of BNY Mellon Variable Investment Fund, Appreciation Portfolio made available through insurance products may be similar to those of other funds managed by BNY Mellon. However, the investment results of the fund may be higher or lower than, and may not be comparable to, those of any other BNY Mellon fund.
Recent market risks include pandemic risks related to COVID-19. The effects of COVID-19 have contributed to increased volatility in global markets and will likely affect certain countries, companies, industries and market sectors more dramatically than others. To the extent the fund may overweight its investments in certain countries, companies, industries or market sectors, such positions will increase the fund’s exposure to risk of loss from adverse developments affecting those countries, companies, industries or sectors.
4
FUND PERFORMANCE (Unaudited)
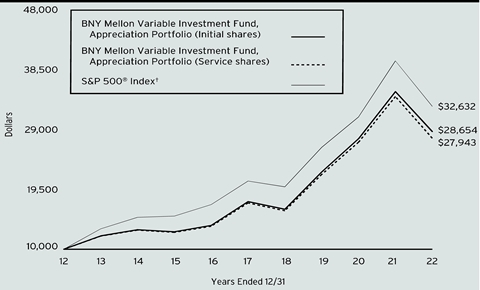
Comparison of change in value of a $10,000 investment in Initial shares and Service shares of BNY Mellon Variable Investment Fund, Appreciation Portfolio with a hypothetical investment of $10,000 in the S&P 500® Index (the “Index”).
† Source: Lipper Inc.
Past performance is not predictive of future performance. The fund’s performance does not reflect the deduction of additional charges and expenses imposed in connection with investing in variable insurance contracts which will reduce returns.
The above graph compares a hypothetical investment of $10,000 made in each Initial shares and Service shares of BNY Mellon Variable Investment Fund, Appreciation Portfolio on 12/31/12 to a hypothetical investment of $10,000 made in the Index on that date.
The fund’s performance shown in the line graph above takes into account all applicable fund fees and expenses for Initial shares and Service shares. The Index is widely regarded as the best single gauge of large-cap U.S. equities. The Index includes 500 leading companies and captures approximately 80% coverage of available market capitalization. Unlike a mutual fund, the Index is not subject to charges, fees and other expenses. Investors cannot invest directly in any index. Further information relating to fund performance, including expense reimbursements, if applicable, is contained in the Financial Highlights section of the prospectus and elsewhere in this report.
| | | | |
Average Annual Total Returns as of 12/31/2022 |
| 1 Year | 5 Years | 10 Years |
Initial shares | -18.06% | 10.31% | 11.10% |
Service shares | -18.26% | 10.03% | 10.82% |
S&P 500® Index | -18.10% | 9.42% | 12.55% |
The performance data quoted represents past performance, which is no guarantee of future results. Share price and investment return fluctuate and an investor’s shares may be worth more or less than original cost upon redemption. Current performance may be lower or higher than the performance quoted. Go to www.im.bnymellon.com for the fund’s most recent month-end returns.
The fund’s Initial shares are not subject to a Rule 12b-1 fee. The fund’s Service shares are subject to a .25% annual Rule 12b-1 fee. All dividends and capital gain distributions are reinvested.
The fund’s performance shown in the graph and table does not reflect the deduction of taxes that a shareholder would pay on fund distributions or the redemption of fund shares.
5
UNDERSTANDING YOUR FUND’S EXPENSES (Unaudited)
As a mutual fund investor, you pay ongoing expenses, such as management fees and other expenses. Using the information below, you can estimate how these expenses affect your investment and compare them with the expenses of other funds. You also may pay one-time transaction expenses, including sales charges (loads), redemption fees and expenses associated with variable annuity or insurance contracts, which are not shown in this section and would have resulted in higher total expenses. For more information, see your fund’s prospectus or talk to your financial adviser.
Review your fund’s expenses
The table below shows the expenses you would have paid on a $1,000 investment in BNY Mellon Variable Investment Fund, Appreciation Portfolio from July 1, 2022 to December 31, 2022. It also shows how much a $1,000 investment would be worth at the close of the period, assuming actual returns and expenses.
| | | | | |
Expenses and Value of a $1,000 Investment | |
Assume actual returns for the six months ended December 31, 2022 | |
| | | | |
| | Initial Shares | Service Shares | |
Expenses paid per $1,000† | $4.29 | $5.58 | |
Ending value (after expenses) | $1,050.20 | $1,049.10 | |
COMPARING YOUR FUND’S EXPENSES WITH THOSE OF OTHER FUNDS (Unaudited)
Using the SEC’s method to compare expenses
The Securities and Exchange Commission (“SEC”) has established guidelines to help investors assess fund expenses. Per these guidelines, the table below shows your fund’s expenses based on a $1,000 investment, assuming a hypothetical 5% annualized return. You can use this information to compare the ongoing expenses (but not transaction expenses or total cost) of investing in the fund with those of other funds. All mutual fund shareholder reports will provide this information to help you make this comparison. Please note that you cannot use this information to estimate your actual ending account balance and expenses paid during the period.
| | | | | |
Expenses and Value of a $1,000 Investment | |
Assuming a hypothetical 5% annualized return for the six months ended December 31, 2022 | |
| | | | |
| | Initial Shares | Service Shares | |
Expenses paid per $1,000† | $4.23 | $5.50 | |
Ending value (after expenses) | $1,021.02 | $1,019.76 | |
† | Expenses are equal to the fund’s annualized expense ratio of .83% for Initial Shares and 1.08% for Service Shares, multiplied by the average account value over the period, multiplied by 184/365 (to reflect the one-half year period). |
6
STATEMENT OF INVESTMENTS
December 31, 2022
| | | | | | | | |
| |
Description | | | | Shares | | Value ($) | |
Common Stocks - 99.2% | | | | | |
Banks - 1.5% | | | | | |
JPMorgan Chase & Co. | | | | 20,980 | | 2,813,418 | |
Capital Goods - 1.6% | | | | | |
Otis Worldwide Corp. | | | | 10,965 | | 858,669 | |
Raytheon Technologies Corp. | | | | 20,120 | | 2,030,510 | |
| | | | | 2,889,179 | |
Commercial & Professional Services - .5% | | | | | |
Verisk Analytics Inc. | | | | 5,165 | | 911,209 | |
Consumer Durables & Apparel - 4.5% | | | | | |
Hermes International | | | | 800 | | 1,237,440 | |
LVMH SE | | | | 6,280 | | 4,570,577 | |
NIKE Inc., Cl. B | | | | 20,985 | | 2,455,455 | |
| | | | | 8,263,472 | |
Consumer Services - 3.7% | | | | | |
Marriott International Inc., Cl. A | | | | 18,350 | | 2,732,132 | |
McDonald's Corp. | | | | 15,165 | | 3,996,432 | |
| | | | | 6,728,564 | |
Diversified Financials - 6.7% | | | | | |
BlackRock Inc. | | | | 6,655 | | 4,715,933 | |
Intercontinental Exchange Inc. | | | | 33,775 | | 3,464,977 | |
S&P Global Inc. | | | | 12,415 | | 4,158,280 | |
| | | | | 12,339,190 | |
Energy - 11.6% | | | | | |
Chevron Corp. | | | | 51,930 | | 9,320,916 | |
Exxon Mobil Corp. | | | | 41,400 | | 4,566,420 | |
Hess Corp. | | | | 52,075 | | 7,385,276 | |
| | | | | 21,272,612 | |
Food, Beverage & Tobacco - 9.0% | | | | | |
Altria Group Inc. | | | | 22,610 | | 1,033,503 | |
Nestle SA, ADR | | | | 25,305 | | 2,918,679 | |
PepsiCo Inc. | | | | 24,530 | | 4,431,590 | |
Philip Morris International Inc. | | | | 38,165 | | 3,862,680 | |
The Coca-Cola Company | | | | 66,480 | | 4,228,793 | |
| | | | | 16,475,245 | |
Health Care Equipment & Services - 8.0% | | | | | |
Abbott Laboratories | | | | 39,050 | | 4,287,300 | |
Intuitive Surgical Inc. | | | | 10,005 | a | 2,654,827 | |
UnitedHealth Group Inc. | | | | 14,425 | | 7,647,846 | |
| | | | | 14,589,973 | |
Household & Personal Products - 2.5% | | | | | |
The Estee Lauder Companies, Cl. A | | | | 14,860 | | 3,686,915 | |
7
STATEMENT OF INVESTMENTS (continued)
| | | | | | | | |
| |
Description | | | | Shares | | Value ($) | |
Common Stocks - 99.2% (continued) | | | | | |
Household & Personal Products - 2.5% (continued) | | | | | |
The Procter & Gamble Company | | | | 6,500 | | 985,140 | |
| | | | | 4,672,055 | |
Insurance - 1.3% | | | | | |
The Progressive Corp. | | | | 18,470 | | 2,395,744 | |
Materials - 4.7% | | | | | |
Air Products & Chemicals Inc. | | | | 19,215 | | 5,923,216 | |
The Sherwin-Williams Company | | | | 10,940 | | 2,596,390 | |
| | | | | 8,519,606 | |
Media & Entertainment - 4.0% | | | | | |
Alphabet Inc., Cl. C | | | | 53,350 | a | 4,733,745 | |
Comcast Corp., Cl. A | | | | 73,275 | | 2,562,427 | |
| | | | | 7,296,172 | |
Pharmaceuticals Biotechnology & Life Sciences - 4.8% | | | | | |
Eli Lilly & Co. | | | | 2,000 | | 731,680 | |
Johnson & Johnson | | | | 10,670 | | 1,884,856 | |
Novo Nordisk A/S, ADR | | | | 45,415 | | 6,146,466 | |
| | | | | 8,763,002 | |
Retailing - 2.9% | | | | | |
Amazon.com Inc. | | | | 63,700 | a | 5,350,800 | |
Semiconductors & Semiconductor Equipment - 5.3% | | | | | |
ASML Holding NV | | | | 6,695 | | 3,658,148 | |
Texas Instruments Inc. | | | | 36,515 | | 6,033,008 | |
| | | | | 9,691,156 | |
Software & Services - 17.4% | | | | | |
Adobe Inc. | | | | 6,155 | a | 2,071,342 | |
Automatic Data Processing Inc. | | | | 6,235 | | 1,489,292 | |
Gartner Inc. | | | | 2,685 | a | 902,536 | |
Intuit Inc. | | | | 6,815 | | 2,652,534 | |
Mastercard Inc., Cl. A | | | | 8,450 | | 2,938,319 | |
Microsoft Corp. | | | | 60,205 | | 14,438,363 | |
Visa Inc., Cl. A | | | | 35,700 | b | 7,417,032 | |
| | | | | 31,909,418 | |
Technology Hardware & Equipment - 5.7% | | | | | |
Apple Inc. | | | | 80,355 | | 10,440,525 | |
Transportation - 3.5% | | | | | |
Canadian Pacific Railway Ltd. | | | | 29,720 | | 2,216,815 | |
Union Pacific Corp. | | | | 20,515 | | 4,248,041 | |
| | | | | 6,464,856 | |
Total Common Stocks (cost $67,758,181) | | | | 181,786,196 | |
8
| | | | | | | | |
| |
Description | | 1-Day
Yield (%) | | Shares | | Value ($) | |
Investment Companies - .7% | | | | | |
Registered Investment Companies - .7% | | | | | |
Dreyfus Institutional Preferred Government Plus Money Market Fund, Institutional Shares
(cost $1,281,219) | | 4.37 | | 1,281,219 | c | 1,281,219 | |
Total Investments (cost $69,039,400) | | 99.9% | | 183,067,415 | |
Cash and Receivables (Net) | | .1% | | 128,693 | |
Net Assets | | 100.0% | | 183,196,108 | |
ADR—American Depository Receipt
a Non-income producing security.
b Security, or portion thereof, on loan. At December 31, 2022, the value of the fund’s securities on loan was $7,342,862 and the value of the collateral was $7,503,328, consisting of U.S. Government & Agency securities. In addition, the value of collateral may include pending sales that are also on loan.
c Investment in affiliated issuer. The investment objective of this investment company is publicly available and can be found within the investment company’s prospectus.
| | |
Portfolio Summary (Unaudited) † | Value (%) |
Information Technology | 28.4 |
Health Care | 12.7 |
Energy | 11.6 |
Consumer Staples | 11.5 |
Consumer Discretionary | 11.1 |
Financials | 9.6 |
Industrials | 5.6 |
Materials | 4.7 |
Communication Services | 4.0 |
Investment Companies | .7 |
| | 99.9 |
† Based on net assets.
See notes to financial statements.
9
STATEMENT OF INVESTMENTS (continued)
| | | | | | | |
Affiliated Issuers | | | |
Description | Value ($) 12/31/2021 | Purchases ($)† | Sales ($) | Value ($) 12/31/2022 | Dividends/
Distributions ($) | |
Registered Investment Companies - .7% | | |
Dreyfus Institutional Preferred Government Plus Money Market Fund, Institutional Shares - .7% | 1,682,704 | 22,824,352 | (23,225,837) | 1,281,219 | 21,159 | |
Investment of Cash Collateral for Securities Loaned - .0% | | |
Dreyfus Institutional Preferred Government Plus Money Market Fund, SL Shares - .0% | - | 14,458,143 | (14,458,143) | - | 10,026 | †† |
Total - .7% | 1,682,704 | 37,282,495 | (37,683,980) | 1,281,219 | 31,185 | |
† Includes reinvested dividends/distributions.
†† Represents securities lending income earned from the reinvestment of cash collateral from loaned securities, net of fees and collateral investment expenses, and other payments to and from borrowers of securities.
See notes to financial statements.
10
STATEMENT OF ASSETS AND LIABILITIES
December 31, 2022
| | | | | | | |
| | | | | | |
| | | Cost | | Value | |
Assets ($): | | | | |
Investments in securities—See Statement of Investments
(including securities on loan, valued at $7,342,862)—Note 1(c): | | | |
Unaffiliated issuers | 67,758,181 | | 181,786,196 | |
Affiliated issuers | | 1,281,219 | | 1,281,219 | |
Cash denominated in foreign currency | | | 28,098 | | 28,570 | |
Dividends and securities lending income receivable | | 145,354 | |
Tax reclaim receivable—Note 1(b) | | 131,906 | |
Receivable for shares of Beneficial Interest subscribed | | 57,316 | |
Prepaid expenses | | | | | 2,918 | |
| | | | | 183,433,479 | |
Liabilities ($): | | | | |
Due to BNY Mellon Investment Adviser, Inc. and affiliates—Note 3(b) | | 102,673 | |
Due to Fayez Sarofim & Co. | | | | | 34,413 | |
Payable for shares of Beneficial Interest redeemed | | 33,645 | |
Trustees’ fees and expenses payable | | 805 | |
Other accrued expenses | | | | | 65,835 | |
| | | | | 237,371 | |
Net Assets ($) | | | 183,196,108 | |
Composition of Net Assets ($): | | | | |
Paid-in capital | | | | | 52,586,671 | |
Total distributable earnings (loss) | | | | | 130,609,437 | |
Net Assets ($) | | | 183,196,108 | |
| | | | |
Net Asset Value Per Share | Initial Shares | Service Shares | |
Net Assets ($) | 148,683,015 | 34,513,093 | |
Shares Outstanding | 4,655,840 | 1,101,974 | |
Net Asset Value Per Share ($) | 31.93 | 31.32 | |
| | | |
See notes to financial statements. | | | |
11
STATEMENT OF OPERATIONS
Year Ended December 31, 2022
| | | | | | | |
| | | | | | |
| | | | | | |
Investment Income ($): | | | | |
Income: | | | | |
Cash dividends (net of $45,538 foreign taxes withheld at source): | |
Unaffiliated issuers | | | 2,911,239 | |
Affiliated issuers | | | 21,159 | |
Income from securities lending—Note 1(c) | | | 10,026 | |
Total Income | | | 2,942,424 | |
Expenses: | | | | |
Management fee—Note 3(a) | | | 1,062,390 | |
Sub-advisory fee—Note 3(a) | | | 433,934 | |
Distribution fees—Note 3(b) | | | 96,557 | |
Professional fees | | | 86,697 | |
Chief Compliance Officer fees—Note 3(b) | | | 17,082 | |
Trustees’ fees and expenses—Note 3(c) | | | 12,521 | |
Custodian fees—Note 3(b) | | | 9,278 | |
Prospectus and shareholders’ reports | | | 8,480 | |
Loan commitment fees—Note 2 | | | 3,295 | |
Shareholder servicing costs—Note 3(b) | | | 2,363 | |
Miscellaneous | | | 17,894 | |
Total Expenses | | | 1,750,491 | |
Less—reduction in fees due to earnings credits—Note 3(b) | | | (167) | |
Net Expenses | | | 1,750,324 | |
Net Investment Income | | | 1,192,100 | |
Realized and Unrealized Gain (Loss) on Investments—Note 4 ($): | | |
Net realized gain (loss) on investments and foreign currency transactions | 16,343,517 | |
Net change in unrealized appreciation (depreciation) on investments
and foreign currency transactions | (62,304,879) | |
Net Realized and Unrealized Gain (Loss) on Investments | | | (45,961,362) | |
Net (Decrease) in Net Assets Resulting from Operations | | (44,769,262) | |
| | | | | | |
See notes to financial statements. | | | | | |
12
STATEMENT OF CHANGES IN NET ASSETS
| | | | | | | | | | |
| | | | Year Ended December 31, |
| | | | 2022 | | 2021 | |
Operations ($): | | | | | | | | |
Net investment income | | | 1,192,100 | | | | 1,666,169 | |
Net realized gain (loss) on investments | | 16,343,517 | | | | 216,800,860 | |
Net change in unrealized appreciation
(depreciation) on investments | | (62,304,879) | | | | (110,430,149) | |
Net Increase (Decrease) in Net Assets
Resulting from Operations | (44,769,262) | | | | 108,036,880 | |
Distributions ($): | |
Distributions to shareholders: | | | | | | | | |
Initial Shares | | | (49,260,114) | | | | (31,784,721) | |
Service Shares | | | (12,305,995) | | | | (14,100,431) | |
Total Distributions | | | (61,566,109) | | | | (45,885,152) | |
Beneficial Interest Transactions ($): | |
Net proceeds from shares sold: | | | | | | | | |
Initial Shares | | | 5,098,767 | | | | 8,890,258 | |
Service Shares | | | 4,465,808 | | | | 9,494,352 | |
Distributions reinvested: | | | | | | | | |
Initial Shares | | | 49,260,114 | | | | 31,784,721 | |
Service Shares | | | 12,305,983 | | | | 14,100,431 | |
Cost of shares redeemed: | | | | | | | | |
Initial Shares | | | (21,378,557) | | | | (182,479,259) | |
Service Shares | | | (11,004,944) | | | | (127,733,452) | |
Increase (Decrease) in Net Assets
from Beneficial Interest Transactions | 38,747,171 | | | | (245,942,949) | |
Total Increase (Decrease) in Net Assets | (67,588,200) | | | | (183,791,221) | |
Net Assets ($): | |
Beginning of Period | | | 250,784,308 | | | | 434,575,529 | |
End of Period | | | 183,196,108 | | | | 250,784,308 | |
Capital Share Transactions (Shares): | |
Initial Shares | | | | | | | | |
Shares sold | | | 140,376 | | | | 183,200 | |
Shares issued for distributions reinvested | | | 1,375,506 | | | | 721,370 | |
Shares redeemed | | | (596,803) | | | | (3,493,168) | |
Net Increase (Decrease) in Shares Outstanding | 919,079 | | | | (2,588,598) | |
Service Shares | | | | | | | | |
Shares sold | | | 121,154 | | | | 192,253 | |
Shares issued for distributions reinvested | | | 349,939 | | | | 325,030 | |
Shares redeemed | | | (314,330) | | | | (2,492,895) | |
Net Increase (Decrease) in Shares Outstanding | 156,763 | | | | (1,975,612) | |
| | | | | | | | | |
See notes to financial statements. | | | | | | | | |
13
FINANCIAL HIGHLIGHTS
The following tables describe the performance for each share class for the fiscal periods indicated. All information (except portfolio turnover rate) reflects financial results for a single fund share. Net asset value total return is calculated assuming an initial investment made at the net asset value at the beginning of the period, reinvestment of all dividends and distributions at net asset value during the period, and redemption at net asset value on the last day of the period. Net asset value total return includes adjustments in accordance with accounting principles generally accepted in the United States of America and as such, the net asset value for financial reporting purposes and the returns based upon those net asset values may differ from the net asset value and returns for shareholder transactions. The fund’s total returns do not reflect expenses associated with variable annuity or insurance contracts. These figures have been derived from the fund’s financial statements.
| | | | | | | | | | | |
| | | | | | | |
| | |
| | Year Ended December 31, |
Initial Shares | | 2022 | 2021 | 2020 | 2019 | 2018 |
Per Share Data ($): | | | | | | |
Net asset value, beginning of period | | 53.72 | 47.18 | 42.76 | 35.84 | 44.71 |
Investment Operations: | | | | | | |
Net investment incomea | | .23 | .23 | .33 | .43 | .53 |
Net realized and unrealized
gain (loss) on investments | | (8.53) | 11.43 | 7.99 | 11.58 | (3.27) |
Total from Investment Operations | | (8.30) | 11.66 | 8.32 | 12.01 | (2.74) |
Distributions: | | | | | | |
Dividends from
net investment income | | (.24) | (.22) | (.33) | (.46) | (.52) |
Dividends from net realized
gain on investments | | (13.25) | (4.90) | (3.57) | (4.63) | (5.61) |
Total Distributions | | (13.49) | (5.12) | (3.90) | (5.09) | (6.13) |
Net asset value, end of period | | 31.93 | 53.72 | 47.18 | 42.76 | 35.84 |
Total Return (%) | | (18.06) | 27.13 | 23.69 | 36.10 | (6.86) |
Ratios/Supplemental Data (%): | | | | | | |
Ratio of total expenses
to average net assets | | .83 | .80 | .81 | .81 | .81 |
Ratio of net expenses
to average net assets | | .83 | .80 | .81 | .81 | .81 |
Ratio of net investment income
to average net assets | | .65 | .46 | .80 | 1.10 | 1.30 |
Portfolio Turnover Rate | | 8.59 | 3.81 | 8.82 | 6.71 | 6.50 |
Net Assets, end of period ($ x 1,000) | | 148,683 | 200,725 | 298,456 | 273,832 | 225,631 |
a Based on average shares outstanding.
See notes to financial statements.
14
| | | | | | | | | |
| | | | | | | |
| | |
| | Year Ended December 31, |
Service Shares | | 2022 | 2021 | 2020 | 2019 | 2018 |
Per Share Data ($): | | | | | | |
Net asset value, beginning of period | | 52.96 | 46.60 | 42.29 | 35.49 | 44.34 |
Investment Operations: | | | | | | |
Net investment incomea | | .14 | .10 | .22 | .33 | .42 |
Net realized and unrealized
gain (loss) on investments | | (8.38) | 11.26 | 7.89 | 11.46 | (3.25) |
Total from Investment Operations | | (8.24) | 11.36 | 8.11 | 11.79 | (2.83) |
Distributions: | | | | | | |
Dividends from
net investment income | | (.15) | (.10) | (.23) | (.36) | (.41) |
Dividends from net realized
gain on investments | | (13.25) | (4.90) | (3.57) | (4.63) | (5.61) |
Total Distributions | | (13.40) | (5.00) | (3.80) | (4.99) | (6.02) |
Net asset value, end of period | | 31.32 | 52.96 | 46.60 | 42.29 | 35.49 |
Total Return (%) | | (18.26) | 26.78 | 23.38 | 35.78 | (7.10) |
Ratios/Supplemental Data (%): | | | | | | |
Ratio of total expenses
to average net assets | | 1.08 | 1.05 | 1.06 | 1.06 | 1.06 |
Ratio of net expenses
to average net assets | | 1.08 | 1.05 | 1.06 | 1.06 | 1.06 |
Ratio of net investment income
to average net assets | | .40 | .21 | .55 | .85 | 1.05 |
Portfolio Turnover Rate | | 8.59 | 3.81 | 8.82 | 6.71 | 6.50 |
Net Assets, end of period ($ x 1,000) | | 34,513 | 50,060 | 136,119 | 128,404 | 112,387 |
a Based on average shares outstanding.
See notes to financial statements.
15
NOTES TO FINANCIAL STATEMENTS
NOTE 1—Significant Accounting Policies:
Appreciation Portfolio (the “fund”) is a separate diversified series of BNY Mellon Variable Investment Fund (the “Trust”), which is registered under the Investment Company Act of 1940, as amended (the “Act”), as an open-end management investment company and operates as a series company currently offering four series, including the fund. The fund is only offered to separate accounts established by insurance companies to fund variable annuity contracts and variable life insurance policies. The fund’s investment objective is to seek long-term capital growth consistent with the preservation of capital. Its secondary goal is current income. BNY Mellon Investment Adviser, Inc. (the “Adviser”), a wholly-owned subsidiary of The Bank of New York Mellon Corporation (“BNY Mellon”), serves as the fund’s investment adviser. Fayez Sarofim & Co. (the “Sub-Adviser” or “Sarofim & Co.”) serves as the sub-adviser to the fund, pursuant to a sub-investment advisory agreement with Sarofim & Co. effective October 25, 2022 (the “New Sub-Investment Advisory Agreement”). Due to a change in the ownership and organizational structure of Sarofim & Co. that occurred on May 28, 2022 (the “Effective Date”), the then-existing sub-investment advisory agreement with Sarofim & Co. (the “Prior Sub-Investment Advisory Agreement”) terminated in accordance with its terms and the Act.
To enable Sarofim & Co. to continue to provide sub-advisory services to the fund after the Effective Date, the Trust’s Board of Trustees (the “Board”) approved an interim sub-investment advisory agreement on June 6, 2022, which did not require shareholder approval before it went into effect on the Effective Date, and the New Sub-Investment Advisory Agreement between the fund and Sarofim & Co. on July 21, 2022, which required approval by a majority of the fund’s outstanding voting securities before it could go into effect. The New Sub-Investment Advisory Agreement was approved by the fund shareholders on October 4, 2022. See “Proxy Results (Unaudited)”
The sub-advisory fee payable under the New Sub-Investment Advisory Agreement is the same as the sub-advisory fee under the Prior Sub-Investment Advisory Agreement. The fund’s investment strategy and management policies did not change in connection with the implementation of the New Sub-Investment Advisory Agreement. The Adviser continues to serve as the fund’s investment adviser. Please refer to the Subsequent Event below for additional information.
BNY Mellon Securities Corporation (the “Distributor”), a wholly-owned subsidiary of the Adviser, is the distributor of the fund’s shares, which are
16
sold without a sales charge. The fund is authorized to issue an unlimited number of $.001 par value shares of Beneficial Interest in each of the following classes of shares: Initial and Service. Each class of shares has identical rights and privileges, except with respect to the Distribution Plan, and the expenses borne by each class, the allocation of certain transfer agency costs, and certain voting rights. Income, expenses (other than expenses attributable to a specific class), and realized and unrealized gains or losses on investments are allocated to each class of shares based on its relative net assets.
The Trust accounts separately for the assets, liabilities and operations of each series. Expenses directly attributable to each series are charged to that series’ operations; expenses which are applicable to all series are allocated among them on a pro rata basis.
The Financial Accounting Standards Board (“FASB”) Accounting Standards Codification (“ASC”) is the exclusive reference of authoritative U.S. generally accepted accounting principles (“GAAP”) recognized by the FASB to be applied by nongovernmental entities. Rules and interpretive releases of the SEC under authority of federal laws are also sources of authoritative GAAP for SEC registrants. The fund is an investment company and applies the accounting and reporting guidance of the FASB ASC Topic 946 Financial Services-Investment Companies. The fund’s financial statements are prepared in accordance with GAAP, which may require the use of management estimates and assumptions. Actual results could differ from those estimates.
The Trust enters into contracts that contain a variety of indemnifications. The fund’s maximum exposure under these arrangements is unknown. The fund does not anticipate recognizing any loss related to these arrangements.
(a) Portfolio valuation: The fair value of a financial instrument is the amount that would be received to sell an asset or paid to transfer a liability in an orderly transaction between market participants at the measurement date (i.e., the exit price). GAAP establishes a fair value hierarchy that prioritizes the inputs of valuation techniques used to measure fair value. This hierarchy gives the highest priority to unadjusted quoted prices in active markets for identical assets or liabilities (Level 1 measurements) and the lowest priority to unobservable inputs (Level 3 measurements).
Additionally, GAAP provides guidance on determining whether the volume and activity in a market has decreased significantly and whether such a decrease in activity results in transactions that are not orderly.
17
NOTES TO FINANCIAL STATEMENTS (continued)
GAAP requires enhanced disclosures around valuation inputs and techniques used during annual and interim periods.
Various inputs are used in determining the value of the fund’s investments relating to fair value measurements. These inputs are summarized in the three broad levels listed below:
Level 1—unadjusted quoted prices in active markets for identical investments.
Level 2—other significant observable inputs (including quoted prices for similar investments, interest rates, prepayment speeds, credit risk, etc.).
Level 3—significant unobservable inputs (including the fund’s own assumptions in determining the fair value of investments).
The inputs or methodology used for valuing securities are not necessarily an indication of the risk associated with investing in those securities.
Changes in valuation techniques may result in transfers in or out of an assigned level within the disclosure hierarchy. Valuation techniques used to value the fund’s investments are as follows:
The Board has designated the Adviser as the fund’s valuation designee, effective September 8, 2022, to make all fair value determinations with respect to the fund’s portfolio investments, subject to the Board’s oversight and pursuant to Rule 2a-5 under the Act.
Investments in equity securities are valued at the last sales price on the securities exchange or national securities market on which such securities are primarily traded. Securities listed on the National Market System for which market quotations are available are valued at the official closing price or, if there is no official closing price that day, at the last sales price. For open short positions, asked prices are used for valuation purposes. Bid price is used when no asked price is available. Registered investment companies that are not traded on an exchange are valued at their net asset value. All of the preceding securities are generally categorized within Level 1 of the fair value hierarchy.
Securities not listed on an exchange or the national securities market, or securities for which there were no transactions, are valued at the average of the most recent bid and asked prices. These securities are generally categorized within Level 2 of the fair value hierarchy.
Fair valuing of securities may be determined with the assistance of a pricing service using calculations based on indices of domestic securities and other appropriate indicators, such as prices of relevant ADRs and
18
futures. Utilizing these techniques may result in transfers between Level 1 and Level 2 of the fair value hierarchy.
When market quotations or official closing prices are not readily available, or are determined not to accurately reflect fair value, such as when the value of a security has been significantly affected by events after the close of the exchange or market on which the security is principally traded (for example, a foreign exchange or market), but before the fund calculates its net asset value, the fund may value these investments at fair value as determined in accordance with the procedures approved by the Board. Certain factors may be considered when fair valuing investments such as: fundamental analytical data, the nature and duration of restrictions on disposition, an evaluation of the forces that influence the market in which the securities are purchased and sold, and public trading in similar securities of the issuer or comparable issuers. These securities are either categorized within Level 2 or 3 of the fair value hierarchy depending on the relevant inputs used.
For securities where observable inputs are limited, assumptions about market activity and risk are used and such securities are generally categorized within Level 3 of the fair value hierarchy.
Investments denominated in foreign currencies are translated to U.S. dollars at the prevailing rates of exchange.
The following is a summary of the inputs used as of December 31, 2022 in valuing the fund’s investments:
| | | | | | | |
| | Level 1-Unadjusted Quoted Prices | Level 2- Other Significant Observable Inputs | | Level 3-Significant Unobservable Inputs | Total | |
Assets ($) | | |
Investments in Securities:† | | |
Equity Securities - Common Stocks | 181,786,196 | - | | - | 181,786,196 | |
Investment Companies | 1,281,219 | - | | - | 1,281,219 | |
† See Statement of Investments for additional detailed categorizations, if any.
(b) Foreign currency transactions: The fund does not isolate that portion of the results of operations resulting from changes in foreign exchange rates on investments from the fluctuations arising from changes in the market prices of securities held. Such fluctuations are included with the net realized and unrealized gain or loss on investments.
Net realized foreign exchange gains or losses arise from sales of foreign currencies, currency gains or losses realized on securities transactions
19
NOTES TO FINANCIAL STATEMENTS (continued)
between trade and settlement date, and the difference between the amounts of dividends, interest and foreign withholding taxes recorded on the fund’s books and the U.S. dollar equivalent of the amounts actually received or paid. Net unrealized foreign exchange gains and losses arise from changes in the value of assets and liabilities other than investments resulting from changes in exchange rates. Foreign currency gains and losses on foreign currency transactions are also included with net realized and unrealized gain or loss on investments.
Foreign taxes: The fund may be subject to foreign taxes (a portion of which may be reclaimable) on income, stock dividends, realized and unrealized capital gains on investments or certain foreign currency transactions. Foreign taxes are recorded in accordance with the applicable foreign tax regulations and rates that exist in the foreign jurisdictions in which the fund invests. These foreign taxes, if any, are paid by the fund and are reflected in the Statement of Operations, if applicable. Foreign taxes payable or deferred or those subject to reclaims as of December 31, 2022, if any, are disclosed in the fund’s Statement of Assets and Liabilities.
(c) Securities transactions and investment income: Securities transactions are recorded on a trade date basis. Realized gains and losses from securities transactions are recorded on the identified cost basis. Dividend income is recognized on the ex-dividend date and interest income, including, where applicable, accretion of discount and amortization of premium on investments, is recognized on the accrual basis.
Pursuant to a securities lending agreement with BNY Mellon, the fund may lend securities to qualified institutions. It is the fund’s policy that, at origination, all loans are secured by collateral of at least 102% of the value of U.S. securities loaned and 105% of the value of foreign securities loaned. Collateral equivalent to at least 100% of the market value of securities on loan is maintained at all times. Collateral is either in the form of cash, which can be invested in certain money market mutual funds managed by the Adviser, or U.S. Government and Agency securities. The fund is entitled to receive all dividends, interest and distributions on securities loaned, in addition to income earned as a result of the lending transaction. Should a borrower fail to return the securities in a timely manner, BNY Mellon is required to replace the securities for the benefit of the fund or credit the fund with the market value of the unreturned securities and is subrogated to the fund’s rights against the borrower and the collateral. Additionally, the contractual maturity of security lending transactions are on an overnight and continuous basis. During the period
20
ended December 31, 2022, BNY Mellon earned $1,367 from the lending of the fund’s portfolio securities, pursuant to the securities lending agreement.
(d) Affiliated issuers: Investments in other investment companies advised by the Adviser are considered “affiliated” under the Act.
(e) Market Risk: The value of the securities in which the fund invests may be affected by political, regulatory, economic and social developments, and developments that impact specific economic sectors, industries or segments of the market. The value of a security may also decline due to general market conditions that are not specifically related to a particular company or industry, such as real or perceived adverse economic conditions, changes in the general outlook for corporate earnings, changes in interest or currency rates, changes to inflation, adverse changes to credit markets or adverse investor sentiment generally. In addition, turbulence in financial markets and reduced liquidity in equity, credit and/or fixed income markets may negatively affect many issuers, which could adversely affect the fund. Global economies and financial markets are becoming increasingly interconnected, and conditions and events in one country, region or financial market may adversely impact issuers in a different country, region or financial market. These risks may be magnified if certain events or developments adversely interrupt the global supply chain; in these and other circumstances, such risks might affect companies world-wide. Recent examples include pandemic risks related to COVID-19 and aggressive measures taken world-wide in response by governments, including closing borders, restricting international and domestic travel, and the imposition of prolonged quarantines of large populations, and by businesses, including changes to operations and reducing staff.
Foreign Investment Risk: To the extent the fund invests in foreign securities, the fund’s performance will be influenced by political, social and economic factors affecting investments in foreign issuers. Special risk associated with investments in foreign issuers include exposure to currency fluctuations, less liquidity, less developed or less efficient trading markets, lack of comprehensive company information, political and economic instability and differing auditing and legal standards.
(f) Dividends and distributions to shareholders: Dividends and distributions are recorded on the ex-dividend date. Dividends from net investment income are normally declared and paid quarterly. Dividends from net realized capital gains, if any, are normally declared and paid annually, but the fund may make distributions on a more frequent basis to comply with the distribution requirements of the Internal Revenue Code of 1986, as amended (the “Code”). To the extent that net realized capital gains can be offset by capital loss carryovers, it is the policy of the fund not
21
NOTES TO FINANCIAL STATEMENTS (continued)
to distribute such gains. Income and capital gain distributions are determined in accordance with income tax regulations, which may differ from GAAP.
(g) Federal income taxes: It is the policy of the fund to continue to qualify as a regulated investment company, if such qualification is in the best interests of its shareholders, by complying with the applicable provisions of the Code, and to make distributions of taxable income and net realized capital gain sufficient to relieve it from substantially all federal income and excise taxes.
As of and during the period ended December 31, 2022, the fund did not have any liabilities for any uncertain tax positions. The fund recognizes interest and penalties, if any, related to uncertain tax positions as income tax expense in the Statement of Operations. During the period ended December 31, 2022, the fund did not incur any interest or penalties.
Each tax year in the four-year period ended December 31, 2022 remains subject to examination by the Internal Revenue Service and state taxing authorities.
At December 31, 2022, the components of accumulated earnings on a tax basis were as follows: undistributed ordinary income $239,616, undistributed capital gains $16,344,222 and unrealized appreciation $114,025,599.
The tax character of distributions paid to shareholders during the fiscal years ended December 31, 2022 and December 31, 2021 were as follows: ordinary income $2,120,857 and $1,630,599, and long-term capital gains $59,445,252 and $44,254,553, respectively.
During the period ended December 31, 2022, as a result of permanent book to tax differences, primarily due to the tax treatment for treating a portion of the proceeds from redemptions as a distribution for tax purposes, the fund decreased total distributable earnings (loss) by $156,501,974 and increased paid-in capital by the same amount. Net assets and net asset value per share were not affected by this reclassification.
NOTE 2—Bank Lines of Credit:
The fund participates with other long-term open-end funds managed by the Adviser in a $823.5 million unsecured credit facility led by Citibank, N.A. (the “Citibank Credit Facility”) and a $300 million unsecured credit facility provided by BNY Mellon (the “BNYM Credit Facility”), each to be utilized primarily for temporary or emergency purposes, including the financing of redemptions (each, a “Facility”). The Citibank Credit Facility is available in two tranches: (i) Tranche A is in an amount equal to $688.5
22
million and is available to all long-term open-ended funds, including the fund, and (ii) Tranche B is an amount equal to $135 million and is available only to BNY Mellon Floating Rate Income Fund, a series of BNY Mellon Investment Funds IV, Inc. In connection therewith, the fund has agreed to pay its pro rata portion of commitment fees for Tranche A of the Citibank Credit Facility and the BNYM Credit Facility. Interest is charged to the fund based on rates determined pursuant to the terms of the respective Facility at the time of borrowing. During the period ended December 31, 2022, the fund did not borrow under the Facilities.
NOTE 3—Management Fee, Sub-Advisory Fee and Other Transactions with Affiliates:
(a) Pursuant to an investment advisory agreement with the Adviser, the management fee is computed at the annual rate of .5325% of the value of the fund’s average daily net assets. Pursuant to a sub-investment advisory agreement with the Sub-Adviser, the fund pays the Sub-Adviser a monthly sub-advisory fee at the annual rate of .2175% of the value of the fund’s average daily net assets. Both fees are payable monthly.
(b) Under the Distribution Plan adopted pursuant to Rule 12b-1 under the Act, Service shares pay the Distributor for distributing its shares, for servicing and/or maintaining Service shares’ shareholder accounts and for advertising and marketing for Service shares. The Distribution Plan provides for payments to be made at an annual rate of .25% of the value of the Service shares’ average daily net assets. The Distributor may make payments to Participating Insurance Companies and to brokers and dealers acting as principal underwriter for their variable insurance products. The fees payable under the Distribution Plan are payable without regard to actual expenses incurred. During the period ended December 31, 2022, Service shares were charged $96,557 pursuant to the Distribution Plan.
The fund has an arrangement with BNY Mellon Transfer, Inc., (the “Transfer Agent”), a subsidiary of BNY Mellon and an affiliate of the Adviser, whereby the fund may receive earnings credits when positive cash balances are maintained, which are used to offset Transfer Agent fees. For financial reporting purposes, the fund includes transfer agent net earnings credits, if any, as an expense offset in the Statement of Operations.
The fund has an arrangement with The Bank of New York Mellon (the “Custodian”), a subsidiary of BNY Mellon and an affiliate of the Adviser, whereby the fund will receive interest income or be charged overdraft fees when cash balances are maintained. For financial reporting purposes, the fund includes this interest income and overdraft fees, if any, as interest income in the Statement of Operations.
23
NOTES TO FINANCIAL STATEMENTS (continued)
The fund compensates the Transfer Agent, under a transfer agency agreement, for providing transfer agency and cash management services for the fund. The majority of Transfer Agent fees are comprised of amounts paid on a per account basis, while cash management fees are related to fund subscriptions and redemptions. During the period ended December 31, 2022, the fund was charged $2,098 for transfer agency services. These fees are included in Shareholder servicing costs in the Statement of Operations. These fees were partially offset by earnings credits of $167.
The fund compensates the Custodian, under a custody agreement, for providing custodial services for the fund. These fees are determined based on net assets, geographic region and transaction activity. During the period ended December 31, 2022, the fund was charged $9,278 pursuant to the custody agreement.
During the period ended December 31, 2022, the fund was charged $17,082 for services performed by the fund’s Chief Compliance Officer and his staff. These fees are included in Chief Compliance Officer fees in the Statement of Operations.
The components of “Due to BNY Mellon Investment Adviser, Inc. and affiliates” in the Statement of Assets and Liabilities consist of: management fee of $84,252, Distribution Plan fees of $7,466, Custodian fees of $6,540, Chief Compliance Officer fees of $4,082 and Transfer Agent fees of $333.
(c) Each board member also serves as a board member of other funds in the BNY Mellon Family of Funds complex. Annual retainer fees and attendance fees are allocated to each fund based on net assets.
NOTE 4—Securities Transactions:
The aggregate amount of purchases and sales of investment securities, excluding short-term securities during the period ended December 31, 2022, amounted to $17,234,508 and $38,157,084, respectively.
At December 31, 2022, the cost of investments for federal income tax purposes was $69,041,169; accordingly, accumulated net unrealized appreciation on investments was $114,026,246, consisting of $114,286,691 gross unrealized appreciation and $260,445 gross unrealized depreciation.
NOTE 5—Subsequent Event:
On January 11, 2023, the Board approved, effective February 27, 2023, an amended sub-investment advisory agreement (the “Amended Sub-Investment Advisory Agreement”), which reflects a change in Sarofim & Co.’s corporate form, from a Texas corporation to a Delaware limited
24
liability company, and a new name, Fayez Sarofim & Co., LLC. The sub-advisory fee payable under the Amended Sub-Investment Advisory Agreement is the same as the sub-advisory fee under the Prior Sub-Investment Advisory Agreement and the New Sub-Investment Advisory Agreement (see Note 1). The fund’s investment strategy and management policies did not change in connection with the implementation of the Amended Sub-Investment Advisory Agreement. The Adviser continues to serve as the fund’s investment adviser.
25
REPORT OF INDEPENDENT REGISTERED PUBLIC ACCOUNTING FIRM
To the Shareholders and the Board of Trustees of Appreciation Portfolio
Opinion on the Financial Statements
We have audited the accompanying statement of assets and liabilities of Appreciation Portfolio (the “Fund”) (one of the funds constituting BNY Mellon Variable Investment Fund), including the statement of investments, as of December 31, 2022, and the related statement of operations for the year then ended, the statements of changes in net assets for each of the two years in the period then ended, the financial highlights for each of the five years in the period then ended and the related notes (collectively referred to as the “financial statements”). In our opinion, the financial statements present fairly, in all material respects, the financial position of the Fund (one of the funds constituting BNY Mellon Variable Investment Fund) at December 31, 2022, the results of its operations for the year then ended, the changes in its net assets for each of the two years in the period then ended and its financial highlights for each of the five years in the period then ended, in conformity with U.S. generally accepted accounting principles.
Basis for Opinion
These financial statements are the responsibility of the Fund’s management. Our responsibility is to express an opinion on the Fund’s financial statements based on our audits. We are a public accounting firm registered with the Public Company Accounting Oversight Board (United States) (“PCAOB”) and are required to be independent with respect to the Fund in accordance with the U.S. federal securities laws and the applicable rules and regulations of the Securities and Exchange Commission and the PCAOB.
We conducted our audits in accordance with the standards of the PCAOB. Those standards require that we plan and perform the audit to obtain reasonable assurance about whether the financial statements are free of material misstatement, whether due to error or fraud. The Fund is not required to have, nor were we engaged to perform, an audit of the Fund’s internal control over financial reporting. As part of our audits, we are required to obtain an understanding of internal control over financial reporting, but not for the purpose of expressing an opinion on the effectiveness of the Fund’s internal control over financial reporting. Accordingly, we express no such opinion.
Our audits included performing procedures to assess the risks of material misstatement of the financial statements, whether due to error or fraud, and performing procedures that respond to those risks. Such procedures included examining, on a test basis, evidence regarding the amounts and disclosures in the financial statements. Our procedures included confirmation of securities owned as of December 31, 2022, by correspondence with the custodian, brokers and others; when replies were not received from brokers and others, we performed other auditing procedures. Our audits also included evaluating the accounting principles used and significant estimates made by management, as well as evaluating the overall presentation of the financial statements. We believe that our audits provide a reasonable basis for our opinion.

We have served as the auditor of one or more investment companies in the BNY Mellon Family of Funds since at least 1957, but we are unable to determine the specific year.
New York, New York
February 9, 2023
26
IMPORTANT TAX INFORMATION (Unaudited)
For federal tax purposes, the fund hereby reports 100% of the ordinary dividends paid during the fiscal year ended December 31, 2022 as qualifying for the corporate dividends received deduction. Shareholders will receive notification in early 2023 of the percentage applicable to the preparation of their 2022 income tax returns. Also, the fund hereby reports $.1955 per share as a short-term capital gain distribution and $13.0519 per share as a long-term capital gain distribution paid on March 31, 2022.
27
PROXY RESULTS (Unaudited)
A special meeting of the fund’s shareholders was held on October 4, 2022. The proposal considered at the meeting and the results were as follows:
| | | | | |
| | | Shares |
| | | For | Against | Abstain |
To approve a new sub-investment advisory agreement between BNY Mellon Investment Adviser, Inc., on behalf of the fund, and Fayez Sarofim & Co. | | 3,013,554 | 102,387 | 152,029 |
28
INFORMATION ABOUT THE APPROVAL OF THE FUND’S SUB-INVESTMENT ADVISORY AGREEMENT (Unaudited)
At a meeting of the Trust’s Board of Trustees (the “Board”) held on July 21, 2022 (the “July Meeting”), the Board considered and approved a new sub-investment advisory agreement (the “New Sub-Advisory Agreement”) with Fayez Sarofim & Co. (the “Sub-Adviser”), pursuant to which the Sub-Adviser provides day-to-day management of the fund’s investments. The New Sub-Advisory Agreement was considered and approved in order to enable the Sub-Adviser to continue to provide sub-investment advisory services to the fund after the passing of Fayez Sarofim, the founder and controlling shareholder of the Sub-Adviser at the time of his death, which caused a “change in control” of the Sub-Adviser and triggered an assignment and automatic termination of the fund’s then-existing sub-investment advisory agreement (the “Prior Sub-Advisory Agreement”) between the Trust, on behalf of the fund, and the Sub-Adviser pursuant to its terms and the applicable provisions of the Investment Company Act of 1940, as amended (the “1940 Act”). The new Sub-Investment Advisory Agreement was approved by fund shareholders on October 4, 2022. The Board members, none of whom are “interested persons” (as defined in the 1940 Act) of the fund (the “Independent Board Members”), were assisted in their review by independent legal counsel and met with counsel in executive sessions separate from representatives of the fund’s investment adviser, BNY Mellon Investment Adviser, Inc. (the “Adviser”), and the Sub-Adviser. In considering the approval of the New Sub-Advisory Agreement, the Board considered whether approval of the new agreement would be in the best interest of the fund and its shareholders, an evaluation based on several factors that it believed to be relevant, including those discussed below. The Board did not identify any one factor as dispositive, and each Board member may have attributed different weights to the factors considered.
The Prior Sub-Advisory Agreement was most recently reapproved by the Board for a one-year continuance at a meeting held March 8-9, 2022 (the “15(c) Meeting”). At the 15(c) Meeting, the Board members requested and received information from the Adviser and the Sub-Adviser they deemed reasonably necessary for their review of the Prior Sub-Advisory Agreement and the performance and services provided by the Sub-Adviser. The information received by the Board included information related to the fees paid by the fund to the Adviser under the fund’s Investment Advisory Agreement, pursuant to which the Adviser provides the fund with investment advisory and administrative services, and by the fund to the Sub-Adviser under the Prior Sub-Advisory Agreement, and the profitability of the Adviser and its affiliates with respect to the fund, among other items, in accordance with Section 15(c) of the 1940 Act. At the July Meeting, management of the Adviser confirmed that it believed there were no material changes to the information presented at the 15(c) Meeting relevant to the Board’s consideration of the New Sub-Advisory Agreement, other than the change in control at the Sub-Adviser following the death of Fayez Sarofim as the firm’s controlling shareholder. In addition, the Sub-Adviser represented that its new ownership structure was not expected to have a material impact on the nature, extent or quality of the investment advisory services that the Sub-Adviser provided to the fund, and that the
29
INFORMATION ABOUT THE APPROVAL OF THE FUND’S SUB-INVESTMENT ADVISORY AGREEMENT (Unaudited) (continued)
persons responsible for portfolio management of the fund (other than Fayez Sarofim) were anticipated to remain the same.
At the July Meeting, and in accordance with Section 15(c) of the 1940 Act, the Board requested, and the Adviser and Sub-Adviser provided, materials relating to the change in control of the Sub-Adviser in connection with the Board’s consideration of whether to approve the New Sub-Advisory Agreement. This included a description of the Sub-Adviser’s new ownership structure and its anticipated effects on the Sub-Adviser and its business activities and personnel. Management of the Adviser and the Sub-Adviser represented that under the New Sub-Advisory Agreement there would be no diminution in services provided by the Sub-Adviser to the fund or changes in the fees payable by the fund to the Adviser or to the Sub-Adviser. The Board noted that the services provided under the New Sub-Advisory Agreement would be substantially identical to those provided under the Prior Sub-Advisory Agreement. In addition, the Board noted that the sub-advisory fee under the New Sub-Advisory Agreement would remain the same as the sub-advisory fee under the Prior Sub-Advisory Agreement. The Board also discussed the substance of discussions with representatives of the Adviser and Sub-Adviser at the 15(c) Meeting. Additionally, the Board reviewed materials supplied by counsel that were prepared for use by the Board in fulfilling its duties under state law and the 1940 Act.
In voting to approve the New Sub-Advisory Agreement, the Board considered whether approval of the agreement would be in the best interest of the fund and its shareholders, an evaluation based on several factors including those discussed below. Based on their discussions and considerations, including those described below, the Board, including the Independent Board Members, approved the New Sub-Advisory Agreement. It is currently anticipated that the New Sub-Advisory Agreement will be reviewed by the Board as part of its annual review of advisory arrangements for the fund in the first quarter of 2023.
Nature, Extent and Quality of Services to be Provided under the New Sub-Advisory Agreement. At the 15(c) Meeting, the Board received and considered information regarding the nature, extent and quality of services provided to the fund by the Sub-Adviser under the Prior Sub-Advisory Agreement. The Board noted that information received at regular meetings throughout the year related to the services rendered by the Sub-Adviser to the fund, including the scope and quality of the investment management and other capabilities of the Sub-Adviser. Based on such considerations, the Board concluded that the nature, extent and quality of the services provided by the Sub-Adviser were adequate and appropriate.
At the July Meeting, the Board received and considered information regarding the fact that the nature, extent and quality of services to be provided to the fund by the Sub-Adviser under the New Sub-Advisory Agreement would not change as a result of the Sub-Adviser’s new ownership structure. The Board members discussed with management the portfolio management strategies of the fund’s portfolio managers and noted that there were currently no long-term or short-term plans to make changes to the management or investment policies, strategies or objective of the fund as a result of the
30
Sub-Adviser’s new ownership structure. The Board members considered the specific responsibilities in all aspects of the day-to-day management of the fund by the Sub-Adviser, and the fact that the persons responsible for portfolio management (with the exception of Fayez Sarofim) were anticipated to remain the same. The Board also considered that the division of responsibilities between the Adviser and the Sub-Adviser would remain the same as it was under the Prior Sub-Advisory Agreement. The Board members also considered the financial resources available to the Sub-Adviser. At the July Meeting, the fund’s Chief Compliance Officer discussed the compliance infrastructure of the Sub-Adviser. The Board also discussed the acceptability of the terms of the New Sub-Advisory Agreement.
The Board concluded that the fund will continue to benefit from the quality and experience of the Sub-Adviser’s investment professionals that will continue to provide services to the fund. Based on its consideration and review of the foregoing information, the Board concluded that it was satisfied with the nature, extent and quality of the sub-investment advisory services expected to be provided by the Sub-Adviser.
Fund Investment Performance. The Board members considered the investment performance of the Sub-Adviser in managing the fund’s portfolio as a factor in evaluating the New Sub-Advisory Agreement.
At the 15(c) Meeting, the Board received and reviewed reports prepared by Broadridge Financial Solutions, Inc. (“Broadridge”), an independent provider of investment company data, which included information comparing the fund’s performance with the performance of a group of funds selected by Broadridge as comparable to the fund (the “Performance Group”) and with a broader group of funds (the “Performance Universe”), all for various periods. It was noted that, while the Board has found the Broadridge data generally useful, the Board members recognized the limitations of such data, including that the data may vary depending on the end date selected and that the results of the performance comparisons may vary depending on the selection of the peer group and its composition over time. The Adviser also provided a comparison of the fund’s calendar year total returns to the returns of the fund’s benchmark index. The Board concluded that it was satisfied with the fund’s performance.
At the July Meeting, the Board reviewed updated reports prepared by Broadridge which included information comparing the fund’s performance with its Performance Group and Performance Universe, all for various periods ended May 31, 2022. The Board discussed with representatives of the Adviser and the Sub-Adviser the results of the comparisons and considered the fund’s performance in light of overall financial market conditions. Where the fund’s total return performance was below the median during one or more specified periods, the Board noted the explanations from the Adviser and the Sub-Adviser concerning the fund’s relative performance versus the Performance Group or Performance Universe for such periods. Based on its review, the Board concluded that it continued to be satisfied with the fund’s historical performance under the Sub-Adviser’s day-to-day management of the fund’s investments.
31
INFORMATION ABOUT THE APPROVAL OF THE FUND’S SUB-INVESTMENT ADVISORY AGREEMENT (Unaudited) (continued)
Sub-Advisory Fee and Expense Ratio. At the 15(c) Meeting, the Board reviewed and considered the contractual management fee payable under the fund’s Investment Advisory Agreement, and the contractual sub-investment advisory fee payable by the fund to the Sub-Adviser pursuant to the Prior Sub-Advisory Agreement, and the sub-investment advisory services provided by the Sub-Adviser. The Board considered the fee paid to the Sub-Adviser in relation to the fee paid to the Adviser by the fund and the respective services provided by the Sub-Adviser and the Adviser. The Board also reviewed reports prepared by Broadridge which included information comparing the fund’s actual and contractual management fees and total expenses with those of the same group of funds in the Performance Group (the “Expense Group”) and with a broader group of funds (the “Expense Universe”), the information for which was derived in part from fund financial statements available to Broadridge as of the date of its analysis. The Board also reviewed the range of actual and contractual management fees and total expenses of the Expense Group and Expense Universe funds and discussed the results of the comparisons. The Board concluded that the fee paid to the Sub-Adviser under the Prior Sub-Advisory Agreement was appropriate under the circumstances and in light of the factors and the totality of the services provided.
At the July Meeting, the Board considered the proposed fee payable under the New Sub-Advisory Agreement, noting that the proposed fee would be the same as that payable under the Prior Sub-Advisory Agreement for the fund. At the July Meeting, the Board reviewed updated reports prepared by Broadridge which included information comparing the fund’s actual and contractual management fees and total expenses with those of its Expense Group and Expense Universe, the information for which was derived in part from fund financial statements available to Broadridge as of the date of its analysis. The Board also reviewed the range of actual and contractual advisory fees and total expenses of the Expense Group and Expense Universe funds and discussed the results of the comparisons.
The Board determined that the advisory fees and other expenses were reasonable in light of the nature, extent and quality of the services to be provided to the fund under the New Sub-Advisory Agreement. The Board concluded that the fee payable to the Sub-Adviser under the New Sub-Advisory Agreement continued to be appropriate under the circumstances and in light of the factors and the totality of the services expected to be provided.
Profitability. At the 15(c) Meeting, the Board received and considered a profitability analysis of the Adviser and its affiliates in providing services to the fund. The Adviser’s representatives reviewed the expenses allocated and profit received by the Adviser and its affiliates and the resulting profitability percentage for managing the fund and the aggregate profitability percentage to the Adviser and its affiliates for managing the funds in the BNY Mellon fund complex, and the method used to determine the expenses and profit. The Board concluded that the profitability results were not excessive, given the services rendered and service levels provided by the Adviser and its affiliates.
At the July Meeting, the Board noted that the fee payable to the Sub-Adviser under the Prior Sub-Advisory Agreement was the same as that payable under the New Sub-
32
Advisory Agreement, and, thus, no material impact to profitability with respect to the fund is expected as a result of the Sub-Adviser’s new ownership structure. Therefore, the Board determined that profitability of the Adviser and its affiliates should not be excessive in light of the nature, extent and quality of the services to be provided to the fund under the New Sub-Advisory Agreement. At the July Meeting, the Board received and considered a profitability analysis of the Sub-Adviser in providing services to the fund and concluded that the profitability results were not excessive, given the services and service levels expected to be provided by the Sub-Adviser under the New Sub-Advisory Agreement.
Economies of Scale. At the 15(c) Meeting, the Board discussed any economies of scale or other efficiencies that may result from increases in the fund’s assets. The Board noted that there are various ways to share potential economies of scale with fund shareholders and that it appeared that the benefits of any economies of scale would be appropriately shared with shareholders.
At the July Meeting, the Board noted that no material impact to the analysis of economies of scale is expected as a result of the Sub-Adviser’s new ownership structure and that, to the extent in the future it is determined that material economies of scale had not been shared with the fund, the Board would seek to have those economies of scale shared with the fund.
Other Benefits to the Sub-Adviser. At the 15(c) Meeting, the Board considered potential benefits to the Adviser and the Sub-Adviser from acting as investment adviser and sub-investment adviser, respectively, and took into consideration the soft dollar arrangements in effect for trading the fund’s investments. The Board noted that the Sub-Adviser is required to select brokers who met the funds’ requirements for seeking best execution, and that the Adviser monitors and evaluates the Sub-Adviser’s trade execution with respect to fund brokerage transactions on a quarterly basis and provides reports to the Board on these matters. In light of the costs of providing investment management and other services to the fund and the Sub-Adviser’s commitment to the fund, any other ancillary benefits that the Sub-Adviser received were considered reasonable. At the July Meeting, the Board determined that any such ancillary benefits continued to be reasonable.
After full consideration of the factors discussed above, with no single factor identified as being of paramount importance, the Board, including a majority of the Independent Board Members, determined to approve, subject to shareholder approval, the New Sub-Advisory Agreement.
33
BOARD MEMBERS INFORMATION (Unaudited)
IIndependent Board Members
Joseph S. DiMartino (79)
Chairman of the Board (1995)
Principal Occupation During Past 5 Years:
· Director or Trustee of funds in the BNY Mellon Family of Funds and certain other entities (as described in the fund’s Statement of Additional Information) (1995-Present)
Other Public Company Board Memberships During Past 5 Years:
· CBIZ, Inc., a public company providing professional business services, products and solutions, Director (1997-Present)
No. of Portfolios for which Board Member Serves: 92
———————
Peggy C. Davis (79)
Board Member (2006)
Principal Occupation During Past 5 Years:
· Shad Professor of Law, New York University School of Law (1983-Present)
No. of Portfolios for which Board Member Serves: 32
———————
Gina D. France (64)
Board Member (2019)
Principal Occupation During Past 5 Years:
· France Strategic Partners, a strategy and advisory firm serving corporate clients across the United States, Founder, President and Chief Executive Officer (2003-Present)
Other Public Company Board Memberships During Past 5 Years:
· Huntington Bancshares, a bank holding company headquartered in Columbus, Ohio, Director (2016-Present)
· Cedar Fair, L.P., a publicly-traded partnership that owns and operates amusement parks and hotels in the U.S. and Canada, Director (2011-Present)
· CBIZ, Inc., a public company providing professional business services, products and solutions, Director (2015-Present)
· FirstMerit Corporation, a diversified financial services company, Director (2004-2016)
No. of Portfolios for which Board Member Serves: 22
———————
Joan Gulley (75)
Board Member (2017)
Principal Occupation During Past 5 Years:
· Nantucket Atheneum, public library, Chair (2018-June 2021) and Director (2015-June 2021)
· Orchard Island Club, golf and beach club, Governor (2016-Present)
No. of Portfolios for which Board Member Serves: 39
———————
34
Robin A. Melvin (59)
Board Member (2012)
Principal Occupation During Past 5 Years:
· Westover School, a private girls’ boarding school in Middlebury, Connecticut, Trustee (2019-Present)
· Mentor Illinois, a non-profit organization dedicated to increasing the quality of mentoring services in Illinois, Co-Chair (2014–2020); Board Member, Mentor Illinois (2013-2020)
· JDRF, a non-profit juvenile diabetes research foundation, Board Member (June 2021-June 2022)
Other Public Company Board Memberships During Past 5 Years:
· HPS Corporate Lending Fund, a closed-end management investment company regulated as a business development company, Trustee (August 2021-Present)
No. of Portfolios for which Board Member Serves: 71
———————
Michael D. DiLecce (60)
Advisory Board Member (2022)
Principal Occupation During Past 5 Years:
· Retired since July 2022. Global Asset Management Assurance Leader, Ernst & Young LLP (2015-2022)
· Americas Regional Talent Managing Partner for Ernst & Young’s Financial Service Practice (2017-2021)
· Partner, Ernst & Young LLP (1997-2022)
No. of Portfolios for which Board Member Serves: 22
———————
The address of the Board Members and Officers is c/o BNY Mellon Investment Adviser, Inc., 240 Greenwich Street, New York, New York 10286. Additional information about each Board Member is available in the fund’s Statement of Additional Information which can be obtained from the Adviser free of charge by calling this toll free number: 1-800-373-9387.
35
OFFICERS OF THE FUND (Unaudited)
DAVID DIPETRILLO, President since January 2021.
Vice President and Director of the Adviser since February 2021; Head of North America Product, BNY Mellon Investment Management since January 2018; and Director of Product Strategy, BNY Mellon Investment Management from January 2016 to December 2017. He is an officer of 54 investment companies (comprised of 107 portfolios) managed by the Adviser or an affiliate of the Adviser. He is 44 years old and has been an employee of BNY Mellon since 2005.
JAMES WINDELS, Treasurer since November 2001.
Vice President of the Adviser since September 2020; and Director–BNY Mellon Fund Administration. He is an officer of 55 investment companies (comprised of 127 portfolios) managed by the Adviser or an affiliate of the Adviser. He is 64 years old and has been an employee of the Adviser since April 1985.
PETER M. SULLIVAN, Chief Legal Officer since July 2021 and Vice President and Assistant Secretary since March 2019.
Chief Legal Officer of the Adviser and Associate General Counsel of BNY Mellon since July 2021; Senior Managing Counsel of BNY Mellon from December 2020 to July 2021; and Managing Counsel of BNY Mellon from March 2009 to December 2020. He is an officer of 55 investment companies (comprised of 127 portfolios) managed by the Adviser or an affiliate of the Adviser. He is 54 years old and has been an employee of BNY Mellon since April 2004.
JAMES BITETTO, Vice President since August 2005 and Secretary since February 2018.
Senior Managing Counsel of BNY Mellon since December 2019; Managing Counsel of BNY Mellon from April 2014 to December 2019; and Secretary of the Adviser. He is an officer of 55 investment companies (comprised of 127 portfolios) managed by the Adviser or an affiliate of the Adviser. He is 56 years old and has been an employee of the Adviser since December 1996.
DEIRDRE CUNNANE, Vice President and Assistant Secretary since March 2019.
Managing Counsel of BNY Mellon since December 2021, Counsel of BNY Mellon from August 2018 to December 2021; and Senior Regulatory Specialist at BNY Mellon Investment Management Services from February 2016 to August 2018. She is an officer of 55 investment companies (comprised of 127 portfolios) managed by the Adviser or an affiliate of the Adviser. She is 32 years old and has been an employee of the Adviser since August 2018.
SARAH S. KELLEHER, Vice President and Assistant Secretary since April 2014.
Vice President of BNY Mellon ETF Investment Adviser; LLC since February 2020; Senior Managing Counsel of BNY Mellon since September 2021; Managing Counsel of BNY Mellon from December 2017 to September 2021; and Senior Counsel of BNY Mellon from March 2013 to December 2017. She is an officer of 55 investment companies (comprised of 127 portfolios) managed by the Adviser or an affiliate of the Adviser. She is 47 years old and has been an employee of the Adviser since March 2013.
JEFF PRUSNOFSKY, Vice President and Assistant Secretary since August 2005.
Senior Managing Counsel of BNY Mellon. He is an officer of 55 investment companies (comprised of 127 portfolios) managed by the Adviser or an affiliate of the Adviser. He is 57 years old and has been an employee of the Adviser since October 1990.
AMANDA QUINN, Vice President and Assistant Secretary since March 2020.
Counsel of BNY Mellon since June 2019; Regulatory Administration Manager at BNY Mellon Investment Management Services from September 2018 to May 2019; and Senior Regulatory Specialist at BNY Mellon Investment Management Services from April 2015 to August 2018. She is an officer of 55 investment companies (comprised of 127 portfolios) managed by the Adviser or an affiliate of the Adviser. She is 37 years old and has been an employee of the Adviser since June 2019.
36
NATALYA ZELENSKY, Vice President and Assistant Secretary since March 2017.
Chief Compliance Officer since August 2021 and Vice President since February 2020 of BNY Mellon ETF Investment Adviser, LLC; Chief Compliance Officer since August 2021 and Vice President and Assistant Secretary since February 2020 of BNY Mellon ETF Trust; Managing Counsel of BNY Mellon from December 2019 to August 2021; Counsel of BNY Mellon from May 2016 to December 2019; and Assistant Secretary of the Adviser from April 2018 to August 2021. She is an officer of 55 investment companies (comprised of 127 portfolios) managed by the Adviser or an affiliate of the Adviser. She is 37 years old and has been an employee of BNY Mellon since May 2016.
DANIEL GOLDSTEIN, Vice President since March 2022.
Vice President and Head of Product Development of North America Product, BNY Mellon Investment Management since January 2018; Co-Head of Product Management, Development & Oversight of North America Product, BNY Mellon Investment Management from January 2010 to January 2018; and Senior Vice President, Development & Oversight of North America Product, BNY Mellon Investment Management since 2010. He is an officer of 54 investment companies (comprised of 107 portfolios) managed by the Adviser or an affiliate of the Adviser. He is 53 years old and has been an employee of the Distributor since 1991.
JOSEPH MARTELLA, Vice President since March 2022.
Vice President of the Adviser since December 2022, Head of Product Management of North America Product, BNY Mellon Investment Management since January 2018; Director of Product Research and Analytics of North America Product, BNY Mellon Investment Management from January 2010 to January 2018; and Senior Vice President of North America Product, BNY Mellon Investment Management since 2010. He is an officer of 54 investment companies (comprised of 107 portfolios) managed by the Adviser or an affiliate of the Adviser. He is 46 years old and has been an employee of the Distributor since 1999.
GAVIN C. REILLY, Assistant Treasurer since December 2005.
Tax Manager–BNY Mellon Fund Administration. He is an officer of 55 investment companies (comprised of 127 portfolios) managed by the Adviser or an affiliate of the Adviser. He is 54 years old and has been an employee of the Adviser since April 1991.
ROBERT SALVIOLO, Assistant Treasurer since July 2007.
Senior Accounting Manager–BNY Mellon Fund Administration. He is an officer of 55 investment companies (comprised of 127 portfolios) managed by the Adviser or an affiliate of the Adviser. He is 55 years old and has been an employee of the Adviser since June 1989.
ROBERT SVAGNA, Assistant Treasurer since December 2002.
Senior Accounting Manager–BNY Mellon Fund Administration. He is an officer of 55 investment companies (comprised of 127 portfolios) managed by the Adviser or an affiliate of the Adviser. He is 55 years old and has been an employee of the Adviser since November 1990.
JOSEPH W. CONNOLLY, Chief Compliance Officer since October 2004.
Chief Compliance Officer of the BNY Mellon Family of Funds and BNY Mellon Funds Trust since 2004; and Chief Compliance Officer of the Adviser from 2004 until June 2021. He is the Chief Compliance Officer of 54 investment companies (comprised of 112 portfolios) managed by the Adviser. He is 65 years old.
CARIDAD M. CAROSELLA, Anti-Money Laundering Compliance Officer since January 2016.
Anti-Money Laundering Compliance Officer of the BNY Mellon Family of Funds and BNY Mellon Funds Trust. She is an officer of 48 investment companies (comprised of 120 portfolios) managed by the Adviser or an affiliate of the Adviser. She is 54 years old and has been an employee of the Distributor since 1997.
37
BNY Mellon Variable Investment Fund, Appreciation Portfolio
240 Greenwich Street
New York, NY 10286
Adviser
BNY Mellon Investment Adviser, Inc.
240 Greenwich Street
New York, NY 10286
Sub-Adviser
Fayez Sarofim & Co.
Two Houston Center
Suite 2907
Houston, TX 77010
Custodian
The Bank of New York Mellon
240 Greenwich Street
New York, NY 10286
Transfer Agent &
Dividend Disbursing Agent
BNY Mellon Transfer, Inc.
240 Greenwich Street
New York, NY 10286
Distributor
BNY Mellon Securities Corporation
240 Greenwich Street
New York, NY 10286
Telephone 1-800-258-4260 or 1-800-258-4261
Mail The BNY Mellon Family of Funds, 144 Glenn Curtiss Boulevard, Uniondale, NY 11556-0144 Attn: Institutional Services Department
E-mail Send your request to info@bnymellon.com
Internet Information can be viewed online or downloaded at www.im.bnymellon.com
The fund files its complete schedule of portfolio holdings with the Securities and Exchange Commission (“SEC”) for the first and third quarters of each fiscal year on Form N-PORT. The fund’s Forms N-PORT are available on the SEC’s website at www.sec.gov.
A description of the policies and procedures that the fund uses to determine how to vote proxies relating to portfolio securities and information regarding how the fund voted these proxies for the most recent 12-month period ended June 30 is available at www.im.bnymellon.com and on the SEC’s website at www.sec.gov and without charge, upon request, by calling 1-800-373-9387.
| | |
© 2023 BNY Mellon Securities Corporation
0112AR1222 | 
|
BNY Mellon Variable Investment Fund, Government Money Market Portfolio
| |
ANNUAL REPORT December 31, 2022 |

| |
Save time. Save paper. View your next shareholder report online as soon as it’s available. Log into www.im.bnymellon.com and sign up for eCommunications. It’s simple and only takes a few minutes. |
| |
The views expressed in this report reflect those of the portfolio manager(s) only through the end of the period covered and do not necessarily represent the views of BNY Mellon Investment Adviser, Inc. or any other person in the BNY Mellon Investment Adviser, Inc. organization. Any such views are subject to change at any time based upon market or other conditions and BNY Mellon Investment Adviser, Inc. disclaims any responsibility to update such views. These views may not be relied on as investment advice and, because investment decisions for a fund in the BNY Mellon Family of Funds are based on numerous factors, may not be relied on as an indication of trading intent on behalf of any fund in the BNY Mellon Family of Funds. |
| |
Not FDIC-Insured • Not Bank-Guaranteed • May Lose Value |
Contents
THE FUND
FOR MORE INFORMATION
Back Cover
UNDERSTANDING YOUR FUND’S EXPENSES (Unaudited)
As a mutual fund investor, you pay ongoing expenses, such as management fees and other expenses. Using the information below, you can estimate how these expenses affect your investment and compare them with the expenses of other funds. You also may pay one-time transaction expenses, including sales charges (loads), redemption fees and expenses associated with variable annuity or insurance contracts, which are not shown in this section and would have resulted in higher total expenses. For more information, see your fund’s prospectus or talk to your financial adviser.
Review your fund’s expenses
The table below shows the expenses you would have paid on a $1,000 investment in BNY Mellon Variable Investment Fund, Government Money Market Portfolio from July 1, 2022 to December 31, 2022. It also shows how much a $1,000 investment would be worth at the close of the period, assuming actual returns and expenses.
| | | | |
Expenses and Value of a $1,000 Investment | |
Assume actual returns for the six months ended December 31, 2022 | |
| | | |
| | | |
Expenses paid per $1,000† | $2.79 | |
Ending value (after expenses) | $1,012.00 | |
COMPARING YOUR FUND’S EXPENSES WITH THOSE OF OTHER FUNDS (Unaudited)
Using the SEC’s method to compare expenses
The Securities and Exchange Commission (“SEC”) has established guidelines to help investors assess fund expenses. Per these guidelines, the table below shows your fund’s expenses based on a $1,000 investment, assuming a hypothetical 5% annualized return. You can use this information to compare the ongoing expenses (but not transaction expenses or total cost) of investing in the fund with those of other funds. All mutual fund shareholder reports will provide this information to help you make this comparison. Please note that you cannot use this information to estimate your actual ending account balance and expenses paid during the period.
| | | | |
Expenses and Value of a $1,000 Investment | |
Assuming a hypothetical 5% annualized return for the six months ended December 31, 2022 | |
| | | |
| | | |
Expenses paid per $1,000† | $2.80 | |
Ending value (after expenses) | $1,022.43 | |
† | Expenses are equal to the fund’s annualized expense ratio of .55%, multiplied by the average account value over the period, multiplied by 184/365 (to reflect the one-half year period). |
2
STATEMENT OF INVESTMENTS
December 31, 2022
| | | | | | | |
| |
U.S. Government Agencies Obligations - 14.9% | Annualized
Yield (%) | | Principal
Amount ($) | | Value ($) | |
Federal Farm Credit Banks: | | |
1/3/2023, 3 Month SOFR +0.04% | 4.34 | | 5,000,000 | a | 5,000,000 | |
1/3/2023, 3 Month SOFR +0.05% | 4.35 | | 2,000,000 | a | 2,000,000 | |
1/3/2023, 3 Month SOFR +0.05% | 4.35 | | 3,000,000 | a | 3,000,000 | |
Federal Home Loan Banks: | | |
1/3/2023, 3 Month SOFR +0.01% | 4.31 | | 3,000,000 | a | 3,000,000 | |
1/3/2023, 3 Month SOFR +0.02% | 4.32 | | 3,000,000 | a | 3,000,000 | |
1/3/2023, 3 Month SOFR +0.03% | 4.33 | | 3,000,000 | a | 3,000,000 | |
1/3/2023, 3 Month SOFR +0.03% | 4.33 | | 3,000,000 | a | 3,000,000 | |
1/3/2023, 3 Month SOFR +0.04% | 4.34 | | 3,000,000 | a | 3,000,000 | |
1/3/2023, 3 Month SOFR +0.04% | 4.34 | | 3,000,000 | a | 3,000,000 | |
1/3/2023, 3 Month SOFR +0.04% | 4.34 | | 3,000,000 | a | 3,000,000 | |
1/3/2023, 3 Month SOFR +0.05% | 4.35 | | 3,000,000 | a | 3,000,000 | |
1/3/2023, 3 Month SOFR +0.05% | 4.35 | | 2,000,000 | a | 2,000,000 | |
1/3/2023, 3 Month SOFR +0.07% | 4.37 | | 2,000,000 | a | 2,000,000 | |
1/18/2023 | 8.01 | | 3,000,000 | b | 2,994,411 | |
4/24/2023 | 8.82 | | 1,000,000 | b | 986,534 | |
Total U.S. Government Agencies Obligations (cost $41,980,945) | | | | | 41,980,945 | |
U.S. Treasury Bills - 2.8% |
| |
| | | |
1/12/2023 | 5.45 | | 3,000,000 | b | 2,997,539 | |
1/26/2023 | 5.93 | | 3,000,000 | b | 2,993,917 | |
2/21/2023 | 8.44 | | 2,000,000 | b | 1,988,270 | |
Total U.S. Treasury Bills (cost $7,979,726) | | | | | 7,979,726 | |
U.S. Treasury Floating Rate Notes - 10.0% |
| |
| | | |
1/3/2023, 3 Month U.S. T-BILL -0.08% | 4.32 | | 8,000,000 | a | 7,996,001 | |
1/3/2023, 3 Month U.S. T-BILL +0.03% | 4.43 | | 10,000,000 | a | 10,000,000 | |
1/3/2023, 3 Month U.S. T-BILL +0.04% | 4.44 | | 7,000,000 | a | 6,996,610 | |
1/3/2023, 3 Month U.S. T-BILL +0.14% | 4.54 | | 3,000,000 | a | 2,997,120 | |
Total U.S. Treasury Floating Rate Notes (cost $27,989,731) | | | | | 27,989,731 | |
Repurchase Agreements - 73.5% |
| |
| | | |
ABN Amro Bank, Tri-Party Agreement thru BNY Mellon, dated 12/30/2022, due at 1/3/2023 in the amount of $52,037,266 (fully collateralized by: U.S. Treasuries (including strips), 0.63%-3.13%, due 3/31/2024-5/15/2032, valued at $53,040,003) | 4.30 | | 52,000,000 | | 52,000,000 | |
3
STATEMENT OF INVESTMENTS (continued)
| | | | | | | |
| |
Repurchase Agreements - 73.5%(continued) | Annualized
Yield (%) | | Principal
Amount ($) | | Value ($) | |
Bank of Montreal, Tri-Party Agreement thru BNY Mellon, dated 12/30/2022, due at 1/3/2023 in the amount of $55,039,417 (fully collateralized by: Federal Home Loan Mortgage Corp Agency Collateralized Mortgage Obligation, 1.64%-4.50%, due 1/15/2042-4/15/2048, Federal Home Loan Mortgage Corp Agency Debentures and Agency Strips, 0.35%-5.00%, due 4/25/2041-9/25/2052, Federal National Mortgage Association Agency Collateralized Mortgage Obligation, 0.00%-4.50%, due 1/15/2023-9/25/2052, Federal National Mortgage Association Agency Mortgage-Backed Securities, 0.49%, due 2/25/2029, Government National Mortgage Association Agency Collateralized Mortgage Obligation, 0.00%-5.00%, due 3/20/2040-3/20/2072, valued at $59,400,000) | 4.30 | | 55,000,000 | | 55,000,000 | |
Fixed Income Clearing Corp., Tri-Party Agreement thru Northern Trust Company, dated 12/30/2022, due at 1/3/2023 in the amount of $60,042,700 (fully collateralized by: U.S. Treasuries (including strips), 4.63%, due 2/15/2040, valued at $61,200,000) | 4.27 | | 60,000,000 | | 60,000,000 | |
ING Financial Markets LLC, Tri-Party Agreement thru BNY Mellon, dated 12/30/2022, due at 1/3/2023 in the amount of $40,028,667 (fully collateralized by: U.S. Treasuries (including strips), 0.00%-5.38%, due 4/18/2023-11/15/2051, valued at $40,800,002) | 4.30 | | 40,000,000 | | 40,000,000 | |
Total Repurchase Agreements (cost $207,000,000) | | | | | 207,000,000 | |
Total Investments (cost $284,950,402) | | 101.2% | | 284,950,402 | |
Liabilities, Less Cash and Receivables | | (1.2%) | | (3,438,739) | |
Net Assets | | 100.0% | | 281,511,663 | |
SOFR—Secured Overnight Financing Rate
U.S. T-BILL—U.S. Treasury Bill Money Market Yield
a Variable rate security—interest rate resets periodically and rate shown is the interest rate in effect at period end. Date shown represents the earlier of the next interest reset date or ultimate maturity date. Security description also includes the reference rate and spread if published and available.
b Security is a discount security. Income is recognized through the accretion of discount.
4
| | |
Portfolio Summary (Unaudited) † | Value (%) |
Repurchase Agreements | 73.5 |
U.S. Government Agencies Obligations | 14.9 |
U.S. Treasury Securities | 12.8 |
| | 101.2 |
† Based on net assets.
See notes to financial statements.
5
STATEMENT OF ASSETS AND LIABILITIES
December 31, 2022
| | | | | | | |
| | | | | | |
| | | Cost | | Value | |
Assets ($): | | | | |
Investments in securities—See Statement of Investments
(including repurchase agreements of $207,000,000)
—Note 1(b) | 284,950,402 | | 284,950,402 | |
Cash | | | | | 2,276,392 | |
Interest receivable | | 440,062 | |
Receivable for shares of Beneficial Interest subscribed | | 2,610 | |
Prepaid expenses | | | | | 2,172 | |
| | | | | 287,671,638 | |
Liabilities ($): | | | | |
Due to BNY Mellon Investment Adviser, Inc. and affiliates—Note 2(b) | | 143,961 | |
Payable for shares of Beneficial Interest redeemed | | 5,959,659 | |
Trustees’ fees and expenses payable | | 527 | |
Other accrued expenses | | | | | 55,828 | |
| | | | | 6,159,975 | |
Net Assets ($) | | | 281,511,663 | |
Composition of Net Assets ($): | | | | |
Paid-in capital | | | | | 281,513,261 | |
Total distributable earnings (loss) | | | | | (1,598) | |
Net Assets ($) | | | 281,511,663 | |
| | | | | |
Shares Outstanding | | |
(unlimited number of $.001 par value shares of Beneficial Interest authorized) | 281,481,987 | |
Net Asset Value Per Share ($) | | 1.00 | |
| | | | |
See notes to financial statements. | | | | |
6
STATEMENT OF OPERATIONS
Year Ended December 31, 2022
| | | | | | | |
| | | | | | |
| | | | | | |
Investment Income ($): | | | | |
Interest Income | | | 4,863,574 | |
Expenses: | | | | |
Management fee—Note 2(a) | | | 1,456,030 | |
Professional fees | | | 76,978 | |
Trustees’ fees and expenses—Note 2(c) | | | 19,205 | |
Chief Compliance Officer fees—Note 2(b) | | | 17,082 | |
Custodian fees—Note 2(b) | | | 15,533 | |
Prospectus and shareholders’ reports | | | 13,759 | |
Shareholder servicing costs—Note 2(b) | | | 611 | |
Miscellaneous | | | 8,130 | |
Total Expenses | | | 1,607,328 | |
Less—reduction in expenses due to undertaking—Note 2(a) | | | (390,640) | |
Less—reduction in fees due to earnings credits—Note 2(b) | | | (36) | |
Net Expenses | | | 1,216,652 | |
Net Investment Income, representing net increase in
net assets resulting from operations | | | 3,646,922 | |
| | | | | | |
See notes to financial statements. | | | | | |
7
STATEMENT OF CHANGES IN NET ASSETS
| | | | | | | | | | |
| | | | Year Ended December 31, |
| | | | 2022 | | 2021 | |
Operations ($): | | | | | | | | |
Net Investment Income, representing net
increase in net assets resulting from operations | 3,646,922 | | | | 28,629 | |
Distributions ($): | |
Distributions to shareholders | | | (3,646,922) | | | | (28,629) | |
Beneficial Interest Transactions ($1.00 per share): | |
Net proceeds from shares sold | | | 809,451,037 | | | | 1,152,356,151 | |
Distributions reinvested | | | 3,643,869 | | | | 28,629 | |
Cost of shares redeemed | | | (821,062,564) | | | | (1,104,175,296) | |
Increase (Decrease) in Net Assets
from Beneficial Interest Transactions | (7,967,658) | | | | 48,209,484 | |
Total Increase (Decrease) in Net Assets | (7,967,658) | | | | 48,209,484 | |
Net Assets ($): | |
Beginning of Period | | | 289,479,321 | | | | 241,269,837 | |
End of Period | | | 281,511,663 | | | | 289,479,321 | |
| | | | | | | | | |
See notes to financial statements. | | | | | | | | |
8
FINANCIAL HIGHLIGHTS
The following table describes the performance for the fiscal periods indicated. Net asset value total return is calculated assuming an initial investment made at the net asset value at the beginning of the period, reinvestment of all dividends and distributions at net asset value during the period, and redemption at net asset value on the last day of the period. Net asset value total return includes adjustments in accordance with accounting principles generally accepted in the United States of America and as such, the net asset value for financial reporting purposes and the returns based upon those net asset values may differ from the net asset value and returns for shareholder transactions. The fund’s total returns do not reflect expenses associated with variable annuity or insurance contracts. These figures have been derived from the fund’s financial statements.
| | | | | | | | | | | |
| | | | | |
| | |
| | Year Ended December 31, |
| | 2022 | 2021 | 2020 | 2019 | 2018 |
Per Share Data ($): | | | | | | |
Net asset value, beginning of period | | 1.00 | 1.00 | 1.00 | 1.00 | 1.00 |
Investment Operations: | | | | | | |
Net investment income | | .013 | .000a | .002 | .017 | .013 |
Distributions: | | | | | | |
Dividends from
net investment income | | (.013) | (.000)a | (.002) | (.017) | (.013) |
Net asset value, end of period | | 1.00 | 1.00 | 1.00 | 1.00 | 1.00 |
Total Return (%) | | 1.26 | .01 | .21 | 1.67 | 1.28 |
Ratios/Supplemental Data (%): | | | | | | |
Ratio of total expenses
to average net assets | | .55 | .55 | .56 | .58 | .58 |
Ratio of net expenses
to average net assets | | .42 | .05 | .26 | .57 | .58 |
Ratio of net investment income
to average net assets | | 1.25 | .01 | .17 | 1.65 | 1.26 |
Net Assets, end of period ($ x 1,000) | | 281,512 | 289,479 | 241,270 | 181,934 | 181,596 |
a Amount represents less than $.001 per share.
See notes to financial statements.
9
NOTES TO FINANCIAL STATEMENTS
NOTE 1—Significant Accounting Policies:
Government Money Market Portfolio (the “fund”) is a separate diversified series of BNY Mellon Variable Investment Fund (the “Trust”), which is registered under the Investment Company Act of 1940, as amended (the “Act”), as an open-end management investment company and operates as a series company currently offering four series, including the fund. The fund is only offered to separate accounts established by insurance companies to fund variable annuity contracts and variable life insurance policies. The fund’s investment objective is to seek as high a level of current income as is consistent with the preservation of capital and the maintenance of liquidity. The fund is managed by Dreyfus, a division of BNY Mellon Investment Adviser, Inc. (the “Adviser”), the fund’s investment adviser and a wholly-owned subsidiary of The Bank of New York Mellon Corporation (“BNY Mellon”). BNY Mellon Securities Corporation (the “Distributor”), a wholly-owned subsidiary of the Adviser, is the distributor of the fund’s shares, which are sold to the public without a sales charge.
Effective May 2, 2022, “Dreyfus Cash Investment Strategies” was renamed “Dreyfus”.
The fund operates as a “government money market fund” as that term is defined in Rule 2a-7 under the Act. It is the fund’s policy to maintain a constant net asset value (“NAV”) per share of $1.00 and the fund has adopted certain investment, portfolio valuation and dividend and distribution policies to enable it to do so. There is no assurance, however, that the fund will be able to maintain a constant NAV per share of $1.00.
The Trust accounts separately for the assets, liabilities and operations of each series. Expenses directly attributable to each series are charged to that series’ operations; expenses which are applicable to all series are allocated among them on a pro rata basis.
The Financial Accounting Standards Board (“FASB”) Accounting Standards Codification (“ASC”) is the exclusive reference of authoritative U.S. generally accepted accounting principles (“GAAP”) recognized by the FASB to be applied by nongovernmental entities. Rules and interpretive releases of the SEC under authority of federal laws are also sources of authoritative GAAP for SEC registrants. The fund is an investment company and applies the accounting and reporting guidance of the FASB ASC Topic 946 Financial Services-Investment Companies. The fund’s financial statements are prepared in accordance with GAAP, which may require the use of management estimates and assumptions. Actual results could differ from those estimates.
10
The Trust enters into contracts that contain a variety of indemnifications. The fund’s maximum exposure under these arrangements is unknown. The fund does not anticipate recognizing any loss related to these arrangements.
(a) Portfolio valuation: Investments in securities are valued at amortized cost in accordance with Rule 2a-7 under the Act. If amortized cost is determined not to approximate fair market value, the fair value of the portfolio securities will be determined by procedures established by and under the general oversight of the Trust’s Board of Trustees (the “Board”).
The fair value of a financial instrument is the amount that would be received to sell an asset or paid to transfer a liability in an orderly transaction between market participants at the measurement date (i.e., the exit price). GAAP establishes a fair value hierarchy that prioritizes the inputs of valuation techniques used to measure fair value. This hierarchy gives the highest priority to unadjusted quoted prices in active markets for identical assets or liabilities (Level 1 measurements) and the lowest priority to unobservable inputs (Level 3 measurements).
Additionally, GAAP provides guidance on determining whether the volume and activity in a market has decreased significantly and whether such a decrease in activity results in transactions that are not orderly. GAAP requires enhanced disclosures around valuation inputs and techniques used during annual and interim periods.
Various inputs are used in determining the value of the fund’s investments relating to fair value measurements. These inputs are summarized in the three broad levels listed below:
Level 1—unadjusted quoted prices in active markets for identical investments.
Level 2—other significant observable inputs (including quoted prices for similar investments, interest rates, prepayment speeds, credit risk, etc.).
Level 3—significant unobservable inputs (including the fund’s own assumptions in determining the fair value of investments).
The inputs or methodology used for valuing securities are not necessarily an indication of the risk associated with investing in those securities. For example, money market securities are valued using amortized cost, in accordance with rules under the Act. Generally, amortized cost approximates the current fair value of a security, but since the value is not obtained from a quoted price in an active market, such securities are reflected within Level 2 of the fair value hierarchy.
11
NOTES TO FINANCIAL STATEMENTS (continued)
The following is a summary of the inputs used as of December 31, 2022 in valuing the fund’s investments:
| | | | | | | |
| | Level 1-Unadjusted Quoted Prices | Level 2- Other Significant Observable Inputs | | Level 3-Significant Unobservable Inputs | Total | |
Assets ($) | | |
Investments in Securities:† | | |
Short-Term Investments | - | 284,950,402 | | - | 284,950,402 | |
† See Statement of Investments for additional detailed categorizations, if any.
(b) Securities transactions and investment income: Securities transactions are recorded on a trade date basis. Interest income, adjusted for accretion of discount and amortization of premium on investments, is earned from settlement date and is recognized on the accrual basis. Realized gains and losses from securities transactions are recorded on the identified cost basis.
The fund may enter into repurchase agreements with financial institutions, deemed to be creditworthy by the Adviser, subject to the seller’s agreement to repurchase and the fund’s agreement to resell such securities at a mutually agreed upon price. Pursuant to the terms of the repurchase agreement, such securities must have an aggregate market value greater than or equal to the terms of the repurchase price plus accrued interest at all times. If the value of the underlying securities falls below the value of the repurchase price plus accrued interest, the fund will require the seller to deposit additional collateral by the next business day. If the request for additional collateral is not met, or the seller defaults on its repurchase obligation, the fund maintains its right to sell the underlying securities at market value and may claim any resulting loss against the seller. The collateral is held on behalf of the fund by the tri-party administrator with respect to any tri-party agreement. The fund may also jointly enter into one or more repurchase agreements with other funds managed by the Adviser in accordance with an exemptive order granted by the SEC pursuant to section 17(d) and Rule 17d-1 under the Act. Any joint repurchase agreements must be collateralized fully by U.S. Government securities.
(c) Market Risk: The value of the securities in which the fund invests may be affected by political, regulatory, economic and social developments, and developments that impact specific economic sectors, industries or segments of the market. The value of a security may also decline due to general market conditions that are not specifically related to a particular company or industry, such as real or perceived adverse economic conditions, changes in the general outlook for corporate earnings, changes
12
in interest or currency rates, changes to inflation, adverse changes to credit markets or adverse investor sentiment generally. In addition, turbulence in financial markets and reduced liquidity in equity, credit and/or fixed income markets may negatively affect many issuers, which could adversely affect the fund. Global economies and financial markets are becoming increasingly interconnected, and conditions and events in one country, region or financial market may adversely impact issuers in a different country, region or financial market. These risks may be magnified if certain events or developments adversely interrupt the global supply chain; in these and other circumstances, such risks might affect companies world-wide. Recent examples include pandemic risks related to COVID-19 and aggressive measures taken world-wide in response by governments, including closing borders, restricting international and domestic travel, and the imposition of prolonged quarantines of large populations, and by businesses, including changes to operations and reducing staff.
(d) Dividends and distributions to shareholders: It is the policy of the fund to declare dividends daily from net investment income. Such dividends are paid monthly. Dividends from net realized capital gains, if any, are normally declared and paid annually, but the fund may make distributions on a more frequent basis to comply with the distribution requirements of the Internal Revenue Code of 1986, as amended (the “Code”). To the extent that net realized capital gains can be offset by capital loss carryovers, it is the policy of the fund not to distribute such gains.
(e) Federal income taxes: It is the policy of the fund to continue to qualify as a regulated investment company, if such qualification is in the best interests of its shareholders, by complying with the applicable provisions of the Code, and to make distributions of taxable income and net realized capital gain sufficient to relieve it from substantially all federal income and excise taxes.
As of and during the period ended December 31, 2022, the fund did not have any liabilities for any uncertain tax positions. The fund recognizes interest and penalties, if any, related to uncertain tax positions as income tax expense in the Statement of Operations. During the period ended December 31, 2022, the fund did not incur any interest or penalties.
Each tax year in the four-year period ended December 31, 2022 remains subject to examination by the Internal Revenue Service and state taxing authorities.
At December 31, 2022, the components of accumulated earnings on a tax basis were as follows: accumulated capital losses $1,598.
13
NOTES TO FINANCIAL STATEMENTS (continued)
The fund is permitted to carry forward capital losses for an unlimited period. Furthermore, capital loss carryovers retain their character as either short-term or long-term capital losses.
The accumulated capital loss carryover is available for federal income tax purposes to be applied against future net realized capital gains, if any, realized subsequent to December 31, 2022. The fund has $1,598 of short-term capital losses which can be carried forward for an unlimited period.
The tax character of distributions paid to shareholders during the fiscal years ended December 31, 2022 and December 31, 2021 were all ordinary income.
At December 31, 2022, the cost of investments for federal income tax purposes was substantially the same as the cost for financial reporting purposes (see the Statement of Investments).
(f) New accounting pronouncements: In 2020, the FASB issued Accounting Standards Update No. 2020-04, Reference Rate Reform (Topic 848): Facilitation of the Effects of Reference Rate Reform on Financial Reporting, which provides optional guidance to ease the potential burden in accounting for (or recognizing the effects of) reference rate reform on financial reporting.
The objective of the guidance in Topic 848 is to provide temporary relief during the transition period. The FASB included a sunset provision within Topic 848 based on expectations of when the London Interbank Offered Rate (“LIBOR”) would cease being published. At the time that Update 2020-04 was issued, the UK Financial Conduct Authority (FCA) had established its intent that it would no longer be necessary to persuade, or compel, banks to submit to LIBOR after December 31, 2021. As a result, the sunset provision was set for December 31, 2022—12 months after the expected cessation date of all currencies and tenors of LIBOR.
In March 2021, the FCA announced that the intended cessation date of the overnight 1-, 3-, 6-, and 12-month tenors of USD LIBOR would be June 30, 2023, which is beyond the current sunset date of Topic 848.
Because the current relief in Topic 848 may not cover a period of time during which a significant number of modifications may take place, the amendments in this Update defer the sunset date of Topic 848 from December 31, 2022, to December 31, 2024 (“FASB Sunset Date”), after which entities will no longer be permitted to apply the relief in Topic 848.
Management had evaluated the impact of Topic 848 on the fund’s investments, derivatives, debt and other contracts that will undergo reference rate-related modifications as a result of the Reference Rate
14
Reform. Management has no concerns in adopting Topic 848 by FASB Sunset Date. Management will continue to work with other financial institutions and counterparties to modify contracts as required by applicable regulation and within the regulatory deadlines. As of December 31, 2022, management believes these accounting standards have no impact on the fund and does not have any concerns of adopting the regulations by FASB Sunset Date.
NOTE 2―Management Fee and Other Transactions with Affiliates:
(a) Pursuant to an investment advisory agreement with the Adviser, the management fee is computed at the annual rate of .50% of the value of the fund’s average daily net assets and is payable monthly.
The Adviser has undertaken to waive receipt of the management fee and/or reimburse operating expenses in order to facilitate a daily yield at or above a certain level which may change from time to time. This undertaking is voluntary and not contractual, and may be terminated at any time. The reduction in expenses, pursuant to the undertaking, amounted to $390,640 during the period ended December 31, 2022.
(b) The fund has an arrangement with BNY Mellon Transfer, Inc., (the “Transfer Agent”), a subsidiary of BNY Mellon and an affiliate of the Adviser, whereby the fund may receive earnings credits when positive cash balances are maintained, which are used to offset Transfer Agent fees. For financial reporting purposes, the fund includes transfer agent net earnings credits, if any, as an expense offset in the Statement of Operations.
The fund has an arrangement with The Bank of New York Mellon (the “Custodian”), a subsidiary of BNY Mellon and an affiliate of the Adviser, whereby the fund will receive interest income or be charged overdraft fees when cash balances are maintained. For financial reporting purposes, the fund includes this interest income and overdraft fees, if any, as interest income in the Statement of Operations.
The fund compensates the Transfer Agent, under a transfer agency agreement, for providing transfer agency and cash management services for the fund. The majority of Transfer Agent fees are comprised of amounts paid on a per account basis, while cash management fees are related to fund subscriptions and redemptions. During the period ended December 31, 2022, the fund was charged $538 for transfer agency services. These fees are included in Shareholder servicing costs in the Statement of Operations. These fees were partially offset by earnings credits of $36.
15
NOTES TO FINANCIAL STATEMENTS (continued)
The fund compensates the Custodian, under a custody agreement, for providing custodial services for the fund. These fees are determined based on net assets, geographic region and transaction activity. During the period ended December 31, 2022, the fund was charged $15,533 pursuant to the custody agreement.
During the period ended December 31, 2022, the fund was charged $17,082 for services performed by the fund’s Chief Compliance Officer and his staff. These fees are included in Chief Compliance Officer fees in the Statement of Operations.
The components of “Due to BNY Mellon Investment Adviser, Inc. and affiliates” in the Statement of Assets and Liabilities consist of: management fee of $131,470, Custodian fees of $8,338, Chief Compliance Officer fees of $4,082 and Transfer Agent fees of $71.
(c) Each board member also serves as a board member of other funds in the BNY Mellon Family of Funds complex. Annual retainer fees and attendance fees are allocated to each fund based on net assets.
16
REPORT OF INDEPENDENT REGISTERED PUBLIC ACCOUNTING FIRM
To the Shareholders and the Board of Trustees of Government Money Market Portfolio
Opinion on the Financial Statements
We have audited the accompanying statement of assets and liabilities of Government Money Market Portfolio (the “Fund”) (one of the funds constituting BNY Mellon Variable Investment Fund), including the statement of investments, as of December 31, 2022, and the related statement of operations for the year then ended, the statements of changes in net assets for each of the two years in the period then ended, the financial highlights for each of the five years in the period then ended and the related notes (collectively referred to as the “financial statements”). In our opinion, the financial statements present fairly, in all material respects, the financial position of the Fund (one of the funds constituting BNY Mellon Variable Investment Fund) at December 31, 2022, the results of its operations for the year then ended, the changes in its net assets for each of the two years in the period then ended and its financial highlights for each of the five years in the period then ended, in conformity with U.S. generally accepted accounting principles.
Basis for Opinion
These financial statements are the responsibility of the Fund’s management. Our responsibility is to express an opinion on the Fund’s financial statements based on our audits. We are a public accounting firm registered with the Public Company Accounting Oversight Board (United States) (“PCAOB”) and are required to be independent with respect to the Fund in accordance with the U.S. federal securities laws and the applicable rules and regulations of the Securities and Exchange Commission and the PCAOB.
We conducted our audits in accordance with the standards of the PCAOB. Those standards require that we plan and perform the audit to obtain reasonable assurance about whether the financial statements are free of material misstatement, whether due to error or fraud. The Fund is not required to have, nor were we engaged to perform, an audit of the Fund’s internal control over financial reporting. As part of our audits, we are required to obtain an understanding of internal control over financial reporting, but not for the purpose of expressing an opinion on the effectiveness of the Fund’s internal control over financial reporting. Accordingly, we express no such opinion.
Our audits included performing procedures to assess the risks of material misstatement of the financial statements, whether due to error or fraud, and performing procedures that respond to those risks. Such procedures included examining, on a test basis, evidence regarding the amounts and disclosures in the financial statements. Our procedures included confirmation of securities owned as of December 31, 2022, by correspondence with the custodian, brokers and others; when replies were not received from brokers and others, we performed other auditing procedures. Our audits also included evaluating the accounting principles used and significant estimates made by management, as well as evaluating the overall presentation of the financial statements. We believe that our audits provide a reasonable basis for our opinion.

We have served as the auditor of one or more investment companies in the BNY Mellon Family of Funds since at least 1957, but we are unable to determine the specific year.
New York, New York
February 9, 2023
17
BOARD MEMBERS INFORMATION (Unaudited)
Independent Board Members
Joseph S. DiMartino (79)
Chairman of the Board (1995)
Principal Occupation During Past 5 Years:
· Director or Trustee of funds in the BNY Mellon Family of Funds and certain other entities (as described in the fund’s Statement of Additional Information) (1995-Present)
Other Public Company Board Memberships During Past 5 Years:
· CBIZ, Inc., a public company providing professional business services, products and solutions, Director (1997-Present)
No. of Portfolios for which Board Member Serves: 92
———————
Peggy C. Davis (79)
Board Member (2006)
Principal Occupation During Past 5 Years:
· Shad Professor of Law, New York University School of Law (1983-Present)
No. of Portfolios for which Board Member Serves: 32
———————
Gina D. France (64)
Board Member (2019)
Principal Occupation During Past 5 Years:
· France Strategic Partners, a strategy and advisory firm serving corporate clients across the United States, Founder, President and Chief Executive Officer (2003-Present)
Other Public Company Board Memberships During Past 5 Years:
· Huntington Bancshares, a bank holding company headquartered in Columbus, Ohio, Director (2016-Present)
· Cedar Fair, L.P., a publicly-traded partnership that owns and operates amusement parks and hotels in the U.S. and Canada, Director (2011-Present)
· CBIZ, Inc., a public company providing professional business services, products and solutions, Director (2015-Present)
· FirstMerit Corporation, a diversified financial services company, Director (2004-2016)
No. of Portfolios for which Board Member Serves: 22
———————
Joan Gulley (75)
Board Member (2017)
Principal Occupation During Past 5 Years:
· Nantucket Atheneum, public library, Chair (2018-June 2021) and Director (2015-June 2021)
· Orchard Island Club, golf and beach club, Governor (2016-Present)
No. of Portfolios for which Board Member Serves: 39
———————
18
Robin A. Melvin (59)
Board Member (2012)
Principal Occupation During Past 5 Years:
· Westover School, a private girls’ boarding school in Middlebury, Connecticut, Trustee (2019-Present)
· Mentor Illinois, a non-profit organization dedicated to increasing the quality of mentoring services in Illinois, Co-Chair (2014–2020); Board Member, Mentor Illinois (2013-2020)
· JDRF, a non-profit juvenile diabetes research foundation, Board Member (June 2021-June 2022)
Other Public Company Board Memberships During Past 5 Years:
· HPS Corporate Lending Fund, a closed-end management investment company regulated as a business development company, Trustee (August 2021-Present)
No. of Portfolios for which Board Member Serves: 71
———————
Michael D. DiLecce (60)
Advisory Board Member (2022)
Principal Occupation During Past 5 Years:
· Retired since July 2022. Global Asset Management Assurance Leader, Ernst & Young LLP (2015-2022)
· Americas Regional Talent Managing Partner for Ernst & Young’s Financial Service Practice (2017-2021)
· Partner, Ernst & Young LLP (1997-2022)
No. of Portfolios for which Board Member Serves: 22
———————
The address of the Board Members and Officers is c/o BNY Mellon Investment Adviser, Inc., 240 Greenwich Street, New York, New York 10286. Additional information about each Board Member is available in the fund’s Statement of Additional Information which can be obtained from the Adviser free of charge by calling this toll free number: 1-800-373-9387.
19
OFFICERS OF THE FUND (Unaudited)
DAVID DIPETRILLO, President since January 2021.
Vice President and Director of the Adviser since February 2021; Head of North America Product, BNY Mellon Investment Management since January 2018; and Director of Product Strategy, BNY Mellon Investment Management from January 2016 to December 2017. He is an officer of 54 investment companies (comprised of 107 portfolios) managed by the Adviser or an affiliate of the Adviser. He is 44 years old and has been an employee of BNY Mellon since 2005.
JAMES WINDELS, Treasurer since November 2001.
Vice President of the Adviser since September 2020; and Director–BNY Mellon Fund Administration. He is an officer of 55 investment companies (comprised of 127 portfolios) managed by the Adviser or an affiliate of the Adviser. He is 64 years old and has been an employee of the Adviser since April 1985.
PETER M. SULLIVAN, Chief Legal Officer since July 2021 and Vice President and Assistant Secretary since March 2019.
Chief Legal Officer of the Adviser and Associate General Counsel of BNY Mellon since July 2021; Senior Managing Counsel of BNY Mellon from December 2020 to July 2021; and Managing Counsel of BNY Mellon from March 2009 to December 2020. He is an officer of 55 investment companies (comprised of 127 portfolios) managed by the Adviser or an affiliate of the Adviser. He is 54 years old and has been an employee of BNY Mellon since April 2004.
JAMES BITETTO, Vice President since August 2005 and Secretary since February 2018.
Senior Managing Counsel of BNY Mellon since December 2019; Managing Counsel of BNY Mellon from April 2014 to December 2019; and Secretary of the Adviser. He is an officer of 55 investment companies (comprised of 127 portfolios) managed by the Adviser or an affiliate of the Adviser. He is 56 years old and has been an employee of the Adviser since December 1996.
DEIRDRE CUNNANE, Vice President and Assistant Secretary since March 2019.
Managing Counsel of BNY Mellon since December 2021, Counsel of BNY Mellon from August 2018 to December 2021; and Senior Regulatory Specialist at BNY Mellon Investment Management Services from February 2016 to August 2018. She is an officer of 55 investment companies (comprised of 127 portfolios) managed by the Adviser or an affiliate of the Adviser. She is 32 years old and has been an employee of the Adviser since August 2018.
SARAH S. KELLEHER, Vice President and Assistant Secretary since April 2014.
Vice President of BNY Mellon ETF Investment Adviser; LLC since February 2020; Senior Managing Counsel of BNY Mellon since September 2021; Managing Counsel of BNY Mellon from December 2017 to September 2021; and Senior Counsel of BNY Mellon from March 2013 to December 2017. She is an officer of 55 investment companies (comprised of 127 portfolios) managed by the Adviser or an affiliate of the Adviser. She is 47 years old and has been an employee of the Adviser since March 2013.
JEFF PRUSNOFSKY, Vice President and Assistant Secretary since August 2005.
Senior Managing Counsel of BNY Mellon. He is an officer of 55 investment companies (comprised of 127 portfolios) managed by the Adviser or an affiliate of the Adviser. He is 57 years old and has been an employee of the Adviser since October 1990.
AMANDA QUINN, Vice President and Assistant Secretary since March 2020.
Counsel of BNY Mellon since June 2019; Regulatory Administration Manager at BNY Mellon Investment Management Services from September 2018 to May 2019; and Senior Regulatory Specialist at BNY Mellon Investment Management Services from April 2015 to August 2018. She is an officer of 55 investment companies (comprised of 127 portfolios) managed by the Adviser or an affiliate of the Adviser. She is 37 years old and has been an employee of the Adviser since June 2019.
20
NATALYA ZELENSKY, Vice President and Assistant Secretary since March 2017.
Chief Compliance Officer since August 2021 and Vice President since February 2020 of BNY Mellon ETF Investment Adviser, LLC; Chief Compliance Officer since August 2021 and Vice President and Assistant Secretary since February 2020 of BNY Mellon ETF Trust; Managing Counsel of BNY Mellon from December 2019 to August 2021; Counsel of BNY Mellon from May 2016 to December 2019; and Assistant Secretary of the Adviser from April 2018 to August 2021. She is an officer of 55 investment companies (comprised of 127 portfolios) managed by the Adviser or an affiliate of the Adviser. She is 37 years old and has been an employee of BNY Mellon since May 2016.
DANIEL GOLDSTEIN, Vice President since March 2022.
Vice President and Head of Product Development of North America Product, BNY Mellon Investment Management since January 2018; Co-Head of Product Management, Development & Oversight of North America Product, BNY Mellon Investment Management from January 2010 to January 2018; and Senior Vice President, Development & Oversight of North America Product, BNY Mellon Investment Management since 2010. He is an officer of 54 investment companies (comprised of 107 portfolios) managed by the Adviser or an affiliate of the Adviser. He is 53 years old and has been an employee of the Distributor since 1991.
JOSEPH MARTELLA, Vice President since March 2022.
Vice President of the Adviser since December 2022, Head of Product Management of North America Product, BNY Mellon Investment Management since January 2018; Director of Product Research and Analytics of North America Product, BNY Mellon Investment Management from January 2010 to January 2018; and Senior Vice President of North America Product, BNY Mellon Investment Management since 2010. He is an officer of 54 investment companies (comprised of 107 portfolios) managed by the Adviser or an affiliate of the Adviser. He is 46 years old and has been an employee of the Distributor since 1999.
GAVIN C. REILLY, Assistant Treasurer since December 2005.
Tax Manager–BNY Mellon Fund Administration. He is an officer of 55 investment companies (comprised of 127 portfolios) managed by the Adviser or an affiliate of the Adviser. He is 54 years old and has been an employee of the Adviser since April 1991.
ROBERT SALVIOLO, Assistant Treasurer since July 2007.
Senior Accounting Manager–BNY Mellon Fund Administration. He is an officer of 55 investment companies (comprised of 127 portfolios) managed by the Adviser or an affiliate of the Adviser. He is 55 years old and has been an employee of the Adviser since June 1989.
ROBERT SVAGNA, Assistant Treasurer since December 2002.
Senior Accounting Manager–BNY Mellon Fund Administration. He is an officer of 55 investment companies (comprised of 127 portfolios) managed by the Adviser or an affiliate of the Adviser. He is 55 years old and has been an employee of the Adviser since November 1990.
JOSEPH W. CONNOLLY, Chief Compliance Officer since October 2004.
Chief Compliance Officer of the BNY Mellon Family of Funds and BNY Mellon Funds Trust since 2004; and Chief Compliance Officer of the Adviser from 2004 until June 2021. He is the Chief Compliance Officer of 54 investment companies (comprised of 112 portfolios) managed by the Adviser. He is 65 years old.
CARIDAD M. CAROSELLA, Anti-Money Laundering Compliance Officer since January 2016.
Anti-Money Laundering Compliance Officer of the BNY Mellon Family of Funds and BNY Mellon Funds Trust. She is an officer of 48 investment companies (comprised of 120 portfolios) managed by the Adviser or an affiliate of the Adviser. She is 54 years old and has been an employee of the Distributor since 1997.
21
BNY Mellon Variable Investment Fund, Government Money Market Portfolio
240 Greenwich Street
New York, NY 10286
Adviser
BNY Mellon Investment Adviser, Inc.
240 Greenwich Street
New York, NY 10286
Custodian
The Bank of New York Mellon
240 Greenwich Street
New York, NY 10286
Transfer Agent &
Dividend Disbursing Agent
BNY Mellon Transfer, Inc.
240 Greenwich Street
New York, NY 10286
Distributor
BNY Mellon Securities Corporation
240 Greenwich Street
New York, NY 10286
Telephone Call your representative or 1-800-373-9387
Mail BNY Mellon Family of Funds to: BNY Mellon Institutional Services, 144 Glenn Curtiss Boulevard, Uniondale, NY 11556-0144
E-mail Send your request to instserv@bnymellon.com
Internet Access Dreyfus Money Market Funds at www.dreyfus.com
The fund will disclose daily, on www.dreyfus.com, the fund’s complete schedule of holdings as of the end of the previous business day. The schedule of holdings will remain on the website for a period of five months. The fund files a monthly schedule of portfolio holdings with the Securities and Exchange Commission (“SEC”) on Form N-MFP. The fund’s Forms N-MFP are available on the SEC’s website at www.sec.gov.
Information regarding how the fund voted proxies related to portfolio securities for the most recent 12-month period ended June 30 is available at www.dreyfus.com and on the SEC’s website at www.sec.gov and without charge, upon request, by calling 1-800-373-9387
| | |
© 2023 BNY Mellon Securities Corporation
0117AR1222 
| 
|
BNY Mellon Variable Investment Fund, Growth and Income Portfolio
| |
ANNUAL REPORT December 31, 2022 |

| |
Save time. Save paper. View your next shareholder report online as soon as it’s available. Log into www.im.bnymellon.com and sign up for eCommunications. It’s simple and only takes a few minutes. |
| |
The views expressed in this report reflect those of the portfolio manager(s) only through the end of the period covered and do not necessarily represent the views of BNY Mellon Investment Adviser, Inc. or any other person in the BNY Mellon Investment Adviser, Inc. organization. Any such views are subject to change at any time based upon market or other conditions and BNY Mellon Investment Adviser, Inc. disclaims any responsibility to update such views. These views may not be relied on as investment advice and, because investment decisions for a fund in the BNY Mellon Family of Funds are based on numerous factors, may not be relied on as an indication of trading intent on behalf of any fund in the BNY Mellon Family of Funds. |
| |
Not FDIC-Insured • Not Bank-Guaranteed • May Lose Value |
Contents
THE FUND
FOR MORE INFORMATION
Back Cover
DISCUSSION OF FUND PERFORMANCE (Unaudited)
For the period from January 1, 2022, through December 31, 2022, as provided by John Bailer, CFA, Karen Behr, Brian Ferguson, Keith Howell, David Intoppa and John Porter III, Portfolio Managers.
Market and Fund Performance Overview
For the 12-month period ended December 31, 2022, BNY Mellon Variable Investment Fund, Growth and Income Portfolio’s (the “fund”) Initial shares achieved a total return of −14.81%, and its Service shares achieved a total return of −15.03%.1 In comparison, the fund’s benchmark, the S&P 500® Index (the “Index”), produced a total return of −18.10% for the same period.2
U.S. stocks declined during the reporting period due to increasing inflation, rising interest rates and concerns about a possible recession. The fund outperformed the Index largely due to allocation and stock selections in the energy and financials sectors.
The Fund’s Investment Approach
The fund seeks long-term capital growth, current income and growth of income, consistent with reasonable investment risk. To pursue its goal, the fund normally invests primarily in stocks of domestic and foreign issuers. We seek to create a portfolio that includes a blend of growth and dividend-paying stocks, as well as other investments that provide income. We choose stocks through a disciplined investment process that combines computer-modeling techniques, “bottom-up” fundamental analysis and risk management. The investment process is designed to provide investors with investment exposure to sector weightings and risk characteristics similar to those of the Index.
In selecting securities, we seek companies that possess some or all of the following characteristics: growth of earnings potential; operating margin improvement; revenue growth prospects; business improvement; good business fundamentals; dividend yield consistent with the fund’s strategy pertaining to income; value, or how a stock is priced relative to its perceived intrinsic worth; and healthy financial profile, which measures the financial well-being of the company.
The fund may use listed equity options to seek to enhance and/or mitigate risk. The fund will engage in “covered” option transactions where the fund has in its possession, for the duration of the strategy, the underlying physical asset or cash to satisfy any obligation the fund may have with respect to the option strategy.
Inflation, Monetary Policy and Possible Economic Slowdown Weigh on Markets
The reporting period was defined by a significant shift from positive to negative investor sentiment. This was initially driven by high inflation, dramatically tightening monetary policy from the Federal Reserve (the “Fed”) and the Russia-Ukraine War. Later in the period, the possibility of an economic slowdown and negative earnings revisions weighed on markets, though investors also increasingly looked ahead to a potential easing in the Fed’s tightening policy.
As 2022 progressed, inflation data and central bank monetary tightening policies dominated the market narrative. Slower growth prospects, supply-chain concerns and expectations that interest rates would be higher for a longer period negatively impacted stock valuations. Across Europe, a broad monetary tightening effort by the Bank of England and the European Central Bank was implemented. In the EU, high inflation readings dampened the growth outlook, while soaring energy prices became a focus for European policymakers.
In contrast to monetary normalization and reopening trends worldwide, China continued to implement more accommodative monetary policies to address lackluster economic growth stemming from a weak macroeconomic environment and strict COVID-19 lockdown policies.
Geopolitical forces also weighed on markets. In addition to the war in Ukraine, China’s “Zero-COVID” policies added uncertainty to the global economic landscape.
2
As the reporting period progressed, markets responded in rollercoaster fashion to tightening monetary policy, mixed economic data and geopolitical uncertainties. Midway through the year, the market appeared to reach a bottom and began to rebound before descending again. Late in the period, markets largely rebounded as inflation began to abate, and investors began to consider the possibility of a shift in Fed tightening policy.
Energy and Financials Aided Performance
The fund’s performance was aided by sector allocation and stock selection decisions. Overweight positioning in both the energy and financial sectors, in particular, was beneficial. In the energy sector, stocks benefited from rising prices for oil and gas. Shares of Schlumberger Ltd., an oilfield services company, were advantageous. The company has been benefiting from a return to capital spending in the energy sector. Positions in the refining industry, especially Marathon Petroleum Corp. and Valero Energy Corp., were also helpful as the industry benefited from higher gasoline prices. In the financial sector, the fund’s overweight to the insurance industry added to performance, as did certain stock selections. Shares of Chubb Ltd., a property and casualty company, were a leading contributor.
On the other hand, although the fund benefited from an underweight in the information technology sector, which lagged, stock selections in this sector were especially detrimental. Shares in the sector generally were hurt by higher interest rates, which caused valuations to fall. Declining earnings estimates also weighed on these shares. The fund’s position in Twilio, a software company, was especially harmful. The fund’s underweight to the consumer staples sector also hampered performance.
Focused on Strong Cash Flows
We believe the market is experiencing a regime change that will benefit active managers, who are better able to capitalize on the attractive valuations that have resulted from a change in the market environment from one of economic growth and easy money to one of rising interest rates and potentially slowing business activity. As the market continues to adjust to this environment, we are focusing on companies with pricing power and the ability to generate high cash flows that can be used to pay dividends.
January 17, 2023
1 Total return includes reinvestment of dividends and any capital gains paid. Past performance is no guarantee of future results. Share price and investment return fluctuate such that upon redemption, fund shares may be worth more or less than their original cost. The fund’s performance does not reflect the deduction of additional charges and expenses imposed in connection with investing in variable insurance contracts, which will reduce returns. The fund’s returns reflect the absorption of certain fund expenses by BNY Mellon Investment Adviser, Inc. pursuant to an agreement in effect through April 29, 2023, at which time it may be extended, modified or terminated. Had these expenses not been absorbed, returns would have been lower.
2 Source: Lipper Inc. — The S&P 500® Index is widely regarded as the best single gauge of large-cap U.S. equities. The Index includes 500 leading companies and captures approximately 80% coverage of available market capitalization. Investors cannot invest directly in any index.
Please note: the position in any security highlighted with italicized typeface was sold during the reporting period.
Equities are subject generally to market, market sector, market liquidity, issuer and investment style risks, among other factors, to varying degrees, all of which are more fully described in the fund’s prospectus.
The use of derivatives involves risks different from, or possibly greater than, the risks associated with investing directly in the underlying assets. Derivatives can be highly volatile, illiquid and difficult to value, and there is the risk that changes in the value of a derivative held by the fund will not correlate with the underlying instruments or the fund’s other investments.
The fund is only available as a funding vehicle under variable life insurance policies or variable annuity contracts issued by insurance companies. Individuals may not purchase shares of the fund directly. A variable annuity is an insurance contract issued by an insurance company that enables investors to accumulate assets on a tax-deferred basis for retirement or other long-term goals. The investment objective and policies of BNY Mellon Variable Investment Fund, Growth and Income Portfolio made available through insurance products may be similar to those of other funds managed or advised by BNY Mellon Investment Adviser, Inc. However, the investment results of the fund may be higher or lower than, and may not be comparable to, those of any other BNY Mellon fund.
Recent market risks include pandemic risks related to COVID-19. The effects of COVID-19 have contributed to increased volatility in global markets and will likely affect certain countries, companies, industries and market sectors more dramatically than others. To the extent the fund may overweight its investments in certain countries, companies, industries or market sectors, such positions will increase the fund’s exposure to risk of loss from adverse developments affecting those countries, companies, industries or sectors.
3
FUND PERFORMANCE (Unaudited)
Comparison of change in value of a $10,000 investment in Initial shares and Service shares of BNY Mellon Variable Investment Fund, Growth and Income Portfolio with a hypothetical investment of $10,000 in the S&P 500® Index (the “Index”).
† Source: Lipper Inc.
Past performance is not predictive of future performance. The fund’s performance does not reflect the deduction of additional charges and expenses imposed in connection with investing in variable insurance contracts which will reduce returns.
The above graph compares a hypothetical $10,000 investment made in Initial shares and Service shares of BNY Mellon Variable Investment Fund, Growth and Income Portfolio on 12/31/12 to a hypothetical investment of $10,000 made in the Index on that date.
The fund’s performance shown in the line graph above takes into account all applicable fees and expenses. The Index is widely regarded as the best single gauge of large-cap U.S. equities. The Index includes 500 leading companies and captures approximately 80% coverage of available market capitalization. Unlike a mutual fund, the Index is not subject to charges, fees and other expenses. Investors cannot invest directly in any index. Further information relating to fund performance, including expense reimbursements, if applicable, is contained in the Financial Highlights section of the prospectus and elsewhere in this report.
| | | | |
Average Annual Total Returns as of 12/31/2022 |
| 1 Year | 5 Years | 10 Years |
Initial shares | -14.81% | 10.42% | 12.71% |
Service shares | -15.03% | 10.15% | 12.43% |
S&P 500® Index | -18.10% | 9.42% | 12.56% |
The performance data quoted represents past performance, which is no guarantee of future results. Share price and investment return fluctuate and an investor’s shares may be worth more or less than original cost upon redemption. Current performance may be lower or higher than the performance quoted. Go to www.im.bnymellon.com for the fund’s most recent month-end returns.
The fund’s Initial shares are not subject to a Rule 12b-1 fee. The fund’s Service shares are subject to a 0.25% annual Rule 12b-1 fee. All dividends and capital gain distributions are reinvested.
The fund’s performance shown in the graph and table does not reflect the deduction of taxes that a shareholder would pay on fund distributions or the redemption of fund shares.
4
UNDERSTANDING YOUR FUND’S EXPENSES (Unaudited)
As a mutual fund investor, you pay ongoing expenses, such as management fees and other expenses. Using the information below, you can estimate how these expenses affect your investment and compare them with the expenses of other funds. You also may pay one-time transaction expenses, including sales charges (loads), redemption fees and expenses associated with variable annuity or insurance contracts, which are not shown in this section and would have resulted in higher total expenses. For more information, see your fund’s prospectus or talk to your financial adviser.
Review your fund’s expenses
The table below shows the expenses you would have paid on a $1,000 investment in BNY Mellon Variable Investment Fund, Growth and Income Portfolio from July 1, 2022 to December 31, 2022. It also shows how much a $1,000 investment would be worth at the close of the period, assuming actual returns and expenses.
| | | | | |
Expenses and Value of a $1,000 Investment | |
Assume actual returns for the six months ended December 31, 2022 | |
| | | | |
| | Initial Shares | Service Shares | |
Expenses paid per $1,000† | $3.63 | $4.93 | |
Ending value (after expenses) | $1,060.00 | $1,059.20 | |
COMPARING YOUR FUND’S EXPENSES WITH THOSE OF OTHER FUNDS (Unaudited)
Using the SEC’s method to compare expenses
The Securities and Exchange Commission (“SEC”) has established guidelines to help investors assess fund expenses. Per these guidelines, the table below shows your fund’s expenses based on a $1,000 investment, assuming a hypothetical 5% annualized return. You can use this information to compare the ongoing expenses (but not transaction expenses or total cost) of investing in the fund with those of other funds. All mutual fund shareholder reports will provide this information to help you make this comparison. Please note that you cannot use this information to estimate your actual ending account balance and expenses paid during the period.
| | | | | |
Expenses and Value of a $1,000 Investment | |
Assuming a hypothetical 5% annualized return for the six months ended December 31, 2022 | |
| | | | |
| | Initial Shares | Service Shares | |
Expenses paid per $1,000† | $3.57 | $4.84 | |
Ending value (after expenses) | $1,021.68 | $1,020.42 | |
† | Expenses are equal to the fund’s annualized expense ratio of .70% for Initial Shares and .95% for Service Shares, multiplied by the average account value over the period, multiplied by 184/365 (to reflect the one-half year period). |
5
STATEMENT OF INVESTMENTS
December 31, 2022
| | | | | | | | |
| |
Description | | | | Shares | | Value ($) | |
Common Stocks - 97.9% | | | | | |
Automobiles & Components - 1.5% | | | | | |
General Motors Co. | | | | 8,976 | | 301,953 | |
Tesla Inc. | | | | 7,846 | a | 966,470 | |
| | | | | 1,268,423 | |
Banks - 3.8% | | | | | |
Bank of America Corp. | | | | 17,098 | | 566,286 | |
Comerica Inc. | | | | 3,392 | | 226,755 | |
JPMorgan Chase & Co. | | | | 14,863 | | 1,993,128 | |
U.S. Bancorp | | | | 9,880 | | 430,867 | |
| | | | | 3,217,036 | |
Capital Goods - 9.5% | | | | | |
AMETEK Inc. | | | | 6,522 | | 911,254 | |
Caterpillar Inc. | | | | 2,323 | | 556,498 | |
Eaton Corp. | | | | 4,784 | | 750,849 | |
Howmet Aerospace Inc. | | | | 22,841 | | 900,164 | |
Hubbell Inc. | | | | 870 | | 204,172 | |
Ingersoll Rand Inc. | | | | 27,078 | | 1,414,825 | |
L3Harris Technologies Inc. | | | | 1,577 | | 328,347 | |
Northrop Grumman Corp. | | | | 777 | | 423,939 | |
Quanta Services Inc. | | | | 2,347 | | 334,447 | |
Raytheon Technologies Corp. | | | | 12,276 | | 1,238,894 | |
Trane Technologies PLC | | | | 6,079 | | 1,021,819 | |
| | | | | 8,085,208 | |
Commercial & Professional Services - 1.0% | | | | | |
Cintas Corp. | | | | 1,786 | | 806,593 | |
Consumer Durables & Apparel - .6% | | | | | |
Lululemon Athletica Inc. | | | | 855 | a | 273,925 | |
Peloton Interactive Inc., Cl. A | | | | 32,078 | a | 254,699 | |
| | | | | 528,624 | |
Consumer Services - 2.5% | | | | | |
Booking Holdings Inc. | | | | 383 | a | 771,852 | |
International Game Technology PLC | | | | 33,847 | | 767,650 | |
Las Vegas Sands Corp. | | | | 11,600 | a | 557,612 | |
| | | | | 2,097,114 | |
Diversified Financials - 6.7% | | | | | |
Ameriprise Financial Inc. | | | | 1,024 | | 318,843 | |
Berkshire Hathaway Inc., Cl. B | | | | 6,418 | a | 1,982,520 | |
CME Group Inc. | | | | 6,585 | | 1,107,334 | |
Morgan Stanley | | | | 7,901 | | 671,743 | |
The Charles Schwab Corp. | | | | 7,963 | | 662,999 | |
The Goldman Sachs Group Inc. | | | | 1,870 | | 642,121 | |
6
| | | | | | | | |
| |
Description | | | | Shares | | Value ($) | |
Common Stocks - 97.9% (continued) | | | | | |
Diversified Financials - 6.7% (continued) | | | | | |
Voya Financial Inc. | | | | 5,350 | b | 328,971 | |
| | | | | 5,714,531 | |
Energy - 7.9% | | | | | |
ConocoPhillips | | | | 3,359 | | 396,362 | |
EOG Resources Inc. | | | | 3,423 | | 443,347 | |
EQT Corp. | | | | 38,921 | | 1,316,697 | |
Exxon Mobil Corp. | | | | 15,263 | | 1,683,509 | |
Hess Corp. | | | | 4,062 | | 576,073 | |
Marathon Petroleum Corp. | | | | 5,716 | | 665,285 | |
Schlumberger Ltd. | | | | 31,725 | | 1,696,018 | |
| | | | | 6,777,291 | |
Food & Staples Retailing - .2% | | | | | |
Sysco Corp. | | | | 2,152 | | 164,520 | |
Food, Beverage & Tobacco - .9% | | | | | |
Archer-Daniels-Midland Co. | | | | 2,324 | | 215,783 | |
British American Tobacco PLC, ADR | | | | 8,999 | | 359,780 | |
Bunge Ltd. | | | | 2,314 | | 230,868 | |
| | | | | 806,431 | |
Health Care Equipment & Services - 9.4% | | | | | |
Align Technology Inc. | | | | 2,907 | a | 613,086 | |
Becton Dickinson and Co. | | | | 5,343 | | 1,358,725 | |
DexCom Inc. | | | | 11,897 | a | 1,347,216 | |
Edwards Lifesciences Corp. | | | | 8,652 | a | 645,526 | |
Humana Inc. | | | | 2,670 | | 1,367,547 | |
Intuitive Surgical Inc. | | | | 3,085 | a | 818,605 | |
McKesson Corp. | | | | 1,668 | | 625,700 | |
Medtronic PLC | | | | 10,156 | | 789,324 | |
UnitedHealth Group Inc. | | | | 866 | | 459,136 | |
| | | | | 8,024,865 | |
Household & Personal Products - .6% | | | | | |
The Estee Lauder Companies, Cl. A | | | | 2,187 | | 542,617 | |
Insurance - 5.1% | | | | | |
Aon PLC, Cl. A | | | | 1,214 | | 364,370 | |
Assurant Inc. | | | | 5,747 | | 718,719 | |
Chubb Ltd. | | | | 4,346 | | 958,728 | |
Everest Re Group Ltd. | | | | 1,018 | | 337,233 | |
MetLife Inc. | | | | 7,186 | | 520,051 | |
RenaissanceRe Holdings Ltd. | | | | 1,704 | b | 313,928 | |
The Allstate Corp. | | | | 5,674 | | 769,394 | |
The Progressive Corp. | | | | 2,874 | | 372,787 | |
| | | | | 4,355,210 | |
Materials - 2.0% | | | | | |
Alcoa Corp. | | | | 18,310 | | 832,556 | |
7
STATEMENT OF INVESTMENTS (continued)
| | | | | | | | |
| |
Description | | | | Shares | | Value ($) | |
Common Stocks - 97.9% (continued) | | | | | |
Materials - 2.0% (continued) | | | | | |
Freeport-McMoRan Inc. | | | | 22,827 | | 867,426 | |
| | | | | 1,699,982 | |
Media & Entertainment - 6.9% | | | | | |
Alphabet Inc., Cl. A | | | | 12,106 | a | 1,068,112 | |
Alphabet Inc., Cl. C | | | | 23,246 | a | 2,062,618 | |
Comcast Corp., Cl. A | | | | 14,266 | | 498,882 | |
Match Group Inc. | | | | 3,479 | a | 144,344 | |
Netflix Inc. | | | | 1,081 | a | 318,765 | |
Omnicom Group Inc. | | | | 6,650 | | 542,440 | |
The Interpublic Group of Companies | | | | 22,671 | | 755,171 | |
The Walt Disney Company | | | | 5,734 | a | 498,170 | |
| | | | | 5,888,502 | |
Pharmaceuticals Biotechnology & Life Sciences - 10.6% | | | | | |
AbbVie Inc. | | | | 2,798 | | 452,185 | |
Bio-Techne Corp. | | | | 5,712 | | 473,411 | |
Danaher Corp. | | | | 4,886 | | 1,296,842 | |
Eli Lilly & Co. | | | | 6,628 | | 2,424,788 | |
Gilead Sciences Inc. | | | | 12,399 | | 1,064,454 | |
Horizon Therapeutics PLC | | | | 6,134 | a | 698,049 | |
Illumina Inc. | | | | 2,236 | a | 452,119 | |
Merck & Co. | | | | 3,401 | | 377,341 | |
Repligen Corp. | | | | 2,657 | a | 449,857 | |
Sanofi, ADR | | | | 21,425 | | 1,037,613 | |
Seagen Inc. | | | | 2,354 | a | 302,513 | |
| | | | | 9,029,172 | |
Retailing - 3.5% | | | | | |
Amazon.com Inc. | | | | 31,060 | a | 2,609,040 | |
Chewy Inc., Cl. A | | | | 9,756 | a,b | 361,752 | |
Farfetch Ltd., Cl. A | | | | 11,370 | a | 53,780 | |
| | | | | 3,024,572 | |
Semiconductors & Semiconductor Equipment - 3.9% | | | | | |
Applied Materials Inc. | | | | 9,511 | | 926,181 | |
Marvell Technology Inc. | | | | 10,247 | | 379,549 | |
Micron Technology Inc. | | | | 5,943 | | 297,031 | |
NVIDIA Corp. | | | | 10,035 | | 1,466,515 | |
Qualcomm Inc. | | | | 2,613 | | 287,273 | |
| | | | | 3,356,549 | |
Software & Services - 11.1% | | | | | |
Ansys Inc. | | | | 2,185 | a | 527,874 | |
Bill.com Holdings Inc. | | | | 3,645 | a | 397,159 | |
Block Inc. | | | | 13,617 | a | 855,692 | |
CrowdStrike Holdings Inc., CI. A | | | | 2,485 | a | 261,646 | |
Datadog Inc., Cl. A | | | | 3,267 | a | 240,125 | |
8
| | | | | | | | |
| |
Description | | | | Shares | | Value ($) | |
Common Stocks - 97.9% (continued) | | | | | |
Software & Services - 11.1% (continued) | | | | | |
Dolby Laboratories Inc., Cl. A | | | | 3,143 | | 221,707 | |
Fidelity National Information Services Inc. | | | | 6,205 | | 421,009 | |
HubSpot Inc. | | | | 1,563 | a | 451,910 | |
Microsoft Corp. | | | | 14,073 | | 3,374,987 | |
Roper Technologies Inc. | | | | 1,157 | | 499,928 | |
Salesforce Inc. | | | | 4,872 | a | 645,978 | |
Shopify Inc., Cl. A | | | | 22,196 | a | 770,423 | |
Twilio Inc., Cl. A | | | | 13,560 | a | 663,898 | |
Zoom Video Communications Inc., CI. A | | | | 2,113 | a | 143,135 | |
| | | | | 9,475,471 | |
Technology Hardware & Equipment - 6.9% | | | | | |
Apple Inc. | | | | 23,542 | | 3,058,812 | |
Cisco Systems Inc. | | | | 27,751 | | 1,322,058 | |
Corning Inc. | | | | 9,522 | | 304,133 | |
Hewlett Packard Enterprise Co. | | | | 40,509 | | 646,524 | |
Zebra Technologies Corp., Cl. A | | | | 2,232 | a | 572,307 | |
| | | | | 5,903,834 | |
Transportation - .7% | | | | | |
FedEx Corp. | | | | 1,308 | | 226,546 | |
Uber Technologies Inc. | | | | 14,897 | a | 368,403 | |
| | | | | 594,949 | |
Utilities - 2.6% | | | | | |
Constellation Energy Corp. | | | | 9,708 | | 836,927 | |
Exelon Corp. | | | | 14,319 | | 619,010 | |
NextEra Energy Partners LP | | | | 2,645 | | 185,388 | |
PPL Corp. | | | | 19,067 | | 557,138 | |
| | | | | 2,198,463 | |
Total Common Stocks (cost $69,582,078) | | | | 83,559,957 | |
| | | 1-Day
Yield (%) | | | | | |
Investment Companies - 2.1% | | | | | |
Registered Investment Companies - 2.1% | | | | | |
Dreyfus Institutional Preferred Government Plus Money Market Fund, Institutional Shares
(cost $1,781,995) | | 4.37 | | 1,781,995 | c | 1,781,995 | |
9
STATEMENT OF INVESTMENTS (continued)
| | | | | | | | |
| |
Description | | 1-Day
Yield (%) | | Shares | | Value ($) | |
Investment of Cash Collateral for Securities Loaned - .7% | | | | | |
Registered Investment Companies - .7% | | | | | |
Dreyfus Institutional Preferred Government Plus Money Market Fund, SL Shares
(cost $617,400) | | 4.37 | | 617,400 | c | 617,400 | |
Total Investments (cost $71,981,473) | | 100.7% | | 85,959,352 | |
Liabilities, Less Cash and Receivables | | (.7%) | | (555,155) | |
Net Assets | | 100.0% | | 85,404,197 | |
ADR—American Depository Receipt
a Non-income producing security.
b Security, or portion thereof, on loan. At December 31, 2022, the value of the fund’s securities on loan was $686,858 and the value of the collateral was $712,167, consisting of cash collateral of $617,400 and U.S. Government & Agency securities valued at $94,767. In addition, the value of collateral may include pending sales that are also on loan.
c Investment in affiliated issuer. The investment objective of this investment company is publicly available and can be found within the investment company’s prospectus.
| | |
Portfolio Summary (Unaudited) † | Value (%) |
Information Technology | 21.9 |
Health Care | 20.0 |
Financials | 15.6 |
Industrials | 11.1 |
Consumer Discretionary | 8.1 |
Energy | 7.9 |
Communication Services | 6.9 |
Investment Companies | 2.8 |
Utilities | 2.6 |
Materials | 2.0 |
Consumer Staples | 1.8 |
| | 100.7 |
† Based on net assets.
See notes to financial statements.
10
| | | | | | | |
Affiliated Issuers | | | |
Description | Value ($) 12/31/2021 | Purchases ($)† | Sales ($) | Value ($) 12/31/2022 | Dividends/
Distributions ($) | |
Registered Investment Companies - 2.1% | | |
Dreyfus Institutional Preferred Government Plus Money Market Fund, Institutional Shares - 2.1% | 1,584,938 | 28,530,170 | (28,333,113) | 1,781,995 | 39,372 | |
Investment of Cash Collateral for Securities Loaned - .7% | | |
Dreyfus Institutional Preferred Government Plus Money Market Fund, SL Shares - .7% | 622,733 | 14,393,294 | (14,398,627) | 617,400 | 3,469 | †† |
Total - 2.8% | 2,207,671 | 42,923,464 | (42,731,740) | 2,399,395 | 42,841 | |
† Includes reinvested dividends/distributions.
†† Represents securities lending income earned from the reinvestment of cash collateral from loaned securities, net of fees and collateral investment expenses, and other payments to and from borrowers of securities.
See notes to financial statements.
11
STATEMENT OF ASSETS AND LIABILITIES
December 31, 2022
| | | | | | | |
| | | | | | |
| | | Cost | | Value | |
Assets ($): | | | | |
Investments in securities—See Statement of Investments
(including securities on loan, valued at $686,858)—Note 1(c): | | | |
Unaffiliated issuers | 69,582,078 | | 83,559,957 | |
Affiliated issuers | | 2,399,395 | | 2,399,395 | |
Receivable for investment securities sold | | 198,167 | |
Dividends and securities lending income receivable | | 101,334 | |
Tax reclaim receivable—Note 1(b) | | 2,916 | |
Receivable for shares of Beneficial Interest subscribed | | 2,699 | |
Prepaid expenses | | | | | 1,532 | |
| | | | | 86,266,000 | |
Liabilities ($): | | | | |
Due to BNY Mellon Investment Adviser, Inc. and affiliates—Note 3(b) | | 52,401 | |
Liability for securities on loan—Note 1(c) | | 617,400 | |
Payable for investment securities purchased | | 112,378 | |
Payable for shares of Beneficial Interest redeemed | | 8,022 | |
Trustees’ fees and expenses payable | | 752 | |
Other accrued expenses | | | | | 70,850 | |
| | | | | 861,803 | |
Net Assets ($) | | | 85,404,197 | |
Composition of Net Assets ($): | | | | |
Paid-in capital | | | | | 62,695,398 | |
Total distributable earnings (loss) | | | | | 22,708,799 | |
Net Assets ($) | | | 85,404,197 | |
| | | | |
Net Asset Value Per Share | Initial Shares | Service Shares | |
Net Assets ($) | 81,555,352 | 3,848,845 | |
Shares Outstanding | 2,825,280 | 132,925.15 | |
Net Asset Value Per Share ($) | 28.87 | 28.95 | |
| | | |
See notes to financial statements. | | | |
12
STATEMENT OF OPERATIONS
Year Ended December 31, 2022
| | | | | | | |
| | | | | | |
| | | | | | |
Investment Income ($): | | | | |
Income: | | | | |
Cash dividends (net of $4,304 foreign taxes withheld at source): | |
Unaffiliated issuers | | | 1,365,741 | |
Affiliated issuers | | | 39,372 | |
Income from securities lending—Note 1(c) | | | 3,469 | |
Total Income | | | 1,408,582 | |
Expenses: | | | | |
Management fee—Note 3(a) | | | 694,241 | |
Professional fees | | | 84,774 | |
Chief Compliance Officer fees—Note 3(b) | | | 17,082 | |
Prospectus and shareholders’ reports | | | 15,399 | |
Distribution fees—Note 3(b) | | | 10,322 | |
Custodian fees—Note 3(b) | | | 9,446 | |
Trustees’ fees and expenses—Note 3(c) | | | 5,996 | |
Loan commitment fees—Note 2 | | | 1,571 | |
Shareholder servicing costs—Note 3(b) | | | 820 | |
Registration fees | | | 51 | |
Miscellaneous | | | 16,129 | |
Total Expenses | | | 855,831 | |
Less—reduction in expenses due to undertaking—Note 3(a) | | | (166,628) | |
Less—reduction in fees due to earnings credits—Note 3(b) | | | (60) | |
Net Expenses | | | 689,143 | |
Net Investment Income | | | 719,439 | |
Realized and Unrealized Gain (Loss) on Investments—Note 4 ($): | | |
Net realized gain (loss) on investments | 8,906,177 | |
Net change in unrealized appreciation (depreciation) on investments | (25,721,848) | |
Net Realized and Unrealized Gain (Loss) on Investments | | | (16,815,671) | |
Net (Decrease) in Net Assets Resulting from Operations | | (16,096,232) | |
| | | | | | |
See notes to financial statements. | | | | | |
13
STATEMENT OF CHANGES IN NET ASSETS
| | | | | | | | | | |
| | | | Year Ended December 31, |
| | | | 2022 | | 2021 | |
Operations ($): | | | | | | | | |
Net investment income | | | 719,439 | | | | 492,601 | |
Net realized gain (loss) on investments | | 8,906,177 | | | | 19,072,590 | |
Net change in unrealized appreciation
(depreciation) on investments | | (25,721,848) | | | | 4,407,570 | |
Net Increase (Decrease) in Net Assets
Resulting from Operations | (16,096,232) | | | | 23,972,761 | |
Distributions ($): | |
Distributions to shareholders: | | | | | | | | |
Initial Shares | | | (18,522,652) | | | | (7,014,637) | |
Service Shares | | | (853,635) | | | | (343,017) | |
Total Distributions | | | (19,376,287) | | | | (7,357,654) | |
Beneficial Interest Transactions ($): | |
Net proceeds from shares sold: | | | | | | | | |
Initial Shares | | | 1,230,513 | | | | 3,095,610 | |
Service Shares | | | 206,537 | | | | 43,155 | |
Distributions reinvested: | | | | | | | | |
Initial Shares | | | 18,522,652 | | | | 7,014,637 | |
Service Shares | | | 853,635 | | | | 343,017 | |
Cost of shares redeemed: | | | | | | | | |
Initial Shares | | | (10,309,912) | | | | (11,743,048) | |
Service Shares | | | (577,161) | | | | (1,013,964) | |
Increase (Decrease) in Net Assets
from Beneficial Interest Transactions | 9,926,264 | | | | (2,260,593) | |
Total Increase (Decrease) in Net Assets | (25,546,255) | | | | 14,354,514 | |
Net Assets ($): | |
Beginning of Period | | | 110,950,452 | | | | 96,595,938 | |
End of Period | | | 85,404,197 | | | | 110,950,452 | |
Capital Share Transactions (Shares): | |
Initial Shares | | | | | | | | |
Shares sold | | | 38,457 | | | | 80,423 | |
Shares issued for distributions reinvested | | | 557,426 | | | | 196,863 | |
Shares redeemed | | | (320,164) | | | | (301,041) | |
Net Increase (Decrease) in Shares Outstanding | 275,719 | | | | (23,755) | |
Service Shares | | | | | | | | |
Shares sold | | | 7,208 | | | | 1,110 | |
Shares issued for distributions reinvested | | | 25,565 | | | | 9,633 | |
Shares redeemed | | | (18,277) | | | | (25,957) | |
Net Increase (Decrease) in Shares Outstanding | 14,496 | | | | (15,214) | |
| | | | | | | | | |
See notes to financial statements. | | | | | | | | |
14
FINANCIAL HIGHLIGHTS
The following tables describe the performance for each share class for the fiscal periods indicated. All information (except portfolio turnover rate) reflects financial results for a single fund share. Net asset value total return is calculated assuming an initial investment made at the net asset value at the beginning of the period, reinvestment of all dividends and distributions at net asset value during the period, and redemption at net asset value on the last day of the period. Net asset value total return includes adjustments in accordance with accounting principles generally accepted in the United States of America and as such, the net asset value for financial reporting purposes and the returns based upon those net asset values may differ from the net asset value and returns for shareholder transactions. The fund’s total returns do not reflect expenses associated with variable annuity or insurance contracts. These figures have been derived from the fund’s financial statements.
| | | | | | | |
| | | |
| | | Year Ended December 31, |
Initial Shares | | 2022 | 2021 | 2020 | 2019 | 2018 |
Per Share Data ($): | | | | | | |
Net asset value,
beginning of period | | 41.58 | 35.68 | 31.82 | 28.03 | 32.72 |
Investment Operations: | | | | | | |
Net investment incomea | | .25 | .18 | .23 | .30 | .27 |
Net realized and unrealized
gain (loss) on investments | | (5.47) | 8.50 | 6.17 | 7.36 | (1.66) |
Total from Investment Operations | | (5.22) | 8.68 | 6.40 | 7.66 | (1.39) |
Distributions: | | | | | | |
Dividends from net
investment income | | (.25) | (.19) | (.23) | (.33) | (.26) |
Dividends from net realized
gain on investments | | (7.24) | (2.59) | (2.31) | (3.54) | (3.04) |
Total Distributions | | (7.49) | (2.78) | (2.54) | (3.87) | (3.30) |
Net asset value, end of period | | 28.87 | 41.58 | 35.68 | 31.82 | 28.03 |
Total Return (%) | | (14.81) | 25.63 | 24.63 | 29.12 | (4.68) |
Ratios/Supplemental Data (%): | | | | | | |
Ratio of total expenses
to average net assets | | .91 | .91 | .93 | .93 | .93 |
Ratio of net expenses
to average net assets | | .73 | .80 | .82 | .93 | .93 |
Ratio of net investment income
to average net assets | | .79 | .47 | .77 | 1.00 | .87 |
Portfolio Turnover Rate | | 67.86 | 53.70 | 66.45 | 61.08 | 63.89 |
Net Assets, end of period ($ x 1,000) | | 81,555 | 106,015 | 91,818 | 82,328 | 69,774 |
a Based on average shares outstanding.
See notes to financial statements.
15
FINANCIAL HIGHLIGHTS (continued)
| | | | | | | |
| | | |
| | | Year Ended December 31, |
Service Shares | | 2022 | 2021 | 2020 | 2019 | 2018 |
Per Share Data ($): | | | | | | |
Net asset value,
beginning of period | | 41.68 | 35.76 | 31.88 | 28.08 | 32.76 |
Investment Operations: | | | | | | |
Net investment incomea | | .17 | .09 | .16 | .22 | .19 |
Net realized and unrealized
gain (loss) on investments | | (5.49) | 8.51 | 6.19 | 7.37 | (1.65) |
Total from Investment Operations | | (5.32) | 8.60 | 6.35 | 7.59 | (1.46) |
Distributions: | | | | | | |
Dividends from net
investment income | | (.17) | (.09) | (.16) | (.25) | (.18) |
Dividends from net
realized gain on investments | | (7.24) | (2.59) | (2.31) | (3.54) | (3.04) |
Total Distributions | | (7.41) | (2.68) | (2.47) | (3.79) | (3.22) |
Net asset value, end of period | | 28.95 | 41.68 | 35.76 | 31.88 | 28.08 |
Total Return (%) | | (15.03) | 25.31 | 24.33 | 28.79 | (4.90) |
Ratios/Supplemental Data (%): | | | | | | |
Ratio of total expenses
to average net assets | | 1.16 | 1.16 | 1.18 | 1.18 | 1.18 |
Ratio of net expenses
to average net assets | | .98 | 1.05 | 1.07 | 1.18 | 1.18 |
Ratio of net investment income
to average net assets | | .54 | .22 | .52 | .76 | .62 |
Portfolio Turnover Rate | | 67.86 | 53.70 | 66.45 | 61.08 | 63.89 |
Net Assets, end of period ($ x 1,000) | | 3,849 | 4,936 | 4,778 | 4,484 | 4,039 |
a Based on average shares outstanding.
See notes to financial statements.
16
NOTES TO FINANCIAL STATEMENTS
NOTE 1—Significant Accounting Policies:
Growth and Income Portfolio (the “fund”) is a separate diversified series of BNY Mellon Variable Investment Fund (the “Trust”), which is registered under the Investment Company Act of 1940, as amended (the “Act”), as an open-end management investment company and operates as a series company currently offering four series, including the fund. The fund is only offered to separate accounts established by insurance companies to fund variable annuity contracts and variable life insurance policies. The fund’s investment objective is to seek long-term capital growth, current income and growth of income consistent with reasonable investment risk. BNY Mellon Investment Adviser, Inc. (the “Adviser”), a wholly-owned subsidiary of The Bank of New York Mellon Corporation (“BNY Mellon”), serves as the fund’s investment adviser. Newton Investment Management North America, LLC (the “Sub-Adviser”), a wholly-owned subsidiary of BNY Mellon and an affiliate of the Adviser, serves as the fund’s sub-adviser.
BNY Mellon Securities Corporation (the “Distributor”), a wholly-owned subsidiary of the Adviser, is the distributor of the fund’s shares, which are sold without a sales charge. The fund is authorized to issue an unlimited number of $.001 par value shares of Beneficial Interest in each of the following classes of shares: Initial and Service. Each class of shares has identical rights and privileges, except with respect to the Distribution Plan, and the expenses borne by each class, the allocation of certain transfer agency costs, and certain voting rights. Income, expenses (other than expenses attributable to a specific class), and realized and unrealized gains or losses on investments are allocated to each class of shares based on its relative net assets.
The Trust accounts separately for the assets, liabilities and operations of each series. Expenses directly attributable to each series are charged to that series’ operations; expenses which are applicable to all series are allocated among them on a pro rata basis.
The Financial Accounting Standards Board (“FASB”) Accounting Standards Codification (“ASC”) is the exclusive reference of authoritative U.S. generally accepted accounting principles (“GAAP”) recognized by the FASB to be applied by nongovernmental entities. Rules and interpretive releases of the SEC under authority of federal laws are also sources of authoritative GAAP for SEC registrants. The fund is an investment company and applies the accounting and reporting guidance of the FASB ASC Topic 946 Financial Services-Investment Companies. The fund’s financial statements are prepared in accordance with GAAP, which may
17
NOTES TO FINANCIAL STATEMENTS (continued)
require the use of management estimates and assumptions. Actual results could differ from those estimates.
The Trust enters into contracts that contain a variety of indemnifications. The fund’s maximum exposure under these arrangements is unknown. The fund does not anticipate recognizing any loss related to these arrangements.
(a) Portfolio valuation: The fair value of a financial instrument is the amount that would be received to sell an asset or paid to transfer a liability in an orderly transaction between market participants at the measurement date (i.e., the exit price). GAAP establishes a fair value hierarchy that prioritizes the inputs of valuation techniques used to measure fair value. This hierarchy gives the highest priority to unadjusted quoted prices in active markets for identical assets or liabilities (Level 1 measurements) and the lowest priority to unobservable inputs (Level 3 measurements).
Additionally, GAAP provides guidance on determining whether the volume and activity in a market has decreased significantly and whether such a decrease in activity results in transactions that are not orderly. GAAP requires enhanced disclosures around valuation inputs and techniques used during annual and interim periods.
Various inputs are used in determining the value of the fund’s investments relating to fair value measurements. These inputs are summarized in the three broad levels listed below:
Level 1—unadjusted quoted prices in active markets for identical investments.
Level 2—other significant observable inputs (including quoted prices for similar investments, interest rates, prepayment speeds, credit risk, etc.).
Level 3—significant unobservable inputs (including the fund’s own assumptions in determining the fair value of investments).
The inputs or methodology used for valuing securities are not necessarily an indication of the risk associated with investing in those securities.
Changes in valuation techniques may result in transfers in or out of an assigned level within the disclosure hierarchy. Valuation techniques used to value the fund’s investments are as follows:
The Trust’s Board of Trustees (the “Board”) has designated the Adviser as the fund’s valuation designee, effective September 8, 2022, to make all fair value determinations with respect to the fund’s portfolio investments, subject to the Board’s oversight and pursuant to Rule 2a-5 under the Act.
18
Investments in equity securities are valued at the last sales price on the securities exchange or national securities market on which such securities are primarily traded. Securities listed on the National Market System for which market quotations are available are valued at the official closing price or, if there is no official closing price that day, at the last sales price. For open short positions, asked prices are used for valuation purposes. Bid price is used when no asked price is available. Registered investment companies that are not traded on an exchange are valued at their net asset value. All of the preceding securities are generally categorized within Level 1 of the fair value hierarchy.
Securities not listed on an exchange or the national securities market, or securities for which there were no transactions, are valued at the average of the most recent bid and asked prices. These securities are generally categorized within Level 2 of the fair value hierarchy.
Fair valuing of securities may be determined with the assistance of a pricing service using calculations based on indices of domestic securities and other appropriate indicators, such as prices of relevant ADRs and futures. Utilizing these techniques may result in transfers between Level 1 and Level 2 of the fair value hierarchy.
When market quotations or official closing prices are not readily available, or are determined not to accurately reflect fair value, such as when the value of a security has been significantly affected by events after the close of the exchange or market on which the security is principally traded, but before the fund calculates its net asset value, the fund may value these investments at fair value as determined in accordance with the procedures approved by the Board. Certain factors may be considered when fair valuing investments such as: fundamental analytical data, the nature and duration of restrictions on disposition, an evaluation of the forces that influence the market in which the securities are purchased and sold, and public trading in similar securities of the issuer or comparable issuers. These securities are either categorized within Level 2 or 3 of the fair value hierarchy depending on the relevant inputs used.
For securities where observable inputs are limited, assumptions about market activity and risk are used and such securities are generally categorized within Level 3 of the fair value hierarchy.
The following is a summary of the inputs used as of December 31, 2022 in valuing the fund’s investments:
19
NOTES TO FINANCIAL STATEMENTS (continued)
| | | | | | | |
| | Level 1-Unadjusted Quoted Prices | Level 2- Other Significant Observable Inputs | | Level 3-Significant Unobservable Inputs | Total | |
Assets ($) | | |
Investments in Securities:† | | |
Equity Securities - Common Stocks | 83,559,957 | - | | - | 83,559,957 | |
Investment Companies | 2,399,395 | - | | - | 2,399,395 | |
† See Statement of Investments for additional detailed categorizations, if any.
(b) Foreign taxes: The fund may be subject to foreign taxes (a portion of which may be reclaimable) on income, stock dividends, realized and unrealized capital gains on investments or certain foreign currency transactions. Foreign taxes are recorded in accordance with the applicable foreign tax regulations and rates that exist in the foreign jurisdictions in which the fund invests. These foreign taxes, if any, are paid by the fund and are reflected in the Statement of Operations, if applicable. Foreign taxes payable or deferred or those subject to reclaims as of December 31, 2022, if any, are disclosed in the fund’s Statement of Assets and Liabilities.
(c) Securities transactions and investment income: Securities transactions are recorded on a trade date basis. Realized gains and losses from securities transactions are recorded on the identified cost basis. Dividend income is recognized on the ex-dividend date and interest income, including, where applicable, accretion of discount and amortization of premium on investments, is recognized on the accrual basis.
Pursuant to a securities lending agreement with BNY Mellon, the fund may lend securities to qualified institutions. It is the fund’s policy that, at origination, all loans are secured by collateral of at least 102% of the value of U.S. securities loaned and 105% of the value of foreign securities loaned. Collateral equivalent to at least 100% of the market value of securities on loan is maintained at all times. Collateral is either in the form of cash, which can be invested in certain money market mutual funds managed by the Adviser, or U.S. Government and Agency securities. The fund is entitled to receive all dividends, interest and distributions on securities loaned, in addition to income earned as a result of the lending transaction. Should a borrower fail to return the securities in a timely manner, BNY Mellon is required to replace the securities for the benefit of the fund or credit the fund with the market value of the unreturned securities and is subrogated to the fund’s rights against the borrower and the collateral. Additionally, the contractual maturity of security lending transactions are on an overnight and continuous basis. During the period
20
ended December 31, 2022, BNY Mellon earned $472 from the lending of the fund’s portfolio securities, pursuant to the securities lending agreement.
(d) Affiliated issuers: Investments in other investment companies advised by the Adviser are considered “affiliated” under the Act.
(e) Market Risk: The value of the securities in which the fund invests may be affected by political, regulatory, economic and social developments, and developments that impact specific economic sectors, industries or segments of the market. The value of a security may also decline due to general market conditions that are not specifically related to a particular company or industry, such as real or perceived adverse economic conditions, changes in the general outlook for corporate earnings, changes in interest or currency rates, changes to inflation, adverse changes to credit markets or adverse investor sentiment generally. In addition, turbulence in financial markets and reduced liquidity in equity, credit and/or fixed income markets may negatively affect many issuers, which could adversely affect the fund. Global economies and financial markets are becoming increasingly interconnected, and conditions and events in one country, region or financial market may adversely impact issuers in a different country, region or financial market. These risks may be magnified if certain events or developments adversely interrupt the global supply chain; in these and other circumstances, such risks might affect companies world-wide. Recent examples include pandemic risks related to COVID-19 and aggressive measures taken world-wide in response by governments, including closing borders, restricting international and domestic travel, and the imposition of prolonged quarantines of large populations, and by businesses, including changes to operations and reducing staff.
Foreign Investment Risk: To the extent the fund invests in foreign securities, the fund’s performance will be influenced by political, social and economic factors affecting investments in foreign issuers. Special risk associated with investments in foreign issuers include exposure to currency fluctuations, less liquidity, less developed or less efficient trading markets, lack of comprehensive company information, political and economic instability and differing auditing and legal standards.
(f) Dividends and distributions to shareholders: Dividends and distributions are recorded on the ex-dividend date. Dividends from net investment income are normally declared and paid quarterly. Dividends from net realized capital gains, if any, are normally declared and paid annually, but the fund may make distributions on a more frequent basis to comply with the distribution requirements of the Internal Revenue Code of 1986, as amended (the “Code”). To the extent that net realized capital gains can be offset by capital loss carryovers, it is the policy of the fund not
21
NOTES TO FINANCIAL STATEMENTS (continued)
to distribute such gains. Income and capital gain distributions are determined in accordance with income tax regulations, which may differ from GAAP.
(g) Federal income taxes: It is the policy of the fund to continue to qualify as a regulated investment company, if such qualification is in the best interests of its shareholders, by complying with the applicable provisions of the Code, and to make distributions of taxable income and net realized capital gain sufficient to relieve it from substantially all federal income and excise taxes.
As of and during the period ended December 31, 2022, the fund did not have any liabilities for any uncertain tax positions. The fund recognizes interest and penalties, if any, related to uncertain tax positions as income tax expense in the Statement of Operations. During the period ended December 31, 2022, the fund did not incur any interest or penalties.
Each tax year in the four year period ended December 31, 2022 remains subject to examination by the Internal Revenue Service and state taxing authorities.
At December 31, 2022, the components of accumulated earnings on a tax basis were as follows: undistributed ordinary income $108,683 undistributed capital gains $10,027,481 and unrealized appreciation $12,572,635.
The tax character of distributions paid to shareholders during the fiscal years ended December 31, 2022 and December 31, 2021 were as follows: ordinary income $2,740,232 and $1,257,376, and long-term capital gains $16,636,055 and $6,100,278, respectively.
NOTE 2—Bank Lines of Credit:
The fund participates with other long-term open-end funds managed by the Adviser in a $823.5 million unsecured credit facility led by Citibank, N.A. (the “Citibank Credit Facility”) and a $300 million unsecured credit facility provided by BNY Mellon (the “BNYM Credit Facility”), each to be utilized primarily for temporary or emergency purposes, including the financing of redemptions (each, a “Facility”). The Citibank Credit Facility is available in two tranches: (i) Tranche A is in an amount equal to $688.5 million and is available to all long-term open-ended funds, including the fund, and (ii) Tranche B is an amount equal to $135 million and is available only to BNY Mellon Floating Rate Income Fund, a series of BNY Mellon Investment Funds IV, Inc. In connection therewith, the fund has agreed to pay its pro rata portion of commitment fees for Tranche A of the Citibank Credit Facility and the BNYM Credit Facility. Interest is charged to the
22
fund based on rates determined pursuant to the terms of the respective Facility at the time of borrowing. During the period ended December 31, 2022, the fund did not borrow under the Facilities.
NOTE 3—Management Fee, Sub-Advisory Fee and Other Transactions with Affiliates:
(a) Pursuant to an investment advisory agreement with the Adviser, the management fee is computed at the annual rate of .75% of the value of the fund’s average daily net assets and is payable monthly. The Adviser had contractually agreed, from January 1, 2022 through April 28, 2022, to waive receipt of its fees and/or assume the direct expenses of the fund so that the direct expenses of neither class of fund shares (excluding Rule 12b-1 Distribution Plan fees, taxes, interest expense, brokerage commissions, commitment fees on borrowings and extraordinary expenses) exceed .80% of the value of the fund’s average daily net assets. The Adviser has contractually agreed, from April 29, 2022 through April 29, 2023, to waive receipt of its fees and/or assume the direct expenses of the fund so that the direct expenses of neither class of fund shares (excluding expense describe above) exceed .70% of the value of the fund’s average daily net assets. On or after April 29, 2023, the Adviser may terminate this expense limitation agreement at any time. The reduction in expenses, pursuant to the undertaking, amounted to $166,628 during the period ended December 31, 2022.
Pursuant to a sub-investment advisory agreement between the Adviser and the Sub-Adviser, the Adviser pays the Sub-Adviser a monthly fee at an annual rate of .36% of the value of the fund’s average daily net assets.
(b) Under the Distribution Plan adopted pursuant to Rule 12b-1 under the Act, Service shares pay the Distributor for distributing its shares, for servicing and/or maintaining Service shares’ shareholder accounts and for advertising and marketing for Service shares. The Distribution Plan provides for payments to be made at an annual rate of .25% of the value of the Service shares’ average daily net assets. The Distributor may make payments to Participating Insurance Companies and to brokers and dealers acting as principal underwriter for their variable insurance products. The fees payable under the Distribution Plan are payable without regard to actual expenses incurred. During the period ended December 31, 2022, Service shares were charged $10,322 pursuant to the Distribution Plan.
The fund has an arrangement with BNY Mellon Transfer, Inc., (the “Transfer Agent”), a subsidiary of BNY Mellon and an affiliate of the Adviser, whereby the fund may receive earnings credits when positive cash balances are maintained, which are used to offset Transfer Agent fees. For
23
NOTES TO FINANCIAL STATEMENTS (continued)
financial reporting purposes, the fund includes transfer agent net earnings credits, if any, as an expense offset in the Statement of Operations.
The fund has an arrangement with The Bank of New York Mellon (the “Custodian”), a subsidiary of BNY Mellon and an affiliate of the Adviser, whereby the fund will receive interest income or be charged overdraft fees when cash balances are maintained. For financial reporting purposes, the fund includes this interest income and overdraft fees, if any, as interest income in the Statement of Operations.
The fund compensates the Transfer Agent, under a transfer agency agreement, for providing transfer agency and cash management services for the fund. The majority of Transfer Agent fees are comprised of amounts paid on a per account basis, while cash management fees are related to fund subscriptions and redemptions. During the period ended December 31, 2022, the fund was charged $707 for transfer agency services. These fees are included in Shareholder servicing costs in the Statement of Operations. These fees were partially offset by earnings credits of $60.
The fund compensates the Custodian, under a custody agreement, for providing custodial services for the fund. These fees are determined based on net assets, geographic region and transaction activity. During the period ended December 31, 2022, the fund was charged $9,446 pursuant to the custody agreement.
During the period ended December 31, 2022, the fund was charged $17,082 for services performed by the fund’s Chief Compliance Officer and his staff. These fees are included in Chief Compliance Officer fees in the Statement of Operations.
The components of “Due to BNY Mellon Investment Adviser, Inc. and affiliates” in the Statement of Assets and Liabilities consist of: management fee of $55,460, Distribution Plan fees of $839, Custodian fees of $5,254, Chief Compliance Officer fees of $4,082 and Transfer Agent fees of $101, which are offset against an expense reimbursement currently in effect in the amount of $13,335.
(c) Each board member also serves as a board member of other funds in the BNY Mellon Family of Funds complex. Annual retainer fees and attendance fees are allocated to each fund based on net assets.
NOTE 4—Securities Transactions:
The aggregate amount of purchases and sales of investment securities, excluding short-term securities, during the period ended December 31, 2022, amounted to $61,654,691 and $70,460,466, respectively.
24
At December 31, 2022, the cost of investments for federal income tax purposes was $73,386,717 accordingly, accumulated net unrealized appreciation on investments was $12,572,635, consisting of $19,477,183 gross unrealized appreciation and $6,904,548 gross unrealized depreciation.
25
REPORT OF INDEPENDENT REGISTERED PUBLIC ACCOUNTING FIRM
To the Shareholders and the Board of Trustees of Growth and Income Portfolio
Opinion on the Financial Statements
We have audited the accompanying statement of assets and liabilities of Growth and Income Portfolio (the “Fund”) (one of the funds constituting BNY Mellon Variable Investment Fund), including the statement of investments, as of December 31, 2022, and the related statement of operations for the year then ended, the statements of changes in net assets for each of the two years in the period then ended, the financial highlights for each of the five years in the period then ended and the related notes (collectively referred to as the “financial statements”). In our opinion, the financial statements present fairly, in all material respects, the financial position of the Fund (one of the funds constituting BNY Mellon Variable Investment Fund) at December 31, 2022, the results of its operations for the year then ended, the changes in its net assets for each of the two years in the period then ended and its financial highlights for each of the five years in the period then ended, in conformity with U.S. generally accepted accounting principles.
Basis for Opinion
These financial statements are the responsibility of the Fund’s management. Our responsibility is to express an opinion on the Fund’s financial statements based on our audits. We are a public accounting firm registered with the Public Company Accounting Oversight Board (United States) (“PCAOB”) and are required to be independent with respect to the Fund in accordance with the U.S. federal securities laws and the applicable rules and regulations of the Securities and Exchange Commission and the PCAOB.
We conducted our audits in accordance with the standards of the PCAOB. Those standards require that we plan and perform the audit to obtain reasonable assurance about whether the financial statements are free of material misstatement, whether due to error or fraud. The Fund is not required to have, nor were we engaged to perform, an audit of the Fund’s internal control over financial reporting. As part of our audits, we are required to obtain an understanding of internal control over financial reporting, but not for the purpose of expressing an opinion on the effectiveness of the Fund’s internal control over financial reporting. Accordingly, we express no such opinion.
Our audits included performing procedures to assess the risks of material misstatement of the financial statements, whether due to error or fraud, and performing procedures that respond to those risks. Such procedures included examining, on a test basis, evidence regarding the amounts and disclosures in the financial statements. Our procedures included confirmation of securities owned as of December 31, 2022, by correspondence with the custodian, brokers and others; when replies were not received from brokers and others, we performed other auditing procedures. Our audits also included evaluating the accounting principles used and significant estimates made by management, as well as evaluating the overall presentation of the financial statements. We believe that our audits provide a reasonable basis for our opinion.

We have served as the auditor of one or more investment companies in the BNY Mellon Family of Funds since at least 1957, but we are unable to determine the specific year.
New York, New York
February 9, 2023
26
IMPORTANT TAX INFORMATION (Unaudited)
For federal tax purposes, the fund hereby reports 58.95% of the ordinary dividends paid during the fiscal year ended December 31, 2022 as qualifying for the corporate dividends received deduction. Shareholders will receive notification in early 2023 of the percentage applicable to the preparation of their 2022 income tax returns. Also, the fund hereby reports $6.4582 per share as a long-term capital gain distribution and $.7842 per share as a short-term capital gain distribution paid on March 31, 2022.
27
BOARD MEMBERS INFORMATION (Unaudited)
Independent Board Members
Joseph S. DiMartino (79)
Chairman of the Board (1995)
Principal Occupation During Past 5 Years:
· Director or Trustee of funds in the BNY Mellon Family of Funds and certain other entities (as described in the fund’s Statement of Additional Information) (1995-Present)
Other Public Company Board Memberships During Past 5 Years:
· CBIZ, Inc., a public company providing professional business services, products and solutions, Director (1997-Present)
No. of Portfolios for which Board Member Serves: 92
———————
Peggy C. Davis (79)
Board Member (2006)
Principal Occupation During Past 5 Years:
· Shad Professor of Law, New York University School of Law (1983-Present)
No. of Portfolios for which Board Member Serves: 32
———————
Gina D. France (64)
Board Member (2019)
Principal Occupation During Past 5 Years:
· France Strategic Partners, a strategy and advisory firm serving corporate clients across the United States, Founder, President and Chief Executive Officer (2003-Present)
Other Public Company Board Memberships During Past 5 Years:
· Huntington Bancshares, a bank holding company headquartered in Columbus, Ohio, Director (2016-Present)
· Cedar Fair, L.P., a publicly-traded partnership that owns and operates amusement parks and hotels in the U.S. and Canada, Director (2011-Present)
· CBIZ, Inc., a public company providing professional business services, products and solutions, Director (2015-Present)
· FirstMerit Corporation, a diversified financial services company, Director (2004-2016)
No. of Portfolios for which Board Member Serves: 22
———————
28
Joan Gulley (75)
Board Member (2017)
Principal Occupation During Past 5 Years:
· Nantucket Atheneum, public library, Chair (2018-June 2021) and Director (2015-June 2021)
· Orchard Island Club, golf and beach club, Governor (2016-Present)
No. of Portfolios for which Board Member Serves: 39
———————
Robin A. Melvin (59)
Board Member (2012)
Principal Occupation During Past 5 Years:
· Westover School, a private girls’ boarding school in Middlebury, Connecticut, Trustee (2019-Present)
· Mentor Illinois, a non-profit organization dedicated to increasing the quality of mentoring services in Illinois, Co-Chair (2014–2020); Board Member, Mentor Illinois (2013-2020)
· JDRF, a non-profit juvenile diabetes research foundation, Board Member (June 2021-June 2022)
Other Public Company Board Memberships During Past 5 Years:
· HPS Corporate Lending Fund, a closed-end management investment company regulated as a business development company, Trustee (August 2021-Present)
No. of Portfolios for which Board Member Serves: 71
———————
Michael D. DiLecce (60)
Advisory Board Member (2022)
Principal Occupation During Past 5 Years:
· Retired since July 2022. Global Asset Management Assurance Leader, Ernst & Young LLP (2015-2022)
· Americas Regional Talent Managing Partner for Ernst & Young’s Financial Service Practice (2017-2021)
· Partner, Ernst & Young LLP (1997-2022)
No. of Portfolios for which Board Member Serves: 22
———————
The address of the Board Members and Officers is c/o BNY Mellon Investment Adviser, Inc., 240 Greenwich Street, New York, New York 10286. Additional information about each Board Member is available in the fund’s Statement of Additional Information which can be obtained from the Adviser free of charge by calling this toll free number: 1-800-373-9387.
29
OFFICERS OF THE FUND (Unaudited)
DAVID DIPETRILLO, President since January 2021.
Vice President and Director of the Adviser since February 2021; Head of North America Product, BNY Mellon Investment Management since January 2018; and Director of Product Strategy, BNY Mellon Investment Management from January 2016 to December 2017. He is an officer of 54 investment companies (comprised of 107 portfolios) managed by the Adviser or an affiliate of the Adviser. He is 44 years old and has been an employee of BNY Mellon since 2005.
JAMES WINDELS, Treasurer since November 2001.
Vice President of the Adviser since September 2020; and Director–BNY Mellon Fund Administration. He is an officer of 55 investment companies (comprised of 127 portfolios) managed by the Adviser or an affiliate of the Adviser. He is 64 years old and has been an employee of the Adviser since April 1985.
PETER M. SULLIVAN, Chief Legal Officer since July 2021 and Vice President and Assistant Secretary since March 2019.
Chief Legal Officer of the Adviser and Associate General Counsel of BNY Mellon since July 2021; Senior Managing Counsel of BNY Mellon from December 2020 to July 2021; and Managing Counsel of BNY Mellon from March 2009 to December 2020. He is an officer of 55 investment companies (comprised of 127 portfolios) managed by the Adviser or an affiliate of the Adviser. He is 54 years old and has been an employee of BNY Mellon since April 2004.
JAMES BITETTO, Vice President since August 2005 and Secretary since February 2018.
Senior Managing Counsel of BNY Mellon since December 2019; Managing Counsel of BNY Mellon from April 2014 to December 2019; and Secretary of the Adviser. He is an officer of 55 investment companies (comprised of 127 portfolios) managed by the Adviser or an affiliate of the Adviser. He is 56 years old and has been an employee of the Adviser since December 1996.
DEIRDRE CUNNANE, Vice President and Assistant Secretary since March 2019.
Managing Counsel of BNY Mellon since December 2021, Counsel of BNY Mellon from August 2018 to December 2021; and Senior Regulatory Specialist at BNY Mellon Investment Management Services from February 2016 to August 2018. She is an officer of 55 investment companies (comprised of 127 portfolios) managed by the Adviser or an affiliate of the Adviser. She is 32 years old and has been an employee of the Adviser since August 2018.
SARAH S. KELLEHER, Vice President and Assistant Secretary since April 2014.
Vice President of BNY Mellon ETF Investment Adviser; LLC since February 2020; Senior Managing Counsel of BNY Mellon since September 2021; Managing Counsel of BNY Mellon from December 2017 to September 2021; and Senior Counsel of BNY Mellon from March 2013 to December 2017. She is an officer of 55 investment companies (comprised of 127 portfolios) managed by the Adviser or an affiliate of the Adviser. She is 47 years old and has been an employee of the Adviser since March 2013.
JEFF PRUSNOFSKY, Vice President and Assistant Secretary since August 2005.
Senior Managing Counsel of BNY Mellon. He is an officer of 55 investment companies (comprised of 127 portfolios) managed by the Adviser or an affiliate of the Adviser. He is 57 years old and has been an employee of the Adviser since October 1990.
AMANDA QUINN, Vice President and Assistant Secretary since March 2020.
Counsel of BNY Mellon since June 2019; Regulatory Administration Manager at BNY Mellon Investment Management Services from September 2018 to May 2019; and Senior Regulatory Specialist at BNY Mellon Investment Management Services from April 2015 to August 2018. She is an officer of 55 investment companies (comprised of 127 portfolios) managed by the Adviser or an affiliate of the Adviser. She is 37 years old and has been an employee of the Adviser since June 2019.
30
NATALYA ZELENSKY, Vice President and Assistant Secretary since March 2017.
Chief Compliance Officer since August 2021 and Vice President since February 2020 of BNY Mellon ETF Investment Adviser, LLC; Chief Compliance Officer since August 2021 and Vice President and Assistant Secretary since February 2020 of BNY Mellon ETF Trust; Managing Counsel of BNY Mellon from December 2019 to August 2021; Counsel of BNY Mellon from May 2016 to December 2019; and Assistant Secretary of the Adviser from April 2018 to August 2021. She is an officer of 55 investment companies (comprised of 127 portfolios) managed by the Adviser or an affiliate of the Adviser. She is 37 years old and has been an employee of BNY Mellon since May 2016.
DANIEL GOLDSTEIN, Vice President since March 2022.
Vice President and Head of Product Development of North America Product, BNY Mellon Investment Management since January 2018; Co-Head of Product Management, Development & Oversight of North America Product, BNY Mellon Investment Management from January 2010 to January 2018; and Senior Vice President, Development & Oversight of North America Product, BNY Mellon Investment Management since 2010. He is an officer of 54 investment companies (comprised of 107 portfolios) managed by the Adviser or an affiliate of the Adviser. He is 53 years old and has been an employee of the Distributor since 1991.
JOSEPH MARTELLA, Vice President since March 2022.
Vice President of the Adviser since December 2022, Head of Product Management of North America Product, BNY Mellon Investment Management since January 2018; Director of Product Research and Analytics of North America Product, BNY Mellon Investment Management from January 2010 to January 2018; and Senior Vice President of North America Product, BNY Mellon Investment Management since 2010. He is an officer of 54 investment companies (comprised of 107 portfolios) managed by the Adviser or an affiliate of the Adviser. He is 46 years old and has been an employee of the Distributor since 1999.
GAVIN C. REILLY, Assistant Treasurer since December 2005.
Tax Manager–BNY Mellon Fund Administration. He is an officer of 55 investment companies (comprised of 127 portfolios) managed by the Adviser or an affiliate of the Adviser. He is 54 years old and has been an employee of the Adviser since April 1991.
ROBERT SALVIOLO, Assistant Treasurer since July 2007.
Senior Accounting Manager–BNY Mellon Fund Administration. He is an officer of 55 investment companies (comprised of 127 portfolios) managed by the Adviser or an affiliate of the Adviser. He is 55 years old and has been an employee of the Adviser since June 1989.
ROBERT SVAGNA, Assistant Treasurer since December 2002.
Senior Accounting Manager–BNY Mellon Fund Administration. He is an officer of 55 investment companies (comprised of 127 portfolios) managed by the Adviser or an affiliate of the Adviser. He is 55 years old and has been an employee of the Adviser since November 1990.
JOSEPH W. CONNOLLY, Chief Compliance Officer since October 2004.
Chief Compliance Officer of the BNY Mellon Family of Funds and BNY Mellon Funds Trust since 2004; and Chief Compliance Officer of the Adviser from 2004 until June 2021. He is the Chief Compliance Officer of 54 investment companies (comprised of 112 portfolios) managed by the Adviser. He is 65 years old.
CARIDAD M. CAROSELLA, Anti-Money Laundering Compliance Officer since January 2016.
Anti-Money Laundering Compliance Officer of the BNY Mellon Family of Funds and BNY Mellon Funds Trust. She is an officer of 48 investment companies (comprised of 120 portfolios) managed by the Adviser or an affiliate of the Adviser. She is 54 years old and has been an employee of the Distributor since 1997.
31
This page intentionally left blank.
32
This page intentionally left blank.
33
BNY Mellon Variable Investment Fund, Growth and Income Portfolio
240 Greenwich Street
New York, NY 10286
Adviser
BNY Mellon Investment Adviser, Inc.
240 Greenwich Street
New York, NY 10286
Sub-Adviser
Newton Investment Management
North America, LLC
BNY Mellon Center
201 Washington Street
Boston, MA 02108
Custodian
The Bank of New York Mellon
240 Greenwich Street
New York, NY 10286
Transfer Agent &
Dividend Disbursing Agent
BNY Mellon Transfer, Inc.
240 Greenwich Street
New York, NY 10286
Distributor
BNY Mellon Securities Corporation
240 Greenwich Street
New York, NY 10286
Telephone 1-800-258-4260 or 1-800-258-4261
Mail The BNY Mellon Family of Funds, 144 Glenn Curtiss Boulevard, Uniondale, NY 11556-0144 Attn: Institutional Services Department
E-mail Send your request to info@bnymellon.com
Internet Information can be viewed online or downloaded at www.im.bnymellon.com
The fund files its complete schedule of portfolio holdings with the Securities and Exchange Commission (“SEC”) for the first and third quarters of each fiscal year on Form N-PORT. The fund’s Forms N-PORT are available on the SEC’s website at www.sec.gov.
A description of the policies and procedures that the fund uses to determine how to vote proxies relating to portfolio securities and information regarding how the fund voted these proxies for the most recent 12-month period ended June 30 is available at www.im.bnymellon.com and on the SEC’s website at www.sec.gov and without charge, upon request, by calling 1-800-373-9387.
| | |
© 2023 BNY Mellon Securities Corporation
0108AR1222 | 
|
BNY Mellon Variable Investment Fund, Opportunistic Small Cap Portfolio
| |
ANNUAL REPORT December 31, 2022 |

| |
Save time. Save paper. View your next shareholder report online as soon as it’s available. Log into www.im.bnymellon.com and sign up for eCommunications. It’s simple and only takes a few minutes. |
| |
The views expressed in this report reflect those of the portfolio manager(s) only through the end of the period covered and do not necessarily represent the views of BNY Mellon Investment Adviser, Inc. or any other person in the BNY Mellon Investment Adviser, Inc. organization. Any such views are subject to change at any time based upon market or other conditions and BNY Mellon Investment Adviser, Inc. disclaims any responsibility to update such views. These views may not be relied on as investment advice and, because investment decisions for a fund in the BNY Mellon Family of Funds are based on numerous factors, may not be relied on as an indication of trading intent on behalf of any fund in the BNY Mellon Family of Funds. |
| |
Not FDIC-Insured • Not Bank-Guaranteed • May Lose Value |
Contents
THE FUND
FOR MORE INFORMATION
Back Cover
DISCUSSION OF FUND PERFORMANCE (Unaudited)
For the period from January 1, 2022, through December 31, 2022, as provided by Patrick Kent and Andrew Leger, Portfolio Managers of Newton Investment Management North America, LLC, sub-adviser.
Market and Fund Performance Overview
For the 12-month period ended December 31, 2022, BNY Mellon Variable Investment Fund, Opportunistic Small Cap Portfolio’s (the “fund”) Initial shares produced a total return of −16.62%, and its Service shares produced a total return of −16.83%.1 In comparison, the Russell 2000® Index (the “Index”), the fund’s benchmark, produced a total return of −20.44% for the same period.2
Small-cap stocks declined over the reporting period, as high inflation and rising interest rates weighed on returns. The fund outperformed the Index, mainly due to stock selection decisions.
The Fund’s Investment Approach
The fund seeks capital growth. To pursue its goal, the fund normally invests at least 80% of its net assets, plus any borrowings for investment purposes, in the stocks of small-cap companies. The fund currently considers small-cap companies to be those companies with market capitalizations that fall within the range of the companies in the Index. Stocks are selected for the fund’s portfolio based primarily on bottom-up, fundamental analysis. The fund’s portfolio managers use a disciplined investment process that relies, in general, on proprietary fundamental research and valuation.
Generally, elements of the process include analysis of mid-cycle business prospects, estimation of the intrinsic value of the company and the identification of a revaluation trigger catalyst. In general, the fund seeks exposure to securities and sectors that are perceived to be attractive from a valuation and fundamental standpoint.
Inflation, Monetary Policy and Possible Economic Slowdown Weigh on Markets
The reporting period was defined by a significant shift from positive to negative investor sentiment. This was initially driven by high inflation, dramatically tightening monetary policy from the Federal Reserve (the “Fed”) and the Russia-Ukraine War. Later in the period, the possibility of an economic slowdown and negative earnings revisions weighed on markets, though investors also increasingly looked ahead to a potential easing in the Fed’s tightening policy.
As 2022 progressed, inflation data and central bank monetary tightening policies dominated the market narrative. Slower growth prospects, supply-chain concerns and expectations that interest rates would be higher for a longer period negatively impacted stock valuations. Across Europe, a broad monetary tightening effort by the Bank of England and the European Central Bank was implemented. In the EU, high inflation readings dampened the growth outlook, while soaring energy prices became a focus for European policymakers.
In contrast to monetary normalization and reopening trends worldwide, China continued to implement more accommodative monetary policies to address lackluster economic growth
2
stemming from a weak macroeconomic environment and strict COVID-19 lockdown policies.
Geopolitical forces also weighed on markets. In addition to the war in Ukraine, China’s “Zero-COVID” policies added uncertainty to the global economic landscape.
As the reporting period progressed, markets responded in rollercoaster fashion to tightening monetary policy, mixed economic data and geopolitical uncertainties. Midway through the year, the market appeared to reach a bottom and began to rebound before descending again. Late in the period, markets largely rebounded as inflation began to abate, and investors began to consider the possibility of a shift in Fed tightening policy.
Security Selection Decisions Benefited Performance
The fund’s performance versus the Index was primarily the result of stock selection decisions. Selections in the health care, industrials and energy sectors were the leading positive contributors. In the health care sector, shares of Alkermes PLC, a biotech firm that makes treatments for addiction and schizophrenia, performed well with the introduction of a new schizophrenia drug. The company also announced it would spin off its oncology unit, and it won a lawsuit against Johnson & Johnson regarding a royalty stream. Xenon Pharmaceuticals Inc., a biotechnology company, also contributed as it performed well with a successful result on a drug trial. Shares of Transmedics Group Inc., which provides organ transplant transportation services, also contributed. In the industrial sector, the fund’s position in Fluor Corp., an engineering and construction firm, performed well as the company reported an improving outlook. A position in Maxar Technologies Inc., a space technology firm, also contributed when the company was bought out at a significant premium. In the energy sector, shares of PBF Energy Inc., an oil refiner, contributed positively to relative returns as well. Higher oil prices and wider refining margins resulted in strong returns. Certain allocation decisions were also a boost to the fund’s performance. An overweight to the utilities sector added to returns, as did an underweight to real estate. The fund’s relatively large cash position also helped cushion performance as the market declined.
On a less positive note, positions in the consumer discretionary, consumer staples and information technology sectors detracted. In consumer discretionary, shares of Party City Holdco Inc., a retailer, were hurt by the effects of the pandemic and also by its heavy debt load. In the consumer staples sector, a position in Spectrum Brands Holdings Inc., was hurt as the company’s attempt to sell off its home improvement unit was challenged by the Federal Trade Commission. In the information technology sector, the fund’s position in Zuora Inc., a software firm that makes applications to help companies manage their software subscriptions, also was hurt by the sell-off in technology. Shares of Edgio Inc., a content delivery network, also detracted. An acquisition weighed on shares when the new unit lost a key customer. In the health care sector, the fund’s position in Health Catalyst Inc., an information technology company that serves the health care companies, was hindered by cost-cutting measures in the hospital segment.
Outlook Uncertain, Valuations Attractive
A number of factors are combining to add uncertainty to the outlook. High inflation and slowing economic growth could lead to an earnings recession, and stocks may also be hindered by less stimulative monetary and fiscal policy. On a more positive note, earnings
3
DISCUSSION OF FUND PERFORMANCE (Unaudited) (continued)
may benefit from a likely weakening in the U.S. dollar. In addition, valuations among small-cap stocks are more attractive than those on large caps.
January 17, 2023
¹ Total return includes reinvestment of dividends and any capital gains paid. Past performance is no guarantee of future results. Share price and investment return fluctuate such that upon redemption, fund shares may be worth more or less than their original cost. The fund’s performance does not reflect the deduction of additional charges and expenses imposed in connection with investing in variable insurance contracts, which will reduce returns.
² Source: Lipper Inc. — The Russell 2000® Index measures the performance of the small-cap segment of the U.S. equity universe. The Russell 2000® Index is a subset of the Russell 3000® Index, representing approximately 10% of the total market capitalization of that index. It includes approximately 2,000 of the smallest securities based on a combination of their market cap and current index membership. The Russell 2000® is constructed to provide a comprehensive and unbiased, small-cap barometer and is completely reconstituted annually to ensure larger stocks do not distort the performance and characteristics of the true, small-cap opportunity set. Investors cannot invest directly in any index.
Please note: the position in any security highlighted with italicized typeface was sold during the reporting period.
Equities are subject generally to market, market sector, market liquidity, issuer and investment style risks, among other factors, to varying degrees, all of which are more fully described in the fund’s prospectus.
Stocks of small- and/or mid-cap companies often experience sharper price fluctuations than stocks of large-cap companies.
The fund is only available as a funding vehicle under variable life insurance policies or variable annuity contracts issued by insurance companies. Individuals may not purchase shares of the fund directly. A variable annuity is an insurance contract issued by an insurance company that enables investors to accumulate assets on a tax-deferred basis for retirement or other long-term goals. The investment objective and policies of BNY Mellon Variable Investment Fund, Opportunistic Small Cap Portfolio made available through insurance products may be similar to those of other funds managed or advised by BNY Mellon Investment Adviser, Inc. However, the investment results of the fund may be higher or lower than, and may not be comparable to, those of any other BNY Mellon fund.
Recent market risks include pandemic risks related to COVID-19. The effects of COVID-19 have contributed to increased volatility in global markets and will likely affect certain countries, companies, industries and market sectors more dramatically than others. To the extent the fund may overweight its investments in certain countries, companies, industries or market sectors, such positions will increase the fund’s exposure to risk of loss from adverse developments affecting those countries, companies, industries or sectors.
4
FUND PERFORMANCE (Unaudited)

Comparison of change in value of a $10,000 investment in Initial shares and Service shares of BNY Mellon Variable Investment Fund, Opportunistic Small Cap Portfolio with a hypothetical investment of $10,000 in the Russell 2000® Index (the “Index”).
† Source: Lipper Inc.
Past performance is not predictive of future performance. The fund’s performance does not reflect the deduction of additional charges and expenses imposed in connection with investing in variable insurance contracts which will reduce returns.
The above graph compares a hypothetical investment of $10,000 made in Initial and Service shares of BNY Mellon Variable Investment Fund, Opportunistic Small Cap Portfolio on 12/31/12 to a hypothetical investment of $10,000 made in the Index on that date.
The fund’s performance shown in the line graph above takes into account all applicable fees and expenses. The Index measures the performance of the small-cap segment of the U.S. equity universe. The Index is a subset of the Russell 3000® Index representing approximately 10% of the total market capitalization of that index. It includes approximately 2,000 of the smallest securities based on a combination of their market cap and current index membership. The Index is constructed to provide a comprehensive and unbiased small-cap barometer and is completely reconstituted annually to ensure larger stocks do not distort the performance and characteristics of the true small-cap opportunity set. Unlike a mutual fund, the Index is not subject to charges, fees and other expenses. Investors cannot invest directly in any index. Further information relating to fund performance, including expense reimbursements, if applicable, is contained in the Financial Highlights section of the prospectus and elsewhere in this report.
5
FUND PERFORMANCE (Unaudited) (continued)
| | | | |
Average Annual Total Returns as of 12/31/2022 |
| 1 Year | 5 Years | 10 Years |
Initial shares | -16.62% | 2.79% | 9.46% |
Service shares | -16.83% | 2.53% | 9.19% |
Russell 2000® Index | -20.44% | 4.13% | 9.01% |
The performance data quoted represents past performance, which is no guarantee of future results. Share price and investment return fluctuate and an investor’s shares may be worth more or less than original cost upon redemption. Current performance may be lower or higher than the performance quoted. Go to www.im.bnymellon.com for the fund’s most recent month-end returns.
The fund’s Initial shares are not subject to a Rule 12b-1 fee. The fund’s Service shares are subject to a 0.25% annual Rule 12b-1 fee. All dividends and capital gain distributions are reinvested.
The fund’s performance shown in the graph and table does not reflect the deduction of taxes that a shareholder would pay on fund distributions or the redemption of fund shares.
6
UNDERSTANDING YOUR FUND’S EXPENSES (Unaudited)
As a mutual fund investor, you pay ongoing expenses, such as management fees and other expenses. Using the information below, you can estimate how these expenses affect your investment and compare them with the expenses of other funds. You also may pay one-time transaction expenses, including sales charges (loads), redemption fees and expenses associated with variable annuity or insurance contracts, which are not shown in this section and would have resulted in higher total expenses. For more information, see your fund’s prospectus or talk to your financial adviser.
Review your fund’s expenses
The table below shows the expenses you would have paid on a $1,000 investment in BNY Mellon Variable Investment Fund, Opportunistic Small Cap Portfolio from July 1, 2022 to December 31, 2022. It also shows how much a $1,000 investment would be worth at the close of the period, assuming actual returns and expenses.
| | | | | |
Expenses and Value of a $1,000 Investment | |
Assume actual returns for the six months ended December 31, 2022 | |
| | | | |
| | Initial Shares | Service Shares | |
Expenses paid per $1,000† | $4.16 | $5.45 | |
Ending value (after expenses) | $1,039.60 | $1,038.40 | |
COMPARING YOUR FUND’S EXPENSES WITH THOSE OF OTHER FUNDS (Unaudited)
Using the SEC’s method to compare expenses
The Securities and Exchange Commission (“SEC”) has established guidelines to help investors assess fund expenses. Per these guidelines, the table below shows your fund’s expenses based on a $1,000 investment, assuming a hypothetical 5% annualized return. You can use this information to compare the ongoing expenses (but not transaction expenses or total cost) of investing in the fund with those of other funds. All mutual fund shareholder reports will provide this information to help you make this comparison. Please note that you cannot use this information to estimate your actual ending account balance and expenses paid during the period.
| | | | | |
Expenses and Value of a $1,000 Investment | |
Assuming a hypothetical 5% annualized return for the six months ended December 31, 2022 | |
| | | | |
| | Initial Shares | Service Shares | |
Expenses paid per $1,000† | $4.13 | $5.40 | |
Ending value (after expenses) | $1,021.12 | $1,019.86 | |
† | Expenses are equal to the fund’s annualized expense ratio of .81% for Initial Shares and 1.06% for Service Shares, multiplied by the average account value over the period, multiplied by 184/365 (to reflect the one-half year period). |
7
STATEMENT OF INVESTMENTS
December 31, 2022
| | | | | | | | |
| |
Description | | | | Shares | | Value ($) | |
Common Stocks - 94.2% | | | | | |
Automobiles & Components - 1.0% | | | | | |
Stoneridge Inc. | | | | 119,092 | a | 2,567,624 | |
Banks - 10.5% | | | | | |
BankUnited Inc. | | | | 136,634 | | 4,641,457 | |
Essent Group Ltd. | | | | 104,804 | | 4,074,780 | |
First Bancorp/Puerto Rico | | | | 454,578 | | 5,782,232 | |
First Interstate BancSystem Inc., Cl. A | | | | 92,477 | | 3,574,236 | |
First Merchants Corp. | | | | 80,386 | | 3,304,669 | |
Synovus Financial Corp. | | | | 108,847 | | 4,087,205 | |
Texas Capital Bancshares Inc. | | | | 47,720 | a | 2,877,993 | |
| | | | | 28,342,572 | |
Capital Goods - 11.0% | | | | | |
EnerSys | | | | 42,898 | | 3,167,588 | |
Flowserve Corp. | | | | 69,422 | | 2,129,867 | |
Fluor Corp. | | | | 268,696 | a,b | 9,313,003 | |
Matrix Service Co. | | | | 306,052 | a | 1,903,644 | |
Maxar Technologies Inc. | | | | 109,031 | | 5,641,264 | |
Terex Corp. | | | | 56,125 | | 2,397,660 | |
Titan Machinery Inc. | | | | 80,901 | a | 3,214,197 | |
Wabash National Corp. | | | | 88,452 | | 1,999,015 | |
| | | | | 29,766,238 | |
Commercial & Professional Services - .9% | | | | | |
The Brink's Company | | | | 46,036 | | 2,472,594 | |
Consumer Durables & Apparel - 3.1% | | | | | |
Allbirds Inc., Cl. A | | | | 387,742 | a | 938,336 | |
GoPro Inc., Cl. A | | | | 539,230 | a | 2,685,365 | |
Topgolf Callaway Brands Corp. | | | | 236,407 | a | 4,669,038 | |
| | | | | 8,292,739 | |
Consumer Services - 4.4% | | | | | |
Bloomin' Brands Inc. | | | | 198,003 | | 3,983,820 | |
Genius Sports Ltd. | | | | 745,296 | a | 2,660,707 | |
Papa John's International Inc. | | | | 31,662 | b | 2,606,099 | |
Six Flags Entertainment Corp. | | | | 111,402 | a,b | 2,590,097 | |
| | | | | 11,840,723 | |
Diversified Financials - 1.6% | | | | | |
PJT Partners Inc., Cl. A | | | | 57,743 | | 4,255,082 | |
Energy - 6.8% | | | | | |
CNX Resources Corp. | | | | 284,210 | a,b | 4,786,096 | |
Dril-Quip Inc. | | | | 125,229 | a | 3,402,472 | |
PBF Energy Inc., Cl. A | | | | 114,262 | | 4,659,604 | |
Viper Energy Partners LP | | | | 175,707 | | 5,585,726 | |
| | | | | 18,433,898 | |
8
| | | | | | | | |
| |
Description | | | | Shares | | Value ($) | |
Common Stocks - 94.2% (continued) | | | | | |
Food & Staples Retailing - 1.8% | | | | | |
The Chefs' Warehouse Inc. | | | | 143,012 | a | 4,759,439 | |
Health Care Equipment & Services - 11.5% | | | | | |
Acadia Healthcare Co. | | | | 60,146 | a | 4,951,219 | |
Amedisys Inc. | | | | 25,547 | a | 2,134,196 | |
Merit Medical Systems Inc. | | | | 26,041 | a | 1,839,015 | |
ModivCare Inc. | | | | 34,673 | a | 3,111,208 | |
NuVasive Inc. | | | | 57,304 | a | 2,363,217 | |
Privia Health Group Inc. | | | | 221,220 | a | 5,023,906 | |
R1 RCM Inc. | | | | 267,005 | a,b | 2,923,705 | |
Select Medical Holdings Corp. | | | | 164,986 | | 4,096,602 | |
TransMedics Group Inc. | | | | 75,573 | a | 4,664,366 | |
| | | | | 31,107,434 | |
Household & Personal Products - 1.6% | | | | | |
Spectrum Brands Holdings Inc. | | | | 71,416 | | 4,350,663 | |
Insurance - 2.6% | | | | | |
BRP Group Inc., Cl. A | | | | 132,873 | a,b | 3,340,427 | |
The Hanover Insurance Group Inc. | | | | 28,264 | | 3,819,314 | |
| | | | | 7,159,741 | |
Materials - 4.3% | | | | | |
Alamos Gold Inc., Cl. A | | | | 852,718 | | 8,620,979 | |
Largo Inc. | | | | 275,901 | a | 1,484,347 | |
Tronox Holdings PLC | | | | 119,262 | | 1,635,082 | |
| | | | | 11,740,408 | |
Media & Entertainment - 2.3% | | | | | |
Eventbrite Inc., Cl. A | | | | 387,469 | a | 2,270,568 | |
Magnite Inc. | | | | 385,530 | a | 4,082,763 | |
| | | | | 6,353,331 | |
Pharmaceuticals Biotechnology & Life Sciences - 4.5% | | | | | |
Alkermes PLC | | | | 241,991 | a | 6,323,225 | |
Denali Therapeutics Inc. | | | | 129,794 | a | 3,609,571 | |
Xenon Pharmaceuticals Inc. | | | | 57,629 | a | 2,272,312 | |
| | | | | 12,205,108 | |
Real Estate - 1.2% | | | | | |
Colliers International Group Inc. | | | | 34,481 | b | 3,173,631 | |
Retailing - 3.0% | | | | | |
Designer Brands Inc., Cl. A | | | | 203,430 | b | 1,989,545 | |
Ollie's Bargain Outlet Holdings Inc. | | | | 88,294 | a | 4,135,691 | |
Petco Health & Wellness Co. | | | | 199,690 | a | 1,893,061 | |
| | | | | 8,018,297 | |
Semiconductors & Semiconductor Equipment - 1.2% | | | | | |
MaxLinear Inc. | | | | 94,513 | a | 3,208,716 | |
Software & Services - 7.0% | | | | | |
DigitalOcean Holdings Inc. | | | | 50,246 | a,b | 1,279,766 | |
9
STATEMENT OF INVESTMENTS (continued)
| | | | | | | | |
| |
Description | | | | Shares | | Value ($) | |
Common Stocks - 94.2% (continued) | | | | | |
Software & Services - 7.0% (continued) | | | | | |
DoubleVerify Holdings Inc. | | | | 136,268 | a | 2,992,445 | |
Edgio Inc. | | | | 1,318,233 | a | 1,489,603 | |
JFrog Ltd. | | | | 153,598 | a | 3,276,245 | |
Paya Holdings Inc. | | | | 958,387 | a | 7,542,506 | |
Zuora Inc., Cl. A | | | | 373,019 | a | 2,372,401 | |
| | | | | 18,952,966 | |
Technology Hardware & Equipment - 6.8% | | | | | |
ADTRAN Holdings Inc. | | | | 277,228 | b | 5,209,114 | |
Arlo Technologies Inc. | | | | 385,186 | a | 1,352,003 | |
Extreme Networks Inc. | | | | 415,170 | a | 7,601,763 | |
Itron Inc. | | | | 79,355 | a,b | 4,019,331 | |
Ondas Holdings Inc. | | | | 93,380 | a,b | 148,474 | |
| | | | | 18,330,685 | |
Transportation - 1.0% | | | | | |
SkyWest Inc. | | | | 163,691 | a,b | 2,702,538 | |
Utilities - 6.1% | | | | | |
Atlantica Sustainable Infrastructure PLC | | | | 60,940 | b | 1,578,346 | |
Clearway Energy Inc., Cl. C | | | | 215,373 | b | 6,863,938 | |
NextEra Energy Partners LP | | | | 116,408 | b | 8,159,037 | |
| | | | | 16,601,321 | |
Total Common Stocks (cost $257,065,175) | | | | 254,635,748 | |
| | | | | | | | |
Exchange-Traded Funds - 2.0% | | | | | |
Registered Investment Companies - 2.0% | | | | | |
iShares Russell 2000 ETF
(cost $6,033,811) | | | | 31,752 | b | 5,536,279 | |
| | | 1-Day
Yield (%) | | | | | |
Investment Companies - 3.9% | | | | | |
Registered Investment Companies - 3.9% | | | | | |
Dreyfus Institutional Preferred Government Plus Money Market Fund, Institutional Shares
(cost $10,424,843) | | 4.37 | | 10,424,843 | c | 10,424,843 | |
10
| | | | | | | | |
| |
Description | | 1-Day
Yield (%) | | Shares | | Value ($) | |
Investment of Cash Collateral for Securities Loaned - 2.5% | | | | | |
Registered Investment Companies - 2.5% | | | | | |
Dreyfus Institutional Preferred Government Plus Money Market Fund, SL Shares
(cost $6,871,403) | | 4.37 | | 6,871,403 | c | 6,871,403 | |
Total Investments (cost $280,395,232) | | 102.6% | | 277,468,273 | |
Liabilities, Less Cash and Receivables | | (2.6%) | | (7,006,612) | |
Net Assets | | 100.0% | | 270,461,661 | |
ETF—Exchange-Traded Fund
a Non-income producing security.
b Security, or portion thereof, on loan. At December 31, 2022, the value of the fund’s securities on loan was $38,114,939 and the value of the collateral was $38,997,430, consisting of cash collateral of $6,871,403 and U.S. Government & Agency securities valued at $32,126,027. In addition, the value of collateral may include pending sales that are also on loan.
c Investment in affiliated issuer. The investment objective of this investment company is publicly available and can be found within the investment company’s prospectus.
| | |
Portfolio Summary (Unaudited) † | Value (%) |
Health Care | 16.0 |
Information Technology | 15.0 |
Financials | 14.7 |
Industrials | 12.9 |
Consumer Discretionary | 11.4 |
Investment Companies | 8.4 |
Energy | 6.8 |
Utilities | 6.1 |
Materials | 4.3 |
Consumer Staples | 3.4 |
Communication Services | 2.4 |
Real Estate | 1.2 |
| | 102.6 |
† Based on net assets.
See notes to financial statements.
11
STATEMENT OF INVESTMENTS (continued)
| | | | | | | |
Affiliated Issuers | | | |
Description | Value ($) 12/31/2021 | Purchases ($)† | Sales ($) | Value ($) 12/31/2022 | Dividends/
Distributions ($) | |
Registered Investment Companies - 3.9% | | |
Dreyfus Institutional Preferred Government Plus Money Market Fund, Institutional Shares - 3.9% | 7,865,339 | 61,765,571 | (59,206,067) | 10,424,843 | 143,628 | |
Investment of Cash Collateral for Securities Loaned - 2.5% | | |
Dreyfus Institutional Preferred Government Plus Money Market Fund, SL Shares - 2.5% | 16,400,206 | 123,100,599 | (132,629,402) | 6,871,403 | 56,958 | †† |
Total - 6.4% | 24,265,545 | 184,866,170 | (191,835,469) | 17,296,246 | 200,586 | |
† Includes reinvested dividends/distributions.
†† Represents securities lending income earned from the reinvestment of cash collateral from loaned securities, net of fees and collateral investment expenses, and other payments to and from borrowers of securities.
See notes to financial statements.
12
STATEMENT OF ASSETS AND LIABILITIES
December 31, 2022
| | | | | | | |
| | | | | | |
| | | Cost | | Value | |
Assets ($): | | | | |
Investments in securities—See Statement of Investments
(including securities on loan, valued at $38,114,939)—Note 1(c): | | | |
Unaffiliated issuers | 263,098,986 | | 260,172,027 | |
Affiliated issuers | | 17,296,246 | | 17,296,246 | |
Dividends and securities lending income receivable | | 100,962 | |
Receivable for investment securities sold | | 53,025 | |
Receivable for shares of Beneficial Interest subscribed | | 15,775 | |
Prepaid expenses | | | | | 7,671 | |
| | | | | 277,645,706 | |
Liabilities ($): | | | | |
Due to BNY Mellon Investment Adviser, Inc. and affiliates—Note 3(b) | | 186,242 | |
Liability for securities on loan—Note 1(c) | | 6,871,403 | |
Payable for shares of Beneficial Interest redeemed | | 26,228 | |
Trustees’ fees and expenses payable | | 2,482 | |
Other accrued expenses | | | | | 97,690 | |
| | | | | 7,184,045 | |
Net Assets ($) | | | 270,461,661 | |
Composition of Net Assets ($): | | | | |
Paid-in capital | | | | | 267,102,499 | |
Total distributable earnings (loss) | | | | | 3,359,162 | |
Net Assets ($) | | | 270,461,661 | |
| | | | |
Net Asset Value Per Share | Initial Shares | Service Shares | |
Net Assets ($) | 253,112,399 | 17,349,262 | |
Shares Outstanding | 6,426,037 | 471,556 | |
Net Asset Value Per Share ($) | 39.39 | 36.79 | |
| | | |
See notes to financial statements. | | | |
13
STATEMENT OF OPERATIONS
Year Ended December 31, 2022
| | | | | | | |
| | | | | | |
| | | | | | |
Investment Income ($): | | | | |
Income: | | | | |
Cash dividends (net of $35,477 foreign taxes withheld at source): | |
Unaffiliated issuers | | | 3,074,221 | |
Affiliated issuers | | | 143,628 | |
Income from securities lending—Note 1(c) | | | 56,958 | |
Interest | | | 168 | |
Total Income | | | 3,274,975 | |
Expenses: | | | | |
Management fee—Note 3(a) | | | 2,175,084 | |
Professional fees | | | 83,854 | |
Distribution fees—Note 3(b) | | | 46,433 | |
Prospectus and shareholders’ reports | | | 39,567 | |
Trustees’ fees and expenses—Note 3(c) | | | 18,650 | |
Chief Compliance Officer fees—Note 3(b) | | | 17,082 | |
Custodian fees—Note 3(b) | | | 6,898 | |
Loan commitment fees—Note 2 | | | 4,351 | |
Shareholder servicing costs—Note 3(b) | | | 1,328 | |
Miscellaneous | | | 24,938 | |
Total Expenses | | | 2,418,185 | |
Less—reduction in fees due to earnings credits—Note 3(b) | | | (104) | |
Net Expenses | | | 2,418,081 | |
Net Investment Income | | | 856,894 | |
Realized and Unrealized Gain (Loss) on Investments—Note 4 ($): | | |
Net realized gain (loss) on investments | 5,993,934 | |
Net change in unrealized appreciation (depreciation) on investments | (62,163,398) | |
Net Realized and Unrealized Gain (Loss) on Investments | | | (56,169,464) | |
Net (Decrease) in Net Assets Resulting from Operations | | (55,312,570) | |
| | | | | | |
See notes to financial statements. | | | | | |
14
STATEMENT OF CHANGES IN NET ASSETS
| | | | | | | | | | |
| | | | Year Ended December 31, |
| | | | 2022 | | 2021 | |
Operations ($): | | | | | | | | |
Net investment income (loss) | | | 856,894 | | | | (408,034) | |
Net realized gain (loss) on investments | | 5,993,934 | | | | 64,142,601 | |
Net change in unrealized appreciation
(depreciation) on investments | | (62,163,398) | | | | (14,081,002) | |
Net Increase (Decrease) in Net Assets
Resulting from Operations | (55,312,570) | | | | 49,653,565 | |
Distributions ($): | |
Distributions to shareholders: | | | | | | | | |
Initial Shares | | | (55,760,430) | | | | (342,095) | |
Service Shares | | | (4,063,030) | | | | - | |
Total Distributions | | | (59,823,460) | | | | (342,095) | |
Beneficial Interest Transactions ($): | |
Net proceeds from shares sold: | | | | | | | | |
Initial Shares | | | 16,948,550 | | | | 16,726,030 | |
Service Shares | | | 863,522 | | | | 1,470,360 | |
Distributions reinvested: | | | | | | | | |
Initial Shares | | | 55,760,430 | | | | 342,095 | |
Service Shares | | | 4,063,030 | | | | - | |
Cost of shares redeemed: | | | | | | | | |
Initial Shares | | | (28,219,086) | | | | (33,340,521) | |
Service Shares | | | (1,644,939) | | | | (2,872,363) | |
Increase (Decrease) in Net Assets
from Beneficial Interest Transactions | 47,771,507 | | | | (17,674,399) | |
Total Increase (Decrease) in Net Assets | (67,364,523) | | | | 31,637,071 | |
Net Assets ($): | |
Beginning of Period | | | 337,826,184 | | | | 306,189,113 | |
End of Period | | | 270,461,661 | | | | 337,826,184 | |
Capital Share Transactions (Shares): | |
Initial Shares | | | | | | | | |
Shares sold | | | 392,653 | | | | 296,401 | |
Shares issued for distributions reinvested | | | 1,206,153 | | | | 6,297 | |
Shares redeemed | | | (644,722) | | | | (594,724) | |
Net Increase (Decrease) in Shares Outstanding | 954,084 | | | | (292,026) | |
Service Shares | | | | | | | | |
Shares sold | | | 21,384 | | | | 27,690 | |
Shares issued for distributions reinvested | | | 93,921 | | | | - | |
Shares redeemed | | | (40,559) | | | | (53,728) | |
Net Increase (Decrease) in Shares Outstanding | 74,746 | | | | (26,038) | |
| | | | | | | | | |
See notes to financial statements. | | | | | | | | |
15
FINANCIAL HIGHLIGHTS
The following tables describe the performance for each share class for the fiscal periods indicated. All information (except portfolio turnover rate) reflects financial results for a single fund share. Net asset value total return is calculated assuming an initial investment made at the net asset value at the beginning of the period, reinvestment of all dividends and distributions at net asset value during the period, and redemption at net asset value on the last day of the period. Net asset value total return includes adjustments in accordance with accounting principles generally accepted in the United States of America and as such, the net asset value for financial reporting purposes and the returns based upon those net asset values may differ from the net asset value and returns for shareholder transactions. The fund’s total returns do not reflect expenses associated with variable annuity or insurance contracts. These figures have been derived from the fund’s financial statements.
| | | | | | | |
| | |
| | | Year Ended December 31, |
Initial Shares | | 2022 | 2021 | 2020 | 2019 | 2018 |
Per Share Data ($): | | | | | | |
Net asset value, beginning of period | | 57.77 | 49.66 | 41.78 | 41.20 | 60.91 |
Investment Operations: | | | | | | |
Net investment income (loss)a | | .14 | (.06) | .06 | .26 | (.06) |
Net realized and unrealized
gain (loss) on investments | | (8.22) | 8.23 | 8.07 | 8.35 | (9.48) |
Total from Investment Operations | | (8.08) | 8.17 | 8.13 | 8.61 | (9.54) |
Distributions: | | | | | | |
Dividends from net
investment income | | - | (.06) | (.25) | - | - |
Dividends from net realized
gain on investments | | (10.30) | - | - | (8.03) | (10.17) |
Total Distributions | | (10.30) | (.06) | (.25) | (8.03) | (10.17) |
Net asset value, end of period | | 39.39 | 57.77 | 49.66 | 41.78 | 41.20 |
Total Return (%) | | (16.62) | 16.46 | 19.89 | 21.78 | (19.08) |
Ratios/Supplemental Data (%): | | | | | | |
Ratio of total expenses
to average net assets | | .82 | .82 | .85 | .84 | .84 |
Ratio of net expenses
to average net assets | | .82 | .82 | .85 | .84 | .84 |
Ratio of net investment income
(loss) to average net assets | | .31 | (.10) | .16 | .64 | (.12) |
Portfolio Turnover Rate | | 37.56 | 59.71 | 68.67 | 65.42 | 67.90 |
Net Assets, end of period ($ x 1,000) | | 253,112 | 316,092 | 286,250 | 260,321 | 146,730 |
a Based on average shares outstanding.
See notes to financial statements.
16
| | | | | | | |
| | |
| | | Year Ended December 31, |
Service Shares | | 2022 | 2021 | 2020 | 2019 | 2018 |
Per Share Data ($): | | | | | | |
Net asset value, beginning of period | | 54.77 | 47.15 | 39.65 | 39.53 | 58.98 |
Investment Operations: | | | | | | |
Net investment income (loss)a | | .02 | (.19) | (.03) | .16 | (.19) |
Net realized and unrealized
gain (loss) on investments | | (7.70) | 7.81 | 7.68 | 7.99 | (9.09) |
Total from Investment Operations | | (7.68) | 7.62 | 7.65 | 8.15 | (9.28) |
Distributions: | | | | | | |
Dividends from net
investment income | | - | - | (.15) | - | - |
Dividends from net realized
gain on investments | | (10.30) | - | - | (8.03) | (10.17) |
Total Distributions | | (10.30) | - | (.15) | (8.03) | (10.17) |
Net asset value, end of period | | 36.79 | 54.77 | 47.15 | 39.65 | 39.53 |
Total Return (%) | | (16.83) | 16.16 | 19.58 | 21.49 | (19.29) |
Ratios/Supplemental Data (%): | | | | | | |
Ratio of total expenses
to average net assets | | 1.07 | 1.07 | 1.10 | 1.09 | 1.09 |
Ratio of net expenses
to average net assets | | 1.07 | 1.07 | 1.10 | 1.09 | 1.09 |
Ratio of net investment income
(loss) to average net assets | | .06 | (.36) | (.09) | .41 | (.37) |
Portfolio Turnover Rate | | 37.56 | 59.71 | 68.67 | 65.42 | 67.90 |
Net Assets, end of period ($ x 1,000) | | 17,349 | 21,734 | 19,939 | 17,628 | 15,291 |
a Based on average shares outstanding.
See notes to financial statements.
17
NOTES TO FINANCIAL STATEMENTS
NOTE 1—Significant Accounting Policies:
Opportunistic Small Cap Portfolio (the “fund”) is a separate diversified series of BNY Mellon Variable Investment Fund (the “Trust”), which is registered under the Investment Company Act of 1940, as amended (the “Act”), as an open-end management investment company and operates as a series company currently offering four series, including the fund. The fund is only offered to separate accounts established by insurance companies to fund variable annuity contracts and variable life insurance policies. The fund’s investment objective is to seek capital growth. BNY Mellon Investment Adviser, Inc. (the “Adviser”), a wholly-owned subsidiary of The Bank of New York Mellon Corporation (“BNY Mellon”), serves as the fund’s investment adviser. Newton Investment Management North America, LLC (the “Sub-Adviser”), a wholly-owned subsidiary of BNY Mellon and an affiliate of the Adviser, serves as the fund’s sub-adviser.
BNY Mellon Securities Corporation (the “Distributor”), a wholly-owned subsidiary of the Adviser, is the distributor of the fund’s shares, which are sold to the public without a sales charge. The fund is authorized to issue an unlimited number of $.001 par value shares of Beneficial Interest in each of the following classes of shares: Initial and Service. Each class of shares has identical rights and privileges, except with respect to the Distribution Plan, and the expenses borne by each class, the allocation of certain transfer agency costs, and certain voting rights. Income, expenses (other than expenses attributable to a specific class), and realized and unrealized gains or losses on investments are allocated to each class of shares based on its relative net assets.
The Trust accounts separately for the assets, liabilities and operations of each series. Expenses directly attributable to each series are charged to that series’ operations; expenses which are applicable to all series are allocated among them on a pro rata basis.
The Financial Accounting Standards Board (“FASB”) Accounting Standards Codification (“ASC”) is the exclusive reference of authoritative U.S. generally accepted accounting principles (“GAAP”) recognized by the FASB to be applied by nongovernmental entities. Rules and interpretive releases of the SEC under authority of federal laws are also sources of authoritative GAAP for SEC registrants. The fund is an investment company and applies the accounting and reporting guidance of the FASB ASC Topic 946 Financial Services-Investment Companies. The fund’s financial statements are prepared in accordance with GAAP, which may
18
require the use of management estimates and assumptions. Actual results could differ from those estimates.
The Trust enters into contracts that contain a variety of indemnifications. The fund’s maximum exposure under these arrangements is unknown. The fund does not anticipate recognizing any loss related to these arrangements.
(a) Portfolio valuation: The fair value of a financial instrument is the amount that would be received to sell an asset or paid to transfer a liability in an orderly transaction between market participants at the measurement date (i.e., the exit price). GAAP establishes a fair value hierarchy that prioritizes the inputs of valuation techniques used to measure fair value. This hierarchy gives the highest priority to unadjusted quoted prices in active markets for identical assets or liabilities (Level 1 measurements) and the lowest priority to unobservable inputs (Level 3 measurements).
Additionally, GAAP provides guidance on determining whether the volume and activity in a market has decreased significantly and whether such a decrease in activity results in transactions that are not orderly. GAAP requires enhanced disclosures around valuation inputs and techniques used during annual and interim periods.
Various inputs are used in determining the value of the fund’s investments relating to fair value measurements. These inputs are summarized in the three broad levels listed below:
Level 1—unadjusted quoted prices in active markets for identical investments.
Level 2—other significant observable inputs (including quoted prices for similar investments, interest rates, prepayment speeds, credit risk, etc.).
Level 3—significant unobservable inputs (including the fund’s own assumptions in determining the fair value of investments).
The inputs or methodology used for valuing securities are not necessarily an indication of the risk associated with investing in those securities.
Changes in valuation techniques may result in transfers in or out of an assigned level within the disclosure hierarchy. Valuation techniques used to value the fund’s investments are as follows:
The Trust’s Board of Trustees (the “Board”) has designated the Adviser as the fund’s valuation designee, effective September 8, 2022, to make all fair value determinations with respect to the fund’s portfolio investments, subject to the Board’s oversight and pursuant to Rule 2a-5 under the Act.
19
NOTES TO FINANCIAL STATEMENTS (continued)
Investments in equity securities are valued at the last sales price on the securities exchange or national securities market on which such securities are primarily traded. Securities listed on the National Market System for which market quotations are available are valued at the official closing price or, if there is no official closing price that day, at the last sales price. For open short positions, asked prices are used for valuation purposes. Bid price is used when no asked price is available. Registered investment companies that are not traded on an exchange are valued at their net asset value. All of the preceding securities are generally categorized within Level 1 of the fair value hierarchy.
Securities not listed on an exchange or the national securities market, or securities for which there were no transactions, are valued at the average of the most recent bid and asked prices. These securities are generally categorized within Level 2 of the fair value hierarchy.
Fair valuing of securities may be determined with the assistance of a pricing service using calculations based on indices of domestic securities and other appropriate indicators, such as prices of relevant American Depository Receipts and futures. Utilizing these techniques may result in transfers between Level 1 and Level 2 of the fair value hierarchy.
When market quotations or official closing prices are not readily available, or are determined not to accurately reflect fair value, such as when the value of a security has been significantly affected by events after the close of the exchange or market on which the security is principally traded, but before the fund calculates its net asset value, the fund may value these investments at fair value as determined in accordance with the procedures approved by the Board. Certain factors may be considered when fair valuing investments such as: fundamental analytical data, the nature and duration of restrictions on disposition, an evaluation of the forces that influence the market in which the securities are purchased and sold, and public trading in similar securities of the issuer or comparable issuers. These securities are either categorized within Level 2 or 3 of the fair value hierarchy depending on the relevant inputs used.
For securities where observable inputs are limited, assumptions about market activity and risk are used and such securities are generally categorized within Level 3 of the fair value hierarchy.
The following is a summary of the inputs used as of December 31, 2022 in valuing the fund’s investments:
20
| | | | | | | |
| | Level 1-Unadjusted Quoted Prices | Level 2- Other Significant Observable Inputs | | Level 3-Significant Unobservable Inputs | Total | |
Assets ($) | | |
Investments in Securities:† | | |
Equity Securities - Common Stocks | 254,635,748 | - | | - | 254,635,748 | |
Exchange-Traded Funds | 5,536,279 | - | | - | 5,536,279 | |
Investment Companies | 17,296,246 | - | | - | 17,296,246 | |
† See Statement of Investments for additional detailed categorizations, if any.
(b) Foreign taxes: The fund may be subject to foreign taxes (a portion of which may be reclaimable) on income, stock dividends, realized and unrealized capital gains on investments or certain foreign currency transactions. Foreign taxes are recorded in accordance with the applicable foreign tax regulations and rates that exist in the foreign jurisdictions in which the fund invests. These foreign taxes, if any, are paid by the fund and are reflected in the Statement of Operations, if applicable. Foreign taxes payable or deferred or those subject to reclaims as of December 31, 2022, if any, are disclosed in the fund’s Statement of Assets and Liabilities.
(c) Securities transactions and investment income: Securities transactions are recorded on a trade date basis. Realized gains and losses from securities transactions are recorded on the identified cost basis. Dividend income is recognized on the ex-dividend date and interest income, including, where applicable, accretion of discount and amortization of premium on investments, is recognized on the accrual basis.
Pursuant to a securities lending agreement with BNY Mellon, the fund may lend securities to qualified institutions. It is the fund’s policy that, at origination, all loans are secured by collateral of at least 102% of the value of U.S. securities loaned and 105% of the value of foreign securities loaned. Collateral equivalent to at least 100% of the market value of securities on loan is maintained at all times. Collateral is either in the form of cash, which can be invested in certain money market mutual funds managed by the Adviser, or U.S. Government and Agency securities. The fund is entitled to receive all dividends, interest and distributions on securities loaned, in addition to income earned as a result of the lending transaction. Should a borrower fail to return the securities in a timely manner, BNY Mellon is required to replace the securities for the benefit of the fund or credit the fund with the market value of the unreturned securities and is subrogated to the fund’s rights against the borrower and
21
NOTES TO FINANCIAL STATEMENTS (continued)
the collateral. Additionally, the contractual maturity of security lending transactions are on an overnight and continuous basis. During the period ended December 31, 2022, BNY Mellon earned $7,763 from the lending of the fund’s portfolio securities, pursuant to the securities lending agreement.
(d) Affiliated issuers: Investments in other investment companies advised by the Adviser are considered “affiliated” under the Act.
(e) Market Risk: The value of the securities in which the fund invests may be affected by political, regulatory, economic and social developments, and developments that impact specific economic sectors, industries or segments of the market. The value of a security may also decline due to general market conditions that are not specifically related to a particular company or industry, such as real or perceived adverse economic conditions, changes in the general outlook for corporate earnings, changes in interest or currency rates, changes to inflation, adverse changes to credit markets or adverse investor sentiment generally. In addition, turbulence in financial markets and reduced liquidity in equity, credit and/or fixed income markets may negatively affect many issuers, which could adversely affect the fund. Global economies and financial markets are becoming increasingly interconnected, and conditions and events in one country, region or financial market may adversely impact issuers in a different country, region or financial market. These risks may be magnified if certain events or developments adversely interrupt the global supply chain; in these and other circumstances, such risks might affect companies world-wide. Recent examples include pandemic risks related to COVID-19 and aggressive measures taken world-wide in response by governments, including closing borders, restricting international and domestic travel, and the imposition of prolonged quarantines of large populations, and by businesses, including changes to operations and reducing staff.
(f) Dividends and distributions to shareholders: Dividends and distributions are recorded on the ex-dividend date. Dividends from net investment income and dividends from net realized capital gains, if any, are normally declared and paid annually, but the fund may make distributions on a more frequent basis to comply with the distribution requirements of the Internal Revenue Code of 1986, as amended (the “Code”). To the extent that net realized capital gains can be offset by capital loss carryovers, it is the policy of the fund not to distribute such gains. Income and capital gain distributions are determined in accordance with income tax regulations, which may differ from GAAP.
(g) Federal income taxes: It is the policy of the fund to continue to qualify as a regulated investment company, if such qualification is in the best interests of its shareholders, by complying with the applicable
22
provisions of the Code, and to make distributions of taxable income and net realized capital gain sufficient to relieve it from substantially all federal income and excise taxes.
As of and during the period ended December 31, 2022, the fund did not have any liabilities for any uncertain tax positions. The fund recognizes interest and penalties, if any, related to uncertain tax positions as income tax expense in the Statement of Operations. During the period ended December 31, 2022, the fund did not incur any interest or penalties.
Each tax year in the four-year period ended December 31, 2022 remains subject to examination by the Internal Revenue Service and state taxing authorities.
At December 31, 2022, the components of accumulated earnings on a tax basis were as follows: undistributed ordinary income $854,125, undistributed capital gains $6,097,857 and unrealized depreciation $3,592,820.
The tax character of distributions paid to shareholders during the fiscal years ended December 31, 2022 and December 31, 2021 were as follows: ordinary income $16,291,269 and $342,095, and long-term capital gains $43,532,191 and $0, respectively.
NOTE 2—Bank Lines of Credit:
The fund participates with other long-term open-end funds managed by the Adviser in a $823.5 million unsecured credit facility led by Citibank, N.A. (the “Citibank Credit Facility”) and a $300 million unsecured credit facility provided by BNY Mellon (the “BNYM Credit Facility”), each to be utilized primarily for temporary or emergency purposes, including the financing of redemptions (each, a “Facility”). The Citibank Credit Facility is available in two tranches: (i) Tranche A is in an amount equal to $688.5 million and is available to all long-term open-ended funds, including the fund, and (ii) Tranche B is an amount equal to $135 million and is available only to BNY Mellon Floating Rate Income Fund, a series of BNY Mellon Investment Funds IV, Inc. In connection therewith, the fund has agreed to pay its pro rata portion of commitment fees for Tranche A of the Citibank Credit Facility and the BNYM Credit Facility. Interest is charged to the fund based on rates determined pursuant to the terms of the respective Facility at the time of borrowing. During the period ended December 31, 2022, the fund did not borrow under the Facilities.
23
NOTES TO FINANCIAL STATEMENTS (continued)
NOTE 3—Management Fee, Sub-Advisory Fee and Other Transactions with Affiliates:
(a) Pursuant to an investment advisory agreement with the Adviser, the management fee is computed at the annual rate of .75% of the value of the fund’s average daily net assets and is payable monthly.
Pursuant to a sub-investment advisory agreement between the Adviser and the Sub-Adviser, the Adviser pays the Sub-Adviser a monthly fee at an annual rate of .36% of the value of the fund’s average daily net assets.
(b) Under the Distribution Plan adopted pursuant to Rule 12b-1 under the Act, Service shares pay the Distributor for distributing its shares, for servicing and/or maintaining Service shares’ shareholder accounts and for advertising and marketing for Service shares. The Distribution Plan provides for payments to be made at an annual rate of .25% of the value of the Service shares’ average daily net assets. The Distributor may make payments to Participating Insurance Companies and to brokers and dealers acting as principal underwriter for their variable insurance products. The fees payable under the Distribution Plan are payable without regard to actual expenses incurred. During the period ended December 31, 2022, Service shares were charged $46,433 pursuant to the Distribution Plan.
The fund has an arrangement with BNY Mellon Transfer, Inc., (the “Transfer Agent”), a subsidiary of BNY Mellon and an affiliate of the Adviser, whereby the fund may receive earnings credits when positive cash balances are maintained, which are used to offset Transfer Agent fees. For financial reporting purposes, the fund includes transfer agent net earnings credits, if any, as an expense offset in the Statement of Operations.
The fund has an arrangement with The Bank of New York Mellon (the “Custodian”), a subsidiary of BNY Mellon and an affiliate of the Adviser, whereby the fund will receive interest income or be charged overdraft fees when cash balances are maintained. For financial reporting purposes, the fund includes this interest income and overdraft fees, if any, as interest income in the Statement of Operations.
The fund compensates the Transfer Agent, under a transfer agency agreement, for providing transfer agency and cash management services for the fund. The majority of Transfer Agent fees are comprised of amounts paid on a per account basis, while cash management fees are related to fund subscriptions and redemptions. During the period ended December 31, 2022, the fund was charged $1,187 for transfer agency services. These fees are included in Shareholder servicing costs in the Statement of Operations. These fees were partially offset by earnings credits of $104.
24
The fund compensates the Custodian, under a custody agreement, for providing custodial services for the fund. These fees are determined based on net assets, geographic region and transaction activity. During the period ended December 31, 2022, the fund was charged $6,898 pursuant to the custody agreement.
During the period ended December 31, 2022, the fund was charged $17,082 for services performed by the fund’s Chief Compliance Officer and his staff. These fees are included in Chief Compliance Officer fees in the Statement of Operations.
The components of “Due to BNY Mellon Investment Adviser, Inc. and affiliates” in the Statement of Assets and Liabilities consist of: management fee of $174,238, Distribution Plan fees of $3,724, Custodian fees of $4,006, Chief Compliance Officer fees of $4,082 and Transfer Agent fees of $192.
(c) Each board member also serves as a board member of other funds in the BNY Mellon Family of Funds complex. Annual retainer fees and attendance fees are allocated to each fund based on net assets.
NOTE 4—Securities Transactions:
The aggregate amount of purchases and sales of investment securities, excluding short-term securities, during the period ended December 31, 2022, amounted to $106,835,500 and $120,529,660, respectively.
At December 31, 2022, the cost of investments for federal income tax purposes was $281,061,093; accordingly, accumulated net unrealized depreciation on investments was $3,592,820, consisting of $49,950,581 gross unrealized appreciation and $53,543,401 gross unrealized depreciation.
25
REPORT OF INDEPENDENT REGISTERED PUBLIC ACCOUNTING FIRM
To the Shareholders and the Board of Trustees of Opportunistic Small Cap Portfolio
Opinion on the Financial Statements
We have audited the accompanying statement of assets and liabilities of Opportunistic Small Cap Portfolio (the “Fund”) (one of the funds constituting BNY Mellon Variable Investment Fund), including the statement of investments, as of December 31, 2022, and the related statement of operations for the year then ended, the statements of changes in net assets for each of the two years in the period then ended, the financial highlights for each of the five years in the period then ended and the related notes (collectively referred to as the “financial statements”). In our opinion, the financial statements present fairly, in all material respects, the financial position of the Fund (one of the funds constituting BNY Mellon Variable Investment Fund) at December 31, 2022, the results of its operations for the year then ended, the changes in its net assets for each of the two years in the period then ended and its financial highlights for each of the five years in the period then ended, in conformity with U.S. generally accepted accounting principles.
Basis for Opinion
These financial statements are the responsibility of the Fund’s management. Our responsibility is to express an opinion on the Fund’s financial statements based on our audits. We are a public accounting firm registered with the Public Company Accounting Oversight Board (United States) (“PCAOB”) and are required to be independent with respect to the Fund in accordance with the U.S. federal securities laws and the applicable rules and regulations of the Securities and Exchange Commission and the PCAOB.
We conducted our audits in accordance with the standards of the PCAOB. Those standards require that we plan and perform the audit to obtain reasonable assurance about whether the financial statements are free of material misstatement, whether due to error or fraud. The Fund is not required to have, nor were we engaged to perform, an audit of the Fund’s internal control over financial reporting. As part of our audits, we are required to obtain an understanding of internal control over financial reporting, but not for the purpose of expressing an opinion on the effectiveness of the Fund’s internal control over financial reporting. Accordingly, we express no such opinion.
Our audits included performing procedures to assess the risks of material misstatement of the financial statements, whether due to error or fraud, and performing procedures that respond to those risks. Such procedures included examining, on a test basis, evidence regarding the amounts and disclosures in the financial statements. Our procedures included confirmation of securities owned as of December 31, 2022, by correspondence with the custodian, brokers and others; when replies were not received from brokers and others, we performed other auditing procedures. Our audits also included evaluating the accounting principles used and significant estimates made by management, as well as evaluating the overall presentation of the financial statements. We believe that our audits provide a reasonable basis for our opinion.

We have served as the auditor of one or more investment companies in the BNY Mellon Family of Funds since at least 1957, but we are unable to determine the specific year.
New York, New York
February 9, 2023
26
IMPORTANT TAX INFORMATION (Unaudited)
For federal tax purposes, the fund hereby reports 11.05% of the ordinary dividends paid during the fiscal year ended December 31, 2022 as qualifying for the corporate dividends received deduction. Shareholders will receive notification in early 2023 of the percentage applicable to the preparation of their 2022 income tax returns. Also, the fund hereby reports $7.4974 per share as a long-term capital gain distribution and $2.8056 per share as a short-term capital gain distribution paid on March 30, 2022.
27
INFORMATION ABOUT THE RENEWAL OF THE FUND’S INVESTMENT ADVISORY AND SUB-ADVISORY AGREEMENTS (Unaudited)
At a meeting of the fund’s Board of Trustees held on July 26, 2022, the Board considered the renewal of the fund’s Investment Advisory Agreement, pursuant to which the Adviser provides the fund with investment advisory and administrative services, and the Sub-Investment Advisory Agreement (together with the Investment Advisory Agreement, the “Agreements”), pursuant to which Newton Investment Management North America, LLC (the “Sub-Adviser”) provides day-to-day management of the fund’s investments. The Board members, none of whom are “interested persons” (as defined in the Investment Company Act of 1940, as amended) of the fund, were assisted in their review by independent legal counsel and met with counsel in executive session separate from representatives of the Adviser and the Sub-Adviser. In considering the renewal of the Agreements, the Board considered several factors that it believed to be relevant, including those discussed below. The Board did not identify any one factor as dispositive, and each Board member may have attributed different weights to the factors considered.
Analysis of Nature, Extent, and Quality of Services Provided to the Fund. The Board considered information provided to it at the meeting and in previous presentations from representatives of the Adviser regarding the nature, extent, and quality of the services provided to funds in the BNY Mellon fund complex, including the fund. The Adviser provided the number of open accounts in the fund, the fund’s asset size and the allocation of fund assets among distribution channels. The Adviser also had previously provided information regarding the diverse intermediary relationships and distribution channels of funds in the BNY Mellon fund complex (such as intermediary, in which intermediaries typically are paid by the fund and/or the Adviser) and the Adviser’s corresponding need for broad, deep, and diverse resources to be able to provide ongoing shareholder services to each intermediary or distribution channel, as applicable to the fund.
The Board also considered research support available to, and portfolio management capabilities of, the fund’s portfolio management personnel and that the Adviser also provides oversight of day-to-day fund operations, including fund accounting and administration and assistance in meeting legal and regulatory requirements. The Board also considered the Adviser’s extensive administrative, accounting and compliance infrastructures, as well as the Adviser’s supervisory activities over the Sub-Adviser. The Board also considered portfolio management’s brokerage policies and practices (including policies and practices regarding soft dollars) and the standards applied in seeking best execution.
Comparative Analysis of the Fund’s Performance and Management Fee and Expense Ratio. The Board reviewed reports prepared by Broadridge Financial Solutions, Inc. (“Broadridge”), an independent provider of investment company data based on classifications provided by Thomson Reuters Lipper, which included information comparing (1) the performance of the fund’s Initial shares with the performance of a group of small-cap core funds underlying variable insurance products (VIPs) selected by Broadridge as comparable to the fund (the “Performance Group”) and with a broader
28
group of funds consisting of all small-cap core funds underlying VIPs (the “Performance Universe”), all for various periods ended June 30, 2022, and (2) the fund’s actual and contractual management fees and total expenses with those of the same group of funds in the Performance Group (the “Expense Group”) and with a broader group of all other small-cap core funds underlying VIPs with similar 12b-1/non-12b-1 structures, excluding outliers (the “Expense Universe”), the information for which was derived in part from fund financial statements available to Broadridge as of the date of its analysis. The Adviser previously had furnished the Board with a description of the methodology Broadridge used to select the Performance Group and Performance Universe and the Expense Group and Expense Universe.
Performance Comparisons. Representatives of the Adviser stated that the usefulness of performance comparisons may be affected by a number of factors, including different investment limitations and policies that may be applicable to the fund and comparison funds and the end date selected. The Board discussed with representatives of the Adviser and the Sub-Adviser the results of the comparisons and considered that the fund’s total return performance was below the Performance Group and Performance Universe medians for all periods, except the three-, five- and ten-year periods when the fund’s total return performance was above the Performance Group medians and the six-month, three- and ten-year periods when the fund’s total return performance was above the Performance Universe medians. The Adviser also provided a comparison of the fund’s calendar year total returns to the returns of the fund’s benchmark index. The Board discussed with representatives of the Adviser and the Sub-Adviser the reasons for the fund’s underperformance versus the Performance Group and Performance Universe during certain of the periods under review and noted that the fund’s relative performance had improved since the Board last considered renewal of the Agreements.
Management Fee and Expense Ratio Comparisons. The Board reviewed and considered the contractual management fee rate payable by the fund to the Adviser in light of the nature, extent and quality of the management services and the sub-advisory services provided by the Adviser and the Sub-Adviser, respectively. In addition, the Board reviewed and considered the actual management fee rate paid by the fund over the fund’s last fiscal year. The Board also reviewed the range of actual and contractual management fees and total expenses as a percentage of average net assets of the Expense Group and Expense Universe funds and discussed the results of the comparisons.
The Board considered that the fund’s contractual management fee was equal to the Expense Group median contractual management fee, the fund’s actual management fee was equal to the Expense Group median and equal to the Expense Universe median actual management fee and the fund’s total expenses were equal to the Expense Group median and lower than the Expense Universe median total expenses.
Representatives of the Adviser reviewed with the Board the management or investment advisory fees (1) paid by funds advised by the Adviser that are in the same Lipper category as the fund and (2) paid to the Adviser or the Sub-Adviser for advising any separate accounts and/or other types of client portfolios that are considered to have
29
INFORMATION ABOUT THE RENEWAL OF THE FUND’S INVESTMENT ADVISORY AND SUB-ADVISORY AGREEMENTS (Unaudited) (continued)
similar investment strategies and policies as the fund (the “Similar Clients”), and explained the nature of the Similar Clients. They discussed differences in fees paid and the relationship of the fees paid in light of any differences in the services provided and other relevant factors. The Board considered the relevance of the fee information provided for the Similar Clients to evaluate the appropriateness of the fund’s management fee.
The Board considered the fee payable to the Sub-Adviser in relation to the fee payable to the Adviser by the fund and the respective services provided by the Sub-Adviser and the Adviser. The Board also took into consideration that the Sub-Adviser’s fee is paid by the Adviser, out of its fee from the fund, and not the fund.
Analysis of Profitability and Economies of Scale. Representatives of the Adviser reviewed the expenses allocated and profit received by the Adviser and its affiliates and the resulting profitability percentage for managing the fund and the aggregate profitability percentage to the Adviser and its affiliates for managing the funds in the BNY Mellon fund complex, and the method used to determine the expenses and profit. The Board concluded that the profitability results were not excessive, given the services rendered and service levels provided by the Adviser and its affiliates. The Board also had been provided with information prepared by an independent consulting firm regarding the Adviser’s approach to allocating costs to, and determining the profitability of, individual funds and the entire BNY Mellon fund complex. The consulting firm also had analyzed where any economies of scale might emerge in connection with the management of a fund.
The Board considered, on the advice of its counsel, the profitability analysis (1) as part of its evaluation of whether the fees under the Agreements, considered in relation to the mix of services provided by the Adviser and the Sub-Adviser, including the nature, extent and quality of such services, supported the renewal of the Agreements and (2) in light of the relevant circumstances for the fund and the extent to which economies of scale would be realized if the fund grows and whether fee levels reflect these economies of scale for the benefit of fund shareholders. Representatives of the Adviser stated that a discussion of economies of scale is predicated on a fund having achieved a substantial size with increasing assets and that, if a fund’s assets had been stable or decreasing, the possibility that the Adviser may have realized any economies of scale would be less. Representatives of the Adviser also stated that, as a result of shared and allocated costs among funds in the BNY Mellon fund complex, the extent of economies of scale could depend substantially on the level of assets in the complex as a whole, so that increases and decreases in complex-wide assets can affect potential economies of scale in a manner that is disproportionate to, or even in the opposite direction from, changes in the fund’s asset level. The Board also considered potential benefits to the Adviser and the Sub-Adviser from acting as investment adviser and sub-adviser, respectively, and took into consideration the soft dollar arrangements in effect for trading the fund’s investments.
At the conclusion of these discussions, the Board agreed that it had been furnished with sufficient information to make an informed business decision with respect to the
30
renewal of the Agreements. Based on the discussions and considerations as described above, the Board concluded and determined as follows.
· The Board concluded that the nature, extent and quality of the services provided by the Adviser and the Sub-Adviser are adequate and appropriate.
·��The Board was satisfied with the fund’s improved performance.
· The Board concluded that the fees paid to the Adviser and the Sub-Adviser continued to be appropriate under the circumstances and in light of the factors and the totality of the services provided as discussed above.
· The Board determined that the economies of scale which may accrue to the Adviser and its affiliates in connection with the management of the fund had been adequately considered by the Adviser in connection with the fee rate charged to the fund pursuant to the Investment Advisory Agreement and that, to the extent in the future it were determined that material economies of scale had not been shared with the fund, the Board would seek to have those economies of scale shared with the fund.
In evaluating the Agreements, the Board considered these conclusions and determinations and also relied on its previous knowledge, gained through meetings and other interactions with the Adviser and its affiliates and the Sub-Adviser, of the Adviser and the Sub-Adviser and the services provided to the fund by the Adviser and the Sub-Adviser. The Board also relied on information received on a routine and regular basis throughout the year relating to the operations of the fund and the investment management and other services provided under the Agreements, including information on the investment performance of the fund in comparison to similar mutual funds and benchmark performance indices; general market outlook as applicable to the fund; and compliance reports. In addition, the Board’s consideration of the contractual fee arrangements for the fund had the benefit of a number of years of reviews of the Agreements for the fund, or substantially similar agreements for other BNY Mellon funds that the Board oversees, during which lengthy discussions took place between the Board and representatives of the Adviser. Certain aspects of the arrangements may receive greater scrutiny in some years than in others, and the Board’s conclusions may be based, in part, on its consideration of the fund’s arrangements, or substantially similar arrangements for other BNY Mellon funds that the Board oversees, in prior years. The Board determined to renew the Agreements for the remainder of the one-year term.
31
BOARD MEMBERS INFORMATION (Unaudited)
Independent Board Members
Joseph S. DiMartino (79)
Chairman of the Board (1995)
Principal Occupation During Past 5 Years:
· Director or Trustee of funds in the BNY Mellon Family of Funds and certain other entities (as described in the fund’s Statement of Additional Information) (1995-Present)
Other Public Company Board Memberships During Past 5 Years:
· CBIZ, Inc., a public company providing professional business services, products and solutions, Director (1997-Present)
No. of Portfolios for which Board Member Serves: 92
———————
Peggy C. Davis (79)
Board Member (2006)
Principal Occupation During Past 5 Years:
· Shad Professor of Law, New York University School of Law (1983-Present)
No. of Portfolios for which Board Member Serves: 32
———————
Gina D. France (64)
Board Member (2019)
Principal Occupation During Past 5 Years:
· France Strategic Partners, a strategy and advisory firm serving corporate clients across the United States, Founder, President and Chief Executive Officer (2003-Present)
Other Public Company Board Memberships During Past 5 Years:
· Huntington Bancshares, a bank holding company headquartered in Columbus, Ohio, Director (2016-Present)
· Cedar Fair, L.P., a publicly-traded partnership that owns and operates amusement parks and hotels in the U.S. and Canada, Director (2011-Present)
· CBIZ, Inc., a public company providing professional business services, products and solutions, Director (2015-Present)
· FirstMerit Corporation, a diversified financial services company, Director (2004-2016)
No. of Portfolios for which Board Member Serves: 22
———————
Joan Gulley (75)
Board Member (2017)
Principal Occupation During Past 5 Years:
· Nantucket Atheneum, public library, Chair (2018-June 2021) and Director (2015-June 2021)
· Orchard Island Club, golf and beach club, Governor (2016-Present)
No. of Portfolios for which Board Member Serves: 39
———————
32
Robin A. Melvin (59)
Board Member (2012)
Principal Occupation During Past 5 Years:
· Westover School, a private girls’ boarding school in Middlebury, Connecticut, Trustee (2019-Present)
· Mentor Illinois, a non-profit organization dedicated to increasing the quality of mentoring services in Illinois, Co-Chair (2014–2020); Board Member, Mentor Illinois (2013-2020)
· JDRF, a non-profit juvenile diabetes research foundation, Board Member (June 2021-June 2022)
Other Public Company Board Memberships During Past 5 Years:
· HPS Corporate Lending Fund, a closed-end management investment company regulated as a business development company, Trustee (August 2021-Present)
No. of Portfolios for which Board Member Serves: 71
———————
Michael D. DiLecce (60)
Advisory Board Member (2022)
Principal Occupation During Past 5 Years:
· Retired since July 2022. Global Asset Management Assurance Leader, Ernst & Young LLP (2015-2022)
· Americas Regional Talent Managing Partner for Ernst & Young’s Financial Service Practice (2017-2021)
· Partner, Ernst & Young LLP (1997-2022)
No. of Portfolios for which Board Member Serves: 22
———————
The address of the Board Members and Officers is c/o BNY Mellon Investment Adviser, Inc., 240 Greenwich Street, New York, New York 10286. Additional information about each Board Member is available in the fund’s Statement of Additional Information which can be obtained from the Adviser free of charge by calling this toll free number: 1-800-373-9387.
33
OFFICERS OF THE FUND (Unaudited)
DAVID DIPETRILLO, President since January 2021.
Vice President and Director of the Adviser since February 2021; Head of North America Product, BNY Mellon Investment Management since January 2018; and Director of Product Strategy, BNY Mellon Investment Management from January 2016 to December 2017. He is an officer of 54 investment companies (comprised of 107 portfolios) managed by the Adviser or an affiliate of the Adviser. He is 44 years old and has been an employee of BNY Mellon since 2005.
JAMES WINDELS, Treasurer since November 2001.
Vice President of the Adviser since September 2020; and Director–BNY Mellon Fund Administration. He is an officer of 55 investment companies (comprised of 127 portfolios) managed by the Adviser or an affiliate of the Adviser. He is 64 years old and has been an employee of the Adviser since April 1985.
PETER M. SULLIVAN, Chief Legal Officer since July 2021 and Vice President and Assistant Secretary since March 2019.
Chief Legal Officer of the Adviser and Associate General Counsel of BNY Mellon since July 2021; Senior Managing Counsel of BNY Mellon from December 2020 to July 2021; and Managing Counsel of BNY Mellon from March 2009 to December 2020. He is an officer of 55 investment companies (comprised of 127 portfolios) managed by the Adviser or an affiliate of the Adviser. He is 54 years old and has been an employee of BNY Mellon since April 2004.
JAMES BITETTO, Vice President since August 2005 and Secretary since February 2018.
Senior Managing Counsel of BNY Mellon since December 2019; Managing Counsel of BNY Mellon from April 2014 to December 2019; and Secretary of the Adviser. He is an officer of 55 investment companies (comprised of 127 portfolios) managed by the Adviser or an affiliate of the Adviser. He is 56 years old and has been an employee of the Adviser since December 1996.
DEIRDRE CUNNANE, Vice President and Assistant Secretary since March 2019.
Managing Counsel of BNY Mellon since December 2021, Counsel of BNY Mellon from August 2018 to December 2021; and Senior Regulatory Specialist at BNY Mellon Investment Management Services from February 2016 to August 2018. She is an officer of 55 investment companies (comprised of 127 portfolios) managed by the Adviser or an affiliate of the Adviser. She is 32 years old and has been an employee of the Adviser since August 2018.
SARAH S. KELLEHER, Vice President and Assistant Secretary since April 2014.
Vice President of BNY Mellon ETF Investment Adviser; LLC since February 2020; Senior Managing Counsel of BNY Mellon since September 2021; Managing Counsel of BNY Mellon from December 2017 to September 2021; and Senior Counsel of BNY Mellon from March 2013 to December 2017. She is an officer of 55 investment companies (comprised of 127 portfolios) managed by the Adviser or an affiliate of the Adviser. She is 47 years old and has been an employee of the Adviser since March 2013.
JEFF PRUSNOFSKY, Vice President and Assistant Secretary since August 2005.
Senior Managing Counsel of BNY Mellon. He is an officer of 55 investment companies (comprised of 127 portfolios) managed by the Adviser or an affiliate of the Adviser. He is 57 years old and has been an employee of the Adviser since October 1990.
AMANDA QUINN, Vice President and Assistant Secretary since March 2020.
Counsel of BNY Mellon since June 2019; Regulatory Administration Manager at BNY Mellon Investment Management Services from September 2018 to May 2019; and Senior Regulatory Specialist at BNY Mellon Investment Management Services from April 2015 to August 2018. She is an officer of 55 investment companies (comprised of 127 portfolios) managed by the Adviser or an affiliate of the Adviser. She is 37 years old and has been an employee of the Adviser since June 2019.
34
NATALYA ZELENSKY, Vice President and Assistant Secretary since March 2017.
Chief Compliance Officer since August 2021 and Vice President since February 2020 of BNY Mellon ETF Investment Adviser, LLC; Chief Compliance Officer since August 2021 and Vice President and Assistant Secretary since February 2020 of BNY Mellon ETF Trust; Managing Counsel of BNY Mellon from December 2019 to August 2021; Counsel of BNY Mellon from May 2016 to December 2019; and Assistant Secretary of the Adviser from April 2018 to August 2021. She is an officer of 55 investment companies (comprised of 127 portfolios) managed by the Adviser or an affiliate of the Adviser. She is 37 years old and has been an employee of BNY Mellon since May 2016.
DANIEL GOLDSTEIN, Vice President since March 2022.
Vice President and Head of Product Development of North America Product, BNY Mellon Investment Management since January 2018; Co-Head of Product Management, Development & Oversight of North America Product, BNY Mellon Investment Management from January 2010 to January 2018; and Senior Vice President, Development & Oversight of North America Product, BNY Mellon Investment Management since 2010. He is an officer of 54 investment companies (comprised of 107 portfolios) managed by the Adviser or an affiliate of the Adviser. He is 53 years old and has been an employee of the Distributor since 1991.
JOSEPH MARTELLA, Vice President since March 2022.
Vice President of the Adviser since December 2022, Head of Product Management of North America Product, BNY Mellon Investment Management since January 2018; Director of Product Research and Analytics of North America Product, BNY Mellon Investment Management from January 2010 to January 2018; and Senior Vice President of North America Product, BNY Mellon Investment Management since 2010. He is an officer of 54 investment companies (comprised of 107 portfolios) managed by the Adviser or an affiliate of the Adviser. He is 46 years old and has been an employee of the Distributor since 1999.
GAVIN C. REILLY, Assistant Treasurer since December 2005.
Tax Manager–BNY Mellon Fund Administration. He is an officer of 55 investment companies (comprised of 127 portfolios) managed by the Adviser or an affiliate of the Adviser. He is 54 years old and has been an employee of the Adviser since April 1991.
ROBERT SALVIOLO, Assistant Treasurer since July 2007.
Senior Accounting Manager–BNY Mellon Fund Administration. He is an officer of 55 investment companies (comprised of 127 portfolios) managed by the Adviser or an affiliate of the Adviser. He is 55 years old and has been an employee of the Adviser since June 1989.
ROBERT SVAGNA, Assistant Treasurer since December 2002.
Senior Accounting Manager–BNY Mellon Fund Administration. He is an officer of 55 investment companies (comprised of 127 portfolios) managed by the Adviser or an affiliate of the Adviser. He is 55 years old and has been an employee of the Adviser since November 1990.
JOSEPH W. CONNOLLY, Chief Compliance Officer since October 2004.
Chief Compliance Officer of the BNY Mellon Family of Funds and BNY Mellon Funds Trust since 2004; and Chief Compliance Officer of the Adviser from 2004 until June 2021. He is the Chief Compliance Officer of 54 investment companies (comprised of 112 portfolios) managed by the Adviser. He is 65 years old.
CARIDAD M. CAROSELLA, Anti-Money Laundering Compliance Officer since January 2016.
Anti-Money Laundering Compliance Officer of the BNY Mellon Family of Funds and BNY Mellon Funds Trust. She is an officer of 48 investment companies (comprised of 120 portfolios) managed by the Adviser or an affiliate of the Adviser. She is 54 years old and has been an employee of the Distributor since 1997.
35
This page intentionally left blank.
36
This page intentionally left blank.
37
BNY Mellon Variable Investment Fund, Opportunistic Small Cap Portfolio
240 Greenwich Street
New York, NY 10286
Adviser
BNY Mellon Investment Adviser, Inc.
240 Greenwich Street
New York, NY 10286
Sub-Adviser
Newton Investment Management
North America, LLC
BNY Mellon Center
201 Washington Street
Boston, MA 02108
Custodian
The Bank of New York Mellon
240 Greenwich Street
New York, NY 10286
Transfer Agent &
Dividend Disbursing Agent
BNY Mellon Transfer, Inc.
240 Greenwich Street
New York, NY 10286
Distributor
BNY Mellon Securities Corporation
240 Greenwich Street
New York, NY 10286
Telephone 1-800-258-4260 or 1-800-258-4261
Mail The BNY Mellon Family of Funds, 144 Glenn Curtiss Boulevard, Uniondale, NY 11556-0144 Attn: Institutional Services Department
E-mail Send your request to info@bnymellon.com
Internet Information can be viewed online or downloaded at www.im.bnymellon.com
The fund files its complete schedule of portfolio holdings with the Securities and Exchange Commission (“SEC”) for the first and third quarters of each fiscal year on Form N-PORT. The fund’s Forms N-PORT are available on the SEC’s website at www.sec.gov.
A description of the policies and procedures that the fund uses to determine how to vote proxies relating to portfolio securities and information regarding how the fund voted these proxies for the most recent 12-month period ended June 30 is available at www.im.bnymellon.com and on the SEC’s website at www.sec.gov and without charge, upon request, by calling 1-800-373-9387.
| | |
© 2023 BNY Mellon Securities Corporation
0121AR1222 | 
|
Item 2. Code of Ethics.
The Registrant has adopted a code of ethics that applies to the Registrant's principal executive officer, principal financial officer, principal accounting officer or controller, or persons performing similar functions. There have been no amendments to, or waivers in connection with, the Code of Ethics during the period covered by this Report.
Item 3. Audit Committee Financial Expert.
The Registrant's Board has determined that Gina D. France, a member of the Audit Committee of the Board, is an audit committee financial expert as defined by the Securities and Exchange Commission (the "SEC"). Ms. France is "independent" as defined by the SEC for purposes of audit committee financial expert determinations.
Item 4. Principal Accountant Fees and Services.
(a) Audit Fees. The aggregate fees billed for each of the last two fiscal years (the "Reporting Periods") for professional services rendered by the Registrant's principal accountant (the "Auditor") for the audit of the Registrant's annual financial statements or services that are normally provided by the Auditor in connection with the statutory and regulatory filings or engagements for the Reporting Periods, were $139,412 in 2021 $142,200 in 2022.
(b) Audit-Related Fees. The aggregate fees billed in the Reporting Periods for assurance and related services by the Auditor that are reasonably related to the performance of the audit of the Registrant's financial statements and are not reported under paragraph (a) of this Item 4 were $31,535 in 2021 and $31,395 in 2022. These services consisted of one or more of the following: (i) agreed upon procedures related to compliance with Internal Revenue Code section 817(h), (ii) security counts required by Rule 17f-2 under the Investment Company Act of 1940, as amended, (iii) advisory services as to the accounting or disclosure treatment of Registrant transactions or events and (iv) advisory services to the accounting or disclosure treatment of the actual or potential impact to the Registrant of final or proposed rules, standards or interpretations by the Securities and Exchange Commission, the Financial Accounting Standards Boards or other regulatory or standard-setting bodies.
The aggregate fees billed in the Reporting Periods for non-audit assurance and related services by the Auditor to the Registrant's investment adviser (not including any sub-investment adviser whose role is primarily portfolio management and is subcontracted with or overseen by another investment adviser), and any entity controlling, controlled by or under common control with the investment adviser that provides ongoing services to the Registrant ("Service Affiliates"), that were reasonably related to the performance of the annual audit of the Service Affiliate, which required pre-approval by the Audit Committee were $0 in 2021 and $0 in 2022.
(c) Tax Fees. The aggregate fees billed in the Reporting Periods for professional services rendered by the Auditor for tax compliance, tax advice, and tax planning ("Tax Services") were $19,008 in 2021 and $17,631 in 2022. These services consisted of: (i) review or preparation of U.S. federal, state, local and excise tax returns; (ii) U.S. federal, state and local tax planning, advice and assistance regarding statutory, regulatory or administrative developments; (iii) tax advice regarding tax qualification matters and/or treatment of various financial instruments held or proposed to be acquired or held, and (iv) determination of Passive Foreign Investment Companies. The aggregate fees billed in the Reporting Periods for Tax Services by the Auditor to Service Affiliates, which required pre-approval by the Audit Committee were $12,369 in 2021 and $16,369 in 2022.
(d) All Other Fees. The aggregate fees billed in the Reporting Periods for products and services provided by the Auditor, other than the services reported in paragraphs (a) through (c) of this Item, were $201 in 2021 and $110 in 2022. These services consisted of a review of the Registrant's anti-money laundering program.
The aggregate fees billed in the Reporting Periods for Non-Audit Services by the Auditor to Service Affiliates, other than the services reported in paragraphs (b) through (c) of this Item, which required pre-approval by the Audit Committee, were $0 in 2021 and $0 in 2022.
(e)(1) Audit Committee Pre-Approval Policies and Procedures. The Registrant's Audit Committee has established policies and procedures (the "Policy") for pre-approval (within specified fee limits) of the Auditor's engagements for non-audit services to the Registrant and Service Affiliates without specific case-by-case consideration. The pre-approved services in the Policy can include pre-approved audit services, pre-approved audit-related services, pre-approved tax services and pre-approved all other services. Pre-approval considerations include whether the proposed services are compatible with maintaining the Auditor's independence. Pre-approvals pursuant to the Policy are considered annually.
(e)(2) Note. None of the services described in paragraphs (b) through (d) of this Item 4 were approved by the Audit Committee pursuant to paragraph (c)(7)(i)(C) of Rule 2-01 of Regulation S-X.
(f) None of the hours expended on the principal accountant's engagement to audit the registrant's financial statements for the most recent fiscal year were attributed to work performed by persons other than the principal accountant's full-time, permanent employees.
Non-Audit Fees. The aggregate non-audit fees billed by the Auditor for services rendered to the Registrant, and rendered to Service Affiliates, for the Reporting Periods were $3,095,435 in 2021 and $1,803,830 in 2022.
Auditor Independence. The Registrant's Audit Committee has considered whether the provision of non-audit services that were rendered to Service Affiliates, which were not pre-approved (not requiring pre-approval), is compatible with maintaining the Auditor's independence.
(j) Not applicable.
Item 5. Audit Committee of Listed Registrants.
Not applicable.
Item 6. Investments.
(a) Not applicable.
| Item 7. | Disclosure of Proxy Voting Policies and Procedures for Closed-End Management Investment Companies. |
Not applicable.
Item 8. Portfolio Managers of Closed-End Management Investment Companies.
Not applicable.
| Item 9. | Purchases of Equity Securities by Closed-End Management Investment Companies and Affiliated Purchasers. |
Not applicable.
| Item 10. | Submission of Matters to a Vote of Security Holders. |
There have been no material changes to the procedures applicable to Item 10.
| Item 11. | Controls and Procedures. |
(a) The Registrant's principal executive and principal financial officers have concluded, based on their evaluation of the Registrant's disclosure controls and procedures as of a date within 90 days of the filing date of this report, that the Registrant's disclosure controls and procedures are reasonably designed to ensure that information required to be disclosed by the Registrant on Form N-CSR is recorded, processed, summarized and reported within the required time periods and that information required to be disclosed by the Registrant in the reports that it files or submits on Form N-CSR is accumulated and communicated to the Registrant's management, including its principal executive and principal financial officers, as appropriate to allow timely decisions regarding required disclosure.
(b) There were no changes to the Registrant's internal control over financial reporting that occurred during the period covered by this report that have materially affected, or are reasonably likely to materially affect, the Registrant's internal control over financial reporting.
| Item 12. | Disclosure of Securities Lending Activities for Closed-End Management Investment Companies. |
Not applicable.
(a)(1) Code of ethics referred to in Item 2.
(a)(2) Certifications of principal executive and principal financial officers as required by Rule 30a-2(a) under the Investment Company Act of 1940.
(a)(3) Not applicable.
(b) Certification of principal executive and principal financial officers as required by Rule 30a-2(b) under the Investment Company Act of 1940.
SIGNATURES
Pursuant to the requirements of the Securities Exchange Act of 1934 and the Investment Company Act of 1940, the Registrant has duly caused this Report to be signed on its behalf by the undersigned, thereunto duly authorized.
BNY Mellon Variable Investment Fund
By: /s/ David J. DiPetrillo
David J. DiPetrillo
President (Principal Executive Officer)
Date: February 8, 2023
Pursuant to the requirements of the Securities Exchange Act of 1934 and the Investment Company Act of 1940, this Report has been signed below by the following persons on behalf of the Registrant and in the capacities and on the dates indicated.
By: /s/ David J. DiPetrillo
David J. DiPetrillo
President (Principal Executive Officer)
Date: February 8, 2023
By: /s/ James Windels
James Windels
Treasurer (Principal Financial Officer)
Date: February 8, 2023
EXHIBIT INDEX
(a)(1) Code of ethics referred to in Item 2.
(a)(2) Certifications of principal executive and principal financial officers as required by Rule 30a-2(a) under the Investment Company Act of 1940. (EX-99.CERT)
(b) Certification of principal executive and principal financial officers as required by Rule 30a-2(b) under the Investment Company Act of 1940. (EX-99.906CERT)